4 July-August- 1974 Volume 39 : Number 4 Coden: JFDSAZ 39(4) 645-864 (1974) DURJNAL FOOD SCIEKCE HUM mobilized enzymes in food systems: Introduction— T. Richardson aracteristics of immobilized multi-enzymic systems— H.O. Hultin mobilized enzymes in food processing and analysis— N.F. Olson and T. Richardson e chemistry of immobilizing enzymes—W.L. Stanley and A.C. Olson iss transfer characteristics of immobilized enzymes— Y.Y. Lee and G. T. Tsao D SCIENCE and ENGINEERING ;rcury content of some foods—Af./. Gomez and P. Markakis ench fried potatoes: Factors affecting yields measured as servings per 100 lb of frozen product—/./W. Zak ;tension of post-harvest storage life of sliced celery— C.E. Johnson \ rehydration and respiration of dry and partially dried vegetables— G.J. Haas, H.E. Prescott Jr. and C.J. Cante crobial quality of dehydrated onions—/?. Firstenberg, C.H. Mannheim and A. Cohen nino acid losses in turnip greens (Brassica rapa L.) during handling and processing— F.l. Meredith, M.H. Gaskins and G. G. Dull :at transfer from condensing steam to vegetable pieces— C.-C.A. Ling, J.L. Bomben, D.F. Farkas and C.J. King reduced effluent blanch-cooling method using a vibratory conveyor— G.E. Brown, J.L. Bomben, W.C. Dietrich, J.S. Hudson and D. F. Farkas ternal color as a maturity index of papaya fruits— M. Peleg and L. Gomez Brito udies on reverse osmosis for concentration of fruit juices— T. Matsuura, A.G. Baxter and S. Sourirajan 712 Stabilization of carotenoids in dried citrus flavedo— R.J. Braddock and J. W. Kesterson 715 Effect of broiling, grill frying and microwave cooking on moisture, some lipid components and total fatty acids of ground beef—Z../. Janicki and H. Appledorf 718 Influence of curing ingredients and storage time on the quality of preblended sausage meats and frankfurters— R.C. Waldman, D.O. Westerberg and S. Simon 723 Effect of gas atmospheres on microbial quality of pork— D.L. Huffman 726 Lipid-protein interaction during aqueous extraction of fish protein: Myosin-lipid interaction—5. Y.K. Shenouda and G.M. Pigott 735 Process requirements and properties of spray-dried squid protein— C.M. Lee, R.T. Toledo, T.O.M. Nakayama and C.O. Chichester 739 Calculation of temperature measurement errors in thermo- couples in convection heating cans— G.J.K. Packer and J.L.B. Gamlen 744 Reverse osmosis concentration of carbohydrate solutions: Process modelling and costing— J.P.K. Peeler and O. Sitnai 751 Characterization of lactase immobilized on collagen: Con- version of whey lactose by soluble and immobilized lac- tase— /./?. Giacin, J. Jakubowski, J.G. Leeder, S.G. Gilbert and D.H. Kleyn 755 Microorganisms from oil palm tree (Elaeis guineensis) tap holes—S./. Faparusi 758 Acceptability of saltine crackers containing cottonseed pro- tein products— L.G. Stoats and N.M. Tolman BASIC SCIENCE 761 Pentane formation and rancidity in vegetable oils and in potato chips— K. Warner, C.D. Evans, G.R. List, B.K. Boundy and W.F. Kwolek -CONTENTS CONTINUED (on the inside of the frt>nt cover) . . . iw m im rm n r 'js 'p v j A PUBLICATION OF THE INSTITUTE OF FOOD' TECHNbLOGISTS

Welcome message from author
This document is posted to help you gain knowledge. Please leave a comment to let me know what you think about it! Share it to your friends and learn new things together.
Transcript

4 July-August- 1974 V olum e 3 9 : Num ber 4
Coden: JFDSAZ 39(4) 645-864 (1974)
DURJNAL FOOD SCIEKCE
HUM
mobilized enzymes in food systems: Introduction— T. Richardsonaracteristics of immobilized multi-enzymic systems—H.O. Hultin
mobilized enzymes in food processing and analysis—N.F. Olson and T. Richardsone chemistry of immobilizing enzymes— W.L. Stanley andA.C. Olson
iss transfer characteristics of immobilized enzymes— Y.Y. Lee and G. T. Tsao
D SCIENCE and ENGINEERING;rcury content of some foods—Af./. Gomez and P. Markakis
ench fried potatoes: Factors affecting yields measured as servings per 100 lb of frozen product—/./W. Zak
;tension of post-harvest storage life of sliced celery—C.E. Johnson
\ rehydration and respiration of dry and partially dried vegetables— G.J. Haas, H .E. Prescott Jr. and C.J. Cante
crobial quality of dehydrated onions—/?. Firstenberg,C.H. Mannheim and A. Cohen
nino acid losses in turnip greens (Brassica rapa L.) during handling and processing— F.l. Meredith, M .H . Gaskins and G. G. Dull
:at transfer from condensing steam to vegetable pieces—C.-C.A. Ling, J.L. Bomben, D .F. Farkas and C.J. King
reduced effluent blanch-cooling method using a vibratory conveyor— G.E. Brown, J.L. Bomben, W.C. Dietrich, J.S. Hudson and D. F. Farkas
ternal color as a maturity index of papaya fruits—M. Pel eg and L. Gomez Brito
udies on reverse osmosis for concentration of fruit juices— T. Matsuura, A.G. Baxter and S. Sourirajan
712 Stabilization of carotenoids in dried citrus flavedo— R.J. Braddock and J. W. Kesterson
715 Effect of broiling, grill frying and microwave cooking on moisture, some lipid components and total fatty acids of ground beef—Z../. Janicki and H. Appledorf
718 Influence of curing ingredients and storage time on the quality of preblended sausage meats and frankfurters—R.C. Wald man, D.O. Wester berg and S. Simon
723 Effect of gas atmospheres on microbial quality of pork—D.L. Huffman
726 Lipid-protein interaction during aqueous extraction of fish protein: Myosin-lipid interaction—5. Y.K. Shenouda andG.M. Pigott
735 Process requirements and properties of spray-dried squid protein—C.M. Lee, R.T. Toledo, T.O.M. Nakayama andC.O. Chichester
739 Calculation of temperature measurement errors in thermocouples in convection heating cans— G.J.K. Packer andJ.L.B. Gamlen
744 Reverse osmosis concentration of carbohydrate solutions: Process modelling and costing—J.P.K. Peeler and O. Sitnai
751 Characterization of lactase immobilized on collagen: Conversion of whey lactose by soluble and immobilized lactase—/./?. Giacin, J. Jakubowski, J.G. Leeder, S.G. Gilbert and D.H. Kleyn
755 Microorganisms from oil palm tree (Elaeis guineensis) tap holes—S./. Faparusi
758 Acceptability of saltine crackers containing cottonseed protein products— L.G. Stoats and N.M. Tolman
BASIC SCIENCE761 Pentane formation and rancidity in vegetable oils and in
potato chips— K. Warner, C.D. Evans, G.R. List, B.K. Boundy and W.F. Kwolek
-CONTENTS CONTINUED (on the inside of the frt>nt cover) . . .
i w m i m r m n r ' j s ' p v jA PUBLICATION OF THE INSTITUTE OF FOOD' TECHNbLOGISTS


XBjJOURNAL of FOOD
July-A ugust 19 7 4 V olum e 3 9 : Num ber 4
SCIENCED irecto r of Pub licatio n sJohn B. Klis
Managing Ed ito rBernard Schukraft
Advertising Manager Edward H. Hoffman
PublisherCalvert L. Willey
S c ie n t if ic Ed ito rBernard J. Liska
A sst, to S c ie n t if ic E d it o r Anna May Schenck
Board o f E d ito rsE. Briskey (74)L. Dugan (74)F. Francis (74)J. Liston (74)R. Pangborn (74) J. Powers (74) W. Stahl (74)
R. Cassens (75) A. Denton (75) D. Goll (75)H. Hultin (75) T. Labuza (75) R. Maxcy (75) P. Nelson (75)
W. Clark (76)R. Eiserle (76)G. Giddings (76) D. Heldman (76) P. Hopper (76)Y. Pomeranz (76) M. Solberg (76)
• MANUSCRIPTS (3 copies) should be submitted to:Dr. Bernard J. Liska IFT Scientific EditorP.O. Box 3067 Lafayette, IN 47906 USA
NO RESPONSIBILITY is assumed by the Institute of Food Technologists for statements and opinions expressed by the contributors to its publications.
MANUSCRIPTS should conform to the style used in Journal o f Food Science. Authors should request from the Director of Publications the revised leaflet “Style Guide for Research Papers.” Journal o f Food Science reserves the privilege of editing manuscripts to make them conform with the adopted style of the journal or returning them to authors for revision. Editing changes may be reviewed by authors before publication.
PAGE CHARGES for Publications. The IFT Executive Committee has established a page charge of $50 per printed page for all papers published in Journal o f Food Science. The page charge shall not constitute a bar to acceptance of research manuscripts because the author is unable to pay the charge.
• SUBSCRIPTIONS: All communications related to handling of subscriptions, including loss claims, change of address, orders for back issues, and 100 or more reprints should be sent to:
Subscription DepartmentInstitute of Food Technologists-Suite 2120221 N. LaSalle StreetChicago, IL 60601 USA
Member Subscriptions-^ 10 per year.Non-Member Subscriptions-Accepted only on a calendar year basis-no refunds. Rates include postage. Payment must
accompany order. Domestic and Pan American Union-$20; all other destinations-$25. Reduced rates for 2- and 3-year subscriptions.
Change o f address notice, with old address label, is required 4 weeks before issue date.Claims for lost copies are allowed only if received within one month after publication (3 months for foreign subscribers). Single copies and available back issues. $5 each; remittance to accompany order.• REPRINTS: Request single reprints from AUTHORS. Price Schedule for 100 or more reprints available upon request from Subscription Department.
©Copyright 1974 by Institute of Food Technologists. All rights reserved. JOURNAL OF FOOD SCIENCE (formerly Food Research) is published six times a year (bimonthly) by Institute of Food Technologists, Suite 2120, 221 N. LaSalle Street, Chicago, Illinois 60601 USA. Printed in USA. Second class postage paid at Chicago, 111. and at additional mailing offices.
*> m -------- *vifl-jrfjjf? n n n y ij n f h j f f } }
- S n .B . 751?
1

ABSTRACTS :IN THIS ISSUE
CHARACTERISTICS OF IMMOBILIZED MULTI-ENZYMIC SYSTEMS.H.O. HULTIN. /. Food Sci. 39, 647-652 (1974)-Immobilized multi- -enzymic systems are responsible for the high efficiency of many physiological reaction sequences carried out in living cells. Chemical and physical means for artificially immobilizing enzymes presents the opportunity for duplicating this efficiency for use in processing operations. Such artificially immobilized enzymes also serve as useful model systems for studying the properties of physiological multi-enzymic sequences. Factors characteristic of the immobilized multi-enzymic state are described. Comparisons are made between immobilized multi- and single-enzyme systems and between immobilized and soluble multi-enzymic ones.
IMMOBILIZED ENZYMES IN FOOD PROCESSING AND ANALYSIS.N.F. OLSON & T. RICHARDSON. J. Food Sci. 39, 653-659 (1974)- Economics of immobilization and characteristics of immobilized enzymes and substrates which are important in treatment of foods are discussed. Methods of immobilizing enzymes and activity and stability of enzymes which may be used in food processing and analyses are controlled and limited by the properties of foods. Specific immobilized enzymes which have been used or show promise for use in food processing and analysis are described.
THE CHEMISTRY OF IMMOBILIZING ENZYMES. W.L. STANLEY &A.C. OLSON. ./. Food Sci. 39, 660-666 0974) The advantages and disadvantages of three general systems for immobilizing enzymes (adsorption, entrapment and covalent bonding) are discussed with emphasis on practicality for food processing applications. Only covalent bonding results in complete fixation. For economy and simplicity, adsorption has many advantages but composition of feeds may cause excessive enzyme loss. The combination of adsorption on a phenol-formaldehyde resin with covalent crosslinking with glutaraldehyde is described for immobilizing lactase and advantages are discussed.
MASS TRANSFER CHARACTERISTICS OF IMMOBILIZED ENZYMES. Y.Y. LEE & G.T. TSAO. /. Food Sci. 39, 667—672 (1974) — Intrinsic kinetics of an immobilized enzyme can be different from that of soluble enzyme due to changes of the macromolecule caused by immobilization. Also transport of substrate to enzymic sites on the inert support creates a hindrance to overall reaction. Such dift'usional effects on immobilized enzyme reactions were analyzed in terms of effectiveness factor and film factor employing the theories developed earlier in heterogeneous catalysis. The pore diffusion effect in the design of an integral reactor was analytically treated. A brief discussion was given to the dif- fusional effects in relation to common kinetic studies of immobilized enzymes.
MERCURY CONTENT OF SOME FOODS. M I. GOMEZ & P. MARKAKIS. J. Food Sci. 39, 673—675 (1974)-A survey was conducted on the total mercury content of approximately 40 foods, including dairy, poultry, meat and fishery products, cereals, fruits and vegetables, bread and sugar, primarily produced in Michigan. Wet acid digestion and atomic absorption photometry were used in the analyses. The mercury content of most products ranged from less than 0.01 to 0.03 ppm. Fish carried generally higher concentrations of mercury, but no sample exceeded the FDA safety guideline of 0.5 ppm.
FRENCH FRIED POTATOES: FACTORS AFFECTING YIELDS MEASURED AS SERVINGS PER 100 LB OF FROZEN PRODUCT.J.M. ZAK. J. Food Sci. 39, 676-677 (1974)-The relationship between limpness, sizing and par-fried solids of French fried potatoes and their effect on the number of servings obtained per 100 lb of frozen product in the volumetric type of operations (fast food chain outlets) was investigated. French fried potatoes, shoe-string style, which had good sizing and limpness yielded more servings than the ones with poor sizing and limpness. The level of solids in the frozen potatoes had no effect on the number of servings obtained, although it did affect the weight of an individual serving.
EXTENSION OF POST-HARVEST STORAGE LIFE OF SLICED CELERY. C.E. JOHNSON, J.H. von ELBE & R.C. LINDSAY. J. Food Sci. 39, 678-680 (1974)-Precooled, ascorbic acid treated, and control fresh sliced celery samples of varying maturities were evaluated for physical and sensory quality attributes after 6 days post-harvest refrigerated storage and subsequent canning. Sensory evaluations indicated that early harvested celery was of lower quality than optimum or late harvested celery. Shear-press firmness measurements were similar for celery samples of different maturities. Pre-storage cooling of sliced celery, either by vacuum or hydrocooling, improved celery quality. Ascorbic acid additions decreased the rate of browning development on cut surfaces, and was effective in extending the refrigerated shelf life of celery when combined with vacuum or hydrocooling. Drained weight and firmness of canned celery from all treatments increased with post-harvest refrigerated storage time prior to canning.
ON REHYDRATION AND RESPIRATION OF DRY AND PARTIALLY DRIED VEGETABLES. G.J. HAAS, H.E. PRESCOTT JR. & C.J. CANTE. J. Food Sci. 39, 681-684 (197^)-The effect of drying carrots, string beans and peppers to various degrees upon subsequent rehydration was investigated. Rehydration capability at 23°C was lost gradually as drying progressed. Blanching previous to drying under our experimental conditions did not improve rehydration of string beans. In carrots, improvement was observed only upon prolonged rehydration times. Some surface active agents when used as 2.0% presoaks before drying were beneficial for rehydration. Respiration of vegetable tissues measured by Scholander respirometry is decreased upon partial drying; TTC color formation ceases at dehydration between 24% and 40% of fresh weight with carrots and peppers. Loss in respiration capability as shown by TTC staining ceases rapidly when an 80°C temperature is used for drying; this is to be expected as enzymes are heat sensitive.
MICROBIAL QUALITY OF DEHYDRATED ONIONS. R. FIRSTEN- BERG, C.H. MANNHEIM & A. COHEN. J. Food Sci. 39, 685-688(1974)-A reliable indicator for microbial quality of dehydrated onions was sought and the effect of brine treatment of onions on final microbial counts was investigated. Enterococci were found to be a better index for microbial contamination in dehydrated onions than coliforms: they multiplied at a slower rate on raw onions and were much more resistant to the process and in storage. In dehydration experiments carried out in the laboratory and in industrial lines it was found that dipping or fluming of onions prior to dehydration in 2-4% salt solutions improved their total counts ca 12-fold and coliform counts about 32-fold. The fungi counts of dried onions could be reduced by treating whole onions with saturated steam prior to dehydration.
11

AMINO ACID LOSSES IN TURNIP GREENS (Biassica rapa L.) DURING HANDLING AND PROCESSING. F.I. MEREDITH, M.H. GASKINS & G.G. DULL. J. Food Sci. 39, 689-691 (1974)-Turnip green samples were collected at harvesting, unloading dock, post-washing, post-blanching, at can filling and of the canned product. Amino acids were determined at each of the sample points with losses being small during the processing steps. Major losses of lysine (50%) isoleucine (51%) occurred in the canned drained solids. If the canning liquid is added back to the solids, losses of 27% lysine and 35% isoleucine result. Egg ratios of the essential amino acids are given with methionine being the limiting amino acid if the solid and canning liquid are considered as part of the food.
HEAT TRANSFER FROM CONDENSING STEAM TO VEGETABLE PIECES. C.-C.A. LING, J.L. BOMBEN, D.F. FARKAS & C.J. KING. J. Food Sci. 39, 692-695 (1974)-Vegetable pieces were suspended in a vertical 3 in. glass pipe through which steam passed at known temperature, pressure and velocity, and the center temperature of the piece was measured. The values for center temperature vs. time were used to estimate the surface heat transfer coefficient using Gurney-Lurie charts. The volume of noncondensable gas in the vegetable affected the overall heat transfer coefficient. Reducing the volume of gas in the vegetable by vacuum degassing prior to heating increased the rate of center temperature rise, while increasing the volume of gas prior to heating by exposing the vegetable piece to nitrogen at 1500 psig decreased the rate. Steam velocities in the range of 0.1-2.6 ft/sec did not measurably affect the heating rate. However, when the velocity was increased further by using a nozzle, the rate of center temperature rise was increased.
A REDUCED EFFLUENT BLANCH-COOLING METHOD USING A VIBRATORY CONVEYOR. G.E. BROWN, J.L. BOMBEN, W.C. DIETRICH, J.S. HUDSON & D.F. FARKAS. J. Food Sci. 39, 696-700 (1974)-A new vibratory conveyor, blanching-cooling method using the individual quick blanch (IQB) principle was tested. Heating of piece-form foods in steam was done on two stacked circular vibrating conveyor trays. Adiabatic holding was done in an insulated vertical tube. Blancher liquid was atomized into the air used for cooling the product. Solids losses, COD and effluent volume for green beans, carrots and peas were much less than that of best commercial practice. The feasibility of using vibratory conveyors, adiabatic holding in bulk and cooling with blancher liquid was demonstrated. Preliminary estimates show a saving in steam, water and effluent costs over best commercial practice.
EXTERNAL COLOR AS A MATURITY INDEX OF PAPAYA FRUITS.M. PELEG & L. GOMEZ BRITO. J. Food Sci. 39, 701-703 (1974)- Freshly harvested Carica papaya fruits were classified according to the maximum intensity of yellow coloring on the peel with a Hunter lab Color Difference Meter. It was found that the major part of the fruits having b values exceeding 20 units matured normally within 5 -7 days of storage, while the major part of the fruits having maximum b values between 18 and 20 Hunter b units matured normally within 8-10 days. The majority of fruits having maximum b values less than 18 units did not ripen normally. No correlation existed between the total soluble solids content, the texture strength, the internal color development and the external yellow coloration of the peel during storage. A method of grading the state of maturity of papaya is suggested based on three parameters: total soluble solids, texture strength and internal color intensity.
STUDIES ON REVERSE OSMOSIS FOR CONCENTRATION OF FRUIT JUICES. T. MATSUURA, A.G. BAXTER & S. SOURIRAJAN. J. Food Sci. 39, 704-711 (1974)-Data are presented for the osmotic pressures of commercially available lime, lemon, prune, carrot and salted
and unsalted tomato juices and their concentrates. Similar data are presented for sucrose-water and glucose-sucrose (mole ratio 10:l)-water solutions in the temperature range 7.5-25°C. The effects of the temperature on parameters of process design show that by operation at a lower temperature it is possible to obtain a higher recovery of aroma compounds in the concentrate in the second stage reverse osmosis treatment of fruit juice water obtained from the first stage treatment. This possibility is confirmed by the experimental results at 7.5°C and 25°C.
STABILIZATION OF CAROTENOIDS IN DRIED CITRUS FLAVEDO.R.J. BRADDOCK & J.W. KESTERSON. J. Food Sci. 39, 712-714(1974)-Low temperature (-10° F) was considerably more effective than addition of antioxidants for preservation of the carotenoid pigments in stored, dehydrated citrus flavedo. Flavedo dehydrated under conditions similar to commercial practices for dried citrus pulp resulted in losses during drying of from 30-90% of the pigments present in the fresh flavedo. Pigment losses increased with increasing drying temperatures (210° F, 225° F, 290° F). Addition of an antioxidant to the flavedo prior to dehydration aided in retention of pigments during processing. However, none of the common antioxidants effectively prevented pigment destruction during storage of dehydrated flavedo. Much more flavedo color and pigment retention was achieved by carefully controlling dehydration parameters than by adjusting storage variables.
EFFECT OF BROILING, GRILL FRYING AND MICROWAVE COOKING ON MOISTURE, SOME LIPID COMPONENTS AND TOTAL FATTY ACIDS OF GROUND BEEF. L.J. JANICKI & H. APPLEDORF. .7. Food Sci. 39, 715-717 (1974)-Raw and cooked ground beef patties were analyzed for moisture, crude fat, total cholesterol and total fatty acid content. The patties were cooked by broiling, grill frying and micro- wave radiation (2450 MHz). In addition, broiled and frozen patties were reheated by microwaves and analyzed. Compositional differences between patties prepared by broiling and grill frying were not significant. Patties processed by microwaves were lower in moisture and crude fat as compared to those prepared by the other methods. All cooking treatments except microwave decreased cholesterol content significantly compared to raw patties; however, the differences between cooking treatments were not significant. Loss of cholesterol was proportionately less than the decrease in crude fat. Sixteen fatty acids were identified in the total lipid extract. The fatty acids C14, C16, 0 6 :1 , 0 8 , 0 8 :1 and 0 8 :2 accounted for approximately 94% of the total acid measured. • Significant percent composition changes occurred in the 0 6 , 0 8 :1 and 0 8 :2 fatty acids as a result of the various cooking methods. The 0 6 acid underwent the greatest percent loss during cooking and was still further reduced in the microwave reheated precooked patties. The percent of 0 8 :1 and 0 8 :2 acids increased following all cooking treatments. The ratio of unsaturated/saturated fatty acids was increased by all cooking methods with the greatest increase noted in the precooked microwave reheated patties.
INFLUENCE OF CURING INGREDIENTS AND STORAGE TIME ON THE QUALITY OF PREBLENDED SAUSAGE MEATS AND FRANKFURTERS. R.C. WALDMAN, D.O. WESTERBERG & S. SIMON. J.Food Sci. 39, 718-722 (1974)-Meats were refrigerated up to 4 days with different salt levels, with and without sodium nitrite and sodium isoascorbate. Franks manufactured from these meats were evaluated during shelf life. Taste testing indicated that frankfurter desirability decreased with meat storage. Salt at 1.5% was effective in inhibiting bacterial growth and caused less rancidification than 3% salt. Franks prepared from meats containing salt and cure remained satisfactory. Cured pigment conversion and residual nitrite levels in finished products were marginally reduced by preblending compared with conventionally prepared product. Sodium isoascorbate addition reduced residual nitrite. Frankfurter stability, measured by weight change during water cooking, was not affected by preblending meats with salt.
iii

ABSTRACTS :IN THIS ISSUE
EFFECT OF GAS ATMOSPHERES ON MICROBIAL QUALITY OF PORK. D.L. HUFFMAN. J. Food Sci. 39, 723-725 (1974)-Ten 100 kg pigs were slaughtered, chilled at 2-3°C for 48 hr and divided at random into two equal groups. Strict sanitary procedures were used in removing loins. Loins from five pigs (expt 1) were vacuum packaged (50.8 cm Hg) in barrier bags, aged at 2-4°C for 5 days, cut into 1.27 cm thick chops and five chops were allotted at random to each treatment group from each animal. Experiment 2 loins were cut into 1.27 cm thick chops 2 days post-slaughter and 5 chops were allotted at random to each treatment group from each animal. Storage treatments used were: 100% air, 100% 0 2, 100% N2, 100% C02 and a gas mixture (70% N2, 25% C02, 5% 0 2). Chops were individually packaged in saran bags which were evacuated, gas flushed, evacuated, partially filled again with gas and stored at —1.1°C. Bacteria (total count, lactic acid producers and anaerobes) were enumerated 7, 14, 21, 28 and 35 days post-slaughter. No significant differences were found in bacterial counts between experiments within any sampling period; therefore, all animals were pooled into one experiment with 10 replications. Aerobic counts increased more rapidly and were higher (P < 0.05) for air, 0 2 and N2 samples at each week than for C02 and the gas mixture. The gas mixture and C02 suppressed growth of aerobes throughout storage. Aerobic counts were not suppressed by N2, and there was no significant difference in this count on chops incubated in air, 0 2 and N2 at any interval. No significant difference was noted in growth of lactic acid producers in the first 2 wk of storage; however, after the third week, counts were higher in C02 and the gas mixture treatments than in the air, N2 or 0 2 treatments. The fact that C02 and the gas mixture inhibited growth is of importance to the fresh meat industry and deserves further research.
LIPID-PROTEIN INTERACTION DURING AQUEOUS EXTRACTION OF FISH PROTEIN: MYOSIN-LIPID INTERACTION. S.Y.K. SHE- NOUDA & G.M. PIGOTT. J. Food Sci. 39, 726-734 (1974)-Present results of model system experiments to determine whether or not the fish lipid interacts with myosin and which groups of lipids are responsible for this interaction. Studies of the effects of aging, heating and air dénaturation (foam formation) on the formation of these lipoprotein complexes are also reported.
PROCESS REQUIREMENTS AND PROPERTIES OF SPRAY-DRIED SQUID PROTEIN. C.M. LEE, R.T. TOLEDO, T.O.M. NAKAYAMA &C.O. CHICHESTER J. Food Sci. 39, 735-738 (1974)-The process requirements and properties of dehydrated squid protein prepared by a water extraction and spray dehydration process were studied. After removal of skin and viscera, a water soluble fraction was obtained by filtering the comminuted slurry which, when diluted and spray dried, was converted into a powder having a very light color. A low yield of 29.4% on the semi-pilot scale appeared to be due to material loss during washing. In a well designed laboratory study however, yield averaged 74% indicating that loss during washing could be minimized. The product averaged 81% protein, had excellent water solubility and a good oil binding capacity as well as emulsion stability. Animal feeding studies showed that nutritionally the quality of the dehydrated squid protein is comparable with that of casein.
CALCULATION OF TEMPERATURE MEASUREMENT ERRORS IN THERMOCOUPLES IN CONVECTION HEATING CANS G.J.K. PACKER & J.L.B. GAMLEN. J. Food Sci. 39, 739-743 (1974)-Heat conduction along a wire and heat transfer to a wire from liquid in a can
during heating and cooling in a retort are considered. Equations are derived for calculation of the temperature error, which is expressed as a fraction of the difference between the liquid and retort temperatures. Dimensionless numbers are defined for heat conduction along the wire and for heat transfer from the liquid to the wire. Graphs of temperature error are presented in terms of these dimensionless numbers which enable the reader to rapidly determine the error for several points along the wire. A method is also given for correction of the “lag factor” (j) ir. process calculations.
REVERSE OSMOSIS CONCENTRATION OF CARBOHYDRATE SOLUTIONS: PROCESS MODELLING AND COSTING. J.P.X. PEELER & O. SITNAI. J. Food Sci. 39, 744-750 (1974)-Costs have been determined, by means of a mathematical model, for batchwise dewatering of dilute carbohydrate solutions using reverse osmosis. The concept of plant design was based on multiple parallel units comprising a number of tubular modules connected in series. Major operating parameters examined were the initial feed concentration, final concentration, operating pressure and the number of modules in series. Costs, in terms of $A per m3 of water removal, are presented for a basic feed capacity o: 140m3 per day.
CHARACTERIZATION OF LACTASE IMMOBILIZED ON COLLAGEN: CONVERSION OF WHEY LACTOSE BY SOLUBLE AND IMMOBILIZED LACTASE. J.R. GIACIN, J. JAKUBOWSKI, J.G. LEEDER, S.G. GILBERT & D.H. KLEYN. J. Food Sci. 39, 751-754(1974)-The enzymatic hydrolysis of lactose has been studied using (1- galactosidase (,Aspergillus niger) immobilized on collagen. The immobilization process employs simple and inexpensive techniques to bind the enzyme to collagen through noncovalent bond formation. The stability and reusability of collagen bound lactase membranes was evaluated in a biocatalytic modular reactor. Little or no loss in reactor activity was observed after storage for a period of 90 days. Following an initial decrease in activity, stable limit activity was maintained over a number of reactor volume replacements. The activity of the fungal lactase in both the soluble and bound states was determined in ultrafiltered acid whey. The catalytic potency of the enzyme, in both states, showed inhibited enzyme activity in acid whey, as compared to aqueous lactose. In the bound state, the enzyme experienced a partial irreversible inhibition.
MICROORGANISMS FROM OIL PALM TREE (Elaeis guineensis) TAP HOLES. S.I. FAPARUSI.7. Food Sci. 39, 755-757 (1974)-In the study of microorganisms from oil palm tree (Elaeis guineensis) tap holes, 12 yeasts, 18 bacteria and 6 mould species were isolated. On the average half of these microfloral species were also cultured from the palm sap obtained from the tap holes. Observations of microfloral population changes during the period of tapping indicate that sap yield began to fall as soon as bacteria and yeast populations each reached 10s per gram of tissue.
ACCEPTABILITY OF SALTINE CRACKERS CONTAINING COTTONSEED PROTEIN PRODUCTS. L.G. STAATS & N.M. TOLMAN. J. Food Sci. 39, 758-760 (1974)-Saltine-type crackers containing cottonseed products had two to three times as much protein as unfortified crackers

and received acceptable ratings from a six-member taste panel both when fresh and after up to 21 days of storage. Deglanded concentrate, glandless concentrate and storage isolate were substituted for 25, 30 and 35% of the weight of the flour in the recipe. Moisture changes, breaking strength, count-per-pound and height of samples were determined. The two concentrates were found to be more acceptable to the taste panelists than the isolate, and could be used to fortify snack crackers.
PENTANE FORMATION AND RANCIDITY IN VEGETABLE OILS AND IN POTATO CHIPS. K. WARNER, C.D. EVANS, G.R. LIST, B.K. BOUNDY & W.F. KWOLEK. J. Food Sci. 39, 761-765 (1974)-Pentane formation during initial stages of autoxidation is indicative of rancidity in aged vegetable oils and potato chips. Pentane in the headspace gas of oils and chips was measured by gas chromatography. An 18-member taste panel evaluated the samples for development of rancid odors and flavors. Significant linear correlations were obtained between the amount of pentane developed and the number of rancid descriptions. Samples needed only 0.08 ppm pentane in the headspace to be described as rancid by 90% of the panel. Both oils and chips were more stable to the development of pentane as the linoleate content and the iodine value decreased.
CONDITIONS FOR THE AUTOLYSIS OF ALPHA-GALACTOSIDES AND PHYTIC ACID IN CALIFORNIA SMALL WHITE BEANS. R.BECKER, A.C. OLSON, D.P. FREDERICK, S. KON, M R. GUMBMANN & J.R. WAGNER. J. Food Sci. 39,766—769 (1974)-The conditions for the autolysis of stachyose, raffinose and phytic acid in California small white beans were determined. It was found that initially the beans contain about 3.7% stachyose, 0.4% raffinose and no detectable verbascose. Optimum conditions for autolysis of these sugars are pH 5 and 45-65°C. Approximately 30% of the sugars are hydrolyzed in 9 hr, 50% in 24 hr and 70% in 48 hr. Disappearance of the oligosaccharides is accompanied by corresponding increases in galactose and sucrose. Other changes occur during incubation, including the hydrolysis of phytic acid with the production of inorganic phosphate and inositol. Optimum conditions for the production of inorganic phosphate and inositol are pH 5 and 35-45°C. When fed to rats incubated preparations of beans produced less hydrogen than nonincubated preparations.
SWEET CORN AROMA, CHEMICAL COMPONENTS AND RELATIVE IMPORTANCE IN THE OVERALL FLAVOR RESPONSE. L.F. FLORA & R.C. WILEY. J. Food Sci. 39, 770-773 (1974)-Dimethyl sulfide (DMS) was the most abundant aroma volatile in cooked sweet corn head- space, followed by ethanol, acetaldehyde, hydrogen sulfide (H2S), eth- anethiol, methanethiol and another unidentified compound unique to processed corn. Based on sensory monitoring of GC column effluents, DMS was determined as the primary factor in cooked corn aroma along with H2 S, methanethiol and, to a lesser degree, ethanethiol. Also detected in the effluents, but probably of lesser importance, were acetaldehyde, ethanol, and a “grainy” smelling compound in processed corn. When panelists were asked to score corn of widely varying characteristics for aroma, sweetness, texture and overall flavor, it was found that aroma contributed 15% to the flavor response while sweetness and texture contributed 55% and 30%, respectively.
EFFECTS OF LOW TEMPERATURE STORAGE OF TOMATO FRUITS ON ACID-SOLUBLE NUCLEOTIDES. R.W. BUESCHER & H.C. DOSTAL. J. Food Sci. 39, 774-776 (1974)-ATP and UTP contents of mature, green tomato fruits stored at 1°C increased over a period of about 2 wk and then declined. Transfer of chilled fruits to 20°C accelerated the above noted changes. Marked increases in ADP content and rapid declines in ATP, UTP and UDPG levels occurred when chilled fruits were transferred to 20°C. During normal ripening the adenosine nucleotide concentrations increased while the ATP/ADP, ATP/AMP and “energy charge” ratios steadily declined.
FOOD USE OF SOYBEAN 7S AND IIS PROTEINS. High Temperature Expansion Characteristics of Gels. K. SAIO, I. SATO & T. WATANABE. J. Food Sci. 39, 777-782 (1974)-High temperature expansion characteristics of soybean gels coagulated with calcium salt or HC1 were studied. Results show: (1) that the high ionic strength and slight alkaline or acidic range of buffer in which the gels were immersed, promoted expansion characteristics of gels; (2) the higher ratio of 11S to 7S protein in the gels resulted in higher expansion; and (3) presence of sodium sulfite prevented gels from expansion. The binding forces attributed to construct gels before and after expansion are discussed based on studies of expansion characteristics of gels in different conditions and on solubility of gels with 2-mercaptoethanol and sodium dodecyl sulfate.
CELLULASE ACTIVITY IN PEACHES DURING RIPENING. D M. HINTON & R. PRESSEY. J. Food Sci. 39, 783-785 (1974)-Cellulase activity and fruit firmness were studied during ripening of freestone peaches. There was very little cellulase activity in mature green peaches, but it increased during tree and postharvest ripening. The greatest increase in the enzyme activity occurred before the fruit began to soften. The data suggest that cellulase working in conjunction with other hydrolytic enzymes could play a vital role in the softening of peaches during ripening.
ENZYMATIC DEGRADATION OF ANTHOCYANINS: THE ROLE OF SWEET CHERRY POLYPHENOL OXIDASE. P.G. PIFFERI & R. CULTRERA. J. Food Sci. 39, 786-791 (1974)-An enzymatic system capable of degrading cyanidin-3-glucoside in the absence of phenols is present in the skin of sweet cherries; contrarily, the pulp homogenate degraded the anthocyanin only in the presence of phenols. The degradation of this pigment as a function of pH was studied for two polyphenol oxidases isolated from the fruit pulp on DEAE-cellulose with chlorogenic acid, D (+) catechine and pyrocatechol substrates. The decoloration was influenced by the anthocyanin structure at different pH and by the nature of the quinone obtained by enzymatic oxidation. The anhydro- base appeared to be the form of the anthocyanin most susceptible to oxidation. The degradation occurred according to the oxidation kinetics of the phenol substrate and was inhibited by ascorbic acid, indicating that the quinone’s degradation of the anthocyanin occurred by a consecutive-type mechanism.
NONVOLATILE ACIDS IN LYCHEE. H.T. CHAN JR. & S.C.M. KWOK. J. Food Sci. 39, 792-793 (1974)-The nonvolatile acids were extracted from lychee, separated by TLC and identified as levulinic, malic and citric. GLC of the methyl esters of the acids confirmed the presence of levulinic, malic and citric acids and revealed traces of lactic, malonic, fumaric and succinic acids. GLC of the TMS derivatives of the acids confirmed the presence of succinic, malic, levulinic and citric acids and revealed the presence of phosphoric and glutaric. Quantitative analysis by GLC showed that malic was the most abundant acid in lychee; other acids occurred in much lower quantities.
CORRELATIONS BETWEEN SUBJECTIVE AND OBJECTIVE MEASUREMENTS APPLIED TO GRAPE JELLY. M.C. QUINLAN, R E. BARGMANN, Y.M. EL-GALALLI & J.J. POWERS. /. Food Sci. 39, 794-799 (1974)-Nine experimental lots of grape jelly were made with different amounts of pectin and dextrose or invert syrup replacements for sucrose. A commercial grape jelly was used as a reference. The jellies were evaluated for acceptability, appearance (color and sheen), flavor and texture (spreadability and mouth feel). The pH, percent soluble solids, percent sag, shear force required to puncture the gel, percent dextrose and gas-liquid chromatographic (GLC) profiles of an extract-concentrate of the jellies were also determined. A computer program which calculates a contingency table for products and score levels was applied to the data to determine the intervals between scores and to feed back the data on a
v

ABSTRACTS:IN THIS ISSUE
random basis to determine whether the panelists were showing true preference or their choices were approaching randomness. One can thus compare the evidence on experimental and simulated data and decide for himself whether he agrees with any chosen level of significance. Flavor and texture were almost equally correlated with acceptability. Although appearance was less well correlated, this was not because it was unimportant but because the range was less. The various multiple correlation coefficients were calculated. Greater differentiation between products was attained by using the percent sag and shear force measurements in combination with GLC peaks than by using GLC peaks alone. The products tested fell into three categories: the commercial product received the highest preference rating followed by the experimental products containing from 5-7g of pectin; the high pectin (8g) received the lowest preference rating.
STATISTICAL ESTIMATION OF 12D FOR RADAPPERTIZED FOODS. E.W. ROSS JR. J. Food Sci. 39, 800-806 (1974)—This paper presents a new mathematical analysis of the inoculated pack method for determining the effectiveness of radappertization (radiation-sterilization) of canned food. A general theory is developed which makes it clear that two interrelated distribution functions, the probability of organism death and the probability of can sterilization, play important parts in the process. A critique is given of the Schmidt-Nank method for calculating the 12D dose, and modifications of both the experimental design and data analysis are suggested. Two examples are worked out, one illustrating the use of the suggested method, the other using the theory and an experiment on canned ham to show that the mode of organism death is unlikely to be exponential.
NUTRITIONAL AND COMPOSITIONAL CHANGES IN DEHYDRO- IRRADIATED SHRIMP. H. SRINIVAS, U.K. VAKIL & A. SREENI- VASAN. J. Food Sci. 39, 807-811 (1974)-Nutritional and compositional changes in dehydro-irradiated shrimp have been studied and compared with those in samples processed by conventional procedures. No changes in proximate constituents are observed due to radiation treatment, though blanching causes some loss in total proteins. Losses in B vitamins due to radiation are much less than those due to blanching and partial drying. Radiation-induced losses can be minimized by packing the samples in vacuum or nitrogen atmosphere prior to irradiation. A progressive loss up to 22% of B vitamins is observed in processed shrimp during 3 months storage at ambient temperature. No losses in total amino acids or in available lysine are observed in irradiated samples, while thermal treatment results in some losses. In vitro enzymic digestibility of shrimp protein is increased by radiation treatment.
TENDERIZATION OF MEAT WITH PAPAYA LATEX PROTEASES.C.K. KANG & W.D. WARNER J. Food Sci. 39, 812-818 (1974)— Tenderization of meat by papaya latex preparations was achieved by the combined action of several proteases. Both in vitro and in vivo application of enzymes gave degradation of muscle proteins, and degradation of connective tissue only after heat denaturation. Purified papaya enzymes- papain, chymopapain and papaya peptidase A-were uniformly distributed throughout the various muscles and in the extravascular system after antemortem injection into the vascular system. Chymopapain was the
primary contributor for tenderization because it constituted the major protease in the mixture and it had higher thermostability and more favorable action at the meat’s natural pH than papain or papaya peptidase A.
RELATIONSHIPS OF CERTAIN MUSCLE, CARTILAGE AND BONE TRAITS TO TENDERNESS OF THE BEEF LONGISSIMUS. B.W. BERRY, G.C. SMITH & Z.L. CARPENTER. J. Food Sci. 39, 819-824(1974)-Histological and chemical characteristics of longissimus muscle and physical measurements of scapular and vertebral cartilage and bone were related to the tenderness of the beef longissimus. The 195 wholesale ribs were selected from carcasses differing widely in physiological maturity. Smaller diameter muscle fibers, longer sarcomeres, shorter muscle fiber fragments following homogenization, lower percentages of wavy fibers, decreased collagen content, increased percentages of soluble collagen, lower myofibril fragmentation scores, increased percentages of fat, decreased percentages of moisture and smaller areas of expressible juice were associated (P < 0.05 or P < 0.01) with increases in tenderness of the beef longissimus. Among physiological maturity indicators, muscle fiber diameter, total pigment concentration and hardness of scapular cartilage and vertebral bone were most closely related to the variability in tenderness of the beef longissimus and were associated with advancements in physiological maturity. Although most of the relationships in this study were of small magnitude, these data generally support the utilization of fatness-maturity interactions across very wide ranges in physiological maturity for the stratification of beef carcasses according to tenderness.
PROTEOLYTIC ACTIVITY OF Pseudomonas perolens AND EFFECTS ON PORCINE MUSCLE. D.J. BUCKLEY, G.L. GANN, J.F. PRICE &G.C. SPINK. J. Food Sci. 39, 825-828 (1974)-Changes in the solubility of the primary muscle proteins attributable to the presence and growth of Pseudomonas perolens were increases in the extractability of myofibrillar and nonprotein nitrogen components at the expense of the sarcoplasmic and stroma proteins. Initiation of the production of high levels of proteolytic enzyme by Pseudomonas perolens in inoculated pork occurred concurrently with a rapid rise in pH and the peak of the bacterial growth curve. Incubation of porcine muscle at 3°C with or without bacterial cells resulted in minor ultrastructural changes. The purified proteolytic enzyme extract produced by Pseudomonas perolens appeared to cause the removal of the Z line and M line after as little as 4 days incubation. Fragmentation of the myofibrils and disintegration of actin filaments was evident after 8 days. Those samples containing bacterial cells exhibited varying degrees of ultrastructural damage after 8 days incubation. Localized disruption of myofibrils was observed and may have been due to localized growth or enzyme elaboration of bacterial cells.
ADENOSINE 3 ',5 -CYCLIC MONOPHOSPHATE IN NORMAL PORCINE MUSCLES. K. ONO & D.R. WOODS. ./. Food Sci. 39, 829-832(1974)-As part of a study to define the etiology of pale, soft and exudative pork and porcine stress syndrome, some properties of cyclic AMP, a compound which mediates the action of epinephrine, were studied. Results show that cyclic AMP is uniformly distributed in hog skeletal muscles both within and between muscles and is unstable at 2° but stable at -20°C and below. Under the conditions of the experiments, no simple relationship is obvious between rate of glycogen breakdown and concentration of cyclic AMP.
vi

THE EFFECT OF BACTERIAL FERMENTATION ON PROTEIN SOLUBILITY IN A SAUSAGE MODEL SYSTEM. J.T. KLEMENT, R.G. CASSENS & O.R. FENNEMA J. Food Sci. 39, 833-835 (1974)-The solubilities of myofibrillar and sarcoplasmic proteins were studied in response to bacterial fermentation in a simplified system. As pH decreased from 7.4 to 4.6, the solubility of the myofibrillar fraction decreased 60% and that of sarcoplasmic proteins decreased 40%; solubility of sarcoplasmic proteins previously adjusted to 0.67M NaCl decreased 50%. Sarcoplasmic proteins with and without added NaCl were more susceptible to insolubilization from heat than were the myofibrillar proteins. The myofibrillar preparation showed a marked increase in nonprotein nitrogen during fermentation whereas the sarcoplasmic fraction exhibited only a small increase in nonprotein nitrogen.
PROPERTIES OF A FERMENTED. SEMIDRY TURKEY SAUSAGE DURING PRODUCTION WITH LYOPHILIZED AND FROZEN CONCENTRATES OF Pediococcus cerevisiae. J.E. KELLER & J.C. ACTON. J. Food Sci. 39, 836-840 (1974)-Turkey sausage mixes utilizing breast, thigh and skin tissues were inoculated with either lyophilized or frozen concentrate starter cultures of Pediococcus cerevisiae. Main phases of production were examined to determine where and at what rate compositional, microbial and physical changes occur. Fermentation of the sausages was more rapid with the frozen concentrate (6 -8 hr lag phase) than with the lyophilized culture (12-14 hr lag phase), as determined by the rates of pH reduction and lactic acid production. The sausage meat waterholding capacity during fermentation using either culture form showed a minimum at pH 5.0, the approximate isoelectric point of major muscle proteins. During heat processing to 71°C internally, counts of total viable bacteria and lactic acid bacteria were reduced by 5 log cycles. Changes in concentrations of chemical components (protein, fat, moisture, salt) and shear force values during the drying phase were highly correlated with the amount of shrinkage and moisture removed. A semidry product was attained in 10-12 days.
EFFECTS OF PROTEOLYTIC ENZYMES ON THE FUNCTIONALITY OF CHICKEN EGG ALBUMEN. L.P. GRÜNDEN, D.V. VADEHRA &R.C. BAKER J. Food Sci. 39, 841-843 (1974)-Albumen from eggs of a strain of White Leghorn hens was treated with various proteolytic enzymes (papain, ficin, protease, bromelin and trypsin) for 18 hr at 34°C. Following enzyme treatment the nonprotein nitrogen, measured as Mmoles of tyrosine released per minute, was found to range from 1.1 x 10'3 to 4.8 x 10"3. All treatments were found to cause some changes in the electrophoretic behavior of albumen. The pH of enzyme-treated albumen ranged from 6.2 (protease) to 8.4 (trypsin). Enzymatic treatment of albumen, with the exception of papain, improved angel food cake volumes from 3-9%. In general, enzyme-treated albumen showed a 6-16% increase in foam volume; however, the foam stability was inferior compared to the control.
ENUMERATION OF THERMALLY STRESSED Staphylococcus aureus MF 31. R.J.H. GRAY, M.A. GASKE & Z.J. ORDAL. J. Food Sci. 39, 844-846 (1974)-Procedures used to enumerate microorganisms in food should detect all viable organisms present, regardless of their physiological state. Several currently recognized procedures were unable to satisfactorily enumerate thermally stressed cells of Staphylococcus aureus. After heating cells at 52°C in 100 mM potassium phosphate buffer pH 7.2, the cells were enumerated by comparative platings on both selective and nonselective media and by a most probable number technique (MPN). All media produced similar counts of unheated cells. When heated cells were enumerated by plating on selective media, productivity varied with the degree of stress imposed and the particular medium used. Baird-Parker’s medium enumerated normal and stressed cells equally well. When stressed cells were inoculated into trypticase soy broth + 10% NaCl the plate count on the nonselective medium decreased and approached that of the selective medium. After an extended lag the counts then increased in a parallel manner.
DETERMINATION OF WATER ACTIVITY IN INTERMEDIATE MOISTURE PET FOODS BY SOLVENT EXTRACTION. D. MALLETT, J.B. KOHNEN & T. SURLES. J. Food Sci. 39, 847-848 (1974)-Measuring water activity rapidly and inexpensively to determine whether intermediate moisture pet foods will have sufficiently low water activity to insure stable shelf life is a continuing problem. An attempt was made to adapt the solvent extraction method of Hasegawa and Sekine to IM dog foods and results were found in good agreement with those obtained from Hygrodynamics sensors. There was slightly more spread in results by solvent extraction, but a 75% saving in time: 2 hr vs. 8 for a similar run using sensors.
IMPROVED PROCEDURES FOR MATHEMATICAL EVALUATION OF HEAT PROCESSES. K. HAYAKAWA J. Food Sci. 39, 849-850(1974)—It is frequently necessary to determine the heating time of a thermal process producing a specified sterilizing value. This sterilizing value is one usually required for “microbially safe” heat processing. In most cases the determination is accomplished through iterative calculations. To minimize these calculations, an assumed heating time for the first iteration should be as close as possible to a correct one. Since no reliable procedure for estimating the approximate heating times is published, mathematical procedures were developed for this estimation. Mathematical evaluation of safe thermal processes may be accomplished with considerably less computation through the application of the developed procedures.
CHARACTERIZATION OF MEAT FROM MECHANICALLY DE- BONED LAMB BREASTS. R.A. FIELD & M.L. RILEY. J. Food Sci. 39, 851-852 (1974)-Seven lots of choice and prime lamb breasts were mechanically deboned using an AUX 70 Beehive deboner with 0.635 mm diam holes in the cylinder. The meat was compared to hand-boned meat from the same lots of breasts. Numbers of bacteria per g of meat and percent fat, protein and dry matter were similar in hand- and machineboned meat. Mechanically deboned meat contained less hydroxyproiine and more calcium than hand-boned meat.
LEAD AND CADMIUM CONTENT OF SELECTED OREGON GROUNDFISH. E.A. CHILDS & J.N. GAFFKE. J. Food Sci. 39, 853-854 (1974)-The lead and cadmium content of selected Oregon groundfish was determined. Rex sole (G/yptocephalus zachirus), English sole (Parophrys vetulus), Dover sole (Microstomus pacificus), petrale sole (Eopsetta jordani), orange rockfish (Sebastes pinniger), lingcod (Ophio- don elongatus), Pacific hake {Merluccius productus), starry flounder (Platichthys Stella tus) and sand sole (Pset tick thy s melanostictus) samples had mean lead and cadmium contents of < 0.25 ppm. Therefore Oregon groundfish would not be a source of toxic levels of Pb and Cd in the diet.
EFFECT OF ESSENCE ENHANCEMENT AND STORAGE ON THE FLAVOR OF FROZEN CONCENTRATED ORANGE JUICE. M.H. DOUGHERTY, D.R. PETRUS & P.J. FELLERS. J. Food Sci. 39, 855-856 (1974)—13 packs of 44.8° Brix frozen concentrated orange juice (FCOJ) were prepared using a commercially prepared 65° Brix Valencia frozen concentrated orange juice as a base product and essences produced by three different Florida commercial citrus processors. The essences differed in odor and flavor characteristics and chemical composition. Essence was added to twelve of the packs on the basis of total aldehydes. Each of the three essences was added to obtain levels of 5, 15, 30 and 45 mg/1 of total essence aldehydes in the reconstituted juices. The 13th pack contained no essence and was used as a control. All packs had coldpressed Valencia orange oil added to a level of 0.019% v/v in the reconstituted products. The packs were stored at -22.2°C. Flavor evaluations were made by twelve experienced taste panelists after storage
vii

ABSTRACTS :I N THIS ISSUE
periods of 1.5, 6, 9, 12, 15 and 30 months. Results indicate that essences produced by different recovery systems are distinct and differ in their chemical composition and strength. In some cases there is an optimum level of essence that can be added to a juice to improve its flavor, and higher levels can lower its flavor quality. Storage at -22.2°C had no effect on the flavor of products containing essence as a flavor enhancement material.
COLOR STABILITY OF MAPLE SIRUP IN VARIOUS RETAIL CONTAINERS. J.C. UNDERWOOD, J.C. KISSINGER, R.A. BELL & J.W. WHITE JR. J. Food Sci. 39, 857-858 (1974)-Reduced quality and availability of traditional tinned retail containers for pure maple sirup has prompted the appearance of plastic containers for this product. Tests in which four sirups were stored 6 months in glass, metal and two types of plastic containers at three temperatures showed that the sirups in both plastics darkened significantly more than in the other containers during the storage, and a significant interaction between temperature and container was shown. The possibility of a sirup falling to the next lower USDA grade during storage is pointed out.
AN ANTHOCYANIN RECOVERY SYSTEM FROM GRAPE WASTES.T. PHILIP. J. Food Sci. 39, 859 (1974)—A new anthocyanin recovery system from grape wastes based on tartaric acid-methanol extrac
tion followed by controlled precipitation of excess tartaric acid as potassium hydrogen tartrate is described. An artificial grape drink colored with the anthocyanin extract thus prepared was found to be acceptable.
SHELF LIFE OF FOODS. A Scientific Status Summary. IFT EXPERT PANEL ON FOOD SAFETY & NUTRITION. J. Food Sci. 39, 861-864(1974)-Attempts are constantly being made to maximize shelf life consistent with costs, distribution patterns and consumer use. Stability and shelf life are concerned with any element affecting the quality, wholesomeness, or performance of the product. Foods can be divided into two main categories: perishable (including semi-perishable) and shelf stable. Shelf-stable foods, although biologically stable, are subject to a variety of chemical changes that may adversely affect product quality or nutritive value. A prudent packaging system can provide adequate protection against oxygen and moisture, but temperature and time are less controllable variables, and shelf life of food is time-temperature dependent. Considerable progress has been made in the development of monitoring devices for frozen-foods but cost is still a drawback for general application. A 1971 USDA food freshness survey showed 25% of consumers were not completely satisfied with the freshness of their food purchases. Open dating is a step in the right direction enabling the consumer to shop more efficiently; however, it is only a guideline, not a guarantee. Vigi- lence on the part of the consumer is still necessary not only in making purchases but in the handling and storage prior to the time the product is ultimately consumed.
viii

T. RICHARDSONDept, o f F o o d Science, University o f Wisconsin-Madison, Madison, W! 53706
A SYMPOSIUM . . . complete in this issue
IMMOBILIZED ENZYMES IN FOOD SYSTEMS INTRODUCTION
A N I M M O B I L I Z E D e n z y m e i s a n e n z y m e t h a t h a s b e e n c h e m i c a l l y o r p h y s i c a l l y a t t a c h e d t o a w a t e r - i n s o l u b l e m a t r i x , p o l y m e r i z e d i n t o a w a t e r - i n s o l u b l e g e l o r e n t r a p p e d w i t h i n a w a t e r - i n s o l u b l e g e l m a t r i x o r w a t e r - i n s o l u b l e m i c r o - c a p s u l e
( Z a b o r s k y , 1 9 7 3 ) .I t i s r a t h e r a m a z i n g t h a t t h e f i r s t i m
m o b i l i z e d e n z y m e w a s p r e p a r e d in 1 9 1 6 a t C o l u m b i a U n i v e r s i t y b y N e l s o n a n d
G r i f f i n ( 1 9 1 6 ) w h o a d s o r b e d i n v e r t a s e o n c h a r c o a l a n d a l u m i n u m h y d r o x i d e g e l . T h is , o f c o u r s e , w a s s u b s t a n t i a l l y b e f o r e
t h e n a t u r e o f e n z y m e s w a s f u l l y u n d e r s t o o d . I n f a c t , t h e o b s e r v a t i o n t h a t i n v e r t a s e a c t i v i t y w a s a b s o r b e d f r o m s o l u t i o n b y c h a r c o a l w a s u s e d a s e v i d e n c e o f t h e c o l l o i d a l n a t u r e o f i n v e r t a s e . A b o u t 5 y r l a t e r a n o t h e r p a p e r w a s p u b l i s h e d o n t h e
a d s o r p t i o n o f i n v e r t a s e b y c h a r c o a l a n d a l u m i n u m h y d r o x i d e g e l b y N e l s o n a n d
H i t c h c o c k ( 1 9 2 1 ) . T h e s e e a r l y p a p e r s b y N e l s o n a n d c o - w o r k e r s a n t i c i p a t e d s o m e
o f t h e o b s e r v a t i o n s t h a t a r e b e i n g m a d e t o d a y . F o r e x a m p l e , t h e y s u g g e s t e d t h a t
t h e p H a t t h e a d s o r b e n t s u r f a c e m a y b e d i f f e r e n t t h a n i n t h e b u l k s o l u t i o n a n d
t h u s a f f e c t e n z y m e a c t i v i t y ; t h e y o b s e r v e d t h a t t h e a c t i v i t y o f t h e a d s o r b e d
e n z y m e w a s d e c r e a s e d u p o n b i n d i n g , b u t c o u l d b e i n c r e a s e d b y r a p id s t ir r i n g .
A l t h o u g h s o m e p e o p l e m i g h t a r g u e
t h a t i m m o b i l i z e d e n z y m e s r e s u l t e d f r o m t h e e v o l u t i o n a r y p r o c e s s , t h e o r i g i n s o f m a n - m a d e i m m o b i l i z e d e n z y m e s g o b a c k s o m e 5 7 y e a r s . H o w e v e r , h e r e c l e a r l y w a s
a n i d e a w h o s e t i m e h a d n o t c o m e . I n t h e s c i e n t i f i c e n v i r o n m e n t o f t h a t p e r i o d , w h e n e n z y m e t e c h n o l o g y w a s j u s t a
g l e a m in W a l l e r s t e i n ’s e y e , t h e t e c h n o l o g i c a l i m p l i c a t i o n s o f t h e s e o b s e r v a t i o n s
w e r e o b v i o u s l y n o t e v i d e n t .I t w a s n o t u n t i l 1 9 5 1 t h a t a d e v e l o p
m e n t in t h e f i e l d o f i m m u n o l o g y s i g n a l l e d t h e a d v e n t o f c o v a l e n t l y b o u n d e n z y m e s . C a m p b e l l e t a l . ( 1 9 5 1 ) a t t h e C a l i f o r n i a I n s t i t u t e o f T e c h n o l o g y c o v a l e n t l y b o u n d a n a n t i g e n t o c e l l u l o s e i n o r d e r t o i s o l a t e
a n t i b o d i e s . S h o r t l y t h e r e a f t e r , G r u b h o f e r a n d S c h l e i t h ( 1 9 5 3 , 1 9 5 4 ) i n G e r m a n y w e r e t h e f i r s t t o c o v a l e n t l y l i n k t h e e n z y m e s p e p s i n , d i a s t a s e , r i b o n u c l e a s e a n d c a r b o x y p e p t i d a s e t o a n i n s o l u b l e m a t r i x .
T h e c o n c e p t o f c o v a l e n t l y c o u p l i n g e n z y m e s t o s o l i d s u p p o r t s a p p a r e n t l y a p p e a l e d t o t h e v a n i t y o f t h e o r g a n i c c h e m i s t b e c a u s e i n t h e i n t e r v e n i n g 2 0 y r a v a r i e t y o f e n z y m e s h a s b e e n b o u n d t o
Fig. 1 —Publication frequencies for articles and patents on immobilized enzymes.
a n e v e r i n c r e a s i n g n u m b e r o f s u p p o r t s . I n
a d d i t i o n , a l t e r n a t i v e m e t h o d s o f e n z y m e i m m o b i l i z a t i o n h a v e b e e n d e v e l o p e d .
T h e e n t i r e a r e a o f i m m o b i l i z e d e n z y m e s h a s g e n e r a t e d i m m e n s e s c i e n t i f i c a n d t e c h n o l o g i c a l i n t e r e s t , n o t o n l y i n t h e
f i e l d o f f o o d - r e l a t e d r e s e a r c h , b u t a l s o in e n g i n e e r i n g , b i o c h e m i c a l , p h a r m a c e u t i c a l a n d m e d i c a l s c i e n c e s . I m m o b i l i z e d e n z y m e s h a v e t r e m e n d o u s i m p l i c a t i o n s in
p r o c e s s i n g a n d a n a l y s i s . I t i s n o t d i f f i c u l t t o v i s u a l i z e c o n t i n u o u s p r o c e s s e s i n v o l v in g i m m o b i l i z e d e n z y m e s i n v a r i o u s r e a c t o r m o d e s s u c h a s a p a c k e d o r a f l u i d i z e d b e d . I n a d d i t i o n i m m o b i l i z e d e n z y m e s m i g h t b e u s e d r e p e a t e d l y in b a t c h p r o c e s s e s . I n f o o d a n a l y s i s , i m m o b i l i z e d e n z y m e s c a n b r in g t o b e a r t h e s e n s i t i v i t y a n d s p e c i f i c i t y o f e n z y m i c a n a l y s e s , b u t o n a c o n t i n u o u s o r r e p e a t e d b a s i s . I m m o b i l i z e d e n z y m e s a r e a l s o o f i m p o r t a n c e t o t h e f o o d s c i e n t i s t i n t e r e s t e d i n p o s t m o r t e m a n d p o s t - h a r v e s t p h y s i o l o g y a s a n a l o g s o f p a r t i c u l a t e b o u n d e n z y m e s .
T h e i m m e n s e i n t e r e s t i n i m m o b i l i z e d e n z y m e s i s e m p h a s i z e d b y t h e a p p e a r a n c e o f a r e c e n t b o o k b y Z a b o r s k y ( 1 9 7 3 ) o n t h e s u b j e c t . I n t h i s b o o k a r e l i s t e d 4 8 2 j o u r n a l r e f e r e n c e s a n d 6 9 p a t e n t s r e l a t i n g t o i m m o b i l i z e d e n z y m e s . D e p i c t e d in F i g u r e 1 a r e t h e y e a r l y j o u r n a l p u b l i c a t i o n f r e q u e n c i e s a n d i s s u a n c e o f p a t e n t s t h r o u g h 1 9 7 1 . S t a r t i n g a b o u t 1 9 6 5 , j o u r n a l a r t i c l e s b e g a n t o a p p e a r a t a n e x p o n e n t i a l r a t e u n t i l in 1 9 7 1 a p p r o x i m a t e l y 1 3 0 p a p e r s w e r e p u b l i s h e d . T h e e n t h u s i a s m f o r p u b l i s h i n g o n i m m o b i l i z e d e n z y m e s i s c u r r e n t l y u n a b a t e d . H o w e v e r , i t i s i n t e r e s t i n g t o n o t e t h a t 1 9 7 0 w a s a p e a k y e a r f o r p a t e n t s , p o s s i b l y i n d i c a t i n g t h a t t h e b a s i c p a t e n t s h a v e b e e n i s s u e d . I t w i l l b e i n t e r e s t i n g t o s e e i f t h e r e w i l l b e s e c o n d a r y s u r g e s o f p a t e n t a c t i v i t y b a s e d o n p r o c e s s e s .
T h i s i n t e n s e i n t e r e s t in i m m o b i l i z e d e n z y m e s a n d t h e i m p l i c a t i o n s i t h a s f o r t h e f o o d i n d u s t r y a n d f o o d s c i e n c e , w e r e t h e r e a s o n s f o r h o l d i n g t h i s s y m p o s i u m . C o n s e q u e n t l y , p e o p l e w h o a r e a c t i v e in t h i s f i e l d h a v e c o l l e c t e d a n d r e v i e w e d t h e v a s t a m o u n t o f i n f o r m a t i o n t h a t h a s b e c o m e a v a i l a b l e . T h e f i r s t p a p e r ( H u l t i n ,1 9 7 4 ) r e v i e w s t h e v a r i o u s m e t h o d s f o r p r e p a r in g i m m o b i l i z e d e n z y m e s . T h e s e c o n d a r t i c l e ( O l s o n a n d R i c h a r d s o n ,
V o lu m e 3 9 ( 1 9 7 4 )-J O U F IN A L O F F O O D S C IE N C E - 645

6 4 6 -J O U R N A L OF FO O D S C IE N C E -V o lu m e 3 9 (1974)
1 9 7 4 ) c o v e r s s o m e o f t h e e n g i n e e r i n g
a s p e c t s in t h e u s e o f i m m o b i l i z e d e n z y m e s . T h e t h i r d c o n t r i b u t i o n ( S t a n l e y a n d O l s o n , 1 9 7 4 ) d e a l s w i t h m u l t i e n z y m e
s y s t e m s a n d t h e i r i m p l i c a t i o n s f o r f o o d s c i e n c e , w h e r e a s t h e f o u r t h p a p e r ( L e e
a n d T s a o , 1 9 7 4 ) r e v i e w s t h e u s e o f i m m o b i l i z e d e n z y m e s in f o o d p r o c e s s i n g
a n d a n a l y s i s .
REFERENCES
Campbell, D.H., Luescher, E. and Lerman, L.S.1951. Im m unologic adsorbents. 1. Isolation
of antibody by means of a cellulose-protein antigen. Proc. Nat. Acad. Sei., U .S . 37: 575.
Grubhofer, N. and Schleith, L. 1953. M odified ion exchange resins as specific adsorbents. Naturwiss. 40: 508.
Grubhofer, N. and Schleith, L. 1954. Coupling of proteins on diazotized polyam inostyrene. H oppe-Seyler’s Z. Physiol. Chem. 297: 108.
H ultin, H.O. 1974. Characteristics o f im m obilized m ulti-enzym ic system s. J. Food Sei. 39: 647.
Lee, Y.Y . and Tsao, G.T. 1974. Mass transfer characteristics of im m obilized enzym es. J. Food Sei. 39: 667.
Nelson, J.M. and Griffin, E.G. 1916. Adsorption of invertase. J. Am. Chem. Soc. 38: 1109.
N elson, J.M. and H itchcock, D.I. 1921 . The activity o f adsorbed invertase. J. Am. Chem.
Soc. 43: 1956.Olson, N .F. and Richardson, T. 197 4 . Im m obi
lized enzym es in food processing and analysis. J. F ood Sci. 39: 653 .
Stanley, W.L. and Olson, A.C. 1974 , The chem istry o f im m obilizing enzym es. J . Food Sci. 39: 660.
Zaborsky, O. 1973 . “ Im m obilized E nzym es.” CRC Press, Cleveland, Ohio.
Ms received 1 2 /1 8 /7 3 ; accepted 2 /5 /7 4 .Presented at the 33rd Annual M eeting o f the
Institute o f Food Technologists in Miami Beach.
Funds for publication were obtained from the College o f Agricultural and Life Sciences, University of Wisconsin, and the Cooperative State Research Service, U .S. D ept, o f Agriculture.

H. 0. HUL TINDept, of Food Science & Nutrition, University of Massachusetts, Amherst, MA 01002
SYMPOSIUM: Immobilized Enzymes in Food Systems CHARACTERISTICS OF IMMOBILIZED MULTI-ENZYM IC SYSTEMS
INTRODUCTION
T H E R E I S a g r e a t p o t e n t i a l f o r t h e u s e o f i m m o b i l i z e d e n z y m e s b o t h i n t h e f o o d
a n d t h e c h e m i c a l p r o c e s s i n d u s t r i e s , b a s e d p r i n c i p a l l y o n t h e r e c o v e r a b i l i t y o f i m m o b i l i z e d e n z y m e s a n d t h e a b i l i t y t o u s e t h e m i n c o n t i n u o u s f l o w r e a c t o r s . T h i s a l o n g w i t h t h e t w o f a c t o r s w h i c h m a k e
e n z y m e s u n i q u e a s c a t a l y s t s , t h a t i s , t h e i r e x t r e m e l y h i g h c a t a l y t i c a c t i v i t y a n d t h e i r
g r e a t s p e c i f i c i t y , p r e s e n t s p o s s i b i l i t i e s o f c a t a l y s t d e v e l o p m e n t w h i c h d i d n o t p r e v i
o u s l y e x i s t . I s h a l l d e s c r i b e s o m e g e n e r a l c h a r a c t e r i s t i c s o f m u l t i - e n z y m i c s y s t e m s
w h i c h e x i s t in n a t u r e t o g i v e a g e n e r a l
b a c k g r o u n d o f t h e c a t a l y t i c a d v a n t a g e s t h a t c a n a c c r u e f r o m t h e u s e o f m u l t i -
e n z y m i c s y s t e m s . I w i l l t h e n d i s c u s s s o m e g e n e r a l p r o p e r t i e s o f i m m o b i l i z e d m u l t i - e n z y m i c s y s t e m s a n d f i n a l l y p r e s e n t s o m e
v i e w s o n t h e p o s s i b l e f u t u r e d e v e l o p m e n t
o f m u l t i - e n z y m i c c a t a l y s t s .
S i n c e a l l m e t a b o l i c p r o c e s s e s a r e c a r r ie d o u t b y w h a t a r e , i n a s e n s e , m u l t i - e n z y m i c s y s t e m s ( s i n c e m o r e t h a n o n e e n z y m e is i n v o l v e d in t h e s e r e a c t i o n p r o c e s s e s ) , I s h a l l d e f i n e a m u l t i - e n z y m i c s y s t e m a s c o n s i s t i n g o f t w o o r m o r e e n z y m e s w h i c h e x i s t i n s o m e w a y p h y s i c a l l y o r i e n t e d t o e a c h o t h e r , i . e . , t h e y a r e n o t
h o m o g e n e o u s l y d i s t r i b u t e d i n s o l u t i o n .
M u l t i - e n z y m i c s y s t e m s i n n a t u r e c a n e x i s t a s i n s o l u b l e p a r t i c u l a t e a g g r e g a t e s , v e r y o f t e n c o m b i n e d w i t h s i g n i f i c a n t
a m o u n t s o f l i p i d s , o r t h e y m a y b e s o l u b l e e n t i t i e s . I t i s a l s o p o s s i b l e t h a t t h e y m a y e x i s t b o t h i n t h e a s s o c i a t e d a n d d i s s o c i a t e d f o r m s w i t h t h e a m o u n t o f a s s o c i a t i o n b e i n g d e t e r m i n e d b y t h e p a r t i c u l a r
c o n d i t i o n s i n t h e e n v i r o n m e n t .
I n T a b l e 1 a r e s h o w n s o m e o f t h e f u n c t i o n a l a d v a n t a g e s o f t h e s e n a t u r a l
m u l t i - e n z y m i c s y s t e m s . T h e r e i s , p r e s u m a b l y , a m o r e e f f i c i e n t t r a n s f e r o f s u b s t r a t e , t h a t i s , b y p r o p e r p h y s i c a l a r r a n g e m e n t o f s e q u e n t i a l e n z y m e s , t h e c e l l c a n i n c r e a s e t h e c a t a l y t i c e f f i c i e n c y o f t h e r e a c t i o n s e q u e n c e . T h i s w o u l d o c c u r b y in c r e a s e d e f f i c i e n c y in p a s s i n g t h e p r o d u c t o f a r e a c t i o n c a t a l y z e d b y o n e e n z y m e t o a s e c o n d e n z y m e in t h e s e q u e n c e
f o r w h i c h t h e p r o d u c t w o u l d s e r v e a s s u b s t r a t e . T h i s w o u l d m i n i m i z e d i f f u s i o n a l
r e s i s t a n c e s a n d , in f a c t , t h e p r o d u c t o f o n e r e a c t i o n m i g h t p o s s i b l y b e p a s s e d d i r e c t l y t o t h e s e c o n d e n z y m e w i t h n o i n t e r m e d i a t e t i m e b e i n g s p e n t in f r e e
s o l u t i o n . T h e p o s s i b i l i t y o f a s u r f a c e r e
a c t i o n a l s o e x i s t s . T h a t i s , t h e s e c o n d e n z y m e m i g h t a c t o n t h e p r o d u c t o f t h e f i r s t w h i l e i t i s s t i l l b o u n d t o t h e e n z y m e . T h u s , f o r e x a m p l e , l a c t a t e d e h y d r o g e n a s e h a s b e e n s h o w n t o b e c a p a b l e o f o x i d i z i n g N A D H w h i c h i s b o u n d t o g l y - c e r a l d e h y d e 3 - p h o s p h a t e d e h y d r o g e n a s e
( C o l o w i c k e t a h , 1 9 6 9 ) . T h e r e m o v a l o f r e s t r i c t i o n s c a u s e d b y d i f f u s i o n a l p r o c e s s e s w o u l d b e o f g r e a t i m p o r t a n c e i n s i t u a t i o n s w h e r e t h e a m o u n t o f s u b s t r a t e a v a i l a b l e w a s l i m i t i n g .
A n e x a m p l e o f i n c r e a s e d c a t a l y t i c
e f f i c i e n c y i s a 5 - e n z y m e c o m p l e x i s o l a t e d f r o m N e u r o s p o r a c r a s s a w h i c h c a t a l y s e s
t h e c o n v e r s i o n o f 3 - d e o x y - D - a r a b i n o -
h e p t u l o s o n a t e - 7 - p h o s p h a t e t o 3 - e n o l p y - r u v y l - s h i k i m a t e - 5 - p h o s p h a t e ( G a e r t n e r e t
a h , 1 9 7 0 ) . I t w a s f o u n d t h a t t h e r a t e o f t h e o v e r a l l r e a c t i o n i n v o l v i n g a l l f i v e e n z y m e s w a s g r e a t e r t h a n t h e r a t e s o f t h e
r e a c t i o n i n w h i c h k n o w n i n t e r m e d i a t e s , t h a t i s , p a s t t h e f i r s t s t e p o f t h e s e q u e n c e , w e r e a d d e d . A d d i t i o n o f t h e i n t e r m e d i a t e s d id n o t i n c r e a s e o r i n h i b i t t h e o v e r a l l
r e a c t i o n r a t e .
Table 1 —Functions o f m u lti-en zym ic
aggregates
M ore e ffic ie n t transfer o f substrate
P rodu ction , enhancem ent, or in h ib itio n of reaction by aggregation
S tab iliza tion o f in term ediates
Sharing o f cofactors U nid irectio na l reactions or contro l Establishm ent o f H + gradient or redox
poten tia lProvide hydrop hob ic area fo r reactions
Table 2 —Exam ples o f soluble m u lti-en zym ic
com plexes11
C om plex
N o . o f enzym ic
com ponents
Pyruvate dehydrogenase 3
a -K e to g lu ta ra te dehydrogenase 3
F a tty acid synthetase 6 (E. cod)7 (yeast)
T ry p to p h a n synthetase 2
a The data are taken from the and Cox (1966).
review by Reed
T h e s e c o n d f u n c t i o n t h a t a g g r e g a t i o n
o f e n z y m e s m i g h t h a v e is t h e p r o d u c t i o n ,
e n h a n c e m e n t o r i n h i b i t i o n o f a r e a c t i o n w h i c h i s d i r e c t l y c a u s e d b y t h e a g g r e g a t i o n . T h a t i s , t h e a c t i v i t y o f a n e n z y m e
m a y b e m o d i f i e d b y i t s i n t e r a c t i o n w i t h
o t h e r p r o t e i n s , o r a n a c t i v e s i t e m a y b e s h a r e d b y m o r e t h a n o n e p r o t e i n . T h i s
m a y o c c u r w i t h l i k e p r o t e i n s o r d i s s i m i l a r p r o t e i n s . A n e x a m p l e o f m o d i f i c a t i o n o f e n z y m e a c t i v i t y b y a g g r e g a t i o n i s t h a t o f a t w o e n z y m e c o m p l e x i s o l a t e d f r o m S a l m o n e l l a t y p h i m u r i u m c a t a l y z i n g t h e
f i r s t t w o r e a c t i o n s o f t h e b i o s y n t h e t i c p a t h w a y l e a d i n g t o t r y p t o p h a n e ( S m i t h a n d B a u e r l e , 1 9 6 9 ) . O n e e n z y m i c c o m p o n e n t i s s o l e l y r e s p o n s i b l e f o r c a t a l y s i s
o f t h e f i r s t r e a c t i o n . T h e s e c o n d c o m p o n e n t h a s a d u a l f u n c t i o n . I t n o t o n l y c a t a l y z e s t h e s e c o n d r e a c t i o n , b u t i t a l s o
a c t i v a t e s t h e f i r s t e n z y m i c r e a c t i o n .
A n o t h e r e x a m p l e is a p r o t e i n a g g r e g a t e i s o l a t e d f r o m t h e y e a s t S a c c h a r o m y c e s c e r e v i s i a e w h i c h c o n t a i n s b o t h a s p a r t a t e
t r a n s c a r b a m y l a s e a n d c a r b a m o y l p h o s p h a t e s y n t h e t a s e a c t i v i t i e s . S t u d i e s i n d i c a t e d t h a t o n l y a s i n g l e p r o t e i n w a s i n v o l v e d in t h e c o m p l e x , b u t i t s d e g r e e o f a s s o c i a t i o n w i t h o t h e r l i k e m o l e c u l e s t e n d e d t o f a v o r o n e o f t h e e n z y m i c a c t i v i t i e s o v e r t h e o t h e r ( L u e a n d K a p l a n ,1 9 6 9 ) .
T h e h y d r o p h o b i c i n t e r i o r o f a m u l t i - e n z y m i c a g g r e g a t e m a y s t a b i l i z e c e r t a i n
i n t e r m e d i a t e s o f t h e r e a c t i o n d u e t o t h e l o w d i e l e c t r i c c o n s t a n t o f t h e e n v i r o n m e n t ( G r e e n a n d S i l m a n , 1 9 6 7 ) . M u lt i - e n z y m i c c o m p l e x e s m a y a l s o s h a r e c o f a c t o r s ( R e e d a n d C o x , 1 9 6 6 ) .
T h e f i r s t f o u r f a c t o r s m e n t i o n e d in
T a b l e 1 r e f e r t o s o l u b l e m u l t i - e n z y m i c s y s t e m s a s w e l l a s p a r t i c u l a t e . I n T a b l e 2 a r e l i s t e d s o m e s p e c i f i c e x a m p l e s o f s o l u b l e m u l t i - e n z y m i c s y s t e m s . T h i s l i s t g iv e s t h e r e a c t i o n s e q u e n c e c a t a l y z e d b y t h e c o m p l e x a n d t h e n u m b e r o f e n z y m i c c o m p o n e n t s t h a t a r e a s s o c i a t e d w i t h e a c h o n e . I n g e n e r a l , n o t a s m u c h h a s b e e n a c c o m p l i s h e d w i t h m u l t i e n z y m i c s o l u b l e s y s t e m s a s w i t h p a r t i c u l a t e s y s t e m s . T h e r e a s o n f o r t h i s r e s i d e s in t h e d i f f i c u l t y in i s o l a t i n g a n d i d e n t i f y i n g m u . l t i - e n z y m i c s o l u b l e s y s t e m s . M a n y o f t h e p r o c e d u r e s u s e d in i s o l a t i n g e n z y m e s t e n d t o d i s s o c i a t e a g g r e g a t e s . E n z y m e c h e m i s t s h a y e b e e n t r a i n e d t o o b t a i n a h ig h s p e c i f i c a c t i v i t y o f a s i n g l e a c t i v i t y d u r in g i s o l a t i o n o f a n e n z y m e a n d s o n o r m a l l y t e n d
t o d e v e l o p p r o c e d u r e s w h i c h w o u l d e l i m i -
Volum e 3 9 ( 1974)—JO U R N A L O F FOOD S C IE N C E - m i

648-J O U R N A L O F FO O D S C IE N C E -V o lu m e 3 9 (1 9 7 4 )
Fig. 1 —Schematic representation of multi-enzymic system inside semipermeable membrane. Substrate (S) can pass through the pores, but enzymes (E) can not.
n a t e o b s e r v a n c e o f t h e s e m u l t i - e n z y m i c c o m p l e x e s . I t i s k n o w n t h a t a l d o l a s e a n d a - g l y c e r o l p h o s p h a t e d e h y d r o g e n a s e o f t h e g l y c o l y t i c s y s t e m c a n b e i s o l a t e d a s
m i x e d c r y s t a l s ( B a r a n o w s k i a n d N i e d e r - l a n d , 1 9 4 9 ) . I t h a s b e e n s u g g e s t e d , t h e r e f o r e , t h a t p e r h a p s t h e y e x i s t a s a c o m p l e x in v i v o . I t h a s a l s o b e e n s h o w n t h a t g l y - c e r a l d e h y d e - 3 - p h o s p h a t e d e h y d r o g e n a s e
e n h a n c e s t h e a c t i v i t y o f a l d o l a s e ( K w o n
a n d O l c o t t , 1 9 6 5 ) , a n d i t h a s b e e n s u g g e s t e d t h a t t h i s i n t e r a c t i o n m i g h t o c c u r in v i v o . T h e s e e x a m p l e s o f i n t e r a c t i o n s b e t w e e n “ s o l u b l e ” p r o t e i n s a r e r a r e h o w e v e r .
M a n y m e t a b o l i c r e a c t i o n s e q u e n c e s a r e c a r r ie d o u t b y p a r t i c u l a t e e n z y m e s v e r y o f t e n a s s o c i a t e d w i t h m e m b r a n e o u s s y s t e m s s u c h a s m i t o c h o n d r i a , c h l o r o p l a s t s , m i c r o s o m e s , o r n u c l e i . S o m e o f t h e s e s y s t e m s h a v e v e r y h i g h d e g r e e s o f o r g a n i z a t i o n a n d t h e v a r i o u s e n z y m i c c o m p o n e n t s m a y b e l o c a l i z e d i n d i f f e r e n t p a r t s o f t h e v a r i o u s p a r t i c u l a t e s t r u c t u r e s . T h e l a s t t h r e e f u n c t i o n s o f m u l t i - e n z y m i c a g g r e g a t e s l i s t e d i n T a b l e 1 r e f e r s p e c i f i c a l l y t o t h e s e p a r t i c u l a t e m u l t i - e n z y m i c a g g r e g a t e s . T h e s e i n c l u d e u n i d i r e c t i o n a l r e a c t i o n s o r c o n t r o l , i . e . , a n e n z y m e w i l l i n t e r a c t w i t h s u b s t r a t e , i n h i b i t o r , o r a c t i v a t o r o n o n l y o n e s i d e o f a m e m b r a n e ( C h a n c e a n d F u g m a n n , 1 9 6 1 ) . P a r t i c u l a t e m u l t i - e n z y m i c s y s t e m s m a y b e i n v o l v e d in t h e e s t a b l i s h m e n t s o f a h y d r o g e n i o n
g r a d i e n t o r a r e d o x p o t e n t i a l a c r o s s t h e m e m b r a n e ( M i t c h e l l , 1 9 6 9 ) . I t h a s b e e n s u g g e s t e d t h a t m e m b r a n e s y s t e m s p r o v i d e a n o n a q u e o u s e n v i r o n m e n t f o r c a r r y i n g
o u t c e r t a i n r e a c t i o n s ( K a t c h a l s k i e t a l . ,1 9 7 1 ) .
A n o t h e r t y p e o f a g g r e g a t i o n t h a t m a y p o s s i b l y o c c u r i n n a t u r a l s y s t e m s is t h e i n t e r a c t i o n o f s o l u b l e e n z y m e s w i t h
m a c r o m o l e c u l a r o r p a r t i c u l a t e s t r u c t u r e s u n d e r s o m e c o n d i t i o n s . T h e s e i n t e r a c t i o n s m a y m o d i f y t h e k i n e t i c p r o p e r t i e s o f t h e s o l u b l e e n z y m e . S o m e e x a m p l e s o f
i n t e r a c t i o n s t h a t h a v e b e e n o b s e r v e d in v i t r o a r e s h o w n i n T a b l e 3 . T h e r e i s n o s e t
p a t t e r n , a n d c h a n g e s i n V m 3 X , M ic h a e l i s c o n s t a n t a n d i n h i b i t o r c o n s t a n t c a n c h a n g e i n e i t h e r d i r e c t i o n d e p e n d i n g b o t h o n t h e e n z y m e a n d o n t h e p a r t i c u l a t e o r m a c r o m o l e c u l a r m a t e r i a l w i t h w h i c h t h e e n z y m e i n t e r a c t s . S u c h i n t e r a c t i o n s m a y p l a y a r o l e i n b r i n g i n g t h e p r o d u c t o f t h e r e a c t i o n c a t a l y z e d b y t h e e n z y m e t o t h e
p a r t i c u l a t e e n z y m i c s t r u c t u r e f o r m o r e e f f i c i e n t u t i l i z a t i o n .
ARTIFICIALLY IMMOBILIZED ENZYMES
I T W I L L m o s t l i k e l y n o t b e p o s s i b l e t o
d u p l i c a t e t h e s p e c i f i c i t y a n d c o m p a t i b i l i t y o f n a t u r a l l y o c c u r r i n g m u l t i - e n z y m i c s y s t e m s i n t h e c o n s t r u c t i o n o f m u l t i - e n z y m i c r e a c t o r s , a l t h o u g h i t m a y b e f e a s i b l e a n d d e s i r a b l e t o u s e t h e s e n a t u r a l
m u l t i - e n z y m i c c o m p l e x e s t h e m s e l v e s a f t e r i s o l a t i o n . T h e m o s t g e n e r a l a p p r o a c h
s e e m s t o b e t h e u s e o f t h e p h y s i c a l c h a r a c t e r i s t i c s o f m u l t i - e n z y m i c s y s t e m s t o a c h i e v e t h e d e s i r e d r e s u l t s .
O n e o f t h e s i m p l e s t t e c h n i q u e s w o u l d b e t o p u t s e v e r a l s o l u b l e e n z y m e s b e h i n d a s e m i p e r m e a b l e m e m b r a n e . M a n y g e o m e t r i e s w o u l d b e p o s s i b l e i n t h i s t y p e o f s y s t e m . I n F i g u r e 1 i s s h o w n o n e o f t h e s i m p l e s t w h i c h s h o w s a c a p s u l e i n s i d e o f
w h i c h a r e p la c e d s o l u b l e e n z y m e s . T h e m e m b r a n e h a s p o r e s t h r o u g h w h i c h t h e s u b s t r a t e c a n g e t in a n d p r o d u c t o u t , b u t t h e p o r e s a r e t o o s m a l l f o r t h e m o v e m e n t o f t h e e n z y m e s . T h i s t y p e o f e x p e r i m e n t h a s b e e n p e r f o r m e d w i t h s i n g l e e n z y m e s w i t h o r w i t h o u t c r o s s - l i n k i n g o f t h e e n z y m e s ( C h a n g , 1 9 7 1 ) . G e n e r a l l y , l o w a c t i v i t i e s h a v e b e e n f o u n d w h i c h h a v e b e e n
a s c r i b e d t o a s l o w d i f f u s i o n o f s u b s t r a t e in a n d p r o d u c t o u t . T h e s i t u a t i o n t h a t i s i n d i c a t e d i n t h e f i g u r e s h o w s a m u l t i - e n z y m i c s y s t e m . T h e r e m a y b e s o m e a d v a n t a g e w i t h t h i s t y p e o f s y s t e m . F o r e x a m p l e , s u b s t r a t e f o r t h e f i r s t e n z y m e w o u l d c o m e i n , b e a c t e d o n , a n d b e f o r e t h e p r o d u c t h a s t i m e t o d i f f u s e o u t a g a i n , i t g e t s a c t e d o n b y t h e s e c o n d e n z y m e a n d s o o n a n d s o f o r t h .
I f c o n d i t i o n s a r e a d j u s t e d p r o p e r l y ,
Table 3 —Soluble enzym e-particu late in teractions
E nzym e-p artic le R esult o f in teraction Reference
Lactate dehydrogenase- muscle particulates
Decrease in V ^ a x -' increase in K |; no change in K ^ .
H u ltin e t al. (1 9 7 2 ) Ehm ann and
H u ltin (1 9 7 3 ).
G lyceraldehyde phosphate dehydrogenase-m uscle particles
Decrease in V |yja x ; no change in K |; decrease in K ^ .
Dagher (1 9 7 1 ).
H exokinase-m itochondria V M a x . k m variab le; increase in K |
K arpa tk in (1 9 6 7 );Kosow and Rose (1 9 6 8 ); Southard and H u ltin (1 9 7 2 ).
A ldo lase-F -actin Increase in V |yja x ; increase in K m .
A rn o ld and Pette (1 9 7 0 ).

IM M O B IL IZ E D M U L T I-E N Z Y M IC SYSTEM S-649
Fig. 2 —Diffusion processes in one- and two-enzyme immobilized s / s - tems. If the activity o f E2 is high compared to diffusionat processes, Pl will be converted to P2 before it has time to diffuse away from the surface.
t h e f i n a l p r o d u c t o f t h e f o u r t h r e a c t i o n w i l l b e f o r m e d b e f o r e t h e m a t e r i a l h a s a c h a n c e t o d i f f u s e o u t o f t h e p a r t i c l e . T h u s w i t h t h e m u l t i - e n z y m i c s y s t e m , a d v a n t a g e m a y b e t a k e n o f t h e p h y s i c a l
c h a r a c t e r i s t i c s o f t h e s y s t e m s u c h t h a t t h e r e l a t i v e l y s l o w d i f f u s i o n c a n b e u t i l i z e d t o c o m p l e t e t h e r e a c t i o n w i t h m i n i m u m r e l e a s e o f i n t e r m e d i a t e s i n t o t h e b u l k p h a s e o f t h e s o l u t i o n .
W it h e n z y m e s i m m o b i l i z e d o n t o a s o l id s u p p o r t s u r f a c e , d i f f u s i o n m a y b e a p r o b l e m i n c o n t r o l l i n g t h e r a t e o f r e a c t i o n o f t h e c a t a l y s t . I n f a c t , w i t h m o s t s i n g l e e n z y m e s y s t e m s , a t t e m p t s a r e m a d e
t o k e e p d i f f u s i o n t o a m i n i m u m s o t h a t k i n e t i c f a c t o r s c a n p r e d o m i n a t e . I n F i g u r e 2 i s i l l u s t r a t e d t h e d i f f e r e n c e b e t w e e n a s i n g l e - a n d a t w o - e n z y m e s y s t e m i m m o b i l i z e d o n t o t h e s u r f a c e o f a s u p p o r t . I n t h e t o p r e p r e s e n t a t i o n , a s i n g l e e n z y m e
i s a t t a c h e d t o t h e s u r f a c e . T h e r e is i n d i c a t e d t h e d i f f u s i o n l a y e r a s w e l l a s d i f f u s i o n o f t h e s u b s t r a t e i n a n d p r o d u c t
o u t . I f t h e p r o c e s s o f d i f f u s i o n i s s l o w c o m p a r e d w i t h t h e r a t e o f t h e e n z y m i c r e a c t i o n , t h e n t h e o v e r a l l r a t e w i l l b e c o n t r o l l e d b y d i f f u s i o n r a t h e r t h a n t h e c a t a l y t i c p r o p e r t i e s o f t h e i m m o b i l i z e d e n z y m e ( K a t c h a l s k i e t a l . , 1 9 7 1 ) .
W it h t h e m u l t i - e n z y m i c s y s t e m , w e m a y b e a b l e t o u t i l i z e t h i s d i f f u s i o n t o a d v a n t a g e . T h e b o t t o m r e p r e s e n t a t i o n in t h e f i g u r e s h o w s w h a t m i g h t o c c u r w i t h a s i m p l e t w o - e n z y m e s y s t e m . D i f f u s i o n o f
s u b s t r a t e t o t h e s u r f a c e w h e r e t h e e n z y m e i s l o c a t e d a g a in o c c u r s . T h e p r o d u c t o f t h e f i r s t r e a c t i o n i s p r o d u c e d a n d i f t h e r e a c t i o n r a t e o f t h e s e c o n d e n z y m e is
r e l a t i v e l y f a s t c o m p a r e d w i t h t h e d i f
f u s i o n p r o c e s s e s , t h e p r o d u c t o f t h e f i r s t r e a c t i o n , w h i c h i s t h e s u b s t r a t e f o r t h e s e c o n d r e a c t i o n , m a y b e a c t e d u p o n b e f o r e i t h a s t i m e t o d i f f u s e a w a y f r o m t h e
s u r f a c e a n d o u t o f t h e d i f f u s i o n la y e r . A g a i n , w e a r e u t i l i z i n g t h e p h y s i c a l p r o p e r t i e s o f t h e s y s t e m , t h i s t i m e t h e r e l a t i v e l y s l o w d i f f u s i o n o f p r o d u c t a w a y f r o m t h e s u r f a c e , t o i m p r o v e t h e e f f i c i e n c y o f t h e o v e r a l l t w o - e n z y m e r e a c t i o n .
K a t c h a l s k i e t a l . ( 1 9 7 1 ) h a v e p r e d i c t e d , b a s e d o n t h e o r e t i c a l c o n s i d e r a t i o n t h a t in a m u l t i - e n z y m i c s y s t e m w h e r e t h e e n z y m i c a c t i v i t i e s a r e r e l a t i v e l y h i g h a n d t h u s d i f f u s i o n c o n t r o l l e d , t h e r a t e o f p r o d u c t i o n o f e n d p r o d u c t i n a t w o e n z y m e s y s t e m in t h e e a r l y s t a g e s o f t h e r e a c t i o n w i l l b e h i g h e r i n t h e i m m o b i l i z e d e n z y m e
s y s t e m t h a n w o u l d b e p r e d i c t e d f o r a c o r r e s p o n d i n g h o m o g e n e o u s s o l u b l e s y s t e m . M o s b a c h a n d M a t t i a s s o n ( 1 9 7 0 ) w o r k e d w i t h t h e t w o - e n z y m e s y s t e m o f h e x o k i n a s e a n d g l u c o s e - 6 - p h o s p h a t e d e h y d r o g e n a s e a t t a c h e d t o b o t h S e p h a r o s e a n d a c o p o l y m e r o f a c r y l a m i d e a n d a c r y l i c a c i d a n d o b t a i n e d t h e t y p e o f r e s u l t s i n d i c a t e d i n F i g u r e 3 . A l t h o u g h t h e f i n a l r e a c t i o n r a t e s o f h o m o g e n e o u s a n d h e t e r o g e n e o u s s y s t e m s w e r e s im i l a r , t h e r e w a s a d e f i n i t e la g p h a s e i n t h e h o m o g e n e o u s s o l u b l e s y s t e m w h i c h d i d n o t o c c u r i n t h e i m m o b i l i z e d h e t e r o g e n e o u s s y s t e m . T h e s e
w o r k e r s a s c r i b e d t h i s t o a c c u m u l a t i o n o f
Fig. 3 —Schematic representation o f activity o f two-enzyme system im- Fig. 4 —Schematic representation of pH optima of two enzymes (Ei andmobilized to solid support and free in solution (taken from Mosbach E2). Optimal pH of the overall reaction catalyzed by the enzymes isand Mattiasson, 1970). intermediate (after Gestrelius e t at., 1972).

6 5 0 -J O U R N A L OF FO O D S C IE N C E - V olum e 3 9 ( 1974)
t h e p r o d u c t o f t h e f i r s t r e a c t i o n w i t h i n t h e N e r n s t d i f f u s i o n la y e r a t t h e s u r f a c e
o f t h e c a t a l y s t p a r t i c l e s . T h e S w e d i s h g r o u p f o u n d a n e v e n g r e a t e r a d v a n t a g e
w i t h a t h r e e - e n z y m e i m m o b i l i z e d s y s t e m
c o m p a r e d t o t h e s o l u b l e t h r e e - e n z y m e
s y s t e m ( M a t t i a s s o n a n d M o s b a c h , 1 9 7 1 ) .
I n o u r l a b o r a t o r y , w e h a v e w o r k e d o n
t h e d u a l s y s t e m o f g l u c o s e o x i d a s e - c a t a la s e . G l u c o s e o x i d a s e c a t a l y z e s t h e o x i d a t i o n o f b e t a - D - g l u c o p y r a n o s e t o g l u c o n o -
d e l t a - l a c t o n e a n d h y d r o g e n p e r o x i d e . H y d r o g e n p e r o x i d e is t h e n d e c o m p o s e d
w i t h c a t a l a s e . W e d e f i n e “ e f f i c i e n c y ” o f
t h i s s y s t e m a s t h e p e r c e n t a g e o f t h e r a t e o f h y d r o g e n p e r o x i d e u t i l i z a t i o n o b t a i n e d
w i t h t h e d u a l s y s t e m a s c o m p a r e d t o t h a t
o b t a i n e d in t h e p r e s e n c e o f e x c e s s c a t a la s e t a k e n a s 1 0 0 % . T h e r a t e o f t h e r e a c t i o n o f g l u c o s e o x i d a s e in t h e p r e s e n c e o f
e x c e s s s o l u b l e c a t a l a s e w a s e x a c t l y o n e - h a l f t h e r a t e i n t h e a b s e n c e o f c a t a l a s e . T h i s i s w h a t w o u l d b e t h e o r e t i c a l l y e x p e c t e d i f a l l o f t h e h y d r o g e n p e r o x i d e
p r o d u c e d b y t h e g l u c o s e o x i d a s e w a s i m m e d i a t e l y u s e d u p b y t h e e x c e s s c a t a l a s e . T h e s e r e s u l t s i n d i c a t e t h a t w e d o n o t
h a v e d i f f u s i o n a l r e s t r i c t i o n s o f t h e c a t a la s e i n t o t h e s i l i c a a l u m i n a p a r t i c l e s t h a t
w e r e u s e d a n d i n d i c a t e t h a t t h e m e a s u r e m e n t o f t h e r a t e o f h y d r o g e n p e r o x i d e u t i l i z a t i o n i s a v a l id i n d i c a t i o n o f t h e e f f i
c i e n c y o f t h e d u a l e n z y m e s y s t e m .
W e h a v e c o m p a r e d t h e g l u c o s e o x i d a s e - c a t a l a s e s y s t e m i m m o b i l i z e d t o g e t h e r o n a n i c k e l - i m p r e g n a t e d s i l i c a a l u m i n a s u p p o r t t o t h a t i n w h i c h t h e e n z y m e s a r e i m m o b i l i z e d o n t o s e p a r a t e s u p p o r t s u r f a c e s . W e h a v e a l s o c o m p a r e d b o t h o f t h e s e t o t h e s o l u b l e s y s t e m . T h e
p r e d i c t i o n w o u l d b e t h a t g r e a t e r a c t i v i t y
w o u l d b e o b t a i n e d w h e n t h e t w o e n z y m e s a r e o n a s i n g l e s u r f a c e , t h e s o l u b l e w o u l d b e s o m e w h a t l e s s e f f i c i e n t , a n d t h e
e n z y m e o n d i f f e r e n t p a r t i c l e s w o u l d b e l e s s s t i l l . T h i s l a t t e r i s d u e t o t h e f a c t t h a t w h e n t h e e n z y m e s a r e o n d i f f e r e n t p a r t i c l e s , t h e p r o d u c t o f t h e f i r s t r e a c t i o n w o u l d h a v e t o d i f f u s e a w a y f r o m o n e p a r t i c l e t o a n o t h e r .
I n a b a t c h t y p e a s s a y , w e h a v e f o u n d t h a t t h e t w o - e n z y m e s y s t e m o n a s i n g l e
s u p p o r t i s s e v e r a l t i m e s m o r e e f f i c i e n t t h a n t h e t w o - e n z y m e s y s t e m o n d i f f e r e n t s u r f a c e s . T h e e f f i c i e n c y o f t h e s o l u b l e
g l u c o s e o x i d a s e - c a t a l a s e s y s t e m w a s b e t w e e n t h e s e t w o .
A n o t h e r i m p o r t a n t f a c t o r in t h e e f f i c i e n c y o f a d u a l e n z y m e s y s t e m i s t h e
a b s o l u t e a c t i v i t i e s o f e n z y m e s t h a t a r e u s e d ( K a t c h a l s k i e t a l . , 1 9 7 1 ) . I n T a b l e 4 , w e s h o w s o m e r e s u l t s w e h a v e o b t a i n e d w i t h g l u c o s e o x i d a s e a n d c a t a l a s e i m
m o b i l i z e d a t v a r i o u s a b s o l u t e l e v e l s o n n i c k e l - i m p r e g n a t e d s i l i c a a l u m i n a p a r t i c l e s . T h e r a t i o s o f t h e e n z y m e s w e r e k e p t a p p r o x i m a t e l y t h e s a m e . I t c a n b e s e e n
t h a t a s t h e t o t a l a c t i v i t y o f t h e e n z y m e is l o w e r e d , t h e e f f i c i e n c y o f t h e s y s t e m is
l o w e r e d . T h e e x p l a n a t i o n f o r t h i s b e h a v i o r i s t h a t a s t h e t o t a l a c t i v i t i e s o f t h e t w o e n z y m e s a r e l o w e r e d , t h e a v e r a g e d i s t a n c e b e t w e e n g l u c o s e o x i d a s e a n d c a t a la s e g e t s t o b e g r e a t e r . E v e n t u a l l y it w i l l b e c o m e g r e a t e r t h a n t h e d i s t a n c e f r o m t h e s u r f a c e t o t h e e d g e o f t h e u n s t i r r e d l a y e r . T h u s , i t b e c o m e s e a s i e r f o r t h e h y d r o g e n p e r o x i d e t o e s c a p e t o t h e b u l k o f t h e s o l u t i o n t h a n i t i s t o g e t t o t h e n e x t e n z y m e .
A n o t h e r f a c t o r w h i c h w i l l a f f e c t t h e p e r f o r m a n c e o f m u l t i - e n z y m e s y s t e m s is t h e r a t i o o f t h e e n z y m e s i n v o l v e d . W e h a v e s h o w n in o u r l a b o r a t o r y t h a t t h e
Table 4 —E ffe c t o f absolute activities o f du a l-im m o b ilized enzym es
at constant ra tio on e ffic iency o f system 3
Glucose oxidase a c tiv ity 15
Catalasea c tiv ity 15 R atio
E ffic iency
(% )c
76 123 1 /1 .6 3 77
53 8 8 1 /1 .6 5 6 5
9 .8 17 .5 1 /1 .8 0 26
a The enzymes were immobilized on a 5% nickel-impregnated silica alumina support with glutaraldehyde. Assays were performed at pH 5.5 and 25°C.
b Activity ^ moles 0 2 per sec per mg support X 1 0 1 2 . c Efficiency is the percentage rate of H20 2 utilization of the dual-
immobitized system compared to that in the presence of excess catalase.
- E, e2'
rE 2 e2
- e2 E,-
•e2 Ed
-E, e2-E, E f
-e2 e2-
z 2/ 2w -EZ E I E,
e2 ^
uf / /' E, E2
h' ! ^ E2
0 > E'
yE2
E2\
E,
v “2 ' Er7E, E2
I 2
e2 E\lI2 / '
~ E r K 2
y \ E|2 ei
e2\
Fig. 5—Means of immobilizing two enzymes onto solid surface. Top: direct immobilization, Middle: immobilization of organic polymer followed by immobilization of enzymes: Bottom: Crosslinking of enzymes followed by immobilization.

IM M O B IL IZ E D M U L T I-E N Z Y M IC S Y S T E M S -651
h i g h e s t r a t e o f c o n v e r s i o n o f H 2 O 2 i n t h e
i m m o b i l i z e d g l u c o s e o x i d a s e - c a t a l a s e s y s t e m o c c u r s w h e r e t h e r a t i o o f c a t a l a s e
t o g l u c o s e o x i d a s e is h i g h e s t ( u n p u b l i s h e d o b s e r v a t i o n ) .
I n F i g u r e 4 i s i l l u s t r a t e d t h e t y p e o f
r e s u l t s w h i c h G e s t r e l i u s e t a l . ( 1 9 7 2 ) o b t a i n e d o n t h e e f f e c t o f p H o n t h e t w o - e n z y m e s y s t e m o f a m y l o g l u c o s i d a s e a n d g l u c o s e o x i d a s e . T h e f i r s t e n z y m e w a s u t i l i z e d t o h y d r o l y z e m a l t o s e t o g l u c o s e
w h i c h w a s t h e n o x i d i z e d b y t h e g l u c o s e o x i d a s e . T h e a m y l o g l u c o s i d a s e h a s a
l o w e r p H o p t i m u m t h a n d o e s t h e g l u c o s e
o x i d a s e a n d is e q u i v a l e n t t o E l a n d g l u c o s e o x i d a s e is e q u i v a l e n t t o E 2 s h o w n in t h i s f i g u r e . O n i m m o b i l i z a t i o n o f t h e t w o e n z y m e s t o S e p h a r o s e , a n o n i o n i c s u p p o r t , t h e p H o p t i m a o f t h e t w o e n z y m e s d id n o t c h a n g e . I n t h e s o l u b l e s y s t e m , i f
t h e p H o p t i m u m i s d e t e r m i n e d f o r t h e o v e r a l l r e a c t i o n s e q u e n c e , a v a l u e s o m e w h e r e b e t w e e n t h e p H o p t i m a o f t h e t w o s in g le e n z y m e s w o u l d b e e x p e c t e d . T h i s i s i l l u s t r a t e d b y t h e s o l u b l e E l p l u s E 2 in F i g u r e 5 . T h e a u t h o r s s u g g e s t t h a t w h e r e
e x a c t l y t h i s o p t i m u m w i l l b e l o c a t e d w i l l d e p e n d o n t h e r e l a t i v e a m o u n t s o f t h e t w o e n z y m e s . A s t h e a m y l o g l u c o s i d a s e e n z y m e i s in c r e a s e d ( E l ) , i t w i l l s h i f t t h e p H o p t i m u m u p w a r d s b e c a u s e t h e o v e r a l l r e a c t i o n t h e n b e c o m e s m o r e d e p e n d e n t o n t h e g l u c o s e o x i d a s e a c t i v i t y s i n c e i t b e c o m e s m o r e r a t e l i m i t i n g . H o w e v e r , o n
i m m o b i l i z i n g t h e t w o - e n z y m e s y s t e m a n d c a r r y in g o u t t h e o v e r a l l r e a c t i o n , a s h i f t is
s e e n t o w a r d s t h e a l k a l i n e s i d e u t i l i z i n g
t h e s a m e a c t i v i t i e s o f E l a n d E 2 a s w e r e
u s e d in t h e s o l u b l e s y s t e m . T h e a u t h o r s
a t t r i b u t e d t h i s e f f e c t t o b e t h e r e s u l t o f
i n c r e a s i n g t h e c o n c e n t r a t i o n o f t h e i n t e r m e d i a t e , g l u c o s e , in t h e m i c r o e n v i r o n
m e n t o f t h e b o u n d s y s t e m d u r in g t h e i n i t i a l p h a s e o f t h e t w o - e n z y m e r e a c t i o n .
S i n c e t h e g l u c o s e i s i n c r e a s e d i n c o n c e n t r a t i o n a t t h e s u r f a c e , i t g i v e s t h e s a m e
e f f e c t a s w o u l d b e o b s e r v e d o n i n c r e a s i n g t h e g l u c o s i d a s e e n z y m e ( E l ) in t h e s o l u b l e s y s t e m , t h u s m a k i n g t h e g l u c o s e o x i d a s e e n z y m e s o m e w h a t m o r e r a t e l i m i t i n g
in t h e r e a c t i o n . T h i s w o u l d s h i f t t h e p H o p t i m u m o f t h e o v e r a l l s y s t e m c l o s e r t o t h a t o f g l u c o s e o x i d a s e ( E 2 ) .
W e h a v e n o t o b t a i n e d c o m p a r a b l e r e s u l t s w i t h t h e g l u c o s e o x i d a s e - c a t a l a s e s y s t e m . T h e r a t i o o f g l u c o s e o x i d a s e x a t a - la s e h a d n o e f f e c t o n t h e o p t i m u m p H o f t h e o v e r a l l t w o - e n z y m e r e a c t i o n . T h e p H o p t i m u m r e m a i n e d a t a p p r o x i m a t e l y 5 .5
o v e r a r a n g e o f e n z y m e r a t i o s . T h i s p H is t h e o p t i m u m f o r g l u c o s e o x i d a s e a n d w o u l d i n d i c a t e t h a t t h e f i r s t r e a c t i o n , t h a t i s t h e o n e c a t a l y z e d b y g l u c o s e o x i d a s e , w a s t h e o n e d e t e r m i n i n g t h e o v e r a l l o p t i m u m o f t h e d u a l e n z y m e s y s t e m .
It c a n n o t b e a s s u m e d t h a t u t i l i z a t i o n o f t h e d i f f u s i o n l a y e r is a l w a y s g o i n g t o r e s u l t in a n a d v a n t a g e in a g i v e n m u l t i e n z y m e s y s t e m . T h e d i f f u s i o n l a y e r a n d s u b s e q u e n t b u i l d - u p o f p r o d u c t in t h e
v i c i n i t y o f t h e s u r f a c e m a y b e a d i s a d v a n t a g e i f t h e s e c o n d e n z y m e in a d u a l s y s t e m is s u b j e c t t o s u b s t r a t e i n h i b i t i o n . O n e w o u l d t h e n h a v e t o b e v e r y c a r e f u l in
h o w f a s t t h e s u b s t r a t e a c c u m u l a t e d s i n c e i t m ig h t i n h i b i t t h e e n z y m e . L i k e w i s e , a
p r o b l e m c o u l d a r i s e i f t h e p r o d u c t o f o n e
o f t h e e n z y m e s i n h i b i t e d e i t h e r o f t h e e n z y m e s . U t i l i z a t i o n o f m u l t i - s t e p e n z y m i c p r o c e s s e s c a n o f t e n b e d o n e m o r e e f f i c i e n t l y , h o w e v e r , w i t h a n i m m o b i l i z e d
s y s t e m i f t h e c a t a l y s t i s c o n s t r u c t e d t o t a k e a d v a n t a g e o f t h e p h y s i c a l p a r a m e t e r s o f t h e s y s t e m .
FUTURE DEVELOPMENTSG R E A T L I M I T A T I O N S w i l l b e p l a c e d o n t h e u s e o f m u l t i - e n z y m i c r e a c t i o n s i f
m e a n s a r e n o t d e v e l o p e d t o r e t a i n a n d r e c y c l e e x p e n s i v e c o f a c t o r s . I f a r e a c t i o n i n v o l v e s t h e o x i d a t i o n o f N A D H t o N A D + , f o r e x a m p l e , t h e r e a c t i o n w o u l d q u i c k l y u s e u p c o f a c t o r u n l e s s t h e r e w a s s o m e
m e a n s o f r e g e n e r a t i n g N A D H . T h i s c o u l d b e d o n e w i t h a s e c o n d e n z y m e s y s t e m u t i l i z i n g a n o t h e r e n z y m i c r e a c t i o n w h i c h r e c o n v e r t s t h e N A D + t o t h e r e d u c e d c o f a c t o r a s i n d i c a t e d b e l o w . T h i s m a y b e d o n e b y c o n c u r r e n t l y f e e d i n g s u b s t r a t e s A a n d B H 2 i n t o t h e r e a c t o r s u c h t h a t
N A D H + A + H + E .‘ - N A D + + A H 2
E 2N A D + + B H 2 N A D H + B + H +
t h e o x i d a t i o n - r e d u c t i o n r e a c t i o n s p r o c e e d c o n t i n u o u s l y a n d s i m u l t a n e o u s l y . T h i s w o u l d r e q u i r e a p r o c e d u r e t o s e p a r a t e B
a n d A H 2 . S im i la r c o n s i d e r a t i o n s w o u l d h a v e t o b e g i v e n t o o t h e r c o f a c t o r s s u c h
a s A T P .T h e p o s s i b i l i t y o f i m m o b i l i z i n g c o f a c
t o r o n t o a s o l u b l e m a c r o m o l e c u l e s u c h a s
a p o l y s a c c h a r i d e h a s b e e n s u g g e s t e d . T h e
e n z y m e m i g h t s t i l l b e a b l e t o i n t e r a c t w i t h t h e c o f a c t o r . B o t h t h e e n z y m e a n d
i m m o b i l i z e d c o f a c t o r c o u l d b e r e t a i n e d d u r in g t h e r e a c t i o n b y a s e m i p e r m e a b l e m e m b r a n e . I f t h e e n z y m e w e r e a l s o i m m o b i l i z e d in t h e s y s t e m , t h e s h e e r b u l k o f t h e i m m o b i l i z e d e n z y m e a n d c o f a c t o r
w o u l d m a k e i t d i f f i c u l t f o r t h e m t o i n t e r a c t .
A s e m i p e r m e a b l e m e m b r a n e m i g h t b e u s e d w i t h o u t i m m o b i l i z a t i o n o f t h e c o f a c t o r , b u t s i n c e t h e s i z e o f t h e c o f a c t o r is
o f t e n o n l y s l i g h t l y la r g e r t h a n t h e s u b s t r a t e o f t h e r e a c t i o n s , t h i s w o u l d n o t l e a v e m u c h o f a r a n g e i n p o r e s i z e w h i c h c o u l d b e u s e d . T h e r e w o u l d b e , t h e r e f o r e , v e r y p o o r d i f f u s i o n r a t e s o f s u b s t r a t e i n t o a n d p r o d u c t o u t o f t h e s y s t e m .
A n o t h e r p o s s i b i l i t y w o u l d b e t h e i m m o b i l i z a t i o n o f t h e c o f a c t o r d i r e c t l y t o t h e e n z y m e o r e n z y m e s c o n c e r n e d . H o w e v e r , t h i s h a s n o t y e t b e e n a c c o m p l i s h e d e x p e r i m e n t a l l y , a n d t h e r e is n o h a r d e v i d e n c e t h a t t h i s i s a f e a s i b l e a p p r o a c h .
A l t h o u g h m u c h o f t h e w o r k i n v o l v i n g
i m m o b i l i z a t i o n o f e n z y m e s h a s u s e d
o r g a n i c p o l y m e r s a s t h e s u p p o r t i n g m a t e r ia l , t h e r e a r e s o m e v e r y p r a c t i c a l l i m i t a t i o n s t o t h e u s e o f t h i s t y p e o f s u p p o r t in
i n d u s t r i a l r e a c t o r s . F o r t h i s r e a s o n , a
g r e a t d e a l o f i n t e r e s t h a s c e n t e r e d o n t h e d e v e l o p m e n t o f e n z y m e s i m m o b i l i z e d t o
i n o r g a n i c s u p p o r t s . T h e m a j o r a d v a n t a g e s o f i n o r g a n i c o v e r o r g a n i c s u p p o r t s a r e
t h e i r g o o d d i m e n s i o n a l s t a b i l i t y t o s u c h
t h i n g s a s p H a n d s o l v e n t e n v i r o n m e n t a n d t h e f a c t t h a t t h e y a r e n o t a t t a c k e d b y
m i c r o o r g a n i s m s . T h e i r r i g i d i t y a n d s t r u c
t u r e a l l o w r e a s o n a b l y g o o d f l o w r a t e s in a
c o l u m n - t y p e r e a c t o r . T h e y h a v e t h e d i s a d v a n t a g e c o m p a r e d w i t h o r g a n i c s u p p o r t s , h o w e v e r , o f a r e l a t i v e l y s m a l l s u r f a c e a r e a . T o i n c r e a s e t h e a r e a o f t h e
s u p p o r t s , m o s t o f t h e s e m a t e r i a l s c a n b e
m a d e p o r o u s . P o r o u s g l a s s h a s b e e n w i d e l y s t u d i e d in t h i s r e s p e c t ( W e e t a l l a n d H e r s h , 1 9 6 9 ) . W e h a v e f o u n d , h o w e v e r , b e t t e r m e c h a n i c a l s t a b i l i t y w i t h s u c h s u p p o r t s a s s i l i c a a l u m i n a o r K i e s e l g u h r . T h e y a r e a l s o m u c h c h e a p e r t h a n p o r o u s g la s s .
I t m a y b e d e s i r a b l e t o in c r e a s e t h e
e f f e c t i v e s u r f a c e a r e a o f t h e s e i n o r g a n i c s u p p o r t s s t i l l f u r t h e r . A c o u p l e o f
a p p r o a c h e s t o w a r d s t h i s e n d a r e s h o w n in
F i g u r e 5 , w h e r e t w o e n z y m e s d e s i g n a t e d E l a n d E 2 h a v e b e e n i m m o b i l i z e d t o t h e
s u r f a c e o f a c y l i n d r i c a l p o r e . T h e t o p p i c t u r e s h o w s t h e t y p i c a l c a s e o f t w o e n z y m e s b o u n d t o a s u r f a c e . A n o t h e r s y s t e m w h i c h h a s b e e n s u g g e s t e d ( R o y e r e t a l . , 1 9 7 3 ) i s s h o w n in t h e c e n t e r o f F i g u r e
5 . A n o r g a n i c p o l y m e r i s i m m o b i l i z e d t o t h e s u r f a c e o f t h e i n o r g a n i c s u p p o r t . T h e e n z y m e s c a n t h e n b e a t t a c h e d t o t h e p o l y m e r .
W e a r e w o r k i n g o n t h e s y s t e m s h o w n
a t t h e b o t t o m . T h e e n z y m e s a r e f i r s t c r o s s l i n k e d o r p o l y m e r i z e d t o e a c h o t h e r
a n d t h e n t h i s p o l y m e r i z e d , m u l t i - e n z y m e c o m p l e x i s a t t a c h e d t o t h e s u r f a c e o f t h e p o r e . T h e s e l a t t e r t w o a p p r o a c h e s b o t h t e n d t o g i v e a g r e a t e r c o n c e n t r a t i o n o f e n z y m e w i t h i n t h e p o r e . T h i s i s e q u i v a l e n t t o i n c r e a s i n g t h e s u r f a c e a r e a .
T h e d i s t a n c e w h i c h a n e n z y m e is f r o m t h e s u r f a c e o f t h e s u p p o r t m a y h a v e i m p o r t a n t i m p l i c a t i o n s o n t h e p r o p e r t i e s o f t h e e n z y m e . T a y l o r a n d S w a i s g o o d( 1 9 7 2 ) s t u d i e d t h e e f f e c t o f c o u p l i n g d i s t a n c e o n t h e k i n e t i c p a r a m e t e r s o f i m m o b i l i z e d t r y p s i n . T h e c a t a l y t i c r a t e w a s n o t a f f e c t e d b u t t h e K M d e c r e a s e d a t s h o r t d i s t a n c e s . T h e a u t h o r s s u g g e s t e d t h a t t h i s w a s d u e t o t h e g r e a t e r i n t e r a c t i o n o f s u b s t r a t e w i t h t h e h y d r o p h o b i c
s u r f a c e .
A n o t h e r m a j o r a r e a o f d e v e l o p m e n t w h i c h I f o r s e e i s t h e u s e o f n a t u r a l m u l t i - e n z y m i c s y s t e m s . T h e s e m a y b e p a r t i c u l a t e o r s o l u b l e . I n t h e c a s e o f s o l u b l e s y s t e m s , i t m a y b e n e c e s s a r y t o f i r s t c r o s s l i n k t h e i n d i v i d u a l p r o t e i n s t o g iv e

652-J O U R N A L OF FO O D S C IE N C E -V o lu m e 3 9 (1 9 7 4 )
s t a b i l i t y a n d t o p r e v e n t d i s a g g r e g a t i o n u n d e r c o n d i t i o n s o f r e a c t i o n . I n t h e c a s e
o f p a r t i c u l a t e s y s t e m s , s u c h a s m i t o c h o n d r ia , i t m a y b e p o s s i b l e t o i m m o b i l i z e t h e m e m b r a n e d i r e c t l y o n t o a n i n o r g a n i c s u p p o r t e i t h e r b y a c o v a l e n t - t y p e l i n k a g e o r
p e r h a p s s i m p l y b y a d s o r p t i o n . P r io r t r e a t m e n t w i t h a c r o s s l i n k i n g a g e n t s u c h a s g l u t a r a l d e h y d e m a y a l s o b e u s e d t o m a k e t h e e n z y m e s y s t e m s o f t h e m e m b r a n e l e s s l i k e l y t o b e w a s h e d o u t ( E l la r e t a l . , 1971).
W e s h o u l d n o t c o n s e n t t o r e s t r i c t o u r s e l v e s t o o m u c h o n t h e b a s i s o f w h a t n a t u r e h a s p r o v i d e d . T h e r e is n o r e a s o n w h y s y s t e m s c o u l d n o t b e s e t u p u t i l i z i n g s o l u b l e e n z y m e s a n d m e m b r a n e s in c o m b i n a t i o n s w h i c h d o n o t o c c u r in n a t u r e . I n t h i s w a y w e c o u l d t a i l o r t h e p a r t i c u l a r i m m o b i l i z e d s y s t e m s t o o u r p a r t i c u l a r n e e d s . T h e w a y s t h a t w e c a n p u t t h e s e
c a t a l y s t s t o g e t h e r w i l l b e l i m i t e d o n l y b y o u r i m a g i n a t i o n s . T h e p r o c e s s o f i m m o b i l i z a t i o n a n d s p e c i f i c a l l y t h e i m m o b i l i z a t i o n o f m u l t i - e n z y m i c s y s t e m s s h o u l d
o p e n u p a n e w e r a i n t h e u s e o f t h e s e c a t a l y s t s i n p r o c e s s e s i m p o r t a n t t o m a n .
REFERENCES
Arnold, H. and Pette, D. 1970. Binding of aldolase and triosephosphate dehydrogenase to F-aetin and m odification o f catalytic properties o f aldolase. Eur. J. Biochem. 15: 360.
Baranowski, T. and Niederland, T.R. 1949 . Aldolase activity o f m yogen A. J. Biol. Chem. 180: 543.
Chance, B. and Fugmann, U. 1961 . ATP induced oxidation of exogenous cytochrom e C in terminally inhibited phosphorylating particles. Biochem . Biophys. Res. Comm. 4: 317.
Chang, T.M.S. 1971 . Stabilization of enzym es by m icroencapsulation with a concentrated
protein solution or by m icroencapsulation follow ed by cross-linking with glutaraldehyde. Biochem . Biophys. Res. Comm. 44: 1531.
Colowick, S.P., van Eys, J. and Park, J.H. 1969. Dehydrogenation. In “Comprehensive Biochem istry,” Ed. Florkin, M. and Stotz, E.H. V ol 14. p. 27. Elsevier, Amsterdam.
Dagher, S.M. 1971. Association of glyceralde- hyde-3-phosphate dehydrogenase with sub- cellular fractions o f chicken breast muscle. Ph.D. thesis, Univ. o f M assachusetts, Amherst, Mass.
Ehmann, J. and Hultin, H.O. 1973. Substrate inhibition of soluble and bound lactate dehydrogenase (isoenzym e 5). Arch. Biochem. Biophys. 154: 471.
Ellar, D.J., M unoz, E. and Salton, M.R.J. 1971. The effect o f low concentrations o f glutaraldehyde on M icrococcus lysodeikticus membranes: changes in the release o f m em brane-associated enzym es and membrane structure. Biochim. Biophys. Acta 225: 140.
Gaertner, F .H., Ericson, M.C. and DeMoss, J.A.1970 . Catalytic facilitation in vitro by two m ultienzym e com plexes from Neurospora crassa. J. Biol. Chem. 245: 595.
Gestrelius, S., M attiasson, B. and Mosbach, K.1972 . Studies on pH-activity profiles o f an im m obilized tw o-enzym e system . Biochim . Biophys. Acta 276: 339.
Green, D.E. and Silman, I. 1 967 . Structure o f the m itochondrial electron transfer chain. In “ Annual Review Plant P hysiology,” Ed. Machlis, L., Briggs, W.R. and Park, R.B. Vol 18 , p. 156 . Annual Reviews, Inc., Palo Alto, Calif.
Hultin, H.O., Ehmann. J.D. and M elnick, R.L.1972. M odification of kinetic properties of muscle lactate dehydrogenase by subeellular associations and possible role in the control o f glycolysis. J. Food Sci. 37: 269.
Karpatkin, S. 1967 . Soluble and particulate hexokinase o f frog skeletal m uscle. J. Biol. Chem. 242: 3525.
Katchalski, E., Silman, I. and Goldman, R.1971 . E ffect o f the m icroenvironm ent on the m ode o f action of im m obilized enzym es. In “ Advances in E nzym ology,” Ed. Nord, F .F. V ol 34 , p. 445 . Interscience Publ., New York.
Kosow, D.P. and Rose, I. 1968. Ascites tumor m itochondrial hexokinase. 2. E ffect o f binding on kinetic properties. J. Biol. Chem. 243: 3623.
Kwon, T.-W. and O lcott, H.S. 1965. Augmentation of aldolase activity by glyeeraldehyde-3-phosphate dehydrogenase. Biochem . Biophys. Res. Comm. 19: 300.
Lue, P.F. and Kaplan, J.G. 1969 . The aspartate transcarbamylase and carbom oyl phosphate synthetase of yeast: A m ulti-functional enzym e com plex. Biochem . B iophys. Res. Comm. 34: 426.
Mattiasson, B. and Mosbach, K. 1971 . Studies on a m atrix-bound three-enzym e system . Biochim. Biophys. Acta 235: 253.
M itchell, P. 1969 . The chem ical and electrical com ponents o f the electrochem ical p oten tial of H+ ions across the m itochondrial cristae membrane. In “M itochondria: Structure and F unction ,” Ed. Em ster, L. and Drahota, Z., Vol 17, p. 219. Federation of European Biochem ical Societies, Academ ic,N.Y.
Mosbach, K. and M attiasson, B. 1970 . Matrix- bound enzym es. Part 2: Studies on a matrix- bound tw o-enzym e-system . Acta Chem. Scand. 24: 2084 .
Reed, L.J. and Cox, D.J. 196 6 . Macro m olecular organization o f enzym e system s. In Annual Review Biochem istry, Ed. Boyer, P.D ., V ol 35, Part I, p. 80 . Annual Reviews, Inc., Palo Alto, Calif.
Royer, G.P., Andrews, J.P. and U y, R. 1973 . Support materials for im m obilized enzym es. Enzym e Technol. Digest 1 99.
Smith, D. and Bauerle, H. 1969 . The anthranil- ate synthetase-5-phosphorylribose 1-pyrophosphate phosphoribosyl transferase com plex o f the tryptophan pathway in Salm onella typhim urium. Purification by the in vitro assembly o f its subunits. Biochem istry 8: 1451.
Southard, J.H. and Hultin, H.O. 1 972 . The effect o f energy charge on the activity of solubilized and bound m itochondrial h exokinase from chicken skeletal m uscle. Arch. Biochem . Biophys. 153: 468.
Taylor, J.B. and Swaisgood, H.E. 1972. A kinetic study on the effect o f coupling distance betw een insoluble trypsin and its carrier m atrix. Biochim . Biophys. Acta 284: 268.
Weetall, H.H. and Hersh, L-S. 1969 . Urease covalently coupled to porous glass. Biochim . Biophys. Acta 185: 464.
Ms received 1 2 /1 8 /7 3 ; accepted 2 /5 /7 4 .Presented at the 33rd Annual M eeting of the
Institute o f Food Technologists in MiamiBeach.
This work was supported in part by grant GI3 4 976 from the National Science Foundation.
Work performed in my laboratory was performed principally by Dr. Mokhtar T. Atallah,Mr. James C. Bouin and Mrs. Phyllis Dudgeon.

N . F. O L S O N a n d T. R IC H A R D S O N
D e p t, o f F o o d S c ie n c e , U n iv e r s ity o f W isco n s in -M a d iso n , M a d iso n , W ! 5 3 7 0 6
SYMPOSIUM: Immobilized Enzymes in Food Systems IMMOBILIZED ENZYMES IN FOOD PROCESSING AND ANALYSIS
INTRODUCTION
A S I N D I C A T E D in t h e p r e v i o u s s y m p o s i u m p a p e r s , m o s t o f t h e w o r k o n i m m o b i l i z e d e n z y m e s h a s d e a l t w i t h t e c h n i q u e s o f i m m o b i l i z a t i o n , k i n e t i c b e h a v i o r o f
i m m o b i l i z e d e n z y m e s a n d s t a b i l i t y d u r in g u s e a n d s t o r a g e . O n l y a l i m i t e d n u m b e r o f s t u d i e s w e r e c o n c e r n e d w i t h f o o d s y s t e m s o r u t i l i z e d c o n d i t i o n s w h i c h m i g h t o c c u r d u r in g f o o d p r o c e s s i n g . T h e p r e s e n t p a p e r
w i l l f o c u s o n p r o p e r t i e s , u s a g e a n d t y p e s o f i m m o b i l i z e d e n z y m e s t h a t m u s t b e c o n s i d e r e d i n t h e a p p l i c a t i o n o f i m m o b i l i z e d e n z y m e s in f o o d s y s t e m s .
IMMOBILIZATION VARIABLESC R I T I C A L F A C T O R S i n t r e a t m e n t o f
f o o d s y s t e m s w i t h i m m o b i l i z i n g e n z y m e s a r e : e c o n o m i c s o f i m m o b i l i z a t i o n ; s u i t a b i l i t y o f c o m p o n e n t s , u s e d f o r i m m o b i l i z a t i o n , i n f o o d s y s t e m s ; a c t i v i t y o f i m m o b i l i z e d e n z y m e ; c h a r a c t e r i s t i c s o f s u b s t r a t e a n d m e d i u m b e i n g t r e a t e d ; s t a b i l i t y o f i m m o b i l i z e d e n z y m e ; a n d p o t e n t i a l f o r m i c r o b i a l g r o w t h d u r in g u s e o f i m m o b i l i z e d e n z y m e s .
E c o n o m i c s
E c o n o m i c s o f i m m o b i l i z a t i o n d e p e n d
n o t o n l y u p o n o r i g i n a l i n v e s t m e n t i n e n z y m e a n d c o m p o n e n t s f o r i m m o b i l i z i n g
e n z y m e s b u t a l s o o n a c t i v i t y a n d s t a b i l i t y o f e n z y m e s . I t i s b e y o n d t h e s c o p e o f t h i s
p a p e r t o d e t e r m i n e u n i t c o s t s o f v a r i o u s i m m o b i l i z e d e n z y m e s y s t e m s .
O f v a r i o u s c o s t c o m p o n e n t s , c o s t o f f e r m e n t a t i o n w o u l d b e a m i n o r p o r t i o n
o f t h e t o t a l i n p r o d u c t i o n o f i m m o b i l i z e d e n z y m e s ; p u r i f y i n g e n z y m e s f r o m t h e f e r m e n t a t i o n b r o t h c o n s t i t u t e s a m a j o r s h a r e . H o w e v e r , i m m o b i l i z a t i o n t e c h n i q u e s m a y s i m p l i f y o r e v e n e l i m i n a t e s o m e o f t h e s t e p s i n t h e e n z y m e p u r i f i c a t i o n . C r u d e e x t r a c t s o f e n z y m e s m a y b e i m m o b i l i z e d a n d u s e d t o t r e a t f o o d s s i n c e e x t r a n e o u s e n z y m e s a n d p r o t e i n s w o u l d n o t c o n t a m i n a t e t h e f i n i s h e d f o o d . I m m o b i l i z a t i o n o f e n z y m e s a l s o m a y p u r i f y e n z y m e s a s s u g g e s t e d i n r e c e n t s t u d i e s b y W a n g a n d V i e t h ( 1 9 7 3 ) . T h e s e w o r k e r s d e s c r i b e d a m e t h o d o f e l e c t r o d e p o s i t i o n o f a n e n z y m e - c o l l a g e n m i x t u r e u s i n g a c r u d e e n z y m e . E l e c t r o d e p o s i t i o n o f c o l l a g e n f r o m a s lu r r y w a s d e s c r i b e d a l s o b y K a r u b e e t a l . ( 1 9 7 1 ) a n d u s e d b y S u z u k i e t a l . ( 1 9 7 2 ) t o e l e c t r o d e p o s i t a - a m y l a s e -
c o l l a g e n i n f i l m s o n p l a t i n u m e l e c t r o d e s .
O n e e c o n o m i c f a c t o r t h a t h a s n o t r e c e i v e d m u c h a t t e n t i o n in t h e l i t e r a t u r e is
c o m p l e t e n e s s o f i m m o b i l i z i n g a n e n z y m e .
E n t r a p m e n t o r b i n d i n g e n z y m e s t o i n s o l u b l e s u p p o r t s o n a c o m m e r c i a l s c a l e
o b v i o u s l y w o u l d h a v e t o a v o i d l o s s o f e n z y m e e x p e r i e n c e d i n m o s t s t u d i e s . T h i s m a y b e c i r c u m v e n t e d b y h a v in g a n e x c e s s o f e n z y m e b i n d i n g s i t e s o n t h e i n s o l u b l e
s u p p o r t . H o w e v e r , t h i s w o u l d r e s u l t i n l o w e r e n z y m i c a c t i v i t y p e r u n i t o f i n s o l u b l e e n z y m e a n d w o u l d i n c r e a s e t h e s i z e o f
t h e e n z y m e r e a c t o r . A l t e r n a t i v e l y , t h e a m o u n t o f e n z y m e a n d p o t e n t i a l b i n d i n g
s i t e s c o u l d b e e q u i v a l e n t b u t t h i s w o u l d r e q u i r e c a r e f u l c o n t r o l a n d t h e c a p a b i l i t y
o f m o n i t o r i n g e x t e n t o f b i n d i n g . V e r y f e w e x a m p l e s o f c o m p l e t e i m m o b i l i z a t i o n o f e n z y m e s i n s o l u t i o n h a v e b e e n r e p o r t e d . H o w e v e r , T o s a e t a l . ( 1 9 6 6 b ) o b t a i n e d c o m p l e t e a b s o r p t i o n o f a m i n o - a c y l a s e o n D E A E - c e l l u l o s e c o l u m n s b y
c o n t r o l l i n g c o n c e n t r a t i o n a n d f l o w r a t e s o f e n z y m e s o l u t i o n s t h r o u g h t h e c o l u m n . T h e p r o c e s s o f c o u p l i n g e n z y m e s t o s o l i d
s u p p o r t s c o n t a i n e d i n a c o l u m n m i g h t b e s i m p l i f i e d a l s o b y u s i n g m u l t i p l e c o l u m n s s im i la r t o s y s t e m s u s e d f o r e x t r a c t i n g r e n - n i n f r o m c a l f v e l d s . E n z y m e s o l u t i o n
c o u l d b e p u m p e d t h r o u g h s e v e r a l c o l u m n s in s e r i e s a t a r a t e s o t h a t n o e n z y m e
i s p r e s e n t in t h e e f f l u e n t .
I m m o b i l i z a t i o n m a y b e a m a j o r c o s t
c o m p o n e n t d e p e n d i n g o n t h e m a t e r i a l
u s e d f o r i m m o b i l i z a t i o n . I n t e r a c t i n g p a r a m e t e r s i n c l u d e d in c o s t c a l c u l a t i o n a r e c o s t o f m a t e r i a l s , l a b o r r e q u i r e d f o r i n i t i a l i m m o b i l i z a t i o n a n d s u b s e q u e n t m a i n t e n a n c e , p e r c e n t a g e o f s o l u b l e e n z y m e
i m m o b i l i z e d , s t a b i l i t y a n d a c t i v i t y o f e n z y m e , f l o w r a t e i f c o n t i n u o u s s y s t e m s a r e u s e d a n d c a p a b i l i t y f o r c o m p l e t e c o n v e r s i o n o f s u b s t r a t e t o p r o d u c t . C h i b a t a e t
a l . ( 1 9 7 2 ) c o m p a r e d v a r i o u s p a r a m e t e r s t o b e c o n s i d e r e d in p r e p a r a t i o n o f i m m o b i l i z e d a m i n o a c y l a s e s . T h e s e i n c l u d e d e a s e o f p r e p a r in g c o l u m n s , a c t i v i t y o f i m m o b i l i z e d e n z y m e , s t r e n g t h o f b i n d i n g f o r c e a n d a b i l i t y t o r e g e n e r a t e t h e c o l u m n . W h i l e t h e i r o b s e r v a t i o n s c a n n o t b e
a p p l i e d t o a l l s i t u a t i o n s , t h e i r a p p r o a c h t o t h e p r o b l e m s h o u l d b e c o n s i d e r e d .
S u i t a b i l i t y o f c o m p o n e n t s
E v e n t h o u g h t h e i m m o b i l i z e d e n z y m e
a n d s u p p o r t i n g m a t e r i a l s s h o u l d n o t c o n t a m i n a t e t h e f i n i s h e d f o o d , e f f i c a c y o f t h e c o m p o n e n t s o f i m m o b i l i z e d e n z y m e s
m u s t b e c o n s i d e r e d . I m m o b i l i z e d e n
z y m e s w o u l d h a v e t o b e e v a l u a t e d a s a n y
o t h e r f o o d c o n t a c t s u r f a c e a n d p r e s u m a b l y s a t i s f y t h e s a m e r e q u i r e m e n t s f o r l a c k
o f c o n t a m i n a t i o n . T h e c o m p o n e n t s w o u l d
h a v e t o b e g e n e r a l l y r e c o g n i z e d a s s a f e o r i t w o u l d h a v e t o b e d e m o n s t r a t e d t h a t t h e r e is n o l i k e l i h o o d o f c a r r y o v e r t o f o o d .
A c t i v i t y o f e n z y m e
A c t i v i t y o f e n z y m e s a l m o s t a l w a y s d e c r e a s e s a s a r e s u l t o f i m m o b i l i z a t i o n . T h e
e x t e n t o f d e c r e a s e d e p e n d s o n t h e i m m o b i l i z a t i o n t e c h n i q u e , c o n d i t i o n s r e q u i r e d f o r e n z y m i c t r e a t m e n t , c h a r a c t e r i s t i c s o f s u p p o r t i n g m a t e r i a l s , d i f f u s i o n r a t e s o f s u b s t r a t e t o a n d p r o d u c t f r o m t h e e n z y m e , a n d m o l e c u l a r w e i g h t o f t h e s u b s t r a t e . T h e c o m p l e x i t y a n d v a r i a t i o n
o f c h a r a c t e r i s t i c s o f f o o d s y s t e m s p r e c l u d e a n y g e n e r a l i z a t i o n s a b o u t o p t i m u m i m m o b i l i z a t i o n t e c h n i q u e s .
E n c a p s u l a t i o n o r e n t r a p m e n t o f e n z y m e s w i t h i n l a t t i c e s r e t a i n s t h e e n z y m e i n s o l u t i o n b u t i s l i m i t e d g e n e r a l l y t o l o w
m o l e c u l a r w e i g h t s u b s t r a t e s a n d p r o d u c t s c a p a b l e o f d i f f u s i n g t h r o u g h t h e e n t r a i n in g m a t e r i a l . T h i s w a s i l l u s t r a t e d b y l a c k o f c a s e i n o l y t i c a c t i v i t y o f t r y p s i n i m m o b i l i z e d in x e r o g e l ( J o h n s o n a n d W a te - l e y , 1 9 7 1 ) . E x a m p l e s o f l a t t i c e - e n t r a p p e d
e n z y m e s , w i t h p o t e n t i a l in t h e f o o d i n d u s t r y , t h a t p o s s e s s e d g o o d a c t i v i t y w e r e g l u c o s e i s o m e r a s e ( S t r a n d b e r g a n d S m i l e y , 1 9 7 1 ) , a n d a s p a r t a s e ( T o s a e t a l . ,1 9 7 3 ) .
E n z y m e s c o v a l e n t l y b o n d e d t o a w a t e r - i n s o l u b l e s u p p o r t o r e n z y m e s in - s o l u b i l i z e d b y c r o s s l i n k i n g w i t h m u l t i f u n c t i o n a l r e a g e n t s a l s o p o s s e s s l o w e r
a c t i v i t i e s a g a i n s t m a c r o m o l e c u l e s t h a n t h e i r n a t i v e f o r m s b e c a u s e o f s t e r i c a n d d i f f u s i o n a l l i m i t a t i o n s . T h i s w a s i l l u s t r a t e d b y m o d i f i c a t i o n o f a - c h y m o t r y p s i n c o u p l e d t o c y a n o g e n b r o m i d e a c t i v a t e d S e p h a d e x ( A x e n e t a l . , 1 9 7 0 ) . T h e i n s o l u b l e e n z y m e p o s s e s s e d 1 5 % o f t h e s p e c i f i c a c t i v i t y o f i t s s o l u b l e c o u n t e r p a r t . S o l u b i l i z a t i o n o f S e p h a d e x w i t h d e x t r a n a s e i n c r e a s e d t h e s p e c i f i c a c t i v i t y o f t h e e n z y m e d e r i v a t i v e t o 7 0 % . S t e r i c h i n d r a n c e i n d u c e d b y t h e c a r r ie r w a s i l l u s t r a t e d a l s o b y h i g h e r a c t i v i t y r a t e s o f w a t e r - i n s o l u b l e d e r i v a t i v e s o f p o l y t y r o s y l t r y p s i n a n d p a p a i n a g a i n s t B A E E a s c o m p a r e d t o c a s e i n ( B a r - E l i a n d K a t c h a l s k i , 1 9 6 3 ; G o l d s t e i n , 1 9 7 0 ; G o l d s t e i n e t a l . , 1 9 7 0 ; S i l m a n e t a l . , 1 9 6 6 ) . A n u m b e r o f o t h e r e x a m p l e s o f s t e r i c h i n d r a n c e o f p r o t e i n s
Volum e 3 9 (1 9 7 4 )-J O U R N A L O F FOOD S C IE N C E -6 5 3

6 5 4 -J O U R N A L OF FO O D S C IE N C E -V o /u m e 3 9 (1974)
h a v e b e e n r e p o r t e d b y G o l d m a n e t a l .( 1 9 7 1 ) . T h e s i z e o f c a r r ie r a l s o c a n a f f e c t r a t e s o f e n z y m i c a c t i o n e v e n o n s m a l l e r s u b s t r a t e s a s i l l u s t r a t e d b y t h e a c t i o n o f g l u c o a m y l a s e c o u p l e d t o b r o m o -
a c e t y l a n d i o d o a c e t y l c e l l u l o s e o n m a l t o s e ( M a e d a a n d S u z u k i , 1 9 7 2 ) . S m a l l e r
e n z y m e - c e l l u l o s e p a r t i c l e s h a d g r e a t e r a c t i v i t y a n d l o w e r a p p a r e n t M ic h a e l i s c o n s t a n t s a s c o m p a r e d t o la r g e r p a r t i c l e s .
Characteristics of food systemsM a c r o m o l e c u l a r s u b s t r a t e s o r o t h e r
c o m p o n e n t s i n f o o d s a n d h i g h i o n i c s t r e n g t h s o f m a n y f o o d s c o m p l i c a t e u s e
o f i m m o b i l i z e d e n z y m e s a n d d i c t a t e , in p a r t , t h e m e t h o d o f i m m o b i l i z a t i o n . S t e r - i c e f f e c t s c a n b e m i n i m i z e d d u r in g t r e a t m e n t o f m a c r o m o l e c u l a r s u b s t r a t e s b y a t t a c h i n g t h e e n z y m e t o a “ t e t h e r ” w h i c h
i s c o u p l e d t o a s o l i d s u p p o r t ( T a y l o r a n d S w a i s g o o d , 1 9 7 2 ) . T e t h e r s h a v e b e e n
u s e d v e r y e f f e c t i v e l y i n a f f i n i t y c h r o m a t o g r a p h y o f e n z y m e s e s p e c i a l l y f o r i n t e r a c t i n g s y s t e m s o f l o w a f f i n i t y ( C u a t r e -
c a s a s , 1 9 7 1 ) .I n a d d i t i o n t o t h e i r e f f e c t o n e n z y m a t
i c a c t i v i t y , c o l l o i d a l f o o d c o n s t i t u e n t s a l s o l i m i t u s e o f p a c k e d b e d r e a c t o r s a n d m a y e v e n h a v e d e t r i m e n t a l e f f e c t s o n c o n t i n u o u s l y s t i r r e d r e a c t o r s . P r e c i p i t a t i o n o f p r o t e i n a n d p e p t i d e s o n a p e p s i n - g l a s s b e a d c o l u m n o c c u r r e d d u r in g c o n t i n u o u s
t r e a t m e n t o f m i l k a t l o w t e m p e r a t u r e s
( F e r r i e r e t a l . , 1 9 7 2 ) . P a r t i a l b l o c k a g e
o f c o l u m n s o f i m m o b i l i z e d a m y l o g l u c o - s i d a s e d u r in g t r e a t m e n t o f s t a r c h w a s r e p o r t e d ( B a c h l e r e t a l . , 1 9 7 0 ; W i l s o n a n d
L i l l y , 1 9 6 9 ) . A f l u i d i z e d b e d o f i m m o b i l i z e d a m y l o g l u c o s i d a s e w i t h a n u p w a r d f l o w o f s u b s t r a t e i n a r e a c t o r c o l u m n w a s u s e d t o m i n i m i z e b l o c k a g e ( B a r k e r e t a l . ,1 9 7 1 ) .
T h e s i z e o f c a r r ie r p a r t i c l e s t o w h i c h e n z y m e s a r e a t t a c h e d a l s o a f f e c t p e r f o r m a n c e o f c o l u m n r e a c t o r s ( W e e t a l , 1 9 7 3 a ) . S m a l l p a r t i c l e s u s e d a s c a r r ie r s a g g r a v a t e
c o l u m n p l u g g i n g a n d s h o u l d n o t b e u s e d
i n c o l u m n s u n l e s s s u b s t r a t e - d i f f u s i o n r a t e s m a k e i t n e c e s s a r y . L a r g e c a r r ie r p a r t i c l e s a r e n o t s u i t a b l e f o r f l u i d i z e d b e d o r b a t c h r e a c t o r s s i n c e t h e y a r e d i f f i c u l t t o k e e p i n s u s p e n s i o n a n d in c r e a s e b u l k d i f f u s i o n l i m i t a t i o n s . A m a j o r d i f f i c u l t y c i t e d f o r p a c k e d b e d s i s a t t a i n i n g a d e
q u a t e f l o w r a t e s w i t h p r e s e n t l y a v a i la b le e n z y m e s u p p o r t m a t e r i a l s ( G o l d m a n e t a l . , 1 9 7 1 ) . I t w a s s u g g e s t e d t h a t i n c r e a s e d f l o w r a t e s c o u l d b e a t t a i n e d w i t h p o r o u s s h e e t s , s u c h a s f i l t e r p a p e r o r c l o t h , t o w h i c h e n z y m e w a s a t t a c h e d . K i n e t i c s o f e n z y m e s a t t a c h e d t o p o r o u s s h e e t s w e r e s im i la r t o t h o s e o f i m m o b i l i z e d e n z y m e s i n p a c k e d b e d s ( S h a r p e t a l . , 1 9 6 9 ) .
H i g h i o n i c s t r e n g t h o f m a n y f o o d s a l s o
l i m i t s u s e f u l n e s s o f e n z y m e s a d s o r b e d o n t o o r b o u n d b y i o n i c b o n d s t o a c a r r ie r m a t r i x . C h a n g e i n i o n i c s t r e n g t h , p H o r
t e m p e r a t u r e c o u l d d e s o r b t h e e n z y m e . R e v e r s a l o f b i n d i n g w a s i n d u c e d b y
c h a n g e s in p H f o r p a p a i n a d s o r b e d o n
g la s s ( M e s s i n g , 1 9 7 0 ) , l e u c i n e a m i n o p e p -
t i d a s e o n c a l c i u m p h o s p h a t e g e l ( K o e l s c h e t a l . , 1 9 7 0 ) , c a t a l a s e o n D E A E - c e l l u l o s e
( M i t z , 1 9 5 6 ) a n d b y i n c r e a s e s i n i o n i c s t r e n g t h a n d s u b s t r a t e c o n c e n t r a t i o n f o r
a d s o r b e d a m i n o a c y l a s e ( T o s a e t a l . , 1 9 6 6 b ; T o s a e t a l . , 1 9 6 7 b ) .
StabilityS t a b i l i t y o f i m m o b i l i z e d e n z y m e s r e
f e r s t o s e v e r a l f a c t o r s i n c l u d i n g s t a b i l i t y d u r in g a n d b e t w e e n u s a g e a n d t e m p e r a t u r e a n d p H s t a b i l i t y . H a l f - l i f e o f v a r i o u s i m m o b i l i z e d e n z y m e s v a r i e s w i d e l y . G l u c o a m y l a s e i m m o b i l i z e d o n a c o l u m n o f g la s s b e a d s l o s t n o a c t i v i t y a g a i n s t a n e n z y m e - t h i n n e d 3 0 % c o r n s t a r c h s o l u t i o n d u r in g 5 6 d a y s o f c o n t i n u o u s o p e r a t i o n ( W e e t a l , 1 9 7 3 b ) . P a p a in o n g l a s s b e a d s l o s t 5 0 % o f i t s i n i t i a l c a s e i n o l y t i c a c t i v i t y i n 4 8 d a y s w i t h a s h a r p e r d r o p o c c u r r i n g b e t w e e n 4 8 —5 6 d a y s . T h e d e c r e a s e in a c t i v i t y o f p a p a i n m a y h a v e b e e n c a u s e d b y d e p o s i t i o n o f c a s e i n o r i t s h y d r o l y s i s p r o d u c t s o n t h e e n z y m e b e a d s a s w a s r e p o r t e d b y F e r r ie r e t a l . ( 1 9 7 2 ) . A c t i v i t y o f a D E A E - S e p h a d e x - a m i n o a c y l a s e c o l u m n d e c r e a s e d a t a g r a d u a l , u n i f o r m r a t e
t o 5 0 - 7 0 % o f o r i g i n a l a c t i v i t y d u r in g c o n t i n u o u s u s a g e f o r 2 0 d a y s . I m m o b i l i z e d c a t a l a s e w a s v e r y u n s t a b l e d u r in g
c o n t i n u o u s t r e a t m e n t o f 0 . 0 5 % H 2 0 2 i n
m i l k ( B a l c o m e t a l . , 1 9 7 1 ) .
S t a b i l i t y o f i m m o b i l i z e d e n z y m e s d u r in g c o n t i n u o u s u s a g e c a n d e p e n d o n t h e t y p e o f c a r r ie r a n d t h e t y p e o f r e a c t o r
v e s s e l u s e d . A g l a s s - i n v e r t a s e d e r i v a t i v e l o s t n o a c t i v i t y d u r in g 2 8 d a y s o f c o n t i n u o u s u s e in a c o l u m n w h e r e a s o n l y 5 % o f
t h e a c t i v i t y o f a c e l l u l o s e d e r i v a t i v e r e m a i n e d a f t e r 1 6 d a y s . G e n e r a l i z a t i o n s s h o u l d n o t b e m a d e , h o w e v e r , o n t h e b a s i s o f t h i s e n z y m e . O ’N e i l l ( 1 9 7 2 )
p o i n t e d o u t t h a t a p l u g - f l o w r e a c t o r is p r e f e r a b l e t o a s i n g l e c o n t i n u o u s s t i r r e d t a n k r e a c t o r i f t h e s u b s t r a t e p r o t e c t s t h e
e n z y m e f r o m i n a c t i v a t i o n . T h e o p p o s i t e i s t r u e i f e n z y m e i n a c t i v a t i o n d e c r e a s e s w i t h i n c r e a s i n g p r o d u c t c o n c e n t r a t i o n .
L o s s o f e n z y m i c a c t i v i t y d u r in g u s a g e o f i m m o b i l i z e d e n z y m e s p r e s e n t s o b v i o u s p r o b l e m s in c o m m e r c i a l a p p l i c a t i o n . I t w o u l d b e n e c e s s a r y t o u s e a n e x c e s s o f i m m o b i l i z e d e n z y m e t o e n s u r e a d e q u a t e c o n v e r s i o n o f t h e s u b s t r a t e d u r in g a g i v e n t i m e i n t e r v a l . A l t e r n a t i v e l y , p r o d u c t c o n c e n t r a t i o n c o u l d b e m o n i t o r e d a n d f l o w r a t e s a d j u s t e d t o o b t a i n d e s i r e d p r o d u c t o u t p u t . T h i s p r o b l e m is m o r e c r i t i c a l w h e n p a r t i a l c o n v e r s i o n o f t h e s u b s t r a t e
o c c u r s a n d a c o n s t a n t c o n c e n t r a t i o n o f p r o d u c t is d e s i r e d in t h e e f f l u e n t f r o m a c o n t i n u o u s s y s t e m .
I m m o b i l i z e d e n z y m e s m a y e x h i b i t b e t t e r s t o r a g e s t a b i l i t y t h a n s o l u b l e e n z y m e s . N o s i g n i f i c a n t l o s s in a c t i v i t y w a s o b s e r v e d d u r in g 4 m o n t h s o f s t o r a g e o f m o i s t o r l y o p h i l i z e d e t h y l e n e - m a l e i c a c id
d e r i v a t i v e s o f t r y p s i n , c h y m o t r y p s i n , p a p a i n , s u b t i l i s i n C a r ls b e r g a n d s u b t i l i s i n N O V O ; c a r b o x y m e t h y l c e l l u l o s e d e r i v a t i v e s o f c h y m o t r y p s i n , f i c i n a n d b r o m e la i n ; a n d S e p h a r o s e d e r i v a t i v e s o f c h y m o t r y p s i n ( G o l d m a n e t a l . , 1 9 7 1 ) . G l u c o s e
o x i d a s e a n d a c e t y l c h o l i n e s t e r a s e o c c l u d e d
i n p o l y a c r y l a m i d e a n d s t a r c h g e l s a n d p a p a i n in c o l l o d i o n m e m b r a n e s r e t a i n e d m o s t o f t h e i r a c t i v i t y d u r i n g s e v e r a l
m o n t h s o f c o l d s t o r a g e ( G o l d m a n e t a l . ,1 9 7 1 ) . I n c o n t r a s t t o t h e a b o v e s t a b i l i t y
l e v e l s , i n v e r t a s e a n d p e p s i n c o u p l e d t o a
c o p o l y m e r o f m e t h a c r y l i c a c i d a n d m e t h -
a c r y l i c a c i d f l u o r o d i n i t r o a n i l i d e l o s t m o s t o f t h e i r a c t i v i t i e s w i t h i n s e v e r a l w e e k s a t
4 ° C ( M a n e c k e , 1 9 6 2 ) . P e p s i n - g l a s s b e a d s s t o r e d a t 2 5 ° C l o s t a l m o s t a l l t h e i r a c t i v i t y w i t h i n 1 w k , e v e n t h o u g h t h e y w e r e
s t o r e d in 0 .1 % H 2 0 2 t o m i n i m i z e m i c r o b i a l g r o w t h , b u t r e m a i n e d a c t i v e d u r in g 4 w k a t 5 a n d 1 5 ° C ( F e r r i e r e t a l . ,1 9 7 2 ) .
A l t h o u g h o n l y l i m i t e d d a t a h a v e b e e n d e v e l o p e d o n t h e r m a l s t a b i l i t y , G o l d m a n
e t a l . ( 1 9 7 1 ) c o n c l u d e d t h a t t h e r m a l s t a b i l i t y i s l o w e r e d b y a d s o r p t i o n o r c o v a l e n t b i n d i n g o f e n z y m e s . H o w e v e r , i m p r o v e d t h e r m a l s t a b i l i t i e s h a v e b e e n
r e p o r t e d f o r C M - c e l l u l o s e - f i c i n ( H o r n b y e t a l . , 1 9 6 6 ; L i l l y e t a l . , 1 9 6 6 ) , g l u c o s e o x i d a s e i m m o b i l i z e d o n c e l l o p h a n e s h e e t s
( B r o u n e t a l . , 1 9 6 9 ) , a c e t y l c h o l i n e s t e r a s e e n t r a p p e d in s i l a s t i c ( P e n n i n g t o n e t a l . ,1 9 6 8 ) , p a p a i n c o u p l e d t o g l a s s ( W e e t a l ,1 9 6 9 ) , a n d j 3 - g a la c t o s id a s e c o v a l e n t l y l i n k e d t o a p o l y i s o c y a n a t e p o l y m e r ( H u s t a d e t a l . , 1 9 7 3 a ) . E n z y m e s t h a t e x h i b i t e d l o w e r h e a t s t a b i l i t i e s a f t e r i m m o b i l i z a t i o n i n c l u d e i n v e r t a s e b o u n d t o
p o r o u s g la s s ( W e e t a l , 1 9 7 3 a ) a n d p a p a i n b o u n d t o n e u t r a l c a r r ie r s s u c h a s l e u c i n e -
p - a m i n o p h e n y l a l a n i n e ( S i l m a n e t a l . ,1 9 6 6 ) , S - M D A r e s i n s ( G o l d s t e i n , 1 9 7 0 ; G o l d s t e i n e t a l . , 1 9 7 0 ) , p - a m i n o b e n z y l
c e l l u l o s e ( G o l d s t e i n , 1 9 7 0 ; G o l d s t e i n e t
a l . , 1 9 7 0 ) a n d c o l l o d i o n ( G o l d m a n e t a l . , 1 9 6 5 , 1 9 6 8 ) .
S t a b i l i t y o f i m m o b i l i z e d e n z y m e s
t o w a r d v a r i a t i o n s in p H v a l u e s d e p e n d s u p o n p h y s i c a l a n d c h e m i c a l c h a r a c t e r i s t i c s o f t h e e n z y m e c a r r ie r a n d c h e m i c a l m o d i f i c a t i o n o f t h e e n z y m e b r o u g h t a b o u t b y c o v a l e n t b i n d i n g o f e n z y m e t o a
c a r r ie r . P o l y a n i o n i c d e r i v a t i v e s ( e . g . , E M A - d e r i v a t i v e s ) o f t r y p s i n , c h y m o t r y p s i n , a n d p a p a i n e x h i b i t e d i m p r o v e d s t a b i l i t i e s t o w a r d a l k a l i n e p F I v a l u e s ( L e v i n
e t a l . , 1 9 6 4 ; G o l d s t e i n , 1 9 7 0 ) . P o l y c a t - i o n i c d e r i v a t i v e s p o s s e s s e d g r e a t e r s t a b i l i t y in t h e a c i d i c p H r a n g e ( G o l d m a n e t a l . , 1 9 7 1 ) .
H i g h l y c h a r g e d c a r r ie r s a l s o s h i f t t h e o p t i m u m p H o f a n i m m o b i l i z e d e n z y m e b y p r o d u c i n g a n e l e c t r o s t a t i c f i e l d w h i c h
a f f e c t s t h e m i c r o e n v i r o n m e n t o f t h e e n z y m e ( G o l d s t e i n e t a l . , 1 9 6 4 ; G o l d s t e i n a n d K a t c h a l s k i , 1 9 6 8 ; G o l d s t e i n , 1 9 7 0 ; G o l d m a n e t a l . , 1 9 7 1 ) . A l t e r i n g t h e p H

IM M O B IL IZ E D E N Z Y M E S -F O O D PRO CESSING A N D A N A L YSIS-655o p t i m a m a y h a v e s o m e p r a c t i c a l s i g n i f i c a n c e in f o o d s w i t h l o w e r i o n i c s t r e n g t h s . I t m a y b e a d v a n t a g e o u s t o r a i s e t h e p H
o p t i m u m o f a c i d p r o t e a s e s in t r e a t i n g
f o o d s a t p H v a l u e s c l o s e r t o n e u t r a l i t y .
S h i f t i n g t h e p H t o w a r d a c i d i c v a l u e s c o u l d a i d i n c o n t r o l l i n g m i c r o b i a l g r o w t h
d u r in g c o n t i n u o u s p r o c e s s i n g o r i t c o u l d
in c r e a s e t h e a c t i v i t y o f e n z y m e s in a c i d i c f o o d s .
M i c r o b ia l g r o w t h
V e r y l i t t l e a t t e n t i o n h a s b e e n g i v e n t o
p o t e n t i a l f o r m i c r o b i a l g r o w t h d u r in g
c o n t i n u o u s u s e o f i m m o b i l i z e d e n z y m e s . M a n y o f t h e s u b s t r a t e s , t e m p e r a t u r e s a n d
p H v a l u e s u s e d a r e i d e a l f o r g r o w t h o f
m i c r o o r g a n i s m s . H o w e v e r , s o m e s y s t e m s
a r e o p e r a t e d a t t e m p e r a t u r e s o r p H v a l u e s t h a t a r e n o t c o n d u c i v e t o g r o w t h . E x a m
p l e s w o u l d b e a m i n o a c i d r e s o l u t i o n a n d
g l u c o s e i s o m e r i z a t i o n a t 5 0 - 6 0 ° C ( S t r a n d - b e r g a n d S m i l e y , 1 9 7 2 ; T o s a e t a l . ,
1 9 6 9 a ; Z i e n t y , 1 9 7 2 ) a n d u s e o f p a p a i n , e n t r a p p e d i n c o l l o d i o n m e m b r a n e ; , a t p H v a l u e s o f 3 —4 ( G o l d m a n e t a l . ,1 9 6 8 ) . C e r t a i n m a t r i c e s u s e d f o r i m m o b i l i z a t i o n a r e r e s i s t a n t t o m i c r o b i a l a t t a c k s u c h a s i n o r g a n i c c a r r ie r s , p o l y a c r y l a m i d e
a n d g l u t a r a l d e h y d e . H o w e v e r , m i c r o o r g a n i s m s c a n a t t a c k e n z y m e s a t t a c h e d t o
c a r r ie r s o r m a t e r i a l s b e i n g t r e a t e d . I t m a y b e i m p e r a t i v e t o t r e a t i m m o b i l i z e d e n z y m e s w i t h b a c t e r i c i d a l a g e n t s b e t w e e n u s a g e . P e p s i n c o v a l e n t l y c o u p l e d t o p o r o u s g la s s w a s s t e r i l i z e d w i t h 0 . 0 5 M h y d r o g e n p e r o x i d e w i t h o u t a f f e c t i n g e n
z y m i c a c t i v i t y ( F e r r i e r e t a l . , 1 9 7 2 ) .
APPLICATIONS OF SPECIFIC ENZYMES
A m i n o a c y l a s e
T h e f i r s t d o c u m e n t e d , l a r g e s c a l e u s e
o f i m m o b i l i z e d e n z y m e s w a s r e s o l u t i o n
o f r a c e m i c m i x t u r e s o f a m i n o a c i d s e m
p l o y i n g a m i n o a c y l a s e c o n j u g a t e s ( T o s a e t
a l . , 1 9 6 6 a , b ; T o s a e t a l . , 1 9 6 7 a , b ; T o s a e t a l . , 1 9 6 9 a , b ; T o s a e t a l . , 1 9 7 1 a , b ) .
S a t o e t a l . ( 1 9 7 1 ) a l s o i m m o b i l i z e d a m i n o a c y l a s e b y c o v a l e n t c o u p l i n g t o c h l o r - a c e t y l , b r o m a c e t y l o r i o d o a c e t y l g r o u p s o n c e l l u l o s e .
T h e r e a r e a n u m b e r o f r e a s o n s f o r s u c c e s s o f t h e a m i n o a c y l a s e c o l u m n s y s t e m . T h e s u b s t r a t e s y s t e m i s f a i r l y s i m p l e
a n d c o n t a i n s n o m a c r o m o l e c u l e s o r s u s p e n d e d m a t e r i a l s . I m m o b i l i z a t i o n i s s i m p l e a n d p r o d u c e s a r e a s o n a b l y s t a b l e c o n j u g a t e . C r u d e a m i n o a c y l a s e p r e p a r a t i o n s
w e r e c a p a b l e o f b e i n g u s e d s i n c e t h e y
w e r e c o m p l e t e l y a d s o r b e d o n D E A E - S e p h a d e x . T h e c o l u m n c a n b e r e a c t i v a t e d
w i t h o u t l a b o r i o u s r e p a c k i n g . T h e c o l u m n c a n b e o p e r a t e d a t a f a i r l y h i g h t e m p e r a t u r e w h i c h m i n i m i z e d t r o u b l e s o m e m i c r o b i a l g r o w t h . Y i e l d o f p r o d u c t c a n b e v e r y h i g h ; a y i e l d o f L - m e t h i o n i n e e q u a l t o 8 8 % o f t h e o r e t i c a l w a s a c h i e v e d b y
T o s a e t a l . ( 1 9 6 6 b ) . P u r i f i c a t i o n o f t r e a t e d a m i n o a c i d m i x t u r e w a s s i m p l e r s i n c e t h e r e w e r e n o p r o t e i n s o r o t h e r m a c r o m o l e c u l e s c o n t a m i n a t i n g t h e p r o d u c t a s a r e s u l t o f a d d i n g s o l u b l e e n z y m e p r e p a r a t i o n s . I t h a s a l s o b e e n s u g g e s t e d t h a t D -
a m i n o a c i d o x i d a s e , c o v a l e n t l y c o u p l e d t o w - a m i n o a l k y l a g a r o s e p a r t i c l e s , b e u s e d
t o o b t a i n L - a m i n o a c i d i s o m e r s f r o m r a c e m i c m i x t u r e s ( T u a n d M c C o r m i c k , 1 9 7 2 ) .
G l u c o s e i s o m e r a s e
G l u c o s e i s o m e r a s e is t h e o n l y o t h e r i m m o b i l i z e d e n z y m e u s e d o n a c o m m e r c ia l s c a l e . L i k e c o n t i n u o u s r e s o l u t i o n o f
a m i n o a c i d s w i t h i m m o b i l i z e d a m i n o a c y l a s e , i t i s d i s t i n g u i s h e d b y t h e s i m p l i c i t y o f i m m o b i l i z a t i o n p r o c e d u r e . T h e
p r o c e d u r e i n v o l v e s s t a b i l i z a t i o n o f e n z y m e s in c e l l s o f S t r e p t o m y c e s s p e c i e s b y h e a t t r e a t m e n t , e n t r a p p i n g c e l l s i n a f i l t e r
b e d , a n d p a s s i n g g l u c o s e t h r o u g h t h e b e d
( T a k a s a k i e t a l . , 1 9 6 9 ; L l o y d a n d L o g a n ,1 9 7 2 ) . G l u t a r a l d e h y d e w a s u s e d a l s o t o f i x g l u c o s e i s o m e r a s e i n c e l l s o f S t r e p t o m y c e s o l i v a c e u s ( Z i e n t y , 1 9 7 2 ) .
G l u c o s e i s o m e r a s e h a s b e e n i m m o b i l i z e d b y e n t r a p m e n t in p o l y a c r y l a m i d e g e l s ( S t r a n d b e r g a n d S m i l e y , 1 9 7 1 ) a n d c o v a l e n t c o u p l i n g t o p o r o u s g la s s b e a d s ( S t r a n d b e r g a n d S m i l e y , 1 9 7 2 ) . E n z y m e
e n t r a p p e d i n g e l a n d n a t i v e e n z y m e w e r e
r a p i d l y a n d i r r e v e r s i b l y i n a c t i v a t e d in a b a t c h r e a c t i o n s y s t e m b u t e n t r a p p e d e n z y m e w a s m o r e s t a b l e w h e n u s e d i n a
c o l u m n . S m i l e y a n d S t r a n d b e r g ( 1 9 7 1 ) s u g g e s t e d t h a t c o n t i n u o u s s u p p l y o f s u b s t r a t e a n d c o n t i n u o u s r e m o v a l o f p r o d u c t c o n t r i b u t e d t o t h e in c r e a s e d s t a b i l i t y .
I n v e r t a s e
I n v e r t a s e h a s b e e n i m m o b i l i z e d b y a d s o r p t i o n o n b e n t o n i t e f o l l o w e d b y c r o s s - l i n k i n g w i t h c y a n u r i c c h l o r i d e ( M o n s a n
a n d D u r a n d , 1 9 7 1 ) , a d s o r p t i o n o n D E A E -
c e l l u l o s e ( S u z u k i e t a l . , 1 9 6 6 ) , a n d c o v a l e n t c o u p l i n g t o p o l y a m i n o s t y r e n e t u b e s
( F i l i p p u s s o n a n d H o r n b y , 1 9 7 0 ) a n d t o p o r o u s g la s s ( M a s o n a n d W e e t a l , 1 9 7 2 ) . I n v e r t a s e - g la s s l o s t n o a c t i v i t y d u r in g 2 8
d a y s o f o p e r a t i o n a t 2 3 ° C i n a c o l u m n . O p e r a t i o n o f s u c h a c o l u m n m i g h t p o s e
m i c r o b i o l o g i c a l p r o b l e m s . I n v e r t a s e c o v a l e n t l y c o u p l e d t o c e l l u l o s e e x h i b i t e d
c o n s t a n t l o s s o f a c t i v i t y ( M a s o n a n d
W e e t a l , 1 9 7 2 ) .
|3 - G a l a c t o s i d a s e ( l a c t a s e )
I n t e r e s t in i m m o b i l i z e d ( 3 - g a la c t o s i -
d a s e s h a s b e e n g e n e r a t e d b y n u t r i t i o n a l a n d s e n s o r y q u a l i t i e s o f d a ir y p r o d u c t s o r b y - p r o d u c t s . M a n y n o n - C a u c a s i a n s a n d y o u n g s t e r s s h o w a n i n t o l e r a n c e t o l a c t o s e
w h i c h is m a n i f e s t e d a s s e v e r e d ia r r h e a a n d g a s t r o i n t e s t i n a l d i s t r e s s ( K r e t c h m e r ,1 9 7 2 ) . I n a d d i t i o n , l a c t o s e i s n o t v e r y
s o l u b l e r e s u l t i n g in c r y s t a l l i z a t i o n in c o n c e n t r a t e d d a i r y p r o d u c t s . H y d r o l y s i s o f l a c t o s e d e c r e a s e s i t s c o n c e n t r a t i o n a n d t e n d e n c y t o c r y s t a l l i z e . S i n c e g l u c o s e a n d g a l a c t o s e a r e s w e e t e r t h a n l a c t o s e , i t m a y
b e p o s s i b l e t o p r o d u c e s w e e t s y r u p s f r o m s o u r c e s o f l a c t o s e s u c h a s c h e e s e w h e y .
B e t a - g a l a c t o s i d a s e h a s b e e n i m m o b i l i z e d o n p o r o u s s h e e t s o f c e l l u l o s e v ia a c h l o r o - s - t r i a z i n y l l i n k i n g a g e n t ( K a y e t a l . , 1 9 6 8 ) . T h i s d e r i v a t i v e w a s r e l a t i v e l y s t a b l e f o r s e v e r a l m o n t h s b u t l o s t 8 1 %
o f i t s a c t i v i t y d u r i n g 3 y e a r s a t 2 —5 ° C
( L i l l y , 1 9 7 1 ) . F r e e z e d r y i n g o f t h e p o r o u s s h e e t s r e d u c e d e n z y m i c a c t i v i t y ( S h a r p e t
a l . , 1 9 6 9 ) . T h e p o r o u s s h e e t r e a c t o r c o n t a i n i n g i m m o b i l i z e d j 3 - g a la c t o s id a s e f u n c t i o n e d f o r l o n g p e r i o d s o f t i m e w i t h o u t
s u p e r v i s i o n . I n o n e e x p e r i m e n t , 2 0 % l o s s o f a c t i v i t y o c c u r r e d in 2 w k w h i l e 6 0 0
l i t e r s o f s u b s t r a t e w e r e p a s s e d t h r o u g h t h e p o r o u s s h e e t s .
T h e ( 3 - g a la c t o s id a s e f r o m v a r i o u s m i c r o b i a l s o u r c e s d i f f e r s in p r o p e r t i e s s u c h
a s p H o p t i m a , e t c . F o r e x a m p l e , j3 -g a la c -
t o s i d a s e f r o m A s p e r g i l l u s n i g e r h a s a p H
o p t i m u m a r o u n d 4 . 5 , a n d i t h a s b e e n
p r o p o s e d t o u s e t h i s e n z y m e f o r p r o c e s s in g a c i d C o t t a g e c h e e s e w h e y ( W i e r z b i c k i
a n d K o s i k o w s k i , 1 9 7 3 ) . T h i s a c i d i c (3- g a l a c t o s i d a s e r e t a i n e d 7 5 % o f i t s o r i g i n a l
a c t i v i t y w h e n i m m o b i l i z e d o n p o r o u s g la s s a n d l o s t n o a c t i v i t y d u r i n g s t o r a g e a t
4 ° C f o r 2 m o n t h s ( W o y c h i k a n d W o n -
d o l o w s k i , 1 9 7 2 ) . G a l a c t o s e w a s a c o m p e t i t i v e i n h i b i t o r f o r i m m o b i l i z e d /3 -g a la c -
t o s i d a s e . R e c e n t l y , a n i m p r o v e d m e t h o d f o r i m m o b i l i z i n g / 3 - g a l a c t o s id a s e o n p o r o u s g la s s h a s a p p e a r e d ( R o b i n s o n e t a l . ,1 9 7 1 ) . B e t a - g a l a c t o s i d a s e f r o m E s c h e r i c h i a c o l i a l s o h a s b e e n i m m o b i l i z e d o n T e f l o n s t i r r i n g b a r s v ia a p o l y i s o c y a n a t e p r e - p o l y m e r ( H u s t a d e t a l . , 1 9 7 3 a , b ) .
B e t a - g a l a c t o s i d a s e f r o m E s c h e r i c h i a c o l i w a s e n t r a p p e d in p o l y a c r y l a m i d e g e l a n d t h e k i n e t i c s o f a c t i v i t y o n o - n i - t r o p h e n y l |3 - D - g a l a c t o p y r a n o s i d e s t u d i e d
( B u n t i n g a n d L a i d l e r , 1 9 7 2 ) . A c o m m e r c ia l |3 - g a l a c t o s i d a s e p r e p a r a t i o n f r o m
y e a s t h a s b e e n e n t r a p p e d w i t h c r o s s - l i n k e d p o l y a c r y l a m i d e u s i n g a b e a d - p o l y m e r i z a t i o n t e c h n i q u e ( D a h l q v i s t e t a l . ,1 9 7 3 ) . T h e i m m o b i l i z e d e n z y m e w a s u s e d t o t r e a t m i l k .
A m y l a s e s
A p p l i c a t i o n s o f a m y l a s e s t o f o o d p r o c e s s i n g a n d s t a r c h c o n v e r s i o n h a v e b e e n
r e v i e w e d b y R e e d ( 1 9 6 6 ) . S i n c e t h e c o n v e r s i o n o f s t a r c h t o l o w e r m o l e c u l a r
w e i g h t s a c c h a r i d e s i s c a r r i e d o u t in f l u i d s y s t e m s , u s e o f i m m o b i l i z e d a m y l a s e s is f e a s i b l e . A l l m a j o r t y p e s o f a m y l a s e s h a v e D e e n i m m o b i l i z e d b y c o v a l e n t a t t a c h m e n t t o i n s o l u b l e s u p p o r t s , b y a d s o r p t i o n a n d in u l t r a f i l t r a t i o n c e l l s ; w h e r e a s a - a n d 13- a m y l a s e s h a v e b e e n e n t r a p p e d in g e l l a t t i c e s a n d o n l y a - a m y l a s e h a s b e e n a d s o r b e d o n c e l l o p h a n e f o l l o w e d b y c r o s s - l i n k i n g w i t h g l u t a r a l d e h y d e ( S e l e g n y e t
a t . , 1 9 7 1 ) . T h e f i r s t e x a m p l e o f a n e n z y m e c o v a l e n t l y a t t a c h e d t o a n i n s o l u b l e m a t r i x i n c l u d e d t h e c o u p l i n g o f a - a m y l a s e t o d i a z o t i z e d p o l y a m i n o s t y r e n e in
1 9 5 3 ( G r u b h o f e r a n d S c h l e i t h , 1 9 5 4 ) .

m e - J O U R N A L OF FO O D S C IE N C E -V o lu m e 39 (1974)
A l p h a - a m y l a s e h a s b e e n a d s o r b e d o n a
v a r i e t y o f c h a r g e d m a t r i c e s ( Z a b o r s k y ,1 9 7 3 ) b u t a m a j o r p r o b l e m i s l e a c h i n g o r
e l u t i o n o f e n z y m e s f r o m t h e s u p p o r t ,
p a r t i c u l a r l y w i t h c h a n g e in p H , i o n i c
s t r e n g t h o r s u b s t r a t e c o n c e n t r a t i o n s ( U s a m i a n d T a k e t o m i , 1 9 6 5 ) . A l p h a -
a m y l a s e h a s a l s o b e e n e n t r a p p e d in g e l s b u t t h e a c t i v i t y r e l a t i v e t o s o l u b l e e n z y m e w a s o n l y 1 .9 % ( B e r n f e l d a n d W a n ,1 9 7 3 ) .
S p e c i f i c i t y o f i m m o b i l i z e d a - a m y l a s e c h a n g e s u p o n a t t a c h m e n t t o a n i n s o l u b l e
s u p p o r t ( L e d i n g h a m a n d H o r n b y , 1 9 6 9 ) .
W h e n u s e d in a c o n t i n u o u s s t i r r e d r e a c t o r , e n z y m e a t t a c h e d t o p o l y s t y r e n e
y i e l d e d a m a r k e d i n c r e a s e in p r o d u c t i o n o f g l u c o s e a n d m u l t i p l i c i t y o f a t t a c k o n s t a r c h a s c o m p a r e d t o n a t i v e e n z y m e .
C o v a l e n t b i n d i n g o f a m y l a s e a f f e c t s
h e a t a n d s t o r a g e s t a b i l i t i e s o f t h e e n z y m e ; a - a m y l a s e c o v a l e n t l y l i n k e d t o c r o s s - l i n k e d p o l y a c r y l a m i d e d e r i v a t i v e s ( E n z a c r y l A A , E n z a c r y l A H a n d p o l y a c e t a l ) w a s m o r e
h e a t s t a b l e t h a n s o l u b l e e n z y m e ( B a r k e r a n d E p t o n , 1 9 7 0 ; B a r k e r e t a l . , 1 9 7 0 ; E p t o n a n d T h o m a s , 1 9 7 1 ) . S t a b i l i t y o f a -
a m y l a s e o v e r e x t e n d e d p e r i o d s o f u s e h a s b e e n e v a l u a t e d f o r s o l u b l e e n z y m e o r s o l u b l e e n z y m e d e r i v a t i v e s i m m o b i l i z e d i n u l t r a f i l t r a t i o n r e a c t o r s ( W y k e s e t a l . , 1 9 7 1 ;
B u t t e r w o r t h e t a l . , 1 9 7 0 ; M a r s h a l l a n d W h e la n , 1 9 7 1 ) . T h e u l t r a f i l t r a t i o n r e a c t o r
i s d e s i g n e d t o r e t a i n e n z y m e w i t h i n m e m b r a n e s b u t a l l o w e s c a p e o f p r o d u c t s b y c o n t r o l o f p o r e s i z e o f t h e m e m b r a n e . H o w e v e r , B u t t e r w o r t h e t a l . ( 1 9 7 0 ) r e p o r t e d s o m e l o s s o f a m y l a s e a c t i v i t y t h r o u g h r e a c t o r m e m b r a n e s . W y k e s e t a l .( 1 9 7 1 ) m i n i m i z e d l o s s t h r o u g h m e m b r a n e s b y c o u p l i n g a - a m y l a s e t o s o l u b l eS - t r i a z i n e d e r i v a t i v e s o f d e x t r a n , D E A E -
d e x t r a n a n d C M - c e l l u l o s e t o y i e l d s o l u b l e “ s u p e r p o l y m e r s . ” T h e s e d e r i v a t i v e s w o u l d b e l e s s l i k e l y t o p a s s t h r o u g h u l t r a f i l t r a t i o n m e m b r a n e s b u t a r e s o l u b l e a n d
r e t a i n g o o d a c c e s s i b i l i t y t o t h e s t a r c h s u b s t r a t e . U r a b e a n d O k a d a ( 1 9 7 2 ) a l s o
i n c r e a s e d e n t r a p m e n t o f a - a m y l a s e o n a m i l l i p o r e f i l t e r m e m b r a n e b y a c y l a t i n g
t h e e n z y m e . P a l m i t y l a t e d a - a m y l a s e e x h i b i t e d g o o d r e t e n t i o n o n t h e f i l t e r a n d s t a b i l i t y d u r in g c o n t i n u o u s p a s s a g e o f s t a r c h t h r o u g h t h e f i l t e r .
i3 - A m y la s e
B e t a - a m y l a s e w a s i m m o b i l i z e d o n E n z a c r y l d e r i v a t i v e s b u t w a s l e s s h e a t s t a b l e t h a n n a t i v e e n z y m e ( B a r k e r e t a l . , 1 9 7 0 ) . B e t a - a m y l a s e a l s o h a s b e e n e n t r a p p e d in a g e l l a t t i c e ; h o w e v e r , a c t i v i t y w a s o n l y
6 .6 % o f t h e f r e e e n z y m e ( B e r n f e l d a n d W a n , 1 9 7 3 ) . D e g r a d a t i o n o f p o t a t o s t a r c h b y /3 - a m y la s e i n t h e p r e s e n c e o f p u l l u l a n -
a s e y i e l d e d p r i m a r i l y m a l t o s e , a s e x p e c t e d ( M a r s h a l l a n d W h e la n , 1 9 7 1 ) .
G l u c o a m y l a s e
G l u c o a m y l a s e h a s b e e n b o u n d c o v a l e n t l y t o a v a r i e t y o f m a t r i c e s ( Z a b o r s k y ,
1 9 7 3 ) . T h e m e t h o d s u s e d i n c l u d e a c t i v a t i o n o f m a t r i c e s l i k e c e l l u l o s e , n y l o n o r g la s s w i t h t r a n s i t i o n m e t a l s a l t s l i k e t i t a n i
u m c h l o r i d e ( B a r k e r e t a l . , 1 9 7 1 ) ; a n d c y n o g e n b r o m i d e a c t i v a t i o n o f w o o d , p u l p a n d m i c r o c r y s t a l l i n e c e l l u l o s e
( M a e d a a n d S u z u k i , 1 9 7 2 b ) a n d S e p h a -
r o s e ( U s a m i e t a l . , 1 9 6 8 ) . G l u c o a m y l a s e h a s b e e n c o v a l e n t l y l i n k e d t o c a r b o x y - m e t h y l c e l l u l o s e ( M a e d a a n d S u z u k i ,1 9 7 0 ) , f i b r o u s D E A E c e l l u l o s e ( W i l s o n
a n d L i l l y , 1 9 6 9 ; O ’N e i l l e t a l . , 1 9 7 1 ) , b r o m a c e t y l a n d i o d o a c e t y l c e l l u l o s e
( M a e d a a n d S u z u k i , 1 9 7 2 a ) a n d t h e i s o -
t h i o c y a n a t o d e r i v a t i v e o f 3 - ( - p a m i n o - p h e n o x y ) - 2 - h y d r o x y p r o p y l c e l l u l o s e
( B a r k e r e t a l . , 1 9 6 9 ) . A n o v e l m e t h o d o f i m m o b i l i z i n g g l u c o a m y l a s e f r o m A s p e r g i l lu s n i g e r i n v o l v e d t h e o x i d a t i o n o f t h e c a r b o h y d r a t e m o i e t y o f t h e e n z y m e w i t h
s o d i u m m e t a p e r i o d a t e ( C h r i s t i s o n , 1 9 7 2 ) . T h e o x y g l u c o a m y l a s e w a s t h e n i m m o b i l i z e d v ia r e s u l t a n t c a r b o n y l g r o u p s t o c a r b o x y m e t h y l c e l l u l o s e h y d r a z i d e .
G l u c o a m y l a s e a l s o h a s b e e n p h y s i c a l l y a d s o r b e d o r b o u n d o n t o v a r i o u s m a t r i c e s s u c h a s a c t i v a t e d c l a y ( U s a m i e t a l . , 1 9 6 8 ; U s a m i a n d S h ir a s a k i , 1 9 7 0 ) a n d a c t i v a t e d c h a r c o a l ( U s a m i a n d S h ir a s a k i , 1 9 7 0 ;
K im u r a e t a l . , 1 9 6 9 ) . G l u c o a m y l a s e , i o n i c a l l y b o u n d t o D E A E c e l l u l o s e , e x h i b i t e d 1 6 t o 5 5 % o f t h e a c t i v i t y o f t h e
s o l u b l e e n z y m e b u t d e c r e a s e d t e m p e r a t u r e s t a b i l i t y ( B a c h l e r e t a l . , 1 9 7 0 ) . C o l u m n s o f b o u n d e n z y m e s w e r e o p e r a t e d c o n t i n u o u s l y f o r m o r e t h a n 3 w k b u t
h i g h s a l t c o n c e n t r a t i o n s e l u t e d t h e e n z y m e . P r e t r e a t m e n t o f s t a r c h w i t h a - a m y l a s e w a s n e c e s s a r y t o p r e v e n t b l o c k i n g o f t h e c o l u m n .
I n a l a t e r s t u d y , g l u c o a m y l a s e o n D E A E c e l l u l o s e w a s u s e d i n a C S T R a t
5 5 C f o r p e r i o d s o f 3 —4 w k w i t h o u t l e a c h i n g o f e n z y m e ( S m i l e y , 1 9 7 1 ) . A f t e r t h i s t i m e , i n s o l u b l e s t a r c h f r a c t i o n s s e e m e d t o i n t e r f e r e w i t h o p e r a t i o n o f t h e
r e a c t o r . R e c e n t l y , g l u c o a m y l a s e w a s b o u n d t o a s t r o n g a n i o n e x c h a n g e r e s i n f o r c o n t i n u o u s s a c c h a r i f i c a t i o n o f l o w D E
c o r n s y r u p a n d l i q u i f i e d c a s s a v a s t a r c h
( P a r k a n d L im a , 1 9 7 3 ) . A c o l u m n o f t h e i m m o b i l i z e d e n z y m e w a s o p e r a t e d 1 2 0 h r w i t h l o s s a p p r o x i m a t i n g 2 8 % o f t h e b o u n d e n z y m e .
U l t r a f i l t r a t i o n r e a c t o r s h a v e b e e n a p p l i e d a l s o t o c o n t i n u o u s c o n v e r s i o n o f s t a r c h t o g l u c o s e u s i n g g l u c o a m y l a s e . O n e r e a c t o r w a s u s e d f o r 2 d a y s o n p o t a t o s t a r c h ( M a r s h a l l a n d W h e la n , 1 9 7 1 ) ; a s e c o n d o p e r a t e d s u c c e s s f u l l y o n w a x y - m a i z e s t a r c h , t h i n n e d w i t h a - a m y l a s e , f o r
4 0 h r ( B u t t e r w o r t h e t a l . , 1 9 7 0 ) .
P u l l u l a n a s e
T h i s e n z y m e c l e a v e s a - l , 6 - g l y c o s i d i c l i n k a g e s a n d c o u l d p r o d u c e l o w m o l e c u l a r w e i g h t a m y l o s e , h i g h p u r i t y m a l t o s e , a n d m a l t o t r i o s e f r o m p u l l u l a n a n d b e u s e d a s a n a l t e r n a t i v e c a r b o h y d r a s e i n b r e w i n g u n m a l t e d c e r e a l s ( M a r t e n s s o n a n d M o s -
b a c h , 1 9 7 2 ) . A p a r t i a l l y p u r i f i e d m i c r o b i a l p u l l u l a n a s e h a s b e e n c r o s s l i n k e d
t o a c o p o l y m e r o f a c r y l a m i d e - a c r y l i c a c i d
u s i n g a w a t e r s o l u b l e c a r b o d i i m i d e . I n o n e p o s s i b l e a p p l i c a t i o n , a m y l o s e c o u l d
b e p r o d u c e d f r o m a m y l o p e c t i n b y p u l l u l a n a s e a n d t h e n t r e a t e d w i t h i m m o b i l i z e d | 3 - a m y la s e t o o b t a i n h i g h p u r i t y m a l t o s e
w i t h o u t c o n t a m i n a t i n g p r o t e i n s .
I m m o b i l i z e d p r o t e a s e s
Z a b o r s k y ( 1 9 7 3 ) r e v i e w e d m e t h o d s o f i m m o b i l i z i n g a n d c h a r a c t e r i s t i c s o f i m m o b i l i z e d p r o t e a s e s t h r o u g h 1 9 7 1 . A l t h o u g h s e v e r a l p r o b l e m s e x i s t i n a p p l i c a t i o n , t h e r e i s p o t e n t i a l f o r u s e o f
i m m o b i l i z e d p r o t e a s e s b e c a u s e o f h i g h
c o s t o f p r o t e a s e s a n d p e p t i d a s e s a n d b e c a u s e m a n y o f t h e s e e n z y m e s a r e n o t o n t h e G R A S l i s t ( W e e t a l , 1 9 7 3 b ) . H o w e v e r ,
o n l y a l i m i t e d n u m b e r o f i n v e s t i g a t i o n s h a v e b e e n m a d e o f a p p l i c a t i o n o f i m m o b i l i z e d p r o t e a s e s i n f o o d s y s t e m s . T h e s e i n c l u d e c h i l l p r o o f i n g b e e r , c o n t i n u o u s c o a g u l a t i o n o f m i l k a n d i n h i b i t i o n o f
o x i d a t i v e r a n c i d i t y in m i l k .C h i l l p r o o f i n g o f b e e r w a s c a r r ie d o u t
o n a p i l o t p l a n t b a s i s u s i n g p r o t e a s e s
c o u p l e d t o a c o p o l y m e r o f e t h y l e n e a n d m a l e i c a n h y d r i d e ( W i l d i a n d B o y c e , 1 9 7 1 ) .
T h e i m m o b i l i z e d e n z y m e s w e r e u s e d t o t r e a t b e e r d u r in g f e r m e n t a t i o n a n d r u h s t a g e o r b y a c o n t i n u o u s h i g h t e m p e r a t u r e s y s t e m . A p a p a i n s u p e r p o l y m e r ,
f o r m e d b y c r o s s - l i n k i n g e n z y m e w i t h g l u t a r a l d e h y d e , h a s b e e n u s e d a l s o t o
c h i l l p r o o f b e e r ( W i t t e t a l . , 1 9 7 0 ) .I t i s f e a s i b l e t o d e v e l o p a s y s t e m f o r
c o n t i n u o u s c o a g u l a t i o n o f m i l k e m p l o y
i n g i m m o b i l i z e d p r o t e o l y t i c e n z y m e s b e c a u s e o f a p e c u l i a r i t y o f t h e c o a g u l a t i o n p r o c e s s . C o a g u l a t i o n c f m i l k b y p r o t e a s e s c o n s i s t s o f a n e n z y m i c ( p r i m a r y ) a n d a n o n e n z y m i c ( s e c o n d a r y ) p h a s e . T h e p r im a r y p h a s e , l i k e m o s t e n z y m i c r e a c
t i o n s , h a s a t e m p e r a t u r e c o e f f i c i e n t (Qio) o f a b o u t 2 ; w h e r e a s t h e Q 1 0 f o r t h e s e c o n d a r y p h a s e , w h i c h r e q u i r e s c a l c i u m i o n s , i s a p p r o x i m a t e l y 1 5 ( E r n s t r o m a n d T i t t s l e r , 1 9 6 5 ) . C o n s e q u e n t l y , c o a g u l a t i o n o f m i l k c a n b e s e l e c t i v e l y r e t a r d e d i n a n e n z y m e r e a c t o r b y l o w e r i n g t h e t e m p e r a t u r e t o i n h i b i t t h e n o n e n z y m i c p h a s e b u t a l l o w c o m p l e t i o n o f t h e e n z y m i c p h a s e . S u b s e q u e n t w a r m i n g w o u l d c l o t t h e m i l k .
I m m o b i l i z e d c h y m o t r y p s i n ( D o l g i k h e t a l . , 1 9 7 1 ) , c h y m o t r y p s i n a n d r e n n i n ( G r e e n a n d C r u t c h f i e l d , 1 9 6 9 ) a n d p e p s i n ( F e r r i e r e t a l . , 1 9 7 2 ) h a v e b e e n u s e d t o
c l o t m i l k . P r e p a r a t i o n a n d u t i l i z a t i o n o f i m m o b i l i z e d c h y m o t r y p s i n a n d r e n n i n
( G r e e n a n d C r u t c h f i e l d , 1 9 6 9 ) i n c o n t i n u o u s s y s t e m s w e r e f r u s t r a t e d b y c o n t i n u o u s l e a c h i n g o f s o l u b l e e n z y m e f r o m s u p p o r t i n g m a t r i c e s a n d p h y s i c a l p r o p e r t i e s o f i n s o l u b l e s u p p o r t s ( a g a r o s e a n d a m i n o e t h y l c e l l u l o s e ) . T h e s e d i f f i c u l t i e s
w e r e l a r g e l y o v e r c o m e i n t h e u s e o f p e p s i n i m m o b i l i z e d o n g l a s s b e a d s ( F e r r i e r e t

IM M O B IL IZ E D E N Z Y M E S -F O O D PRO CESSING A N D A N A L YSIS-657a l . , 1 9 7 2 ) . A p e p s i n c o l u m n , o p e r a t e d a t
1 5 ° C , e f f e c t i v e l y c o a g u l a t e d s k i m m i l k a t
p H 5 . 6 t o 5 . 9 a n d y i e l d e d a t y p i c a l s k i m m i l k c u r d . N o s o l u b l e p e p s i n w a s d e t e c t e d in w h e y f r o m t r e a t e d m i l k o r in a
s i m u l a t e d m i l k s a l t s s o l u t i o n p a s s e d t h r o u g h t h e c o l u m n . H o w e v e r , t h e p e p s i n
c o l u m n s l o w l y l o s t i t s a c t i v i t y o v e r a1 2 - h r t e s t p e r i o d . I n a c t i v a t i o n m a y b e o v e r c o m e b y u s i n g o t h e r e n z y m e s a n d s u p p o r t s a n d b y d e s i g n i n g r e a c t o r s o t h e r t h a n a p a c k e d b e d . V i r t u a l l y a n y i m m o b i l i z e d p r o t e a s e m i g h t b e u s e d s i n c e n o c o n t a m i n a t i o n o f m i l k w i t h p r o t e a s e
w o u l d o c c u r t h e r e b y a v o i d i n g e x c e s s i v e p r o t e o l y s i s l e a d i n g t o b i t t e r n e s s a n d d e f e c t i v e t e x t u r e in c h e e s e .
T r y p s i n c o u p l e d t o p o r o u s g la s s w a s u s e d t o i n h i b i t d e v e l o p m e n t o f o x i d a t i v e r a n c i d i t y ( S h i p e e t a l . , 1 9 7 2 ) . T r e a t e d
m i l k d e v e l o p e d o x i d i z e d f l a v o r s s i g n i f i c a n t l y s l o w e r a n d t o a l e s s e r i n t e n s i t y
t h a n c o n t r o l s b u t o v e r t r e a t m e n t o f m i l k r e s u l t e d in b i t t e r f l a v o r .
Flavor modificationA n u m b e r o f e n z y m e s c a n b e u s e d f o r
f l a v o r m o d i f i c a t i o n s u c h a s n a r i n g i n a s e a n d a d e n o s i n e d e a m i n a s e . N a r i n g i n a s e h a s b e e n c o u p l e d t o a c o p o l y m e r o f m a l e i c
a n h y d r i d e a n d e t h y l e n e ( G o l d s t e i n e t a l . ,1 9 7 1 ) . T h i s e n z y m e d e s t r o y s n a r i n g i n , a
b i t t e r c o m p o n e n t o f g r a p e f r u i t , a n d m i g h t b e u s e d i n d e b i t t e r i n g c l a r i f i e d g r a p e f r u i t j u i c e . A d e n o s i n e d e a m i n a s e h a s
b e e n b o u n d t o c o m m e r c i a l p o l y a c r y l a m i d e g e l p r e p a r a t i o n s a n d u s e d t o c o n v e r t a d e n o s i n e t o i n o s i n e ( L u c a c c h i n i e t a l . ,1 9 7 1 ) . I n o s i n e m o n o p h o s p h a t e w a s p r o d u c e d a l s o f r o m a d e n o s i n e m o n o p h o s p h a t e b y w a t e r i n s o l u b l e A T P d e a m i n a s e ( C h u n g e t a l . , 1 9 6 8 ) .
SynthesisE n z y m e d i r e c t e d s y n t h e s i s o f f o o d
c o n s t i t u e n t s m a y b e c o m e i m p o r t a n t in t h e f u t u r e . L - t r y p t o p h a n h a s b e e n p r o d u c e d b y a n e n z y m e c o m p l e x f r o m E s c h e r i c h i a c o l i i m m o b i l i z e d w i t h i n c e l l u l o s e t r i a c e t a t e ( D i n e l l i , 1 9 7 2 ) . T h e e n z y m e c o m p l e x w a s r e u s e d o v e r 1 5 0 t i m e s
w i t h o u t l o s s i n a c t i v i t y . A s p a r t a s e i m m o b i l i z e d w i t h i n p o l y a c r y l a m i d e g e l h a s
b e e n u s e d f o r c o n t i n u o u s p r o d u c t i o n o f
L - a s p a r t i c a c i d f r o m a m m o n i u m f u m a r a t e p r o d u c i n g y i e l d s o f 9 5 % o f t h e t h e o r e t i c a l ( T o s a e t a l . , 1 9 7 3 ) . T h e e n z y m e e x h i b i t e d g o o d s t a b i l i t y d u r in g 8 d a y s o f u s a g e w i t h s u b s e q u e n t g r a d u a l d e c r e a s e in
a c t i v i t y .
Miscellaneous applicationsS o l u b l e o r i m m o b i l i z e d p r o t e a s e s c o u l d
b e u s e d i n c o m b i n a t i o n w i t h i m m o b i l i z e d a m i n o p e p t i d a s e s a n d c a r b o x y p e p t i d a s e s t o p r o d u c e p r o t e i n h y d r o l y s a t e s w i t h s p e c i f i c c h a r a c t e r i s t i c s . A m i n o p e p t i d a s e h a s b e e n c o u p l e d t o S e p h a r o s e a lo n g w i t h p r o t e a s e s t o o b t a i n c o m p l e t e h y d r o l y s i s o f
p r o t e i n s ( B e n n e t t e t a l . , 1 9 7 1 ) . L e u c i n e
a m i n o p e p t i d a s e a n d a m i n o p e p t i d a s e M
h a v e b e e n c o v a l e n t l y b o u n d t o p o r o u s
g la s s ( R o y e r a n d A n d r e w s , 1 9 7 2 ) . C a r
b o x y p e p t i d a s e s h a v e b e e n c o v a l e n t l y b o n d e d t o a n u m b e r o f c a r r ie r s i n c l u d i n g S e p h a r o s e , p o l y a m i n o s t y r e n e , p h e n y l a l a n i n e -
l e u c i n e c o p o l y m e r , a n d m a l e i c a n h y d r i d e a n d e t h y l e n e c o p o l y m e r ( Z a b o r s k y , 1 9 7 3 ) . I n s o l u b i l i z a t i o n w a s a c h i e v e d a l s o b y t r e a t i n g c a r b o x y p e p t i d a s e c r y s t a l s w i t h g lu t a r -
( Q u i o c h o a n d R i c h a r d s , 1 9 6 6 ) .
ENZYMATIC ANALYSIS
U S E O F S O L U B L E a n d i m m o b i l i z e d e n z y m e s f o r a n a l y s i s o f s p e c i f i c s u b s t r a t e s h a s b e e n r e v i e w e d b y G u i l b a u l t ( 1 9 7 0 a , b , c ) a n d Z a b o r s k y ( 1 9 7 3 ) . I m m o b i l i z e d e n z y m e s h a v e b e e n a p p l i e d t o a n a l y t i c a l
s y s t e m s b y : i n c o r p o r a t i n g e n z y m e s i n t o p H o r i o n - s e l e c t i v e e l e c t r o d e s a n d i n c o r p o r a t i n g e n z y m e s i n t o a u t o m a t e d a n a l y t i c a l s y s t e m s .
Enzyme electrodesT h e u s u a l c o n f i g u r a t i o n i n v o l v e s a f i l m
o f e n t r a p p e d e n z y m e c o v e r i n g t h e t i p o f a n e l e c t r o d e w h i c h m e a s u r e s u t i l i z a t i o n
o f a r e a c t a n t o r p r o d u c t i o n o f a p r o d u c t . S u c h e n z y m e e l e c t r o d e s c o m b i n e t h e
s p e c i f i c i t y a n d s e n s i t i v i t y o f e n z y m e s a n d s i m p l i c i t y o f p o t e n t i o m e t r i c m e a s u r e m e n t . E n z y m e e l e c t r o d e s h a v e b e e n d e v e l o p e d f o r a n a l y s e s o f g l u c o s e ( U p d i k e
a n d H i c k s , 1 9 6 7 ; W i l l i a m s e t a l . , 1 9 7 0 ;
W in g a r d e t a l . , 1 9 7 1 ; G u i l b a u l t a n d L u b r a n o , 1 9 7 2 ) , u r i c a c i d a n d u r e a ( G u i l b a u l t e t a l . , 1 9 6 9 ; G u i l b a u l t a n d H r a b a n - k o v a , 1 9 7 0 a ; G u i l b a u l t a n d M o n t a l v o , 1 9 6 9 a , b , 1 9 7 0 ; G u i l b a u l t a n d S h u , 1 9 7 2 ; M o n t a l v o , 1 9 7 0 ; M o n t a l v o a n d G u i l b a u l t ,1 9 6 9 ) , a m i n e s a n d a m i n o a c i d s ( G u i l b a u l t a n d H r a b a n k o v a , 1 9 7 0 b , c , 1 9 7 1 ; G u i l b a u l t a n d S h u , 1 9 7 1 , 1 9 7 2 ) , l a c t a t e (W i l l i a m s e t a l . , 1 9 7 0 ) , a s p a r a g i n e ( G u i l b a u l t a n d H r a b a n k o v a , 1 9 7 1 ) a n d i n o r g a n i c p h o s p h a t e ( W e e t a l , 1 9 7 3 b ; W e e t a l a n d J a c o b s o n , 1 9 7 2 ) .
M o s t e n z y m e e l e c t r o d e s w e r e d e v e l o p e d f o r c l i n i c a l a n a l y s e s b u t c o u l d b e a p p l i e d d i r e c t l y t o f o o d s y s t e m s . U r e a s e e l e c t r o d e s m i g h t b e u s e d t o d e t e c t r o d e n t i n f e s t a t i o n o f g r a i n s , a n d s p e c i f i c a m i n o
a c i d e l e c t r o d e s f o r r o u t i n e m o n i t o r i n g o f s e l e c t e d a m i n o a c i d s t o a s c e r t a i n v a r ia t i o n s i n f r e s h f o o d s a n d t h e e f f e c t s o f p r o c e s s i n g . E n z y m e p r o b e s c o n s i s t i n g o f
a m i n o a c i d d e a m i n a s e s a n d a n a m m o n i a p r o b e a r e a v a i l a b l e ( G u i l b a u l t a n d H r a b a n k o v a , 1 9 7 0 b , c , 1 9 7 1 ; G u i l b a u l t a n d S h u , 1 9 7 1 ) b u t t h e e n z y m e s l a c k s p e c i f i c i t y a n d c a t i o n i n t e r f e r e n c e w i t h t h e s e n s o r e l e c t r o d e p o s e s m a j o r p r o b l e m s in
f o o d a p p l i c a t i o n s . A l t e r n a t i v e l y , a m i n o a c i d s m i g h t b e a s s a y e d w i t h a s p e c i f i c d e c a r b o x y l a s e a n d a c a r b o n d i o x i d e e l e c t r o d e a s h a s b e e n u s e d f o r d e t e r m i n a t i o n o f L - t y r o s i n e ( G u i l b a u l t a n d S h u , 1 9 7 2 ) .
A n i n t e r e s t i n g c o n c e p t o f e n z y m a t i c
a n a l y s i s w a s s u g g e s t e d r e c e n t l y f o r a n a l y s i s o f i n o r g a n i c p h o s p h a t e ( W e e t a l ,
1 9 7 3 b ; W e e t a l a n d J a c o b s o n , 1 9 7 2 ) . I n t h i s s y s t e m , p - n i t r o p h e n y l p h o s p h a t e is h y d r o l y z e d t o t h e c h r o m o p h o r e , p - n i t r o - p h e n o l , a n d i n o r g a n i c p h o s p h a t e b y a l k a l i n e p h o s p h a t a s e . I t w a s f o u n d t h a t a d d e d p h o s p h a t e s h i f t e d t h e r e a c t i o n e q u i l i b r i u m a n d t h a t l e v e l s o f p h o s p h a t e c o u l d b e c o r r e l a t e d w i t h t h i s s h i f t a s m e a s u r e d b y d e c r e a s e i n c h r o m o p h o r e c o n c e n t r a t i o n .
I t w a s s u g g e s t e d t h e m e t h o d c o u l d b e a p p l i e d t o a n e n z y m e s y s t e m in w h i c h a p r o d u c t a f f e c t s r e a c t i o n e q u i l i b r i u m i f
o n e o f t h e c o m p o n e n t s o f r e a c t i o n c a n b e
m e a s u r e d .
Automated analysisS e v e r a l a u t o m a t e d a n a l y s e s h a v e b e e n
d e v e l o p e d f o r a s s a y o f e n z y m e s a n d c o n s t i t u e n t s u s i n g e n z y m i c r e a c t i o n s ( G u i l b a u l t , 1 9 7 0 b ) w h i c h i n c l u d e a n a l y s e s o f g l u c o s e a n d u r e a ( H o r n b y e t a l . , 1 9 7 0 ;
I n m a n a n d H o r n b y , 1 9 7 2 ; F i l i p p u s s o n e t
a l . , 1 9 7 2 ; B e r g m e y e r a n d H a g e n , 1 9 7 2 ) . I n t h e s e s y s t e m s , e n z y m e s a r e u s u a l l y c o u p l e d t o t h e i n s i d e o f s a m p l e t r a n s f e r t u b e s . P r o d u c t i s m o n i t o r e d c o n t i n u o u s l y i n t h e a u t o m a t e d s y s t e m .
A c i r c u l a t i n g s y s t e m u s i n g g l u c o s e o x i d a s e a n d a n o x y g e n e l e c t r o d e h a s b e e n
d e s c r i b e d r e c e n t l y w h i c h a n a l y z e d s a m p l e s a t t h e r a t e o f 6 0 p e r h r ( B e r g m e y e r a n d H a g e n , 1 9 7 2 ) . A c o n t i n u o u s m o n i t o r
o f w a t e r s u p p l i e s f o r c h o l i n e s t e r a s e i n h i b i t o r s s u c h a s m a l a t h i o n , p a r a t h i o n , d i m e l i t a n a n d p a r a o x o n i s b e i n g d i s t r i b u t e d c o m m e r c i a l l y ( G o o d s o n a n d J a c o b s , 1 9 7 2 , 1 9 7 3 ) .
P r i n c i p l e s i n v o l v e d i n r a d i o i m m u n o a s s a y h a v e b e e n a d a p t e d r e c e n t l y t o e n z y m e i m m u n o a s s a y . T h e t e c h n i q u e h a s
b e e n u s e d t o d e t e c t n a n o g r a m q u a n t i t i e s o f m o r p h i n e ( R o b e n s t e i n e t a l . , 1 9 7 2 ) a n d f o r q u a n t i t a t i o n o f h u m o r a l I g G
( A v r a m e a s a n d G u i l b e r t , 1 9 7 2 ) . I t s h o u l d b e a p p l i c a b l e t o a n y c o m p o u n d t h a t w i l l
p r o d u c e s p e c i f i c a n t i b o d i e s b u t a m a j o r p r o b l e m w o u l d b e c r o s s r e a c t i o n s w i t h c o m p o u n d s h a v i n g s i m i l a r s t r u c t u r e s .
D e v e l o p m e n t o f e n z y m i c a n a l y s e s a p p e a r s t o b e a p r o m i s i n g r e s e a r c h a r e a in
t h e f o o d i n d u s t r y . T h e s p e c i f i c i t y a n d s e n s i t i v i t y o f e n z y m a t i c m e t h o d s c o u l d
e l i m i n a t e m a n y s t e p s r e q u i r e d f o r p u r i f i c a t i o n a n d c o n c e n t r a t i o n o f t h e c o m p o n e n t t o b e t e s t e d . A p p l i c a t i o n o f i m m o b i
l i z e d e n z y m e s t o t h e s e a n a l y t i c a l t e c h n i q u e s w o u l d d e p e n d o n t h e s p e c i f i c i t y , s e n s i t i v i t y a n d s t a b i l i t y o f t h e e n z y m e d e r iv a t i v e a n d t o a v a i l a b i l i t y o f t h e s u b s t r a t e t o
e n z y m e .
REFERENCESAvrameas, S. and Guilbert, B. 1972 . Enzyme-
im munoassay for the measurement o f antigens using peroxidase conjugates. Bio- chim. 54: 837.
Axen, R., Myrin, P.A. and Janson, J.C. 1970. Chemical fixation of chym otrypsin to water-insoluble crosslinked dextran (Sepha-

658-J O U R N A L O F FO O D S C IE N C E -V o lu m e 3 9 (1 9 7 4 )
dex) and solubilization of the enzym e derivatives by means of dextranase. B iopolymers 9: 401.
Bachler, M.J., Strandberg, G.W. and Sm iley,K.L. 1970 . Starch conversion by im m obilized glucoam ylase. B iotechnol. Bioeng. 12: 85.
Balcom, J., Foulkes, P ., Olson, N.F. and Richardson, T. 197 1 . Im m obilized catalase. Proc. B iochem . 6(8): 42.
Bar-Eli, A. and Katchalski, E. 1963 . Preparation and properties o f water insoluble derivatives o f trypsin. J. Biol. Chem. 238: 1690.
Barker, S .A ., Emery, A.N. and Novais, J.M. 1971 . Enzym e reactors for industry. Proc. Biochem . 6: 11.
Barker, S.A . and E pton, R. 1970. Water insoluble enzym es. Proc. Biochem . 5: 14.
Barker, S .A ., Somers, P.J. and Epton, R. 1968. Preparation and properties o f a-amylase chem ically coupled to m icrocrystalline cellulose. Carbohyd. Res. 8: 491.
Barker, S .A ., Somers, P.J. and Epton, R. 1969. Preparation and stability o f exo-am ylolytic enzym es chem ically coupled to m icrocrystalline cellulose. Carbohyd. Res. 9: 257.
Barker, S .A ., Somers, P.J., Epton, R. and McLaren, J.V. 197 0 . Crosslinked polyacrylam ide derivatives (Enzacryls) as water insolub le ca rr ier s o f am ylolytic enzym es. Carbohyd. Res. 14: 287.
Bennett, H.P.J., E lliott, D .F ., Lowry, P.J. and McMartin, C. 1971 . The com plete hydrolysis o f peptides by a mixture of Sepharose- bound peptidases. Biochem . J. 125: 80.
Bergmeyer, H.U. and Hagen, A. 1972 . Ein neues Prinzip enzym atischer Analyse. Z. Anal. Chem. 261: 333.
Bernfeld, P. and Wan, J. 197 3 . Antigens and enzym es m ade insoluble by entrapping them into lattices o f synthetic polym ers. Science 142: 678.
Broun, G., Selegny, E., Avrameas, S. and Thom as, T. 1969 . Enzym atically active membranes: Som e properties of cellophane membranes supporting cross-linked enzym es. Biochim . Biophys. Acta 185: 258.
Bunting, P.S. and Laidler, K.J. 1 972 . K inetic studies on solid supported 0-galaetosidase. Biochem . 11: 4477 .
Butterworth, T .A ., Wang, D.I.C. and Sinskey,A. J. 1 970 . A pplication of ultrafiltration for enzym e retention during continuous enzym atic reaction. B iotechnol. Bioeng. 12: 615.
Chibata, I., Tosa, T., Sato, T., Mori, T. and Matsuo, Y. 1972 . Preparation and industrial application of im m obilized enzym es. Proc. Fourth Intern. Ferm entation Sym posium . Publ. by Soc. Ferm entation Technol., Osaka, Japan.
Christison, J. 1972. Preparation of im m obilized glucoam ylase. Chem. Ind. 1972(5 ): 215.
Chung, S.T., Hamano, M., Aida, K. and Uemura, T. 1968 . Studies on ATP deaminase. Part 3. Water insoluble ATP deaminase. Agr. Biol. Chem. 32: 1287.
Cuatrecasas, P. 1971 . Selective adsorbents based biochem ical specificity . In “ Biochem ical Aspects o f R eactions on Solid Supports,” Ed. Stark, G.P. Academ ic Press, New York.
Dahlqvist, A., M attiasson, B. and Mosbach, K.1973. H ydrolysis o f 0-galactosides using polymer-entrapped lactase. A study towards producing lactose-free milk. B iotechnol. Bioeng. 15: 395.
Dinelli, D. 1972. Fiber-entrapped enzym es. Process Biochem . 7(8): 9.
Dolgikh, T .V ., Surovtsev, V .I., K ozlov, L.V., A ntonov, V.K., Ginodman, L.M. and Zvyat- intsev, V .I. 1971 . Properties o f chym otryp- sin covalently bound to carboxym ethyl-cel- lulose in relation to milk coagulation. Prikl. Biokhim . M ikrobiol. 7: 686.
Epton, R. and Thomas, T.H. 1971. Improving nature’s catalysts. Aldrichimica Acta 4: 61.
Ernstrom, C.A. and Tittsler, R.P. 1965 . Rennin action and cheese chem istry. In “Fundam entals o f Dairy Chem istry,” Ed. by Webb,B. H. and Johnson, A.H. Avi Publ. Co., Inc., Westport, Conn.
Ferrier, L.K., Richardson, T., Olson, N .F. and Hicks, C.L. 1972 . Characteristics o f insoluble pepsin used in continuous milk clotting system . J. Dairy Sci. 55: 726 .
Filippusson, H. and Hornby, W.E. 1970. The preparation and properties o f yeast /3-fruc- tofuranosidase chem ically attached to p o lystyrene. Biochem . J. 120: 215.
Filippusson, H., Hornby, W.E. and McDonald,
A. 197 2. The use o f im m obilised derivatives o f urease and ureate oxidase in autom ated analysis. FEBS Lett. 20: 291.
Getrelius, S., M attiason, Bo. and Mosbach, K.1972 . Studies on pH activity profiles o f an im m obilized tw o enzym e system . Biochim. Biophys. Acta 276: 339.
Goldman, R., G oldstein, L. and Katchalski, E. 1971 . Water-insoluble enzym e derivatives and artificial membranes. In “ Biochemical A spects o f R eactions on Solid Supports,” Ed. Stark, G.R. Academ ic Press, New York.
Goldman, R., Kedem, O., Silman, I.H ., Caplan,S.R. and Katchalski, E. 1968 . Papain-collod ion membranes. 1. Preparation and properties. Biochem . 7: 486.
Goldman, R., Silman, H.I., Caplan, S.R., Kedem, O. and Katchalski, E. 1965 . Papain membrane on a collod ion matrix: preparation and enzym ic behavior. Science 150: 758.
G oldstein, L. 1970 . W ater-insoluble derivatives o f proteolytic enzym es. In “ M ethods En- zy m o l,” Ed. Perlman, G.E. and Lorand, L. V ol. 19, Academ ic Press, New York.
G oldstein, L. and Katchalski, E. 1968. Use of water-insoluble enzym e derivatives in b iochem ical analysis and separation. Fresenius’ Z. Anal. Chem. 243: 375.
Goldstein, L., Levin, Y. and Katchalski, E.1964 . A water-insoluble poly anionic derivative o f trypsin. 2. E ffect of the polyelectroly te carrier on the kinetic behavior o f the bound trypsin. Biochem . 3: 1913 .
G oldstein, L., Lifshitz, A. and Sokolovsky, M. 1971 . W ater-insoluble derivatives o f narin- ginase. Int. J. Biochem . 2: 446.
Goldstein, L., Pecht, M., Blumberg, S., Atlas, D. and Levin, Y. 1970 . W ater-insoluble enzym es. Synthesis o f a new carrier and its utilization for preparation of insoluble derivatives o f papain, trypsin and subtilopep- tidase A. Biochem . 9: 2322 .
G oodson, L.H. and Jacobs, W.B. 1972 . A rapid d etection system for organophosphates in water. In “Proc. National Conference on Control o f Hazardous Materials Spills,” H ouston, Texas. Environmental Protection Agency.
G oodson, L.H. and Jacobs, W.B. 1973 . An im m obilized cholinesterase product for use in rapid d etection of enzym e inhibitors in air or water. Anal. Biochem . 51: 362.
Green, M.L. and Crutchfield, G. 196 9 . Studies on the preparation of water-insoluble derivatives o f rennin and chym otrypsin and their use in the hydrolysis o f casein and the clotting of milk. Biochem . J. 115: 183.
Grubhofer, N. and Schlieth, L. 1954. Coupling o f proteins on diazotized polyam inostyrene. H oppe-Seylers Z. Physiol. Chem. 297: 108.
Guilbault, G. 1970a. “Enzym atic M ethods of A nalysis.” Pergamon Press, Oxford, England.
Guilbault, G. 1970b . Use o f enzym es in and kinetic aspects o f analytical chem istry. Anal. Chem. 42: 334R .
Guilbault, G.G. 1970c. Enzym ic m ethods of analysis. CRC Crit. Rev. Anal. Chem. 1: 377.
Guilbault, G.G. and Hrabankova, E. 1970a. Determ ination of urea in b lood and urine w ith a urea-sensitive electrode. Anal. Chim. Acta 52: 287.
Guilbault, G.G. and Hrabankova, E. 1970b . An electrode for determ ination of am ino acids. Anal. Chem. 42: 1779 .
Guilbault, G.G. and Hrabankova, E. 1970c. L-Amino acid electrode. Anal. Lett. 3: 53.
Guilbault, G.G. and Hrabankova, E. 1971 . New enzym e electrode probes for D-amino acids and asparagine. Anal. Chim. Acta 56: 285.
Guilbault, G.G. and Lubrano, G.J. 1 972 . Enzym e electrode for glucose. Anal. Chim. Acta 60: 254.
Guilbault, G.G. and M ontalvo, J.G. Jr. 1969a. A urea-specific enzym e electrode. J. Am. Chem. Soc. 91: 2164.
Guilbault, G.G. and M ontalvo, J.G. Jr. 1969b. Improved urea-specific electrode. Anal. Lett. 2: 283.
Guilbault, G.G. and M ontalvo, J.G. Jr. 1970. An enzym e electrode for the substrate urea. J. Am. Chem. Soc. 92: 2533.
Guilbault, G.G. and Shu, F.R. 1971 . A1 electrode for the determ ination of glutamine. Anal. Chim. Acta 56: 333.
Guilbault, G.G. and Shu, F.R. 1972. Enzym e electrodes based on the use o f a carbon
dioxide sensor. Urea and L-tyrosine elec trodes. Anal. Chem. 44: 2161 .
Guilbault, G.G., Smith, R.K. and M ontalvo J.G. Jr. 1 969 . Use o f io n selective electrode: in enzym ic analysis. Cation electrodes foi deaminase enzym e system s. Anal. Chem 41: 600.
Hornby, W.E., F ilippusson, H. and M cDonald. A. 1970 . The preparation of glucose oxidase chem ically attached to polystyrene and its use in the autom ated analyses o f glucose. FEBS Lett. 9: 8.
Hornby, W.E., Lilly, M.D. and Crook, E.M.1966 . The preparation and properties oi ficin chem ically attached to carboxym ethyl- eellulose. Biochem . J. 98: 420.
Hustad, G.O., Richardson, T. and Olson, N .F. 1973a. Im m obilization of/3-galactosidase on an insoluble carrier with a polyisocyanate polym er. 1. Preparation and properties. J. Dairy Sci. 56: 1111.
Hustad, G.O., Richardson, T. and Olson, N .F. 1973b . Im m obilization of 0-galactosidase on an insoluble carrier w ith a polyisocyanate polym er. 2. K inetics and stability. J. Dairy Sci. 56: 1118.
Inman, D.J. and Hornby, W.E. 1972 . The im m obilization o f enzym es on nylon structures and their use in autom ated analysis. Biochem . J. 129: 255.
Johnson, P. and W ateley, T.L. 197 1 . On the use of polym erizing silica gel system s for the im m obilization o f trypsin. J. Colloid Interface Sci. 37: 557.
Karube, I., Suzuki, S., Kinoshita, S. and Miyu- guchi, J. 1971 . Electrochem ical shaping of fibrous protein fibrils. Ind. Eng. Chem. Prod. Res. Dev. 10: 160.
Katchalski, E., Silm an, I. and Goldm an, R. 197 1 . E ffect o f the m icroenvironm ent on the m ode of action of im m obilized enzym es. Adv. E nzym ol., Relat. Areas Mol. Biol. 34: 445 .
Kay, G., Lilly, M .D., Sharp, A.K. and W ilson, R.J.H. 1968. Preparation and use o f porous sheets w ith enzym e action. Nature 217: 641.
Kimura, A., Shirasaki, H. and Usami, S. 1969 . K inetics o f enzym e adsorbed on adsorbent. K ogyo Kagaku Zasshi 72: 489.
Koelsch, R., Lasch, J. and Hanson, H. 1970 . Covalent and noncovalent binding of leucine am inopeptidase to water-insoluble carriers. Acta Biol. Med. Ger. 24: 833.
Kretchmer, N. 197 2 . Lactose and lactase. Sci. Amer. 227(4): 71.
Ledingham, W.M. and Hornby, W.E. 1 9 6 9 . The action pattern of water-insoluble a-amyl- ases. FEBS Lett. 5: 118.
Levin, Y ,, Pecht, M., G oldstein, L. and K atchalski, E. 1964 . Water insoluble polyanionic derivative o f trypsin. 1. Preparation and properties. Biochem . 3: 1905.
Lilly, M.D. 197 1 . Stability o f im m obilized (3- galactosidase on prolonged storage. B iotechnol. Bioeng. 13: 589.
Lilly, M.D., Hornby, W.E. and Crook, E.M.1966 . The kinetics o f carboxym ethylcellu- lose-ficin in packed beds. Biochem . J. 100: 718.
L loyd, N.E. and Logan, R.M. 1972 . Process for isom erizing glucose to fructose. U .S. Patent 3 ,6 9 4 ,3 1 4 .
Lucacchini, A ., R onca, G., M ontali, U. and Rossi, C.A. 1971. Preparation and properties o f active water-insoluble derivatives o f adenosine deaminase. Int. J. Protein R es. 4: 57.
Maeda, H. and Suzuki, H. 1970 . Water insoluble enzym e. 1. General properties o f CM cellulose glucoam ylase. N ippon N ogei Kagaku Kaishi 44: 547. (Chem. Abstr. 74: 1 3 5 4 4 2 , 1971).
Maeda, H. and Suzuki, H. 1972a. Preparation and general properties o f glucoam ylase bound to halogenacetyl cellulose. Agr. Biol. Chem. 36: 1581.
Maeda, H. and Suzuki, H. 1972b . On the activities o f glucoam ylase chem ically fixed to cyanogen brom ide activated cellulose. Agr. Biol. Chem. 36: 1839.
Manecke, G. 1962. Reactive polym ers and their use for the preparation o f antibody and enzym e resins. Pure Appl. Chem. 4: 507.
Marshall, J.J. and Whelan, W.J. 1971 . A new approach to the use of enzym es in starch technology. Chem. Ind. 1971 (2 5 ): 701.
Martensson, K. and M osbach, K. 1972 . Covalen t coupling of pullulanase to an acrylic copolym er using a water soluble carbodi-

IM M O B IL IZ E D E N Z Y M E S -F O O D PRO CESSING A N D A N A L Y S IS-659im ide. B iotechnol. Bioeng. 14: 715.
Mason, R.D. and Weetal, H.H. 197 2 . Invertase covalently coupled to porous glass. B iotechnol. Bioeng. 14: 637 .
Melrose, G.J.H. 1971 . Insolubilized enzym es; biochem ical applications o f synthetic p o ly mers. Rev. Pure Appl. Chem. 21: 83.
Messing, R.A . 1 970 . Insoluble papain prepared by adsorption on porous glass. Enzym ologia 38: 39.
Mitz, M.A. 1956 . New insoluble active derivative o f an enzym e as a m odel for study of cellular m etabolism . Science 125: 1076 .
Monsan, P. and Durand, G. 197 1 . Preparation o f insolubilized invertase by adsorption on bentonite. FEBS Lett. 16: 39.
M ontalvo, J.G. Jr. 1970. An im proved urease electrode. Anal. Biochem . 38: 357.
M ontalvo, J.G. Jr. and Guilbault, G.G. 1969 . Sensitized cation selective electrode. Anal. Chem. 41: 1897.
Mosbach, K. 1 971 . Enzym es bound to artificial m atrixes. Sci. Am. 224: 26.
O’Neill, S.P. 1972 . Thermal inactivation o f im m obilized enzym es in ideal continuous reactors. B iotechnol. Bioeng. 14: 47 3 .
O’Neill, S .P ., Dunnill, P. and Lilly, M.D. 1971. A comparative study of im m obilized amylo- glucosidase in a packed bed reactor and a continuous feed stirred tank reactor. Biotechnol. Bioeng. 13: 337.
Park, Y .K . and Lima, D.C. 1 973 . C ontinuous conversion o f starch to glucose b y an am ylo- glucosidase-resin com plex. J. Food Sci. 38: 358.
Pennington, S .N ., Brown, H .D ., Patel, A.B. and Knowles, C.O. 1968. Properties o f matrix supported acetylcholinesterase. Biochim . Biophys. Acta 167: 479.
Quiocho, F .A . and Richards, F.M. 1966 . The enzym ic behavior o f carboxypeptidase-A , in the solid state. Biochem . 5: 4062 .
Reed, G. 1966 . “E nzym es in F ood Processing.” Academ ic Press, N .Y .
R obinson, P.J., Dunnill, P. and Lilly, M.D. 1971. Porous glass as a solid support for im m obilization or affin ity chrom atography of enzym es. Biochim . Biophys. Acta 242: 659 .
Royer, G.P. and Andrews, J.P. 197 2 . Im m obilized derivatives o f am inopeptidase and am inopeptidase M. J. Biol. Chem. 248: 1807.
Rubenstein, K.E., Schneider, R .S. and Ullman,E.F. 1 972 . H om ogeneous enzym e im m unoassay. Biochem . Biophys. Res. Commun. 47: 846.
Sato, T., Mori, T ., Tosa, T. and Chibata, I. 1971. Studies on im m obilized enzym es. 9. Preparation and properties o f am inoacylase covalently attached to halogenoaeetylcellu- loses. Arch. Biochem . Biophys. 147: 788.
Selegny, E., Broun, G. and Thom as, D. 1971. Enzym atically active m odel membranes: ex perimental illustrations and calculations on the basis o f d iffusion reaction kinetics o f their functioning, o f regulatory effects, o f facilitated, retarded and active transports. Physiol. Veg. 9: 25.
Sharp, A .K., Kay, G. and Lilly, M.D. 1969. The kinetics o f (3-galactosidase attached to p o rous cellu lose sheets. B iotechnol. Bioeng. 11: 363.
Shipe, W.F., Senyk, G. and Weetal, H.H. 1972. Inhibition o f oxid ized flavor developm ent in m ilk by im m obilized trypsin. J. Dairy Sci. 55: 647.
Silman, I.H., Albu-Weissenberg, M. and Katchal- ski, E. 1966. Som e water-insoluble papain derivatives. Biopolym ers 4: 441 .
Silman, I.H. and Katehalski, E. 1966 . Water-
insoluble derivatives of enzym es, antigens, and antibodies. Ann. Rev. Biochem . 35: 873.
Sm iley, K.L. 197 1 . C ontinuous conversion of starch to glucose w ith im m obilized gluco- amylase. B iotechnol. Bioeng. 13: 309 .
Strandberg, G.W. and Sm iley, K.L. 1971. Free and im m obilized glucose isomerase from Strep tom yces phaeochrom ogenes. Appl. M icrobiol. 21: 588.
Strandberg, G.W. and Sm iley, K.L. 1972 . Glucose isomerase covalently bound to porous glass beads. B iotechnol. Bioeng. 14: 509.
Suzuki, H., Karube, I. and Watanabe, Y . 1972 . Electrolytic preparation o f enzym e-collagen film s. Proc. Fourth Intern. Ferm entation Sym posium . Publ. by Soc. Ferm entation Technol., Osaka, Japan.
Suzuki, H., Ozawa, Y. and Maeda, H. 1966 . Studies on the water-insoluble enzym e hydrolysis o f sucrose by insoluble yeast invertase. Agr. Biol. Chem. 30: 807 .
Takasaki, Y ., Kosugi, Y. and Kanbayashi, A.196 9 . Streptom yces glucose isom erase. In “ Ferm entation Advances,” Ed., Perlman, D. p. 561.
Taylor, J.B. and Swaisgood, H.E. 1 972 . A k inetic study on the effect o f coupling distance betw een insoluble trypsin and its carrier m atrix. Biochim . Biophys. Acta 284: 268.
Tosa, T., Mori, T. and Chibata, I. 1971b . Studies on continuous enzym e reactions. 8. K inetics and pressure drop of am inoacylase colum n. Hakko Kogaku Zasshi 49: 522.
Tosa, T., Mori, T ., Fuse, N. and Chibata, I. 1966a. Studies on continuous enzym e reactions. 1. Screening o f carriers for preparation of water-insoluble am inoacylase. En- zym ol. 31: 214.
Tosa, T., Mori, T., Fuse, N. and Chibata, I. 1966b . Studies on continuous enzym e reactions. 2. Preparation o f DEAE-cellulose- am inoacylase colum n and continuous op tical resolution o f acetyl-D L-m ethionine. E nzym ol. 31: 225 .
Tosa, T., Mori, T ., Fuse, N. and Chibata, I. 1967a. Studies on continuous enzym e reactions. 3. Enzym atic properties o f the DEAE- cellulose-am inoacylase com plex. Enzym ol. 32: 153.
Tosa, T., Mori, T., Fuse, N . and Chibata, I. 1967b. Studies on continuous enzym e reactions. 4. Preparation o f a DEAE-Sephadex- am inoacylase colum n and continuous op tical resolution of acyl-DL-amino acids. B iotechnol. Bioeng. 9: 603.
Tosa, T ., Mori, T., Fuse, N. and Chibata, I. 1969a. Studies on continuous enzym e reactions. Part 5. K inetics and industrial application o f am inoacylase colum n for continuous optical resolution of acyl-DL-amino acids. Agr. Biol. Chem. 33: 1047.
Tosa, T., Mori, T. and Chibata, I. 1969b. Studies on continuous enzym e reactions. Part 6. Enzym atic properties o f the DEAE-Sepha- d ex-am in oaey lase com plex. Agr. Biol. Chem. 33: 1053.
Tosa, T., Mori, T. and Chibata, I. 1971a. Studies on continuous enzym e reactions. 7. Activation o f water-insoluble am inoacylase by protein denaturing agents. Enzym ol. 40: 49.
Tosa, T., Sato, T., Mori, T., M atuo, Y . and Chibata, I. 1 9 7 3 . Continuous production of L-aspartic acid by im m obilized aspartase. Biotechnol. Bioeng. 15: 69.
Tu, S. and M cCormick, D.B. 197 2 . Insolubilized D-amino acid oxidase: properties and potential use. Separation Sci. 7: 403.
Updike, S.J. and Hicks, G.P. 1967. The enzym e electrode. Nature 214: 986.
Urabe, I. and Okada, H. 1972 . Im m obilization o f acylated bacterial a-amylase. Proc. Fourth Intern. Ferm entation Sym posium . Publ. by Soc. Ferm entation Technol., Osaka, Japan.
Usami, S. and Shirasaki, H. 197 0 . K inetics o f enzym e adsorbed on adsorbent. Hakko Kogaku Zasshi 48: 506.
Usami, S. and Taketom i, N. 1965 . A ctivities o f enzym e adsorbed on adsorbents. 1. Hakko Kyokaishi 23: 267.
Usami, S., Yamada, T. and Kimura, A. 1967. A ctivities o f enzym e adsorbed on adsorbents. 2. Stability o f adsorbed enzym e. Hakko K yokaishi 25: 513. (Chem. Abstr. 68: 8 4 4 9 9 , 1968).
Wang, S.S. and V ieth , W.R. 1973 . Collagen- enzym e com plex m embranes and their perform ance in b iocatalytic m odules. B iotechnol. Bioeng. 15: 93.
Weetal, H.H. 1 9 6 9 . Trypsin and papain covalen tly coupled to porous glass: preparation and characterization. Science 166: 615 .
Weetal, H. 1973a. Im m obilized enzym es: som e applications to foods and beverages. Part 1. Im m obilization m ethods. Food Product D evelopm ent 7(3): 46.
Weetal, H.H. 1973b . Im m obilized enzym es: som e applications to foods and beverages. Part 2. Applications. Food Product D evelopm ent 7(4): 94 .
Weetal, H.H. and Jacobson, M.A. 197 2 . Studies on phosphate inhibition and quantitation using im m obilized bacterial alkaline phosphatase. Proc. Fourth Intern. Ferm entation. Sym posium . Publ. Soc. Ferm entation Technology , Osaka, Japan.
Wierzbicki, L.E. and K osikowski, F .V . 1973. Lactase potential o f various microorganisms grown in w hey. J. Dairy Sci. 56: 26.
Wildi, B.S. and B oyce, C. 1 9 7 1 . Chillproofing of beverages using insoluble polym er-enzym e product. U .S. Pat. 3 ,5 9 7 ,2 1 9 .
Williams, D., Doig, A. and Korosi, A. 1970. Electrochem ical enzym atic analysis o f b lood glucose and lactate. Anal. Chem. 42: 118.
Wilson, R.J.H. and Lilly, M.D. 1969. Preparation and use o f insolubilized am yloglueosi- dase for the production of sw eet glucose liquors. B iotechnol. Bioeng. 11: 349.
Wingard, L.B., Liu, C.C. and Nagda, N.L. 1971. Electrochem ical m easurem ents w ith glucose oxidase im m obilized in polyacrylam ide gel: Constant current voltam etry. B iotechnol. Bioeng. 13: 629.
Witt, P.R ., Sair, R .A ., Richardson, T. and Olson, N .F. 1970 . Chillproofing beer with insoluble papain. Brewers Digest 45(10 ): 70.
W oychik, J.H. and W ondolowski, V. 1972. Covalent bonding o f fungal /3-galactosidase to glass. Biochim. Biophys. A cta 289: 347.
Wykes, J .R ., Dunnill, P. and Lilly, M.D. 1971. Im m obilization o f a-amylase by attachm ent to soluble support materials. Biochim . Biophys. Acta 250: 522.
Zaborsky, O. 1973. “ Im m obilized E nzym es.” CRC Press, Cleveland, Ohio.
Z ienty, M.F. 197 2 . Stabilization o f glucose isomerase in Streptom yces olivaceus cells. Ger. O ffen. 2 ,2 2 3 ,3 4 0 . (Chem. Abstr. 78: 4 1 5 8 4 , 1 9 7 3 ).
Ms received 2 /1 8 /7 3 ; accepted 2 /5 /7 4 .Presented at the 33rd Annual M eeting o f the
Institute o f Food Technologists in Miami Beach.
Funds for publication were obtained from the College o f Agricultural and Life Sciences, University o f W isconsin, and the Cooperative State Research Service, U .S. Dept, o f Agriculture.

W IL L IA M L. S T A N L E Y a n d A L F R E D C. O L S O N
U S D A W estern R eg io n a l R esea rch L a b ., A R S , B e r k e le y , CA 9 4 7 1 0
SYMPOSIUM: Immobilized Enzymes in Food Systems THE CHEMISTRY OF IM M OBILIZING ENZYMES
H E T E R O G E N E O U S C A T A L Y S I S w i d e l y u s e d in c h e m i c a l i n d u s t r i e s h a s h a d o n l y
l i m i t e d a p p l i c a t i o n in f o o d p r o c e s s i n g . O n e n o t a b l e e x c e p t i o n is t h e c a t a l y t i c i s o m e r i z a t i o n a n d h y d r o g e n a t i o n o f v e g e t a b l e o i l s . G e n e r a l l y , t h e c a t a l y s t s o f
c h e m i c a l p r o c e s s i n g o p e r a t e b e s t u n d e r c o n d i t i o n s o f t e m p e r a t u r e a n d p r e s s u r e
t o o v i g o r o u s f o r f o o d s , a n d a r e n o t s e l e c t i v e e n o u g h in t h e i r f u n c t i o n s .
E n z y m e s , t h e c a t a l y s t s o f l i v i n g o r g a n i s m s , b e c a u s e t h e y o p e r a t e u n d e r m u c h m i l d e r c o n d i t i o n s a n d a r e h i g h l y s e l e c t i v e , h a v e b e e n u s e d in a n u m b e r o f f o o d p r o c e s s i n g a p p l i c a t i o n s . H o w e v e r , t h e y h a v e b e e n u s e d i n s o l u t i o n a s h o m o g e n e o u s c a t a l y s t s . F o r m a n y a p p l i c a t i o n s t h i s is n o t t h e m o s t e f f i c i e n t w a y t o u s e t h e s e c a t a l y s t s b e c a u s e r e a c t i o n i s s l o w , u s u a l l y t a k i n g s e v e r a l h o u r s , a l a r g e a m o u n t o f e n z y m e is u s e d a n d l e f t in t h e p r o d u c t , p r o d u c t i n h i b i t i o n m a y l i m i t t h e e x t e n t o f r e a c t i o n , p r e c i s e c o n t r o l i s d i f f i c u l t , a n d e n z y m e a c t i o n c a n g e n e r a l l y o n l y b e s t o p p e d b y h e a t i n g . I t i s , o f c o u r s e , t h e o n l y w a y t o u s e e n z y m e s o p e r a t i n g o n
s o l i d s s u c h a s p r o t e a s e s f o r t e n d e r i z i n g m e a t s a n d p e c t i n a s e s a n d c e l l u l a s e s f o r i m p r o v i n g t h e e x t r a c t i o n o f j u i c e s . T a b le 1 l i s t s a s e l e c t i o n o f e n z y m e s u s e d a s h o m o g e n e o u s c a t a l y s t s i n f o o d p r o c e s s i n g a n d t h e i r f u n c t i o n . A n e x t e n s i v e s u r v e y
o f e n z y m e s u s e d in f o o d p r o c e s s i n g c a n b e f o u n d i n R e e d ( 1 9 6 6 ).
M a n y o f t h e e n z y m e s i n l i v i n g c e l l s a r e h i g h l y e f f i c i e n t b e c a u s e t h e y f u n c t i o n a s h e t e r o g e n e o u s c a t a l y s t s i m m o b i l i z e d w i t h i n t h e v a r i o u s o r g a n e l l e s a n d a t t a c h e d t o c e l l m e m b r a n e s . W h e r e s e q u e n t i a l r e a c t i o n s i n v o l v i n g s e v e r a l e n z y m e s o c c u r t h e r e i s a n o r d e r e d a r r a n g e m e n t o f e n z y m e s f i x e d s o t h a t c e l l f l u i d s s t r e a m p a s t c a r r y i n g t h e c o m p o n e n t s a n d i n t e r m e d i a t e s o f t h e r e a c t i o n t o c o m p l e t i o n f r o m s t a g e t o s t a g e i n p r o p e r s e q u e n c e . I n t w o -
a n d t h r e e - e n z y m e c o n c e r t e d r e a c t i o n s in t h e l a b o r a t o r y , M o s b a c h a n d M a t t i a s s o n( 1 9 7 0 ) a n d M a t t i a s s o n a n d M o s b a c h( 1 9 7 1 ) f o u n d t h a t , e v e n t h o u g h r a n d o m l y f i x e d , t h e e n z y m e s in i m m o b i l i z e d f o r m o p e r a t e d m o r e e f f i c i e n t l y t h a n w h e n b o t h w e r e d i s s o l v e d . I t w i l l b e p r o b a b l y a l o n g t i m e b e f o r e s u c h o r d e r e d s y s t e m s w i l l b e u s e d i n f o o d p r o c e s s i n g . H o w e v e r , i m m o b i l i z e d s i n g l e - e n z y m e s y s t e m s h a v e b e e n d e v e l o p e d a n d a r e a l r e a d y b e i n g u s e d c o m m e r c i a l l y .
T h e a d v a n t a g e s o f u s i n g f i x e d o r i m m o b i l i z e d e n z y m e s a r e : t h e y a r e c a p a b l e o f r e p e a t e d r e u s e , a r e r e a d i l y r e m o v e d
f r o m r e a c t a n t s t o s t o p r e a c t i o n , a l l o w m o r e p r e c i s e c o n t r o l , u s u a l l y h a v e i n c r e a s e d s t a b i l i t y , e x h i b i t r e d u c e d p r o d u c t i n h i b i t i o n , d o n o t u n d e r g o s e l f - d i g e s t i o n
( p r o t e o l y s i s ) , h a v e r e d u c e d p o s s i b i l i t y o f
i m m u n o l o g i c a l r e a c t i o n s , p e r m i t u s e o f e n z y m e s f r o m p a t h o g e n i c o r g a n i s m s , a l l o w o p e r a t i o n a t a l t e r e d p H o p t i m a b y m o d i f y i n g t h e c h a r g e c h a r a c t e r i s t i c s o f t h e s u p p o r t .
ENZYME IMMOBILIZATIONN E L S O N A N D G R I F F I N ( 1 9 1 6 ) w e r e t h e f i r s t t o d e m o n s t r a t e i n t h e l a b o r a t o r y
t h e f i x i n g o f a n a c t i v e e n z y m e b y a d s o r b in g i n v e r t a s e o n a l u m i n a a n d o n c h a r c o a l . G r u b h o f e r a n d S c h l e i t h ( 1 9 5 4 ) f i r s t c o u p l e d a n e n z y m e ( p e p s i n ) w i t h a s u p p o r t b y c o v a l e n t b o n d i n g u s i n g d i a z o t i z e d p o l y a m i n o s t y r e n e . I n t h e i n t e r v e n i n g y e a r s , p a r t i c u l a r l y i n t h e l a s t 5 y e a r s , t h e r e h a s b e e n a r e m a r k a b l e n u m b e r o f m e t h o d s r e p o r t e d f o r i m m o b i l i z i n g e n z y m e s , t o o m a n y f o r c o m p l e t e c o v e r a g e h e r e . I n t h i s d i s c u s s i o n w e w i l l p r e s e n t s o m e o f t h e m o r e p r o m i s i n g b a s i c s y s t e m s
w i t h e m p h a s i s o n t h o s e t h a t a t t h i s t i m e a p p e a r t o b e m o s t s u i t e d f o r f o o d p r o c e s s i n g a p p l i c a t i o n s .
I m m o b i l i z i n g s y s t e m s m a y b e c l a s s i f i e d u n d e r t h e f o l l o w i n g t h r e e g e n e r a l
c a t a g o r i e s o r m a y r e p r e s e n t c o m b i n a t i o n s t h e r e o f : ( 1 ) a d s o r p t i o n , ( 2 ) e n t r a p m e n t ( e n c a p s u l a t i o n ) , a n d ( 3 ) c o v a l e n t b o n d
in g . N o s i n g l e s y s t e m c a n b e s a id t o s e r v e w e l l f o r a l l e n z y m e s , b e c a u s e e n z y m e s d i f f e r w i d e l y i n t h e i r c o m p o s i t i o n , o v e r a l l
c h a r g e c h a r a c t e r i s t i c s a n d t h e c o m p o s i t i o n o f t h e i r a c t i v e p r o s t h e t i c g r o u p s . S u b s t r a t e c h a r a c t e r i s t i c s a l s o w i l l i n f l u e n c e t h e c h o i c e o f i m m o b i l i z i n g s y s t e m s .
A d s o r p t i o n
A d s o r p t i o n , i n v o l v i n g t h e a t t r a c t i o n o f
o p p o s i t e e l e c t r i c a l c h a r g e s a n d o t h e r “ p h y s i c o c h e m i c a l b o n d s , ” i s p r o b a b l y t h e c h e a p e s t a n d l e a s t c o m p l i c a t e d s y s t e m f o r
i m m o b i l i z i n g e n z y m e s . I t i s m i l d a n d f r e q u e n t l y p r o v i d e s p u r i f i c a t i o n d u r i n g s o r p t i o n . H o w e v e r , a d s o r b e d e n z y m e i s in e q u i l i b r i u m w i t h e n z y m e in s o l u t i o n a n d
m a y b e d i s p l a c e d b y o t h e r i o n i c s p e c i e s , o t h e r p r o t e i n , o r s u b s t r a t e . T h u s , in f l o w t h r o u g h s y s t e m s , s u c h a s s t i r r e d - b e d r e a c t o r s a n d p a c k e d c o l u m n s , e n z y m e i s g r a d u a l l y l o s t a n d e v e n t u a l l y m u s t b e r e p l a c e d w h e n t h e l e v e l b e c o m e s t o o l o w . A d s o r p t i o n s h o u l d n o t b e u s e d , i f e n z y m e c a n n o t b e t o l e r a t e d in t h e p r o d u c t . T h e i o n i c s t r e n g t h a n d p H o f t h e r e a c t a n t s o l u t i o n a s w e l l a s t h e l e v e l o f p r o t e i n a c e o u s m a t e r i a l a n d o t h e r c o n t a m i n a n t s ( M i t z ,
1 9 5 6 ) m u s t b e c a r e f u l l y c o n t r o l l e d . A s i s t r u e w i t h a l l i m m o b i l i z e d e n z y m e s y s t e m s , p r o t e i n m a y “ p i l e o n ” f o u l i n g t h e
s u r f a c e a n d t h e r e b y b l o c k i n g a c c e s s o f s u b s t r a t e t o a c t i v e s i t e s . T h i s e f f e c t , f o r e x a m p l e , s e r i o u s l y l i m i t s t h e a c t i v e l i f e o f i m m o b i l i z e d r e n n i n , a n d t o a l e s s e r e x t e n t , t h e u s e f u l l i f e o f i m m o b i l i z e d l a c t a s e w h e n i n c o n t a c t w i t h n o n f a t m i l k ( O l s o n a n d S t a n l e y , 1 9 7 3 ) .
T ab le 1—E nzym es and th e ir u tiliza tio n in fo o d processing
E nzym e Fu nction
Amylases L iq u ified starchesG lucoam ylase Glucose from starchInvertase In vert syrupsGlucose oxidase-catalase C ontro l o f o ff-fla v o r and
brow ning in pow dered eggsPapain Beer c la rifica tionPectinases Juice c la rifica tionCatalase Destroying hydrogen peroxide
in cheese m anufactu reR ennin Cheese curd fo rm atio n(3-Galactosdase Lactose hydrolysis in w hey
660—JO U R N A L O F FO O D S C IE N C E - V olum e 3 9 (1974)

C H E M IS T R Y O F IM M O B IL IZ IN G E N ZY M E S - 661
A d s o r p t i o n i s b e i n g u s e d i n t h e f i r s t r e p o r t e d c o m m e r c i a l a p p l i c a t i o n o f a n i m m o b i l i z e d e n z y m e , a c o n t i n u o u s p r o c e s s f o r t h e p r e p a r a t i o n o f 1 - m e t h i o n i n e f r o m t h e s y n t h e t i c r a c e m i c m i x t u r e ( T o s a
e t a l . , 1 9 6 7 ) . T h e e n z y m e u s e d , a m i n o
a c y l a s e , b e c a u s e o f i t s o v e r a l l n e g a t i v e
c h a r g e , i s r e l a t i v e l y s t r o n g l y a d s o r b e d
b y d i e t h y l a m i n o e t h y l ( D E A E ) c e l l u l o s e .
U n d e r c o n t i n u o u s o p e r a t i o n t h e c o l u m n o f a d s o r b e d e n z y m e l o s e s a b o u t 4 0 % o f
i t s a c t i v i t y a f t e r a b o u t 4 w e e k s . T h i s i s s i m p l y r e p l a c e d b y a d s o r b i n g s u f f i c i e n t e n z y m e t o b r in g t h e c o l u m n b a c k t o s t r e n g t h . T h e c o n t i n u o u s c o l u m n o p e r a t i o n w a s f o u n d t o g i v e t e n t i m e s t h e y i e l d o f 1 - m e t h i o n i n e o b t a i n e d w i t h s o l u b l e e n z y m e b y t h e b a t c h p r o c e s s .
A l i s t i n g o f a d s o r b e n t s a p p e a r s i n T a b l e 2 . M o s t o f t h e s e m a t e r i a l s a r e c o m m e r c i a l l y a v a i l a b l e a n d m u c h i n f o r m a t i o n i s k n o w n a b o u t t h e i r o p e r a t i o n a l c h a r a c t e r i s t i c s . S o m e o f t h e v e r y f i n e l y d i v i d e d m a t e r i a l s , e . g . , c l a y s , p o w d e r e d c e l l u l o s e , D E A E c e l l u l o s e , c o l l o i d a l s i l i c a , e t c . , m a y s h o w e x c e s s i v e p r e s s u r e d r o p in
c o l u m n o p e r a t i o n . D e p e n d i n g o n d e n s i t y a n d v i s c o s i t y o f f l u i d s t r e a t e d , t h i s p r o b l e m m a y b e o v e r c o m e b y o p e r a t i n g t h e
c o l u m n u p - f l o w o r b y u s i n g a s t i r r e d r e a c t o r f o l l o w e d b y f i l t r a t i o n o r s e t t l i n g
t o r e c o v e r c a t a l y s t . I n t h e 1 - m e t h i o n i n e p r o c e s s m e n t i o n e d e a r l i e r t h e D E A E c e l l u l o s e - a m i n o a c y l a s e c o l u m n w a s o p e r a t e d u p - f l o w . I t i s o u r f e e l i n g t h a t f o r m o s t f o o d a p p l i c a t i o n s i t i s m o r e p r a c t i c a l t o u s e g r a n u la r m a t e r i a l r a n g in g b e t w e e n 2 0 a n d 5 0 m e s h . A n o t a b l e v a r i a t i o n s h o u l d b e m e n t i o n e d ; n a m e l y , a c o m m e r c i a l p r o c e s s f o r c o n v e r t i n g g l u c o s e s y r u p s t o h i g h f r u c t o s e o r s i m u l a t e d
i n v e r t s u g a r s y r u p s , g l u c o s e i s o m e r a s e . T h e o r g a n i s m i t s e l f , S t r e p t o m y c e s s p . ,
T a b le 2 —A dsorbents
A lum in aA n io n - and cation-exchange resins
CarbonC arbo xym ethy ! cellulose D ie th y la m in o e th y l cellulose
ClaysCollagen and co llod ion film s
Glass and o th er m ineral adsorbents
Phenolic po lym ers
a t t e n u a t e d b y h e a t t r e a t m e n t , i s u s e d t o c a r r y o u t t h e c o n v e r s i o n ( L l o y d e t a l . ,1 9 7 0 ) . F a c i l i t i e s a r e n o w i n o p e r a t i o n m a k i n g h u n d r e d s o f m i l l i o n s o f p o u n d s
o f p r o d u c t p e r y e a r ( S c h n y d e r , 1 9 7 3 ) .
E n t r a p m e n t
E n t r a p m e n t o r e n c a p s u l a t i o n u s u a l l y i n v o l v e s t h e f o r m a t i o n o f a w a t e r i n s o l u b l e p o l y m e r o f s t a b l e g e l i n a s o l u t i o n c o n t a i n i n g e n z y m e . F o r e n t r a p p e d e n z y m e s t o f u n c t i o n e f f e c t i v e l y t h e s u b s t r a t e a n d p r o d u c t m o l e c u l e s m u s t b e s m a l l e n o u g h t o d i f f u s e T e a d i ly i n a n d o u t
o f t h e m a t r i x a n d t h e r e s h o u l d b e n o e l e c t r o s t a t i c r e p u l s i o n b e t w e e n m a t r i x a n d
s u b s t r a t e . E n t r a p m e n t c a u s e s n o i n t r i n s i c c h a n g e s i n t h e e n z y m e i t s e l f a l t h o u g h t h e r e m a y b e s o m e l o c a l i z e d c h a r g e e f f e c t s i n t r o d u c e d b y t h e m a t r i x m a t e r i a l
o r , d u r i n g r e a c t i o n , b y b u i l d u p o f r e a c t i o n p r o d u c t s . A m a j o r d i s a d v a n t a g e o f t h e m e t h o d i s t h a t e n z y m e s a c t i n g o n m a c r o m o l e c u l e s , e . g . , p r o t e a s e s a n d a m y l a s e s , e x h i b i t v e r y l o w a c t i v i t y , l e a k a g e o f e n z y m e c a n o c c u r , a n d r e p r o d u c i b l e p r e p
a r a t i o n s a r e d i f f i c u l t t o m a k e . T h e m o s t
w i d e l y u s e d p o l y m e r i s p o l y a c r y l a m i d e
p r o d u c e d b y t h e l i g h t c a t a l y z e d r e a c t i o n
o f a c r y l a m i d e a n d N j N ' - m e t h y l e n e b i s - a c r y l a m i d e . O t h e r e n t r a p p i n g m a t e r i a l s
i n c l u d e s i l i c a g e l , s t a r c h , a n d s i l a s t i c r e s i n
( s i l i c o n e r u b b e r ) . T h e l a t t e r c o n j u g a t e i s p r e p a r e d b y s u s p e n d i n g s i l a s t i c r e s i n in w a t e r c o n t a i n i n g e n z y m e a n d a d d i n g c a t a l y t i c a m o u n t s o f s t a n n o u s o c t o a t e t o
i n d u c e g e l f o r m a t i o n . L o c a l i z e d h e a t i n g
d u r i n g g e l f o r m a t i o n h a s b e e n r e p o r t e d t o c a u s e u p t o 8 0 % l o s s i n e n z y m e a c t i v i t y
( G u i l b a u l t a n d D a s , 1 9 7 0 ) . S t r a n d b e r g a n d S m i l e y ( 1 9 7 1 ) r e p o r t e d o n e n t r a p m e n t o f g l u c o s e i s o m e r a s e i n p o l y a c r y l a m i d e . A b o u t 5 0 % o f t h e e n z y m e a d d e d w a s r e t a i n e d i n t h e m a t r i x a n d a b o u t 3 0 % o f t h i s e n t r a p p e d e n z y m e e x h i b i t e d a c t i v i t y .
A n a d d i t i o n a l n o v e l e n t r a p m e n t d e v i c e w a s e m p l o y e d b y W i t t e t a l . ( 1 9 7 0 ) f o r f i x i n g p a p a i n . I n t h i s s y s t e m p a p a i n i n c r u d e l a t e x f o r m w a s t r e a t e d w i t h g lu t a r -
a l d e h y d e t o f o r m a c r o s s l i n k e d g e l w h i c h w a s t h e n u s e d a s s u c h i n s t u d i e s o f h a z e c o n t r o l i n b e e r .
I n a d d i t i o n t o e n z y m e s , m i c r o o r g a n i s m s o r i n t a c t c e l l s h a v e b e e n i m m o b i l i z e d b y e n t r a p m e n t ( M o s b a c h a n d M o s b a c h ,1 9 6 6 ) . F u n g a l c e l l s w e r e t h u s u s e d i n
p r e p a r i n g c o r t i s o l .
C o v a l e n t b o n d i n g
I m m o b i l i z a t i o n o f e n z y m e s b y c o v a l e n t b o n d i n g i s p a r t i c u l a r l y a t t r a c t i v e b e c a u s e t h e r e i s l e s s t e n d e n c y f o r e n z y m e t o b e l o s t . B o n d i n g i s n o t n e c e s s a r i l y
p e r m a n e n t , h o w e v e r , a s d i a z o a n d s u l f u r -
s u l f u r l i n k a g e s h a v e b e e n r e p o r t e d t o b e u n s t a b l e u n d e r c e r t a i n c o n d i t i o n s . L a r g e
s u b s t r a t e a l s o m a y c a u s e l o s s e s s u c h a s r e p o r t e d b y E p t o n e t a l . ( 1 9 7 1 ) f o r t r y p s i n a n d p a p a i n i m m o b i l i z e d w i t h c r o s s l i n k e d p o l y a c r y l o y l a m i n o a c e t a l d e -
h y d e d i m e t h y l a c e t a l , a p o l y a l d e h y d e .
- C H 2 - C H 2 - C H ------CH
, c -
1
'o
+ ENZ. + H2 N - ( C H 2) 6 - N H 2
- C H 2 - C H 2 - C H ------CH - C H 2 - C H 2- C H - C H -I
N H v OI
EN ZYM E l i
c=o 0=0I I1*0O H N H OH
I(C H 2 )6
NH .o j ? H ¿=o
I Ie t c . - c h 2- c h 2 - c h - c h -
C R O S S — l i n k e d p o l y m e r
Fig. 1—M aleic a n h y d r id e -e th y le n e c o p o ly m e r r e a c tio n w ith e n z y m e u sin g h e x a m e th y le n e d ia m in e as c r o ss lin k in g agen t.
Fig. 2 —A c t iv a t io n o f a ro m a tic a m in o group .
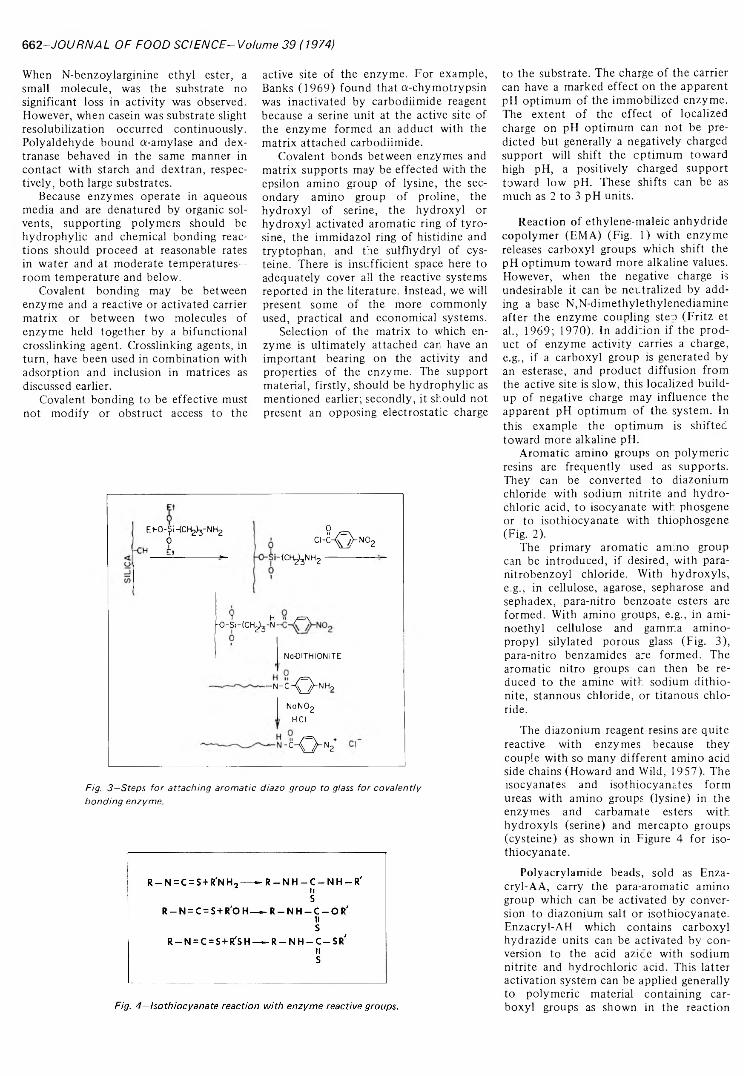
6Q2—JO U R N A L O F FO O D S C IE N C E -V o lu m e 39 (1974)
W h e n N - b e n z o y l a r g i n i n e e t h y l e s t e r , a s m a l l m o l e c u l e , w a s t h e s u b s t r a t e n o
s i g n i f i c a n t l o s s i n a c t i v i t y w a s o b s e r v e d . H o w e v e r , w h e n c a s e i n w a s s u b s t r a t e s l i g h t r e s o l u b i l i z a t i o n o c c u r r e d c o n t i n u o u s l y . P o l y a l d e h y d e b o u n d a - a m y l a s e a n d d e x -
t r a n a s e b e h a v e d i n t h e s a m e m a n n e r in c o n t a c t w i t h s t a r c h a n d d e x t r a n , r e s p e c t i v e l y , b o t h la r g e s u b s t r a t e s .
B e c a u s e e n z y m e s o p e r a t e in a q u e o u s m e d i a a n d a r e d e n a t u r e d b y o r g a n i c s o l v e n t s , s u p p o r t i n g p o l y m e r s s h o u l d b e
h y d r o p h y l i c a n d c h e m i c a l b o n d i n g r e a c t i o n s s h o u l d p r o c e e d a t r e a s o n a b l e r a t e s i n w a t e r a n d a t m o d e r a t e t e m p e r a t u r e s —
r o o m t e m p e r a t u r e a n d b e l o w .C o v a l e n t b o n d i n g m a y b e b e t w e e n
e n z y m e a n d a r e a c t i v e o r a c t i v a t e d c a r r ie r m a t r i x o r b e t w e e n t w o m o l e c u l e s o f
e n z y m e h e l d t o g e t h e r b y a b i f u n c t i o n a l
c r o s s l i n k i n g a g e n t . C r o s s l i n k i n g a g e n t s , in t u r n , h a v e b e e n u s e d in c o m b i n a t i o n w i t h a d s o r p t i o n a n d i n c l u s i o n i n m a t r i c e s a s
d i s c u s s e d e a r l ie r .C o v a l e n t b o n d i n g t o b e e f f e c t i v e m u s t
n o t m o d i f y o r o b s t r u c t a c c e s s t o t h e
a c t i v e s i t e o f t h e e n z y m e . F o r e x a m p l e ,
B a n k s ( 1 9 6 9 ) f o u n d t h a t a - c h y m o t r y p s i n
w a s i n a c t i v a t e d b y c a r b o d i i m i d e r e a g e n t
b e c a u s e a s e r i n e u n i t a t t h e a c t i v e s i t e o f
t h e e n z y m e f o r m e d a n a d d u c t w i t h t h e m a t r i x a t t a c h e d c a r b o d i i m i d e .
C o v a l e n t b o n d s b e t w e e n e n z y m e s a n d m a t r i x s u p p o r t s m a y b e e f f e c t e d w i t h t h e
e p s i l o n a m i n o g r o u p o f l y s i n e , t h e s e c o n d a r y a m i n o g r o u p o f p r o l i n e , t h e h y d r o x y l o f s e r i n e , t h e h y d r o x y l o r h y d r o x y l a c t i v a t e d a r o m a t i c r in g o f t y r o s i n e , t h e i m m i d a z o l r in g o f h i s t i d i n e a n d t r y p t o p h a n , a n d t h e s u l f h y d r y l o f c y s t e i n e . T h e r e i s i n s u f f i c i e n t s p a c e h e r e t o a d e q u a t e l y c o v e r a l l t h e r e a c t i v e s y s t e m s r e p o r t e d i n t h e l i t e r a t u r e . I n s t e a d , w e w i l l p r e s e n t s o m e o f t h e m o r e c o m m o n l y
u s e d , p r a c t i c a l a n d e c o n o m i c a l s y s t e m s .S e l e c t i o n o f t h e m a t r i x t o w h i c h e n
z y m e i s u l t i m a t e l y a t t a c h e d c a n h a v e a n
i m p o r t a n t b e a r i n g o n t h e a c t i v i t y a n d p r o p e r t i e s o f t h e e n z y m e . T h e s u p p o r t m a t e r i a l , f i r s t l y , s h o u l d b e h y d r o p h y l i c a s
m e n t i o n e d e a r l ie r ; s e c o n d l y , i t s h o u l d n o t
p r e s e n t a n o p p o s i n g e l e c t r o s t a t i c c h a r g e
t o t h e s u b s t r a t e . T h e c h a r g e o f t h e c a r r ie r c a n h a v e a m a r k e d e f f e c t o n t h e a p p a r e n t
p H o p t i m u m o f t h e i m m o b i l i z e d e n z y m e .
T h e e x t e n t o f t h e e f f e c t o f l o c a l i z e d
c h a r g e o n p H o p t i m u m c a n n o t b e p r e d i c t e d b u t g e n e r a l l y a n e g a t i v e l y c h a r g e d
s u p p o r t w i l l s h i f t t h e o p t i m u m t o w a r d h i g h p H , a p o s i t i v e l y c h a r g e d s u p p o r t
t o w a r d l o w p H . T h e s e s h i f t s c a n b e a s
m u c h a s 2 t o 3 p H u n i t s .
R e a c t i o n o f e t h y l e n e - m a l e i c a n h y d r i d e
c o p o l y m e r ( E M A ) ( F i g . 1 ) w i t h e n z y m e
r e l e a s e s c a r b o x y l g r o u p s w h i c h s h i f t t h e
p H o p t i m u m t o w a r d m o r e a l k a l i n e v a l u e s . H o w e v e r , w h e n t h e n e g a t i v e c h a r g e is
u n d e s i r a b l e i t c a n b e n e u t r a l i z e d b y a d d i n g a b a s e N , N - d i m e t h y l e t h y l e n e d i a m i n e
a f t e r t h e e n z y m e c o u p l i n g s t e p ( F r i t z e t
a l . , 1 9 6 9 ; 1 9 7 0 ) . I n a d d i t i o n i f t h e p r o d u c t o f e n z y m e a c t i v i t y c a r r i e s a c h a r g e , e .g . , i f a c a r b o x y l g r o u p i s g e n e r a t e d b y a n e s t e r a s e , a n d p r o d u c t d i f f u s i o n f r o m t h e a c t i v e s i t e i s s l o w , t h i s l o c a l i z e d b u i l d u p o f n e g a t i v e c h a r g e m a y i n f l u e n c e t h e a p p a r e n t p H o p t i m u m o f t h e s y s t e m . I n
t h i s e x a m p l e t h e o p t i m u m i s s h i f t e d
t o w a r d m o r e a l k a l i n e p H .A r o m a t i c a m i n o g r o u p s o n p o l y m e r i c
r e s in s a r e f r e q u e n t l y u s e d a s s u p p o r t s . T h e y c a n b e c o n v e r t e d t o d i a z o n i u m c h l o r i d e w i t h s o d i u m n i t r i t e a n d h y d r o c h l o r i c a c i d , t o i s o c y a n a t e w i t h p h o s g e n e o r t o i s o t h i o c y a n a t e w i t h t h i o p h o s g e n e
( F i g . 2 ) .T h e p r i m a r y a r o m a t i c a m i n o g r o u p
c a n b e i n t r o d u c e d , i f d e s i r e d , w i t h p a r a - n i t r o b e n z o y l c h l o r i d e . W i t h h y d r o x y l s , e . g . , i n c e l l u l o s e , a g a r o s e , s e p h a r o s e a n d
s e p h a d e x , p a r a - n i t r o b e n z o a t e e s t e r s a r e f o r m e d . W i t h a m i n o g r o u p s , e . g . , i n a m i - n o e t h y l c e l l u l o s e a n d g a m m a a m i n o - p r o p y l s i l y l a t e d p o r o u s g la s s ( F i g . 3 ) ,
p a r a - n i t r o b e n z a m i d e s a r e f o r m e d . T h e a r o m a t i c n i t r o g r o u p s c a n t h e n b e r e d u c e d t o t h e a m i n e w i t h s o d i u m d i t h i o -
n i t e , s t a n n o u s c h l o r i d e , o r t i t a n o u s c h l o r id e .
T h e d i a z o n i u m r e a g e n t r e s i n s a r e q u i t e
r e a c t i v e w i t h e n z y m e s b e c a u s e t h e y
c o u p l e w i t h s o m a n y d i f f e r e n t a m i n o a c i d s i d e c h a i n s ( H o w a r d a n d W i ld , 1 9 5 7 ) . T h e i s o c y a n a t e s a n d i s o t h i o c y a n a t e s f o r m
u r e a s w i t h a m i n o g r o u p s ( l y s i n e ) i n t h e e n z y m e s a n d c a r b a m a t e e s t e r s w i t h h y d r o x y l s ( s e r i n e ) a n d m e r c a p t o g r o u p s
( c y s t e i n e ) a s s h o w n i n F i g u r e 4 f o r i s o t h i o c y a n a t e .
P o l y a c r y l a m i d e b e a d s , s o l d a s E n z a -
c r y l - A A , c a r r y t h e p a r a - a r o m a t i c a m i n o g r o u p w h i c h c a n b e a c t i v a t e d b y c o n v e r s i o n t o d i a z o n i u m s a l t o r i s o t h i o c y a n a t e . E n z a c r y l - A H w h i c h c o n t a i n s c a r b o x y l h y d r a z i d e u n i t s c a n b e a c t i v a t e d b y c o n v e r s i o n t o t h e a c i d a z i c e w i t h s o d i u m n i t r i t e a n d h y d r o c h l o r i c a c i d . T h i s l a t t e r
a c t i v a t i o n s y s t e m c a n b e a p p l i e d g e n e r a l l y t o p o l y m e r i c m a t e r i a l c o n t a i n i n g c a r b o x y l g r o u p s a s s h o w n in t h e r e a c t i o n
Et-o-^Hcryj-NHgo
'H _ £ t ____________ __
0Ct-C-K > NC2
-<Chy3NH2 -
T H » / = \-O -SH C H ^ -N
Na-DITHIONITE
- n- c - Q h NHp
NaN02HCI
^ " 0 " N2+
Fig. 3 —S te p s fo r a t ta c h in g a r o m a tic d ia zo g ro u p to g lass fo r c o v a le n t ly b o n d in g e n z y m e .

C H E M IS T R Y O F IM M O B IL IZ IN G E N Z Y M E S - 663s e q u e n c e i n F i g u r e 5 . T h e s t a r t i n g m a t e r ia l i n t h i s e x a m p l e , c a r b o x y m e t h y l c e l l u l o s e ( C M C ) , i s c o n v e r t e d t o t h e m e t h y l
e s t e r w i t h m e t h a n o l a n d h y d r o c h l o r i c a c i d a n d t h e n t o t h e h y d r a z i d e b y e s t e r
e x c h a n g e . C M C a c i d h y d r a z i d e i s c o m m e r c i a l l y a v a i l a b l e . A s w i t h E n z a c r y l , a b o v e , t h e h y d r a z i d e i s t h e n c o n v e r t e d t o
a c i d a z i d e w i t h s o d i u m n i t r i t e a n d h y d r o c h l o r i c a c i d p r i o r t o c o u p l i n g w i t h e n z y m e ( M i t z a n d S u m m a r i a , 1 9 6 1 ) .
Carbodiimide reagent. A n o t h e r c o u
p l i n g r e a g e n t f o r c a r b o x y l i c a c i d c o n t a i n i n g s u p p o r t s i s t h e c a r b o d i i m i d e ( M e r r i f i e l d r e a g e n t ) d e v e l o p e d o r i g i n a l l y
f o r p r o t e i n s y n t h e s i s s h o w n i n F i g u r e 6 . T h e R a n d R g r o u p s a r e v a r i e d t o p r o v i d e
b e t t e r w a t e r s o l u b i l i t y a s , f o r e x a m p l e ,
t h e 2 - m o r p h o l i n o e t h y l g r o u p ( M o s b a c h
a n d M a t t i a s s o n , 1 9 7 0 ) .
Cyanogen bromide h a s b e e n u s e d e x
t e n s i v e l y ( A x e n e t a l . , 1 9 6 7 ) f o r a c t i v a t i n g c a r b o h y d r a t e p o l y m e r s . T h e m e t h o d i s s i m p l e a n d m i l d . T h e p o s t u l a t e d r e a c t i o n m e c h a n i s m ( F i g . 7 ) i n v o l v e s t h e f o r m a t i o n o f a n e s t e r o f h y d r o c y a n i c a c id w h i c h t h e n f o r m s a c y c l i c i m i d o c a r b o n a t e w i t h a n a d j a c e n t h y d r o x y l g r o u p . T h i s
t h e n c o u p l e s w i t h l y s i n e e p s i l o n a m i n o
g r o u p s o f t h e e n z y m e t o g i v e t h r e e p o s s i b l e b o n d i n g l i n k a g e s . A s t h e s e a r e a m i d e
l i n k a g e s t h e y a r e s o m e w h a t l a b i l e .Ethylene-maleic anhydride. A c o
p o l y m e r t h a t h a s b e e n w i d e l y u s e d is
e t h y l e n e - m a l e i c a n h y d r i d e , f i r s t r e p o r t e d
b y L e v i n e t a l . ( 1 9 6 4 ) a n d u s e d t o d e m o n s t r a t e t h e e f f e c t s o f l o c a l i z e d c h a r g e o n
p H o p t i m a m e n t i o n e d e a r l i e r ( F i g . 2 ) . A d d i t i o n a l s t r e n g t h i s g i v e n t o t h e p o l y m e r b y t r e a t m e n t w i t h h e x a m e t h y l e n e
d i a m i n e t o c r o s s l i n k t h e p o l y m e r t h r o u g h
t h e c a r b o x y l g r o u p s .
Crosslinking agentsA t a b u l a t i o n o f c r o s s l i n k i n g a g e n t s
a p p e a r s i n F i g u r e 8 . C r o s s l i n k i n g b y i t s e l f
w i l l p r o b a b l y f i n d l i t t l e p r a c t i c a l a p p l i c a t i o n i n f o o d p r o c e s s i n g b e c a u s e t o o m u c h
e n z y m e i s c o n s u m e d , s t a b i l i t y i s p o o r , a n d t h e i n s o l u b l e p r e c i p i t a t e s a r e t o o f i n e
t o b e m e c h a n i c a l l y p r a c t i c a l . T h e c o n d i t i o n s f o r p r e p a r a t i o n m u s t b e c a r e f u l l y
c o n t r o l l e d a n d o n l y a l i m i t e d n u m b e r o f e n z y m e s h a v e g i v e n i n s o l u b l e p r o d u c t s . I n
c o n t r a s t , c o m b i n a t i o n s o f c r o s s l i n k i n g w i t h a d s o r p t i o n h a v e b e e n w i d e l y p r a c t i c e d . B e c a u s e o f t h e w i d e s e l e c t i o n o f
s u p p o r t m a t e r i a l s a v a i l a b l e , t h e i r p h y s i c a l s t r e n g t h , a s s o r t m e n t s o f g r a n u la r s i z e , c h e a p n e s s , a n d e a s e i n p r e p a r a t i o n t h e s e
Fig. 5 —Conversion o f carboxym ethyl cellulose to acid azide and reac- Fig. 7—Cyanogen bromide activation o f carbohydrate polym ers and tion with enzym e amino group. reaction with enzyme.
O HR - C + H © + » -
IIN
R - C - O - Ciio 11 © N H ®
NHi
P R O T E IN -N H 2 + R - C - O - C
N Hk"
PR O TE IN —N H — C — R
RN Hi
o=cNHIR"
11 (°!+ H ©
Fig. 6—Carbodiimide reaction for coupling enzym e with carboxylic Fig. 8 —Crosslinking agents,acid.

664-J O U R N A L OF FO O D S C IE N C E -V o lu m e 3 9 (1974)
s y s t e m s a r e w e l l a d a p t e d f o r t h e s c a l e o f
o p e r a t i o n r e q u i r e d in f o o d a p p l i c a t i o n s .
A r e p r e s e n t a t i v e l i s t o f c o m b i n a t i o n s o f a d s o r p t i o n a n d c r o s s l i n k i n g a p p e a r s in
T a b l e 3 s h o w i n g t h e w i d e r a n g e o f m a t e r ia ls t h a t h a v e b e e n u s e d . T h e m o s t f r e q u e n t l y u s e d b i - f u n c t i o n a l r e a g e n t i s
g l u t a r a l d e h y d e b e c a u s e i t i s c o m m e r c i a l l y a v a i l a b l e , r e l a t i v e l y c h e a p a n d e a s y t o u s e .
B e c a u s e o f i t s w a t e r s o l u b i l i t y , i t i s e a s i l y w a s h e d o u t a f t e r r e a c t i o n i s c o m p l e t e .
O n e a p p l i c a t i o n , c o l l a g e n m e m b r a n e a d s o r p t i o n f o l l o w e d b y t r e a t m e n t w i t h g l u t a r a l d e h y d e , ( W a n g a n d V i e t h , 1 9 7 3 )
o r d i a z o b e n z i d i n e r e a g e n t s ( G o l d m a n e t a l . , 1 9 6 8 ) m a y i n v o l v e e n t r a p m e n t t o s o m e d e g r e e . T h e c r o s s l i n k e d e n z y m e w i t h i n t h e p o r o u s g e l s t r u c t u r e i s t o o
la r g e t o d i f f u s e o u t a n d t h u s b e c o m e s t r a p p e d . G l u t a r a l d e h y d e c r o s s l i n k i n g o f
c o l l a g e n i t s e l f m a y r e s t r i c t t h e m o b i l i t y a n d r e s u l t i n e n t r a p m e n t o f e n z y m e . M e m b r a n e c o n f i g u r a t i o n s , h o w e v e r , m a y b e h a r d t o d e v e l o p t o m a t c h t h e s i m p l i c i t y a n d e c o n o m y o f a p a c k e d c o l u m n o r s t i r r e d r e a c t o r .
A n o t h e r v a r i a t i o n i s t h e u s e o f a c r o s s - l i n k i n g a g e n t t o a c t i v a t e a p o l y m e r s u p p o r t . T h i s h a s b e e n u s e d v e r y e f f e c t i v e l y
b y W e e t a l l ( 1 9 7 3 ) w i t h a b o u t 5 0 m e s h p o r o u s g la s s o r z i r c o n i u m c e r a m i c b e a d s
( F i g . 9 ) . T h e s i l i c e o u s s u r f a c e i s a l l o w e d
t o r e a c t w i t h t r i e t h o x y - g a m m a - a m i n o - p r o p y l s i l a n e . T h e r e s u l t i n g m i n e r a l s u p p o r t w i t h a p r i m a r y a m i n o g r o u p a t t a c h e d i s t r e a t e d w i t h g l u t a r a l d e h y d e a n d t h e n e x p o s e d t o e n z y m e i n b u f f e r . T h e g l u t a r a l d e h y d e i n t h i s p r o c e d u r e s e r v e s a s
a c o u p l i n g b e t w e e n s u p p o r t a n d e n z y m e . S i m i l a r l y s y m m e t r i c a l c h l o r o t r i a z i n e ( c y a - n u r i c c h l o r i d e ) a n d d e r i v a t i v e s h a v e b e e n
u s e d t o c o u p l e e n z y m e s t o c e l l u l o s e ( K a y
a n d C r o o k , 1 9 6 7 ) ( F i g . 1 0 ) .C o l l o i d a l s i l i c a h a s b e e n u s e d a s a n
a d s o r b e n t ( H a y n e s a n d W a ls h , 1 9 6 9 ) f o r
Table 3 —A dsorp tio n and crosslinking systems
A lum in a and glutaraldehyde
Cheesecloth and g lutara ldehyde D E A E cellulose and g lutara ldehyde C oncentrated pro te in and glutara ldehyde
C ollod ion m em brane and g lutara ldehyde C ollo idal silica and glutara ldehyde F ilte r paper and d iazobenzid ine C ollod ion and d iazobenzid ines
W hole crystals and d iazobenzid ine
Pheno l-form aldehyde resins and glutaraldehyde
T ab le 4 —R ete n tio n o f activ ity o f im m o b ilized lactase (G-galactosidase) w ith o u t and w ith
glutara ldehyde tre a tm e n t4
R elative activities
A fte r 10A fte r w a te r liters
System wash 6% lactose
E nzym e + resin 1 .0 0 0 .9 0E nzym e + resin
+ glutaraldehyde 1 .20 1 .2 0
a Same initial amounts of j3-galactosicase; jacketed columns; 1.2 X 9 cm column; 7g wet weight resin; 45°C; pH 4.0, 0.01M NaOAc; 60 ml/hr
s u p p o r t i n g g l u t a r a l d e h y d e c r o s s l i n k e d
l y s o z y m e , t r y p s i n a n d a - c h y m o t r y p s i n , T h e f i n e n e s s o f t h i s s u p p o r t , h o w e v e r ,
w o u l d m a k e r e m o v a l o f c a t a l y s t d i f f i c u l t in b a t c h o p e r a t i o n s a n d c a u s e u n m a n a g e a b l e p r e s s u r e d r o p s i n c o l u m n s .
P r e v e n t i n g e n z y m e l e a k a g e
I n t r y i n g t o p r e v e n t l e a k a g e o f e n z y m e f r o m t a n n i c a c i d - e n z y m e c o m p l e x e s ( N e g o r o , 1 9 7 0 ) w e f o u n d t h a t g l u t a r a l d e h y d e w a s v e r y e f f e c t i v e b u t t h e p r o d u c t
h a d t h e c o n s i s t e n c y o f f i n e c l a y . E v e n w i t h f i l t e r a i d s , p r e s s u r e d r o p s w e r e h i g h . W e h a v e n o w f o u n d t h a t p h e n o l - f o r m a l d e h y d e p o l y m e r , s o l d a s D u o l i t e S - 3 0 b y D i a m o n d S h a m r o c k C o m p a n y , h a s a f f i n i t y f o r p r o t e i n s i m i l a r t o t a n n i c a c i d . T h e r e s in h a s b e e n r e p o r t e d t o b e a g o o d
m a t e r i a l f o r r e m o v i n g c o l o r e d c o m p o n e n t s f r o m s u g a r s o l u t i o n s a n d h a s c l e a r a n c e a s a f i l t e r a id f o r u s e i n c o n t a c t w i t h f o o d s . I t h a s a w a t e r - h o l d i n g c a p a c i t y o f
a b o u t 6 0 % a n d h a s g o o d s t r u c t u r a l s t a b i l i t y . T h e r e s i n m a y b e u s e d d i r e c t l y o r w i t h g l u t a r a l d e h y d e ( F i g . 1 1 ; O l s o n a n d S t a n l e y , 1 9 7 3 ) . W i t h a c i d t o l e r a n t l a c t a s e f r o m A s p e r g i l l i s n i g e r a t p H 4 . 0 t h e r e w a s
n o m e a s u r e a b l e l o s s i n a c t i v i t y a f t e r
e x p o s u r e t o 1 0 l i t e r s o f 6 % l a c t o s e s o l u t i o n t h r o u g h a c o l u m n c o n t a i n i n g 7 g o f
t h e m o i s t r e s i n - e n z y m e c a t a l y s t T a b l e 4 .
W i t h o u t g l u t a r a l d e h y d e t r e a t m e n t t h e r e w a s a 1 0 % l o s s u n d e r t h e s a m e c o n d i t i o n s . I n c o n t i n u o u s c o l u m n o p e r a t i o n w i t h a 3 —4 % l a c t o s e s o l u t i o n d u r i n g 4 w k
a t 7 0 — 8 0 % c o n v e r s i o n t h e e n z y m e o n r e s in a l o n e l o s t 2 0 % a c t i v i t y w h e r e a s
c o m b i n e d a d s o r p t i o n a n d g l u t a r a l d e h y d e t r e a t m e n t i n t h e s a m e t i m e g a v e i n s i g n i f i c a n t l o s s i n a c t i v i t y . T h i s c o m b i n a t i o n h a s
Fig- 9 —Attachment o f aldehyde group to glass and ceramics and reac- Fig. 10—Coupling enzyme to carbohydrate support with symmetricaI tion with enzyme amino group. chlorotriazine.

C H E M IS T R Y O F IM M O B IL IZ IN G E N ZY M E S -G G 5
functioned well with acid wheys and deproteinated acid whey “permeate,” and is currently under study on a semicommercial scale by the Foremost Dairy Company.Effect of pH
The effect of pH on the activity of immobilized lactase is shown in Table 5. As with the soluble enzyme, it is most active in the range pH 4 —5. In Figure 12 a flow diagram for column operation is given. Feed is pretreated to pH 4 —5, deaerated and brought to the desired temperature and passed through the column of resin at suitable flow rates. Hydrolysis rate is inversely proportional to substrate concentration (Fig. 13), inversely proportional to flow rate and directly proportional to temperature, Figure 14.
At pH 6.5 activity was about 20% of that observed at pH 4. With nonfat milk at pH 6.5 10% loss in activity was observed, however, in 17 hours probably because of blocking of the active sites.
We have no data on microbial control in processing nonfat milk through our system. We did not carry studies with acid whey beyond about 4—6 wk. Our procedure for sanitation was to rinse columns frequently with water or dilute hydrogen peroxide, particularly before
Table 5 —E ffe c t o f pH on im m o b ilize d lactase activ ity
pH A c tiv ity 3
3 .0 1744 .0 2 0 05 .0 1726 .0 9 87 .0 5 27.9 13
a Moles of glucose produced/min/g of drained immobilized lactase
shutting them down. When columns were not being used they were stored in the cold. Generally this was sufficient to keep microbiological contamination under control. The phenol-formaldehyde resin itself and glutaraldehyde are both unfavorable substrates for microorganisms.
We have also bound invertase, gluco- amylase, glucose oxidase, a tyrosine hydroxylase, a-chymotrypsin, pepsin, pronase and rennin on phenol-formaldehyde resin with glutaraldehyde with retention of enzyme activity. Adsorbed urease retained activity but treatment with glutaraldehyde made the enzyme inactive. A specially prepared ready-to- use, acid and base washed phenol-formaldehyde resin prescreened to about 50 mesh is commercially available now under the trade name Duolite Enzyme Support Resin.
In a study of modifications in phenolic polymer structure, formylation of the phenolic resin with dimethyl formamide
+ LACTASE
JnI
RESIN-ENZYME COMPLEX
GLUTARALDEHYDE
PERMANENTLY FIXED LACTASE
IMMOBILIZED ENZYME SYSTEM
FEED' PRETREATMENTIMMOBILIZED ENZYME
COLUMN OR STIRRED TANK REACTOR PRODUCT
TEMPERATURE AND pH ADJUSTMENT
DEAERATION FLOW CONTROL
MONITORING DEVICE
Fig. 11— Phenol-formaldehyde resin-glutaraldehyde system for immobil- Fig. 12—F lo w diagram for column operation o f lactase enzym e im- izing enzyme. mobilized on phenol-form aldehyde resin with glutaraldehyde.
Fig. 13—Effect o f substrate concentration on hydrolysis o f lactose In column operation by lactase im mobilized on phenol-form aldehyde resin with glutaraldehyde.
Fig. 14—E ffe ct o f temperature and flow rate on hydrolysis o f lactose in column operation by lactase enzym e im mobilized on phenol-formaldehyde resin with glutaraldehyde.

6 6 6 -J O U R N A L O F FO O D S C IE N C E - Volum e 3 9 (1974)
a n d p h o s p h o r u s o x y c h l o r i d e s h o w e d i m p r o v e m e n t in e n z y m e r e t e n t i o n f o r l a c t a s e ( S t a n l e y a n d P a l t e r , 1 9 7 3 ) .
A p p l i c a t i o n s o f i m m o b i l i z a t i o n
T w o o t h e r a p p l i c a t i o n s o f i m m o b i l i z a t i o n w i l l b e o f i m p o r t a n c e t o f o o d t e c h n o l o g i s t s . P r o b a b l y o f m o s t i m m e d i a t e u t i l i t y i s t h e u s e o f i m m o b i l i z e d e n z y m e s in a n a l y t i c a l a p p l i c a t i o n s , e i t h e r in c o n t i n u o u s m o n i t o r i n g o r s i n g l e t e s t s . T h e e n z y m e c a n b e h i g h l y s p e c i f i c . F o r e x a m p l e , g l u c o s e i n t h e p r e s e n c e o f o t h e r
s u g a r s c a n b e a n a l y z e d w i t h g l u c o s e
o x i d a s e . F i x e d e n z y m e o n p a p e r s t r i p s f o r
q u a l i t a t i v e t e s t s f o r g l u c o s e a r e c o m m e r c i a l l y a v a i l a b l e . A b l u e c o l o r i n d i c a t e s t h e
p r e s e n c e o f g l u c o s e . A l i s t i n g o f s p e c i f i c
c o m p o u n d s f o u n d i n f o o d s t h a t c o u l d b e a s s a y e d w i t h i m m o b i l i z e d e n z y m e s a p p e a r s i n T a b l e 6 . E n z y m e s y s t e m s h a v e b e e n e n t r a p p e d i n m e m b r a n e s o n e l e c t r o d e s a n d s h o w p r o m i s e i n s o m e a n a l y t i c a l a p p l i c a t i o n s ( G o u g h a n d A n d r a d e ,1 9 7 3 ) . I t s h o u l d b e n o t e d t h a t e n z y m e e l e c t r o d e s m e a s u r e a c t i v i t y a n d n o t c o n c e n t r a t i o n , h o w e v e r . T h e d e v e l o p i n g
d e m a n d s f o r c o m p o s i t i o n l a b e l i n g o f
f o o d s w i l l s t i m u l a t e i n v e s t i g a t i o n s o n t h e u s e o f e n z y m e s i n s o l u t i o n a n d i n i m m o b i l i z e d f o r m . T h e m o s t n e e d e d a r e a f o r s p e c i f i c m e t h o d s is i n v i t a m i n a s s a y .
F i n a l l y , i m m o b i l i z i n g t e c h n i q u e s a r e b e i n g u s e d i n r e c o v e r i n g a n d p u r i f y i n g
e n z y m e s t h e m s e l v e s b y a f f i n i t y c h r o m a t o g r a p h y ( C u a t r e c a s a s a n d A n f i n s e n ,1 9 7 1 ) . A d s o r p t i o n a l o n e f o l l o w e d b y d e s o r p t i o n w i t h s u b s t r a t e o r s p e c i f i c
e n z y m e i n h i b i t o r s c a n r e s u l t i n c o n c e n t r a t i o n a n d p u r i f i c a t i o n o f t h e e n z y m e . T h e
i n h i b i t o r o r s u b s t r a t e c a n a l s o b e f i x e d t o a s t a t i o n a r y p h a s e a n d u s e d a s a s p e c i f i c a d s o r b e n t f o r a n e n z y m e f o l l o w e d b y d e s o r p t i o n . B e c a u s e o f s e l e c t i v i t y f o r p r o t e i n , p h e n o l - f o r m a l d e h y d e p o l y m e r s a n d t a n n i c a c i d c o n c e n t r a t e e n z y m e .
A f i n a l c o n s i d e r a t i o n i n t h e u s e o f
i m m o b i l i z e d e n z y m e s i s s a n i t a t i o n . B y b e i n g a b l e t o o p e r a t e a t h i g h e r t e m p e r a t u r e s w i t h f i x e d e n z y m e s s o m e p r o t e c t i o n i s p r o v i d e d . C o l u m n s h a v e b e e n o p e r a t e d s u c c e s s f u l l y w i t h s o m e e n z y m e s a t
5 0 —6 0 ° C . C o l u m n s c a r . b e f l o o d e d w h e n n e e d e d w i t h s o l u t i o n s o f h y d r o g e n p e r o x i d e , g l u t a r a l d e h y d e , o r o t h e r b a c t e r i o - c i d e s . ( C a r e s h o u l d b e t a k e n t o t e s t b a c - t e r i o c i d e s b e f o r e u s i n g t h e m b e c a u s e s o m e b a c t e r i o c i d e s h a v e b e e n k n o w n t o i n a c t i v a t e e n z y m e s . ) T h e c o l u m n i s t h e n t h o r o u g h l y w a s h e d t o r e m o v e r e a g e n t b e f o r e i t i s a g a in p u t t o u s e . P h e n o l - f o r m a l d e h y d e r e s i n i t s e l f h a s b e e n r e p o r t e d t o e x h i b i t b a c t e r i o s t a t i c a c t i v i t y ( B u r n e t t , 1 9 7 3 ) .
F o r d e t a i l e d i n f o r m a t i o n a n d r e f e r -
Table 6 —Specific com ponents in foods th a t
could be analyzed w ith im m o b ilize d enzym es
LactoseGlucoseSuc -oseA m in o acidsLipidsPhenolPesticidesV itam insCo-enzym esTrace metals
e n c e s o n i m m o b i l i z e d e n z y m e s t h e f o l l o w i n g r e v i e w a r t i c l e s a r e r e c o m m e n d e d : S i l m a n a n d K a t c h a l s k i ( 1 9 6 6 ) , G o l d s t e i n( 1 9 6 9 ) , G u i l b a u l t ( 1 9 7 0 ) , M o s b a c h( 1 9 7 1 ) , B r o w n a n d H a s s e l b e r g e r ( 1 9 7 1 ) ,
M e l r o s e ( 1 9 7 1 ) , W e e t a l l ( 1 9 7 3 ) , Z a b o r s k y( 1 9 7 3 ) .
REFERENCESA xen, R ., Porath, J. and Ernback, S. 1967 .
Chemical coupling of peptides and proteins to polysaccharides by means of cyanogen halides. Nature 214: 1302.
Banks, T.E. 1969. Inactivation of a-chym o- trypsin by a water-soluble carbodiimide. J. Biol. Chem. 244: 6323.
Brown, H.D. and Hasselberger, F.X. 1971. “ Chemistry o f the Cell Interface,” Part B, Ed. Brown, H.D. Academ ic Press, New York.
Burnett, F. 1973. Personal com m unication. Diamond Shamrock Corp., Palo A lto , Calif.
Cuatrecasas, P. and Anfinsen, C.B. 1971 . Affinity chrom atography. M ethods E nzym ol. 22: 345.
Epton, R ., McLaren, J.V . and Thom as, T.H. 1971. E n z y m e insolubilization with cross- linked poly aery loylam inoacetaldehyde di- m ethylacetal. Biochem . J. 123: 21p.
Fritz, H., Gebhardt, M., Fink, E ., Schramm, W. and Werle, E. 1969 . The use o f water-insoluble enzym es on resins w ith polyanionic and polyam photeric resin matrices for the isolation o f protease inhibitors. H oppe-Seyler’s Z. Physiol. Chem. 348: 950.
Fritz, H., Gebhardt, M., Meister, R. and Schult,H. 197 0 . Preparation o f m odified protease inhibitors using water-insoluble trypsin resins. H oppe-Seyler’s Z. Physiol. Chem. 351: 1119.
Goldman, R ., Kedem, O., Silman, I.H ., Caplan,S.R . and Katchalski, E. 1968 . Papain-collodion membranes. 1. Preparation and properties. Biochem istry 7: 486 .
G oldstein, L. 1969 , Use o f water-insoluble enzym e derivatives in synthesis and separation. In “ Ferment. Advan., Pap. Int. Ferm ent. Sym p., 3rd,” Ed. Perlman, D. Academ ic Press, New York.
Gough, D.A . and Andrade, J.D. 1973. Enzym e electrodes. Science 180: 380.
Grubhofer, N. and Schleith , L. 1954. Coupling o f proteins on diazotized polyam inostyrene. H oppe-Seyler’s Z. Physiol. Chem. 297: 108.
Guilbault, G.G. 1970 . Enzym ic m ethods o f analysis. CRC Crit. Rev. Anal. Chem. 1: 377.
Guilbault, G.G. and Das, J. 1970 . Im m obilization o f cholin-estarase and urease. Anal. B iochem . 33: 341.
Haynes, R. and Walsh, K .A . 1969 . Enzym e envelopes on colloidal particles. Biochem . Biophys. Res. Commun. 36: 235 .
Howard, A .N . and Wild, F. 1 9 5 7 . The reactions o f diazonium com pounds w ith amino acids and proteins. B iochem . J. 65: 651.
Kay, G. and Crook, E.M. 1967 . Coupling of enzym es to cellu lose using chloro-s-triazines. Nature 216: 514,
Levin, Y ., Pecht, M., G oldstein , L. and Katchalski, E. 1964 . A water-insoluble poly anionic derivative o f t r y p s in . 1. P re p a ra tio n a nd properties. Biochem istry 3: 1905.
L loyd, N .E ., Lewis, L .T ., Logan, R.M. and Patel, D .N. 1970. Process for isom erizing glucose to fructose. U .S. Patent 3 ,6 9 4 ,3 1 4 .
M attiasson, B. and Mosbach, K. 1971 . Studies on a matrix-bound three-enzym e system . Biochim . Biophys. Acta 235: 253.
Melrose, G.J.H. 1971. Insolubilized enzym es; biochem ical applications o f synthetic p o ly mers. Rev. Pure Appl. Chem. 21: 83 .
Mitz, M.A. 1956 . New insoluble active derivative o f an enzym e as a m odel for study of cellular m etabolism . Science 125: 1076.
Mitz, M.A. and Summaria, L.J. 196 1 . Synthesis of biologically active cellu lose derivatives o f enzym es. Nature 189: 576 .
Mosbach, K. 1971 . Enzym es bound to artificial m atrixes. Sci. Am. 224: 26.
Mosbach, K. and M attiasson, B. 1970 . Matrix bound enzym es. Part 2. Studies on a matrix- bound tw o-enzym e-system . Acta Chem . Scand. 24: 2093.
M osbach, K. and M osbach, R. 196 6 . Entrapm ent o f enzym es and microorganism s in synthetic crosslinked polym ers and their application in colum n techniques. Acta Chem. Scand. 20: 2807 .
N egoro, H. 1970 . C ontinuous inversion of sucrose by u s in g insoluble saecharase. Hakko Kogaku Zasshi 48: 689.
Nelson, J.M. and Griffin, E.G. 1 916 . Adsorption of invertase. J. Am. Chem. Soc. 38: 1109.
Olson, A.C. and Stanley, W.L. 1973 . Lactase and other enzym es bound to a phenol- form aldehyde resin with glutaraldehyde. J. Agr. Food Chem. 21: 440
Reed, G. 1966 . “ Enzym es in F ood Processing.” A cadem ic Press, New York.
Schnyder, B.J. 1973 . Letter to the editor.Enzym e Technol. Dig. 1: 165.
Silman, I.H. and Katchalski, E. 196 6 . Water- insoluble derivatives o f enzym es, antigens, and antibodies. Ann. Rev. B iochem . 35: 873.
Stanley, W.L. and Palter, R. 197 3 . Lactase im m obilization on phenolic resins. Biotech- nol. Bioeng. 15: 597,
Strandberg, G.W. and Sm iley, K .L. 1971 . Free and im m obilized glucose isom erase from S trep tom yces phaeochrom ogenes. Appl. M icrobiol. 21: 588.
Tosa, T., Mori, T., Fuse, N . a n d Chibata, I.1967. Studies on continuous enzym e reactions. Part 4. Preparation o f a DEAE- sephadex-am inoacylase colum n for continuous optical resolution o f acyl-DL-amino acids. B iotechnol. and Bioeng. 9: 603.
Wang, S.S. and V ieth , W.R. 1 973 . Collagen- enzym e com plex m embranes and their perform ance in b iocatalytic m odules. B iotechnol. Bioeng. 15: 93.
Weetall, H.H. 1973. Im m obilized enzym es: som e applications to foods and beverages. Part 1. Im m obilization m ethods. F ood Prod. Devel. No. 4: 46.
Witt, P.R. Jr., Sair, R .A ., Richardson, T. and Olson, N .F. 1970. Chill-proofing beer w ith insoluble papain. Brewers Dig., Oct. 197 0 .
Zaborsky, O. 1973 . “ Im m obilized E n zym es.” CRC Press, Cleveland, Ohio.
Ms received 1 2 /1 8 /7 3 ; revised 2 /2 2 /7 4 ; accepted 2 /2 7 /7 4 .
Presented at the 33rd Annual M eeting o f the Institute of Food T echnologists in Miami Beach.
Reference to a com pany and/or product named by the departm ent is on ly for purposes o f inform ation and does n ot im ply approval or recom m endation o f the product to the exclu sion of others w hich may also be suitable.

YO O N Y. L E E and G E O R G E T. TSA O Dept, o f Chemical Engineering & Nuclear Engineering, lowa State University, Am es, IA 50010
SYMPOSIUM: Immobilized Enzymes in Food SystemsMASS TRANSFER CHARACTERISTICS OF IMMOBILIZED ENZYMES
INTRODUCTION
R E C E N T A C H I E V E M E N T i n i m m o b i l i z e d e n z y m e r e s e a r c h h a s g r e a t l y e n h a n c e d i t s p o t e n t i a l a s i n d u s t r i a l c a t a l y s t
a n d m a n y o t h e r u s e s b u t b e t t e r u n d e r s t a n d i n g o f t h i s c o m p l e x m o d e o f r e a c t i o n i s b e i n g r e q u e s t e d . O n e o f t h e e s s e n
t i a l f a c t o r s t h a t m a k e s t h i s c a t a l y t i c r e a c t i o n m o r e c o m p l i c a t e d i s o r i g i n a t e d
f r o m m a s s t r a n s f e r p h e n o m e n a .T h e d i f f u s i o n a l r e s t r i c t i o n t h a t u s u a l l y
a p p e a r s in h e t e r o g e n e o u s r e a c t i o n h a s
a l s o b e e n f r e q u e n t l y f o u n d i n i m m o b i l i z e d e n z y m e r e a c t i o n s . T h e c o m m o n
e n z y m e c a r r ie r s a r e m o s t l y o f p o r o u s
f o r m t o m e e t t h e r e q u i r e m e n t o f p r o v i d i n g e n o u g h c o n t a c t a r e a . T h e r e f o r e , t h e
d i f f u s i o n a l e f f e c t s a r e c r e a t e d b y t w o t r a n s f e r p r o c e s s e s : ( a ) t r a n s f e r t h r o u g h t h e p o r o u s e n z y m e s u p p o r t ; a n d ( b ) t r a n s f e r t h r o u g h t h e e x t e r n a l l i q u i d f i l m . T h is e x a c t s i t u a t i o n h a s b e e n e n c o u n t e r e d
e a r l i e r in t h e a r e a o f h e t e r o g e n e o u s c a t a l y s i s a n d e x t e n s i v e i n v e s t i g a t i o n s h a v e b e e n a s s e s s e d i n t h i s r e g a r d a s t h e y a r e t h o r o u g h l y r e v i e w e d i n c h e m i c a l e n g i n e e r i n g l i t e r a t u r e ( S a t t e r f i e l d , 1 9 7 0 ;
S m i t h , 1 9 7 0 ) . A s f a r a s t h e t h e o r e t i c a l a s p e c t s a r e c o n c e r n e d , t h e s e w e l l - e s t a b l i s h e d c o n c e p t s a r e e q u a l l y a p p l i c a b l e t o
e n z y m i c s y s t e m s . I t i s o u r i n t e n t i o n t o
i n t r o d u c e s u c h a p p l i c a t i o n s o f t h e p r e v i o u s l y d e v e l o p e d t h e o r i e s i n t o t h e
i m m o b i l i z e d e n z y m e s y s t e m a n d d i s c u s s t h e p r o b l e m s t h a t a r i s e e s p e c i a l l y f o r
e n z y m i c r e a c t i o n s .
THEORETICAL TREATMENT OF PORE DIFFUSION
T H E S I M U L T A N E O U S r e a c t i o n a n d d i f
f u s i o n i n s i d e t h e p o r o u s m e d i u m i n d u c e s t h e s u b s t r a t e c o n c e n t r a t i o n g r a d i e n t a c r o s s t h e e n z y m e s u p p o r t . S u c h i n t e r n a l d i f f u s i o n o r p o r e d i f f u s i o n e f f e c t a l w a y s
r e d u c e s t h e o v e r a l l r e a c t i o n r a t e f o r o r d i n a r y k i n e t i c s . T h i s s i m u l t a n e o u s d i f f u s i o n a n d r e a c t i o n w a s f i r s t t r e a t e d
t h e o r e t i c a l l y b y T h i e l e ( 1 9 3 9 ) , w h o i n t r o d u c e d t h e c o n c e p t o f t h e e f f e c t i v e n e s s f a c t o r . T h e e f f e c t i v e n e s s f a c t o r w a s d e f i n e d a s t h e r a t i o o f r e a c t i o n r a t e s w i t h a n d w i t h o u t p o r e d i f f u s i o n e f f e c t . S i n c e
t h e n t h i s p r o b l e m h a s b e e n e x h a u s t i v e l y s t u d i e d f o r v a r i o u s s i t u a t i o n s r e g a r d i n g k i n e t i c s , g e o m e t r y o f c a t a l y s t a n d h e a t o f r e a c t i o n s ( A r i s , 1 9 5 7 ; K r a s u k a n d S m i t h ,
1 9 6 5 ; R o b e r t s a n d S a t t e r f i e l d , 1 9 6 5 ; W e is z a n d H i c k s , 1 9 6 2 ) .
S o m e o f t h e s e r e s u l t s a r e r e a d i l y a p p l i c a b l e f o r i m m o b i l i z e d e n z y m e s . M a r s h e t
a l . ( 1 9 7 3 ) c a l c u l a t e d t h e e f f e c t i v e n e s s f a c t o r s f o r M i c h a e l i s - M e n t e n k i n e t i c s
b a s e d o n s la b g e o m e t r y o f e n z y m e s u p p o r t w h i c h w i l l b e a g o o d a p p r o x i m a t i o n
f o r m e m b r a n e s . A s i m i l a r t r e a t m e n t c a n e a s i l y b e m a d e i n t o a s p h e r i c a l g e o m e t r y
o f e n z y m e c a r r ie r . T h e m a t e r i a l b a l a n c e
i n s i d e t h e p o r o u s m e d i u m l e a d s i n t o
t h e f o l l o w i n g d i f f e r e n t i a l e q u a t i o n f o r
M i c h a e l i s - M e n t e n k i n e t i c s o f :
( 1 9 6 5 ) f o r t h e r e s p e c t i v e a s y m p t o t i c c a s e s :
ß ^ ° ° E = J r < H b r - w0 R t a n h 0 R 0 R
ß ^ O ( E = 1 ¿ R < y j 6 j ß
V E = 1 — p e 3 (pR > y j 6 / ß
(8)
w h e r e p e is d e f i n e d b y
VmCK m + C
(1)
De(—T d r
2 d C ,
7 ^ V m (K m + C
) = 0 (2)
B .C . ( r = R C = C S ( 3 )
| r = 0 f = o ( 4 )
w h e r e D e = e f f e c t i v e d i f f u s i v i t y o f t h e
s u b s t r a t e in t h e p o r o u s m e d i u m a n d V m = m a x i m u m r e a c t i o n r a t e in t h e M i c h a e l i s - M e n t e n e q u a t i o n b a s e d o n t h e v o l u m e o f e n z y m e c a r r ie r .
B y n o r m a l i z i n g t h e d i f f e r e n t i a l e q u a t i o n , i t b e c o m e s c l e a r t h a t t h e e f f e c t i v e n e s s f a c t o r e v a l u a t e d f r o m t h e c o n c e n t r a t i o n p r o f i l e d e p e n d s o n t h e f o l l o w i n g t w o d i m e n s i o n l e s s q u a n t i t i e s :
0 r = R14
I v m( 5 )
[ D e K m
K m
C s( 6 )
A m o n g t h e m 0 R i s c o n v e n t i o n a l l y r e f e r r e d t o a s t h e T h i e l e m o d u l u s . D u e t o t h e b e h a v i o r o f M i c h a e l i s - M e n t e n e q u a t i o n , t h e r e a p p e a r t w o a s y m p t o t i c c a s e s . I f j3 ( t h e d i m e n s i o n l e s s M i c h a e l i s c o n s t a n t ) g o e s t o i n f i n i t y , t h e e q u a t i o n t u r n s i n t o f i r s t o r d e r k i n e t i c s a n d a s (3 a p p r o a c h e s z e r o i t b e c o m e s z e r o - o r d e r k i n e t i c s . T h e f o l l o w i n g a n a l y t i c a l s o l u t i o n s a r e a v a i l a b l e f r o m t h e e a r l y s t u d i e s b y S m i t h ( 1 9 7 0 ) a n d W e e k m a n a n d G o r r in g
( l - p e ) [ l / 2 ( l + p e ) - p e 2 ] ^
O t h e r t h a n a s y m p t o t i c c a s e s , t h e n o n l i n e a r d i f f e r e n t i a l e q u a t i o n o f ( l ) t o ( 3 ) c a n b e s o l v e d b y n u m e r i c a l m e t h o d . T h i s
e x a c t m a t h e m a t i c a l p r o b l e m w a s a l s o s o l v e d b y K r a s u k a n d S m i t h ( 1 9 6 5 ) in
t h e i r s t u d y o f e f f e c t i v e n e s s f a c t o r w i t h
s u r f a c e a d s o r p t i o n k i n e t i c s , w h i c h is f o r m a l l y i d e n t i c a l t o M i c h a e l i s - M e n t e n
k i n e t i c s . T h e n u m e r i c a l s o l u t i o n w a s r e p e a t e d h e r e a n d t h e r e s u l t i n g e f f e c t i v e n e s s f a c t o r s a r e s h o w n i n F i g u r e l . T h e
a s y m p t o t i c s o l u t i o n s a r e i n c l u d e d b y d a s h e d l i n e s .
I n t h e s t r i c t m a t h e m a t i c a l s e n s e t h e s e r e s u l t s a r e a p p l i c a b l e o n l y t o t h e s p h e r i c a l
e n z y m e c a r r ie r . H o w e v e r , t h e c o m p a r a t i v e s t u d i e s o n s h a p e e f f e c t s c o n d u c t e d
b y A r is ( 1 9 5 7 ) a n d K n u d s e n e t a l . ( 1 9 6 6 ) f o r f i r s t o r d e r a n d L a n g m u i r - H i n s h e l w o o d
k i n e t i c s s h o w e d t h a t t h e e f f e c t i v e n e s s f a c t o r s c o m p u t e d f o r s e v e r a l r e g u la r g e o m e t r i e s o f c a t a l y s t p e l l e t s c l o s e l y a g r e e d w i t h e a c h o t h e r p r o v i d e d t h a t t h e c h a r a c t e r i s t i c l e n g t h o f t h e p e l l e t i s
p r o p e r l y c h o s e n . T h u s t h e i n d i c a t i o n is t h a t t h e c u r r e n t r e s u l t s f o r s p h e r i c a l g e o m e t r y w i l l a l s o b e a p p l i c a b l e t o o t h e r g e o m e t r i e s l i k e m e m b r a n e o r i r r e g u la r s h a p e c a r r ie r s w i t h o u t c a u s i n g i n t o l e r a b l e e r r o r , i f w e c a r e f u l l y d e f i n e t h e c h a r a c t e r i s t i c l e n g t h .
EXPERIMENTAL EVIDENCE OF PORE DIFFUSION EFFECT
A T T H I S S T A G E , a l i m i t e d n u m b e r o f e x p e r i m e n t a l d a t a a r e a v a i l a b l e o n p o r e
d i f f u s i o n e f f e c t i n i m m o b i l i z e d e n z y m e r e a c t i o n s . R o v i t o a n d K i t t r e l ( 1 9 7 3 ) o b s e r v e d s i g n i f i c a n t p o r e d i f f u s i o n e f f e c t in
Volum e 3 9 (1 9 7 4 )-J O U R N A L O F FOOD S C IE N C E -6 6 7

6 6 8 -J O U R N A L O F FO O D S C IE N C E -V o lu m e 3 9 (1974)
glucose oxidase immobilized on porous glass beads for bead size greater than 125 micron. Similar results were reported by Marsh et al. (1973) in their study on glucoamylase. Kobayashi and Moo-Young(1973) also reported that invertase immobilized on ion exchange resin beads showed considerable pore diffusion effect for pellet size larger than 400 micron.
Ford et al. (1972) found that the trypsin immobilized on porous glass of 35 micron can be free of mass transfer effects when operated in a packed bed. Severe pore diffusion effect was observed by Goldman et al. (1968a, b) in their study of papain immobilized on collodion membrane with the papain layer thickness of 49—470 micron.
A series of experiments on this subject are being conducted in our laboratory using glucose isomerase immobilized on Zr02 coated porous glass (Kwang, 1973). The effectiveness factors were measured over the temperature range of 40 ~ 75°C for the average glass bead size of 270 micron. Up to 55°C no appreciable pore diffusion effect was observed and the
Fig. 1 —Effectiveness factor as function o f Thiele modulus and dimensionless Michaelis constant for spherical geom etry o f enzym e support.
z -
z =
Fig. 2 —Im m obilized enzym e packed colum n reactor.
Fig. 3 —Average and pointwise effectiveness factors in an integral re- Fig. 4 —Average and pointwise effectiveness factors in an integral reactor vs. the dimensionless concentration (1-conversion), 0 r = 5. actor i/s. the dimensionless concentration (1-conversicn), 0 R = 20.

MASS TRANSFER CHARACTERISTICS OF IMMOBILIZED ENZYMES- 669
Fig. 5 —Average and pointwise effectiveness factors in an integral reactor vs. the dimensionless concentration (1-conversion), 0 r = 50.
Fig. 6 —Comparison o f average effectiveness factor and the pointwise effectiveness factor calculated at log mean o f inlet and outlet concentration.
effectiveness factor gradually decreased down to 0.6 at 75°C. This increasing tendency of diffusional effect for higher temperature can be explained by the effectiveness factor and Thiele modulus relationship.
It will be useless to attempt to draw a general conclusion from these scattered experimental results since the degree of pore diffusion depends on many system variables including the operating conditions and properties of immobilized enzymes which are specific to each experiment. However, it will be pointed out that these experimental results provide enough evidence for the importance of diffusional effects on the kinetics or reactor study of immobilized enzymes.
PORE DIFFUSION EFFECT IN INTEGRAL REACTOR
THE CONVENIENT definition of effectiveness factor enables simple mathematical treatment in the design of ideal reactors. The following reactor design equations are derived for typical ideal reactors when the pore diffusion effect is accounted.
CSTR:K„
(Cbi - Cbf) ( l + — ) = Ec bf
VmfVR(9)
Packed column: (Plug flow)
Cbfc b i (1
Cbfm fin ( - ^ )
= Eav mf v R
(10)
Fig. 7—Com bined film and pore diffusion resistances.
Batch Reactor:
Cbi 0Cbf Cj,f7^ ) - Km fin ( - ^ ) M>i Mm
= EaVmft(11)
where Cbi = inlet substrate concentration; Cbf = outlet substrate concentration; VR = reactor volume; f = volume fraction of the immobilized enzyme in the reactor; Q = flow rate; and Ea = average effectiveness factor.
For the continuous stirred tank reactor the pore diffusion effect is accounted by single term, E, the effectiveness factor. Without such effect E simply becomes unity.
In the packed-column reactor we have a different situation in its relation to the effectiveness factor. It can change significantly from top to bottom of the column because of the concentration dependence of the effectiveness factor. This situation always occurs for nonfirst-order reaction including Michaelis-Menten kinetics. For instance, referring to Figure 1, the local effectiveness factor can change from unity at inlet point to 0.14 at complete conversion for Thiele modulus of 20 and high enough inlet substrate concentration ((3 < 0.01). We have identical situations for batch reactors in which the concentration is continuously changing along the

6 7 0 -J O U R N A L O F FO O D S C IE N C E -V o lu m e 39 (1974)
time instead of the length of the column. This problem has been brought to attention on several occasions (Chu and Hou- gen, 1962; Ford et al., 1972; Satterfield, 1970) but no general treatment was made for the reactor design.
For the design of integral reactors it becomes necessary to estimate the average effectiveness factor in Eq. (10) and (11) due to the continuously changing effectiveness factor. For proper definition of such average effectiveness factor, we need to trace back to the following differential form of reactor equation, which was derived from the material balance in the column reactor described in Figure 2:
dCb ^A f VmC3dz E Q Km "f Cb
z = 0, Cb ~ Qm( 12)
In integrated form we have
f Cbf
Cbi
dCh
E (Cb
Km + Cb-)
VmfVR Q (13)
Comparing Eq. (13) and (11), we can now define the average effectiveness factor in the integral reactors by the following equation:
Cbi O - ” Î) - K m ßn AE„ = ----------^ ^ (14)/Cbf dCb
Cb s Cbi E (v _ )
Such average effectiveness factors were numerically computed from the result of local effectiveness factor (Fig. 1) as shown in Figures 3—5. The dashed line in the figures represents the pointwise effectiveness factor which amounts to the cross plot of Figure 1. At the inlet point the two effectiveness factors are equal and as the reaction proceeds the average effectiveness factor exhibits higher values than the pointwise effectiveness factor.
An interesting comparison was made between the computed Ea and the point- wise effectiveness factor (E) calculated at the log mean of inlet and outlet concentration for several combinations of 0 R and j3 values (Fig. 6). It so happens that these two closely agree with the maximum deviation of less than 10% up to 0 R = 50 and 99% conversion. Identical comparison based on arithmatic average concentration gave far more deviation with maximum of 25%. Therefore the indication is that the cumbersome computation of Eq. (14) can now be avoided for the estimation of average effectiveness factor by simply taking log mean of inlet and
outlet concentration as the average concentration in the reactor.
COMBINED FILM AND PORE DIFFUSION EFFECT
ADDED diffusional resistance is created by the external liquid film in immobilized enzyme reaction. The nature of the liquid
film resistance is characterized by its involvement with the fluid dynamics of the system. Such fact provides a means to qualitatively test for the importance of film resistance as suggested by Levenspiel (1967). The method of this test is to observe the reaction rates at changing conditions of fluid dynamics such as the flow rate in a packed column or degree of
Fig. 8 —Film factor and effectiveness factor as function of film modulus. 4>r = 20.
WITHOUT PORE DIFFUSION EFFECT
Fig. 9-F i/m factor as function of film modulus and dimensionless Michaelis constant without the interference of pore diffusion effect.

M A S S T R A N S F E R C H A R A C T E R I S T I C S O F IM M O B IL IZ E D E N Z Y M E S - 671
Fig. 10—Effect o f pore diffusion on Lineweaver-Burk plot. Fig. 11—Effect of film diffusion on Lineweaver-Burk plot.
agitation in a CSTR at otherwise identical experimental conditions. This exact test has been made for several immobilized enzymes (Ford et al., 1972; Kwang, 1973; Marsh et al., 1973), in which considerable film resistance was observed in a packed column operation for certain flow rate range. Quantitative results on the film resistance were also reported by Rovito and Kittrel (1973) and Goldman et al. (1971) from their respective studies on the glucose oxidase immobilized on porous glass and alkaline phosphatase on collodion membranes.
In an attem pt to avoid the complicated situation of combined film and pore diffusion, these two effects have been studied separately by isolating one effect from the other. If Michaelis- Menten or any nonfirst-order reaction is involved, separating these two resistances becomes difficult when both of them are important. This will become clear as the following analysis proceeds. This situation can be pictured by Figure 7. The following equation is obtained by material balance at the solid-liquid interface.
kL(Cb - C s) = ELVm( C*— ) (15)+ '-s
where kL = mass transfer coefficient at
the liquid film; and L = characteristic length of the enzyme carrier defined as the volume divided by outer surface area. Solving for Cs/Cb , the ratio of interface and bulk concentration, we have
Cs/Cb = l / 2 [ j l - 0 (1 + E0S)}(15)
+ 1 -0 ( 1 +E0s) 2 +4/3]
where 0S = (LVm )/(kLKm)
The factor Cs/Cb, the index of film resistance, and the dimensionless parameter, 0s, will be referred to as film factor and film modulus, respectively, as they bear the meaning of nomenclature.
Equation (16) is in implicit form since E depends on Cs term. Therefore, the film factor of Eq. (16) can only be solved simultaneously with the effectiveness factor of Figure 1. Equation (16) also shows that the film and pore resistances are interrelated as one can be influenced by the other. This situation is created by the nonlinearity of Michaelis-Menten equation and it never occurs to first order reaction.
An example of the simultaneous solution for the film and effectiveness factors
is shown in Figure 8. The interrelationship between film factor and effectiveness factor can be demonstrated by this figure. Suppose we have a packed column reactor in which the flow rate was gradually increased keeping other conditions constant. We decrease the film modulus by increasing kb . As a result, the film factor increases and the effectiveness factor increases at the same time. This confirms the difficulty of separating two resistances. Therefore, for experimental study of one diffusional resistance, it becomes particularly important to minimize the interference of the other.
The solution of Eq. (16) in the absence of pore diffusion effect (E = 1) is given in Figure 9. The result is very similar to the effectiveness factor chart of Figure 1. Effectiveness factor and Thiele modulus are now replaced by film factor and film modulus. The resemblance of the curves can be noticed knowing that the film factor is not in logarithmic scale.
DIFFUSIONAL EFFECTS ON KINETIC STUDIES
THE OBVIOUS mass transfer interference on the intrinsic kinetics of immobilized enzyme reactions has now become clear through the preceding analysis. It is

6 7 2 -J O U R N A L O F FO O D S C IE N C E -V o /u m e 3 9 (1974)
quite probable that the major difference of the kinetics between native and immobilized enzymes may come from the mass transfer effects. Overlooking this one can easily misinterpret the kinetic data. A few examples will be given here concerning the mass transfer interferences on common kinetic studies.
Temperature dependence of immobilized enzyme reaction has been repeatedly studied for various enzymes. It is generally accepted that up to a certain temperature the Arrhenius’ law still holds for both native and immobilized enzymes. The diffusional effects increase as the temperature goes higher due to the increasing modulus values in Figures 1 and 9. This is directly reflected in the Arrhenius plot as decreasing slope at high temperature region. This behavior was observed on several occasions (Kwang, 1973; Weetall and Havewala, 1972). It is also possible that the data taken over narrow temperature spans might appear as a straight line simply giving lower activation energy.
The mass transfer effect on pH dependence becomes particularly important if the stoichiometry of the reaction involves hydrogen or hydroxyl ion. Due to the local pH profile created by continuous reaction inside the enzyme support, the pH activity curve for immobilized enzyme can drastically deviate from that of free enzyme. This case was found and thoroughly discussed by Goldman et al.(1968). The usual pH dependence in immobilized enzyme reaction, however, is not directly linked to the diffusional process if the reaction does not involve the hydrogen or hydroxyl ion.
The Lineweaver-Burk plot has been widely employed to determine the constants in the Michaelis-Menten equation. The sensitive reflection of diffusional effects on the Lineweaver-Burk plots are shown in Figure 10 for pore diffusion and Figure 11 for film diffusion. The degree of diffusional resistances is indicated by Thiele and Film modulus (the figures were prepared referring back to the effectiveness factor and film factor charts). As illustrated, the slopes in Lineweaver-Burk plot become higher as the diffusional effect increases. The usual increase of apparent Michaelis constant upon enzyme immobilization can readily be explained by this result. The curves are nearly straight except the very high concentra
tion region where they are concave upward. Thus, the apparent straight-line relationship in Lineweaver-Burk plot by no means implies that the reaction was free of mass transfer effects. However, the extremely high apparent Michaelis constant compared to that of free enzyme will very likely be the sign of severely diffusion limiting case.
NOTATIONA = cross-sectional area
of packed column reactorC = concentrationcb = bulk concentrationCbi = inlet bulk concentration
cbf = outlet bulk concentrationcs = concentration at the
liquid-solid interfaceDe = effective diffusivityE = effectiveness factorEa = average effectiveness factorf volumetric fraction of
the immobilized enzyme in the reactor
kL = mass transfer coefficientKm = Michaelis constantL = characteristic length of
immobilized enzyme supportQ = flow rater = radius (variable)R
=radius of the spherical enzyme support
t = timeV = reaction ratev m maximum reaction rate in
Michaelis-Menten equation based on the volume of enzyme support
Vr = reactor volumeß = dimensionless Michaelis
constant, Km/Cspe = defined by Eq. (8-a)
&R_ / v mThiele modulus, R - t--------
V * Km0f = film modulus
REFERENCESAris, R. 1957 . On shape factors for irregular
particles. 1. The steady state problem . D iffusion and reaction. Chem. Eng. Sei. 6 : 262.
Chu, C. and H ougen, O.A. 1962 . The e ffe ct o f adsorption on the effectiveness factor o f catalyst pellets. Chem. Eng. Sci. 17: 169.
Ford, J .R ., Lambert, A .H ., Cohen, N. and Chambers, R.P. 1972 . Recirculation reactor system for k inetic studies o f im m obilized enzym es. In “ Enzym e Engineering,” Ed. Wingard, J.B. Jr., p. 2 6 7 . Interscience Publishers, New York.
Goldman, R., Kedem , O. and Katchalski, E. 1968a. Papain—Collodion m embranes. 2. Analysis o f the k inetic behavior o f enzym es im m obilized in artificial membranes. B iochem istry 7: 4518 .
Goldman, R., Kedem , O. and Katchalski, E. 1971 . K inetic behavior o f alkaline phosphatase. Collodion membranes. B iochem istry 10(1): 165.
Goldman, R., Kedem, O., Silm an, I.H., Caplan,S.R . and Katchalski, E. 1968b. Papain— C ollodion membranes. 1. Preparation and properties. Biochem istry 7: 486.
Knudsen, C.W., R oberts, G.W. and Satterfield,C.N. 1 966 . E ffects o f geom etry on catalyst effectiveness factor. Ind. Eng. Chem. Fundam entals 5(3): 325.
K obayashi, T. and M oo-Young, M. 1973 . The kinetics o f mass transfer behavior o f im m obilized invertase on ion-exchange resin beads. Biotech. & Bioeng. 15: 47.
Krasuk, J.H. and Sm ith, J.M. 1965 . E ffectiveness factor w ith surface d iffusion. Ind. Eng. Chem. Fundam entals 4 (1): 102.
Kwang, W. 1973 . Mass transfer and k inetic studies o f glucose isom erase im m obilized on porous glass. M.S. thesis. Chem. Eng. Iowa State University.
Levenspiel, O. 1967 . “ Chemical R eaction Engineering.” John W iley, New York.
Marsh, D .R ., Lee, Y .Y . and Tsao, G.T. 1 973 . Im m obilized glucoam ylase on porous glass. Biotech. & Bioeng. 15: 483.
Roberts, G.W. and Satterfield, C.N. 1965 . Effectiveness factor for porous catalysts. Ind. Eng. Chem. Fundam entals. 4(3): 288.
R ovito, B.J. and K ittrel, J .R . 1973 . Film and pore diffusion studies w ith im m obilized glucose. Oxidase. B iotech. & Bioeng. 15: 143 .
Satterfield, C.N. 1970. “ Mass Transfer in Heterogeneous Catalysis.” M.I.T. Press, Cambridge, Mass.
Smith, J.M, 1970 . “ Chemical Engineering Kinetics,” 2d ed. McGraw-Hill, New York.
Thiele, E.W. 1939. R elation betw een catalytic activity mid size o f particle. Ind. Eng. Chem. 31: 916.
Weekman, V.W. Jr. and Gorring, R.L. 196 5 . Influence o f volum e change on gas-phase reactions in porous catalysts. J. o f Catalysis 4: 260.
Weetall, H.H. and Havewala, N.B. 1 972 . C ontinuous production o f dextrose from cornstarch. A study o f reactor parameters necessary for com m ercial application. In “ Enzym e Engineering,” Ed. Wingard, J.B. Jr., p. 241. Interscience Publishers, New York.
Weisz, P.B. and Hicks, J.S. 1962 . The behavior of porous catalyst particles in view o f internal mass and heat d iffusion effects. Chem. Eng. Sci. 17: 265.
Ms received 1 2 /1 8 /7 3 ; revised 3 /1 /7 4 ; accepted3 /5 /7 4 . ___________________
Presented at the 33rd Annual M eeting o f the Institute o f Food Technologists in Miami Beach.
This work was supported by the National Science Foundation through Grant G I-34933 and by the Engineering Research Institute at Iow a State University.

vV ‘f y ù f f
\£ J .APPLIED SCIENCE and ENGINEERING
M. I. GOMEZ and P. MARKAKIS Dept, of Food Science & Human Nutrition, Michigan State University, E. Lansing, Mi 48824
MERCURY CONTENT OF SOME FOODS
INTRODUCTIONINDUSTRIAL and agricultural uses of mercury and its compounds have resulted in the widespread occurrence of this metal in the environment and the presence of mercury residues in foods. M ercury-containing industrial wastes from the chemical and paper industries have been a source of contamination of fish in Japan (D’ltri, 1972), Sweden (Lofroth, 1969), USA and Canada (Bligh,1972). Fish have been shown to exhibit the property of concentrating mercury (Johnels and Westermark, 1969). Fish is recognized as a major source of mercury in the diet.
Agricultural uses of mercury constitute a lesser hazard. The possibility of translocation of mercury from treated seed to finished crop has been investigated (Smart, 1968) and the amounts appearing in the harvested crop shown to be below significant levels. However, mercury accumulated in the soil, either by geophysical processes or from repeated crop or soil treatment with mercurials, appears to be absorbed and translocated to edible parts of the plant in significant amounts (Furtani and Osajima, 1966). Fallout of mercury from the burn
ing of fossil fuels (Bertine and Goldberg,1971) has been shown to contribute to the soil burden of mercury.
The presence of mercury in foods has been reported in several recent studies. Jervis et al. (1970) analyzed over 300 Canadian foods and found mercury levels approaching or exceeding the 0.5 ppm FDA guideline in many of them. Somers(1971) and Meranger and Cunningham(1972) , however, reexamined some of these foods and their values are lower, sometimes by a factor of ten. More recent surveys of common foods in the U.K. (Min. of Agr., 1971) and USA (Tanner et al., 1972) reported generally levels lower that the FDA guideline of 0.5 ppm.
This study was undertaken to assess total mercury levels in staple food-stuffs. Foods from areas not known to be specifically contaminated with mercury were selected, since background leve's of mercury in the dietary supply were sought. Foods of Michigan origin were initially selected for the study in order to relate background mercury levels to geographic location. Subsequently, a few foods of different origin, but representing market samples of food sold in Michigan, were included in the study.
MATERIALS & METHODSFOODS were selected to represent a cross section of the average diet and included three major categories of food; animal (dairy, fish, meat and poultry) products, dry plant products (cereals and legumes), and fresh vegetables and fruits. Three basic subsidiary items of diet, sugar, salt and bread, were also analyzed. The size of samples brought to the laboratory varied from 1 lb (imported fishery products) to 50 lb (potatoes, beans, cereals). The sample size was reduced to a representative subsample of l-3 g , which was subjected to digestion before Hg determination.
Destruction of the organic matter without loss of Hg is a major concern in the determination of Hg in biological materials, because of the volatility of certain of its organic compounds. Moderation of the conditions of digestion, on the other hand, may result in incomplete release of Hg. Due to the variety of materials analyzed, three different digestion procedures were employed.
Digestion 1The sample was transferred to the bottom
of a 100 ml volumetric flask as recommended by Uthe et al. (1970). 5 ml of cone H2SO, were added, a 10-ml beaker was inverted on the flask, and the mixture was heated for 2 hr on a steam bath. After cooling first at room temperature and then in an ice bath, the digest was filtered through glass wool and the filtrate was
Table 1 —Recovery samples of food
of mercury added as mercuric chloride to 1g Table 2—Recovery of methyl mercuric chloride
mercury added as to 1g of barley
Food DigestionP9 Hg added
% Hg recovered (2 tests)
(H N 03:H 2S 0 , Digestion)
% Hg recoveredMilk, spray dried h 2s o . 0.03 106, 107 Mg Hg added (range, 4 tests)
Barley HIMOj :H 2 SO, 0.04 80, 105 0.01 50-100Potatoes H N 03 :H 2 SO, 0.05 94, 111 0.03 66-100Beans, navy HNOj :H2SO, 0.01 88, 92 0.05 80-100Chicken, muscle h 2s o . 0.20 95, 98 0.10 90-100
Average recovery 98% 0.20 9 3 - 97Average recovery 87%
Volum e 3 9 ( 1 9 7 4 )-J O U R N A L O F FO O D S C IE N C E -6 7 3

&74—JO U R N A L OF FOO D S C IE N C E -V o lu m e 3 9 (1974)
Table 3—Total Hg content of foods (other than fish)Food Total no. detma Rangeb (ppm) Mean (ppm)
Dairy and poultryMilk, whole, unpasteurized 5 (2) 0 .01-0 .02 0.01Milk, whole, pasteurized 6 (2) 0.005-0.01 0.01Milk, spray dried 6 (2) 0.01-0.03 0.02Cheese, Cheddar 6 (2) 0 .015-0.03 0.02Chicken, muscle 6 (2) 0.015-0.03 0.02Chicken, liver 6 (2) 0.015-0.03 0.03Eggs, whole 12 (3) 0 .02-0.04 0.03CerealsWheat (Dickson) 6 (2) 0 .01-0.025 0.02Wheat (Beizes) 6 (2) 0 .02-0.03 0.02Barley (Avon) 4 (1) 0 .02-0.025 0.02Barley (Talbot) 6 (1) 0 .02-0 .04 0.03Oats (Garry) 5 (1) 0.005-0.01 0.01Rice, polished 7 (2) 0.005-0.01 0.01MeatPork, muscle 12 (3) 0 .00-0.005 0.005Pork, liver 11 (3) 0 .02-0 .04 0.03Beef, muscle 6 (2) 0 .00-0 .02 0.01Beef, liver 6 (2) 0.01-0.015 0.01FruitsApples (Golden Delicious)
1. Flesh 6 (2) 0.00-0.01 0.012. Peel washed 6 (2) 0.00-0.01 0.013. Peel unwashed 4 (2) 0.015-0.03 0.02
Apples (Johnathan) 1. Flesh 6 (2) 0.00-0.01 0.01
Strawberries 6 (2) 0.00-0.01 0.01Tomatoes
1. Flesh 5 (2) 0.00-0.01 0.012. Peel washed 5 (2) 0.00-0.01 0.013. Peel unwashed 5 (2) 0 .01-0.02 0.01
VegetablesPotatoes (Russet)
1. Flesh 4 (2) 0 .01-0.015 0.012. Peel washed 6 (2) 0 .01-0.02 0.013. Peel unwashed 6 (2) 0.02-0.03 0.03
VegetablesPotatoes (Merrimack)
1. Flesh 6 (2) 0.00-0.01 0.012. Peel unwashed 6 (2) 0 .01-0.02 0.01
Asparagus 6 (2) 0.01-0.015 0.01Beans, navy, dry 6 (2) 0.025-0.03 0.03Beans, red kidney, dry 6 (2) 0.02-0.035 0.03MiscellaneousBread, white 6 (2) 0.005-0.01 0.01Sugar, white 12 (3) 0.005-0.01 0.01Salt, noniodized 6 (2) 0.03-0.09 0.06
a N u m b er o f sam p les in p a re n th es ish T h e th ird d e c im a l d ig it is a read ing e s tim a te used in th e v e ry lo w range o f m e asu rem e n ts .
Table 4—Total Hg content of fish and shellfish
Food OriginTotal no.
detmaRange(ppm)
Mean(ppm)
Large mouth bass )| 6 (2) 0 .20-0.28 0.25Yellow perch 'l Winter Green Lake, 5 (2) 0 .12-0.18 0.15Sunfish X Pumpkin |
seed ]\ Michigan 6 (2) 0.11-0.13 0.12
Lake trout 1 Lake Michigan 3 (1) 0 .40-0.46 0.43Whitefish | (north) 6 (2) 0 .03-0.05 0.04Coho salmon Lake Huron 3 (1) 0 .12-0 .14 0.13Catfish Saginaw Bay, Mich. 3 (1) 0 .05-0.08 0.07Shrimp Alaska 5 (1) 0 .03-0.05 0.04Clams Maryland 5 (1) 0 .03-0 .04 0.04Oysters Japan 5 (1) 0 .01-0.03 0.02
a N u m b er o f sa m p le s in p a re n th es is
further processed according to the Dow Chemical Co. (1970) method All animal products, except eggs, liver and cheese which contain considerable fat, were digested by this method.Digestion 2
Plant tissues and eggs, liver and cheese were digested with a 3:1 mixture of 35%HN03 and cone H2S04, which is a slight modification of the procedure of Jeffus et al. (1970). Heating on the steam bath was continued until evolution of brown nitrous fumes ceased.Digestion 3
Sugar and salt were digested with 35% HN03 (Hoover et al., 1970).
Mercury was determined as total elementary mercury using the flameless atomic absorption spectrophotometry method of Hatch and Ott(1968). The instrument used in the study was a direct reading Coleman Mercury Analyzer- MAS 50 with a range of detection of 0.00-9.00 Mg of Hg and a specified sensitivity limit of 0.01 Mg Hg. Readings were estimated to the nearest0.005 Mg at the lower range of measurement,0.000-0.035 Mg- The calibration of the instrument was checked four times during the survey by using standard HgCl2 solutions in the concentration range of 0.01-0.10 Mg- Samples were acid-digested and all Hg present was oxidized to the mercuric form with potassium permanganate. Excess permanganate was reduced with hydroxylamine hydrochloride and the mercury reduced to the elemental (atomic) state with stannous chloride.
Samples of representative items of the food categories examined were spiked with known additions of Hg as mercuric chloride and methyl mercuric chloride and subjected to digestion and subsequent analysis to determine recoveries of Hg.
All-reagent blank values were obtained each day food samples were analyzed.
RESULTS & DISCUSSION
THE CALIBRATION tests indicated tha t the readings of the instrum ent were correct w ithin ±2% (range) at the 0.10 ppm level and ±15% at the 0.01 ppm level of concentration.
The results of th e recovery experim ents are shown in Tables 1 and 2. In general the recovery levels were satisfactory.
Tables 3 and 4 summarize the results o f the analyses perform ed on foods. These data indicate tha t the Hg concentration in land produced foods nonsus- pected of exposure to m an-induced contam ination is generally low, in the range from less than 0.01 ppm to 0.03 ppm. The fish samples contained larger quantities o f Hg but still lower than the FDA safety guideline concentration (0.5 ppm). This is not surprising in view of the fact tha t aquatic food chains may lead to high levels o f m ercury in certain types of fish. These results are also in general agreement with a British survey (Min. o f Agr. Fish & F ood , 1971) and the findings of Tanner et al. (1972). In addition to the relative safety assurance chat these data may yield, some indication is also provid-

M E R C U R Y C O N T E N T O F S O M E F O O D S - 675
ed regarding th e background mercury levels in our food supply.
REFERENCESBertine, K.K. and Goldberg, E .D . 1 9 7 1 . Fossil
fuel com bustion and major sedim entary cycle. Science 173: 233.
Bligh, E.G. 197 2 . Mercury in Canadian Fish. J.Inst. Can F ood Sci. & Tech. 5: A6.
DTtri, F.M. 1 9 7 2 . “ The Environm ental Mercury Problem .” CRC Press, Cleveland.
Dow Chem ical Com pany. 1970 . The determ ination o f Mercury (A tom ic absorption spec- trophotom etric m ethod) CAS-AM -70, p. 13.
Furtani, S. and Osajima, Y . 1 9 6 6 . Residual com pounds from agricultural chem icals. 2. Mercury in rice. Fac. Agr. Kyushu University . 21: 363 . Cited by DTtri in “ The Environm ental Mercury Problem ,” 1 9 7 2 .
Hatch, W.R. and O tt, W.L. 1 9 6 8 . The determ ination o f sub microgram quantities o f mercury o f atom ic absorption spectrophom etry. Anal. Chem. 40: 2085 .
Hoover, N .L ., M elton, J.R. and Howard, P.197 0 . D eterm ination o f trace am ounts o f mercury in foods b y flam eless atom ic absorption. J. AOAC. 54: 1971 .
Jeffus, M.T., Elkins, J.S. and Kenner, C.T. 197 0 . Determ ination o f mercury in b iological materials. J. AOAC. 53: 1172 .
Jervis, R .E., Debrun, D ., LePage, W. and Tiefen- bach, B. 1970 . Mercury residues in Canadian foods, fish and w ildlife. National Health Grant Project N o. 605-7-510 , p. 39. University o f Toronto.
Johnels, A.G. and Westermark, T. 1969 . Mercury contam ination of the environm ent in Sw eden. In “ Chem ical F allou t,” Ed. Miller, M.W. and Berg, G.G. C.C. Thom as Publishers, Springfield, 111.
L ofroth, G. 1 9 6 9 . A review of health hazards and side effects associated w ith the em ission o f mercury com pounds into natural system s. Rept. National Sci. Res. Council, Stockholm , Sweden.
Meranger, J.C. and Cunningham, H.M. 1972 . Mercury content o f Canadian foods and cereals determ ined by different m ethods.
Intern. Conference on M ercury, Ann Arbor Science Publ., Ann Arbor, Mich.
Ministry o f Agriculture, F isheries & F ood.197 1 . Survey o f mercury in foods. Her M ajesty’s Stationary O ffice, L ondon.
Smart, N .A . 1 9 6 8 . Residues o f mercury com pounds. Residue Review 23: 1.
Somers, E. 1 971 . Mercury contam ination of foods. Proc. o f R oy. Soc. o f Canada, International Sym posium on ‘Mercury in m an’s environm ent,’ p. 99 .
Tanner, J.T., Friedman, M.H., Lincoln , D .N ., Ford, L.A . and Jafee, M. 1 9 7 2 . Mercury content o f com m on foods determ ined by neutron activation analysis. Science. 177: 1102.U the, J.F ., Armstrong, F.A .J. and Stainton, M.P. 1 9 7 0 . Mercury determ ination in fish samples by wet digestion and flameless atom ic absorption spectrophotom etry. J. Fish. Res. Bd. o f Canada 27: 805.
Ms received 1 1 /1 5 /7 3 ; revised 1 /9 /7 4 ; accepted1 /1 5 /7 4 ,________ ______________________________
Michigan Agricultural Experim ent StationJournal Article N o. 6619 .

JANUSZM. Z AK'Lynden Farms, Div. o f Western Farmers Association, 201 Elliott Ave. West, Seattle, WA 98119
FRENCH FRIED POTATOES: FACTORS AFFECTING YIELDS MEASURED AS SERVINGS PER 100 LB OF FROZEN PRODUCT
INTRODUCTIONSEVERAL quality factors o f French fried potatoes were defined by the U.S. Dept, of Agriculture (USDA, 1967); namely, sizing, uniform ity , color, tex ture and defects. These factors relate to (a) eating qualities o f French fried potatoes, and (b) profitability of the product, yields obtained at the end users level. While bo th of these factors are extrem ely im portant, most o f the papers published to date dealt primarily with the first one (Lachm ann, 1969; Nonaka and Weaver,1973). There are no papers published which would attem pt to determ ine which factors affect the “yield-per-serving,” profitability of the product. The following w ork was carried out to provide a factual inform ation on how limpness, sizing and par-fried solids affect the num ber o f servings per 100 lb of frozen French fried potatoes. The samples of French fries used were shoe-string style, since they are the predom inant cut sold on a volum etric basis.
MATERIALS & METHODSSAMPLES of French fried potatoes were purchased from a local distributor and maintained at -18°C prior to use. All samples were shoestring style, straight cut, 1/4 x 1/4 in. square, and were produced by different companies. The factor of sizing was determined by counting a 1-lb sample of frozen product, taken at random. The counts reported represent an average of three samples from each case of product. Units were divided into categories according to their length (USDA, 1967): (a)
1 Présent address: Collins Foods International, Inc., 12731 W. Jefferson Blvd., Los Angeles, CA 90066
shorter than 2 in.; (b) 2 -3 in. long; and (c) 3 in. and longer. The results were expressed on a per centum basis.
Finish frying was done in a commercial electric fryer, Wells type. Samples were fried for 2.75 min at 171°C in a vegetable shortening, from the frozen state. The ratio of oil to potatoes was 25:1. The oil temperature profile during frying was closely controlled for all samples and did not vary by more than 1.5°C at any time.
Yields, in terms of servings per 100 lb of frozen potatoes were evaluated by filling commercially available, waxed paper bags with finish fried product, using a hand filler (“Bagging Scoop,” model 152A, Prince Castle Association, Inc., Addison, 111.). The size of the bags used was 5 x 3.5 in.; bags were filled within 2 min after finish frying. The number of servings per 100 lb of frozen product was calculated according to the following formula:
N = C x J X JlQO) x 100 lb X
where: N = number of servings; C = conversion factor -_4.536 x 101 2 g/lb; Y = cookout yield (%); and X = an average serving weight (g).
The term “cookout yield” refers to the ratio of the weight of product obtained after finish frying to the weight of frozen French fries used.
Limpness of French fried potatoes was evaluated according to the method described earlier by Zak and Holt (1973). The values reported represent an average of three tests run on each sample. Moisture content of the product was determined by a vacuum oven technique (AOAC, 1965).
RESULTS & DISCUSSIONTHE EFFECT of limpness on the num ber of servings per 100 lb of frozen French fried potatoes was evaluated using three different samples o f commercially available products (A, B and C). Their limpness scores were 17%, 24% and 32%,
respectively. In order to elim inate the effect o f sizing, all units were divided into sub-groups according to their length. The first sub-group contained units shorter than 2 in.; the second contained those which were 2—3 in. long; units longer than 3 in. were placed in the th ird subgroup.
The results presented in Table 1 indicated, th a t the num ber o f servings per 100 lb of frozen product decreased when the limpness factor o f samples increased. This was found true for each length category. The average serving weight was found to increase as the limpness of samples increased. The correlation coefficients between limpness and the average serving weight for individual length categories were 0.87, 0.80 and 0.84, respectively. The increase in the average serving weight w ithin each subgroup was significant at p < 3.01 level. The decrease in the num ber of servings obtained was fairly similar for each size category and was approxim ately 15%. This decrease could be a ttribu ted to the fact that units which lacked or lost their rigidity after finish frying tended to bend and pack closer together in the bags.
The results shown above indicate, tha t the surface rigidity of the units is of great im portance in assuring the o p timum yields of product at the end users’ level. Considering the fact tha t approximately 50% of all shoe-string French fries produced annually in th is country have limpness scores greater than 20% (Zak,1972), there is a definite need for more research in this area. In troduction of high amylose starches and changes in processing m ethods which could improve the limpness factor of the finished product should be investigated. The above results
Table 1—Effect of limpness on the average weight of serving the number of servings per 100 lb of frozen French fried potatoes
ProductLimpness
(%>Cookout yield (%)
Number ofsamples®
Average serving weight (g) < 2 in. 2—3 in. > 3 in.
Servings per 100 lb < 2 in. 2—3 in. > 3 in.
A 17 66.0 14 96.1 98.5 95.1 311 303 314B 24 64.2 10 103.5 106.5 102.3 381 273
00CM
C 32 63.5 11 108.9 112.3 108.6 264 256 266Correlation Coefficient r = 0.87 0.80 0.84
a F o r each s ize ca te g o ry
6 7 6 -J O U R N A L O F FO O D S C IE N C E -V o lu m e 3 9 (1 9 7 4 )


C. E. JOHNSON, J. H. von ELBE and R. C. LI NCSA Y Dept, of Food Science, University of Wisconsin-Madison, Madison, W7 53706
EXTENSION OF POST-HARVEST STORAGE LIFE OF SLICED CELERY
INTRODUCTION
SLICED AND DICED fresh celery is an im portant ingredient in some canned or frozen food products. Celery stalks, as conventionally delivered to food processors, contain over 26% waste consisting of soil, bu tts and leaves (Johnson and von Elbe, 1971). Food plant waste disposal loads could be reduced if only the waste- free product were delivered to processing plants.
Many studies have indicated that the quality of fruits and vegetables can be enhanced by prom pt removal of heat prior to refrigerated storage or processing (Anon., 1971; Stewart and Barger, 1960, 1961, 1962; Weckel et al., 1964). Celery is considered a highly perishable vegetable, and Redit (1969) has recommended vacuum or hydrocooling of celery to 4.4°C soon after harvest. Optim um storage conditions for celery are a tem perature of —0.6 to 0°C and a relative hum idity of 90—95% (Anon., 1962; Ashby,1970). The purpose of this study was to determ ine whether waste-free sliced celery could be cooled and stored for at least 6 days by the grower for subsequent delivery to processors.
EXPERIMENTAL
CELERY harvested at various stages of maturity was washed, mechanically sliced into 0.5 in. pieces, and air cleaned to remove leaves. Precooling was accomplished by either hydrocooling under a 1.1°C spray of water or by vacuum cooling in a commercial unit. Temperature of the celery was reduced from 18.3- 19.4°C to 4.4°C in 3.8 and 10 min, respec
tively. Browning inhibitors were applied by passing celery through a solution of inhibitors for 1 min contact time. The effect of maturity upon quality was evaluated for celery harvested at optimum maturity, 1 wk prior to optimum maturity, and 1 wk after optimum maturity.
Processed celery was placed in polyethylene- lined 1,000-lb bins (4' X 4' x 4') and stored at 4.4°C for 6 days. A storage time of 6 days was chosen because this would be adequate to ensure orderly delivery. Control celery samples were prepared similarly except that precooling and application of browning inhibitors were omitted.
Browning inhibitors evaluated were solutions of 100 ppm ascorbic acid, 200 ppm citric acid/ 200 ppm ascorbic acid, and 1,000 ppm citric acid/5,000 ppm ascorbic acid. The efficiency of browning inhibitor solutions was evaluated by preparing 5-lb lots of celery slices and visually examining each lot for discoloration every 2 days during 8 days’ storage at 4.4°C.
Temperature profiles of precooled celery during refrigerated storage were recorded from four thermocouple locations in 1,000-lb bins including the geometric center, and points located on parallel lines to the center one-third the distance from the top and bottom of the box, and one-third the distance from the side of the box.
Raw and processed samples were evaluated for firmness with a Lee-Kramer shear press at a range setting of 3,000 and 300, respectively and a stroke of 30 sec. In addition canned samples were evaluated for drained weight (Anon.,1968) and sensory characteristics. Canned celery was prepared by packing 250g of product into No. 303 C-enameled cans, filling with a solution of 1% brine at 82.2°C, exhausting to a center temperature of 77.8°C, and sealing. Cans were processed at 115.5°C for 25 min and cooled to 37.8°C (Anon., 1966). Processed cans were stored for 6 wk prior to evaluation.
All canned samples of celery were evaluated in the laboratory by four experienced judges for comparative sample appearances and the presence of off-flavors.
Triangle difference tests carried out under controlled conditions were employed to determine significant visual differences between individual samples (Amerine et ah, 1965). 12-15 trained panel members were used and judges were also asked to indicate preferences for either the paired or ode sample. Only ballots correctly distinguishing the odd sample were tabulated for preference indications. Visual evaluations were conducted using a standard MacBeth daylight type lamp system (MacBeth Daylight Corp., Newburgh, N.Y.) for illumination.
RESULTS & DISCUSSIONT em perature profile
Daily internal tem perature m onitoring of 1,000-lb bins of celery precooled to 3.3°C and stored for 6 days at 1.7 7.2°C showed only small increases, and the tem perature in the geom etric center of the bin increased less than 1 degree per day. This slight tem perature increase was attributed to tem perature of respiration, and the air tem perature fluctuation of1.7—7.2°C th a t occurred in the com m ercial storage facility.In h ib ition o f brow n in g
The developm ent o f brown spots on cut surfaces of un treated celery samples after 2 days of storage indicated tha t a browning inhibitor treatm ent was necessary for extended storage life. T reatm ents with either ascorbic acid or ascorbic acid- citric acid m ixtures were found to be
Table 1—Effects of maturity and cooling on drained weight and maximum shear pressure values of canned celeryHydrocooled Vacuum Cooled No Cooling
Early harvest Optimum Late Optimum OptimumStorage time
(Days)Drained
wt ShearDrained
wt ShearDrained
wt ShearDrained
wt ShearDrained
wt Shear
0 24 2a 197b 243 235 242 226 252 226 242 2491 244 204 245 214 240 227 242 196 242 2413 250 210 249 230 247 242 254 251 248 2696 251 231 250 241 254 270 257 251 245 271
a A v e ra g e o f s ix d e te rm in a t io n s , can s ize 3 0 3 ; d ra in e d w e ig h t in g ram s ± 3 b A v e ra g e o f s ix d e te rm in a t io n s , sh ear p o u n d ± 3
6 7 8 -J O U R N A L O F FO O D S C IE N C E -V o lu m e 3 9 (1 9 7 4 )


6 8 0 -J O U R N A L OF FO O D S C IE N C E -V o lu m e 39 (1974)
A nonym ous. 1966 . Processes fo r low -acid canned foods in m eta l co n ta iners. Bull. 26-L. N ational C anners Assoc. W ashington,D.C.
A nonym ous. 1968 . “ L ab o ra to ry M anual for F o o d C anners and P rocessors.” N ational C anners A ssoc., Avi, W estport, C onn.
A nonym ous. 197 1 . F resh-p icked vegetables get on-site cooling . C om m . G row ers (8): 199.
A shby, B.H. 1970. P ro tec tin g perishab le foods during tran sp o rt by m o to r tru ck . U.S. D ept. Agr. H an d b o o k N o. 105.
Jo h n so n , C .E. and von E lbe, J .H . 1971 . C elery w astes. U npublished data .
R edit, W.H. 1969 . P ro te c tio n o f rail sh ipm en ts o f fru its and vegetables. U.S. D ept. Agr. H an d b o o k N o. 195.
S tew art, J .K . and Barger, W.R. 1960 . E ffec ts o f cooling m e th o d and to p icing on th e quality o f peas and sw eet co rn . A m er. Soc. H ort. Sci. P roc. 7 5: 470 .
S tew art, J.K . an d Barger, W.R. 1961 . E ffec ts of cooling m e th o d on th e quality o f asparagus and cau liflow er. A m er. Soc. H ort. Sci. P roc. 78 : 295.
S tew art, J.K . and Barger, W .R. 1962 . E ffec ts of precoo ling m e th o d o n th e quality o f crate- packed and prepackaged celery . A m er. Soc. H o rt. Sci. P roc . 81: 347.
W eckel, K .G ., Seem an, B. and Ng, W e-Su-Lo.1964 . E ffec t of post-harvest te m p e ra tu re of fresh peas on th e quality o f cann ed peas. F oo d T echnol. 18: 1207 .
Ms received 1 1 /2 4 /7 3 ; revised 2 /1 1 /7 4 ; accep ted 2 /1 8 /7 4 .
R esearch su p p o rted in p a r t by th e College o f A gricultural & L ife Sciences, U niversity of W isconsin-M adison and in p a r t b y fun d s from L each Farm s, Berlin, Wise. The assistance o f th e Sensory E valuation Lab. in th e D ept, o f F o o d Science is acknow ledged .

G. J. HAAS, H. E. PRESCOTT JR. and C. J. CANTETechnical Center, General Foods Corp. White Plains, NY 10625
ON REHYDRATION AND RESPIRATION OF DRY AND PARTIALLY DRIED VEGETABLES
INTRODUCTIONDRYING of vegetables is important for the food industry. Reduction of water content prevents microbial growth and slows enzymatic changes, thus making storage without refrigeration possible. It also reduces shipping weight. On the other hand, drying brings with it shrivelling of the particular food to a small fraction of its former size. This slows up complete dehydration and makes rehydration slow and incomplete (Van Arsdel and Copley, 1964).
The purpose of this investigation was to correlate degree of drying with the speed and degree of rehydration. Another aim was to find whether there is a point of no return short of which the vegetable could be dried, without suffering from the inability to rehydrate completely. Our work also included experiments on respiration to determine whether there is
a point of drying at which respiration ceases; this point could be a meaningful indicator for desired extent of drying. In addition, we attempted to determine whether preblanching of vegetable pieces or treatment with surface active agents would help increase the rate and degree of rehydration.
EXPERIMENTALDrying experiments
Drying studies were carried out on green (or string) beans, carrots, and green bell peppers. These were purchased locally, but the varieties were not known. Preparation of experimental samples was as follows: beans were cut into pieces about 2 cm long. For carrots, transverse slices were cut 2 -4 mm thick and about 1 -2 cm in width (the diameter of the carrots). For peppers, the pieces were cut (1/2-1) X (2-4 ) cm and all slices came from three pepper fruits; the slices were so distributed that each sample had equal amounts of material from each
pepper fruit. Samples were weighed and these fresh weights were considered to constitute 100%. Samples were then dried at 65° C in a Proctor and Schwartz air oven to varying degrees of desiccation and reweighed. Weights were expressed as percentages of original fresh weight.
Rehydration of these samples was carried out by placing them in 250 ml water at room temperature (23°C) for convenience. There was excess water, about three- to sixfold on a fresh weight basis, or thirty- to sixtyfold on a dry weight basis. Water uptake was measured at time intervals by pouring off the water, blotting the samples on paper towels and weighing them. The samples were returned to fresh distilled water after each weighing in order to continue the rehydration.Effect of blanching
We wanted to investigate whether blanching prior to drying would have a beneficial effect on rehydration. There have been reports in the literature supporting this tenet (Sterling and Schimazu, 1961).
The experiments were undertaken as described previously except that blanching was carried out by immersing the sample in boiling water for 6 min. The change in net weight after blanching was a 7.3% decrease for carrots, but a 3.1% increase for beans.Pretreatment with surface active agents to improve subsequent rehydration
Saravacos and Charm (1962) pretreated some fruits and vegetables with certain surface
Fig. 1—Schoiander respirometer (from Betico, Vineland, N.J.). Fig. 2 — Rehydration o f partially dried string beans.
Volum e 3 9 ( !9 7 4 )—JO U R N A L OF FO O D SCIENCE-681

6 8 2 -J O U R N A L O F FO O D S C IE N C E -V o lu m e 3 9 (1974)
active agents (at a concentration of 0.2%) and then measured their effects on dehydration and subsequent rehydration. They found no improvement of rehydration. We used celery slices in our surfactant work, and the concentration was usually 2.0%.
Usually, samples of celery slices (2 to 3 mm thick) were soaked in the 2.0% solutions of selected surfactants for 4-1/2 hr (25-g samples in 250 mis of solution), air dried, then stored in a desiccator for several days, and finally rehydrated in water at room temperature. The soaked slices were drained for 45 min before they were weighed.
Respiration studiesTwo methods were used for the measure
ment of respiration. The first was a direct measurement of oxygen consumed using the Scholander respirometer (Scholander, 1950). The second was based on the reduction of the oxidation-reduction indicator, triphenyltetra- zolium chloride (TTC). A respiring system of reducing enzymes will result in the formation of the formazan derivative, a red color, which can be observed in the tissue.
Slices of fresh celery were dried to about 25% of their fresh weight by keeping them in a drying oven with air flowing at about 35°C for about 3 hr. Then samples (a little more than 3g) were put into Scholander respirometers (from Bellco, Vineland, N.J., Fig. 1). The respirometer chambers were covered with aluminum foil to prevent any photosynthesis. These respir
ometers are completely closed systems with a compensating chamber. Small containers of KOH solution with wicks of filter paper were used to absorb any C02 evolved.
RESULTSE ffect o f drying
Results of drying shown in Figures 2, 3 and 4 dem onstrate th a t the greater the degree of drying, the slower and less com plete the degree of rehydration. We would expect higher absolute values if rehydration had taken place at higher tem perature (Davis and Howard, 1943; Neubert et al., 1968) and w ith agitation.
Fig. 3 — Rehydration of partially dried carrots. Fig. 5 —Rehydration o f preblanched, partially dried carrots.
Fig. 4— Rehydration of partially dried peppers. Fig. 6 —Rehydration of preblanched string beans.

R E H Y D R A T IO N & R E S P IR A T IO N O F D R IE D V E G E T A B LE S-683Effect of blanching
Results, shown in Figures 5 and 6 , substantiate the published data tha t blanching improves the rehydration properties of carrots; this happens on all samples regardless o f the degree o f dehydration. This im provem ent, however, was evident only for long rehydration times;
luring the first 2 h r o f rehydration we could no t observe differences. There was no im provem ent for the rehydration of blanched green beans.
The variation in results obtained for celery by different investigators is discussed by Neumann (1972). Of four workers in the field, two found improved
Table 1—Weights (as % fresh weight) of celery slices soaked in either water or beneficial surfactant solutions: wet, dried and rehydrateda
S o lu t io n
Drainedwt
Drywt
Rehydrated wt after soaking 4-1/2 hr
(Drained 40')
Rehydrated wt after soaking
overnight (Drained 45')
Water 110 3.8 18 26A LIP A L AB-436 97 2.5 43 68
(ammonium salt o f a sulfated l in e a r
primary alcohol ethoxylate)A LIP A L AB-436 97 2.5 41 70A LIP A L CO-436 97 2.6 46 68
[ammonium salt of a sulfate ester of alkylphenoxypoly-(ethyleneoxy) ethanol]
A L IP A L CO-436 97 2.5 44 66Water 111 3.7 20 28Water 113 3.7 18 26IGEPOIM AC-78 99 2.8 33 67
(Coconut oil acid ester of sodium isethionate)
IGEPOIM AC-78 99 2.7 35 70IGEPON AP-78 100 3.1 34 72
(oleic acid ester of sodium isethionate)
IGEPON AP-78 100 3.0 34 72Water 112 3.6 18 24
a T h is ta b le rep rese n ts tw o se p a ra te e x p e r im e n ts w ith c o n tro ls so ake d in w a te r being ru n a t th e b eg inn ing and end o f each e x p e r im e n t . S u r fa c ta n t s are G A F p ro d u c ts .
rehydration due to blanching, while two did no t; experim ental conditions relating to drying and rehydration probably caused these variations.
Surface active agentsTable 1 summarizes data for the surf
actants which more than doubled the rehydration rate of dried celery as com pared to the controls (celery soaked in distilled water). Table 2 lists other surface active agents which had m uch less or no effect. The residual am ount o f surface active agent in the celery was not measured.
F urther work might uncover even more effective surface active agents, and could include locating the surface-active agent. We were interested mainly if rehydration could be improved, but practical application would depend on FDA status and taste.
Respiratory studiesA sample (w t 3.24g) of partly dried
(to 24.4% of its fresh weight by drying at 3 5°C) celery slices consumed oxygen: about 0.9 ml in 2-2/3 hr. Although there was no t a proper control of fresh celery from the same stalk, there was no doubt tha t partial drying did no t stop respiration, but it did slow it on an equal fresh weight basis. These results are given in Table 3; similar m easurem ents were made on pieces of green pepper bells (Table 4) and carrot slices (Table 5). In general, respiration is slowed by drying but not necessarily abolished. As shown in Tables 3 and 5, rehydration of dried celery and carrot samples did no t restore lost respiration rates. Degree of replication may be seen in the above tables.
Staining by TTC was carried out with
Table 2—Less effective surface active agents Table 3—Respiration studies—Celery (Transverse section, 2 —3 mm thick)
(Concentration was 2.0% except as noted) % of fresh wt
Sample wt (g)
ml 0 2Absorbed
(ml 0 2/hr)/ (g sample)
(ml 0 2/hr)/ (g fresh wt)
Drewpone 60 (from PVO International) 100% 3.02 0.65 in 0.072 0.072[polyoxyethylene (20) sorbitan monostearate] (1.6%) 3 hr
100% 4.32 0.90 in 0.069 0.069Tween 20 (from Atlas) [polyoxyethylene (20) 3 hr
sorbitan monolaurate] (0.5%, 1.0%, 3.0%, 6.0% and 10%) 24% 3.24 0.90 in 0.104 0.025Triglycerol mono-oleate (0.25%) 2.67 hr
Brij 30 (from Atlas) [polyoxyethylene (4) lauryl ether] 100% 3.30 1.14 in 0.115 0.115and Brij 35 [polyoxyethylene (23) lauryl ether] 3 hr
100% 3.60 0.72 in 0.067 0.067Emulphogene BC-720 and Emulphogene BC-840 (from GAF) 3 hr
[tridecyloxypoly (ethyleneoxy) ethanol] 26%, then rehydrated 3.20 0.25 in 0.026 0.015C a fa c LO-529 ( f r o m G A F) [partial sodium salt of to 56% 3 hr
complex organic phosphate ester] 26%, then rehydrated 3.50 0.30 in 0.029 0.016to 56% 3 hr
Igepal CO-610, Igepal CO-710, and Igepal RC-520 26%, then rehydrated 3.30 0.44 in 0.044 0.025( f ro m G A F ) [polyethoxylated hydrophobes] to 56% 3 hr
Igepal CTA-639 (from GAF) [alkylphenoxypoly (ethyleneoxy) ethanol]

684-J O U R N A L OF FO O D S C IE N C E - V olum e 3 9 (19741
Table 4—Respiration studies—Green peppers (5mm)3
% of fresh wt
Sample wt (g)
ml 0 2 Absorbed
(ml 0 2/hr)/ (g sample)
(ml 0 2/hr)/ (g fresh wt)
100% 3.05 0.55 in 3 hr
0.061 0.061
100% 3.39 0.62 in 3 hr
0.061 0.061
21% 3.10 0.38 in 2 hr
0.061 0.013
21% 2.60 0.36 in 2 hr
0.069 0.015
Table 5—Respiration studies—Carrots (Transverse sections, 2—3 mm thick)
% of fresh wt
Sample Wt (g)
ml 0 2Absorbed
(ml 0 2/hr)/ (g sample)
(ml 0 2/hr)/ (g fresh wt)
100% 3.02 0.90 in 2.5 hr
0.119 0.119
100% 3.02 0.92 in 2.5 hr
0.122 0.112
39% 3.10 0.72 in 2 hr
0.116 0.045
39% 3.00 1.01 in2 hr
0.168 0.066
27% 3.06 0.30 in .75 hr
0.130 0.035
27% 3.20 0.25 in .75 hr
0.104 0.028
15% 2.00 0.10 in 3 hr
0.017 0.0025
15% 2.00 0.10 in 3 hr
0.017 0.0025
15% 0.90 0.0 in 3 hr
0.000 0.000
100% 3.50 1.10 in 3 hr
0.105 0.105
100% 3.50 1.13 in 3 hr
0.108 0.108
29%, then rehydrated to 64%
3.20 0.57 in 2 hr
0.089 0.057
29%, then rehydrated to 64%
3.25 0.78 in 2 hr
0.120 0.077
29%, then rehydrated to 64%
3.30 0.83 in 2 hr
0.126 0.080
29%, then rehydrated to 64%
3.20 0.52 in 2 hr
0.081 0.052
100% 3.50 1.35 in 3 hr
0.129 0.129
100% 3.40 1.40 in 3 hr
0.137 0.137
100% 3.40 1.05 in 3 hr
0.103 0.103
26%, then rehydrated to 79%
3-10 0.44 in 3 hr
0.047 0.037
26%, then rehydrated to 79%
3.05 0.82 in 3 hr
0.090 0.071
26%, then rehydrated to 79%
3.00 0.54 in 3 hr
0.060 0.047
26%, then rehydrated to 79%
3.20 0.80 in 3 hr
0.083 0.066
a 0 .6% solution of the dye in water. Celery slices (0.5 mm thick), bo th fresh and pre-dried, were treated and observed after 1 hr. Fresh celery was stained w ithin 1 hr, particularly along the vascular bundles. Celery dried at 30° C to 42% of fresh weight still showed this staining, but when dried to 28%, alm ost all capability for staining had disappeared. These experiments were repeated for green pepper with similar results. Pepper dried to 40% of fresh weight exhibited enzyme activity as measured by TTC staining, while pepper dried to 24% did not.
The effect of drying tem perature on staining by TTC was investigated on green peppers. After drying at 60°C to 44% of fresh weight the staining was reduced; after drying to 32% it was eliminated. Drying at 80°C even to 62% of fresh weight elim inated all enzym e activity as measured by staining w ith TTC. This is to be expected because of the heat lability of enzymes.
CONCLUSIONSDAMAGE to tissue during drying becomes more severe as drying progresses. This is shown by the less com plete rehydration of m ore thoroughly dried celery, the lower rate (on a fresh weight basis) of oxygen consum ption of partially dried celery, green peppers and carrots, and the loss of the enzymic system to reduce TTC. Application of our results to practice is lim ited by the rehydration tem perature em ployed as higher tem peratures may lead to different results. Certain surfactants appear to enhance th e rate of rehydration o f dried tissue, and further research in this direction may be profitable.
REFERENCESDavis, M.E. and Howard, L.B. 1943 . E ffects of
varying conditions on the reconstitution of dehydrated vegetables. Proc. Inst. Food Technol. p. 143.
Neubert, A.M., W ilson, C.W. Ill and Miller,W.H. 1968 . Studies on celery rehydration. F ood Technol. 22: 1296.
Neum an, H.J. 1972. Dehydrated celery: E ffects o f predrying treatm ents and rehydration procedures on reconstitution. J. F ood Sci. 37: 437.
Saravacos, G.D. and Charm, S.E. 1962. E ffect o f surface-active agents on the dehydration o f fruits and vegetables. F ood Technol. 16: 91.
Scholander, P .F. 195 0 . V olum etric plastic micro xespirometer. Review of Sci. Instr. 21: 378.
Sterling, C. and Shimazu, F. 1961 . Cellulose crystallinity and the reconstitution of dehydrated carrots. J. Food Sci. 26: 470.
Van Arsdel, W.B. and C opley, M.J. 1964 . “ Food Dehydration: Products and Techn o logy ,” V ol. 2. The Avi Publishing C o., Inc., W estport, Conn.
Ms received 6 /2 8 /7 3 ; revised 3 /1 5 /7 4 ; accepted3 /2 0 /7 4 .

RUTH FIRSTENBERG, CHAIM H. MANNHEIM and A YALA COHEN Dept, o f Food Engineering & Biotechnology, Technion—Israel Institute o f Technology, Haifa, Israel
MICROBIAL QUALITY OF DEHYDRATED ONIONS
INTRODUCTION
UNBLANCHED dehydrated vegetables, such as onions, are a potential source for microbial contamination of foods. One of the problems in setting specifications for dehydrated vegetables is finding a suitable and reliable indicator for fecal contamination which can also serve as an indicator for overall sanitary conditions of the product and plant in which it was produced.
Sheneman (1973) found that the bacterial flora of dried onions consists mainly of the genus Bacillus. The dominant organisms of this group are B. sub- tilis, B. licheniformis, B. cereus and B. firmus. The coliform group in dry onions consists mainly of Aerobacter aerogenes (56% of the total coliforms) (Sheneman, 1973; Clark et ah, 1966), E. coli being rare in this product. Vaughn (1951) found that Mucor, Penicillium and Aspergillus are the main fungi in dried onions. The fungi counts reported in the literature were very low, in the range of 0 —40/g (Karlson and Gunderson, 1965; Fanelli et al., 1965).
The coliform group has been widely used as an indicator of enteric pathogens. But the use of this index for food brought objections from some investigators. Since coliforms, not identified as E. coli, may not indicate fecal contamination, various pathogens may persist afterE. coli is destroyed and E. coli is destroyed in crushed onions, due to the presence of an antimicrobial factor which is the same compound responsible for onion pungency (Vaughn, 1951).
Many investigators suggested using enterococci instead of coliforms as an index for fecal contamination. The advantage of using enterococci, especially in dehydrated products, is that these organisms are more resistant to drying, high temperature, freezing, detergents, disinfectants etc. (Buttiaux and Mossel, 1961; Larkin et al., 1955). Although enterococci are normally present in mammalian feces, they have not been widely adopted as a fecal indicator for lack of proof that there is a correlation between their presence and that of E. coli (Niven,1963). On the other hand in certain raw foods the presence of enterococci is accepted as an indicator of poor microbial quality.
Any microorganism that serves as an indicator for fecal contamination should
not multiply in the specific food. In addition, it should be representative of fecal pathogens, easy to determine and less resistant than the pathogens to the process and storage of the product.
The use of enterococci, as compared to coliforms, as an indicator for sanitary conditions of dehydrated onions was evaluated in this work. Furthermore, the effect of dipping onions in brine solutions prior to dehydration on the microbial quality of the final product was tested.
MATERIALS & METHODSRaw onions
The variety used was a hybrid of white skinned Egyptian onions with Southport White Globe.Microbial counts
From each batch of onions, three samples were taken from different spots. Each sample contained about 300g of raw onions or lOOg of dried onions. Raw onions were prepared as follows: 50g raw onion were transferred to a 1 liter erlenmeyer flask containing 450 ml of sterile 0.5% K2S 03 solution. The aim of using K2 S03 was to inhibit the antimicrobial action of the onions (Wei et al., 1967). The erlenmeyer was shaken for 40 min, adequate dilutions were made and plates were poured in duplicate.
In the case of dried onions, lOg were transferred to a 250 ml flask containing 90 ml of a sterile K2 S03 solution. The flask was stored for 20 min in a refrigerator for rehydration and shaken for 30 min, dilutions were made and plates were poured in duplicate.Total plate counts
Total plate counts were made using Tryp- tone Dextrose Yeast extract agar and incubated at 30°C for 24—48 hr.Coliform
Coliform counts were made using Violet Red Bile agar (Oxoid No. CM 107) in a double layer and incubated at 37° C for 24 hr.Fungi
Fungi were plated on Potato Dextrose agar (Oxoid No. CM 139) and incubated at 30° C for 48 hr.Enterococci
Enterococci were enumerated by plating on the surface of plates containing Slanetz & Bartley medium (Oxoid No. CM 377) and incubated at 37°C for 48 hr.Pungency of onions
Pungency was evaluated by the method described by Schwimmer and Mazelis (1963) which determines thiosulfonates with N-ethyl- malimide, and by the method described by
Saguy et al. (1970) which is based on oxidation of volatiles by bichromate.Inoculation
Cubed raw onions were inoculated with cultures of A. aerogenes, enterococci sp. (not specified) and A. niger all isolated from raw onions and with a laboratory culture of E. coli type I. Inoculation was done by dipping the onions in suspensions of microorganisms. The counts of the suspensions were at least one order of magnitude larger than the native counts on the onions. Counts were made immediately and after 24 hr incubation at 25°C.Brine treatments
Washed and peeled onions were cubed, inoculated as described above, and dipped in 0%, 5%, 20% and saturated salt solutions for times varying from 5-60 min.Dehydration experiments
Experiments were carried out in a pilot plant and on an industrial line. The dehydration process in the pilot plant was carried out in a through-flow tray drier using 80° C as the temperature in the first drying stage for about 80 min. In the second stage 50°C for 7 hr was used and then the onions were transferred to a bin drier where final drying was accomplished at 40° C during 16 hr.
In the industrial line, the salt was added to the water used for fluming peeled cut onions to give a concentration between 0 and 4% in the brine. The dehydration process was carried out on a continuous “Buettner” belt drier.Storage
Dried cubed onions were stored in cans at 10, 20, 25 and 30° C for 12 wk. Every 2 wk two cans from each storage temperature were examined and the microbial counts were made. Influence of saturated steam
Whole raw onions were exposed to saturated steam (at atmospheric pressure) for times varying from 0 -30 min. Microbial counts were made before and after treatment. Cubed onions were exposed to saturated (atmospheric) steam for 10 min and then dried in the usual process. Microbial counts were made only after drying.
RESULTS & DISCUSSIONEnterococci vs. coliforms as an index for microbial contamination of dried onions
Table 1 shows that while E. coli practically did not grow on raw onion slices during a 24-hr period, A. aerogenes multiplied by 2.5—3 orders of magnitude and enterococci by about 2 orders of magnitude.
Table 2 gives the numbers of coliforms, enterococci and total count in
Volum e 3 9 (1 9 7 4 )-J O U R N A L O F FOOD SCIENCE-685

6 8 6 -J O U R N A L O F FO O D S C IE N C E -V o lu m e 39 (1974)
Table 1 —Rate of growth of microorganisms on raw onion slices held at room temperature
Numbers of bacteria3------------------------------------ bacteria
Type of bacteria 5 min 24 hr 24 hr/5 min
B. subtilis 3.2 X 10s 3.2 X 10s 10001.5 X 10s 1.2 X 10⁸ 800
E. coli 1.0 X 10⁷ 3.1 X 10⁷ 3.13.4 X 107 CO b X 107 0.9
A.aerogenes 1.5 X 10⁶ 2.5 X 10⁹ 17004.7 X 106 1.8 X 10⁹ 380
Enterococci CO b X 10s 1.5 X 10⁷ 502.5 X 10⁵ 2.0 X 10⁷ 74
a N u m b e r p e r g ram ra w o n io n
Table 2—Comparison of bacterial count of various types of bacteria in samples of commercial dried onion slices
Expno. Enterococci Coliform Total count
1 5.9 X 10⁷ 2.6 X 10³ 2.4 X 10s2 2.5 X 10³ 4.0 X 10³ 3.6 X 1043 4.2 X 10³ 2.0 X 10³ 3.5 X 1054 2.5 X 10⁷ 1.0 X 10³ 9.4 X 1045 2.8 X 10² 9.3 X 10² 4.8 X 1056 2.6 X 10³ 3.0 X 10³ 2.0 X 1047 1.5 X 10² 8.2 X 10² 2.5 X 10⁴
C o r re l a t i o n c o e f f ic ie n t : c o l i fo r m vs. e n t e r o c o c c i = 0 . 9 1 8 C o r re l a t i o n c o e f f ic ie n t : c o l i fo r m vs. to t a l c o u n t = 0 .2 2 1
seven samples of dried onions, taken at random from different production runs. A highly significant correlation between number of coliforms and number of enterococci was found but none with total count.
A one-way analysis of variance (ANOVA) was done to test the significance of the difference in microbial counts of cubed dehydrated onions stored at four temperatures for 12 wk. A significant difference was found; therefore a comparison of results of each pair of temperatures was made. Results of the analyses are given in Table 3. Results show that there was a significant difference between counts at 30 C and all
I0*C
T IM E (w««ka)
Fig. 1—Comparison of behavior of microorganisms stored at 30° C and 10° C.
o th e r temperatures. The difference between samples stored at 25 and 20 and 10°C was significant for coliforms and enterococci but not for total count. There was no difference between counts of samples stored at 10 and 20°C.
The results of counts at 10°C and 30°C are given in Figure 1. From above results it was seen that during storage of dry onion cubes at 30°C the number of microorganisms, of all tested groups, decreased significantly. Total counts and coliforms decreased rapidly, while enterococci were reduced at a much slower rate. The rate of death of coliforms during storage was found to be so rapid that even very contaminated sampies fit the specification after less than 3 months at 30°C. At lower storage temperatures (10 and 20°C), a lag period was observed for enterococci and coliforms but. not for total count.
The results of this work showed a significant correlation between number of enterococci and coliform on dry onions. In addition, it was found that the enterococci on raw onion slices multiplied slower than the coliforms at room temperature. The enterococci were also found to be much more resistant to storage. These findings indicate that in onions, enterococci may serve as a better index of the original contamination than the coliforms.
Effect of brineThe effect of dipping onions in diluted
brine on their microbial count was studied. Sliced onions were contaminated with the typical native microorganisms and then dipped in brine solutions at various concentrations. The initial numbers of E. co li were 107 — 108/g raw onions. In the first 5 min after dipping, most destruction of E. c o li occurred (Fig. 2). The influence of holding onions in the brine solution for longer periods was very small. In a similar manner the effect of brine on the fungi A . n ig er was studied. It was found that only about 6% of the fungi were affected by 5% brine after 1 hr of dipping.
Dipping onions in brine solutions of more than 5% caused the formation of a hard crust on the surface of the dried product. Therefore, in further experiments only brines with 5% salt or less were used.
The effect of brine on microbial counts at the various stages of the dehydration process are given in Figure 3. The influence of the brine, as compared with commercially used water fluming, increased with the dehydration process.
The results of 36 pilot plant dehydration experiments were subjected to analysis of variance using the BMD, 05V program (Biomedical Computer Programs) (Dixon, 1971), which performs an
Table 3—Analysis of variances of the effect of 12 wk storage of dried onion at four temperatures on the microbial counts
\ TempComparison
Type o f \ ____________________________ F valuescount \ 10/20 10/25 20/25 10/30 20/30 25/30
Total 0.98 0.73 0.01 8.2* 11.2** 9.75*Coliform 1.25 42.4** 29.6** 124.8* 103.2** 18.4*Enterococci 1.21 13.1 ** 7.21** 79.1 ** 65.3* * 60.2***P « 0 .0 5
**P « 0.01

M IC R O B IA L Q U A L I T Y O F D E H Y D R A T E D O N IO N S - 687
Salt an dry onlon(°/0)
Fig. 2 —Effect o f brine on E. coli.
drying drying drying
Fig. 4 —Effect o f brine concentration on conform and enterococci counts.
Salt on dry onion(°/o)
Fig. 3 —Effect of dipping in brine on microbial counts during the de- Fig. 5 —Effect o f brine concentration on fungi and total counts,hydration process.

6 8 8 -J O U R N A L O F FO O D S C IE N C E -V o lu m e 3 9 (1 9 7 4 )
Table 4—Analysis of variance for microbial counts
Total treatmentDegrees of freedom Fungi Coliforms Total count
Total dips 4 0.83 4,57* * * 9.36* * * *Brine 1% 1 0.15 0.12 2.01Brine 2 % 1 1.41 7.60* * 4.43**Brine 4% 1 0.002 2.43* 5.61 **Steam 1 9.23*** 6.22** 3.63**P « 0.1
* * P < 0 .05 * * * P < 0.01
* * * * P < 0 .001
Table 5—Influence of brine treatment on total and coliform counts
CountWithbrine
Withoutbrine
Ratiowithout
withAverage
ratio
Total 0.52 X 10² 0.88 X 10⁵
0.39 X 10" 0.16 X 10⁷
7.518.2
12!6
Coliform 0.52 X 10³ 0.13 X 10⁶
0.96 X 10⁵ 0.61 X 10⁷
18.446.9
32.6
ANOVA when there is a nonequal number in each group, namely, when the n u m b er o f observations for each combination of levels of factors is not the same. The ANOVA was done for the logarithm of the death ratios rather than for the death ratio itself. The reason for this was that a significant positive linear relationship was found between the mean value and the variance of the death ratios. Thus, in order to meet the requirements of homoschedasity, which is assumed in ANOV A the necessary variance stabilizing transformation was used, (i.e., the logarithmic function). The results of this analysis are given in Table 4. It should be noted that there were 20 degrees of freedom for the unexplained variance. A 2% brine was needed to obtain a significant reduction in the bacterial count. In order to estimate the amount of reduction in microbial counts, the raw onions were divided into two batches: one was treated with brine and the other remained untreated. Both batches were then dried under the same conditions. Death ratios obtained for each treatment were divided one by the other (Table 5). Dipping onions in brine prior to dehydration decreased the total count about 12-fold and the coliform counts about 32-fold. This treatment did not decrease the pungency nor impair the color or taste of the final product. Dehydration experiments of dipping in brine were performed also on industrial lines. Results (Fig. 4 and 5) showed the same trend as in laboratory tests and that the coliforms were more sensitive to above treatment than the enterococci.
Based on above results it is recommended to dip or flume peeled, cut onions prior to dehydration in a salt solution of 2—4%. The addition of salt in the dry product should not cause any problem since salt is a legal additive, it is cheap and onions are primarily used in salty products.Fungi in dry onions
Fresh raw onions contained about 103
fungi/g of raw onion. After a month of storage at room temperature (22°C) the count increased to 104 fungi/g. Most of the fungi growth was noted in the area between the dry onion skin and the surface below it.
Dry o n io n s contained between10—4500 fungi/g depending on degree of contamination of raw material. The reduction in number of fungi during the normal dehydration process was less than two orders of magnitude (Fig. 3). In order to reduce fungi count in contaminated onions the whole peeled onions were subjected to live steam for various times (Fig. 6). Saturated steam was effective in reducing fungi counts 10-fold in less than 10 min but had less effect on coliform counts and an even smaller effect on total count. Treating cubed
t i m e (m ir)
Fig. 6 —Influence of steam treatment on number of microorganisms.
onions prior to drying, with saturated steam for 10 min reduced the fungi and total counts of the final product significantly (Table 4). The improvement was 16-fold for total count and about 30-fold for coliform and fungi counts. No decrease in pungency in both chemical and organoleptic tests, was found due to this treatment. Storage of dry onion cubes for 12 wk at four different temperatures (Fig. 1) showed that the reduction of fungi during storage was very low: about 10-fold as compared with about 100-fold for coliforms.
REFERENCESButtiaux, R. and Mossel, D .A .A . 196 1 . The
significance o f various organisms o f fecal origin in foods and drinking water. J. Appl. Bact. 24: 353.
Clark, W.S. Jr., Reinbold, G.W. and Ram bo, R .S. 196 6 . Enterococci and coliform s in dehydrated vegetables. Food Technol. 20: 1353.
D ixon, W.J. 1971 . “ B.M .D. Biom edical C om puter Programs.” University o f California Press, Berkeley, Calif.
Fanelli, M.J., Peterson, A.C. and Gunderson, M.F. 1 965 . M icrobiology of dehydrated soups. 1. A survey. Food Technol. 19: 83 .
Firstenberg, R. 197 0 . Factcrs affecting the microbial flora o f on ion . Undergrad. Res. Thesis, Technion, Haifa (In Hebrew).
Karlson, K.E. and Gunderson, M.F. 1965. M icrobiology o f dehydrated soups. 2. “ Adding M achine” approach. Food T echnol. 19: 8 6 .
Larkin, E.P., L itsky, W. and Fülle, J.E. 1 9 5 5 . Fecal streptococci in frozen foods. Appl. M icrobiol. 3: 102.
Niven, C.F. Jr. 1953 . Microbial indexes o f food quality. Fecal streptococci. In “M icrobial Quality o f F ood s.” A cadem ic Press, N ew York.
Saguy, M., M annheim, C.H. and Peleg. Y . 1970 . Exam ination o f volatile on ion aroma and flavour com ponents. J. F ood Technol. (British) 5: 165.
Schwimm er, S. and Mazelis, M. 1963 . Characterization of Allinase o f Allium cepa (on ion ). Arch. Biochem . B iophys. 100: 6 6 .
Sheneman, J.N . 1973 . M icrobiology o f dehydrated onion products. 1. Survey o f aerobic m esophilic bacteria. J. Food Sei. 38: 206.
Vaughn, R.H. 1951. The m icrobiology o f dehydrated vegetables. Food R es. 16: 429 .
Wei, L .S., Siregam, J .A ., Steinberg, M.P. and N elson, A.I. 1967. Overcoming the bacteriostatic activity o f on ion in making standard plate counts. J. F ood Sei. 32: 346.
Ms received 8 /2 4 /7 3 ; revised 1 1 /2 5 /7 3 ; accepted 1 1 /2 9 /7 3 .

F. I. MEREDITH, M. H. GASKINS' and G. G. DULL USD A Russell Research Center, ARS, Athens, GA 30604
AMINO ACID LOSSES IN TURNIP GREENS (Brassica rapa L.) DURING HANDLING AND PROCESSING
INTRODUCTIONIN VIEW of a growing concern over nu tritional value of processed foods, we are studying the effect of handling and processing on levels of selected nutrients in fruits and vegetables produced in the Southeast. Considerable effort has been expended on studying the retention of nutrients in foods during canning with special emphasis being placed on the vitamins (National Canners Association,1955). We have found little inform ation on the effects of processing on essential amino acids in fruits and vegetables.
Very little is in the literature on the dietary habits of the American people. Ridlon (1916), does give the effects of the disease pellagra in which the consumption of vegetable and fat was prevalent while little animal protein was consumed. It is certain that some people still derive a sizeable portion of their daily protein intake from plant products. We have estim ated tha t a person consuming two 4-oz portions of turnip greens daily (Church and Church, 1969) might derive 10—25% of his protein intake from this source. In situations of econom ic disadvantage, this is not unrealistic as turnip greens are a prolific, easily-grown crop, less expensive than most other leafy vegetables, and a staple food in the southern United States. They are widely available bo th as fresh greens and as frozen and canned products.
The nature and extent of amino acid changes in fruits and vegetables during processing is our primary interest. An understanding of stages in a processing procedure, where amino acid losses occur, can be of value in defining specific problem areas in our nutrient delivery system.
Another reason for interest in amino acid patterns in vegetable proteins concerns a num ber of inborn m etabolic errors for which the recom m ended trea tment m aybe a diet low in a specific amino acid. Phenylketonuria is an example. A knowledge of foods which have low levels of specific amino acids would be necessary to prepare these diets.
1 Present address: U SD A -A R S, 304 Newell Hall, University o f Florida, Gainesville, Fla.
EXPERIMENTALMaterial
Turnip greens (variety Shogoin) were grown in the spring on a commercial farm in Colquitt County, Ga. Our samples were collected at several steps in the standard commercial harvesting, transporting and processing procedures. The greens were mechanically harvested, transported from the field in a farm wagon, and immediately afterward mechanically transferred to a large truck. As the greens were delivered into the truck on a conveyor belt, crushed ice was added to remove field heat and prevent spoilage during the overnight trip to the processing plant. The truck was loaded by about 6 p.m. During the night, the greens were transported approximately 200 miles to the processing plant for unloading early the next morning, some 14 hr after harvesting.
Field samples were collected from the harvester in the late afternoon, and additional samples were collected from the truck as it was unloaded at the processing plant. As the load moved through the plant, samples were collected after washing, after blanching, and off the canning line as the cans were filled. Nine 303 cans of the canned product were collected and combined into three samples consisting of three cans each. The origin of each set of samples is indicated in Table 1. All except the canned samples were frozen in dry ice as they were collected, and on arrival at the laboratory placed in storage at -34.4°C. The noncanned samples were freeze dried for 48 hr in a Vacu- dyne pilot plant freeze drier, ground with a1-mm screen in a stainless steel Wiley mill, and ball milled for 24 hr. After milling, they were stored over phosphorous pentoxide under vacuum until analyzed.
Canned samples were opened and allowed to drain for 10 min, and the solid and liquid portion were then freeze dried separately. The residues from the liquid samples were stored under vacuum with phosphorous pentoxide.
The freeze-dried solid samples were ground and stored in the same manner as the previous samples. Percent moisture was determined on all freeze-dried samples. Total nitrogen, fiber, ash and fat were determined by standard AOAC(1970) methods.Hydrolysis
Duplicate hydrolysates of each sample were prepared by a modified method of Moore and Stein (1963) by weighing 25 mg of sample into 25 ml ampules, adding 6N HC1 and freezing the sample in a dry ice-alcohol mixture. The frozen sample was thawed as vacuum was applied. The sample was refrozen and thawed with the vacuum at 10 millitorr or less and the ampule was sealed with a hand torch. The sample was placed in an oven at 110°C ± 1°C. After 22 hr, the sample was cooled and quantitatively transferred to a 4 5-ml centrifuge tube and dried under vacuum on a Buchler Evapo-mix Evaporator. Water was added and the sample was again dried. The sample was brought to volume by addition of sodium citrate buffer (0.2M sodium) containing 5 ml of thiodiglycol per liter, pH 2.20 ± 0.05, filtered through a Gelman metricel 0.45p filter and placed in storage at -23°C for amino acid analysis. The sample dilutor buffer contained norleucine and a- amino-/3-guanidine propionic acid hydrochloride as internal standards.Amino acid analysis
Amino acid analysis was carried out on a JEOL 6AH automatic amino acid analyzer equipped with a JEOL DK two-channel integrator, using the two-column method of Moore et al. (1958). A set of amino acid standards (Pierce Chemical Co.) was analyzed with each set of five experimental samples.
RESULTS & DISCUSSIONRESULTS of analyses perform ed at different stages of processing are presented in Table 1. The increase of fat, nitrogen
Table 1—Turnip green composition (dry wt basis) at different stages of processing
Where collected
Infield(1)
Unloadingdock(2)
Postwashing
(3)
Postblanching
(4)
At can filling
(5)
After thermal
processi nga (6)
After thermal
processi ngb(7)
Fat (%) 4.80 4.10 4.40 4.60 5.80 6.43 0.90N (%) 3.19 3.27 3.31 3.48 3.72 4.02 1.56Crude fiber (%) 10.18 10.30 11.56 11.06 11.76 14.19 0,39Ash (%) 12.10 14.10 12.40 10.90 9.20 6.42 19.03
a C an n e d so lid s b D ra in e d can n e d liq u id
Volum e 3 9 ( 1974)—JO U R N A L O F FOOD S C IE N C E -6 8 9

6 9 0 -J O U R N A L O F FO O D S C IE N C E -V o lu m e 3 9 (1974)
and crude fiber, and decrease of ash during processing, reflecting loss o f soluble m aterials during washing and blanching
operations, corroborate o ther reported observations (National Canners Association , 1955).
Table 2—Amino acid patterns for raw and canned turnip greens
Aminoacid
Where collected
Infield3
(1)
Unloadingdock(2)
Postwashing
(3)
Postblanching
(4)
At can filling
(5)
Afterthermal
processing1*(6)
Afterthermal
processing1(7)
Lys 95.70 99.89 82.78 104.18 114.27 47.39 22.45Met 33.02 32.05 27.43 33.53 34.09 21.82 2.89Phe 74.33 78.32 69.15 82.78 90.57 44.33 10.13Tyr 42.60 46.77 40.72 43.85 53.41 25.68 7.20Leu 140.36 148.24 130.14 154.83 167.30 86.67 16.39lieu 78.95 83.38 72.84 88.85 94.21 38.87 12.57Val 113.58 126.21 110.07 128.94 136.94 69.17 22.41Thr 93.54 100.54 85.06 101.00 108.01 53.45 23.56His 32.59 34.95 29.73 36.20 40.03 20.78 7.16Arg 72.24 78.78 65.03 76.20 88.93 39.60 13.69Asp 159.06 177.03 151.75 167.46 184.08 91.15 59.11Ser 98.10 101.63 88.94 102.88 11.50 54.37 12.03Glu 204.67 236.40 192.75 226.50 110.50 108.75 130.98Pro 74.46 84.50 79.40 93.27 102.38 54.03 12.03Gl y 166.24 172.58 147.59 173.92 186.98 98.25 38.37Ala 150.85 166.12 149.10 173.37 176.45 90.76 42.74Cysteic 4.21 2.82 2.97 3.14 3.37 .05 3.123 fiM a m in o acid per gram d ry w t b C an n ed so lid s c D ra in e d can n e d liq u id
Table 3—Percent essential amino acids and percent losses of essential amino acids in canned turnip greens3
Aminoacid
Canned product Net loss in canned product
% solid % liquid% if only
solids utilized% if liquid and solid utilized
Lys 49.5 32.1 50.5 27.0Met 66.1 11.7 33.9 25.2Phe 59.6 18.6 40.4 26.7Tyr 60.3 21.9 39.7 22.8Leu 61.7 15.9 38.3 26.6lieu 49.2 24.4 50.8 34.8Val 60.S 24.5 39.1 19.4Thr 57.1 30.5 42.9 17.7His 63.8 25.6 36.2 14.3
a Based upon the composition of the raw product
Table 4—Egg ratio of essential amino acids for raw and processed turnip greensEgg ratio X 100
After AfterAmino In Unloading Post- Post- At can thermal thermal
acid field dock washing blanching filling processing3 processing1* 6+7(1) (2) (3) (4) (5) (61 (7)
Lys 90 91 74 90 92 35 45 80Metc 78 72 62 59 72 41 12 53Phe 100 100 100 100 100 53 31 84Tyr 100 81 92 95 100 47 34 81Leu 100 100 93 100 100 51 25 76lieu 88 90 78 90 90 54 29 83Val 94 100 87 97 97 45 38 83Thr 100 100 98 100 100 51 59 100His 96 100 85 96 100 46 42 88
a Canned solidsDrained canned liquid
c Underscored numbers are limiting amine> acid
The essential am ino acid and eight nonessential amino acid patterns are given in Table 2. The amino acid concentration for samples 2, 4 and 5 increased as various water-soluble m aterial was lost. The loss of nitrogenous m aterial is indicated as being very small since the to ta l n itro gen in Table 1 and the am ino acid concentration in Table 2 generally increased in processing. No explanation can be given for the loss of am ino acids in sample 3. Data on tryp tophan are not included in this w ork since tha t am ino acid is destroyed during acid hydrolysis. Cystine was not found in these samples of turnip greens, but using the same analytical m ethod we have found cystine in other plant tissues. Cysteic acid, reported in Table 2, may represent an artefact arising from cystine. The concentration of all amino acids listed was lower in the canned than in the raw product. There was an additional loss of am ino acid- containing materials from the canned solids into the water added in packing.
Table 3 gives the percent of the essential amino acids in the raw product which were found in the canned solids and liquids. Also listed in Table 3 are the net losses o f amino acids in the canned product. Both sets of data are based upon the pM of amino acid per gram of dry wt in the raw product. If a person consum ed canned solid and liquid, he could expect to encounter am ino acid losses ranging from 14% (histidine) to 35% (isoleucine). In the canned product, 12% (m ethionine) to 32% (lysine) of the essential amino acids were found in the liquid. More than half of the lysine and isoleucine would be lost if the canning liquid were discarded.
The effect of these amino acid losses on the nutritional value of tu rn ip greens can be evaluated by com paring the ratio of the quantity of an essential amino acid in a food protein to the quantity of the respective amino acid in the same am ount of whole egg protein (Sheffner, 1967). These values, which are term ed egg ratios, are given in Table 4.
M ethionine is the limiting am ino acid in all cases if the canning water is considered a part of the food product. Because of the high am ount of isoleucine leached into the water used for filling the cans, isoleucine becomes the limiting amino acid in the food product if the water is discarded.
The chemical score (egg ratio o f the limiting amino acid) is greatly diminished if the canning water is not included as part of the food product. This em phasizes the im portance of using the packing water in preparing the food for table use.
Losses were generally negligible during all operations which preceded the rmal processing. While this is true in the present case, there is little basis for accepting this as a general rule. Harvesting and handling procedures are not uniform ,

A M IN O A C ID L O S S E S IN P R O C E S S IN G - 691
and in some instances serious deterioration occurs before processing. The crop m aterial used for this study was handled, bo th at the farm and at the processing plant, w ith appropriate concern for m aintenance of quality. However, we have noted spoilage of greens and other vegetable products, bo th in transit and after arrival at the processing plant, resulting from exposure to high tem peratures and/or delay betw een harvesting and processing.
Delay at the farm before icing, in transit from farm to processing plant, or at the plant before unloading and processing would perm it deterioration. At this time there are no form al specifications controlling these operations, and miscalculations which perm it spoilage are not uncom m on. Probably the am ount o f ice added at the tim e of transfer to the truck is the most im portant variable which can be used to protect quality (Vines and H endershott, 1969). The quantity of ice
required to remove field heat and m aintain m oderate tem peratures in the loaded truck is affected by the tim e lapse between loading at the farm and unloading at the plant, and by am bient tem peratures during th a t interval. Inadequate icing during loading cannot be corrected satisfactorily by top icing afterw ard, because top ice does not remove heat efficiently from the center o f the load.
The losses of amino acids are small during the initial processing steps; how ever, the losses in the canned m aterial are significant especially if the canning liquid is not consumed. It is im portant the consumer be made aware of the fact that a substantial am ount of the im portant nutritional food com ponents may be throw n away in preparation of the food for eating.
REFERENCES
AOAC. 1970 . “ O fficial M ethods o f Analysis,”
11th ed. A ssociation of Official Agricultural Chem ists, W ashington, D.C.
Church, C.F. and Church, H .N. 1 969 . “ Food Values o f Portions C om m only Used, Bowes and Church” p. 8 6 . J.B. Lippincott Co., Philadelphia, Pa.
M oore, S., Spackman, D.H. and Stein, W.H.1958. Chromatography of am ino acids on sulfonated polystyrene resins. An improved system . Anal. Chem . 30: 1185.
M oore, S. and Stein, W.H. 1 9 6 3 . Chrom atographic determ ination of am ino acids by the use of autom atic recording equipm ent. In “ M ethods in E n zym ology ,” V ol 6 , p. 820. Academ ic Press, New York.
National Canners A ssociation R eport. 1955. “ R etention o f nutrients during canning.” National Canners A ssociation, Washington,D.C.
R idlon, J.R. 1 9 1 6 . Pellagra. The value o f the dietary treatm ent o f the disease. Public Health R ept. 31: 1979 .
Sheffner, A.L. 196 7 . In vitro protein evaluation . In “ New er M ethods of Nutritional B iochem istry,” Ed. Albanese, A .A ., p. 125. A cadem ic Press, N ew York.
V ines, H.M. and H endershott, C.H. 1969. C om paction and temperature o f leafy greens, Assoc, o f Southern Agr. Workers 6 6 : 214.
Ms received 1 2 /1 5 /7 3 ; revised 2 /2 3 /7 4 ; accept- ed 2 /2 7 /7 4 .____________________________________
M ention of a specific trade name does not represent endorsem ent to the exclusion of equivalent equipm ent or material.

C.-C. A. LING ,' J. L. BOMBEN,2 D. F. FARKAS and C. J. KINGUSD A Western Regional Research Lab., ARS, Berkeley, CA 94710
HEAT TRANSFER FROM CONDENSING STEAM TO VEGETABLE PIECES
INTRODUCTION
TWO METHODS of blanching are widely used in food processing: ( 1) w ater blanching, in which the food is immersed in hot water and (2 ) steam blanching, in which the food is heated by condensing steam. Steam blanching leaches less from the product than w ater blanching (Melnick et al., 1944; Holmquist et al., 1954; Lee, 1958). However, it has been found that heating times are less with water blanching than with steam blanching (Melnick et al., 1944; Bakowski, 1971), even though processes using condensing steam usually have m uch higher surface heat transfer coefficients 1 8 0 0 -5 4 0 0 BTU/hr-ft2 °C (1 0 0 0 -3 0 0 0 BTU/hr-ft2°F ) than hot water 9 0 -5 4 0 BTU/hr- f t2oC (5 0 -3 0 0 BTU/hr-ft2°F).
Nusselt (McAdams, 1954) showed w hat effects the physical properties o f the vapor and the size and shape of the surface where liquid is condensing have on heat transfer in vapor condensation. Nusselt’s theory showed tha t steam velocity has a small effect on heat transfer, but any turbulence of the liquid has a marked effect.
McAdams (1954) concisely described the effects of noncondensable gases on the condensation of vapors:
“When a m ixture of a condensable vapor and a noncondensable gas is exposed to a surface colder than the dew point o f the m ixture, some condensation occurs. In the absence of dropwise condensation, a layer of condensate collects on the cooling surfaces, and a film of a m ixture of noncondensable gas and vapor forms next to the condensate layer, the concentration of vapor in the gas film being lower than in the main body of the mixture. As pointed ou t by Lewis, because of the difference in partial pressure of the vapor between the main body of the m ixture and that at the interface between gas and liquid films, the vapor diffuses from the main body through the gas film to liquefy at the interface . . . The rate o f condensation is thus governed by the laws of diffusion of the vapor through a film of noncondensable gas . . .”
In studying condensing heat transfer in the presence of a noncondensable gas, Sparrow and Lin (1964) pointed out that a buildup of the noncondensable gas at the interface decreases the effective therm al driving force; thus a large reduction in the rate of heat transfer may occur under these conditions.
A detailed description of the heat induced changes in the am ount of intercellular air in fresh vegetables was given by Crafts (1944). Heating expands the air forcing it to escape from the vegetable. Although the expulsion of gas is desirable, this flow of gas can affect heat transfer.
The rate o f tem perature rise in the center o f a cut vegetable piece has been used to determ ine the overall heat transfer rate (Lund et al., 1972). Changes in the rate of center tem perature rise can be attribu ted to changes at the surface of the particle, if all o ther conditions remain constant in and around the piece.
P r e se n t address: Dept, o f Food Science & Technology, University of W isconsin, Madison, WI 53706
2 Address any inquiries to this author.
Although there has been some work in the past measuring heating rates in food particles from condensing steam (Melnick et al., 1944; Bakowski, 1971; Lund et al., 1972), none has dealt with factors affecting the surface heat transfer coefficient o f a vegetable piece. Since steam blanching of vegetable pieces is very im portant to the vegetable canning and freezing industry, knowing what affects the heat transfer in this operation is valuable, and it may lead to processing improvements. This w ork examines in detail the effect of intercellular gas and steam velocity on steam heating.
EXPERIMENTAL
Heating systemThe experimental blanching system sketched in Figure 1 consisted
of a 6 ft long, 3 in. diam glass pipe in which steam flowed upward. To obtain a uniform steam flow at the vegetable piece steam flowed for 5 ft before it passed over the sample at the center of the pipe.
High quality steam was obtained from the Laboratory steam supply, and saturated conditions at atmospheric pressure were maintained by keeping the temperature of the pipe wall and steam at 100°C with electrical heating tape, thereby preventing condensation. Steam flow was controlled by a pressure reducing valve in the supply line, and it was measured by condensing the steam and determining the volume of condensate over a given time period. The inside diameter of the condenser was large enough so that there was no back pressure, and thus the steam at the sample was at atmospheric pressure. Steam velocities (up to 2.6 ft/sec) were calculated from the rate of condensation and the saturated steam conditions (100°C, 1 atm) in the pipe. To provide a high steam velocity (approx 100 ft/sec) a nozzle was used to direct steam over the product.Materials and pretreatment of materials
Carrots used for most of the heating experiments were carefully cut into rectilinear pieces 1.3 X 1.3 x 3.8 cm. Dimensions were measured with a micrometer before and after pretreatment and after heating.
The amount of noncondensable gas in the sample tissue was varied by three different pretreatments before heating: (1) degassing under vacuum, (2) equilibrating at atmospheric pressure, and (3) saturating
Fig. 1 -Sketch o f stem heating apparatus.
6 9 2 -J O U R N A L O F FO O D S C IE N C E -V o lu m e 3 9 (1974)

H E A T T R A N S FE R TO V E G E T A B L E PIECES—G93
with nitrogen at 1500 psig. For degassing, samples were placed in a flask which was evacuated with a vacuum pump for 15-20 hr at room temperature and 15 microns of mercury pressure. A thermocouple was inserted into the sample before degassing so that a minimum time (2-3 min) elapsed between the time the sample was removed from the vacuum and heated by steam. Wet cotton was put in the flask to reduce any drying of the sample. Nitrogen saturated samples were handled essentially the same way except that the samples were kept at 1500 psig (from a storage cylinder) and room temperature for 15-20 hr. The samples that were not degassed or pressurized were allowed to equilibrate at atmospheric pressure and room temperature.Temperature measurement
The center temperature of each sample was measured during heating by means of a 30-gauge copper-constantan thermocouple carefully placed in the center of each sample. Visual inspection showed that collapsed vegetable tissue formed a seal between the thermocouple and the piece, and thus steam penetration along the thermocouple was considered negligible. The size of the sample and the length of thermocouple wire in the sample dissipated the heat conducted in by the thermocouple (Lund et al., 1972). After each piece was heated it was cut open to insure that the thermocouple was at the center; temperature measurements from pieces in which the thermocouple was not found at the center were discarded.Experimental procedure
When the steam flow rate reached steady state, the sample was placed 1 ft from the top of the column using the thermocouple in the sample as a support (Fig. 1). A length of tubing was used to position the thermocouple and to assure that the sample was secured in a vertical position at the center of the column. This procedure required about1-2 sec. The starting time was noted on a strip chart recorder, and the center temperature of the particle was measured as a function of time. Vacuum degassed samples were exposed to air for 2 -3 min during transfer from the vacuum flask to the heating pipe; 5 min were required to transfer samples from the nitrogen pressure chamber.
All experiments at the same conditions were repeated at least three times, and were also repeated with raw material obtained at different times. The differences in heating rate with different pretreatments were reproducible in all samples.Data analysis
A surface heat transfer coefficient, assuming that it is constant, was calculated from the plot of center temperature versus time using Gurney-Lurie charts and the Newman method (McAdams, 1954). Details of the calculations are described by Ling (1973).
RESULTS & DISCUSSIONEffect of intercellular gas on heating rate
Figure 2 shows the center tem perature rise of carrot samples for three different pretreatm ents. The center tem perature of the vacuum treated sample had the fastest rate of tem perature change while the sample held under pressure had the slowest. For example, to reach a center tem perature of 88°C the sample at atm ospheric pressure required 105 sec, while that treated under vacuum required 100 sec.
Since the therm al conductivity of a porous solid depends on the void fraction, the pore size, and the fluid contained in the pores (Jakob, 1949), changes in it would require changes in the volume of the vegetable piece or its internal fluid. Changes in the volume of the piece large enough to account for the differences in center tem perature rise were not observed, nor did it seem likely tha t the p retreatm ent conditions would change the gas inside the piece in such a way as to affect the therm al conductivity. To insure tha t volume change during p retreatm ent or heating did no t account for the differences observed, balsa wood pieces were used in some experiments. The results o f these experim ents showed the same phenom ena as observed w ith carrots.
Denny (1946) reports values of 2.5 to 17.1 cm 3 of gas present in lOOg of sweet po ta to tissue at atm ospheric pressure. Goodman and Krase (1931) reported tha t the solubility of nitrogen is 1.07 cm 3/g o f water at 25°C and 1500 psig, as
com pared to 0.00186 cm3 /g of w ater at 25°C and atm ospheric pressure. Using this solubility data and assuming tha t carrot could dissolve as m uch nitrogen as the same weight of water, at 1500 psig a 100-g carrot sample would have 107 cm 3 of nitrogen. Hence in Figure 2 the slower tem perature rise in the sample saturated w ith nitrogen at 1500 psig results from at least six times the volume of gas as present in the sample equilibrated at atm ospheric pressure.
The surface heat transfer coefficient estim ated from a Gurney-Lurie chart is approxim ately 360 BTU /hr-ft2°C (200 BTU/hr f t2 °F) for the carrot sample equilibrated at atm ospheric pressure (Ling, 1973). This w ork postulates th a t this value of heat transfer coefficient is primarily determ ined by the presence of noncondensable gas in the vegetable tissue. The gas can mix w ith the steam to reduce the partial pressure of the steam and hence its condensing tem perature. Figure 3 is an idealized version of how noncondensable gas flows out of a vegetable sample and mixes w ith the flowing steam. The
Fig. 2 —Effect o f pretreatment on rate o f center temperature rise of carrot.
VEGETABLE PIECE WITH EQUIVALENT RADIUS r m
Fig. 3 -M odel o f a food particle heated by condensing steam.

6 9 4 -J O U R N A L O F FO O D S C IE N C E - Volum e 3 9 (1974)
steam-air m ixture at the sample surface has a lower steam partial pressure than pure steam, and thus the condensing tem perature will be less than 100°C. The lower surface tem perature results in a lower tem perature gradient between the surface and the center of the sample, and thus there is a slower rate of rise in the center tem perature.Heat transfer coefficient calculated from a model system
It is possible to calculate the surface heat transfer coefficient for the idealized system shown in Figure 3. The following assumptions must be made: (1) The particle is at steady- state; and (2) Correction to the mass transfer coefficient necessary for high mass transfer rates is negligible. The following equations can be used to represent the system (Bird et ah, 1960), where r m is the radius of a sphere equivalent to the volume of the particle being considered:
Ww - kx A (X\v - X\y0 ) + X\v0 (Ww — WA)
2k x rnc f D W A f
= 2 .0 + 0.6 / 2rmV .P ,\1i / Mf \ \
y F f J \PfDwAf/
Solving explicitly for Ww in Eq. (1) gives %
Wwlcx A (XWq - XWJ
+ Xw. W/
( 1)
(2)
Since there is no air in the incoming steam away from the particle,
XW„= l.
and
Ww = - k xA + XWo WA (3)
If only condensing steam provides heat, then a heat transfer coefficient can be defined as follows:
h =AHvap
AT(4)
Combining Eq. (3) and (4) gives
h =r x Wo w Ai ("AHvap-Lx A J L AT .
(5)
In order to calculate h from equation (5), WA must be known. For the purpose of this calculation it was estim ated using the following: (1) 0.17 cm 3 of gas/g of tissue which is a value reported by Denny (1946) for sweet po ta to ; and (2) the experim entally observed inform ation from this work that almost all gas was released in 20 sec. (The gas mixed with the condensate on the sample surface as a foam and was swept away by the steam .) Now WA can be calculated, and it is found tha t X\yQ WA / A < < k x . Therefore,
hA H v
AT (6)
Using a steam velocity of 1 ft/sec and a 1.3 x 1.3 x 3.8 cm vegetable piece, h = 92 BTU/hr-ft2 °C (51 BTU/hr-ft2 °F). Thus it is seen that the surface heat transfer coefficient can be quite low, and it could control the overall rate of heat transfer. Ling (1973) has the details of the above calculation.
As the heating continues and air is removed, AT = T0 — Tc decreases and therefore h increases until there is pure steam condensing on the surface. The surface tem perature, T0 , is determ ined by the air-water equilibrium relationship.
This calculation assumes steady-state, which requires that AT be constant (hence x W q is constant). The center tem perature rise of the particle requires solution of the unsteady-state heat conduction equation w ithin the particle w ith Eq. (6 ) used as the boundary condition. However, since the concept of discrete condensate and air films is an oversim plification, this would not necessarily lead to an accurate calculation of the center tem perature rise. A photograph of an apple piece at the start o f heating (Fig. 4) shows tha t the surface is an air-water foam. (Apple was used because the gas evolution showed more clearly in the photograph, but the conditions are typical of those observed with o ther vegetables and balsa w ood.) The theoretical description of such a surface condition requires knowledge about the properties of air-watsr foams form ed under these conditions.
Steady continuous flow of intercellular gas over a period of 6 0 -9 0 sec (typical heating tim e in blanching) was no t seen. Experim ental observations indicated tha t most o f the gas left the inside of the particle in 10—20 sec, and then it mixed w ith the condensate on the sample surface as a foam until it was swept away by the steam.
The curves in Figure 2 also suggest that the intercellular gas was removed from the vegetable tissue early in the heating process. A fter 50—60 sec of heating the slopes o f all three heating curves were approxim ately equal, indicating the same heating rate for the three samples. Therefore, any differences in the overall heating rates were due to initial differences. The slight difference in slope for the pressure treated sample is unexplained.Effect of steam flow rate
Figure 5 shows that there was no difference in the heating rate when the steam velocity was varied up to 2.6 ft/sec.
Fig. 4—Photograph o f apple piece heated by condensing steam.

H E A T TR A N S FE R TO V E G E TA B LE P IE C E S -6 9 5
However a high steam velocity of 100 ft/sec, produced w ith a nozzle, gave a higher overall heat transfer rate. The flow pattern produced w ith a nozzle is much different than that of steam flowing in a pipe, and this difference may have caused the increased rate of tem perature rise; nevertheless the slight difference for a large increase in velocity indicates that the heat transfer coefficient is, at least, not very dependent on steam velocity. The reason for this insensitivity to changes in steam velocity is not clear since the movement o f steam through the noncondensable gas film should be affected by the steam velocity even in laminar flow. It is possible that the rate of heat conduction through the foam layer is limiting, and the thickness and structure of the foam layer are not affected at the lower steam velocities.
This work showed tha t the rate of heat transfer to a vegetable piece during steam heating can be increased by vacuum pretreatm ent and decreased by pressure pretreatm ent. Presumably the flow of gas from the food piece reduces the partial pressure of steam at the surface, which then has a lower tem perature. Thus there is a lower tem perature difference between the surface and the center of the particle, and a lower heating rate results.
Experiments showed tha t steam velocities up to 2.6 ft/sec did no t appreciably affect the rate o f heat transfer. When a nozzle was used, the velocity of 100 ft/sec gave a small increase in heat transfer coefficient. Steam flow rates in steam blanchers must be matched to the product feed rate to prevent excessive steam loss at the ends of the blancher. One pound of product entering at 21 °C and heated to 93 C in 1 min requires 0.13 lb of steam, which at 100 C and atm ospheric pressure has a volume o f 3.5 f t3 Assuming a belt loading of 2 lb /f t 2 the superficial steam velocity through the product would be 0.12 ft/sec, which is in the lower range of the velocities examined in this work. Recently a blancher was designed which made use of nozzles to increase steam circulation (Havighorst, 1973); however, no data were provided about steam velocities through the nozzles, or w hat effect these nozzles had on blanching times.
The results of this w ork indicate tha t some means of degassing the vegetable particles before entering the steam
Fig. 5—Effect o f steam flow rate on center temperature rise of carrot.
blancher would reduce the heating tim e much more effectively than increases in steam velocity. Commercial size equipment for continuous degassing during water blanching has been described (Anon., 1958). It may be possible to apply a similar technique prior to steam blanching.
The results of this research may have applications to processes other than blanching. In the sterilization of particulate foods for aseptic packaging the tim e to reach a specified tem perature must be well-known and reproducible. To insure the safety of the product the effect of gas in the particle must be predictable, or the product must be degassed before sterilization.
NOMENCLATURE
Symbol Description
A Surface area of particleCf Molar concentration of gas at interfaceDWa £ Binary diffusion coefficient for water and
air evaluated at interface temperature h Surface heat transfer coefficient between
steam and piece being heated kx Mass transfer coefficient for water and airrm Normal distance from midplane to surface,
or equivalent radiusTc Center temperature of sampleTm Temperature of steamT0 Initial temperature of particle being heated,
or gas-liquid interface temperature V« Bulk velocity of steamWA Noncondensable gas flow rate from pieceWw Water vapor flow rate toward pieceX\ff Mole fraction of water vapor at interface
of particle being heatedXWoo Mole fraction of water vapor in the bulk
of the steamAHvap Heat of vaporization of water Pf Viscosity of steam at the interfacePi Density of steam at the interface0 Time from start of heating
REFERENCESA nonym ous. 1958 . This continuous vac-blanching setup improves
color, flavor o f vegetables. Food Eng. 30(7): 197.Bakowski, J. 1971. A study of the effect o f blanching conditions on the
color o f green vegetables, as a basis for improving their utilization. Final Technical R eport, Research Institute o f Vegetable Crops, Skierniewice, Poland.
Bird, R .B., Stewart, W.E. and L ightfoot, E.N. 1 960 . “ Transport Phenom ena,” p. 641. John Wiley & Son, Inc., New York.
Crafts, A.S. 1944. Cellular changes in certain fruits and vegetables during blanching and dehydration. Food Res. 9: 442.
D enny, F.E. 1946 . Gas content o f plant tissue and respiration measurem ents. Contributions from B oyce Thom pson Institute 14(4): 257.
G oodman, J.B. and Krase, N.W. 1931 . Solubility o f nitrogen in water at high pressures and temperatures. Ind. Eng. Chem. 23: 401.
Havighorst, C.R. 1973. Venturi tubes recycle heat in blancher. Food Eng. 45(6): 89.
Holmquist, J.W., Clifcorn, L.E., Heberlein, D.C. and Schm idt, C.F. 1954. Steam blanching of peas. Food Technol. 8: 437.
Jakob, M. 1949 . “ Heat Transfer,” V ol 1. John Wiley & Son, Inc., New York.
Lee, F.A. 1958. The blanching process. In “ Advances in Food Research,” V ol 8, p. 63. Academ ic Press Inc., New York.
Ling, C.-C.A. 1973. Variables affecting heat transfer in blanching. M.S. thesis, Univ. o f Calif., Berkeley.
Lund, D .B ., Bruin, S. Jr. and Lazar, M.E. 1972. Internal temperature distribution during individual quick blanching. J. Food Sci. 37: 167.
McAdams, W.H. 1954 . “ Heat Transmission.” McGraw-Hill Book Com pany, Inc., New York.
Melnick, D ., Hochberg, M. and Oser, B.L. 1944 . Comparative study of steam and hot water blanching. Food Res. 9: 148.
Sparrow, E.M. and Lin, S.H. 1964. Condensation heat transfer in the presence o f a noncondensable gas. Trans. ASME, J. Heat Transfer 86 : 430.
Ms received 9 /8 /7 4 ; revised 1 /2 8 /7 4 ; accepted 1 /2 9 /7 4 .This paper is taken from the thesis subm itted by one of the authors,
C.-C.A. Ling, in partial satisfaction o f the requirem ents for the M.S.degree in F ood Science from the D ept, o f Nutritional Sciences, University o f California, Berkeley.
Units
ft2lb-moles/ft3
ft2/hr
BTU/hr-ft2 °C lb-moles/ft2 hr
ft°C°C
°Cft/seclb-moies/hrlb-moles/hr
BTU/lb-mole lb/ft sec lb/ft3 hr

G. E. BROWN, J. L. BOMBEN, W. C. DIETRICH, J. S. HUDSON and O. F. FARKASUSD A Western Regional Research Lab., ARS, Berkeley, CA 94710
A REDUCED EFFLUENT BLANCH-COOLING METHOD USING A VIBRATORY CONVEYOR
INTRODUCTIONBLANCHI NG AND COOLING are necessary steps in the processing of most frozen vegetables. Current practices involve steam or water blanching, and flume, water-spray, or air cooling, or a combination of these. A good blanching and cooling process should have a high heat efficiency, occupy little space, maintain product quality and have little or no liquid effluent.
Commercial steam blanchers now fall short of these goals in several respects. They allow steam to be wasted at the inlet and outlet, allow air infiltration (which lowers the interior temperature), and increase effluent by condensation on uninsulated walls. A steam blancher with water-sealed ends has been described (Havighorst, 1973), but steam conservation is achieved at the cost of increased water usage and effluent. In addition, wire mesh blancher belts are hard to clean, and the return portion of the belt either enlarges the size of plenum (internal return) or necessitates additional heating (external return). Finally, steam blanchers occupy more floor space than wáter blanchers for comparable capacity.
Water blanchers with recycled hot water are more efficient in the use of energy than steam blanchers, but may cause severe solids leaching (Lund, 1972, 1973; Ralls et al., 1972a). Hot gas blanching reduces effluent to a negligible quantity, but requires more energy than steam blanching and may cost 2—10 times as much (Ralls et al., 1972b). Microwave blanching has no effluent, but the large capital costs and low energy efficiency make it much more expensive than conventional blanching (Ralls et al., 1972a; Decareau, 1972).
Individual quick blanching (IQB) has shown promise for decreasing blancher effluent while maintaining high yield and product quality (Lazar et al., 1971). IQB consists of heating food pieces rapidly in a single layer to a mass average temperature effective for enzyme inactivation. The pieces are then held adiabatically in a deep-bed second stage until equilibrium temperature is reached within each piece and enzymes are inactivated. Further reduction in leaching and waste effluent can be achieved by partially warming and drying the food surface with air before the steam heating step (Bomben et al.,
1973). However, blanchers of conventional design used for IQB do not conserve floor space and effluent volume is about the same as the best commercial practice with steam blanchers. Conventional IQB with pre-drying would occupy more space and use more energy than conventional steam blanchers although it would reduce effluent.
Most cooling after blanching is done in flumes or by water sprays. Both cause leaching and generate considerable effluent volume. Recently air cooling has been installed in some plants (Coffelt and Winter, 1973; Smith and Robe, 1973). Water sprays are needed with air cooling to prevent a large weight loss in the product. Some of this water becomes effluent. At present, no data are available on the amount of effluent produced with
com m ercial air cooling installations supplemented with water sprays.
The objective of our work was to demonstrate means of achieving a lower cost, less polluting, blanching and cooling method. Product throughput, relative to floor space occupied, should be higher than that achieved by the best commercial steam blanchers, and effluent, steam consumption and leaching loss should also be lower. Steam blanching was chosen as having more potential for improvement than water, hot gas, or microwave blanching.
EXPERIMENTALEquipment
Heater. A solid surface vibrating conveyor (Fig. 1) was chosen as the basic heat transfer
Fig. 1—Inside o f blancher showing coil and tray.
6 9 6 -J O U R N A L O F FO O D S C IE N C E -V o lu m e 3 9 (1974)

V IB R A T O R Y C O N V E Y O R B LA N C H -C O O LIN G —697
system for the blancher. Solid surface vibrating conveyors avoid return belts, can be stacked close together, and are easy to clean. An elec- tromagnetically driven variable amplitude Syntron (Type EB01C) circular conveyor was used. This conveyor operated with a motion that impelled the pieces upward and forward at 3600 strokes per minute. Two conveyor trays were stacked with a downcomer connection so that the product flowed around one tray, dropped through the downcomer, and flowed around the other tray to the outlet. The amount of tray space used could be varied by varying the feed point and the downcomer posi
tion. The cylindrical design was chosen because it could be easily scaled-up in diameter and/or in height. Each tray is 13-1 /4 in. in diam and has an effective surface of 0.8 ft2. The lower tray is directly below the tray shown and another steam distributor between trays completes the unit.
The unit was insulated and product was fed from a hopper attached directly to the steam plenum to reduce steam and heat losses. Steam loss was prevented by the column of feed material in the hopper and the holding section, as shown in Figure 2.
Holder. The hold section consisted of an
insulated flexible rubber tube 6 in. in diam and 10 in. high, attached to the heating section plenum. The heated product, after it passed over a screen to separate blancher liquid, dropped into the tube. The level of the product in the holding section was measured with the dip stick shown in Figure 2. The bulk density of the vegetable pieces, the holder cross sectional area and the feed rate were used to calculate a dipstick setting to obtain a proper residence time in the holder.
Cooler. Blanched product was cooled by spreading in a single layer on a 4 ft long by 2 ft wide rubber conveyor belt. Air into which blancher liquid was atomized was passed co- currently over the product. The liquid was screened through approximately 30 mesh cheesecloth after leaving the blancher, then fed directly to the atomizing nozzle. All liquid from the blancher was used in this manner. The entire unit is shown in Figure 3.Procedures
The unit was tested with 3/8-in. carrot dice (variety unknown), green peas (sizes 4, 5 and 6, Neptune variety) and green beans (1-in. cross cut, mixed sieve size, Galagreen variety) to evaluate uniformity of flow, throughput, heater residence time, holder residence time, yields and effluent characteristics. The uniformity of flow was tested with 3/8-in. carrot dice using slugs of dyed carrot dice as tracers introduced into the feedstream of carrot dice. The output was sampled at uniform time intervals and the tracer content observed. Carrots were used for this study because they seemed to flow less smoothly than the other products.
Steam flow rate through the steam coils was calibrated by measuring the condensate from the coils immersed in water and measuring the temperature rise of the water at various steam input pressures. Steam input to the blancher could then be set at any predetermined point by varying the steam pressure.
Unblanched, washed and screened green peas and green beans were obtained in 400-lb lots from Patterson Frozen Foods, Patterson, Calif. They were mixed with ice and transported in insulated containers to the laboratory. Experiments were done 24-96 hr later. Conventional blanching and conventional water cooling procedures were included for comparison. Green beans for taste testing were blanched and cooled within 36 hr after collection as follows:(1) Blanching in vibratory steam blancher at
100° C with a 45 sec hold and cooling with air containing atomized blancher liquid.
(2) Blanching as in (1) but cooling with air containing atomized fresh water instead of blancher liquid.
(3) Blanching as in (1) but 3-lb portions cooled for 1.5 min with stirring in five times their weight of water to simulate flume cooling.
(4) Blanching in 100° C steam for 105 sec (shortest time used commercially) followed by simulated fluming as in (3).
(5) Blanching with the product in a nylon mesh bag in boiling water for 105 sec followed by simulated fluming as in (3).Samples (1) through (5) were frozen in a
blast freezer at -29° C for 1 hr. A sample commercially processed and frozen by Patterson Frozen Foods was included for comparisons.
Samples of effluent were taken from the blancher and cooler during each run and product was sampled at each stage of the process.
Fig. 2 —Schematic o f blancher and holding tube.
Fig, 3 —Overall view o f biancher-cooler unit.

&Q8—JO U R N A L O F FO O D S C IE N C E -V o lu m e 3 9 (1974)
1009080
atui(J 70 <“ 6C S'? 505 40
3C 20 10 0
0 1 2 3N O RM ALIZED TIME ( t / t )
Fig. 4 —Typical result of a tracer experiment to measure uniformity o f flow in the blancher.
Table 1—Operating conditions in heater and holder
Heat time Hold time % Excess3 Max feed rateCommodity (sec) (sec) steam used (lb/hr-ft2 )
3/8 in. carrot dice 22 60 25 260Green peas 20 60 19 3401 in. cut green beans 45 45 7 160
3 E q u a ls p e rc e n t ove r th e o re t ic a l s team c o n s u m p t io n . T h e o re t ic a l steam c o n su m p t io n fo r a 1 6 ° C in it ia l te m p e ra tu re and a 1 02 C f in a l m ass average te m p e ra tu re is 1 3 .8 lb /1 0 0 lb feed .
.Samples were analyzed for total solids by AOAC method 20.010 (AOAC, 1965). Chemical oxygen demand (COD) of the effluent samples was estimated using a Beckman Total Carbon Analyzer (Model 915) (APHA, 1965).
Peroxidase and chlorophyll levels in the frozen products were measured according to the methods of Dietrich and Neumann (1965). Taste testing was done under lighting conditions designed to minimize visual comparisons. Flavor differences were determined by ranking the samples in order of their most natural flavor or least off flavor. Duo-trio tests were made on samples from treatment (1) vs. those of treatment (4) and those commercially frozen at Patterson.
The green bean samples for flavor comparison were also analyzed for Vitamin A, by the method of Knuckles et al. (1972), for Vitamin C by the method of Freed (1966b), for niacin by the method of Snell et al. (1941), for riboflavin by the method of Johnson (1948), for thiamine by the method of Freed (1966a), and for minerals by X-ray fluorescence (Reuter and Raynolds, 1974).
RESULTS
FIGURE 4 shows the results of a distribution of residence times obtained during a typical experiment using a plug of dyed carrod dice to measure the uniformity in product residence time. The experiment was repeated six times to insure accuracy. The input has been superimposed on the output to compare uniformity. Output was found to be quite close to plug flow. At worst, a very small fraction of carrot dice (about 0.1%) may stay in the heater up to twice the average residence time.
Table 1 shows the heating times, holding times, feed rates and steam consumption for carrots, peas and snap beans. Results are the averages of three or more runs. Steam consumption is expressed as the percentage by which it exceeds the theoretical amount required. Theoretical steam consumption is about 13.8 lb steam per 100 lb feed if the feed enters at 16 C and is heated to a mass average temperature of 102°C. The feed rates are
in lb/hr-ft2 of vibrating surface actually used in the heater. In some runs the residence time in the heater was adjusted by varying the feed point, therefore, the entire surface was not always used. The figures for green beans and carrots are the highest rates used, but are not necessarily the highest rates possible.
The yields for green peas and green beans are shown in Table 2. It should be emphasized that the data for solids losses for peas during conventional water and steam blanching are for blanching only.
Flume cooling would probably contribute a loss equal to or greater than the solids loss in blanching. Data from the literature were chosen to represent the lower range published values.
The characteristics of the effluent from pea and green bean blanching are shown in Table 3. Again, it should be noted that data from other work was chosen to represent the lower range of COD and effluent values reported in the literature. No data were available for flume cooling after conventional water
Table 2—Comparison of yields and solids loss in effluent from different methods of blanching and cooling.
Peas Green beans
Gross yield*2 Solids lossc Gross yield*2 Solid losscType blanch-cool <%) (%) Reference <%) (%> Reference
This work 88 1.8 91 1.0IQB-water spray cool3 82 2.2 Bomben et al. (1973) 98 1.7 Bomben et al. (1973)Circular vibrating 91 6.6 This work 95 5.2 This work
blancher-water cool Conventional water 3.43 Lund (1972, 1973) 96 6.1 Ralls et al. (1972a)
blanch-flume cool Conventional steam 3.3a Lund (1972, 1973) 95 5.7 Ralls et al. (1972a)
blanch-flume cool
3 B la n c h o n ly , no d a ta on c o o lin g b G ro ss y ie ld = w t o f p ro d u c t/w t o f feedc S o lid s lo ss = (% so lid s in e f f lu e n t X w t o f e f f lu e n t )/ (% so lid s in fee d X w t o f fee d )

V IB R A T O R Y C O N V E Y O R B L A N C H -C O O L IN G -6 9 9
and steam blanching of peas so the am ount of effluent and COD would also be lower.
Taste tests done on green bean samples showed no significant differences among any of the samples, whether IQB, steam or water blanched or whether cooled in air containing atom ized blancher liquid, by water spray, or by flume. There were no significant differences in vitamin, mineral, or chlorophyll levels among the various green bean samples and all showed sufficiently low peroxidase levels.
DISCUSSION
THE RESULTS show that a blancher using vibrating conveyors, product seals, and atom ized blancher liquid for cooling can give significant reductions in effluent volume and solids loss over other blanching and cooling m ethods while providing uniform heat treatm ent.
While reliable commercial data on steam usage are lacking, the 90% or better steam efficiency achieved by our m ethod is far higher than th a t estim ated for commercial steam blanchers.
The heating section perform ed especially well, w ith heating times equal to or slightly less than those achieved for the same mass-average tem perature as in earlier IQB w ork (Bomben et al., 1973). The loading of 340 lb /h r-ft2 of tray area for peas, a t least tw ice th a t on previously used wire mesh conveyor belts, was due to the close packing which occurs naturally on a vibrating conveyor and the use of about 1-1/2 layers rather than a mono- layer. Throughput at this loading was lim ited by the small (300 w att) vibrator m otor which in tu rn lim ited the velocity of travel. About one-half o f the available conveyor tray area was used because of this velocity lim itation. A larger vibratory
could possibly double throughput by using all o f the available tray area.
The tube used for holding gave a uniform holding time. The high volume throughput of 2600 lb /h r and low sur- face-to-volume ratio of the tube as compared to a belt conveyor reduced heat loss and considerably reduced the size of the holding section for IQB blanching.
The use of blancher liquid for cooling resulted in a substantial reduction in total effluent. Runs using air cooling w ithout using an atomized spray gave about double the effluent volume and 50% more to ta l COD because the blancher liquid was not reused in the cooler. It is assumed that the reduction was due to reabsorption and evaporation of the liquid as no buildup of effluent in the equipm ent was observed.
While some mist did remain in the air out of the cooler, a materials balance showed tha t only very small am ounts of solids could be in this mist. The exhaust air could be passed out a stack as in some current spray coolers. Weight losses due to evaporation in the air cooling w ithout spray were about 5% greater on a fresh weight basis than weight losses with a spray.
Tables 2 and 3 show tha t the reduction in effluent volume, COD, and solids loss was dramatic. The lower gross yield in the new unit may have been due to some dehydration taking place on cooling.
A preliminary estim ate of the steam, water, effluent and power costs of the system as compared with existing systems was made using the following assumptions. Water costs (cost o f water plus cost of treating effluent and COD surcharge) are assumed to be $0.40 per 1000 gal of
water and $0.02 per lb of COD. Electrical costs are assumed to be $0,015 per kw-hr. The steam cost assumed is $1.00 per 1000 lb of steam. This was done only as a highly preliminary m ethod of com paring these aspects of the various systems to identify possible advantages of the new system.
A cost analysis for peas is shown in Table 4. A 3 hp m otor on a 5 ton per hour commercial conveyor belt blancher is assumed. The vibratory unit used 1 w att-hr per pound per hour of throughput. Steam costs are calculated based on an efficiency of 50% for commercial steam blanchers. A 90% steam efficiency was assumed for the vibrating blancher based on work herein presented. The lower efficiencies for carrots and peas in Table 1 are due to lack of operating experience in early runs. Efficiency is the theoretical steam required as percent of actual steam used. Water blancher steam costs are based on the energy needed to heat up the water used, assuming 100% efficiency. The data for water and steam blanchers are from various sources and were chosen as typical values or ranges of values (Lund, 1972, 1973; Ralls et al., 1972a, b; Bomben et al., 1973; Weckel et al., 1968).
A similar analysis for green beans showed about a $0.25 per ton saving in effluent water and steam costs when com pared to a Scotts tubular blancher (Lund, 1973) with large reuse of water or an $0.80 per ton saving over a steam blancher.
There are still im portan t unknowns which preclude the design of the heating and cooling sections for a larger unit. These include estimates of reasonable product velocity in a larger unit, and tray spacings which can be used. If the loading of 340 lb /hr-ft2 or even half this loading can be achieved on a larger scale, the
Table 3—Comparison of effluent from different types of blanching and cooling
Peas Green beans
TypeCOD
(lb/100 lb feed)Effluent
(lb/100 lb feed) ReferenceCO Dc Effluent
(lb/100 lb feed) (lb/100 lb feed) Reference
This work 0.16 9.6 — 0.04 4.3 -Circular vibrating
blancher-flume cool0.54 17 blanch
600 coolThis work 0.25 15.9 blanch
588 coolThis work
IQB-water spray cool
0.40 18 blanch 4.2 cool
Bomben et al. (1973)
0.25 31 blanch 100 cool
Bomben et al. (1973)
Conventional steam blanch-flume cool
0,83b 20.2b Ralls et al. (1972a)
0.35 19.7 blanch 480 cool
Ralls et al.(1972a),
Lund (1972, 1973),
This workConventional water
blanch-flume cool0.76ab 40— 180b Lund (1972,
1973)0.32 29 blanch
490 coolThis work
a Based on B O D ; Se e W e c k e l, e t a l. (1 9 6 8 ) b B la n ch o n ly , no d a ta on co o lin g c E s t im a te d f ro m to ta l ca rb o n

7 0 0 -J O U R N A L O F FO O D S C IE N C E -V o lu m e 3 9 (1974)
Table 4—An estimate of water, steam, effluent and electricity costs for various blanching and cooling methods for frozen green peas
CQ Da
Type blanch-cool
Water and effluent
Amount(lb)
Cost disposal
($/ton raw product)
Electricity Steam
Volume(gal)
Cost($/ton raw product)
Cost($/ton raw product)
Cost($/ton raw product)
Water-spray 420-1040 $0.15-0.40 34a $0.70 $0,007 $0.80-1.20Water-flume 880-1500 0 .30-0 .60 38a 0.80 0.007 0 .80-1 .20Steam-spray 100 0.04 15 0.30 0.007 0.50Steam-flume 560 0.20 20 0.40 0.007 0.50Blancher-cooler 23 0.009 3.2 0.06 0.030 0.30
modulea Som e values estim ated by total carbon
floor space savings would be substantial, when one considers the space savings inherent in the spiral or circular design. The hold tube capacity of 2600 lb/hr-ft3 could probably be maintained on a larger scale.
In conclusion, we have demonstrated the use of a vibrating conveyor, vertical hold tube, blanching-cooling unit using product seals on the inlet and outlet. The system has the potential for significant reductions in effluent, steam use, and operating costs over conventional blanch- ers. Green beans blanched and cooled by this method had no significant difference in flavor, texture, or retention of five vitamins or nine minerals when compared to those processed by conventional methods.
REFERENCESAOAC. 196 5 . “ Official M ethods of A nalysis,”
10th ed, p. 308. Association of Official Agricultural Chemists, Washington, D.C.
APHA. 1965 . “ Standard M ethods for the Exam ination of Water and W astewater,” 13th ed, p. 257 . American Public Health A ssociation, New York.
Bom ben, J.L., Dietrich, W.C., Farkas, D .F., Hudson, J.S., De Marchena, E.S. and San- shuck, D.W. 1973 . Pilot plant evaluation of
individual quick blanching (IQB) for vegetables. J. Food Sci. 38: 590.
C offelt, R.J. and Winter, F.H. 1973. Evaporative cooling of blanched vegetables. J. Food Sci. 38: 89.
Decareau, R.V. 1972. The process o f micro- wave blanching. Food Production/M anage- m ent 95(5): 12.
Dietrich, W.C. and Neum ann, H.J. 1965 . Blanching Brussel sprouts. Food Technol. 19(5): 150.
Freed, M. 1966a. “ M ethods o f V itamin A ssay,” p. 12 7 . Interscience Publishers, New York.
Freed, M. 1966b . “M ethods of Vitamin A ssay,” p. 320 . Interscience Publishers, New York.
Havighorst, C.R. 1973. Venturi tubes recycle heat in blancher. Food Engr. 45(6): 89.
Johnson, B.C. 1 948 . “M ethods of Vitamin D eterm ination,” p. 58. Burgess Publishing Co., M inneapolis, Minn.
K nuckles, B.E., B iekoff, E.M. and Kohler, G.O.1972 . J. AOAC 55: 1202.
Lazar, M.E., Lund, D.B. and Dietrich, W.C. 1971 . IQB: A new concept in blanching. Food Technol. 25: 684.
Lund, D.B. 1972 . A field study on the application o f individual quick blanching. Proceedings o f the 3rd National Sym posium on Food Processing Wastes, N ew Orleans, La., E n v ir o n m e n ta l Protection Technology Series EPA -R 2-72-018, p. 71.
Lund, D.B. 1 973 . Im pact o f the individual quick blanch (IQB) process on cannery w aste generation. Food processing waste management. Cornell University, Ithaca, NY 14850 .
Ralls, J.W., Maagdenberg, N .J., Y acoub, N.L. and Mercer, W.A. 1972a. Reduced waste generation by alternate vegetable blanching system s. Proceedings o f the 3rd National Sym posium on F ood Processing Wastes, New Orleans, La., Environm ental Protection
Technology Series E PA -R 2-72-018, p. 25. Ralls, J.W., Maagdenberg, H .J., Y acoub, N.L„,
Zinnecker, M.E., Reim an, J.M., Karnath,H.O., H om nick, D .N . and Mercer, W.A. 1972b. In-plant hot-gas blanching o f vegetables. National Canners A ssociation Publication D -2614.
Reuter, F.W. and R aynolds, W.L. 1974 . “Metal Analysis in Biological Material by Energy Dispersive X-ray F luorescence Spectroscop y .” Proceedings o f Sym posium on “Protein-M etal” Interactions. Ed. Friedman, M. Plenum Press, New York. In press.
Snell, E.E. and Wright, L.D, 1941. J. Biol. Chem. 139: 675 .
Sm ith, W.L. and R obe, K. 1 9 7 3 . Saves 300—400 gpm water, im proves vegetable quality. Food Processing 34(3): 36.
Weckel, K.G., Ram bo, R .S ., V eloso , H. and von Elbe, J.H. 1968 . Vegetable canning process wastes. Research Report N o. 38 , Research Div., College o f Agricultural & Life Sciences, University o f W isconsin, M adison, WI.
Williams, R.T. 1973 . Personal com m unication on proposed rates o f East Bay m unicipal u tility district.
Ms received 1 1 /1 9 /7 3 ; revised 1 /2 4 /7 4 ; accept-ed 1 /2 9 /7 4 ,_____________________________________
The authors acknow ledge the personnel o f the Chemical Analysis Research U nit o f Western Regional Research Laboratory for analyses, Dan Guadagni for the taste testing, and Everett Durkee for mechanical design details. We also thank Patterson Frozen F oods for supplying the raw product used in these studies.
Reference to a com pany and/or product named by the Departm ent is on ly for purposes of inform ation and does not im ply approval or recom m endation o f the product to the exclusion of others which m ay also be suitable.

M. PELEG and L. GÓMEZ BRITO Instituto Venezolano de Investigaciones Tecnológicas e Industriales, INVESTI
Apartado 7668, Carmelitas, Caracas 101, Venezuela
EXTERNAL COLOR AS A MATURITY INDEX OF PAPAYA FRUITS
INTRODUCTIONYELLOW COLORATION of the peel of papaya fruits has been traditionally used as the criterion for the determination of their maturity stage. The degree of maturity required to enable maximum shelf life and to avoid the risks of abnormal ripening patterns has been discussed in the literature. Criteria previously published include literal description of the color patterns (Papayas in Hawaii, 1970; Thompson and Lee, 1971; Civetta et al.,1965) and estimation of the fruit surface fraction with yellow coloration (Akamine and Goo, 1971; Brukner and Kinch, 1968; Hundtoft and Akamine, 1971). Brukner and Kinch (1968) found that the force-deformation ratio was a more sensitive index for the maturity stage than the color grade. Akamine and Goo (197O re- ported that for a full development of the total soluble solids of Solo papaya fruits the safe initial coloration should cover almost 6% of the fruit outer surface area. Most of the published information is re
lated to the Solo types of papaya with little available information on other types of Papaya fruits.
The weight of an individual Venezuelan papaya fruit ranges between 2 -8 kg, and its shape and coloration pattern are different from the Hawaiian Solo fruit. The purposes of this study were to investigate the possibility of relating the post harvest changes of the Venezuelan papaya fruit to yellow color intensity and to establish maturity indices based on external color intensity.
EXPERIMENTALRaw material
Fresh Venezuelan Papaya fruits were collected in commercial plantations. The elongated, hermaphrodite type of fruits ranging in weight between 3 and 6 kg were selected. The external color of the fruit ranged from the stage where yellow bands were barely apparent up to the stage of completely yellow skin. The fruits were washed and packed in wooden cases with cloth shreds to avoid mechanical damage during
the transport from the field to the laboratory. The initial color evaluation started about 24 hr after harvest and the fruits were left to ripen at room temperature of 22-24°C.Color evaluation
Color was evaluated by a Hunterlab Color Difference Meter model D25D2 calibrated with a standard yellow tile (L = 78.1; a = -2 .2 ; b = 22.6). External color was evaluated by placing the intact fruits under the instrument cell’s ap- perture (19.6 cm2) in a position in which the apparently most yellow field would be under test. 2 -4 fields were examined on each fruit and for each field, the fruit was moved slightly until maximum b values were obtained on the digital controller of the Hunter instrument. Color measurements were carried out on the same fields on the intact fruit and on the peeled skin. The internal color of the stored fruits was evaluated using longitudinal flesh slices.Texture evaluation
Texture was evaluated by a penetration technique using an Instron Universal Machine Model TM (Peleg, 1974). Penetrations were carried out using a cylindrical 5/16 in. plunger similar in shape to the standard Fruit Pressure Tester described by Magness and Taylor (1925).
Fig. 1-Relationship between Hunter L and b values in the external Fig. 2-Intensification of the yellow coloration of random fields o f the color of papaya fruits. papaya peel.
Volum e 3 9 ( 1974)—JO U R N A L O F FO O D S C IE N C E -7 0 1

7 0 2 -JOURNAL OF FOOD SCIENCE-Volume 39 (1974)
In cases where texture strength distribution within a fruit slice was examined, 3/16 in. plungers were used to enable more replications in a given location. All the fruits were penetrated at the speed of 20 cir./min. Texture strength is reported in terms of g/cm2.Total soluble solids
After the internal color and texture evaluation, the slices of the fruits were disintegrated by a domestic Osterizer. The total soluble solids (TSS) of the puree was determined by a refractóme ter and results are expressed in °Brix.
RESULTS & DISCUSSIONExternal color evaluation
To evaluate the effect of the curative surface of the intact fruit on the color readings, the color of same fields was determined on the intact fruits and the separated peel. Results for fields ranging in apparent color from completely yellow to completely green showed that the separated peel exhibited higher values, L, a and b in the order of 1.5, 1.1 and 0.4, respectively. For the fields selected for maximum value of b (yellow) a linear correlation was found between b and L (Fig. 1 ). No correlation however existed between b and a which exclude the latter as an index of the yellow coloration.
The color of randomly selected fields as well as that of the fields with maximum Hunter b value were evaluated during storage. Results showed (Fig. 2) that in most fields the yellow color had intensified during ripening. The extent and the rate of yellowing varied according to the site in the same fruit and large variations were recorded among individual fruits.TSS, Texture and internal color
Fruits were left to ripen at room temperature and were checked daily. When a
Table 1—Color and texture distribution in a crossection of papaya fru it
TS S Distance from Hunter color Texture strength2(° B rix ) peel (mm) L a b (g/cm2 )
8.4 3 65.7 13.0 35 .0 13998. 63 .8 15.7 34 .5 579
13 60.8 18.1 35.4 47718 58.8 24.1 36.4 315
9.8 3 51.3 8.9 30.2 13378 54.7 15.9 32.5 825
13 52.3 16.4 30 .8 57318 48.2 20.0 30.7 477
12.0 3 61.2 19.4 36.3 16748 56.5 23.5 35.1 960
13 57.3 23.1 35.4 854a Determined by using
cm/min3/16 in. plunger at penetration speed of 20
Table 2—M aturity grades o f papaya fru itsTexture
TSS strength Flesh maxGrade (° B rix ) (g/cm2 ) Hunter a
Ripe >9 < 1000 >16>9 1 0 00 -15 00 >20
Alm ost ripe >9 10 00 -15 00 1 6 -2 08 - 9 <1000 >168 - 9 10 00 -15 00 >20
Not ripe < 8 or >1500 or < 16
fruit started to soften, it was left for another day and then was analyzed for its TSS content, its texture strength and its internal color. After 13—14 days, all the remaining fruits were analyzed in the same way. Results of TSS content in relation to the initial external yellow color
are given in Figure 3. These show that fruits with more intense yellow color at the time of harvesting had the tendency to develop their TSS content more rapidly. A similar type of relationship was found for both internal color development and texture softening. No correla-
x 1* 0D
11
LD 10
” 9 lI— 3
8
9 O
O • w p V
°8»(,9 • 9
0 0 'o °o
W AA
A 2*4 d a y s• 5 -7 ■>• 8-10 »
î Ï Ï Î Î V 1o 11-14 "
0 15 2 0 25 30 35
Hunter bFig. 3 —T S S development in post harvest ripening o f papaya as a function o f the initial external yellow color intensity (Hunter b).

EXTERNAL COLOR OF PAPAYA FRUITS- 703
Fig. 4 —Ripening o f papaya fruits as a function of their initial external yellow color intensity.
tion , however, existed betw een the three characteristics: i.e ., TSS conten t, textural strength and internal color.
It was also observed that zones o f d ifferent color and texture strength could be distinguished even in com pletely ripe fruits (Table 1). A similar pattern was also reported by Brukner and Kinch(1 9 6 8 ) for the Solo type o f fruits. The nonuniform ity o f internal color and te x ture strength, even in ripe fruits, elim inates the possibility o f a single internal quality factor as an exclusive index o f fruit ripening. It is suggested that all these quality factors should be used as the criterion o f degree o f ripeness o f V enezuelan papaya fruits as shown in Table 2. The term “ripe” represented fruits that were acceptable for TSS conten t, softness and internal color appearance. The term “almost ripe” represented fruits which lacked the full developm ent o f one or tw o factors but not to an extrem e extent. This group included som e fruits that were organoleptically acceptable and fruits that perhaps might have matured if left to ripen for a longer tim e. It possibly also included fruits that matured in an abnormal pattern at least w ith regards to one factor. Therefore, this group represents fruits for which the test procedure left some uncertainty. The term “not ripe” represented fruits that might have developed one characteristic to the normal acceptable level, in most cases texture sof
tening, but at least one o f the other properties was com pletely unacceptable.
Ripening and initial yellow color intensity
A lot o f 150 fruits was classified into four coloration intensity levels according to their initial maxim um Hunter b value. The percentage o f fruits o f each class, w hich reached the grades “ripe” and “alm ost ripe” as a function o f the storage tim e is given in Figure 4. Results showed that fruits having higher initial Hunter b values had the tendency to ripen in a shorter tim e. The am ount o f “ripe” fruits a ls o increased w ith increasing initial coloration intensity. A lthough “not ripe” fruits were found in all the groups, the am ount o f “ alm ost ripe” fruits was betw een 11 -2 7 % o f the fruits in each group w ith maximum values in the tw o middle groups. A lthough the “alm ost ripe” fruits represented fruits for w hich the inform ation obtained was not com prehensive, it was observed that in the tw o upper color groups the “alm ost ripe” fruits included considerable am ount o f fruits very close to the grade o f “ripe” specified in Table2. The major part o f the fruits having initial yellow color intensity exceeding 20 Hunter units ripened normally in 5 - 7 days o f storage while the major part o f fruits having 18—20 units ripened in8 —10 days. The majority o f fruits having low er values did not ripen normally and
the low percentage that did ripen normally reached acceptable maturity on ly after 11 — 14 days o f storage.
REFERENCESA kam ine, E .K . and G oo, T . 1 9 7 1 . R e la tionsh ip
b e tw een surface co lor dev e lo p m en t and to ta l so lub le solids in p apaya. H o rt. Sci. 6 (6 ): 567 .
B rukner, P .F . and K inch, D.M. 1 9 6 8 . Force- d e fo rm a tio n ra tio as ind ex o f p ap ay a m a tu ra tio n . T rans. A SA E. 11 : 437.
C ivetta , A ., G aitan , F . and M uller, C .J. 1965. A lgunos cam bios físicos y qu ím icos de la p a p a y a d u r a n t e su a lm acenam ien to y m ad u rac ió n . ITT T echnolog ía (C olom bia) 37: 33.
H u n d to f t, E.B. and A kam ine, E .K . 197 1 . Estab lish ing th e effec ts o f p o s t harvest tr e a tm en t o n fresh m a rk e t papayas by response surface m eth o d o lo g y . J . Agr. E ngn. R es. 16: 343 .
M agness, J .R . and T aylor, G .F . 1 9 2 5 . An im p roved ty p e o f p ressure te s te r fo r th e d e te rm in a tio n o f f ru it m a tu r ity . C ircular N o. 350 , USDA.
P apayas in H aw aii. 1 9 7 0 . C ircular N o. 436 . C oopera tive E x ten sio n Service, U niversity o f H aw aii.
Peleg, M. 197 4 . D ete rm in a tio n o f fresh p a p ay a ’s te x tu re by p e n e tra tio n te s ts . J . F oo d Sci. 39: 156.
T hom pson , A .K . an d Lee, G .R . 1 9 7 1 . F ac to rs a ffec ting th e sto rage b ehav iou r o f p apaya f ru it. J . H or. Sci. 46 : 511 .
Ms received 1 1 /1 2 /7 3 ; revised 1 /9 /7 4 ; accep ted 1 /1 5 /7 4 .____________________ __ _______________
This s tu d y w as financed b y th e Consejo N acional de Investigaciones C ientíficas y Tecn o ló g ic a s (C O N IC IT) (N atio n a l V enezuelan C ouncil o f S cien tific & T echnolog ica l R esearch).
The au th o rs express th e ir th an k s to Mrs. Helga and Mr. P e te r B astiansen fo r th e d o n a tio n o f fru its fo r th e research .

TAKESHI MATSUURA, A. G. BAXTER and S. SOURIRAJAN Div. o f Chemistry, National Research Council o f Canada, Ottawa, Canada
STUDIES ON REVERSE OSMOSIS FOR CONCENTRATION OF FRUIT JUICES
INTRODUCTIONTHE APPLICATION o f reverse osm osis for the concentration o f fruit juices is o f both scientific and technical interest. With reference to this application, a fundam ental approach was presented in an earlier paper (Matsuura et al., 1973) in which the relevant physicochem ical criteria for reverse osm osis separations were discussed, equations for reverse osm osis transport were given in terms o f quantities expressed in readily measurable weight units and carbon weight fractions, a m ethod for determining osm otic pressures o f fruit juice solutions was established, data on osm otic pressures o f com m ercially available apple juice, pineapple juice, orange juice, grapefruit juice, grape juice and tom ato juice solutions were given, and som e aspects o f reverse osm osis process design were discussed with particular reference to concentration o f fruit juices. This paper is in continuation o f the above work.
In this paper, experim ental data are presented for the osm otic pressures o f com m ercially available lim e juice, lem on juice, prune juice, carrot juice and (salted and unsalted) tom ato juice solutions. O sm otic pressures o f sucrose-water, and glucose-sucrose-water solutions are also given in the temperature range 7 .5 — 25°C . These data for the glucose- sucrose-water system are used to illustrate the effect o f operating temperature on parameters of process design relevant to the reverse osm osis concentration o f fruit juices. Experimental data are also presented to show that low temperature reverse osm osis treatment of membrane permeated apple juice waters results in significant recovery o f aroma com pounds which escaped through the membrane during the primary concentration process.
EXPERIMENTALReverse osmosis experiments
The nonflow type cell (effective film area = 9.6 cm2), described in
detail in the literature (Sourirajan, 1970-a), and laboratory made batch 316 (10/30)-type porous cellulose acetate membranes (Pageau and Sourirajan, 1972) were used. Commercially available lime juice (Rea- lime), lemon juice (Realemon), prune juice (Welehs), carrot juice (Eveready), unsalted tomato juice (Aylmer) and salted tomato juice (Heinz) were used in this work. Unless otherwise stated, all experiments were carried out at the laboratory temperature (23-25°C). Some experiments were also carried out at 7.5°C and 15°C with the cell placed in a cold box; the temperature of the cell in the cold box could be held constant within ±1°C during the experiment.
Aqueous sodium chloride feed solutions were used to obtain data on film specifications (Sourirajan, 1970-b). The specifications of all membranes used are given in Table 1 in terms of data on pure water permeability constant A (in g mole H20/cm 2 sec atm), and solute transport parameter (DAkj/K5) for sodium chloride (in cm/sec) at the indicated operating pressure. Some data on membrane performance for the system sodium chloride-water are also given in Table 1 for the specified feed solutions and mass transfer coefficient k (in cm/sec) on the high pressure side of the membrane. The reported product rates are those corrected to 25°C using the relative viscosity and density for pure water. In all experiments, the terms “product” and “product rate” refer to membrane permeated solution.
The fraction solute separation f for the different feed solutions used were calculated as follows. For aqueous sodium chloride feed solutions,
salt ppm in feed - salt ppm in product salt ppm in feed
For fruit juice feed solutions,
C ppm in feed — C ppm in product C ppm in feed
For the separation of volatile flavor compounds present in membrane permeated fruit juice waters obtained from the primary concentration process,
f = (equivalent ethyl alcohol ppm in feed- equivalent ethyl alcohol ppm in product)-r equivalent ethyl alcohol ppm in feed.
Table 1—Specif¡cation o f membranes and some performance data3
Film no. J1 4 J15 J16 J17 J18 J19 J20 J21Film shrinkage temp °C 80 80 80 80 80 80 80 80Specification at 1000 psig Pure water permeability
constant, A g-mole
cm 2 sec atm x 10 1.76 1.63 1.62 2.43 1.88 2.06 2.04 1.46Solute transport parameter.I^ A M ^ ^ lN aC l (cm/sec) X 10s 2 .32 2.95 1.17 4 .85 2.32 3.87 3.29 2.00Performance data Feed cone, ppm NaCI 3500 3500 3500 3500 3500 3500 3500 3500Mass transfer coefficient, k (cm/sec) X 10" 20 20 20 20 20 20 20 20Operating pressure, pslg 1000 1000 1000 1000 1000 1000 1000 1000Solute separation, % 95.7 95 .0 97.3 92 .5 95 .4 94 .9 95 .5 97 .0Product rate, g/hr 60.2 57.6 54.6 80 .9 62 .6 76.7 76 .0 55 .83 Nonflow-type cell, film area 9.6 cm 2
704-JOURNAL OF FOOD SCIENCE- Volume 39 (19741

RO FOR FRUIT JUICE CONCENTRATION-705
AnalysisThe concentration of sodium chloride in aqueous solutions was
determined using a conductivity bridge. The Beckman total carbon analyzer, model 915, was used to measure the total carbon content of organic solutes in the feed, product, and concentrate solutions.
A Tracor (model 160) gas chromatograph was used for the analysis of volatile flavor compounds present in solution in the fruit juice waters. The latter term refers to the membrane permeated product solution obtained during the primary reverse osmosis concentration (first stage treatment) of fruit juices. These fruit juice waters may be subjected to a subsequent reverse osmosis treatment (second stage treatment) for the concentration of the flavor compounds which escaped through the membrane along with water during the first stage treatment. Consequently, the feed solution for the second stage treatment contains very little sugars and probably a major part of the dissolved volatile flavor compounds (alcohols, esters etc.). The gas chromatographic analysis in this work was concerned only with the solutions involved in the second stage treatment of apple juice waters.
The chromatographic column used was a 6 ft long, 0.25 in. diam stainless steel tubing packed with 20-30 mesh ascarite for the initial4.5 in., and with 5% OVI on 80-100 mesh chromosorb W(HP) for the remaining length. Helium flow through the column was 60 cm3 /min, and the entire effluent from the column passed into a hydrogen flame detector. The column was operated at 80°C, and 2 pi of solution sample were used for each injection. Since the nonvolatile solute remained in the column without being eluted by the carrier gas, the packing of the column had to be changed frequently. In each analysis, the total area under the peak was integrated and expressed as equivalent ethyl alcohol using standard ethyl alcohol solutions for calibrations. The chromatogram representing the flavor compounds present in the liquid sample injected in the column usually contained a single peak with some tailing. The error introduced in analysis by the presence of tailing was estimated to be about 3%.
Density measurements were made by weighing known volumes of the fruit juice samples at 25°C; the accuracy of the data is within ±1% (Fig. 1).
RESULTS & DISCUSSION Fruit juices and their concentrates
Major com ponents in solution in fruit juices. The major com ponents present in apple juice, pineapple juice, grapefruit juice, grape juice and tom ato juice solutions have been given (Matsuura et al., 1973). Table 2 gives the com position o f lem on juice (Tressler and Joslyn, 1971) w hich has a relatively high concentration of citric acid and a low concentration o f sugar compared to other juices. The com positions o f other juices studied in this work are not readily available. The physicochem ical criteria governing the reverse osm osis separations of fruit juice com ponents have already been discussed (Matsuura et al., 1973; Matsuura and Sourirajan, 1973).
Table 2—Major components in solution in lemon ju ice (from Tressler and Jo slyn , 1971)
LemonJuice
Sugars, w t %D-glucose 0 .7 8 -2 .6 3D-fructoseSucrose 0 .0 3 -0 .6 3
Acids, w t %D-IVIalic acid 0 .1 5 -0 .4 1C itric acid 4 .2 0 -8 .3 3
Fats, w t % none—0.6Proteins, w t % 0 .2 6 -0 .7 7Vitam ins, ppm 3 1 0 -6 1 0Inorganic, w t % 0 .1 5 -0 .3 5Water, w t % 'V 90
O sm otic pressure data. It was established earlier (Matsuura et al., 1973) that the reverse osm osis data for the concentration o f fruit juices could be analyzed by transport equations written in the follow ing form in terms o f quantities expressed in readily measurable weight units and carbon weight fractions.
pw pA (w t) - s x 3 6 o o X P (1 )
N B (w t)= A (w t) [ P - 7r(XC 2) + 7r(XC 3)]
D AM
KÔ1 - X c ;
XC3
= k c 1(w t)( l - Xc 3 )ln
( c 2 ( w t ) X C 2 ~ c 3 ( w t ) X C 3 )
X C 2 - X C 3
_X C 1 — XC 3
where Xc = X A MC/[M A X A + MB (1 - XA )]
(2)
(3)
(4)
(5)
All sym bols are defined at the end o f the paper. Making use o f the above equations, a m ethod was established (Matsuura et al., 1973) for determining the osm otic pressure o f fruit juices and their concentrates as a function o f carbon weight fraction X c in solution. In this m ethod tw o reverse osm osis experim ents are carried out, each at a different pressure, for each
Fig. 1 —Densities o f fruit juice solutions.

106-JOURNAL OF FOOD SC/ENCE-Vo/ume 39 (1974)
fruit juice solution. Each experiment involves the determination of PWP, PR and solute separation at the given operating pressure. The first experiment (called the “low-pressure experiment”) is at a pressure only slightly higher than the osmotic pressure of the fruit juice solution under study; at the pressure used for this experiment the product rate is small, and hence the concentration polarization also is small. The second experiment (called the “high-pressure experiment”) is at a pressure (1000 psig in this work) much higher than the osmotic pressure of the fruit juice solution; under the conditions of the latter experiment both product rate and concentration polarization are much higher than those obtained at the low-pressure experiment. Both the experiments are of the short-run type,i.e., the net amount of product removed is small compared to the amount of feed in the cell so that there is no significant change in concentration in the feed solution during the experiment. From the above two sets of experimental data, precise values of 7t(Xc 2) and k are obtained by an iteration technique (Matsuura et al., 1973). These values are used in conjunction with Eq. (1) to (4) to obtain the osmotic pressure of fruit juice solutions of different concentrations.
The osmotic pressure data were obtained by the above technique for at least six concentrations of different fruit juices and their concentrates up to Xc = 12 x 10'2 which represented two to four times the concentrations of natural fruit juices in most cases. The experimental results obtained for lime juice, lemon juice, prune juice, carrot juice and tomato juice (salted and unsalted) and their concentrates are shown in Figure 2; curve I in Figure 2 represents data for apple juice, pineapple juice, orange juice, grapefruit juice and grape juice solutions reported earlier (Matsuura et al., 1973). The experimental osmotic pressure data scattered within 5% if the osmotic pressure was < 1 5 0 psi, and within 2% if the osmotic pressure was > 500 psi; the scatter was between the above limits if the osmotic pressure was in the intermediate range. The experimental points are omitted in Figure 2 for the sake of clarity. It may be seen that the osmotic pressure data as a function of Xc fall in a narrow band for all the fruit juice solutions studied except tomato juice solutions. Further, with respect to
Fig. 2 —Osm otic pressure o f fruit ju ices and their concentrates at lab temperature (2 3 —2 5 °C ).
Table 3—Data on a and b for osmotic pres-sure calculation
rr(psi)a 7T + b
a b*C
Name of Juice
For juice representedby curve la 3 .94 3560
Lim e juice 3.31 3997Lemon juice 2.59 4442Prune juice 3.31 4217Carrot juice 4.93 3088Tomato juice 8.95 4187
a A p p le , p in e a p p le , o ran g e , g ra p e fru it and grape ju ic e s
the fruit juice solutions studied except tomato juice solution, for a given Xc, the osmotic pressure of aqueous glucose (monosaccharide) solution is higher and that of aqueous sucrose (disaccharide) solution is lower than the osmotic pressure of the corresponding fruit juice solution (Matsuura et al.,1973). With respect to tomato juice solutions, two observations are significant. The Xc versus osmotic pressure correlation is essentially the same for the particular “unsalted” and “salted” varieties of the juice solutions tested; this shows that the amount of salt added in the “salted” variety is too small to affect the osmotic pressure significantly. Further, at a given Xc, the osmotic pressure of tomato juice solution is significantly higher than that of each of the other juice solutions tested; this result is probably due to the presence of relatively higher amounts of inorganics present in tomato juice (Matsuura et al., 1973).
As illustrated earlier (Matsuura et al., 1973) it was found that the plot of Tt (osmotic pressure) versus 7f/Xc was essen-
Fig. 3 —E ffe ct o f concentration o f fruit ju ice solution X (: on mass transfer coefficient k on the high pressure side o f the membrane.

RO FOR FRUIT JUICE CONCENTRATION-707
tially a straight line for each of the fruit juice solutions studied. This correlation can be represented by the relation
7r/Xc = a Tt + b (6)
where a and b are constants characteristic of the fruit juice solution under consideration. Using the least-square technique for the treatment of experimental Xc versus tt data, the values of the constants a and b were calculated for all the solutions studied. The results obtained are given in Table 3. Eq. (6) along with the values of a and b given in Table 3, may be considered as a valid working relationship for the calculation of the osmotic pressure of fruit juice solutions at least up to a carbon weight fraction (X c) of about 12 x 10‘2. The values of Xc x 102 for the commercially available lime juice, lemon juice, prune juice, carrot juice, and unsalted tomato juice used in this work were 3 .51 ,3 .21 ,7 .56 , 3.87 and 2.59, respectively.
Effect of Xc on (D ^ m /K5) and k. The effects of concentration of fruit juice solution Xc on (DAm /K5) and k on the high pressure side of the membrane are important in reverse osmosis process design for the concentration process. The values of PR, (DAm /K5) and k obtained with different fruit juice solutions and film samples at 1000 psig in the apparatus used in this work are given in Table 4 and Figure 3.
Table 4 shows that (DAm /K5) was much less than 1.0 x 10~5 cm/sec in all cases tested except prune juice solutions, which case was characterized by a definite tendency for (DAm /K5) to decrease with an increase in carbon content. For the entire range of concentrations involved in this work, the average value of (DAm /K5) was less than 1.0 x 10'5 cm/sec in all the cases studied. As pointed out earlier (Matsuura et al.,
1973) when (Da m /K5) is < 1.0 x 10‘5 cm/sec, changes in its value have very little effect on product rate and fraction solute separation. Consequently, under such experimental conditions, (DAm /K6) may be considered constant for practical purposes of process design.
Figure 3 shows the effect of Xc on k obtained with the particular apparatus used in this work. The data show that the values of k for prune and carrot juice solutions were ^ 10 x 10'4 cm/sec, and then decreased to ^ 7 x 10“4 cm/sec when Xc increased to 10 x 10"2. The values of k x 104 (in cm/sec) for lime and lemon juice solutions were in the range 5 -6 in the entire concentration range studied, and the corresponding values for tomato juice solutions were 'v 4. Comparing the above values of k with those reported earlier (Matsuura et al.,1973), one may conclude that at a given feed flow rate and Xc, the values of k would be about the same for apple, pineapple, orange, grapefruit, grape, prune, and carrot juice solutions, and the corresponding values of k would be about half the above value for lime and lemon juice solutions, and still less for tomato juice solutions.
Systems sucrose-water and glucose-sucrose-water
The object of this part of the work was to investigate the effect of temperature on parameters of process design relevant to reverse osmosis concentration of fruit juice solutions. The work involved the determination of the effect of temperature on osmotic pressure, (DAM/K5), and k for a simulated fruit juice solution, and parametric study of the results of system analysis for the above solution.
Effect of temperature on osmotic pressure. The Xc versus
Table 4—Effe ct of feed concentration on (D AM/Ki>) for juice solutes at 1000 psig
Filmno. Feed solution
Carbon content in feed solution
(ppm)(D a m /K S ) X 105
(cm/sec)Product rate
(g/hr)a
J14 Lim e Juice 12000 0.29 39.625400 0.40 29.435300 0.47 19.454900 0.46 13.181900 0.38 7.3
103600 0.39 3.7
J15 Lemon Juice 23500 0.32 30.436400 0.27 20.663800 0.37 12.575300 0.27 9.297200 0.25 4.1
118000 0.27 3.7J16 Prune Juice 27700 1.03 34.6
53000 0.58 20.976800 0.38 15.087900 0.33 11.1
120300 0.12 3.6138800 0.12 2.6
J 17 Carrot Juice 15800 0.43 36.631100 0.49 32.845200 0.45 30.155200 - 22.162900 - 21.777600 - 15.0
J18 Tomato Juice 13600 0.29 47.926400 0.23 32.136900 0.15 10.8
a E f fe c t iv e f i lm a rea = 9 .6 c m 2

708-JOURNAL OF FOOD SCIENCE-Volume 39 (1974)
Fig. 4 —Osmotic pressure o f aqueous sucrose solutions in the temperature range 7.5—2 5 3 C.
Fig. 5 —Osm otic pressure o f glucose-sucrose (mole ratio 10-11-water system s at 7 .5 ' C and 25 ' C.
osmotic pressure correlation was experimentally determined for different concentrations of sucrose-water system at temperatures of 7.5°C and 15°C by the technique identical to that used for fruit juice solutions. Similar data were also obtained at 7.5°C and 25°C for the system glucose-sucrose-water using glucose:sucrose molar ratio of 10:1 in the feed solutions. The low temperature experiments were carried out in a cold box as stated earlier. The densities of feed solutions at the temperature of the experiment were used in the calculations.
Figure 4 gives the experimental osmotic pressure data for the system sucrose-water. These data include those reported earlier (Matsuura et al., 1973) for 25°C and the corresponding literature data (Timmermans, 1960) (solid lines) at the specified temperature. Figure 5 gives similar experimental data for the system glucose-sucrose (mole ratio 10: l)-water along with the calculated data (solid line) for 25°C obtained from the corresponding data for the systems sucrose-water and glucose- water (Matsuura et al., 1973) using the additivity principle. The excellent agreement between the experimental, literature, and calculated values confirmed the validity of the experimental technique used in this work for the determination of osmotic pressures. Further, the results obtained for the above glucose-sucrose-water system showed that the osmotic pressure data fell in the narrow band of similar data obtained for fruit juice solutions (Fig. 2) up to Xc = 'v 10 x 10"2. On the basis of the latter result, the system glucose-sucrose (mole ratio 10: l)-water could be considered as a simulated fruit juice solution (excluding aroma compounds) for purposes of parametric analysis relevant to the first stage concentration process.
Effect of temperature on (DAM/K5) and k. Analysis of reverse osmosis data obtained from the “high-pressure” (1000 psig) experiments (conducted for osmotic pressure determinations) for the simulated fruit juice solution (glucose-sucrose- water) at 7.5°C and 25°C showed that both (DAM/K5) and k decreased with decrease in temperature at any given value of Xc- Similar data have been reported in literature (Sourirajan, 1970-b) for the system NaCl-H2 O for which the above variation was shown to follow the relation
(D AM/K S ) o r k ° c e “ T (7)
where T is the operating temperature and a is a constant with respect to temperature. Assuming that the above relation holds for the simulated fruit juice solution in the temperature range7.5 —25°C, the value of a was determined as a function of X^. The results are shown in Figure 6 which shows that a decreased with increase in Xc , and the value of a was essentially the same with respect to the variations of both (DAM /K6) and
k with temperature. Further, the results showed that the value of a was four to ten times that given for the system sodium chloride-water (Sourirajan, 1970-b). These results show that the values of (Da m /K5) and k are sensitive to operating temperature particularly at low concentrations of fruit juice solutions.
Application of system analysis. The concepts of system specification and their application for parametric studies of reverse osmosis process design relevant to concentration of fruit juices have been discussed in detail (Matsuura et al., 1973; Sourirajan, 1970-c; Ohya and Sourirajan, 1971). Only some results of such studies based on experimental data on simulated fruit juice solution will be discussed here. For the sake of convenience, the following definitions are included:
Parameters o f system specifica tion osmotic pressure of initial feed solution BXAJ
y = -------------------------------------------------------------------------------------------------------------------- = — —— ( 8 )
operating pressure r
solute transport parameter (Da m /K5)pure water permeation velocity vw * ^
mass transfer coefficient on the high pressure side of the membrane k
solute transport parameter (Da m /K6) ^ ^The quantity vw * is obtained from the relation
where c is molar density of pure water. When (DAM/K5) is small, the mass transfer situation on the high pressure side of the membrane is best expressed in terms of X0 ( = k/vw *).
Parameters o f system perform ance
A = volumetric fraction water recoveryVj
- 1 — (batch operation) or
(ID1 — ^ (continuous operation)
- avg product cone for given A initial cone of feed (12)
r = Svw * t/Vj ° (batch operation) (13)
X = vw * x/u°h (continuous operation) (14)

RO FOR FRUIT JUICE CONCENTRATION-709
Fig. 6 —Effect o f temperature and concentration of fruit juice solution on mass transfer coefficient k and solute transport parameter (Da m /K o) in the temperature range 7 .5 -2 5 0C (• a for (DAM/Kb); o a for k).
The quantities r and X are num erically identical w hen 1/h = S /V i° and x /u ° = t.
Table 5 gives data on system specification for a particular membrane at 7 .5°C and 25°C based on experim ental reverse osmosis data for a simulated fruit juice solution (glucose- sucrose-water). The values o f y and A 0 were smaller at 7 .5°C than at 25°C whereas the value o f 0 was the same at both temperatures. These data reflect the effect o f temperature on vw *, (D a m /K 5 ), k, and osm otic pressure o f feed solution. The results o f system analysis are p lotted in Figure 7 w hich gives r (or X) versus C3 and A correlation for 7.5°C and 25°C for A 0 values o f 0 .46 and 0 .58 actually obtained with the apparatus used in this work at the above temperatures; in addition, the corresponding data for A© values o f 1.0 and °° are also included in the figure for purpose o f discussion. The results show that at the experim ental conditions actually used in this work, the values o f r (or X) and C3 are higher at the low er temperature for a given value o f A. These data express the fact that at a
low er tem perature, it would take a longer tim e (in a batch concentration process) for a given recovery and the average concentration o f the membrane permeated product will also be higher; the latter result is probably not critical from a practical point o f view because, at A = 0 .5 0 , C3 < 0.01 (i.e ., > 99% solute separation) at both temperatures.
However, if the value o f k, and hence A0, could be increased (by higher feed flow rate, turbulent prom otors, change in apparatus design, etc .) Figure 7 show s that both t (or X) and C3 decrease w ith increase in A0, and they also decrease with decrease in operating tem perature when A0 is held constant. For exam ple, w ith respect to the latter change, when A 0 = 1, t = 1.0 and C3 = 0 .0052 at 25°C , and r = 0 .96 and C3 = 0.005 at 7 .5°C _for A = 0.5 . With higher values o f A0, the values o f t and C3 for any given A, approach those given for A0 = These data indicate precisely that for a given value o f A 0, it is advantageous to carry out the reverse osm osis operation at a low er tem perature, but the advantage is probably only marginal with respect to first stage treatm ent for the fruit juice concentration process.
Recovery of Fruit Juice Aroma Com pounds
For the practical success o f reverse osm osis for fruit juice concentration, it has already been suggested (Matsuura et al.,1973) that the process be carried out in more than one stage. In the first stage, the objective is naturally the alm ost com plete (> 99%) recovery o f fruit juice sugars; in the subsequent stages, the objective could be the recovery o f the fruit juice aroma com pounds by the repeated reverse osm osis treatment o f the membrane permeated fruit juice waters obtained from the first stage operation, under appropriate experim ental conditions. This concept was tested in this work by carrying out a second stage treatm ent using apple ju ice water as the feed solution; the aroma concentration o f the latter was 'v 350 ppm equivalent EtOH.
On the basis o f the studies already reported on the system t-butyl alcohol-sucrose-water (Matsuura et al., 1974), it is evident that, in addition to the physicochem ical factors involved, tw o reverse osm osis operational factors tend to decrease the separation o f aroma com pounds (and hence increase their concentration in the product water) in the first stage treatm ent o f the fruit ju ice solution . These factors are the
Table 5—System parameters fo r simulated fru it juice (F ilm no. J20 )Temperature
7 .5 °C 25° C
Operating conditionsOperating pressure, atm 68 .0 68 .0Mass transfer coefficient k , cm/sec 7.1 X 10 '4 13.9 X 10 '4
Properties of feed solutionCarbon content in feed, ppm 43800 43800Osmotic pressure of feed, atm 13.72 14.68Average density, g/cm3 1.03 1.03
Film specification Pure water permeability constant.
A (Wt) , grams H 20/cm 2 sec atm 23.29 X 10‘6 36 .56 X 10'6Solute transport parameter,
(D a m /KS b cm/sec 0.154 X 10 '5 0 .276 X 10‘ 5System specification
7 0.202 0.216© 0.001 0.001k e 0.46 0 .58
Table 6—System parameters for apple ju ice water (F ilm no. J21 )Temperature
7 .5 °C 25° C
Operating conditionsOperating pressure, atm 68.0 68 .0Mass transfer coefficient k , cm/sec
Properties of feed solution7.4 X 10~4 14.6 X 10‘ 4
Equivalent ethyl alcohol conein feed, ppm 361 340
Osmotic pressure of feed, atm 0 ry 0Average density, g/cm3 1.00 1.00
Film specificationPure water permeability constant,
A (wt)- gtams H2 O/cm2 sec atm Solute transport parameter.
15.66 X 10 '6 31 .85 X 10 '6
(D a m /K S ), cm/sec 25.1 X 10 s 177.1 X 10‘ 5System specification
7 0 0© 0.236 0.815
0 .695 0.672

TiO—JOURNAL OF FOOD SCIENCE-Vo/ume 39 (1974)
t c A)f / : c A ),
Fig. 7—Results o f reverse osmosis system analy- Fig. 8 —Experim ental results on reverse osmosis concentration o f applesis for a simulated fruit ju ice solution Iglucose- ju ice water at 7 .S3 C and 25° C; initial feed concentration o f aromasucrose-water) at 7 .5 ' C and 2 5 ' C. com pound, 35 0 ppm equivalent E tO H ; operating pressure, 1000 psig.
following: ( 1 ) the high osmotic pressures of the fruit juice solution and its concentrates, which reduce the effective pressure for water transport through the membrane; and (2) the high viscosity of the boundary solution caused by the high concentration of sugars, which reduces the mass transfer coefficient for the aroma compounds on the high pressure side of the membrane. Both these factors are essentially eliminated in the second stage treatment with fruit juice water; consequently, in the latter treatment, the experimental conditions tend to favor the practical realization of the highest potential of the particular me- brane for the separation of aroma compounds.
Further, the foregoing discussion on the results of system analysis for the fruit juice concentration process has shown the possible advantage of operating reverse osmosis at a lower temperature. This advantage can be particularly significant for the second stage treatment because of the effect of decrease in temperature on the relative values of (D^m /KS) and k with respect to the aroma compounds. This is illustrated by the data presented in Table 6 for a particular film sample used for the second stage treatment of apple juice water at 1000 psig. The data showed that by decreasing the operating temperature from 25 to 7.5°C, the value of k decreased by about 50%
while the value of (D^m /KS) decreased by about 85%. In terms of system specifications, 7 0 at both temperatures, 0decreased from 0.815 at 25°C to 0.236 at 7.5°C, and X@ remained essentially constant at both temperatures because of the simultaneous decrease in vw* and k at the lower temperature. These data on system specifications indicated that lower operating temperature was particularly favorable for higher recovery of aroma compounds in the concentrate by the second stage treatment. This possibility was hence experimentally tested by actually carrying out the second stage treatment for the apple juice water up to A = 0.72 at 7.5° and 25°C. The results obtained are given in Figure 8 which gives both A and C3 as a function of (cA)f/(cA)i where (c a )ì and (cA)j represent aroma concentration in the final concentrate and that in the initial feed respectively.
These results confirmed the practical advantage of operating the second stage treatment at the lower temperature. For example, Figure 8 shows that for A = 0.7, the values of C3 and (cA)ì /(ca )ì are respectively 0.9 and 1.235 at 25°C, and 0.75 and 1.565 at 7.5°C. Thus the results show that for a given A (volumetric fraction of water permeated through the membrane), the concentration of aroma compounds is significantly less in the membrane permeated water and correspondingly

RO FOR FRUIT JUICE CONCENTRA Tl O N - 711
more in the concentrate when the second stage reverse osmosis treatment is carried out at a lower temperature.
For a batch concentration process, the quantity called “the processing capacity of the membrane for solute concentration” is a useful design parameter. The above quantity is defined as the volume of charge (feed solution) that 1 square foot of film surface can handle per day in a batch concentration process to obtain a given value of (cA)f/(cA)j (Matsuura et al., 1973; Sourirajan, 1970-d). Data on processing capacities are also plotted in Figure 8 as a function of (cA)f/(cA)j. Since water permeation rate through the membrane is lower at a lower operating temperature due to the higher viscosity of water, the processing capacities are lower at 7.5°C compared to those at 25°C. Comparing again the data for A = 0.70, Figure 8 shows that the processing capacities for the membrane tested are 58 gal/day/ft2 at 25°C and 27 gal/day/ft2 at 7.5°C; but the concentrations of aroma compounds in the concentrates are 23.5% and 56.5% higher respectively compared to the concentration in feed. Thus the lower processing capacity at the lower operating temperature is compensated by higher aroma recovery in the concentrate. These results are hence of practical interest in reverse osmosis processing of fruit juices.
CONCLUSIONS
THE DATA presented in this paper offer further confirmation of the validity of the experimental technique used for determining the osmotic pressure of fruit juice solutions. The higher recovery of aroma compounds obtained by low temperature operation of the reverse osmosis process in the treatment of fruit juice waters, opens new possibilities for practical developments in reverse osmosis systems for concentration of fruit juices and similar applications.
LIST OF SYMBOLSa
A >A(w t)
bB
c(w t)
(cA)f(ca ) ì
C3
= constant defined by Eq. (6)
= pure water permeability constants in units of g mole water/cm2 sec atm and grams water/cm2 sec atm respectively
= constant defined by Eq. (6)= proportionality constant = molar density of pure water, g mole/cm3 = density of solution, grams/cm3 = aroma concentration in the final concentrate = aroma concentration in the initial feed = quantity defined by Eq. (12)
(Dam /K5) = solute transport parameter (treated as a single quantity), cm/sec
f = solute separationh“' = membrane area per unit volume of fluid space in the
reverse osmosis unit, cm"1k = mass transfer coefficient on high pressure side of mem
brane, cm/secma
Mb
McN B(wt)
= molecular weight of solute = molecular weight of water= molecular weight of solute with respect to carbon only= solvent water flux through membrane in unit of grams
water/cm2 secP operating pressure, atm or psig as indicated
[PR] = product rate, grams/hour per given membrane area in cm2[PWP] = pure water permeation rate, grams/hr per given membrane
area in cm2S = membrane area, cm2 or ft2t = time in sec, or dayT = absolute temperature, "KÜ average fluid velocity parallel to membrane surface on tire
high pressure side of the membrane at any position in flow process, cm/sec
u° = value of u at membrane entrance in flow process, cm/sec
vw* = pure water permeation velocity through the membrane, cm/sec
v, = volume of solution on the high pressure side of membrane at any time in a batch process, cm3
v , ° = value of V, at the start of batch operation, cm3X = longitudinal distance along the length of the membrane
from channel entrance in a flow process, cmX = quantity defined by Eq. (14)
XA = mole fraction of solute in solution
XÂ1 = initial value of XA in feed
Xc carbon weight fraction in solutionGreek lettersa = constant defined by Eq. (7)
7 = quantity defined by Eq. (8)A = quantity defined by Eq. (11)© = quantity defined by Eq. (9)
= quantity defined by Eq. (10)n = osmotic pressure, psi or atmi r(Xc ) = osmotic pressure of solution corresponding to carbon
weight fraction Xc of solutionT = quantity defined by Eq. (13)Numerical subscripts1. bulk solution on the high pressure side of the membrane2. concentrated boundary solution on the high pressure side of the
membrane3. membrane permeated product solution on the atmospheric side of the
membrane
REFERENCESM atsuura, T ., B ax te r, A .G . and Sourira jan , S. 197 3 . C o n c en tra tio n of
f ru it ju ices b y reverse osm osis using p o ro u s cellulose ace ta te m em branes. A cta A lim en taria 2 (2): 109.
M atsuura, T ., B ednas, M.E. and S o urira jan , S. 1974 . R everse osm osis se p a ra tio n o f single an d m ixed alcoho ls in aq u eo u s so lu tio n s using p o ro u s cellulose ace ta te m em branes. J . A ppl. Po lym . Sci. 18: 567.
M atsuura, T. and S o urira jan , S. 1 9 7 3 . P hysicochem ical c rite ria fo r re verse osm osis separa tio n o f m o n o h y d ric an d p o ly h y d ric alcohols and som e re la ted h y d ro x y co m p o u n d s in aq u eo u s so lu tio n s using p o ro u s cellulose ace ta te m em branes. J . A ppl. P o lym . Sci. 17: 1043.
O hya, H. an d S ourira jan , S. 197 1 . “ R everse O sm osis S ystem Specificatio n and P erfo rm ance D ata fo r W ater T re a tm e n t A p p lica tio n s.” T h ay er S chool o f E ngineering , D a r tm o u th College, H anover, N .H .
Pageau, L. and Sourira jan , S. 197 2 . Im p ro v em en t o f p o ro u s cellulose ace ta te reverse osm osis m em branes b y change o f casting co nd itions. J . A ppl. Polym . Sci. 16: 3185.
S ourira jan , S. 1970 . “ Reverse O sm osis,” (a) C h ap te r 1; (b ) C h ap te r 3; (c) C h ap te r 4; and (d) C h ap te r 5. A cadem ic Press, New Y ork.
T im m erm ans, J . 1960 . “ T he P hysicochem ical C on stan ts o f B inary System s in C o n c en tra ted S o lu tio n s ,” V ol. 4, p . 282 . In tersc ience , New Y ork.
T ressler, D .K . and Jo s ly n , M.A. (E d ito rs). 1 971 . “ F ru it and V egetable Ju ice Processing T ech n o lo g y ,” 2 n d ed . T he Avi Publish ing Co., W estport, C onn.
Ms received 1 0 /2 7 /7 3 ; revised 1 /2 2 /7 4 ; accep ted 1 /2 9 /7 4 .Issued as NRC N o. 13978 .

R. J. B R A D D O C K and J. W. K E S T E R S O N University o f Florida, Institute o f F o o d & Agricultural Sciences
Agricultural Research & Education Center, P.O. Box 1088, Lake A lfred, F L 33850
STABILIZATION OF CAROTENOIDS IN DRIED CITRUS FLAVEDO
INTRODUCTIONDURING THE manufacture of frozen concentrated orange juice, the peel waste from the extractors amounts to approximately 35—45% of the total fruit weight. This wet peel waste is limed and pressed to remove about 13% of the liquid present and then dried for manufacture into animal feeds. About 660,000 tons of dried citrus pulp is produced yearly in Florida and sold on world markets (Florida Canners Assoc., 1972).
Peel from all varieties of citrus is dried; however, most of the dried peel comes from oranges, since these fruits constitute about 70% of the Florida citrus crop tonnage. Besides being manufactured into animal feed, there have been other uses proposed for citrus peel which are pertinent to this study. Research has been published showing that the natural pigments in orange peel can be extracted and used for the purpose of enhancing the color of orange juice products (Ting and Hendrickson, 1969). Other workers have shown that several types of citrus peel waste can be used as sources of natural carotenoids for the preparation of color concentrates (Wilson et al., 1971).
There also has been considerable interest in the effect of processing and storage variables on the quality of dried citrus peel. Protein digestibility decreased and darkening was observed in citrus peel commercially dried at temperatures above 260°F (Ammerman et ah, 1965). A recent bulletin has stressed the nutritional importance of producing high quality, light-colored dried peel and pellets for cattle (Chapman et al., 1972).
Commercial equipment is available to process whole citrus peel into the colored (flavedo) and the white (albedo) fractions. The carotenoid pigments of interest to this study are located in the flavedo portion of the whole peel. Some previous investigations by the authors have shown that extensive destruction of the carotenoids in orange and tangerine flavedo occurs at the temperatures commonly used in commercial citrus plant feed mill dryers (Braddock and Kesterson, 1972). However, very little is known concerning the stability during processing and storage of the carotenoid pigments in dried citrus flavedo. It was the intent of this study to show that proper processing and handling during storage can be effective in prevent
ing extensive carotenoid losses in dried citrus flavedo.
EXPERIMENTALSample preparation
Shaved peel flavedo from mature ‘Pineapple’ oranges and ‘Dancy’ tangerines was obtained from processing runs using a commercial extractor and shaver (Automatic Machinery Corp., Winter Haven, Fla.). Flavedo was dried in a pilot plant feed mill dryer (Vincent Processes, Inc., Tampa, Fla.) at temperatures of 210°, 225° and 290°F, measured at stack gas emission. The drying data and conditions have been described in a previous publication (Braddock and Kesterson, 1972).Antioxidant treatment
The experiment was designed to measure the effects of drying temperatures and antioxidant treatments on color stability during processing and subsequent storage of shaved peel flavedo. Antioxidants were applied by spraying a mixture of the antioxidant in food grade ethyl acetate on the dried flavedo. Emulsions of butylated hydroxyanisole (BHA) in water were applied to some samples of wet flavedo prior to dehydration. Quantities of antioxidants applied to samples were based on absolute dry weight of the flavedo, according to standard animal feed formulations. The antioxidants and application rates used in this study included the following: BHA (0.02%), butylated hydroxytolu- ene (BHT, 0.015%), propyl gallate (PG, 0.015%), 1,2-dihydro-6-ethoxy-2,2,4-trimethyl- quinoline (Santoquin, 0.015%) and soy lecithin (0.015%). BHA, BHT and PG were obtained from Tennessee Eastman, Kingsport, Tenn., Santoquin from Monsanto Co., St. Louis, Mo. and soy lecithin from Central Soya, Chicago,111.Pigment analysis
Carotenes (C), monohydroxy-carotenoids (MHC) and dihydroxy-carotenoids (DHC) were extracted from dried flavedo and purified by column chromatography on silica gel. Isolation and estimation of these pigment fractions was
done according to an established procedure for dried plant materials (AOAC, 1970). Moisture content of dried flavedo samples was determined by titration with Karl Fischer reagent. All calculations and comparisons of pigments in the various treatments were based on absolute dry weight of duplicate flavedo samples. Dried samples were sealed in 2-oz bottles for the storage study. 26 bottles were sealed for each treatment, which permitted duplicate analyses each month for 13 months. Once a sample bottle was opened and the contents analyzed, it was discarded.
RESULTS & DISCUSSIONVISUAL APPEARANCE of commercially dried citrus peel can be used to determine if abuse has occurred during drying of the wet peel. The most common industry abuse is the use of excessive heat (above 290°F exit-stack gas temperature) in the feed mill dryers, producing a dark-brown colored finished product. While drying at lower temperatures will produce a light- orange colored finished product, very little published information is available detailing recommended dehydration and storage conditions for dried citrus peel (Braddock and Kesterson, 1972).
Drying has a pronounced destructive effect on the carotenoid pigments in orange and tangerine peel. By experimentation with different drying temperatures, it was found that 225°F (measured at exit-stack gas emission ) was a practical temperature for the feed rates and capacity (100 lb product/hr) of the pilot Vincent dryer used in this experiment. Temperatures down to 190°F produced less pigment destruction than at 225°F, but the volume of throughput would make lower temperatures commercially impractical for most drying of citrus ña- vedo. Temperatures above 230°F caused
Table 1—Concentration of carotenoid fractions in fresh, unprocessed and dried flavedo
Pigment concentration (mg/lb peeljaDancy tangerine Pineapple orange
C MHC DHC C MHC DHCFresh flavedo 316 122 97 192 170 91Dried (225° F) 93 70 46 58 63 38
All pigment concentrations are based on absolute dry weights for comparison purposes
T \1 —JO U R N A L O F FO O D S C IE N C E -V o lu m e 3 9 (1974)

CA R O TE N 0 ID S /C l TRUS F L A V E D O - 713
increased carotenoid losses with increasing temperatures.
Even when drying at 225°F, there were considerable losses of the carotenoids which had been present in the fresh flavedo. Data presented in Table 1 show that drying at 225°F produced losses of from 40—70% (tangerine) and 60—70% (orange) of the pigments present in the fresh flavedo. In both the orange and tangerine flavedo, the carotene (C) fraction exhibited greater losses as a result of dehydration than the MHC and DHC fractions. These results for citrus differ from those of other research which has reported greater losses of xanthophylls than carotenes during dehydration of alfalfa in pilot and commercial type dryers (Livingston et al., 1970). The carotenoid pigments in alfalfa apparently are more stable to dehydration than those found in citrus flavedo, as exhibited by the 40—70% losses of Table 1 compared with losses of 10—35% cited by Livingston et al., 1970.
The comparisons of citrus flavedo pigment stability with those of alfalfa have been made for two reasons. First, part of this data was taken from research designed to evaluate the production of dried citrus flavedo for use as a chicken feed supplement to pigment egg yolks, similar to the use of dried alfalfa (Hinton, 1972). Second, the various experiments concerning alfalfa processing by Livingston’s group were performed under conditions with objectives similar to our research (Livingston et al., 1970; Knowles et al.,1968).
The effect of increasing dehydration temperatures on the carotenoids in orange flavedo can be seen by examination of Figure 1. The carotene fraction de-
Fig. 1—E ffe ct o f temperature on pigm ent concentration during dehydration o f orange flavedo.
creased from about 75 to less than 10 mg pigment/lb dried flavedo with dryer outlet temperature increases from 210—290 F. The MHC and DHC fractions also showed significant losses with increasing dehydration temperature, MHC and DHC decreasing from 85 to 5 and 58 to 3 mg pigment/lb dried flavedo, respectively, with temperature increases from 210—290°F. Similar results were obtained for tangerine flavedo. Dryer outlet temperatures of from 290— 300 F are frequently used in the commercial drying of citrus peel, and charred or darkened products are not uncommon, particularly if the peel has been pelletized. In an experiment to prevent pigment destruction at 290°F, it was found that addition of 0.02% BHA prior to dehydration at 290°F yielded C, MHC and DHC concen
trations similar to values obtained had the flavedo been dried at 260°F (Fig. 1). The beneficial effect of BHA addition prior to dehydration has been previously published for tangerine flavedo (Braddock and Kesterson, 1972). Final moisture content of the flavedo was also a factor influencing pigment destruction during dehydration. Dehydrated flavedo with high moisture contents (11—13%) showed more retention of carotenoids during drying than those with 6—7% moisture (Braddock and Kesterson, 1972).
The effectiveness of several antioxidants was tested on pigment stability during long term storage of dried tangerine and orange flavedo. The antioxidants, BHA, BHT, PG, Santoquin and lecithin did not effectively prevent dried flavedo carotenoid destruction for the first 2—3 months of room temperature storage in the presence of air and darkness. Only Santoquin caused increased retention of flavedo pigments after 3—12 months storage (Fig. 2). The C fraction of orange flavedo was preserved to the greatest extent during this storage time; however, overall destruction of this fraction during the experiment was over 60%, a loss from about 75 to 25 mg pigment/lb dried flavedo. The effectiveness of Santoquin in preventing destruction during storage of the MHC and DHC fractions was negligible (Fig. 2).
Room temperature storage of dried flavedo samples in darkness under nitrogen atmosphere showed only slightly more retention of C, MHC and DHC fractions than similar samples stored in the presence of air. There may have been sufficient residual or adsorbed oxygen in the nitrogen atmosphere samples to have caused oxidative destruction of the carot-
• C■ MHC A DHC
------- Storage at -10° F-------Room Temp., Dark
Fig. 2 —E ffe ct o f antioxidant on pigm ent concentration during storage Fig. 3 —E ffe ct o f storage at — 1 0 °F on pigment concentration o f de- o f dehydrated orange flavedo. hydrated tangerine flavedo.

714-JOURNAL OF FOOD SCIENCE-Vo/ume 39 (1974)
enoids present. The pigment losses in these samples during storage for 12 months were similar to those presented in Figure 2.
A marked stability of the C, MHC and DHC pigment fractions was noted when the dried flavedo was stored in a walk-in freezer at —10 F. Figure 3 shows very little loss of the C, MHC and DHC fractions from dried tangerine flavedo stored at —10 F compared with samples stored at room temperature. These results showed that storage of dried flavedo samples at — 10 F was much more effective in preventing carotenoid destruction than any of the antioxidant treatments used in this experiment.
CONCLUSIONSMANY COMMERCIAL citrus feed mill dryers operate at outlet temperatures of 290 F or higher, temperatures shown to be destructive to flavedo pigments. It has been shown that the greatest losses of
orange and tangerine flavedo pigments occurred during dehydration and prior to storage. Therefore, it is recommended that more care should be taken when drying citrus peel in order to preserve nutritional quality and prevent pigment destruction. Treatment of flavedo with BHA before dehydration was shown to reduce losses of pigments during drying; however, use of low temperature (-1 0 °F ) was more effective than antioxidant treatment in preserving the carotene and xanthophyll pigments during storage of dried flavedo.
REFERENCESA m m e rm a n , C .B ., H endrickson , R ., H a ll, G .M .,
Easley, J .F . and Loggins, P .E . 1 9 6 5 . The n u tritiv e value o f various fractions o f citrus pu lp and the e ffec t o f d ry ing tem perature on the n u tritiv e value o f citrus pu lp . Proc. F la . S ta te H o r t . Soc. 78: 3 07 .
A O A C . 1 9 7 0 . M e th o d 3 9 .0 2 3 . “ M ethods o f A nalys is ,” 1 1 th ed, p. 7 7 0 . Assoc. O ff. A n a l. C hem ., W ashington, D .C .
B raddock, R .J . and K esterson, J .W . 1 9 7 2 . Pig
m en t s tab ility o f d ried orange and tangerine flavedo. Proc. F la . S ta te H o r t . Soc. 8 5 : 2 1 4 .
C hapm an , H .L . , A m m e rm a n , C .B ., B aker, F .S ., H entges, J .F ., H ayes, B .W . and C unha, T .J .1 9 7 2 . C itrus feeds fo r b ee f c a ttle . B u ll. 7 5 1 . U niv . o f F la ., A gric. E x p . S tn ., Gainesville, Fla.
F lo rid a Canners Assoc. 1 9 7 2 . S ta tis tica l S um m ary . 1 9 7 1 —1 9 7 2 Season. W in te r H aven, Fla.
H in to n , C .F . 1 9 7 2 . R eflec tance co lo rim e tric evaluation o f caro teno id p igm ent deposition in bro ilers and egg yo lks. P h .D . thesis, U nivers ity o f F lo rid a , Gainesville , F la .
K now les, R .E ., L iv ingston , A .L . , N elson, J .W . and K o h le r, G .O . 1 9 6 8 . S ta b iliza tio n o f carotenoids by e th o x y q u in in harvested fresh a lfa lfa . J. A gr. F o o d C hem . 1 6: 9 8 5 .
L iv ingston , A .L . , K now les, R .E . and K o h le r , G .O . 1 9 7 0 . X a n th o p h y ll, carotene and a lph a-to co phero l s tab ility in a lfa lfa as a f fected by p ilo t and in dus tria l scale dehydra tio n . Tech. B u ll. 1 4 1 4 . A gr. Res. Serv.. U S D A .
T ing, S .V . and H en drickso n , R . 1 9 6 9 . N a tu ra l color enchancers—Orange peel carotenoids fo r orange ju ice products. F o o d Techno l. 23: 9 4 7 .
W ilson, C .W ., Bissett, O .W . and B erry , R .E . 1 9 7 1 . Three types o f c itrus peel waste as sources o f co lor. J. F o o d Sci. 36: 1 0 3 3 .
Ms received 1 /1 7 /7 4 ; accepted 2 /2 7 /7 4 .
F lo r id a A g ric u ltu ra l E x p e rim e n t S tationsJourna l Series N o . 5 2 6 0 .

L. J. J A N IC K I and H. A P P L E D O R F F o o d Science Dept., University o f Florida, I F A S , Gainesville, F L 32611
EFFECT OF BROILING, GRILL FRYING AND MICROWAVE COOKING ON MOISTURE, SOME LIPID COMPONENTS AND
TOTAL FATTY ACIDS OF GROUND BEEF
INTRODUCTIONTHE EFFECTS of cooking and heating on the fatty acid composition of foods have been reported with varying results. Kilgore and Bailey (1970) found that heating decreased the linoleic acid content of various cooking oils; however, small increases in the mean percentages of C l6 and Cl 8 saturates were reported in broiled steaks by Terrell et al. (1967). Siedler et al. (1964) claimed that braising did not influence the fatty acid composition of variety meats, and boiling prior to freeze drying had no significant effect on the composition of either free or bound lipids in beef (Giam and Dugan, 1965). Terrell et al. (1968) reported that broiling reduced C14, Cl 5 and Cl 8:3 acid content in the neutral lipid portion of beef. Campbell and Turkki (1967) reported that the concentration of linoleic acid (C l8:2) in the phospholipid fatty acids was higher in cooked than in raw pork. Schiller et al. (1973) found no change in the fatty acids from lipids in egg yolk or cakes that were cooked in microwave ovens.
The increasing consumption of fast- foods and the interest in lipids and their relationship to health justify a closer look at the lipid composition of franchise fast- foods (Sherck, 1971; Appledorf, 1973). The two most popular cooking procedures used by hamburger franchises are broiling and grill frying. Microwave ovens are gaining in popularity in large scale feeding operations to reheat conventionally prepared foods and to thaw and warm precooked frozen foods (Keefe and Goldblith, 1973).
The objectives of the present study were to compare moisture, crude fat, cholesterol and total fatty acid patterns of ground beef before and after cooking by broiling, grill frying and microwave radiation since these cooking methods are in commercial use in the fast food industry today. In addition, the effects of microwave reheating of prebroiled, frozen ground beef patties were determined.
MATERIALS & METHODSMaterials
Ground beef patties (Whopper) were obtained from the Burger King franchise outlet in Gainesville, Fla. For the moisture, crude fat and
cholesterol study, a total of six batches of 10 samples each were obtained over a 4-month period. Two raw patties from each batch served as controls, four patties were broiled, of which two were analyzed immediately and two were placed in plastic bags and frozen at ~29°C for subsequent reheating in a microwave oven; two patties were grill fried; and the remaining two patties were cooked in a microwave oven.
For the total fatty acid study, 15 patties were obtained in one lot. Three raw patties served as controls and three patties were subjected to each of the cooking treatments.
The raw beef patties measured approximately 6 in. in diameter, 1/4 in. in thickness and weighed 107.5g.Cooking methods
Broiling. The patties were broiled to commercial doneness on a Model BK-1001 broiler (Davemore Industries). The broiler utilized a gas flame and radiant heat to broil the top and bottom surfaces as each patty passed through an oven on a continuous flow belt. Cooking time for each patty was 50 sec.
Grill frying. The patties were grill fried to commercial doneness on a Model TG-72 Special McDonald’s grill (Wolf Range Corporation) at a temperature of 375°C. Natural gas was used to heat the grill surface. Cooking time for each patty was 4 min.
Microwave cooking. A raw patty was placed in a glass dish, covered with a glass plate, and cooked in a Menumaster Systems 70/50 micro- wave oven (2450 MHz). Two heating cycles of 45 sec each were used and the patty was turned over between cycles. Any drip was allowed to drain after cooking.Analyses
Percent yield was determined by weighing the patties before and after cooking. Moisture content was determined by the vacuum oven method and crude fat was determined by the petroleum ether extraction method described by the AOAC (1970).
Table 1—Heating treatments and cooking times
Treatments Cooking timeRawBroiled 50 secGrill frying 4 minMicrowave 90 secaBroiled-frozen-microwave 75 secb
a T w o h ea tin g c y c le s o f 4 5 sec each b T w o h ea tin g c y c le s , 4 5 and 3 0 sec , re sp e c t iv e
ly . T h is c o o k in g t im e d o es n o t in c lu d e th e b ro ilin g , o n ly th e m ic ro w a v e h eatin g .
Cholesterol assay. A modification of the method of Rosenthal and Jud (1958) was used to determine the total cholesterol content. Approximately 10g of the sample were extracted for 4 -5 hr in a Goldfish extraction apparatus using acetone-ethanol (1:1, v/v) as the solvent. Aliquots of the cholesterol solution was dried and the residue was dissolved in glacial acetic acid. The solution was reacted with 2 ml of ferric chloride color reagent (Rosenthal et al., 1957) at room temperature for 30 min. Cholesterol concentration was determined colorimetrically.
Total fatty acid assay. The method of Bligh and Dyer (1959) was used to extract the total lipids from the ground beef patties. The chloroform layer was concentrated to approximately 300-400 mg of total lipid and analyzed for fatty acid content by the methods for fatty acid methyl ester preparation and analysis (AOAC, 1970). Boron trifluoride-methanol was used as the methylating reagent.
Fatty acid methyl esters were determined on an F & M 400-500 biomedical gas chromatograph equipped with a Sargent model SR recorder. The separation was effected on a 5 ft X 1/4 in. glass column packed with 20% diethylene glycol succinate with chromasorb W, 80-100 mesh, used as a solid support. The column was operated at 175PC with a flow rate of 40 ml of helium per minute. Temperatures of the injection port and hydrogen flame detector were 240°C and 215°C, respectively. Fatty acid methyl esters were identified by matching their retention times with those of standard fatty acid methyl esters (Applied Science Laboratories) and logarithmic plots of retention times. Peak areas were determined by multiplying the height by the width at half height. The relative percent of each fatty acid methyl ester was determined by dividing the area under individual peaks by the total peak area.
Statistical analyses were done by analysis of variance and Duncan’s Multiple Range Test.
RESULTS & DISCUSSIONHEATING METHODS and cooking times used as treatments for the ground beef patties are presented in Table 1. Cooking times given for broiling and grill frying are those used to prepare the patties to commercial doneness as served in franchise outlets. Microwave cooking times were determined by measuring the time required to cook the patties to a comparable degree of doneness with no red meat visible in the center of the patties.
No statistical differences in mean weights and percent yields were found be-
Volum e 3 9 (1 9 7 4 )-J O U R N A L O F FO O D S C I E N C E - ! ^

716-JOURNAL OF FOOD SCIENCE-Volume 39 (1974)
Table 2—Effect of cooking method on percent yield and composition of ground beef patties3
T reatment Weight (g) Y ie ld (%) Moisture (g) Crude fa t (g) Cholesterol (mg)Cholesterol/crude
Fat X 103
Raw 107.5 ± 2 .8 a 100 a 67 .6 ± 2.3 a 18.1 ± 3.0 a 77 ± 11 a 4.47 ± 1.27 cBroiled 73.1 ± 5.3 b 67 .4 ± 4 .6 b 42 .5 1 4 .1 b 10.0 ± 1.0 be 63 ± 12 b 6 .36 ± 1.37 bGrill fried 73.3 ± 3.7 b 67 .8 ± 3.3 b 42 .4 ± 3.4 b 10.5 ± 1.2 b 62 ± 14 b 6 .02 ± 1.82 bMicrowave 64 .6 ± 2 .5 c 59 .7 ± 2 .4 c 36 .2 ± 2.2 c 8 .0 ± 1.0 d 70 ± 17 ab 9.03 ± 2 .64 aBroiled-frozen-
microwave 59 .8 ± 2.6 d 55.3 ± 2.6 d 30 .4 ± 2.9 d 8 .9 ± 1.2 c 61 ± 11 b 6 .98 ± 1.71 b
M ean ± std . d e v . fo r 1 2 p a t t ie s p e r t re a tm e n t . V a lu e s in e a ch c o lu m n fo l lo w e d b y th e sa m e le tte r a re n o t s ig n if ic a n t ly d if fe re n t (P < 0 .0 5 ) .
tween broiled and grill fried patties (Table 2). Raw beef patties cooked in a microwave oven showed lower weights and percent yields than the broiled and the grill fried patties. These results contradict those of Bollman et al. (1948) who reported only slight differences between the yields of beef patties cooked in an electronic oven (microwave) and on a gas grill, but agree with the results of Causey et al. (1950) who found that pan- broiled (grill fried) and oven-broiled beef patties had greater yields than beef patties heated in a microwave oven. The percent yields for broiled and grilled patties (Table 2) also compare favorably with the yields reported by Fruin and Van Duyne(1961) who oven-broiled beef patties with a similar fat content.
Meat patties that had been precooked by broiling, frozen and then reheated in the microwave oven weighed the least when compared to all other cooking procedures studied and correspondingly had the smallest percent yields. This lower yield would be expected since the patties in effect underwent two cooking processes.
Mean values and standard deviations for the weights of moisture, crude fat and total cholesterol are given in Table 2. Values obtained for grams of moisture for broiled and grill fried patties were not statistically different. The patties lost approximately 30% moisture during cooking. Significantly more moisture was lost in microwave heated precooked frozen patties. Microwave cooking has been reported to cause more drip in beef patties than conventional cooking (Thomas et al., 1949) and also to cause more evaporation in chicken than roasting (Wing and Alexander, 1972).
Cooking procedure affected the fat content retained in the cooked patties. The mean values of grams of crude fat were similar between the broiled and the grill fried patties and also between the broiled and the microwave reheated patties. The microwave cooked patties showed the greatest loss of crude fat. The broiled, grill fried and the microwave reheated patties possessed a brown crust caused by the browning reaction and
charring in the conventional cooking procedures. This brown crust did not occur in patties heated by microwaves alone due to the short cooking time and low surface temperature. Reheating the frozen, broiled patties with microwaves did not significantly alter the amount of crude fat in the patties.
Decreases in the total cholesterol content were observed in all cooking treatments except microwave when compared to the raw patties. The decreases, however, were not significantly different between cooking treatments.
The mean values of the fatty acids obtained from the ground beef patties for each treatment are presented in Table 3. The acids appear in the order of elution from the chromatographic column. Only
the fatty acids contributing 0.1% or more of the total fatty acids are indicated. Three individual samples from each treatment were measured in triplicate. Analysis of variance and Duncan’s Range Tests were performed to determine significant differences at the 0.05 level of probability.
Significant percent composition changes occurred in the C16, C18:1 and C18:2 fatty acids during all methods of cooking. The C l6 acid underwent the greatest percent loss during cooking and was still further reduced in the microwave reheated broiled, frozen patties. The percent of C l8:1 and C l8:2 fatty acids increased following all cooking treatments. The C18:1 and C18:2 fatty acids are probably more intimately involved as
Table 3—Effect of cooking method on relative percent fa tty acid composition of total lipid extract
TreatmentsBroiled-frozen-
Fa tty acid3 Raw Broiled Grilled Microwave microwave10 0.1 0.1 0.1 0.1 0.112 0.1 0.1 0.1 0.1 0.114 2.8 2.8 2.7 2.8 2.81 4 :1b 1.8 1.5 1.8 1.9 1.614:2 0.4 0.4 0.4 0.5 0.616 27.1 25 .4* 25 .9* 25 .6* 23 .8*16:1 5.5 5.1 5.8 6.0 5.017 1.2 1.3 1.2 1.1 1.216 :2 0.7 0.8 0.8 0.8 0.718 16.4 15.3 14.4 14.4 14.918:1 39.5 42 .0 * 42 .0 * 41 .4 * 42 .5 *18:2 2.4 3 .6 * 2 .7* 3 .1 * 4 .0 *20 0.2 0.2 0.2 0.2 0.218 :3 1.2 1.2 1.2 1.2 1.322 0.2 0.2 0.2 0.3 0.320 :4 0.3 0.3 0.4 0.6 0.8Sat. 48.1 45 .5 44 .8 44.6 43 .4Unsat. 51 .8 55.1 55.1 55.5 56.5Unsat./sat. 1.07 1.21* 1 .23* 1.24* 1.30*
N u m b e r id e n t if ie s th e c h a in le n g th an d n u m b e r a fte r c o lo n s ig n if ie s th e n u m b e r o f d o u b le b o n d s.
; 1 4 :1 + 15S ig n if ic a n t ly d if fe re n t f ro m ra w a t 0 .0 5 le ve l.
EFFECTS O F C O O K IN G M E T H O D ON G R O U N D B E E F - 1 M
structural components and phospholipids and less likely to be lost to drip.
The ratio of unsaturated to saturated fatty acids increased during all cooking treatments (Table 3). The microwave treated patties showed the largest ratio of unsaturated to saturated fatty acids.
The results of this study indicate no nutritional advantage in terms of lipid composition between broiled and grilled ground beef patties. Microwave heating, however, produces a pattie with less crude fat than the two conventional cooking procedures and might be recommended for persons on low fat diets.
REFERENCESA O A C . 1 9 7 0 . “ O ffic ia l M ethod s o f A nalysis ,”
1 1 th ed. A ssociation o f O ffic ia l A n a ly tic a l Chemists, W ashington, D .C .
A p p led o rf, H . 1 9 7 3 . N u trie n ts to go. Fast F o o d . M ay: 1 02 .
B ligh, E .G . and D y e r, W .J. 1 9 5 9 . A rap id -m e th od o f to ta l lip id e x tra c tio n and p u rific a tio n . J. B iochem . Physio l. 3 7 : 9 1 1 .
B o llm an, M .C ., B renner, S ., G o rd o n , L .E . and
L a m b e rt, M .E . 1 9 4 8 . A p p lic a tio n o f electro n ic cooking to large-scale feed ing . J. A m er. D ie t. Assn. 2 4 : 1 0 4 1 .
Causey, K ., H au srath , M .E . , R am stad , P .E . and F e n to n , F . 1 9 5 0 . E ffe c t o f thaw ing and cooking m ethods on p a la ta b ility and n u tr itive value o f f r o z e n ground m eat. 2. Beef. F o o d Res. 15: 2 49 .
C am pb ell, P .M . and T u rk k i, P .R . 1 9 6 7 . L ip ids o f raw and cooked ground b ee f and p o rk . J. F o o d Sci. 32: 1 43 .
F ru in , M .F . and V an D u y n e , F .O . 1 9 6 1 . F a t co n te n t, y ie ld , and p a la ta b ility o f ground bee f. J. A m e r. D ie t. Assn. 39: 3 17 .
G iam , I . and D ugan, L .R . Jr. 1 9 6 5 . The fa tty acid com position o f free and bo und lip ids in freeze dried m eat. J. F o o d Sci. 30: 2 6 2 .
K ee fe , R .T . and G o ld b lith , S .A . 1 9 7 3 . H osp ita l feeding via m icrow ave k itch en e tts—A cost analysis. F o o d Techno l. 2 7 (8 ): 1 6 .
K ilg ore , L . and B ailey , M . 1 9 7 0 . D eg radatio n o f lin o le ic acid during p o ta to fry in g . J. A m er. D ie t. Assn. 56: 1 3 0 .
K ram er, A . and Tw igg, B .A . 1 9 7 0 . “ Q u a lity C o n tro l fo r the F o o d In d u s try .” A v i Pub. C o., W estport, Conn.
R osen thal, H .L . and Jud , L . 1 9 5 8 . M icroestim atio n o f serum cholestero l and esters on fin gertip b lood . J. Lab . & C lin . M ed . 51: 1 4 3 .
R osen thal, H .L . , P flu ke , M .L . and Buscaglia, S. 1 9 5 7 . A stable iro n reagent fo r determ inatio n o f cholesterol. J . L a b . & C lin . M ed . 50: 1 43 .
Sherck, C .K . 1 9 7 1 . Changes in fo o d consum ptio n patterns. Fo od Techno l. 25: 9 1 4 .
S chiller, E .A ., P ra tt, D .E . and R eber, E .F .1 9 7 3 . L ip id changes in egg yolks and cakes baked in m icrow ave ovens. J. A m er. D ie t. Assn. 6 2 : 5 2 9 .
S iedler, A .J ., S pringer, D ., S lover, H .T . and K iz la itis , L . 1 9 6 4 . N u tr ie n t c o n te n t o f varie ty m eats. 3 . F a t ty acid com position o f lip ids o f certa in raw and cooked variety m eats. J. F o o d Sci. 29: 8 7 7 .
T e rre ll, R .N ., Lew is , R .W ., Cassens, R .G . and B ray , R .W . 1 9 6 7 . F a t ty acid com position o f bovine subcutaneous fa t depots determ in ed b y gas-liquid chrom ato grap hy. J. F o o d Sci. 32: 5 16 .
T e rre ll, R .N ., Suess, G .C ., Cassens, R .G . and B ray, R .W . 1 9 6 8 . B ro ilin g , sex, and in te rrelationships w ith carcass and g row th characteristics and th e ir e ffec t on the ne u tra l and phospho lip id fa t ty acids o f the bovine longissimus dorsi, J. F o o d Sci. 33: 5 62 .
Thom as, M .H ., B renner, S ., E a to n , A . and Craig, V . 1 9 4 9 . E ffe c t o f e lectronic cooking on n u tritiv e value o f foods. J. A m e r. D ie t. Assn. 2 5 : 39.
W ing, R .W . and A lexan d er, J .C . 1 9 7 2 . E ffe c t o f m icrow ave heating o n v ita m in B 6 re te n tio n in ch icken. J. A m e r. D ie t. Assn. 61: 6 6 1 .
Ms received 1 2 /2 6 /7 3 ; revised 3 /4 /7 4 ; accepted3 /1 3 /7 4 ,__________________________________________
F lo r id a A g ric u ltu ra l E x p e rim e n t S tationsJourna l Series N o . 5 0 6 1 .

R. C. W ALD M AN , D. O. W E S T E R B E R G and S. S IM O N
Union Carbide Corp., Films-Packaging Div., F o o d Science Institute, Chicago, IL 60638
INFLUENCE OF CURING INGREDIENTS AND STORAGE TIME ON THE QUALITY OF PREBLENDED SAUSAGE MEATS AND FRANKFURTERS
INTRODUCTIONPREBLENDING of meat and other ingredient materials is a relatively new addition to the manufacturing process in many sausage plants. This technique has effectively converted sausage making from a batchwise relatively small, 100-lb multiple unit chopper (silent cutter) to a relatively larger 500- or 1000-lb multiple unit blender oriented process. Preblending allows more efficient materials handling and compositional control. This change in technique also requires the operator to consider a new array of technical factors such as: physical arrangem ent of equipment, blending procedure (mechanical), preblend composition, and holding time and temperature of preblends.
Little information on preblending of meats is available in the literature. Shannon (1967) reported that very little difference in emulsion stability existed between mixer emulsified and cutter emulsified blends of salted hot-boned beef. A general discussion of preblending techniques and problems was presented by Webb (1968). Acton and Saffle (1969) reported that frankfurters prepared with meat trimmings preblended with salt were more stable and could emulsify more fat than frankfurters prepared without presalting. Investigation of meat emulsions has been more extensive. The work of Borton et al. (1968a) describes the reduction in emulsifying capacity of porcine muscle associated with bacterial development and (Borton et al., 1968b) emulsifying capacities of 13 commercial sausage meat trimmings. Froning and Janky(1971) showed that adjusting pH of mechanically deboned turkey meat and/or preblending with salt improved emulsifying ability of the meat. Reviews by Saffle (1968) and Sulzbacher (1973) present an excellent summary of knowledge in this field.
The present study was designed to investigate the influence of selected meat trimming storage conditions on the quality of prepared frankfurters.
EXPERIMENTALPreparation of raw materials
Beef chucks, beef plates, regular pork trimmings (“50% lean”) and pork jowls were selected as commonly used meat ingredients in
comminuted products. The meat trimmings were prepared for three (duplicated) test series consisting of:(a) Meat batches stored with salt;(b) Meat batches stored with salt plus sodium
nitrite and sodium nitrate; and(c) Meat batches stored with salt, sodium ni
trite, sodium nitrate plus sodium isoascorbate.
These materials were used in quantities indicated in the frankfurter formulation shown in Table 1. The beef chucks were ground through a 6.4 mm plate and the beef plates, regular pork trimmings and jowls through a 25 mm plate. Each raw material was thoroughly mixed in lots large enough for 13 batches containing 22.7 kg of meat per batch. Individual raw materials were separated into three primary units (90.8 kg meat/primary unit) and mixed with 0, 1.5 or 3% salt by weight. Meats mixed at each salt level were divided into four secondary units (22.7 kg meat/secondary unit). Each secondary unit was then put into a polyethylene bag and stored in a 4.4°C cooler. A control, zero time frankfurter batch (22.7 kg meat) containing 3% salt was prepared ar.d processed according to the procedure described in the next section.
Table 1—Frankfurter form ulation3
ItemAm ount
(kg)Beef chuck 9.1Beef plate 4.52Regular pork trimmings 5.65Pork jowls 3.4Water 5.65Salt 0 .6805Commercial spice mix 0.1415Sodium nitrate 0.0105Sodium nitrite 0.0035Sodium isoascorbate 0.0125
a Final batch composition
Table 2--Smokehouse process schedule3
Dry WetTim e Bulb Bulb R .H .(m in) (°C> <°C) <%)
30 54.5 40 .0 4230 65.6 48 .9 4130 76.7 57.8 38
a F in a l in te rn a l te m p e ra tu re s a fte r co o k in gw e re b etw een 6 8 .3 —7 1 .1 C .
Raw materials were removed from storage after 1, 2, 3 and 4 days of storage and 22.7 kg meat batches were used to prepare frankfurters from meats premixec at each salt level.
In a second test series using the same mixing procedure, 10.64g sodium nitrate and 3.545g sodium nitrite (maximum allowed level, Code of Federal Register, 1970) were added per 22.7 kg of meat, in combination with the different concentrations of salt. In a third test series sodium isoascorbate (12.5 g/22.7 kg meat) was added along with the other additives. Curing ingredients were not added to premixed meats without salt.Comminuting and processing
Meat ingredients (Table 1) were added to a Kramer Grebe Cut-Mix along with water, spice and cures. Salt was added as needed to sustain a 3% salt level per meat block. Then the mixture was chopped at 24 rpm until the temperature of the emulsion reached 10° C. This was accomplished in about 2.5 min. Emulsion was minced through a Mincemaster (28 h.p., 3600 rpm, Griffith Laboratories, Inc.) fitted with a1.4 mm plate and then stuffed and linked into Size 25 Precision NOJAX casing (Films-Packag- ing Div., Union Carbide Corp.) to recommended diameter (23 mm) via a Frank-A-Matic machine (Townsend Engineering Corp.). One22.7 kg batch was prepared according to this procedure for each salt level at the end of each storage period.
Upon stuffing and linking, the uncooked frankfurters from different batches were hung on smokesticks, loaded on a smoke cage, and then cooked in an air conditioned smokehouse (Drying Systems, Inc.). The processing schedule is tabulated in Table 2. Product was exposed to a controlled level of smoke (60% density) for 5 min at the beginning of the processing cycle. After reaching 68.5°C internal temperature (IT), the product was showered with cold tap water for 8 min and then placed in a 4.4°C cooler overnight.
The casings were removed with a sanitized Timesaver (Lathan Manufacturing Co.) peeler and the skinless product coLected in polyethylene bags. Appropriate samples of finished product that were collected for analysis and taste panel evaluations were vacuum packaged in mylar-saran-polyethylene laminated pouches and stored in a — 1°C cooler.Chemical & microbiological analyses
A 1.4-kg sample was taken from each raw material prior to mixing with the various levels of salt or curing additives. Moisture, protein, fat, pH were run on each sample according to AO AC (1970) methods and 2-thiobarbituric acid (TBA) analyses were conducted according to Tarladgis et al. (1960). A 1-kg sample was obtained from raw materials premixed at each salt level when taken out of storage and TBA, pH, salt, sodium nitrite and sodium isoascor-
IWS—J O U R N A L OF FO O D S C /E N C E -V o lu m e 3 9 (1974)

Q U A L I T Y O F P R E B L E N D E D S A U S A G E M E A T S - 719
bate levels determined. The TBA analysis was omitted when samples contained sodium nitrite.
Total counts of aerobic and anaerobic bacteria were determined on all raw material samples. Microbiological tests were conducted as outlined in Recommended Methods for the Microbiological Examination o f Foods (APHA,1958). Finished product samples were analyzed for moisture, protein, fat, salt, pH, sodium nitrite according to AOAC (1970) methods, and sodium isoascorbate (Merck, 1959). Total and nitroso heme pigment concentrations were determined following the method of Hornsey(1956). Products from all treatments were subjected to the consumer cook test described by Tauber and Lloyd (1947).Taste panel evaluations
Vacuum packaged products held at -1°C were evaluated over a 4 wk period by a 10 member taste panel. Samples were tasted immediately after manufacture and at 1 wk intervals and ranked on a hedonic scale from 1 to 9 where 1 = dislike extremely and 9 = like extremely.
Analysis of variance as described by Steel and Torrie (1960) for factorial experiments was used to determine significance of chemical and bacteriological changes resulting from additives such as salt, cure and isoascorbate on raw materials and frankfurters. Duncan’s New Multiple Range Test (Duncan, 1955) was employed to compare significance among means.
RESULTS & DISCUSSIONRaw materials
Means of chemical and bacteriological analyses over all treatments within raw materials are shown in Table 3. Beef chucks and plates had lower (P < 0.05) pH values than pork jowls or trimmings. Differences in overall TBA values among materials were not statistically significant (P < 0.05). However, among raw materials, chucks had the highest TBA values when averaged over all treatments. Beef chucks, undoubtedly, contained greater
Table 3—Raw material means overall treatmentsaRaw materials
VariableBeef
chucksBeef
platesPorkjow ls
Porktrimmings
pH 5.94 6 .18 6.38a 6.33aT B A 1.39a 1.11a 1.09a 0.82aSodium nitrite, ppmb 100 138 161 151Sodium isoascorbate, ppmc 249 155 123 202Aerobic bacteria, log
organisms/g 5.88a 6.44b 5.70a 6.44bAnaerobic bacteria, log
organisms/g 6.09 6.17 5.71 5.96
a M eans o n th e sam e lin e w ith a co m m o n le tte r are n o t s ig n if ic a n t ly d if fe re n t {P < 0 .0 5 ) .
b In it ia l a m o u n t ad ded w a s 1 56 ppm c In it ia l a m o u n t added w a s 5 4 6 ppm
Table 4 —Influence of raw material storage time on chemical and bacteriological changes in raw materials and finished frankfurters3
Storage Tim e (days)
Variable 0 1 2 3 4
Raw materialspH 6 .1 5ab 6.09b 6.25ab 6.28a 6.28aT B A 0.65a 0.87a 1.09a 1.27ab 1.64bResidual sodium nitrite , ppmb 143a 142a 135ab 128bResidual sodium isoascorbate, ppmc 165a 214b 177ab 172abAerobic bacteria, log organisms/g 5.62a 5.57a 6.05a 6.12a 6 .72Anaerobic bacteria, log organisms/g 5.51 6.14a 6.01b 6.18a 5.97b
Finished frankfurterspH 5.88a 5.93a 5.94a 5.94a 5.88aResidual sodium nitrite , ppm 32ab 34a 31 ab 28ab 27bResidual sodium isoascorbate, ppm 386 204a 236a 207a 234aPigment conversion, % 85.6a 86.0a 86.8a 86.9a 87.3aConsumer cook y ie ld , % 100.5a 100.1a 100.6a 100.7a 100.0aTaste panel rating*3 6.2a 6.0a 5.4ab 4.8b 4.5b
a M eans on th e sam e lin e w ith a c o m m o n le tte r a re n o t s ig n if ic a n t ly d if f e re n t (P < 0 .0 5 ) . b In it ia l a m o u n t added w a s 1 5 6 ppm c In it ia l a m o u n t added w a s 5 4 6 ppmd T a s te panel ra tin g s based on a h e d o n ic sca le f ro m 1 (d is l ik e e x tre m e ly ) to 9 ( l ik e e x tre m e ly )
concentrations of heme pigments than the other raw materials used in this study. The higher TBA value in chucks was most likely related to the findings of Tappel(1955) who reported that heme pigments were associated with accelerated production of carbonyl compounds and propagation of autoxidation. Ellis et al. (1968) studied frozen ground pork mixtures containing 4% NaCl and found a sharp increase in the rate of autoxidation as the lean content of the mixtures increased.
All raw materials differed significantly (P < 0.05) in residual sodium nitrite concentrations. Beef chucks and plates had lower residual levels than pork materials. The ranking of these means appeared to parallel normal myoglobin concentrations in the various meats. Ginger et al. (1954) found the ratio of myoglobin in beef muscle to dark colored pork muscle was 2.6 to 1. Beef chucks and pork trimmings had greater (P < 0.05) residual isoascorbate concentrations than beef plates and pork jowls.
Aerobic bacteria populations in beef plates and pork trimmings were higher (P < 0.01) than those found in beef chucks and pork jowls. The populations, therefore, correlated with the amount of handling and surfaces exposed in boning necessary to prepare the meats for further processing. All meats differed (P < 0.05) in anaerobic bacteria populations. The anaerobic growth pattern was similar to that found for aerobic bacteria.Preblend storage time
The pH of the raw materials (Table 4) generally remained the same (P < 0.05) during the storage time. TBA values increased after each additional day of storage. The TBA number at 4 days was significantly higher (P < 0.01) than those at zero time or 1 day of storage. Conversely, sodium nitrite concentrations decreased (P < 0.01) as storage time increased. Levels at 1 and 2 days were significantly higher than that after 4 days. The residual level of sodium isoascorbate after 1 day of storage was less (P < 0.05) than that at 2 days but not significantly different from those at 3 and 4 days. No explanation was found for the low level at 1 day.
Aerobic bacteria populations increased with storage time (Table 4). Populations through the third day were not statistically different. However, a fourfold increase in growth occurred between the third and fourth day of storage. Anaerobic growth showed an overall increase through the third day but a significant drop in population at the fourth day. The decrease in anaerobic numbers coincided with the sharp increase in the aerobic population.
Storage of raw materials did not appear to significantly (P < 0.05) influence residual concentrations of sodium nitrite or isoascorbate in finished frank

720-JOURNAL OF FOOD SCIENCE-Volume 39 (1974)
furters (Table 4). Similarly, the conversion of heme pigments to the nitroso form and emulsion stability, as measured by the consumer cook test, were neither improved nor adversely affected by raw material storage. Taste panel evaluations indicated that the desirability of the franks decreased (P < 0.01) consistently as raw material storage time increased. It was apparent from comments made by the panelists that the undesirable effect of storage on taste was influenced by increased rancidity and microbial activity in the raw materials.
Preblending with saltBoth 1.5 and 3.0% salt levels (Table 5)
resulted in a slight increase (P < 0.05) in pH of raw meat compared with unsalted controls. Increases in salt concentration promoted greater (P < 0.01) rates of rancidity development. The addition of 1.5% salt resulted in a sharp rise in TBA values over unsalted materials. Although the TBA value in material mixed with 3% salt was higher than in those mixed with 1.5% salt, the increase was not statistically significant. The practical effect, however, of increased salt concentration and the resultant elevation of rancidity level on product quality was evident in taste panel evaluations (see section on Taste Panel Evaluations and Tables 8 and 9). Our observations support the work of Ellis et al. (1968) who found rancidity in frozen pork materials mixed with 2, 4 and 6% salt.
Residual levels of both sodium nitrite and isoascorbate were higher (P < 0.01) in meats mixed with 3% than 1.5% salt. The higher residual concentrations in raw materials, however, did not result in significantly different (P < 0.05) residuals in finished franks or in greater conversion of heme pigments to the nitroso forms. The consumer cook test indicated no significant difference in stability due to presalting. Using a different criterion for emulsion stability, Acton and Saffle (1969) studied frankfurter emulsions containing prerigor and post rigor cow meat preblended with salt, ice, nitrite and ascorbic acid and held at 3°C for 14 to 24 hr before use. They found preblended meats produced emulsions which were stable during smokehouse processing at a fat level higher than corresponding nonpre- blended controls.
Salt concentration had a highly significant inhibitory effect on aerobic and anaerobic bacteria counts (Table 5). Populations of both types of organisms decreased as the concentration of salt was increased; the decrease in counts at the 1.5% level was nearly as great as the 3.0% salt level. These data indicated that the overall quality of raw materials was most effectively preserved by the 1.5% salt level.
Influence of curing saltsMeats premixed with sodium nitrite
(Table 6) had a significantly higher (P < 0.01) pH than those mixed with salt alone or in combination with sodium isoascorbate. Residual concentrations of sodium nitrite in preblends did not decrease from the initial 156 ppm just prior to final product manufacturing. The addition of sodium isoascorbate to preblends resulted in a drop (P < 0.01) in residual sodium nitrite to approximately 120 ppm. The concentration of sodium nitrite in finished franks when added at the time of manufacture was not significantly greater than when added to preblends and stored. Concentration in finished franks
was at the lowest level when isoascorbate was used in preblending. Although the overall difference among treatments was not significant (P < 0.05), the residual level of nitrite in finished products followed the pattern established in preblended raw materials. Pigment conversion to the cured form was slightly more efficient (P < 0.01) when sodium nitrite was added at the time of manufacture. The addition of isoascorbate to preblends did not affect the conversion of pigment from that obtained from meats premixed with nitrite alone.
Materials premixed with sodium nitrite alone and in combination with isoascorbate had significantly higher (P < 0.05)
Table 5 —Effect of salt levels3Salt level added to raw materials (%)
Variable 0 1.5 3 .0Raw materials
pH 6.11 6.26a 6.26aT B A 0.61 1.2a 1.51aResidual sodium nitrite, ppmb 131 143Residual sodium isoascorbate, ppmc 158 206Aerobic bacteria, log organisms/g 6.56 5.96a 5.69aAnaerobic bacteria, log organisms/g 6.36 5.77 5.32
Finished frankfurterspH 5.93a 5.92a 5.89aResidual sodium nitrite, ppm 29a 30a 32aResidual sodium isoascorbate, ppm 274a 249a 227aPigment conversion, % 87.4a 86.2a 86.0aConsumer cook y ie ld , % 100.1a 100.5a 100.5aTaste panel rating'1 5.0a 5.7a 5.5a
a M eans on the sam e line w ith a com m on letter are not sig n ifican tly d ifferen t (P < 0 .0 5 ).
D In itia l am o unt added w as 156 ppm ® In itial am o un t added w as 5 4 6 ppma T aste panel ratings based on a hedo nic scale from 1 (d islike estrem ely)
to 9 (lik e extrem ely)
Table 6--Effect of curing additivesa
Additives
Variable Salt only Sodium nitriteSodium nitrite +
Sodium isoascorbateRaw materials
PH 6.01a 6 .49 6.13aResidual sodium nitrite , ppmb (156) 155 119Aerobic bacteria, log organisms/g 5.89 6.36a 6.30aAnaerobic bacteria, log organisms/g 5.13 6 .06 6 .26
Finished frankfurterspH 5.86a 5.87a 6 .0Residual sodium nitrite, ppm 33a 30ab 28bPigment conversion, % 89 .0 85.4a 85.1aTaste panel rating0 5.6a 5.2a 5.4a
^ M eans on the sam e line w ith a com m on letter are not sig n ifican tly d iffe ren t (P < 0 .0 5 ).D In itial am o unt added w as 156 ppm
Taste panel ratings based on a hedo nic scale from 1 (d islike extrem ely) to 9 (lik e extrem ely)

Q U A L I T Y O F P R E B L E N D E D S A U S A G E M E A T S - 1 2 1
populations of aerobic bacteria than those mixed only with salt. Anaerobes were more numerous (P < 0.01) in meats preblended with nitrite than salt alone and were even more (P < 0.01 ) prolific in meats containing both nitrite and isoascorbate.
A number of investigators have reported that nitrite has an inhibitory action on microbial growth. For the most part, studies such as those of Duncan and Foster (1968), Tarr (1942), Johnston et al. (1969) investigated the inhibitory effect of nitrite during heat processing of meat products or incubation of certain putrefactive or pathogenic strains. Duncan and Foster (1968) found spores (putrefactive anaerobe 3679 strain h) that survived 98 C for 10 min were less tolerant of curing salts than were unheated spores. Pivnick et al. (1970) concluded that the main value of nitrite in stabilizing canned, cured shelf-stable meats
appears to reside in its ability to aid in the prevention of growth from spores that survive heat processing and germinate during post-processing storage. Gough and Alford (1965) found several strains of C los trid ium perfringens survive and grow in concentrations of curing salts considerably higher than those used in normal curing operations. The greater numbers of aerobic and anaerobic bacteria in meats premixed with nitrite alone or in combination with isoascorbate than in meats mixed only with salt were not readily explained.
When averaged overall treatments, taste panel evaluations did not appear to be significantly (P < 0.05) influenced by the addition of curing salts to preblends. A more detailed study of taste panel data indicated that this was not the case.
Taste panel evaluationsFinished frankfurters were vacuum
Table 7 —Effect of frankfurter shelf storage and additives on taste panel evaluations overall raw material storage times3
oait Storage time (wk)Additives level (%) 0 1 2 3 4
Salt only 0 6.5 5.9 5.7 5.6 5.11.5 6.2 5 .5 5.2 5.3 4.63.0 5.6 5.2 4.7 4 .7 3.8
(control )b 7.5 6.6 6 .8 7.2 5.6Salt, sodium nitrite 0 4 .8 4 .5 4.1 3.6 3.6
1.5 5.9 6.1 5.5 5.6 4.93.0 6.3 5.6 5.3 5.6 5.0
(control )b 7.2 5.3 5.4 4.6 4 .4Salt, sodium nitrite. 0 4 .8 4.2 4 .2 3.9 3 .4Sodium isoascorbate 1.5 6 .2 5.9 6 .0 5.6 5.1
3.0 6.2 5.7 5.6 5.2 5.2(control )b 7.1 5.8 6.8 6.6 5.9
A ll treatments 6.1 5.5 5 .4 5.2 4.7
a T a s te p a n e l ra t in g s b ased on a h e d o n ic s c a le f ro m 1 ( d is l ik e e x tre m e - ly ) to 9 ( l ik e e x t re m e ly )
b C o n t ro l f r a n k s p re p a re d fro m m e a ts n o t p re b le n d e d an d s to re d
Table 8 —Effect of raw material storage time and additives on taste panel evaluation3
AdditivesSalt
level (%)
Storage time (days)
0 1 (control)
2 3 4
Salt only 0 6.7 6.7 6.6 5.7 4.21.5 6.1 5.6 5.4 4.53 .0 6 .0 5.1 4.2 3.8
Salt, sodium nitrite 0 5.6 6.0 3.9 3.4 3.21.5 5.9 5.4 5.3 6.03 .0 5.8 5.7 5.1 5.2
Salt, sodium nitrite, 0 6.5 5.7 4.9 3.2 3.1Sodium isoascorbate 1.5 6.2 6 .0 5.8 5.4
3 .0 6.0 5.6 5.8 5.23 T a s te p a n e l ra t in g s b ased o n a h e d o n ic sc a le f ro m 1 (d is l ik e e x t re m e
ly ) to 9 ( l ik e e x t re m e ly )
packaged and evaluated weekly over a4-wk period. Overall panel ratings (Table7) consistently declined as shelf storage increased. Zero time, control franks were considered more desirable than any of the stored products. Evaluations thereafter did not decrease significantly until the fourth week of storage.
A breakdown of taste panel evaluations within raw material storage time, curing additives and salt levels employed in this study is shown in Table 8. When salt alone was added to preblends, franks were generally less desirable in taste as storage time and salt level increased. This observation was consistent with the main effect of these factors as discussed above. However, the influence of sodium nitrite addition to preblends on panel evaluations was not evident when considering the overall effect of curing additives. This was due to sharply lower ratings within the salt plus nitrite treatment for control product manufactured at the time of preblending.
Examination of the data within treatments demonstrated a clear advantage in the addition of sodium nitrite to meats premixed with salt. Moreover, the suggestion discussed above that the 1.5% level of salt was more desirable than 3% was supported by within treatment taste panel means. Ratings showed a greater decline in relation to raw material storage time when products were premixed with 3% rather than 1.5% salt. Panel ratings indicated that franks prepared from materials containing only salt, both 1.5 and 3%, deteriorated to a greater degree with raw material storage time than those containing nitrite or nitrite plus isoascorbate in addition to salt. No real improvement in panel ratings due to the addition of isoascorbate to raw materials was evident over that obtained with nitrite alone.
Taste panel evaluation means within finished product storage time, curing additives and salt levels and overall raw material storage times are shown in Table7. The beneficial effect of preblending with nitrite on product shelf life is evident in these data. Conversely, the adverse effect of using salt alone also is apparent. In the salt plus nitrite treatment, ratings fo r co n tro l franks prepared from raw materials at the time of preblending decreased to an unsatisfactory level after a shelf life of 3 wk. Franks prepared from meats preblended with sodium nitrite alone or in combination with isoascorbate were rated at or above a satisfactory level (5.0) throughout the4-wk storage period. Within the latter treatments, franks prepared from meats preblended without salt were rated unsatisfactory immediately after manufacture. However, unsalted control products within the salt only treatment were

722-JOURNAL OF FOOD SCIENCE- Volume 39(1974)
rated within the satisfactory range throughout the 4-wk shelf life period.
The beneficial effect of sodium nitrite in preserving the quality of meats preblended with salt found in this study appears to differ with the findings of other investigators, recognizing that experimental conditions were at a variance. Ellis et al. (1968) reported that sodium nitrite in combination with sodium chloride caused a greater oxidative effect in frozen pork mixtures than sodium chloride alone. On the other hand, a bacteriostatic effect was ruled out since materials preblended with sodium nitrite had significantly greater numbers of aerobes and anaerobes than those containing sodium chloride alone. Comments by taste panel members indicated that franks prepared from meats premixed only with salt became objectionably rancid while this did not occur when nitrite was added at preblending.
REFERENCESA cto n , J .C . and S affle , R .L . 1 9 6 9 . Preblended
and prerigor m eat in sausage emulsions. F o o d Techno l. 23: 3 67 .
A O A C . 1 9 7 0 . “ O ffic ia l M ethods o f A nalysis ,” 1 1 th ed. Association o f O ffic ia l A gricu ltu ra l Chemists, W ashington, D .C .
A P H A . 1 9 5 8 . “ R ecom m ended M ethods fo r the M icrob io lo g ica l E x a m in a tio n o f F o o d s ,” A m erican Pub lic H ea lth Association, N .Y .
B orton , R .J ., W ebb, N .B . and B ratz ler, L .J . 1 9 6 8 a . Th e e ffec t o f m icroorganism s on the em uls ify ing capacity and e x tra c t release volum e o f fresh porc ine tissues. F o o d Techno l. 22: 94 .
B orton , R .J ., W ebb, N .B . and B ra tz le r, L .J . 1 9 6 8 b , E m uls ify in g capacities and em ulsion s tab ility o f d ilu te m eat slurries fro m various m eat trim m ings. F o o d Techno l. 2 2 : 5 06 .
Code o f Federal Regulations. 1 9 7 0 . A n im a l and A n im a l Products, C hapter I I I S ection 3 1 8 .7 , R ev. O ct. 2 0 , T it le 9.
D uncan , C .L . and Foster, E .M . 1 9 6 8 . R o le o f curing agents in the preservation o f shelf stable canned m ea t products. A p p l. M ic ro b io l. 16: 4 0 1 .
D uncan , D .B . 1 9 5 5 . M u ltip le range and m u lt ip le F tests. B iom etrics 1 1: 1 .
E llis , R ., C urvie, G .T ., T h o rn to n , F .E ., B o llin ger, N .C . and Gaddis, A .M . 1 9 6 8 . C arbonyls in ox id iz in g fa t. 11 . Th e e ffec t o f the p ro o x id a n t ac tiv ity o f sodium chlo ride on po rk tissue. J . F o o d Sci. 3 3 : 5 55 .
Fron ing , G .W . and Jan ky , D . 1 9 7 1 . E ffe c t o f p H and salt p reblend ing on em uls ify ing characteristics o f m echan ically deboned tu rk e y fram e m eat. P o u ltry Sci. 50: 1 2 0 6 .
G inger, I .D . , W ilson, G .D . and Schw eigert, B .S. 1 9 5 4 . C hem ical studies w ith p u rified m etm yo g lo b in . A gr. & F o o d C hem . 10: 1 0 3 7 .
G ough, B .J. and A lfo rd , J .A . 1 9 6 5 . E ffe c t o f curing agents on the g row th and survival o f foo d poisoning strains o f C lo s trid iu m per- fringens. J. Fo o d Sci. 30: 1 0 2 5 .
H ornsey , H .C . 1 9 5 6 . The color o f cooked cured p o rk . 1 . E s tim a tio n o f th e n itric oxide-haem pigm ents. J . Sci. F o o d & A gr. 7: 5 34 .
Johnston, M .A ., P ivn ick , H . and Sam son, J .A .1 9 6 9 . In h ib it io n o f C los trid ium b o tu lin u m
b y sodium n itr ite in a bacterio log ica l m ed iu m and in m eat. Can. In s t. F o o d T e c h no l. J. 2: 52.
M e rck and C o . 1 9 5 9 . C om m erc ia l C o m m u n ica tio n . M e rc k and C o ., In c ., R ah w a y , N .J .
P ivn ick , H ., Johnston, M .A ., Tacher, C. and Loynes, R . 1 9 7 0 . E ffe c t o f n itr ite on destru ction and germ ina tion o f C lo s trid iu m b o tu lin u m and pu tre factive anaerobes 3 6 7 9 and 3 6 7 9h in m eat and in b u ffe r . Can. In s t. F o o d Techno l. J . 3: 1 03 .
S affle , R .L . 1 9 6 8 . M e a t em ulsions. In “ A d vances in F o o d R esearch ,” E d . Chichester, C .O ., M ra k , E .M . and S tew ard , G .F . V o l 1 6 , p. 1 0 5 . A cadem ic Press, N ew Y o rk .
Shannon, W .J. 1 9 6 7 . R educe y o u r sausage op eration to w ritin g . The N a tio n a l Prov. 1 5 6 (9 ): 7 6 .
S teel, R .G .D . and T o rr ie , J .H . 1 9 6 0 . “ P rincip les and Procedures o f S ta tis tics .” M c G ra w -H ill B o o k C o ., In c ., N e w Y o rk .
Sulzbacher, W .L . 1 9 7 3 . M e a t em ulsions. J. Sci. F o o d & A gr. 24: 589 .
Tappel, A .L . 1 9 5 5 . U nsatu ra ted lip id o x id a tio n cata lized b y hem atin com pounds. J. B io l. C hem . 2 17 : 7 2 1 .
Tarladgis, B .G ., W atts, B .M . and Y o u n a th a n , M .T . 1 9 6 0 . A d is tilla tio n m eth o d fo r the qu an tita tiv e d e te rm in a tio n o f m alona lde- hyde in rancid foods. J. A m . O il C hem . Soc. 37: 44.
T a rr, H .L .A . 1 9 4 2 . Th e actions o f n itr ite on bacteria: F u rth e r experim ents . J. F ish . Res. Bd. Can. 6: 74.
Tauber, F .W . and L lo y d , J .H . 1 9 4 7 . V a ria tio n s in com position o f fran k fu rte rs w ith special reference to cooking changes. Fo o d Res. 12: 158 .
W ebb, N .B . 1 9 6 8 . P re fo rm u la tio n o f sausage raw m ateria ls. Proc. 21s t A n n . R ec ip ro ca l M e at C onference, p . 3 7 1 . N a tio n a l L iv e stock and M eat B oard , Chicago.
M s received 1 0 /3 1 /7 3 ; revised 2 /7 /7 4 ; accepted2 /1 0 /7 4 .

D. L. H U F F M A N
Dept, o f Animat and Dairy Sciences, Auburn University, A uburn, A L 36830
EFFECT OF GAS ATMOSPHERES O N MICROBIAL Q UALITY OF PORK
INTRODUCTIONMICROBIAL SPOILAGE of fresh meat is one of the major problems of the meat industry. The average storage and retail shelf life of fresh pork is approximately 10—14 days. The limiting factors are bacterial spoilage and deterioration of desired color.
Adams and Huffman (1972) have reviewed the literature and concluded that the major spoilage organisms are aerobic; however, lactic acid producing bacteria have been shown to increase on fresh meats packaged anaerobically or in gas impermeable films (Jaye et al., 1962; Gardner et al., 1967; Baran et al., 1970; Pierson et al., 1970).
Adams and Huffman (1972) reported that bacterial growth was significantly reduced by storing pork chops at —2.2°C rather than 2.2°C. When similar studies were undertaken using commercial showcases the meat samples held at —2.2°C froze during normal cycling of the refrigeration system. A temperature of —1.1 °C was selected for this study.
Brown and Huggett (1968) have studied the effect of various partial pressures of oxygen on microbial growth and concluded that oxygen is toxic for many forms of life; however, much is to be learned about the mechanisms by which oxygen exerts its toxicity at the cell level. Oxygen concentrations must be drastically reduced to affect aerobic bacterial growth according to Gardner et al.(1967), King and Nagel (1967), Shaw and Nicol (1969) and Ledward et al. (1971).
Clark and Lentz (1969) reported that carbon dioxide inhibition of aerobic organisms increased as temperatures were lowered. Scott and Smith (1971) reported that carbon dioxide lowered bacterial counts of cottage cheese significantly, but nitrogen atmospheres were not effective.
In view of the current interest in central cutting of fresh meat and related need for improving storage and shelf life of red meats, the technology of processing, storage and distribution of fresh meats must be improved.
The objective of this study was to determine growth patterns of microorganisms on pork chops stored in air, oxygen, nitrogen, carbon dioxide and a gas mixture composed of 70% N2 , 25% C02 and 5% 0 2.
MATERIALS & METHODSPreparation and storage of samples
Ten 100 kg pigs were slaughtered, chilled at2-3°C for 48 hr and divided at random into two equal groups. During removal of loins and processing of chops strict sanitary procedures were followed. Loins and chops were handled with plastic gloves and all equipment was sanitized with 200 ppm of chlorine before each use.
In experiment 1, both loins from each of five pigs were vacuum packaged (50.8 cm Hg) in barrier bags (barrier bags are five layer laminated plastic bags that provide minimal transmission of vapor and gases) 2 days post- slaughter and stored at 2 -4 °C for 5 days. Seven days post-slaughter loins were cut into 1.27 cm thick pork chops and five chops were allotted at random to each treatment group from each animal.
In experiment 2, both loins from each of five pigs were cut into 1.27 cm thick chops 2 days post-slaughter and five chops were allotted at random to each treatment group from each animal.
Treatments used in this study were: air, 0 2, N2, C 02 and a gas mixture composed of 70% N2, 25% C 02 and 5% 0 2. Each chop was individually packaged in a saran bag. The appropriate gas mixture was produced using a three module National simet proportional mixing valve. Each saran bag was vacuumized at 50.8 cm Hg, then the appropriate gas was forced into the bag by pressure until filled. The vacuum was pulled again and the gas was forced into the bag again until the bag was approximately half inflated. The end of the bag was then closed twice with standard metal butt-type closures and stored at - l . l ° C in the dark until sampled. In both experiments 1 and 2 one chop from each treatment from each animal was sampled for microbial growth at 7, 14, 21 and 28 days post-slaughter.
The difference between experiments 1 and 2 was the difference in storage method during the first 7 days post-slaughter. Statistical analysis revealed no significant differences between experiments 1 and 2 at any sampling period therefore all animals were pooled into a single experiment with 10 replications.
Microbiological methodMethods described by Adams and Huffman
(1972) were used to enumerate aerobic, lactic acid producing and anaerobic bacteria at each sampling interval. At each storage time sample packages were aseptically opened and the sample was placed in a sterile quart jar. The bag was rinsed with 198 ml of sterile, buffered, distilled water which was poured into the jar containing the sample. The sample was rinsed on a Burrell wrist action shaker at a setting of 5 for 5 min. After appropriate dilutions were made from this rinse, the chop was removed, the outline
traced on acetate paper, and surface area calculated using a compensating polar planimeter to measure the surface area of the loin eye. A linear planimeter was used to determine circumference. Total surface area was calculated by adding the chop thickness times the circumference to the areas of both sides.
Aerobic plate counts were made using the procedure recommended by the American Public Health Association (Sharf, 1966), and counts were expressed as number per cm2 of total surface area. Plates were incubated at 32°C for 48 hr. An average of three plate counts was reported as numbers of organisms per cm2.
Lactic acid producing bacteria were counted using McCaskey’s (1971) modification of Kulp and White’s (1932) method which involved mixing 0.75% calcium carbonate with tomato juice agar and counting only those colonies surrounded by a clear zone.
Anaerobic bacteria were grown on plate count agar in a Brewer anaerobic jar (Brewer and Allgeier, 1966) at 32°C for 48 hr. Since oxygen was not removed from the medium, the organisms that grew were microaerophiles, not strict anaerobes.
RESULTS & DISCUSSIONAerobic bacterial counts
Chops stored in C 02 had significantly (P < 0.01) lower counts for the entire5-wk storage period than chops stored in air, 0 2 and N2 as shown in Figure 1. No significant differences were found in aerobic growth among chops stored in air, 0 2 and N2 at any sampling period. This finding is consistent with a report by Daun et al. (1971) who indicated that microbial growth was similar when fresh meat was stored in air or 0 2 enriched atmospheres. Since atmospheres containing approximately 100% C 02 or N2 would be expected to inhibit growth of aerobic organisms, it was rather surprising to find that growth of aerobic organisms in these two atmospheres was significantly different. This finding supports a report by Scott and Smith (1971) who found that N2 did not affect the aerobic bacterial growth on the surface of cottage cheese but C02 significantly inhibited bacterial growth.
The object of using the gas mixture was to take advantage of the bacteriostatic effect of C02 reported by Shaw and Nicol (1969), Scott and Smith(1971) and Ledward et al. (1971) and provide sufficient 0 2 in the atmosphere to retain the desired color of pork. While
Volum e 3 9 (1 9 7 4 J -J O U R N A L O F FO O D S C IE N C E -1 2 3

724-JOURNAL OF FOOD SCIENCE-Volume 39 (1974)
Fig. 1—Growth o f aerobic organisms during storage o f pork chops at — 1 .1°C for 35 days: aC 0 2 < air, 0 2 and N 2 (P < 0 .01); h Gas mixture < air, 0 2 and N 2 (P < 0 .05); CC 0 2 and gas m ixture < air, 0 2 and N 2 (P < 0 .01); dC 0 2 < gas m ixture, air, 0 2 and N 2 (P < 0.01). (Legend: ________a ir ;------- C 0 2; ------- N 2; ------ 0 2; ----- gas m ixture)
Fig. 2—Growth o f lactic acid producing organisms during storage o f pork chops at —1.1°C for 3 5 days: aA ir, l\l2 and O _ < C 0 2 and gas m ixture (P < 0 .0 5 ); bAir, N 2 and 0 2 < gas m ixture 'P < 0.05). (Legend: ________a ir ;------- C 0 2; ------- N 2; ------ 0 2; ----- gas m ixture)
the differences in growth of organisms stored in the gas mixture was significantly (P < 0.05) lower than that of air, 0 2 and N2 at 14, 21 and 28 days post-slaughter there were consistently higher counts of aerobic organisms found in chops stored in the gas mixture than in C02. A casual observation of color of chops throughout the study suggested that there was little difference in color of chops stored in C02 or the gas mixture; however, this observation will require further study. Lactic acid producing bacteria
There was no significant difference in the growth of lactic acid producing bacteria among the five test atmospheres during the first 2 wk of storage (Fig. 2). However, at the third sampling period, (21 days post-slaughter) lactic acid counts increased more rapidly on chops stored in C02 and the gas mixture than on chops stored in air, 0 2 or N2 atmospheres. In a similar study Adams and Huffman (1972) reported no significant difference in numbers of lactic acid producers between chops stored in air and those stored in the gas mixture. Counts of lactic acid producing bacteria were significantly (P < 0.05) higher for chops stored in the gas mixture for the remainder of the storage period. Chops stored in C02 were significantly higher than those stored in air, N2 and 0 2 at 35 days post-slaughter. These findings are in agreement with Brock(1970) who stated that all lactic acid bacteria grow anaerobically, although most of them are not sensitive to 0 2 and can grow in the presence or absence of0 2 . Shaw and Nicol (1969) found that if 0 2 concentration is virtually nil, the
lactic acid type of bacteria would be expected to dominate.
Anaerobic bacterial countsAnaerobic bacterial growth was inhib
ited by C02 throughout the storage period as shown in Figure 3. At 14 days post-slaughter chops stored in the gas mixture and C02 had significantly (P < 0.05) lower counts than chops stored in N2. There were no significant differences in counts at 21 days post-slaughter; however, at 28 days post-slaughter there were significantly (P < 0.01) higher numbers
on chops stored in air than those stored in C02. It is reasonable to assume that there was less pH change in samples stored in air than those stored in C 02, thus counts may have been reduced by lower pH.
Certainly the higher counts on samples stored in air are related to the higher total counts for these samples. Chops stored in the gas mixture had the lowest counts for the first 21 days post-slaughter, but then increased rapidly and showed the highest count at 35 days. One could only speculate on the increase in counts on samples
Fig. 3 —Growth o f anaerobic organisms during storage o f pork chops at — 1.1°C for 3 5 days: aGas m ixture and C 0 2 < N 2 (P < 0 .05); bC 0 2 <air (P < 0.01). (L e g e n d :________a ir ;------- C 0 2; ------N 2; ------ 0 2;gas m ixture)

MICROBIAL QUALITY OF PORK-12*
stored in the gas mixture after 21 days post-slaughter. It is possible that the presence of 5% 0 2 in this gas mixture reduced the growth of anaerobic bacteria early in the storage period, then when aerobic bacteria used up available 0 2 anaerobic bacteria were better able to grow. The difference in growth between samples stored in the gas mixture and those stored in C02 would appear to be related to change in pH.
CONCLUSIONSIT WAS CONFIRMED that high C 02 atmospheres significantly reduce microbial growth on fresh pork chops stored at temperatures above freezing. This research established that the inhibition of microbial growth was not simply the result of lowered amounts of 0 2 present in the storage atmosphere, since the chops stored in N2 had counts similar to those stored in air.
Further research is indicated to determine the mechanism of C02 inhibition. The obvious question that must be answered is whether the presence of high
C02 atmospheres results in increased production of carbonic acid, thus lowering pH and decreasing microbial growth.
REFERENCESA dam s, J .R , and H u ffm a n , D .L . 1 9 7 2 . E ffe c t o f
contro lled gas atm ospheres and tem p era tures on q u a lity o f packaged p o rk . J. F o o d Sci. 37: 8 6 9 .
Baran, W .L ., K ra ft , A .A . and W a lker, H .W .1970. E ffec ts o f carbon d io x id e and vacuum packaging on color and bac teria l coun t o f m eat. J. M ilk Fo o d Techno l. 33: 7 7 .
B rew er, J .H . and A llg eier, D .L . 1966. Safe self- conta ined carbon d iox ide-hydrog en anaerob ic system . A p p l, M ic ro b io l. 14: 9 8 5 .
B ro ck , T .D . 1970. “ B io logy o f M icroorganism s.” N ew Jersey: P ren tice -H a ll, In c .
B ro w n , O .R . and H ugg ett, D .O . 1968. E ffe c ts o f h y p e ro x ia u p o n m icroorganism s. 1. M em brane cu ltu re techn ique fo r exposing cells d ire c tly to test atm ospheres. A p p l. M ic ro b io l. 16: 4 7 6 .
C la rk , D .S . and L e n tz , C .P. 1 9 6 9 . Th e e ffec t o f carbon d io x id e on the g row th o f slim e p ro ducing bacteria on fresh bee f. Can. In s t. F o o d Techno l. J. 2 : 7 2 .
G ardner, G .A ., Carson, A .W . and P a tto n , J,1 9 6 7 . B acterio logy o f prepackaged p o rk w ith reference to the gas com position w ith in the pack . J. A p p l. B acterio l. 30: 3 2 1 .
D au n , H .K ., Solberg, M ., F ra n k e , W . and G ilb e r t, S. 1 9 7 1 . E ffe c t o f oxygen-enriched atm ospheres on storage q u a lity o f packaged fresh m eat. J. F o o d Sci. 36: 1 0 1 1 .
Jaye, M ,, K it ta k a , R .S . and O rda l, Z .J . 1 9 6 2 . The e ffec t o f tem p era tu re and packaging
m ateria l on the storage life and bacteria l flo ra o f ground b e e f. F o o d Techno l. 1 6 : 95 .
K ing , A .D . Jr. and N agel, C .W . 1967. G ro w th in h ib it io n o f a Pseudom onas b y carbon d io x id e . J. F o o d Sci. 32: 5 7 5 .
K u lp , W .L . and W h ite , V . 1932. A m o d ifie d m ed iu m fo r p lating L . acidophilus. Science 6: 17 .
Led w ard , D .A ., N ic o l, D .J . and Shaw , M .K .1971. M ic ro b io lo g ica l and colo r changes du ring aging o f beef. F o o d Techno l. In Austra lia , 23: 3 0 .
M cC askey, T .A . 1 9 7 1 . Personal com m unicatio n .
Pierson, M .D ., C o llins -Thom pson, D .L . and O rd a l, Z .J . 1970. M ic rob io lo g ica l, sensory and p igm ent changes o f aerob ica lly and anaerob ically packaged beef. F o o d Techno l. 24: 1 29 .
S c o tt, C .R . and S m ith , H .O . 1 9 7 1 . Cottage cheese shelf li fe and special gas atm ospheres. J. F o o d Sci. 36: 78.
S harf, J .M . 1966. M e a t and m eat products. In “ R ecom m ended M ethod s fo r th e M ic ro b io log ical E x a m in a tio n o f F o o d s ,” p . 1 11 . A m erican P ub lic H e a lth Assn., In c ., N ew Y o rk .
Shaw , M .K . and N ic o l, D .J . 1969. E ffe c t o f the gaseous env iro n m en t on the g row th on the m eat o f some fo o d poisoning and foo d spoilage organisms. Proc. 1 5 th E uropean Research W orkers M eeting . B 16 : 2 2 6 .
Ms received 6 /2 6 /7 3 ; revised 3 /2 4 /7 4 ; accepted3 /2 8 /7 4 .__________________________________________
The au th o r expresses apprec ia tion to M rs.L illia n S o u th w e ll fo r exp e rt tech n ica l assistanceand to W .R . Grace and Co. (C ryovac D iv .),U M C N o lin M an u fac tu rin g C o . and W in n D ix ie ,In c . fo r fin an cia l assistance.

SOLIMAN Y. K. SH EN OU DA and GEORGE M. P! GOTT institute for Food Science & Technology, College of Fisheries, University of Washington, Seattle, WA 98195
LIPID-PROTEIN INTERACTION DURING AQUEOUS EXTRACTION OF FISH PROTEIN: MYOSIN-LIPID INTERACTION
INTRODUCTION
FOOD SCIENTISTS are interested in studying new sources of highly nutritional food. Fish Protein Concentrate (FPC) was technologically developed as a protein-rich product and should help in solving the protein deficiency problem. In spite of the fact that much research was devoted to developing this product, (Finch, 1970; Stillings, 1970) it is still not completely acceptable as a final food supplement because of storage instability and high production costs. The techniques used in FPC production can be classified into three major groups', organic solvent extraction, enzymatic hydrolysis, and aqueous extraction. The various aqueous extraction techniques are now attracting the most interest, owing to the low operational cost and the preservation of many desired functional properties of the proteins (Chu, 1971). Although the aqueous methods remove up to 90% of the total lipid, the remaining part causes instability and loss of nutritional value of the products.
The residual lipids in FPC are probably bound in some form with other components in the FPC. Little information is available in this area, since most of the research work regarding lipid-protein interaction is mainly concerned with biological systems, i.e., cell membranes, serum albumin, etc. The interaction between lipid and protein can be covalent, ionic, Van der Waals, hydrogen bonding hydrophobic, or combinations of these forces (Green and Fleischer, 1963; Robinson, 1966; McClare, 1967; Gulik et al., 1969; and Lenaz et al., 1970). The interaction could be directly between the protein and lipid or indirectly through metal bridges (Fullingtcn, 1969). Chapman (1969) summarized the possibilities if lipids and proteins are brought together in aqueous phase. He proposed that either there is interaction or no interaction, with both groups retaining their original configuration, or there is interaction and either the lipids or proteins or both groups lose part or all of their configuration.
Information regarding the basic behavior of fish lipids and protein in aqueous media and the factors which affect their kind or degree of interaction are required
not only in FPC production, but also in other fields of food production.
The aim of the present work is to determine the interaction between fish lipids and proteins in an aqueous environment.
This paper presents the results of model system experiments to determine whether or not the fish lipid interacts with myosin and which groups of lipids are responsible for this interaction. Studies on the effect of aging, heating and air denaturation (foam formation) on the formation of these lipoprotein complexes are also reported.
MATERIALS & METHODSFish used
Yellow perch (Perea flavescens) were used throughout this work, owing to their availability in a fresh state all year. However, since it was difficult to keep yellow perch alive after catch, rockfish (Sebastes auriculatus) were used instead for preparing the 14-C fish lipids.Myosin
In the acidified trine extraction technique for FPC production proposed by Chu and Kgott (1969, 1973), the procedure begins by washing the ground fish with water, which eliminates most of the sarcoplasmic proteins. Thus the myofibrillar proteins constitute the majority of the protein which may be responsible for complexing with the lipid in FPC. Therefore,
myosin was chosen as the first myofibrillar protein to be tested in the model systems throughout this work, since it represents about 54% of the myofibrillar proteins present (Connell,1964). Myosin is a very complex asymmetrical molecule with mol wt of about 500,000 daltons and is composed of five polypeptide chains. It also possesses enzymatic activity (ATP-ase) and is very sensitive to denaturation (Lowey et al., 1969; Briskey and Fukazawa, 1971).Myosin preparation
A modification of Connell’s method (1962) was used. 30g of fish muscle were blended in an Osterizer blendor for 3 min with 250 ml of Connell (1962) extraction solution (0.45p KC1, 0.1 ju phosphate buffer, 0.1m pyrophosphate, and 15 X 10"3m MgCl2 pH 6.4). 0.02% NaN, was added to prevent microbial growth, 10‘4M phenylmethylsulfonylfluoride was added to inhibit proteolytic enzyme activity, and 10 mM2-mercaptoethanol was added to protect the SH groups on myosin. The extract was centrifuged at 10,000 rpm for 30 min, and the supernatant was filtered through cheesecloth. Myosin was precipitated by diluting tenfold with cold H20 containing 2-mercaptoethanol, collected by centrifugation at 5,000 rpm for 30 min and redissolved in 0.5p KC1 containing 10 mM Tris- HC1, 0.025M histidine, and 5 mM 2-mercaptoethanol, pH 7.0.
Further purification of myosin was carried out as recommended by Smoller and Fineberg(1964) by (a) separating the actomyosin from the myosin preparation by lowering the ionic strength to 0.3m, followed by centrifugation at35,000 X G for 1 hr; (b) precipitation with
Fig. 1 —Gel filtration elution diagram of yellow-perch myosin preparation. 40 ml of 1% solution o f the partially purified myosin preparation were applied to a 100 X 4.5 column o f Sephadex G 200, previously equilibrated with 0.5 KCI containing 5 mM Tris-HCI buffer (pH 7.0). The chromatography was carried out in the cold room; fractions o f 10 ml o f elute were analyzed. (— A TP-ase specific activ ity;----A 2 B 0.)
7 2 6 -J O U R N A L O F FO O D S C IE N C E -V o /u m e 39 (1974)

A Q U E O U S E X T R A C T I O N O F F I S H P R O T E I N - 1 2 1
dilution to 0.10.1m and redissolving the myosin in 0.5m buffer solution, pH 6.0; (c) following centrifugation at 100,000 X G for 2 hr, the myosin was placed on a Sephadex-G 200 (Pharmacia, N.J.) column (100 x 5 cm) that had been equilibrated with 0.5M KC1 5 mM Tris-HCl buffer (pH 7.0). High flow rate was achieved by using upward flow and packing the lower 10 cm of the column with glass beads 6 mm in diameter. ATP-ase activity of the myosin peak was tested according to Chung Wu (1969), and' the liberated phosphorus was determined according to the Fisk and Subbarow method. The elution profile and the myosin ATP-ase specific activity of the effluent is shown in Figure 1. The most active part of the effluent peak was collected and myosin concentrated by either ultrafiltration (Amicon membrane XM 300) or by sprinkling the outside of the dialyzing tubing with aquacide II (Calbiochem, Calif.) or by precipitation with dilution and redissolving. Final centrifugation at 100,000 x G for 2 hr followed the concentration step, and the purity of the myosin was checked by SDS-polyacrylamide gel electrophoresis (5% acrylamide), as described by Weber and Osborn(1969). All the operations were carried out at 4°C in the cold room, and the concentration of myosin added to the column was not more than 1.5%, to prevent plugging the column.Lipid extraction
Lipid was extracted according to Bligh and Dyer (1959) and dried under vacuum at 50°C. Lipid separation into polar and neutral groups was carried out by partition between petroleum ether and 87% ethyl alcohol, as described by Galanos and Kapoulas (1962). The purity of separation was checked by TLC.Lipid identification
20 x 20 cm precoated silica gel-G-plates,
Pet. e th e r ; E th e r : H A c
N L- Y 5 A
250m thickness, were activated at 130°C for 2 hr. Fish lipid samples, as well as standard lipid references, were applied as recommended by Stahl (1965). The developing system for the neutral lipid consisted of petroleum ether :- ether:acetic acid (90:10:1). The developing system for the polar lipid consisted of chloroform: methanol: water (65:25:4). The separated lipids were detected under UV light after spraying with 0.2% solution of 2'7'dichlorofluorocin, or by charring with 5% chromic acid in 55% sulphuric acid and heating at 115.5°C for 30 min. Esterified phosphate was detected, using the reagent of Vaskovsky and Kostetsky(1968); choline was detected with a modified Dragendorff reagent (Bregoff et al., 1953); vicinal hydroxy groups were detected with a periodate Schiff reagent (Shaw, 1968); and amino groups were detected with ninhydrin. The standard references used were: glycerol- monooleate; 1,3-dipalmitoylglycerine; 1,2-di- pa lm itoy lg lycerine ; triolein; iripalmitin; squalene; DL-alpha-lecithin; sphingomyelin; ph osphatidylethanolamine; ly sophosphatidy T ethanolamine; and lysophosphatidylcholine (Calbiochem, Calif.).
Labeling the fish lipids with carbon-14250m Ci sodium acetate l-C-14 specific
activity 738m Ci/mg and 50m Ci glycerol l-C-14 specific activity 283m Ci/mg (Amersham Searle,111.) were dissolved in 2 ml H20 and injected with a No. 22 needle into the main dorsal vein of 588g rockfish after it was anaesthetized with quinalodine. After injection, the fish were kept in 230 lb water at 10°C in a barrel equipped with fluorescent light and aeration. The fish were fed daily with fish pellets, and the water changed after 2 days. Lipid was extracted from the whole fish after 4.5 days by the Bligh and Dyer (1959) method.
C h lo ro fo rm : M ethano l : W ater
T r ig ly c .
\ /
______n
N L - X 3 6 = » fiS>V
D ig ly c . 2 O oMonog !y c.
1 K Q,po l a r •A> •CP 0
F P C F IS H F P C
( a ) ( b ) ( c )
6 PE 5 PL-X
4 PC3 Sph.2 Lyso PE 1 Lyso PC
( d )
Fig. 2 —Thin layer chromatography o f fish lipids and the residual lipids from F P C aqueously extracted from the same fish. Silica G ei G plates were used: (a) and (b) are the separation o f the neutral lipids by using the solvent system -petroleum ether:ether:acetic acid (9 0 :1 0 :1 ); (c) and (d) are the separation o f the polar lipids by using the solvent system chloroform :m eth- ano!-.water (65 :25 :4 ).
Sucrose gradient centrifugationSucrose was purified to eliminate back
ground UV absorption, as recommended by the ISCO manual for UV analyzer. The concentration of sucrose solution was checked by the refractive index. 6 ml from each of 35% and 3% sucrose solutions were used to form the gradient in nitrate cellulose tubes (Beckman No. 331101 9/16 x 3-3/4 in.), using the gradient forming apparatus. 1 4C lipids were dispersed by ultrasonication in 1 ml buffer solution, mixed with 1 ml myosin (1%), and incubated at 4°C overnight. 1 ml of the mixture was layered over the freshly prepared gradient, and centrifugation was performed at 35,000 rpm for 24 hr in Beckman centrifuge Model L2 with SW-40 head at 4° C. Fractions were obtained, using a density gradient fractionator Model 1 83 (ISCO, Nebraska) at an upward flow rate of 0.75 ml/min. The fractions were monitored at 280 nm in UV-analyzer Model UA-2 (ISCO) and1-ml fractions were collected in scintillator vials containing 10 ml of the scintillation solution. The scintillation solution was composed of 4 liters toluene, 10g PPO, 0.4g POPOP, and 2 liters Triton XI00. The vials were counted in the liquid scintillator Packard Model 3003. NCS tissue solubilizer for liquid scintillation counting (Amersham/Searle) was used when coagulated myosin was counted.Spin labeling
12-nitroxidemethylstearate was synthesized according to Waggoner et al. (1969).
The probe was added to 50 mg fish lipid (polar or neutral) and the solvent was evaporated off under reduced pressure. The mixed lipid and spin label were dispersed in 0 .2 m phosphate buffer, pH 7.0. In the case of neutral lipids, 5 mg Triton XI00 was added to help oil dispersion, if needed. Myosin was added to form various lipid/protein ratios. The final concentration of the spin label was 1.4 x 10"4M. The electron spin resonance spectra of these mixtures were obtained at 9.5 GHz on a Varian E3 EPR spectrometer. Reorientation correlation times (Tc) were calculated according to Waggoner et al. (1967).Heat dénaturation
' 4C lipid (polar or neutral) was sonicated in 1 ml phosphate buffer 0.5m, pH 7.0. 10 ml myosin solution (about 1.2% concentration) was added to the lipid, and the mixture was placed in a steam chamber at 100°C for 15 min. After cooling, myosin was precipitated either by dilution with 30 ml H20 or by adjusting the pH to 4.5 with 10 ml buffer, and a myosin pellet was collected by centrifugation at 10,000 rpm for 10 min.. Washing the myosin was carried out by dispersing the pellet in 40 ml H20 and recentrifuging. The pellets were solubilized by NCS solubilizer and the radioactivity was determined by the liquid scintillation method.

728-JOURNAL OF FOOD SCIENCE-Volume 39 (1974)
Stability of polar lipid suspension at different pH values
11.2 mg fish polar lipid was sonicated in 10 ml H20 for 5 min. The suspension was divided into three portions and the pH was adjusted to7.0, 4.5 and 3.3. After centrifugation at 10,000 rpm for 15 min, quantitative determination of the phospholipids in 0.2 ml of the aqueous phase was determined, using the method described by Rouser et al. (1966). Na2HP04 standard curve was prepared to calculate the amount of phosphorous in micrograms.
RESULTS & DISCUSSIONALL DATA presented are from at least duplicate runs.Lipid identification
Lipids extracted from whole fish and from FPC aqueous extraction (the acidified brine extraction procedure by Chu and Pigott, 1969) manufactured from the same batch of fish, were identified on TLC plates. Figure 2 shows the separation of the neutral and polar lipids into their subgroups. The neutral lipids consisted mainly of mono-, di-, triglycerides, hydrocarbons and two other unidentified groups (spot numbers 3 and 5) with Rf values 0.25 and 0.64, respectively, the triglycerides were obviously the major fraction of the neutral lipids in both FPC and whole fish lipids. The polar lipid consisted of seven main subgroups listed in Table 1. Phosphatidylcholine (PC) represented the major subgroup on the polar lipid. Medwadowsky et al. (1968)
stated that the nature of the residual lipid in FPC-organic solvent extracted varied according to the type of fish. Fatty fish such as menhaden produced FPC with residual lipid almost entirely triglycerides, with phospholipids (PL) up to 4%, while residual lipid from lean fish as hake consisted of up to 35% PL. Our results (Fig.2) show that the processing steps of FPC by aqueous extraction decreased signifi
cantly the amount of monoglycerides and hydrocarbons from the neutral group and phosphatidylethanolamine (PE) from the polar group.
Lipid-protein interaction:Sucrose gradient technique
With C-14-triglycerides. The results from applying this technique could occur with (1) no interaction where the myosin
Table 1—((identification of fish polar-lipids on T L C
DetectionRf
Spot (Solvent l )a Fb
oa. Ninc Dd Se Identification
Origin — — — — — — —1 0.11 + + ~ + — Ly s . PC2 0.14 + + + - - Lys . PE3 0.16 + + — + - Sph4 0.26 + + — + — PC
5 0.45 + + ~ + — PL-X6 0.47 + + + - — PE7 0.62 + + — — + G LN Lg migrate with
the solvent front+ — — ~ — Neutral lipids
a C h lo ro fo rm :m e th a n o l:w a te r ( 6 5 :2 5 :4 )13 2 , 7 , D ic h lo ro f lu o re s c e in c N in h y d r in d D ra g e n d o rff ® P e r io d a te /S c h if f
L y s .P C = L y so p h o sp h a t id y lc h o U n e ; L y s .P E = L y so p b o s p h a t id y le th a n o la m in e ; S p h - S p h in g o - l ip id ; P C = P h o s p h a t id y lc h o lin e ; P E = P h o s p h a t id y le th a n o la m in e ; G L = G ly c o lip id .
N e u tra l L ip id
O D 2 8 0
O D 2 80
c p m.
. 3 0 0
. 200
O .D .
( b ) ( C )
c .p .m .*10000
X
M yo sin + C 14 T r ip a lm it in
( d )
* Before Sephadex
Fig. 3 —Sucrose gradient centrifugation profile o f m yosin and triglycerides. Sucrose gradient 5 —35%, 1 m l o f m yosin (1%) m ixed with 1 ml sonicated lipid in buffer was incubated @ 4° C overnight. 1 m l o f the m ixture was layered on top o f the gradient, centrifugation was applied @ 3 5 ,000 rpm for 20 hr, and the gradient was fractionated from the top. M yosin was traced b y absorbancy @ 28 0 nm, fractions o f 1 ml o f the gradient were counted for lipid detection: (a) m yosin alone; (b) triolein alone; (c) myosin + triolein; (d) myosin + tripafmitin.

A Q U E O U S E X T R A C T I O N O F F IS H P R O T E I N - 7 2 9
Table 2 —Isotope balance
cpm/1 mlTotal voi
(m l)Total
count/min %
Water in the injecting tub Water in the varrel:
2113 5000 10565,000 4.3
first 2 days 243 515200 125193,600 51.5the second period 164 515200 84492,800 34.7
MeOH & H z 0 layer 5514 2700 14887,800 6.11 )Fish residue 2128 4 3 9 .5g 937,038 0 .38 ) 9.45%Oil extracted
Tota! count 1,332,000
113538 6 3 .5g 7209,663 2.96 )
ment are presented in Tables 2 and 3. Table 2 shows the isotope material balance throughout the experiment. The fish expelled most of the injected acetate and glycerol (probably through its gills). Roughly 9.45% of the injected isotopes was retained in the fish until the end of the experiment, and one-third of it was synthesized as lipid. The entire amount of isotope preparation was not injected (residual in syringe and loss during adjustment), so that the 182/i Ci recovered is reasonable as compared to the total amount of the preparation (300ju Ci). Table 3 shows that the polar lipid, which is less than 10% of the value of the neutral lipid, was 10 times more radioactive than the neutral lipid.
peak migrates alone to the bottom of the gradient tube, leaving the lipid fraction floating on the top; (2) a lipid-protein complex formation (definite interaction) if either part or all of the lipid migrates with the myosin peak; or (3) interaction with the formation of a new intermediate peak in the gradient.
The first model system used consisted of incubation of myosin with C-14-triolein or C-14-tripalmitin. Figures 3a and 3b show the OD at 280 nm of the myosin alone and triolein alone, respectively, fractionated on the gradient as a control guide. The figure shows that the myosin migrated to the bottom of the tube at the end of the centrifugation period (fractions between 7 and 11 ml), while the triolein stayed at the top. Tripalmitin showed a similar pattern to triolein. Incubation of labeled triolein with myosin shows (Fig. 3c) that some of the triolein accompanied the myosin, as indicated by increase in counts in the upper fraction of the myosin peak. Tripalmitin shows (Fig. 3d) almost the same pattern. Nonpolar lipids such as triglycerides probably interact with certain functional groups on myosin, which are also hydrophobic. Daniel et al. (1966) stated that triglycerides binding during dough mixing appeared nonspecific. Comparing Figures 3c and 3d indicates that the amount of triolein that migrated with the myosin peak is slightly more than the amount of tripalmitin. Robinson (1966) suggested that the double bond of the hydrocarbon chain can interact with sulphhydryl groups of protein to bring about binding. Pomeranz et al. (1968) found that binding of lipid during dough mixing increased with the degree of unsaturation. In general, results obtained from this model system indicate that the amount of triglycerides migrating with myosin is a small fraction of the total triglycerides added, as indicated by the counts accompanying the myosin peaks and the counts at the top of the tubes.
Labeling the fish lipid with C-14. The
need for C-14-polar lipids which are either not available or are very expensive, and the need to increase the reliability of the model system’s results by using the natural fish lipids, made it worth trying the fish labeling experiment. (The labeling experiment was a single run, owing to the expense of the C-14 materials injected, but the analyses were at least in duplicate.) The results from this experi-
Sucrose-gradient with labeled neutral lipids. Figure 4 shows that more lipid migrated to the bottom of the gradient tubes in the presence of myosin than in its absence. This can be seen by noticing the slopes of the counts on the gradient and/or comparing the ratio counts at the bottom to the top of the gradient (frac- tion#8 to fraction #1). For example, in the case of neutral lipid alone, the ratio was 21/98 (or 21.4%), while in the pres-
Table 3—Separation o f 14-C-fish-lipid into neutral and polar groups
Neutrallipid
Polarlipid
Weight in grams 8.6056 0.6205Weight percent 93 .27 6 .73cpm
Total count of the fraction 1312011 1026262% count of the fraction 56% 43%Count per 1 gram 152460 1653928
O. D ÍLÍ.Ü1.,280
( a ) , 4 C - n eu tra l lip id ( b ) 14C - n e u t ra l l ip id + M y o s in
Fig. 4 —Sucrose gradient centrifugation profile o f m yosin and C-14- neutral lipids. The system is the same as m entioned in Figure 3. Ia! C-14-netural fish lipids alone; (b) myosin plus C-i4-fish neutral lipids.(— c p m ;---- OD @ 280 nm.)

130-JOURNAL OF FOOD SCIENCE- Volume 39 (1974)
c.p.m.3 0 0 0
200
1 00
5 0
O. D 28 0
0.7
0.5
0 .3
0.1 LA
c p. m.
8 0
60
4 0
2 0
1 3 5 7 9 ml
( b) M yosin +- 14C “ P o la r lip id
Fig. 5 —Sucrose gradient centrifugation profile o f myosin and C-14- poiar lipids same as m entioned in Figure 3. fa! C-14-poiar lipids alone, (bl myosin plus C-14-poiar lipids. (— c p m ;---- OD @ 280 nm.)
ence of myosin it was 16/71 (or 22.5%). This indicates that a minute amount of neutral lipid migrated with myosin, in spite of the high centrifugal force applied (150,000 x G for 24 hr).
Sucrose-gradient with labeled polar lipids. Fish polar lipids contain proportionately more unsaturated fa tty acids than do the neutral lipids (Roubal, 1967).
Also these polyunsaturated acids are of the methylene-interrupted type (Stansby,1967). When scanning the gradient at 280 nm in the presence of polar lipids, another sharp peak appeared near the top of the gradient tube. Polyacrylamide gel disc electrophoresis confirmed that this peak was protein-free (there was interference also on applying the Lowery meth
od for protein detection or Ellman’s reagent for total sulphhydryl estimation). Figure 5 shows that small amounts of the polar lipids migrated with the myosin towards the bottom of the gradient. The counts ratio (fractions 8 to 1) were 57/3087 in the case of polar lipid alone and 21/80 in the presence of myosin.Lipid-protein interaction:Electron spin resonance (ESR)
Results obtained from this system give some idea about the degree of interaction between the myosin and the fish lipids. Figure 6 presents the actual ESR spectra as a first derivative of the absorption curves of the nitroxide moiety in various media. Figure 6a represents the spectrum of the 12-doxyl-methylstearate in chloroform. The sharp three-line hyper-fine pattern arises from the high degree of mobility of the probe. Figure 6b shows also that the spin label still has a high rotational freedom in the aqueous dispersion of the neutral lipids in the buffer solution. The same spectrum as 6b was obtained when the probe was attached to polar lipid dispersion. The reorientational correlation times (Tc) of the spin label molecules were 1.49 x 10'9 and 1.38x 10"9 sec in neutral and polar lipid dispersion respectively. Figures 6c and 6d show typical spectra when myosin was added to neutral or polar lipids. Figure 7 shows a plot of Tc of the probe in polar
Fig. 6 —Spectra o f spin-label in different media.

AQUEOUS EXTRACTION OF FISH PROTEIN-731
or neutral lipid as a function of myosin concentration. The addition of myosin did not reduce the mobility of the probe s ig n ifica n tly in polar or neutra l lipids.
4 .0 -
Tc
3 .0 -( x IO '9 sec.)
c.p.m.
Fig. 8 —Effe ct o f aging: sucrose gradient centrifugation profile prepared as m entioned in Figure 3. The m yosin used was left <® 4° C for 7 wk. 1 ml o f this myosin (1%) was incubated with C-14-triolein @ 4° C overnight before applying to the gradient. (— c p m ;----OD @ 28 0nm.)
The type of molecular aggregation of lipids in aqueous dispersion is governed, mainly, by the class of lipids used. For example, lysophosphatidylcholine forms
______. Pol ar
...........+ N e u t r a l
c.p. tn
M y o s in + ^ C - T r io le « n
micellar aggregates (Saunders, 1966), w hile phosphatidylcholine or phos- phatidylserine forms lamellar aggregates (Chapman et al., 1968; Fluck et al., 1969). Berger et al. (1971) attributed the degree of interaction between lipid and protein to this phenomenon. He stated that the micellar lipids bind more strongly to the apoproteins from human erythrocyte membranes than do the lamellar lipids. Using natural fish lipids consisting of several types of lipids, as indicated in Figure 2, one would expect the presence of both lamellar and micellar aggregates. The weak interaction between fish lipids and undenatured myosin molecules, as shown by the ESR experiments (Fig. 7), indicates that the state of myosin is the important factor in forming lipid-myosin complexes.Effect of aging
Aging of the myosin solution for 6—8 wk at 4 C caused a noticeable increase in the amount of C-14-triolein complexing with it, as illustrated in Figure 8. The pattern in Figure 8 shows the presence of other protein peaks which differ in their capability o f interaction with triolein. Godfrey and Harrington (1970) found that there was a rapidly reversible monomer dimer equilibrium of myosin molecules in salt solutions, and this equi-
C .p . l
M yosin ■+ '^ C - N e u t r a l hp'd
a f o r s h o r t tu n e , u , ( .. .' l b ) fo r long t im e
Fig. 9 —Effe ct o f agitation: (al sucrose gradient centrifugation profile. 1/2 ml o f m yosin (1%) plus 1/2 ml sonicated lipids in buffer were placed on a test tube shaker for 30 sec. The mixture was applied to the gradient, fb) as in (a) except the m ixture was exposed for a long period o f agitation (3 min). (— c p m ;----OD @ 280 nm, p p t = m yosin precipitated coagulate.)
2 0 .
1.0 -
10
M Y O S IN /L IP ID (W/W)
Fig. 7—A plot o f T c in the e.s.r. spectra o f polar fish lipids or neutral fish lipids:water system containing 12 doxylm ethylstearate as a function o f added myosin.

7 32- J OU R NAL OF FOOD SCIENCE-Volume 39 (1974)
librium was pH and ionic strength dependent. Gersham and Dreizen (1970) stated that the pure myosin tended to dissociate into subunits, a heavy-chain core and light components, in various salt solutions. They also stated that the light chains underwent aggregation during prolonged salt treatment, especially in ihe absence of thiol protection, and heavy chain core aggregated to at least dimer level. Lowey and Holtzer (1959) stated that myosin aggregation was independent of protein concentration, and it involved local configuration change. Since the fresh myosin preparations, as indicated earlier, have a very weak tendency to interact with lipid, the configurational changes which take place during aging may cause either unfolding of the myosin molecule and exposing hindered functional groups which have the capability to react with lipids, or may cause activating or untying of the surface functional groups on the myosin molecule and free them to react with other molecules (lipids or proteins).Effect of agitation and foam formation
The effect of vigorous shaking for a short time (30 sec on a test tube shaker) of myosin with C-l 4-triolein is shown in Figure 9a. Agitation for such short periods showed a strange pattern of the myosin distribution through the sucrose gradient as scanned at 280 nm. The counts indicated that myosin after this short treatment showed a great ability to complex with lipids. Figure 9b shows the effect of the same treatment for a longer time (3 min). In this case the majority, if not all, of the myosin coagulated and formed a clot. Scanning of the gradient showed that most of the lipids also disappeared from solution. The coagulated
Fig. 10—Effe ct o f heating: sucrose gradient centrifugation profile was prepared as mentioned in Figure 3. 1/2 mi o f myosin (1%) was mixed with 1/2 ml o f sonicated lipid (C-14-triolein) and heated @ 70° C for 30 sec. The mixture was placed on the top o f the gradient. (— cpm ; — OD @ 280 nm.)
myosin did not compact as a pellet after the centrifugation of the gradient, but appeared as a porous-fibrous clot suspended in the bottom part of the tube. This probably was due to an increase in the specific volume of the myosin as a result of air incorporation in the clot. Counting these coagulates showed that the majority, if not all, of the lipids were complexed in this clot. For example, the maximum count in the gradient solution was below 100 cpm, while the coagulate count was over 1500 cpm. In conclusion, dénaturation of myosin by this technique, even for a very short time, greatly increased its ability to interact with lipids and form a complex which did not dis
sociate under high centrifugal forces.
Effect of heat dénaturationA mild heat treatment of myosin
(70°C for 30 sec) markedly changed its properties. Figure 10 shows the effect of this treatment in the presence of C-14-triolein. Myosin did not show its distinctive single peak at 280 nm. However, no apparent pellets were observed in the sucrose gradient tube. Figure 10 shows that the majority of the labeled triolein was located among the fractions in the bottom part of the tube (between fraction 7 and 11). At this stage of heat dénaturation, it could be possible that mild heating can cause changes in the configuration as well as molecular size of the myosin molecules, resulting in different products as monitored at 280 nm (Fig. 10). Heating myosin in the presence of labeled polar or neutral fish lipid at 100°C for 15 min resulted in abundant coagulates which could be collected by centrifugation. However, dilution to low ionic strength (less than 0.2/r) or adjusting the pH to i.e.p. (4.5) was applied to assure full collection of the myosin. The results of these experiments are presented in Table 4 and Figure 11. Table 4 lists the amounts of polar lipid and neutral lipid which were complexed with 136.4 mg myosin on heating the mixture at 100°C for 15 min. The results showed that 43.1% of the polar lipids were retained in the myosin pellets collected by dilution with 30 ml H2 O, followed by centrifugation at 10,000 rpm for 10 min. Similar heat treatment of myosin in the presence of neutral lipids retained only 33.5% of the added neutral lipids.
Subsequent change of the charges on myosin by altering the pH value from 7.0 to 4.5 (the isoelectric point for myosin)
Table 4 —The effect of heat dénaturation and methods of myosin precipitation on myosin-lipid interaction3
mg Lip id added to
10 ml myosin T reatment °cpm in
the pellet
Calc mg lipid complexed in
the pellet
% lipid in the pellet (D .W .B .)
% lipid retained
14-C polar lipid 5.663 A 4040 2.443 43.1 1.755.668 A + VV 3750 2.267 39.9 1.63
14-C neutral lipid 5.668 B 4040 2.443 43.1 1.755.668 B + V\i 3900 2.358 41 .6 1.698.455 A 431 2.827 33.5 2.038.171 A + W 425 2.787 34.1 2.007.995 B 312 2.043 25.6 1.477.869 B + W 287 1.879 23.9 1.35
Neutral lipid plus 8 .876 A 115 0.754 8.5 0 .54Triton X 100 (16.2 mg)
3 1 0 m l m y o s in s o lu t io n c o n ta in s 1 3 6 .4 m g m y o s in .A : H e a te d @ 1 0 0 ° C fo r 15 m in p re c ip ita t io n b y d ilu t io n ( 3 x ) , c e n tr ifu g a t io n @ 1 0 ,0 0 0 rp m fo r 15 m in .A + W : A s ( A ) , th e n th e p e lle ts w e re w a sh e d w ith 4 0 m l H 2 0 an d re c e n tr ifu g e d ; B : H e a te d @ 1 0 0 ° C fo r 1 5 m in , p H w a s a d ju s te d to 4 .5 b y a d d it io n o f 1 0 m i o f 0 .5 p b u f fe r , c e n tr ifu g a t io n @ 1 0 ,0 0 0 rp m fo r 1 5 m in ; B + W : A s ( B ) , th e n th e p e lle t s w e re w a sh e d w ith 4 0 m l H 2 0 an d re c e n tr ifu g e d .

AQUEOUS EXTRACTION OF FISH PROTEIN-733
has no effect on the amount of polar lipid complexed with myosin during heating (43.1%). However, lowering the pH to 4.5 decreased the amount of neutral lipids retained in the myosin pellets (25.6%). The results also showed that the bound lipids (polar or neutral) were very diffi
Also, changing the pH from 7.0 to 4.5 will not affect the charge condition on most of the polar lipids (Johnson and Davenport, 1971). A control run on the polar lipids alone (Table 5) showed that lowering the pH of the sonicated polar fish lipids from pH 7.0 to 3.3 did not cause any p rec ip ita tio n of the phospholipid suspensions. Therefore, the presence of extra charges on the denatured myosin molecules at pH 4.5 will decrease the chances of hydrophobic bonding between the nonpolar groups on both the lipid and the protein molecules. This may exp la in the decrease (7.9—10.2%) in the amount of the neutral lipids retained in the pellets on lowering the pH. Assuming that the configurational changes in myosin molecules during heat denaturation are the same in the presence of either polar or neutral lipids, the neutral lipids will interact with the heat-denatured myosin hydrophobically, and the polar lipids interact both hydrophobically and hydrophilically. Therefore, increasing the chance of ionic interaction between the polar lipids and the
cult to remove with repeated washing of the pellets with 40 ml H2O. Possibly, by changing the pH of myosin to its isoelectric point (i.e.p.), there is an increase in the total charge on the molecules if the majority of the functional groups have pK’s around the i.e.p. value:
heat-denatured myosin at pH 4.5 compensates for the decrease in the hydrophobic bonding between them and, consequently, lowering the pH from 7.0 to 4.5 did not show any effect in the amount of the polar lipid retained in the pellets.
Table 4 shows also that addition of weak detergents such as Triton X 100 decreased the amount of lipid retained in the myosin pellets from 34% to 8.5%. This indicates the role of hydrophobic interaction between the heat-denatured myosin and neutral lipids. Connell (1969) found that the use of detergents (sodium dodecyl sulphate, SDS) in FPC production was unsatisfactory; the product extracted with SDS, precipitated at pH3—4, washed with water and dried in vacuum has a low lipid content, but the residual SDS was as high as 40%. Parkinson (1970) studied the effect of some technological steps on egg composition and found that heat-pasteurization, as well as freezing and subsequent thawing, changed the numbers and the amounts of the protein components and caused a
Table 5—Stab ility of fish polar lipid suspensions at different pH valuesa
M9 Piin 0 .2 ml
pH of the suspension7.0 6.74 .5 6.83.3 6.7
a N o s ig n if ic a n t d if fe re n c e f o u n d b e tw e e n p h o s p h o ro u s v a lu e a t 1-a = 0 .9 5 u s in g x 2 a n a ly s is <X2 8 = 0 .0 2 3 )
formation of lipid protein complexes. The lipoprotein formed had a higher molecular weight and contained 70% lipid and 30% extremely insoluble protein of unique amino acid composition. Chiu and Pomeranz (1966) showed that more lipids bind to the wheat flour during baking than during dough-mixing. Figure 11 shows the effect of increasing the a- mounts of lipid heated with a certain amount of myosin (132.1 mg) on the amount of complexed lipid in pellets. Both polar and neutral lipids showed a linear increase in complexed lipid with increasing lipid/myosin ratio. Polar lipid, however, showed a greater capability of complexing in the pellet than neutral lipid. For example, when the myosin- /lipid ratio was about 2.6/1, the amount of polar lipid retained in the pellets was double the amount of the neutral one. Chiu and Pomeranz (1966) showed also that a higher percentage of polar to nonpolar wheat flour lipids was bound during dough-mixing.
SUMMARY & RECOMMENDATIONSTHE AQUEOUS EXTRACTION technique as proposed by Chu and Pigott(1969) for FPC production, does not greatly alter the nature of residual lipid from the original fish lipids. The main changes may be considered as a decrease in the monoglycerides, hydrocarbons and phosphatidylethanolamine. Triglycerides represent the major component in both perch lipid and the corresponding FPC (by aqueous extraction) lipids. The model systems were composed of purified fish myosin and different types of lipids (C-14-triglycerides, labeled polar fish lipid, and labeled neutral fish lipid). They were tested by different techniques, and it was shown that fresh undenatured myosin had a very weak ability to interact with the added lipids. Myosin aging, denaturation by agitation or heating, caused configurational changes which resulted in a noticeable increase in the myosin-lipid interaction. Hydrophobic interaction, as well as ionic bonding,
— CH2-----C00H^=
+n h2
=^R-----CH2------C 0 0 " vJ+n h2
= =R-----CH,----- COO
NH2
(Low pH) (i.e.p.) (High pH)
m 9 14-C - L i p j d added to 132.1 mg myos i n
Fig. 11 —A p lo t o f mg C-14-polar fish lipid and neutral fish lipid com plexed in the m yosin pellets after heating (<s> 100P C for 15 mint as a function o f lipid/myosin ration before heating.

734-J O U R N A L O F FO O D S C IE N C E -V o lu m e 3 9 (1974)
p articipate in form ing th e lip id -m y o sin c o m p lex es . T he lip id -protein c o m p lex es form ed were very d ifficu lt to reseparate, even under severe ph ysica l m eans or rep eated w ashing w ith w ater. F ish polar lip id sh ow ed m ore te n d e n c y to interact w ith heat-denatured m y o sin than did the neutral lip ids.
In v iew o f th e above co n c lu sio n s , it m ay be im portant to consider th ese fa c to rs during FPC (b y a q u eou s ex tra c tio n ) p ro d u ctio n , in order to reduce th e residual lip ids in th e final p rodu ct. F or exam ple, it is recom m en d ed that m ost o f th e lip id ex tra ctio n (or separation ) steps be carried o u t under m ild co n d itio n s w h ich m in im iz e m y o sin denatu ration , i .e ., avoid ing foam form a tio n , m aintain ing lo w er tem perature, and avoid ing any heat trea tm en ts, esp ecia lly in the first steps o f th e process. A lso , fresh fish as a starting m aterial and avoid ing storage or aging m ay also b e h e lp fu l in producing low -fat FPC b y a q u eou s ex tra ctio n . E xperim enta l w ork app ly in g th ese recom m en d ation s for FPC b y a q u eou s ex tra ctio n produ ctio n in a p ilo t plant at th e F o o d Science D epartm en t (U n iversity o f W ashington) is now under in vestigation .
REFERENCESBerger, K.U., Barratt, M.D. and Kamat, V.B.
1 9 7 1 . Magnetic resonance studies on the com ponents o f human erythrocyte m em branes. Chem. Phys. Lipids 6: 351.
Bligh, E.G. and Dyer, W.J. 1959 . A rapid m ethod o f total lipid extraction and purification. Can. J. Biochem . 37(8): 911.
Bregoff, H.M., Roberts, E. and D elw iche, C.C.195 3 . Paper chromatography and quaternary am m onium bases and related com pounds. J. Biol. Chem. 205: 565.
Briskey, E.J. and Fukazawa, T. 1 9 7 1 . M yofibrillar proteins o f skeletal m uscle. Adv. Food Res. 19: 279 .
Chapman, D. 1 9 6 9 . Physical studies o f lipid- lipid and lipid-protein interactions. Lipids 4(4): 251 .
Chapman, D., Fluck, D .J., Penkett, S.A. and Shipley, G.G. 1 9 6 8 . Physical studies o f phospholipids. 10. The effect o f sonication on aqueous dispersions o f egg yolk lecithin. Biochim . Biophys. Acta 163: 255 ,
Chiu, C.M. and Pomeranz, Y . 1 9 6 6 . Changes in extract ability o f lipids during bread making. J. Food Sci. 31: 753 .
Chu, C.L. 197 1 . Total utilization o f hake by m ethod o f brine acid extraction. Ph.D. thesis, Inst, for Food Science & Technology, College o f Fisheries, University o f Washington , Seattle, Washington.
Chu, C.L. and Pigott, G.M, 1 9 7 3 . Acidified brine extraction o f fish. Am . Soc. Agric. Eng. 16: 949 .
Chu, C.L. and P igott, G.M. 1 9 6 9 . Brine-acid process for production of FPC. Research in Fisheries, Cont. N o. 32 0 , College o f Fisheries, University o f Washington.
Chung Wu, C.S. 1 969 . Comparative studies on m yosin from breast and leg m uscles of chicken. Biochem istry 8(1): 39.
Connell, J.J. 196 9 . The fish protein concentrate story. 8. On the use o f detergents in FPC production. Food Teehnol. 23(2): 72.
C onnell, J.J. 1 9 6 2 . Changes in am ount of m yosin extractable from cod flesh during storage at —14°. J. Sci. Food Agric. 13: 60 7 .
Connell, J.J. 1964 . Fish m uscle proteins and som e effects on them of processing. In “ C/F Sym posium on Foods: Proteins and Their R eactions,” Ed. Shultz. H.W. and Angle- mier, A .F ., Chapter 12. Avi Publishing Co., Inc., W estport, Conn.
Daniels, N.W .R., R ichm ond, J.W., Eggitt,D.W.R. and C oppock, J.B.M. 196 6 . Studies on the lipids o f flour. 3. Lipid binding in bread making. J. Sci. F ood Agric. 17: 20.
F inch, R. 1 9 7 0 . Fish protein for human foods. CRC Critical Reviews in F ood Teehnol. 1: 519 .
Fluck, D.J., H enson, A .F . and Chapman, D.196 9 . The structure o f dilute lecithin-water system s revealed by freeze-etching and electron m icroscopy. J. Ultrastruc. R es. 29: 416.
Fullington, J.G. 1969 , Lipid-protein interaction. Bakers Digest 43(6): 34.
Galanos, D .S. and Kapoulas, V.M. 1 9 6 2 . Isolation o f polar lipids from triglyceride m ixtures. J. Lipid Res. 3: 134 .
Gersham. L.C. and Dreizen, P. 197 0 . R elationship o f structure to function in m yosin. 1. Subunit dissociation in concentrated salt solutions. Biochem istry 9(8): 1677.
G odfrey, J.E. and Harrington, W.F. 1 970 . Selfassociation in m yosin system at high ionic strength. 1. Sensitivity o f the interaction to pH and ion ic environm ent. Biochem istry 9(4): 886.
Green, D.E. and Fleischer, S. 1 963 . The role o f lipids in m itochondrial electron transport and oxidative phosphorylation. Biochem . Biophys. Acta 70: 554.
G ulik, K .T., Schechter, E. and Luzzati, V.F.M .196 9 . Interaction of proteins and lipids: structure and polym orphism o f protein lipid water phases. Nature 223(5 2 1 1 ): 1116 .
Johnson, A .R . and Davenport, J.B. 1971 . “ Biochem istry and m ethodology o f lip ids.” W iley-Interscience Inc., N ew York.
Lenaz, G., Sechi, A.M ., Parent, G.G. and M asotti, L. 1970 . Lipid-protein interaction in the structure o f m itochondrial m em branes. Proc. Biochem . Soc. 116: 27.
L ow ey, S., Slayter, H .S., Weeds, A.G. and Baker, H. 1 969 . Substructure o f the m yosin m olecule. 1 . Subfragments o f m yosin by enzym ic degradation. J. M ol. Biol. 42: 1.
L ow ey, S., and H oltzer, A. 195 9 . The aggregation o f m yosin . J. Am. Chem. Soc. 81: 1 378 .
McClare, C.W.F. 1 9 6 7 . Bonding betw een proteins and lipids in the envelops o f Halo- bacterium halobium . Nature 216: 766 .
M edwadowski, B., Van der V een , J. and O lcott,H .S. 1 9 6 8 . Nature o f residual lip ids in m enhaden fish protein concentrate. J. Am. Oil Chem. Soc. 45: 709 .
Parkinson, T.L. 1 9 7 0 . Som e analytical problem s in egg research. Proc. Soc. Anal. Chem , 7: 63 .
Pomeranz, Y ., Tao, R .P ., H oseney, R .C ., Shogren, M.D. and F inney, K .F. 196 8 , Evaluation o f factors affecting lipid binding in w heat flours. J. Agric. F ood Chem . 16(6): 974 .
R obinson, J.D. 1 9 6 6 . Interaction betw een protein sulphhydryl groups and lipid double bonds in biological m embranes. Nature 212: 199 .
R oubal, W.T. 1 9 6 7 . Oxidative deterioration of flesh lipids o f Pacific cod . J. Am. Oil Chem . Soc. 44(5): 325.
Rouser, G ., S iakotos, A .N . and Fleischer, S.1966 . Quantitative analysis o f phospholipids b y thin-layer chrom atography and phosphorous analysis o f spots. Lipids 1: 85 .
Saunders, L. 196 6 . Molecular aggregation in aqueous dispersions o f phosphatidyl and ly so phosphatidyl cholines. B iochim . Biophys. Acta 125: 70.
Shaw, N. 1 9 6 8 . The d etection of lipids on thin- layer chrom atograms w ith the periodate- Schiff reagents. B iochim . B iophys. Acta 164: 435 .
Sm oller, M. and Fineberg, R . 1 9 6 4 . Purification o f m ouse m yosin by gel filtration. Biochim . Biophys. Acta 86: 187 .
Stahl, E. 196 5 . “ Thin Layer C hrom atography,” Section II. Academ ic Press, N ew York.
Stansby, M.E. 1 9 6 7 . “ Fish Oils.” Avi Publishing C o.. Inc., W estport, Conn.
Stillings, B.R. 1 9 7 0 . “ Fish Protein C oncentrate, A Comprehensive Bibliography.” Library o f Congress, W ashington, D.C.
V askovsky, V .E . and K ostetsky, E .Y . 196 8 . M odified spray for the detection of phospholipids on thin-layer chrom atograms. J. Lipid Res. 9: 396 .
Waggoner, A .S., Griffith, O.H. and Christensen, C.R. 1 9 6 7 . Magnetic resonance of n itroxide probes in m icell-containing solutions. Proc Natl. Acad. Sci., USA, 57: 1198 .
Waggoner, A .S., K ingzett, T.J., R ottschaffer, S. and G riffith, O.H. 196 9 . A spin-labeled lipid for probing b iological m embranes. Chem. Phys. Lipids 3: 245 .
Weber, K. and Osborn, M. 1 9 6 9 . The reliability o f molecular w eight determ ination by dodecyl sulfate-polyacrylam ide gel electrophoresis. J. Biol. Chem. 2 44(16): 440 6 .
Ms received 1 0 /6 /7 3 ; revised 1 /1 0 /7 4 ; accepted1 /1 5 /7 4 .
This work was supported b y the National Sea Grant program.
The authors are grateful to Dr. V ictor M. R iddle, F ood Science D ept., and Dr. K enneth A. Walsh, Biochem istry D ept. (University o f W ashington) for constant advice and help in this w ork. The authors are also grateful to Dr. William T. R oubal, National Marine Fisheries Service, Seattle, Wash., for invaluable assistance in the ESR experim ents, and Mr. Fred O lney, College o f Fisheries (University o f W ashington) for making available fresh perch.

C. M. L E E , ' R. T. T O L E D O , T. O. M. N A K A Y A M A 1 2 and C. O. C H IC H E S T E R ' Dept, o f F o o d Science, University o f Georgia, Athens, G A 30602
PROCESS REQUIREMENTS AND PROPERTIES OF SPRAY-DRIED SQUID PROTEIN
INTRODUCTIONTHE PO T E N T IA L in th e fo o d industry for prote in pow ders having go o d so lu b ility and fu n ctio n a l properties was discussed b y H am m onds and Call (1 9 7 0 ) . P resently th is n eed is m et prim arily by o ilseed p ro te in co n cen tra tes and iso lates. A nim al p rote in s have b etter nu tritional properties th an plant prote in s and could be used as a n u trition a l su p p lem en t to plant p rotein s. So lvent ex tracted prote in co n cen tra tes from anim al sou rces, h o w ever, have p oor so lu b ility and co u ld n ot be easily b len d ed w ith o th er ingred ients (Barse, 19 6 9 ; R oels, 1 9 6 9 ) . So lu b iliza tio n o f th e p ro te in co n cen tra tes can be achieved b y e n zy m a tic , ch em ica l, or m icro b io log ica l trea tm en ts (R o e ls , 1 9 6 9 ) but th e produ ct is no longer native prote in and th erefore has poor fu n ctio n a l properties.
Squid has p o ten tia l as a sou rce o f a protein pow der that has g o o d fu n ctio n a l properties and b lend s easily w ith other ingred ients. Saffle (1 9 7 3 ) sh o w ed that raw squid can em u lsify fat and m ake heat stab le m eat batters w h en m ixed w ith pork fa t. The tex tu re o f th e c o o k ed product was so ft and h e attrib uted th is to the fact that w h en ch o p p ed w ith salt the squid p ro te in so lu b ilizes and there is no fibrous m aterial le ft to give a firm te x ture. M ore than 50% o f to ta l squid m uscle prote in s is w ater so lu b le (M atsu m oto , 1 9 5 8 ). Squid has a m ild fishy flavor and a slightly sw eetish taste . It is savored as a delicacy in Asia and th e M editerranean countries but in th e Sou th ern and S o u th eastern U n ited States, it is u tilized prim arily for fish bait. A report o f a sizable squid resource in th e w aters o f f Southern C alifornia and an experim en ta l squid harvesting sy stem w as given by Longhurst (1 9 7 0 ) .
Squid has a so ft b o d y w hen w et but w h en dried the m u scle b eco m es very tough . A b o u t h a lf the squid landed in Japan are dried for d o m estic co n su m p tion or for ex p o rt (T akahashi, 1 9 6 5 ). Several investigators have w orked on m eth od s for so ften in g the dried squid and pretreatm ent o f squid b efo re drying to
1 Present address: D ept, o f Food & Resource Chemistry, University o f R hode Island, Kingston , RI 02881
2 Present address: D ept, o f Food Science, University o f Hawaii, H onolulu, Hawaii
enhan ce d eh yd ration (O shim a et ah, 1 9 2 6 ; O kuda et ah, 19 5 4 ; Takahashi and T akei, 1 9 5 5 ). S o m e o f th ese treatm ents im proved reh yd ration properties but also a ffec ted the flavor or co lo r o f the product (T akahashi, 1 9 6 5 ). W ith th e d ev e lo p m ent o f tech n iq u es for shaping or tex tu r izing fo o d prod u cts from pow dered ingred ients, dried squid p ow d er w ith go o d fu n ctio n a l properties cou ld be reco n stitu ted in to su itab le shapes.
This w ork is a feasib ility stu dy o n the preparation o f spray-dried squid pow der. The param eters required for e ffic ie n t processing, th e y ie ld s th a t can be ex pected from th e process, and the propertie s o f th e dried pow der w ere evaluated .
MATERIALS & METHODSPilot plant procedure
Figure 1 shows a flow diagram of the pilot plant procedure used in preparing the squid powder.
The raw squid was washed thoroughly before chopping. The washer employed consisted of a cylindrical wire mesh basket made out of galvanized screen wire having 0.5 in. 2
holes, a large bucket and a mixer. The wire mesh basket was placed inside the bucket and the height of the basket was such that it projected over the lip of the bucket. The squid was placed inside the wire mesh basket and water was run into the bucket continuously. A “Lightnin” mixer inside the wire mesh basket kept the squid under constant agitation during washing. All material that can be washed out was removed along with the water that contin-
uously overflowed the bucket. Washing was continued until the wash-water became dear (about 2 0 min).
The washed whole squid was then chopped through a meat grinder fitted with a 0.5 in. diameter plate. The grinding process broke the material into small pieces, and also broke the ink sac and viscera thus making it possible to wash away the black ink and the contents of the viscera.
The chopped squid was again thoroughly washed in a system similar to that employed for the whole squid. The wire mesh basket used in this stage had 0.25 in . 2 openings. Washing was continued (15 min) until the wash-water became clear.
The washed squid was then diluted with water and comminuted in a large Waring Blendor at a high speed for 2 min to solubilize the water-soluble protein fraction. The pH of the resultant slurry was 6 .8 .
The comminuted slurry was then passed through a finisher fitted with a screen having 0.027 in. diameter openings. The insoluble quill, fragments of the beak, and the small bone-like particles adhering on the surface of the tentacles were separated from the meat in this manner.
The viscosity of the finished, comminuted squid slurry was adjusted by further dilution with water. Spray dehydration was accomplished in an “Anhydro” laboratory spray dryer size No. 1 (Tower Iron Works, Inc.) using a centrifugal atomizer.
Determination of maximum yieldThe proposed process was tested in a bench
scale to determine the yield that can be expected if a minimum of product loss occurs during the process. The manually skinned squid
(I)
(II)
IOOLB. SQUID ( I8LB.SOLID)
I WATER ( 2.5 X Lß.WASHED SQUID )
WASHER CHOPPER WASHER BLENDER( PEELE R)
SKIN VISCERA.INK.AND OTHERUNDESIRABLE MATTER( 10.3 LB. SOLID LO ST)
FINISHER
IINSOLUBLE
SOLID ( 2.44 LB.
SOLID LOST)
SPRAY DRYER
l5.6 LB. PRODUCT(5.26 LB. SOLID)
MANUALLY SKINNED IOOLB. SQUID ( 18 LB. SOLID)I
WATER (25 X LB. WASHED SQUID)I
CUTTER - WASHER - BLENDER - FINISHER - SPRAY DRYER
i * t(2 52 LB SOLID LOST) ( 2.16 LB. SOLID LOST) I40LBPR0DUCT
( 13.52 LB. SOLID)
Fig. I - Schem atic diagram o f process used and yields obtained in the preparation o f spray-dried squid.
Volum e 3 9 ( 1 9 7 4 )—JO U R N A L O F FO O D S C IE N C E -7 3 5

736-J O U R N A L OF FO O D S C IE N C E -V o lu m e 3 9 (1974)
was slit by passing it underneath a rotating blade rather than having it squeezed through the meat grinder. The squid was then washed so as to remove the ink and the undesirable water- soluble matter. Washing was accomplished by using a similar type of washer with the one used in semi-pilot scale except miniaturized, having 1/16 in. 2 holes.
The washed meat was comminuted in a large Waring Blendor, having a fairly sharp blade, with sufficient water to allow for easy filtration. The comminuted slurry was then filtered by vacuum filtration through a perforated metal screen having 0 . 0 2 in. diameter holes. The residue retained on the screen was resuspended in water, comminuted, and the slurry was again filtered adding the filtrate to the first one. The procedure was repeated until the residue could no longer be comminuted and filtered.Quality tests on protein concentrate
Proximate analysis for fat, moisture, ash and protein was done using AOAC procedures(1960) for meat and meat products.
Nonprotein nitrogen was determined using the trichloroacetic acid precipitation method reported by Mezincescu and Szabo (1936).
The amino acid distribution was determined both in protein and in nonprotein nitrogen fractions, using a “Technicon Auto-Analyzer” (Technicon Instrument Co., Tarrytown, N.Y.). The sample was hydrolyzed with 6 N HC1 at 110°C for 24 hr and introduced into the autoanalyzer following standard procedures. Tryptophan was determined by an enzymatic hydrolysis with pronase, following the procedure reported by Spies (1967) except that 19N H2 SO„ and 4 mg/ml of pronase in phosphate buffer was used, and the reaction mixture was incubated 1 hr prior to amino acid analysis.
Solubility of the product was determined by measuring the extent to which the product will be solubilized in water using the American Dry Milk Institute standard method (ADMI, 1962).
The functionality of the protein concentrate was evaluated by determining the capacity of the salt-soluble protein extract to stabilize oil- in-water emulsions. The stability of the emulsion thus produced was evaluated by heating the emulsion to 95°C for 30 min and observing the amount of fat released from the emulsion. The procedure used to determine the oil-binding capacity and the emulsion stability was that devised by Carpenter and Saffle (1964).
Nutritional value of protein concentrate
Animal growth studies to evaluate the protein efficiency ratio (PER) of the protein concentrate was done using the method devised by Campbell (1961), except that a slightly lower protein content (ca. 8 %, Table 5) was used. The test animal was weanling albino mice of the Swiss-Webster strain (Cherokee Labs. Inc., Atlanta, Ga.). The test lasted for 28 days.
The animals were housed in individual wire mesh cages and were given feed and water ad libitum. Six animals were used for each protein evaluated. Individual weights were recorded weekly and feed intake was measured every feeding period on an individual basis. The feed was in the form of pellets and consisted of 70% corn starch, 1 0 % squid protein, 1 0 % corn oil, 4% USP salt mixture, 5% nonnutritive cellulose and 1% vitamin mixture. Casein was used as the reference protein.
The PER value was determined for each diet
as the grams of weight gained per gram of dietary protein consumed.
The calculated PER value was then corrected using a reference PER of casein of 2.5.
RESULTS & DISCUSSIONProximate analysis and amino acid analysis
The p roxim ate analysis o f squid is sh o w n in T able 1. T he raw squid co n tained a very low level o f fat and m ost o f the so lids present w ere p rotein . F at, prote in and w ater accou n t for 97 .18% o f the raw squid.
The balance could be polysaccharid es w h ich occu r in the form o f p o lysacch aride-protein c o m p lex w h ich has been c o n firm ed to be present in the invertebrates by H unt (1 9 7 0 ) . The analysis o f the spray-dried p rodu ct sh ow ed a decrease in fat and ash and a con seq u en t enrichm ent o f th e protein , as th e process o f washing rem oved so m e fat and the fin ish ing rem oved in so lu b le m atter.
T he am ino acid profile o f squid p ow der is sh ow n in T able 2. It m eets the essentia l am ino acid requirem ents o f the FAO reference protein , and com pares
favorably w ith fish prote in co n cen tra te from red hake (S idw el! et a l., 1 9 7 0 ). C ystine as rep orted in T able 2 m ay be low er than w hat is actually present b e cause o f d estru ctio n during protein hyd rolysis.
The n o n p ro tein n itrogen as a TCA extractab le fra ction present in squid is sign ifican tly h:gh. The am ino acid p rofile o f th e TCA ex tractab le fraction (T able 2 ) in d icates that a considerab le p o rtio n o f n on p ro tein n itrogen appears to be essen tial am ino acids. The sign ifican ce o f the practice o f retain ing th e r .on p rcte in n itro gen fraction during processing was n o t evaluated in th is w ork.Yields
The p ilo t plant scale process as sh ow n in Figure 1 gave a y ield o f o n ly 29.4% o f the to ta l so lid s in th e raw un w ashed squid. The process o f ch op p in g in a m eat grinder sq u eezes th e m aterial such that som e so lu b le co m p o n e n ts w ere w ashed away during the w ashing process. T his and the m aterial lo ss through th e screens accou n t for the m ajor lo ss during w ashing.
A n other m ajor lo ss occurred during
Table 1—Proximate analysis of raw squid and spray dried squid
Sample%
h 2o%
Fat
%Protein
(N X 6.25)
% IMon- protein
nitrogen
% Protein corrected
for nonprotein nitrogen
%Ash Other
Raw, unwashed 78.7 1.38 14.97 _ _ 1.09 2.86Spray dried 4.4 2.11 81.20 1.83 69.75 4.10 8.19
Table 2—The amino acid profile of squid protein concentrate and of its nonprotein nitrogenous fraction
Amino acidAmino acid
g/100g protein
Amino acid g' N)/100g total
nonprotein nitrogen
Aspartic acid 8.66 0.09Threonine 3.32 1.24Serine 2.59 1.33Glutamic acid 12.13 1.53Proline 2.45 3.16Glycine 2.64 1.97Alanine 4.05 4.73Valine 3.54 1.23Cystine 0.93 —Methionine 2.19 0.06Isoleucine 3.88 1.05Leucine 6.45 2.03Tyrosine 2.45 0.03Phenylalanine 3.44 0.09Lysine 8.20 3.90Histidine 2.33 0.11Arginine 6.58 7.25Tryptophan 1.22 “

SPRA Y -D R IE D S Q U ID -7 3 1
Fig. 2 —Effe ct o f dilution ratio and m oisture content on viscosity o f com m inuted squid slurry.
Fig. 4 —E ffe ct o f inlet air temperature on spray drying rate at an air flow o f 172.5 lb dry air per hr.
finish ing. The slurry was passed through the fin isher o n ly o n c e , and no attem p t was m ade to re-suspend the m aterial that did n ot go through the screen. T his m aterial still co n ta in ed recoverable water- so lub le fraction and re-suspension in w ater fo llo w ed by c o m m in u tio n and a second fin ish ing w ou ld have im proved the y ield . It has b een rep orted by M atsum oto(1 9 5 8 ) that m ore o f th e w ater-soluble prote in can be ob ta in ed from squid by a repeated ex traction .
The result from a b en ch scale stu dy that was designed for m axim um y ield , ind icates that a y ield up to 74% o f w h ole raw squid so lid s can be ex p ected if the squid is slit rather than having it sq ueezed through th e m eat grinder and th e loss through the screens is m in im ized by em p loy in g a washer having sm all size holes.
Spray deh yd rationE xperim ents on spray deh yd ration was
designed to id en tify the o p tim u m param eters required for m ax im um p ro d u ctio n and go o d p rodu ct q u a lity . T he tw o variables stu d ied w ere feed v isco sity and in let air tem perature.
F eed v isco sity m ust be carefu lly regulated for o p tim u m spray drying rate. Water needs to be added to th e chopp ed squid during co m m in u tio n in order that a slurry w ith very fin e ly subd ivided particles can be atta ined . A d ilu ted slurry also handles w ell in th e fin isher.
Figure 2 sh ow s the e ffe c t o f feed v isco sity on deh yd ration rate. T he squid slurry fo llo w in g b lend in g , fin ish ing and dilu tion w ith water to a m oisture co n ten t above 95% was a lm ost N ew to n ia n in flow behavior w ith very sm all dev iation s in v iscosity w ith changes in ro ta tion a l speed o f the v iscom eter used (B roo k fie ld , M odel R V F ). T he sp in d le and rota tion a l speed ch osen a llow ed abou t a m id-scale
d e flec tio n o f th e v isco m eter ind icator. The op tim u m feed v isco sity for m axim um p ro d u ctio n rate o f dry p ow der was abou t 3 9 0 cen tip o ises . F rom F igure 3, a v isco sity o f 3 9 0 cen tip o ises corresponds to a d ilu tio n ratio o f 2 .5 parts w ater to 1 part o f ch o p p ed w ashed squid by w eight, giving a m oisture c o n te n t o f 97.3% .
A ll o f th e runs that w ere used to prepare th e squid prote in sam ples for
□ IB FEED PROCESSED PER HOUR B LB. WATER EVAPORATED PER HOUR
1 1
• LB. BONE DRY MATTER PROCESSED PER HOUR
0 ------------1------------1------------1----------- 1---100 200 300 4 0 0
VISCOSITY IN CENTIPOISES
Fig. 3 —Spray drying rate as a function o f feed viscosity.
testin g w ere carried o u t w ith th e a tom izer operated at 3 4 ,0 0 0 rpm . A co n sta n t feed rate was necessary to m in im ize caking o f th e feed and clogging o f th e atom izer. The co n sta n t rate w as m ain ta ined by feed in g under a p o sitiv e pressure o f 3 .5 psig.
T he e ffe c t o f in let air tem perature on rate o f drying is sh o w n in F igure 4 . An increase in in let air tem perature corresp on d in g ly raised th e rate o f evaporation . The drying rate as a ffec ted b y operating c o n d itio n s for the spray drier is sh o w n in T able 3. T he ex it air tem perature that w ou ld a llo w m axim um feed rate and yet n ot cause a d e p o s it io n o f w et liq u id on th e sides o f th e spray drier is that w h ich corresponds to an e x it air relative h u m id ity o f 9%, and an equal w et bulb tem p erature as that o f th e in let air. This can be seen b y tak ing the values for the in let and e x it air tem p erature as sh o w n in Table 3, and fo llo w in g an ad iabatic h u m id ifica tio n process in a h igh tem perature psychro- m etric chart.
T he spray drier used in th is w ork has an air f lo w rate o f 1 7 2 .5 lb dry air per hr, and th e exp erim en ta lly ob ta in ed drying rates based on w ater evaporation from feed correspon d very c lo se ly w ith the drying rates determ ined from the hu m id ity o f th e in let and ex it air.
F u n ction a l propertiesF u n ctio n a l properties evaluated w ere
so lu b ility and o il b inding cap acity in anoil-in-w ater em ulsion .
T he so lu b ility o f the spray-dried pow der was e x ce llen t. D rying tem p eratures up to an in let air tem p erature o f 2 8 0 ° C did n o t sh ow any e ffe c t o n the so lu b ility . W hen su sp en ded in 10 tim es its w eight o f d istilled w ater, the dried squid pow der registered 92% o n the so lu b ility in d ex using th e ADM I (1 9 6 2 ) standard procedure, com pared to 97% for the

1 3 8 -J O U R N A L O F FO O D S C IE N C E -V o lu m e 3 9 (1974)
Table 3—Drying rates and operating temperatures used during spray drying
Drying air temp Solid contentInlet Exit Drying air humidity Feed rate Feed Product Drying rate(°C) (°C) Inlet Exit (Ib/hr) (%) <%) (lb evap/hr)
175 88 0.004 0.033 5.1 1.60 92.1 5.01200 93 0.004 0.043 6.9 2.15 94.7 6.74225 96 0.004 0.049 8.0 2.75 93.4 7.76
Table 4—Oil binding capacity of products dried at various temperatures
Inlet air temp used in drying
r o
Salt sol protein in 15 ml of extract
(mg)
Oil bound per 15 ml extracta
(ml)
Temp of emulsion
<°C)
Oil bound per 100 mg of salt sol protein
(ml)175 324.15 55.00 31.75 16.96200 330.22 57.16 31.50 17.30220 333.76 56.83 31.50 17.02285 303.66 51.75 31.50 17.04
a S ig n if ic a n t d iffe re n c e a t th e 95% c o n fid e n c e leve l ( F 0 = 10.79, F 05 3 1 2 = 3 .49)
Table 5—Animal feeding test data using squid protein concentrate dried at different temperature
Diet
Protein level ( IN X 6.25)
(% )Gained wt
<g) Feed efficiency PER3Adjusted
PER
A 8.22 14.23 ± 2.5 0.127 ± 0.0215 1.54 ± 0.268 2.78B 8.15 16.04 ± 5.35 0.139 ± 0.0189 1.70 ± 0.219 3.08C 8.12 13.33 ± 0.68 0.119 ± 0.0078 1.47 ± 0.084 2.66Standard 8.33 14.56 ± 2.64 0.115 ± 0.0200 1.38 ± 0.165 2.50
a N o s ig n if ic a n t d iffe re n c e s a t th e 9 5 % c o n fid e n c e leve l
spray-dried m ilk reference. This result attests to th e ex ce llen t reh ydration capacity o f th e squid pow der. N o t all o f the p ow der was d issolved but th e undissolved fraction absorbed w ater to such an ex ten t that th e particles sw elled and a gel-like m ass was produ ced . F or th is reason, the ADM I procedure for so lu b ility w hich m easures th e q u a n tity o f so lid s that settle from a su sp en sion after cen trifu gation cou ld n o t d ifferen tia te b e tw een the so lu b ilized prote in and th e un disso lved p ro te in particles that form the gel-like m atrix. The q u a n tity o f unrehydrated particles o n the o th er hand cou ld be evaluated from the fraction that se ttled d u r in g cen tr ifu g a tio n . This fraction acco u n ted for a very sm all percentage o f the spray-dried squid pow der.
The o il-b inding capacity o f th e spray dried pow der is sh o w n in T able 4 . There appeared to be sign ifican t d ifferen ces in th e o il-b in d ing capacity b e tw een various drying tem peratures in term s o f in let air tem p eratu re . The excessiv e ly high tem perature app arently caused an inferior oil binding a b ility . T he results also sh ow that squid p ro te in had 67% sa lt-so lub le pro
te in . T his is considerab ly higher w hen com pared to o th er ty p e s o f m eat, e.g ., pork ch eek m eat (45% ) and b e e f heart (41% ) as determ ined by Saffle and Gal- breath (1 9 6 4 ) . T he am oun t o f sa lt-so lub le p ro te in o f squid pow der ind ica tes that itso il-b in d ing capacity m ay be higher than th e oth er m ajor group o f m eat in term s o f o il b ou n d per given a m ou n t. H ow ever, the o il-b in d ing capacity o f squid protein expressed in term s o f o il bou n d per 100 m l o f sa lt-so lub le protein (1 7 m l /100 mg, T able 4 ) appeared less than th o se o f the b e e f and pork m eat prote in ( 2 0 —35 m l/100 m g, Carpenter and Saffle , 1 9 6 4 ).
C ook in g te st for em u lsion stab ility sh ow ed that no o il w as released from the three em u lsion s that w ere prepared by em u lsify in g 2 5 m i o f ex tract w ith 9 0 , 95 and 97 m l o f o il. A d d itio n o f oil in excess o f 97 m l m ade th e em u lsion un stab le and o il and w ater separated after heating.
N utritional valueThe resu lts o f anim al feed in g tests
using th e squid prote in are sh o w n in Table 5. D iets A , B and C w ere prepared from squid p ow der spray dried at 1 9 0 ,
2 1 0 and 2 4 0 °C in let tem p erature, respec tively .
The adjusted PE R value o f th e squid protein w ere all higher than th e referen ce casein d iet. N o sign ifican t d ifferen ces in PER w ere observed w ith the op eratin g tem peratures used.
The m ice used in th e feed in g ex p erim en ts w ere equal num bers o f m ale and fem ale for each te st . T he data rep orted were averaged for b o th m ale and fem ale . Since fem ales generally sh o w low er w eight gains th an m ales, th e w eight gains sh ow n in T able 5 m ay be lo w er than that observed by oth er investigators. F urtherm ore, w eight gains for m ice are generally low er than for rats, w h ich are used in m o st anim al feed in g stu d ies. T he data sh ow n in T able 5 h ow ever are valid for com paring p ro te in q u a lity o f ex p erim ental sam ples, and th e P E R w ith reference to casein , s in ce the sam e c o n d itio n s w ere u tilized in th e anim al feed in g tests for the various sam ples.
REFERENCESADM I. 1962 . S tan d ard s fo r grades fo r th e d ry
m ilk ind u stry . Bull. 916 , A m erican D ry Milk In s titu te , Chicago, 111.
AOAC. 1960 . “ O fficial M ethods o f A nalysis,” 9 th ed. A ssociation of O fficial A g ricu ltu ra l C hem ists, W ashington, D.C.
Barse, J .R . 1969. Ja p a n ’s food dem an d and 1965 grain im p o rt p rosp ec ts , p . 46. F A E R - 50, E R S, USDA, W ashington, D.C.
C am pbell, J .A . 1961 . M e thodology of p ro te in evaluation n u tr itio n d o c u m e n t, p. 10 , A dd. 27. W H O :F A O :U N IC E F :P A G , N ew Y ork.
C arpen ter, J .A . and Saffle, R .L . 196 4 . A sim ple m e th o d of estim ating th e em ulsify ing p ro p e rty o f various sausage m eats. J . F ood Sci. 29: 774.
H am m onds, T.M. and Call, D .L . 197 0 . U tilizat io n o f p ro te in ing red ien ts in th e fo o d ind u stry . P art 2. The fu tu re m a rk e t fo r p ro te in ingred ien ts. D ep t, o f A gricu ltu ral E conom ics, C ornell U niversity , Ith aca , N .Y .
H u n t, S. 197 0 . P o ly saccharide-p ro te in co m plexes in inverteb ra tes . A cadem ic Press, New Y ork.
L onghurst, A .R . 1970 . S quid slurp te s te d successfully . C om m ercial F isheries R eview 32: 4.
M atsum oto , J . 1958. Som e aspects on th e w ate r so luble p ro te in o f squid p ro te in . Bull. T okai R egional F isheries Lab. N o. 20 , p. 65.
M ezincescu, M.D. and S zabo , F . 1936 . D e te rm in a tio n o f n o n -p ro te in n itrogen . J . Biol. Chem . 115: 131.
O kuda, Y., S ak am o to , T. and T akeya, S. 1954. D isten tio n o f d ried squid m ea t in sod ium b ica rb o n a te so lu tion . J . H okkaido F isheries E x p t. S ta. 1 1 :9 .
O shim a, K ., F u n a to , M., I to , C. and T akahash i,H . 1926 . T echniques to so ften dried squid. J . F isheries 29: 58.
R oe ls , O .A . 1969. P ro te in p ro d u c tio n , m arine p ro te in s. C hem . Eng. Prog. 65: 9.
Saffle, R .L . 1973 . The use o f squid in m ea t em ulsions. J . F o o d Sci. 38: 551.
Saffle, R .L , an d G alb rea th , J.W . 1964 . Q uantita tiv e d e te rm in a tio n o f sa lt so lub le p ro te in in various ty p e s o f m eat. F oo d T echnol. 18: 119.
Sidw eil, V .D ., Stillings, B .R . and K nob l, G .M . J r . 1970. The fish p ro te in c o n c e n tra te s to ry . F o o d T echnol. 24: 876.
Spies, J .R . 1967. D ete rm in a tio n o f try p to p h a n in p ro te in s. Anal. C hem . 39: 1412 .
T akahashi, T. 1965 . Squid m ea t and its p rocessing. In “ Fish as F o o d ,” E d. B orgstrom , G.. A cadem ic Press, N ew Y ork.
T akahashi, T . and T akei, M. 1 9 5 5 . O n th e toughness o f bo iled squ id m ea t. Bull. Ja p an Soc. Sci. F isheries 20: 11.
Ms received 1 0 /3 1 /7 3 ; revised 2 /7 /7 4 ; accep ted2 /1 0 /7 4 .

G. J. K . P A C K E R a n d j . L . B. G A M L E N '
D e p a r tm e n ts o f F o o d S c ie n c e a n d M a th e m a tic s
U n iv e r s ity o f A lb e r ta , E d m o n to n , A lb e r ta , C anada T 6 G 2 E 2
CALCULATION OF TEMPERATURE MEASUREMENT ERRORS IN THERMOCOUPLES IN CONVECTION HEATING CANS
INTRODUCTIOND U R IN G H E A T IN G or c o o lin g o f cans tw o factors can give rise to d ifferen ces b e tw een th e tem p erature o f th e sensing elem en t (e .g ., th erm o co u p le ju n c tio n or th erm om eter bu lb ) and the tem perature o f th e m aterial surrounding th e ju n ctio n or bulb. Heat co n d u ctio n a long th e th erm o co u p le wire or therm om eter stem has b een recogn ized as a sou rce o f error by a num ber o f w orkers (e .g ., B igelow et al., 1 9 2 0 ; Ford and Osborne, 1 9 2 7 ). T em perature m easurem ent errors also occur because there m ust be a tem p erature d ifferen ce b e tw een the sensing e lem en t and surrounding m aterial for transfer o f the heat w h ich is required to heat th e bulb or ju n ctio n . This sec ond factor , w h ich causes th e recorded tem p erature to lag behind that o f th e fo o d m ateria l, d o es n o t appear to have been discussed q u a n tita tiv e ly in th e therm al processing literature. Ball (1 9 2 3 ) and E cklund (1 9 4 9 ; 1 9 5 6 ) have proposed correctio n s for th e heat c o n d u ctio n error in fo o d s heating by c o n d u ction . T hese correction factors can n ot be app lied to can tem peratures m easured in cans h eatin g b y co n v e ctio n because o f the d ifferen ces in th e ty p e s o f tem p erature d istr ib u tion in co n d u ctio n -h ea tin g and co n v ectio n -h ea tin g cans.
We could n o t find any m eth o d for ca lcu lating th e heat co n d u ctio n and tim e lag errors for cans heating b y c o n v ectio n , and h en ce our aim in th e stu d y rep orted in th is paper w as to derive expressions for th e tem perature error in th erm o co u p les in cans heating b y co n v e ctio n , and to d evelop m eth o d s by w h ich corrections cou ld be easily app lied to process calculatio n s. T he ty p e o f th erm o co u p le considered w as that described by Board (1 9 6 5 ) and used b y Packer (1 9 6 7 ) in w h ich the th erm o co u p le leads pass through d iam etrica lly o p p o sed h o les in the can w all w here th e y are sealed w ith e p o x y resin. We have n o t considered tem perature m easurem ent errors for the th ick probes described b y E cklund (1 9 4 9 ) because th e m ath em atical analysis is q u ite d ifferen t from and m uch m ore co m p lex than that for the ten sio n ty p e o f th erm o co u p le , and also because w e consider th a t th e so lid probe is in h eren tly u n su itable for tem perature m easurem ent in liq u id -filled cans as the th ick stem is q u ite lik e ly to sign ifica n tly disturb th e w eak co n v ectio n currents in th e can.
EXPERIMENTALConvection model
In order to derive the differential equation describing the heating of the thermocouple wire, the temperature of the liquid near the wire (Tl ) must be known beforehand. Since we are interested only in the difference between the temperatures of liquid and thermocouple, it suffices to assume a rough approximation for Tr . We will assume Tl is uniform across the can, and approaches the retort temperature exponentially. This is justified according to a simple convection model based on the observations of one of the authors (Packer, 1967) and those of Jackson and Olson (1939), Tani (1939) and Fagerson and Esselen (1950). In the model, the film of liquid moving up the wall is thin, and
'P re se n t address: D ep t, o f M athem atics, Y ale U niversity , New H aven, CT 0 6 520
the “piston” of liquid flowing slowly down the center has uniform temperature. Thus for our purposes, uniform temperature may be assumed. We cannct give a precise value for the maximum viscosity of liquid for uniformity of temperature across the can. It will probably be necessary to check horizontal uniformity experimentally for very viscous liquids before applying the corrections described in this paper.
To simplify our equations we assume that the wire has uniform properties across the can and that its ends are maintained at retort temperature.Equation for wire temperature and its solution
If Tr is the constant retort temperature, we assume that the liquid temperature near the wire is Tr (0) = Tr - (Tr — Tq) exp(— 7 0 ), 0 denoting time. The equation describing T(x,0) (the temperature of the wire at position x and time 6) is found in the standard way, by considering heat transfer for an infinitesimal cylinder of the wire. This involves the heat transfer from the liquid through the insulation of the wire, the conduction of heat along the wire, and the rate of increase of wire temperature (3T/30). The resulting “boundary value problem” is:
d"T 4h pc3T3x2 kd L) k 30
T(—a, 0 ) = T(a, 0) = Tr for all 0 > 0
T(x, 0) = To for -a < x < a
where a = radius of the can; k = conductivity of the wire material; d = diameter of the wire; p = density of the wire; c = specific heat of the wire material; and h = heat transfer coefficient, liquid to wire.
A Fourier-type expansion for the wire temperature. The “boundary value problem” for T(x,0) as formulated above was solved by the method of eigenfunction transforms (cf. Mackie, 1965), yielding a Fourier-type expansion:
T(x,0 ) = T0 + (TR - T0) 1 bn(0) sin ~ (1 + f)n odd 1 d
where
bn(») =• (* n 2rr2
4ce2
an \ n‘ it‘ + 4a2 — 4/3' n2 rr2 - 4g2
n 2ir2 + 4a-2 - 4/J!4ha2
exp(— 7 0 )
exp(- n2 7r2 + 4a2 \
kda2 cp7
; and
Formulae for the thermocouple errorIn order to get a correction factor for the observed temperature, we
will use the previous series expansion to find the theoretical proportional error (8 ):
T(x,0) - TL(0) Tr - T l (0) ’
which we abbreviate toT - T L
Tr - Tl
Our basic assumption is that this is a good approximation to (T1 — T*l )/ (Tr - Tl ) where T'r denotes the actual liquid temperature and T'
Volume 39 (1974 )-JO U R N A L OF FOOD SC IEN C E-739

740—J O U R N A L OF FOOD S C I E N C E - V o lu m e 3 9 (1974)
is the observed thermocouple temperature. (Recall that Tl was our rough guess for the liquid temperature.)
We have 8 = (T - TL)/(TR - TL), and T'L = T' - ((T' - T'L)/ (Tr - r L)] • (Tr - T'l ) identically, so T'L - T' - 8 (TR — T'L). Solving for T l , the corrected temperature, we obtain:
t l = r - 1 n b (Tr - r )
Although the series in (5) converges very rapidly, we give the following estimate of the remainder after summing from n = 1 to N (N odd),again assuming that P2 < + a2.
4
The remainder after summing (5) from r. = 1 to N is less than
64(a2 - p2 )2 a2 3tt5(N - 1 ) ~
(N odd).
where 8 = (T - Tl)/(Tr - Tl) (to be calculated theoretically).
r is the observed thermocouple reading, and TR is the retort temperature.
Calculation of S = (T - Tl)/ (Tr - TL)If we calculate 8 neglecting the final exponential transient term in
our series solution for T(x,0), it turns out that 8 is independent of time 6 . (The next section analyzes the transient term, to justify this procedure.) We will use the following formula:
Formulae for the transient errorWe will write down the “transient terms” which we neglected in
calculating [(T - Tl)/(Tr - TL) ] (= 8 ) so that it can be checked directly whether or not our formulae (3) or (5) are sufficiently accurate.
The exact formula for the proportional error 6 is:
_ T(x,0 ) - TL(9)Tr - T l (0)
equals formula (3) or (5) minus the term:
— £ - sin ^ ( 1 +- ) = 1 , for -a < x< a. ( 1 )w n odd n 2 a
We can write Tl (0) as
T 0 + (Tr - T 0 )(l - e x p (- yd)).
£ 1 / n2 7r2 - 4p2__\ . mrn n mddZï y^TT2 + 4a2 - 4p2J Sm 2 ’ + X)a
• exp(- + 4a 2 — 4(32
4 p ^(y d
(6 )
Then
Tl(9) =4 V*1 1 wjt y
T0 + [(Tr - T0)d - exp(- ,0 )] ■ - n 2 d - s in y (1 + -).
A calculation with our solution T(x,0) now yields:
T - Tl 4 v l n2w2 - 4p2 . nrr ,, , x,t R - t L n n odd n n2rr2 +4o<2 -4(32 2 a
(plus small transient terms)
(2 )
Using formula (1) again, we may rewrite formula(2) as the following more rapidly converging series:
6 _ T(x, 0) — Tl (0)Tr - Tl (0)
= 116a2
n ocld n (n 2 rr2 + 4a2 - 4|32)
(plus small transient terms).
nrr xsin — ( 1 + —)
2 a(3)
In order to facilitate any desired accuracy, we will give an estimate of the remainder after summing the above series from n = 1 to N. It can be shown using integration that the remainder after summing (3) from n = 1 to N is less than
~j , N odd (providing j32 < \ + a2) (4)(N - l ) 2 4The assumption (32 < + a2 will be justified at the end of the
paper.We used formulae (3) and (4) above as the basis of the satisfactory
computer program to find 8 in terms of the constants a and p. We also give a more complicated but also more rapidly convergent series formula for 8 which should enable the reader to find S easily, using pencil and paper only, for given values of a, x, a and (3. The following formula is obtained from (3) (using no approximations) by expanding various polynomials in Fourier-type series.
5 = 1 — f (1 - X2) + ^ £ ------ }(1 - X2)( l - I f )2 ir 24ît 5
256(a2 — p2 )2 a 2 sin— (1 + X)I ---------- 2- ----------------
n odd n5[n27r2 + 4a2 - 4(32 ]
(5)
(plus small transient terms)
where X denotes x/a.
Each term in the transient series above is the same as the corresponding term in the series for 8 in formula (3) except for the addition of the exponential factor:
exp(- n 2 n 2 + 4a2 4 p24P2
■ (70)).
We have the condition that ir2 + 4a2 > 4p2, and hence the exponential factor must be less than 1 for all n and all 0 > 0. The n2 n 2 term in the exponent gives rapidly decreasing terms as n increases and hence a few calculations of the transient series will be sufficient to determine the magnitude of the transient effect.
A more precise observation is that the remainder after summing the series (6 ) for n = 1 to N - 2 is less than:
4P2 exp( N2 tt2 +4a 2 - 4P2
N 2n 3yd
for all x and N2 n 2 + 2 a 2 > 4P2 .
4P 2y 6 )
For x = 0 (i.e., at the center of the can) the remainder after summing from n = 1 to N - 2 (N odd) is less than:
4 p 2
N3 (N + 2)7r37 0exp(- + 4a2
~ 4 F ~
4P70)
The complete series (6 ) i.e., the complete transient term, for x = 0 is then less than:
4P2
3tt370exp(- + 4a2 - 4P— ---------70).
4P2(7)
Limiting value of p 2
We have made the assumption that P1 < tt2/4 + a2, i.e., P2 - a 2 < n 2 /4 . The series for 8 (equations 2,3 and 5) cannot be evaluated for P2 - a 2 = 7t2 / 4 although a limit exists as p 2 — a 2 tends to rr2 /4. For values of a 2 and p2 such that p 2 - a 2 < -n2 ¡4 , and sufficiently large 0, the curves of log(TR — T) and log(TR - Tl) vs 0 are parallel, i.e., the rate of approach of the thermocouple temperature (T) to retort temperature (Tr ) is dependent only on the rate of approach of the liquid temperature (TL) to Tr . However, when p 2 - a 2 > 7r2 /4 , the heat capacity of the wire is so great that the two curves are no longer parallel, even for infinitely large values of 0. When this occurs, temperature measurement is not possible, and hence we can consider that the assumption that (32 < n 2 ¡4 + a2 is justified for all situations of interest in the present discussion.

T E M P E R A T U R E ER R O R S IN THER M O C O U P LES-741RESULTS & DISCUSSION
The graphsWe used a Fortran program (c o p ie s available from auth ors)
to ca lcu late values o f 6 for a range o f values o f th e d im en sio n less num bers Cp and Cy. T he program in c lu d es a ca lcu la tion o f th e nu m ber o f term s required for any given accu racy , w h ich can be sp ecified as o n e o f th e inp ut param eters. The resu lts reported here have a m ax im um ca lcu la tio n error o f 10 "6i.e ., 0 .0 0 0 1 % o f th e u n accom p lish ed tem perature d ifferen ce , T r - T.
5 thermocouple wires-l in rane
Fig. 1—T y p ic a l c u r v e s o f re la tiv e h e a t c o n d u c t io n e rro r (&) vs. ra d iu s o f th e can (X ) .
Figure 1 sh ow s 5 vs. x /a for ty p ica l values o f CD( - a2 c p /fh k = /32 / I n 10 ) and Cy (= ha2 /kd = a 2 /4 ) . As ex p ected th e error is p ositive near th e can w all (d u e to heat c o n d u ctio n from th e ends o f the w ire) and in all cases sh o w n th e error is negative in th e central p o rtion o f th e can. The negative error (tem p erature o f th erm o co u p le lagging behind that o f the liq u id ) is due tc th e liq u id to wire heat transfer tem perature d ifferen ce . T he curves c lo se ly approach the values o f 5 for in fin ite ly long th erm o co u p le w ires for w h ich 5 = 1 / ( a 2 /(32 — 1).
In F igures 2 through 6 w e have co n to u rs o f 5 in term s o f Cp and Cy for values o f X(= x /a ) = 0 .0 , 0 .2 , 0 .4 , 0 .6 and 0 .8 . T he area in the lo w er right corn er o f each graph is th e area w here ¡32 > tt2 /4 + a 2 .
T he upper ranges o f c o n v ectio n num ber Cy give con to u rs o f 6 w ith a slop e o f + 1 . This region o f th e graph is for co n d itio n s w here c o n d u ctio n is neg lig ib le and th e error is en tire ly due to th e therm al inertia o f th e w ire giving a w ire tem perature lagging beh in d that o f th e liq u id . T he eq u a tio n app lying to th ese c o n d itio n s is that for th e in fin ite w ire case:
5 = l/(c*2 /j32 l ) = I/o4 h fh
In 10 • cpd1 ).
T he area w here th e values o f 5 are p o sitiv e is the area w here c o n d u ctio n o f heat along th e w ire prevails. This area gets larger as x increases, u n til near th e can w all (x = 0 .8 ) m o st o f the graph has positive values o f tem p erature error.T yp ica l ca lcu la tio n s o f 5
We have con sid ered n y lo n insu lated th erm o co u p le wires (2 4 g ) in a 6 in. diam can filled w ith a liq u id having a v isco sity four tim es th a t o f w ater at 10 0 °C and a v e lo c ity o f 10 f t/h r [w h ich is s low er than any observed b y Packer ( 1 9 6 7 ) ] . T hese co n d itio n s w ere ch o sen to give th e m axim u m lik e ly e ffe c t o f the transient term s, a lthough n o t necessarily to give an estim ate o f th e m axim um lik e ly tem perature error in a can. The value o f fh used is 5 .0 m in.
Fig. 2 —C o n to u rs o f h e a t c o n d u c t io n e rro r (e x p r e s s e d as p e r c e n ta g e o f Fig. 3 —C o n to u r s o f h e a t c o n d u c t io n e rro r (e x p r e s s e d as p e r c e n ta g e o f u n a c c o m p lis h e d te m p e r a tu r e d i f fe r e n c e ) fo r X = 0 .0 . u n a c c o m p lis h e d te m p e r a tu r e d i f fe r e n c e ) fo r X = 0 .2 .

742-J O U R N A L OF FO O D S C IE N C E -V o lu m e 3 9 (1 9 7 4 )
We used the heat transfer correlation
based o n the data o f Davis (1 9 2 4 ) for values o f d V p //i b e tw een 0.2 and 200 to ca lcu late th e film heat transfer co e ffic ie n t. This, a long w ith the resistance to heat transfer o f th e 0 .0 0 7 in. n y lo n insu la tion gives an overall heat transfer c o e ff ic ie n t o f 20 B tu/hr f t2 °F .
F or con stan tan , ircn and copper w ires th e respective values o f C y are 58 , 22.6 and 3 .3 1 , and o f C o are 2 .9 0 , 1 .23 and 0 .1 6 6 . A t th e cen ter o f the can (x = 0 .0 ) F igure 2 gives values o f 5 o f —3.0% , -3 .2 % and +2.8% for the co n sta n ta n , iron and cop p er wires respectively .Transient e ffe c ts
T he m axim um value o f the transient error can be estim ated for the three w ires us.ng eq u a tio n (7 ) for the cen ter p o in t in the can. A fter 3 0 sec th e transient errors for th e constan tan , iron and cop p er wires are less than 0 .0 0 0 5 , 0 .0 0 0 3 and 0 .0 0 0 0 0 7 resp ectively and at 6 0 sec are less than 10"7 , 10 ' 7 and 4 .1 O’1 0 , resp ectively . B ecause fj, = 5 .0 m in , th e transient error is neg lig ib le w ell b e fo re leth al tem p eratures are reached. In general w e e x p e c t that the transient error w ill be un im portant in all processing situ ation s , and in any case i f the m axim um transient error as given b y form ula (7 ) d ecays to o s lo w ly , ca lcu la tion o f the first few term s o f series ( 6 ) w ill give a precise value o f the transient error.
A p p lica tion to process ca lcu la tionsFor process ca lcu la tion s using th e form u lae o f S tu m bo
(1 9 7 3 ) or o th er equivalen t m eth od s, sim ple correction s can be applied to the “ lag fa c to rs” (jh and jc ) o f the heating and c o o lin g curves to acco u n t for the heat c o n d u ctio n error, as fo llow s:
Jh = j ,h /U — 5 ) and j 'c = jc / ( l - 5 )
w here ji, and are th e values o f j ca lcu lated from th e observed
th erm o co u p le tem peratures. In th e presen t stu d y w e have n o t ca lcu lated the e ffe c ts o f heat c o n d u ctio n errors during the early part o f th e co o lin g curve. H ow ever, w e are o f th e o p in io n that as lo n g as th e co rrection factor is n o t u n d u ly large, th e use o f the corrected value o f j c given above w ill be a very go o d a p p rox im ation for use in process ca lcu lations.
Fig. 5 —C o n to u r s o f h e a t c o n d u c t io n e rro r (e x p r e s s e d as p e r c e n ta g e o f u n a c c o m p lis h e d te m p e r a tu r e d i f fe r e n c e ) fo r X = 0 .6 .
1006
Q01 0.02 0.05 0.1 1.0 2.0 ^ 50 10.0
Fig. 4 —C o n to u r s o f h e a t c o n d u c t io n e rro r (e x p re sse d as p e r c e n ta g e o f u n a c c o m p lis h e d te m p e r a tu r e d if fe r e n c e ) fo r X = 0 .4 .
Fig. 6 —C o n to u r s o f h e a t c o n d u c t io n e r ro r (e x p r e s s e d as p e r c e n ta g e o f u n a c c o m p lis h e d te m p e r a tu r e d i f fe r e n c e ) fo r X = 0 .8 .

T E M P E R A T U R E E R R O R S IN TH ER M O C O U PLES-743SYMBOLS REFERENCES
a radius of canc specific heatCp dimensionless conduction number = a2 cp/f^k = p2 /In 1 0
Cy dimensionless convection number = ha2 /kd = a 2 /4d diameter of thermocouple wiree base of natural logarithmsf “slope” of heating or cooling curve = In 1 0 / 7
h heat transfer coefficient (liquid to wire)j actual lag factor for heating or cooling curvej' observed lag factor for heating or cooling curvek thermal conductivityn,N parameters of summation in seriesT temperatureV velocity of liquidx distance from can axisX dimensionless radial distancea 2, p 2 constants (see Cj) and Cy above)7 constant (see f above)6 timep densityju viscosity
SUBSCRIPTS
c coolingh heatingL liquid0 initialR retort
B all, C .O . 1 9 2 3 . D ete rm in in g b y m ethods o f ca lcu la tio n , the tim e necessary to process canned foods. N a tio n a l Research C oun cil B u lle t in 7 (3 7 ) : 9 .
B igelow , W .D ., B ohart, G .S ., R ichardson, A .C . and B all, C .O . 1 9 2 0 . H ea t p e n e tra tio n in processing canned foods. B u lle tin N o . 1 6 -L . Research L a b o ra to ry , N a tio n a l Canners Association, W ashington,D .C .
B oard , P .W . 1 9 5 6 . D e te rm in a tio n o f th e rm a l processes fo r canned foods. C ircu lar N o . 7-P. C o m m o n w e a lth S c ien tific & In d u s tria l Research O rgan ization , A ustralia .
Davis, A .H . 1 9 2 4 . Convective cooling o f w ires in streams o f viscous liqu ids. P h il. M ag. 47: 1 0 5 7 .
E c k lu n d , O .F . 1 9 4 9 . A pparatus fo r the m easurem ent o f the ra te o f heat pen etra tio n in canned foods. F o o d T ech n o l. 3 (7 ): 2 3 1 .
E ck lund , O .F . 1 9 5 6 . C orrec tion factors fo r heat p e n e tra tio n th e rm o couples. F o o d Techno l. 10: 43 .
Fagerson, I.S . and Esselen, W .B . J r. 1 9 5 0 . H ea t transfer in com m ercia l glass containers during th e rm a l processing. F o o d Techno l. 4: 4 1 1 .
F o rd , K .L . and Osborne, A .G . 1 9 2 7 . P ro tective tubes fo r th e rm o couples for de term in ing heat p e n e tra tio n in processed foods. In d . Eng. C hem . 1 9 (1 2 ): 1 3 4 5 .
Jackson, J .M . and Olsen, F .C .W . 1 9 3 9 . T h erm a l processing o f canned foods in t in containers. 4 . Studies o f th e m echanism o f heat transfer w ith in the conta iner. F o o d Research 5: 4 0 9 .
M ack ie , A .G . 1 9 6 5 . “ B oun dary V a lu e P rob lem s,” p . 9 1 . O liver and B o yd , E dinburgh.
Packer, G .J .K . 1 9 6 7 . The deve lopm ent o f a chem ical analogue o f th e rm a l destru ction o f bacteria l spores. P h .D . thesis, Massey U n ivers ity , N ew Zealand.
S tu m b o , C .R . 1 9 7 3 . “ T h erm o b acte rio lo g y in F o o d Processing.” A cadem ic Press, N e w Y o rk .
T a n i, S. 1 9 3 9 . N a tu ra l convection in can-shaped space. Jap. Soc. Sci. Fisheries B u ll. 3 (2 ): 7 6 ( in Japanese).
Ms received 9 /7 /7 3 ; revised 2 /2 2 /7 4 ; accepted 2 /2 7 /7 4 .

J. P. K. P E E L E R a n d O. S I T N A I
C h e m ica l E n g in e e rin g D iv ., C o m m o n w e a lth S c ie n t i f ic & In d u s tr ia l R esearch O r g a n iza tio n , C la y to n , V ic to r ia 3 1 6 8 , A u s tra lia
REVERSE OSMOSIS CONCENTRATION OF CARBOHYDRATE SOLUTIONS: PROCESS MODELLING AND COSTING
INTRODUCTIONE X T E N SIV E research program s were undertaken in th e late 1 9 6 0 ’s to develop industrial processes based o n reverse o sm osis (L acey and L oeb , 1 9 7 2 ) for the p rod u ction o f p otab le w ater from seaw ater and brackish w aters. The tech n ica l su ccess o f reverse osm o sis in th e field o f d esa lination attracted th e a tten tio n o f the fo o d processing ind ustry , w here th e p o ten tia l o f dew atering fo o d s tu ffs at low (a m b ien t) tem p eratures in relativ ely cheap sm all-scale equ ip m ent appeared advantageous w h en com pared w ith vacuum evaporation .
Reverse osm o sis can be considered for three m ain app licatio n s in th e fo o d processing industry: (a) c o n cen tra tio n , (b ) pu rifica tion and (c ) e fflu en t trea tm en t. Where the process is operated such that o n ly water is rem oved from th e feed stream th en th e process is sim ilar to con cen tra tio n b y evaporation ; how ever, if th e m em brane properties are such that som e o f th e sm aller m olecular w eight so lu tes are able to pass, th en partial p u rification m ay also be p o ssib le , e .g ., partial desalting. In the case o f e fflu en t treatm ent th e feed stream m ay be co n cen tra ted prior to further processing w hilst th e perm eate stream can either be recycled or d isposed o f w ith o u t further treatm ent. To date , m aterials such as m aple sap (U n d erw ood and W illits,1 9 6 9 ) , egg w h ite (L o w e et a l., 1 9 6 9 ) , raw sugar so lu tio n s (Sourirajan, 1 9 6 7 ) , fruit ju ices (M erson and M organ, 1 9 6 8 ) and w h ey (M arshall, 1 9 6 8 ; D u n k ley , 1 9 6 9 ) have been co n c en trated using laboratory scale, p ilo t plant and in som e cases sm all com m ercia l plant reverse o sm o sis eq u ip m en t.
It is necessary to m en tio n , how ever, that the tech n ica l feasib ility o f th is tech n iq u e o f dew atering has been proved , to date, m o stly on sm all capacity p lants. Som e m ajor problem s viz. chem ica l stab ility o f m em branes, cleaning procedures, and o p tim a l geo m etry o f the m em brane d u ct, m ust be in ten sive ly stu d ied and solved to enable large scale com m ercia l app licatio n .
Som e tim e ago a program w as in itia ted , in th is D ivision , to deal w ith problem s encountered in the d isposal o f large quantit ie s o f w h ey , and th e associated p o llu tio n , concerned w ith casein and Cheddar cheese m anufacture. R esu lts had sh ow n th e tech n ica l fea sib ility o f w h ey co n cen tra tio n using reverse osm o sis (S iem on and Sitnai, 1 9 7 2 ). H ow ever, e co n o m ic assessm ents o f the process w ere n ot available and it was therefore decid ed to undertake a param etric stu dy o f th e in flu en ce o f the m ajor processing variables on the cost o f dew atering d ilu te carbohydrate so lu tio n s. For the purpose o f th is stu d y , a d isaccharide (la cto se) w as se lected as a h y p o th e tica l substance for sim u la tion o f natural p rodu cts and b yp ro d u cts such as w h ey perm eate from u ltrafiltration plants, fruit ju ices, e tc .
Plants currently treating th ese and sim ilar m aterials usually have a sm all annual capacity w h ich is designed to co p e w ith th e seasonal variation in su pp ly o f th e m aterials being treated . F or exam ple, in V ictoria (A u stra lia ) the average annual prod u ctio n o f w h ey , o n a fa c to ry basis, is abou t 3 0 ,0 0 0 m 3 , w ith a m o n th ly peak p rod u ction to annual average o f ap p rox im ate ly 2 :1 . Such seasonal variation in w h ey p ro d u ctio n ten d s to m ake cap ita l in tensive processes u n eco n o m ic . As th e to ta l fixed capita l for reverse osm o sis can be ex p ected to be a p p rox im ately p ro p o rtio n a l to ca p a c ity , it th u s o ffers a relative cost advantage to sm all capacity plants.
T he processing capacity ch osen for th is eva lu ation is th erefore in th e range 3 0 - 4 5 , 0 0 0 m 3 per ann um , at a so lid s c o n te n t , considered as lacto se , o f ap p ro x im a te ly 5% b y w eight. B ecause o f th e season ab ility and relatively sm all ca p a c ity , a b a tch system o f op eration was ch o sen , as prelim inary ca lcu latio n s had sh o w n that a c o n tin u o u s sy stem o f o p era tio n could o n ly be ju stified at m uch greater capacities.
M odules based on tubular m em branes w ere ch o sen fo r th is stu d y , as in com parison to o ther ty p e s available th e y o ffer advantages w ith respect to in itia l co st, ease o f m em brane rep la cem en t, and sanitary cleaning o f th e m em brane and m o d u le surfaces.
All co sts w ere calcu lated relative to th e am ou n t o f perm eate rem oved from the original feed . T his procedure fo llo w s th e practice ad op ted in oth er ap p lica tion s o f reverse o sm o sis a lth o u g h in th is particular case, and other cases o f in terest to th e fo o d processing ind ustry , th e perm eate usually represents a w aste m aterial.
MATERIALS & METHODS
Modeliing of the reverse osmosis systemThe reverse osmosis design concept selected for this case study com
prises a single stage batch recirculating system. Referring to Figure 1, feed of concentration (c, ) and volume (Q, ) (initial values c0 and Q0 ) is pressurized and pumped at a rate (v) through the bank of modules. The concentrated reject stream is returned to the feed tank and the permeate of volume (Q2) at a flowrate (w) and concentration (c ,) is discharged into the permeate receiver.
Defining the overall permeate recovery (<p) as:
0 = Q2 /Qo = 1 - Q ,/Q 0 (1)
and assuming perfect mixing in the storage vessels, the bulk concentrations of the liquids in the feed (c, ) and the permeate (c2 ) tanks and concentration of the feed stream (Cy) are then related by
c, = Cv = (c0 — 0 c2 )/(l — 0 ) (2 )
During the processing the concentration of the material in the feed tank increases and operation is stopped when required concentration is achieved.
PRESSUREPUMP
Fig. 7— P rocess m o d e l o f b a tc h c o n c e n tr a t io n u s in g reverse o sm o s is .
7 4 4 —J O U R N A L O F F O O D S C I E N C E - V o l u m e 3 9 (1 9 7 4 )

R EV E R S E OSMOSIS C O N C E N T R A T IO N-745In the module bank the flowrate and bulk concentration of the
main stream changes along the direction of flow as a result of the permeate flow through the membrane. The relationship between the instantaneous concentration in the main stream (c) and the permeate recovery (a) at a given position along the length of the module is calculated from the differential material balance, Figure 2:
v(l — a)c = v(l — a — 8 a) [c + (dc/da)8 a]+ v c (1 — 7 )5 a (3)
where: (a) is the section permeate recovery based on the instantaneous feed rate at the module inlet and defined as:
a = w/v (4)
and (7 ) is the apparent solute rejection defined:
7 = (Cb - cp)/cb (5)
where (cb) is the bulk concentration of solute in the main stream and (Cp) is the corresponding permeate concentration. Whilst the overall permeate recovery depends on operating conditions and elapsed proc-essing time, the sectional permeate recovery depends, in addition, on the position along the flow path within the module.
After rearrangement of equation (3), this simplifies to the first order differential equation:
a) - y c (6 )
At a = 0, c = Cy thus:c ot
therefore:
11
>
C daJ U T - o )
0
C = Cy(l - a ) ' 7 (7)
The instantaneous permeate concentration (cp) can be expressed as a function of the sectional permeate recovery by combining equations(7) and (5) (when c = cb):
cp = cv (1 - 7)/(l - <*)7 (8)The mean permeate concentration is obtained by integration along
the module:
but: w = av, thus dw = vda, and therefore: a a
cw = /*cp d a l f d a (9)* , 0 J 0
which on substitution for cp, using equation (8 ) yields:/ a a
T f T ^ y y 1 ( d a (10)u J 0
o t e t * b o t
I“ " v ( 1 - o t - 6 e e ) ]
_____ _ c+ 3 ï t 6<X (
v 6 ocCp =(1-2r)c
Fig. 2 —D iffe r e n tia ! m a te r ia l b a la n c e o v e r an e le m e n ta l s e c t io n o f tu b u la r m e m b r a n e .
therefore:
cw = cv[l - ( 1 - a ) 1-7 ]/« (1 1 )
The specific rate per unit of membrane area at which the permeate is produced, so-called permeate flux (J), is proportional to the difference between the static pressures (AP) and osmotic pressures (Arr) across the membrane and is approximated by the simple relationship:
J = Kp (AP - K„\cb) (12)
where (K„) is the thermodynamic constant relating the osmotic pressure and bulk concentration of the solution and (Kp) is the permeability of the membrane. The driving force term in the above equation is a function of both concentration and hydrodynamic conditions. This implies that calculation of the pressure in the module must take into account the pressure drop along the modules including the effects of the volume reduction in main stream flow due to permeate removal and the increase in viscosity due to increase in concentration of liquid.
The calculation of batch concentration as a function of time proceeds in a stepwise manner. Constant pressure and fluid velocity and the concentration of the feed at the inlet to the module is assumed for each increment of the overall recovery, instantaneous and local values of pressure, velocity of main stream, concentrations and flux along the flow path are then calculated. The bulk concentration of permeate (c2) and concentration of permeate collected from the module (cw) is then related:
c2 = £ (Cy, w) 2 w (13)a a
This procedure is repeated until the final bulk concentration of the feed (c ,) is achieved.
The apparent solute rejection (7 ) is specific for a given membrane and solvent/solute species and in addition is dependent on hydro- dynamic conditions and the operational history of the membrane viz. operating pressure, temperature and cumulative operating time. However, for a certain range of operating conditions, namely pressure, temperature and pH, the rejection is fairly stable and experimental values using a small test module can be readily determined.
In contrast, the permeability (Kp) is much more sensitive to hydro- dynamic conditions, temperature and membrane history. Published literature is concerned mainly with the study of the dependence of flux on operating conditions in short time tests. Little information is available on the long term influence of temperature, pressure, pH and complex physical and chemical environment on membrane properties when concentrating carbohydrate solutions. Fortunately, such information is not technically difficult to achieve from a simple laboratory rig.
The mass transfer may be further complicated by impurities or bulk components, present in the feed, which have a tendency to form a separate film, and hence an additional resistance to solvent flux, at the membrane surface during the progress of concentration. This effect can be partially overcome by periodic cleaning of the membrane surface but care must be taken as severe chemical treatment and other conditions may cause irreversible reduction in performance. With respect to the uncertainties discussed above, an average value of the permeability during the life of the membrane has been used as a parameter for these calculations, assuming once daily cleaning and annual membrane replacement.
This approach to process design takes into consideration the dynamic behavior of the system arising from the effects of concentration polarization, fouling and other contraints on membrane performance. Thus an experimental value of the average life permeability inherently allows for these effects. Detailed calculation of the effects of concentration polarization for a typical case, using the relationship derived in the Appendix, shows that the overall flux is decreased by approximately 8 %. This effect is much less significant than the effects of fouling and irreversible loss of performance arising from structural changes in the membrane which our laboratory experiments have shown to be of the order 30-60% relative to the new membrane performance.
The hydrodynamic conditions for the main flow of liquid in the tubular module were selected to produce reasonable turbulent regime throughout the process, so ensuring satisfactory rates of mass transfer while maintaining acceptable pressure loss due to friction.
Dependence of the viscosity of solution (g ) on the concentration of

746-J O U R N A L O F FO O D S C IE N C E -V o lu m e 3 9 (1974)
carbohydrate (cb) was approximated by an empirical relation (Siemon and Sitnai, 1971):
M = l /( l - k c b/p) (14)
where the constant (k) has a value of 2.83 for viscosity in centipoise in the range of concentrations of carbohydrate (lactose) between 0-30% by weight.
Pressure drop in the liquid stream flowing in the tubes of the module was calculated from the Fanning equation (Perry, 1963).
dP/dx = (f/2) W / d (15)
where the Fanning friction factor (f/2) is for 10* < Nrc < 10s ,
f/2 = 0.032 NRe-° '” (16)
Allowance for alteration of the flow direction by 180° due to arrangement of the membranes in the module (length of tubes in a module is 2.5m with 18 tubes per module) was also included in the calculation of the overall pressure drop. This resistance is significant and represents about 50% of the overall pressure losses.Description of the cost model
Preparation of the cost model was carried out with regard to the equipment and technical requirements of the process. The basic design rate of 140m3 feed to be processed in 20 hr allows 4 hr for cleaning of membranes. A process load factor of 220 days per annum (approximately 60%) was also selected as being appropriate to food processing plants.
The plant was considered as installed adjacent to existing equipment and necessary services. All process equipment and piping in contact with the process streams are assumed to be of stainless steel construction in accordance with standards currently accepted by the food processing industry.
A tubular module was chosen having a cellulose acetate membrane whose average operating characteristics, based on criteria discussed above, may be described by an overall solute rejection of 0.98 and a permeability of 0.72 liter/(m2 bar hr). Each module comprises 18 tubes of length 2.5m and internal diameter 13 mm, giving a total membrane area of 1.7m2.
Allowance has been made for the provision of simple automatic control to protect the modules from over pressure and to protect the high pressure pump from .nterruption of flow. Process labor has been assumed at one operator per shift even though this allocation should be capable of handling a plant of several times larger capacity. It may, however, be possible to assume less than one operator per shift but this will depend on specific conditions of individual plants and the extent of their integration. Fixed capital dependent charges have been considered as comprising two main groups, viz. depreciation of plant and equipment and repairs and maintenance (both labor and materials), the values being 1 0 % and 2 % respectively of the total fixed capital per annum.
Some other relevant cost details are summarized below [basis Australian dollars, $A1 = $US 0.83 (1972)]:
Membrane replacement
Process labor
Fixed annual capital charges
$A 21.5 per m2 based on annual replacement
$A 3.75 per hr assuming an allowance for shift operation
1 2 % of total fixed capital comprising charges for depreciation and maintenance only.
The total fixed capital cost calculation was prepared for the basic capacity and a number of additional capacities so that the relationship between cost and plant capacity could be determined.
The process model was formulated so that variations in the main operating parameters were possible and interactions could be examined. The major operating parameters varied were: initial feed concentration, final product concentration, operating pressure, and the number of modules connected in series.
The cost model was run in conjunction with the process model and for each configuration, defined by the operating parameters, contributions to the total manufacturing cost were calculated and the cost of dewatering expressed as $A oer m3 of permeate removal.
A program listing and worked example has been published (Peeler and Sitnai, 1973).
RESULTS & DISCUSSION R esults o f m odelling
C onsideration o f the perm eate flu x eq u a tio n im plies th a t a decrease in the driving force term w ill reduce the perm eate flow rate correspon d ingly un til at zero driving force th e perm eate f lo w ceases. In the case o f batch o p eration , th is driving force, is reduced by tw o e ffec ts . F irstly , the net o sm o tic pressure term increases w ith increasing co n cen tra tio n in the bulk stream , and seco n d ly th e rise in co n cen tra tio n is accom p an ied by an increase in v isco sity o f the co n cen tra te and a corresp ond in g rise in pressure drop a long the m o d u le . This causes a progressively lo w er average operatin g pressure, and h en ce low er f lu x , over the len gth o f the m od u le during batch processing. C onsidering, for ex am p le, th e case o f a single m o d u le (see Fig. 3 ), there is a sm all pressure drop a long the m od u le increasing s lo w ly to a co n cen tra tio n o f a p p ro x im a te ly 20% solids. Further con cen tra tio n is accom p an ied b y a sharp in-
Fig. 3 —In flu e n c e o f c o n c e n tr a t io n o n th e m o d u le o u t l e t p re ssu re a n d th e o s m o tic p re ssu re fo r a range o f va lues o f s a l t r e je c tio n ( \ s).
Instantaneous permeate recovery, percent
Fig. 4 — V a ria tion in f lu x a n d c o n c e n tr a t io n d u r in g b a tc h c o n c e n tr a tio n ( th re e m o d u le s in series).

R EV E R S E OSMOSIS C O N C E N T R A T IO N -7 4 7
Fig. 5 —E f f e c t o f m o d u le c o n fig u r a tio n a n d o p e r a tin g p re ss u re o n th e c o s t o f c o n c e n tr a tin g f r o m 5% so lid s t o a f in a l c o n c e n tr a t io n o f 2 0% so lid s.
crease in v isco sity and a correspon d ing increase in pressure drop u n til th e driving force at th e m od u le o u tle t equals the net o sm o tic pressure. A t th is co n cen tra tio n th e driving force at the m odu le o u tle t is zero and co n tin u ed op era tio n o f the process w ou ld n o t m ake fu ll use o f th e to ta l in sta lled m em brane area. Sim ilar behavior is in d ica ted in th e curves representing three m odu les and five m o d u les in series, op eratin g at the sam e in let pressure. H ow ever, the larger pressure drop due to th e additional m o d u les in series red uces th e o u tle t pressure at the last m odu le and the perm eate f lo w ceases at lo w er con cen tra tion s. H ence, for any in let pressure and particular num ber o f m o d u les in series there is a lim itin g c o n cen tra tio n w h ich the process m ay approach.
T he relation sh ip b e tw e en in sta n ta n eo u s perm eate recovery and instan taneous average f lu x for three values o f in let pressure, Figure 4 , in d ica tes th a t sharp red u ction s in flu x o ccu r at recoveries correspon d ing to th e sharp increase in con cen tra tio n and v isco sity .
The operation a l lim ita tio n s d iscussed above con cern the case o f a tw o -c o m p o n en t system ; h ow ever, fo r add ition al c o m p o n en ts in th e feed th e lim it to co n cen tra tio n can be severely red uced . For ex a m p le , th e presence o f lo w m o lecu lar w eight inorganic salts in th e feed m aterial m ay increase the o sm o tic pressure during processing and th u s lo w er th e n et
driving force w ith a c o n seq u en t red u ctio n in f lu x . T he e x te n t to w h ich an inorganic salt increases th e o sm o tic pressure w ill dep en d on its in itial m olar co n cen tra tio n and rejection o f the m em brane for th is so lu te . R eference to F igure 3 , w here o sm o tic pressure curves have b een drawn fo r th e con cen tra tio n o f a so lu tio n co n sistin g in itia lly o f 5% la cto se and 0.5% so d ium ch loride (b y w e ig h t), using a m em brane having a lactose rejection o f 0 .S 8 and salt rejections o f 0 , 0 .5 and 0 .8 respectiv e ly , sh ow s that the rejection o f salt lim its th e final co n cen tration o f carb ohydrate to a greater e x te n t at lo w er operating pressures and a sm aller num ber o f m o d u les in series.
For each p rodu ct req u irem en t there w ill be a ch o ice o f design alternatives, th e m ain tw o being th e m o d u le configuratio n and the sy stem in let pressure. U ltim ate se lec tio n o f the co n figu ration has been m ade b y con sid era tio n o f th e m anufacturing co sts for dew atering. T he relative m anufacturing co sts (see Fig. 5 ) decrease w ith a larger num ber o f m o d u les in series. H ow ever, th e advantages to be gained by using a greater num ber o f m od u les in series, i .e ., m ore fu lly u tiliz in g the pum p energy b y a ccep tin g a lo w e r average driving force , tends to b e o ffse t above three m o d u les in series by th e co st o f the add ition al m em brane area due to lo w er average f lu x , and it w o u ld appear that three m od u les in series cou ld be considered adequate.
H ence, th e plant design co n cep t ch o sen in th is stu d y c o n sists o f a num ber o f parallel un its , com prisin g three m odu les in series, operated b atch w ise at a co n sta n t daily feed rate. F or a range o f operating pressures, 3 4 .5 , 4 8 .3 and 62 .1 bar respective ly , and in itia l d issacharide co n cen tra tio n s , 1 .0 , 2 .5 , 5 .0 , 7 .5 and 1 0 .0% b y w eigh t, th e co st o f dew atering w as calcu lated and presented as a fu n ctio n o f perm eate recovery in Figures 6 A, 6B and 6C. On the basis o f a c o n sta n t da ily feed v o lu m e, an increase in the final perm eate recovery represents an in crease in p lant capacity w ith respect to perm eate produ ction . T herefore, as the req u irem en t on perm eate recovery and h en ce final co n cen tra tio n o f th e prod u ct is increased , th e dew atering co sts fall rapidly. H ow ever, as th e req u irem en t for final co n cen tra tion approaches the range w here th e rapid increase in pressure drop and o sm o tic pressure occu rs, th e sharp d ec lin e in perm eate f lu x n ecessita tes a m uch greater to ta l m em brane area, w ith the n et result that th e co st o f perm eate rem oval begins to increase.
T he d ep en d en ce o f th e co st o f dew atering on th e e x ten t o f perm eate recovery is in th is case due to d ifferen t operating co n d itio n s . F or co n sta n t perm eate recovery , but d ifferen t capacities th e perm eate rem oval co sts are d ep en d en t on capac-
Fig. 6 — V a ria tion in c o s t o f p e r m e a te re m o v a l w ith p e r m e a te re c o v e r y fo r a range o f in it ia l c o n c e n tr a t io n s a t a n o p e r a tin g p re ssu re o f 3 4 .5 bar (A ) , 4 8 .3 b a r (B ) a n d 6 2 .1 b a r (C ) w ith th r e e m o d u le s in se r ie s (w h e re c a a n d c a re th e in it ia l a n d f in a l c o n c e n tr a t io n s in p e r c e n t so lids).

748-J O U R N A L OF FO O D S C 'E N C E -V o lu m e 3 9 (1974)
Fig. 7 —E f f e c t o f in s ta lle d c a p a c i ty o n th e c o n tr ib u t io n o f va rio u s c o s t g ro u p s fo r c o n c e n tra tin g fr o m 5% to 20% so lid s . (C o m p o n e n t: ( ! ) M e m b ra n e r e p la c e m e n t; (2 ) F ix e d ca p ita l d e p e n d e n ts ; (3 ) u ti l i t ie s a n d ch e m ic a ls ; (4) L a b o r ch a rg es; a n d (51 T o ta l p e r m e a te re m o v a l co s t. B asic in s ta lle d c a p a c ity 1 4 0 m 3 fe e d p e r d a y , o p e r a tin g a t 4 8 .1 b a r w ith th r e e m o d u le s in series .)
Fig. 8 —R e la tiv e p e r m e a te re m o v a l c o s t fo r a p e r m e a b i l i ty c f d o u b le th e b a sic va lue. In itia l c o n c e n tr a t io n o f 5% so lid s w ith th re e m o d u le s in series.
ity (see Fig. 7 ) w hen th e co st o f labor is a m ajor portion o f the to ta l co st. In th e low er range o f w ater rem oval capacities for the p lants co n cern ed , even w ith a m in im um labor req uirem ent, the c o st o f d ew aterin g is labor d ep en d en t. This exp la in s w h y th e m anufacturing co sts on F igures 6A, 6 B and 6C ex p erien ce steeper m inim a than w ou ld be th e case at h igher design capacities. T he co st o f dew atering by reverse osm osis is q u ite favorable w hen com pared w ith vacu u m evaporation w h ich is at a d is t in c t disadvantage at th e relatively lo w cap acity , 14 0 m /d a y , considered here. In v iew o f this fact it w ou ld be reasonable to dew ater to ap p rox im ate ly 20% so lids at the ind iv idu al fa c to r ies and th en transport the precon centrate to a central p lan t w here further co n cen tra tio n can be ach ieved by vacuum evaporation .
It has been assum ed that th e value o f p erm eab ility is c o n stan t over th e range o f pressures consid ered . Thus th e general resu lt—the higher th e operatin g pressure th e lo w er th e c o s t o f dew atering. The m axim um pressure is lim ited b y th e irreversib le co m p ression o f e ith er th e m em brane or seco n d a ry film o f im purities d ep o s ited on the m em brane. T he value o f perm eab ility used , 0 .7 2 lite r /(m 2 bar hr), represents a conservative value achieved b y current com m ercia l m em branes. It is d ifficu lt to forecast th e e x ten t to w h ich m em branes can be im proved w ith o u t large increase in th e ir co st, b u t it w o u ld seem that a tw o fo ld increase in p erm eab ility w o u ld be an o p tim istic value. F or m any ap p lica tion s th e lim itin g factors are n o t perm eab ility or se lec tiv ity o f th e m em b ran e, b u t se c o n d ary e ffe c ts su ch as fou lin g , p o lar iza tion , d iff icu ltie s in c lean ing and chem ica l sta b ility o f th e m em brane. By d o u b lin g th e p erm eab ility the perm eate rem oval co sts are reduced by1 4 —18% in th e region o f m in im um co st (F ig . 8 ). A s th is red uctio n in co st w ou ld be o ffse t by an increase in m em brane co st o f ap p ro x im a te ly 300% , further sco p e ex ists in th e fie ld o f m em brane d ev e lo p m en t. T he in flec tio n s o f th e curves in F igure 8 are in th e region o f m in im um perm eate rem oval co sts (see F ig. 6 A, B and C) for lo w er perm eab ility m em branes. Increasing the p erm eab ility co n sta n t w ill sh ift th e m in im a to the area o f higher perm eate co n cen tra tio n s . .A lternatively, it m ay be m ore advantageous to use a m em b ran e w ith a reasonable perm eab ility at high pressure op era tio n than a m em brane w ith high er perm eab ility bu t restricted to lo w er pressures. F or ex am p le, th e m anufacturing co sts o f d ew aterin g b y a m em brane having tw ice the basic perm eab ility and op eratin g at 35 bar fo r the designed perm eate rem oval o f 70% and original feed co n cen tra tio n o f 5%, is still 1 0 c /m 3 h igher than d ew atering b y a m em brane w ith the basic p erm eab ility b u t op eratin g at a pressure o f 62 bar.
CONCLUSIONSTHE D A T A d evelop ed through m ath em atica l m o d e llin g and presented in th is paper ind ica te that com m ercia l-sca le dew atering o f carb ohydrate so lu tio n s by batch reverse o sm o sis should prove to be eco n o m ica lly a ttractive. T he lim itin g con cen tra tion to w h ich the process m ay approach is co n tro lled by in creases in b o th o sm o tic pressure and v isco sity o f the so lu tio n during processing. Increasing th e num ber o f m o d u les operating in series red uces th is lim it bu t im proves th e u tiliz a tio n o f pum ping energy. Over a w ide range o f op eratin g co n d itio n s considered it appears that the m axim um co n cen tra tio n that can be ach ieved is a p p rox im ate ly 25% so lids, correspon d ing to the sharp increase in v isco sity and the c o n seq u en t rapid in crease in fr ic tion a l pressure drop along th e f lo w p a th in th e m odu les. C osts o f dew atering, for capacities less than 2 0 0 m 3 o f perm eate per day, are capacity d ep en d en t m ain ly b ecause o f th e c o n tr ib u tio n o f labor charges. As th e req u irem en t for w ater rem oval is increased , m anufacturing co sts fall rapidly to a m in im um at final co n cen tra tio n s in the region 15% to 20% so lids depend ing o n the operating pressure and th e in itia l c o n cen tra tion . T he co sts seem co m p etitiv e w h en com p ared , at the sam e ca p acity , to vacuum evaporation as currently practiced in the fo o d processing ind ustry . T he relation sh ip s b e tw e en operating pressure, f lu x and c o s t o f m em branes m ust be carefu lly exam in ed in lo n g term ex p erim en ts to enable o p tim a l design o f a com m ercia l p lan t. The resu lts ind ica te that small im provem ents in m em brane perform ance can lead to large savings in energy con su m p tio n . T hus sco p e ex ists for the d ev e lo p m en t o f im proved m em branes even th ou gh th ey m ay b e m ore e x p e n sive.
SYMBOLSVariables and constantsc concentration (mass/volume)d tube diameter

R E V E R S E OSMOSIS C O N C E N TR A T !O N-749D coefficient diffusionF convective fluxf friction factor [equations (16) and (A. 11) ]J permeate flux [equation (12)]jp mass transfer factorKp permeability constantK n thermodynamic constant relating osmotic pressure and bulk
concentration of solutionk constant [in equation (14)]k(j mass transfer coefficient [equations (A.10) and (A.12)]Ngc Schmidt number = ju/pDNRe Reynolds number = dup/pP pressureQ volumer radiusu linear velocityv feed flowratew permeate flowratex axial distance along the tubular membraney radial distance from the membrane surfacea section permeate recovery [equation (4)]7 apparent solute rejection [equation (5)]6 thickness of the laminar layer5e thickness of the boundary laminar layer in turbulent flow A differenceX true solute rejection [equation (A.4)]M coefficient of viscosity7r osmotic pressurep density(p permeate recovery [equation (1)]
Subscriptsb bulki componentp permeate, instantaneous values at membrane surfacev feedw permeate, average value from the module0 input1 feed2 permeate, integral value
APPENDIXDERIVATION of the working equation for calculating the concentration polarization effect on the performance of reverse osmosis.
Several authors have discussed the concentration polarization problem in reverse osmosis (Merten, 1963; Sherwood et al., 1965; Brian,1965), and suggested solutions for both turbulent and laminar flows.
For turbulent flow in tubular membranes it is assumed that the bulk solution, flowing parallel to the membrane surface, is totally mixed in the main stream, and the velocity and the concentration gradients exist only in the laminar boundary layer, as is postulated in the Nernst film model (see Fig. 9). This simplification enables the solute balance and concentration relations to be expressed in terms of simple empirical functions.
The material balance for key component (i), selectively rejected by the membrane then becomes:
Fig. 9 —F lu x b a la n ce o v e r th e m e m b r a n e a n d la m in a r b o u n d a r y layer.
that is, the convective flux F; is equal to the sum of the permeate solute flux J; and the diffusive flux Nj.
Alternatively in terms of concentrations and overall fluxes:
Fq - Jcj j. — D - (A.2)
where (D) is the molecular diffusion coefficient of the species (i) in water. Relative to the permeate flux, the magnitude of the diffusive flux is insignificant and approximately:
F = J (A.3)
For a two-component system the true rejection (X), based on the concentration at the membrane surface (cs) is defined
X = (cs - cp)/cs (A.4)
thus
cp = cs(l - X) (A.5)
Combining equations (A.2), (A.3) and (A.5) and integrating across the laminar film of thickness 6 :
6 cb
J/ dy = ° / dc/[Cs(1 - - CJ (A.6)becomes 0 cs
cs/cb = 1 - X[1 - exp(-J5/D)] (A.7)
For turbulent flow in agreement with the film theory, replacing the laminar film of thickness (S) by a hypothetical thickness of a laminar film in the turbulent region ( 6 e), the ratio (5 e/D) then represents the mass transfer coefficient (kq). After substitution and rearrangement, the concentration ratio becomes:
cs/cb = exp(J/k0)/[X + (1 - X)exp(J/k0)] (A.8 )
For the particular case when:
X 1 or Cp ->■ 0
equation (A.8) simplifies to:
cs/cb = exp(J/k0) (A. 9)
For turbulent flow in tubes (Bennett and Meyers, 1962)
ko=iDUbNsc ‘2/3 =(f/2)ubNSc‘2/3F¡ - J¡ + N¡ (A.l) (A. 10)

7 5 0 -J O U R N A L O F FOOD S C IE N C E -V o /u m e 3 9 (1974)
and substitution for (f/2) from the Blasius equation
f/2 = 0.04 NR e ' I/4 (A .ll)
into equation (A. 10) yields:
ko = 0.04ubNSc-2/3 NReJ/‘ (A. 12)
And finally, substitution of equation (A. 12) into (A.9) gives the following relationship between hydrodynamic conditions and concentration polarization:
cs/cb = exp[25(J/ub) NS c 2 / 3 NRe'/4] (A. 13)
R E F E R E N C E S
B en nett, C .O . and M eyers, J .E . 1 9 6 2 . “ M o m e n tu m H e a t and M ¿s T ran s fer.” M c G ra w -H ill B ook Co.
Brian, P .L .T . 1 9 6 5 . In fluence o f concentra tion po larisa tion on rev r s e osmosis system design. Proc. F irs t In te rn . S ym p . on W ate r Desa ^natio n , S W D 1 7 9 , 1— 2 1, W ashington, D .C .
D u n k le y , W . 1 9 6 9 . C oncen tration and frac tio n a tin g w h ey . U .S . D ep t. Agr. R e p o rt A S R 7 4 /5 1 , 1 9 —28.
Lacey , R .E . and L o eb , S. 1 9 7 2 . “ In d u s tria l Processing w ith M em branes.” W iley-Interscience.
L o w e , E ., D urkee , E .L ., M erson , R .L . , I j ic h i, K . and C im in o , S .L . 1 9 6 9 . Egg w h ite concentrated b y reverse osmosis. F o o d Techno l. 2 3 : 45.
M arshall, P .G . 1 9 6 8 . F ra c tio n a tio n and c oncen tra tion o f w hey by re verse osmosis. Fo od Techno l. 22: 37 .
M erson, R .L . and M organ, A .I . 1 9 6 8 . Juice co n cen tra tio n b y reverse osmosis. F o o d Techno l. 22: 9 7 .
M e rte n , U . 1 9 6 3 . F lo w relationships in reverse osmosis. I . & E .C . F u n d . 2: 229 .
Peeler, J .P .K . and S itn ai, O . 197,3- Reverse osmosis c o n cen tra tio n o f carbohydrate solutions: Process m odelling and costing. C .S .I .R .O . R ep o rt C E /R 3 8 .
P erry , J .H . 1 9 6 3 . “ C hem ical E ng ineer’s H a n d b o o k .” M c G ra w -H ill B ook C o., In c .
Sherw ood, T .K . , B rian, P .L .T ., F isher, R .E . and D resn er, L . 1 9 6 5 . S a lt concen tra tion a t phase boundaries in desalination b y reverse osmosis. I . & E .C . F u n d . 4: 113 .
S iem on, J .R . and S itn a i, O. 1 9 7 1 . Studies on u ltra fil tra tio n o f w h ey . C .S .I .R .O . In te rn a l rep o rt.
S iem on, J .R . and S itn ai, O . 1 9 7 2 . The ap p lica tio n o f reverse osmosis to w h ey processing. C .S .I .R .O . R ep o rt C E /M 2 9 .
S ourira jan, S. 1 9 6 7 . Reverse osmosis separation and co n cen tra tio n of sucrose in aqueous solutions using cellulose acetate m em branes. I . &E .C . Proc. Des. Dev. 6: 1 54 .
S ourira jan , S. 1 9 7 0 . “ Reverse Osmosis,” p . 5 67 . Logos Press, L o n d o n .U n d e rw o o d , J .C . and W illits , C .O . 1 9 6 9 . O p era tion o f a reverse osmosis
p lan t fo r the p a rtia l concentra tion o f m aple sap. F o o d Techno l. 23: 79.
Ms received 1 1 /1 5 /7 3 ; revised 2 /1 1 /7 4 ; accepted 2 /1 8 /7 4 ._______________The authors th an k J .R . S iem on o f the D iv . o f C hem ical Eng ineering,
C .S .I.R .O . fo r supplying some o f the exp erim enta l data on perfo rm ancecharacteristics o f reverse osmosis m em branes, and fo r s tim u la tin g discussions on mass transfer problem s.

J. R. G IA C IN , J. J A K U B O W S K I, J. G. L E E D E R , S . G. G I L B E R T a n d D. H. K L E Y N
F o o d S c ie n c e D e p t., R u tg e r s — T h e S ta te U n iv e r s ity , N e w B r u n s w ic k , N J 0 8 9 0 3
CHARACTERIZATION OF LACTASE IMMOBILIZED ON COLLAGEN: CONVERSION OF WHEY LACTOSE
BY SOLUBLE AND IMMOBILIZED LACTASE
INTRODUCTIONALTH O U G H w h ey so lid s are a high ly nu tritious source o f p ro te in and lactose (Cerbulis et al., 1 9 7 2 ) , th e co n cep t o f using w h ey so lid s in fo o d prod u cts has m et w ith lim ited su ccess. R ecent d ev e lo p m ents in th e u tiliza tio n o f w h ey in fo o d products, as w ell as an e co n o m ic analysis o f w h ey u tiliza tio n , have b een rep orted in the Proceedings o f the W hey Products C onference (C h icago, 111., 1 9 7 2 ).
A p oten tia l so lu tio n to th e w h ey u tiliza tion problem is th e h y d ro ly sis o f lacto se to its m ore so lu b le h e x o se s . A nu m ber o f studies have b een reported for the h yd ro lysis o f la cto se by so lu b le lactase (K osik ow sk i and W ierzbicki, 1 9 7 1 , 19 7 3 ; K osikow sk i et a l., 1 9 7 2 ; W endorff et al., 19 7 1 ; W ierzbicki and K osik ow sk i, 1 9 7 3 ) and by bou n d m icrobia l (¡-galactosidases (D ahlqvist et al., 1 9 7 3 ; E skam ani, 1972; W ierzbicki et al., 1 9 7 3 a , b; W oychik and W ond olow sk i, 1 9 7 2 , 1 9 7 3 ; and O lson and Stan ley , 1 9 7 3 ). D ue to recent advances in im m ob ilized en zy m e research, b o th th e academ ic and industria l co m m u n ities have expressed considerab le in terest in th e tech n o lo g ica l p o ten tia l o f im m o b ilized enzym es.
T he a p p lica tion o f an im m o b ilized en zym e for th e h y d ro ly sis o f la cto se in various m ilk p rodu cts has b een th e subject o f several recen t pu b lica tion s. W oych ik and W ond olow sk i (1 9 7 3 ) reported the h y d ro lysis o f acid w h ey by a fungal lactase bou nd to glass beads. O kos and Harper(1 9 7 3 ) reported on th e ac tiv ity o f glass bou nd lactase in acid w h ey . W ierzbicki et al. (1 9 7 3 a , b ) have also described th e h yd ro lysis o f acid w h ey b y glass bound lactase. O lson and S tan ley (1 9 7 3 ) reported o n th e h y d ro ly sis o f reco n stitu ted nonfat dry m ilk b y lactase bou n d to a ph en o l-form ald eh yd e resin . D ahlqvist et al. (1 9 7 3 ) evaluated the h y d ro ly sis o f sk im m ilk b y a p o lym er entrapped lactase .
B ecause o f its h igh heat stab ility and pH o p tim u m (pH 4 .0 ) , a fungal |3-galac- to sid ase w as se lec ted for stu d ies o n th e h y d ro ly sis o f acid w h ey . T he present paper describes th e im m o b iliza tio n o f lactase (A sperg il lus n ig er ) to co llagen and the u tiliza tio n o f th e co llagen-bou nd lactase for h y d ro ly sis o f lacto se in acid w hey.
EXPERIMENTAL
ReagentsA sample of the (3-galactosidase 0f A . n ig e r
(Lactase LP) donated by the Wallerstein Co., Morton Grove, 111., was used without further purification. The enzyme was bound to hide collagen which was obtained from the U.S. Dept, of Agriculture, Eastern Regional Research Center.
Analytical grade reagents and distilled water were used throughout this work. Other materials were: a-D-glucose and lactose, Fisher Scientific Co.; Glucostat Special, Worthington Biochemical Corp. All other chemicals, were from Fisher Scientific Co.
All lactose solutions (w/v) were prepared by dissolution of lactose in 0.1M sodium acetate buffer, pH 4.0.
Whey was obtained from the cottage cheese processing plant of the Lehigh Valley Dairy, Allentown, Pa. The whey was deproteinized by ultrafiltration, using an Amicon, model No. 402, ultrafiltration apparatus. A PM-10 membrane (cut off limit, 1 0 , 0 0 0 molecular weight) was employed. The lactose content of the deproteinized whey was 4.68% as determined by the Phenol Sulfuric Acid Method (Joslyn,1970). The pH of the whey was 4.3.Analytical
Soluble and bound lactase activity was determined in 5% lactose (w/v) and ultrafiltered acid whey as substrate.
Soluble lactase activity was determined by pipetting a 1 . 0 ml aliquot of enzyme solution (5 mg/ml, in 0.1M sodium acetate buffer, pH4.0) into 200 ml of substrate maintained at 37°C, and removing 0.5 ml aliquots for assay at different time intervals. The reaction was stopped by heating the aliquots at 100°C for2 -3 minutes, after which they were analyzed for glucose. Glucose concentration was determined by the glucose oxidase-chromagen procedure supplied by Worthington as Glucostat Special. A unit of activity was defined as pmole of glucose produced/min/mg of enzyme. A calibration curve was constructed from glucose solutions of known concentration.
Collagen-bound lactase activity was assessed by utilizing the complex in a convenient spiral reactor configuration (Vieth et al., 1972b; Eskamani et al., 1973) as a batch recycle reactor. Prior to hydrolysis of lactose in whey, the reactor was stabilized to steady limit activity. The substrate reservoir, containing 200 ml of substrate solution, was maintained at 37°C. The biocatalytic reactor was immersed in a 37°C constant temperature bath and the substrate was recirculated through the reactor for 15 min, at a rate of 2 0 0 ml/min by a peristaltic pump. The change in glucose concentration of the reservoir was followed by removing 0.5 ml
aliquots for assay at different time intervals. Glucose concentration was determined by the glucose oxidase method. A unit of activity was defined as ¡umole of glucose produced/min/g of complex.
For both the soluble and bound enzyme, initial rates were calculated from a minimum of six samples taken at different times, within the first 15 min of reaction.
Analysis for bound enzyme was based on the tryptophan content of the complex. A modification of the method of Gaitonde and Dovey (1970) was employed (Eskamani et al.,1974).
The stability of the free enzyme was determined by evaluating the catalytic potency of the soluble enzyme as a function of storage time. The enzyme was dissolved in 0.1M sodium acetate buffer (1.0 mg/ml) of pH 4.0, and 5 ml aliquots were transferred to 5 ml volumetric flasks. The solutions were stored at 0°C and the enzymatic activity of the soluble enzyme was determined as a function of storage time. The activity was evaluated in a pure lactose solution (5%) by the standard conditions described in the experimental section.
Immobilization procedureCollagen-lactase complexes were prepared
by two procedures, the interdiffusional penetration process (Vieth et al., 1972a; Eskamani,1972) and the macromolecular complexing process (Vieth et al., 1973).
Interdiffusional penetration. In this method, a collagen membrane was first formed, and it was then impregnated with the enzyme. Collagen dispersion was prepared from hide collagen according to the method outlined in U.S. Patent No. 2,920,000 (Hockstadt et al., 1960). The dispersion contained 1.0% solids (w/w) at pH 3.5. Hydrochloric acid (4N) was used to adjust the pH.
The collagen dispersion (400 ml) was cast on a Mylar® support to form the membrane. The formation of an even surface of the membrane was accomplished by using a Gardner knife, pulled by a motor at uniform speed. The cast film was dried at room temperature for 48 hr. The film thickness was 3.8 mil, measured with a Testing Machines, Inc. Model 549 micrometer.
A known amount of film (3.87 89g) was impregnated by incubating it in enzyme solution at 0°C for 90 hr. A 50 ml solution containing 20 mg/ml Lactase LP, in 0.1M sodium acetate buffer, pH 4.0 was employed as the impregnation bath. At the end of the incubation period, the film was washed with 1 0 liters of water, layered on Mylar® and dried at room temperature for 24 hr.
Macromolecular complexing. In this method, enzyme is added directly to the collagen dispersion, and a collagen membrane formed.
V o lu m e 3 9 ( 1 9 7 4 ) - J O U R N A L O F F O O D S C I E N C E - 7 5

7 5 2 -J O U R N A L O F FO O D S C IE N C E -V o lu m e 3 9 (1 9 7 4 )
Table 1—Evaluation of (3-galactosidase activity in acid whey(A. niger)
Enzyme state Substrate% Relative
activity % Inhibition
Soluble3 5% lactose 100.0 —acid whey 44.4 55.6ultrafiltered acid whey 43 .8 56.2deionized acid whey 68.9 32 .0
Boundb,c 5% lactose 100.0 —acid whey 59.0 41 .0ultrafiltered acid whey 69.7 30.3
Assay Conditions:
a 37 °C , pH = 4 .5 , 200 ml substrateb 37°C , pH = 4 .5 , 200 ml substrate, recycle at 200 m l/m in. c Module II — Prepared by Interdiffusional Penetration.
Collagen dispersion was prepared from hide collagen. The dispersion contained 1.0% collagen solids (w/w) in water, pH 3.5. lg o f Lactase LP was added to 400 ml of the hide collagen dispersion. The mixture was well dispersed and was cast on a Mylar® support to form a membrane. The cast film was dried at room temperature for 48 hr. The membrane was peeled from the Mylar, washed with 10 liters o f water and dried at room temperature. The membrane thickness was 3.8 mil.
Reactor construction. Membranous collagen-lactase complexes were used to construct biocatalytic reactors in a spiral reactor configuration (Vieth et al., 1972b; Eskamani et al., 1973a). 3.4g of a 3.8 mil thick collagen-lactase complex membrane, with an overall surface area of 1123 cm2 was layered on a 1.16 mil thick cellulose acetate backing film. A solid glass rod 10 cm long, 15 mm outside diameter was used as a central core element. Two Vex- ar® sheets, 96 cm X 9 cm having a thickness of24.5 mil were used as spacing elements. The collagen lactase membrane was layered on the Vexar® sheets, and coiled about the central core element to construct a cartridge with an outside diameter of 5.0 cm. The cartridge was fitted into an outer plastic shell, 5 .0 cm o.d. x3.7 cm i.d. x 11.4 cm.
R E S U L T S
L ac ta seT he sp ec ific a c tiv ity o f th e so lu b le en
zy m e in 5% lacto se w as 4 .5 lim o le o f g lu cose p ro d u ced /m in /m g o f e n zy m e, under th e standard co n d itio n s described in the exp erim en ta l sec tio n .
T he L actase LP co n ta in ed 0.46% try p to p h a n . W hen lactase was bou n d to co llagen b y th e in terd iffu sio n a l penetratio n procedure, 6 4 m g o f en zy m e was b o u n d /g o f c o m p lex . Im m ob iliza tion by th e m acrom olecu lar com p lex in g p rocedure a fford ed 8 9 .3 m g o f en zy m e bound- /g co m p lex .
T hese values represent th e in itia l b in ding capacity o f th e co llagen c o m p lex and n o t th e load ing factor at stea d y state activ ity .
S ta b ili ty a n d re u sa b ili ty
T he e ffec tiv en ess o f im m ob ilized enzy m es is prim arily determ in ed b y their ab ility to retain en zy m a tic ac tiv ity over prolonged usage. The reu sab ility o f a c o llagen-lactase c o m p lex prepared b y th e m a c r o m o le c u la r com p lex in g process (M odule I) is sh ow n in Figure 1. The a ctiv ity o f th e im m o b ilized e n zy m e is p lo tted as a fu n ctio n o f rep eat co n ta cts (runs) in th is figure. T he co m p lex was w ashed w ith 2 liters o f w ater b e tw een su bseq uent runs. W hen n ot in o p eration , th e reactor was drained o f residual water and stored at 4°C . Under th ese storage co n d itio n s , th e m em brane is to ta lly satu rated w ith water.
As sh o w n in F igure 1, th e b io ca ta ly tic reactor atta ined stead y lim it ac tiv ity after five runs. F o llow in g the in itia l decrease in activ ity , stab le lim it a c tiv ity w as m ainta ined over a num ber o f reactor vo lum e rep lacem ents. T he to ta l v o lu m e o f substrate and wash w ater passed th rou gh the reactor during th ese 14 c o n ta c ts was
a p p rox im ate ly 65 liters. The stab le lim it a ctiv ity for M odule I w as 1 3 .0 ¿¿mole o f g lu cose p r o d u ced /m in /g co m p lex . The activ ity at stead y sta te was equ iva len t to abou t 30% o f th e in itia l ac tiv ity .
The reu sab ility o f a b io ca ta ly tic reactor c nstru cted from a co llagen-lactase m em brane prepared b y th e in terd iffu sio n al p en etra tion process (M odule II) is sh o w n in F igure 2. T he stab le lim it a c tiv ity for M odule II w as 1 1 .2 M mole o f g lu cose p ro d u ced /m in /g co m p lex , w h ich was a p p rox im ate ly 24% o f th e in itia l a c tiv ity .
The ca ta ly tic p o te n c y o f a co llagen- lactase m em brane, stored over a per iod o f 90 days did n o t change sig n ifica n tly (1 3 .3 vs. 1 2 .4 /rm ole o f g lu cose p ro d u ced /m in /g c o m p lex ). T he reactor was drained o f residual w ater and stored at 4 °C , w h en not in o p eration . A m ore stringent m easure o f th e e ffec tiv en ess o f an im m o b ilized en zym e is to test its sta b ility under co n d itio n s o f actual u se. T he stab ility o f a b io ca ta ly tic reactor over a period o f 29 days is sh o w n in Figure 3 , during w h ich th e
Fig. 1- R e u s a b i l i t y o f a b io c a ta ly t ic re a c to r fa b - Fig. 2 - R e u s a b i l i t y o f b io c a ta ly t ic re a c to r fab- Fig. 3 - S t a b i l i t y o f b io c a ta ly t ic m o d u le ,r ic a te d fr o m c o lla g en -la c ta se c o m p le x p re p a re d r ic a te d fr o m co lla g en -la c ta se c o m p le x p re p a re d b y th e m a c r o m o le c u la r c o m p le x in g p ro cess . b y th e in te r -d i f fu s io n a l p e n e tr a t io n p ro cess .

L A C T O S E H Y D R O L Y S I S B Y B O U N D L A C T A S E - 7 5 3
activ ity was determ ined at fix ed intervals o f t im e . F o llo w in g th e in itia l decrease in a c tiv ity , a 30% lo ss in relative a c tiv ity was exp erien ced .
E valuation o f th e storage sta b ility o f th e so lu b le en zy m e sh ow ed a 98% lo ss in relative a c tiv ity after 3 days o f storage at 4°C . T hese resu lts d em o n stra te th e go o d reu sab ility and sta b ility characteristics o f co llagen-lactase co m p lex es .
A ctiv ity o n w h eyT he a c tiv ity o f th e fun gal lactase in
th e so lu b le and b o u n d sta te w as determ ined w ith u ltrafiltered (U F ) acid w h ey as substrate. The resu lts o f th is stu d y are tabu lated in T able 1.
As sh ow n in T able 1, th e ca ta ly tic p o ten cy o f th e lactase was in h ib ited in U F acid w h ey , as com pared to aqu eou s la ctose . T he a ctiv ity o f th e free en zy m es in U F acid w h ey was 2 .2 6 pim ole o f g lu co se p ro d u ced /m in /m g e n zy m e. The sp ecific a c tiv ity o f th e free en zy m e in U F acid w h ey correspon ds to an a c tiv ity o f about 45% o f th e a c tiv ity in lacto se .
The a c tiv ity o f a bou nd lactase in U F acid w h ey was 6.0 pim ole o f g lu co se pro- d u ced /m in /g co m p lex , w h ich correspon ds to an a ctiv ity o f a p p ro x im a te ly 70% o f th e activ ity in la cto se . T he ca ta ly tic p o te n c y o f co llagen-bou nd e n zy m e in nonultra- filtered acid w h ey w as a lso determ ined and corresponded to a b ou t 60% o f the activ ity in lactose .
The reu sab ility o f a co llagen-lactase co m p lex over a num ber o f reactor c o n ta cts (runs) w ith U F acid w h ey is sh ow n in Figure 4 . The a c tiv ity o f th e b iocata- ly t ic reactor is p lo tte d as a fu n c tio n o f repeat c o n ta c ts w ith U F acid w h ey and lacto se in th is figure. The reactor w as w ashed w ith tw o liters o f w ater b etw een runs.
As sh o w n in Figure 4 , th e b io ca ta ly tic
reactor ex p erien ced a partial, irreversible in h ib itio n u p on ex p osu re to U F acid w h ey . F o llo w in g th e in itia l in h ib itio n , th e a ctiv ity o f th e co llagen-lactase co m p lex ten d ed to stab ilize u p o n su b seq u en t co n ta c ts (runs) w ith e ith er acid w h ey or lacto se .
DISCUSSIONA SIM PLE, in ex p en siv e process for im m o b iliza tio n o f lactase using reco n stitu ted h ide co llagen as support m aterial has b een describ ed . T he m em branes thu s form ed can be shaped in to co n ven ien t con figu ration s fo r carrying o u t ca ta ly tic reaction s by m erely passing th e substrate over th e active m em brane. P en etration o f th e m em brane b y substrate to th e en zy m e lo c i is fa c ilita ted b y th e h igh ly sw o llen , o p e n structure o f th e h o st m atrix.
The m o d u les w ere used as batch rec y c le reactors. This reactor design prov ides a co n v en ien t and q u ick w ay o f o b ta in ing a m easure o f th e ca ta ly tic p o ten cy o f th e en zy m e co m p lex , by a m ultipass o p era tio n , ach ieving rapid, m u ltip le rep la cem en t o f th e flu id environ m en t o f th e b ou n d e n zy m e. T his, in turn , a fford s a rapid and stringent test fo r the stab ility o f th e im m o b ilized en zy m e.
In evaluating th e reu sab ility o f th e co llagen-lactase c o m p lex , th e in itia l decrease in ca ta ly tic ac tiv ity is a ttrib uted to th e leach ing o f lo o se ly bou nd en zy m e from sublayers near th e surface o f th e m em brane.
A com p arison o f th e a c tiv ity o f the bou n d |3-galactosidase sh o w ed partial, irreversib le in h ib itio n in u ltrafiltered acid w h ey as com pared to la cto se . The in h ib ito ry e ffe c t o f m ilk co n stitu e n ts has been rep orted by o th er w orkers (O k o s and Harper, 1 9 7 3 ; O lson and S tan ley , 19 7 3 ;
Fig. 4 —R e u s a b il i ty o f a b io c a ta ly t ic re a c to r fa b r ic a te d fr o m co llagen - la c ta se c o m p le x u t i l iz in g la c to se (5% ) a n d a c id w h e y as su b s tra te .
W ierzbicki et a l., 19 7 3 a ; W oychik and W o n d olow sk i, 1 9 7 3 ; D ahlqvist et al., 1 9 7 3 ; and W endorff et al., 1 9 7 1 ) .
The cause o f th e partial irreversible inh ib itio n is n o t read ily apparent and further stu d ies are required to characterize th e w h ey co n stitu en t an d /o r c o n stitu en ts responsib le for th e in h ib itio n . T he d ifferen ces in in h ib i to r y a c t io n can also be stu d ied to help e lu c id a te th e o p era tio n o f en z y m es in th e b o u n d state .
A possib le e x p la n a tio n for th e o b served irreversible in h ib itio n o f bou n d en zy m e is in h ib itio n by trace q u an tities o f divalen t ca tio n s present in w h ey . T he e f fect o f trace m eta l ca tio n s on lactase a c tiv ity has b een rep orted b y H ill and H uber (1 9 7 1 ) and b y R e ith e l and Kim(1 9 6 0 ) . It has been rep orted (W allerstein Co., T ech n ica l B u lletin , 1 9 7 0 ) , that at a level o f 0.000 1 M, z in c , barium , m agnesiu m , m angan ese, iron , cop p er and p o ta ssium w ere w ith o u t d e tec ta b le e ffe c t on th e ac tiv ity o f L actase LP. A ctiv ity was d e t e r m in e d using 0-nitrophenyl-/J-D - g a la ctop yran osid e (O N P G ) as substrate. Since th e co n cen tra tio n o f m agnesium and ca lc ium io n s in acid w h e y is considerab ly higher, being 0 .0 0 3 4 M and 0 .0 2 5 M respectively (F e e le y et al., 1 9 7 2 ) , the d eleteriou s e ffe c t o f th ese ca tio n s should be consid ered .
T hese resu lts represent prelim inary stu d ies and d em o n stra te th e feasib ility o f em p lo y in g a co llagen b ou n d lactase for the h y d ro ly sis o f acid w h e y to reduce lacto se c o n te n t for d ietary and processing needs.
REFERENCESCerbulis , J ., W o yc h ik , J .H . and W ondolow ski,
M .V . 1 9 7 2 . C om pos ition o f com m ercia l wheys. J. A gr. Fo o d C hem . 2 0 : 1 0 5 7 .
D ah lqvist, A ., M attiasson , B. and M osbach, K .1 9 7 3 . H yd ro lys is o f /3-galactosides using p o ly m e r e n trap ped lactase. A study tow ards producing lactose-free m ilk . B io techno l. Bioeng. 1 5 : 3 95 .
Eskam ani, A . 1 9 7 2 . C h arac te riza tio n o f lactase im m o b ilize d on collagen. P h .D . thesis, R u tgers U n iv e rs ity , N ew B runsw ick, N .J .
Eskam ani, A ., G ilb e rt, S .G .. Leeder. J .G . and V ie th , W .R . 1 9 7 3 . C h arac te riza tio n o f lactase im m o b ilize d on collagen 1. C om parative studies o f soluble and im m o b ilize d form s. (S u b m itte d fo r p u b lica tio n to B iotech. & B ioeng.)
Eskam ani, A ., Chase, T . J r., Freudenberger, J. and G ilb e rt, S .G . 1 9 7 4 . D e te rm in a tio n o f tryp to p h an co n te n t. A na l. B iochem . 57; 4 2 1
Fee ley , R .M ., C rin er, P .E ., M u rp h y , E .W . and To ep fer, E .W . 1 9 7 2 . M a jo r m inera l elem ents in da iry p roducts . Research 61: 505 .
G a ito n d e , M .V . and D o v ey , T . 1 9 7 0 . A rapid and d irec t m eth o d fo r the qu an tita tive d e te rm in a tio n o f try p to p h a n in the in tac t p ro te in . B iochem . J. 1 1 7 : 9 0 7 .
H ill , J .A . and H u b e r, R .E . 1 9 7 1 . E ffec ts o f various concentrations o f N a + and M g ++ o n the a ctiv ity o f ^-galactosidase. B iochem . B io- phys. A cta . 2 5 0 : 5 30 .
H ochstad t, H .R ., Pack, F . and L ib e rm a n , E .R .1 96 0 . U .S . P a ten t N o . 2 ,9 2 0 ,0 0 0 .
Joslyn, M .A . 1 9 7 0 . “ M ethod s in Food A n a ly sis.” A cadem ic Press, N .Y .
K osikow sk i, F .V . and W ierzb ick i, L .E . 197 1 . Low -lactose y o g u rt fro m m icrob ia l lactase (j3-galactosidase) applications. J. D airy Sci. 5 4: 7 6 4 .
K osikow ski, F .V . and W ierzb ick i, L .E . 1 9 7 3 .

7 5 4 -J O U R N A L O F FO O D S C IE N C E -V o lu m e 3 9 (1974)
Lactose hydrolysis o f raw and pasteurized m ilk s b y Saccharom yces lactis lactase. J. D a iry Sei. 5 6 : 1 4 6 .
K osikow sk i, F .V ., W ierzb ick i, L .E . and Iw asaki,T . 1 9 7 2 . Low -lactose m ü k fro m L actobac illus helveticus derived from lactose. J. D airy Sei. 55: 6 70 .
O kos, E.S. and H arper, W .J. 1 9 7 3 . A c tiv ity and s tab ility o f ß-galactosidase im m o b ilize d on porous glass. Proceedings o f 3 3rd A nnu al M eeting o f In s titu te o f Fo od Technologists, M ia m i.
Olson, A .C . and S tanley, W .L . 1 9 7 3 . Lactase and o th er enzym es bound to a phenol- fo rm aldehyde resin w ith g lutara ldehyde. J. Agr. F o o d C hem . 2 1 : 4 40 .
Proceedings, W hey Products C onference, June 1 4 — 15, 1 9 7 2 . A gricu ltu re Research Service, U S D A , Chicago, 111.
R e ith e l, F .J . and K im , J .L . 1 9 6 6 . Archives B iochem . & B iophys. 9 0 : 2 7 1 .
V ie th , W .R ., G ilb e rt, S .G . and Wang, S.S. 1 9 7 2 a . U rea hydrolysis on collagen-urease
c o m p le x m em brane. B iotech. B ioengr. S ym p. N o . 3 , 2 85 .
V ie th , W .R ., G ilb e rt, S .G . and Wang, S.S. 1 9 7 2 b . P erfo rm ance o f collagen-invertase com plex m em brane in a b io c a ta ly tic m o d ule. Transactions o f the N ew Y o rk A cadem y o f Sciences. Series I I , 3 4 (5 ): 4 5 4 .
V ie th , W .R ., Wang, S.S. and Saini, R . 1 9 7 3 . The im m o b iliza tio n o f w h o le cells in a m em brane fo rm . B io techno l. B ioengr. 1 5 : 565 .
W allerstein C om pany. 1 9 7 0 . Techn ical B u lle tin , W allerstein C o m p a n y , M o rto n G rove, 111.
W en d o rff, W .L ., A m undson , C .H ., Garver, J.C . and Olson, N .F . 1 9 7 1 . Use o f yeast /3-galac- tosidase in m ilk and m ilk products. J. M ilk F o o d Techno l. 34: 2 94 .
W ierzb ick i, L .E . and K osikow ski, F .V . 1 97 3 . Lactase p o te n tia l o f various m icroorganism s grow n in w h ey . J. D a iry Sei. 56: 2 6 .
W ierzb ick i, L .E ., Edw ards, V .H . and K o s ik o w ski, F .V . 1 97 3 a . K inetics o f lactose h y d ro lysis in acid w h ey by Aspergillus niger, ß - galactosidases im m o b ilize d on porous glass
particles in packed bed reactors. Proceedings o f 3 3 rd A nnu al M eeting , In s titu te o f Fo od Technologists, M ia m i.
W ierzb ick i, L .E ., Edw ards, V .H . and K o s ik o w ski, F .V . 1 9 7 3 b . Im m o b iliz a tio n o f m icrobia l lactases by covalent a ttac h m e n t to porous glass. J. Fo o d Sci. 3 8 (6 ): 1 0 7 0 .
W o ych ik , J .H . and W o ndo low ski, M .V . 1 9 7 2 . C ovalent b ind ing o f fungal /3-galactosidase to glass. B iochem . B iophys. A cta . 289 : 3 4 7 .
W o ych ik , J .H . and W o ndo low ski, M .V . 1 9 7 3 . Lactose hydro lys is in m ilk and m ilk p ro d ucts by bo und fungal /3-galactosidase. J. M ilk F o o d Techno l. 3 6 : 3 1 .
Ms received 6 /2 6 /7 3 ; revised 3 /2 4 /7 4 ; accepted 3 /2 8 /7 4 . ___________________________
This is a paper o f the Journa l Series, N .J . A g ricu ltu ra l E x p e rim e n t S ta tio n , C o o k C ollege, Rutgers U n ivers ity , The S tate U n ivers ity o f N ew Jersey, F o o d Science D e p t., N ew B runsw ick,N .J . This w o rk was supported in p a rt by the N atio n a l Science F o u n d atio n , G ra n t N o . G l - 3 4 2 8 7 -1 -B .

S. /. F A P A R U S I
Dept, o f Biochem istry, University o f Ibadan, Nigeria
MICROORGANISMS FROM OIL PALM TREE (Elaeis guineensis) TAP HOLES
INTRODUCTIONTHE O IL PALM tree in S o u th ern Nigeria is tapped for its sap. A ferm en ted beverage k n o w n as palm w in e is m ade from the sap and th is p rodu ct is an im portant source o f in com e to th e lo ca l farm ers.
T uley (1 9 6 5 ) has described th e various m eth o d s em p lo y ed in tapp in g palm trees. W hen a tree is to be tapp ed there is a prelim inary clearing o f th e o lder palm fronds so as to ex p o se th e p o in t o f tap ping to th e sun. T his ex p o sed surface encourages rapid evaporation , and thu s sets up a transp iration pull o f sap w ith in th e xy lem vessels. A fter th e clearing o f th e leaves, a triangular h o le is cut either at th e base o f a m ale flo w er bud (in in flo rescen ce tapp in g) or at th e stem a little w ay b e lo w th e term inal bud (in stem tapp in g). T his h o le is usually a b ou t 3 cm deep and th e area is enlarged as th e tap ping process progresses. T he h o le is left for 2 4 —3 6 hr after w h ich th e palm ju ice starts to o o z e ou t.
T he ju ice passes throu gh a bam b oo fun nel in to a b o tt le or gourd . During m orning and even ing tapp in g , p ieces o f tissu e from th e tapp ing h o le are scraped ou t w ith a specia l sharp kn ife b y th e tapper. This clearing process resu lts in th e enlargem ent o f th e h o le from w h ich th e sap o o z e s o u t. T he h o le gets larger, th e flow o f ju ice d im in ish es u n til, after 7 — 12 days, n o ju ice can be o b ta in ed . If th e tap h o le is n o t cleared regularly th e tapp ing period usually ends in 3 —4 days. The early stoppage o f sap f lo w has been attrib uted to th e b lo ck age o f th e tap h o le by yeasts; how ever, clearing o f th e h o le tw ic e daily enab les th ese organism s to be rem oved (F aparusi, 1 9 6 6 ).
In th e m icroflora l stu d ies o f palm sap (Faparusi, 1 9 7 1 ) it w as d em onstrated that various sp ec ies o f bacteria , yeasts and m ou ld s w ere responsib le for th e conversion o f th e sap to palm w in e .
This w ork w as c o n d u cted to relate th e m icroorganism s in th e tap h o le s to th o se in palm sap. It w as also considered n ecessary to relate th e p o p u la tio n o f th e m icroorganism s in tap h o les to sap y ields.
MATERIALS & METHODSTISSUE SLICES cut with a sterile knife during clearing of the tap holes in the mornings and evenings were collected in sterile polythene bags. The samples were stored in a refrigerator (2°C) until the microorganisms were cultured.
This was done within a period of 5 days of storage. Collection of tissue samples was done until the process of tapping the particular palm tree had ceased-usually 7 days.
Palm sap samples were collected at the same time for microfloral investigations.
50g of the tissues were put into a sterilized 500 ml capacity Waring Blendor (Beech and Davenport, 1971). Each of the samples was blended with 1 0 0 ml of chilled sterile isotonic saline for 60 sec. Successive tenfold dilutions of each blended sample were made aseptically with the sterile saline solution.
Table 1—Bacteria from tap holes and palm sap
Bacteria isolated Sources®Acetobacter roseus s, tAerobacter aerogens s, tArchromobacter superficiale tBacillus cereus tBacillus circulans tFlavobacterium solane tLactobacillus brevis s, tLactobacillus sp. s, tLeuconostoc mesenteroides s, tMicrococcus candidatus s, tMicrococcus conglomeratus s, tMicrococcus varians s, tPseudomonas putrefaciens tPseudomonas striata tSarcina s, tSerratia marcescens s, tStreptomyces sp. tZymomonas mobilis s, ta t = tap hole; s = palm sap.
Table 2—Yeasts from tap holes and palm sap
Yeasts Sources®
Candida valida tHansenula anomala tKloeckera apiculata s, tMetschnikowia pulcherrima tPichia pastoris s, tPichia membranaefaciens s, tSaccharomyces cerevisiae s, tSchizosaccharomyces pombe s, tSporobolomyces roseus tTorulopsis candida tTorulopsis sp. tTrichosporon fermentans t
s = p a im sap ; t = tap h o le .
To culture the organisms in the palm sap, 1 ml of the sample was successively diluted as above. The dilutions were streaked and plated on various media. The colonies were purified by subsequent subculturing.
The bacteria were isolated on all-purpose tryptone agar at pH 6.7 (Sharf, 1966), and Rogosa-Mitchell-Wiseman medium which was adjusted to pH 5.8 with drops of glacial acetic acid (Cosilow et al., 1964). Yeast extract-malt extract agar (Wickerham, 1951) and acidified nitrogen base agar containing 2 % ( w /v ) glucose (Etchells et al., 1954), and dextrose agar containing 0 .1 % yeast extract, acidified with 2 ml of 5% tartaric acid per 100 ml of medium were used for yeast and mould isolation. To inhibit bacterial growth, aureomycin and actinomycin were added (Beech and Carr, 1960). 0.5% ferric ammonium citrate was added to allow full pigmentation of Metschnikowia pulcherrima.
All plates were incubated at room temperature (22-25°C) for 3—5 days.Identification of organisms
The bacteria were examined according to procedures described in the Manual of Methods for Pure Culture Study of Bacteria (Committee on Bacteriological Technic, 1957) and nomenclature is based on Bergey’s Manual (1957).
Yeast isolates were identified using the methods given by Lodder (1970).
RESULTSTABLE 1 lists the bacteria isolated from both the tap holes and the palm sap. Of the 18 bacteria species found in the tap holes, only 1 1 got into the palm sap samples. The bacteria species which were not identified in the palm sap included Bacillus spp, P se u d o m o n a s spp, S tre p to - m y c e s sp, F la vo b a c te r iu m solane and A r c h r o m o b a c te r superfic iale .
The bacteria isolated from both the tap holes and the palm sap samples included the typical palm wine bacteria such as L e u c o n o s t o c m esen te ro id es , Sarcina sp., L a cto b a c i l lu s spp., A c e to - b a c te r roseus, A e r o b a c te r aerogens, and L y m o m o n a s m obilis .
Less than half o f the 12 yeast species isolated during the study have been found in the palm sap (Table 2). The 5 yeast species which were isolated from both the tap holes and palm sap consisted of K lo ec k era apicu lata , Pichia pastoris , Pi. m em bran efac ien s , S a c c h a ro m y c e s cere- visiae and S c h i zo s a c c h a r o m y c e s p o m b e .
Such yeast species as Candida valida, T oru lops is spp., T rich osporon fermentans, S p o r o b o lo m y c e s roseus, and Hansenula anam ala have not been isolated from the palm sap.
V o lu m e 3 9 ( 1 9 7 4 1 - J O U R N A L O F F O O D S C I E N C E - 755

756—JO U R N A L O F FO O D S C IE N C E -V o lu m e 39 (1974)
As sh o w n in T able 3 o n ly Penicill ium c itr in ium and A sperg il lu s o r y z a e w ere not iso la ted from th e palm sap. T he oth er four m o u ld s, A. niger, A . f lavus, M u co r m u c e d o and R h iz o p u s nigricans, w ere iso la ted from b o th tap h o le s and palm sap.
P op u la tion stu d ies o f th e m icroorganism s from th e tap h o les and palm saps dem onstra ted that b o th the bacteria and yeasts increased in num bers in th e tap h o les during th e period o f tapp ing. The increase in averages o f logarithm s o f c o u n ts per gram o f palm tissu es and per m l o f sap from 20 regular tappings is sh ow n in Figure 1. T he p o p u la tio n s o f th e bacteria and yeasts in th e tap h o les increased th ro u g h o u t th e period o f tap ping. H ow ever, after th e in itia l slow increase during th e first 2 4 hr o f tapp ing, th e n ex t 2 4 - 3 6 hr sh ow ed a rapid rise in th e pop u la tion s; from th e third day th e p o p u la tio n increases w ere gradual.
On th e o th er hand th e m oulds sh ow ed a slight rise during th e first 4 8 hr before falling to an a lm ost stead y level.
T he increases in averages o f logarithm s o f co u n ts per m l o f palm sap fo llo w ed alm ost th e sam e pattern as th e co u n ts per unit w eight o f palm tissu es after th e first 2 4 hr o f th e tapp ing process. T he bacteria and yeasts increased sharply from the seco n d day u n til th e third day w h en th e increases b eco m e gradual and steady .
Table 3—Moulds from tap holes and palmsap
Moulds Sources3Aspergillus oryzae tAspergillus niger s, tAspergillus flavus s, tMucor mucedo s, tRhizopus nigricans s, tPenicillium citrinum ta t = tap h o le ; s = p a lm sap .
T he pattern o f m ou ld c o u n ts w as not sh o w n in th e graph b ecause it did not fo llo w any stead y variation .
There w as a stead y increase in sap flow during th e first 4 8 hr after tapp ing. A fter th a t, th e vo lum e y ie ld ed decreased un til7 —8 days w h en th e sap flo w term in ated . It seem s that as so o n as th e leve l o f bacteria or yeast co u n ts ex ceed s 1 0 8 per gram o f tissu e at th e tap h o les , th e flow o f sap begins to fall.
DISCUSSIONTH E FA C T that m ore yeasts and bacteria ty p e s w ere a lw ays iso la ted from th e tap h o les th an from th e palm sap in d ica tes that o n ly a fraction o f th e organism s are
w ashed from th e tap h o le b y th e sap as it drips o u t. T his stu d y also d em on stra ted that few er m ould sp ec ies w ere w ashed o u t o f th e tap holes.
C onsidering th e previous m icroflora l analyses o f palm sap and palm w in e sam ples, it appears o n ly 3 yeast sp ec ies (S a c c h a ro m y ce s cerevis iae, Sch izosaccha- r o m y c e s pom .be and Pichia sp p .) are easily w ashed in to th e sap. Their co n sta n t appearance in th e palm sap cou ld a lso be due to their relative d om in a n ce in th e yeast p o p u la tio n .
In an earlier stu d y o f th e orig in o f m icroorganism s o f palm w in e (F aparusi,1 9 7 3 ) S a c c h a ro m y ce s cerevis iae was foun d to be abundant o n th e f lu ffy hairy ou t-grow th s o f th e fe lt used in covering th e tap h o les . It co u ld be th a t th is particular yeast is a lw ays transferred in to th e h o le from th e fe lt . A lso , so m e yea sts w ere reported during th e stu d y to b e present in th e tissu es o f th e palrr. tree , e .g ., Pi. pastoris , Sacch. cerevis iae, T r ich osporon fe rm e n ta n s and Torulapsis spp.
T he bacteria prev iou sly iso la ted from palm sap and palm w in e con sist o f L a c t o bacillus sp p ., Bacillus sp p ., L e u c o n o s t o c m esen te ro id es , Sarcina and Z y m o m o n a s m o b il i s (Bassir, 1 9 6 2 ; F aparusi and Bassir, 1 9 7 2 ). A c e t o b a c t e r and A e ro b a c - te r spp. have a lso b een fo u n d d o m in a n t w h en palm sap w as stored for 3 —4 days. Lactobaci l lu s , M icro c o cc u s and S tr e p to - m y c e s spp. have b een iso la ted from th e palm tissu es at th e tapp ing region (F aparusi, 1 9 7 4 ). It has b een suggested that som e o f th ese bacteria l sp ec ies m ight have orig inated from th e so il and th en transported th rou gh th e x y lem stream up th e p lant. It is e x p e c te d , h ow ever, th at a num ber o f th e bacteria and yeast sp ecies co u ld have b een carried in th e air. For in stan ce such yeasts as Pichia, T oru lopsis and Candida spp. and S p o r o b o lo m y c e s roseus, and bacteria such as A c e t o b a c t e r and A e r o b a c te r spp. cou ld have g o tte n in to th e tap h o les from th e air.
T he m oulds iso lated during th is stu d y cou ld have b een in troduced b y a tm o spheric c o n ta m in a tio n . A ll o f th em have been cultured from th e air around th e palm trees during an earlier stu d y o f th e m icroflora o f th e air around th e palm trees.
As sh ow n above th e palm sap y ield began to fa ll as so o n as th e y east or bacteria c o u n ts ex ceed ed 1 0 8 per gram o f tissu e. W hen th e tissu es o f th e tap h o les are left unsliced during tapp in g , it was observed that bacteria l and yeast co u n ts each ex ceed ed 1 0 8 per gram tissu e w ith in 36 hr and th e palm sap y ie ld sto p p ed after abou t 4 8 hr. It is n o t d e fin ite w h eth er th e stop page o f sap flo w is due to com b in ed e ffe c ts o f th e tw o organ ism s. H ow ever, th e ro le o f various organism s in th e stoppage o f sap f lo w co u ld be a subject fo r fu tu re investiga tion .
Days of tapping
Fig. 1— Variation o f microbial counts and sap yield during the sap flow period: <1! bacteria from tap holes; (2) yeasts from tap holes; (3) bacteria from palm sap; (4) yeasts from palm sap; (5) sap yield; and (61 moulds from tap holes.

M I C R O O R G A N I S M S F R O M P A L M T R E E T A P H O L E S - 757
It was also observed during th e stu dy th a t th e period required to a tta in th ese p o p u la tio n co u n ts w as d ep en d en t o n the season o f th e year. During N ovem ber to January, th ese figures o f p o p u la tio n co u n ts w ere usually a tta ined after about 4 days o f tapp ing w hereas during th e oth er season s th e period is usually 2 —3 days.
This delay in p o p u la tio n grow th around N ovem ber w h en there is harm attan (co ld and dry north-east w in d ) and th e night tem p erature is as lo w as 10°C m ight be th e reason for higher and longer palm ju ice y ie ld a lready observed during th is period o f th e year. N aghski and W illits (1 9 5 5 ) observed that stop page o f m aple sap f lo w usually fo llo w ed periods w h en sap flo w w as in terrup ted b y abnorm ally w arm w eather. S u ch w eather c o n d itio n s w h ich are co n d u civ e to th e rapid gro w th o f m icroorgan ism s, w ere said to be resp on sib le fo r th e prem ature stoppage o f sap flo w .
T he present stu d y to correlate m icrobial p o p u la tio n s w ith palm sap y ie ld
w ou ld d eterm in e n o t o n ly th e in flu en ce o f th ese organism s o n th e tap h o les but also th ro w som e ligh t o n th e b est m eth od o f tapp in g for m ax im um y ield s.
REFERENCESBassir, O. 1 9 6 2 . O bservations on the fe rm e n ta
tio n o f palm w ine . West A fric . J. B io l. & A p p l. C hem . 6: 20.
Beech, F .W . and Car, J .G . 1 9 6 0 . Selective m edia fo r yeasts and bacteria in apple ju ice and cider. J . Sc. F d . A gric . 11: 38.
Beech, F .W . and D avenpo rt, R .R . 1 9 7 1 . “ M ethods in M ic ro b io lo g y ,” E d . N orris , J .R . and R ibb ons, D .W . V o l. 4 A cadem ic Press, L o ndo n .
“ Bergey’s M anua l o f D e te rm in a tive B acterio lo g y ,” 7 th E d . 1 9 5 7 . B reed, R .S ., M u rra y ,E .G .D . and S m ith , N .R . The W averly Press, In c . B a ltim o re , U .S .A .
C o m m ittee on B acterio logical Techn ic , Society o f A m erican B acteriologists. 1 9 5 7 . “ M anual o f M ethods fo r Pure C u ltu re S ociety o f B acteria .” M c G ra w -H ill B ook C o ., N ew Y o rk .
C os tilo w , R .N ., E tchells , J .L . and Anderson,T .E . 1 9 6 4 . M e d iu m fo r producing cells o f lac tic acid bacteria . A p p l. M ic ro b io l. 12: 5 39 .
E tchells , J .L ., C o s tilo w , R .N ., Bell, T .A . and D em a in , A .L . 1 9 5 4 . C o n tro l o f m oulds du r
ing the enum era tion and iso lation o f yeasts fro m soil and p lan t m ate ria l. A p p l. M ic ro b io l. 2: 2 9 6 .
Faparusi, S .I. 1 9 6 6 . A b iochem ica l study o f palm w ine fro m d iffe re n t varieties o f Elaeis guineensis. P h .D . thesis, U n ivers ity of Ib ad an , N igeria.
Faparusi, S .I. 1 9 7 1 . M ic ro flo ra l o f fe rm enting palm sap. J. F d . Sci. & Tech . 8: 2 0 6 .
Faparusi, S .I. and Bassir, O . 1 9 7 2 . Factors affec tin g the q u a lity o f pa lm w ine . 1 . Period o f tapp ing a pa lm tree . West A fr ic . J. B io l. & A d p I. C hem . 1 5: 1 7 .
Faparusi, S .I. 1 9 7 3 . O rig in o f in it ia l m ic ro flo ra o f pa lm w ine fro m o il palm trees (E laeis guineensis). J. A p p l. Bact. 3 6 .
L o d d er, J. 1 9 7 0 . “ The Yeasts— A T a x o n o m ic S tu d y .” N o rth -H o lla n d Publishing C o ., A m sterdam .
Naghski, J. and W illits , C .O . 1 9 5 5 . M aple sirup.9. M icroorganism s as a cause o f p rem ature stoppage o f sap flo w fro m m aple tap holes. A p p l. M ic ro b io l. 3 : 1 4 9 .
Sharf, J .M . 1 9 6 6 . “ R ecom m ended M ethods fo r the M ic ro b io lo g ic a l E x a m in a tio n o f Fo ods ,” 2nd ed. A m . Pub lic H e a lth A ssociation, In c ., N ew Y o rk .
T u le y , P. 1 9 6 5 . H o w to tap p a lm . N igerian F ield 30: 28.
W ickerham , L .J . 1 9 5 1 . T a x o n o m y o f yeasts. Tech. B u ll. N o . 1 0 2 9 . U .S . D ep t. A gric ., W ashington, D .C .
Ms received 1 0 /1 3 /7 3 ; revised 1 /1 0 /7 4 ; accepted 1 /1 5 /7 4 .
M y a pprec ia tion goes to M r . D av id N k w o r fo r his techn ica l assistance during the study.

L O R R A I N E G. S T A A T S a n d N A N C Y M . T O L M A N
C ollege o f H o m e E c o n o m ic s , L o u is ia n a T ech U n iv e r s ity , R u s to n , L A 7 1 2 7 0
ACCEPTABILITY OF SALTINE CRACKERS CONTAINING COTTONSEED PROTEIN PRODUCTS
INTRODUCTIONA SH O R T A G E o f prote in is fou n d in m any parts o f the w orld , particularly in develop in g co u n tr ies , w here serious prote in d efic ien cies are seen (L am b ou et al.,1 9 6 6 ). Even in th e U n ited States w here prote in fo o d s are p len tifu l, p eo p le tend to use h igh -carbohyd rate , low -p rotein fo o d s , e sp ecia lly for snacks, and protein in takes m ay be less than desirable for so m e groups. E nrichm ent o f accep ted snacks w ith protein w ou ld help m aintain or increase th e level o f prote in intakes. B ecause o f the increasing co st o f traditio n a l h igh -q uality p ro te in prod u cts , n ew p rote in -con ta in in g su bstances need to be exp lo red as possib le rep lacem ents.
D im ler (1 9 7 1 ) p red icts that th e role o f o ilseed s as a protein source w ill be in creasing sin ce their co st is lo w and the various ty p es are grow n th rou gh ou t the w orld. C o tto n is grow n m ain ly for its fiber in m any trop ica l and su btrop ica l areas. T he o il and c o tto n se ed presscake are tw o im p ortan t by-p rod u cts (M artinez et al., 1 9 7 0 ; L am bou e t al., 1 9 6 6 ; Alt- schu l, 1 9 6 5 ) , bu t th e y are n o t at present m uch used as hum an fo o d sources. The rem oval o f to x ic g o ssy p o l and im proved o ilseed processing m eth o d s have increased the p o ten tia l for providing a readily available sou rce o f h igh qu ality prote in supp lem en t for hu m ans from th e co tto n seed presscake, w h ich h ereto fo re was o n ly used for anim al feed or fertilizer (Martin ez et al., 1 9 7 0 ; B ressani, 1 9 6 5 ).
Saltine crackers w ere seen as a snack fo o d w h ich cou ld be enriched w ith high prote in c o tto n se ed produ cts; th e glandless co n cen tra te , a deglanded co n cen tra te , and a storage iso la te w ere th e three selec ted for use. T he purpose o f th is stu dy w as to d evelop and evaluate sa ltin e-typ e crackers w ith p ro te in c o n te n t increased b y su b stitu tio n o f a c o tto n se ed protein prod u ct fo r a p o rtio n o f th e flour.
EXPERIMENTALTHE THREE cottonseed products were obtained from the Southern Regional Laboratory of the USDA (New Orleans, La.). The deglanded (DGC) and glandless concentrate (GC) had been prepared from cottonseed flours made using the Liquid Cyclone Process and the reported nitrogen content was 10.55% and 10.29% respectively. The storage isolate, (SI) prepared by selective precipitation and spray dried at pH 6 .8 , contained 15.90% nitrogen.
Cottonseed products replaced 25, 30, or 35% by weight of the wheat flour in the crackers. 15% of the cottonseed protein product was put in the sponge and 85% in the dough.
Information and recipes furnished by cracker manufacturers provided the basis for preliminary work. The formulation developed for making crackers is given in Table 1.
The sponge was prepared by sifting the allpurpose flour and cottonseed protein together, cutting in the lard with a pastry blender and then, using a fork, incorporating the yeast
Table 1—Ingredient amounts for cracker recipe
IngredientWeight
(9)Sponge
All purpose flour 112.0Water 40.0Active dry yeast 0.6Lard 36.0
DoughCake flour 48.0Water 6.0Salt 2.0Soda 0.4
which had beer, dissolved in 43°C water. The sponge was covered with plastic wrap and placed in a warming oven set at 27° C for 18 hr. To prepare the dough, the cottonseed protein, cake flour, salt and soda were sifted together and added to the sponge. Water was incorporated using a fork and further mixing was done with the fingers and thumb, using a folding motion. The mixture was covered and allowed to ferment in the warming oven for 4 hr at 27° C.
Control (no cottonseed protein), DGC and GC crackers were rolled to desired thickness on a hand operatec noodle maker (Rolecta 64 by Torino). Seven laminations of the dough were made and the final thickness was approximately 3/64 in. The SI dough was not pliable enough to be rolled with the noodle maker, so a rolling pin was used. Duplication of the mechanical rolling procedure was attempted, but it was not possible to roll the dough as thin for the SI crackers as for the others. The dough was cut into 1 -in. circles with a metal biscuit cutter, pricked with a fork to prevent formation of large air cells, and baked 3—6 min on wire racks in an oven set at 232°C, until browned. Groups of 1 2 crackers were wrapped in wax paper which was sealed with masking tape, placed in brown paper bags, and stored at room temperature for 1, 7 and 21 days.
A six-member taste panel evaluated crackers for exterior appearance, interior appearance, tenderness, crispness and flavor. Other data collected included weight loss, breaking strength,
Table 2—Significance values for effects of variables on traits of crackers made with different levels of cottonseed protein products
Source of variation
Trait Replication Product LevelStorage
time
ProductX
Level
ProductX
Storagetime
LevelX
Storagetime
Exteriorappearance 0.3625 0.0001 0.0001 0.0505 0.0770 0.1080 0.5149
Interiorappearance 0.9895 0.0001 0.0001 0.0198 0.9452 0.0547 0.4036
Crispness 0.0431 0.0001 0.0017 0.0017 0.0532 0.0028 0.6803Tenderness 0.1468 0.0001 0.0019 0.0544 0.2893 0.4156 0.8871Flavor 0.5617 0.0001 0.0003 0.0028 0.5604 0.5035 0.1434Moisture
loss 0.0184 0.0002 0.1233 0.3812 0.0002 0.3615 0.8789Breaking
strength 0.0805 0.2365 0.5581 0.0001 0.0408 0.5215 0.5806Count-per-
pound 0.5067 0.0001 0.9607 — 0.5730 — _Height 0.2727 0.0612 0.0348 - 0.4051 - -
7 5 S - J O U R N A L O F F O O D S C I E N C E - V o l u m e 3 9 ( 1 9 7 4 )

C R A C K E R S C O N T A I N I N G C O T T O N S E E D P R O T E I N - 7 59
count-per-pound and height. The preparation of each variation of crackers was replicated three times. Analysis of variance was used to determine the significance of the differences among means.
RESULTS & DISCUSSIONStatistica l analysis
T he analysis o f variance program dev e lop ed by Barr and G o o d n ig h t (1 9 7 2 ) was used to analyze th e data. Levels o f sign ifican ce for the m ain e ffe c ts and the tw o-term in tera ctio n s for th e crackers enriched w ith c o tto n se ed p ro te in produ cts are given in T able 2. In th e co m p u ter
analysis th e sm allest p ro b ab ility listed was 0 .0 0 0 1 ; higher probab ilities w ere lis ted as m ore e x a c t num erical values. Storage was assum ed t o n o t a f fec t c o u n i - per-pound and h e ig h t, so th ese characteristics w ere n o t rem easured.
T he ty p e and am o u n t o f c o tto n se ed p rote in prod u ct sign ifica n tly a ffec ted all o f th e o rg a n o lep tic traits. This sim ilarity w as e x p e c te d , as it is d o u b tfu l i f th e taste pan el m em bers co u ld jud ge each tra it in d ep en d en tly o f th e others. The ty p e o f p ro d u ct a lso a ffec ted th e m oisture lo ss and th e cou n t-p er-p ou n d . Breaking stren gth , crispness, and flavor w ere a ffec ted b y storage tim e. T he o n ly in teraction s
sign ifican t at P < 0 .0 1 w ere th e e ffe c ts o f prod u ct x co n cen tra tio n o n m oistu re and product x storage t im e o n crispness. These w ere app arently d u e t o d i f fe ren ce s in th e prod u cts co n ta in in g th e iso la te as co m pared to th o se con ta in in g th e co n c en trates.
A ccep ta b ilityO rganoleptic eva lu ation s w ere m ade
using a 5 -p o in t sca le (1 = very p o o r to 5 = very g o o d ). In T able 3 th e rela tion sh ip o f the c o tto n se ed p ro d u ct to a c cep ta b ility is sh ow n . T he DG C sam ples w ere rated “g o o d ” to “very g o o d ” at th e 25 and 35% levels and th e GC sam ples ranged from “ fair” to “ g o o d ” at th e sam e levels. T he general appearance and co lo r w ere a ccep tab le . Crackers w ere crisp and had a g o o d flavor. O n the o th er han d , the SI prod u cts w ere an u n a p p etiz in g grey-green co lor, th ick and so m etim es ch ew y . An u n pleasant a fter ta ste from th e SI sam ples was n o te d b y ta ste pan elists; th e aftertaste w as a lso ev id en t at th e 35% level for som e o f th e DG C and G C crackers. The appearance scores, b o th ex ter io r and in terior, ten d ed to decrease as th e a- m o u n t o f c o tto n se e d p ro te in increased . Crackers m ade w ith th e storage iso la te w ere the lea st desirable in appearance, w h ile scores for th e crackers con ta in in g 25 or 30% gland less c o tto n se e d protein w ere sim ilar to th o se fo r the co n tro l crackers.
T he SI crackers w ere u n a ccep ta b le as sh ow n b y th e scores for crispness, tenderness and flavor. T he increased th ickness o f th ese crackers com pared to th e others m ay have con tr ib u ted to th e po o r quality . T he ten d ern ess, crispness and flavor scores o f th e GC and D G C crackers ranged from accep ta b le to very accep ta b le; in so m e in stan ces, be ing higher than th e scores fo r th e co n tro l crackers.
S ign ifican t d ifferen ces due to storage tim e w ere fo u n d fo r ten derness (P = 0 .0 0 0 1 ) , crispness (P = 0 .0 0 0 1 ) , and fla vor (P = 0 .0 0 3 6 ) o f th e co n tro l crackers. A verage a c cep ta b ility scores fo r fresh and stored crackers are given in T able 4 . T he scores for th e co n tro l fo r all organ o lep tic traits ten d ed to decrease w ith increased storage tim e. Even th o u g h th e scores fo r a particular trait w ere probab ly b iased by scores fo r o th e r o rg a n o lep tic traits, on e can co n c lu d e th at th e a ccep ta b ility o f the crackers m ade w ith o u t c o tto n se ed prote in decreased w ith storage. On the other hand, scores for th e GC and DG C crackers did n o t reveal th is c o n sisten t deteriora tion . In fa c t, scores ten d ed to increase w ith storage. Scores fo r th e SI crackers ten d ed to decrease w ith storage t im e , but the in itia l scores w ere so lo w th a t the crackers w ere consid ered un acceptable . This d ifferen ce b e tw e en th e concen trates and th e iso la te w ith storage is em phasized b y th e s ign ifican t in teraction (T able 2).
T aste p an elists k n ew that so m e o f the
Table 3—Average taste panel scoresa for crackers made with various levels of cottonseed protein products
Cottonseed product level
Exterior Interiorappearance appearance Crispness Tenderness Flavor
None 4.14 4.28 3.72 4.13 4.08G lan d less c o n e
25% 4.34 4.32 4.22 4.28 4.0330% 4.22 4.28 4.22 4.12 3.7835% 3.85 3.95 4.11 4.02 3.43
D eg lan d ed c o n e25% 3.76 3.84 4.05 3.92 3.4430% 3.22 3.69 3.87 3.88 3.2035% 2.96 3.36 3.35 3.45 3.19
S to ra g e iso la te25% 2.69 2.48 2.59 2.60 2.8730% 2.62 2.43 2.27 2 Ì 0 2.6235% 2.20 2.02 2.31 2.32 2.47
a S c a le o f 1 to 5 w ith 5 = v e ry g o o d a n d 1 = very p o o r
Table 4—Average taste panel scoresa after storage of made with various cottonseed protein products
crackers
Product and storage time
Exterior Interior appearance appearance Crispness Tenderness Flavor
None0 day 4.23 4.44 4.21 4.48 4.301 day 4.23 4.37 4.29 4.57 4.437 days 4.12 4.18 3.46 4.00 3.89
21 days 3.96 4.11 2.91 3.47 3.68Glandless cone
0 day 4.01 3.87 3.68 3.84 3.601 day 4.19 4.31 4.22 4.18 4.007 days 4.18 4.28 4.44 4.28 3.71
21 days 4.17 4.28 4.39 4.26 3.69Deglanded cone
0 day 3.24 3.36 3.30 3.56 3.161 day 3.50 3.62 3.80 3.84 3.487 days 3.46 3.81 3.99 3.88 3.32
21 days 3.06 3.73 3.93 3.72 3.16Storage isolate
0 day 2.64 2.39 2.53 2.42 2.701 day 2.49 2.38 2.47 2.52 2.877 days 2.53 2.28 2.38 2.42 2.77
21 days 2.34 2.21 2.18 2.27 2.27
a S c a le o f 1 to 5 w ith 5 = very g o o d a n d 1 = very p o o r

760-J O U R N A L O F FO O D S C IE N C E -V o lu m e 3 9 (1974)
Table 5—Estimated protein content and average of all organoleptic evaluations for crackers made with various levels of cottonseed protein products
Cottonseed product level g/cracker
ProteinRatio to
control cracker
AvgOrganoleptic
scoreNone 0.28 1.0 4.1Glandless cone
25% 0.58 2.07 4.230% 0.64 2.28 4.135% 0.71 2.53 3.9
Deglanded cone25% 0.57 2.03 3.830% 0.63 2.25 3.635% 0.69 2.46 3.3
Storage isolate25% 0.96 3.42 2.630% 1.10 3.92 2.435% 1.21 4.32 2.1
sam p les h a d b e e n s to re d fo r v a rio u s le n g th s o f t im e , b u t th e y d id n o t k n o w w h e th e r o r n o t a g iven sam p le h a d b e e n s to re d . C o m m e n ts o n sc o re ca rd s in d ic a te d th a t 6 3 o f th e sam p le s w e re “ s ta le .” O f th e s e , 38 w ere f o r th e c o n tr o l c ra c k e rs , 17 fo r th e SI c ra c k e rs a n d 4 e a c h fo r th e G C a n d D G C crack e rs .
M o is tu re , c o u n t-p e r -p o u n d , h e ig h t a n d b re a k in g s t re n g th
M o is tu re ch an g es w ere e s t im a te d b y d e te rm in in g ch an g es in w e ig h t b e fo re an d a f te r b a k in g an d w ith s to ra g e . T h e c o n tr o l c ra c k e rs lo s t a b o u t 26% o f th e ir w e ig h t d u rin g b ak in g , a n d th is w as assu m e d to b e p r im a ri ly m o is tu re . W eigh t ch an g ed d u rin g s to ra g e (P = 0 .0 0 0 1 ) , w ith th e d if fe re n c e b e tw e e n th e w e ig h t o f c ra c k e rs s to re d 3 w k a n d u n b a k e d c ra c k ers b e in g a p p ro x im a te ly 22% o f th e raw w e ig h t. T h is in c re a se in m o is tu re c o n te n t p ro b a b ly is r e la te d to th e d e c re a se d ac c e p ta b ili ty o f th e c o n tr o l c ra c k e rs w ith s to ra g e . S to rag e t im e d id n o t s ig n ific a n tly a f f e c t th e m o is tu re level o f c o tto n s e e d p ro te in c ra c k e rs (T a b le 2). T h e w e ig h t o f fre sh ly b a k e d c ra c k e rs c o n ta in in g a c o tto n s e e d p ro te in w as a p p ro x im a te ly 20% less th a n th a t o f u n b a k e d c rack e rs . C hanges in w e ig h t o v e r th e 3 -w k p e rio d w e re less th a n 1%. T h u s , th e c o tto n s e e d c ra c k e rs d id n o t a p p e a r to lo se as m u ch m o is tu re d u rin g b a k in g as th e c o n tro l c ra c k e rs , b u t n e i th e r d id th e c o tto n s e e d c ra c k e rs te n d to p ic k u p m o is tu re d u rin g s to ra g e as th e c o n tr o l d id . C rack e rs c o n ta in in g 35% s to ra g e is o la te h a d a w e ig h t lo ss o f a p p ro x im a te ly 18% as c o m p a re d to 20% f o r th e o th e r c ra c k e rs , e x p la in in g th e s ig n if ic a n t e f f e c t o f p ro d u c t a n d th e in te r a c t io n l is te d in T a b le 2. M o is tu re c o n te n t w o u ld b e e x p e c te d to b e re la te d t o c risp n ess . E v a lu a tio n s o f c risp n ess fo r th e G C a n d D G C c ra c k e rs w ere h ig h e r
a f te r s to ra g e th a n th o s e f o r th e c o n tro l c ra c k e r (T a b le 4 ).
T h e c o u n t-p e r-p o u n d w as s im ila r fo r th e G C a n d D G C c ra c k e rs , 2 7 0 a n d 2 6 7 , re sp e c tiv e ly . A lth o u g h th e u n b a k e d c o n tr o l c ra c k e rs w ere th e sam e v o lu m e as th e G C a n d D G C c ra c k e rs , th e b a k e d p ro d u c t w as h e a v ie r as in d ic a te d b y a c o u n t-p e r- p o u n d o f 2 2 3 . T h e SI c ra c k e rs w ere a lso h e a v ie r w ith a c o u n t-p e r-p o u n d o f 2 2 1 , b u t th e se c ra c k e rs w e re th ic k e r b e fo re b a k in g b e c a u se o f d if f ic u ltie s in ro llin g th e d o u g h .
T h e h e ig h t o f a s ta c k o f six c ra c k e rs w as m e a su re d to g e t an in d ic a t io n o f d iffe re n c e in v o lu m e , a n d p e rh a p s f lak in ess , w ith b ak in g . T h e c o n tr o l c ra c k e rs ro se m o re d u rin g b ak in g , w ith a n average h e ig h t o f 1 -1 /8 in . as c o m p a re d to 1 5 /1 6 in . f o r b o th th e G C an d D G C crack ers . T h e SI c ra c k e rs ro se v e ry l i t t le w ith th e h e ig h t o f s ix b a k e d c ra c k e rs averag ing o n ly 7 /8 in ., ev e n th o u g h th e s e c ra c k e rs w e re th ic k e r b e fo re b a k in g th a n th e o th e rs .
T o e s t im a te b re a k in g s t re n g th o f c ra c k e rs , a p la t fo rm w ith a U -sh ap ed d e p re s s io n w as a d d e d to a W arn e r-B ra tz le r sh e a r a p p a ra tu s . T h is p ro v id e d s u p p o r t f o r th e c ra c k e r , b u t a llo w e d th e b la d e to c o n tin u e to lo w e r a f te r b re a k in g th e c ra c k e r . B reak in g s t r e n g th w as a f fe c te d s ig n if ic a n tly (T a b le 2 ) b y s to ra g e t im e fo r th e c o tto n s e e d c ra c k e rs , as less fo rc e w as n ecessa ry to b re a k c ra c k e rs a f te r s to ra g e th a n b e fo re . A lth o u g h n o t a s ta tis tic a lly s ig n ific a n t d if fe re n c e , th e fo rc e n ecessa ry to b re a k c o n tr o l c ra c k e rs te n d e d to in c rease w ith s to ra g e tim e .
P ro te in c o n te n t
T h e c o n v e rs io n fa c to r , 5 .3 (W a tt an d M errill, 1 9 6 3 ) w as u se d to e s t im a te th e p ro te in c o n te n t o f th e c o tto n s e e d p ro d u c ts . T h ese va lu es a n d in f o rm a t io n fro m
fo o d c o m p o s it io n ta b le s (B o w e s an d C h u rc h , 1 9 7 0 ) w e re u se d to c a lc u la te th e p ro te in c o n te n t l is te d in T a b le 5 . In c o rp o ra t io n o f a c o tto n s e e d p r o d u c t in c reased th e p ro te in c o n te n t o f c ra c k e rs a t le a s t tw o fo ld . U sing th e av erag e sc o re o f all o rg a n o le p tic tr a i ts , i t c an b e se e n th a t th e c ra c k e rs m a d e w ith th e d e g la n d e d c o n c e n tra te c o m p a re d v e ry fa v o ra b ly w ith th e c o n tr o l c ra c k e rs . W hile th e c ra c k e rs c o n ta in in g th e s to ra g e is o la te w ere h ig h in p ro te in c o n te n t , th e y w ere n o t a c c e p ta b le . F u r th e r w o rk m ig h t in d ic a te th a t an a c c e p ta b le p ro d u c t c o u ld b e o b ta in e d w ith th e s to ra g e is o la te i f th e level o f p ro te in in th e fin a l p r o d u c t w ere d e c re a se d to th e lev e l o f th e a c c e p ta b le D G C a n d G C c rack e rs .
W hile th e a c tu a l p ro te in c o n te n t p e r c ra c k e r is lo w , o n e sh o u ld re m e m b e r th a t th e s e c ra c k e rs w ere sm a ll (1 in . d ia m ) a n d th a t severa l w o u ld p ro b a b ly b e e a te n as a sn ack . F o r e x a m p le , te n c ra c k e rs c o n ta in ing 30% o f th e d e g la n d e d c o n c e n t r a te w o u ld p ro v id e a p p ro x im a te ly 141/2% o f th e re c o m m e n d e d a llo w a n c e o f p ro te in (F o o d a n d N u tr i t io n B o a rd , 1 9 7 3 ) f o r a1 2 -y r-o ld c h ild , w h e re a s th e sam e w e ig h t o f th e c o n tr o l c ra c k e rs w o u ld p ro v id e o n ly a b o u t 6 '/>% o f th e R D A . A c c e p ta b le , “ h ig h -p ro te in ” c ra c k e rs can b e m a d e b y re p la c in g p a r t o f th e w h e a t f lo u r w ith a c o tto n s e e d p ro te in p ro d u c t .
R E F E R E N C E S
A ltsch u l, A .M . 1 9 6 5 . “ P rote ins T h e ir C hem istry and P o litics .” Basic B ooks, In c ., N ew Y o rk .
Barr, A .J . and G o odn igh t, J .H . 1 9 7 2 . “ S ta tis tical A nalysis S ys tem .” D e p t, o f S tatistics, N o rth C aro lina S tate U n iv e rs ity , R aleigh.
Bowes, A . de P. and C hurch , C .F . 1 9 7 0 . “ Fo od Values o f Portions C o m m o n ly U sed ,” 1 1 th ed. J .B . L ip p in c o tt C o ., P h ilade lph ia , Pa.
Bressani, R . 1 9 6 5 . Th e use o f cottonseed p ro te in in hum an foods. F o o d T ech n o l. 19: 1 65 5 .
D im le r, R .J . 1 9 7 1 . P ro d u c tio n and use o f o ilseed proteins. J. A m , O il C hem ists’ Soc. 48: 4 00 .
F o o d and N u tr it io n B oard , N a tio n a l A cadem y o f Sciences—N a tio n a l Research C oun cil.1 9 7 3 . “ R ecom m ended D a ily D ie ta ry A llo w ances, Revised 1 9 7 3 .” N u tr . R ev . 3 1 : 3 9 4 .
L a m b o u , M .G ., Shaw , R .L . , Decossas, K .M . and V ix , H .L .E . 1 9 6 6 . C o ttonseed ’s ro le in a hungry w o rld . E con. B o tany . 2 0 (3 ) : 2 5 6 .
M a rtin e z , W .H ., B erard i, L .C . and G o ld b la tt,L .A . 1 9 7 0 . P o ten tia l o f cottonseed: p ro d ucts, com position , and use. T h ird In te rn a tio n a l Congress o f F o o d Sci. & Techno l. S O S /7 0 , W ashington, D .C .
W a tt, B .K . and M e rr ill, A .L . 1 9 6 3 . “ C om posit io n o f Fo ods .” A g ric u ltu ra l H an d b o o k N o . 8. U .S . G o vernm ent P rin tin g O ffice , W ashington, D .C .
Ms received 1 1 /2 5 /7 3 ; revised 2 /1 2 /7 4 ; accept- ed 2 /1 8 /7 4 .________________________ ______________
The w o rk rep orted in this paper was supp o rte d in p a rt by a grant fro m the U n io n O il M ill, M o n ro e , Louisiana.
D r. A lle n Johnson and D r. R ic h a rd H o w e , Louisiana Tech U n iv e rs ity , are acknow ledged fo r th e ir assistance in statistical in te rp re ta tio n o f the data; M rs. Janet W rig h t, L o u is ia n a Tech U nivers ity , fo r her assistance in p rep ara tio n o f th is paper; and M rs. W ild a H . M a rtin e z , U S D A S outhern R eg ional L a b o ra to ry , fo r her cooperatio n in supp lying cottonseed p ro te in products used in th is study.
Based on a thesis subm itted b y Lo rra in e G . Staats in p artia l fu lf illm e n t o f the requ irem ents fo r the degree o f M aster o f Science in H o m e Econom ics, Louis iana Tech U n iv e rs ity , R us ton , La.

/ BASIC SCIENCE
K. W A R N E R , C. D. E V A N S , G. R . L IS T , B. K. B O U N D Y a n d W. F. K W O L E K '
U S D A N o r th e r n R e g io n a l R esea rch L a b o r a to r y , A R S , P eoria , IL 6 1 6 0 4
PENTANE FORMATION AND RANCIDITY IN VEGETABLE OILS AND IN POTATO CHIPS
INTRODUCTIONR A N C ID IT Y R E S U L T IN G fro m th e o x id a tio n o f lip id s is a p r im a ry c o n c e rn d u rin g s to ra g e o f fa ts a n d fa t-c o n ta in in g fo o d s . O b jec tiv e in s tru m e n ta l te c h n iq u e s to m e a su re ra n c id i ty w o u ld b e u se fu l w h e n s e n so ry e v a lu a tio n p a n e ls a re n o t av a ilab le ; so m e in s tru m e n ta l m e th o d s have b e e n p u b lish e d fo r d e te rm in in g fa t d e te r io r a t io n a n d q u a li ty . N aw ar an d F a g e rso n (1 9 6 2 ) , S ch o lz a n d P ta k (1 9 6 6 ) , H a rtm a n e t al. (1 9 7 0 ) , Ja rv i e t al. (1 9 7 1 ) , D u p u y e t al. (1 9 7 2 ) a n d F io r i t i e t al.(1 9 7 3 ) d e v e lo p e d gas c h ro m a to g ra p h ic (G C ) te c h n iq u e s to e v a lu a te th e q u a li ty o f g ro u n d b e e f , ch eese a n d e d ib le oils. M easu ring d e c o m p o s it io n p ro d u c ts c o u ld in d ic a te th e d eg ree o f ra n c id i ty o f a fo o d .
F in d in g s b y H o rv a t e t al. (1 9 6 4 ) w ith m e th y l l in o le a te a n d b y S elk e e t al.(1 9 7 0 ) w ith so y b e a n o il sh o w th a t s a tu ra te d h y d ro c a rb o n s a rise e a rly d u rin g a u to x id a tio n w h e n a ld e h y d e s a re e i th e r a b se n t o r n o t d e te c ta b le . E vans e t al.(1 9 6 7 ) r e p o r te d th a t p e n ta n e is th e p re d o m in a n t sh o r t-c h a in h y d ro c a r b o n to a rise th ro u g h th e rm a l d e c o m p o s it io n . C o rre la tio n s o f f lav o r sco re s a n d p e n ta n e fo rm a tio n h av e b e e n u se d to d e te rm in e ra n c id ity o f o ils a f te r d ire c tly in je c tin g th e o ils o n a G C c o lu m n (E v an s e t a l., 1 9 6 9 ; Ja rv i e t a l., 1 9 7 1 ) . B u t d e te r io ra t io n s tu d ie s o f so lid fo o d s re q u ire an a ly s is o f h e a d sp a c e gases. W e h av e fo u n d s ig n ific a n t c o rre la t io n s b e tw e e n th e a m o u n t o f p e n ta n e d e te c te d in h e a d sp a c e b y G C a n d th e ra n c id i ty d e sc r ib e d b y a tr a in e d p a n e l fo r b o th aged v e g e ta b le o ils a n d p o ta to ch ips.
In d ic a to rs o f th e p o te n t ia l s ta b il i ty o f oils an d fa t-c o n ta in in g fo o d s w o u ld be
1 B io m e t r ic ia n , U S D A N o rth C en tra l R egion, A R S , stationed at th e N o rth e rn L ab o ra to ry .
h e lp fu l to fo o d p ro c e sso rs . F u lle r e t al.(1 9 7 1 ) fo u n d th a t p o ta to ch ip s fr ied in o le ic sa f f lo w e r o il, w h ic h h a d an io d in e v a lu e o f 9 0 , w e re as s ta b le to w a rd ra n c id i ty d u rin g a c c e le ra te d s to ra g e as w ere ch ip s fr ie d in h y d ro g e n a te d v e g e ta b le oil. L in o le ic ac id d e riv a tiv e s h av e a m u c h fa s te r ra te o f o x id a t io n th a n o le ic c o m p o u n d s (F u l le r e t a l., 1 9 7 1 ). S in ce m e th y l l in o le a te is th e m a jo r o x id iz a b le f a t ty ac id in fo o d s (L a b u z a e t a l., 1 9 6 9 ) , th e l in o le a te c o n te n t o f o ils c o u ld p o ss ib ly in d ic a te th e s ta b il i ty o f fa ts a n d fa t- c o n ta in in g fo o d s . O u r fla v o r s tu d ie s on p e n ta n e f o r m a tio n in fo o d s h av e sh o w n th a t i t is p o ss ib le to c o rre la te lin o le a te c o n te n t a n d io d in e v a lu e w ith th e in d u c t io n p e r io d fo r p e n ta n e fo r m a tio n in o ils a n d p o ta to ch ip s .
EXPERIMENTALMaterials and storage conditions
Edible vegetable oils included soybean (salad), corn, cottonseed, sunflower (laboratory deodorized), hydrogenated winterized soybean, safflower and high-oleic safflower (redeodorized at the Northern Laboratory). All samples were commercially refined, bleached and deodorized unless specified otherwise. The only sample to contain additives was the hydrogenated winterized soybean oil, which had butylated hydroxytoluene and butylated hydroxy anisole as preservatives and methyl silicone. The safflower and high-oleic safflower oils were combined to give mixtures of the following ratios: 100:0, 75:25, 50:50, 25:75 and 0:100. Potato chips were either purchased locally or provided from experimental runs by the Red River Valley Potato Processing Laboratory, East Grand Forks, MN 56721. These chips had been fried in corn oil, hydrogenated vegetable oil with preservatives or a 70% cottonseed oil/30% corn oil mixture. The linoleate content of the oils and of oil extracted from the potato chips was measured by standard GC methods (Cowan et al., 1971). Their iodine values were then calculated from GC data.
The oil and chip samples were stored in16-oz wide mouth glass jars. Lids were fitted with rubber serum caps to facilitate headspace sampling. The samples were stored at 60° C in a forced draft oven and were tested periodically for pentane in the headspace. In each jar 60g of chips were placed for storage and taste panel evaluation. Oils were stored in two ways. For oils to be tasted in addition to pentane measurement, 150g of oil were placed in each jar. During storage, the jars were shaken twice a day. For oils which were tested for pentane development only, 50g were placed in each jar along with six strips of 7 in. X 1 in. filter paper folded accordion style. Jars were shaken to saturate the paper at the beginning of storage. Headspace vapor analyses
Analyses were made with an F&M 1609 GC equipped with a flame ionization detector. The column was a 4 ft x 1/4 in. aluminum tube packed with 80/100 mesh Microtek alumina as described by List et al. (1965). Standards of 1 ppm of pentane in nitrogen were run on the column before and after each day’s samples were run. The amount of pentane in the head- space (ppm) was calculated from the sample’s peak height in proportion to the height of the standard. The detection limit for pentane by this method is about 0.02 ppm. For each sampling, 1 ml of headspace gas was injected onto the column.Sensory evaluation
An 18-member trained panel evaluated both chips and oils. Samples were tasted immediately after pentane measurement. Oils were scored on a 1 0 -point scale with 1 0 as excellent or bland and 1 as bad or as having a strongly deteriorated flavor. Chips were scored on a similar scale with 1 0 as excellent or as having a good potato chip flavor and 1 as having a strongly deteriorated flavor. The number of rancid descriptions for both the chips and oils is expressed as a percentage of the total number of panel members giving this response.Moisture content of potato chips
The effect of moisture content of potato chips on pentane formation was tested. A desiccator with 30% relative humidity and a
V o lu m e 3 9 ( 1 9 7 4 ) - J O U R N A L O F F O O D S C I E N C E - 7 6 '1

7 6 2 -J O U R N A L O F FO O D S C IE N C E -V o lu m e 3 9 (1974)
Table 1—Flavor scores, percentage of taste panel giving rancid descriptions and ppm of pentane in safflower oils
Days storage at 60° C
Safflower oil50% Safflower oil/50% high-
oleic safflower oil25% Safflower oil/75% high-
oleic safflower oil
Flavorscore
Ranciddescriptions
(%)Pentane(ppm)
Flavorscore
Ranciddescriptions
(%)Pentane(ppm)
Flavorscore
Ranciddescriptions
•:%)Pentane(ppm)
0 7.4 7 0 7.6 7 0 7.9 7 0
3 3.6 8 6 0.08 7.5 28 Trace 5.7 64 0.044 4.3 87 0.08 6.4 47 0 . 0 2 6 . 0 47 0.056 4.3 92 0.18 5.9 54 0.059 4.7 92 0.09
vacuum oven gave chips with moisture contents of 3.8 and 0.95%, respectively. The moisture content (2 %) of a third set of chips was measured in the samples as received. All samples were measured for moisture content after vacuum oven drying. Pentane formation was periodically measured in the headspace of 60-g samples stored in glass jars.
RESULTS & DISCUSSIONP entane form ation and rancid ity o f o ils
Flavor eva lu ation s and pen tan e form atio n o f m ixtures o f sa fflow er and high- o le ic sa fflo w er o ils are given in Table 1. A linear correlation o f 0 .7 9 (sign ifican t at th e 99% lev e l) was ca lcu lated for th e percen tage o f rancid descr ip tion s given by th e panel at various levels o f pen tan e in th e headspace o f th e oils. T he correlation c o e ff ic ie n t is 0 .9 5 i f results are om itted for the m ixture o f 50% safflow er/50% high -o le ic sa fflo w er o ils stored 6 days at 6 0 °C . F igure 1 sh ow s the data w ith this d a y ’s results o m itted . P entane form ation
was un u su a lly fast for th is sam ple in c o m parison w ith th e others.
Evans et al. (1 9 6 9 ) and Jarvi et al.(1 9 7 1 ) fo u n d correlations b etw een pen tane and flavor scores and b etw een pentane and p erox id e values. T hese o ils w ere d irectly in jected o n a GC co lu m n . Head- space sam pling has advantages over in jectin g the sam ple d irectly o n to the co lu m n , w here heat d eterioration occurs, because co m p o sitio n o f headspace gases is a m easure o f the actual o il q u ality . B esides headspace gas analysis is a m ore direct and sim pler m eth od . Correlating rancid descr ip tion s w ith pen tan e form atio n provides a m ore sp ec ific in d ex in d eterm in ing rancid ity than do flavor scores or p erox id e values. F or fresh o ils in w h ich n o pentan e was d e tec ted , 7% o f th e panel gave rancid d escrip tion s. This 7% represents a m in im um bias o f the panel since th e sam e ind ividuals do not report rancid ity in all sam ples. R an cid ity is easily co n fu sed w ith sta leness, and in the term in o lo g y o f a few tasters, the
sam ples w ere e ith er fresh or rancid.Sam ples w ith as litt le pentan e as 0 .0 8
ppm w ere described as rancid b y 90% o f the panel. M ore than 0 .0 8 ppm o f p en tane neither increased the nu m b er o f ran cid descr ip tion s sig n ifica n tly nor decreased th e flavor score m uch further. In the o ils stu d ied , 0 .0 2 ppm o f pen tan e in th e headspace is en o u g h to decrease the flavor score sign ifica n tly and to have 50% o f th e panel describe th e sam p le as rancid. If sam ples have at least 0.1 ppm o f p en tan e, there is n o d o u b t that th e oil is rancid.
S ign ificant correlations b e tw een rancid d escrip tion s and ppm o f pen tan e p o in t m ore sp ec ifica lly to pen tan e as an in d ex o f prod u ct qu a lity for stored sam ples than flavor score w h ich in c lu d es poor qu ality characteristics o th er than rancidity .
Pentane form a tio n and rancid ity o f p o ta to chips
Flavor evaluation and p en tan e m eas-
Pentane in Headspace, ppm
Fig. 1—C o rre la tio n b e tw e e n p e r c e n ta g e o f th e ta s te p a n e l g iv in g ra n c id d e s c r ip tio n s a n d vario u s le v e ls o f p e n ta n e in h e a d sp a ce gas o f m i x tu re s o f s a f f lo w e r a n d h ig h -o le ic s a f f lo w e r o ils.
F ig. 2 —R e la tio n s h ip o f p e r c e n ta g e o f ta s te p a n e l g iv in g ra n c id d e s c r ip t io n s a n d o f d e v e lo p m e n t o f p e n ta n e w ith d a y s o f s to ra g e a t 6 0 ° C fo r p o ta to c h ip s in glass jars. C ircles d e n o te r a n c id d e sc r ip tio n s , tr iang les d e n o te p e n ta n e c o n c e n tr a tio n .

P E N T A N E A N D R A N C ID IT Y IN O ILS A N D C H IP S - 763
Standard Pentane 1 ppm V/V C5
24 Days
C5I
Fig. 3 —P e n ta n e d e v e lo p m e n t in th e h e a d sp a ce gas o f p o ta to c h ip s s to r e d a t 6 0 ° C as m e a s u r e d b y gas c h r o m a to g ra p h y . P ea k id e n t i f ic a t io n : 1, m e th a n e ; 2 , e th a n e ; 3 , p r o p a n e ; 4 , b u ta n e ; a n d 5, p e n ta n e .
u re m e n t fo r aged p o ta to c h ip s f r ie d in c o rn o il a re p lo t te d in F ig u re 2. A t 2 0 d ay s o f s to ra g e , 0 .0 3 p p m o f p e n ta n e w as m e a su re d in th e h e a d sp a c e w ith 69% o f th e p a n e l d e sc r ib in g th e sa m p le as ra n c id . T h ree a d d it io n a l d a y s o f s to ra g e b ro u g h t th e p p m o f p e n ta n e to 0 .0 8 w ith 100% o f th e p a n e l g iv ing th e c h ip s ra n c id d e sc r ip tio n s . C h ips s to re d fo r 2 4 a n d 25 d a y s a t 6 0 °C w ere n o t ta s te d b e c a u se o f th e ir s tro n g ra n c id o d o r , a n d n o d o u b t a ll th e p a n e l w o u ld h av e d e sc r ib e d th e m as ra n c id . A se c o n d series o f c h ip s fr ie d in a
m ix tu re o f 70% c o tto n s e e d o il/3 0 % c o rn o il w as e v a lu a te d in the sam e w ay w ith s im ila r re su lts . B e fo re p e n ta n e d e v e lo p e d th e c h ip s w ere d e sc r ib e d p r im a r i ly as s ta le . T h e re w as a g ra d u a l in c re a se in th e n u m b e r o f ra n c id d e sc r ip tio n s g iven as s to ra g e c o n tin u e d . A s so o n as p e n ta n e w as d e te c te d in th e h e a d sp a c e th e r e w as a s ig n ific a n t in c re a se in th e p e rc e n ta g e o f th e p a n e l giving ra n c id d e s c r ip t io n s - f r o m 31 to 69% . T h e f lav o r sc o re w as s ig n ific a n tly lo w e re d —fro m 5 to 3 .7 . O nce p e n ta n e b eg a n to fo rm , i t a c c u m u la te d
ra p id ly in th e h e a d sp a c e . B ecau se p e n ta n e seem s to c o in c id e w ith r a n c id i ty o f p o ta to ch ip s , its f o r m a tio n c o u ld b e u se d to e v a lu a te o b je c tiv e ly th e fla v o r q u a li ty o f s to re d ch ip s o n a n e x p e r im e n ta l basis.
F ig u re 3 sh o w s th e d e v e lo p m e n t o f p e n ta n e in th e h e a d sp a c e gas o f p o ta to ch ip s s to re d a t 6 0 C. O n ly tra c e s o f p e n ta n e a re sh o w n f o r sam p le s s to re d f ro m 0 to 2 2 d ay s . A t 23 d ay s a p ro m in e n t p e a k fo r p e n ta n e is o b se rv e d . A f te r 25 d a y s , a s tro n g p e n ta n e p e a k o c c u rs , a n d w ell- re so lv e d p e a k s a re a lso easily d isc e rn e d fo r each o f th e lo w e r h y d ro c a r b o n h o m o lo g s .
L in o le a te c o n te n t a n d io d in e va lue vs. p e n ta n e fo r m a t io n
F o r th is s tu d y , o ils w ere s a tu ra te d o n f i l te r p a p e r s tr ip s as d e sc r ib e d p rev io u sly . T h e o ils d e v e lo p e d p e n ta n e in th e h ead - sp ace o f th e ja r s a t a s lig h tly fa s te r ra te th a n d id th e o ils p la c e d in th e ja r s w ith o u t p a p e r . In c re a se d su rfa c e a re a o f th e o il to a ir p lu s tr a c e a m o u n ts o f p ro o x id a tiv e c o n ta m in a n ts in th e p a p e r seem th e p ro b a b le cau se .
P e n ta n e fo r m a tio n b y v a rio u s aged o ils is sh o w n in F ig u re s 4 a n d 5. T h e lin o le a te c o n te n t a n d io d in e v a lu e o f e a c h o il h av e b e e n p lo t te d ag a in s t th e in d u c t io n p e r io d , w h ich is th e n u m b e r o f d a y s o f s to ra g e a t 6 0 C f o r a sa m p le to re a c h a n a rb i tra ry p e n ta n e level o f 0 .3 5 p p m . S am p les w ith th is a m o u n t o f p e n ta n e in th e h e a d sp a c e are d e sc r ib e d as d e f in ite ly ra n c id b y o u r ta s te p a n e l. T a b le 2 c o n ta in s a l is t o f th e l in o le a te c o n te n t a n d io d in e v a lu e o f each o il te s te d . In th e v e g e ta b le o il series sh o w n in F ig u re 4 , h y d ro g e n a te d w in te r iz e d so y b e a n o il is th e m o s t s ta b le to p e n ta n e f o r m a tio n fo l lo w e d b y c o rn , c o t to n seed , s o y b e a n , su n f lo w e r a n d sa f flo w e r
Fig. 4 —C o rre la tio n o f b o th l in o le a te c o n te n t a n d io d in e va lue w ith th e d a y s o f s to ra g e a t 6 0 ° C re q u ire d to d e v e lo p 0 . 3 5 p p m p e n ta n e fo r s ix d i f f e r e n t veg e ta b le o ils.
____ 1_________I_________I-------------0 2 E 10 14
Induction Period |Aged at 60°C|, days
Fig. 5 —C o rre la tio n o f b o th lin o le a te c o n te n t a n d io d in e va lue w ith th e d a y s o f s to ra g e a t 6 0 ° C r e q u ir e d to d e v e lo p 0 .3 5 p p m p e n ta n e fo r s a f f lo w e r /h ig h -o le ic s a f f lo w e r o il m ix tu r e s .
Storage at E0°C. days
Fig. 6 —R e la tio n s h ip s o f l in o le a te c o n te n t o f s a f f lo w e r /h ig h -o le ic s a f f lo w e r o il m ix tu r e s to th e n u m b e r o f d a y s o f s to ra g e a t 6 0 ° C req u ired to d e v e lo p va rio u s a m o u n ts o f p e n ta n e .

7 6 ^ J O U R N A L OF FO O D S C IE N C E -V o lu m e 3 9 (1974)
oils in that order. H ydrogen ated w in terized so y b ea n o il w ith a lin o le a te co n ten t o f 35% to o k 3 8 days o f storage at 6 0 °C to reach 0 .3 5 ppm o f p entan e, whereas th e sa fflo w er o il w ith 78% lin o le a te to o k on ly 2 days. T he correlation b etw een lin o lea te c o n te n t and days o f storage to reach 0 .3 5 ppm o f pen tan e w as 0 .8 7 , w h ich is sign ifican t at the 95% level.
In m ixtures o f sa fflo w er and h igh -o le ic sa fflow er o ils (F igu re 5 ), th e percentage lin o lea te in each sam ple w as p lo tted against the in d u c tio n period . T he correlatio n c o e ff ic ie n t (0 .9 8 ) w as sign ifican t at th e 99% level. S ign ifican t correlations w ere also ob ta in ed b y p lo ttin g the io d in e value o f th e o ils against th e in d u c tio n period fo r th e six d ifferen t vegetab le oils and for th e sa fflo w er/h ig h -o le ic sa fflow er o il m ixtures.
A p paren tly th e in d u c tio n period for pentan e fo rm a tio n is n o t a ffec ted by lin o lea te c o n te n t a lone. A n y factor that in flu en ces o x id a tio n a lso a ffec ts pentane form ation . T hree o f th e vegetab le o ils te s te d —so y b ea n , c o tto n se ed and c o r n - have a p p ro x im a te ly the sam e lin o lea te c o n te n t, bu t their in d u c tio n periods range from 8 to 24 days. Such factors as prior o x id a tio n , ligh t, o x y g e n , m eta l co n ta m in a tio n , to co p h ero ls , added a n tiox id an ts and ch elates in th e o il all co n tr ib u te to th e stab ility or in sta b ility o f an o il. T he sa fflo w er/h ig h -o le ic sa fflo w er o il series w as a m ore co n tro lled te st becau se it had few er variables, o ther than d ifferen ces in lin o lea te co n ten t, than did th e series w ith th e six d ifferen t vegetab le oils.
Figure 6 relates the lin o lea te c o n te n t o f th e o ils to th e num ber o f days storage required to develop various am ou n ts o f p entan e. A general secon d degree equatio n was f it te d to th e data b y least squares. T he resu ltin g response surface provides pred icted levels o f pentan e based on: A ctual am ou n ts o f pentan e m easured
Fig. 7 —E f f e c t o f m o is tu r e c o n te n t o f p o ta to c h ip s o n th e n u m b e r o f d a y s o f s to ra g e a t 60° C r e q u ir e d to d e v e lo p various a m o u n ts o f p e n tane.
in th e headspace o f th e sa fflow er/h igh - o le ic sa fflo w er o il m ix tu res, th e lin o lea te c o n te n t o f th ese o ils and th e days o f storage at 6 0 ° C. A m u ltip le correlation c o e ff ic ie n t o f 0 .9 5 (s ign ifican t at the 99% lev e l) was fo u n d b e tw een th e observed p en tan e and th e p en tan e pred icted from the eq u a tio n . The response surface o f Figure 5 sh ow s con to u rs o f co n sta n t pen tan e level. T hese con to u rs in d ica te h o w m uch pen tan e w ill have form ed in a given o il w ith a certain lin o le a te c o n te n t after a sp ec ified num ber o f storage days.
F or o ils w ith h igh lin o lea te co n ten t, o n ly a fe w days are need ed to develop p en tan e, w hereas it takes s ig n ifican tly longer for o ils w ith lo w lin o lea te . By lo o k in g at a given day o f storage, the e ffe c t o f lin o lea te c o n te n t on pen tan e fo rm a tio n can be seen in F igure 6. A t 7 days o f storage, th e pred icted am ou n t o f p en tan e to develop in an o il w ith a lin o lea te c o n te n t o f 63% is 3 .2 ppm ,
w hereas o n ly 0 .0 8 ppm is e x p e c te d to form in an o il w ith 17% lin o lea te . Statisti-' cally , an e ig h tfo ld d ifferen ce is needed b etw een a m o u n ts o f p en ta n e fo rm ed in tw o sam p les b efore sign ifican t variations in p en tan e a ccu m u la tio n can be seen . For ex am p le, th e oil w ith 55% lin o le a te develop s a p p rox im ate ly 1 .6 pp m o f p en ta n e after 7 days o f storage, w h ich is sign ifican tly faster than th e 0 .2 ppm p rodu ced b y the o il w ith 27% lin o lea te . T he low er the lin o lea te c o n te n t th e longer th e o il is stab le to p en tan e fo rm a tio n . If th e percen tage lin o lea te o f a p ro d u ct is k n o w n , its p o ten tia l s ta b ility in rela tion to sim ilar fo o d s m ight be pred icted .
L in o lea te c o n te n t o f p o ta to ch ip fry in g o ils and pen tan e form a tio n
T able 3 sh o w s th e e f fe c t o f lin o le a te c o n te n t o f o ils used to fry p o ta to chips o n th e storage sta b ility o f th e chips. Chips fried in o ils w ith a lin o le a te c o n te n t a b ou t 60% are less stab le to p en tan e fo rm a tio n th an ch ips fr ied in h y d ro genated vegetab le o il w ith o n ly 8% lin o lea te . T he e ffe c t o f prior han d ling b efore storage can be seen in data for ch ips fried in a m ix tu re o f c o tto n se ed and corn o ils and in tw o d ifferen t lo ts o f corn o il. A d ifferen ce o f 12 days o f acce lerated sto r age ex is ts b e tw e en ch ips fried in th e c o tto n se ed and corn o il m ix tu re w h ich w ere aged at 6 0 ° C w h en th e y w ere fresh and th e sam e chips aged after be ing held at —17 C for 4 m o n th s. A lso , pen tan e form a tio n varies becau se o f d ifferen ces in lo ts o f ch ips, as sh o w n in T able 3 for chips fried co m m ercia lly in corn oil. T hese w ere purchased several w eek s apart in lo ca l m arkets. D ifferen ces in the am o u n t o f t im e to form p en tan e in the headspace o f th ese ch ips probab ly can be attrib uted to variation in m oistu re c o n ten t. R esearch b y Labuza e t al. (1 9 6 9 )
Table 2—Linoleate content and iodine value of seven different vegetable oils and of three safflower/high-oleic safflower oil mixtures
OilsLinoleatecontent
Iodinevalue
Vegetable oilsSafflower 78 146Sunflower 73 140Soybean 55 135Corn 59 125Cottonseed 60 114Hydrogenated soybean 35 111High oleic safflower 17 94
Safflower/high-oleic safflower oil mixtures75% Safflower/25% high-oleic safflower 63 13350% Safflower/50% high-oleic safflower 48 12025% Safflower/75% high-oleic safflower 32 107
Table 3—Pentane formation of potato chips fried in oils with various linoleate content
Frying oilLinoleatecontent Lot
Days of storage at 60° C
for 0 . 0 2 ppm pentane to form
in headspace of the chips
Hydrogenated vegetable oilawith preservatives 3 50
70% Cottonseed oil/30% corn oil15 57 14c24d26d
Corn oila 58 A 12B 20
k L in o le a te c o n te n t d e te rm in e d f ro m o il e x t ra c te d f ro m th e ch ip s L in o le a te c o n te n t d e te rm in e d on o il b e fo re c h ip s w e re fr ie d
a S to re d w h en fre shQ S to re d a f te r being he ld 4 m o n th s a t —1 7 ° C

P E N T A N E A N D R A N C ID IT Y IN O ILS A N D C H IP S -765sh ow ed that increasing th e m oisture c o n te n t has an in h ib ito ry e ffe c t on the o x id a tio n o f m eth y l lin o lea te . Q uast and Karel (1 9 7 2 ) fo u n d that in early stages o f o x id a tio n at lo w h u m id itie s th e rate o f o x y g en up tak e is a strong fu n c tio n o f relative h u m id i t y .
Figure 7 co n ta in s results o f du p licate tests co n d u cted to determ ine w h eth er or n o t ch ips w ere a ffec ted b y d ifferen t m oisture levels. T he chips w ere fried in corn oil. P entane form a tio n was slow er in th e sam ple w ith 3.8% m oistu re in com parison w ith th e ch ips w ith 0.95% m oisture.
REFERENCESC ow an, J .C ., M oser, H ., L is t, G .R . and Evans,
C .D . 1 9 7 1 . O rgano leptic and ox id ative s tab ility o f blends o f soybean and peanut oils. J. A m e r. O il C hem . Soc. 48: 8 3 5 .
D u p u y , H .P ., F o re , S.P. and G o ld b la tt, B .A .1 9 7 2 . D ire c t gas chrom atographic exam in atio n o f volatiles in salad oils and shortenings. J . A m e r. O il C hem . Soc. 49: 8 0 A , A bstr. 34.
Evans, C .D ., L is t, G .R ,, D o lev , A -, M cC o nne ll, D .G , and H o ffm a n , R .L . 1 9 6 7 . Pentane fro m therm al decom position o f lipoxidase- derived products. L ip id s 2 (5 ): 4 3 2 .
Evans, C .D ., L is t, G .R ., H o ffm a n , R .L . and M oser, H .A . 1 9 6 9 . E d ib le o il q u a lity as measured by th e rm a l release o f pentane. J. A m e r. O il C hem . Soc. 4 6 : 5 0 1 .
F io r it i , J .A ., K a n u k , M .J . and Sim s, R .J . 1 9 7 3 . C hem ical and organo leptic properties o f ox id iz in g oils. J. A m e r. O il C hem . Soc. 50: 8 2 A , A bstr. 2 7 .
F u lle r , G ., G uadagni, D .G ., W eaver, M .L ., N o tte r , G . and H o rv a t, R .J . 1 9 7 1 . Eva luat io n o f oleic s a fflow er o il in fry in g p o ta to chips. J. F o o d Sci. 3 6 : 43 .
H artm an , K .T . , Rose, L .C . and V andaveer, R .L .1 9 7 0 . A sim ple techn ique fo r determ in ing the G L C p ro file o f vo la tile com pounds in vegetable oils. J. A m er. O il C hem . Soc. 47: 7 9 A , A bs tr. 20.
H o rva t, R .J ., Lane, W .G ., N g , H . and Shepard, A .D . 1 9 6 4 . S aturated hydrocarbons fro m a u to x id iz in g m e th y l lino lea te . N atu re 203 : 5 2 3 .
Jarv i, P .K ., Lee, G .D ., E rickson , D .R . and B utkus , E .A . 1 9 7 1 . D e te rm in a tio n o f the e x te n t o f ran c id ity o f soybean o il by gas chrom atography com pared w ith peroxide value. J. A m er. O il C hem . Soc. 48: 1 21 .
Labuza, T .D . , T s u y u k i, H . and K are l, M . 1 9 6 9 . K in e tics o f lin o lea te o x id a tio n in m odel systems. J. A m e r. O il C hem . Soc. 46: 4 09 .
L ist, G .R ., H o ffm a n , R .L , and Evans, C .D .1 9 6 5 . Gas solid chrom ato grap hy o f h y d ro carbons on activated a lum in a, J . A m er. O il C hem . Soc. 4 2 : 1 0 5 8 .
N aw ar, W .W . and Fagerson, I.S . 1 9 6 2 . D irec t gas chrom atograph ic analysis as an objective m eth od o f flavor m easurem ent. Fo od Tech- no l. 1 6 (1 1 ): 107 .
Quast, D .G . and K are l, M . 1 9 7 2 . E ffe c ts o f en v iro n m en ta l facto rs on th e o x id a tio n o f p o ta to chips. J. F o o d Sci. 3 7 : 5 84 .
Scholz, R .G . and P tak , L .R . 1 9 6 6 . A gas chrom atograph ic m eth o d fo r m easuring ran c id ity in vegetable oils. J . A m e r. O il C hem . Soc. 4 3 : 5 96 .
Selke, E ., M oser, H .A . and R o h w ed d e r, W .K .1 9 7 0 . Tand em gas chrom atography-m ass spectrom etry analysis o f vo latiles fro m soybean o il. J. A m e r. O il C hem . Soc. 4 7 : 3 93 .
M s received 8 /2 /7 3 ; revised 1 /2 0 /7 4 ; accepted1 / 2 2 / 7 4 . _____________________________________
Presented at the 33rd A n n u al M eeting o f the In s titu te o f F o o d Technologists, M ia m i Beach, F lo rid a , June 10— 1 4 , 1 9 7 3 .
A ckn o w led g m en t is m ade o f assistance by the o il panel th ro u g h o u t these tests and to I . S tein fo r co m p u te r calculations.
Th e m e n tio n o f f irm nam es or trade p ro d ucts does n o t im p ly th a t th e y are endorsed or recom m ended by the D e p a r t m e n t o f A g ricu ltu re over o th e r firm s o r s im ilar products n o t m en tion ed .

ROBERT BECKER, ALFRED C. OLSON, DORIS P. FREDE RICK, SAMUEL KON,MICHAEL R. GUMBMANN and JOSEPH R. WAGNER
USDA Western Regional Research Lab., ARS, Berkeley, CA 94710
CONDITIONS FOR TH E A U TO LYSIS OF ALPH A-GALACTOSID ES AND PHYTIC ACID IN C A LIFO R N IA SM ALL WHITE BEANS
INTRODUCTIONSEVERAL com pounds in dried beans are nutritionally unavailable. Humans lack a-galactosidases and )3-D-fructosidases to hydrolyze raffinose, stachyose and ver- bascose (Kuriyama and Mendel, 1917; Gitzelmann and Auricchio, 1965) and phytases required to hydrolyze phytic acid to inositol and partially phosphor- ylated inositol (R apoport et al., 1941). Largely unabsorbed, the a-galactosides pass into the lower intestine where microorganisms ferm ent them contribu ting to the production of flatus (Bergey, 1957; Speck et al., 1970).
Previous work at this laboratory by Kon et al., 1973 explored the autolytic hydrolysis of bean phytic acid and a- galactosides. They found th a t these compounds can be conveniently reduced by incubating beans and bean slurries under certain pH and tem perature controlled conditions. This paper defines these autolysis conditions and presents data showing th a t rats fed autolyzed preparations produced less hydrogen than rats fed unautolyzed preparations.
EXPERIMENTALWHOLE DRY California small white beans or beans ground to 20 mesh in a Wiley Mill were suspended in 10 vol of 0.1M sodium acetate buffer at the incubation temperature. Preparations incubated at pH 3.5, 6.5 and above were adjusted with concentrated HC1 and 12N NaOH, respectively. To retard bacterial growth, 1 ml toluene per liter of buffer was added. The toluene level was maintained by adding half of the initial toluene dose to each reaction flask every 24 hr of incubation. The reaction flasks were covered with parafilm and shaken during incubation. Temperatures were controlled within ± 2°C. Whole beans were ground after incubation. Slurry aliquots were centrifuged and the clear supernatant assayed for total phosphorus, inorganic phosphorus and various sugars. Before the bean slurries were fed to rats, the incubated mixtures were cooked approximately 1 hr and lyophilized. In the case of the whole beans, the suspension was lyophilized and then ground to 20 mesh in a Wiley mill before being fed to rats.
Mono and polysaccharides as well as inositol were determined by gas liquid chromatography of trimethylsilyl derivatives. The aliquot supernatants were lyophilized to dryness and silylat- ed overnight at room temperature with Tri-Sil reagent (Pierce Chemical Co. #48997A). Mono and disaccharides were run on a Varian Aerograph 15200C gas-liquid chromatography unit
with flame ionization detector. This unit was equipped with 1/8 in. stainless steel columns 5 or 10 ft long, packed with 3% OV17 on 100/200 Varaport 30 and temperature programmed for 4°C/min rise between 150°C and 240°C. Inositol and the polysaccharides were run on a F and M model 810 gas-liquid chromatography unit with flame ionization detectors. This unit was equipped with 1/4 in. stainless steel column 3 ft long packed with 3% OV-1 on Chromosorb W(HP) 80/100 (Varian Aerograph) and temperature programmed for 20°C/min rise between 180° and 340°C (Delente and Laden- burg, 1972). Sugars were identified by comparison of retention times of peaks with those of known sugars run under the same conditions. The amounts of the sugars present were determined from peak areas using standard curves constructed from the areas produced by known amounts of sugars. Inositol was determined by both systems and served as a cross check. Total and inorganic phosphate were determined by the phosphomolybdate method of Allen(1940).
The number of microorganisms present in the incubating bean preparations was determined by spread plating, in duplicate, 0.01 ml aliquots of the appropriate dilutions on Trypti- case Soy agar plates. The seeded plates were incubated for 24 hr at a temperature identical
to that of the corresponding experimental bean preparation, and then counted. The plates were enclosed in polyethylene bags to prevent desiccation at the higher temperatures.
The method of Gumbmann and Williams (1971) was used to follow the hydrogen produced by rats fed bean diets. In this method, a rat is placed in an enclosed life support system with either a basal or test diet, and the amount of hydrogen produced after 16 hr is measured by gas chromatography and compared to that produced by feeding a diet containing casein or untreated beans.
Bean slurries were used for essentially all of this work to facilitate the extraction and determination of the initial sugars and to provide for substrate availability. Experiments with whole beans gave similar autolytic changes to those observed with the slurries which indicated that substrate enzyme proximity was not a problem.
RESULTS & DISCUSSIONCALIFORNIA small white beans contained about 3.7% stachyose and 0.4% raffinose as determ ined by our prodecure. Optim um tem perature
The effect o f tem perature on the autolysis reaction is shown in Figure 1. At
Fig. 1—Effects o f incubation temperature on the disappearance of stachyose IIAl and raffinose (1BI and the appearance of sucrose <1CI and galactose (1D) at pH 5.2.
7 6 6 - J O U R N A L O F F O O D S C I E N C E - V o l u m e 3 9 ( 1 9 7 4 )

A U T O L Y S I S O F B E A N S - 7 6 7
am bient tem perature (25°C) the stachy- ose concentration shows only a small decrease in 24 h r and a 35% drop after 48 hr (Fig. 1 A). The usual process of soaking beans overnight at room tem perature results in only small stachyose losses. As the tem perature is increased, the rate reaches a broad maxim um between 45° and 65°C. At 75°C, the oligosaccharides are n o t hydrolyzed and there is no appearance of the simpler sugars. Between 45 and 65° roughly 30% of the oligosaccharides are lost in 9 hr, 50% in 24 hr and 70% in 48 hr. The loss o f raffinose parallels that of stachyose. The concentration of raffinose is only 1 / 1 0 th a t of stachyose (Fig. IB). As stachyose and raffinose disappear, the concentration of sucrose and galactose increases (Fig. 1C, ID). Typically the moles of galactose recovered corresponded to approxim ately 85% of the moles o f stachyose th a t disappeared. There was no indication of any verba- scose in either unautolyzed or autolyzed California small white bean samples. GLC determ inations of know n am ounts of ver- bascose established the minimum detectable level of this com pound at 0.05% with these conditions. In addition to the appearance of galactose and sucrose, we also observe increasing am ounts of inositol (Fig. 2).
The optim um tem perature for form ation of inositol is 3 5 —45°C. Less inositol is form ed at 25 and 55 C, almost no inositol is form ed at 65 C, and the auto- lytic enzymes are inactivated at 75°C. It takes over 48 hr at 35° or 45°C to approach the point where no more inositol is formed.
Figure 3 shows the appearance of inositol and inorganic phosphate and their relationship to phytic acid. The to ta l am ount o f phosphate was used to calculate the maximum am ount of phytic acid which could be present. It was assumed tha t each mole of phytic acid was com pletely hydrolyzed during autolysis to liberate 6 moles of inorganic phosphate and 1 mole of inositol. The am ount of hydrolyzed phytic acid was then calculated and p lo tted from determ inations of bo th the moles of liberated inorganic phosphate and inositol. Both curves indicate tha t phytic acid decreases during incubation. The difference between the two curves may be due to phytic acid which has been partially hydrolyzed to give inorganic phosphate but which has no t yet liberated inositol.
In 24 hr, 65% o f the inorganic phosphate is liberated and 43% of the inositol. After 48 hr, the inorganic phosphate climbs to 8 8 % and the inositol to 77%.
pH OptimumThere is a broad optim um pH for the
disappearance of stachyose (Fig. 4). The useful range extends from about pH4 .5 —6.0. Raffinose exhibited a similar pH
optim um . The appearance of galactose coincides with the disappearance of stachyose and raffinose.
The appearance of inositol also occurs over a broad pH range (Fig. 5). The optimum pH 5.2 we observed agrees with literature values for the hydrolysis of phytic acid by wheat phytase (Peers,1953).
Substrate-product concentration effects
Stachyose, raffinose, stachyose plus raffinose, or galactose were added to a bean slurry and their effects on hydrolysis observed (Fig. 6 ). Figure 6 A shows the autolytic changes in stachyose concentration when other sugars were added to the slurry. Added galactose or raffinose caused negligible changes in the course of the disappearance of stachyose. The disappearance of the added stachyose and stachyose plus raffinose indicates the presence of enough enzyme to hydrolyze these added am ounts with no gross changes in rate.
Added galactose did not influence the disappearance of raffinose (Fig. 6 B). Added raffinose was rapidly hydrolyzed as was the initial part of the added raffinose plus stachyose. When stachyose or stachyose plus raffinose was added at 24 hr, the observed increase in raffinose at 48 hr strongly suggests that raffinose is produced during stachyose degradation. The slower rate o f raffinose hydrolysis in the control slurry in Figure 6 B is probably due to the continuous liberation of raffinose as an interm ediate in stachyose hydrolysis.
Galactose measurem ents are shown in Figure 6 C. Added galactose did not cause major changes in galactose production or the disappearance of stachyose and raffinose. This indicates a lack of product inhibition at these levels. There was no evidence th a t significant am ounts of galactose are being consumed during the autolysis.
Inositol measurem ents are shown in Figure 6 D. Adding other sugars had no clearcut effects on inositol production.
Fig. 2 —Effects of incubation temperature on the appearance of inositol at pH 5.2.
0 2 0 4 0
HOURS
Fig. 3—Phytic acid calculated from the appearance of inositol □ and inorganic phosphate • during autolysis at 55° C and pH 5.2. The maximum amount of phytic acid o was calculated from the amount of total phosphate present. (See text for details.)
Fig. 4 - Disappearance of stachyose at varying Fig. 5—Appearance of inositol at different pH's pH's at 55°C. at 55°C after 6 hr autolysis.

7 6 8 - J O U R N A L O F F O O D S C I E N C E - V o l u m e 3 9 ( 1 9 7 4 )
HOURSFig. 6—Effects of added substrates and products on the disappearance of stachyose (6A) and raffinose (6B) and appearance of galactose (6C) and inositol (6D) during autolysis at 55°C and pH 5.2. The substrates and products added during incubation are designated on the individual curves.
Activity vs. stability
This experim ent was designed to find the best conditions for good enzyme activity and stability (Fig. 7). a-Galactosi-
dase was inactive at 75°C, but we d idn’t know if some heat inactivation occurred at slightly lower tem peratures but was masked by increased enzyme activity. To show if this occurred, about a tenfold
Fig. 7—Losses in enzyme activity on prolonged autolysis.
excess of raffinose was added at zero time to one set o f samples, and a similar am ount at 120 hr to another set (Fig. 7). The samples incubated for 120 hr show a d ea r loss of activity at 6 5 °C and a possible activity loss at 55°C. Enzym e activity at 35°C and 45°C was unaffected.
Rat hydrogen productionThe system devised by Gum bm ann
and Williams (1971) for collecting and sampling hydrogen produced by rats fed controlled diets was used in these experiments. The hydrogen produced was assumed to be an indicator of the to ta l am ount of flatus. The correlation of the hydrogen produced by rats with hum an flatus production from a similar diet will be published elsewhere.
Figure 8 shows that autolysis, as measured by the disappearance of the a-oligo- saccharides, significantly reduces rat hydrogen production. Restoring the am ount of autolyzed stachyose and raffinose to a bean preparation raised the production of hydrogen by rats to slightly above the original level. Extrapolation of the curve in Figure 8 to 0% «-oligosaccharides indicate some other com ponent- (s) may also cause the production of hydrogen.
Preliminary experim ents w ith sterile, m onitored preparations dem onstrated that the autolysis was due to endogenous enzymes. Incubation of boiled samples, with or w ithout the subsequent addition of toluene resulted in nc changes in the initial levels of stachyose, raffinose, inositol or inorganic phosphorus. The changes observed during incubation of nonboiled samples are thus due to bean enzym e activity. Toluene was added as a preservative to simplify sample preparation and reduce the need for frequent m onitoring of bacterial growth. Typically, the initial bacterial contam ination was very low, probably less than 1 0 per ml of solution. Addition of toluene perm itted autolysis for 24 hr with no significant bacterial
% ALPHA-OLIGOSACCHARIDES IN DIETFig. 8-Hydrogen produced by rats fed beans autolyzed for different time at pH 5.2 and 55°C. Rat hydrogen was normalized by the value for the control. The bars indicate ranges of values from multiple determinations.

A U T O L Y S I S O F B E A N S - 7 6 9
population increases. Longer incubation occasionally gave counts up to 1 0 4 or 1 0 s bacteria per ml, even with toluene present. These counts did not correlate with noticeable changes in the oligosaccharide disappearance curves, but may correlate with a sour off taste in the final product. The cooked and lyophilized products were initially odorless but on storage in closed containers a toluene-like odor developed. This odor did not influence rat acceptance or consum ption of the samples. Selected autolyzed samples prepared w ithout toluene and m onitored to show no significant m icrobial contam ination gave the same rat hydrogen response to com parable samples prepared with added toluene.
A utolyzed, cooked, lyophilized bacteria free bean preparations tasted sweeter and tended to brown more during cooking than did unautolyzed samples, probably due to the liberation of sugars from
the oligosaccharides. Browning was probably caused by the reaction of these sugars with amino acids. Autolysis undoubtedly influences other bean com ponents besides those reported in this paper. The effect of autolysis on starch and protein and other bean constituents together w ith bean edibility is currently being investigated.
REFERENCES
A lle n , R .J .L . 1 9 4 0 . Th e estim ation o f phosphorus. B ioehem . J. 3 4 B: 8 5 8 .
Bergey, D .H . 1 9 5 7 . “ Bergey’s M an u a l o f D e te rm in a tio n B ac te rio logy .” W illiam s & W ilkins C o., B a ltim o re , M d .
D elen te , J. and Ladenburg , K . 1 9 7 2 . Q u an tita tive d e te rm in a tio n o f the oligosaccharides in d efa tted soybean m eal. J. Fo od Sci. 37: 3 7 2 .
G itze lm a n , R . and A u ric ch io , S. 1 9 6 5 . The hand ling o f soya alpha-galactosides b y a no rm a l and a galactosém ie ch ild . Pediatrics 3 6 (2 ): 2 3 1 .
G u m b m ann , M .R . and W illiam s, S .N . 1 9 7 1 . The qu an tita tive co llec tio n and d e te rm in a tio n o f hydrogen gas fro m the ra t and factors
affec tin g its p ro d u c tio n . Proc. Soe. E x p t. B io l, and M e d . 1 3 7 (4 ) : 1 1 7 1 .
K o n , S ., Olson, A .C ., F re d e ric k , D .P ., Eggling,S .B . and W agner, J .R . 1 9 7 3 . E ffe c t o f d iffe r e n t trea tm ents on p h y ta te and soluble sugars in C a lifo rn ia small w h ite bean (Phaseolus vulgaris). J. F o o d Sci. 3 8 : 2 1 5 .
K u riy a m a , S. and M e n d e l, L .B . 1 9 1 7 . The physio log ical behav ior o f raffinose . J. B io l. C hem . 3 1 : 125 .
Peers, F .G . 1 9 5 3 . The phytase o f w h ea t. B io- chem J. 53: 1 02 .
R a p o p o rt, S ., Leva , E . and G uest, G .M . 1 9 4 1 . Phytase in plasm a and e ry th rocy tes o f various species o f vertebrates. J. B io l. C hem . 1 3 9 : 6 2 1 .
Speck, R .S ., C a llo w ay , D .H . and H ad le y , W .K . 1 9 7 0 . H u m an fecal flo ra under co n tro lled d ie t in tak e . A m . J. C lin . N u tr . 2 3 : 1 4 8 8 .
M s received 1 2 /4 /7 3 ; revised 2 /1 4 /7 4 ; accepted 2 /1 8 /7 4 .__________________________________________
Presented a t the 3 3 rd A n n u al M eeting o f the In s titu te o f F o o d Technologists in M ia m i Beach, F lo r id a , June 1 0 —1 4 , 1 9 7 3 .
We th a n k M rs. M a rio n C . Long fo r the phosphate d e te rm in a tions . D r. R .M . M cC ready fo r his g ift o f verbascose and D r. J .A . G ariba ld i fo r he lp in c o n t r o l l i n g and m o n ito rin g m ic ro b io logical co n tam in a tio n .
R eference to a com pany o r p ro d u c t nam e does n o t im p ly approval o r recom m endatio n of the p ro d u c t by the U .S . D e p t, o f A gricu ltu re to the exclusion o f others th a t m ay be suitable.

L. F. FLORA and R. C. WILEY Food Science Program, Dept, of Horticulture, University of Maryland, College Park, MD 20742
SW EET CORN AROMA, CH EM ICAL COMPONENTS AND R E LA T IV E IMPORTANCE IN TH E O V E R A LL FLA V O R RESPONSE
INTRODUCTIONREPORTS have been published of flavor studies on a number of vegetables, including snap beans (Stevens et al., 1968), peas (Bengtsson and Bosund, 1964; Anonymous, 1971), potatoes (Self, 1967), onions and other members of the genus Allium (Carson, 1967), celery (Gold and Wilson, 1963), cucumbers (Forss et al., 1962; Fleming et al., 1968), bell peppers (Buttery et al., 1969), carrots (Buttery et al., 1968; Heatherbell and Wrolstad, 1971; Heatherbell et al., 1971), cabbage (Bailey et al., 1961), tom atoes (Spencer and Stanley, 1954; Miers, 1966; Nelson and Hoff, 1969; Kazeniac and Hall,1970), and others (Self et al., 1963; Stevens, 1970; Johnson et al., 1971a, b). Stevens (1970) and Johnson et al. (1971a, b) have reviewed the work done on vegetable flavors in recent years. The recent reviews on vegetable flavor, how ever, have not included the flavor chemistry of sweet corn.
Self et al. (1963) measured the relative quantities of the low boiling volatiles present in cooked sweet corn by gas chrom atography. They found relatively high levels of dim ethyl sulfide (DMS), hydrogen sulfide (H2 S) and acetaldehyde and relatively low levels of m ethanethiol, ethanethiol, acetone and m ethanol in the corn. Bills and Keenan (1968) implicated DMS as the com pound characteristic of the aroma of cooked sweet corn. They also found high levels of ethanol in canned corn, but did not observe the mer- captans reported by Self et al. (1963). O ther studies (Williams et al., 1972; Williams and Nelson, 1973) have concentrated on DMS levels in sweet corn.
Assumptions concerning the im portance of the above com pounds in cooked sweet corn aroma have been based on c o n c e n t r a t io n th re s h o ld ratios. No sensory panel work has been reported on cooked sweet corn aroma.
The im portance of flavor in the consumer acceptance of sweet corn has been well docum ented in recent research (Kramer, 1952; Twigg et al., 1956). The United States Grade Standards for canned whole grain sweet corn (Almanac, 1973) give flavor a maximum score of 2 0 out of 100. If one considers the tactual response resulting from the tenderness of the corn as part of the flavor stimulus, this adds 40
points to the flavor score, giving it a possible score of 60 out of 100. Grade standards for frozen whole kernel corn do not include flavor, but tenderness and m aturity may receive a score of 50 out of 100.
The food scientist’s definition of flavor includes taste, odor and tex ture or tactual response as com ponents of flavor. Consequently, it would be useful to know the relative im portance of these com ponent parts in determ ining the overall flavor of cooked sweet corn.
MATERIALS & METHODSTHE CORN used in the evaluations was grown at the University of Maryland Plant Research Farm near Fairland, Md. Five commercially grown cultivars were harvested at stages of maturity covering the range of fancy to standard to insure a good range of samples for sensory panelists and for sensory monitoring and gas chromatographic evaluation. After harvesting, the corn was processed into frozen and canned packs according to established commercial procedures.
Preliminary analysis of ether and other organic solvent extracts of canned sweet corn, presumably comprising the high boiling volatiles, yielded only one or two odorant peaks, neither of which smelled like cooked sweet corn, upon sensory monitoring of the GC column effluent. Thus it was decided that head- space analysis of the cooked corn would be more appropriate for study since this fraction had yielded several odorous peaks that could be related to corn aroma in preliminary runs.
Gas chromatography was employed to separate the low boiling headspace aroma volatiles of 160 samples. An Aerograph 204 gas chromatograph, in conjunction with a Hewlett- Packard Model 3370B digital print-out integrator, was used for the headspace volatiles analysis. After screening several columns, best resolution was obtained using a 2.4m X 3.12 mm stainless steel column packed with 10% SE-30 on 80/100 AW Chrom W. Initial column temperature was 50°C, programmed at 4°C/min after 1 min up to 80°C. Nitrogen carrier gas flow was adjusted to 15 ml/min.
Consistent retention times for the peaks were recorded before sensory monitoring of the column effluent was begun. Once this was accomplished, the hydrogen was cut off to the flame ionization detector and the time at which an odor was detected after injection of a sample could be recorded and compared to the corresponding peak.
Fresh, frozen and canned corn was prepared for sensory monitoring by cooking 400-g samples for 10 min in closed 500 ml Erlenmeyer flasks in boiling water and injecting 1 ml of the headspace into the gas chromatograph. 1-ml gas
samples were also taken for odor evaluation from heated (55°C) closed can samples with the aid of a can piercing unit from Alltech Associates, Inc. (Arlington Heights, 111.).
Individual laboratory panelists were asked to monitor the effluents coming off the column, to indicate when they could detect an odor, and to describe it, if possible. Both fresh, frozen and canned samples in closed flasks and pierced canned samples were evaluated by this procedure.
Peak assignments were based on combinations of retention data, combination gas chro- matography-mass spectrometry (GC-MS), addition of pure compounds to canned samples and observing the peak that increases in concentration, and by smell. GC-MS work was performed in the University of Maryland Dept, of Chemistry’s GC-MS Lab. The GC-MS system consisted of a Varian 2430 gas chromatograph in conjunction with a Dupont Model 21-492 mass spectrometer. The column and GC conditions previously described were also used in these analyses.
Sensory evaluations of 160 samples of fresh, frozen and canned corn were conducted to determine the relative importance of aroma. Panelists were asked to score aroma, sweetness, texture, and overall flavor on the basis of preference on a 0 to 10 scale, 10 being most acceptable. The values from the score sheets were compiled and submitted to stepwise multiple regression computer analysis.
The corn was prepared for the panelists by boiling fresh corn for 10 min, frozen corn for 5 min and bringing canned samples to a boil. Before serving, the com was allowed to cool to 50-60°C. The cooking procedures were designed to simulate those that might be practiced by a typical consumer. The range of 50-60°C for testing gave the fullest flavor sensation during preliminary experiments. The corn was served in covered Erlenmeyer flasks where the headspace aromas were somewhat confined. Mean scores of the panelists per sample were used in the statistical analyses.
RESULTSDetection and identification of aroma constituents
Seven distinct odor notes were detected in the course of the GC effluent monitoring (see Fig. 1). The first of these, which eluted from the column in just under a m inute and had a “ro tten egg” odor, was identified as H2 S. Although H2S did not show up as a peak on the chrom atogram , pure H2S injected onto the colum n also eluted in about 55 sec based on smell. The next no te was detected between 1 1 0 and 1 2 0 sec and had
7 7 0 -J O U R N A L OF FO O D S C IE N C E -V o lu m e 3 9 (1974)

S W E E T C O R N A R O M A C O M P O N E N T S A N D I M P O R T A N C E — 7 T \
a curiously unpleasant, alm ost fecal, sul- furous odor. This was m ethanethiol, also reported by Self et al. (1963). Identity assignment of this peak was confirmed on the basis o f retention tim e and by adding 1 0 0 - 2 0 0 ¡ig of pure m ethanethiol to a pierced can corn sample fitted with a headspace sample and then observing the increase in the size of the m ethanethiol peak.
A fruity aroma was detected just after the m ethanethiol and it seemed to blend into another slightly different fruity note also described as smelling like etha
nol. These fru ity aroma notes were only detected in the headspace from the pierced can corn samples when the concentrations were usually greater than those in the cooking flasks. These odors were identified as acetaldehyde and ethanol, respectively, on the basis of retention data, by observing peak increases with addition of pure substances, and by mass spectral data. The fragm entation patterns of the acetaldehyde and ethanol peaks agreed with standard data (American Petroleum Institu te Project, 1971).
Being detected only rarely at about
Fig. 1—Chromatogram of corn headspace.
2 0 0 sec was another odor with a characteristic sulfur note that was identified as ethanethiol. Im m ediately following this odor was one that was always detected in all samples. This aroma, which had a rather strong but pleasant note and was characterized as being “corny” was due to dim ethyl sulfide. These peaks were confirmed by mass spectral data, by reten tion data and by pure substance addition and observance of increased peak size.
The small peak following DMS between 260 and 300 sec was described as “grainy” or “m usty” in odor and was not identified. It is believed to be responsible for the characteristic background odor associated with canned corn since it occurred almost exclusively in the canned samples. Acetone was reported by Self et al. (1963) and was tentatively identified by retention data and pure com pound addition and peak increase as the small peak im m ediately preceding ethanethiol. Figure 1 shows a GC separation with consistent peaks being num bered. The identities, m ethods of identification and aromas for most of the num bered peaks can be found in Table 1.
The relative concentrations of the volatiles in canned, fresh and frozen corn can be seen in Figure 2. Standard curves were calibrated only for H 2 S and DMS. M ethanethiol and ethanethiol were present in ppb concentrations, although they were not detected in all samples. Acetaldehyde was usually present in concentrations less than 20 ppm. Ethanol was often present in hundreds of ppm. DMS concentrations ranged from 0.43 — 17.0 ppm and H2S was present in the samples at concentrations between 34 and 208 ppb. These values include fresh, frozen and canned sample values.
Relative importance of aroma in determining flavor
Flavor as used in sensory panel work was used to denote the to ta l experience derived from the aroma, sweetness and tex ture of the corn. Multiple regression analysis of the mean sensory panel scores for aroma, tex ture, sweetness and overall flavor and subsequent calculation of standardized partial regression coefficients yielded the relative im portance of the first three factors when overall flavor was used as the dependent variable. Scores of fresh and processed corn were analyzed separately and in com bination.
The R2 value for the fresh corn was a very high 0.963 when tex ture, sweetness and aroma are incorporated into the regression equation to predict overall flavor. Upon calculation of the standardized partial regression coefficients, the relative im portance of tex ture, sweetness, and aroma in predicting overall flavor of fresh sweet corn was 48.6%, 45.8% and 5.6%,

1 1 2 - J O U R N A L O F F O O D S C I E N C E - V o l u m e 3 9 ( 1 9 7 4 )
respectively. These and other summary values are shown in Table 2.
The multiple regression analysis for processed corn included panel scores of both frozen and canned corn. The R2 here, 0.808, was somewhat lower than for the fresh corn. The relative im portance of sweetness, texture and aroma in predicting overall flavor of processed corn was 52.8%, 32.7% and 14.5%, respectively (Table 2).
40 samples of fresh corn were subm itted to panelists and analyzed and 1 2 0 samples of processed corn were subm itted and analyzed. A multiple regression analysis of combined fresh and processed sweet corn probably gives the best overall picture of the influence of sweetness, tex
ture and aroma on overall flavor. An R 2 of 0.856 was obtained here with relative im portance of sweetness, tex tu re and aroma on flavor being 55.1%, 29.9% and 15.0%, respectively (Table 2).
The correlations between sweetness, tex ture and aroma and flavor are recorded in Table 2. Texture and sweetness show relatively high positive correlations with flavor while aroma shows a considerably lower correlation with flavor. Plotting the observations showed that the lack of fit to the regression line was much less for sweetness and tex ture versus flavor than it was for aroma versus flavor. One cause of the greater deviation of observations from the regression line for aroma was probably a lack of precision of the panelists.
DISCUSSION & SUMMARY
IT APPEARS that most of the aroma com ponents in cooked sweet corn are present in the low boiling headspace volatiles fraction. Sensory m onitoring of headspace volatiles is more reliable than monitoring of concentrates simply because headspace analysis avoids artifact form ation which often occurs in concentration techniques and also because the concentration of the flavor volatiles in the headspace would m ore nearly approach those in an aroma com plex experienced by consumers.
Seven com pounds were detected by sensory m onitoring of headspace volatiles and, being present in above threshold concentrations, would logically contrib-
1 0 0 ,0 0 0 —I
T a b le 1 —C h e m ic a l Id e n t i t ie s , m e t h o d s o f id e n t i f ic a t io n a n d a ro m a s o f p e a k s in c o r n h e a d s p a c e ______
P e a k C o m p o u n d M e th o d s o f id e n t i f ic a t io n A r o m a
1 C a rb o n d io x id e G C - M S , r e t e n t io n d a ta2 U n k n o w n3 U n k n o w n 1 0 , 0 0 0 —3 a M e t h a n e th io l R e t e n t io n d a ta , p u re U n p le a s a n t -
c o m p o u n d a d d it io n s u l f u r o u s , fe c a l _4 A c e t a ld e h y d e G C - M S , r e t e n t io n d a ta , F r u i t y -
P u re c o m p o u n d a d d it io n -
6 E t h a n o l G C - M S , r e t e n t io n d a ta . S l ig h t ly f r u i t y . -P u re c o m p o u n d a d d it io n e th a n o l ic
7 A c e t o n e R e t e n t io n d a ta , p u re -
c o m p o u n d a d d it io n8 E t h a n e t h io l G C - M S , r e t e n t io n d a ta , S u lf u r o u s
1 , 0 0 0 —P u re c o m p o u n d a d d it io n9 D im e t h y l G C - M S , r e t e n t io n d a ta . C o r n y in _
s u l f id e P u re c o m p o u n d a d d it io n O-
9 a U n k n o w n M u s t y , g ra in y O00
1 0 U n k n o w n c
ZZ
100 — -
T a b le 2 —S u m m a r y d a ta f o r m u l t ip le re g re s s io n a n a ly s is o f s e n s o ry p a n e l s c o re s
S im p le R e la t iv e p e r c e n tc o r r e la t io n im p o r ta n c e in
V a r ia b le w i t h f l a v o r R 2 o v e ra l l f l a v o r
F re s h T e x t u r e 0 .9 5 8 0 .9 1 9 4 8 .6c o r n S w e e tn e s s 0 .9 5 7 0 .9 6 1 4 5 .8
A r o m a 0 .5 8 4 0 .9 6 3 5 .6
P ro c e ss e d S w e e tn e s s 0 .8 5 7 0 .7 3 4 5 2 .8c o r n T e x t u r e 0 .7 8 5 0 .7 9 1 3 2 .7
A r o m a 0 .5 5 5 0 .8 0 8 1 4 .5F r e s h a n d S w e e tn e s s 0 .8 9 5 0 .8 0 1 5 5 .1
P ro c e s s e d T e x t u r e 0 .8 2 1 0 .8 4 0 2 9 .9c o r n A r o m a 0 .5 9 8 0 .8 5 6 1 5 .0
I
f
!IPi ifM
(
□ F resh
m Canned
E2 F ro zen
£ ‘ 1 2 3 4 5 6 7 8 9 1 0P e a ks
V o l a t i le s
* H2S in ppb, peaks ay i n t e g r a t o r sc o res
Fig. 2—Distribution of volatiles among fresh, canned and frozen cooked sweet corn.

S W E E T C O R N A R O M A C O M P O N E N T S A N D I M P O R T A N C E - 7 7 3
ute to the aroma response of cooked sweet corn. These were hydrogen sulfide, m e th an e th io l, acetaldehyde, ethanol, ethanethiol, dim ethyl sulfide, and another unidentified com pound unique to processed corn and contributing a “musty ” or “grainy” odor note. The sulfur-containing com pounds contribu te most to the aroma of cooked sweet corn. These com pounds in their pure states are repulsive, yet in small concentrations and in com bination w ith each other and other chemicals can give rise to a mild, pleasant aroma. The above com pounds are heat produced and are not present in raw corn.
More than likely, com pounds present in the high boiling volatiles fraction also contribute to the flavor of sweet corn. However, they appear to be of secondary im portance, at least in the area of occurrence as detected by sensory monitoring.
Dimethyl sulfide would appear to be the dom inant character of cooked sweet corn aroma. One reason is simply its high concentration.threshold ratio , or odor unit as described by Stevens (1970) and Teranishi et al. (1971). It is also the one com pound whose odor is most often related to that o f sweet corn.
However, multiple regression analysis of sensory panel scores indicated that sweetness and tex ture were most im portan t in overall flavor and that aroma played a relatively small part. The low correlation of aroma with flavor may illustrate the com plex nature of things. Aroma is not as easily definable as sweetness or texture. It was observed during the sittings tha t the panelists had trouble scoring for aroma. A nother fact of in terest is th a t, although the correlation of aroma w ith flavor was essentially the same for fresh and processed corn, the correlations between sweetness and texture and overall flavor decreased noticeably in processed corn. Texture and sweetness have essentially equal im portance in fresh corn, but sweetness, along with aroma, seems to gain more im portance in processed corn. The R2 decreased from 0.963 for fresh corn to 0.808 for processed corn. Part of this difference is probably due to the difference in sample size betw een the two categories. Only 40 fresh samples were evaluated while 1 2 0 processed samples were evaluated. However, the gap is broad enough to suggest a real difference. The
increased im portance of aroma in processed corn is probably due to its prom inence in canned corn and the greater likelihood of off flavors.
During the course of this study, similar aroma notes were observed between heat processed sweet corn and other heat processed com m odities, namely peas and tom atoes. This would be expected on the basis of work by Self et al. (1963). Thus the relative quantities of the low boiling volatiles com mon to many vegetables would account in part for the different flavors, but similar aroma notes.
Factors such as genetics, m aturity and processing would also be expected to have an effect on the quantitative and/or qualitative nature of the flavor volatiles produced from sweet corn. Even the physical state o f the food system will affect the concentration of aroma volatiles available for sensing. The relationships between the aroma volatiles and panel scores are param ount in determ ining their im portance. However, a question as basic as “What are the quantitative differences necessary to obtain detectable differences?” should also be in the forefront of investigation. The answers to these questions may aid in objectively identifying a “good” corn aroma.
REFERENCES“ Th e A lm anac o f the Canning, F reezing , Pre
serving In dus tries .” 1 9 7 3 . 5 8 th ed. E dw ardE . Judge & Sons, In c ., W estm inster, M d .
A m erican P etro leum In s titu te Research P ro ject4 4 . 1 9 7 1 . “ Catalog o f Selected Mass Spect r a l D a ta .” Therm odynam ics Research C enter, Texas A & M U n ivers ity , College S tatio n , T X .
A non ym ou s. 1 9 7 1 . Th e flavour o f green peas.Fo od Techno l. (A u s tra lia ) 2 3 (5 ): 2 4 3 .
B ailey , S .D ., B azinet, M .L ., D risco ll, J .L . and M c C a rth y , A .I . 1 9 6 1 . Th e vo la tile su lfur com ponents o f cabbage. J. Fo od Sci. 2 6 : 1 6 3 .
Bengtsson, B. and Bosund, I . 1 9 6 4 . Gas chrom atographic evaluation o f the fo rm a tio n o f vo la tile substances in stored peas. Fo o d Techno l. 18: 7 7 3 .
Bills, D .D . and K eenan, T .W . 1 9 6 8 . D im e th y l sulfide and its precursor in sweet corn. J. Agr. F o o d C hem . 1 6: 6 4 3 .
B u tte ry , R .G ., S e ife rt, R .M ., G uadagni, D .G ., B lack, D .R . and L ing , L .C . 1 9 6 8 . C haracteriza tion o f some vo la tile constituents o f carrots. J. A gr. F o o d C hem . 16: 1 0 0 9 .
B u tte ry , R .G ., S e ifert, R .M ., L u n d in , R .E ., G uadagni, D .G . and L ing , L .C . 1 9 6 9 . Characte riza tio n o f an im p o rta n t arom a com ponent o f be ll peppers. C hem . & In d .: 4 9 0 .
Carson, J .R . 1 9 6 7 . O n ion flavor. In “ C hem istry and Physiology o f F lavors ,” p. 3 9 0 . A v i Publishing C o ., W estport, Conn.
F lem in g , H .P ., C obb , W .Y ., E tc h e ll, J .L . and Bell, T .A . 1 9 6 8 . The fo rm a tio n o f carbonyl
com pounds in cucum bers. J. Fo od Sci. 33: 572 .
Forss, D .A ., D unstone, E .A ., R am shaw , E .H . and S ta rk , W . 1 9 6 2 . The flavor o f cucum bers. J. F o o d Sci. 2 7 :9 0 .
G o ld , H .J . and W ilson, C .W . I I I . 1 9 6 3 . Th e volatile flavor substances o f celery . J. Fo od Sci. 28: 4 8 4 .
H ea th erb e ll, D .A . and W ro lstad , R .E . 1 9 7 1 . In fluence o f v a rie ty , m a tu r ity and storage. J. F o o d Sci. 3 6 : 2 25 .
H ea th erb e ll, D .A ., W ro lstad , R .E . and L ib b ey ,L .M . 1 9 7 1 . C arro t vo latiles. 1 . C haracteriza t io n and effec ts o f canning and freeze d ry ing. J. Fo od Sci. 3 6 : 2 19 .
Johnson, A .E ., N ursten , H .E . and W illiam s, A .A . 1 9 7 1 a . Vegetab le volatiles: A survey o f com ponents id e n tifie d . P art 1 . C hem . & In d .: 5 5 6 .
Johnson, A .E ., N ursten , H .E . and W illiam s, A .A . 1 9 7 1 b . Vegetab le volatiles: A survey o f com ponents id e n tifie d . P art 2 . C hem . & In d .: 1 2 1 2 .
K azeniac, S.J. and H a ll, R .M . 1 9 7 0 . F lavor chem istry o f to m a to volatiles. J. Fo o d Sci. 3 5: 5 19 .
K ram er, A . 1 9 5 2 . A tr i-m e tr ic test fo r sweet corn q u a lity . Proc. A m er. Soe. H o rt. Sci. 59: 4 0 5 .
M iers, J .C . 1 9 6 6 . F o rm a tio n o f vo la tile su lfur com pounds in processed to m a to products. J. A gr. F o o d C hem . 14: 4 1 9 .
N elson, P .E . and H o ff , J .E . 1 9 6 9 . T o m a to vo la tiles: E ffe c t o f v a rie ty , processing and s to rage tim e . J. F o o d Sci. 3 4 : 5 3 .
Rasekh, J. and K ra m e r, A . 1 9 7 1 . Gas chro m ato graphic pro files o f stored carrots. J. A m er. Soc. H o rt. Sci. 9 6 : 5 72 .
Self, R . 1 9 6 7 . P ota to flavor. In “ C hem istry and Physiology o f F lavors ,” p. 3 6 2 . A v i Publishing C o ., W estport, Conn.
S elf, R ., Casey, J.C . and S w ain , T . 1 9 6 3 . The lo w -bo iling volatiles o f cooked foods. C hem . & In d .: 8 6 3 .
Spencer, M .L . and S tan ley , W .L . 1 9 5 4 . F lavor and odor com ponents in the to m a to . J. Agr. Fo od C hem . 2: 1 1 1 3 .
Stevens, M .A . 1 9 7 0 . Vegetab le flavor. H o rt- Science 5: 9 5 .
Stevens, M .A ., L indsay, R .C ., L ib b e y , L .M . and Frazie r, W .A . 1 9 6 8 . V o la tile com ponents o f canned snap beans (Phaseolus vulgaris L .) J. A m er. Soc. H o rt. Sci. 9 1 : 8 3 3 .
Teran ishi, R ., Issenberg, P ., H ornste in , I . and W ick , E .L . 1 9 7 1 . “ F lavo r Research—P rinc iples and Techn iques .” M . D e k k e r, In c . N ew Y o rk .
Tw igg , B .A ., K ra m e r, A ., Fa len , H .N . and S ou therlan d , F .L . 1 9 5 6 . O b jective evaluatio n o f the m a tu rity fa c to r in processed sweet corn. Fo od Techno l. 1 0 : 1 7 1 .
W illiam s, M .P ., H o f f , J .E . and N elson, P .E .1 9 7 2 . A precise m eth o d fo r the de te rm in a tio n o f d im e th y l sulfide in processed foods. J. Fo od Sci. 3 7 : 4 0 8 .
W illiam s, M .P . and N elson, P .E . 1 9 7 3 . E ffec ts o f hybrids and processing on the d im e th y l sulfide p o te n tia l o f sweet corn. J. F o o d Sci. 38: 1 1 3 6 .
Ms received 1 2 /9 /7 3 ; revised 2 /2 3 /7 4 ; accepted2 /2 7 /7 4 .
S cientific a rtic le N o . A 1 9 5 8 , C o n tr ib u tio n N o . 4 8 8 8 o f the M a ry la n d A g ric u ltu ra l E x p e rim en t S ta tio n , D ep t, o f H o rtic u ltu re .
G ra te fu l acknow ledgem ent is accorded D r. M a rth a G ay o f the U n ivers ity o f M a ry la n d C hem istry D ep t, fo r her he lp in perform ing GC-M S analyses and in the in te rp re ta tio n o f spectral da ta . A p p rec ia tio n is also expressed to M rs. M ild red M o d ery and M rs. Th elm a Chase fo r th e ir aid in conducting sensory panels.

R. W. B U E S C H E R ' a n d H. C. P O S T A L
D e p a r tm e n t o f H o r tic u ltu r e , P u rd u e U n iv e rs ity , W e s t L a fa y e t te , IN 4 7 9 0 7
E F F E C T S OF LOW TEM PER A TU R E STO RA G E OF TOMATO FR U ITS ON A CID-SO LUBLE N U CLEO TID ES
INTRODUCTION
CONSIDERABLE EVIDENCE indicates that m alfunctioning of m itochondria may be the key to chilling injury of plant tissue. M itochondria from chill-sensitive plants are structurally inflexible as co m p a re d to chill-insensitive plants (Lyons et al., 1964). M itochondria became disorganized during low tem perature exposure (Jaweed and Watada, 1969; Yamaki and Uritani, 1972). At low tem peratures m itochondrial membrane- bound enzymes have a higher activation energy than at higher tem peratures (Lyons and Raison, 1969, 1970; Raison et al,, 1971).
A decline in phosphorylative capacity of m itochondria has been dem onstrated in chilled sweet potatoes (Lieberman et al., 1958; Uritani et al., 1971), tom atoes (Lewis and Workman, 1964) and grapefruit (Pantastico et al., 1968). However, quantitative measurem ents of ATP in grapefruit and snapbean fruits indicate a decline in concentrations only after 2 wk of chilling tem perature exposure (Vakis et al., 1971; Watada, 1969). With the loss of phosphorylation capacity due to chilling, a decline in the energy levels should be expected.
The purpose of the present study was to determ ine the content of acid-soluble nucleotides in tom ato fruits during storage at 1°C, after transfer from 1—20°C and during normal ripening.
MATERIALS & METHODSMATURE green tomato fruits (cv. Tiny Tim) were placed in 1°C storage for 0, 7, 14, 21 and 28 days. Samples for analysis were taken immediately or after being stored at 20° C for 2 days. Freshly harvested fruits at mature green, breaker, orange and red stages were used to o approximate maturity stages of 0, 5, 15 and 20 days at 20° C. Storage for 20 days at 20° C was q usually required for the ripening of this culti- Ö var.
Acid-soluble nucleotides were extracted and separated according to the method of Hurlbert et al. (1954) as modified by Cherry and Hageman (1960). 30g of tomato tissue (representing six fruits with the locular material discarded) was homogenized in 60 ntl cold 0.6M HC10„. After centrifugation at 20,000 X G for 20 min, the supernatant was filtered through
glass wool and the pH was adjusted to 7.0 with 5N KOH. Insoluble KC104 was allowed to precipitate for 30 min at 4°C and then removed by centrifugation at 10,000 x G for 15 min. Half the supernatant solution was applied immediately to a Dowex-1 x 8 (200-400 mesh) formate form (1 X 40 cm) anion exchange column for nucleotide separation. The first stage of elution consisted of a linear gradient with 300 ml each of water and 4N formic acid in the reservoirs. The second stage was carried out by a linear gradient of 450 ml each of 4N formic acid and 1.6M ammonium formate.
Fractions containmg 5 ml were collected and read at 260 nm in a Beckman DB spectrophotometer. Identification of the peaks was accomplished by chromatography of pure nucleotides and by ultraviolet absorption ratios (Pabst Laboratories, 1956). Concentrations (micromoles) of the identified nucleotides were calculated by using the molar absorbancy values at pH 2.
The results represent the average of two separate experiments.
RESULTSTHE TYPICAL edition profile of the acid-soluble nucleotides from the various treatm ents dem onstrated 1 0 separate peaks (Fig. 1). The peak designated as (CMP) was identified by chrom atography
of commercial CMP but not by UV absorption ratios. A com bination of CMP, NAD and ascorbic acid have been repo rted to occur in the fractions of this peak (Cherry and Hageman, 1960; Barmore and Biggs, 1972; Watada, 1969). The secondary peak preceding the large UDPG peak was not consistently observed. R etention tim e of the standard GDP was the same as this secondary peak. The retention times for UDP and ATP were approxim ately the same; however, UV absorption ratios o f this fraction from all treatm ents indicated negligible influence from the UDP. The predom inant acid-soluble nuclec tides in chilled and nonchilled extracts v/ere AMP, ADP, ATP, UMP, UTP and UDPG.
During normal ripening UMP and UDPG contents declined substantially between the m ature green and breaker stages and increased during the later m aturity stages (Fig. 2). UTP conten t was the highest in orange fruits and then declined. Increases in the con ten t of AMP, ADP and ATP occurred in all stages of fruit ripening (Fig. 3). The am ount of AMP increased sixfold between the m ature green and red m aturity stages. The almost linear declines of ATP/ADP
1 P resen t address: D ept, o i H o rticu ltu ra lF oo d S cience, U niversity o f A rkansas, F ay e tte - T ig . 1 — t / u t i o n p r o f i l e o f a c i d - s o l u b l e n u c l e o t i d e s i n t o m a t o f r u i t f r o m a n i o n e x c h a n g e c o l u m nville, A rk. ( D o w e x - 1 X 8 2 0 0 —4 0 0 m e s h f o r m a t e f o r m , 1 X 4 0 c m ) .
7 1 A—J O U R N A L O F FOOD S C IE N C E -V o lu m e 3 9 (1 97 4 )

LO W TEMP S TO R A G E O F TO M A TO E S - 775
and ATP/AMP ratios during ripening were no t due to a decline in ATP levels but were attributed to the large increases in ADP and AMP levels (Table 1). The “energy charge,” as proposed by Atkinson and Walton (1967) to be a fundamental metabolic control param eter, also declined during the ripening process.
During the first week of 1 C storage UMP content declined and then increased until the third week (Fig. 2A). Transfer to 20°C for 2 days did not affect UMP levels in fruit chilled for 3 wk. A fter 4 wk of chilling and transfer to 20°C for 2 days the UMP content in fruit increased tw ofold. UDPG content gradually declined during 1°C storage (Fig. 2B). The UDPG content declined in fruits stored for 2, 3 and 4 wk at 1°C and transferred to 20 C for 2 days.
The UTP conten t increased through 2 wk of 1°C storage and then decreased rapidly (Fig. 2C). Likewise, when fruits
Fig. 2 —Changes in u rid ine nuc leo tide concentrations in tom ato fru its du ring ripen ing, during ch illin g and a fte r transfer from ch illin g tem perature.
were transferred to 20°C for 2 days the UTP conten t increased from its original level during the first 2 wk of 1 C storage and then rapidly declined.
The level of AMP during storage at 1 C increased slightly (Fig. 3 A). Increases were observed in AMP content in fruits
T a b le 1 —C h a n g e s in a d e n y la t e r a t io s d u r in g r ip e n in g
H a rv e s te ds ta g e A T P /A M P A T P / A D P
A d e n y la t e (e n e r g y
c h a r g e )a
M a tu re g re e n 3 .3 4 8 .0 0 0 .7 5B r e a k e r 2 .6 3 5 .8 2 0 .7 0
O ra n g e 1 .3 3 3 .7 3 0 .5 6R e d 0 .8 4 3 .1 5 0 .4 6
a D e fin e d as A T P + J 4 A D P / A M P + A D P + A T P
DAYSFig. 3 —C hanges in a d e n in e n u c le o t id e c o n c e n tra tio n s in to m a to fr u its d u r in g r ip e n in g , d u r in g ch illin g a n d a f te r tra n s fe r fr o m c h illin g t e m p era tu re .
placed at 20°C for 2 days after being stored at 1°C for 1, 2 and 4 wk.
The ADP conten t increased about sixfold in fruits stored at 1°C for 4 wk (Fig. 3B). Large increases in ADP content occurred after 1, 2, 3 and 4 wk of 1°C storage and transfer to 20°C for 2 days. The largest increase was observed after 2 days at 20°C in fruits stored at 1°C for 4 wk.
The ATP conten t increased in fruits stored for 1 and 2 wk at 1°C (Fig. 3C). Though ATP content rem ained about the same between the second and th ird week at 1 C, a subsequent sharp decrease occurred. The level o f ATP increased after fruits were chilled for 1 wk and transferred to 20°C for 2 days. When fruits were chilled for 2 and 3 wk and transferred to 20°C, the level of ATP rapidly declined.
During storage at 1°C the ATP/ADP ratios continuously declined (Table 2). The ratio declined sharply after chilled fruits were moved to 20 C for 2 days. The early declines were attribu ted to an increase in ADP content and the later declines were caused by a decline in ATP conten t along with increases in ADP content. The rapid declines of the ATP/ADP ratios which occurred when chilled fruits were transferred to 20 C were primarily caused by a rapid increase in ADP content.
The ATP/AMP ratio nearly doubled after 7 days o f 1 °C storage and subsequently declined. Rapid declines occurred in chilled fruits transferred to 20 C for 2 days. The “ energy charge” remained fairly constant through 21 days of 1°C storage and then sharply declined. In fruit transferred to 20 C the “ energy charge” declined in com parison to that in fruit which were m aintained at 1°C.
DISCUSSIONMEASUREMENTS of acid-soluble nucleotides dem onstrated tha t ATP and UTP levels increased in m ature green tom ato fruit during the first 2 wk of exposure to chilling tem perature. Apparently, utilization or degradation of nucleotide triphosphates did no t exceed production un til after a considerable time of low tem perature exposure. Similar results were observed in snap beans by Watada (1969). These findings do not support the results o f Lewis and Workman (1964) whereby phosphorylation declined m arkedly after 2 days at 0°C or those of Lyons and Raison (1970) which indicate im pairm ent of the m itochondria. On the other hand, the appearance of severe chilling injury did not develop until after approxim ately 2 wk of low tem perature exposure which may be related to the decline in nucleotide triphosphates. Furtherm ore, m aintenance of a uniform “ energy charge” during 3 wk of

1 1 Q - J 0 U F I N A L O F F O O D S C I E N C E - V o l u m e 3 9 ( 1 9 7 4 )
T a b le 2 —C h a n g e s in a d e n y la t e r a t io s d u r in g a n d a f t e r s to ra g e a t c h i l l in g t e m p e r a tu r e s
A T P / A M P A T P / A D P A d e n y la t e
(e n e r g y c h a rg e )3
D a y s 1 ° C+ 2 d a y s a t 2 0 ° C 1 ° C
+ 2 d a y s a t 2 0 ° C 1 ° C
+ 2 d a y s a t 2 0 ° C
0 3 .3 4 — 8 .0 0 _ 0 .7 5 _
7 5 .9 0 4 .5 3 4 .5 1 1 .5 4 0 .8 0 0 .7 11 4 4 .7 9 2 .7 5 3 .5 0 1 .5 2 0 .7 7 0 .6 621 4 .0 2 2 .8 6 3 .0 8 0 .7 5 0 .7 1 0 .6 22 8 1 .7 3 1 .6 2 0 .9 3 0 .3 7 0 .5 8 0 .5 5
a D e f in e d a s A T P + '/ ¡A D P / A M P + A D P + A T P
1°C storage indicates that reactions regulated by adenylate levels would be neither stim ulated nor reduced (A tkinson and Walton, 1967).
Transfer of^fruits to 20°C after 2 wk of storage at 1°C accentuated the decline of ATP, UTP and UDPG which suggests that utilization or degradation of these nucleotides was stim ulated and/or synthesis declined. Also the reduction in adenylate ratio values indicates an alteration in m etabolic control which may subsequently be detrim ental to normal ripening.
The observed increases in ADP content in chilled fruit cannot be explained entirely on declines in ATP or UTP concentrations. The conversion of UDPG or of other nucleotides not analyzed may have contributed to the enhancem ent of ADP concentrations. Also degradation of nucleotide phosphate containing substances may have contributed to the ADP enhancem ent.
Low ATP/ADP ratios have been indicated as stim ulatory to the respiration rate due to a requirem ent for ADP in glycolysis (Beevers, 1961). The respiratory climacteric during normal ripening could be explained on the decline of ATP/ADP ratios. Likewise, the high respiration rates observed when chilled fruits are transferred to 20°C may be due to the decline in this ratio.
Atkinson (1965) reported that high (greater than un ity ) ATP/AMP ratios favored biosynthetic events. The increase in the ATP/AMP ratio during the first week of chilling suggests that conditions
were favorable for synthesis of some materials and that synthesis did occur as indicated by the decline in UDPG levels. Transfer to 20°C may have stim ulated the rate of synthesis which dem anded the utilization of materials such as ATP and UDPG. Subsequent decreases in ATP and UDPG content in chilled fruits transferred to 20°C would limit cellular repair and m aintenance which may provide a feasible explanation for the form ation of chilling injury sym ptom s.
Small changes occurring in to ta l extractable nucleotides probably reflect very large alterations at the site o f utilization in in tact cells. In chilled tissue the measurable am ounts are likely to be closely related to the actual concentrations, since increased m em brane permeability (Lewis and Workman, 1964) would result in dispersion of previously com partm entalized substances.
Our results confirm previous studies whereby a net synthesis of adenosine pyrophosphates occurs during normal ripening (Chalmers and Rowan, 1971; Rowan et al., 1969). The large increases in AMP content, which remain unexplainable, were primarily responsible for the decline in adenylate ratios.
REFERENCESA tk in s o n , D .E . 1 9 6 5 . B iological feedback
co n tro l a t the m olecular level. Science 1 9 5 0 : 8 51 .
A tk in s o n , D .E . and W a lto n , G .M . 1 9 6 7 . A denosine triphosphate conservation in m etabo lic regu la tion . J. B io l. C hem . 242: 3 2 3 9 .
B arm ore, C .R . and Biggs, R .H . 1 9 7 2 . A cid - soluble nucleotides o f ju ice vesicles o f citrus fru it . J . Fo od Sci. 37: 7 1 2 .
Beevers, H . 1 9 6 1 . “ R esp ira to ry M e tab o lism in P lants ,” P. 1 4 7 . H arp er & R o w , N .Y .
Chalm ers, D .J . and R o w a n , K .S . 1 9 7 1 . The c lim acteric in ripen ing to m a to fru it . P lan t Physiol. 4 8 : 2 35 .
C herry , J .H . and Hagem an, R .H . 1 9 6 0 . Separatio n and id e n tific a tio n o f soluble nucleotides fro m e tio la te d corn seedlings as a fu n ctio n o f g row th . P lan t P hysio l. 35: 3 4 3 .
H u rlb e rt, R .B ., S chm itz , H ., B ru m , A .F . and P otler, V .R . 1 9 5 4 . N u c leo tid e m etabo lism .2. C hrom atograph ic separation o f acid- soluble nucleotides. J. B io l. C hem . 209 : 23 .
•laweed, M .M . and W atada , A .W . 1 9 6 9 . E le c tro n m icrographs o f snapbean m ito c h o n d ria exposed to ch illin g tem peratures. Proc. W . V a . A cad. Sci. 41: 1 50 .
Lew is, T .L . and W o rk m an , M . 1 9 6 4 . Th e e ffec t o f lo w tem p era tu re on phosphate esterificat io n and cell m em brane p e rm e a b ility in to m a to fru it and cabbage le a f tissue. A ust. J. B io l. Sci. 17: 1 47 .
L ieb erm an , M .C ., C ra ft , C .C ., A u d ia , W .V . and W ilc o x , M .S . 1 9 5 8 . B iochem ica l studies o f chilling in ju ry in sweet potatoes. P lant Physiol. 33: 3 07 .
Lyon s, J .M . and R aison, J .K . 1 9 6 9 . Changes in activation energy o f m ito c h o n d ria l o x id a tio n induced by chilling tem peratures in cold sensitive plants and ho m eo th erm ic anim als. C ryob io logy 6: £ 8 5 .
Lyons, J .M . and R aison, J .K . 1 9 7 0 . O x id ative a c tiv ity o f m ito c h o n d ria iso lated fro m p lan t tissues sensitive and resistant to chilling in ju ry . P lant Physiol. 4 5 : 3 86 .
Lyons, J .M ., W heaton , T .A . and P ra tt, H .K .1 9 6 4 . R elationsh ip betw een the physical nature o f m ito c h o n d ria l m em branes and chilling sensitivity in plants. P lan t P hysio l. 39: 2 62 .
Pabst Laboratories . 1 9 5 8 . U ltra v io le t absorpt io n spectra o f 5 -ribonucleotides. D iv . o f Pabst B rew ing C o ., C ircu lar O R -1 0 .
Pantastico, E .B ., Soule, J. and Grierson, W.1 9 6 8 . C hilling in ju ry in tro p ica l and subtro p ica l fru its . 2 . L im es and grapefru its . Proc. T ro p . Reg. A m . Soc. H o rt. Sci. 12: 171 .
R aison, J .K ., Lyons, J .M . and Th om so n , W .W .1 9 7 1 . The in fluence o f m em branes on the tem p era tu re induced changes in the k inetics o f some resp irato ry enzym es in m ito chondria. A rch . B iochem . B iophys. 1 4 2 : 83 .
R ow an , K .S ., M cGlasson, W .B . and P ra tt, H .K .1 9 6 9 . Changes in adenosine pyrophosphate in cantaloupe fru it during ripen ing n o rm a lly and a fte r trea tm e n t w ith e thy lene . P lant Physiol. 37: 31.
U rita n i, I . , H y o d , H . and K u w a n o , M . 1 9 7 1 . M echanism o f co ld in ju ry in sweet potatoes. 4 . B iochem ical m echanism o f co ld in ju ry w ith special reference to m ito ch o n d ria l activ ities. Agr. B io l. C hem . 35: 1 2 4 8 .
V ak is , N ., Grierson, W . and Soule, J. 1 9 7 1 . C hillin g in ju ry in tro p ica l and subtrop ical fru its . 3. The ro le o f C 0 2 in suppressing chilling in ju ry o f grapefru its and avocadoes. Proc. T ro p . Reg. A m . Soc. H o rt. Sci. 1 4 : 89.
W atada, A .E . 1 9 6 9 . A cid-soluble nucleotides o f chilled snapbean fru its . Proc. W. V a . A cad. Sci. 41: 1 45 .
Y a m a k i, S. and U rita n i, I . 1 9 7 2 . M echan ism o f chilling in ju ry in sweet p o ta to . 7. Changes in m ito c h o n d ria l structu re during chilling storage. P lant and C ell Physiol. 13: 7 9 5 .
Ms received 1 1 /2 6 /7 3 ; revised 1 /2 1 /7 4 ; accepted 2 /1 0 /7 4 .

K Y O K O S A I O , ' IIA/AO S A T O 2 a n d T O K U J I Z V A T A N A B E 1
N a tio n a l F o o d R esea rch I n s t i tu te a n d K y o w a H a k k o K o g y o C o., T o k y o , Ja p a n
FOOD USE OF SOYBEAN 7S AND 11S PROTEIN S High Temperature Expansion Characteristics of Gels
INTRODUCTION
ABURAGE is one o f the most popular foods derived from Tofu, soybean curd (Watanabe, 1969). Thin sliced Tofu, after being dehydrated by press, is deep-fried in oil a t low tem perature (1 1 0 —120°C) and then at high tem perature (180°C). During deep-frying at low tem perature, the original Tofu gel swells more than three times in area and its tex tu re becomes very porous. The expansion ratio and textural changes caused by moisture flashing, are influenced by various conditions in preparing the Tofu. Conditions for preparing Aburage were traditionally selected by experience. The expansion characteristics o f soybean gels as shown in Aburage might be essentially similar to that shown in textured protein products extruded at high tem perature. Little has been reported on the changes of soybean protein heated at more than 1 0 0 °C.
In a previous paper (Saio, 1973) we reported on the conventional m ethod of fractionating 7S and 1 1 S proteins and p re lim in a ry investigations comparing functional properties for preparing calcium gel, heat-induced gel, a cheese-like product and a fish jelly product. Separated fractions were designated 7S PRF (the 7S protein rich fraction) and 1 1 S PRF (the 11S protein rich fraction). Detailed investigations on heat-induced gels prepared by kneading 7S PRF or 1 IS PRF with water and heating at 6 0 — 100°C were also reported (Saio et al., 1973). In th a t paper, heat-induced gel from 11S PRF indicated higher tensile strain, tensile stress and shear strength than tha t from 7S PRF and soybean protein isolate (SPI) when gels were prepared by heating at m ore than 80°C; moreover, the 11S PRF had higher water retention than 7S PRF and SPI.
This paper deals w ith the high tem perature expansion characteristics of soybean protein gels, considering differences between 7S and 11 S proteins.
1 N a tio n a l F o o d Research In s titu te , M in is try of A gricu ltu re & F o res try , 12 -4 -1 Shioham a K o to -k u , T o k y o , Japan
2 T o k y o Research L a b o ra to ry , K yo w a H akko K ogyo C o. L td ., 6 -6 -3 Asahi-m achi, M achida-shi, T o k y o , Japan
D E F A T T E DS O Y B E A N
M E A LE x t r a c t e d w i t h 1 0 m M C a C I2 f o r 2 —3 h r
( m e a l :s o lv e n t is 1 :1 0 ) C e n t r i fu g e d w i t h S h a r p ie s c e n t r i f u g e
j
R e s id u e
S u s p e n d e d in w a t e r ( 4 0 ° C , r e s id u e .'w a t e r is 1 :1 0 )
A d ju s t e d p H to 8 —8 .5 C e n t r i fu g e d w i t h S h a rp ie s
c e n t r i fu g e
"R e s id u e E x t r a c t
A d ju s t e d p H to 7 S p r a y d r ie d
1 1 S p r o t e in r ic h f r a c t io n ( I I S P R F )
E x t r a c t
A d ju s t e d p H t o 4 .5
I-------------------1W h e y P r e c ip i t a t e
S u s p e n d e d in w a t e r A d ju s t e d p H t o 7
S p r a y d r ie d
7 S p r o t e in r ic h f r a c t io n ( 7 S P R F )
Fig. 1 —F lo w s h e e t o f 7 S P R F a n d 1 1 S P R F p re p a ra tio n .
MATERIALS & METHODS
Preparation o f protein fractionsThe SPI was acid precipitated protein from
the whole water extract of soybean meal, it was
protein flour I2g| water 1 f
dissolveheat max 90° cool 70" coagulateo a |
keep 30min press in mold hea t in autoc lave
water or buffer
gel
Fig. 2 —F lo w s h e e t o f e x p a n d e d g e l p re p a ra tio n .
spray-dried at 150-160°C inlet and 80-90°C outlet temperature after neutralization.
The 7S PRF and 11S PRF used in the experiment shown in Table 1 and 2 were prepared by the method (Fig. 1) previously described (Saio et al., 1973), that is, extracted with 10 mM CaCl2 for 2 -3 hr (meal: solvent 1:10). By changing the concentration (5-12.5 mM), protein fractions having different ratios of 7S protein to 11S protein (used in the experiment shown in Fig. 9) were prepared. The lower the concentration of calcium chloride, the higher ratio of 11S protein to 7S was obtained. Each fraction was spray dried at the same condition as SPI.Preparation o f cold insoluble fraction (CIF) and crude 7S
CIF was prepared by the method of Briggs and Wolf (1957) and crude 7S by the method of Koshiyama (1965). Each fraction was spray dried at 150-160°C inlet and 80-90°C outlet temperatures.
Volume 39 ( 1974)—JO U RN AL OF FOOD SC IE N C E -777

7 7 8 - J O U R N A L O F F O O D S C I E N C E - V o l u m e 3 9 ( 1 9 7 4 )
Hardness and cohesiveness were measured with a GF-Texturometer. The gel sheets were layered 1 cm thick in a dish and the profile curves obtained at 0.125 volt input, 2 mm clearance, using an 18 mm lusite plunger. Measurement o f solubility o f gel
To 0.5g of gel which was ground in a mor- tor, 10 ml of solution containing different
concentration of 2-mercaptoethanol (ME) and sodium dodecyl sulfate (SDS) were added. The mixture was kept at 40° C overnight and centrifuged at 3,000 rpm for 15 min. The absorbance at 280 nm of the supernatant from the centrifugation was measured after appropriate dilution. When the sample was turbid, the value was corrected by subtracting the absorbance at 280 nm from that at 400 nm. The solubility was the percentage of dissolved protein to total protein in the original sample, calculated from the absorbance.
Preparation o f expanded gel at high temperature
The flow sheet to prepare the expanded gel is shown in Figure 2. 12g of each protein fraction were dissolved with 1 liter of water, heated to 90° C and cooled immediately to 70° C in an ice bath. CaCl2 was added to the protein solution, with stirring, to make the final concentration 10-40 mM; stirring was continued for 30 sec. The induced calcium curd was kept at room temperature for 30 min and molded in the box shown in Figure 2 with a press for 1-2 hr. In the case of acid coagulation, each protein fraction was dissolved, heated as calcium coagulation and the pH of the solution adjusted to5.5-5.7 after cooling, kept for 30 min at room temperature and molded as in the case of calcium. The pressed gel (7 cm x 8 cm x 0.5 cm) was quartered. Each slice was immersed in water or in buffer and autoclaved at 100- 160°C under appropriate pressure. The gel was kept for 5 min after settling the temperature and the pressure of autoclave was then gradually decreased. Unless otherwise pointed out, calcium gel was coagulated with 0.01M CaCl2 and the gel was immersed in 0.2M NH^Cl-HCl buffer containing 0.1M NaCl (pH 8.5) and then heated at 132°C.Measurement o f physical properties o f gel
Since the gels were mainly expanded horizontally by this preparative method, the expansion ratio was shown as the ratio of area of expanded gel to that of the original gel. In the case of Aburage, its expansion is shown as the change in area.
Fig. 3 —E x p a n s io n o f ca lc iu m g e t a n d a c id get in d i f f e r e n t te m p e r a tu re s o f hea tin g .
RESULTS & DISCUSSIONTO INVESTIGATE expansion characteristics of soybean protein gels, the effects of tem perature of heating, pH, ionic strength, coagulant and protein com ponent were studied.
Figure 3 shows the expansion ratio of calcium gel (gel coagulated w ith calcium chloride) and acid gel (gel coagulated with HC1) from SPI heated at 100— 132°C. Results of this experim ent show tha t the expansion ratio increased as tem perature increased and tha t calcium gel showed greater expansion than the acid gel. As shown in Figure 4, induced gel was porous, the calcium gel being more elastic than that from acid gel.
Figure 5 shows the expansion ratio of calcium-gel from SPI, when immersed in buffer solution of different pH (0.2M
Fig. 4 —P h o to g ra p h s o f c a lc iu m g e l a n d a c id g e l in d i f f e r e n t te m p e r a tu re s o f hea tin g .

S O Y B E A N 7 S A N D 1 1 S P R O T E I N S - 7 7 9
Fig. 5 —E x p a n s io n o f c a lc iu m g e ls in d i f f e r e n t p H : • • N H 4 O H -H C I b u f fe r ; o o C H 3 C 0 2 N a-H C i b u f fe r .
concentration of C3CI2
Fig. 6 —E x p a n s io n o f gels c o a g u la te d w ith d i f fe r e n t c o n c e n tr a tio n s o f CaCI2.
Fig. 8 —E ffe c t o f s o d iu m s u l f i te in b u f fe r o n e x p a n s io n o f c a lc iu m gels.
Fig. 7 —E x p a n s io n o f c a lc iu m g e ts in d i f f e r e n t c o n c e n tr a tio n s o f NaCI.
Fig. 9 —E x p a n s io n o f c a lc iu m gels fr o m fra c t io n s o f d i f f e r e n t p r o te in c o m p o n e n ts .
NH4 CI-HCI or 0.2M CH3 CO2 Na-HCl). The maximum expansion ratio was obtained around pH 2.5 in the acidic side and around pH 8.5 in the alkaline side, where the gel becam e softer and was apt to dissolve in buffer at more drastic pH than 2.5 or 8.5.
Figure 6 shows the effects on the expansion ratio of the CaCl2 concentration used to coagulate SPI. In concentration higher than 40 mM, calcium gel cannot be prepared, being dissolved with excess of calcium ion. In this range, the higher concentration of C a d 2 resulted in a higher expansion ratio.
Figure 7 shows the effect o f NaCI in buffer on the expansion ratio o f calcium gel from SPI. A higher concentration of NaCI resulted in a higher expansion ratio.
Figure 8 shows the effect o f sodium sulfite in buffer on the expansion ratio of calcium gel from SPI. The higher concentration of sodium sulfite resulted in a lower expansion ratio.
Figure 9 shows the expansion ratio of calcium gel from fractions of different protein com ponents: the higher the ratio of 1 1 S protein in the gel, the higher the expansion ratio , the higher the value of cohesiveness and the lower the hardness value. The tex ture of expanded gels from fractions having a high ratio o f 1 1 S protein, were soft and elastic, like reclaimed rubber.
In order to clarify the relationship between protein com ponent and expansion characteristics, using 7S PRF, 11S PRF and SPI, the expansion ratio and textural properties were determ ined, varying the concentration of C aQ 2 for coagulation and pH of the buffer. As shown in Table 1, the expansion ratio of gel from 11S PRF varies from 1.58—9.40 (avg 4.34); tha t o f 7S PRF from2.1—3.29 (avg 2.68); and th a t o f SPI from 2 .02—5.41 (avg 4.01). This fact shows th a t com pared with 7S PRF, 11S PRF has the higher possibility o f expansion by selecting the conditions.
The analysis of variance of results in Table 1, including tex tural properties, is shown in Table 2. The expansion property was influenced predom inantly by protein com ponent, followed by pH, having 1% o f critical coefficient. The effect of calcium concentration is also significant (5% o f critical coefficient), but there is no significant interference between these variables. The textural properties shown by hardness and cohesiveness are influenced predom inantly by pH and next by protein com ponent having 1 % of critical coefficient, and there is significant interference between both.
F ro m the experim ents described above, the causes and effects o f expansion of soybean protein gel were put in the following order:

7 3 0 - J O U R N A L O F F O O D S C / E N C E - V o l u m e 3 9 ( 1 9 7 4 )
T a b le 1 —E x p a n s io n r a t io o f g e ls f r o m 7 S P R F , 1 1 S P R F a n d S P I
p H
C o n e o f C a C I ,
(M l
E x p a n s io n r a t io
7 S P R F A v g 1 1 S P R F A v g S P I A v g
0 .0 1 2 .1 5 1 .5 8 2 .0 2
0 .0 2 2 .2 8 2 .4 0 3 .2 46 .7 0 .0 3 2 .2 8 3 .1 9 3 ,9 5
0 .0 4 3 .1 4 3 .6 0 3 .8 4
2 .4 6 2 .6 9 3 .2 6
0 .0 1 2 .5 4 4 .0 6 2 .8 3
0 .0 2 2 .6 0 5 .1 7 2 .9 97 .3 0 .0 3 2 .1 1 4 .1 3 3 .7 0
0 .0 4 2 .6 3 3 .7 2 3 .5 52 .4 7 4 .2 7 3 .3 6
0 .0 1 3 -1 3 3 .2 0 5 .2 80 .0 2 3 .1 9 4 .4 2 5 .3 0
8 .0 0 .0 3 2 .9 3 5 .7 6 5 .4 10 .0 4 3 2 9 9 .4 0 4 .4 5
3 .1 4 5 .7 0 5 .1 10 .0 1 2 .6 5 3 .8 3 3 .5 00 .0 2 2 .5 3 4 .4 2 4 .0 3
8 .4 0 .0 3 2 .6 9 4 .6 1 5 .1 10 .0 4 2 .7 8 6 .0 1 5 .2 1
2 .6 6 4 .7 2 4 .4 6
to ta l a v e ra g e 2 .6 8 4 .3 4 4 .0 1
Fig. 10—Solubility of calcium gels from CIF or crude 7S: • • original gels before expansion; o o expanded gels. (1—in the absence of 2- mercaptoethanol; 2—in the presence o f 2-mer- captoethanol, 0.025M; 3 —in the presence of 2-mercaptoethanol, 0.05MI
T a b le 2 —A n a ly s is o f v a r ia n c e a n d s o u r c e o f v a r ia t io n
E x p e r im e n tF r a c t io n 1 1 S P R F , 7 S P R F , Is o la tep H 6 .7 , 7 .3 , 8 .0 , 8 .4C a C I2 0 . 0 1 , 0 . 0 2 , 0 .0 3 , 0 .0 4
E x p a n s io nD .F F V a lu e
F r a c t io n 2 1 5 .9 2 * *p H 3 9 . 6 8 * *C a C l j 3 4 .0 8 *F x P 6 1 .5 6F x C 6 1 .4 3P x C 9 .5 1E r r o r 1 8
5 % , 3 . 5 5 : 1 % , 6 .0 1
H a rd n e s sD .F F V a lu e
F r a c t io n 2 2 8 .7 0 * *p H 3 1 4 6 .4 8 * *C a C I , 3 1 .7 4F x P 6 8 . 0 7 * *F x C 6 2 .0 0P x C 9 .9 0E r r o r 1 8
5 % , 3 .1 6 ; 1 % , 5 .0 9
C o h e s iv e n e s sD .F F V a lu e
F r a c t io n 2 5 .9 6 *p H 3 7 2 .0 2 * *C a C I2 3 .1 1F x P 6 3 .6 1 *F x C 6 1 .9 2P x C 9 .8 8E r r o r 1 8
5 % , 2 .6 6 ; 1 % , 4 .0 1
(1) Coagulation with calcium or acid: calcium > acid
(2) Cone of CaCl2 for coagulation: high > low
(3) Cone of NaCl in buffer: high > low
(4) Temperature of heating: 132°C > 100°C
(5) pH: alkaline (8.5) > < acid (2.5)(6) Cone of Na2 S 0 3 in buffer: high <
low(7) Protein component: 11S PRF >
SPI> 7S PRFCatsimpoolas et al. (1970) and Cat-
simpoolas and Meyer (1970) previously reported that the binding forces involved in gel heated at less than 100°C could be hydrogen and electrostatic cross-links, hydrophobic bond and disulfide bridges formed by sulfhydryl-disulfide exchange. During reheating at more than 100°C in different conditions, these binding forces seem to be partly destroyed and reconstructed in expanded gels. Conditions for the above, namely, (1) coagulation with calcium or acid, (2) coagulation with a higher concentration of CaCl2 , (3) presence of a higher concentration of NaCl,(4) heating at a higher temperature and(5) an alkaline or acidic range other than neutral may contribute to a decrease of binding forces dependent on hydrogen or electrostatic cross-links. Calcium gel dissolves easier than acid gel; higher concentration of calcium or sodium ion inhibits the formation of cross-links between ionized carboxyl or/and basic groups and rising temperature weakens hydrogen and electrostatic bonds. Conditions such as heating at higher temperature, an alkaline or acidic range other than neutral, a higher ratio of 1 IS protein to 7S protein and the presence of sodium sulfite may contribute to disulfide bridge formation. The sulfhydryl-disulfide exchange reaction is accelerated at the alkaline or acidic
100 110 120 130 14C 150 160 “Cterrperature of heating
Fig. 11—Effect of concentration of buffer on expansion ratio of gels from CIF or crude 7S.

S O Y B E A N 7 S A N D I I S P R O T E I N S - ! ^
pH range, especially by rising temperature (Donovan, 1967; Takagi, 1973) and sodium sulfite inhibits the formation of disulfide bonds. The amounts of cystine and methionine in protein molecule are higher in 11S protein than 7S protein (Catsimpoolas et al., 1971; Koshiyama,1968); moreover, sulfhydryl groups in 11S protein are more reactive than those in 7S protein (Saio et al., 1971).
To examine in more detail the nature of binding forces in gels before and after expansion, solubilities of calcium-gels
from CIF or crude 7S were determined with different concentration of SDS and ME. As shown in Figure 10, the original gel from crude 7S protein was more soluble than that from CIF with SDS without ME; however, with increase of ME (the key 1 to 3 in Fig. 10), the original gel from CIF became more soluble than that from crude 7S. After heating at 132°C expanded gel from crude 7S was more difficult to dissolve with SDS than that from CIF, and with increase of ME, solubilities of expanded gel from CIF
increased more distinctly than that from crude 7S. It may be concluded from the results described above that in gel from 11S protein before or after heating at 132°C, disulfide bridges contributed most to the gel construction, while the binding forces other than disulfide bridges are predominant in gel from 7S protein before or especially after heating at 132°C.
These facts let us consider that the formation of disulfide bridges after weakening hydrogen or electrostatic bonds might be effective for expansion of gels.
Fig. 12 —P h o to g ra p h s o f e x p a n d e d gels fr o m C IF (1 IS ) o r c r u d e 7 S (7 S ) p ro te in s .

7 8 2 - J O U R N A L O F F O O D S C I E N C E - V o l u m e 3 9 ( 1 9 7 4 )
Finally, Figure 11 shows the effect of concentration of buffer on expansion ratio of gels from CIF or crude 7S over a wider temperature range, and Figure 12 shows photographs of these expanded gels. The results showed that there existed a critical point at 130—150°C (depending on the concentration of buffer) where the expansion ratio reached a maximum. As shown in Figure 12, the gels changed into quite a different state in the range of higher temperature other than this critical point: the color became darker, the form amorphous and the texture harder with lower water retention. The authors are still working on this phenomenon.
REFERENCESBriggs, D .R . and W o lf, W .J. 1 9 5 7 . S tudies o f
the cold insoluble frac tio n o f the w a te r extrac tab le soybean proteins. A rch . B iochem . B iophys. 72: 1 27 .
Catsim poolas, N ., Berg, T . and M e ye r, E .W .1 9 7 1 . H ydrogen io n titra tio n io n izab le side- chains in native and denatured glycin in . Prote in Res. 3: 6 3 .
C atsim poolas, N ., F u n k , S .K . and M eyer, E .W .1 97 0 . T h erm al aggregation o f g lyc in in subun its. Cereal C hem . 47: 3 3 1 .
C atsim poolas, N . and M eyer, E .W . 1 9 7 0 . Gera- t io n phenom ena o f soybean globulins. 1. P ro te in -p ro te in in tera c tio n . Cereal C hem . 47: 5 59 .
D onovan , J .W . 1 9 6 7 . S pec tro pho tom etric observation o f the alka line hydrolysis o f p ro te in d isu lfide bonds. B iochem . B iophys. Res. C om m . 29: 7 34 .
K osh iyam a, I . 1 9 6 8 . C hem ical and physical properties o f a 7S p ro te in in soybean globulins. Cereal C hem . 45: 394 .
K osh iyam a, I . 1 9 6 5 . P u rifica tio n o f the 7S
com pon en t o f soybean proteins. Agr. B io l. C hem . 29: 8 8 5 .
Saio, K ., K a jik a w a , M . and W atanabe, T . 1 9 7 1 . Food processing characteristics o f soybean proteins. 1. E ffe c t o f s u lfh yd ry l groups on physical properties o f T o fu gel. A gr. B io l. C hem . 35: 8 9 0 .
Saio, K ., W atanabe, T . and K a ji, M . 1 9 7 3 . Fo od use o f soybean 7S and 11S pro te ins. 1. E x trac tio n and fu n ctio n a l p roperties o f the ir fractions. J. F o o d Sci. 38: 1 1 3 9 .
Saio, K ., S ato , I . and W atanabe, T . 1 9 7 3 . F u n c tio n a l properties o f heat-induced gels from crude 7S and 11S proteins. N ip p o n Sho- k u h in K ogyo G akkaish i. In press.
Takagi, T . 1 9 7 3 . D isu lfide bonds and s u lfh yd ry l groups in p ro te in m olecules. In “ C hem istry o f P ro te in ,” V o l 3 , p. 4 3 3 . K yo ritsu Shuppan.
W atanabe, T . 1 9 6 9 . In d u s tria l p ro d u c tio n o f soybean foods in Japan. M eeting on soya bean processing and use, N ov . 17— 21, U n ite d N ations. N .Y .
Ms received 9 /2 7 /7 3 ; revised 1 2 /4 /7 3 ; accepted1 2 /4 /7 3 ,

D. M. H I N T O N a n d R . P R E S S E Y
U S D A R ic h a rd B. R u sse ll A g r ic u ltu ra l R esea rch C e n te r , A R S , A th e n s , G A 3 0 6 0 4
C E L L U L A S E A C T IV IT Y IN PEACH ES DURING RIPENING
INTRODUCTION
SOFTENING of fruit during ripening often is attributed to enzymatic degradation of the pectic substances. We recently demonstrated that polygalacturonase activity develops in peaches during ripening and parallels the formation of soluble pectin (Pressey et al., 1971). There is evidence that changes in cellulose may also occur during fruit softening. Cellulose has been reported to decrease during ripening of peaches (Nightingale et al., 1930) and pears (Jermyn and Isherwood,1956). Sterling (1961) found small increases in micellar size of cellulose in ripening peaches and interpreted this as evidence of limited degradation of cellulose. The softening of apples has been related to a reduction in the number of cellulose microfibrils (Kertesz et al.,1959).
If fruit ripening is accompanied by hydrolysis of cellulose, it is of considerable importance to identify the enzymes involved. Cellulolytic enzymes are relatively common in microorganisms, but the only fruits known to contain cellulase are tomatoes (Hall, 1963; Hobson, 1968) and dates (Hasegawa and Smolensky, 1971). Microbial cellulases have been classified according to a system which has been extended to higher plant enzymes. The cellulases acting on native cellulose have been termed “Ci cellulases.” Other enzymes that degrade cellulose are termed Cx cellulase, exocellulase and cellobiase. Cx cellulase is an endoenzyme which acts on swollen or ground cotton, carboxy- methyl cellulose or cellulodextrins. Pharr and Dickinson (1973) recently reported that the cellulolytic activity in tomatoes is due to Cx cellulase and cellobiase.
In the present study, we detected Cx type cellulase activity in peaches. The changes in activity were followed during ripening of two varieties of freestone peaches, and some of the properties of the enzyme were determined.
EXPERIMENTALMaterials
The peaches used in this study were of two varieties: the Elberta variety obtained from Watkinsville, Ga. and an experimental variety from Byron, Ga. Fresh harvested fruit was analyzed to follow changes during tree ripening of peaches. Firm peaches which had lost most of their chlorophyll were obtained and stored at 25°C to study changes during postharvest ripen
ing. Carbowax 4000 was purchased from Mann Research Laboratories and the substrate sodium carboxymethyl cellulose (CMC) was purchased from Nutritional Biochemicals Corp.Methods
Firmness measurement. Three peaches were selected randomly from each sample. Flesh firmness was measured with a Magness-Taylor fruit pressure tester, using a 5/16 in. tip. Both cheeks of each peach were tested after removing the skin and the mean firmness was calculated from the six readings.
Cellulase assay. lOOg of peach tissue were added to 100 ml of a cold aqueous solution containing 12% carbowax 4000 and 0.2% sodium bisulfite. The tissue was disintegrated with a polytron homogenizer (Brinkmann Instruments, Inc.) and centrifuged at 8000 x G for 20 min. In this study all centrifugations were conducted at 8000 x G for 20 min at 2°C. The supernatant was discarded and the residue was suspended in 200 ml of cold water containing 0.2% sodium bisulfite by homogenizing for 2 min. The sample was centrifuged and washing was repeated. The residue was then suspended in 50 ml of 6% NaCl containing 0.2% sodium bisulfite and the homogenate was adjusted to pH 6.0 with IN sodium hydroxide. The homogenate was stirred with a magnetic stirrer for 2 hr at 2°C, centrifuged and filtered through miracloth. The supernatant was used as the enzyme source. All other fractions obtained during the cellulase preparation were checked for cellulase activity, but no activity was detected.
The enzyme reaction mixture consisted of 1 ml of the extract, 3 ml of 0.5% sodium carboxymethyl cellulose, pH 6.0, and 1 ml of
0.1M sodium citrate-phosphate buffer, pH 6.0. A blank containing 1 ml of extract heated in boiling water for 3 min was run with each sample. 0.1 ml of chloramphenicol and cyclohexi- mide solution (25 mg of each dissolved in 20 ml of water) was added to prevent microbial contamination. The samples were incubated at 37°C in a water bath. After 16 hr, the samples were heated in boiling water for 3 min, cooled, and centrifuged. A 5 ml portion of each supernatant solution was withdrawn and the viscosity was measured in an Ostwald viscometer. The percent loss in viscosity was interpreted as being proportional to the cellulase activity.
Enzyme isolation. A concentrated solution of the enzyme was prepared for characterization studies. The extraction procedure was the same as described above except that lOOOg of tissue was used. The supernatant was concentrated in an ultrafiltration unit (Amicon Corp.) using a Diaflo PM-10 membrane. After the sample was removed from the unit, the membrane was rinsed with 0.15M NaCI to recover any activity remaining on the membrane. The pooled extract (60 ml) was centrifuged, filtered and dialyzed against cold 0.15M NaCl for 2 hr.
RESULTSCHANGES in cellulase activity were studied in Elberta peaches during tree ripening. The data indicate very little activity in mature green peaches. As the fruit ripened there was a marked increase in activity until the fruit reached the late- red stage and then the activity began leveling off (Fig. 1). Cellulase activity also
Fig. 1—C hanges in ce llu la se a c t iv i ty in E lb e rta p e a c h e s d u r in g tree ripen ing .
Volum e 3 9 (1 9 7 4 )-J O U R N A L O F FOO D SCIENCE - 783

7 8 4 - J O U R N A L O F F O O D S C I E N C E - V o l u m e 3 9 ( 1 9 7 4 )
was studied during postharvest ripening of Elberta peaches, but the harvest date for the fruit was not the same as that for the tree ripening fruit. The fruit was harvested and allowed to ripen at 25°C. The initial level of cellulase activity was relatively high and the overall increase in activity during postharvest ripening was low compared to the increase in activity during tree ripening. An 83% loss in fruit firmness occurred during the postharvest study (Table 1). An experimental freestone peach variety also was studied during postharvest ripening. The data agreed with that for the Elberta peaches, with only a 9% increase in cellulase activity while fruit firmness decreased 96% during the study.
The effects of NaCl concentration and pH on cellulase solubility were studied. The results (Table 2) indicate that 6% NaCl was sufficient for the release of cellulase from particulates during the postharvest studies. The data (Table 3) for the effects of pH on the solubility of cellulase show that pH 6.0 was optimum for the solubilization of cellulase.
We also investigated the effects of Ca++ and Na+ ions on peach cellulase activity. The enzyme solution was dialyzed against cold deionized water for 2 hr for this study. Maximum activation of the enzyme was obtained at about 0 .0 1M Ca++ and higher concentrations decreased activity (Table 4). The data (Table 5) show that 0.167M NaCl caused maximum activation of the enzyme.
Peach cellulase was quite heat stable. The activity was tested by exposing the enzyme extract to different temperatures for 5 min and measuring residual activity under standard conditions. The treatments from 30—50°C had no significant effect on activity. The 60°C treatment caused only a 10% loss, whereas, the 70°C treatment caused a 94% loss and the 80°C treatment caused a 96% loss in activity, when compared to the unheated sample held at room temperature.
Fig. 2 —E f f e c t o f p H o n p e a c h ce llu la se a c tiv ity .
The pH for optimum peach cellulase activity was determined by using 0.1M sodium citrate-phosphate buffer solutions (Fig. 2). The substrate and buffer solutions were adjusted to pH 4 through pH8.5. The reaction mixture consisted of 1 ml of sodium citrate-phosphate buffer, 1
T a b le 1 —C h a n g e s in f i r m n e s s a n d c e l lu la s e a c t i v i t y in E lb e r t a p e a c h e s d u r in g p o s th a r v e s t r ip e n in g .
% L o s s in F ir m n e s sD a y C M C v is c o s i t y ( K g )3
0 5 6 7 .21 5 5 3 .22 6 7 1 .3
a E a c h n u m b e r r e p r e s e n ts th e m e a n f i r m n e s s c a lc u la t e d f r o m s ix re a d in g s .
T a b le 2 — E f f e c t o f N a C l c o n c e n t r a t io n o n th e s o lu b i l i t y o f c e l lu la s e d u r in g p o s th a r v e s t r ip e n in g .
% L o s s in v is c o s i t y o f C M C s o lu t io n
S a m p le 3
D a y 0 4 6 8 1 0
0 2 5 0 5 0 4 6 4 71 1 5 5 7 6 5 6 8 6 42 1 9 61 6 2 6 4 6 4
a E a c h n u m b e r re p r e s e n ts th e % N a C l in th ee x t r a c t io n m e d iu m E a c h e x t r a c t w a s p re-p a re d f r o m 1 0 0 g o f t is s u e u s in g th e s ta n d a rde x t r a c t io n p ro c e d u re e x c e p t th e N a C l c o n c e n t r a t io n s o f th e e x t r a c t e d m e d ia v a r ie d a s in d i c a te d a b o v e . T h e r e a c t io n m ix t u r e s c o n s is te d o f 3 .0 m l o f 0 .2 5 % C M C p H 6 .0 , 1 .0 m l o f c it r a te - p h o s p h a te b u f f e r p H 6 .0 , 1 .0 m l o f e x t r a c t a n d 0 .1 m l o f c h lo r a m p h e n ic o l an d c y c lo h e x im id e s o lu t io n . T h e a s sa y w a s c o n d u c te d u s in g s ta n d a rd p ro c e d u re .
T a b le 4 — E f f e c t o f c a lc iu m c h lo r id e o n p e a c h c e l lu la s e a c t i v i t y
% L o s s inC a C I 2 ( M ) a C M C v is c o s i t y
0 2 1
0 . 0 0 1 2 90 .0 1 4 40 . 1 3 3
3 T h e re a c t io n m ix t u r e s fo r t h is s t u d y c o n ta in e d 3 .0 m l o f 0 .5 % C M C p H 6 .0 , 1 .0 m l o f c it r a te - p h o s p h a te b u f f e r p H 6 .0 , 1 .0 m l o f th e c o n c e n t r a t e d e n z y m e s o lu t io n a n d 1 .0 m l o f C a C I2 a t th e d e s ig n a te d c o n c e n t r a t io n . T h e m ix t u r e s w e r e in c u b a te d a t 3 7 ° C 2 h r , h e a te d in b o il in g w a t e r 3 m in a n d c o o le d . T h e r e s id u a l a c t i v i t y in th e s o lu t io n s w a s d e t e rm in e d u s in g s ta n d a rd c o n d i t io n s . A b la n k c o n ta in in g 1 m l o f e x t r a c t h e a te d in b o i l in g w a t e r f o r 3 m in w a s ru n w i t h e a c h s a m p le .
ml of the concentrated extract, and 3.0 ml of 0.25% sodium carboxymethyl cellulose. The mixtures were incubated 2 hr at 37°C, heated in boiling water 3 min, and cooled. A blank containing 1 ml of extract heated in boiling water for 3 min was run with each sample. The viscosity of the solutions was measured under standard conditions.
The concentrated enzyme extract was checked for cellobiase and Ci activities. The Ct activity was studied using SIG- MACELL type 19 microcrystalline cellulose as the substrate. The reaction mixture consisted of 3.0 ml of 0.50% microcrystalline cellulose, 1.0 ml of sodium citrate-phosphate buffer pH 6.0 and1.0 ml of enzyme extract. The mixture was incubated 3 hr at 37°C heated in boiling water 3 min, cooled and centrifuged. A blank containing 1 ml of extract heated in boiling water for 3 min was run
T a b le 3 — E f f e c t o f p H o n th e s o lu b i l i t y o f c e l lu la s e
L o s s in v i s c o s i t yE x t r a c t io n a o f C M C s o lu t io n
p H <%)
4 .0 515 .0 5 36 . 0 5 67 .0 4 58 . 0 4 4
a T h e e x t r a c t s in th is s t u d y w e r e p re p a re d u s in gth e s t a n d a rd e x t r a c t io n p r o c e d u r e s e x c e p t th e p H o f th e e x t r a c t io n m e d ia w a s v a r ie d a s in d i-c a te d a b o v e . T h e re a c t io n m ix t u r e s w e r e p re -p a re d a s d e s c r ib e d in T a b le 2 . T h e a s s a y w a s c o n d u c t e d u s in g s ta n d a rd c o n d i t io n .
T a b le 5 — E f f e c t o f s o d iu m c h lo r id e o n p e a c h c e l lu la s e a c t i v i t y
% L o s s inN a C l (M )3 C M C v is c o s i t y
0 2 3 .80 .0 8 3 4 6 .00 .1 6 7 4 6 .40 .3 3 0 3 8 .1
3 T h e re a c t io n m ix t u r e s fo r t h is s t u d y c o n s is te d o f 3 .0 m l o f 0 .5 % C M C p H 6 .0 , 1 .0 m l o f c it r a te - p h o s p h a te b u f f e r p H 6 .0 , 1 .0 m l o f th e c o n c e n t r a t e d e n z y m e s o lu t io n a n d 1 .0 m l o f N a C l a t th e d e s ig n a te d c o n c e n t r a t io n . T h e m ix t u r e s w e re in c u b a te d a t 3 7 ° C 2 h r , h e a te d in b o il in g w a t e r 3 m in a n d c o o le d . T h e r e s id u a l a c t i v i t y in th e s o lu t io n s w a s d e t e r m in e d u s in g s ta n d a rd p r o c e d u r e . A b la n k c o n t a in in g 1 m l o f e x t r a c t h e a te d in b o i l in g w a t e r f o r 3 m in w a s r u n w i t h e a c h s a m p le .

C E L L U L A S E A C T I V I T Y IN P E A C H E S —785
with each sample. The viscosity of the solutions was measured under standard conditions. To study cellobiase activity a reaction mixture consisting of 1.0 ml of 0.125M beta-D(+) cellobiose and 0.5 ml enzyme solution was prepared. A blank containing 0.5 ml of extract heated 3 min was run with the sample. The mixtures were incubated 3 hr at 37°C, heated in boiling water 3 min and cooled. The solutions were analyzed for reducing groups by the arsenomolybdate method (Nelson, 1944). We were unable to detect any Ch or cellobiase activity in the enzyme prep- eration.
DISCUSSION
ACCORDING to our studies, cellulase activity is low in immature peaches, but it increases during the ripening process. It should be noted that the enzyme level in ripe peaches is considerably lower than that reported for tomatoes (Dickinson and McCollum, 1964) and dates (Hase- gawa and Smolensky, 1971). The greatest increase in cellulase activity in peaches occurs before a significant change in fruit firmness. The fruit selected for our postharvest ripening studies contained the maximum levels of cellulase at harvest although the fruit softened markedly on further ripening. The behavior of the peach system is therefore different than that reported for tomatoes (Sobotka and
Watada, 1971). Tomatoes decrease sharply in firmness during the very early stages of ripening but the cellulase activity increases only slightly.
As in the case of the tomato enzyme, peach cellulase is of the Cx type. It degrades the soluble substrate carboxy- methyl cellulose, but its in vivo action on native cellulose is unknown. We failed to detect Cx cellulase which is consistent with other studies on higher plant cellu- lases. Cellulose is the chief structural constituent of higher plants. Since it has been reported that cellulose decreased during the ripening of peaches (Nightingale et al., 1930), the enzymatic degradation of cellulose may be an important process of ripening. Thus, the increase in cellulase activity during peach ripening suggests that cellulase(s), acting in conjunction with other hydrolytic enzymes, such as the pectic enzymes, contributes to the softening of peaches during the ripening. Whereas, polygalacturonase activity was found to develop during the later stages of peach softening (Pressey et al., 1971), cellulase appears to form prior to fruit softening. This enzyme, therefore, may be involved in the initiation of the processes leading to tissue softening and disintegration.
REFERENCESD ickinson , D .B . and M c C o llu m , J.P. 1 9 6 4 . Cel
lulase in to m a to fru its . N a tu re 2 03 : 5 25 .
H a ll, C .B . 1 9 6 3 . Cellulase in to m a to fru its . N atu re 2 0 0 : 1 0 1 0 .
Hasegawa, S. and Sm olensky, D .C . 1 9 7 1 . C ellu lase in dates and its ro le in fru it softening. J. F o o d Sci. 3 6 : 9 6 6 .
Hobson, G .E . 1 9 6 8 . Cellulase a ctiv ity during the m atu ra tio n and ripen ing o f to m a to fru it . J. F o o d Sci. 3 3 : 588 .
K ertesz, A .I . , E ucore, M . and F o x , G . 1 9 5 9 . A study o f apple cellulose. F o o d Res. 2 4 : 14.
Jerm yn , M .A . and Isherw ood, F .A . 1 9 5 6 . Changes in the cell w a ll o f pears during ripen ing . B iochem . J. 6 4 : 123 .
N elson, N . 1 9 4 4 . A p h o to m e tric a dap ta tion o f the S om ogyi m eth o d fo r the de te rm in a tio n o f glucose. J. B io l. C hem . 1 53 : 3 7 5 .
N igh tingale, G .T ., A ddom s, R .M . and B lake,M .A . 1 9 3 0 . D eve lo pm en t and ripen ing o f peaches as corre lated w ith physical characteristics, chem ical c om pos ition , and h istolog ical structu re o f the fru it flesh. 3. M acro chem istry . N e w Jersey A gr. E x p t. S ta. Bull. 4 94 .
Pharr, D .M . and D ick inson , D .B . 1 9 7 3 . P artia l c harac te riza tion o f C x cellulase and cello biase fro m ripen ing to m a to fru its . P lant Physio l. 51: 5 7 7 .
Pressey, R ., H in to n , D .M . and Avants, J .K .1 9 7 1 . D eve lo p m en t o f polygalacturonase a c tiv ity and s o lu b iliza tio n o f pectin in peaches during ripen ing . J. F o o d Sci. 3 6 : 1 07 0 .
S ob otka, F .E . and W atada, A .E . 1 9 7 1 . Cellulase in high p igm en t and crim son to m a to fru it . J. A m er. Soc. H o rt. Sci. 9 6 (6 ) : 7 0 5 .
S terling, C .J. 1 9 6 1 . Physical state o f cellulose during ripen ing o f peach. J. F o o d Sci. 26: 95.
Ms received 1 /1 9 /7 4 ; revised 3 /8 /7 4 ; accepted3 /1 3 /7 4 .
The authors th an k V .E . Prince, Southeastern F ru it and Tree N u t Research S ta tion , B yron , Ga. fo r provid ing peaches fo r th is study.
R eference to a com pany o r p rod uc t nam e does n o t im p ly approval or recom m endatio n o f the p rod uc t by the U .S . D ep t, o f A gricu ltu re to the exclusion o f others th a t m ay be suitable.

P. G . P I F F E R I a n d R . C U L T R E R A
I s t i t u t o d i T e c n o l o g i e C h i m i c h e S p e c i a l i , F a c o l t à d i C h i m i c a I n d u s t r i a l e
U n i v e r s i t à d i B o l o g n a , B o l o g n a , I t a l y
ENZYM ATIC DEGRADATION OF ANTHOCYANINS: THE R O LE OF SW EET C H ER R Y POLYPHENOL OXIDASE
INTRODUCTIONNATURALLY OCCURING enzymatic systems capable of decoloring antho- cyanins are present in molds (Huang, 1955, 1956a, b; Bolcato and Lamparelli, 1962; Bolcato et al., 1964a, b; Dali’Aglio and Porretta, 1970; Dali’Aglio et al., 1970; Peng and Markakis, 1963) in leaves (Nagai, 1917; Bayer and Wegmann, 1957; Proctor and Creasy, 1969; Bjorkman and Holmgren, 1960; Forsyth and Quesnel,1957) and in the fruits of various vegetables (Van Buren et al., 1960; Wagen- knecht et al., 1960; Sakamura and Obata, 1963; Sakamura et al., 1965, 1966; Schmid, 1967; Segal and Segal, 1969). Huang (1955) and Forsyth and Quesnel(1957) attributed the decoloration of anthocyanins to the action of a |3-glycosi- dase. The aglycon liberated by the enzymatic hydrolysis would undergo spontaneous transformation into a colorless product (pseudobase) capable of further degradation in accord with work reported by Lukton et al. (1956).
Sakamura et al. (1966) isolated from eggplants a polyphenol oxidase which specifically oxidized the anthocyanin typical of that fruit (delphinidin-3-p- coumaroyl-rutinoside-5-glucoside).
Other authors, among whom Bayer and Wegmann (1957), Van Buren et al. (1960), Segal and Segal (1969) and Proctor and Creasy (1969), demonstrated that crude vegetable extracts can appreciably degrade anthocyanins only in the presence of phenols. They maintain that polyphenol oxidase is the enzyme responsible for such action. The destruction of the anthocyanin, in such case, would be attributed to its reaction with the qui- none formed by oxidation of an appropriate phenol substrate.
It should be noted, above all, that the presence of anthocyanase activity in crude vegetable extracts has been investigated using anthocyanin substrates with unspecified purity with regard to possible contamination by polyphenols, even in trace amounts.
The present article reports the results of research aimed at ascertaining the presence of anthocyanase in the sweet cherry, the role of various phenols in the decoloration of anthocyanins, and the form in which such pigments are preferably degraded.
MATERIALS & METHODSMORB1ANE var. clingstone cherries, kept refrigerated at -2 0 °C until use, were employed for the enzyme extraction. The anthocyanic pigment used as substrate was cyanidin-3- glucoside extracted from Mora var. cherries from Vignola, Italy.Isolation and purification of the anthocyanins
The anthocyanins used in the experiments were isolated, purified and identified according to the method presented in a previous article (Pifferi et al., 1972). The anthocyanins were checked for phenol contamination by spraying some bidimensional anthocyanin chromatograms with chromogens reactive towards phenols, and other chromatograms with a pH6.5 solution of cherry polyphenol oxidase according to the technique of Drawert et al.(1967). In addition, the absorbance spectrum in0.01% methanolic cone HC1 was performed according to Harborne (1958).Partial purification of the cherry pulp and peel enzymes
The cherries were frozen to -20°C, stemmed and pitted; the peel was removed and kept in an atmosphere of C02 at -20°C until use.
The fruit pulp, after addition of a volume of 0.01 M citric-phosphate buffer (pH 4.6), was crushed with quartz sand for 10 min in a precooled mortar. It was centrifuged for 10 min at 13,416 x G in a rotor type 21 Beckman centrifuge, yielding a supernatant which represented the crude fruit extract (A). An aliquot of it was chromatographed on Sephadex G-100, eluating with 0.02M phosphate buffer (pH 7.0).
A portion of preparation A underwent addition of acetone at -20°C (1:2 v/v). The precipitate obtained was taken up with 0.05M buffer (pH 7.0) and two volumes of acetone were newly added. The procedure was repeated a third time, thereby attaining an enzymic preparation free of phenols (B).
Another aliquot of preparation A was saturated to 85% with anhydrous (NH4)2S 04. The precipitate, centrifuged for 15 min at 13,416 x G, was taken up with 0.01M buffer (pH 7.0) and dialyzed against the same buffer for 24 hr at 4°C (C).
The peels were ground with quartz sand for 10 min in precooled mortar in acetone at -20°C three times, decanting the supernatant. The residue was homogenized with 0.1 M phosphate buffer (pH 7.0) and centrifuged for 10 min at 7,267 x G; the resultant supernatant constituted crude extract A'. A portion of it was then precipitated with acetone according to the above procedure (B').Isolation and purification of the polyphenol oxidase from the cherry acetone powder
The method, reported in a previous paper (Pifferi and Cultrera, 1972), required the extraction of the acetone powder of the fruit with 0.02M phosphate buffer (pH 7.0), dialysis (against 1 mM phosphate buffer at pH 7.0 for 36 hr) of the precipitate obtained by saturating the crude extract with (NH, )2 S04 between 30% and 85%, and chromatography on Whatman DE 23 DEAE-cellulcse (eluating with 0.025M, 0.05M, 0.075M, 0.1M and 0.2M phosphate buffers at pH 7.0).Determination of catecholase activity
The catecholase activity of preparations A, B and C was determined by a modified Voigt and Noske method using pyrocatechol as substrate (Pifferi and Baldassari, 1973).
For the polyphenol oxidase eluated on Whatman DE 23 DEAE-cellulose with the 0.05M and 0.2M phosphate buffers (pH 7.0), the activity as a function of pH was determined using pyrocatechol, D (+) catechine and chloro- genic acid in the presence of ascorbic acid. The disappearance of the ascorbic acid was followed spectrophotometrically with the method of El- Bayoumi and Frieden (1957). 1 ml of 0.7 mM phenol substrate, 0.5 ml of 0.5 mM ascorbic acid, 1.5 ml of 0.1M phosphate buffer (0.1 mM
T a b le 1 —S a m p le - b la n k c o m p o s it io n s c h e m e u se d t o f o l lo w d e c re a s e in a n t h o c y a n in a b s o r p t io n a t 5 1 0 n m
B L A N K S A M P L E
1 .6 m l P h o s p h a te b u f f e r (p H 6 .5 ) 1 .3 m l0 .1 m l 0 .5 m M A s c o r b ic a c id 0 .1 m l0 .2 m l 5 m M C h lo r o g e n ic a c id 0 .2 m l0 .9 m l 0 .2 5 m M A n t h o c y a n in in 1 m M H C I 0 .9 m l
- E n z y m e 0 .3 m l0 .7 m l 5 0 p M E D T A 0 .7 m l
786-J O U R N A L O F FO O D S C IE N C E -V o lu m e 3 9 (1974)

E N Z Y M A T I C D E G R A D A T ! O N O F A N T H O C Y A N I N S - 7 8 7
T a b le 2 — R f V a lu e s a n d c h a r a c t e r i s t ic s o f t h e p ig m e n ts is o la te d f r o m M o ra v a r . s w e e t c h e r r ie s f r o m V ig n o la , I t a l y 3
m a x ^m a x A / t
w i t hR e s id u e s
o f p a r t ia l O D 4 4 0 n m
O D m a x k
P h e n o ls re s p o n s e c h r o m o g e n ic re a g e n ts
B A W A A W n m b A I C I 3 c h y d r o ly s e s A g ly c o n S u g a r Id e n t i f i c a t io n F e K d T B e P P O f
P ig m e n t 1 0 .3 7 0 .3 4 5 3 0 2 0 n m 1 C y a n id in G lu c o s e 0 .2 7 C y a n id in - 3 - g lu c o s id e N o n e N o n e N o n eP ig m e n t 2 0 .3 5 0 .5 3 5 3 0 2 0 n m 2 C y a n id in G lu c o s e
rh a m n o s e0 .2 2 C y a n id in - 3 - r u t in o s id e N o n e N o n e N o n e
a A v e ra g e o f d u p lic a t e d e t e r m in a t io n b S p e c t r a in 0 .0 1 % m e t h a n o l ic c o n e H C I ® 5 % A I C I 3 in 9 5 % m e t h a n o l“ M ix t u r e o f a q u e o u s 0 .5 % F e C I 3 a n d 0 .5 % K 3 F e ( C N ) 6 (w / v ) a c c o rd in g to K e p p le r ( 1 9 5 7 ) ® T e t r a z o t iz e d b e n z id in e a c c o rd in g t o L in d s t e t ( 1 9 5 0 ) .1 P o l ip h e n o i o x id a s e a c c o rd in g t o D r a w e r t e t a l . ( 1 9 6 7 )
in EDTA) and 0.5 ml of enzyme were successively placed in a spectrophotometric cell. The blank was prepared in the same manner, substituting the ascorbic acid and enzyme with 1 ml distilled water. The ascorbic acid absorbance readings were performed at 245 nm for the trials at pH 3.0 and pH 3.5, at 252 nm for pH3.9, and at 265 nm for pH 4.2-9.0. Determination of anthocyanase activity in the absence of phenols
The trials were conducted using the partially purified preparations obtained from the peels (A' and B') and pulp (A, B and C). 5.0 ml of 0.4M citric-phosphate buffer (pH 4.2 and 6.5) were added to 20 ml of 0.25 mM aqueous anthocyanin solution in 1 mM HCI and the solution was allowed to stabilize for 90 min at 25° C.
Two 10-ml aliquots of this solution were drawn and placed in two erlenmeyer flasks, one containing 2 ml of enzyme equilibrated at 25° C for 2 min and the other 2 ml of enzyme inactivated in a boiling water bath for 2 min. For each solution, a 2-ml aliquot was placed in a test tube containing 1 ml of IN HCI.
Other samples were taken at opportunely chosen successive times and acidified in the
Fig. 1 —E ff e c t o f p H o n th e p o ly p h e n o l o x id a s e a c t iv i ty o f h o m o g e n a te A a cc o rd in g to a m o d i f ie d V o ig t a n d N o s k e m e th o d (P iffe r i a n d B aidassari, 1973 ). R e s u lts are th e average o f th re e d e te r m in a tio n s .
same manner. The spectrophotometric readings of the reaction mixtures were conducted with a Beckman DU 402 spectrophotometer after 30 min of acidification. The % decrease in optical density at 510 nm as compared to the initial anthocyanin solution was taken as the measure of anthocyanin degradation.Enzymatic degradation of anthocyanin in the presence of phenols
For the following experiments, the cyan- idin-3-monoglucoside extracted from the cherries was used.
Effect of pH and the nature of the phenol(a). The trials were performed using enzyme preparation C. The concentration of the phenols tested (pyrocatechol, chlorogenic acid, pyrogallol, p-cresol, hydroquinone and re- sorcine) was 2 mM. 2 ml of 0.25 mM anthocyanin solution in 1 mM HCI was mixed with 18 ml phosphate buffer at the desired pH in a 50 ml round bottom flask. After 90 min at 25° C, an 8-ml aliquot was added to each of two erlenmeyer flasks, one containing the reaction mixture (4 ml phenol and 2 ml enzyme) and the other the blank (4 ml phenol and 2 ml boiled enzyme). After 0, 5, 10 and 15 min, an aliquot was drawn from each which, after acidification with 2 ml 2% H3 P04 (v/v), was extracted with 5 ml ether in a separatory funnel to remove the products of the phenol substrate oxidation. After 60 min the absorbance of the aqueous phase was read against the blank at 510 nm.
The same method was also used for the two
polyphenol oxidases eluated on DEAE-cellulose with the 0.05M and 0.2M buffers (pH 7.0) using 7 mM pyrocatechol, D (+) catechine and chlorogenic acid as substrates.
Effects of phenol concentration (b). The enzyme eluated on DEAE-cellulose with the 0.2M phosphate buffer (pH 7.0) was employed. It was 49-fold purified with respect to the crude extract (Pifferi and Cultrera, 1972). The substrate used was 10 juM, 50 pM, 75 pM, 100 pM, 1 mM and 2 mM chlorogenic acid. The method was that described under (a). The pH of the reaction mixture was 6.5.
Ascorbic acid action in anthocyanin degradation (c). The enzyme eluated on DEAE- cellulose with the 0.2M phosphate buffer (pH7.0) was employed using chlorogenic acid as substrate. The decrease in anthocyanin absorption was followed at 510 nm according to the sample-blank composition scheme shown in Table 1.Electrophoresis
Polyacrylamide gel electrophoresis was conducted according to Davis (1964) using a sample of preparation A containing 1.5 —1.7 mg protein. The small (0.35 x 10 cm) tubes contained 7.0 cm separator gel (7%) and 1.0 cm spacer gel (1.25%). The sample was introduced directly 2 cm from the top of the tube. The pH at the electrodes was 8.3, the operational pH8.9, and the pH in the spacer gel 6.7. A potential of 300v was applied to six tubes for 6 hr. The proteins were colored with Coomassie Brillant Blue R-250 (Serva, Heidelberg) accord-
T a b le 3 —% D e g r a d a t io n / u n i t p o ly p h e n o l o x id a s e a c t i v i t y o f c y a n - id in - 3 - g lu c o s id e a t p H 4 .2 a n d p H 6 .5 f o r p r e p a r a t io n s o b ta in e d f r o m th e c h e r r y p u lp ( A ) a ,b a n d p e e l ( A ' , B ' )
A A ' B '
T im e 4 .2 6 .5 4 .2 6 .5 4 .2 6 .5
5 ' 1 .8 8 1 .5 8 2 .2 0 1 .3 0 1 .0 4 0 .7 0
1 0 ' 2 .5 0 1 .8 5 3 .0 5 2 .7 0 1 .4 3 1 .3 01 5 ' 3 .0 0 2 .3 0 3 .9 5 3 .6 0 1 .8 3 1 .7 5
3 0 ' 4 .7 7 2 .9 8 9 .1 5 7 .2 0 4 .0 5 3 .7 5
P h e n o ls P re s e n t P re s e n t A b s e n t
a P r e p a r a t io n B a n d C , n o t r e p o r te d in th e t a b le , w e r e f r e e o f p h e n o ls a n d w e re d e m o n s t ra te d in e f f e c t iv e .
b T h e re s u lt s a re th e a v e ra g e o f t h re e t r ia l s o n th e s a m e p re p a ra t io n s .

7 8 8 - J O U R N A L O F F O O D S C I E N C E - V o l u m e 3 9 ( 1 9 7 4 )
ing to Chrambach et al. (1967). The enzymatic activity was revealed with 0.2M pyrocatechol in 0.1M phosphate buffer (pH 6.5) containing 0.05% p-phenylenediamine, washing after 15 min with 1 mM ascorbic acid, according to the technique of Harel et al. (1965).
presence of two predominant polyphenol oxidases, one with a negative response to the Coomassie Blue test for proteins.
The first fraction eluated from Sepha- dex G-100 and more active at pH 6.5 (Fig. 2), showed a polyphenol oxidase
migrating faster than the isoenzyme last eluated and more active at pH 4.2 (Fig.3).
For this isoenzyme, protein associated with catecholase activity was evident after gel filtration (Fig. 3).
RESULTS & DISCUSSIONNature of the pigments
The pigments identified were cyanidin-3-glucoside and cyanidin-3-rutinoside. Table 2 reports the characteristic pigment data.Isolation of the fruit pulp polyphenol oxidase
Gel filtration of crude cherry extract A on Sephadex G-100 demonstrated the presence of two predominant polyphenol oxidases, differing in molecular weight and optimal pH values in the presence of pyrocatechol, pH 4.2 and 6.5 respectively (Fig. 1 and Fig. 2).
Electrophoresis on polyacrylamide gel of the crude extract demonstrated the
+
a
Fig. 3 —E le c tr o p h o r e t ic p a t te r n s o f 1 1) c ru d e e x t r a c t A ; 12) s e c o n d a n d (3 ) f ir s t fra c tio n fr o m g e l f i l tr a t io n o f c r u d e e x tr a c t A o n S e p h a d e x G -100 . P ro te in (a); p o ly p h e n o l o x id a s e a c t iv i ty lb ) .
Fig. 2 —C h r o m a to g ra p h y o f h o m o g e n a te A o n S e p h a d e x G -1 0 0 w ith 0 .0 2 M p h o s p h a te b u f fe r (p H 7 .0 ). (1 m l 0 .1 M p y r o c a te c h o l s u b s tra te , 0 .2 m l e n z y m e , 5 m l 0 .1 M p h o s p h a te b u f f e r a t p H 4 .2 o r p H 6 .5 ) . P o in ts are fr o m a s in g le d e te r m in a tio n .
Fig. 4 —A c t io n o f e n z y m e p re p a ra tio n ( C) o n c y a n id in -3 -g lu c o s id e as a fu n c t io n o f p H a n d tim e . [S u b s tra te s : 2 m M p y r o c a te c h o l (a); 2 m M c h to r o g e n ic a c id (b). C a tec h o la se a c t iv i ty : 4 7 .2 u n i t s /m l a t p H 4 .2 ; 5 5 .5 u n i t s /m l a t p H 6 .5 .] V alues are th e m e a n s o f th r e e d e te r m in a t io n s .

E N Z Y M A T I C D E G R A D A T I O N O F A N T H O C Y A N I N S - 7 8 9
Anthocyanase activity of the crude cherry pulp and peel extracts
The results in Table 3 show that by acetone precipitation of an aqueous, buffered (pH 7.0) cherry peel extract it was possible to obtain an enzymatic preparation (B1) free of phenols and possessing weak but evident anthocyanase activity. The fruit pulp homogenate (A) also possessed anthocyanase activity which, however, disappeared upon precipitation with acetone (B) or saturation to 85% with (NH4)2 S04 (C).
It appears reasonable to maintain that the capacity of the pulp homogenate to degrade anthocyanins depends on the presence of phenols. In fact, the crude homogenate showed the presence of considerable quantities of phenolic substances, whereas the precipitates obtained with acetone or (NH4)2 S04 were demonstrated devoid.
The nature of the enzymatic system present in the peels and capable of degrading anthocyanins is still a subject of investigation.Enzymatic anthocyanin degradation in the presence of phenols at various pH
Of the phenols studied, pyrocatechol and chlorogenic acid were demonstrated
12
11.
3 4 5
to be active, pyrogallol and p-cresol almost inactive, and hydroquinone and resorcine completely inactive in the anthocyanin degradation.
The same activity order was found for the phenols as substrate of the polyphenol oxidase.
Figure 4 reports the destruction as a function of time and pH of cyanidin-3- glucoside with preparation C in the presence of chlorogenic acid and pyrocatechol. For both substrates, pigment degradation increased with pH until pH5.6. Since the enzyme preparation is considered to possess very strong polyphenol oxidase activity, it follows that the role of the phenols may be to provide enzymatic oxidation products capable of reacting with the anthocyanin, changing its structure and therefore its color. Since, on the other hand, maximum pigment destruction was verified at pH5.6, and not in correspondence with one of the two polyphenol oxidase optimal pH values (pH 4.2 and pH 6.5), it appears that the degradability of the anthocyanin is tied, above all, to its structure, which is strictly correlated to the reaction pH. It seems evident, in any case, that the form of such structure is not the flavylium cation, but more probably the anhydro- base stable at values such as pH 5.6.
Figures 5 and 6 show, at various pH, the polyphenol oxidase activity (a), the course of the cyanidin-3-monoglucoside degradation (b) and the profile of the b/a ratio (c). The trials were conducted in the presence of pyrocatechol, D (+) cate- chine and chlorogenic acid substrates using the polyphenol oxidase eluated from DEAE-cellulose with the 0.05M and 0.2M buffers.
The first of the two enzymes had an activity maximum for the three phenols at pH 3.9 and oxidized in the order of preference: chlorogenic acid > catechine > pyrocatechol. The anthocyanin degradation, in absolute value, was favored by the phenolic substrates in the same order, and the destruction maximum for each phenol was at a pH value superior to that at which the maximum polyphenol oxidase activity occurred. The value of the degradation/polyphenol oxidase activity ratio clearly demonstrated that, whatever the substrate, the anthocyanin degradation increased as the pH increased, with a sharp rise starting at pH 4.2. The absolute value of the ratio for any given pH demonstrated that catechine was the most efficient phenolic substrate in the degradation.
The second polyphenol oxidase, having maximum activity at pH 7.0 for
Fig. 5 - P o ly p h e n o l o x id a s e a c t iv i ty (a), c y a n id in -3 -g lu c o s id e d eg ra d a tio n lb ) a n d b /a ra tio (c). E n z y m e e lu a te d w ith 0 .0 5 M p h o s p h a te b u f f e r a t p H 7 .0 , [S u b s tra te s : 7 m M p y r o c a te c h o l (D, 7 m M D 1+) c a te c h in e (II) a n d 7 m M c h lo ro g e n ic a c id ( III); e n z y m e a c t iv i ty e x p r e s s e d as c o n s u m p t io n o f a sc o rb ic a c id .] R e s u lts are average o f d u p l ic a te d e te r m in a tio n s .

7 9 0 - J O U R N A L O F F O O D S C / E N C E - V o l u m e 3 9 ( 1 9 7 4 )
pyrocatechol and pH 7.5 for D (+) cate- chine and chlorogenic acid, produced maximum anthocyanin degradation at pH values notably inferior to those of maximum polyphenol oxidase activity. The value of the degradation/enzyme ratio revealed that anthocyanin underwent the major part of its degradation in the pH 4.5—7.0 interval, as was also the case for the first polyphenol oxidase. Pyrocatechol was shown to be the most active substrate in the anthocyanin degradation. This indicated that the nature of the phenol used as substrate and, there
fore, the nature of its oxidation products play a role in the degradation of the anthocyanin.
The decoloration of the anthocyanin (cyanidin-3-monoglucoside) was studied with buffered anthocyanin solution, after allowing sufficient time for the stabilization of the equilibrium between the diverse forms present at each pH. The velocity of the interconversion of such form is rather slow with respect to the velocity of quinone production via the enzymatic pathway. From this it appears that the forms most susceptible to reac
tion with quinone are those which are actually present at each pH.
According to Jurd and Asen (1966), the stability of the cyanidin-3-mono- glucoside anhydrobase increases at pH values greater than 5.0. In the unionized form it has a maximum stability around pH 6.1. In the pH 6.1—7.0 interval, it may partially ionize. On the basis of these considerations and the experimental results, the anthocyanin form most likely to be degraded appears to be the cyan- idin-3-monoglucoside anhydrobase or, to a lesser extent, the ionized anhydrobase.
Fig. 6 —P o ly p h e n o l o x id a s e a c t iv i ty (a ), c y a n id in -3 -g iu c o s id e d eg ra d a tio n (b ), a n d b /a ra tio (c). E n z y m e e lu a te d fr o m D E A E -c e llu lo s e jv ith 0 .2 M p h o s p h a te b u f fe r a t p H 7 .0 . [S u b s tra te s : 7 m M p y r o c a te c h o l (I), 7 m M D (+) c a te c h in e (II), a n d 7 m M c h lo ro g e n ic a c id ( III); e n z y m a t ic a c t iv i ty e x p r e s s e d as c o n s u m p tio n o f a sc o rb ic a c id .] D ata are m e a n s o f tw o trials.
Off. 7 —S a tu r a tio n g ra p h fo r c h lo r o g e n ic a c id (a) a n d c y a n id in -3 -g lu c o s id e d eg ra d a tio n (b ) as a fu n c t io n o f th e c h lo r o g e n ic a c id c o n c e n tr a tio n . E n z y m e e lu a te d fr o m D E A E -c e llu lo se w ith 0 .2 M p h o s p h a te b u f fe r a t p H 7 .0. P o in ts are m e a n s fro m th re e trials.
,/4m
in

E N Z Y M A T I C D E G R A D A T I O N O F A N T H O C Y A N I N S - ! ^
Fig. 8 —P r o te c tiv e a c t io n o f a sc o rb ic a c id o n th e e n z y m a t ic d eg ra d a tio n o f c y a n id in -3 -g lu c o s id e in th e p re se n c e o f 0 .3 1 m M c h lo r o g e n ic ac id : A s c o r b ic a c id d e s tr u c t io n (a); c h lo r o g e n ic a c id o x id a t io n la '); a n th o c y a n in d e g ra d a tio n (b ). E n z y m e e lu a te d fr o m D E A E -c e llu lo s e w ith 0 .2 M p h o s p h a te b u f fe r a t p H 7 .0 . R e s u lts are fr o m tw o trials.
Anthocyanin degradation in the poly- phenolic and noncationic forms may be of the quinone-phenol type condensation (Thompson, 1964).Enzymatic degradation of the anthocyanin as a function of phenol concentration
The anthocyanin degradation (Fig. 7) showed a trend analogous to that for the enzymatic oxidation of chlorogenic acid in the absence of anthocyanin. The decoloration of the pigment, that is, depends substantially on the process of quinone formation and can be represented by the following analytic expression:
v = k [anthocyanin] [quinone]= k [quinone]
where the anthocyanin concentration, nearly constant during the course of the experiments, can be incorporated into the constant k .
This leads to the conclusion that the anthocyanin destruction occurs by reaction with the enzymatic oxidation products of chlorogenic acid according to a consecutive-type mechanism, previously hypothesized by Peng and Markakis (1963) and Sakamura (1965).Action of ascorbic acid in enzymatic anthocyanin degradation
The results in Figure 8 indicate that as long as ascorbic acid was present (a), the anthocyanin remained unaltered, whereas its destruction (b) commenced as soon as all the ascorbic acid was consumed, simultaneously with the appearance of the chlorogenic acid oxidation products
(a’). This occurred after a brief period in which chlorogenic acid quinone accumulated, as revelaed by the slight increase in the absorbance at 510 nm. Since the enzyme preparation used was ascorbic oxidase-free, it is evident that the ascorbic acid, progressively oxidized by the chlorogenic acid quinone, exerted a preventive action on the anthocyanin decoloration.
REFERENCESBayer, E . and W egm ann, K , 1 9 5 7 . E n z y m a ti
scher A bbau von A n th o cyan en , Z . N a tu rforsch. 12b : 37.
Bjò’rkm an , O. and H o lm gren , P. 1 9 6 0 . P o ly phenols and p o ly p h e n o l oxidases in leaves o f solid ago virgaurea. Physiol. P lant. 13: 582 .
B oicato , V . and L am p are lli, F . 1 9 6 2 . Le p ro b ab ili basi b iologiche della ro ttu ra ossidasica dei v in i. A grochim ica. 4: 3 66 .
B oicato , V . , L am p are lli, F . and L o sito , F . 1 9 6 4 a . A zion e della “ B. C inerea” e del lie v ito sulle sostanze co lo ran ti dei m osti d ’uva. R iv is ta d ì V it ic o l. e E n o l. 10: 20.
B oicato , V . , L o sito , F . , L a m p a re lli, F . and Palla v ic in i, C . 1 96 4b . T ransform azione delle sostanze co lo ran ti dei v in i in seguito a ro ttu ra ossidasica. R iv is ta d i V it ic o l. ed E no l. 17: 24.
C hram baeh, A ., R eisfe ld , R .A ., W y c k o ff, M . and Zaccari, J. 1 9 6 7 . A procedure fo r R ap id Sensitive Stain ing o f P ro te in Fractionated b y P o lyacry lam ide G el E lectrophoresis. A n a l. B iochem . 2 0: 1 50 .
D a ll’A g lio , G ., B alestrazzi, A . and G herard i, S. 1 9 7 0 . A zion e della polifenolossidasi e delle j3-glucosidase sugli an toc ian i d i ribes. In d . Conserve 45: 3 01 .
D a ll’A g lio , G . and P orre tta , A . 1 9 7 0 . A zione della polifenolossidasi su alcuni p igm enti a n t o c i a n i c i . In d . C o n s e r v e . 45: 2 11 .
Davis, B .J. 1 9 6 4 . Disc electrophoresis. 2. M e th o d and app lica tion to hu m an serum prote ins. A n n . N .Y . A cad. Sci. 1 21 : 4 04 .
D ra w e rt, F ., G ebb ing , H . and Z ieg ler, A . 1 9 6 7 . o-D iphenoloxidase als S p rü h m itte l zum Nachw eis von S ubstraphenolen a u f D ü n n sch ichtp latten . J. C hrom atog . 30: 2 59 .
E l-B a yo u m i, A . and F rie d e n , E . 1 9 5 7 . A spec- tro p h o to m e tric m eth od fo r the determ in at io n o f the catecholase ac tiv ity o f tyrosinase
and s o m e o f i t s a p p l i c a t i o n s . J . A m . Chem . Soc. 7 9 : 4 8 5 4 .
Fo rsy th , W .G .C . and Quesnel, V .C . 1 9 5 7 . Cacao p o lypheno lic substances. 4. Th e an tho cyan in pigm ents. B iochem . J. 65: 1 77 .
H arbo rn e, J .B . 1 9 5 8 . Spectra l m ethods o f characterizing anthocyanins. B iochem . J. 70: 2 2 .
H are l, E ., M a ye r, M .A . and Shain , Y . 1 96 5 . P u rifica tio n and m u ltip lic ity o f catechol oxidase fro m apple chloroplasts. P hy to - chem . 4: 7 83 .
H uang, H .T . 1 9 5 5 . D ec o lo ra tio n o f an tho cyanins b y fungal enzym es. J . A gr. F o o d Chem . 3: 1 41 .
H uang, H .T . 1 9 5 6 a . E n zy m ic id e n tific a tio n o f the an tho cyan in p igm ent o f b lackberry . N atu re 177 : 39.
H uang, H .T . 1 9 5 6 b . Th e k inetics o f the deco lo ra tio n o f an thocyanins b y fungal an tho - cyanase. J. A m . C hem . Soc. 7 8 : 2 39 0 .
Jurd, L . and Äsen, S. 1 9 6 6 . Th e fo rm a tio n o f m eta l and “ c op igm en t” com plexes o f cyan- id in-3-glucoside. P h y to ch em . 5: 1 26 3 .
K ep p ler, H .H . 1 9 5 7 . Th e iso lation and constitu tio n o f m ollisacacidina, a n e w l e u c o a n t h o - cyan id in fro m th e h eartw o o d o f Acacia m ollissim a W ild . J. C hem . Soc. 2 72 1 .
L in d s ted t, G . 1 9 5 0 . C onstituen ts o f p ine heart- w o od . 20 . S eparation o f ph en olic heart- w o od constituents by paper p a rtit io n chrom atography. A c ta C hem . Scand. 4:4 48 .
L u k to n , A ., C hichester, C .O . and M c K in n e y , G.1 9 5 6 . The b reakd ow n o f s traw berry a n th o cyan in p igm en t. F o o d Techno l. 10: 4 27 .
Nagai, I . 1 9 1 7 . A c tio n o f oxidase on a n th o cyanins. B ot. Mag. T o k y o . 31: 6 5 . [C hem . A bstr. 1 9 1 8 , 12: 1 6 5 4 .]
Peng, C .Y . and M arkak is , P. 1 9 6 3 . E ffe c t o f phenolase on anthocyanins. N atu re 199 : 5 97 .
P iffe ri, P .G . and Baldassari, L . 1 9 7 3 . A Spectro- p h o to m e tric M e th o d fo r the D e te rm in a tio n o f the Catecholase A c tiv ity o f Tyrosinase by B esthorn ’s H yd ra zo n e. A n a l. B iochem . 52: 3 25 .
P iffe r i, P .G . and C u ltre ra , R . 1 9 7 2 . R icerche sulla Polifenolossidasi. N o ta 1. E strazione, p a r z ia le p u r if ic a z io n e e m o lte p lic ità d e ll'en zim a delle ciliegie. Scienza e Tecnologia degh A lim e n ti. 2: 9 3 .
P iffe r i, P .G ., C u ltre ra , R . and Baldassari, L .1 9 7 2 . S tu d i sui P ig m enti N a tu ra li. N o ta 7. G li an toc ian i de l m elograno (P un ica grana- tu m ). Scienza e Tecnologia degh A lim e n ti. 2: 3 07 .
P roctor, J .T .A . and Creasy, L .L . 1 9 6 9 . A n an- thocyan in -deco lo riz ing system in flo rets o f cichoriu m in tybus . P hy tochem . 8: 1 40 1 .
Sakam ura, S. and O b ata , Y .J . 1 9 6 3 . A n th o - cyanase and anthocyanins occurring in eggplant. 2. Iso la tio n and id e n tific a tio n o f chlorogenic acid and re la ted com pound fro m eggplant. A gr. B io l. C hem . 27: 121 .
Sakam ura, S ., W atanabe, S. and O bata , Y .1 9 6 5 . A nthocyanase and anthocyanins occurring in eggplant. 3 . O x id ative decolorat io n o f th e a n th o cyan in b y po lypheno l oxidase. Agr. B io l. C hem . 2 9 : 1 81 .
Sakam ura, S ., Shibusa, S. and O bata , Y . 1 9 6 6 . Separation o f a p o lyp h en o l oxidase fo r an tho cyan in degradation in eggplant. J. Fo od Sci. 31: 3 17 .
S chm id, P. 1 9 6 7 . Idaein -abbauende E nzym e in Ä p fe ln . Z . Lebensm . U n te r, u. Forsch. 1 3 3 (5 ): 3 04 .
Segal, C . and Segal, M . 1 9 6 9 . D egradation enzym atique des anthocyanes des raisins. R ev. F e rm e n t. In d . A lim . 24: 22.
Th om pson, R .H . 1 9 6 4 . S tructu re and reac tiv ity o f phenolic com pounds. In “ B iochem istry o f Phenolic C om pou nds,” E d. H arborne, J .B ., p. 1. A cadem ic Press, N ew Y o rk .
V an B uren , J .P ., Scheiner, D .M . and Wagen- k n ech t, A .C . 1 9 6 0 . A n A nthocyan in -de- colo riz ing System in S our Cherries. N atu re 1 85 : 1 65 .
W agenknecht, A .C ., Scheiner, S .M . and V a n B uren , J .P . 1 9 6 0 . Anthocyanase activ ity and its possible re la tio n to scald in sour cherries. F o o d Techno l. 14: 4 7 .
Ms received 7 /3 0 /7 3 ; revised 1 1 /2 5 /7 3 ; accept-ed 1 1 /2 9 /7 3 ._____________________________________
This w o rk was supported by the N ationa lResearch C ouncil o f Ita ly .

H A R V E Y T . C H A N , J R . a n d S I M O N C . M . K W O K
U S D A H a w a i i F r u i t L a b . , A R S , a n d H a w a i i A g r i c u l t u r a l E x p e r i m e n t S t a t i o n
U n i v e r s i t y o f H a w a i i , H o n o l u l u , H I 9 6 8 2 2
N O N VO LA TILE ACIDS IN LY C H EE
INTRODUCTIONTHE LYCHEE (L itc h i chinensis Sonn.), a native of southern China, is grown in many areas throughout the tropics. Its small ovate fruit, about 1-1/2 in. in diameter, is eaten fresh, canned in syrup, or dried to produce “lychee nuts” (Purse- glove, 1968). Although horticultural (Yee, 1972) and processing studies of lychee (Chan and Cavaletto, 1973; Ross et al., 1969) have been reported recently, information on composition appears to be lacking except for a nutritional analysis of the fruit (Wenkam and Miller,1965). Using gas-liquid chromatography
(GLC) and thin-layer chromatography (TLC), the nonvolatile acids of lychee were identified and quantitated in this laboratory.
EXPERIMENTALPreparation of lychee puree
Lychee var. Brewster were harvested from the Hawaii Agricultural Experiment Station Farms. The fruit was peeled, pitted and then pureed in a Waring Blendor. The puree was frozen and stored at -17.8°C.Total acidity, total volatile acidity and ascorbic acid
Total titratible acidity and total volatile
acidity were determined by AOAC (1960) methods. The coloiimetric method of Loeffler and Ponting (1942), with slight modifications, was used for ascorbic acid assay of whole frozen lychees blended with metaphosphoric acid.Extraction of organic acids
Lychee puree (200g) was mixed with 1400 ml of 70% methanol and filtered in vacuo through Whatman No. 2 filter paper. The acids were further purified by cationic and anionic ion exchange. They were further prepared for TLC and GLC by concentrating in vacuo azeo- tropically with benzene to a dry residue (Chan et al., 1973).Gas-liquid chromatography
Separation and identification of the organic acids as their methyl esters and as their trimeth- ylsilylated (TMS) derivatives were performed as previously described (Chan et al., 1973). However, with lychee purees, 50—100 mg of adipic acid were added as the internal standard to lOOg of puree. The organic acids were esterified to their corresponding methyl esters with 14% BF3 methanol (w/v) and silylated to their corresponding TMS derivatives with Trisil (Pierce Chemical Co.). Methyl esters were separated on a 9-ft, 0.093-in. i.d. stainless steel column with 5% FFAP (Varian Aerograph Co.) on Chromo- sorb G AW DMCS 60/80. For the separation and identification of the TMS derivatives, a7-ft, 0.093-in. i.d. stainless steel columns packed with 3% OV-17 (Applied Science Laboratory) on Chromosorb G AW DMCS 60/80 was used.
T a b le 1 — R f v a lu e s 3 ( X 1 0 0 1 o f a c id s o n c e l lu lo s e d e v e lo p e d in t w o s o lv e n t s y s te m s a n d o n s i l i c a g e l d e v e lo p e d in th re e s o lv e n t s y s te m s
C e llu lo s e S i l i c a gel
S o lv e n t I S o lv e n t I I S o lv e n t 1 S o lv e n t 11 S o lv e n t I I I( E F W b ) ( B F W C) ( E F W b > ( B F W C) ( B B I F W d )
A u th e n - A u th e n - A u t h e n - A u th e n - A u th e n -C o m p o u n d t i c L y c h e e t i c L y c h e e t i c L y c h e e t i c L y c h e e t i c L y c h e e
L e v u l in ic 9 3 9 4 9 0 8 9 7 9 7 9 6 4 6 6 8 4 8 4M a lic 5 4 5 5 6 4 6 3 6 7 6 6 5 8 5 8 7 0 7 0C i t r i c 4 6 4 5 61 61 5 7 6 7
b E F W (a n h y d r o u s e t h y l e t h e r - fo r m ic a c id - w a te r ) 2 0 :5 : 3 (v / v ) c B F W (n - b u t y l a lc o h o l- f o r m ic a c id - w a te r ) 4 : 1 : 5 (v / v )d 8 B I F W (b e n z y l a lc o h o l- t e r t - b u t y l a lc o h o l- is o p r o p y l a lc o h o l- f o r m ic a c id - w a te r ) 2 4 : 3 : 8 : 1 : 8
(v / v )
T a b le 2 — R e la t iv e r e t e n t io n t im e o f m e t h y l e s te r s o f a u t h e n t ic o r g a n ic a c id s a n d ly c h e e a c id s o n a 5 % F F A P c o lu m n a t t w o t e m p e r a tu re s
T a b le 3 — R e la t iv e r e t e n t io n t im e o f T M S d e r iv a t iv e s o f a u t h e n t ic o r g a n ic a c id s a n d l y c h e e a c id s o n a 3 % O V - 1 7 c o lu m n a t t w o te m p e ra t u re s
T a b le 4 —Q u a n t it a t iv e d e t e r m in a t io n o f o r g a n ic a c id s in l y c h e e 3
B a s e d o n m e t h y l B a s e d o n e s te r d a ta T M S d a ta
A c id m e q u iv / 1 0 0 g m e q u iv / 1 0 0 g
C o m p o u n d A u t h e n t ic L y c h e e
1 2 5 ° C
M e t h y l la c t a te 0 .1 0 0 .0 9U n k n o w n 0 .2 0D im e t h y l m a lo n a te 0 .2 3 0 .2 3D im e t h y l fu m a r a te 0 .3 0 0 .2 9M e t h y l le v u l in a t e 0 .3 3 0 .3 2D im e t h y l s u c c in a t e 0 .3 6 0 .3 5D im e t h y l a d ip a te 3 1 .0 0 1 .0 0
1 7 0 ° C
D im e t h y l a d ip a te 1 .0 0 1 . 0 0D im e t h y l m a la t e 2 .2 4 2 .3 2T r im e t h y l c i t r a t e 8 .1 7 8 .3 8
3 In t e r n a l s ta n d a rd
C o m p o u n d A u t h e n t ic L y c h e e
T M S le v u l in ic
1 4 0 ° C
0 .1 8 0 .1 8T M S p h o s p h o r ic 0 .2 7 0 .2 8T M S s u c c in ic 0 .3 5 0 .3 5T M S g lu ta r ic 0 .5 6 0 .5 5T M S m a lic 0 .7 6 0 .7 7T M S a d ip ic 3 1 .0 0 1 .0 0
T M S a d ip ic 3
1 8 0 ° C
1 .0 0 1 .0 0T M S c i t r i c 3 .3 5 2 .9 6
3 In te r n a l s ta n d a rd
M a lic 4 .1 6 3 .5 7C i t r i c 0 .5 2 0 .0 4S u c c in ic 0 .0 4 0 .2 5L e v u l in ic 0 .0 1 t r a c eP h o s p h o r ic 0 .2 0G lu t a r ic 0 .0 4M a lo n ic 0 .0 2L a c t ic 0 .0 2A s c o r b ic b 0 .2 8 b 0 .2 8 bV o la t i l e a c id s c O CO
o 0 .1 3 C
T o t a l 5 .1 8 4 .5 1
T o t a l t i t r a t a b le a c id s c 4 .6 0 4 .6 0
3 E a c h v a lu e is th e m e a n o f s e v e n o r m o re r e p l i c a te s .
b V a lu e s o b ta in e d c o lo r lm e t r l c a l l y c V a lu e s o b ta in e d t i t r a m e t r i c a l l y
7 9 2 - J O U R N A L O F F O O D S C I E N C E - V o l u m e 3 9 ( 1 9 7 4 )

LY C H E E A C ID S - 793
Thin-layer chromatographyThe following sorbents were used for TLC:
precoated sheets of cellulose (Eastman Chromatogram sheet 6064) and silica gel (Polygram Sil N-HR Brinkmann Instruments, Inc.).
The organic acid extract in 4 ml of ethanol (0.5-1.0 m1) was applied directly to the plates with a micropipette. The plates were developed in the following solvent systems: EFW (anhydrous ethyl ether-formic acid-water) 20:5:3 (v/v); BFW (n-butyl alcohol-formic acid-water) 4:1:5 (v/v); and BBIFW (benzyl alcohol-ierf butyl alcohol-isopropyl alcohol-formic acid- water) 24:8:8:1:8 (v/v).
After development, the plates were dried overnight. The acid spots were detected as described by Chan et al. (1973). Each Rf value in Tables 1-4 is the mean of 10 or more replications.
RESULTS & DISCUSSIONLYCHEE ACIDS chromatographed on cellulose and developed in solvent I (EFW) showed three spots whose Rf values matched those of levulinic, malic and citric acid (Table 1). Acids chromatographed on cellulose and developed in solvent II (BFW) showed two spots whose Rf values also matched those of levulinic and malic acids (Table 1).
Acids chromatographed in solvents I,
II and III (BBIFW) with silica gel as the sorbent showed two spots whose Rf values matched those of malic and levulinic acids.
The relative retention times for the gas chromatography of the methyl esters of known and lychee acids on a FFAP column at 125°C and 170°C as shown in Table 2 confirmed the presence of levulinic, malic, and citric acids and indicated the presence of lactic, malonic, fumaric, and succinic acids in trace quantities.
The TMS derivatives of lychee acids chromatographed on OV-17 at 140°C and 1 80°C confirmed the presence of succinic, malic, levulinic and citric acids and revealed the presence of phosphoric, and trace quantities of glutaric (Table 3).
The quantitative data obtained from the methyl esters on the FFAP column and the TMS derivatives on the OV-17 column were not in close agreement with each other. Total acid values determined through the methyl ester derivatives were slightly higher than the acid values obtained by titration for the total acids. However, the total acid values determined by the TMS derivatives were in close agreement with the total titratable acid values. Differences in acids obtained solely by GLC and total titratable acids are
partly accounted for by ascorbic and volatile acids (Table 4).
Quantitative data obtained by both types of derivatives indicated that malic is the predominant acid comprising about 80% of the acids with the other acids contributing to the remaining 20%.
REFERENCESA O A C . 1 9 6 0 . “ O ffic ia l M ethod s o f A nalysis ,”
9 th ed. A ssociation o f O ffic ia l A gricu ltu ra l Chem ists, W ashington, D .C .
Chan, H .T . Jr. and C ava le tto , C .G . 1 9 7 3 . Lye peeling o f lychee. Res. R ep . 2 1 5 , H aw a ii A gric. E x p . S tn ., H o n o lu lu , H i.
C han, H .T . J r., C henchin , E . and V o n n a h m e, P.1 9 7 3 . N o n v o la tile acids in pineapple ju ice . J. A gr. F o o d C hem . 2 1: 2 0 8 .
L o e ffle r , H .J . and P on ting , J .D . 1 9 4 2 . Ascorbic acid: R ap id d e te rm in a tio n in fresh, fro ze n , o r dehydra ted fru its and vegetables. In d . Eng. C hem . A nal. E d . 1 4 : 8 4 6 .
Purseglove, J .W . 1 9 6 8 . “ T ro p ic a l C rops,” V o l.2, p . 6 4 2 . W ile y , N e w Y o rk , N .Y .
Ross, I.J ., K u h n , G .D . and K ik e r , C .F . 1 9 6 9 . D ry in g lychee fru it . Trans. A m er. Soc. Agric. Eng. 12: 20 .
W enkam , N .S . and M ille r , C .D . 1 9 6 5 . C om positio n o f H aw a ii fru its . B u ll. 1 3 5 , H aw a ii A gric. E x p . S tn ., H o n o lu lu , H i.
Y e e , W . 1 9 7 2 . The lychee in H a w a ii. C irc. 3 6 6 . U niv . o f H aw a ii C oop . E x t. Serv., H o n o lu lu , Hi.
Ms received 1 /1 9 /7 4 ; revised 3 /9 /7 4 ; accepted 3 /1 3 /7 4 .__________________________________________
R eference to a com pany or p rod uc t nam e does n o t im p ly approval or recom m endatio n o f the p rod uc t by the U .S . D ep t, o f A gricu ltu re to the exclusion o f others th a t m ay be suitable.

M A R Y C. Q U IN L A N , R O L F E. B A R G M A N N , Y A H Y A M. E L - G A L A L L I a n d J O H N J. P O W E R S
D e p t, o f F o o d S c ien ce , U n ive rs ity o f G eorgia , A th e n s , G A 3 0 6 0 2
CO RRELA TIO N S BETW EEN SU B JEC TIV E AND O B JECT IV E M EASUREM ENTSAPPLIED TO GRAPE J E L L Y
INTRODUCTION
THIS STUDY was originally undertaken with two goals in mind. During the course of the study a third phase became possible because of the development of a new computer program.
The chief purpose of the study was to apply the statistical methods used successfully to correlate subjective-objective data for flavor (Powers, 1970; Milutinovic et al., 1970; Young et al., 1970) to measurements other than flavor. Grape jellies were made with different sugar replacements or amount of pectin to induce sensory differences. The jellies were then judged organoleptically and various physical or chemical attributes measured.
A second purpose was to ascertain the weight that should be attributed to flavor in terms of overall palatability. In the grading of foods there often are objective standards for color and texture, but flavor is usually dismissed with the statement that the product must possess a “good” flavor or a “distinct and appropriate” flavor. Unlike color or some texture attributes, flavor is not as easily expressed on a grading point scale inasmuch as the rating has had to be based upon exclusively subjective measures. In recent years several laboratories have observed significant correlations between gas-liquid chromatographic (GLC) patterns and sensory evaluation for flavor (Powers and Keith, 1968; Dravnieks and Krotoszynski, 1968; Powers, 1968, 1970; Tanaka and Saito, 1969; Biggers et al., 1969; von Sydow et al., 1970; Dravnieks et al., 1970; Tanaka et al., 1970; Biswas and Biswas, 1971; Biswas et al., 1971; Powers et al., 1971; Vuataz and Rey- mond, 1971; Persson and von Sydow, 1972, 1973; Persson et al., 1973; Kosaric et al., 1973; Dravnieks et al., 1973; Powers and Quinlan, 1973). Practical methods for the objective estimation of texture and color are both older and more widespread in industry.
Supran et al. (1966) applied multiple correlation methods to sensory evaluation of pimientos for flavor, color and texture. Their trials showed that flavor was a more important determinant of overall palatability than color or texture.
The third phase permitted examination of an old problem in sensory evaluation. Well known is the fact that panel
ists do not necessarily maintain equal intervals between scoring levels even though the scale interval is the same. When hedonic descriptions are used and the descriptions then changed into numerical values for computational purposes, equal intervals between score levels are even less likely. The program utilized permits estimation of the distance between score levels.
EXPERIMENTALMaterials
Nine experimental lots of grape jelly were made, varying in pectin content and the kind of sugar. The nine formulations are listed in Table1. Smucker’s grape jelly was used as commercial reference. The experimental lots were prepared by using 500g of Welch’s grape juice, 14g of a standard citric acid solution (100g citric acid in 100 ml water), 454g of sugar and 5, 7 or 8g slow-set pectin, 150 grade. The pectin was provided by Sunkist Growers, Inc. Some of the batches had 25% replacement of dextrose for sucrose, and two batches had a 50% replacement with invert sugar. The purpose of the variations in type of sugar and amount of pectin was to cause flavor and texture differences. Five or six replicate batches were made.
The pectin and a small portion of the sugar were mixed and then added to the juice. The sugar-juice-pectin mixture was heated to boiling and the rest of the sugar was added. As the temperature approached the finish point (4.4°C
T a b le 1 — F o r m u la t io n s u se d
T r e a t m e n tN o . F o r m u la
1 S m u c k e r 's g ra p e j e l ly2 S u c r o s e , 8 g p e c t in3 2 5 % d e x t r o s e r e p la c e m e n t ,
8 g p e c t in4 5 0 % in v e r t s y r u p r e p la c e m e n t ,
8 g p e c t in5 S u c r o s e , 5 g p e c t in6 S u c r o s e , 7g p e c t in7 2 5 % d e x t r o s e r e p la c e m e n t ,
5 g p e c t in8 2 5 % d e x t r o s e r e p la c e m e n t ,
7 g p e c t in9 5 0 % in v e r t s y r u p re p la c e m e n t ,
5g p e c t in1 0 5 0 % in v e r t s y r u p r e p la c e m e n t ,
7g p e c t in
above the temperature of boiling water), the acid was added. The jelly was then poured into jars or into the special vessels for testing with a ridgelimeter (Black and Smit, 1972).Methods
Twelve panelists evaluated the 10 lots of jelly hedonically. The hedonic descriptions were then scaled from 5 — 1, 5 being excellent and 1 being poor. After evaluating the jellies for overall palatability, the panelists then evaluated them for appearance (color and sheen), flavor and texture (mouth feel and spreadability). Again, scores from 5-1 were applied to the descriptions. One of the commercial jellies and three of the experimental lots were evaluated at each session.
The pH of the jelly was obtained by inserting electrodes directly into tile jelly. The percent soluble solids was measured by refrac- tometry. A ridgelimeter, manufactured by FredC. Henson Co. for Sunkist Growers, Inc. was used to make the percent sag measurements (Black and Smit, 1972). The height of the ridgelimeter vessel was 5 cm. A Marine Colloids gel tester was used to determine shear force. The area of the probe was 93.26 mm2. The jelly was prepared in the ridgelimeter cylinders, forced from the vessels, and sliced into four equal parts. Each slice was then tested for the force necessary to puncture the surface of the gel. The percent sag and the shear-force measurements were made on separate samples.
Percent glucose was determined by the glucose-oxidase method (Glucostat preparation of Worthington Biochemical Corp). A standard curve was obtained at 400 nm using a spectrometer (Bausch and Lomb Spectronic 20).
Samples were prepared for GLC analysis by the combination steam-distillation-solvent-extraction procedure of Likens and Nickerson(1964). 200g of jelly was weighed out, 300 ml of water added and distillation carried on for 2 hr. Details of the extraction-concentration procedure have been previously described (Milutinovic et al., 1970; Powers et al., 1971).
For GLC analysis, a Perkins-Elmer model 900 dual-flame chromatograph equipped with a 1.8m, 3.175 mm (o.d.) stainless steel column packed with 8% butanediol succinate on Chromosorb W-HMDS, 80/100 mesh, was used. The temperature was programmed from 70 to 170°C at a rate of 5°/min; 4 pi of sample was injected. The area of the peaks was measured by triangulation, and the areas were then converted into percent areas by dividing the area of each peak by the total area under the chromatographic curve.Statistical analysis
The MUDAID program (Applebaum and Bargmann, 1967) was used to examine each judges scores to ascertain the judges discriminating power and reliability. By univariate analysis of variance with each judge as a vari-
7 2 4 -J O U F IN A L O F FO O D S C IE N C E -V o lu m e 3 9 (1 9 7 4 )

S U B J / O B J M E A S U R E M E N T S O N G R A P E J E L L Y - 7 9 5
T re a tm e n t
T a b le 2 —C o n t in g e n c y t a b le f o r p a la t a b i l i t y s c o r e s , c o r r e la t io n c o e f f ic ie n t s a n d p r o b a b i l i t y le v e l
S c o r e s
S u m s
N o . D e s c r ip t io n p a R b P R P R P R P R P R
1 S m u c k e r 's 0 3 0 11 4 2 6 2 7 2 9 6 9 3 2 1 0 0 10 12 S u c r o s e , 8 g p e c t in 2 0 8 5 2 0 1 6 1 6 1 3 4 1 5 5 0 4 93 2 5 % d e x t r o s e , 8 g p e c t in 5 1 1 6 7 11 9 13 1 7 5 1 6 5 0 5 04 5 0 % in v e r t s y r u p , 8 g p e c t in 6 0 1 4 4 1 9 1 6 11 1 5 0 1 8 5 0 5 35 S u c r o s e , 5 g p e c t in 0 1 1 6 1 0 1 4 2 0 2 4 1 9 13 5 0 5 86 S u c r o s e , 7g p e c t in 0 4 3 4 1 6 1 2 2 2 1 5 1 9 1 4 6 0 4 97 2 5 % d e x t r o s e , 5 g p e c t in 0 0 4 3 17 9 2 0 1 3 9 2 3 5 0 4 88 2 5 % d e x t r o s e , 7 g p e c t in 0 1 0 6 1 9 1 3 2 2 2 6 1 9 1 8 6 0 6 49 5 0 % d e x t r o s e , 5 g p e c t in 2 1 6 8 1 9 1 2 1 4 1 3 9 11 5 0 4 5
1 0 5 0 % d e x t r o s e , 7 g p e c t in 0 4 8 6 1 0 1 3 2 0 2 0 2 2 1 5 6 0 6 3S u m s 1 5 1 5 6 0 6 0 1 4 5 1 4 5 1 8 5 1 8 5 1 7 5 1 7 5 5 8 0 5 8 0
S t a n d a r d iz e d s c a le f o r p a n e l a s s ig n m e n t
S c o re 1 2 3 4 5T r a n s f o r m a t io n - 2 . 4 6 9 - 1 . 6 4 4 - 0 . 6 6 6 0 .1 0 2 1 .2 2 0
r = 0 .5 5 4 P r o b a b i l i t y le v e l = 1 X 1 0 " 1 s
S t a n d a r d iz e d s c a le f o r r a n d o m a s s ig n m e n t
S c o re 1 2 3 4 P
T r a n s f o r m a t io n - 5 . 0 9 8 - 0 .3 7 1 - 0 . 1 8 2 - 0 . 2 4 5 0 .9 7 4
r = 0 .1 7 1 P r o b a b i l i t y le v e l = 0 .4 9
a P a n e l 's a s s ig n m e n t o f s c o re s b R a n d o m a s s ig n m e n t o f s c o re s
able, the treatment/error F values and the root mean square error terms were used to ascertain which judges were discriminating and consistent in their judgment.
A program for categorical sealing (PREPRO) was employed to construct contingency tables (Kundert and Bargmann, 1972). Products were listed as rows and the five possible judgment scores as columns. After the contingency table has been constructed, the same frequencies with which each judgment score occurred are used once more. They are randomly distributed to the products to construct a second (random) contingency table. The canonical correlation reported for each contingency table can be used to test whether the judges discriminated between products, but charts are required which are not always easily accessible (Heck, 1960). For the person who intends to use contingency tables for interpretation, it is more helpful to see a comparison of a contingency table in which preference for a product depends on judgment with another one in which randomness alone determines the variation from product to product. Thus, while the distributions are well known for the usual large-sample (central-limit) assumptions employed in nearly all goodness-of-fit tests, they are somewhat difficult and, because of the arbitrariness of significance levels, not necessarily informative even for trained statisticians. It should be much more instructive to compare a contingency table based on data on which judgment was exercised with a parallel one based on random assignment of responses. A reader can then draw his own conclusion whether chance alone could have produced the results observed.
The program performs a second function. When a person scores two products as 3 and 4 on some scale, this may not, for example, repre
sent the same quality difference as for two products having scores of 2 and 3. The program rescales, i.e., translates, the 5-point scale values in such a way that interval lengths are comparable to the distances the panel apparently is using between scoring levels. The object of this scaling is to make distances between products as large as possible (Kundert and Bargmann,1972). The translation of categorical responses into numerical scale values has concerned scientists in many disciplines; an important consideration is the “dimensionality” concept for, in reality, different values of a categorized variable (e.g., color) represent different dimensions. One of the more promising approaches was introduced by Fisher (1940) and expanded by Lancaster (1957). It is the basis for the PREPRO routines employed here. At least two variables are required (one of which may but need not be categorized). The different responses, in our case the five responses given to a trait, are translated in such a way that the distance (a measure related to the F-statistic) in the other variable, the criterion, is maximized. There is thus no assumption of monotonicity or uni-dimensionality.
A contingency table was calculated for each of the factors judged: palatability, flavor, appearance and texture.
The transformed values were then subjected to a multivariate analysis of variance, again using the MUD AID program. This analysis produced means of products, ordered according to magnitude of scaled scores, as well as correlation coefficients between flavor, appearance, texture and palatability.
The MUDAID program was also used to calculate the correlation coefficients between the sensory evaluations and the physicochemical measurements.
After the data had been edited to eliminate those variables least correlated with sensory scores (Powers et al., 1971; Powers and Quinlan, 1973), an equation was calculated using the most effective variables. From this discriminant equation, a mean weighted over the physicochemical measurements was calculated for each product, the weights being chosen in such a way as to maximize discrimination between products.
In some instances in carrying on the MUDAID program to calculate the correlation coefficients between each GLC peak area and treatment differences, the computer would abort. The reason for this was that some peaks had areas for different treatments (products) which were significantly less than that which would be expected by chance if the areas between treatments were equal. Prior to aborting, a univariate analysis of variance has been carried out by the program. By eliminating peak areas which show a very low F value for treatment, the situation can be corrected. Subsequent multivariate analyses will invariably run to completion.
RESULTS & DISCUSSION Panel vs. random assignment
Table 2 shows a contingency table for the scores assigned to the 10 lots of jelly.
Normally, we would eliminate nondiscriminating and inconsistent judges first by running a one-way analysis of variance (see Experim ental section). Not having used PREPRO previously, we wanted to see if we would select different judges according to w hether we used the

7 9 6 - J O U R N A L O F F O O D S C I E N C E - V o l u m e 3 9 ( 1 9 7 4 )
T a b le 3 —C o n t in g e n c y t a b le f o r f l a v o r s c o re s , c o r r e la t io n c o e f f ic ie n t s , a n d p r o b a b i l i t y le v e l
S c o re s
1 2 3 4 5 S u m sT r e a t m e n t ----------------- ------------------- ------------------- ------------------ ------------------------ ---------------
N o . D e s c r ip t io n p a R b P R P R P R P R P R
1 S m u c k e r 's 1 0 0 1 2 7 1 9 2 5 2 8 6 7 4 2 1 0 0 1 0 1
2 S u c r o s e , 8 g p e c t in 0 0 8 4 13 1 6 1 5 1 1 1 4 1 8 5 0 4 9
3 2 5 % d e x t r o s e , 8 g p e c t in 1 0 1 2 5 1 5 1 0 13 1 1 9 2 4 5 0 5 0
4 5 0 % in v e r t s y r u p , 8 g p e c t in 2 0 6 2 2 0 1 5 1 5 1 6 7 2 0 5 0 5 3
5 S u c r o s e , 5 g p e c t in 0 0 1 3 9 1 4 17 1 6 2 3 2 5 5 0 5 8
6 S u c r o s e , 7 g p e c t in 0 1 2 4 1 2 1 1 2 2 2 6 2 4 1 7 6 0 4 9
7 2 5 % d e x t r o s e , 5 g p e c t in 0 0 1 1 1 5 1 0 2 0 1 5 1 4 2 2 5 0 4 8
8 2 5 % d e x t r o s e , 7 g p e c t in 0 1 9 6 1 6 8 1 6 3 0 2 4 1 9 6 0 6 4
9 5 0 % d e x t r o s e , 5 g p e c t in 0 1 9 6 1 1 1 0 1 5 1 5 1 5 1 3 5 0 4 5
1 0 5 0 % d e x t r o s e , 7 g p e c t in 1 2 6 6 1 3 1 8 1 8 1 8 2 2 1 9 6 0 6 3
S u m s 5 5 4 9 4 9 131 131 1 7 6 1 7 6 2 1 9 2 1 9 5 8 0 5 8 0
P a n e l a s s ig n m e n t
S c o re s
r = 0 .3 8 4
1- 1 . 4 8 9
2- 2 . 0 2 6
3 4 5- 0 . 9 3 3 - 0 . 0 3 8 1 .0 7 6
P r o b a b i l i t y = 4 .6 X 1 0 " ' 0
R a n d o m a s s ig n m e n t
S c o re s 1- 6 . 0 8 6
2 3 4 5- 1 . 0 1 7 0 .5 6 5 - 0 . 9 6 0 0 .8 0 0
r = 0 .1 8 P r o b a b i l i t y = 0 .3 3
a P a n e l 's a s s ig n m e n t o f s c o re s b R a n d o m a s s ig n m e n t o f s c o re s
original scores or the transformed values.Table 2 is actually two contingency
tables combined. The program first prints out the frequency of assignment of scores at the different score levels according to the products. In Table 2, these are the values listed under the columns headed ‘P \ After computing the correlation coefficient between the score levels and the products and determining the distance between score levels, the program constructs a second contingency table. The same values are assigned at random, keeping exactly the same columns and selecting rows at random (row sums are only approximately equal to the observed ones). The purpose is to learn whether the panelists are truly making judgments based on preference or they are approaching random choices. The r values listed at the bottom of Table 2 show that the panelists had clear-cut preferences among the treatments. The probability is 1 x 10’1S for the frequency distribution to come out in the way the panel assigned scores if there were no differences, whereas the probability is 0.49 for the random assignment. Had the two correlation coefficients been approximately the same, no further analysis would have been justified.
Interval distanceThe second thing which can be seen
from Table 2 is that the panel’s judgment about distances between score levels is not uniform. Between score levels 3 and
4, the distance is 0.768, but between 4 and 5 it is 1.118. Note also that the random assignment is inconsistent.Reversal of score levels
Unlike palatability, for which the panelists used the entire span of five scoring levels, the panelists rarely did so when flavor was evaluated. Table 3 shows a reversal between score levels 1 and 2. In other words, the panel had truncated the score range by not using it fully; so the scale should be contracted to four levels,i.e., levels 1 and 2 combined. This was done in subsequent analyses. This again shows the fact that the chosen statistical technique does not assume monotonicity in the transformation. In this application,
where the underlying scale is at least supposed to he ordinal the proper scientific conclusion would be that judges fail to discriminate at the lower end.
In spite of the panel s indecisiveness with regard to score levels 1 and 2, the contingency table showed that the panel, again, had clear-cut preferences for some of the treatments. The correlation coefficient for the panel’s assignment was 0.384 (4.6 x 10"10 probability) whereas the randomly assigned values had an r value of 0.18 (probability, 0.33).
Appearance and texture were analyzed in the same fashion. Actually, the four contingency tables for palatability, flavor, appearance and texture (and the corre-
T a b le 4 —C o r r e la t io n s b e tw e e n p r o d u c t s a n d ju d g e s ’ s c o re s
1 0 P ro d u c ts -
P a n e l a s s ig n m e n t
- 1 0 Ju d g e s
R a n d o m a s s ig n m e n t
r P r o b a b i l i t y le v e l r P r o b a b i l i t y le v e l
P a la t a b i l i t y 0 .5 5 1 X 1 0 ' 5 0 .1 7 0 .4 9F la v o r 0 .3 8 4 .6 X 1 0 ' 1 0 0 .1 8 0 .3 3T e x t u re 0 .5 8 5 .0 X 1 0 ‘ ‘ 4 0 .1 6 0 .4 0
1 0 P r o d u c t s —7 B e s t Ju d g e s
P a la t a b i l i t y 0 .6 3 2 .4 X 1 0 '* 3 0 . 2 2 0 .5 2F la v o r 0 .4 7 1 . 8 x 1 0 ‘ ‘ 3 0 .1 5 0 .5 3C o lo r 0 .3 6 1 .3 x 1 0 ' 5 0 .1 9 0 .3 6T e x t u r e 0 .6 2 3 .3 X I O ' 1 3 0 . 2 1 0 .4 9

S U B J / O B J M E A S U R E M E N T S O N G R A P E J E L L Y - 7 9 7
sponding random tables) were obtained from the same computer run.Selection of judges
Having learned that there were distinct preferences for each of the qualities judged, we looked at the scores more critically so as to carry on further analyses only with judges who could discriminate well. As pointed out above, this would normally have been done first.
The PREPRO program can be instructed to punch out a new deck of cards with the transformed values. These
values were used to determine the judges’ discriminating power and reliability. The judgments of seven of the original 12 judges were statistically significant at the 0.05 level for palatability, flavor, color and texture. Some of the other judges were satisfactory for one or two categories but not all four.
The original score values for the most discriminating judges were run through the PREPRO program again to sharpen up the transformed values somewhat, on the assumption that the scores of the 3
judges who were dropped would have affected the scaling distance. (Two of the original judges were eliminated before any analyses were made because it was obvious they were inconsistent.) The correlation coefficients improved in each case (Table 4). Once the new set of transformed values (for the seven judges) were obtained, the data were subjected to analysis of variance (MUDAID program) to determine the differences between products and to permit calculation of significant differences (Tables 5, 6, 7, 8).
T a b le 5 —A c c e p t a b i l i t y s c o re s a n d le a s t s ig n i f i c a n t 3 d if f e r e n c e b e tw e e n p r o d u c t s ; p r o d u c t s l is t e d in o r d e r o f d e c re a s in g d e s i r a b i l i t y
P r o d u c t
P r o d u c t
5 1 0 8 6 7 9 2 3 4
1 X XX XX XX XX XX XX XX XX
5 X XX XX XX
1 0 X X XX XX XX
8 X XX XX XX
6 X XX XX XX
7 X XX XX
9 X X X
S c o r e s f o r p r o d u c t s a n d n u m b e r o f ju d g m e n t s
N o . N o .P r o d u c t S c o r e ju d g m e n t s P r o d u c t S c o r e ju d g m e n t s
1 0 . 9 7 2 7 0 7 0 . 0 9 7 3 5
5 0 . 3 2 0 3 5 9 - 0 . 2 8 3 3 5
1 0 0 . 2 5 6 4 2 2 - 0 . 6 6 5 3 5
8 0 . 2 2 3 4 2 3 - 0 . 9 0 9 3 5
6 0 . 1 1 8 4 2 4 - 1 . 0 4 1 3 5
x = S ig n i f ic a n c e a t 0 .0 5 le v e l b y F is h e r 's L . S . D . t e s t , x x = S ig n i f ic a n c e a t le a s t a t 0 .0 5 le v e l b y R o y - S c h e f f e t e s t .
T a b le 6 — F la v o r s c o re s a n d le a s t s ig n i f i c a n t 3 d i f f e r e n c e b e tw e e n p r o d u c t s
P r o d u c t
P r o d u c t
5 8 7 6 1 0 9 2 4 3
1 X X X X XX XX XX XX XX
5 X XX XX XX
8 X X X XX
7 X X X
6 X X X
1 0 X X X
9 X
S c o r e s f o r p r o d u c t s 15
P r o d u c t S c o r e P r o d u c t S c o r e
1 0 . 7 6 4 1 0 - 0 . 0 0 9
5 0 . 2 9 0 9 - 0 . 3 2 4
8 0 .1 7 1 2 - 0 . 4 3 0
7 0 . 0 6 9 4 - 0 . 5 9 1
6 0 . 0 4 2 3 - 0 . 7 8 2
3 x = S ig n i f i c a n c e a t 0 .0 5 le v e l b y F is h e r 's L . S . D . t e s t .x x = S ig n i f ic a n c e a t le a s t a t 0 .0 5 le v e l b y R o y - S c h e f f e t e s t .
b T h e n u m b e r o f ju d g m e n t s f o r e a c h p r o d u c t is th e s a m e as l is te d in T a b le 5 .
T a b le 7 —T e x t u r e s c o re s a n d le a s t s ig n i f i c a n t d i f f e r e n c e 3 b e tw e e n p r o d u c t s
P r o d u c t
P r o d u c t
6 8 5 1 0 9 7 2 4 3
1 X X X X XX XX XX XX
6 X XX XX XX XX
8 X XX XX XX XX
5 X XX XX XX XX
10 XX XX XX XX
9 XX XX XX XX
7 X XX XX
S c o r e s f o r p r o d u c t s 15
P r o d u c t S c o r e P r o d u c t S c o r e
1 0 . 6 6 8 9 0 . 1 0 7
6 0 . 3 9 5 7 - 0 . 0 6 7
8 0 . 3 4 5 2 - 0 . 7 5 4
5 0 . 3 3 6 4 - 1 . 0 3 2
1 0 0 . 2 7 7 3 1 . 1 4 5
3 x = S ig n i f ic a n c e a t 0 .0 5 le v e l b y F is h e r 's L . S . D . t e s t .x x = S ig n i f ic a n c e a t le a s t a t 0 .0 5 le v e l b y R o y - S c h e f f e te s t ,
b T h e n u m b e r o f ju d g m e n t s f o r e a c h p r o d u c t is t h e s a m e a s l is te d in T a b le 5 .
T a b le 8 —A p p e a r a n c e s c o re s a n d le a s t s ig n i f i c a n t 3 d i f f e r e n c e b e tw e e n p r o d u c t s
P r o d u c t
P r o d u c t
5 8 1 0 6 9 7 2 3 4
1 X X X X X X XX XX XX
5 X X X
8 X X
1 0 X X
6 X X
9 X
7 X
S c o r e s f o r p r o d u c t s '5
P r o d u c t S c o r e P r o d u c t S c o r e
1 0 . 6 3 3 9 - 0 . 0 6 9
5 0 . 1 1 2 7 - 0 . 0 8 7
8 0 . 0 5 4 2 - 0 . 3 3 8
1 0 0 . 0 5 0 3 - 0 . 4 8 5
6 0 . 0 2 7 4 - 0 . 5 6 7
3 x = S ig n i f ic a n c e a t 0 .0 5 le v e l b y F is h e r 's L . S . D . t e s t v x x = S ig n i f ic a n c e a t le a s t a t 0 .0 5 le v e l b y R o y - S c h e f f e t e s t ,
b T h e n u m b e r o f ju d g m e n t s f o r e a c h p r o d u c t is th e s a m e a s l is te d in T a b le 5 .

798-JOURNAL OF FOOD SCIENCE-Volume 39 (1974)
T a b le 9 —M ultip le and sim ple palatab ility
co rre la tio n co effic ien ts for co lo r , flavor, tex tu re vs.
C o m b inatio n R 2 E lim in ated R 2
Flavo r, appearance, texture vs. a ccep tab ility 0 .6 0 2 Flavo r, texture vs. a ccep tab ility 0 .5 8 7 A ppearance 0 .3 0 4A p pearance, texture vs. a cceptab ility 0.481 Flavor 0 .4 0 7F lavo r, appearance vs. a ccep tab ility 0 .4 7 7 T e x tu re 0 .3 9 8Flavor vs. a ccep tab ility 0 .4 0 7 A ppearance, texture 0.481T e x tu re vs. a ccep tab ility 0 .3 9 8 F lavo r, appearance 0 .4 7 7A ppearance vs. a cceptab ility 0 .3 0 4 F lavo r, texture 0 .5 8 7
P alatab ilityC o rre la tio n s
Flavo r A ppearance T e x tu re
Palatab ility 1 0 .6 3 7 9 0 .5 5 1 4 0 .6 3 0 5Flavor 1 0 .5 0 5 5 0 .3 6 9 9A ppearance 1 0 .4 7 0 8
Effects of treatmentIn all sensory categories, the three
treatments containing 8g of pectin were rated the lowest, although in appearance products 2, 3 and 4 were not significantly different from some of the other products. The commercial sample was always rated significantly higher than the experimental lots. There were thus essentially three categories: the commercial product, the products containing 5 or 7g of pectin, and the products containing 8g of pectin. The kind of sugar influenced the scores somewhat but not consistently. With respect to flavor (which includes taste), 25% replacement of the dextrose did not affect flavor (compare treatments 5 and 7 or 6 and 8), but 50% invert syrup did cause a significant difference between treatments 5 or 7 and 9. The same was not true between treatments 6, 8 or 10. With respect to texture, the sucrose seemed to offset what would have been the somewhat more tender structure of the 5g of pectin treatments. When a product was scored low in one category, it tended to be scored low in other categories. This of course is often observed in taste testing.
The values listed in Tables 5—8 show the range encountered when the raw scores were transformed to reflect the different intervals between scoring levels. The two different significant tests listed show the difference in interpretation one would make according to whether a fairly liberal test (Fisher’s L.S.D. test) or a more conservative test for significance (the Roy-Scheffe test) is used.Simple and multiple correlations
Table 9 shows the simple and multiple correlation coefficients for flavor, appearance and texture as they relate to p a y a bility. Flavor and texture were more highly correlated with palatability than appearance. The jellies were all made from the same brand of juice, and noth
ing was done to purposely influence color whereas experimental variations were introduced to affect flavor and gel characteristics. The range of appearance differences was thus less, and correspondingly, correlation is more difficult to establish.
Subjective vs. objective measurements
Of the physical-chemical tests carried on, percent sag and shear-force measurements were most highly correlated with texture (and by derivation thus with general preference). Texture and pH were also significantly correlated although the pH ranged from only 3.0—3.14. Jell strength and pH are of course related.
With respect to flavor, the areas of 29 of the GLC peaks were measured. Ultimately, the data were edited down to eight peaks most highly correlated with flavor. Of the eight peaks, only three were by themselves significantly correlated with flavor, but discrimination among products was better with eight peaks than with three peaks.
Using the eight peaks, weighted averages were calculated for products three and eight, these being among the poorest and the best of the experimental products. The Z values were, respectively, — 14,650 and —7,259. When the shear- force and percent sag measurements were substituted for the two GLC peak areas least correlated with flavor, the respective values were then 12.8 and 35.1, or a twofold difference had increased to threefold. (Because only two treatments were involved, the matrix could not be inverted with 10 factors; two of the peaks had to be eliminated to accomodate the two physical measurements.) Though the shear force and percent sag measurements by themselves were not linearly correlated with texture, they in combination with the GLC measurements added appreciably to the power of the discriminant equation.
The multiple correlation phase of the trials demonstrated in a numerical fashion that flavor should be accorded more weight than it is in some food grading systems. For acceptability, objective tests should logically include measurement values related to each of the sense modalities (scent, taste, sight, feel, and, for some things, perhaps sound). The trials demonstrated that a combination of measurement values related to flavor and texture were more efficient in discriminating between treatments than values for flavor or texture alone.
REFERENCESA pp leb au m , M . and Bargm ann, R .E . 1 9 6 7 . A
F o rtra n I I program fo r M U D A ID m u ltiv a r ia te , un ivaria te , and d iscrim inan t analysis o f irregular data. Tech. R ep t. N O N R 1 8 3 4 (3 9 ) , U n ivers ity o f Illin o is , U rb an a , 111.
Biggers, R .E ., H ilto n , J.J. and G ian tu rco , M .A .1 9 6 9 . D iffe re n tia tio n b etw een C o ffea ara- bica and C o ffea robusta by c om puter evalua t io n o f gas-chromatc graphic profiles: com parisons o f n u m erica lly derived q u a lity predictions w ith organo leptic eva luation . J. C h ro m at. Sci. 7 (3 ) : 4 5 3 .
Biswas, A .K . and Biswas, A .K . 1 9 7 1 . B iological and chem ical factors a ffec tin g the valuation o f N orth -E ast In d ia n plain teas. 1 . S ta tis tica l association c f liquo r characteristics w ith cash valuation o f b lack teas. J. Sci. F d . Agric. 2 2 : 191 .
Biswas, A .K ., Biswas, A .K . and Sarkar, A .R . 1 97 1 . B iological and chem ical factors a ffe c ting the valuations o f N o rth -E a s t In d ia n p lain teas. 2 . S tatis tica l evaluation o f the b io chem ical constituents and th e ir e ffects on briskness, q u a lity , and cash valuations. J. Sci. F d . A gric. 22: 1 96 .
B lack, S .A . and S m it, C .J .B . 1 9 7 2 . T h e grading o f low -ester pectin fo r use in dessert gels. J. Food Sci. 37: 7 26 .
D ravnieks, A . and K ro toszyn sk i, B .K . 1 9 6 8 . Collecting and processing a irborne chem ical in fo rm a tio n 2. J. Gas C h ro m ato . 6: 1 44 .
D ravnieks, A ., K ro toszyn sk i, B .K ., K e ith , L . and Bush, I .M . 1 9 7 0 . O d or thresho ld and gas-chrom atographic assays o f vaginal odors: changes w ith n itro fu razo n e tre a tm e n t. J. Pharm aeeut. Sci. 5 9 : 4 95 .
D ravnieks, A ,, R e ilic h , H .G ., W h ite fie ld . J. and W atson, C .A . 1 9 7 3 . C lassification o f corn odor by statistical analysis o f gas c h ro m ato graphic patterns o f headspace vo latiles . J. F o o d Sci. 3 8 : 3 4 .
Fisher, R .A . 1 9 4 0 . Th e precision o f d isc rim inant functions. A n n . Eugenics 1 0: 4 2 2 .

SUBJ/OBJ MEASUREMENTS ON GRAPE JELL Y- 799
H eck, D .L . 1 9 6 0 . Charts o f s o m e upper percentage po in ts o f the d is tr ib u tio n o f the largest characteristic ro o t. A n n . M a th . Sta. 31: 6 25 .
Kosaric, N ., D uong, T .B . and Svrcek, W .Y .1 9 7 3 . A statistical approach to the subjective and ob jective m easurem ent o f odors induced by g -irrad ia tion o f beef fa t. J. F o o d Sci. 38: 3 69 .
K u n d ert, D .R . and Bargm ann, R .E . 1 9 7 2 . Tools o f analysis fo r p a tte rn recog n ition . Them is R e p t. N o . 22 , D ep t, o f Statistics and C om pu te r Science, U n ivers ity o f Georgia, A th ens, G A 3 0 6 0 2 .
Lancaster, H .O . 1 9 5 7 . Som e properties o f the b ivariate norm al d is tr ib u tio n considered in the fo rm o f a contingency tab le . B io m e trika 4 4: 2 89 .
L ikens , S .T . and N ickerson , G .B . 1 9 6 4 . D e te rm in a tio n o f certa in hop o il constituents in brew ing products. Proc. A m . Soc. Brew ing Chemists, A nnu al M eeting 1 9 6 4 . 5—13.
M ilu tin o v ic , L ., B argm ann, R .E ., Chang, E -Y , Chastain, M . and Powers, J.J. 1 9 7 0 . C om parison o f flavor and volatiles o f to m a to products and o f peanuts. J. F o o d Sci. 35: 2 24 .
Persson, T . and von S ydow , E . 1 9 7 2 . A q u a lity com parison o f fro zen and refrigerated cooked sliced beef. 2 . R elationships be
tw een gas chrom atograph ic data and flavor scores. J. F o o d Sci. 37: 2 34 .
Persson, T . and von S yd o w , E . 1 9 7 3 . A ro m a o f canned beef. Gas chrom atographic and mass spectrom etric analysis o f the volatiles. J. F o o d Sci. 38: 3 77 .
Persson, T ., von S yd o w , E . and Akesson, C.1 9 7 3 . Th e a ro m a o f canned beef: m odels fo r c o rre la tion o f in s tru m en ta l and sensory data . J. F o o d Sci. 38: 6 8 2 .
Powers, J.J. 1 9 6 8 . T o w ard ob jective evaluation o f food flavors. F o o d Techno l. 2 2 : 3 83 .
Powers, J.J. 1 9 7 0 . M easurem ent o f re lative c o n trib u tio n o f constituen ts to flavor com position . Proceedings, T h ird In te rn a tio n a l Congress o f F o o d Science & Techno logy, W ashington, D .C ., p. 3 95 .
Powers, J .J ., C ox , R .J ., E ilan d , M .C . and A ck - ro y d -K e lly , P. 1 9 7 1 . Exposure o f peanuts and peanut volatiles to light: in fluence on f lo u r flavour and gas-chrom atographic pro file . Th e F lavou r In d . 2: 87 .
Powers, J.J. and K e ith , E .S . 1 9 6 8 . Stepwise discrim inan t analysis o f gas chro m ato graphic data as an a id in classifying the flavor q u a lity o f foods. J. F o o d Sci. 33: 2 07 .
Powers, J .J . and Q u in lan , M .C . 1 9 7 3 . Subjective-objective evaluation o f m odel od or system. Lebensm . Wiss. T e c h n o l. 6: 2 09 .
S upran, M .K ., Powers, J .J ., R ao , P .V ., D o rn - seifer, T .P . and K ing , P .H . 1 9 6 6 . C o m p arison o f d iffe re n t organic acids fo r the a c id ification o f canned p im ien tos . Fo o d Techno l. 20: 1 17 .
Tanaka , T . and S a ito , N . 1 9 6 9 . Studies on sensory eva luation o f soy sauce. 1 0 . R e la t io n b etw een odor patterns and chem ical factors (1 ) . J. F e rm e n t. Techno l. 4 7 : 7 8 0 .
Tanaka , T ., S a ito , N . and Y o k o ts u k a , T . 1 9 7 0 . Studies on sensory evaluation o f soy sauce. 11 . R elations b etw een odor patterns and chem ical facto rs (2 ) . J . F e rm e n t. Techno l. 48: 56.
von S ydow , E ., Andersson, J ., A n jo u , K ., Karlsson, G ., L a n d , D . and G riffith s , N .1 9 7 0 . A ro m a o f b ilberries (V a cc in u m m y rtillu s ). 2. E va lu a tio n o f the press ju ice b y sensory m ethods and by gas chrom atograp hy and mass spec trom etry . Lebensm . Wiss. Techno l. 3 (1 ): 11.
V u a ta z , L . and R e y m o n d , D . 1 9 7 1 . M a th e m a tical trea tm e n t o f GC data: app lication to tea q u a lity eva luation . J. C hrom ât. Sci. 9 : 1 9 8 .
Y o u n g , L .L ., Bargm ann, R .E . and Powers, J.J. 1 9 7 0 . C o rre la tio n b etw een gas chro m ato graphic patterns and flavor evaluation o f chem ical m ix tu res and cola beverages. J. F o o d Sci. 35: 2 1 9 .
Ms received 8 /1 8 /7 3 : revised 1 2 /2 6 /7 3 ; accepted 1 2 /2 8 /7 3 .

E D W A R D W. R O S S J R .
O ff ic e o f T h e T e ch n ica l D ire c to r , U .S. A r m y N a tic k L a b o ra to r ie s , N a tic k , M A 0 1 7 6 0
STATISTICAL ESTIMATION OF 12D FOR RADAPPERTIZED FOODS
INTRODUCTIONTHIS REPORT is concerned with the determination of safe sterilization processes for canned food, i.e., processes which insure that the food is free of dangerous organisms. Although ionizing radiation is the method of sterilization considered here, the mathematical procedures described are equally applicable to any method of killing microorganisms in food.
We may summarize the present situation as follows. An expert committee of the United Nations Food and Agriculture, World Health Organization and the International Atomic Energy Agency (1968) has recommended a criterion of safety for radiation-sterilization which states that the probability must be no more than 1 x 10"1 2 that a dangerous microorganism (usually C los trid ium b o tu lin u m ) will survive the processing. The processing consists of exposing sealed cans of food to a dose of radiation under specified conditions, and the dose needed to satisfy the above criterion is called the 12D dose or minimal radiation dose (MRD). The 12D dose depends on both the microorganism and conditions (temperature, salinity, pH, etc.) in the food substrate and is a measure of the radiation resistance of the microorganisms.
The presently accepted procedure for estimating the 12D dose follows the January 197 1 recommendation of the National Academy of Science-National Research Council’s Advisory Committee to Natick Laboratories on Microbiology of Food. The procedure consists of a set of experiments, collectively called an inoculated pack, and a computation based on the resulting data. The experiments consist of inoculating cans of food with spores of C. b o tu linu m , sealing the cans and exposing them to doses of radiation. Typically, 107 spores are inoculated in each can, 100 replicate cans are exposed to each dose and the doses may range from 0 —5 megarads in increments of 0.5 megarads. After irradiation all cans are incubated for 6 months at 30°C. The cans are examined for swelling weekly during the first month and monthly thereafter. At the end of incubation cans are tested for toxin presence, and all cans showing neither swelling nor toxin are subcultured for surviving spores. The computation takes the resulting partial spoilage data (usually based on surviving spores) and calculates the 12D dose by using the Schmidt-Nank formula (1960).
In this paper we first present a coherent and rather simple mathematical theory that is a basis for treating the results of an inoculated pack. With the aid of this theory we then discuss the inadequacies of the accepted procedure (outlined above) and describe certain changes in both the experimental design and manner of computation that lead to an improved estimate of the 12D dose.
GENERAL THEORYIN THIS SECTION we give a simple probabilistic theory of spore sterilization and examine the conventional experiments in the light of this theory. The theory brings one main difficulty into clear view and suggests a way of dealing with it.
We assume that each spore in a given medium, irradiated under given conditions of temperature, pH, etc. possesses a unique minimum lethal dose, X. If subjected to a dose above X, the spore will be inactivated,i.e., it wHl be unable to produce toxin and descendants; otherwise it
will remain dangerous. The lethal dose, X, is a random variable, and we assume that it possesses a probability distribution function, G(x), and probability density function,
G(x) = Probability that X < x (1)
f(x) = dG(x)/dx (2)
The 12D dose, which we call xc, satisfies the equation
G(xc) = Probability that X < xc
= 1 - (Probability that X > xc) = 1 - H P 2 (3)
In the experiments, n spores (typically n = 10’ ) are put into a can and irradiated at the dose x under the test conditions. We say that a can is sterilized if all the spores in it are inactivated, and define Zn as the minimum dose at which a can containing n spores is sterilized. Different cans will have different Zn-values, hence Zn is a random variable, just as X is. The distribution and density functions associated with Zn are <hn(x), and 0n(x),
4>n(x) = Probability that Zn < x (4)
0n(x) = d<t>n(x)/dx (5)
Equation (4) means that 4>n(x) is the theoretical fraction of cans sterilized at dose x.
There is a very important and well-known relation between 4>n(x) and G(x), which is a consequence of the fact that, if X ,, X, . . ., Xn are the minimum lethal doses of the n spores in the can, then Zn is the largest of these doses. The relation, given in Gumbel (1958) and many other books on probability, is
<t»n(x)= (G(x)j" (6)
A somewhat different form of this relation is obtained by rewritingit as
<I>n(x) = {l - [1 - G (x)]|n = 11 - n1— | n
«= e‘n [1 — G (x )J (7 )
a result which is very accurate when n > > 1 and 1 - G is small, which is almost always the situation when we need to know 4>n(x). Solving (7)for G(x) we obtain with great accuracy
G(x) « 1 + n '1 2 n <t>n(x) (8)
In addition we obtain from (5) and (6)
0n(x) =n [G(x)]“ -1 f(x) (9)
Finally, it can be shown (Gumbel, 1958), that
4>n(x) * e'(e"y), 0n(x) « anc<y + e'y> (10)
y = oin ( x - U n ) (11)
where Un, the characteristic largest value, and an, the extremal intensity function, are found from
G(Un) = 1 - n - ', a n = nf(Un) = n j- (Un) (12)dx
8 0 0 - J O U R N A L O F F O O D S C I E N C E - V o l u m e 3 9 ( 1 9 7 4 )

STATISTICAL ESTIMATION OF 720 -8 01
The distribution defined by (10) to (12) is called the extreme-value distribution derived from the distribution G(x). Formulae (6) and (9) are exact, and (7) and (8) are such good approximations that they too may be regarded as exact for all practical purposes. Equations (10) are approximations to the exact relations (6) and (9) and are accurate when Ix-Unl is not too large. The region where (10) is most accurate is the partial spoilage range, i.e., the x-values for which <t*n(x) is near neither zero nor one. The quantities Un and an‘‘ are approximate measures, respectively, of the location and width of the partial spoilage range for cans containing n spores. As n increases, Un (but not necessarily an_1) increases, i.e., the partial spoilage range moves outward.
In the conventional inoculated pack N cans, each containing n spores, are exposed to a dose x, and after suitable incubation, counts are made of the number, C(x), of cans that are sterilized or clean. Such a pack can be regarded as a sample of N cans, each of which has probability of sterilization <I>n(x). It is well-known that the probability that exactly % cans will be sterilized is given by the binomial distribution,Probability that [C(x) = £]
N'• . ,(N ' r | ! [«n001* [1 -1>n(x)]N -g (13)
Moreover, the best estimate of 4>n(x) that can be obtained from the data is
4>n(x) s estimate of 4>n(x) = f/N (14)
and, if N > > 1, <Sn(x) is approximately normally distributed about its mean, <t>n(x), with estimated standard deviation
l* n f l -<£>n)/N]'/2 (15)
To summarize, we obtain from the conventional inoculated pack an experimental fraction, (14), of cans sterilized at dose x, and this is the best obtainable estimate of *t>n(x). If packs are run at several different doses, we obtain several points on an experimentally-determined graph of 4>n(x). There will be some scatter or noise in this graph, much of which is caused by the sampling error (i.e., the fact that <Pn(x) A 4>n(x)) although some may also be due to random fluctuation in spore load, n, and dose, x. Formula (15) is an estimate of the scatter at dose x due to the sampling error.
Clearly, the inoculated pack provides quite a lot of information about 4>n(x), especially if packs are run at several different doses. However, this information is of little use unless it leads to comparable information about G(x), for it is G(x) that enters the calculation of the 12D dose in Equation (3). In order to apply Equation (3), we have to know both the general form and parameter values of G. We shall see later that it is relatively easy to estimate the parameter values of G from data on <t>n(x) if the general form of G is known, but it is not easy to find the general form of G.
This seems strange at first glance, for we can find G(x) from 4>n(x) directly by means of Equation (8). The difficulty arises because the doses at which 4>n(x) is known are far out on the right-hand tail of the distribution G(x). All probability distributions look very much alike in this region, and the scatter in G(x) that arises from the scatter in the estimates of 4>n(x) will make it very difficult to see the small differences between distributions.
Of course this difficulty does not arise if the form of G(x) is known. It is usually assumed (Schmidt, 1963) that G(x) is of simple exponential form. There is some (perhaps inconclusive) evidence to support this assumption when the spores are in a model system (i.e., a transparent, fluid substrate), see e.g., Anellis et al. (1965). In the critique of the Schmidt-Nank calculation we shall show evidence against the assumption when spores are in a food.
Thus there is a need to determine G(x) from measurements of 4>n(x). Since the conventional inoculated pack was not designed for finding the form of G(x), we should expect that other experimental designs may be superior for that purpose. Intuition suggests that differences in distributions will be most visible when we have data over a wide range in x. The simplest way of obtaining this wide range is to test at several different spore loads, i.e., values of n, because the partial spoilage range moves outward as n increases. We shall pursue this line of thought further in a later section.
A CRITIQUE OF THE SCHMIDT-NANK CALCULATIONTHIS SECTION contains a sketch and critique of the Schmidt- Nank procedure for estimating the 12D dose.
The experimental procedure for a conventional inoculated pack has been described previously. The resulting data are <f'n(x), see Equation (14), evaluated at one or more x-values. The Schmidt-Nank procedure for estimating the 12D dose is based primarily on the assumption that G(x) is of simple exponential form,
G(x) = 1 — e'Ax, x > 0 (16)
If N is the number of cans tested at dose x, n is the number of spores in each can and R is the total number of surviving spores, then some simple manipulations show that xc can be estimated from
xc = 12D (17)
logI0 (Nn) - logio RHere D is the estimated value of D, the decimating dose, i.e., dose at which the probability of spore death is
G(D) = 9/10These formulae are not very useful as they stand because
there is no practical way to measure R. In the Schmidt-Nank method this difficulty is overcome by a second assumption, namely that exactly one spore survives in every can that is spoiled (not sterilized), i.e.,
£R = N ¿ = N ( 1 ~ n ) (19)
or, using (14),
R = N [1 -4 > n(x)] (20)
if § out of N cans are sterilized at dose x. This estimate of R is used in Equation (18) and permits the evaluation of D and hence
The Schmidt-Nank formula, (18), has been generally accepted as a simple, standard method for estimating the 12D dose. However, in recent years other procedures have been suggested as alternatives to the Schmidt-Nank formula (Anellis and Werkowski, 1968; 1971). This is evidence of growing uneasiness about the accuracy of the method, but no systematic study of its validity has appeared. One is presented in the ensuing paragraphs.
The principle criticisms that can be levelled against the Schmidt-Nank procedure are listed here and then discussed below.(1) The assumption of an exponential distribution may be
wrong.(2) The assumption that one spore survives in each can that
is not sterilized is questionable.(3) The results of using the method on experimental data
are inconsistent with the assumptions.(4) The procedure is confusing and unclear.
First, there is much experimental evidence that something is wrong with the Schmidt-Nank formula. For, if it is applied to experimental data at several different doses, it gives an estimate of D (and hence xc) derived from each test dose. If the theory is correct, the same D should be obtained from each test dose, aside from random fluctuations. A typical set of experimental results (Anellis and Werkowski, 1968) is reproduced in Table 1. It is clear from this and other data (Anellis et al., 1969; 1972; Grecz et al., 1965; Segner and Schmidt,1966), that the estimate of D increases very markedly as x increases. This trend is unambiguous and far too pervasive to be attributed to any sort of randomness. It is completely at odds with the theory although it is hard to discern whether assumptions (1) or (2) or both are at fault.

802-JOURNAL OF FOOD SCIENCE-Volume 39 (1974)
T a b le 1—R ad ia tio n resistance of representative stra ins of C . bo tu lin um spores in cured ham
S tra in
N o. of cans w ith viable
Dose C . bo tu lin umSch m id t-N an k
D-value
33 A 1.0 17/20 0 .1 4 81 .5 15/20 0 .2 2 02 .0 8 /2 0 0 .2 8 22 .5 1/100 0 .2 8 8
77 A 1 .0 16/2 0 0 .1 6 71.5 11/20 0 .2 4 52 .0 5 /2 0 0 .3 0 9
1 2 8 8 5 A 1 .0 19/2 0 0 .1 4 91.5 5 /2 0 0 .2 0 62 .0 3 /2 0 0 .2 6 73 .0 1/1 0 0 0 .3 4 6
41 B .5 18/20 0 .0 7 21.0 13/20 0 .1 4 21 .5 6 /2 0 0 .2 0 32 .5 1/100 0 .2 8 2
53 B .5 19/20 0.0711.0 14/20 0 .1 4 01.5 8 /20 0 .2 0 32 .0 1/20 0.241
formulae show it, Equations (18) and (20), but the failure to point it out explicitly has led to confusion when trying to modify the calculation.
For example, Anellis and Werkowski (1968) describe an attempt (by Weibull plotting) to ascertain the form of the partial spoilage distribution, i.e., 4>n(x). The conclusion, that the distribution was nearly normal, is not seriously inconsistent with the form (10). However, the interpretation was marred by a number of confusing statements, evidently arising from failure to distinguish G(x) from 4>n(x).
To summarize, the most telling criticism of the Schmidt- Nank computation is that its results contradict the assumption that D is a constant. Another valid general criticism is that the derivation is confusing. The specific assumption that one spore survives in each spoiled can is illogical and should be abandoned, but it does not usually cause large errors in the estimate of D. The assumption of an exponential distribution is cast into doubt by the experimental evidence that D is not constant.
It appears, therefore, that both the experimental design of the inoculated pack and the procedure for estimating the D- value should be modified.
ALTERNATIVE DISTRIBUTION FUNCTIONS FOR SPORE DEATH
WE SHALL CONSIDER two distributions as possible replacements for the exponential distribution. They are listed below.Weibull distribution
The distribution function is
Second, the assumption (2) implies a relation between 4>n(x) and G(x) that is different from (6). To see this, we notice that assumption (2) implies that only two outcomes of a can sterilization experiment are possible, namely either (a) the can is sterilized or (b) exactly one spore survives in it. Hence, on this assumption
1 — 4>n(x) = theoretical fraction of cans in which exactly one spore survives.
G(x) = 0 , x < 0
= 1 — exp[ - ( x / t7)0 ], x > 0
where r? > 0 and (3 > 0. From Equations (12) we find
Un =i7(logen ) 1/(3(22)
c<n = (0/Un)logen
Since N cans are irradiated, the total theoretical number of surviving spores is N [1 — 4>n(x)] out of Nn spores exposed. The fraction of spores surviving is
N[ 1 - 4>n(x)]------- 7t-------- = 1 — fraction killed = 1 — G(x)Nn
Therefore, we would obtain
'Fnfx) = 1 — n[ 1 — G(x)]
or G(x) = 1 — n-1 [1 — 4>n(x)] (21)
instead of (6), as a consequence of assumption (2). Equation(6) was derived from the reasonable assumption that the minimum sterilizing dose for a can is the minimum lethal dose for the most resistant spore in the can. Assumption (2) therefore gives results which disagree with that assumption in general, and must be logically doubtful.
Moreover, it is clear that the true total number of spores surviving radiation, R, is greater than (or equal to) the number N — given by Assumption (2), Equation (19). Equation (18) shows that an increase in R causes an increase in D, hence the true D-value is larger than that given by (18). However, the difference between these two D-values is usually not very great because almost always R < < Nn.
Finally the Schmidt-Nank calculation is confusing because in deriving it the authors did not give any clear indication that two distinct distributions, G(x) and 4>n(x), are involved. The
It is important to notice that the exponential distribution is a special case of this distribution, obtained by setting (3 = 1. (3 > 1 gives a higher death rate, and (3 < 1 a lower one, than the exponential distribution. Also, the Weibull distribution with (3 85 3.26 mimics the behavior of the Gaussian (normal) distribution in the sense that the mean, median and mode coincide when (3 ~ 3.26. However, the behavior of the Weibull distribution for large x is somewhat different from the normal distribution, regardless of the (3-value.Lognormal distribution
The lognormal distribution has
G(x) = 0, x < 0
= Gg [j3 loge(x/7?)l, x > 0
where Gg is the standardized normal distribution function
Gg(z) = (2tt)A — i
' I 6 x2 /2 dx
If Ug and ag are the Un and a n for the distribution function Gg, then Gumbel shows that
Un = TjeUg/ß
e'Ug/ßßag (23)n

STATISTICAL ESTIMATION OF 12D- 803
and therefore
anUn =|3ag (24)
Other distributions, such as the normal or Gamma distributions, could also be studied, but for the sake of brevity and simplicity we shall limit ourselves to the Weibull and lognormal distribution for the present. These are natural choices, the Weibull because it is a generalization of the exponential distribution and the lognormal because it is often the governing distribution in bacteriological studies.
A NEW METHOD FOR FINDING THE DISTRIBUTION FUNCTIONS AND 12D DOSE
IN THIS SECTION we present a general method for determining the form and parameters of the distribution function G(x) from measurements <I)n(x). The basic idea is a very simple and familiar one. We hypothesize that we have a certain form of distribution, G, and we subject the data, $ n(x), to a transformation which would reduce the data plot to a straight line if G were of the assumed form. The straightness (absence of curvature) of the plot is a measure of how well the data support the hypothesis about the form of G, and the slope and intercept of the line provide estimates of the parameters of the distribution. In practice we usually consider several competing forms of G(x), so that we subject the data to several different transformations, one appropriate for each of the competing forms. The form whose transformation produces the straightest plot is the one which fits the data best.
We illustrate the procedure by deriving the formulae appropriate to the Weibull and lognormal distributions.
Basic FormulaeWhen x > 0, the form of the Weibull distribution is
G(x) = 1 - exp[ - ( x / t?w / w ]
where (3W and r?w are the parameters. We combine this with Equation (8) to obtain
exp[ - (x/i?w / w ] = - n'1 loge $ n
or
(x/r?w),3w = h E loge n
h = - loge ( - lo g e $n)
We take logarithms again and get
Pw (loge x - loge 1?w) = loge (h + loge n)
From this we see that, if we define the transformation
yw = loge [loge n - loge (~ loge $n)l (25)
t = loge X.
then we obtain the straight line relation between yw and t,
Yw — Pw I — Pw loge V w
provided that G is a Weibull distribution with parameters Pw and tjw . This is the desired transformation.
For the lognormal distribution, the form when x > 0 is
G(x) = Gg [p L loge (x/t?l )1
where |3L and 7jL are the parameters. Omitting the details we find that the transformation
y L = Gg'1 [1 + n _1 loge $ 111 (26)
t = loge x
leads to the straight line relation
yL = Pl t — Pl loge VL
if G is a lognormal distribution with parameters (¡l and Vl -
In practice we do not know $ n(x). In its place we use the quantities $ n(xm), the experimentally obtained fractions of cans sterilized [see Equation (14)], at the test doses xm, m = 1, 2, . . . M. To decide whether the true G has Weibull or lognormal form, we construct two graphs of the data points versus loge x, using Formulae (25) and (26), respectively. The transformation which produces the straighter graph of the data points corresponds to the likelier form of G. Then, if the plot is of the form
y = A + Bt,
we obtain the estimated parameters
P = B
rj = e’^(®
(27)
(28)
for whichever distribution has been chosen. The 12D dose, xc, is estimated using
i cw = t?w (27.63)1//3w (29)
if the Weibull distribution has been selected and( 7 . 0 3 4 5 / i ? L )
x CL =VL e (30)
if the lognormal has been chosen.Experimental design
In theory the above is easy enough, but in practice it is often difficult to tell by eye which of the two plots is straighter, especially since there is noise (random fluctuations) in the data. The discussion in the latter portion of General Theory leads us to expect that both plots will appear nearly straight if they cover only the range of x corresponding to the partial spoilage range for, say, n = 107. Figure 1 shows this very clearly. It contains the two graphs for the case where $ n(x) has exactly the theoretical values, $ n(x), derived from a lognormal distribution with Pl = 2 and = 0.2 when n = 1 0 . The graph given by the lognormal transformation (the upper set of points in Fig. 1) is exactly straight. The graph given by the Weibull transformation (the lower set of points) is not exactly straight, but the curvature is so slight that it is hard to see which graph is straighter. If we were given only the data, we could not lell whether the distribution is lognormal with
= 2 and = 0.2 or Weibull with @w = 0.664 and r?w = 0.0409. Moreover, we see from Equations (27) and (28) that the 12D dose is estimated to be 6.74 if the distribution is lognormal (as it really is) and 6.06 if it is (incorrectly) thought to be of Weibull type. The large difference between these estimates of 12D attests to the importance of finding the distribution form correctly.
The discussion at the end of the General Theory section suggests that we can get around this difficulty by conducting tests at several different spore loads. This is illustrated in Figure 2, where, as in Figure 1, the data are assumed to have exactly the theoretical values derived from a lognormal distri

804-JOURNAL OF FOOD SCIENCE- Volume 39 (1974)
bution with (3L = 2 and pL = 0.2. However, we assume now that the partial spoilage data have been taken at three different spore loads, n = 103, 10s , 107. The upper graph for the lognormal distribution is exactly straight. The curvature in the lower graph, although not overwhelming, is rather easily visible, certainly much more so than in Figure 1 which is now reproduced as the portion of Figure 2 for n = 107. We conclude that it is advantageous to test at several different spore loads.
Computation schemeIn order to choose the likelier form of G from test data, we
have to decide which of the two graphs is the straighter. We have seen in Figure 2 that, even when tests are run at several spore loads, the curvature in the “incorrect” graph may not be great. Moreover, in practice the situation will be worse than shown there because of the random errors in the data. It is most desirable to have a sensitive analytical test for measuring the curvature of the graphs, rather than relying on the unaided eye.
The computational method consists of approximating the data, using the unweighted least squares procedure, by means of orthogonal polynomials
y = C0 + C ,P ,(t) + C2P2(t) (31)
the data having been first transformed by the appropriate Weibull or lognormal relation, Equation (25) or (26). Here
t = loge x, Pi (t) = t — t (32)
where t is the average value of t over all the data points. P2 (t) is a second degree polynomial, orthogonal tc P1 (t) and a constant, over the data points. Then
£ _c t0 = c , , T] = exp[ - ( ° 1 )] (33)
If we define
Q ^ j y j - [Co + C ,P 1(t) + C2P2(t)] J>2
(34)
Q = 2 i<Jyj - .[C o + C 1P,(t)]J>2
then a convenient measure of the curvature of the graph is
P = (M - 3)(Q - Q)/Q (35)
where M is the number of partial-spoilage data points.We determine the form of F by carrying out this computa
tion for both the Weibull and lcgnormal distributions and comparing the two resulting values of p, pw and pl - If Pw <- P l , we conclude that spore-death is governed by a Weibull distribution; if pw > pL, then by a lognormal distribution. The quantities pw and p l obey the Fisher variance-ratio distribution and are the quantities that arise in the likelihood-ratio test of the hypothesis that C2 = 0. Comparing the values of pw or P l with the tabulated values of Fisher’s distribution for (1, n—3) degrees of freedom permits one to make confidence statements about whether C2 = 0.
Fig. 1—G ra p h s o f lo g n o rm a l a n d W e ib u ll p lo t s Fig. 2 —G ra p h s o f lo g n o rm a l a n d W e ib u ll p lo ts o f d a ta d e r iv e d f r o m ao f d a ta d e r iv e d fr o m a lo g n o rm a l d is tr ib u t io n lo g n o rm a l d is tr ib u t io n fo r n = 1 0 3, 1 0 s a n d 1 0 1.fo r n = 70’ .

STATISTICAL ESTIMATION OF 12D- 805
Having ascertained the form of G, the constants |3 and 77 are estimated using (27) and (28), and the 12D dose is given by (29) or (30).
The experimental design described in part (b) and the computational scheme outlined above are the methods we suggest as replacements for the conventional inoculated pack and Schmidt-Nank Formula.
EXAMPLES
THIS SECTION contains two examples in which we use the preceding theory. The first example illustrates the use and accuracy of the method proposed in the previous section. Since sufficiently extensive experimental results from tests at three different spore loads were not available, it was necessary to use computer-simulated data for purposes of illustration. The second example shows how the general theory can be used with the absolute minimum amount of partial spoilage data, one point, to show that the form of G(x) is probably not exponential.Example 1
By means of a computer program the artificial partial- spoilage data shown in Table 2 were generated as the simulated outcome of an inoculated pack. Nine partial spoilage data points were obtained at three spore loads, n = 103, 105 and 107. The data were passed through the Weibull and lognormal transformations, Equations (25) and (26), and then subjected to the least squares process of the preceding subsections. The resulting estimates are
Weibull: 0W = 1 .582,7?w = .422, xcw = 3.439, pw = .069 (36)
Lognormal: 0L = 3.928,7?L= .658, i CL = 3.941,pL = 4.278 (37)
Since pw < pL, we conclude that the true distribution is of Weibull form with parameters given in (36). Moreover, comparing the values of p with the 90% confidence limit of F for (1 ,6 ) degrees of freedom, we see that pl exceeds this value,3.78, while pw does not. Hence there is no reason to doubt that the distribution is Weibull, but there is a great deal of reason to doubt that it is lognormal. In this example, then, the new method would unequivocally conclude that the distribution is of Weibull form with parameters given by (36).
The data of Table 2 were generated by assuming a distribution whose true form was Weibull with
)3W = 1.700, r?w = .470, xcw = 3.31
and tainting the results with various (roughly realistic) random
T a b le 2 —S im u la te d o u tco m e of an in o cu lated pack
Sp o re load n
Dose(m egarads)
F ra ct io n of cans sterilized
1 0 7 2 .4 19/402 .6 3 3 /4 0
1 0 s 1.8 1/402 .0 18/4 02 .2 3 3 /4 02.4 3 9 /4 0
1 0 3 1,3 4 /4 01.5 17/401.7 3 6 /4 0
errors. Since we know what the true form is, we can verify that the method gives the correct conclusion and observe that the estimates 0W, v w and (especially) xcw are quite accurate despite the random errors.
The fact that the method gives decent accuracy in this example, where the correct distribution and values of j3w, r jw and xcw are known, suggests that the method is a promising one. Many other simulated examples, not described here, have given like results. Naturally the method has to be tested on real, rather than simulated, data before a final decision is reached on its usefulness.Example 2
An ordinary inoculated pack for FDA clearance of canned ham was run at Natick Laboratories with 107 spores of C. b o tu lim im in each can and 100 cans at each dose. The test and analysis will be described elsewhere in detail, but the results based on can swelling may be described as follows (A. Anellis, private communication):
x < 1.7 all cans swollenx = 2.0 75 out of 100 cans swollenx > 2 .3 no cans swollen
We wish to see whether these results support the assumption that the distribution is exponential.
If the distribution is exponential then we have a Weibull distribution with |3 = 1,
G(x) = 1 - eTx h (38)
and because of (22)
Un = Ploge n
an = 1M
Experimentally we have obtained
l>(2.0) = 25/100 = 0.25
From Equations (10) and (11) we have
an(x - Un) = y = - loge [ - loge (<J>(x))]
Setting x = 2.0 and using <l>(2.0) as the estimate of 4>(2.0), we obtain
^(2 - ploge n) = - loge [ - loge (0.25)]
Since n = 107 this leads to
16.118= -0 .327
or
p = 0.1266
Hence, because of (38),
G(x) = 1 _ e‘7-899x
At x = 2.3 we have, therefore,
1 - G(2.3) = 1.297 x 10'8
Equation (7) then implies
<f>(2.3) = ex p (-1 0 7 x 1.297 x 10'8) = e’01297 = 0.8784

806-JOURNAL OF FOOD SCIENCE-Volume 39(1974)
From Equation (13), with % = 100 and N = 100, we see that P, the probability that 100 cans are sterilized at x = 2.3, obeys
P= [$ (2 .3 )]100 = 0 .8784'00
= 2.34 x 1CT6The smallness of P means that it is exceedingly unlikely
that we would get 100 cans sterilized at x = 2.3 if the result at x = 2.0 is correct and if the distribution is exponential (i.e., 0 =1). Since there is no reason to doubt the experimental result at x = 2.0, we must conclude that it is very improbable that the distribution is exponential. The conclusion would be more striking if it were based on recoverable botulinum cells, rather than visible swelling. These data are not yet available, but the smallness of P suggests that the conclusion is not sensitive to moderate changes in $(2.0). In any case the results tend to cast still more doubt on the assumption of exponential death for botulinum spores in canned food.
DISCUSSION & CONCLUSIONSTHE FIRST conclusion of this paper is that the accepted procedure for estimating the 12D dose of radappertized food has shortcomings that ought not to be ignored. Apparently its most serious limitation is in the assumption of exponential spore-death. If this assumption is abandoned, a procedure for finding the spore-death distribution must be provided. The experimental design and computational scheme outlined in the new method is such a procedure. If it is used, inoculated pack results can yield information about the spore-death distribution and hence well-founded estimates of the 12D dose.
Our second conclusion is that the proposed method is sufficiently promising to justify further investigation. In particular the crucial experiment consists of running tests at three or more different spore loads on an organism and substrate where the true spore-death distribution is already known with satisfactory accuracy. The doses must be closer together, and the number of replicate cans must be larger, than in previous
inoculated packs if a clear verdict is to be obtained.Finally, we should observe that much more needs to be
done before a realistic mathematical model can be obtained for such a complex process.
REFERENCESA nellis, A ., B erk o w itz , D ., Jarboe, C. and E l-B is i, H .M . 1 9 6 9 . R ad ia tio n
steriliza tion o f p ro to ty p e m ilita ry foods. 3 . P o rk lo in . A p p l. M ic ro b io l. 18: 6 04 .
A nellis , A ., B erk o w itz , D ., Sw antaks, W . and S tro jan , C. 1 9 7 2 . R ad ia t io n s teriliza tio n o f p ro to typ e m ilita ry foods. 4 . L o w tem p era tu re irrad ia tio n o f codfish cake, corned beef and p o rk sausage. A p p l. M ic ro b io l. In press.
A nellis , A ., G recz, N . and B erk o w itz , D , 1 9 6 5 . Surv ival o f C los trid ium b o tu lin u m spores. A p p l. M ic ro b io l. 13: 3 97 .
A nellis. A . and W erko w ski, S. 1 9 6 8 . E s tim atio n o f rad ia tio n resistance values o f m icroorganism s in food products. A p p l. M ic ro b io l. 1 6 : 1 3 0 0 .
A nellis , A . and W erko w ski, S. 1 9 7 1 . E s tim a tio n o f an equivalen t “ 1 2 D ” process by the no rm a l d is trib u tio n m eth od . Can. J. M ic ro b io l. 17: 1 1 8 5 .
A non . 1 9 6 8 . “ Status o f the F o o d Irra d ia tio n Program : Hearings befo re the S ub co m m ittee on Research, D eve lo p m en t and R a d ia tio n o f the J o in t C o m m ittee on A to m ic E nergy, Congress o f the U n ite d S tates,” p . 1 9 4 . U .S . G overnm ent P rin ting O ffice , Ju ly 1 8 and 30 .
G recz, N ., S nyder, O .P ., W alker, A .A . and A nellis , A . 1 9 6 5 . E ffe c t o f tem p erature o f liq u id n itrogen in rad ia tio n resistance o f spores o f C lostrid ium b o tu lin u m . A p p l. M ic ro b io l. 1 3 : 5 27 .
G um bel, E .J . 1 9 5 8 . “ Statistics o f E x tre m e s.” C o lu m b ia University- Press, N ew Y o rk .
Segner, W .P . and S chm id t, C .F . 1 9 6 6 . R ad ia tio n resistance o f spores o f C lostrid ium b o tu lin u m , ty p e E . In “ F o o d Ir ra d ia tio n ,” p. 2 8 7 . In t . A t. Energy A gency (V ie n n a ).
S chm id t, C .F . 1 9 6 3 . A ppend ix 2. Dose req u irem en ts fo r the rad ia tio n steriliza tio n o f fo o d . In t . J. A p p l. R ad ia t. Iso to p . 14: 19 .
S ch m id t, C .F . and N a n k , W .K . 1 96 0 . R ad ia tio n s teriliza tio n o f fo o d . 1. Procedure fo r th e evaluation o f the rad ia tio n resistance o f spores o f C lostrid ium b o tu lin u m in foo d products. F o o d Res. 2 5 : 3 2 1 .
Ms received 1 1 /3 /7 3 ; revised 2 /2 /7 4 ; accepted 2 /5 /7 4 .
The au th o r thanks D r. Jack H achigian o f H u n te r C ollege, fo r the o p p o rtu n ity to exam ine his unpublished m anuscript and M r . S.J. W erkow ski o f U .S . A rm y N a tic k Laboratories fo r several h e lp fu l discussions in the early stages o f th is w o rk . John M . Thom as o f B atte lle Pacific N o rth w e s t Laboratories c o n trib u ted a large n u m b er o f valuable com m ents on this w o rk also. Th e au th o r is g ra te fu l to M r . A be A nellis o f U .S . A rm y N a tic k Laboratories fo r co n tin u a l guidance, s tim u la tio n and a great deal o f know ledge abou t the lite ra tu re on rad ia tio n effects in m icrob io logy.

H. S R I N I V A S , U. K . V A K IL a n d A . S R E E N I V A S A N B io c h e m is tr y & F o o d T e c h n o lo g y D iv ., B h a b h a A to m ic R esea rch C e n tre , B o m b a y -4 0 0 0 8 5 , Ind ia
NUTR ITIO NA L AND COMPOSITIONAL CHANGES IN DEHYDRO-IRRADIATED SHRIMP
INTRODUCTIONTHE MAJOR nutritional problem facing India and other developing countries is widespread caloric and protein insufficiency. Sea foods constitute a cheap and abundant source of good quality animal protein sources. However, they have poor keeping qualities and deteriorate rapidly, because of high average temperatures and high humid conditions prevailing in these regions. Low doses of gamma radiation have been used successfully to extend shelf life of fish held at refrigerated temperatures (Shewan, 1966). Shrimp, accounting for nearly 20% of the total seafood catch in India, can be preserved by a combination of blanching and low dose gamma radiation for about 10—20 wk at sub-room temperatures (Kumta et al., 1970). Steam-cooking followed by irradiation (100 krad) stabilizes shrimp for room temperature (25—28°C) storage (Savagaon et al., 1972). Similarly, dehydro-irradiation extends storage life of shrimp at ambient temperature over4—5 months (Gore et al., 1970). Wholesomeness studies, involving multi-generation experiments with rats and mice, have revealed no deleterious effects due to feeding of dehydro-irradiated shrimp (Vakil, 1969).
The present study relates to nutritional losses and compositional changes in partially dehydrated shrimp, irradiated in different environments, with special reference to certain B vitamins, total and free amino acid profiles and in vitro digestibility of proteins. Similar comparative studies in products processed by blanching, canning and air drying or freeze drying are included.
MATERIALS & METHODSFRESH, peeled and deveined shrimp of Meta- penaeus affinis and Peneaus indicus varieties were obtained from a local fisheries agency. Samples were cleaned thoroughly with tap water and allowed to drain before processing. Pepsin, trypsin, erepsin, cytochrome c and polymyxin-B sulfate were from Sigma Chemical Co., USA and takadiastase from Parke Davis Co., USA.Processing techniques
For preparation of freeze-dried samples, shrimp was frozen to -40° C and lyophilized in a food freeze drier under vacuum (1 0 0 m) to2-2.5% moisture. For air-dried samples, shrimp was spread on perforated steel trays and dehy
drated in air dryer for 8 -10 hr at 65-70°C; moisture content of the final product was 2-2.5%. For canning, shrimp was blanched at 90-95°C for 7 min in 7% NaCl before filling in cans containing brine (1.5%). Tire cans were exhausted for 5 min, double-seamed and sterilized for 40 min at 10 psi.Dehydro-irradiation process
The procedure followed was essentially the same as described by Gore et al. (1970). Shrimp was given a dip for 1 hr in 0.5% sorbic acid, pH 6 .8. This was followed by blanching at 80°C for 5 min in 10% NaCl. Partial dehydration of blanched shrimp to 40% moisture level was carried out in an air drier at 55-60°C. The semi-dried shrimp was then packed in polyethylene pouches (700 gauge) and sealed either in vacuum or in air or in a nitrogen atmosphere. Samples were irradiated (in the range 0.25- 0.32 Mrad, the overdose ratio thus being about 30%) at ambient temperature (28-30°C) in a 6 0 Co package irradiator (Atomic Energy of Canada Ltd.). Ceric sulfate dosimetry was employed at a dose rate of 0.25 Mrad/hr.
For storage studies, unirradiated and irradiated samples were stored at 25-28°C for 30 and 90 days, respectively, corresponding to two-thirds of their keeping time as determined earlier.
Proximate analysesTotal nitrogen was estimated by the micro-
Kjeldahl method (Oser, 1965); a factor of 6.25 was used to convert nitrogen to protein values. Lipids were extracted with petroleum ether (40-60°C) in a Soxhlet apparatus, evaporated and weighed. Shrimp was ashed by ignition to constant weight, dissolved in 0.1N HC1 and aliquots analyzed for calcium (AOAC, 1960) and phosphorus (Fiske and Subbarow, 1925).
Certain B vitamins were determined according to the procedures described by AOAC (1960). Shrimp was homogenized in 0.1N HC1 and autoclaved at 121°C for 30 min. Thiamine and riboflavin were released by incubating the acid extract with takadiastase at 37°C for 20 hr. Thiamine was adsorbed on an activated Decalso column (0.5 x 10 cm) and eluted with 5% hot KC1. Oxidizing reagent (1% K3Fe(CN)? in 15% NaOH) was added to the eluate immediately followed by isobutyl alcohol. Tubes were shaken vigorously, centrifuged and the solvent layer removed carefully. Thiochrome fluorescence was measured using quinine sulfate solution (0.25r/ml) to govern reproducibility of fluorometer. For riboflavin estimation, 1 ml HOAC and 0.5 ml 4% KMn04 solution were added to an aliquot of the acid extract of the sample. After 1 min, fluorescence was measured before and after the addition of Na2 S2 0 4 and riboflavin content calculated. Nicotinic acid was determined colorimetrically using sulfanilic acid and cyanogen bromide reagents.
Shrimp was homogenized in 0.1M Na ace
tate buffer (pH 4.5) and digested with papain for 24 hr at 37°C. Folic acid and vitamin B, 2, released in the filtrate, were estimated by microbiological methods using Lactobacillus casei (Noronha and Aboobaker, 1963) and Euglena gracilus (Hutner et al., 1956), respectively, as test organisms.Amino acids
Shrimp (= 20-25 mg protein) was hydrolyzed with 6N HC1 at 110 ± 1°C, for 24 hr, and excess acid was removed in vacuo. Residue was taken in 0.2M sodium citrate buffer, pH 2.2, and an aliquot used for quantitative separation of amino acids on a Beckman Unichrome Automatic Amino Acid Analyzer. To estimate free amino acids, shrimp extract in 70% ethanol was passed through a Dowex-50 H+ column (0.9 X 10 cm), eluted with 2N NH„OH and lyophilized. Residue was processed as described above. Tryptophan was estimated colorimetrically (Spies, 1967). Available lysine was determined with 1-fluoro 2:4 dinitrobenzene (FDNB), according to the method developed by Carpenter (1960).In vitro enzymic digestibility
To study the stepwise enzymic digestion, shrimp (= 5g protein) was homogenized in water (pH adjusted to 1.8 with IN HC1) and the suspension incubated under toluene with pepsin (0.5 mg/ml) at 37°C for 24 hr with frequent shaking. This was followed by a further 24 hr incubation with trypsin (0.5 mg/ml, pH 8.2) (Ford and Salter, 1966). Aliquots were removed at indicated time intervals and a-amino nitrogen estimated (Rosen, 1957) in TCA filtrates. Erepsin was then added (0.5 mg/ml) and the digestion continued for a further 24 hr.
On completion of enzymic digestion, filtrate (= 25 mg N) was subjected to gel filtration on a Sephadex G-25 column (2.7 X 60 cm) equilibrated with 0.02M phosphate buffer, pH 7.6. The position of markers of known molecular weights, like cytochrome C (mol wt 12,400), polymyxin-B sulfate (mol wt 1,470) and of a mixture of 18 amino acids were used to establish the resolution of the protein digest into undigested soluble proteins, peptides and free amino acids, respectively (cf. Ford, 1965).
RESULTSProximate analysis of processed and irradiated shrimp
Values for proximate constituents of dehydro- and dehydro-irradiated shrimp, in comparison with fresh and conventionally processed samples, are given in Table 1. Protein content in the dehydro- and canned shrimp, was somewhat reduced (about 1% on the values for fresh sample) due to the observed losses in soluble nitrogenous compounds during
Volum e 3 9 (1 9 7 4 )-J O U R N A L O F FOO D S C IE N C E -8 0 7
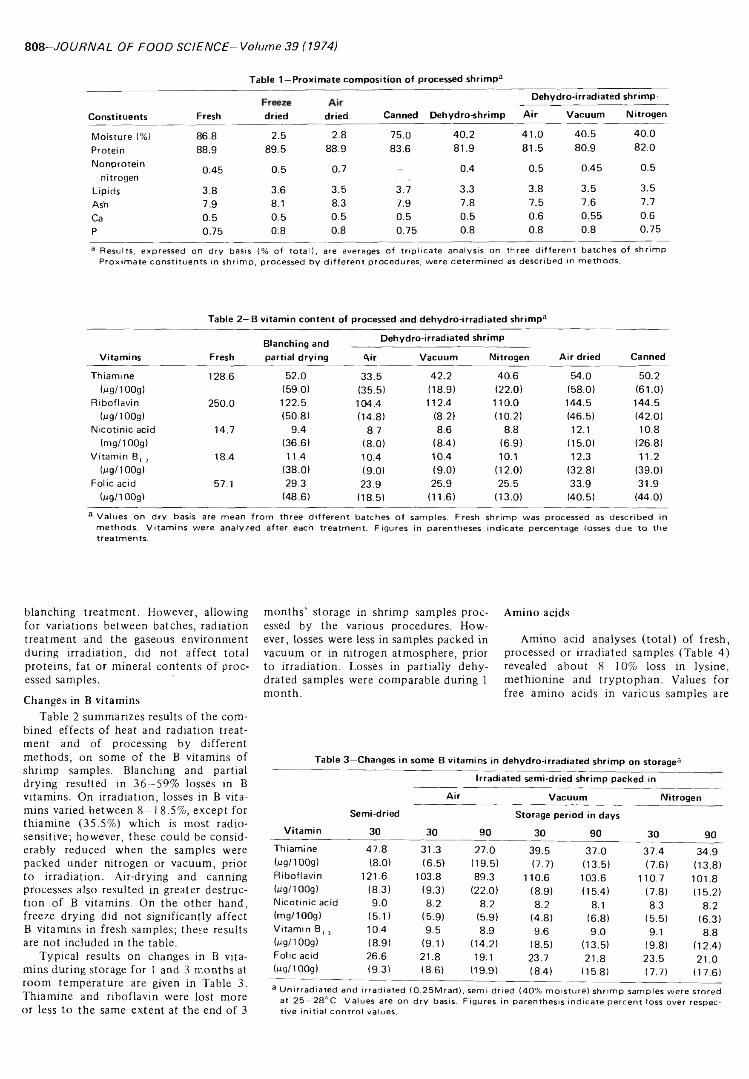
808-JOURNAL OF FOOD SCIENCE-Volume 39(1974)
Tab le 1—P ro xim ate co m po sitio n o f processed shrimp®
D eh yd ro -irrad iated shrim p-
C o n stitu ents Fresh dried dried Canned D eh yd ro -shrim p A ir V a cu u m N itrogen
M oisture (%) 8 6 .8 2 .5 2 .8 75 .0 4 0 .2 4 1 .0 4 0 .5 4 0 .0
Protein 8 8 .9 8 9 .5 8 8 .9 8 3 .6 8 1 .9 8 1 .5 8 0 .9 8 2 .0
N onproteinnitrogen
0 .4 5 0 .5 0 .7 - 0.4 0 .5 0 .4 5 0 .5
L ip id s 3 .8 3 .6 3 .5 3 .7 3 .3 3 .8 3 .5 3 .5
Ash 7 .9 8.1 8.3 7 .9 7 .8 7 .5 7 .6 7.7
Ca 0 .5 0 .5 0 .5 0 .5 0 .5 0 .6 0 .5 5 0 .6P 0 .7 5 0.8 0 .8 0 .7 5 0 .8 0.8 0 .8 0 .7 5
a R esu lts, expressed on dry basis {% of to ta l). are averages of trip licate analysis on three d ifferen t batch es of shrim pP ro xim ate co n stituen ts in shrim p, processed by d iffe ren t pro cedures, w ere determ ined as described in m ethods.
Tab le 2 - B v itam in co n ten t of processed and d ehydro-irrad iated shrimp®
V itam in s FreshB lanching and partial d ry ing
D ehyd ro -irrad iated shrim p
A ir dried CannedAir V a cu u m Nitrogen
T h iam in e 128 .6 5 2 .0 3 3 .5 4 2 .2 4 0 .6 5 4 .0 5 0 .2(ug/100g) (59 .0) (35 .5) (18 .9) (22 .0) (58 .0 ) (61 .0 )
R ib o flav in 2 5 0 .0 1 2 2 .5 104 .4 11 2 .4 11 0 .0 14 4 .5 1 4 4 .5(M9/100g) (50 .8 ) (14 .8 ) (8 .2) (10 .2 ) (46 .5) (42 .0 )
N ico tin ic acid 14.7 9 .4 8.7 8 .6 8.8 12.1 10 .8(m g/100g) (36 .6 ) (8 .0 ) (8 .4 ) (6 .9 ) (15 .0) (26 .8 )
V itam in B , 2 18 .4 11.4 1 0 .4 10 .4 10.1 12 .3 11 .2(Mg/100g) (38 .0 ) (9 .0 ) (9 .0 ) (12 .0) (32 .8 ) (39 .0 )
Fo lic acid 57.1 29 .3 2 3 .9 2 5 .9 2 5 .5 3 3 .9 3 1 .9(pg/100g) (48 .6 ) (18 5) (11 .6 ) (13 .0 ) (40 .5) (44 .0 )
a V a lu e s on dry basis are m ean from three d iffe ren t batches of sam ples. Fresh shrim p w as processed as described in m ethods. V itam in s w ere analyzed after each treatm ent. F igures in parentheses ind icate percentage losses due to the treatm ents.
blanching treatment. However, allowing for variations between batches, radiation treatment and the gaseous environment during irradiation, did not affect total proteins, fat or mineral contents of processed samples.
Changes in B vitaminsTable 2 summarizes results of the com
bined effects of heat and radiation treatment and of processing by different methods, on some of the B vitamins of shrimp samples. Blanching and partial drying resulted in 36-59% losses in B vitamins. On irradiation, losses in B vitamins varied between 8—18.5%, except for thiamine (35.5%) which is most radiosensitive; however, these could be considerably reduced when the samples were packed under nitrogen or vacuum, prior to irradiation. Air-drying and canning processes also resulted in greater destruction of B vitamins. On the other hand, freeze drying did not significantly affect B vitamins in fresh samples; these results are not included in the table.
Typical results on changes in B vitamins during storage for 1 and 3 months at room temperature are given in Table 3. Thiamine and riboflavin were lost more or less to the same extent at the end of 3
months’ storage in shrimp samples processed by the various procedures. However, losses were less in samples packed in vacuum or in nitrogen atmosphere, prior to irradiation. Losses in partially dehydrated samples were comparable during 1 month.
Amino acids
Amino acid analyses (total) of fresh, processed or irradiated samples (Table 4) revealed about 8-10% loss in lysine, methionine and tryptophan. Values for free amino acids in various samples are
in d ehydro-irrad iated shrim p on storage®T a b le 3 —Changes in som e B v itam ins
V itam in
Sem i-dried
30
Irradiated sem i-dried shrim p packed in
A ir V a cu u m N itrogen
30 9 0
Storage period in days
30 90 30 9 0T h iam in e 4 7 .8 31 .3 2 7 .0 3 9 .5 3 7 .0 3 7 .4 3 4 .9(Mg/100g) (8 .0) (6 .5 ) (19 .5) (7 .7) (13 .5 ) (7 .6 ) (13 .8 )R ib o flav in 121 .6 103 .8 89 .3 110 .6 103 .6 11 0 .7 10 1 .8(Mg/1 OOg) (8 .3 ) (9 .3 ) (22 .0 ) (8 .9 ) (15 .4) (7 .8 ) (1 5 .2 )N ico tin ic acid 9 .0 8 .2 8 .2 8 .2 8.1 8.3 8 .2(m g/100g) (5 .1 ) (5 .9 ) (5 .9) (4 .8 ) (6 .8 ) (5 .5 ) (6 .3 )V itam in B , , 10.4 9 .5 8 .9 9 .6 9 .0 9.1 8 .8(pg/100g) (8 .9 ) (9 .1 ) (14 .2) (8 .5 ) (13 .5) (9 .8 ) (12 .4 )Fo lic acid 26 .6 2 1 .8 19.1 23 .7 2 1 .8 2 3 .5 2 1 .0(Mg/10Og) (9 .3 ) (8 .6 ) (19 .9 ) (8 .4 ) (15 .8) (7 .7 ) (1 7 .6 )
a U n ir ra d ia te d an d ir ra d ia te d ( 0 .2 5 M ra d ) , se m i-d rie d (4 0 % m o is tu re ) sh r im p sa m p le s w e re sto re d at 2 5 —2 8 ° C . V a lu e s are on d ry b as is . F ig u re s in p a re n th e s is in d ic a te p e rc e n t lo ss o v er re s p e c tiv e in it ia l c o n tro l v a lu es .

CHANGES IN DEHYDRO-IRRADIATED SHRIMP- 809
T ab le 4 —T o ta l am ino acid s in processed sh rim p 3
A m in o acid FreshFreezedried
A irdried Canned
D e h yd ro shrim p
D eh yd ro -irrad iated shrim p
A ir V a cu u m N itrogen
A sp artic acid 11 .02 11 .0 0 1 0 .9 0
g/16g N itrogen
1 1 .0 8 11 .0 5 11 .0 2 11 .08 11 .05Th reo n in e 4 .0 0 3 .9 8 3 .9 8 3 .9 4 4 .C 2 4 .0 0 4 .0 2 4 .0 6Serine 4 .0 4 4 .0 2 4 .0 0 4 .0 5 3 .9 8 3 .8 8 3 .8 2 3 .8 8G lu tam ic acid 2 0 .1 2 2 0 .4 5 2 1 .6 0 2 0 .8 0 2 0 .1 4 2 1 .2 5 2 0 .0 2 2 1 .0 6Pro line 2 .1 8 2 .2 4 2 .0 9 2 .1 9 2 .2 8 2 .2 6 2 .2 8 2 .3 0G ly c in e 4 .6 8 4 .7 0 4 .7 0 4 .7 5 4 .7 3 4.71 4 .6 9 4 .7 2A lan ine 6 .0 4 6.01 6 .0 5 6 .0 2 6 .0 2 5 .8 8 5 .8 6 5 .7 9'A C ystin e 0 .6 5 0 .6 8 0 .7 0 0 .7 2 0 .6 9 0 .7 3 0 .7 5 0 .7 0V a lin e 4 .6 9 4 .7 3 4 .7 2 4 .7 0 4.71 4 .7 0 4 .6 6 4 .6 2M eth ion ine 2 .8 0 2.81 2 .5 8 2 .6 5 2 .7 9 2 .74 2 .7 8 2 .7 6Iso leucine 4 .7 7 4 .7 6 4 .8 2 4 .6 5 4.71 4 .4 8 4 .4 2 4 .3 9Leu cine 8 .5 5 8 .5 3 8 .3 2 8 .3 8 8 .2 3 7 .97 7 .88 7 .8 5T y ro s in e 3 .2 4 3 .1 9 3.11 3 .1 0 3 .2 7 3 .1 2 3 .1 2 3 .1 6Pheny la lan in e 4 .7 8 4 .8 2 4 .7 2 4 .7 2 4 .7 5 4 .7 0 4 .7 2 4 .7 8Ly s in e 8 .2 8 8 .23 7 .6 2 7 .67 8 .2 3 8 .3 9 8.41 8 .44H istid ine 1 .82 1 .85 1.82 1 .78 1 .89 1 .8 5 1 .88 1 .86A rg in ine 7 .29 7 .2 0 7 .0 8 7.11 8 .4 2 7 .2 9 7 .35 7 .40T ry p to p h an 1 .56 1 .5 8 1.45 1 .40 1.56 1.54 1.56 1 .5 5
a A liq u o ts of the protein h yd ro lysate w ere analyzed fo r am ino acid as given in m ethods. C o rre ctio n s w ere m ade in the values fo r serine and threon ine to' a cco u n t fo r losses during h yd ro ly s is . R esu lts are averages of three independent analyses.
T a b le 5 —Fre e am ino acid s in processed sh rim p 3
A m in o acid FreshFreezedried
A irdried Sem i-dried
D eh yd ro -irrad iated shrim p
A ir V a cu u m N itrogen
A sp artic acid Traces Tracesmg/g N itrogen
0 .3 8 T races T races T races T racesT h reo n in e 0 .5 5 0 .5 9 1.13 0 .0 9 0 .1 4 0 .1 5 0 .1 3Serine 0 .3 5 0 .3 8 0 .8 0 0.11 0 .1 4 0 .1 3 0 .1 5G lu tam ic acid 0 .7 9 0 .8 8 1 .80 0 .3 0 0 .3 9 0.41 0 .3 8G ly c in e 5 .9 5 6 .1 2 8 .8 5 2.51 2 .4 9 2 .5 2 2 .5 8Alan ine 1.81 1.94 4 .1 0 1.02 1.15 1.08 1.12V a lin e 0 .5 5 0 .6 0 1 .28 0 .3 0 0 .3 2 0 .3 8 0 .3 9M ethionine 0 .3 8 0 .4 0 0 .8 5 0 .2 2 0 .2 0 0 .1 8 0 .2 4Iso leucine 0 .4 4 0 .4 6 0 .9 8 0.21 0 .2 5 0 .2 6 0.21Leu cine 0 .6 9 0 .7 2 1.82 0 .4 0 0 .3 8 0 .4 2 0 .4 5T yro sin e 0 .6 8 0 .63 1 .10 0 .5 0 0 .4 8 0 .5 3 0 .5 6Pheny la lan in e 0 .4 9 0.41 1 .18 0 .4 2 0 .3 4 0 .3 6 0 .4 0Ly s in e 1 .85 1.74 2 .9 2 1.12 1 .58 1.51 1 .60H istid ine T races Traces Traces Traces T races T races T ra ce sA rgin ine 0 .5 0 0 .5 2 1 .05 0 .3 0 0 .3 5 0 .3 7 0 .3 9To ta l 15.03 15 .3 9 28 .2 4 7 .55 8.21 8 .3 0 8 .6 0
a Free am ino acids w ere determ ined in 7C% ethanol extracts o f sam ples. V a lues are m ean of three in dependent determ inations.
given in Table 5. Glycine accounted for about 40% of the to ta l values in fresh and freeze-dried samples, whereas histidine and aspartic acid were found only in traces. Air drying resulted in further release of free amino acids by 45%; blanching, prior to partial dehydration, resulted in 50% loss. Gamma irradiation in air, vacuum or nitrogen atmosphere, increased the free amino acids contents in semi-dried shrimp by 8%.
Results of available lysine content in
shrimp processed by different procedures and stored for up to 3 m onths at room temperature are given in Table 6. Partial dehydration (40% moisture) or radiation treatment (0.25 Mrad) in different environments like air, vacuum or nitrogen, did not affect lysine availability (accounting to about 95% in fresh shrimp) in the processed shrimp for up to 1 and 3 months’ storage, respectively. However, available lysine was reduced by 13% on air drying.
In vitro enzymic digestibility of irradiated shrimp
Results on in vitro enzymic digestion of freeze dried, semi-dried and dehydro- irradiated (0.25 Mrad) shrimp samples are plotted in Figure 1. Susceptibility of shrimp proteins to successive 24 hr action of pepsin (pH 1.8) and trypsin (pH 8.2) was increased due to radiation treatment, since increasingly more a-amino nitrogen was liberated from irradiated samples, compared to freeze dried samples.

810-JOURNAL OF FOOD SCIENCE-Volume 39 (1974)
T ab le 6 —A vailab le lysine co n ten ts of processed sh rim p a
Sam ple
A va ilab le ly sin e content
Total Storage period in days
ly sin e 0 3 0 60 9 0
g/16g N itrogen
Freeze dried A ir dried CannedD ehydro-shrim pD eh yd ro -shrim p, irradiated (0 .2 5 M rad)
in airin vacu um in nitrogen
8 m l o f 8 % N a H C O j an d 0 .3 m l F D N B d ilu te d in 1 2 m l e th a n o l w e re ad d e d to 1 0 0 m g sa m p le s h o m o g e n iz e d in w a te r , sh a k e n fo r 2 h r , th e n re f lu x e d fo r 1 6 h r w ith 8 N H C I and e x tra c te d w ith e th e r . C o lo r in te n s ity in a q u e o u s p h a se w a s m e a su re d a t 4 3 5 nm in a B a u sch an d L o m b c o lo r im e te r . R e s u lts a re averag es o f th re e e x p e r im e n ts .
Protein digestion was further continued for 24 hr with addition of erepsin. The protein digests were separated on Sephadex G-25 column into three distinct fractions: undigested soluble proteins, peptides and free amino acids (Table 7). At the end of 72 hr of sequential digestion, negligible amounts of undigested proteins were present in all the samples (not given in Table). However, with all the enzyme sources, 26.7% more free amino acids and smaller peptides were recovered in the digests of irradiated shrimp compared to unirradiated ones, with concomitant decrease in higher peptide fractions.
Similar results were obtained in another experiment, where in vitro digestibility was studied with pepsin (0.5 mg/ml, pH 1.8) followed by papain (0.5 mg/ml, pH 6.5), as proteolytic enzymes (24 hr digestion each) (Table 7).
8 .23 7 .86 7 .77 7.71 7 .6 27 .62 6 .6 0 6 .5 8 6 .6 2 6 .5 47 .67 7 .1 9 7 .18 7 .09 7 .148 .2 3 7.71 7.73 - -
8 .39 8.01 7 .89 7 .92 7 .8 08.41 7 .9 5 7 .89 7 .87 7 .8 28 .44 8 .0 0 7 .96 7 .88 7 .8 0
tions during irradiation are known to influence the stability of individual vitamins (Kennedy and Ley, 1971). B vitamin losses due to blanching and air drying were higher compared to those caused by gamma radiation (Table 2). Further, the losses caused by the individual stages of processing were cumulative and can be minimized by modifying the environment (Table 2). However, on storage for 3 months at room temperature, vitamin losses in irradiated shrimp samples were comparable, irrespective of the environment (Table 3). In Bombay duck, thiamine losses during storage were higher and could be minimized by storage at low temperature (Sawant et al., 1967). Read (1960) concluded that the effect of cooking and of irradiation are broadly similar; thiamine is the most heat- and radio- labile, whereas, riboflavin and nicotinic
acid are relatively radio-resistant. Similar losses of B vitamins up to 50% due to cooking of sword fish and by irradiating halibut (Proctor and Goldblith, 1960) and haddock fillets (Brocke et al., 1966) have been reported.
In the present study, no appreciable losses in total amino acids occurred in processed shrimp, except that about8—10% loss in lysine, methionine and tryptophan, were observed. Similar destruction of amino acids in heat processed Bombay duck (Sawant and Magar, 1961), herring (Gjenr.und, 1960) and fish meal (Ford, 1962) have been reported. Essential amino acids of canned (Dunn et a!., 1949) and frozen (Neilands et al., 1949) fish or of irradiated fish fillets (Proctor and Bhatia, 1950) and haddock (Brooke et al., 1966) reportedly remain unaltered.
Shrimp contains considerable amounts of free amino acids, glycine contributing up to 40% of the total. This is in agreement with the observation made by Loughlin and Teen (1960). The observed increase of some free amino acids in dehydro-irradiated shrimp could be due to breakdown of proteins. Similar release of free amino acids following radiation treatment have been observed with wheat (Srinivas et al., 1972) casein (McArdle and Desrosier, 1955) and clam (Brooke et al., 1964).
In the present studies, available lysine content in air-dried samples (Table 6) was slightly lowered. In cod fillets, heat treatment for 18 hr at 135°C resulted in 60% reduction in its available lysine content (Ford and Salter, 1966). Thus, losses in available lysine depend upon the severity and duration of heat treatment. On the other hand, radiation treatment of semi- dried shrimp showed no loss of available lysine (Table 6), initially or on storage. No loss of available lysine has been shown
DISCUSSIONTHE RADIATION pasteurization (raduri- zation) process for shrimp employed here basically involves blanching, partial drying, packaging in a flexible container, sealing and irradiation at ambient temperature (24°C). The heat treatment or irradiation caused little or no change in proximate constituents (Table 1 ). It has been reported that the biological value of proteins of fish meal (Kennedy, 1965), turkey (Calloway et al., 1957) or wheat (Metta and Johnson, 1959), irradiated up to 2.5 Mrad, remained unaltered. Similarly, no changes in nutritive value of cod fish following prolonged cooking or canning (Dunn et al., 1949) have been observed. In view of possible nutrient destruction due to radiation treatment, vitamin analyses of shrimp samples were carried out prior to and after irradiation and during storage. Environmental condi-
T ab le 7 —Fractio n atio n of en zy m ic digests o f processed sh rim p a
Pepsin , trypsin & erepsin (7 2 hr digest)
Pepsin (48 h
& papain r digest)
Sam ples PeptidesFree
am ino acids PeptidesFree
am ino acid s
mg leucine equ iva lent/25 mg N itrogen
Freeze dried 53.1 117 .4 12 0 .0 57 .0A ir dried 6 7 .0 10 9 .8 13 2 .2 5 0 .6Canned 5 8 .5 118 .3 123 .8 54 .7Dehydro-shrim pD eh yd ro -shrim p, irradiated (0 .2 5 Mrad)
5 6 .0 120 .3 120 .7 54 .7
in air 4 2 .6 147.3 9 6 .6 6 4 .7in vacuum 3 9 .7 14 2 .9 9 1 .2 6 8 .9in nitrogen 4 0 .6 14 0 .8 94 .3 6 9 .3
E n z y m ic d ig e sts w e re f il te re d , a liq u o ts p u t o n S e p h a d e x G - 2 5 c o lu m n , e lu te d w ith 0 .0 2 M p h o sp h a te b u ffe r an d e f f lu e n t c o lle c te d ( 7 .5 m l e a ch ) on L K B f r a c t io n c o lle c t o r , u sin g m a rk e rs as d e sc r ib e d in m e th o d s . F r a c t io n s f ro m e ach p e a k w e re p o o le d an d h y d ro ly z e d w ith 6 N H C I fo r 1 8 h r . a - a m in o n itro g e n w a s e s t im a te d u sin g le u c in e as s ta n d a rd . V a lu e s a re m ean of th re e d e te rm in a t io n s .

CHANGES IN DEHYDRO-IRRADIA TED SHRIM P-M I
FREEZE DRIED O- -0 SEMI-DRIEDDEHYDRO-IRRADIATED (025 Mrad)
zo2<
Fig. 1—ln v itro d ig e s tib i l i ty o f p r o c e s s e d sh r im p : S h r im p sa m p le s (= 5 g p r o te in I w ere d ig e s te d w ith p e p s in fo l lo w e d b y tr y p s in fo r 2 4 h r ea ch a t 3 7 °C . a -a m in o n itr o g e n l ib e r a te d was m e a s u r e d a t in d ic a te d t im e in te rv a ls a n d e x p r e s s e d in te r m s o f le u c in e e q u iv a le n t.
with fish and blood meals (Vanderschaff and Mossel, 1963) due to irradiation at 1 Mrad.
The results on the in vitro enzymic digestibility studies suggest that the dehydro-irradiated product is more susceptible to proteolytic action, compared to unirradiated or thermally processed ones (Fig. 1, Table 7). Such an increase has been shown when irradiated casein or egg albumin is subjected to trypsin hydrolysis (McArdle and Desrosier, 1955). However, with irradiated turkey and pork, Sheffner et al. (1957) observed that radiation treatment did not affect pepsin digestibility ratio (PDR) index, but thermal processing decreased PDR. A decreased release of amino acids after pepsin digestion from air-dried Bombay duck (Sawant and Magar, 1961), compared to spray- or freeze-dried samples (Degroot,1963) has been reported.
REFERENCESA O A C . 1 9 6 0 . “ O ffic ia l M ethods o f A nalysis ,”
9 th ed, p. 6 5 5 . Association o f O ffic ia l A g ricu ltu ra l Chem ists, W ashington, D .C .
B rooke, R .O ., Ravesi, E .M ., Gadbois, D .F . and Steinberg, M .A . 1 9 6 4 . Preservation o f fresh un fro zen fishery products b y lo w level rad i
a tio n . 3 . The effects o f rad ia tio n pasteurizat io n on am ino acids and v itam ins in clams. Fo od Techno l. 18: 1 0 6 0 .
B rooke, R .O ., Ravesi, E .M ., Gadbois, D .F . and S teinberg, M .A . 1 9 6 6 . Preservation o f fresh u n fro zen fishery products b y lo w level rad ia tion : The effects o f rad ia tion pasteurizat io n on am ino acids and v itam ins in haddock fille ts . Food Techno l. 2 0 : 147 9 .
C allow ay , D .H ., C ole, E .R . and Spector, H .1 9 5 7 . N u tr itiv e value o f irrad ia ted tu rk e y . J. A m er. D ie t. Assoc. 33: 1 0 2 7 .
C arpenter, K .J . 1 9 6 0 . The estim ation o f available lysine in an im al p ro te in foods. Bio- chem . J. 7 7 : 6 0 4 .
D egroot, A .P . 1 9 6 3 . The in fluence o f dehydrat io n o f foods on the d igestib ility and the bio logical value o f th e p ro te in . Food Techno l. 1 7 : 1 03 .
D u n n , M .S ., C annien, M .N ., E iduson, S. and M a lin , R .B . 1 9 4 9 . The n u tritiv e value o f canned foods. 1. A m in o acid co n ten t o f fish and m eat products. J. N u tr . 39: 1 7 7 .
F iske, C .H . and Subbarow , Y . 1 9 2 5 . The c o lo rim etric d e te rm in a tio n o f phosphorus. J. B iol. C hem . 66: 3 75 .
F o rd , J .E . 1 9 6 2 . A m icrob io log ical m eth od fo r assessing the n u tritio n a l value o f prote ins. B ri. J. N u tr . 16: 4 0 9 .
Fo rd , J .E . 1 9 6 5 . A m icro b io log ical m ethod fo r assessing the n u tritio n a l value o f proteins. B ri. J. N u tr . 1 9 : 2 77 .
Fo rd , J .E . and Salter, D .N . 1 9 6 6 . Analysis o f e nzym ica lly digested foo d proteins by Sephadex gel f iltra tio n . B ri. J. N u tr . 2 0 : 8 43 .
G jerm und , B. 1 9 6 0 . A m in o acid com position o f herring and herring m eal: D estruction o f am ino acids during processing. J. Sci. Fo od A gr. 1 1 : 362 .
G ore, M .S ., S aw ant, P .L ., K u m ta , U .S . and Sreenivasan, A . 1 9 7 0 . D eh yd ro irra tia tio n
process fo r tro p ic a l shrim ps. F o o d Techno l. 24: 1 1 6 3 .
H u tn e r, S .H ., Back, M .K . and Ross, G .I.M .1 9 5 6 . A sugar conta in ing basal m ed ium fo r v itam in Bj 2 assay w ith Euglena: A pp lica t io n to b o d y flu ids. J. P ro to zo o l. 3: 1 0 1 .
K en nedy, T .S . 1 9 6 5 . N u tr it io n a l value o f foods trea ted w ith gam m a irrad ia tio n . 1 . E ffects on some B -com plex v itam ins in egg and w heat. J. Sci. F o o d A gri. 16: 4 3 3 .
K en nedy, T .S . and L e y , F .J . 1 9 7 1 . Studies on the com bined e ffec t o f gam m a rad ia tio n and cooking on the n u tritio n a l value o f fish. J. Sci. F o o d A gri. 2 2 : 1 4 6 .
K u m ta , U .S ., M avinkurve, S .S ., G ore, M .S ., S aw ant, P .L ., Gangal, S .V . and Sreenivasan, A . 1 9 7 0 . R ad ia tio n pasteuriza tion o f fresh and blanched tro p ica l shrim ps. J. Fo od Sci. 3 5: 3 6 0 .
Lo ugh lin , M .E . and Teen, A .E . 1 9 6 0 . N u tr itiv e value o f fish. 2 . B io tin , fo lic acid, panto - them ic acid and free am ino acids o f various salt w ater species. Fo od Res. 25: 4 7 9 .
M c A rd le , F .J. and Desrosier, N .W . 1 9 5 5 . In f lu ence o f io n iz ing rad ia tio n on the pro te in com ponents o f selected foods. Fo od Techno l. 1 0 : 5 2 7 .
M e tta , V .C . and Johnson, B .C . 1 9 5 9 . B iological value o f gam ma irrad ia ted corn p ro te in and w h eat g luten. J. A gr. F o o d C hem , 7: 1 3 1 .
Neilands, J .B ., S irney , R .J ., S oh lje ll, I . , S trong,F .M . and E lveh jem , C .A . 1 9 4 9 . The n u tritive value o f canned foods. 2 . Th e am ino acid co n te n t o f fish and m eat products. J. N u tr . 3 9 : 1 8 7 .
N o ro n h a , J .M . and A b o o b aker, V .S . 1 9 6 3 . Studies on the fo la te com pounds o f hum an b lood . A rc h . B iochem . B iophys. 1 0 1 : 4 4 5 .
Oser, B .L . 1 9 6 5 . “ Practical Physiological C hem is try ,” 1 4 th ed, p . 1 2 1 4 . M c G raw H ill Book C o., N .Y .
P ro c to r, B .E . and B hatia , D .S . 1 9 5 0 . E ffe c t o f high voltage cathode rays on am ino acids in fish m uscle. F o o d Technol. 4 : 3 5 7 .
P rocto r, B .E . and G o ld b lith , S .A . 1 9 6 0 . In “ N u tr it io n a l E va luation o f F o o d Processing ,” E d . H arris , R .S . A v i Publishing C o., In c ., Londo n .
R ead, M .S . 1 9 6 0 . C u rren t aspects o f the w h o le someness o f irrad ia ted fo o d . J. A gr. Food C hem . 8: 3 4 2 .
Rosen, H . 1 9 5 7 . A m o d ifie d n in h y d rin co lo rim etric analysis fo r am ino acids. A rch . B io chem . B iophys. 6 7 : 10.
Savagaon, K .A . V enug opal, V . , K am a t, S .V ., K u m ta , U .S . and Sreenivasan, A . 1 9 7 2 . R ad ia tio n preservation o f tro p ica l shrimp fo r am b ien t tem p era tu re storage 1. D evelopm ent o f a heat rad ia tio n c o m b in atio n process. J. Fo od Sci. 3 7 : 1 48 .
S aw ant, P .L . and M agar, N .G . 1 9 6 1 . Studies on dried B om bay duck (H arp o d o n nehereus).2 . Changes in the n u tritiv e value during processing. J. Sci. Fo od A gri. 1 2 : 3 0 2 .
S aw ant, P .L ., M avinkurve, S .S ., Saro ja, S., Savagaon, K .A . and K u m ta , U .S . 1 9 6 7 . R ad ia tio n pasteuriza tion o f tro p ica l fish B om bay duck (H arp o d o n nehereus). Food Techno l. 2 1 : 4 4 4 .
S heffner, A .L . , A dach i, R . and Spector, H .1 9 5 7 . The e ffe c t o f rad ia tio n processing upon the in v itro d igestib ility and n u trit io n a l q u a lity o f prote ins. F o o d Res. 2 2 : 4 5 5 .
Shewan, J .M . 1 9 6 6 . Proc. o f In te rn a tio n a l S ym p. on Fo o d Irra d ia tio n , p . 4 8 9 . IA E A / F A O , K arlsruhe, IA E A , V ie n n a .
Spies, J .R . 1 9 6 7 . D e te rm in a tio n o f tryp to p h an in p ro te in s. A n a l. C hem . 3 9: 1 4 1 2 .
Srinivas, H . , A n an thasw am y, H .N ., V a k il, U .K . and Sreenivasan, A . 1 9 7 2 . E ffe c t o f gamma irrad ia tio n o f w h eat prote ins. J. Fo od Sci. 3 7: 7 15 .
V a k il, U .K . 1 9 6 9 . Status o f wholesomeness studies w ith rad ia tio n processed w heat grain and sea foods. Proc. o f sem inar on Fo od I r r a d i a t i o n , p. 4 0 . B A R C /IA E A /F A O .
Vanderschaaf, A . and Mossel, D .A .A . 1 9 6 3 . G am m a rad ia tio n san itation o f fish and b lood m eats. In t . J. A p p . R ad ia t. Iso tope 1 4: 5 57 .
M s received 1 0 /9 /7 3 ; revised 1 /2 0 /7 4 ; accepted2 /5 /7 4 .

C. K . K A N G a n d W. D. W A R N E R
S w i f t & C o m p a n y , R & D C en ter, 1 9 1 9 S w i f t D r ive , O a k B r o o k , IL 6 0 5 2 1
TENDERIZATION OF MEAT WITH PAPAYA LATEX PROTEASES
INTRODUCTIONANTEMORTEM injection of plant proteases has been one of the most effective methods for tenderizing meats since this unique process was introduced by Beuk and his co-workers (1959).
Although introduction of enzyme solutions into live animals through the vascular system is a simple process, control of the process to achieve optimum tenderization of meat is extremely complicated. Enzymatic tenderization of meat results in the partial degradation of meat components, but antemortem tenderization by enzymes does not necessarily correlate directly with their in vitro proteolytic activity. This discrepancy may involve several factors: (1) enzyme preparations used commercially contain a number of different proteases and thus vary in composition and stability; (2) meat consists of a number of structural proteins which possess different degrees of susceptibility toward these enzymes; and (3) the enzymes introduced through intravenous injection interact with the biological components of the live animals.
This study, therefore, was undertaken to investigate the nature and action of papaya enzymes and to determine important parameters and mechanisms involved in the antemortem tenderization of meat with proteolytic enzymes.
MATERIALS & METHODSEnzymes and chemicals
Commercial papaya enzymes used for this study were Sigma crude type I and Sigma crude type II from the Sigma Chemical Company, Food Grade No. 955 and ENRA from the S.B. Penick and Company, and Food Grade No. 1387 from the Wallerstein Company.
Radioactive formaldehyde was purchased from New England Nuclear. The specific activities were 10 mCi per mmole for 1 ‘ C-formalde- hyde and 77.6 mCi per mmole for 3 H-formalde- hyde. The toluene-soluble dialkyl dimethyl ammonium base, NCS, was the product of Amersham/Searle.Enzyme purification
The food grade papaya enzyme preparation, ENRA, was used throughout for the preparation of pure papain, chymopapain and papaya peptidase A. ENRA was chosen because it had the highest specific activity of 10 different commercial papaya latex enzymes tested. Prior to purification, the proteases were protected by reversible inactivation with an excess amount of sodium tetrathionate. Papain was purified by a slight modification of the method of Kimmel
and Smith (1954). Chymopapain and papaya peptidase A were prepared according to Stern’s method (1971) with repeated salt fractionations followed by CM-Sephadex column chromatography. The schematic diagram for enzyme purification is shown in Figure 1. Polyacrylamide gel electrophoresis
Electrophoresis was done following the method of disc electrophoresis described by Colab Laboratories, Inc., using the Polyanalyst disc electrophoresis apparatus of Buchler Instruments, Inc. The stacking buffer for 7.5% gel was glycine-KOH at pH 6.6 and the running buffer was 0.025M Tris HC1 at the same pH. The samples were stained with 0.1% Amido Schwarz in 7% acetic acid and destained with 7% acetic acid.Measurement of protease activity
Casein digestion was determined by Kunitz’s method (1947) with some modification. The one percent Hammerstein quality casein solution in 0.1 M sodium phosphate buffer (pH 7.0 for standard assay) contained 0.2% mercapto- ethanol. Enzymes were activated for 5 min at 25° C with 1% mercaptoethanol in the same phosphate buffer at pH 7.0 prior to reaction with substrates. To 9 ml of substrate, 1 ml of activated enzyme solution was added. After 10 min at 40° C the enzyme reaction was stopped
by adding 5 ml of 15% trichloroacetic acid (TCA). The reaction mixture was then filtered through Whatman filter paper No. 42. The enzyme activity on casein was determined by measuring the increase in optical density (OD) at 280 nm with a Beckman DU spectrophotometer. An OD increase of 1.00 per min was defined as one casein digestion unit.
Esterase activity on benzoylarginine ethyl ester (BAEE) was measured according to a slight modification of the method of Worthington Biochemical Corporation for papain. The titration was made by a Radiometer titrator with the pH stat set at 7.0.
Enzyme activity on meat fractions was determined by analyzing for nitrogen in TCA- soluble filtrates. The breakdown of connective tissue was determined by measurement of hydroxyproline in TCA soluble filtrates as described by Woessner (1961).
Preparation of meat fractionsA semimembranosus muscle from a U.S.
Choice Beef was obtained after 2 days of aging at 5°C. The water-soluble fraction was prepared by blending 1 part of meat and 3 parts of buffer (cold 0.1M sodium phosphate, pH 7.0) for 1 min in a Waring Blendor, then centrifuging and collecting supernatant. After two washings with the same buffer, the remaining insoluble frac-
Crude Papain, ENRA(10% Solution in Cold Water with 40 mM Sodium Tetrathionate) (pH 7.0)
(NH4)2SO4-40% Saturation
Centrifuge
Precipitate SupernatantI Adjust pH to 2.0
Dissolve (pH 7.C)
Centrifuge
Precipitate Supernatant ! Discard
Crystallize in 10% NaCl Repeat Twice
Crystalline PapainIDialyze against buffer
Precipitate Supernatantf(NH4)2SO -67% Saturation
Precipitate Supernatant Discard
CM-SephadexI Tris pH 8.0,NaCl gradient 0-1 M
Chymopapain Papaya peptidase A. 1 iDialyze against Dialyze against buffer buffer
F ig . 1 —S c h e m a t i c d i a g r a m f o r e n z y m e p u r i f i c a t i o n .
Z W -J O U R N A L O F FO O D S C IE N C E -V o lu m e 3 9 (1974)

TE N DE RIZ A T! O N OF ME A T - 813
tion was suspended in the same buffer. Both fractions were diluted to contain 1% substrate protein after the addition of enzyme solutions. Aliquots (9 ml) of each were transferred into test tubes, of which parts were heated for 30 min in an 80° C water bath to provide heat denatured substrates. Then, all meat fractions were kept frozen until use. The amount of hydroxyproline in the water-insoluble fraction was 1.86% based on the total amount of protein.
Measurement of proteins
The amounts of protein in the enzyme solutions were estimated by biuret protein measurements. Nesslerization was done on Kjeldahl digests (Lang, 1958; Minari and Zilversmit,1963) to determine nitrogen content in the meat fractions and the TCA soluble filtrates of meat substrates after enzyme digestion. Bovine serum albumin was used as a standard for both methods.
Determination of enzyme distribution in rats
Enzyme proteins were tagged with either 1 4 C or 3 H labeled formaldehyde in order to distinguish two enzymes in the same animal simultaneously. Papain was tagged with l4C- formaldehyde and chymopapain and papaya peptidase A with 3 H-formaldehyde as described by Rice and Means (1971). Two mixtures of enzymes (buffered solutions of 0.5 mg papain and 0.5 mg chymopapain or of 0.5 mg papain and 0.5 mg papaya peptidase A) were prepared. Each was injected into the tail vein of two 250 ± lg male rats. 30 min after injection, the rats were sacrificed by decapitation and bled thoroughly. The right femoral artery was ligated at the origin and the venae cava inferior was cut at the upper abdominal level to allow drainage of perfusates. Then the left leg was perfused via the abdominal aorta for 30-40 min with about 100 ml of physiological saline to wash out residual blood. Perfusion was terminated when the foot pad became white. Muscle samples from the loin, right leg and the perfused left leg from each rat were solubilized with NCS, as described by Hansen and Bush (1967). Isotope counts were made with a Beckman liquid scintillation counter.Injection of enzymes into chickens and determination of muscle protein hydrolysis
Solutions of crude papaya powder and three of the purified enzymes were prepared and diluted to give 55, 83, 110 casein digestion units per ml. The solutions were injected through an alar vein into 8-wk old chickens at a level of 1 ml per pound. For control, 0.85% sodium chloride in distilled water was used. Eight birds were injected for each level of each enzyme. The chickens were sacrificed 10 min after injection. After thorough bleeding, the legs were removed and kept overnight in a refrigerator. Samples for analysis were prepared by blending 1 part of meat with 7 parts of water for 1 min. 10-ml aliquots of the slurries were transferred into test tubes and incubated for 2 hr at 70° C. The enzyme reaction was stopped by boiling the reaction mixture for 15 min. After filtration, the increase in OD at 280 nm was measured.
RESULTSWE HAVE obtained papaya latex enzymes from various suppliers. Their enzymes had quite different activities, as Table 1 shows.
Different commercial enzyme preparations had similar protein content but the ratio of active to total activity differed greatly. The total casein digestion units represent the total enzyme potency which could participate in hydrolytic action after full activation, and the active casein digestion units measures only those enzymes which exist in their active form. In all cases much of the enzyme naturally present is in an inactive form which can be activated by enzyme activators.
Figure 2 shows the electrophoretic migration patterns of crude and purified papaya enzymes. Purified papain and papaya peptidase A appeared as single bands, whereas chymopapain revealed two adjacent bands. The resolution of
T ab le 1—C o m p ariso n o f p ro tein co n ten ts and casein digestion units fo r five d iffe ren t co m m erc ia l papaya enzym es
C ase in digestion un itsR atio
So urces Pro tein T o ta l3 A c t iv e 17 active
(%) (Per mg pro te in ) (%)
Sigm a T y p e I 4 5 .3 7 .0 4 .3 62.1Sigma T y p e II 5 7 .7 3 .6 1.1 3 1 .7Penick 9 5 5 5 4 .2 2 .9 0 .3 10 .5P en ick , E N R A 5 2 .0 11.7 6 .6 56.1l/Va(lerstein 1 3 8 7 4 8 .7 4 .5 1.2 2 6 .5
a T o ta l a ctiv ity is m easured after enzym e is fu lly activated w ith cys-
b A ct iv e casein digestion un its represent the p o rtio ns of en zym es w h ich e x ist n atura lly in an active fo rm ; the d ifferen ce betw een the total and the active represents the p o rtio ns of en zym es w h ich e x ist n atura lly in a reversib ly inactivated form .
Fig. 2 - P o ly a c r y la m id e g e l e le c tr o p h o re s is o f p a p a y a la te x e n z y m e s : c r u d e p a p a y a la te x p re p a ra tio n , E N R A (A ); p a p a in , (B l; c h y m o p a p a in , (C); a n d p a p a y a p e p t id a s e A , (D).

ÜW—JOURNAL OF FOOD SCIENCE-Volume 39 (1974)
T ab le 2 —E ffe c t o f pH and heat on the stab ility o f papaya enzym es
E n zy m e s
pH 5 pH 7 pH 9
2 5 ° C 7 0 ° C 2 5 ° C 7 0 ° C 2 5 ° C 7 0 ° C
(Percent of enzym e a ctiv ity )Papain 100a 92 101 8 6 67 21C h ym o p ap a in 100a 104 98 100 9 7 81Papaya Peptidase A 1 0 0 a 97 94 88 55 12
a T h e a c t iv it y o f e a ch e n z y m e h e ld a t 2 5 ° C an d p H 5 .0 w a s d e f in e d as 1 0 0 % . T h e e n z y m e d ilu e n ts u sed w e re 0 .0 2 M a c e ta te b u ffe r fo r p H 5 an d T r is b u ffe r fo r 7 an d 9 . T h e te m p e ra tu re t re a tm e n t w a s fo r 3 0 m in a t 2 5 ° o r 7 0 ° C . R e s id u a l a c t iv it y w a s m e a su re d w ith 1% ca se in at p H 7 .0 fo r 1 0 m in at 4 0 ° C .
T ab le 3 —A c t iv ity o f purified en zym es on casein and ben zo ylarg in ine ethyl ester ( B A E E ) at pH 7 .0 and 4 0 ° C
E n zy m e s
S p e c if ic activ ity
C ase in digestion3 B A E E b
Papain 16 7 3 .7 5C h ym o p ap a in 11 8 1 .02Papaya Peptidase A 19.6 5 .0 6
a T h e in c re a se o f O D a t 2 8 0 n m p e r m in /m g e n z y m e p ro te in b T h e in c re a se o f m l t it r a n t (1 M N a O H ) p e r m in /m g e n z y m e p ro te in X
1 0 0 0 .
two bands became more evident with purified chymopapain after exhaustive dialysis against cold 0.025M Tris buffer.
Commercial papaya enzyme preparations show the three enzyme bands which match the purified preparations of the proteolytic enzymes. For all of the commercial papaya enzymes, chymopapain constituted the major component, and both papain and papaya peptidase A were shown as minor constituents. In addition to the enzymes, several other bands were observed, indicating the presence of other protein components. These results are in close agreement with those obtained by column chromatography (Skelton, 1968).
In order to evaluate the role of each enzyme in a crude mixture in meat ten- derization purified papain, chymopapain and papaya peptidase A were tested on several substrates. Since the pH of meat changes considerably during postmortem aging and meat is exposed to elevated temperatures during cooking, determinations of enzyme behavior under a wide range of pH and elevated temperature conditions could provide critical information for evaluating each enzyme’s role in meat tenderization. The influence of pH on hydrolytic ability was reported for papain by Kimmel and Smith (1954) and for chymopapain by Ebata and Yasunobu(1962). Also Kunimitsu and Yasunobu(1 9 6 7 ) observed that chymopapain appears to be more thermostable than papain. The intent of our study was to make a direct comparison of the pH optima and heat stability of the three purified enzymes obtained from the same natural mixture.
Figure 3 illustrates effect of pH on the activity of the three enzymes. All three enzymes showed highest activity in the pH range of 7.0—8.0. Chymopapain retained most of its activity at pH 6, whereas there were sharp drops in activity with papaya peptidase A and papain as the pH was lowered to the acid side.
Figure 4 shows heat inactivation of papaya enzymes. All three enzymes showed good stability up to 60°C but
there were differences at 70°C. Chymopapain was most stable, followed by papaya peptidase A and papain in decreasing order.
The combined effects of pH and holding temperature on enzyme stability are given in Table 2. All three enzymes showed very little reduction of activity at pH 5, some loss at pH 7 and significant loss at pH 9, especially with 70CC heat treatment. Chymopapain showed the highest stability of the three proteases under this range of pH conditions. Papain and papaya peptidase A were less stable and the differences became greater as pH and temperature were raised.
Enzymatic tenderization of meat is achieved by partial degradation of the meat proteins. Table 3 compares hydrolytic potency of our three purified enzymes on casein and benzoylarginine ethyl ester (BAEE).
Papaya peptidase A had the highest specific activity both on casein and BAEE followed by papain and chymopapain in decreasing order. The ratios of enzyme activity on BAEE to casein are 0.23, 0.09 and 0.25 for papain, chymopapain and papaya peptidase A, respectively. Chymopapain showed strikingly lower activity on BAEE than the other two enzymes. We have also analyzed enzyme activity on
Fig. 3 —E ffe c t o f p H o n case in d ig e s tio n o f p a p a in , c h y m o p a p a in , a n d p a p a y a p e p t id a s e A . M c tlv a in e 's b u f f e r w as u s e d fo r th e p H ranges o f 2 to 9 a n d s o d iu m c a r b o n a te b u f fe r fo r p H 10. E n z y m e le ve ls w e re a d ju s te d to g ive o n e u n i t o f case in d ig e s tio n p e r m in u te a t 4 0 ° C.

TENDENZA TION OF MEA T -8 1 5
T a b le 4 —A c t iv ity of papaya proteases on native and heat-denatured m eat fractio n s at 4 0 ° C
W ater so lu b le m uscle p ro tein W ater in so lu b le m uscle p ro tein
N ative D enatured N ative D enatured N ative D enatured
(N itrogen) (N itrogen) (H y d ro x y p ro lin e )
(m cg/m l)aPapain 37 68 77 8 0 0.41 4 .0C h ym o p ap a in 31 4 7 70 82 0 .5 8 4 .4Papaya Peptidase A 28 50 57 69 0 .5 6 2 .7C rud e E n zy m e 26 50 67 81 0 .4 3 4 .0
a Increase in T C A so lub le nitrogen or h y d ro x y p ro lin e per mg of en zym e pro tein per m inute at 4 0 ° C
a number of substrates such as haemoglobin, milk (clotting), gelatin, fresh ground meat and benzoylarginine naph- thylamide (data not shown). However, none of these substrates has proved to be an ideal substrate for predicting meat tenderizing potency of various enzymes.
As an effort to find a substrate which would give in vitro assays showing high correlation with meat tenderizing potency, bovine muscle was separated into water-soluble and water-insoluble fractions. The water-insoluble fraction consists of the fiber components of meat, thus containing both myofibrillar proteins and connective tissue. Enzymes will interact both with native and heat- denatured meat proteins during cooking. Table 4 shows the enzyme activity on native and heat-denatured meat fractions after subtracting blank values. All three enzymes degraded meat fractions, but
with somewhat different hydrolytic potencies. Contrary to the results obtained by casein and BAEE, chymopapain showed activity comparable to papain and papaya peptidase A on meat fractions.
The water-insoluble fraction was more readily digested than the water-soluble fraction. Heat dénaturation naturally made meat proteins more readily digested by these enzymes, and the effect of dénaturation was more significant in the water-soluble fraction than the other fraction. As expected, hydrolysis of the native connective tissue by these enzymes as indicated by increased hydroxyproline was extremely low. Connective tissue after heat dénaturation was readily hydrolyzed. Papaya peptidase A showed about fivefold increase while papain and chymopapain increased their hydrolysis seven- to tenfold.
chymopapain
Table 5 compares the activity of papaya enzymes at 40°, 60° and a programmed temperature ranging from 25 —70°C. The programmed conditions simulate the cooking of meat.
Incubation at 60°C showed higher enzyme activity than 40°C. With the high temperature and programmed conditions, the increase of breakdown was highest with connective tissue as shown by hydroxyproline increase in the TCA soluble filtrates. Papaya peptidase A, which showed highest specific activity on casein and BAEE, proved to be least effective among three papaya proteases in hydrolyzing meat proteins. These results suggest that use of meat or meat protein fractions should serve as a better substrate for predicting tenderizing potency of these enzymes than the substrates commonly used for protease assay.
Independently, we analyzed the enzyme potency on homogenized fresh meat, the water-soluble and the water- insoluble fractions of meat, and compared the activity with the tenderizing potency of papaya enzymes after topical application on beef or antemortem injection. Meat tenderness was rated by expert taste panel members. Among the meat protein substrates tested, the water- insoluble fraction of meat showed highest correlation with the tenderness scores. An optimum tenderness of meat was uniformly obtained when enough enzyme to give 46 meg nitrogen breakdown on water insoluble fraction at 40°C, as described in Table 5, was introduced per pound of inside top round (U.S. prime grade) through multiple needle injection with a spray tenderizer. When introduced through vascular injection, an enzyme level of 950 meg nitrogen breakdown per pound of live cattle gave the same degree of tenderness.
One of the important parameters to consider in enzymatic tenderization of meat by antemortem injection is the availability of the injected enzymes for degradation of meat proteins. Enzymes introduced by vascular injection should be distributed uniformly throughout the
Fig. 4 - H e a t in a c tiv a tio n o f p a p a y a e n z y m e s . T h e p e r c e n t o f e n z y m e a c t iv i ty re ta in e d was d e te r m in e d b y case in d ig e s tio n a f te r h o ld in g e n z y m e s o lu t io n s a t 4 0 ° , 5 0 ° , 6 0 ° , 7 0 ° , o r 8 0 ° C fo r 3 0 m in in M c llva in e 's b u f fe r a t p H 7 .0 . E n z y m e leve ls w ere a d ju s te d to g ive o n e u n i t o f casein d ig e s tio n p e r m in u te a t 4 0 ° C.

WG—JOURNAL OF FOOD SCIENCE-Volume 39 (1974)
T ab le 5 —A c t iv ity o f papaya proteases on m eat fractio n s at 4 0 ° C a , 6 0 ° C a and program m ed tem perature*1 (2 5 —7 0 °C )
W ater-soluble W ater-insoluble
N itrogen N itrogen H y d ro x y p ro lin e
4 0 ° C 6 0 ° C Program m ed 4 0 ° C 6 0 ° C Program m ed 4 0 ° C 6 0 ° C Program m ed
(m cg/m l)
Papain 37 189 4 1 7 6 77 2 6 0 8 6 2 4 0.41 17.8 3 4 4C h ym o papa in 31 171 3 4 5 0 70 217 7262 0 .5 8 13.7 3 5 6Papaya Peptidase A 28 136 3 0 2 7 57 190 6 0 4 7 0 .3 6 13.3 3 0 2C rud e E n zy m e 26 111 3 2 1 9 67 2 2 2 5 7 4 7 0 .4 3 11.9 368
a A c t iv it y o f 1 m g e n z y m e a t 4 0 ° o r 6 0 ° C p e r m in u te w a s d e te rm in e d b y in c re a se in T C A so lu b le n itro g e n an d h y d ro x y - p ro lin e .
“ T o ta l a c t iv it y o f 1 m g e n z y m e in 3 8 m in p e rio d o f p ro g ra m m e d te m p e ra tu re fro m 2 5 ° to 7 0 ° C .
whole animal body. However, since most of the blood is drained when the animals are slaughtered, the enzymes remaining in the vascular system at the time of dispatch may make limited contribution to tenderization. Retention of enzymes in or near muscle cells after penetrating through blood capillary membranes appears to have a direct relationship with the tenderizing effect. Therefore, it is important to determine the distribution and fate of enzymes after injection. Enzymes tagged with radioactive 14 C and 3 H were injected intravenously into live rats and the levels of enzymes retained in the loin and the leg muscles from non- perfused and perfused legs were determined as described in the experimental procedure. The amounts of enzyme injected and the portions retained in the muscles are shown in Table 6.
The isotope counts in different portions of the muscles, i.e., loin and leg, did not show appreciable differences, indicating uniform distribution of enzymes throughout various portions of the animal muscles. After perfusion with a large amount of physiological saline solution, about 1/3 to 1/2 of enzymes in the non- perfused muscle was retained in the perfused muscle.
The most direct effect of antemortem tenderization could be determined by enzymatic hydrolysis of muscle proteins obtained from animals which received antemortem administration of enzymes. This premise was tested by injecting several levels of enzymes into chickens and determining the extent to which muscles hydrolyzed under standard condition. The extent of chicken muscle hydrolysis is shown in Table 7. When the whole legs in the sealed plastic bags were incubated under the same condition, virtually the same result was obtained. However, incubation of a slurry gave more uniform data.
When three levels of enzymes, based on equal casein digestion units, were introduced, the hydrolysis of chicken
muscle was increased with increasing levels of enzymes. The increments of enzyme levels did not bring about the proportional increases in hydrolysis that one observes in an ideal enzyme assay system. This deviation is especially true when one works with biological systems in which so many factors are present to interact with injected enzymes. When higher levels of enzyme were introduced, there seemed to be a greater degree of inhibition of enzyme activity with papaya peptidase A than with other enzymes. Nevertheless, one can conclude from these results that all three of the papaya proteases can hydrolyze chicken meat when introduced by antemortem injection.
DISCUSSION
FOR ANTEMORTEN tenderization of meat with proteolytic enzymes, one of the most important factors is compata- bility of enzyme with the biological systems of live animals. Active enzyme molecules produce meat tenderization by degradation of meat proteins. However, active forms of enzymes cannot be used for antemortem injection because, when introduced into live animals, they cause severe stress with such symptoms as labored breathing, nasal congestion, depression and frothing at the mouth. Only inactivated enzymes which reactivate slowly in the animal body can be used for antemortem application. Therefore,
Tab le 6 —D istrib u tio n o f in jected en zym es in the rat m uscles
M uscles
E n z y m e 3T o ta l in jected
(CPM /g rat)Lo in Leg Leg-Perfused
(CPM /g m uscle)
Papain 1 2 400 2 3 2 7 2163 9 1 0C h ym o papa in 19600 2 5 6 0 2 5 0 0 8 2 0Papaya Peptidase A 12000 1707 1 450 737
a P a p a in w a s tagged w ith 1 4 C ; c h y m o p a p a in an d p a p a / a p e p t id a s e A w ith 3 H .
T ab le 7 —D eterm inatio n of m uscle p ro tein h y d ro ly s is fro m en zym ein jected ch ickens
5 5 U n itsa 8 3 U n its3 110 U n its3
(A O D 2 8 0 nm/g m u sc le )bPapain 7 .6 10.6 14 .2C h ym o p ap a in 8 .5 11.4 14.2Papaya Peptidase A 8 .2 8 .2 10.5C rud e E n zy m e 7.5 11.9 13 .8
a E n z y m e le v e ls w e re a d ju ste d to g ive th e sa m e c a se in d ig e st io n u n its . b M u sc le s lu r r ie s w e re in c u b a te d a t 7 0 ° C fo r 2 h r . T h e e n z y m e a c t iv ity
w as m e a su re d b y th e in c re a se o f O D a t 2 8 0 nm in th e f i l t r a t e s ab o ve sa lin e in je c te d c o n tro l .

TE N D E R IZ A T I O N O F M E A T - 817
commercial enzyme preparations must have low ratios of active to total casein digestion units to be satisfactory in formulating enzyme solutions for antemortem tenderization. Sulfhydryl enzymes derived from plant sources can be reversibly inactivated (Beuk, 1969; Warner et al., 1972), whereas no successful means has been discovered yet to reversibly inactivate nonsulfhydryl proteases to forms which can be regenerated in the animal’s natural physiological system.
The presence of several proteolytic enzymes in papaya latex has been noted: (Kimmel and Smith, 1954; Ebata and Yasunobu, 1962; Kunimitsu and Yasu- nobu, 1967; Shack, 1967; Skelton, 1968, 1969; Stem, 1971). Because these enzymes possess distinctly different physical, chemical and biological characteristics and because they are present in varying quantities depending on the enzyme suppliers, it has been difficult to develop a simple and accurate laboratory method to determine their tenderizing potencies without resorting to expensive animal testing.
Skelton (1968) developed a procedure to show the distribution of proteins and enzymes with the use of a single hydrox- ylapatite column. As an alternative to this column method, polyacrylamide gel electrophoresis has been tested and found to be a simple and reliable method for estimating the quantity of proteases in a preparation. As illustrated in Figure 2(A), gel electrophoresis separates protein components of papaya latex and can show distribution of enzymes in the various commercial enzyme preparations. After electrophoretic separation, protein bands can be scanned and the relative amount of each enzyme can be determined.
Since electrophoretic separation gives only a picture of protein distributions, the capability to integrate the amounts of active enzymes and the hydrolytic potencies contributed by each enzyme in a mixture is being further developed to assess tenderizing potency of different papaya latex preparations.
It was noted earlier by Kang and Rice(1970) that the myofibrillar fraction is more susceptible to enzyme attack than the water-soluble fraction. The water- insoluble fraction, mainly muscle fibers, is the major component of meat and thus plays an important role in determining tenderness of meat. It is not surprising to observe that enzymes hydrolyze heat- denatured fractions of meat faster than the native ones, but increase in free hydroxyproline following hydrolysis after heat denaturation was exceptionally high. Collagen in connective tissue undergoes unfolding of the triple helix structure in the region of 55-65°C , rendering itself more susceptible to enzyme degradation. The thermal shrinkage temperature is affected by interaction with electrolytes,
nonelectrolytes, acids and bases (Gustav- son, 1956). Therefore, the hydroxyproline release in samples incubated at 60CC and programmed 25—70°C showed a much greater degree of hydrolysis than was obtained at 40°C. The results indicate that papaya proteases degrade meat above and below 60°C but they degrade connective tissue only after denaturation.
As illustrated, the papaya enzymes are very powerful in hydrolyzing fiber proteins and connective tissue. This appears to be one of the main differences between the effects of enzymes derived from plant sources and those of catheptic enzymes. Postmortem tenderization of meat with natural aging is believed to be due to the proteolytic enzymes inherently present in meat. Attempts to obtain evidence for the role of proteolytic enzymes in postmortem tenderization have been numerous. Cathepsins isolated from bovine muscle readily hydrolyzed sarcoplasmic proteins, i.e., water-soluble fraction (Bodwell and Pearson, 1964). However, cathepsin preparations which displayed proteolytic activity on that protein substrate showed no evidence of hydrolysis on fibrillar proteins such as actin, myosin and actomyosin (Bodwell and Pearson, 1964; Martins and Whitaker,1968) or the collagen fraction (Sharp,1963).
Selection of substrate(s) to measure enzyme potency which correlate best with meat tenderizing potency has been practically important. It seems logical to find that the fiber protein of meat serves as a satisfactory substrate in predicting the tenderizing potency of enzymes. This is true whether one applies enzymes by injection or postmortem (dipping meat in enzyme solutions or pumping enzyme solutions into meat through multiple needles under standardized conditions). However, greater discrepancies between expected and actual increases in tenderness have been observed in antemortem application of enzymes because so many biological elements are encountered in vivo. Even though our preliminary data show high correlation between fiber protein degradation and tenderizing potency after antemortem injection, more work is needed before one can draw firm conclusions. Small laboratory animals have not proved to be satisfactory for judging tenderness by panel members and beef cattle injection is too expensive to use in laboratory testing. However, by accumulation of data over a long period of time on many different commercial preparations, we hope to obtain enough data for statistical analysis.
The papaya latex enzymes have been commonly called papain and thus people commonly refer to tenderization of meat by papain. The results of this study clarify the fact that chymopapain, the major component of papaya latex preparations,
is the main contributor for tenderization of meat.
Enzymes introduced through vascular injection showed comparable distribution in two entirely different animal muscles (Table 6). At the dosage levels used only12—19% of the injected enzymes were found in the muscles. When 4 times as much chymopapain was injected, there was a slight increase in the amount of enzymes retained in muscles. However, this was not proportional to the increased level of enzyme injected. Organs such as kidney, liver, spleen, lungs, heart and pancreas retained higher isotope counts than the muscles and in a decreasing order as listed. Much of the injected enzyme was lost with blood.
In our earlier experiments with isotope-tagged papain and chymopapain, we noticed substantial amounts of enzymes (as much as 5—20% of the counts in the intact muscles) remaining in the washed muscle fiber pieces. The washed fiber pieces were prepared from homogenized muscle according to the method of Davey and Gilbert (1969) by 3 washings with 5 volumes of KCl-phosphate buffer. These results led us to believe that enzymes introduced through vascular injection must travel to or near the muscle cells after passing through blood vessel membranes. The perfusion experiment after injection of radioactive isotope-tagged enzyme gave a new insight for antemortem treatment. A substantial amount of enzymes (33 — 51% of the total remaining in each muscle) penetrated the capillary membranes. This portion of enzymes in the extra vascular system might contribute effectively to the hydrolysis of muscle protein components.
The passage of proteins through capillaries was noted by Pappenheimer et al.(1951) who recognized that muscle capillaries leak proteins. LeBrie (1967) later confirmed these results with isotope- tagged human serum albumin and dextran fractions of known molecular weights, and concluded that capillaries have an iso- porous small pore system and another larger pore system through which bulk filtration or free diffusion of macromolecules can occur. Penetration of enzymes through capillaries by this mechanism appear to be a slow process. However, since the molecular weights of papaya proteases are relatively smaller (21,000—36,000) than those of plasma proteins and the amount of enzymes necessary for meat tenderization is small, a sufficient amount of enzymes for tenderization may filter through capillaries between injection of enzymes and slaughter of animals (1 5 - 60 min).
Injection of active proteases into the animal causes histamine-like reactions in which vaso dilation and alteration of capillary permeability occur (Dipalma,1965). Reversible inactivation of papaya

818-JOURNAL OF FOOD SCIENCE-Volume 39 (1974)
proteases eliminates this type of animal reaction (Warner et al., 1972). However, enzymes are expected to be reactivated slowly in the vascular system of the live animal and fully reactivated in the animal carcass after slaughter. The amount of enzyme reactivated before slaughter of an animal may have to be enough to cause increased permeability of the capillary walls but not enough to stress the animal. A slight increase in capillary permeability may allow access of enzymes to the extra vascular system, thereby providing for effective tenderization of meat.
The fact that hydrolysis of muscle protein occurs in the meat of animals injected live with enzymes suggests that the cell wall is disrupted by the enzymes or postmortem changes allowing the enzymes to have direct contact with the fiber proteins in the muscle cells. The hydrolysis of chicken muscle protein after vascular injection of enzyme is also evidence that the antemortem injection of proteases gives meat tenderization by degradation of meat proteins.
In addition to structural barriers to mobility of injected enzymes within the animal, specific components of serum proteins are known to bind introduced enzymes (Vogel et al., 1968; Boyde and Pryme, 1968; Yoshioka, 1970). Naturally, the introduced enzymes, when bound to blood proteins, are not available for hydrolysis of meat tissue. In our in vitro assay of papaya enzymes, addition of blood serum, especially purified alpha2- macroglobulin, inhibits proteolytic activity. The extent of inhibition varies with the concentrations of reactants and reaction conditions used. Meat is naturally in a reduced state and can regenerate enzymes which have been inactivated by having their sulfhydryl groups blocked. The inhibitors present in animal blood have a tendency to form a complex with enzymes not necessarily involving the sulfhydryl residue of the enzymes. The extent to which this complex dissociates
in the muscle during storage or cooking is not known. This is one of the reasons why it is not easy o predict the tenderizing potency of enzymes introduced into live animals from the enzyme activities determined in vitro, especially when enzyme preparations exist as a mixture of variable components, each of which reacts differently in the animal systems. Of the three papaya proteases, papaya peptidase A appears to interact with biological inhibitors more strongly than the other two as illustrated by reduced hydrolysis when injected into chickens. However, it is not clear why greater magnitudes of papaya peptidase A activity were reduced only when high levels of enzymes were injected. Much more work is needed before one can fully explain many of the unsolved problems.
REFERENCESB eu k, J .F ., Savich, A .L . , Goeser, P .A . and
H ogan, J .M . 1 9 5 9 . M e th o d o f tendering m eat. U .S . P aten t 2 ,9 0 3 ,3 6 2 .
B euk, J .F . 1 9 6 9 . Process o f producing p lant proteases. U .S . P aten t 3 ,4 4 6 ,7 0 6 .
B odw ell, C .E . and Pearson, A .M . 1 9 6 4 . The a c tiv ity o f p a rtia lly p u rifie d bovine cathep- tic enzym es on various natura l and syn thetic substrates. J. F o o d Sci. 2 9 : 6 0 2 .
B oyde, T .R .C . and P rym e , I .F . 1 9 6 8 . A lp h a 2- M acrog lob u lin b ind ing o f tryp s in , chym o- tryp s in , papain , and cationic aspartate am ino-transferase. C lin ica C h im ica A cta 2 1: 9.
D avey , C .L . and G ilb e rt. K .V . 1 9 6 9 . Studies in m eat tenderness. 7 . Changes in the fine structu re o f m eat during aging. J. F o o d Sei. 34: 6 9 .
D ipa lm a , J .R . 1 9 6 5 . “ D r i l l ’s Pharm acology in M e d ic in e ,” p. 7 6 7 . M c G ra w -H ill, N ew Y o rk .
E b a ta , M . and Y asunobu, K .T . 1 9 6 2 . C h y m o papain . I . Iso la tio n , c rys ta lliza tion , and prelim in a ry characterization . J. B io l. C hem . 237 : 1 0 8 6 .
Gustavson, K .H . 1 9 5 6 . “ The C hem istry and R e a c tiv ity o f C o llagen ,” p. 2 1 1 . A cadem ic Press, N ew Y o rk .
H ansen, D .L . and Bush, E .T . 1 9 6 7 . Im proved so lu b iliza tion procedures fo r liq u id scin tilla t io n counting o f b io log ica l m ateria ls. A na l. B iochem . 18: 3 2 0 .
Jansen, E .F . and Balls, A .K . 1 9 4 1 . C hym o papain : A new crysta lline proteinase fro m papaya la te x . J. B io l. C hem . 1 3 7 : 4 5 9 .
K ang, C .K . and R ice , E .E . 1 9 7 0 . D egradation o f various m eat fractions b y tenderiz in g enzym es. J . F o o d Sci. 3 5 : 5 6 3 .
K im m e l, J .R . and S m ith , E .L . 1 9 5 4 . 1 . P reparat io n , spe c ific ity , and activa tion . J. B io l. C hem . 2 07 : 5 15 .
K un im itsu , D .K . and Y asunob u , K .T . 1 9 6 7 . C h ym o p ap a in . IV . The chrom atograph ic frac tio n a tio n o f p a rtia lly p u rifie d c h y m o papain and the characterization o f c rysta lline chym opapain B. B iochem . B iophys. A cta 139 : 4 0 5 .
K u n itz , M . 1 9 4 7 . C rysta lline soybean tryp s in in h ib ite r. I I . G eneral p roperties . J. G en. Physio l. 3 0 : 2 91 .
Lang, C. 1 9 5 8 . S im ple m ic ro d e te rm in a tio n o f K je ld a h l n itrogen in b io log ica l m ateria ls . A n a l. C hem . 1: 6 9 2 .
L eB rie , S.J. 1 9 6 7 . R en a l p e ritu b u la r cap illary p e rm e a b ility to m acrom olecules. A m . J. Physiol. 2 1 3 : 1 2 2 5 .
M artins , C .B . and W h ita ke r, J .R . 1 9 6 8 . C athep - t ic enzym es and m eat te n d e riza tio n . 1 . P urific a tio n o f cathepsin D and its ac tion on actom yosin . J. F o o d Sci. 3 3 : 59.
M in ari, O . and Z ilversm it, D .B . 1 9 6 3 . Use o f K C N , fo r s tab ilization o f co lor in d irect nesslerization o f K je ld a h l digests. A n a l. B iochem . 6: 3 2 0 .
Pappenheim er, J .R ., R e n k in , E .M . and B orrero , L .M . 1 9 5 1 . F ilte ra tio n d iffu s io n and m o lec u lar sieving th rou gh periph era l cap illa ry m em branes. A c o n trib u tio n to the pore th eo ry o f cap illary p e rm e a b ility . A m . J. Physiol. 1 67 : 13 .
R ice , R .H . and M eans, G .E . 1 9 7 1 . R ad ioactive labeling o f prote ins in v itro . J. B io l. C hem . 2 4 6 : 8 3 1 .
Shack, P. 1 9 6 7 . F ra c tio n a tio n o f p ro te o ly tic enzym es o f d ried papaya la te x . Iso la tion and p re lim in ary charac te rization o f a new p ro te o ly tic enzym e. C o m p t. R en d . T rav. L a b . Carlsberg. 36: 6 7 .
Sharp, J .G . 1 9 6 3 . Aseptic autolysis in ra b b it and bovine muscle during storage a t 3 7 ° . J. Sci. F o o d A gric. 1 4 : 4 6 8 .
S ke lton , G .S . 1 9 6 8 . C o lu m n chrom atography o f papaya proteinases on h y d ro x y la p a tite . J. C hrom atog . 3 5 : 2 8 3 .
S ke lton , G .S . 1 9 6 9 . D eve lo pm en t o f p ro te o ly tic enzym es in grow ing papaya fru it . P h y to chem istry 8: 5 7 .
S tern , I.J . 1 9 7 1 . Process fo r p u rific a tio n o f chym opapain . U .S . P aten t 3 ,5 5 8 ,4 3 3 .
Y osh ioka , Y . 1 9 7 0 . Studies on in tes tin a l absorption o f p ro te o ly tic enzym e. Saporo M ed. J. 2 6 : 4 1 .
V o g el, R ., T rautscho ld , I . and W erle , E . 1 9 6 8 . “ N a tu ra l Proteinase In h ib ito rs ,” p. 5 7 . A cadem ic Press, N ew Y o rk .
W arner, W .D ., Kang, C .K . and R ice, E .E . 1 9 7 2 . Tend eriza tio n o f m eat w ith p ro te o ly tic enzym es. U .S . P aten t (pend ing).
Woessner, J .F . Jr. 1 9 6 1 . Th e d e te rm in a tio n o f h y d ro x y p ro lin e in tissue and p ro te in sam ples conta in ing sm all p rop ortion s o f this im in o acid. A rch . B iochem . B iophys. 9 9 : 4 4 0 .
Ms received 1 0 /9 /7 3 ; revised 1 /8 /7 4 ; accepted1 / 1 5 / 7 4 . ________ ______________________________
The authors th a n k R .F . Jod low ski fo r hisexce llen t technical assistance.

B. W. B E R R Y , ' G. C. S M IT H a n d Z . L. C A R P E N T E R T exa s A g r ic u ltu r a l E x p e r im e n t S ta t io n , M ea ts & M e a t C h e m is tr y Sec.
D e p t, o f A n im a l S c ie n c e , T exa s A & M U n iv e r s ity , C o llege S ta t io n , T X 7 7 8 4 3
RELATIONSHIPS OF CERTAIN MUSCLE, CARTILAGE AND BONE TRAITS TO TENDERNESS OF THE BEEF LONGISSIMUS
INTRODUCTIONUSDA (1965) beef grading standards include the assumption that decreases in tenderness are associated with advances in physiological maturity and that maturity can be determined by evaluating the size, shape and ossification of bones and cartilages in the vertebral column and by considering the color and texture of the longissimus muscle. Subjective appraisal of the latter traits is predicated upon assumed relationships to objective measures of physiological maturity and to ultimate paiatability. A number of characteristics of muscle, cartilage and bone have been
' Présent address: D ep t. o f A n im a l Sciences, C olorado State U n ivers ity , F o rt C ollins , CO 805 2 1
studied to determine their relationship to physiological maturity and/or paiatability. Tuma et al. (1963), Romans et al. (1965a), Cooper et al. (1968) and Covington et al. (1970) reported that muscle fiber diameter was not closely related to tenderness of beef from carcasses differing in physiological maturity. Sarcomere length (longer in A vs. E maturity carcasses, Cooper et al., 1968) and incidence of wavy fibers (higher in E vs. A and B maturity carcasses, Covington et al.,1970) have been implicated in accounting for the decreased tenderness of beef from E maturity carcasses. Romans et al. (1965a) and Walter et al. (1965) observed no difference in the moisture and fat content of beef longissimus muscle from carcasses differing in USDA maturity score; but Covington et al. (1970) concluded
that the proportion of ether-extractable material that is not visible increases as physiological maturity increases. Breiden- stein et al. (1968) reported that samples possessing higher ether extract values had higher paiatability ratings when results were averaged across A, B and E maturity groups. Tuma et al. (1963) and Romans et al. (1965b) observed darker muscle with increases in physiological maturity; but Tuma et al. (1963) found low and nonsignificant correlations between color measurements and tenderness among samples obtained from cattle ranging from 6—90 months in age. Grant et al.(1970) observed that differences in bone, cartilage and muscle mineral content were associated with changes in physiological maturity, but were generally unrelated to measures of tenderness. Adams and
T a b le 1—C la ssifica tio n sch em e fo r selecting beef ribs on the basis of skeletal and m uscle m atu rity ch aracte ristic s and ossificatio n in the cartilag ino us tips of the dorsal sp in o u s processes
Cartilag e o ssificatio n in the tip o f the dorsal sp in o u s p ro cess'’
S e lectio n U S D A m atu rity group3 F ifth th o racic E ig h th th o racic T e n th th o ra c icclass n Ske leta l M uscle vertebrae3 vertebrae0 vertebrae0
1 10 A - A -2 11 A A3 11 A A -4 10 A+ A+5 10 A+ A6 8 A+ A -7 8 B - B -8 7 B - A+
9 8 None None < 1/310 11 None < 1/3 < 1/311 9 < 1/3 < 1/3 < 1/312 6 None < 1/3 1 / 3 -2 / 313 8 < 1/3 < 1/3 1/3—2/314 10 < 1/3 1/3—2/3 1 /3—2/3
15 9 1/3—2/3 1/3—2/3 1/3—2/3
16 6 < 1/3 < 1/3 > 2/3
17 7 < 1/3 1 / 3 -2 / 3 > 2/3
18 10 1 / 3 -2 / 3 1/3—2/3 > 2/3
19 8 < 1/3 > 2/3 > 2/3
20 9 1/3—2/3 > 2/3 > 2/3
21 11 > 2/3 > 2/3 > 2 / 3
22 11 C om p lete Co m p lete C o m p lete
a B ase d on d e s c r ip t io n s p ro v id e d in U S D A (1 9 6 5 ) b e e f g rad in g s ta n d a rd sb F r a c t io n a l q u a n t it ie s re fe r to th e a m o u n t o f th e s u r fa c e area o f th e c a r t ila g in o u s t ip (b u t to n ) w h ic h w a s o s s if ie d . c T h o r a c ic v e rte b ra e w e re n u m b e re d fro m th e c ra n ia l e n d of th e c a rc a s s (1 s t th o ra c ic v e r te b ra a r t ic u la te s w ith th e rib
n e a re st th e c e rv ic a l v e rte b ra e ) .
Volum e 3 9 (1 9 7 4 1 -JO U R N A L O F FO O D S C IE N C E -8 1 9

Q20—JOURNAL OF FOOD SCIENCE-Volume 39(1974)
Arthaud (1970) found that a cartilage press technique was unreliable for predicting tenderness of samples from cattle of similar age. The present study related histological or chemical characteristics of the beef longissimus and hardness of scapular cartilage, vertebral cartilage and vertebral bone from beef carcasses differing
widely in physiological maturity to the tenderness of the longissimus muscle.
EXPERIMENTAL
Selection procedures and palatability evaluations
Wholesale beef ribs were selected from 195
carcasses according to descriptions enumerated in Table 1. Carcasses were evaluated (USDA,1965) with the assistance o f the Meat Grading Branch of the USDA and only carcasses with “ slight,” “small” or “modest” amounts of marbling were selected. After an 8 - 1 0 day postmortem aging period, samples o f longissimus muscle were obtained from the 9th and 12th thoracic vertebrae regions of each wholesale rib for chemical-histological and palatability studies, respectively. Each sample was individually double-wrapped in polyethylene-coated paper, frozen and stored at — 23“C.
Palatability samples (lOOg, 2.3 x 6.5 x 2.3 cm) were thawed in a 3°C cooler for 12 hr and then oven-broiled for 35 min in a preheated 180°C gas oven (one sample per oven) to an internal temperature o f 71°C. Cooked samples were scored by a six-member trained sensory panel by use of the tenderness profile system described by Cover et al. (1962). Warner-Bratz- ler shear force measurements for each steak were performed in duplicate on two 1.27 cm cores which were removed after the samples had cooled to 2.5°C.Histological measurements
Longissimus muscle samples were placed in MacCallum’s macerating fluid (one part dilute nitric acid, two parts glycerine and two parts distilled water) for 24 hr. Measurements o f muscle fiber diameter were obtained on 125 teased and isolated fibers per sample at a magnification of 200X. Sarcomere length was determined by measuring the length o f 10 sarcomere units from each of 50 myofibrils at a magnification of 1000X. Samples were prepared for measurement by homogenizing 5g of muscle with 35 ml of 0.25M sucrose solution for 40 sec.
Fragmentation o f muscle fibers and m yofibrils were obtained on tissue homogenates created by blending 3g of muscle tissue with 40 ml of 0.25M sucrose solution in a Virtis Model Super “ 30” homogenizer using extremely dull blades. The procedure entailed blending for15-sec intervals at a speed two-thirds the distance between the low and intermediate speed indicators on the adjustment dial until a total of 60 sec blending time was achieved. A 15-sec cooling period was imposed between each 15 sec period o f homogenization. The degree of fragmentation in muscle fibers was determined by randomly selecting and measuring the length of 25 fragmented muscle fibers per sample at 100X magnification. A subjective determination o f the degree of myofibril fragmentation was employed using the following scale based on the number o f sarcomeres per myofibril fragment: 6 = few; 5 = mixture o f few and average; 4 = average; 3 = mixture of few, average and many; 2 = mixture o f average and many ; and 1 = many (where “few,” “average” and “many” corresponded tc 2 - 5 , 6 - 1 2 and more than 12 sarcomeres per myofibril fragment). The actual number o f sarcomeres per myofibril fragment was also ascertained on 25 randomly selected and isolated myofibril fragments per sample. The percentage o f muscle fibers which displayed a wavy configuration was recorded for samples prepared for measurements o f sarcomere length.
Chemical measurementsThe moisture content o f the longissimus
muscle was determined as the weight loss o f3 -4 g samples after drying for 24 hr at 100°C. The fat content o f the longissimus muscle was
T a b le 2 —M ean values fo r h isto logical tra its s tra tified according to se lectio n c lassa
S e lectio nclass
F ib erdiam eter(m icrons)
Sarco m erelength
(m icrons)
Length of fragm ented
m uscle fibers (m icrons)
M yo fib rilfragm entation
score*3
Sarco m eres per m yo fib ril
fragm ent (m icrons)
Percent w avy fibers
1 54 .4a 1 .76bcd 287 .6a 4 .4 0 a bed 6 .9 4 a 6 .0 0 a2 5 9 .5abed 1 .83abc 260 .1a 4 .0 9 ab 6.65a 6 .3 6 a3 6 0 .9 b cd e 1 .80abed 26 1 .3 a 5 .0 9 b cd 5 .4 9 a 8 .18a4 6 6 .3 d e 1 .86ab 28 3 .4 a 4 .3 0 a bed 6 .4 7 a 8 .4 0 a5 6 4 .2 cd e 1.85ab 28 6 .2 a 4 .0 0 ab 6 .4 0 a 8 .6 0 a6 6 0 .2 ab cd 1.94a 34 4 .4 a 4 .1 2 ab c 6 .5 4 a 3 .0 0 a7 5 9 .2a be 1 .84abc 28 6 .0 a 3 .6 2 a 7 .49a 3 .7 5 a8 6 0 .4 ab cd e 1.79abcd 275 .6a 4 .25abed 5.78a 4 .5 0 a9 57.2ab 1.81 abed 28 5 .7 a 4 .2 5 ab cd 6 .9 1 a 3 .5 0 a
10 62 .3 b cd e 1 .76bcd 3 2 9 .8 a 4 .0 9 ab 6 .4 0 a 7 .9 1 a11 6 2 .3 b cd e 1.76bcd 2 5 9 .8 a 4 .6 7 ab cd 5 .6 1 a 6 .8 9 a12 59 .5ab cd 1.73 bed 222 .4a 5 .3 3 b cd 5.40a 5 .33a13 6 5 .3 cd e 1 .82abc 2 6 3 .1 a 5 .2 5 b cd 5 .5 2 a 2 .7 5 a14 6 1 .5bcde 1.82ab c 273 .1a 4 .1 0 ab c 7 .08a 7 .40a15 6 2 .5 b cd e 1 ,73bcd 3 0 0 .3 a 4 .2 2 ab cd 6 .5 0 a 6 .0 0 a16 6 0 .0 ab cd 1.76abcd 247 .5a 5 .17 bed 6 .1 7 a 7 .67a17 6 0 .2 ab cd 1.81 abed 2 3 9 .4 a 5 .1 4 b cd 5.51a 7 .1 4 a18 6 5 .6 cd e 1 .75bcd 257 .0a 5 .20b cd 5.47a 10.80a19 6 2 .7 b cd e 1 .83abc 227 .8a 5 .50d 4 .9 0 a 8 .5 0 a20 6 2 .0 b cd e 1.77bcd 290 .5a 5 .2 2 b cd 5.99a 8 .4 4 a21 6 3 .6 b cd e 1.66d 27 6 .8 a 5 .2 7 cd 6 .0 4 a 14.91a22 6 7 .Oe 1 .69cd 3 1 4 .9 a 5 .2 7 cd 5.60a 7 .82a
a M e an s in th e sa m e c o lu m n b e arin g d if fe re n t le tte rs are s ig n if ic a n t ly |P < 0 .0 5 ) d if fe re n t . b M e an s b ased on a 6 - p o in t sc a le (6 = fe w sa rc o m e re s p a r m y o f ib r i l f ra g m e n t ; 1 = m a n y
sa rc o m e re s p e r m y o f ib r i l fra g m e n t).
T a b le 3 —M ean values for h isto lo g ical tra its s tra tified accord ing to U S D A m atu rity g roup3
Length of Sarco m eresU S D A
m aturitygroup
F iberdiam eter(m icrons)
Sarco m erelength
(m icrons)
fragm ented m uscle fibers
(m icrons)
M yo fib rilfragm entation
score*3
per m yo fib ril fragm ent (m icrons)
Percent w avy fibers
A - 54 .4a 1 .76ab 2 8 7 .6 a 4 .4 0 ab c 6 .9 4 a 6 .0 0 aA 6 0 .2 b 1.85a 2 8 3 .0 a 4 .4 7 ab c 6 .2 0 a 6 .1 3 aA+ 6 5 .2 c 1.86a 2 8 4 .8 a 4 .1 5ab 6 .4 4 a 8 .5 0 aB - 6 0 .4 b 1.83a 3 0 5 .9 a 3 .7 5 a 7 .02a 4 .1 9 aB 6 4 .5 b c 1.81 ab 2 9 3 .7 a 4 .5 0 ab c 5 .68a 8 .2 0 aB+ 57 .3ab 1,82ab 2 4 9 .0 a 4 .5 0 ab c 6 .4 5 a 1.00aC - 6 3 .4 b c 1 .79ab 2 6 5 .5 a 4 .8 8 pc 6 .1 1 a 4 .5 0 aC 5 9 .6 b 1.78ab 2 6 2 .6 a 4 .4 6 ab c 5 .93a 6 .4 6 ac+ 6 0 .0 b 1.86a 253 .8a 4 .5 6 ab c 6 .4 2 a 4 .8 8 aD - 6 4 .1 b c 1 .74ab 2 5 7 .6 a 4 .9 3 be 5 .7 9 a 9 .0 0 aD 5 9 .8b 1 ,74ab 2 7 1 .3 a 5 .4 2 c 5 .49a 7 .00aD+ 6 4 .7 b c 1 .67b 257 .8a 5 .3 8 c 5.48a 12.62aE - 6 2 .3 b c 1 .75ab 2 7 1 .0 a 4 .8 6 ab c 6 .3 3 a 9 .1 4 aE 6 4 .4 be 1 .66b 2 9 8 .9 a 5 .4 3 c 6 .4 1 a 16.00aE+ 6 7 .9 c 1 .63b 3 4 8 .4 a 5 .4 3 c 5.21a 9 .7 1 a
3 M e an s in th e sam e c o lu m n b e arin g d if fe re n t le t te rs are s ig n if ic a n t ly (P < 0 ,0 5 ) d if fe re n t , k M e an s b ased on a 6 - p o in t sc a le (6 = fe w sa rc o m e re s p e r m y o f ib r i l f ra g m e n t ; 1 = m a n y
s a rc o m e re s p e r m y o f ib r i l fra g m e n t).

TENDERNESS OF THE BEEF LONGISSIMUS- 821
T a b le 4 —S im p le co rre la tio n co e ffic ie n ts betw een h isto logical ch aracte ristics of m uscle and tenderness m easurem ents fo r co m bin ed se lectio n classes
H isto log ica l ch aracte ristic
Tend erness m easureF ib e r
d iam eterSarco m ere
length
Leng th of fragm ented
m uscle fibers
M yo fib rilfrag m entation
sco re
Sarco m eres per m yo fib ril
fragm ent
P ercentw avyfibers
To ng ue and ch eek pressure score 0 .0 4 0 .1 8 * - 0 .2 4 * * 0 .1 5 * - 0 .1 8 * -0 .1 1
T o o th pressure score - 0 .1 3 0 .3 8 * * - 0 .2 9 * * ^0.01 - 0 .1 2 - 0 .1 9 * *M ealiness score - 0 .2 0 * * 0 .2 5 * * - 0 .2 6 * * - 3 .0 9 - 0 .0 4 - 0 .2 6 * *A d hesion score - 0 .1 6 * 0 .3 9 * * - 0 .2 7 * * - 3 .0 7 - 0 .0 6 - 0 .2 8 * *Fragm entation score - 0 .1 2 0 .4 6 “ - 0 .3 3 * * -3 .0 1 -0 .1 1 - 0 .3 1 “C o n nective tissue
am o un t score - 0 .1 3 0 .2 6 * * - 0 .0 4 - 0 .1 9 * * 0 .0 7 -0 .0 1C o n nective tissue
softness score - 0 .1 4 * 0 .2 6 * * - 0 .0 4 - 0 .1 6 * 0 .0 6 0 .0 0Shear fo rce value 0 .1 5 * - 0 .3 4 * * 0 .3 8 * * - 0 .0 9 0 .2 0 * * 0 .2 1 * *
♦ P < 0 .0 5 * * P < 0 .0 1
determined as the weight loss from the dried samples after continuous extraction in diethyl ether for 8 hr by use of a soxhlet apparatus. The Briskey et al. (1959) procedure was used to determine expressible juice area. Expressible juice area was converted to percent of expressible juice by the use of the formula reported by Carpenter (1962). Total pigment concentration in longissimus samples was determined following the procedure of Rickansrud and Henrick- son (1967).
Longissimus muscle samples from 69 of the 195 carcasses were analyzed for hydroxy proline content. These 69 samples were selected to represent muscle previously evaluated by sensory panel and mechanical tenderness measurements as consistently high, intermediate or low in tenderness within the original selection classes. The hydroxyproline content of the samples was determined following the Woessner (1961) procedure. Total collagen content was calculated by multiplying the combined hydroxyproline contents of the supernatant and residue fractions by 7.25 as described by Goll et al. (1964). Percent soluble collagen was determined using the technique of Hill (1966).Physical measurements on bone
Sections of bone from the 10th thoracic vertebrae, cartilage from the buttons of the 10th thoracic vertebrae and cartilage from the scapulae were obtained for hardness measurements. Five hardness readings per bone sample were taken with both the Shore Durometer (Shore Instrument Co.) and the Barcol Impressor (Barber-Coleman Co.). These measurements were taken on smooth, flat surfaces approximately 6 cm from the juncture between the cartilaginous tip and the bone of the dorsal spinous process. Smooth, flat surfaces of vertebral and scapular cartilage were also tested for hardness with the Shore Durometer. Sections, 0.06 cm in thickness, were cut from unossified scapular and vertebral cartilage and the force required for severance was determined by use of the Nip Tenderometer (Food Tech Corp.). A 0.64 cm length portion of each cartilage section was severed in triplicate for all samples.
Reduction of data was achieved using analysis of variance, while mean separation analyses
were performed using the Kramer (1956) modification of the Duncan (1955) Multiple Range Test.
RESULTS & DISCUSSION Histological traits
Mean values for histological traits stratified according to the original selection criteria are presented in Table 2. General increases in fiber diameter and
myofibril fragmentation score and decreases in sarcomere length were associated with advancing maturity. Muscle samples from the most youthful group (selection class 1) possessed the smallest fiber diameters, while those in the most mature group (selection class 22) had the largest muscle fibers. Tuma et al. (1962) noted an increase in fiber diameter between samples from 6 month old cattle and those from 18—24 month old cattle,
T a b le 5 —M ean values fo r ch em ica l tra its s tra tified accord ing to se lectio n c lassa
S e lectio nclass
Percentfat
M F B b
Percentm oisture
W T B b
Percentexpressib le
ju ice
Ex p ressib le ju ice area
(cm 2 )
T o ta l pigm ent c o n c -M F F B b
(mg/g)
1 14.5a 73 .6a 6 7 .3 a 3 6 .3 ab cd 15.6a2 15.2a 73 .3a 71 .2a 3 8 .2 b cd 18 .7ab c3 14.9a 73.2a 6 5 .1 a 3 4 .9 ab c 19 .9bcd4 16.3a 72.9a 6 4 .1 a 3 4 .2 ab 2 1 .7 b cd e5 16.5a 73.0a 70 .6a 3 7 .7 b cd 20 .4b cd6 16.3a 72 .9a 6 8 .9 a 3 6 .8abed 18.1ab7 16.6a 72 .4a 6 2 .4 a 3 3 .2 a 2 4 .0 d e f8 15.9a 73 .0a 6 7 .8 a 3 6 .1 ab cd 2 7 .2 ef9 15 .1a 73 .3 a 73 .1 a 3 8 .9 cd 2 1 .4bcdef
10 20 .8a 72 .0a 67 .8 a 3 5 .7 ab cd 2 1 .9bcd ef11 16.5a 73 .0a 66 .4 a 3 5 .3 ab cd 23 .6 d ef12 15.7a 73 .9a 74 .3a 4 0 .1d 2 5 .8 e f13 15.5a 73 .2a 6 6 .5 a 3 5 .6 ab cd 21 .Ib c d e f14 15.4a 73 .7a 6 8 .2 a 3 6 .8 ab cd 2 3 .3 cd e f15 13.2a 74 .5a 6 6 .8 a 3 6 .4 ab cd 18.7abc16 14.6a 74 .8a 6 9 .6 a 3 8 .1 ab cd 2 2 .2 b cd ef17 15.3a 73 .3a 6 9 .3 a 3 7 .2a bed 2 3 .8 cd e f18 12.6a 74 .3 a 70 .2a 3 8 .2 b cd 2 3 .1 cd e f19 16.0a 73 .4a 71 .0a 3 8 .2 b cd 2 6 .6 f2 0 13.6a 73 .3a 6 7 .5 a 3 6 .1 ab cd 24 .2 d ef21 14.0a 74 .0a 72 .7a 3 9 .3 d 2 5 .5 ef22 12.8a 74 .2a 6 5 .7 a 3 5 .9 ab cd 25 .0ef
a M e an s in th e sam e c o lu m n b e arin g d if fe re n t le t te rs a re s ig n if ic a n t ly (P < 0 .0 5 ) d if fe re n t . b M F B = M o is tu re fre e b a s is ; W T B = W h o le t issu e b a s is ; M F F B = M o is tu re an d fa t fre e basis.

822-JOURNAL OF FOOD SCIENCE-Volume 39 (1974)
similar to that observed in the present study between class 1 and classes 4 and 5. Samples from more youthful selection classes generally exhibited longer sarcomeres than samples from more mature classes; however, most of the interclass comparisons were not statistically significant. More mature carcasses (those in selection classes 12 and 13 and 16 through 22) had higher myofibril fragmentation scores indicative of fewer sarcomeres per fragment. Generally, advancements in physiological maturity were associated with the appearance of consistently short myofibril fragments, while in youthful maturity groups, the homogenization of muscle produced a mixture of short, intermediate and long myofibril fragments.
Mean values for histological traits stratified according to USDA maturity groups are presented in Table 3. General
increases in fiber diameter and myofibril fragmentation score and decreases in sarcomere length were associated with advancements in maturity, but differences between adjacent maturity groups were seldom statistically significant.
Correlation coefficients between histological characteristics and tenderness measurements for combined selection classes are given in Table 4. The relationship between fiber diameter and tenderness in the present study was similar to that reported by Romans et al. (1965a) but lower than those reported by Tuma et al. (1962) and Cooper et al. (1968). Longer sarcomeres were significantly correlated with all measures of tenderness, which is in agreement with Cooper et al.(1968). Fragmented muscle fiber length was significantly (P < 0.01) associated with 6 of 8 tenderness measurements. Myofibril fragmentation score was signifi
T a b le 6 —M ean values fo r chem ica l tra its stra tified accord ing to U S D A m atu rity group3
U S D A Percent Percent Percent Exp ressib le T o ta l pigm entm atu rity fat m oisture expressib le ju ice area co n e M F F B b
group M F B b W T B b ju ice (cm 2 ) (mg/g)
A - 14 .5bcd 73 .6bcd e 6 7 .3 a 36 .1 a 15.6aA 15.4 bed 73 .2bcd 6 8 .4 a 36 .6 a 19 .0bA+ 16.4bcd 72 .9 b c 6 7 .4 a 36 .0 a 2 1 .1bB - 17 .6b 7 2 .2b 66 .6 a 35 .1 a 2 4 .6 b cB 22 .3a 70 .9a 6 9 .7 a 36 .2a 2 1 .6 bB+ 15 .5abcd 73 .7abcde 72 .2a 38 .8a 19 .0abC - 17 .4bc 72 .9b cd 6 7 .6 c 36 .0 a 2 2 .6bC 15 .4bcd 74.6de 70.2a 38 .4a 2 4 .2 b cc+ 16 .2bcd 73 .5bcd e 68 .5a 36 .9 a 2 2 .7 bD - 1 1 .7d 74 .4cd e 68 .6a 37 .3a 2 3 .4 b cD 12 .5cd 74 .2 cd e 70.4a 38 .2a 2 3 .5 b cD+ 11.4d 74.6e 6 6 .7 a 36 .4 a 2 2 .5 bE - 16.5abcd 73 .3bcd e 70.1a 3 8 .0 a 2 5 .0 b cE 1 1 ,3cd 74 .3 cd e 70 .0a 3 8 .0 a 2 4 .6 b cE+ 12.9bcd 7 4 .3cd e 6 6 .7 a 3 6 .2 a 27 .4 c
a M e an s in th e sa m e c o lu m n b e a r irg d if fe re n t le t te rs a re s ig n if ic a n t ly IP < 0 .0 5 ) d if fe re n t .15 M F B = M o istu re fre e b a s is ; W T B = W h o le t issu e b a s is ; M F F B = M o istu re an d fa t fre e b asis.
T a b le 7 —M ean values fo r collagen co n ten t and so lu b ility among m uscle sam ples prev io usly classified as being high, in term ediate or low in tenderness3
Tenderness levelb
Collagen content High Interm ediate L o w
W hole tissue basis, mg/g 4 .0 4 b 4 .1 5 b 4 .2 7 bM oisture free basis, mg/g 15 .4 9 b 15 .6 2 b 16 .2 0 bFa t free basis, mg/g 4 .2 1 b 4 .3 3 b 4 .4 2 bM oisture and fat free basis, mg/g 18 .47b 18 .33b 18 .8 1 bSo lub le co llagen , % 7 .9 3 b 8 .3 5 b 5 .2 2 c
3 S a m p le s w e re se le c te d fo r co lla g e n a n a ly s e s f ro m lo n g is s im u s m u s c le p re v io u s ly ra te d as e th e r c o n s is te n t ly h ig h , in te rm e d ia te o r lo w in te n d e rn e ss b y all m e c h a n ic a l an d se n s o ry p a r e l m e th o d s o f deter- m in in g te n d e rn e ss .
D M e a n s on th e sa m e lin e b e a rin g d if fe re n t le t te rs are s ig n if ic a n t ly (P < 0 .0 5 ) d if fe re n t .
cantly related to both amount and softness of connective tissue. Increased percentages of wavy fibers were associated with decreases in tenderness as previously reported by Covington et al. (1970).
Chemical traitsMean values for chemical traits strati
fied according to selection class are presented in Table 5. Expressible juice area differed significantly (P < 0.05) among selection classes, but no trend was established relative to advancing maturity. Samples from selection class 1 (A-minus maturity lean color) did not differ from classes 2, 6 or 1 5 in total pigment concentration. Since samples in selection class 6 also exhibited A-minus maturity lean color, this nonsignificant difference was expected; however, the similarity in concentrations of total pigment for samples in class 2 with those from class 15 was not anticipated.
Mean values for chemical traits stratified according to USDA maturity groups are provided in Table 6. More youthful carcasses generally contained higher percentages of extractable fat and lower percentages of moisture than samples from more mature carcasses Tuma et al.(1963) observed higher ether extractable fat contents in the longissimus muscle of 18 and 90 month old cattle as compared to veal and 42 month old cattle and found that the veal longissimus contained about 4% more moisture than that from 90 month old cattle when samples of comparable marbling were used. Muscle from typical-A and A-plus maturity carcasses did not differ in pigment concentration from that in other maturity groups up to and including typical-E maturity. Romans et al. (1965b) reported lower concentrations of myoglobin and hemoglobin in A maturity carcasses as compared to samples from B, C and D maturity carcasses.
Mean values for collagen content and solubility in samples differing widely in tenderness are presented in Table 7. Selected samples stratified according to tenderness levels did not vary in collagen content, but those muscles rated low in tenderness exhibited a lower percent of soluble collagen than samples which were intermediate or high in tenderness. These data indicate that, at least over wide ranges in physiological maturity, samples which have a low percent of soluble collagen may also be less tender.
Increases in percent fat or decreases in percent moisture were associated with higher sensory panel ratings for tenderness and lower shear force values (Table8). These correlations are in close agreement with those for combined samples from A, B and E maturity carcasses reported by Breidenstein et al. (1968). The highest correlations between chemically determined collagen and sensory panel

TENDERNESS OF THE BEEF LONGISSIMUS- 823
scores were those for connective tissue amount and softness. Hunsley et al.(1971) observed nonsignificant relationships between sensory panel scores and collagen content of muscle derived from steers and bulls ranging in age from 6 -1 8 months. In the present study, a higher percent of soluble collagen was associated with increased softness of connective tissue as evaluated by the sensory panel.
Physical measurements on boneMean values for bone and cartilage
hardness measurements stratified according to maturity group are presented in Table 9. Nip Tenderometer values (Table9) for scapular and vertebral cartilage from different USDA maturity groups were not significantly (P > 0.05) different. Mean values for scapular cartilage hardness measured with the Shore Du-
rometer increased with advancements ir. USDA maturity score. Shore Durometer measurements on vertebral cartilage revealed increased hardness for cartilage samples of intermediate maturity. Barcol Impressor values were significantly (P < 0.05) lower for A maturity vertebral bone as compared to measurements obtained on bone samples from C, D and E maturity carcasses. Shore Durometer values for A maturity bone samples were generally lower than those obtained for samples of C, D and E maturity.
Simple correlation coefficients between hardness measurements of bone or cartilage samples, sensory panel ratings and shear force measurements are presented in Table 10. Most of these relationships were small in magnitude and not significant (P > 0.05). Adams and Arthaud (1970) reported that hardness of
spinous process cartilage was not associated with meat tenderness among steers of similar age. Results of the present study indicate that hardness measurements obtained from spinous process vertebrae and cartilage representing a broad range in physiological maturity are not accurate indicators of differences in cooked muscle tenderness.
CONCLUSIONSCHARACTERISTIC differences in tenderness among muscles occur as a result of the collective effects of numerous traits which can be broadly classified (Smith et al., 1973) as follows: (a) acto- myosin effects—contractile state of acto- myosin and/or integrity of the Z line; (b) background effects—amount of connective tissue and/or chemical state of col-
T a b le 8 —S im p le co rre la tio n co e ffic ie n ts betw een certa in ch em ica l co m p o nen ts, sensory panel sco res and m ech an ical tenderness m easurem ents fo r com bined se lection classes
Percent P ercent P ercent Exp ressib le To ta l Collagen P ercentfat m oisture expressib le ju ice area pigm ent co n ten t so lu b le
T ra it M F B a W T B a ju ice (c m 2 ) M F F B 3 M F F B 3 collagen
To ng ue and ch eek pressure score 0 .1 6 * - 0 .1 3 -0 .0 1 - 0 .0 6 0 .0 5 - 0 .1 0 0 .1 2
T o o th pressure sco re 0 .2 6 * * - 0 .2 3 * * - 0 .0 8 - 0 .1 5 * -0 .0 2 - 0 .1 9 0 .2 4 *
M ealiness score 0 .0 5 - 0 .0 9 - 0 .2 0 * * - 0 .2 1 * * -0 .1 1 - 0 .1 6 0 .0 8
A d hesion score 0 .2 0 * * - 0 .1 9 * * - 0 .1 2 - 0 .1 7 * - 0 .0 7 - 0 .2 2 0 .23
Fragm entation sco re 0 .2 6 * * - 0 .2 5 * * - 0 .1 0 - 0 .1 6 * - 0 .0 2 - 0 .2 7 * 0.21
C o n nective tissue am o unt score 0 .1 4 * - 0 .2 4 * * - 0 .0 8 - 0 .1 4 * - 0 .2 9 * * - 0 .3 8 * * 0 .3 2 * *C o n nective tissue softness score 0 .1 6 * - 0 .2 8 * * - 0 .0 8 - 0 .1 5 * - 0 .2 6 * * - 0 .4 1 * * 0 .3 0 *Shear force value - 0 .2 7 * * 0 .2 3 * * 0 .0 2 0 .0 8 0 .0 2 0 .0 7 - 0 .2 5 *
a W T B = W h o le t issu e b a s is ; M F B = M o is tu re fre e b a s is ; M F F B - M o istu re an d f a t fre e b as is .* P < 0 .0 5
* * P < 0 .0 1
T a b le 9 —M ean values3 fo r bone and cartilage hardness m easurem ents’3 stra tified according to U S D A m atu rity group
N ip Tenderò- S h o re Duro- N ip Tenderò- Sh ore Duro- B arco l Im pressor S h o re Duro-U S D A m eter values m eter values m eter values m eter values values m eter values
m atu rity scapu lar scap u lar vertebral vertébral vertebral vertebralgroup cartilage cartilage cartilage cartilage bone bone
A - 15 .7b 2 7 .8 b cd 1 5 .4b 2 4 .0 b 2 7 .9 b 7 9 .3 bA 15 .0b 2 7 .3 b c 14 .3b 26 A b c 3 0 .9 b c 8 1 .2 b cd
A+ 14 .5b 2 5 .0 b 14.0b 2 7 .6 b c 2 8 .2 b 8 0 .9 b cB - 13 .8b 2 8 .6 b cd 15 .0b 3 0 .0 b cd 3 3 .3 b cd 8 3 .2 cd eB 14 .3b 2 7 .4 b cd 14 .8b 3 5 .7d 3 4 .0 b cd 8 3 .2 b cd eB+ 15 .0b 29 .3b cd 1 4 .6b 35.1 bcd 3 2 .5 b cd 83.1 bcdeC - 16 .2b 2 7 .5 b cd 1 5 .1b 3 3 .2 b cd 3 9 .2 d 8 3 .9 cd eC 1 4 .6b 3 1 .3cd 13 .5b 3 4 .8d 4 2 .4 d e 8 5 .1 ec+ 14 .3b 2 7 .8 b cd 15 .0b 3 4 .0 cd 3 6 .3 cd 84 .2 eD - 1 5 .6b 3 3 .0 d — 4 0 .6 b cd 41.1 de 8 2 .5 b cd e
D 15 .7b 2 7 .3 b c — 3 4 .9 b cd 4 2 .5 d e 85 .2 e
D+ 15 .2b 2 8 .0 b cd 13.1b 2 0 .2b 4 2 .5 d e 8 4 .7 e
E - 1 4 .9b 3 1 .7 cd — — 4 0 .7 d e 83 .4b cd e
E 16 .5b 3 9 .5e — 4 0 .9 d e 8 4 .8 d e
E+ 13 .0b 4 3 .2 e - - 48 .5 e 8 4 .7 e
3 M e an s in th e sa m e c o lu m n b e a rin g d if fe r e n t le t te rs are s ig n if ic a n t ly (P < 0 .0 5 ) d if fe re n t .13 A s b o n e a n d / o r c a r t ila g e in c re a se in h a rd n e ss , m e a s u re m e n ts o b ta in e d w ith th e N ip T e n d e ro m e te r , S h o r e D u ro m e te r and
B a rc o l Im p re s so r In s t ru m e n ts in c re a se in n u m e r ic a l v a lu e .

824-JOURNAL OF FOOD SCIENCE-Volume 39 (1974J
T a b le 1 0 —S im p le corre lation co effic ien ts betw een hardness m easurem ents of bone or cartilage, sensory panel scores and m echanical tenderness m easurem ents
T ra it
N ip Tendero- m eter values fo r scapu lar
cartilage
S h o re Duro- m eter values fo r scapu lar
cartilage
N ip Tendero- m eter values fo r vertebral
cartilage
Sh ore Duro- m eter values
fo r vertebral cartilage
Barco) Im pressor values fo r vertebral
bone
S h o re Duro- m eter values fo r vertebral
bone
To ng ue and ch eekpressure score -0 .0 1 - 0 .0 6 - 0 .1 2 0 .0 5 0 .0 0 0 .0 4
T o o th pressurescore 0.11 - 0 .1 6 * - 0 .0 7 - 0 .0 8 - 0 .1 8 * - 0 .0 8
M ealiness score - 0 .1 2 - 0 .1 4 0 .0 8 - 0 .1 3 - 0 .0 4 - 0 .0 9A d hesion score - 0 .1 7 * - 0 .1 3 - 0 .1 2 - 0 .0 7 - 0 .1 3 - 0 .0 6Fragm entation score - 0 .1 6 * - 0 .1 6 * - 0 .0 6 - 0 .0 7 - 0 .1 4 -0 .0 1C o n nective tissue
am o unt score - 0 .0 3 - 0 .3 6 * * -0 .0 1 - 0 .2 0 - 0 .3 6 * * - 0 .2 0 * *C o n nective tissue
softness score - 0 .0 6 - 0 .3 7 * * - 0 .0 3 - 0 .2 0 - 0 .3 4 * * - 0 .2 0 * *Shear force value 0 .0 9 0 .1 3 0 .0 7 0 .0 4 0 .0 0 - 0 .0 7
* P < 0 .0 5 ' * P < 0 .0 1
lagen; and (c) bulk density or lubrication effects—amount, distribution and chemical or physical state of intramuscular fat and moisture. Data of the present study indicate that smaller diameter muscle fibers, longer sarcomeres, shorter muscle fiber fragments following homogenization and lower percentages of wavy fibers (actomyosin effects); decreased collagen content, increased percentages of soluble collagen and lower myofibril fragmentation scores (background effects); and increased percentages of fat, decreased percentages of moisture and smaller areas of expressible juice (bulk density or lubrication effects) were associated with increases in tenderness of the beef longis- simus. Among physiological maturity indicators, muscle fiber diameter (as related to muscle texture), total pigment concentration (as related to muscle color), and hardness of scapular cartilage and vertebral bone (as related to ossification of the skeletal system) were most closely related to the variability in tenderness of the beef longissimus and were associated with advancements in physiological maturity. Although most of the relationships in this study were of small magnitude, these data generally support the utiliza- tionof fatness-maturity interactions across very wide ranges in physiological maturity for the stratification of beef carcasses according to tenderness.
REFERENCESAdam s, C .H . and A rth a u d , V .H . 1 9 7 0 . O bjec
tive tenderness and m a tu rity m easurem ents o f beef steers. J. A n im . Sci. 30: 1 0 6 .
B reidenstein, B .B ., C ooper, C .C ., Cassens, R .G ., Evans, G . and B ray , R .W . 1 9 6 8 . In fluence o f m arbling and m a tu rity on the p a la ta b ility of beef muscle. 1. C hem ical and organo leptic considerations. J. A n im . Sci. 2 7 : 1 5 3 2 .
Briskey, E .J ., B ray, R .W ., H oekstra , W .G ., P h illips, P .H . and G rum m er, R .H . 1 9 5 9 . The chem ical and physical characteristics o f various p o rk ham muscle classes. J. A n im . Sci. 1 8 : 1 46 .
C arpenter, Z .L . 1 9 6 2 . The h isto log ical and physical characteristics o f po rk muscle and th e ir re lationship to q u a lity . P h .D . thesis, U nivers ity of W isconsin, M ad ison , (c iting Carl: unpublished data, U n ivers ity o f Wisconsin).
C ooper, C .C ., Breidenstein, B .B ., Cassens, R .G ., Evans, G . and B ray , R .W . 1 9 6 8 . In fluence o f m arbling and m a tu rity on the p a la ta b ility o f beef m uscle. 2 . H is to log ica l considerations. J. A n im , Sci. 2 7 : 1 5 4 2 .
Cover, S., R itc h e y , S.J. and H o ste tle r, R .L . 1 9 6 2 . Tenderness o f beef. The connective- tissue com pon en t o f tenderness. J. Fo od Sci. 27: 4 6 9 .
C oving ton, R .C ., Tu m a, H .J ., G rant, D .L . and D a y to n , A .D . 1 9 7 0 . V arious chem ical and histo log ical characteristics of beef muscle as related to tenderness. J. A n im . Sci. 30: 191.
D uncan , D .B . 1 9 5 5 . N e w m u ltip le range and m u ltip le F tests. B iom etrics 1 1 : 1 .
G o ll, D .E ., H oekstra , W .G . and B ray , R .W . 1 9 6 4 . Age-associated changes in bovine m uscle connective tissue. 2 . Exposure to in creasing tem p era tu re . J. Fo od Sci. 29: 6 1 5 .
G rant, D .L ., Tu m a, H .J ., C ov ing ton , R .C . and D a y to n , A .D . 1 9 7 0 . B one, cartilage and muscle m inerals as related to physio logical m a tu rity . J. A n im . Sci. 32: 182 (A b s tr).
H ill , F . 1 9 6 6 . Th e s o lu b ility o f in tram uscu lar collagen in m eat anim als o f various ages. J. Food Sci. 3 1 : 161 .
H unsley , R .E ., V e tte r , R .L ., K lin e , E .A . and Burroughs, W . 1 9 7 1 . E ffec ts o f age and sex on q u a lity , tenderness and collagen con ten t o f bovine longissimus muscle. J. A n im . Sci. 33: 9 3 3 .
K ram er, C .Y . 1 9 5 6 . E xten s ion o f m u ltip le range test to group means w ith unequal num bers o f rep lications. B iom etrics 12: 3 0 7 .
R ickansrud , D .A . and H enrickson , R .L . 1 9 6 7 . T o ta l p igm ents and m yo g lo b in concentra tio n o f fo u r bovine muscles. J . F o o d Sci. 3 2: 57.
R om ans, J .R ., T u m a , H .J . and T u cker, W .L . 1 96 5 a . In fluence o f carcass m a tu rity and m arbling on the physical and chem ical characteristics o f beef. 1. P a la ta b ility , fib er diam eter and p ro x im a te analysis. J. A n im . Sci. 2 4 : 6 8 1 .
Rom ans, J .R ., T u m a , H .J . and T u ck e r, W .L . 1 9 6 5 b . In fluence o f carcass m a tu rity and m arbling on the physical and chem ical characteristics o f beef. 2 . M uscle p igm ents and co lo r. J. A n im . Sci. 2 4 : 686.
S m ith , G .C ., K ing , G .T . and C arpenter, Z .L .1 9 7 3 . A n a to m y . In “ L a b o ra to ry Exercises in E lem enta ry M e a t Science,” 2nd ed. K em p Publishing C o ., H o u s to n , Texas.
T u m a , H .J ., V enab le , J .H ., W u th ie r, P .R . and H enrickson , R .L . 1 9 6 2 . R elationsh ip o f fib e r d iam eter to tenderness and m eatiness as in fluenced by bovine age. J. A n im . Sci. 2 1: 3 3 .
Tu m a, H .J ., H enrickson , R .L . , O d e ll, G .V . and Stephens, D .F . 1 9 6 3 . V a ria tio n in the physical and chem ical characteristics o f the lo n gissimus dorsi muscle from anim als d iffe rin g in age. J. A n im . Sci. 2 2 : 3 54 .
U S D A . 1 9 6 5 . O ffic ia l U n ite d States Standards fo r grades o f carcass bee f. U S D A , C & M S , S R A 9 9 .
W alter, M .J ., G o ll, D .E ., K lin e , E .A ., A nderson, L.P . and C arlin , A .F . 1 9 6 5 . E ffe c t o f m arbling and m a tu rity on b ee f muscle characteristics. 1. O b jective m easurem ents o f te n derness and chem ical properties . Food Techno l. 19: 8 41 .
Woessner, J .F . 1 9 6 1 . The de te rm in a tio n o f h y d ro x y p ro lin e in tissue and p ro te in sam ples conta in ing sm all p rop ortion s o f this im in o acid. A rch . B iochem . B io p h y . 9 3 : 4 4 0 .
Ms received 9 /2 1 /7 3 ; revised 2 /2 6 /7 4 ; accepted3 /5 /7 4 .
T .A . 1 0 7 9 5 , Texas A g ric u ltu ra l E x p e rim en t S ta tio n . Th is study was supported b y a grant fro m K ing R anch , In c ., K ingsville , Texas.

D. J. BUCKLEY', G. L. GANN* 2, J. F. PRICE2 and G. C. SPINK3 Michigan State University, East Lansing, Ml 48824
PROTEOLYTIC A C TIV ITY OF Pseudomonas perolens AND EFFECTS ON PORCINE MUSCLE
INTRODUCTION
THE FATE of the primary muscle proteins during storage and spoilage of meat have been receiving renewed consideration in recent years. It has been shown that sarcoplasmic proteins do not undergo large changes in composition during postmortem storage at S C or lower (Aberle and Merkel, 1966; Lawrie et al., 1963; Scopes, 1964). The extractability of the myofibrillar proteins has been shown to increase up to 2 wk postmortem (Aberle and Merkel, 1966; McIntosh, 1967). Davey and Gilbert (1968a) reported an increase in the myofibrillar protein extract during aging of beef and rabbit muscle. Recently, it has been shown that myofibrillar proteins undergo at least two kinds of specific alterations during postmortem storage:
(1) A loss of Z line structure and in some cases complete removal of both the Z and M line (Stromer and Goll, 1967; Stromer et al., 1967; Davey and Gilbert, 1967, 1969; Henderson et al.,1970). Further evidence that the bonds between actin filaments and filaments of the Z line are weakened has been shown by Chaudhry et al.(1969), Davey and Gilbert (1968a, b) and Penny (1968).
(2) The second type of postmortem alteration is the modification of the actin- myosin interaction. Fujimaki et al. (1965a, b) were first to report increased actomyosin ATPase activity with storage. However, the nature of the change causing the increased activity remains unclear.Some studies on the stroma proteins
(McClain et al., 1965; Herring et al.,1967) indicate that postmortem aging may result in some increase in collagen solubility at temperatures above 37 C. Goll et al. (1970) state that any increases are very subtle and probably limited to changes in the number or strength of the cross bridges between the connective tissue proteins. Slight increases in the nonprotein nitrogen contents have been
'P resen t address: D ep t, o f D a iry & Food Techno logy, U n ivers ity College C o rk , C ork, Ire land .
2 D ep t, o f Fo od Science & H u m a n N u tr it io n3 D ep t, o f Pathology and College o f O steo
pathic M edicine
reported during postmortem storage at low temperatures.
In contrast to these findings during postmortem aging, bacterial spoilage at similar low temperatures of storage seem to affect the same proteins but with much more drastic consequences (Ocker- man et al., 1969; Borton et al., 1970; Hasegawa et al., 1970; and Tarrant et al.,1971). Goll et al. (1971) reported a series of similarities between the effect of the enzyme trypsin and the effects of postmortem aging on muscle cells. Z line degradation was one of these, indicating the possibility of proteolysis being a factor in postmortem alterations in muscle cells. Dutson et al. (1971) have reported similar removal of Z-line in the ultrastructure of porcine muscle, as well as disruption of the A-band components due to incubation with Pseudomonas frag i. Tarrant et al. (1973) using an enzyme isolate from Pseudomonas fra g i have found similar disruptions.
Preliminary studies conducted to find the gross effects of Pseudomonas perolens on pH and protein solubility of pork
Fig. I — T h e a c t io n o f P se u d o m o n a s p e r o le n s A T C C 1 0 7 5 7 o n p o r c in e m u s c le d u r in g a 2 0 -d a y s to ra g e p e r io d a t 10° C.
muscle are reported and led to the isolation and purification of a proteolytic enzyme from these bacteria (Buckley et al., 1974a, b). Subsequently, the purified enzyme preparations were used to compare muscle cell ultrastructural alterations resulting from enzyme action with those occurring concurrently with bacterial growth.
EXPERIMENTALGrowth, enzyme production and pH studies
The porcine muscle samples for bacterial inoculation were aseptically obtained according to the method outlined by Borton et al. (1970). The muscle samples were ground through a sterilized grinder (plate with 2 mm holes) and divided into two equal batches. The control batch was reground with a 1% solution of sterile 0.01M phosphate buffer being added during the grinding operation. The second batch was treated in a similar manner except that a 1% inoculum (approx 103 cells/ml) of Pseudomonas perolens ATCC 10757 was used. Storage was at 10°C in a walk-in type cooler. One control and one treated sample were removed daily for analysis. Proteolytic enzyme production was determined as follows: A 20-g sample was placed in a 250 ml plastic centrifuge bottle with 30g of 0.01M phosphate buffer pH7.4. This was stirred gently for 15 min and then centrifuged at 10,000 x G for 30 min. The supernatant was removed and dialyzed in 1/4 in. diam dialysis tubing against 0.03M phosphate buffer, pH 7.2 at 3°C for 18 hr. The enzyme assay was a modification of the method of Anson (1938). A 1% solution of hemoglobin (Nutritional Biochemical Corp., standardized for protease assay) in 0.03M phosphate buffer was used as substrate. 1 ml of enzyme solution was reacted for the desired time period at 35°C in a shaking incubator. The reaction was stopped by adding 2 ml of 5% TCA. Blanks were run in a similar manner, except that the enzyme solution was incubated without substrate. All reaction tubes were allowed to stand •15 min before centrifugation of the precipitate at 3,000 x G for 5 min and filtering supernatant through Whatman No. 2 filter paper. The optical density of the filtrate was read at 280 nm and the difference between blank and assay readings was reported as enzyme activity.
The pH was measured daily on a 1-g sample mixed into slurry with 1 ml of deionized distilled water using a semimicro combination electrode (Corning).
Bacterial counts were measured daily using the standard plate count method (American Public Health Association Inc. 1966).
Protein solubility changes were determined using the method outlined by Helander (1957)
Volum e 3 9 (1 974 )—JO U R N A L O F FOO D S C IE N C E -8 2 5

826—JOURNAL OF FOOD SCIENCE-Volume 39(1974)
Fig. 2 —E le c tro n m icro g ra p h o f m y o f ib r il s fr o m u n in o c u la te d p ig m u s c le in c u b a te d a t 3 ‘ C fo r 4 d a y s in s te r ile K o se r 's c i tr a te m e d iu m . A = A b a n d , 1 = 1 b a n d , H = H z o n e , M = M lin e , Z = Z lin e , S = o n e sa rco m ere len g th . 2 4 ,5 0 0 X )
Fig. 4 —E le c tro n m ic ro g ra p h o f m y o f ib r il s fr o m u n in o c u la te d p ig m u s c le in c u b a te d a t 3° C fo r 8 d a y s in s te r ile K o se r 's c i tr a te m e d iu m . A = A b a n d , Z = Z lin e , M = M lin e , 1 = 1 b a n d , I ~ 2 4 ,5 0 0 X )
Fig. 6 —E le c tr o n m ic ro g ra p h o f m y o f ib r il s fr o m b a c te r ia l in o c u la te d p ig m u s c le in c u b a te d a t 3 ° C fo r 8 days. A = A b a n d , Z = Z lin e , M = M line. (*> 2 4 ,5 0 0 X I
Fig. 3 —E le c tro n m icro g ra p h o f m y o fib r ils fr o m e n z y m e tr e a te d p ig m u s c le in c u b a te d a t 37 C fo r 4 d a ys . A = A b a n d , M = w h e re M lin e w as s itu a te d , Z = w h e re Z line w as s i tu a te d . ( ~ 2 4 ,5 0 0 X )
Fig. 5 —E le c tro n m ic ro g ra p h o f m y o f ib r il s fr o m e n z y m e tr e a te d p ig m u s c le in c u b a te d a t 3° C fo r 8 d a ys . A = A b a n d , Z = w h e re Z lin e w as s itu a te d , M = w h e re M lin e w as s i tu a te d . ( ~ 2 4 ,5 0 0 X )
Fig. 7—E le c tro n m icro g ra p h o f m y o f ib r i l s fr o m b a c te r ia l in o c u la te d p ig m u s c le in c u b a te d a t 3° C fo r 8 d a ys . A = A b a n d , 1 = 1 b a n d area , Z = Z line , M = M line . (~ 24,500 X)

P O R C IN E M U S C LE P R O TE O LY S IS B Y B A C T E R IA -8 2 7
for sarcoplasmic and myofibriiiar protein ex- , traction and analysis by the micro Kjeldahl procedure (American Instrument Co., 1961).
Studies of effects on muscleEnzyme production on a synthetic medium
and purification have been described by Buck- ley et al., 1974a, b. The enzyme preparations were purified according to procedures described by Buckley et al., 1974b by concentrating the crude enzyme preparation with an ultrafiltration system and passing through a G-100 Sepha- dex column. Homogeneity of the active protein was indicated by the coincident nature of the protein concentration and enzymatic activity. Further evidence of purity was indicated by the single protein band upon disc gel electrophoresis (Rampton et al., 1970).Electron microscopy
Samples of porcine muscle were aseptically taken from longissimus dorsi (approx 1 cm long X 2 -4 mm diam) and placed in sterile vials (4.5 cm long X 1.5 cm diam). Control sample vials were filled with sterile Koser’s citrate medium and the treated sample vials with the purified enzyme fraction. Enzyme preparations were freshly prepared for each series of vials and contained 60-70 units of enzyme per ml (ug tyrosine released per min per ml-specific activity approx 1). A second set of treatment vials were filled with an inoculum of Pseudomonas perolens (103 cells/ml). Solution-to-sample ratio was approximately 70:1. Storage was at 3°C with sampling to determine ultrastructural changes at 0, 4 and 8 days. The procedure for sample fixation and embedding, staining and sectioning, and photography of sections was as outlined by Dutson et ah, (1971).
RESULTS & DISCUSSIONGrowth, enzyme production, pH and solubility
The changes observed during the course of preliminary studies are summarized graphically in Figure 1. Bacterial numbers increased from the initial inoculation of1.5 x 104 /g to 1.5 x 10⁹ at day 14, decreasing to 6.6 x 10⁸ at day 20. No growth was found in the aseptic control sample. pH values of both control and inoculated samples were 5.3 initially. The pH of the inoculated sample remained constant until the tenth day and then gradually increased to 8.2 at day 19. Enzyme production was first detected on the eleventh day coinciding with the initial increase in pH and high bacterial numbers of 107 per gram of tissue. These results were in general agreement with those of Tarrant et al. (1971) using Pseudomonas fra g i on porcine muscle and those of Ockerman et al. (1969) using a general type inoculum and a species of each of the genera Pseudomonas and A chrom obacte r on beef muscle.
The primary protein solubility changes observed are shown in Table 1. The observed decreased in sarcoplasmic protein solubility is in agreement with the results of Ockerman et al. (1969) and Borton et al. (1970) during storage of beef and porcine muscle, respectively. The latter group,
T ab le 1—P rim ary p ro tein so lu b ility changes due to the action of Pseudo m onas perolens A T C C 1 0 757
% Protein®
0 D ay 18 D ay
Sarco p lasm ic — Con tro l 6 .0 4.1— Inoculated 6.1 3.3
M yo fib rilla r — Contro l 7 .9 10.7— Inoculated 7 .9 13 .0
N onprotein — Contro l 2 .6 3.1nitrogen — Inoculated 2 .6 4.1
a Data show n are % pro tein 1based on raw sam-p ie w e ig h t th a t w as e x t ra c te d in e a ch cate- g o ry . C o a rse g ro u n d p o rk u sed c o n ta in e d 2 0 % ± 1 to ta l p ro te in .
however, did find an increase in the sarcoplasmic protein extractability due to microbial action. The large myofibrillar protein solubility increases are in agreement with the findings of Ockerman et al.(1969), Borton et al. (1970) and Tarrant et al. (1971). These workers, however, reported gradual decreases after the initial increase. The increase in solubility in the control sample may be explained by the fact that during storage (as in aging) the more insoluble myofibrillar proteins became more soluble (Sharp, 1963). The increases in the nonprotein nitrogen values of the inoculated sample are in agreement with those of other workers (Ockerman et al., 1969; Borton et al., 1970; Tarrant et al., 1971). This preliminary study showed that enzyme production was coincident with high bacterial numbers and pH increase and resulted in substantial changes in primary protein solubility. Subsequent experiments designed to extract and purify the en- zyme(s) detected in the spoiled porcine samples resulted in low yields, possibly due to the long and tedious procedures involved. Further studies on the production of proteases by P. perolens are reported elsewhere (Buckley et al., 1974a, b).Changes in muscle ultrastructure
On day 4 the ultrastructure of the control and the bacterial inoculated samples were essentially the same in all respects to that shown in Figure 2 for uninoculated samples. The enzyme treated sample showed marked ultrastructural alterations at day 4 (Fig. 3). The Z line had been completely removed from the I band as well as the M line from the A band. On closer observation, it appeared that the actin filaments had partially disintegrated in the I band, but no changes were evident in the A band other than the M line disappearance. In the control samples actin and myosin filaments, the Z and M lines and the H zone
were clearly visible (Fig. 2). No changes were evident in the bacterial treated sample. At day 8 of storage the control sample was still essentially intact (Fig. 4). However, the Z line and the I band appeared less dense in comparison to those in the day 4 control (Fig. 2). Z line fragmentation has been shown to occur during postmortem storage (Stromer et al., 1967; Stromer and Goll, 1967). The enzyme treated sample at 8 days (Fig. 5) had further disintegrated with some loss of density in the A bands, indicating possible disruption of the actin-myosin complex. The sample inoculated with bacteria showed variable ultrastructural changes. Some areas were similar to control (Fig. 6). Other areas had Z line fragmentation and myofibril separation (Fig. 7). This localized disruption may be explained by the fact that localized bacterial growth was observed on the sample. Dutson et al. (1971) have also reported specific disruption of components in the A band region and removal of material from the Z line in ground porcine muscle inoculated with Pseudomonas fragi. The M line removal may or may not be due to enzyme action as high ionic strength solutions may have similar effects. Further study is required to determine if bacterial enzymes do indeed remove the M line. It appears that the protease elaborated by the psychrophilic pseudomonas did disrupt the muscle fibers, particularly the myofibrils.
REFERENCESA berle , E .D . and M e rk e l, R .A . 1 9 6 6 . S o lu b ility
and e lectro phoretic behav ior o f some p ro teins o f po stm ortem aged bovine m uscle. J. F o o d Sci. 3 1 : 1 5 1 .
A m erican In s tru m e n t C o. 1 9 6 1 . The de te rm in a t io n o f n itrogen by the K je ld a h l procedure including d igestion, d is tilla tio n and t it ra tio n . R e p rin t N o . 1 04 .
A m erican P ub lic H e a lth A ssociation, In c . 1 96 6 . “ R ecom m ended M ethods fo r the M ic ro b ia l E x a m in a tio n o f F o o d s ,” 2nd ed. A m erican P ub lic H e a lth Association, N ew Y o rk .
A nson, M .L . 1 9 3 8 . E s tim atio n o f pepsin, t ry p sin, papa in and cathepsin w ith hem aglob in . J. G en. P hysio l. 2 2 : 79.
B o rto n , R .J ., B ra tz le r, L .J . and Price, J ,F . 1 9 7 0 . E ffe c t o f fo u r species o f bacteria on porcine m uscle. 1. P ro te in s o lu b ility and em uls ify ing capacity. J. F o o d Sci. 3 5 : 7 79 .
B uckley, D .J ., Price, J .F ., T a rra n t, P .J .V . and Pearson, A .M . 1 9 7 4 a . P ro te o ly tic enzym e p ro d u c tio n b y Pseudom onas perolens on syn thetic m ed ium . 1. P ro d u ctio n and param eters. J. A p p l. M ic ro b io l. S ub m itted .
B uckley, D .J ., Price, J .F ., T a rra n t, P .J .V . and Pearson, A .M . 1 9 7 4 b . P ro te o ly tic enzym e p ro d u c tio n b y Pseudom onas perolens on syn thetic m ed iu m . 2. P u rifica tio n and characterization . J. A p p l. M ic ro b io l. S ubm itte d .
C haudhry , H .M ., Parrish, F .C . J r., and G o ll, D .E . 1 9 6 9 . M olecu lar properties o f postm o rtem m uscle. 6 . E ffe c t o f tem p eratu re on pro te in s o lu b ility o f ra b b it and bovine m uscle. J. Fo o d Sci. 34: 1 83 .
D avey , C .L . and G ilb e rt, K .V . 1 9 6 7 . S tructu ra l changes in m eat during aging. J. Fo od Tech- nol. 2: 57.
D avey , C .L . and G ilb e rt, K .V . 1 9 6 8 a . Studies in m eat tenderness. 4. Changes in the extractab ility o f m y o fib r illa r proteins during m eat aging. J. Fo o d Sci. 33: 2.
D avey, C .L . and G ilb e rt, K .V . 1 96 8 b . Studies in m eat tenderness. 6. The nature o f m y o fib r il

82S—JOURNAL OF FOOD SCIENCE-Vo/ume 39 (1974)
lar proteins extracted fro m m eat during aging. J. F o o d Sci. 33: 3 43 .
D avey, C .L . and G ilb e rt, K .V . 1 9 6 9 . Studies in m eat tenderness. 7 . Changes in the fine structu re o f m eat during aging. J. Fo od Sci. 34: 69.
D u tson , T .R . , Pearson, A .M ., Price, J .F ., S p ink ,G .C . and T a rra n t, P .V .J . 1 9 7 1 . Observations by e lectron m icroscopy on pig muscle inocu la ted and incubated w ith Pseudomonas fragi. A p p l. M ic ro b io l. 22: 1 1 5 2 .
F u jim a k i, M ., O k ita n i, A . and A rakaw a, N . 1 9 6 5 a . Th e changes o f “ M yos in B ” during storage o f ra b b it muscle. 1. Physico-chem ic a l studies on M yo s in B. Agr. B io l. C hem . 29: 5 81 .
F u jim a k i, M ., A rakaw a, N ., O k ita n i, A . and Takag i, O . 1 9 6 5 b . Th e changes o f “ M yosin B ” ( “ A c to m y o s in ” ) during storage o f rab b it muscle. 2. The dissociation o f “ M yosin B ” in to m yosin A and actin and its in terac tio n w ith A T P . J. Fo od Sci. 3 0 : 9 3 7 .
G o ll, D .E ., A rakaw a , N ., S trom er, M .H ., Busch, W .A . and R obson , R .M . 1 9 7 0 . C hem istry o f muscle prote ins as a foo d . In “ Th e P hysio logy and B iochem istry o f M uscle as a F o o d .” Ed. Briskey, E .J ., Cassens, R .G . and M arsh,B .B . U n ivers ity o f W isconsin Press, M adison , Wise.
G o ll, D .E ., S trom er, M .H ., R obson , R .H ., Tem p le , J ., Eason, B .A . and Busch, W .A .1 9 7 1 . T ry p tic digestion o f m uscle com ponents sim ulates m any o f the changes caused by po stm ortem storage. J, A n im . Sci. 33: 9 63 .
Hasegawa, T ., Pearson, A .M ., P rice, J .F ., R am p- to n , J H . and Lechow ich , R .V . 1 9 7 0 . E ffe c t o f m ic ro b ia l g row th upon sarcoplasm ic and urea-soluble prote ins fro m m uscle. J . Fo od Sci. 35: 7 2 0 .
H elan der, E . 1 9 5 7 . O n qu an tita tiv e muscle pro te in d e te rm in a tio n : Sarcoplasm ic and m y o fib r il p ro te in co n ten t o f no rm a l and a tro ph ic skeletal muscle. A c ta Physiol. Scandinavia, 4 1 , S up p lem en tum 141 .
H enderson , D .W ., G o ll, D .E . and S tro m er, M .H . 1 9 7 0 . A com parison o f shortening and Z line degradation in po stm ortem bovine, porcine and ra b b it m uscle. A m . J. A n a t. 128 : 1 17 .
H erring , H .K ., Cassens, R .G . and Briskey, E .J.1 9 6 7 . Factors a ffec tin g collagen so lu b ility in bovine muscle. J. F o o d Sci. 32: 534 .
L aw rie , R .A ., P enny, I .F . , Scopes, R .K . and V o y le , C .A . 1 9 6 3 . Sarcoplasm ic prote ins in pale, exudative pig muscles. N a tu re 200: 6 73 .
M cC la in , P .E ., M u llin s . A .M ., H ansard, S .L ., F o x , J .D . and B oulw are , R .F . 1 9 6 5 . A cid and salt soluble collagen in bovine muscle. Proc. Soc. E x p t. B io l. M ed . 119 : 4 92 .
M c In to sh , E .N . 1 9 6 7 . P ostm ortem changes in pro te in e x tra c ta b ility in beef, p o rk , and chicken muscle. J . F o o d S ci. 3 2 : 2 0 8 .
O ckerm an, H .W ., C ah ill, V .R . , Weiser, H .H ., D avis, C .E . and S ie fker, J .R . 1 9 6 9 . C o m p arison o f sterile and in ocu la ted beef tissue. J. Fo o d Sci. 34: 9 3 .
P enny, I .F . 1 9 6 8 . E ffe c t o f aging on the p rop er
ties o f m yo fib rils o f ra b b it m uscle. J. Sci. F o o d Agr. 19: 5 18 .
R am p to n , J .H ., Pearson, A .M ., P rice, J .F ., Hasegawa, T . and Lechow ich . R .V . 1 9 7 0 . E ffe c t o f m ic ro b ia l g row th up on m y o fib r illa r p ro te in s. J. F o o d Sci. 3 5 : 5 1 0 .
Scopes, R .K . 1 9 6 4 . Th e in fluence o f po s tm o rte m cond itions on th e solubilities o f muscle proteins. B iochem . J. 9 1 : 2 0 1 .
Sharp, J .G . 1 9 6 3 . A septic auto lysis in ra b b it and bovine muscle during storage at 3 7 ° C . J. Sci. F o o d Agr. 14: 4 6 8 .
S trom er, M .H . and G o ll, D .E . 1 9 6 7 . M o lecu lar properties o f po stm ortem m uscle. 2 . Phase m icroscopy o f m yo fib rils from bovine m uscle. J. F o o d Sci. 32: 329 .
S trom er, M .H ., G o ll, D .E . and R o th , L .E . 1 9 6 7 . M o rp h o lo g y o f rigor shortened bovine muscle and the e ffec t o f tryp s in on pre and post rigor m yo fib rils . J. C ell B io l. 3 4 : 4 3 1 .
T a rra n t, P .J .V ., Pearson, A .M ., Price, J .F . and L e c h o w ic h . R . V . 1 9 7 1 . A c tio n o f Pseudom onas frag i on the pro te ins o f pig m uscle. A p p l. M ic ro b io l. 22: 2 24 .
T a rra n t, P .J .V ., Jenkins, N ., Pearson, A .M . and D utson , T .R . 1 9 7 3 . A p ro te o ly tic enzym e preparation fro m Pseudom onas fragi, a m eat spoiler, and its action on pig m uscle. J. A p p l. M ic ro b io l. 25: 9 9 6
Ms received 1 0 /2 4 /7 3 ; revised 1 /2 1 /7 4 ; accept- ed 1 /2 2 /7 4 ._______________________________________
M ichigan A gricu ltu ra l E x p e rim en t S ta tio n Journal A rtic le N o . 6 5 5 0 .

K. O N O a n d D. R . W O O D S
A g r ic u ltu ra l R esea rch S e rv ice
U S D A A g r ic u ltu r a l M a rk e tin g R esea rch I n s t i tu te , A R S , B ldg . 0 4 7 A
A RC West, Beltsville, MO 20705
ADENOSINE 3 ',5-CYCLIC MONOPHOSPHATE IN NORMAL PORCINE MUSCLES
INTRODUCTION
’HE ETIOLOGY of pale, soft and exuda- ive (PSE) muscle is undefined. Since one f the characteristic disorders of PSE luscles is their abnormally rapid rate of naerobic glycolysis, the biochemistry of he process has been investigated and par- ially defined. For example, Kasten- chmidt and coworkers (1968) defined he biochemistry of anaerobic glycolysis n the “slow-” and “fast-glycolyzing” nuscle from pigs, particularly in the area >f glucose 1-phosphate through lactate ormation. Although some differences in mzymic activities between the two types >f pigs were noted, the etiology of PSE nuscle could not be determined from this tudy. Other studies, notably in the area )f phosphorylase activation and epineph- •ine effect (Hedrick et al., 1959; Sayre etil., 1962; Aberle and Merkel, 1968a, b; Pearson et al., 1973) have contributed Erectly or indirectly to the partial elucidation of the glycolytic process in the pig muscle. Still a comprehensive biochemical picture of glycolysis in PSE muscle is lacking.
Sutherland and coworkers (1965;1966) in troduced the concept of the “second messenger” with the discovery of the significance of cyclic 3 ,5 -AMP (c- AMP) in glycogen metabolism. Since c- AMP mediates the action of epinephrine, the relationship of c-AMP to rate of glycolysis and to PSE formation needs definition. As a preliminary step in providing such a definition, we will report on some basic properties of c-AMP in the skeletal muscles of normal pigs.
EXPERIMENTALSampling
Three different sampling techniques were used: First, to establish the stability o f c-AMP in porcine muscles about 300g of longissimus muscles from each o f four normal hogs were excised 30 min postmortem, cut into small pieces, frozen in liquid nitrogen, pulverized with a Sorvall Omnimixer and the resulting powder distributed into four containers. One container each was stored under nitrogen gas at 2°, -2 0 ° , -5 0 ° and -1 9 5 °C (liquid nitrogen). Second, to determine the distribution of c-AMP within a muscle, 1-in. sections of longissimus muscle from each of three normal hogs were excised from the anterior, central and posterior
regions. The sections were frozen in liquid nitrogen, pulverized with a Sorvall Omnimixer and the resulting powder stored at — 50° C. Third, to compare rates o f glycolysis in the longissimus, bicep femoris, semimembranosus and rectus femoris muscles, four normal hogs were electrically stunned and exsanguinated. Samples were excised at 30, 60, 90, 150 and 210 min after slaughter, frozen in liquid nitrogen, pulverized with a Sorvall Omnimixer and the resulting powder stored at -50°C .Extraction
Duplicate samples ( I -3 g ) o f the nitrogen- stored muscle powder were used for all extractions. For c-AMP analysis, samples were homogenized at ice-cold temperature with a Sorvall Omnimixer for 1 min in 50 ml 5% (w/v) tri- chloractic acid (TCA). After centrifugation at 7700 X G maximum for 10 min at 2°C, the supernatant was filtered through glass wool into a 100-ml volumetric flask. The pellet was washed twice, each time with 20 ml o f 5% TCA followed by centrifugation, and the supernatant was pooled. After adjusting to volume, about 10 ml of the supernatant was centrifuged for 3 min in a clinical centrifuge. 3 ml o f the clear supernatant was transferred into a 50-ml ground glass-stoppered tube containing 0.3 ml of 0.1 N HC1. The TCA was removed by extracting the supernatant four times with 10 ml of diethyl ether. Residual ether was removed by gently blowing a stream of air over the interphase and the aqueous phase was lyophilized overnight. The residue was dissolved in 1.0 ml 50 mM sodium acetate buffer, pH 4 .0 , and stored at -2 0 °C until ready to use. Using this extraction procedure, 95-97% of added 3 H-c-AMP was recovered.
Extracts for lactate and ATP assays were prepared by stirring l - 2 g of the pulverized tissue powder in 5 ml 0.6N perchloric acid and centrifuging at 7900 x G maximum for 10 min. The supernatant was filtered through glass wool into a 25-ml beaker. The pellet was rinsed once with 3 ml perchloric acid recentrifuged as above and the supernatant added to the previous supernatant. Solid K2C 0 3 was added to the filtered supernatant with constant stirring until pH 7.5 was attained, as indicated by a pH meter. The extract was centrifuged and the supernatant was filtered through glass wool into a 50-ml volumetric flask and diluted to volume. This extract was used for lactate and ATP assays.Assays
Gilman’s (Gilman, 1970) competitive protein-binding technique was used to assay for c-AMP. Protein kinase and protein kinase inhibitor were obtained from Sigma Chemical Co. and adenosine 3',5'-cyclic phosphate ammonium salt 3 H (G) was obtained from New England Nuclear. The Tri-Carb Packard Scintil
lation Spectrometer was used for all counting.Lactate and ATP were determined, essential
ly, by the methods described by Horhorst(1965) and Lamprecht and Trautschold (1965), respectively.
Glycogen was extracted from tissues by the hot alkali method of Somogyi (1934), followed by acid hydrolysis and glucose analysis, using the Glucostat Reagent (Worthington Biochemical Corp.).
Temperature was measured with a thermocouple sensor.
Analysis o f variance by one-way classification (Steel and Torrie, 1960) was used to compare differences in means.
RESULTS & DISCUSSIONRECENT REPORTS (Fennema, 1971; Behnke et al., 1973) indicate that several enzymatic systems are in a dynamic state even at —3 C. Since the assays for glycolytic metabolites and c-AMP are tedious and time-consuming, samples must be stored under conditions which eliminate or minimize the degradation of c-AMP until the assays can be performed. Figure1 shows the relative stability of c-AMP when stored under nitrogen at 2°, —20°, —50° and —195°C, up to 4 days. Cyclic AMP in samples stored at 2°C deteriorated rapidly and after 2 days of storage, the level was significantly lower (P < 0.05) than that at 0 day. Only 55% of the c- AMP present at 0 day was recovered after2 days’ storage. Testing was limited to a maximum of 4 days since samples were easily extracted within 4 days and analyzed within 5 days, postmortem, allowing 2 days for delays which might occur when samples are shipped from one laboratory to another. Although c-AMP values, especially at 1 and 2 days, fluctuated from 0 day values, differences were not significant (P > 0.05) for samples stored at —20°, —50° and —195°C at any time up to 4 days postmortem. The almost parallel variation exhibited by samples stored at -5 0 ° and — 195°C is difficult to explain. It may appear that the variation could be attributed to variations in methodology since analyses were performed on 4 separate days. However, judging from the nonparallel behavior of the 2 and 20°C samples and also from the constancy of the standard curves within the 4 days, an explanation for the variation is not obvious.
Volum e 3 9 (1 9 7 4 )-J O U R N A L O F FO O D S C IE N C E -8 2 9

330—JOURNAL OF FOOD SCIENCE-Volume 39 (1974)
Another practical problem which faces researchers is the uncertainty of obtaining representative samples of m etabolites w ithin a muscle. Often sampling may involve excision of muscles which cover a limited area. Results in Table 1 indicate that there was no significant difference in c-AMP levels between the samples from the anterior, central, and posterior of the longissimus muscle. Thus in a sample of about 200g a representative quantitation of c-AMP can be obtained.
In addition to studying the distribution and properties of c-AMP in the longissimus muscle, the distribution in three other muscles was studied. Figure 2 shows the distribution w ith tim e in the four muscles. The longissimus, bicep femoris, semimembranosus and rectus femoris were selected since the degree of susceptibility to PSE decreases in the order listed (Briskey et al., 1960;Briskey and Wismer-Pedersen, 1961). Also, by studying the muscles within an animal, conditions such as horm onal influences, substrate availability and enzyme concentrations are controlled better than by studying muscles between animals. Differences in c-AMP levels between muscles were not significant at any tim e when results were compared within and between animals. These results indicate that in the normal hog, all of the four muscles investigated were capable of responding to stress of the slaughter process in a similar manner. Pearson and coworkers
T a b le ’ —D is t r i b u t io n o f c y c l ic A M P in t h r e e
a re a s o f p o r c in e lo n g is s im u s m u s c le
P ic o m o le sR ib a re a c -A M P /g t i s s u e 3
A n te r io r 9 8 2 .4 * 4 4 .2C e n t ra l 9 2 5 .1 ± 2 6 .6
P o s te r io r 1 0 1 0 .1 + 8 6 .7
a M ean ± s ta n d a rd e rro r o f th e m ean (n - 3 ) .
(1973) also postulated tha t the stress of slaughter produces enough epinephrine to cause the maximum rate of glycolysis. However, the length of time elapsed between exsanguination and first sampling needs consideration. Possibly the stress effect on c-AMP production is very rapid and transient and the critical period of response might have been missed during the first 30 min postm ortem . Exton and coworkers (1971) have shown that response to horm ones, as judged by increase in c-AMP, may occur within 30 sec after adm inistration. In vitro work is being undertaken to determ ine the epinephrine sensitivity and time-response of the adenyl cyclase system of the pig skeletal muscle. The glycogen depletion curve (Fig. 3) indicates that the critical level of c-AMP may occur after 30 min postm ortem . During the first 60 min. when c-AMP levels were decreasing rapid
ly, glycogen levels were relatively stable and showed increased rate of degradation only after 60 min postm ortem . Kasten- schmidt and coworkers (1968) showed similar glycogen depletion rates using muscles from slow-glycolyzing Hampshire and Chester white pigs. At c-AMP levels of about 14C 0-950 picomoles/g tissue, the rate of glycogen depletion was most rapid. The rates decreased after 150 min postm ortem when the c-AMP levels were 9 5 0 -7 50 picomoles/g tissue and eventually stopped often w ith residual glycogen still present in the muscles. The presence of residual glycogen may be due to product inhibition such as pH alteration by lactate accum ulation (Briskey, 1964) or to insufficient c-AMP. Assuming phosphodiesterase activity to be constant, the rapid rate of c-AMP depletion after 60 min postm ortem might be attribu ted to decreased synthetic capabilities at the adenyl cyclase step since, ATP, the substrate for c-AMP synthesis, remains fairly constant (Fig. 4). The only significant difference (P < 0.05) in ATP levels was between 30 and 210 min postm ortem for the rectus femoris muscle. Results for the other muscles, especially for the longissimus and bicep femoris muscles show nonsignificant (P > 0.05) variations, possibly due to sample variations.
Rate of lactate accum ulation generally reflected the rate of glycogen degradation (Fig. 5). Levels of lactate at 210 min were similar to levels reported by Kasten-
50 60 90 120 150 160 210TIME POSTMORTEM(Minutes)
I T e m p e ra tu re s ta b i l i ty o f c y c lic A M P in p o rc in e lo n g iss im u s m uscle . F ig . 2 —C y c lic A M P c o n c e n tra tio n s in fo u r p o rc in e m u scles
a t va rio u s tim e s p o s tm o r te m .

CYCLIC AMP IN PORCINE MUSCLES-831
schmidt and coworkers (1968) for “ slow- glycolyzing” pigs. Although the only significant difference in lactate levels at 210 min postm ortem was between the longis- simus and rectus femoris muscles, the general order was longissimus > bicep femoris > semimembranosus > rectus
femoris. The final tem perature levels (Fig.6 ) followed a similar order, indicating that even in muscles from norm al pigs, rates o f glycolysis differ between muscles. Possibly this is a reflection of the initial glycogen levels, and in the case of the rectus femoris, possibly due to glycolytic
contro l exerted at the aerobic level (Beecher et al., 1969).
The present findings add to the difficulty in implicating the catecholamine: c-AM P:phosphorylase 6:phosphorylase a
interactions in porcine stress syndrome (PSS) and PSE disorders. Sayre and co-
F ig . 3 —G ly c o g e n c o n c e n tra tio n s in fo u r p o rc in e m uscles a t various
t im e s p o s tm o r te m .F ig . 4 —A T P c o n c e n tra tio n s in fo u r p o rc in e m uscles a t vario u s tim e s
p o s tm o r te m .
3 0!--------- 1--------- 1--------- 1--------- 1--------- 1
6 0 9 0 120 150 180 210TIME POSTMORTEM (Minutes)
-ig. 5-Lactate concentrations in four porcine muscles at various times Fig. 6—Temperatures of four porcine muscles at various times post-jostmortem. mortem.

8;32-JOURNAL OF FOOD SCIENCE- Volume 39 (1974)
workers (1962) reported that to ta l phos- phorylase activity was not significantly associated with glycogen level or rate of pH decline and tha t at 10 min postm ortem most of the phosphorylase was in the inactive b form. The authors, however, cautioned tha t the tim e course of phosphorylase activation was unknown. Aberle and Merkel (1968b) also found no relationship between to ta l concentrations of phosphorylase and phosphorylase a to rates of pH decline or PSE muscle developm ent. Cooper and coworkers (1969), on the other hand, dem onstrated tha t in the longissimus muscle, certain interm ediate fibers from stress- susceptible animals have higher phosphorylase activity than that o f muscles from stress-resistant animals. Possibly, due to the stress exerted during slaughter, a saturating concentration of catecholamines is released so that in most animals the cat echo ia mine :c-AMP phosphorylase b :phosphorylase a interactions are not seen (Aberle and Merkel, 1968b; Dal- rymple et ah, 1973; Pearson et al., 1973).
Electrical stim ulation, particularly, may have significantly affected phosphorylase activation. Ono and coworkers(1973) recently reported that no significant differences were detected in the levels of c-AMP, lactate, glycogen and ATP between electrically stunned hypo- physectom ized and sham hypophysec- tom ized pigs. O ther reports indicate that electrical stim ulation did not alter c-AMP concentrations or the state of activation of phosphorylase kinase (Posner et ah, 1965; Drummond et al., 1969) although phosphorylase a form ation was accelerated (D anforth et ah, 1962).
Yet w ithout the im plication of catecholamines :c-AMP:phosphorylase b :phosphorylase a interactions, the abnormal rate of glycolysis exhibited by PSE muscles is difficult to explain. Perhaps as suggested by Mayer and Stull (1971) the phosphorylase activation system must be regarded as more complex than a simple cascade. One of the hypotheses advanced to account for some of the anomolies is that phosphorylase kinase activity is controlled by Ca++ (D anforth et ah, 1962) and Mg++ (Villar-Palasi et ah, 1971). The discovery by Greaser and coworkers
(1969a, b) that sarcoplasmic reticulum from normal porcine muscles had higher calcium-accumulating ability than that from PSE muscles is especially pertinent. The possible im plication of faulty Ca++- sequestering mechanisms in the etiology of PSE muscles is an area o f research w orthy of further investigation.
REFERENCESA b erle , E .D . and M e rk e l, R .A . 1 9 6 8 a . 5 ;ade-
n y lic acid deaminase in porc ine muscles. J. F o o d Sci. 33: 2 7 .
A berle , E .D . and M e rk e l, R .A . 1 9 6 8 b . Physical and b iochem ical properties o f porc ine m uscles as affec ted b y exogenous epinephrine and predniso lone. J. Fo od Sci. 3 3 : 43 .
Beecher, G .R ., K astenschm idt, L .L . , H oekstra , W .G ., Cassens, R .G . and Briskey, E .J . 1 9 6 9 . Energy m etabo lites in red and w h ite striated muscles o f the pig. J. A gr. F o o d C hem . 17: 2 9 .
B ehnke, J .R ., Fennem a, O . and Cassens, R .G .1 9 7 3 . R ate o f po stm ortem m etabo lism in fro ze n an im al tissue. J. A gr. F o o d C hem . 2 1: 5.
Briskey, E .J . 1 9 6 4 . E tio log ica l status and associated studies o f pale, soft and exudative porcine m uscu lature . In “ Advances in Fo od R esearch,” V o l 1 3 , p. 8 9 . A cadem ic Press, N ew Y o rk .
Briskey, E .J ., H oekstra , W .G ., B ray, R .W . and G ru m m er, R .H . 1 9 6 0 . A com parison o f certa in physical and chem ical characteristics o f p o rk muscles. J. A n im . Sci. 19: 2 1 4 .
B riskey, E .J . and W ism er-Pederson, J. 1 9 6 1 . B iochem istry o f pale muscle structu re . 1. R ate o f anaerobic and tem p era tu re change versus the apparent s tructure o f muscle tissue. Fo o d Res. 2 6 : 2 97 .
C ooper, C .C ., Cassens, R .G . and B riskey, E .J .1 9 6 9 . C ap illary d is trib u tio n and fib e r characteristics in skeletal muscle o f stress-suscep tib le anim als. J. F o o d Sci. 3 4 : 2 9 9 .
D alry m p le , R .H ., K astenschm idt, L .L . and Cassens, R .G . 1 9 7 3 . G lycogen and phosphorylase in developing red and w h ite m uscle. G ro w th 3 7: 19.
D a n fo rth , W .H ., H e lm re ich , E . and C o ri, C .F . 1 9 6 2 . The e ffec t o f ep inephrine on the phosphorylase a c tiv ity o f frog Sartorius m uscle. Proc. N a t. A cad. Sci. U S A 48: 1 1 9 1 .
D ru m m o n d , G .I . , H arw o o d , J.P. and P ow ell,C .A . 1 9 6 9 . Studies on the activa tio n o f phosphorylase in skeletal muscle by contract io n and by ep inephrine . J. B io l. C hem . 2 4 4 : 4 2 3 5 .
E x to n , J .H ., Lew is, S .B ., H o , R .J ., R ob inson , G .A . and P ark , C .R . 1 9 7 1 . The ro le o f cyclic A M P in the in terac tio n of glucagon and insu lin in the c o n tro l o f liver m etabo lism . A n n . N .Y . A cad. Sci. 185 : 8 5 .
Fennem a, O . 1 9 7 1 . Rates o f chem ical de te rio ra t io n in frozen foods. Proc. M e at In d . Res. C onf. 3 5 .
G ilm an , A .G . 197^0. A p ro te in b inding assay fo r adenosine 3 \5 -cyclic m onophosphate. Proc. N a t. A cad . Sci. U S A 67: 3 0 5 .
Greaser, M .L ., Cassens, R .G ., Briskey, E .J . and H oekstra , W .G . 1 96 9 a . P ostm ortem changes in sub cellu lar fractions fro m no rm a l and pale , so ft, exudative porcine muscle. 1 . C al
c ium accu m u lation and adenosine tr ip h o - phatase activ ities . J. Fo o d Sci. 3 4 : 1.
Greaser, M .L ., Cassens, R .G ., H oekstra , W .G ., B riskey, E .J ., S ch m id t, G .R ., C arr, S .D . and G a llo w a y , D .E . 1 9 6 9 b . C alc ium accu m u la ting a b ility and com positiona l d ifferences betw een sarcoplasm ic re ticu lu m fractions fro m no rm a l and pale, so ft, exudative p o rcine m uscle. J. A n im . Sci. 2 8 : 5 8 9 .
H e d ric k , H .B ., B o ille t, J .B ., B rady , D .E . and N au m ann , H .D . 1 9 5 9 . E tio lo g y o f d a rk -c u tting beef. M d . A gr. E x p . Sta. Res. B u i. 7 1 7 .
H orhors t, H .J . 1 9 6 5 . L -(+ )-la c ta te . D e te rm in a t io n w ith lactic dehydrogenase and D P N . In “ M ethods o f E n zy m a tic A na lys is ,” E d . Bergm eyer, H .U ., p . 2 6 6 . A cadem ic Press, N e w Y o rk .
K astenschm idt, L .L . , H oekstra , W .G . and B riskey, E .J . 1 9 6 8 . G ly c o ly tic in term ed iates and cofactors in “ fast-” and “ s low -g lyco lyz- ing” muscles o f the pig. J. F o o d Sci. 3 3 : 1 51 .
L am p rech t, W .; and Trau tsch o ld , I . 1 9 6 5 . A d e n o s m e ^ -triphosphate . D e te rm in a tio n w ith hexokinase and glucose-6-phosphate dehydrogenase. In “ M ethod s o f E n zy m a tic A nalysis ,” E d . B ergm eyer, H .U ., p . 5 4 3 . A cadem ic Press, N e w Y o rk .
M ayer, S .E . and S tu ll, J .T . 1 9 7 1 . C yc lic A M P in skeletal m uscle. A n n . N .Y . A cad. Sci. 1 85 : 4 3 3 .
O no, K ., K raeling, R .R ., W oods, D .R . and Davis, B.J. 1 9 7 3 . H yp o p h ys e c to m y and glycolysis in the hog. J. A n im . Sci. 3 7 : 2 6 8 (A b s tr).
Pearson, A .M ., Carse, W .A ., W enham , L .M ., F a irb a im , S .J., L o ck e r, R .H . and J u ry , K .E .1 9 7 3 . In fluence o f various adrenergic accelerators and b locking agents u p o n g lyco lysis and some re la ted properties o f sheep m uscle. J. A n im . Sci. 36: 5 0 0 .
Posner, J .B ., S tern , R . and Krebs, E .G . 1 9 6 5 . E ffects o f e lec trica l s tim u la tio n and ep inephrine on muscle phosphorylase, phosphorylase b kinase, and adenosine 3 , 5 - phosphate. J. B io l. C hem . 2 40 : 9 8 2 .
Sayre, R .N ., B riskey, E .J . and H oekstra , W .G . 1 9 6 2 . E ffe c t o f e xc item e n t, fasting, sucrose feeding on porcine muscle phosphorylase and po stm ortem glycolysis. J. Fo od Sci. 2 8 : 4 7 2 .
S om ogyi, M . 1 9 3 4 . The s o lu b ility and preparatio n o f phosphorus- and n itrogen-free g lycogen. J. B io l. C hem . 1 0 4 : 2 4 5 .
S teel, R .G .D . and T o rrie , J .H . 1 9 6 0 . “ Principles and Procedures o f Statis tics ,” p. 9 9 . M c G ra w -H ill, In c ., N e w Y o rk .
S u therland , E .W ., O ye , I . and B u tcher, R .W .1 9 6 5 . Th e action o f ep inephrine and the role o f the adeny l cyclase system in ho rm one action . In “ R ecent Progress in H o r m one Research,” p. 6 2 3 . A cadem ic Press, N e w Y o rk .
S utherland , E .W . and R obinson , G .A . 1 9 6 6 . M e tab o lic effects o f catecholam ines. A . The ro le o f cyclic 3 ,5 ;-A M P in response to catecholam ines and o th er horm ones. P harm o l. Rev. 18: 1 4 5 .
V illa r-P a las i, C ., L a rn er, J. and Shen L .C . 1 9 7 1 . G lycogen m etabo lism and the m echanism o f action o f cyclic A M P . A n n . N .Y . A cad. Sci. 1 85 : 74 .
M s received 1 /1 1 /7 4 ; revised 2 /2 6 /7 4 ; accepted3 /5 /7 4 ,_______________________ ___________ _____
M e n tio n o f specific trade names and com panies is fo r id e n tific a tio n purposes o n ly anddoes n o t im p ly endorsem ent by the U .S .G o v e r n m e n t .

J. T. K L E M E N T a n d R . G . C A S S E N S
M u s c le B io lo g y L a b a n d D e p t , o f M e a t a n d A n im a l S c ie n c e
a n d 0 . R . F E N N E M A
D e p t, o f F o o d S c ie n c e , C o lleg e o f A g r ic u ltu ra l a n d L i fe S ciences
U n iv e rs ity o f W isc o n s in , M a d is o n , W l 5 3 7 0 6
THE EFFECT OF BACTERIAL FERMENTATION ON PROTEIN SOLUBILITY IN A SAUSAGE MODEL SYSTEM
INTRODUCTIONFERMENTATION is utilized in the production of popular food item s such as cheese, bread and certain dry and semidry sausages. Recent published w ork on sum mer sausage (Klem ent et al., 1973; Ward- law et al., 1973) has been directed at elucidating the fundam ental changes undergone by the various m eat com ponents in response to ferm entation and other aspects o f processing; particular interest centers on the role o f muscle proteins in im parting physical p roperty characteristics to the finished product.
The objective of this work was to study the effect of pH, heat and salt on muscle proteins. Bacterial ferm entation was conducted in a model system in order to control such factors as drying.
MATERIALS & METHODSALL MEAT was post-rigor and had pH values of 5.5-5.7. Equal portions of coarse ground unsalted beef (90% lean) and regular trimmings of coarse ground unsalted beef (50% lean) were chopped in a silent cutter to a consistency characteristic of that used for production of a fermented sausage. The temperature of the mix did not exceed 6°C and its composition was: 24% fat, 60% moisture, 15% protein and 1% ash. This preparation was frozen and stored in liquid nitrogen until protein extractions were performed.
Sarcoplasmic protein preparations were prepared by extraction with 0.03M potassium phosphate at pH 7.4 and myofibrillar protein preparations were prepared by extraction with 0.67M NaCl in 0.03M potassium phosphate at pH 7.4 (Klement et al., 1973). Sarcoplasmic protein in 0.67M NaCl was also prepared by adding an appropriate amount of NaCl to the 0.03M potassium phosphate extract. This preparation is identified as “0.67M NaCl sarcoplasmic. ” The final concentration of the solutions ranged from 1.8-3.4 mg protein per ml of solution.
1% dextrose and starter culture were added to aliquots of the protein solutions to be tested. The starter culture was Pediococcus cerevisiae (AC-1, Chris Hansen Laboratory, Milwaukee, Wis.) and the resultant concentration of bacteria in the protein solutions was 1-5 X 10⁶ cells per ml. Control aliquots of protein solutions contained neither sugar nor starter culture and were used to measure the effect of heat only on insolubilization of proteins. Control and test aliquots were incubated at 37°C for a maxi
mum of 64 hr. Measurements of pH were made with a combination glass electrode periodically during the incubation. Inoculated samples were examined as a function of pH value, and controls were examined as a function of time at 37° C. Samples were cooled rapidly in an ice bath when the desired pH or incubation time was reached and analyzed immediately.
The cooled protein solutions were centrifuged at 10,000 X G for 20 min to precipitate insolubilized protein. Nitrogen determinations (micro-Kjeldahl, AO AC, 1960) were performed in duplicate on the supernatants. Changes in solubility were based on solubility of the original unheated extracts. Nonprotein nitrogen (NPN) was measured after precipitation of the protein with trichloracetic acid (20 w/v).
All data were subjected to Analysis of Variance and Duncan’s Multiple Range Test for significant differences as described by Steel and Torrie (1960).
RESULTS & DISCUSSIONTHE SOLUBILITIES of the protein solutions as a function of pH are shown in Figure 1. All samples o ther than the pH
7.4 control were exposed to 37°C. Incubation tim e ranged from 12—40 hr and in general, the lower the pH the longer was the incubation time. There was no significant change in solubility o f myofibrillar proteins above pH 6.2. Below pH 6.2, there was a nearly linear decline in solubility as pH declined. A decrease in solubility o f about 35% (P < 0.01) was observed for m yofibrillar proteins as the pH decreased from pH 6.2 to 5.5. This could reflect a nondenaturing isoelectric precipitation. The slope o f the curve decreased a t abou t pH 5.5 and a further reduction in solubility o f about 25% occurred as the pH fell from 5.5 to 4.6 (P < 0.01). At pH 4.6 alm ost 60% of the original soluble m yofibrillar protein had becom e insoluble.
Sarcoplasmic proteins responded differently. There was little or no reduction in solubility as the pH decreased from 7.4 to 6.8. From pH 6.8 to 4.6 an approximately linear decrease in solubility oc-
F ig . 1—P e rc e n t s o lu b il ity i/s. p / 7 d u r in g fe rm e n ta t io n o f va rio u s p r o te in
p re p a ra t io n s a t 3 7 ° C.
Volume 39 (1974)—JOURNAL OF FOOD SCIENCE-833

834-JOURNAL OF FOOD SCIENCE-Volume 39 (1974)
curred and at pH 4.6 about 40% of the original solubility had been lost. A 17% reduction in solubility occurred when the ferm entation process lowered the pH from 5.5 to 4.6 (usual range for summer sausage).
Sarcoplasmic proteins in 0.67M NaCl behaved similarly to unsalted sarcoplasmic proteins over the pH range 7 .4—5.5. However, as pH declined below 5.5, sarcoplasmic proteins in the presence of salt underw ent a more severe decrease in solubility. Salted samples underw ent a 28% reduction in solubility between pH 5.5 and 4.6. The effect of salt is further dem onstrated by the results at pH 4.6; 40% of the unsalted sarcoplasmic proteins were insoluble whereas about 50% of sarcoplasmic proteins in 3.67M NaCl were insoluble (P < 0.01). At pH 4.6, both salted and unsalted fractions of sarcoplasmic proteins had significantly (P < 0.01) greater solubilities than the m yofibrillar fraction. Sodium chloride is probably im portant in ferm ented sausage manufacture since it not only helps solubilize myofibrillar proteins during early mixing and chopping, but also aids in the insolubilization of water-soluble sarcoplasmic proteins; this la tter phenom enon probably has some im portance in development o f structure in a ferm ented sausage.
In the pH range 5 .7—5.8, solubility differences among the three protein preparations were not significant. However, as
the pH decreased below 5.7, the myofibrillar proteins decreased more rapidly in solubility than the sarcoplasmic proteins (P < 0.05). This finding in a simplified system agrees with the previous results of Klem ent et al. (1973) which were based on commercially prepared sausage.
The solubilities of control protein fractions as a function of time at 37 C is illustrated in Figure 2. The pH of these solutions all remained above 7.0 during incubation. The solubility of the m yofibrillar fraction did not change significantly during 46 hr of incubation. This supports the findings o f Parkes and May(1968) who studied a salt-soluble protein solution from chicken and did not find a change in solubility during heating at 37°C for up to 3 hr. Paul et al. (1966) reported a 40% decrease in solubility of a myofibrillar protein preparation from rabbit muscle when it was heated for 10 hr at 40 C, but their work was conducted on in tact muscle.
Heating the sarcoplasmic protein solution for 40 hr at 37 C resulted in an average reduction in solubility of about 10%. This agrees well w ith the results o f Scopes(1964) who studied solutions of sarcoplasmic proteins and found 7.6% precipitation of sarcoplasmic proteins during heating at 37°C for 4 hr and 22% precipita tion during heating at 45 C for the same length of time. Hamm and Deather- age (1960) found greater insolubility than
reported here when they used in tact muscle.
The addition of NaCl to the sarcoplasmic protein solution accentuated the effect of heating. When the 0 .67M NaCl sarcoplasmic protein preparation was heated at 37°C for 16 hr, a 15—20% decrease in solubility was found, and further heating for up to 40 hr resulted in21—26% insolubilization.
Since there is a definite difference in the heat susceptibilities of m yofibrillar and sarcoplasmic protein solutions, Figure 1 should be interpreted w ith such inform ation in mind. Heat played a partial role in the insolubilization of sarcoplasmic proteins in Figure 1, whereas heat would have had little or no influence on the behavior of the myofibrillar proteins.
The decrease in the solubility o f sarcoplasmic proteins in the presence of salt illustrates tha t salt may influence sausage structure by means o ther than simply solubilizing myofibrillar proteins. This is especially true if precipitation of sarcoplasmic proteins enhances structure. Sarcoplasmic proteins alone are regarded as poor contributors to structure since they lack gelling ability (Trautm an, 1966). However, it is possible tha t salt-induced insolubilization of sarcoplasmic proteins may affect precipitation of myofibrillar proteins, thus prom oting better structure development than would be achieved with myofibrillar proteins alone. In this
F ig . 2 —P ro te in s o lu b il ity o f c o n tr o l fra c tio n s vs. t im e a t 3 7 ° C. F ig . 3 —C hange in n o n p ro te in n itro g e n (N P N ) i/s. p H d u r in g fe rm e n ta
t io n o f s a rc o p la sm ic a n d m y o f ib r i l la r p ro te in s a t 3 7 ° C.

PROTEIN SOLUBILITY IN SAUSAGE-835
regard, Scopes (1964) reported tha t dénaturation of in tact sarcoplasmic proteins is associated with decreased solubility of myofibrillar proteins.
NPN in the myofibrillar protein fraction (Fig. 3) increased from 2 ppm to 25 ppm as the pH declined from 7.4 to 5.4 and showed a much faster rate o f increase as pH declined further. NPN in the sarcoplasmic fraction increased from about 3 ppm to about 12 ppm as the pH decreased from 7.4 to 6.8; below pH 6.8, NPN in the sarcoplasmic fraction changed only slightly. The results for the sarcoplasmic fraction containing 0.67M NaCl are not shown since they were very similar to those for the sarcoplasmic protein fraction. Levels of NPN were significantly greater (P < 0.01) in the myofibrillar fraction than in the sarcoplasmic fraction at all pH values below 6.4.
These results suggest that myofibrillar proteins were hydrolyzed at pH levels below 5.4. Bacteria could play a role in producing proteolytic enzymes tha t preferentially attack myofibrillar proteins.
Sajber et al. (1971) reported marked increases in many am ino acids during the ferm entation of “ Stajer” sausages and they postulated th a t this was caused by proteolytic bacteria, mainly of the Micrococcus species. This mechanism of proteolysis could have occurred in this study if samples contained or were inadvertently contam inated w ithM crococcispecies. The Pediococcus starter culture used is no t regarded as proteolytic (Deibel et ah, 1961).
REFERENCESA O A C . 1 9 6 0 . “ O ffic ia l M ethods o f A nalysis ,”
9 th ed. Association o f O ffic ia l A gricu ltu ra l Chem ists, W ashington, D .C .
D eibe l, R .H ., W ilson, G .D . and N iven , C .F .1 9 6 1 . M ic rob io lo gy o f m eat curing. 4. A ly o p h ilize d Pediococcus cerevisiae starter cu ltu re fo r fe rm ented sausage. A p p l. M ic ro b io l. 9: 2 39 .
H am m , R . and Deatherage, F .E . 1 9 6 0 . Changes in p ro te in s during heating o f m eat. Fo od Research 25: 5 87 .
K le m e n t, J .T ., Cassens, R .G . and Fennem a,O .R . 1 9 7 3 . Th e association o f p ro te in solub ilities w ith the physical p roperties in a fe rm ented sausage. J. Fo od Sci. 3 8 : 1 12 8 .
Parkes, M .R . and M a y , K .N . 1 9 6 8 . E ffe c t o f freezing, evaporation and freeze-dry ing on the em u ls ify ing capacity o f salt-soluble p ro te in . P o u ltry Sci. 47: 1 2 3 6 .
Paul, P .C ., B uchter, L . and W ierenga, A . 1 9 6 6 . S o lu b ility o f rab b it muscle pro te ins a fter various tim e-tem p era tu re trea tm ents . J . Agr. F o o d C hem . 1 7: 4 9 0 .
Sajber, C ., K arakas, R . and M it ic , P. 1 9 7 1 . In fluence o f some s tarter cultures up on the changes in p ro te in s o f “ S ta jer: sausages du ring fe rm e n ta tio n . 21st E urop ean Research C onference.
Scopes, R .K . 1 9 6 4 . Th e in fluence o f postm ortem cond itions on the solubilities o f muscle prote ins. B iochem . J. 9 1 : 2 01 .
S teel, R .G .D . and T o rr ie , J .H . 1 9 6 0 . “ Principles and Procedures o f S tatis tics .” M c G ra w -H ill B ook C o., N ew Y o rk .
T ra u tm an , J .C . 1 9 6 6 . E ffe c t o f tem p erature and p H on soluble pro te ins o f ham . J. Fo od Sci. 31: 4 0 9 .
W ard law , F .B ., S k e lly , G .C ., Johnson, M .G . and A c to n , J .C . 1 9 7 3 . Changes in m eat com ponents during fe rm e n ta tio n , heat processing and dry ing o f sum m er sausage. J. F o o d Sci. 38: 1 22 8 .
Ms received 1 1 /2 5 /7 3 ; revised 3 /4 /7 4 ; accepted3 /1 3 /7 4 . * 58
M uscle B io logy L a b o ra to ry M anuscrip t N o .58.
Research supported by the College o f A gricu ltu ra l and L ife Sciences, U n ivers ity o f W isconsin, M adison , and the K le m e n t Sausage C o., M ilw au kee , Wis.
A p p rec ia tio n and gra titud e is expressed to R . H ap ka and R . Tsai o f th e P ro d u ct C o n tro l La b o ra to ry o f K le m e n t Sausage C o ., M ilw aukee, W is. fo r th e ir tech n ica l suggestions and assistance.

J. E. KELLER1 and J. C. ACTON Dept, of Food Science, Clemson University, Clemson, SC 29631
PROPERTIES OF A FERMENTED, SEMIDRY TURKEY SAUSAGEDURING PRODUCTION WITH LYOPHILIZED AND FROZEN
CONCENTRATES OF Pediococcus cerevisiae
INTRODUCTIONPREVIOUS RESEARCH and reports on ferm ented sausage products (Deibel and Niven, 1957; Everson, 1971; Acton et al., 1972; Townsend and Davis, 1972; Kle- ment et al., 1973; Wardlaw et al., 1973) mainly describes the use of beef, pork, or com binations of these meats. Baran and Stevenson (1973) reported on the changes in the general microflora and survival of pathogens during the processing of a ferm ented, dry turkey sausage. Using a low heat process of 46 C, the extent of destruction of several species of S a l m o n e l l a and of C l o s t r i d i u m perfringens varied with the strain and the am ount of pathogen used in inoculation.
Ferm ented sausages containing either chicken or turkey meats and in com bination with either 25% or 50% beef were studied by Dawson (1970). He reported that more panelists preferred the com bination products than the products containing chicken or turkey meats alone. The lyophilized culture form of P e d i o c o c c u s c e r e v i s i a e was employed in both studies (Dawson, 1970; Baran and Stevenson, 1973) of ferm ented poultry meat sausages. In each case, the final ferm ented sausage pH was 5.3 (Baran and Stevenson,1973) or 5 .2—5.5 (Dawson, 1970).
Starter cultures for meat ferm entation were introduced in a patent o f Jensen and Paddock (1940). Bacteria which have been proposed as starter cultures include M i c r o c o c c u s a u r a n t i a c u s (Niinivaara,1955); P e d i o c o c c u s c e r e v i s i a e (Deibel and Niven, 1957; Deibel et al., 1961) and a num ber of species of L a c t o b a c i l l u s (Jensen, 1954). Starter cultures of L a c t o b a c i l lu s p l a n t a t i o n and P e d i o c o c c u s c e r e v i s i a e are currently available as a frozen concentrate (Anon., 1972; Everson et al., 1970; Everson, 1971), and the la tte r organism is also available as a lyophilized starter. Ferm entation tim e requirem ents have been significantly reduced from 32 to 40 hr using the lyophilized culture to 1 8—24 hr using the frozen concentrate (Everson et al., 1970). Incidences of off-flavor developm ent and rup ture of casings resulting from the growth of undesirable bacteria
' Present address: The B lue Channel C o ., D iv . o f A lexan der D aw son, In c ., P ort R o y a l, SC 2 9 9 3 5
have also been reduced by starter culture inoculations (Jensen, 1954; Everson,1971).
The four phases of ferm ented meat processing can be divided in to initial ingredient blending, sausage mix ferm entation, mild to com plete heat processing, and product drying or aging. An aging period, w ith or w ithout drying, m ust follow after ferm entation to allow the flavor to “ m ellow” thus reducing the harshness or acidity found in freshly processed sausage (Borgstrom, 1968; Wilson, 1960; Merck, 1969).
The present study was conducted to com pare the ferm entation rates o f both lyophilized and frozen forms of P e d i o c o c c u s c e r e v i s i a e , to follow bacteria levels during the overall course of processing, and to investigate the sausage meat properties and com position during ferm entation and drying of the product. The product used in this investigation would be classified as a ferm ented semidry turkey sausage in chub or stick form.
MATERIALS & METHODS
Sausage preparation, fermentation and processing
Mature turkey toms obtained from the Poultry Science Dept, at Clemson University were processed in a regional plant operating under APHIS inspection. The whole carcasses, weighing 8.2-10.9 kg, were frozen at -15°C for approximately 9 months. As needed, carcasses were thawed at 20° C for 18 hr and deboned. The breast muscles, excluding skin, were ground once through an 8 mm plate. Thigh meats, without skin, were ground twice using a 5 mm plate and then regroun i once through a 3 mm plate. Carcass skin from the breast, back and thigh areas was ground toree times through a 3 mm plate with proper chilling (0°C) between grindings due to fat liquefaction. The ground tissues were held at 4°C for 4 -6 hr prior to sausage preparation.
Two turkey sausage formulations (Table 1) were used in this study, The sausage mixes were comparable and yielded only minor differences in initial composition. The major difference in sausage formulations was the starter culture form used for inoculation. Sausages of formulation I (Table 1) were inoculated for fermenta-
T a b le 1 —T u r k e y s a u s a g e in g r e d ie n t s
I n g r e d i e n t
Q u a n t i t y
1 II
M e a ts :
b o n e le s s t u r k e y b r e a s t 2 .9 5 kg 3 .3 2 kg
b o n e le s s t u r k e y th ig h 1 .2 6 kg 0 .6 2 kg
t u r k e y s k in 0 .3 3 kg 0 .6 0 kg
C ure :®s o d iu m n i t r i t e 0 .3 5 g
s o d iu m n i t r a t e 0 .3 5 g
s o d iu m e r y t h o r b a t e 1 .4 2 gs a l t 6 8 .0 4 g
S e a so n in g s .®g r o u n d w h i t e p e p p e r 8 .5 0 g
g r o u n d m u s ta r d 4 .2 5 gs u c r o s e 11 3 4 g
S ta r t e r m a te r ia ls :Pediococcus cere visiae ( A C C E L )b 4 .5 0 g -Pediococcus cerevisiae ( L A C T A C E L )c — 2 3 .0 m ld e x t r o s e 3 4 .0 2 g 3 4 .0 2 g
a Q u a n t it ie s o f c u r in g a g e n ts an d se a so n in g s w e re th e sa m e fo r b o th sau sag e g ro u p s.
B A ly o p h il iz e d sta rte r c u ltu r e p ro d u c e d b y M e rck 8i C o . , R a h w a y , N .J . c A fro z e n c o n c e n t ra te s ta r te r c u ltu re p ro d u c e d b y M e rck & C o . , R a h
w a y , N .J . A c u ltu re su sp e n s io n is p re p a re d fo r in o c u la t io n b y d ilu t in g 6 o z c o n c e n t r a te w ith 1 8 o z d is t ille d w a te r .
836-JOURNAL OF FOOD SC/ENCE-Volume 39(1974)

TURKEY SAUSAGE PROPERTIES- 837
tion with a lyophilized starter culture whereas sausages of formulation II (Tabic 1) were inoculated with a frozen concentrate starter culture. In both cases, Pediococcus cerevisiae was the bacterium utilized. It should be noted that the inoculated sausage mixes do not contain the same initial concentrations of lactic bacteria per g mix (Fig. 3 and 4). The concentrations used represent lactic bacteria levels normally attained in commercial utilization of these culture forms on following the manufacturer’s directions (Everson, 1973).
The ground meats and skin were mixed in a Hobart 4346 Mixer-Grinder for approximately 2 min, followed by addition of the curing agents, seasonings, dextrose and salt. After 8 min of mixing, the starter culture was added to the sausage mix and blended for another 2 min. The initial meat temperature was approximately 5°C and increased to approximately 12°C during the 10 min of mixing. Two replicate batches for each culture form were prepared in different weeks.
Each sausage batch was stuffed into 52 mm diameter “Dry Sausage” fibrous casings (Union Carbide). The sausage sticks, each weighing approximately 480g were hung in a fermentation chamber maintained at 38°C and 95% relative humidity. Fermentation time was 24 hr for sausages inoculated with the frozen concentrate culture and 48 hr for those inoculated with the lyophilized culture. Sausage sticks were removed during each fermentation at 6 -12 hr intervals for analyses.
After fermentation, the sausages were initially heated at 66°C for 30 min. The house temperature was successively increased by 5.6°C each hour until an internal temperature of 71°C was attained. Total heating time ranged from 4 hr to 5 hr. Following the heat process, the product was sprayed with a cold water rinse for 5 min and placed in 7.5 ± 2°C drying room having 10—15 air changes/hr. The air relative humidity ranged from 88-92%. Sausages of the lyophilized culture were removed for weight loss, chemical and microbiological analyses at 0, 3, 6 and 10 days of drying. Samples of those inoculated with the frozen concentrate were removed at 2-day intervals for 12 days.
pH and lactic acid determinationDuplicate 10-g samples of meat were blend
ed for 60 sec with 100 ml quantities of distilled water in an Osterizer. The pH values of the homogenates were recorded. Sample slurries were then titrated with 0.1 N NaOH to an endpoint of pH 8.30. The meq of alkali required for titration of samples prior to fermentation were subtracted from the total meq required in titrating fermented samples to pH 8.30. The developed acidity was assumed to be due to lactic acid production. The meq of NaOH were converted to and expressed as percent lactic acid.Water-holding capacity
An extract release volume method was used as the measurement for water-holding capacity of the sausage mixes during fermentation. A procedure modified from Jay (1964) was followed. Triplicate 25-g samples of meat tempered at 4°C were finely blended with 100 ml of 4°C distilled water. Each slurry was transferred to a 100-ml funnel containing one thickness of Whatman #4 filter paper. The funnel was placed in a 100-ml graduate cylinder and the slurry allowed to filter for 30 min at 4°C. The filtrate volume that had accumulated in the
cylinder was recorded. The water-holding capacity, i.e., that volume retained, was expressed as ml bound/lOg meat.Plate counts
Counts of total viable bacteria and of lactic acid bacteria were made on sausage samples at the following stages in processing: (1) after initial mixing but prior to inoculation; (2) after inoculation of the sausage mix; (3) at the end of the respective fermentation periods; (4) after heat processing to 71° C internal; and (5) at the tenth day of drying.
Samples of lOg of meat were blended for 1 min with 90 ml quantities of 0.9% saline and subsequent decimal dilutions were prepared with the same diluent. Duplicate 1-ml samples of the appropriate dilutions were mixed with standard plate count agar (APHA, 1966) and the V-8 medium of Fabian et al. (1953). Plates were incubated at 30°C for 48-72 hr before counting.Sausage composition
Percentages of moisture, fat, protein and salt were determined for the initial sausage preparations and the products during drying. Moisture, fat, and protein were determined following AOAC (1970a) methods. The salt content, expressed as percent NaCl, was measured with QUANTAB Chloride Titrators following the procedure of the AOAC (1970b) and Vander Werf and Free (1971).Shrink and shear measurements
The percent weight loss or “shrink” of the sausage chubs was determined at 2 -3 day intervals during drying. Seven chubs from each replicate were selected after heat processing (0 day drying) for weight recordings.
For shear measurements, an Allo-Kramer Shear Press equipped with a 3000 lb ring was used with a 30 sec downstroke at range 300.
Meat slices were 9 mm thick and of variable diameter (48-42 mm) due to stage of sausage dryness. Shearing force for each slice of meat was calculated as kg/g cm2. Shear values were recorded for five slices of three sausages at each drying interval.
RESULTS & DISCUSSIONFermentation phase; pH, lactic acid and water-holding capacity
The rates of pH reduction and concurrent lactic acid production in the sausage mixes are shown in Figure 1. The longer lag phase exhibited by the lyophilized culture of Pediococcus cerevisiae, in com parison to the frozen concentrate culture, resulted in an additional 12 hr before pH5.0 was attained (Fig. 1), Everson et al.(1970) stated tha t the 12—16 hr lag of the lyophilized form prior to acid production was necessary to perm it the bacteria to absorb m oisture and return to a vegetative state. This rehydration period may be critical in production, particularly in the event the m eat m ixture contained putrefactive, gas-forming, or pathogenic organisms.
The lactic acid conten t norm ally reported for ferm ented products such as sum m er sausage, cervelat and thuringer ranges from 0 .5—1.5% (Merck, 1969). An acid concentration of 0.5% was attained at approxim ately 11 h r w ith the frozen concentrate and at approxim ately 30 hr with the lyophilized culture (Fig. 1). Additional acidity was allowed to develop
0.9
0.8
0.70.6
0.50.4
0.3
0.2
0.1
0 0
F E R M E N T A T IO N T IM E , H O U R S
Fig. 1—Rates of pH reduction and lactic acid production during fermentation o f sausage with lyophilized and frozen concentrates of Pediococcus cerevisiae.

838-JOURNAL OF FOOD SCIENCE-Volume 39 (1974)
SAUSAGE MEAT pH
Fig . 2 —C hanges in sausage m e a t w a te r -h o ld in g c a p a c ity d u r in g fe r
m e n ta t io n as a f fe c te d b y m e a t p H .
and fermentation was terminated between 0.8—0.9% acid for sausages of both types of inoculation. The terminal point of fermentation was based on lactic acid content rather than fermentation time. Some additional concentrating of acid will occur during drying as discussed later. The acidity or sharpness of flavor in fermented meats is commonly described as “tanginess” (Borgstrom, 1968; Wilson,1960). In general, the higher the level of lactic acid, the greater the degree of flavor intensity.
The meat water-holding capacity (WHC) was followed during the course of fermentation (Fig. 2). A mimmum in WHC occurred at pH 5.0, irrespective of the starter culture form used for inoculation. Hamm (1960) reported that for muscle tissue of beef and pork, the WHC minimum at pH 5.0 corresponds to the approximate isoelectric point of acto- myosin, the major contractile protein. The WHC values for the sausage mix inoculated with the lyophilized culture were slightly higher than those found for the sausages prepared with the frozen concentrate. However, this difference was probably associated with the slight variation in initial sausage composition (Table1) which altered the protein concentration between the two sausage mixes (Table 2).
The increase of WHC after pH reduction below 5.0 suggests that some protein remained functional to bind moisture and was not completely denatured by the 3 8 C temperature of fermentation. Hamm and Deatherage (1960) demonstrated with beef muscle and Acton
(1972) with poultry muscle, that mild dénaturation of protein occurs between 30 and 40°C followed by considerable dénaturation between 40 and 50 C. Hamm and Deatherage (1960) also reported that the WHC declines slightly on heating between 30 and 40 C. Wardlaw et al. (1973) found approximately 52% of the myofibrillar protein in a beef summer sausage mix still extractable after 36 hr of fermentation at 38°C. Thus, the initial decline in WHC, as shown in Figure 3, was probably the effect of both pH and the thermal dénaturation of protein whereas the increase after pH 5.0 was the result of the action of the remaining functional protein.
F ig . 3 — T o ta l v ia b le (p la te ) c o u n ts a n d la c tic
a c id b a c te r ia c o u n ts a t fiv e stages o f m e a t p r o c
essing e m p lo y in g a ly o p h il iz e d s ta r te r c u ltu re .
Bacterial changes during processingThe counts of total viable bacteria and
lactic acid bacteria found at five points during the sausage production are shown in Figures 3 and 4 for sausages inoculated with the lyophilized culture and frozen concentrate, respectively. In both cases, there were less than 101 lactic acid bacteria per g in the initial mixes while the total viable counts were 104 per g of sausage. Inoculations with the Pediococcus cerevisiae starters were at 10s per g for the lyophilized form and 106 per g for the frozen concentrate. The 1-log difference between the sausage inoculations was expected when the lyophilized and frozen cultures are used according to the m anufacturer’s directions (Everson,1973). When the inoculum concentration of Pediococcus cerevisiae is tenfold (one log) or more above the meat’s total plate count, this lactic acid bacterium will perform a satisfactory fermentation.
Analysis of the fermented sausage mixes showed a 3-log (Fig. 3) and 2-log (Fig. 4) increase with the lyophilized and frozen cultures, respectively. It should be noted that the total plate counts, after inoculation with the starters, were essentially the same as the lactic acid bacteria counts.
On attaining a final internal temperature of 71°C, the total viable counts and lactic acid bacteria counts had been reduced by approximately 5 log cycles compared to their respective counts at the end of fermentation. The bacteria levels in the heat processed sausage ranged from 103 (Fig. 4) to 101 (Fig. 3) per g meat. The 5-log cycle reduction is in agreement with the findings of Wardlaw et al., (1973) for summer sausage.
Viable bacteria counts were followed during the heat process at each 11°C interval from 38—71°C, the final internal product temperature. The results, given in Table 3, show that the greatest destruc-
F ig . 4 — T o ta l v ia b le (p la te ) c o u n ts a n d la c t ic
a c id b a c te r ia c o u n ts a t fiv e stages o f m e a t p r o c
essing e m p lo y in g a fro z e n c o n c e n tra te s ta r te r
c u ltu re .

TURKEY SAUSAGE PROPERTIES-839
T a b le 2 —C o m p o s i t i o n o f f e r m e n t e d t u r k e y s a u s a g e s d u r in g d r y in g
L y o p h i l i z e d s t a r t e r c u l t u r e F r o z e n c o n c e n t r a t e s t a r t e r c u l t u r e
S a m p leM o is tu r e
%
F a t
%
P r o te i n
%
N aC I% S a m p le
M o is tu r e%
F a t%
P r o te i n%
N a C I
%
In it ia l m ix 7 0 .2 6 .5 2 1 .1 1.1 In i t ia l m ix 6 5 .8 8 .6 2 3 .8 1 .4
D rie d :
0 d a y 6 5 .1 8 .6 2 3 .3 1 .4
D r ie d :
0 d a y 5 8 .1 8 .9 2 7 .8 1 .63 d a y 6 0 .3 1 0 .7 2 7 .6 1 .5 4 d a y 5 4 .8 1 1 .6 2 9 .6 1 .76 d a y 5 5 .0 1 1 .9 3 0 .0 1 .7 8 d a y 4 8 .2 1 3 .1 3 3 .7 2 .0
1 0 d a y 4 7 .8 1 3 .6 3 3 .9 2 .1 1 2 d a y 4 3 .8 1 4 .6 3 4 .2 2 .3
tion of bacteria occurred between 49°C and 60°C. Breed et al. (1957) states that Pediococcus cerevisiae are killed in a few minutes at 60 C. Presumably this occurs in a broth medium. The meat environment may provide some protection to complete destruction as evidenced by the viable lactic bacteria counts obtained at 71°C.
Sausage chubs examined at 10 days of drying showed no significant differences in total or lactic acid bacteria counts as compared to those immediately after heating processing. The actual counts of the sausages inoculated with the lyophilized culture (Fig. 3) were approximately one log lower than found prior to drying.
Sausage properties during dryingDuring the 10- and 12-day drying peri
ods for the turkey sausages prepared with the lyophilized and frozen cultures, respectively, the increases of fat, protein and salt contents (Table 2) were significantly (P < 0.05) correlated with the decrease in moisture level. The fermented sausages reached the semidry stage (20-25% shrink) at 10—12 days of drying. The shrinkage (weight loss) rate for turkey sausage chubs inoculated with the frozen concentrate is shown in Figure 5. Similar results were obtained for the sausage chubs from the lyophilized-inocu- lated batches. There was a significant (P < 0.05) correlation between the moisture content and degree of shrinkage (r = 0.94) occurring during the drying phase which is in agreement with previous reports (Keller et al., 1974; Wardlaw et al.,1973). Further drying would be necessary to reach the dry stage of 35—40% shrink.
The shear values found at each 4 days of drying (Fig. 5 for sausages of the frozen concentrate) were also correlated with the moisture level and shrinkage. No case hardening was observed at the surface of the sausage chubs. Taste panel analyses were not conducted; however, a number of people in our laboratory who sampled the semidry products stated that the texture and flavor of the products were “very good.” As a comparison to the average shear value of 0.23 kg/g cm2 found for the semidry turkey sausage (Fig. 5), the shear values of semidry summer sausage of previous studies (Keller et al., 1974; Wardlaw et al., 1973) range from 0.2—0.6 kg/g cm2. It should be noted that the type of meat or meat combinations, amount of fat and grinding procedure will influence shear results (Keller et al., 1974).
One noticeable product defect was surface greasiness on slices of the finished product. Even though the fat content of the sausages was low (13—15%), the fluid character of the fat at room temperature was sufficient to produce the greasy exuded film on meat slices. Use of a more saturated fat with a higher melting point might aid in preventing this problem and
T a b le 3 —B a c te r ia l c o u n t s o f f e r m e n t e d t u r k e y s a u s a g e d u r in g h e a t p ro c e s s in g 21
I n t e r n a l T e m p , ° C
B a c te r ia c o u n t s / g s a u s a g eL o g , 0 t o t a l c o u n t L o g , 0 l a c t i c c o u n t
3 8 8 .8 9 8 .7 4
4 9 8 .9 3 8 .8 0
6 0 5 .3 0 4 .3 8
71 3 .5 1 3 .3 1
a S a u sa g e m ix tu re in o c u la te d w ith a f ro z e n c o n c e n t ra te fo rm o f sta rte r c u ltu r e , P e d io c o c c u s ce re v is ia e .
0.25
§ 0.20O»\
IdOoro 0.15Lien-x:
Ido O.IO CE£QCL
¡2 0.05X10
0 .00
0 2 4 6 8 10 12 14D A Y S IN D R Y IN G
F ig . 5 —R ate s o f c h a n g e in s h e a r value a n d s h r in k a g e d u r in g d ry in g o f a
fe rm e n te d tu r k e y sausage.

840- J O U R N A L O F F O O D S C I E N C E - V o lu m e 3 9 ( 1 9 7 4 )
could probably allow a higher content of fa t to be used in the product formulation.
REFERENCESA cto n , J .C . 1 9 7 2 . E ffe c t o f heat processing on
the e x tra c ta b ility o f salt-soluble p ro te in , tis sue b inding strength and cooking loss in p o u ltry m eat loaves. J. F o o d Sci. 37: 244 .
A c to n , J .C ., W illiam s, J .G . and Johnson, M .G .1 9 7 2 . E ffe c t o f fe rm e n ta tio n tem p erature on changes in m eat properties and flavor of sum m er sausage. J. M ilk Fo od Techno l. 35: 2 64 .
A nonym ous. 1 9 7 2 . Im p ro ved cu ltu re cuts sausage p ro d u c tio n tim e . Fo od Processing 3 3 (8 ): 32.
A O A C . 1 97 0 a . “ O ffic ia l M ethods o f A nalysis ,” 1 1 th ed. A ssociation o f O ffic ia l A n a ly tica l Chemists, W ashington, D .C .
A O A C . 1 9 7 0 b . “ O ffic ia l M ethods o f A nalysis ,” 1 1 th ed. 1st Suppl. Association o f O ffic ia l A n a ly tic a l Chemists, W ashington, D .C .
A P H A . 1 9 6 6 . “ R ecom m ended M e th o d fo r the M icrob io lo g ica l E x a m in a tio n o f Fo ods ,” 2nd ed. A m erican Pub lic H ea lth Associatio n , In c ., N ew Y o rk .
Baran, W .L . and Stevenson, K .E . 1 9 7 3 . Survival o f selected pathogens during processing of fe rm ented tu rk e y sausage. Presented at the 33rd A nnu al M eeting o f the In s titu te o f Fo od Technologists, June 1 0 —1 3 , M ia m i Beach, F la.
Borgstrom , G. 1 9 6 8 . “ Principles o f Fo od Science,” V o l 2 , p. 1 2 0 . The M c M illan C o ., C o llie r-M c M illa n Canada, L td ., O n tario , Canada.
Breed, R .S ., M u rra y , E .G .D . and S m ith , N .R . 1 9 5 7 . “ Bergy’s M anual o f D ete rm ina tive B acte rio logy ,” 7 th ed. The W illiam s & W ilkins C om pany, B a ltim o re , M d .
Daw son, L .E . 1 9 7 0 . U tiliz a tio n and acceptability o f p o u ltry in processed m eat products.
In “ Proceedings 1 4 th W o rld ’s P o u ltry Science Congress,” p . 7 4 9 . M a d rid , Spain.
D eibe l, R .H . and N iven , C .F . J r. 1 9 5 7 . Pedio- coccus cerevisiae: a starter cu ltu re fo r summ er sausage. B acterio l. Proc. 1 9 5 7 : 14 (A b s tr).
D eibel, R .H ., W ilson, G .D . and N iven , C .F . Jr. 1 9 6 1 . M ic rob io lo gy o f m eat curing. 4. A ly o p h ilize d Pediococcus cerevisiae starter cu ltu re fo r fe rm en ted sausages. A p p l. M ic ro b io l. 9: 2 39 .
Everson, C .E ., D an ner, W .E . and Ham m es, P .A .1 97 0 . Im p ro ved starter cu ltu re fo r sem idry sausage. F o o d Techno l. 24: 42.
Everson, C .W . 1 9 7 3 . Personal com m u nication . M e rck C hem ical D iv ., M e rc k & C o ., In c ., R ah w a y , N .J ., Dec. 18.
Everson, C .W . 1 9 7 1 . Use o f s tarter cultures in sausage products. In “ Proceedings 1 3th A n n u al M e a t Science In s t itu te ,” E d. C arpente r, J .A . and B ro w n , D .D ., p. 1 1 . N ationa l In dependent M e at Packers Association and the U n ivers ity o f Georgia, A thens, Ga.
Fab ian , F .W ., F u ld e , R .C . and M e rr ic k , J .E . 1 9 5 3 . A new V -8 m ed ium for determ in ing lac tobac illi. F o o d Res. 18: 280 .
H am m , R . 1 9 6 0 . B iochem istry o f m eat hy d ra tio n . In “ Advances in F o o d R esearch,” Ed. Chichester, C .O ., M ra k , E .M . and S te w a rt, G .F . A cadem ic Press, N ew Y o rk .
H am m , R . and D eatherage, F .E . 1 9 6 0 . Changes in h y d ra tio n , s o lu b ility and charges o f m uscle prote ins during heating o f m eat. Fo od Res. 25: 587.
Jay, J .M . 1 9 6 4 . Release o f aqueous extracts by b ee f hom ogenates and factors a ffec tin g re lease vo lum e. F o o d Techno l. 18: 1 6 3 3 .
Jensen, L .B . 1 9 5 4 . “ M ic rob io lo gy o f M eats ,” 3rd ed. The G arrard Press, C ham paign, 111.
Jensen, L .B . and Paddock, L .S . 1 9 4 0 . Sausage trea tm e n t. U .S . P aten t 2 ,2 2 5 ,7 8 3 .
K e lle r, J .E ., S ke lley , G .C . and A c to n , J.C .1 9 7 4 . E ffe c t o f m eat partic le size and casing d iam ete r on sum m er sausage properties d u ring dry ing . J. M ilk Fo o d Techno l. ( In Press.)
K le m e n t, J .T ., Cassens, R .G . and Fennem a,
O .R . 1 9 7 3 . The association o f p ro te in solub ility w ith physical properties in a fe rm e n ted sausage. J. F o o d Sci. 38: 1 1 2 8 .
M e rck Techn ical Service B u lle tin N o . F G -9 0 0 1 .1 9 6 9 . M e rck C hem ical D iv ., M e rc k & C o ., In c ., R ah w a y , N .J .
N iin ivaara , F .P . 1 9 5 5 . The in fluence o f pure bacteria l cultures on aging and changes o f the red co lo r o f d ry sausage ( in G erm an ). S u o m e n M a a ta lo u s t ie te e l lis e n Seuran Julkaisuja N o . 8 4 , A c ta A gralia Fenn ica (H e ls in k i). Q u oted b y W ilson, G .D . 1 9 6 0 , Sausage products. In “ T h e Science o f M e at and M e at P roducts ,” E d . A m erican M eat In s titu te F o u n d atio n , p . 3 6 9 . W .H . F reem an and C o ., San Francisco.
Tow nsend, W .E . and Davis, C .E . 1 9 7 2 . E ffe c t o f hanging position on some properties o f dry sausage. J . F o o d Sci. 3 7 : 6 3 3 ,
V ander W e rf, L .J . and Free. A .H . 1 9 7 1 . C o llaborative study o f the use o f a convenient salt m easuring t i t r a t o r f o r m o n i t o r i n g salt c oncen tra tion in m eat, fish and cheese. J A O A C 54: 5 87 .
W ard law , F .B ., S k e lley , G .C ., Johnson, M .G . and A c to n , J .C . 1 9 7 3 . Changes in m eat com ponents during fe rm e n ta tio n , heat processing, and dry ing o f a sum m er sausage. J. F o o d Sci. 38: 1 2 2 8 .
W ilson, G .D . 1 9 6 0 . Sausage products. In “ The Science o f M e at and M e a t P rodu cts ,” E d. A m erican M e at In s titu te F o u n d a tio n , p. 3 4 9 . W .H . F reem an & C o ., San Francisco.
Ms received 9 /1 0 /7 3 ; revised 2 /2 6 /7 4 ; accepted 3 /5 /7 4 .___________________________________________
Technical C o n tr ib u tio n N o . 1 1 1 8 o f the South C arolina A g ricu ltu ra l E x p e rim en t S tatio n , C lem son U n ivers ity , C lem son, SC 2 9 6 3 1 .
The authors express th e ir a pprec ia tion to the M e rck C hem ical D iv . o f M e rck & C om pany , In c ., R ah w ay , N .J . fo r provid ing samples o f th e ir starter cultures, A C C E L and L A C T A C E L ; to the Film s-Packaging D iv . o f U n io n Carbide C orp ., Chicago, 111. fo r D .S . fib rous casings; and to G r if f i th Laboratories , L ith o n ia , G a. fo r spice and seasoning ingredients.

L. P. GRÜNDEN, D. V. VADEHRA and R. C. BAKER Dept, of Poultry Science, Cornell University, Ithaca, NY 14850
EFFECTS OF PROTEOLYTIC ENZYMES ON THE FUNCTIONALITY OF CHICKEN EGG ALBUMEN
INTRODUCTIONMODIFICATION of egg albumen in order to enhance its functional performance may be an approach to increasing the demand for eggs. Treatment of egg albumen with anionic additives enhanced foaming and increased angel food cake volume (Gardner, 1960; Cotterill et al.,1963). When a substantial amount of sodium dodecyl sulfate was added to egg albumen, marked changes in electrophoretic pattern, an increase in viscosity, and an increase in heat sensitivity were noted. It was also noted that angel food cake volume was unaltered and that the emulsifying properties of egg albumen were enhanced at pH 8.0 (Gandhi et al., 1973). Gandhi et al. (1968a) found that the addition of dimethylglutaric anhydride to egg albumen brought about chemical and functional changes which were time and concentration dependent. The iron-binding capacity and lysozyme activity of egg albumen were considerably reduced. At low concentrations of dimethylglutaric anhydride, angel food cake volume was not affected, but heat stability of the foam was decreased, and the electrophoretic pattern of the treated egg albumen was altered considerably. However, these researchers also found that dimethylglutaric anhydride had a protective action on the albumen against heat denaturation. Addition of potassium persulfate to egg albumen impaired the iron-binding capacity, lysozyme activity and angel food cake performance (Gandhi et al., 1968b). The electrophoretic pattern of the potassium persulfate-treated albumen was also altered. In addition to impairing the functional properties of the egg albumen, potassium persulfate produced a slightly rusty color. Low concentrations of hydrogen peroxide improved the performance of egg albumen in angel food cakes without affecting its electrophoretic pattern, lysozyme activity, and iron binding capacity (Cunningham and Cotterill, 1962; Snider and Cotterill, 1972).
Early work by Cohn and White (1935) showed little proteolysis of egg albumen treated with pepsin or trypsin; however, a preliminary treatment of the albumen with pepsin or heat facilitated the action of trypsin on the substrate. Most of the work relating to enzyme treatment of egg albumen has been concerned with identification of structural features of individual albumen proteins; such as, trypsin
digestion of ovalbumin, conalbumin and avidin (Smith and Back, 1968; Elleman and Williams, 1970; Huang and DeLange,1971). Only a limited amount of work has been done on the use of enzymes to modify structure and function of egg albumen. Sleigh et al. (1969) discovered varying crystal structures (plakalbumin) caused by some bacterial proteolytic enzymes acting on ovalbumin. Over the years patents have been granted for the use of enzymes in egg albumen processing (Balls and Swenson, 1936, 1937; Frey and Miller, 1944, 1948; Azuma, 1966). More recently, proteolytic enzymes fromA. oryzae and S. griceus were found to enhance the foaming of frozen whole egg products (Kewpie, 1970). Yasukawa(1970) found that whole egg products with emulsifying properties comparable to raw egg yolk could be formulated from papain-treated egg albumen, aqueous fat emulsions and mixtures of raw egg yolk with proteins.
The purpose of this study was to examine the effect of several crude proteolytic enzymes on the functional properties of egg albumen, as measured by angel food cake volume and foam volume and stability, and relate them to the electrophoretic changes brought about by the enzymes.
EXPERIMENTALSample preparation
Albumen was obtained from eggs (selected at random) of one strain of White Leghorn hens housed at the Cornell University Poultry Farm. Eggs were obtained within 24 hr of oviposition. The eggs were broken out and the albumen was separated from the yolk and pooled. Approximately 650 ml of albumen were blended at low speed in a Waring Blendor. During the blending process an Erlenmeyer flask was held at the albumen surface to prevent foaming. The blended albumen was passed through a single layer of cheesecloth to remove the remaining large chalazae. An enzyme powder was then added, 0.1% (w/w), to an aliquot of albumen. The mixture was stirred slowly for 10 min followed by incubation at 34° C for 18 hr.Source o f enzyme preparations and assay
The enzymes, papain (crude powder typeII), protease (from A. oryzae, crude powder type II), bromelin (from pineapple, practical grade II), and trypsin (from pancreas, crude powder type II), were obtained from Sigma Chemical Co., St. Louis, Mo. Ficin (a crude
powder) was purchased from Nutritional Biochemicals Corp., Cleveland, Ohio.
Each enzyme was assayed in duplicate by adding 5 mg of the appropriate enzyme to 5 ml of 1% casein in a tris buffer adjusted to pH 8.5. The enzyme substrate mixture was slowly agitated and placed in a 34° C water bath for 20 min. The reaction was stopped by addition of 5 ml of 24% trichloroacetic acid and the supernatant was obtained by centrifugation. Nonprotein nitrogen, as a function of proteolysis, was determined on the supernatant by the procedure of Lowry et al. (1951) and the enzyme units determined.Assay o f enzyme preparations in albumen
Following the 18-hr incubation, 5 ml of 10% trichloroacetic acid were added to Ig of the enzyme substrate mixture to stop the reaction. The supernatant was obtained and the enzyme units determined as described above.Electrophoresis
Electrophoretic behavior of the albumen proteins was observed on an E-C vertical gel apparatus (Model 490, E-C Apparatus Corp., St. Petersburg, Fla.). One part enzyme-treated albumen and four parts tris-borate buffer (pH 8.9) were mixed and 40 ;ul applied per slot on a 7.5% polyacrylamide gel. Electrophoresis was conducted at pH 8.9 at 125 ma for 4 hr. The gel was stained with 1% amido black for 2 min and then destained with a 7% acetic acid solution. Destained gels were scanned at 595 nm using a Beckman spectrophotometer.pH and functional studies
The pH of the enzyme-treated albumen was taken directly from the sample. Angel food cake performance was determined according to the procedure outlined by Slosberg et al.(1948), with some minor modifications. A 100-g aliquot of batter was weighed into each cake pan (2.25 in. x 3.25 in. x 5.50 in.), baked at 176.5°C for 27 min, cooled and their volume measured by rapeseed displacement.
For the foam volume and stability tests lOOg of the albumen (at 24 ± 2°C) were weighed into a graduated liter Griffin beaker and whipped with a Sunbeam Mix Master Model HDM-1 hand mixer at 168 rpm for 1.5 min. The beaker was rotated a quarter turn every 15 sec while the albumen was being whipped, foam volume was determined by matching the level which the foam attained with a graduation on the beaker. Foam stability was determined by allowing the foam to remain undisturbed for 20 min after whipping, then carefully transferring it to a short-stemmed funnel (143 mm in diameter), which was placed on top of a 250 ml graduated cylinder. The milliliters of liquid albumen separating from the foam were measured after 1 hr and 2 hr.
All data were subjected to analysis of variance and Duncan’s multiple range test (Steel and Torrie, 1960).
Volume 39 (1974)-JOURNAL OF FOOD SCIENCE-841

842-JOURNAL OF FOOD SCIENCE-Volume 39 (1974)
RESULTS & DISCUSSIONEnzyme assay
The effect of each proteolytic enzyme on casein at pH 8.5 and egg albumen is presented in Table 1. Compared to the proteolysis of casein there was limited proteolytic activity of the enzymes on egg albumen. This difference in enzyme activity between the two substrates can probably be attributed to the number of enzyme inhibitors present in egg albumen. It is known that ovomucoid inhibits the activity of trypsin (Lineweaver and Murray, 1947). In addition, ovoinhibitor possesses antiproteolytic activity against trypsin, chymotrypsin, fungal protease (Feeney et al., 1963; Ryan and Qary,1964), pronase (Hayenes and Feeney,1967), subtilisin (Tomimatsu et al., 1966) and elastase (Gertler and Feinstein,1971). A ficin-papain inhibitor is also present in albumen (Fossum and Whitaker, 1968), as well as another trypsin inhibitor which possesses different properties from other known trypsin inhibitors (Kanamori and Kawabata, 1968). Electrophoresis
The electrophoretic behavior of enzyme-treated albumen samples is shown in Figures 1 and 2. Since no differences
T a b le 1 —E f f e c t o f v a r io u s p r o t e o l y t i c e n z y m e s o n c a s e in a n d egg a lb u m e n
E n z y m e
E n z y m e u n i t s (X 1 0 ‘3 )a
C a s e in E g g a lb u m e n
F ic in 1 0 3 .1 I 3 .7T r y p s in 9 7 .2 1.1P a p a in 8 8 . 9 1 3 .1B ro m e lin 7 9 .0 4 .8P r o te a s e 7 4 .2 2 .3
a E n z y m e u n it s : ju m oles o f t y r o s in e re leased/- m in . E a c h v a lu e is a m ean o f th re e r e p l ic a t io n s ; e a ch re p lic a te c o n s is ts o f tw o o b s e rv a t io n s . M e a n s c o n n e c te d b y th e sa m e v e rt ic a l l in e a re n o t s ig n if ic a n t ly d if fe re n t , P < 0 .0 1 .
T a b le 2 —P e r f o r m a n c e o f e n z y m e - t r e a t e d egg a lb u m e n in a n g e l f o o d c a k e v o lu m e
C a k e v o lu m e 3
T r e a t m e n t ml*3 R a t io T / C c
S to r e d c o n t r o l 4 6 6P a p a in 4 6 7 1 .0 0
F re s h c o n t r o l 4 7 6 1 .0 2
B ro m e l in 4 8 2 1 .0 3T r y p s in 5 0 0 1 .0 7
P r o te a s e 5 0 4 1 .0 8F ic in 5 0 9 1 .0 9
a E a c h v a lu e is a m e a n o f th re e re p l ic a t io n s ;e a ch r e p l ic a te c o n s is t s o f th re e o b s e rv a t io n s .
b M e an s c o n n e c te d b y th e sa m e v e r t ic a l l in e are n o t s ig n if ic a n t ly d if fe re n t , P < 0 .0 1 .
c T / C re p re se n ts t re a tm e n t/ s to re d c o n tro l .
could be found in electrophoretic patterns of fresh egg albumen (< 24 hr) and stored control egg albumen, only the stored control is shown. Likewise, the electrophoretic pattern for ficin-treated albumen is not shown because it was similar to the papain treatment pattern. All enzyme treatments with the exception of trypsin, showed a cationic migration of the usually immobile protein. An additional peak was found between 0 and 1
cm migration distance in the ficin and protease treatments. The globulin peaks of all enzyme-treated albumen samples were altered. In the ovalbumin region changes were found for all enzyme treatments, with the possible exception of trypsin. Electrophoretic examination of the conalbumin and lysozyme fractions showed relatively little change for all enzyme treatments. As was indicated by enzyme unit values as well as electropho-
DISTANCE MIGRATED (cm)
F ig . 1 —E le c tro p h o re t ic p a tte rn s o f e n z y m e -tre a te d egg a lb u m e n a f t e r 1 8 h r o f in c u b a t io n a t 3 4 ° C.
S y m b o ls : . . . . . s to re d c o n t r o l ;___ , p a p a in tre a tm e n t ; b ro m e lin tre a tm e n t. F o r th e s to re d
c o n tro l , p e a k s a re id e n t if ie d as fo llo w s : ( 1 ! im m o b ile p r o te in (s t i l l in th e s lo t ) ; (2 ) c o n a lb u m in ; (3 )
g lo b u lin G 2; 14) g lo b u lin G 3; (5 ) o v a lb u m in A x; (6 ) o v a lb u m in A 2; (7 ) o v a lb u m in A 3 (V a d e h ra
a n d N a th , 1 9 7 3 ) .
DISTANCE MIGRATED (cm)
Fig . 2 - E le c t r o p h o r e t ic p a tte rn s o f e n z y m e -tre a te d egg a lb u m e n a f t e r 1 8 h r o f in c u b a t io n a t 3 4 ° C.
S y m b o ls : ...... , s to re d c o n t r o l ;___ , try p s in tr e a tm e n t ; p ro te a s e tre a tm e n t. F o r th e s to re d
c o n tro l , p e a k s a re id e n t if ie d as fo llo w s : (1 ) im m o b ile p r o te in (s t i l l in th e s lo t ) ; ( 2 ) c o n a lb u m in ; (3 )
g lo b u lin G 2; (4 ) g lo b u lin G 3; (5 ) o v a lb u m in A t ; (6 ) o v a lb u m in A 2; (7 ) o v a lb u m in A 3 (V a d e h ra a n d N a th , 1 9 7 3 ) .

EFFE C TS OF E N Z Y M E S O N EGG A L B U M E N -8 4 3
retie behavior, the trypsin-treated albumen showed the least amount of protein alteration. All other enzyme treatments were found to have some alteration of the immobile protein fraction, the globulins and the ovalbumins.
pH and functional studiesThe pH for the enzyme treated albu
men samples after 18 hr of incubation ranged from 6.2 (protease) to 8.4 (trypsin). It can be noted that the pH of trypsin, papain and ficin treatments did not vary significantly (P < 0.01) from the pH of the stored control (pH 8.5). However, the protease and bromelin treatments had significantly lower pH values (P C 0.01).
Performance of the enzyme-treated albumen in angel food cakes is summarized in Table 2. Cake volumes ranged from 466 ml (stored control) to 509 ml (ficin). Volumes and ratios of all enzyme treatments were comparable to or better than the stored control. Differences were also noted in the texture of angel food cakes made from control albumen and those made from enzyme treated albumen. Unlike the control cakes, the treatment cakes had a coarse and gummy texture. MacDonnell et al. (1955) made coarse textured angel food cakes using only ovalbumin. In this study, off-odors and flavors could be detected in the angel food cakes made from bromelin and protease treated albumen.
Data on the volume and stability of foam formed from enzyme-treated albumen is presented in Table 3. Foam volume ranged from 590 ml (fresh control) to 729 ml (protease). The trypsin, bromelin and protease treatments produced a significantly greater volume of foam than did the stored control (P < 0.01). All enzyme treatments had inferior foam stability when compared to both controls. Both the rate and amount of foam collapse was greater in the enzyme treated
albumen samples. The fresh control was found to have the most stable foam. MacDonnell et al. (1955) found that the globulins were the most important egg protein in stabilizing the foam. Nakamura and Sato (1964) found that the foaming activity of egg albumen was due to its protein content and they rated the proteins in the following order of importance: Fe-conalbumin, ovomucoid andlysozyme. They also gave evidence that ovomucin B stabilized the foams of egg albumen.
It is evident from the data obtained in this study that treatment of egg albumen w ith proteolytic enzymes produces changes in the electrophoretic and functional properties of albumen. In some instances, these changes were found to enhance the angel food cake volumes and foam volumes, but not foam stability. Further evaluation of the changes occurring in egg albumen and how this information may be used to further enhance functional performance is currently being investigated in this laboratory.
REFERENCESA zu m a, S. 1 9 6 6 . E n zy m a tic trea tm e n t o f egg.
U .S . P aten t 3 ,2 6 0 ,6 0 6 .Balls, A .K . and Swenson, T .L . 1 9 3 6 . E n zy m e
th inn ing o f a lbu m en. U .S . P aten t 2 ,0 5 4 ,2 1 3 . Balls, A .K . and Swenson, T .L . 1 9 3 7 . Process o f
producing th in egg w h ite . U .S . P aten t 2 ,0 7 3 ,4 1 1 .
C ohn , E .W . and W h ite , A . 1 9 3 5 . The enzym atic hydrolysis o f raw and heat-trea ted egg w h ite . J. B io l. C hem . 109 : 1 6 9 .
C o tte rill, O .J ., C unningham , F .E . and F u n k ,E .M . 1 9 6 3 . E ffe c t o f chem ical additives on y o lk -co n tam in a ted liq u id egg w h ite . P ou ltry Sci. 42: 1 0 4 9 .
C unningham , F .E . and C o tte rill, O .J. 1 9 6 2 . Factors a ffec tin g a lka line coagulation o f egg w h ite . P o u ltry Sci. 4 1 : 1 4 5 3 .
E llem an , T .C . and W illiam s, J. 1 9 7 0 . Th e am ino acid sequence o f cysteic acid-contain ing peptides fro m p e rfo rm ic acid -ox id ized ovo- tran sferrin . B iochem . J. 1 1 6 : 515 .
Feeney , R .E ., Stevens, F .C . and Osuga, D .T .1 9 6 3 . The specific ities o f chicken ovom ucoid and o v o in h ib ito r. J. B io l. C hem . 238 : 1 4 1 5 .
Fossum , K . and W h itaker, J .R . 1 9 6 8 . F i c i n and papain in h ib ito r fro m chicken egg w h ite . A rch . B iochem . B iophys. 1 25 : 3 6 7 .
T a b le 3 —P e r f o r m a n c e o f e n z y m e - t r e a t e d eg g a lb u m e n in f o a m v o l-
u m e a n d s t a b i l i t y
T r e a t m e n t
F o a m v o lu m e a F o a m s t a b i l i t y ( m l ) b
m l ' ' R a t io T / C d 1 h r 2 h r
F re s h c o n t r o l 5 9 0 0 .9 4 < 1 0 - 1 0 1 3 - 2 2
S to r e d c o n t r o l 6 3 0 2 0 - 4 9 3 5 - 6 0
P a p a in 6 6 9 1 .0 6 6 8 - 7 2 8 0 - 8 2
F ic in 6 9 4 1 .1 0 7 0 - 7 3 8 2 - 8 4
T r y p s in 7 1 5 1 .1 3 5 1 - 6 4 6 6 - 7 5
B r o m e l in 7 1 9 1 .1 4 6 4 - 7 5 7 4 - 8 4
P r o te a s e 7 2 9 1 .1 6 6 0 - 7 2 7 6 - 8 3
E a c h v a lu e is a m ean o f tw o r e p l ic a t io n s ; e a ch re p lic a te c o n s is ts o f
bth re e o b s e rv a t io n s .E a c h ran ge is d e r iv e d fro m tw o r e p l ic a t io n s ; e a ch re p lic a te c o n s is ts o fth re e o b s e rv a t io n s .
c M e an s c o n n e c te d b y th e sa m e v e r t ic a l l in e a re n o t s ig n if ic a n t ly d if f e r e n t , P < 0 .0 1 .
® T / C re p re se n ts t re a tm e n t/ s to re d c o n tro l .
F re y , C .N . and M ille r , G .E . 1 9 4 4 . P ro te o ly tic enzym e and fa tty acid ester a d d itio n to egg.U .S . P aten t 2 ,3 5 8 ,3 2 4 .
F re y , C .N . and M ille r, G .E . 1 9 4 8 . P ro te o ly tic enzym e and ester a d d itio n to egg. U .S . P aten t 2 ,4 4 7 ,0 6 3 .
G andhi, S .K ., S chu ltz , J .R ., B oughey, F .W . and Fo rsy the , R .H . 1 9 6 8 a . C hem ical m o d ific a tio n o f egg w h ite w ith 3 ,3 -d im eth y lg lu ta ric anhydride. J. F o o d Sci. 33: 1 63 .
G andhi, S .K ., S chu ltz , J .R ., B oughey, F .W . and Fo rsy the , R .H . 1 9 6 8 b . C hem ical m o d ific a t io n o f egg w h ite w ith potassium persulfate. Fo o d Techno l. 22: 1 0 1 8 .
G and h i, S .K ., S chu ltz , J .R ., B oughey, F .W . and F o rsy th e , R .H . 1 9 7 3 . U npublished observations. Q u oted in V adehra , D .V . and N a th ,K .R . 1 9 7 3 . “ Eggs As A Source o f P ro te in .” The C hem ical R u b b er C o ., C leveland, O h io . In Press.
G ardner, F .A . 1 9 6 0 . Th e ro le o f chem ical a d d itives in a lte ring the fu n c tio n a l properties o f egg w h ite . P h .D . thesis, U n ivers ity o f M is souri, C o lu m b ia , M o .
G e rtle r, A . and F e in ste in , G . 1 9 7 1 . In h ib it io n o f porc ine elastase b y tu rk e y ovom ucoid and ch icken o v o in h ib ito r. E u r. J. B iochem . 2 0: 547 .
H ayenes, R . and Feeney , R .E . 1 9 6 7 . F ra c tio n a t io n and properties o f tryp s in and chym o- tryp sin in h ib ito rs fro m lim a beans. J. B io l. C hem . 2 42 : 5 37 8 .
H uang, T .S . and D eLange, R .J . 1 9 7 1 . Egg w h ite avid in I I . Iso la tion , com position and am ino acid sequences o f the try p tic peptides. J. Biol. C hem . 2 46 : 6 86 .
K an am ori, M . and K aw ab ata , J. 1 9 6 8 . J. A gric. C hem . Soc. (Japan ) 38: 3 6 7 . Q uoted in V ad eh ra , D .V . and N a th , K .R . 1 9 7 3 . “ Eggs As A Source o f P ro te in .” Th e C hem ical R u b b er C o ., C leveland, O h io . J. Fo o d Techno l. 4 (2 ): 1 93 .
K ew p ie , K .K . 1 9 7 0 . F rozen w h o le egg p ro d ucts. Jap. P aten t 4 0 2 6 0 /7 0 .
L in e weaver, H . and M u rra y , C .W . 1 9 4 7 . Id e n t ific a tio n o f the tryp s in in h ib ito r o f egg w h ite w ith ovom ucoid . J. B io l. C hem . 171 : 5 65 .
L o w ry , O .H ., R osenbrough, N .J ., F a rr, A .L . and R an d a ll, R .J . 1 9 5 1 . P ro te in m easurem en t w ith fo lin ph en o l reagent. J. B io l. Chem . 1 9 3 : 2 65 .
M a cD o n n e ll, L .R . , Feeney , R .E ., H anson, H .L . , C am pb ell, A , and Sugihara, T .F . 1 9 5 5 . The fu n ctio n a l properties o f the egg w h ite p ro teins. Fo od Techno l. 9: 49.
N akam ura , R . and S ato , Y . 1 9 6 4 . S tudies on the foam ing p ro p erty o f chicken egg w h ite prote ins. 1 0 . O n the ro le o f ovom ucin B in egg w h ite foam iness. A gric. B io l. C hem . T o k y o 2 8: 5 24 .
R y a n , C .A . and C la ry , J.J. 1 9 6 4 . Som e reactions o f ch icken c h ym o tryp s in and tu rk ey tryp sin w ith substrates and n a tu ra lly occurring protease in h ib ito rs . A rch . B iochem . B iophys. 1 08 : 1 69 .
Sleigh, R ., H osken , R ., S m ith , M .B . and Th om pson, E .O .P . 1 9 6 9 . C hem ical characte riza tio n o f a no n-covalen tly linked peptide fro m p lak a lb u m in . A ust. J. B io l. Sci. 22: 2 39 .
Slosberg, H .M ., H anson, H .L . , S tew art, G .F . and L o w e , B. 1 9 4 8 . Factors in fluenc in g the effects o f heat trea tm e n t on the leavening po w er o f egg w h ite . P o u ltry Sci. 27: 2 9 4 .
S m ith , M .B . and B ack, J .F . 1 9 6 8 . S tudies on ovalbu m in . 4 . T ryp s in digestion and the cystine peptides o f ova lbu m in and S-ovalbu- m in . A ust. J. B io l. Sci. 21: 5 49 .
Snider, D .W . and C o tte r ill, O .J. 1 9 7 2 . H y d ro gen perox ide o x id a tio n and coagulation o f egg w h ite . J. F o o d Sci. 37: 5 58 .
S teel, R .G .D . and T o rr ie , J .H . 1 9 6 0 . “ Principles and Procedures o f S tatis tics .” M c G ra w -H ill B ook C o ., N .Y .
To m im atsu , Y . , C la ry , J.J. and B artu lov ich , J.J.1 9 6 6 . Physical charac te rization o f ovo in h ib ito r , a tryp s in and chym o tryps in in h ib ito r fro m chicken egg w h ite . A rch . B iochem . B iophys. 1 15 : 536 .
V adehra , D .V . and N a th , K .R . 1 9 7 3 . “ Eggs As A Source o f P ro te in .” Th e C hem ical R ubber C o., C leveland, O h io . J. F o o d Technol. 4 (2 ):1 93 .
Y asukaw a, H . 1 9 7 0 . L iq u e fied egg product. Jap. P aten t 9 2 1 2 /7 0 .
M s received 1 2 /1 5 /7 3 ; revised 2 /2 2 /7 4 ; accept-ed 2 / 2 7 / 7 4 . _________________________________
The authors th a n k J. D arfle r and E . M u ln ixfo r th e ir technical assistance.

R O D N E Y J. H . G R A Y , 1 M A R G A R E T A . G A S K E a n d Z . J O H N O R D A L
D e p a r tm e n ts o f F o o d S c ie n c e a n d M ic r o b io lo g y
U n iv e rs ity o f Il l in o is a t U rb a n a -C h a m p a ig n , U rb a n a , !L 6 1 8 0 1
ENUMERATION OF THERMALLY STRESSED Staphylococcus aureus MF 31
INTRODUCTION
SEVERAL METHODS and media are employed to enumerate staphylococci in foods. A direct plate count method using Baird-Parker’s Agar (BP) (Egg Yolk-Tellurite-Glycine-Pyruvate Agar) is recommended to quantitate cells where > 100 cells/g foodstuff are expected. When < 100 cells/g are anticipated, a 3-tube most probable number technique (MPN) in Trypticase Soy Broth + 10% NaCl (TSBS) is recommended (U.S. Department of Health, Education and Welfare and the Food and Drug Administration, 1972). Other procedures less commonly used include direct plating on Tellurite-Poly- mixin-Egg Yolk Agar (TPEY), on Vogel- Johnson’s Agar (VJ), and on Staphylococcus Medium #110 Agar (Staph 110) (Thatcher and Clark, 1968).
Almost all selective media used to enumerate staphylococci are somewhat inhibitory, especially for stressed cells. Staph 110 medium, due to its high sodium chloride concentration, hinders the growth of sublethally stressed staphylococci (DeWaart et al., 1968). TPEY and VJ agar, which contain relatively large amounts of tellurite have been reported to inhibit certain strains of Staphylococcus aureus (Chou and Marth, 1969; Marshall et al., 1965). Baer et al. (1971), after testing 18 plating media used for isolating staphylococci, concluded that most of them inhibited the growth of one or more strains of S. aureus. Media containing egg yolk were generally less inhibitory to staphylococci, but were usually less efficient in restricting growth of other species. Currently recognized procedures may be adequate for enumerating normal S. aureus cells in processed food, but fail to quantitate thermally stressed or recovering cells.
MATERIALS & METHODSOrganism
S. aureus MF 31 (E. Wilson, Dept, of Health, Education & Welfare, Cincinnati, Ohio), an enterotoxigenic strain isolated from cheese was used. Cultivation of the organism and preparation of frozen stocks were described by Iandolo and Ordal (1965).
Present address: D ep t, o f Fo od & N u tr itio n , U n ivers ity o f D elaw are, 2 0 6 A lison H all, N ew ark , D E 1 97 1 1
Injury and recovery procedurePreparation of the culture for injury, injury
and recovery procedures have been described previously (Iandolo and Ordal, 1965). Cells were heated at 52°C for varying periods of time prior to enumeration and recovery. To minimize settling, the suspension was slowly agitated with a magnetic stirrer. Injured cells were recovered in Trypticase Soy Broth (TSB, BBL) and in Trypticase Soy Broth + 10% NaCl (TSBS).Media and enumeration procedures
Cells diluted through 0.1% peptone water (Difco) were surface-plated in triplicate on Trypticase Soy Agar (TSA, BBL), Trypticase Soy Agar + 7.5% NaCl (TSAS), Staph 110 (BBL), VJ (Difco), BP (Difco) and TPEY (Difco). All media were prepared using recommended procedures. Plates were incubated at 37°C
for 48 hr. The MPN procedure used was that recommended by Halvorson and Ziegler (1938). Ten tubes were inoculated from each of the four appropriate dilutions used for the parallel plating studies. The media used for the MPN technique were TSB and TSBS. The inoculated tubes were examined for growth after being incubated at 37° C for 48 hr. The MPN value was obtained from a table prepared by Halvorson and Ziegler (1938).
RESULTS & DISCUSSIONWHEN THE productivities of six selective media and the MPN method in quantitating thermally stressed cells were compared, S. aureus MF 31 developed an increasing sensitivity to NaCl and to other selective media (Fig. 1). According to the
F ig . 1 - E n u m e r a t io n b y d ire c t p la t in g a n d b y th e M P N p ro c e d u re o f
th e rm a lly in ju r e d S. a u reu s M F 3 1 . C ells w e re h e a te d a t 5 2 ° C in 1 0 0
m M p h o s p h a te b u f fe r , p H 7 .2 fo r 3 5 m in a n d e n u m e ra te d , a t in te rv a ls ,
o n : a , B P ; n, S ta p h 1 1 0 ; o , T S A ; • , T S A S ; O , T P E Y ; * , V J ; a ,
M P N -T S B ; a n d A, M P N -T S B S . A H p la t in g s w e re d o n e in t r ip l ic a te ; p la te s
a n d M P N tu b es w e re in c u b a te d a t 3 7 ° C f o r 4 8 h r.
844-JOURNAL OF FOOD SCIENCE-Volume 39 (1974)

T H E R M A L L Y STRESSED S. aureus M F 3 1 - 8 4 5
TSA-TSAS assay system for injured cells (Iandolo and Ordal, 1965), the difference in TSA and TSAS counts was a measure of the injury inflicted.
All media and the MPN method were equally capable of enumerating normal cells (counts at zero min, Fig. 1). The media varied considerably in quantitating stressed cells. As heating time progressed, variations in media productivity became more pronounced, reflecting increased sensitization to the selective agents. Of the several media tested, Staph 110 was the least productive. More injured cells were able to grow on VJ and TPEY than on Staph 110; however, after 35 min heating, less than 1 out of 100 viable cells were detected on VJ and TPEY. In contrast, the productivity of BP was consistently higher than that of TSA.
A limited attempt was made to identify the component(s) of BP essential in promoting the growth of thermally injured S. aureus. Contrary to previous reports (Baird-Parker and Davenport,1965), the absence of sodium pyruvate did not impair the growth of heated cells (data not presented). The single exclusion of other major components appeared to
have no detrimental effect on the enumeration of thermally stressed cells.
The productivity of the MPN technique using noninhibitory TSB approximated that of direct plating on TSA (Fig. 1 and 2). However, fewer injured cells were detected by the MPN using TSBS at any time during heating than by any of the other selective plating media. With an increase in heating time, the ability of this MPN technique to enumerate viable cells decreased rapidly.
When thermally stressed cells were incubated in TSB, tolerance to NaCl and to other selective agents was gradually regained (Fig. 2). This confirms the findings of Iandolo and Ordal (1965). The order of productivity of the several media was the same during recovery as during injury; BP, MPN-TSB and TSA were superior to VJ, TPEY, Staph 110, and MPN-TSBS. After a 4-hr incubation in TSB, the injured cells recovered fully; plate counts on all media and MPN counts were essentially equal.
To find why the MPN in TSBS failed to enumerate thermally stressed cells adequately, injured cells were recovered in TSBS and plated on TSA and TSAS. A
parallel suspension of injured cells incubated in TSB recovered in 3 hr (Fig. 3). Cells in TSBS did not recover until after 10 hr of incubation time. During this extended lag, much of the injured population lost viability and could not be enumerated on TSA. TSBS was not lethal to the surviving (uninjured) cells (TSAS counts), but it imposed a lengthy lag. The difference in zero time TSAS counts of cells recovered in TSB and in TSBS represent the additional stress imposed by TSBS on the thermally stressed cells. When injured cells were preincubated in TSBS at 37°C before incubating in TSB at the same temperature, the recovery time varied inversely with the length of exposure to TSBS (data not presented).
The data presented here again demonstrate that selective media used for the enumeration of staphylococci vary markedly in their productivity. All of the media evaluated demonstrated that their productivity for unstressed cells equaled that of the nonselective medium (TSA). All except BP demonstrated a reduced productivity for stressed cells. Their productivity decreased as the thermal stress was increased. The BP medium, regardless
Fig . 2 - R e c o v e r y o f h e a t - in ju r e d S. au reu s M F 3 1 in T S B . C ells w e re F ig . 3 —E f f e c t o f re c o v e r in g h e a t - t re a te d S. a u reu s in T S B a n d TSB S.
h e a te d in 1 0 0 m M p h o s p h a te b u f fe r , p H 7 .2 , a t 5 2 ° C fo r 1 5 m in . C ells w e re h e a te d 1 5 m in a t 5 2 ° C in 1 0 0 m M p h o s p h a te b u f fe r , p H 7 .2
D u r in g re c o v e ry , sam p les w e re e n u m e ra te d o n : , B P ; ■, S ta p h 1 1 0 ; o, a n d re c o v e re d in T S B a n d in T S B S : o , c e ils m T S B p la te d o n T S A ; •„T S A ; • , T S A S ; O , T P E Y ; • , V J; a , M P N -T S B ; a n d * M P N -T S B S . A H cells in T S B p la te d o n T S A S ; a , ce lls in T S B S p la te d o n T S A ; cells in
p la tin g s w e re d o n e in t r ip l ic a te ; p la te s a n d M P N tu b es w e re in c u b a te d T S B S p la te d o n T S A S .
a t 3 7 ° C f o r 4 8 hr.

846-JOURNAL OF FOOD SCIENCE-Volume 39(1974)
of the stress condition or the conditions of recovery, always produced counts greater than or equal to those obtained on the nonselective medium, TSA. This is in contrast to the response of thermally stressed cells of Salm onella typh im u rium to a variety of selective media (Clark and Ordal, 1969). In this case none of the selective media was equal to the nonselective medium (TSA) in enumerating stressed cells. BP is therefore, the medium of choice when numbers greater than 100/g are to be enumerated.
The MPN procedure using TSBS as the enumeration medium gave poor estimates of the number of viable stressed cells actually present. The data obtained (Fig.3) indicate that when stressed cells are placed in TSBS many of the cells die. The cells that survive undergo an extended lag period before they can begin logarithmic growth. The effect of an additional stress (the high salt content of TSBS) to thermally stressed cells of staphylococci may explain in part the results of Ijichi et al.(1973), who demonstrated the effect of added salt and pasteurization of egg yolk
on the survival and delayed growth of staphylococci inoculated into the product.
The MPN procedure has been recommended when low numbers of staphylococci are present in the product (USD- HEW/FDA, 1972), The results presented in this communication question the value of this procedure when a product may contain stressed cells. Additional experiments are needed to evaluate the productivity of various media and procedures when the cells are stressed in the food product.
REFERENCESBaer, E .F ., G ilden , M .M . and F ra n k lin , M .K ,
1 9 7 1 . G ro w th in h ib itio n o f S taphylococcus aureus and o th er species by staphylococcal iso lation m edia. B acteriol. Proc. 1 9 7 1 : 19.
B aird -P arker, A .C . and D avenpo rt, E . 1 9 6 5 . The e ffec t o f recovery m ed ium on the isolation o f S taphylococcus aureus a fter heat tre a tm ent and a fte r the storage o f frozen or dried cells. J. A pp l. B acterio l. 28: 390 .
C lark , C .W . and O rdal, Z .J , 1 9 6 9 . Th erm al in ju ry and recovery o f Salm onella ty p h im u rium and its e ffec t on enum eration procedures. A p p l. M ic ro b io l. 18: 3 3 2 .
C hou , C .C . and M a rth , E .H . 1 9 6 9 . A com parison o f d irec t p lating and enrichm ent m eth
ods fo r d e te c tio n and enum era tion o f coagulase-positive staphylococci in frozen feeds o f an im al orig in. J. M ilk Fo o d Tech- nol. 3 2 : 3 98 .
D eW aart, J ., Mossel, D .D .A ., Ten B roeke, R . and V a n de M o o sd ijk , A . 1 9 6 8 . E n u m era tio n o f S taphylococcus aureus in foods w ith special reference to egg-yolk reaction and m annito l-negative m utants . J. A p p l. Bacte rio l. 3 1 : 276 .
Halvorson, H .O . and Z ieg ler, N .R . 1 9 3 8 . “ Q u an tita tive B ac te rio logy .” Burgess Publishing C o m p an y , M in n .
Ian d o lo , J.J. and O rdal, Z .J . 1 9 6 5 . R ep air o f therm al in ju ry o f S taphylococcus aureus. J. B acterio l. 9 1 : 1 34 .
Ijic h i, K ., G ariba ld i, J .A ., K au fm a n , V .F . , H udson , C .A . and L inew eaver, H . 1 9 7 3 . M icrob io lo gy o f a m o d ifie d procedure fo r cooling pasteurized salt y o lk . J. Fo o d Sci. 3 8: 1 24 1 .
M arshall, R .T ., N eighbors, C .D . and E d m o n d son, J .E . 1 9 6 5 . Iso la tion o f staphylococci from dried m ilk . J. M ilk F o o d Techno l. 28: 117 .
Thatcher, F .S . and C la rk , D .C . 1 9 6 8 . “ M ic ro organisms in Foods: T h e ir S ignificance and M ethods o f E n u m e ra tio n .” U n ivers ity o f T o ro n to Press, T o ro n to .
U .S . D ep t, o f H e a lth , E d u ca tio n & W elfare and Food & Drug A d m in is tra tio n . 1 9 7 2 . “ Bacte ria l A n a ly tic a l M a n u a l.”
Ms received 1 /3 /7 4 ; revised 2 /2 6 /7 4 ; accepted3 / 5 / 7 4 . _______ _______
This investigation was supported b y ResearchGrants 5 -R 0 1 -F D -0 0 0 5 2 and R 0 1 -F D -0 0 0 9 3fro m the F o o d & D rug A d m in is tra tio n , U .S .D ep t, o f H ea lth , E du ca tio n and W elfare.

W S # RESEARCH NOTES
D A N M A L L E T T , J A M E S B . K O H N E N a n d T E R R Y S U R L E S ' - 1 2
T h e Q u a k e r O a ts C o m p a n y , P .O . B o x 8 3 0 , Q u a k e r R o a d , R o c k fo rd , IL 6 1 1 0 5
A Research NoteDETERMINATION OF WATER ACTIVITY IN INTERMEDIATE
MOISTURE PET FOODS BY SOLVENT EXTRACTION
INTRODUCTIONIN RECENT YEARS, with the advent of intermediate moisture dog foods, there has been increasing interest in methods of determinating water activity in foods (Bone, 1973; Labuza, 1968). The primary problem in developing intermediate moisture foods is to keep water activity low enough to prevent growth of bacteria and other food spoilage organisms. Therefore it has been a continuing problem to measure water activity rapidly and inexpensively on products before shipment in order to determine if the products will have a sufficiently low water activity to insure stable shelf life.
There are a variety of methods for measuring water activity. The vapor pressure method is very accurate. However, the method is rather involved because special apparatus must be prepared and a careful control of experimental conditions is necessary (Robinson and Stokes, 1959). Other methods available include use of sensors by Hygrodynamics, Inc., which need considerable time to equilibrate and are poisoned by propylene glycol, and by Beckman hygrometers which may be too expensive for some operations. Therefore, it was of interest to us to attempt to adapt the solvent extraction method of Hasegawa and Sekine (1965) to intermediate moisture dog foods. Their results for salt solutions agreed well with the vapor pressure measurements of Robinson and Stokes(1959).
In this method water is extracted from an aqueous layer or substance containing
1 Present address: V a ria n In s tru m e n t D iv ., 611 Hansen W ay, Palo A lto , CA 9 4 3 0 3
2 A u th o r to w h o m correspondence and inquiries should be addressed
water into an immiscible solvent, benzene. The amount of water extracted into the benzene is proportional to the activity of water in the aqueous phase. By knowing the amount of water extracted into the benzene from pure water (Aw =1.00), a proportion can be set up:
[H2Q ]nA w ~ [H2 0 ]o
Where [H20 ] n = amount of water extracted from the pet food or electrolyte solution [H2 0 ] 0 = amount of water extracted from pure water.
EXPERIMENTALMEASUREMENTS were made on Ken-L- Ration Burger, Ken-L-Ration Cheeseburger, and Ken-L-Ration Special Cuts. About lg of sample was weighed to the nearest O.Olg and put in a 250 ml ground glass erlenmeyer flask containing 100 ml of benzene, stoppered with a
standard tapered 24/40 ground glass stopper and shook for 1 hr on a Burrell Wrist-Action shaker. Similar to Hasegawa and Sekine, we found that 1 hr was ample to insure completeness of separation. Some measurements were made after shaking 24 hr and agreed well with samples from the same batch which were shaken for only 1 hr.
A 50-ml aliquot was then taken and added to 70 ml of anhydrous methanol which had been titrated on the Karl Fisher Auto-Aqua- trator (Sargent-Welch) to neutralize any water present. The aliquot was then titrated on the Karl Fisher titrator. The measurements were carried out in a thermostated room at 25 ± 1°C. Results for water activity by this method were compared with results obtained from Hygrodynamics sensors. These were in good agreement (Table 1). To determine [H2OJo for the calculations, 10 ml of distilled water was mixed with 100 ml of benzene. A 50-ml aliquot of benzene was then titrated in the same manner as the sample solutions. Results were always in good agreement with the theoretical value of30.6 mg water per 50 ml of water-saturated benzene.
T a b le 1 —R e p r e s e n ta t i v e w a t e r a c t i v i t y v a lu e s u s in g s o lv e n t e x t r a c t i o n a n d h y g r o d y n a m ic s e n s o r m e th o d s
S a m p le
S o lv e n t e x t r a c t i o n
W a te r a c t iv i ty * S e n s o r
B u rg e r #1 0 .8 4 2 ± 0 .0 0 9 0 .8 3 3 ± 0 . 0 0 8
B u rg e r # 2 0 . 8 4 8 ± 0 .0 0 9 0 .8 5 3 ± 0 .0 0 3
B u rg e r # 3 0 .8 5 8 ± 0 .0 0 6 0 .8 5 9 ± 0 .0 1 1
C h e e s e b u r g e r #1 0 .8 5 1 ± 0 .0 0 7 0 .8 4 6 ± 0 .0 0 7
C h e e s e b u r g e r # 2 0 .8 6 9 + 0 .0 1 4 0 .8 7 0 + 0 .0 0 2
S p e c ia l C u ts # 1 0 .8 5 5 ± 0 .0 1 3 0 .8 3 5 ± 0 .0 0 4
S p e c ia l C u ts # 2 0 .8 3 5 ± 0 .0 0 8 0 . 8 4 5 ± 0 .0 1 0
P o ta s s iu m n i t r a t e 0 .9 2 3 ± 0 .0 0 7 0 .9 1 9 ± 0 .0 0 9
A m m o n iu m s u l f a t e 0 .8 0 5 ± 0 .0 0 8 0 . 8 0 3 ± 0 .0 0 4
a E a c h v a lu e r e p r e s e n t s an a v e ra g e o f t h r e e t o f iv e r u n s ± r a n g e o fr e s u l t s
Volume 39 (19741-JOURNAL OF FOOD SCIENCE—QA7

848-JOURNAL OF FOOD SCIENCE-Volume 39 (1974)
Standard solutions of potassium nitrate and ammonium sulfate were used to check our procedure. The values obtained for their water activity agreed well with accepted values.
The benzene was spectrograde quality and used without further purification. However, results deviated from accepted values after the benzene container had been opened for several days. This problem was solved by storing opened benzene over sodium hydroxide.
It was found that glassware was sufficiently dry for use if thoroughly rinsed with anhydrous methanol and dried in a 130°C oven for 1 hr.
RESULTS & D ISCUSSIO N
RESULTS between solvent extraction and Hygrodynamics sensors agreed well. There was more spread on the results obtained by solvent extraction. However, eight samples could be run within 2 hr, while it would take 8 hr for a similar run using the sensors.
One possible problem would be the effect of other soluble species in benzene on the solubility of water in benzene. This is due to the principle that other species in solution may strongly affect the solubility of a slightly soluble species, which, in this case, is water. In practice, this was no problem. A chromatograph obtained on a Hewlett-Packard 5 700 A Gas Chromatograph for the benzene solution had only a peak due to water. Surrounding air temperature and humidity is a problem. For a few days when the
laboratory air conditioner was malfunctioning, results obtained using the solvent extraction method were much higher than the sensor values.
One problem which may arise in this type of analysis is using nonhomogeneous food samples. In practice, we found that varying the size of the sample from 1 to lOg and grinding or not grinding the sample had no effect on the water activity. Sample sizes smaller than lg may not be homogeneous and were not used. However, it should be noted that some compact foods would have to be pulverized to allow the inner core to equilibrate with the benzene solution (Anon., 1973). With this method, care would have to be taken to insure that water activity of the sample would not be changed by changing the structure of the sample in the pulverizing process.
This method may not be applicable for low moisture products. In these cases, a small amount of water which is extracted may lower the sample’s water activity, since this small amount would be a significant amount of free water in the sample. In practice, this should not pose a problem, since, the amount extracted should be insignificant as compared to sample size and free water in the sample. For example, a 5-g sample of a low moisture product in 50 ml of benzene would only have 3.1 mg of water extracted if its
water activity was 0.10. However, for low moisture foods this method should be compared with existing methods to observe if it is applicable. As titration difficulties may pose a problem for low moisture foods, it may be advantageous to determine water activity using a gas chromatograph as a more sensitive technique (Anon., 1973).
As presently constituted, this method could be used by labs with Karl Fisher apparatus, but without any way to rapidly measure water activity. In this role, the solvent extraction method could be used as a check on product being sent out before the sensors reach equilibrium. This work should be extended to find if its applicability could be expanded to include other systems.
REFEREN CESA non ym ou s, 1 9 7 3 , rev iew er fo r pu b lica tio n .Bone, D . 1 9 7 3 . W ater a c tiv ity in in term ed ia te
m oisture foods. F o o d Techno l. 2 7 : 7 2 .Hasegawa, Y . and Sekine, T . 1 9 6 5 . S tudies on
liq u id —liq u id p a rtit io n systems. 2 . The d e te rm in a tio n o f w a te r a c tiv ity b y solvent e xtra c tio n techn ique . B u ll. C hem . Soc. Japan 38: 1 7 1 3 .
Labuza, T .P . 1 9 6 8 . S o rp tio n phenom ena in foods. Fo od Techno l. 22: 15 .
R obinson , R .A . and Stokes, R .H . 1 9 5 9 . “ E le c t r o ly te S o lu tio n s .” B u tte rw o rth s , L o ndo n .
Ms received 1 1 /2 5 /7 3 ; revised 2 /1 /7 4 ; accepted2 /5 /7 4 .

K A N - IC H I H A Y A K A W A
D e p t, o f F o o d S c ie n c e , R u tg e rs — T h e S ta te U n iv e rs ity o f N e w J e rs e y , N e w B ru n s w ic k , N J 0 8 9 0 3
A Research NoteIMPROVED PROCEDURES FOR MATHEMATICAL
EVALUATION OF HEAT PROCESSES
IN T R O D U C T IO N
HEAT PROCESSES have been widely utilized in the food industry as means for sterilizing food products because of their reliability and because of their economical feasibility. Mathematical procedures have been successfully applied for determining proper heat processes for about one half century since Ball (1923) developed one of his procedures. The present author (1970) developed a procedure for the accurate determination of proper heat processes. The comparison of this procedure and other published procedures (Ball and Olson, 1957; Pflug, 1968; Stumbo and Longley, 1966) were discussed in detail by Hay aka wa (1970).
Problems for the mathematical evaluation of heat processes may be divided into two types: (1) Evaluating the sterilizing effect of heat processes (type A problems) and (2) Determining the proper heat process which produces a specified sterilizing effect (type B problems). The author’s procedure stated below may be used for solving various problems of both types. Those of type B are solved iteratively when most of the available procedures are applied. Ball’s original procedure (1932) and Stumbo and Longley’s procedure (1966) solve these problems without any iterative calculations. However, these procedures are not widely applicable to various problems because of an assumption imposed on temperature history curves of food. These two methods were obtained by assuming that slope indexes of heating curves were approximately equal to those of respective cooling curves. In order to solve type B problems iteratively, an approximate heating time should be initially estimated. This initially estimated time should be as close as possible to that of a proper heat process in order to minimize iterative calculations required. However, there is no procedure published for this estimation. The present paper presents a reliable procedure for determining an approximate heating time for the first iterative calculation.
E X P E R IM E N T A L
TEMPERATURE history curves of various foods, which were obtained during their heat processings, were collected. Each curve collected was divided into two portions: One applicable to a heating phase of a process and the other applicable to a cooling phase of a process. One sterilizing value was then calculated from each portion of each curve by assuming that z = 20 F° and that z = 60 F°. These z values were selected since the former z value was a typical value for microorganisms and the latter z value for nutritional factors. From sterilizing values estimated, we computed a value of the following ratio for each temperature history curve: (sterilizing value of heating phase of a process)/(sterilizing value of a whole process).
Values of the ratio computed were carefully examined. According to this examination, these values changed greatly with changes in jc, T , , tb and z values and were not greatly affected by changes in Tw values. We observed that the larger tb and z values, the larger the values of the ratio, and the larger jc, t, and Tw values, the less the values of the ratio. The values changed widely from 0.99 to slightly less than 0.50 and their mean value was approximately equal to 0.75.
The relationship stated above was utilized to obtain formulae for determining a heating time, t^, for the first iterative calculation. Procedures for this determination are given below.
When there is no break point on a heating curve, a t{, value may be estimated as follows:
1. Calculate a value of Ub/f, r, by Eq. (1):
r = 0.75 Fp 10<2SO “ T>)/z I f (1)
2. Enter the value calculated into Table 1 of Hayakawa’s (1970) paper and find a value of g/Ks.
3. Estimate a t{, value by the following equation:
ti, = flog10 |0 Io /K s)/(g/Ks) | (2)
When there is one break point on a heating curve and when a heating phase of a thermal process terminates after this point, a t^ value may be estimated through the following steps.
1. Calculate a value of Uh/f, r, by Eq. (3):
r = 10.75 Fp 1 0 (25O - T,)/z _ ^ _ f2) | / f 2 (3 )
2. Enter the r value into Table 1 of Hayakawa’s (1970) paper, and find a value of g/Ks.
3. Estimate a tj, value by Eq. (4):
t{, = f, log, „ |(g , /Ks)/(g/Ks) | + t, (4)
R ESU LTS
SAMPLE calculations are presented below for estimating a value of t{,. Calculations required when there is no break point in a heating curve are similar to those when there is a break point on a heating curve. Therefore, sample calculations for the former case are presented below.
A proper heat process for 307 x 113 cans of King crab meat is to be determined by using the following parametric values: T0 = 80°F; T t = 228°F; Tw = 50°F; f = 35 min; j = 1.80; c = 40 min; jc = 2.00; z = 20F°; and F = 2.0 min. The z and F values are for B acillus m egatherium spores which are target microorganisms for heat processes of crab meat (Tani- kawa, 1957). The target sterilizing value for the heat process, Fp, is obtained by increasing the thermal death time by 20%, a conventional practice in the canning industry.
Fp = 2.0 + (0.2 x 2.0) = 2.4 min
1. A value of r is obtained by Eq. (1):
r = 0.75 x 2.4 x 10(25° ~ 228)/20 /3 5 S 0.691
2. A value of g/Ks is obtained by entering this r value into Table 1 (Hayakawa, 1970):
g/Ks = 1.063 (F°)
3. An approximate value of tb is obtained by Eq. (2):
tb = 35 log! o (1.80 x 148/1.0)/1.063 ss 84.0 (min)
Note that Ks = z/20 = 20/20 = 1.0
Volume 39 (19741-JOURNAL OF FOOD SCIENCE-849

850-JOURNAL OF FOOD SCIENCE-Volume 39(1974)
We assume 85 min as the first approxim ate value of heating tim e, t{,, and calculate an Fp value by the above procedure. An estim ated Fp value is 2.39 min, which is slightly less than the target Fp value. Therefore, we assume 90 min as the second approxim ate value t{,. A nother F p value is 2.73 min. A proper heating tim e, tb , is obtained by interpolating the two F p values estim ated: tj, = 85.1 min.
DISCUSSIO N & C O N C LU SIO N
THE DEVELOPED procedures were used to solve various type B problems. Two iterations were sufficient for solving most of these problems. On the other hand, three or more iterative calculations were frequently required when similar problems were solved w ithout using the developed procedure. Therefore, the developed procedure reduces iterative calculations for solving type B problem s at least by one-third.
We can easily obtain formulae for calculating a tj, value when there is more than one break point in a heating curve by generalizing Eq. (3 ) and (4). For example, we obtain the following equations (5 and 6) which are applicable to cases when there are (n —1) break points on a heating curve.
r = 10.75 Fp 10(2S0 - T i>/Z - r , f , S ' (n - r ^ f t+ r n - 1 f n | f in ( S )
t{, = fn logio | (gn-1 /K s)/(g/K s) | + tn _ i (6)
Com putational steps required for using Eq. (5) and (6) are similar to those given previously.
Sterilizing values of heating phase, Fph, for various therm al processes may be analytically calculated by using an exponential integral function. For example, Eq. (7 ) estimates an Fp i, value when there is no break point in a heating curve (Ball and Olson, 1957):
Fph = in f o ' 10(T‘ “ 25° )/Z [El j ( l n l 0 ) g / z j
— E, ( ln lO ) • j l0 / z |]
This equation may be used to estim ate a g value as follows:
g = E , - 1 [0.75 Fp • 1- 3 ^ • 10(25° - T . ) / z
+ E, { (lnlO ) • jl0/z |] (8)
A value of t{, may be estim ated from a g value calculated by Eq. (8). However, the use of this equation requires considerably more com putations when it is com pared with the procedure described previously.
In conclusion, new procedures are presented for determining an approxim ate heating time. These procedures will be of great use in solving type B problem s for the m athem atical evaluation of therm al processes.
N O M E N C LA TU R E
c = slope index of cooling curve (min)E,(x) = / “ e'Vt dt an exponential integral.
E, (y) Inverse function of E, (x) • y = / “ e_t/t dt.F Thermal death time of target microorganisms (min).Fp Sterilizing value of whole heat process (min).Fph Sterilizing value of heating phase of heat process (min).f Slope index of heating curve. This symbol is used when there
is no break point on a heating curve (min).
fnSlope indexes of first, second ith and nth line or line segments of a heating curve, respectively (min).
g Temperature difference between food and heating medium,determined at the end of the heating phase (F°).
g, > gbg i_ ,,gn -iTemperature differences between food and heating medium applicable to first, ith, (i-l)s t, and (n -l)s t break points on heating curve, respectively (F°).
I0 = T, - T 0(F°).j, jc Intercept coefficients of heating and cooling curves, respec
tively (dimensionless).Ks = z/20 (dimensionless),n Arbitrary integer (dimensionless),r Value of Uh/f applicable to g/Ks (dimensior.less).
r . ’ ri> ri - i > rn - iValue of Uh/f applicable to g,/Ks, gj/Ks, g j_1/Ks, and gn_ , /Ks, respectively (dimensionless).
T Food temperature (°F).T0 Initial temperature of food (°F).T, Holding temperature of heating medium during heating phase
(° F).Tw Temperature of cooling medium (°F’)_t Heating time (mm),tb Length of heating phase (min).tf, Estimated tb value which is to be used for iterative solution
of type B problem.t , , tn _ , Heating times at which the first and (n -i)s t break points
appear on a heating curve, respectively (min).Uh Sterilizing value of heating phase of thermal process. The
reference temperature of this value is a holding temperature of heating medium (min).
x, y Dummy variable.z Slope index of thermal death time curve (F°).
REFEREN CES
Ball, C .O . 1 9 2 3 . Th erm al process tim e fo r canned foo d . N a tio n a l R e search C oun cil B u ll. 7 —1 (3 7 ) .
Ball, C .O . and Olson, F .C .W . 1 9 5 7 . “ S te riliza tio n in F o o d T e c h n o lo g y .“ M c G ra w -H ill B ook C o., N ew Y o rk .
H ayakaw a, K . 1 9 7 0 . E xp erim en ta l fo rm ulae fo r accurate estim ation o f fo o d tem p eratu re and th e ir app lication to th e rm a l process evaluatio n . Fo od Techno l. 2 4 (1 2 ): 1 40 7 .
Pflug, I J . 1 9 6 8 . Evaluating the le th a lity o f heat processes using a m e th od em p loy in g H ic k ’s tab le . Fo od Techno l. 22: 1 1 5 3 .
S tum bo , C .R . and Longley , R .E . 1 9 6 6 . N e w param eters fo r process calcu lation . Fo od Techno l. 20: 3 41 .
T an ikaw a , E . 1 9 5 7 . “ P rodu ction o f Canned F o o d .’’ K igenshya Publishing C o., T o k y o , Japan (in Japanese).
M s received 9 /2 7 /7 3 ; accepted 3 /1 3 /7 4 .A. paper o f the Journal Series, N ew Jersey A g ricu ltu ra l E x p e rim en t
S ta tion , C ook College, Rutgers U n ivers ity—The S tate U n ivers ity o f N ew Jersey, D ep t, o f F o o d Science, N ew B runsw ick, N J 0 8 9 0 3 .

R . A F I E L D a n d M . L . R I L E Y
D iv . o f A n im a l S c ie n c e , U n iv e rs ity o f W y o m in g , L a ra m ie , W Y 8 2 0 7 1
A Research Note CHARACTERISTICS OF
IN T R O D U C T IO N
MANY RED MEAT CUTS, including some cuts of lamb, are in great demand at the retail meat counter. Other cuts, such as lamb breasts have very little sales appeal. Retailers in some parts of the country discard lamb breasts along with bone and fat trimmings rather than attempt to merchandize them. Discarding the breast and flank, which make up 15% of the lamb carcass (Field, 1962), becomes an important economic consideration and it is one reason why some retailers refuse to carry lamb.
Lamb breasts are vulnerable to high labor costs because boneless lamb breasts sell at a lower price than most other boneless red meat. In addition the amount of labor required per unit of meat obtained is greater. Therefore, it has not been economical to remove lamb breasts and flanks in the packing house and bone them for use in processed meat. Recent engineering advancements have made it possible to obtain mechanically deboned meat from lamb breasts. The process is similar to that used for mechanically deboned poultry (Food Engineering, 1970). Mechanically deboned poultry and fish products are becoming increasingly popular and a limited amount of research on these item s is available (Grunden et ah, 1972; Dimick et al., 1972; Crawford et al., 1972; MacNeil et al, 1973; Froning et al., 1971). Little research on mechanically deboned red meat has been published.
This study was undertaken to characterize the chemical and physical properties of meat from mechanically deboned lamb breasts and to compare these properties with properties of meat from hand-boned lamb breasts. Mechanical removal of meat from lamb breasts could increase the amount of saleable protein from the lamb carcass and make removal of lamb breasts and flanks at the packer level practica l. This in turn would make the remaining portion of the carcass more attractive to retailers and purveyors.
E X P E R IM E N T A L
CHOICE AND PRIME whitefaced lambs 9-12 months old furnished the breasts used in this study. Carcasses weighing 25—30 kg were cut according to the procedure of Kemp (1952)
MEAT FROM MECHANICALLY DEBONED LAMB BREASTS
after they had aged approximately 1 wk at 0°C. The untrimmed breasts, minus flanks and briskets, were used to study differences between meat from hand- versus machine-boned lamb breasts. Each of the seven 45 kg lots of breasts were deboned on different days to allow time for data collection. 20% of the breasts in each lot were randomly selected for physical separation by hand. To obtain percent bone in the hand-boned breasts, total bone weight from the hand-boned breasts was divided by total weight of the breasts prior to physical separation. Lean and fat from the hand-boned breasts from each lot were ground, mixed, and subsamples (approx 3 kg) were homogenized prior to chemical and microbiological analysis.
The remaining breasts from each lot were ground through a 1.9 cm plate of a bone grinder. The ground breasts were mixed in a commercial food mixer prior to mechanical deboning using an AUX 70 Beehive deboner with 0.635 mm diam holes in the cylinder.
Subsamples from each of the seven lots of mechanically deboned meat were also homogenized prior to analysis. Care was taken to keep the meat from hand-boned and machine-boned breasts at the same temperature throughout all procedures so that bacterial counts would be comparable. During machine boning and physical separation of the bone, meat from both boning methods had a similar temperature rise. Equipment which came in contact with the hand- and machine-boned meat was cleaned with a commercial sanitizing agent to insure that bacterial counts would not be affected by variable counts on the equipment.
Boneless composite samples from each lot of lamb breasts were analyzed for fat, protein, moisture and ash by standard AOAC methods(1970). Calcium, used as an indicator of the amount of bone in the meat, was determined by atomic absorption spectrophotometry as
outlined by the Perkin-EImer Corp. (1964). Hydroxyproline was determined according to the method of Woessner (1961). Total bacterial counts were determined as outlined by Ocker- man (1970).
R ESU LTS & D ISCUSSIO N
CHOICE AND PRIME lamb breasts used in this study contained an average of 9.98% bone and cartilage when they were physically separated by hand (Table 1). Tightening of the ring valve of the mechanical deboner will result in less than 21.26% discard. However, increased yields are accompanied by higher calcium percentages and higher temperatures in the mechanically deboned meat (Field et al., 1974a). Temperature of the breasts used in this study averaged 0°C prior to grinding, 3°C after grinding and 14°C after mechanical deboning. To prevent increased temperatures, the mechanical deboner used in this study was set to give an average yield of 78.7%.
Number of bacteria per g of meat was similar for hand- and machine-boned meat. Lower total bacterial counts could be obtained if lamb breasts were removed from the carcasses and deboned soon after slaughter instead of allowing the carcasses to age for 1 wk as was done in this study.
Percent fat, protein and dry matter were similar in meat from hand- and machine-boned lamb breasts. Higher protein levels and lower fat and dry matter levels than those shown in Table 1
T a b le 1 —Y ie ld , c o m p o s i t i o n , a n d b a c t e r ia l c o n t e n t o f m e a t f r o m h a n d a n d m a c h in e b o n e d la m b b r e a s t s
I t e m
H a n db o n e d
M a c h in e
b o n e dS t a n d a r d
e r r o r F - v a lu e a
B o n e d i s c a r d e d , % 9 .9 8 2 1 .2 6 2 .0 3 1 5 .3 9Y ie ld , % 9 0 .0 2 7 8 .7 4 2 .0 3 1 5 .3 9F a t , % 3 8 .0 6 3 6 .5 0 3 .4 9 0 .1 0P r o te i n , % 1 5 .4 6 1 4 .9 7 1 .2 8 0 .4 0D ry m a t t e r , % 5 4 .3 4 5 2 .6 8 2 .7 9 0 .1 8A sh , % 0 .9 8 1 .21 0 .0 8 4 .9 3C a lc iu m , % 0 .0 2 0 .1 0 0 .0 1 2 0 .7 9H y d r o x y p r o l in e , % 0 .2 6 0 .1 8 0 .0 1 2 0 .3 6B a c te r ia /g o f m e a t 6 8 0 4 9 0 6 4 5 9 5 0 1 5 5 6 6 0 0 .0 2
a F 'V a lu e > 5 .9 9 s ig n if ic a n t a t th e 0 .0 5 le ve l. F -v a lu e > 1 3 .7 4 signifi c a n t a t th e 0 .0 1 le ve l.
Volume 39 (1974)-JOURNAL OF FOOD SCIENCE-851

852-JOURNAL OF FOOD SCIENCE-Volume 39 (1974)
could be obtained by using whole lamb breasts from leaner lambs. Most of the lambs used in this study contained 7—8 mm of fat over the longissimus muscle at the 12th rib. Trimming some of the exterior fat from lamb breasts prior to mechanical deboning would also increase protein content of the mechanically deboned breasts and make the lean more acceptable for use in processed meat. A third possibility for increasing the protein content of mechanically deboned lamb breasts would be to incorporate a high protein meat extender.
Percent ash and calcium were slightly higher in mechanically deboned meat (Table 1). Field et al. (1974b) indicated that bone particles responsible for increased ash and calcium were so small that they were not objectionable from a palatability standpoint when deboning procedures similar to those used in this study were followed. In addition, microscopic bone particles are easily broken down in the weak solutions of hydrochloric acid which are found in the stomach (Johnson et al., 1970; Guyton,1971). Forbes et al. (1921) and Mitchell et al. (1937) were some of the first to report that retention of calcium from bone sources was high. The additional calcium in mechanically deboned meat may be nutritionally beneficial since many of the 138 articles reviewed by Walker (1972) point to calcium deficiencies in the human diet.
Hydroxyproline content of mechanically deboned meat was lower than hydroxyproline content of hand-boned breasts. This finding also indicates that machine deboning increases the nutritional value of lamb breasts. A close negative relationship exists between net protein utilization and the amount of hydroxyproline in meat (Dvorak, 1972).
R EFEREN CES
A O A C , 1 9 7 0 , “ O ffic ia l M ethods o f A nalysis,” 1 1 th ed, p. 3 46 . A ssociation o f O ffic ia l A g ricu ltu ra l Chem ists, W ashington , D .C .
C raw fo rd , D .L ., L o w . D .K . and B ab b itt, J .K ,1 9 7 2 . Y ie ld and accep tab ility o f m achine separated m inced flesh fro m some m arine foo d fish. J. Fo od Sci. 37: 5 51 .
D im ic k , P .S ., M a cN e il, J .H . and G runden , L .P .1 9 7 2 . P o u ltry p rod uc t q u a lity . C arbonyl com position and organo leptic evaluation o f m echanically deboned p o u ltry m eat. J. Fo od Sci. 37: 5 44 .
D vo rak , Z . 1 9 7 2 . The use o f h y d ro x y p ro lin e analyses to p red ic t the n u tritio n a l value o f the p ro te in in d iffe re n t an im al tissues. Br. J. N u tr . 2 7 : 475 .
F ie ld , R .A . 1 9 6 2 . Carcass evaluation o f lam bs fro m selected crosses. P h .D . d issertation, U nivers ity o f K e n tu c k y , L ex in g to n .
F ie ld , R .A ., R ile y , M .L . and C orbridge, M .H . 1 974a . In flu e n c e o f y ie ld on calcium co n ten t o f m echan ically deboned lam b and m u tto n . J. F o o d Sci. 39: 2 8 5 . In Press.
F ie ld , R .A .. R ile y , M L . and C orbridge, M .H . 1 9 7 4 b . C haracterization o f m echan ically deboned h o t and cold m u tto n carcasses. J. F o o d Sci. 39: 2 8 2 .
Fo o d Engineering. 1 9 7 0 . D eboning system boosts y ie ld . Fo o d Engr. 42: 7 8 .
Forbes, E .B ., Halverson, J .O ., M organ, L .E . and Schulz, J .A . 1 9 2 1 . Th e m etabo lism o f calc ium com pounds by grow ing swine. O h io A gr. E x p . Sta. B u ll. 4 3 7 .
Fron ing , G .W ., A rn o ld , R .G ., M andigo , R .W ., N e th , C .E . and H artu n g , T .E . 1 9 7 1 . Q u ality and storage s tab ility o f fra n k fu rte rs c o n ta in ing 15% m echan ically deboned tu rk e y m eat. J. F o o d Sci. 36: 9 7 4 .
G runden , L .P ., M a cN e il, J .H . and D im ic k , P .S .1 9 7 2 . P o u ltry p rod uc t q u a lity : C hem ical and physical characteristics o f m echan ically deboned p o u ltry m eat. J. F o o d Sci. 37: 2 47 .
G u yto n , A .C . 1 9 7 1 . “ T e x tb o o k o f M ed ica l P hysio logy ,” 4 th ed. W .B . Saunders C o ., Philadelph ia.
Johnson, A .R ., A rm stro ng , W .D . and S inger, L .1 9 7 0 . The s o lu b ility o f the m inera l phase in the ra t o f pow dered bone and d en tine laden w ith s tro n tiu m . Archs O ra l B io l. 1 5 : 4 0 1 .
K em p , J .D . 1 9 5 2 . M e th o d o f c u ttin g lam b carcasses. Proc. 5 th A n n . R ec ip . M e at C o n f., p. 89.
M a cN e il, J .H ., D im ic k , P .S . and M ast, M .G .1 97 3 . Use o f chem ical com pounds and a rosem ary spice e x tra c t in q u a lity m ain te nance o f deboned p o u ltry m eat. J. Food Sci. 38: 108 0 .
M itc h e ll, H .H ., C arro l, W .E ., H a m ilto n , T .S ., Garrigus, W .P. and H u n t, G .E . 1 9 3 7 . C alc ium and phosphorus supplem ents fo r grow ing swine. U n iv . 111. A gr. E x p . S ta. B u ll. 4 3 4 .
O ckerm an, H .W . 1 9 7 0 . “ Q u a lity C o n tro l o f P ost-m ortem M uscle Tissue,” 4 th ed, p. 4 1 0 . The O h io State U n ivers ity , C olum bus.
P erk in -E lm er C orp. 1 9 6 4 . “ A n a ly tic a l M ethods fo r A to m ic A bsorp tio n S p e c tro p h o to m e try ,” N o rw a lk , C o n n ec ticu t.
W alker, A .R .P . 1 9 7 2 . Th e hum an req u irem en t o f calcium : S hould lo w in takes be supplem ented? A m e r. J . C lin . N u tr it io n 25: 5 1 8 .
Woessner, J .F . 1 9 6 1 . The d e te rm in a tio n o f h y d ro x y p ro lin e in tissue and p ro te in samples contain ing such p ro p o rtio n s o f th is im in o acid. A rch . B iochem . B iophys. 93: 440 .
Ms received 1 /2 1 /7 4 ; accepted 2 /5 /7 4 .
U n ivers ity o f W yom in g A g ric u ltu ra l E x p e rim en t S ta tio n Journal A rtic le N o . 6 4 0 . S u p p o rted in part by funds fro m the A m erican SheepProducers C ouncil, D enver, C olorado .

E. A. CHILDS' andJ. N. GAFFKE Oregon State University, Seafoods Laboratory, Astoria, OR 97103
A Research NoteLEAD AND CADMIUM CONTENT OF SELECTED OREGON GROUNDFISH
IN T R O D U C T IO N
MUCH CONCERN has been recently expressed concerning the trace metal content of foods with particular emphasis on seafoods. Numerous investigators have evaluated the mercury content of seafoods in Sweden (Ackefors, 1971), Canada (Zitko et al., 1971), and the United States (Childs and Gaffke, 1973).
The Pb and Cd content of seafoods has not been as rigorously investigated. Reynolds and Reynolds (1971) found the Cd content of English crab to be < 0.15 ppm in white and claw meat but generally >2.0 ppm in dark body meats. In studies of tuna and other species in New South Wales, all tuna and most other species contained < 0.2 ppm Cd (Taylor, 1971). In freshwater studies, the majority of samples from New York lakes contained < 0.02 ppm Cd (Lovett et al., 1972) and from Canadian freshwater lakes < 0.06 ppm Cd.
Seafoods would appear to contain more Pb than Cd. In New South Wales studies, most fish contained < 1.5 ppm Pb but > 4% contained > 3 .0 ppm (Taylor, 1971). In New York freshwater studies, the majority of samples contained <1.0 ppm Pb and very few contained > 2.0 ppm Pb (Pakkala et al., 1972). Canadian freshwater studies indicated < 0 .5 ppm Pb in all samples.
This experimental study was undertaken to systematically determine the Pb and Cd content of selected Oregon groundfish.
M A T E R IA L S & M E TH O D S
Sam plingSamples of whole groundfish were obtained
one day post-catch from commercial fishing processors. The fish were filleted and the fillets stored in evacuated moisture-vapor proof film at -40°C until analysis.D rying and ashing o f sam p les
Fillets were finely chopped and then thoroughly mixed to give a homogeneous sample. A 25-g aliquot weighed to ± 0.1 mg was placed in a 150 ml pyrex beaker and the beaker placed in a cold muffle furnace. Samples were ashed by a modification of the procedure of Gajan and
1 Present address: D ep t, o f Fo od Tech n o logy & Science, U n ivers ity o f Tennessee, K n o x v ille , T N 3 7 9 1 6
Larry (1972). The temperature of the furnace was held at 250°C for 2 hr to dry the sample. The temperature was then raised by 50° increments every 30 min to 350°C and held for 1 hr or until smoking ceased. The sample was then brought to 400°C for 1 hr, 450°C for 30 min, and finally to 500° overnight. The partially ashed samples were cooled and 2.0 ml of concentrated HN03 added. The HN03 was evaporated over low heat and the sample returned to a cold muffle furnace. The temperature of the furnace was brought to 200° C for 30 min, then increased in 50° increments at 30-min intervals to 500°C, and held at 500°C for 4 hr. The samples were again cooled, 2.0 ml of concentrated HN03 added, the HN03 evaporated over low heat, and the sample brought to 500°C and held overnight. This procedure consistently yielded a high quality white-ash.E xtraction o f Pb and C d from the ash
5.0 ml of 1.0 N HC1 were added to the ashed material in the beaker and heated to dissolve the ash. The HC1 ash solution was quantitatively transferred to a 25 ml volumetric flask and brought to volume with additional 1 Nh q .
M easurem ent o f Pb and CdThe amount of Pb and Cd present in the
solubilized ash was measured by atomic absorption spectrophotometry following extraction of the metals into 2-pentanone as previously described (Childs and Gaffke, 1974 a,b). Recovery of spikes from samples was consistently > 95%.
R ESU LTS & D ISCU SSIO N
PbThe Pb content of Oregon groundfish
was in most cases < 0.20 ppm (Table 1).
Rex sole contained more Pb than other species with samples from the northern coast having a mean of 0.229 ppm and southern coast samples a mean of 0.114 ppm.
The sole species were generally higher than other species but the low values found for some samples of sand sole, petrale sole and English sole prevent generalization based on phylogeny.
The mean Pb content of northern coast fish was 0.10 ppm vs. 0.07 ppm for southern coast fish. This difference did not apply to all species since English sole samples from the southern coast had a higher Pb content than northern coast samples.Cd
The Cd content of most Oregon groundfish was < 0.10 ppm (Table 2). The exception was lingcod samples from the northern coast which had a mean Cd content of 0.224 ppm. There was very little variation in the Cd content of various species. In southern coast samples, the range was 0.008—0.014 ppm and in the northern coast samples 0.007—0.088 ppm, if the lingcod samples are excluded.
In general, it would appear that Oregon groundfish contain very little Pb (< 0.20 ppm) and Cd (< 0.10 ppm). Both the Cd and Pb levels were somewhat less than those published for the New South Wales fishery (Taylor, 1971). The data obtained in both studies were in the lower sensitivity ranges of the methodology
T a b le 1 —L e a d c o n t e n t o f s e le c te d s p e c ie s o f O r e g o n g r o u n d f i s h . A ll d a t a a r e p g P b /g f is h m u s c l e (w e t w e ig h t ) ± s t a n d a r d e r r o r o f t h e m e a n
S o u t h e r n C o a s t N o r t h e r n C o a s t
S p e c ie s
N u m b e r o f
s a m p le s P b S p e c ie s
N u m b e r o f
s a m p le s P b
R e x s o le 12 0 .1 1 4 ± 0 .0 2 3 R e x s o le 2 0 0 .2 2 9 ± 0 .0 1 9
E n g l is h s o le 1 2 0 .1 3 0 ± 0 .0 4 2 E n g lish s o le 2 0 0 .0 3 3 ± 0 .0 0 4
D o v e r s o le 1 2 0 .0 7 5 ± 0 .0 2 9 D o v e r s o le 2 0 0 .1 0 5 ± 0 .0 1 0
P e t r a le s o le 1 2 0 .0 4 4 ± 0 .0 0 4 P e t r a le s o le 2 0 0 .0 9 1 ± 0 .0 0 9
O ra n g e r o c k f i s h 1 2 0 .0 9 2 ± 0 .0 5 2 O ra n g e ro c k f is h 1 4 0 .0 6 9 ± 0 .0 0 5
L in g c o d 1 2 0 .0 3 6 ± 0 .0 1 2 L in g c o d 1 0 0 .0 7 0 ± 0 .0 0 7
H a k e 1 2 0 .0 4 4 ± 0 .0 0 9
S ta r r y f l o u n d e r 1 2 0 .0 4 8 ± 0 .0 0 4
S a n d s o le 12 0 .0 4 7 ± 0 .0 1 4
Volume 39 ( 1974)—JOURNAL OF FOOD SCIENCE- 853

854- JOURNAL OF FOOD SCIENCE- Volume 39 ( 1974)
T a b le 2 —C a d m iu m c o n t e n t o f s e le c te d s p e c ie s o f O re g o n g r o u n d f i s h . A ll d a t a a re Mg C d /g
f is h m u s c l e ( w e t w e ig h t ) ± s t a n d a r d e r r o r o f t h e m e a n
S o u t h e r n C o a s t N o r t h e r n C o a s t
S p e c ie s
N u m b e r o f
s a m p le s C d S p e c ie s
N u m b e r o f
s a m p le s C d
R e x s o le 12 0 .0 1 2 ± 0 .0 0 1 R e x s o le 2 0 0 .0 2 6 ± 0 .0 0 7
E n g lish s o le 12 0 .0 1 3 + 0 .0 0 1 E n g lish so le 2 0 0 .0 0 7 ± 0 .0 0 1
D o v e r s o le 1 2 0 .0 1 4 ± 0 .0 0 3 D o v e r s o le 2 0 0 .0 1 1 ± 0 .0 0 1
P e t r a le s o le 12 0 .0 1 2 ± 0 .0 0 2 P e t r a le s o le 2 0 0 .0 0 8 ± 0 .0 0 1
O ra n g e r o c k f is h 12 0 .0 1 4 ± 0 .0 0 3 O ra n g e r o c k f i s h 14 0 .0 8 8 ± 0 .0 1 5
L in g c o d 12 0 .0 0 9 ± 0 .0 0 2 L in g c o d 1 0 0 .2 2 4 ± 0 .0 1 2
H a k e 12 0 .0 1 4 ± 0 .0 0 2S ta r r y f l o u n d e r 12 0 .0 0 8 ± 0 .0 0 2
S a n d s o le 12 0 .0 1 4 + 0 .0 0 3
employed. This makes it difficult to separate analytical variation from biological variation.
These data were also in the general range of Pb and Cd reported for canned fruits and vegetables (Thomas et ah,1973). This indicates that Oregon ground- fish would not provide a large proportion of the Cd or Pb content of the diet.
It should be remembered that these experiments have been concerned with a limited number of samples; however, the fact that most samples were quite low in
Pb and Cd makes the probability of finding high concentrations of Pb and Cd in Oregon groundfish muscle unlikely.
REFERENCES
A ckefors , H . 1 9 7 1 . I I I . E ffects o f particu lar po llu tan ts. M e rcu ry p o llu tio n in Sweden w ith special reference to cond itions in the w a te r hab ita t. Proc. R o y . Soc. L o n d . B. B io l. Sci. 177 : 3 65 .
Childs, E .A . and G a ffk e , J .N . 1 9 7 3 . M ercury conten t o f Oregon groundfish. F ish . Bull. 71: 7 1 3 .
Childs, E .A . and G a ffk e , J .N . 1 9 7 4 a . Solvent e x tra c tio n o f Pb and Cd fo r a tom ic absorpt io n spec trop hoto m etry . J A O A C 57: 360 .
Childs, E .A . and G a ffk e , J .N . 1 9 7 4 b . Possible in terference in the m easurem ent o f Pb and Cd by elem ents fo u n d in fish m uscle. J A O A C 57: 3 65 .
G ajan, R .J . and L a rry , D . 1 9 7 2 . D e te rm in a tio n o f lead in fish by a tom ic absorption spectrop h o to m e try and by po larography. I . D eve lop m en t o f m eth o d . Jr. Assoc. O ff . A na l. C hem . 55: 7 27 .
L o v e tt, R .J ., G u tten m an n , W .H ., P akka la , I.S ., Youngs, W .D ., L isk , D .J ., B urd ick , G .E . and H arris , E .J . 1 9 7 2 . A survey o f the to ta l cadm iu m c o n te n t o f 4 0 6 fish fro m 4 9 N ew Y o rk state fresh w aters. J. F ish. Res. Bd. Can. 29: 1 2 8 3 .
P akkala , I.S ., W h ite , M .N ., B urd ick , G .E ., H a rris, E .J . and L isk , D .J . 1 9 7 2 . A survey o f the Pb c o n t e n t o f fish fro m 4 9 N ew Y o rk state waters. Pesticides M o n ito rin g J. 5: 3 4 8 .
R eynolds, C .V . and R eyno lds, E .B . 1 9 7 1 . C adm iu m in crabs and crabm eat. J. Assoc. Pub. A nal. 9: 1 1 2 .
T a y lo r, D .J . 1 9 7 1 . R e p o rt on a survey o f fish products fo r m eta llic c o n ta m in a tio n un dertaken in S. W . E ng land and S. Wales during early 1 9 7 1 . J. Assoc. Pub. A nal. 9 : 76 .
Thom as, B ., R oughan, J .A . and W atters , E .D .1 9 7 3 . Lead and cadm ium co n ten t o f some canned f r u it and vegetables. J . Sci. F d . Agric. 2 4 : 4 4 7 .
Z itk o , V . , F in layson , B .J., W ild ish , D .J ., A nderson, J .M . and K o h le r , A .C . 1 9 7 1 . M e th y l m ercury in freshw ater and m arine fishes in N ew B runsw ick, in the Bay o f F u n d y , and on the N ova Scotia banks. J. F ish . Res. Bd. Can. 28: 1 28 5 .
Ms received 1 /2 4 /7 4 ; revised 3 /9 /7 4 ; accepted 3 /1 3 /7 4 .__________________________________________
This study was financed in part by the N a tio n a l Oceanic and A tom ospheric A d m in is tra tion (m ain ta ined by the U .S . D e p t, o f C om m erce) In s titu tio n a l Sea G ran t N o . 0 4 -4 -1 5 8 -4 .
We th a n k M a ry DeB lo is fo r her assistance, and A1 C ro p ley , D ean M u rra y , Joe Fenand er and especially A rt Paquet o f the O tte r T ra w l C om m ission o f Oregon fo r th e ir assistance in collecting samples. We also express g ra titud e toD .L . C raw fo rd fo r his adm in istrative aid.

M A R S H A L L H . D O U G H E R T Y , D O N A L D R . P E T R U S a n d P A U L J. F E L L E R S
S ta te o f F lo r id a D e p a r tm e n t o f C itru s , L a k e A lf r e d , F L 3 3 8 5 0
A Research NoteEFFECT OF ESSENCE ENHANCEMENT AND STORAGE ON THE FLAVOR
OF FROZEN CONCENTRATED ORANGE JUICE
IN T R O D U C T IO N
DURING the past few years, the production of orange essence and its use for flavor enhancement has become quite common in the citrus industry. Between 25 and 50% of the Florida pack of frozen concentrated orange juice (FCOJ) now contains essence for flavor enhancement. Numerous investigations have been conducted by the Scientific Research Department of the Florida Department of Citrus pertaining to essence production and flavor characterization: Attaway et al. (1962, 1964); Wolford and Attaway(1962); Wolford et al. (1963, 1965, 1967,1968). In addition, Dougherty (1968), Petrus et al. (1970) and Ismail and Wolford (1970) reported further analytical methods for determining essence quality and concentration.
Throughout the period of essence development, emphasis was placed on improvement of essence recovery and development of procedures for adding essence back to FCOJ. Once these problems had been satisfactorily resolved, the question arose as to the quantity of essence required in FCOJ to give the desired amount of flavor enhancement and what effect, if any, this essence would have on the flavor characteristics after long periods of storage. This paper reports the results of a combination flavor and long range storage study using commercial essence produced by three different citrus processing companies.
E X P E R IM E N T A L
A QUANTITY of commercially prepared 65° Brix Florida Valencia frozen concentrated orange juice containing no essence or cutback juice and having minimal oil (0.004% v/v) content was obtained for use as a base product for all samples prepared for this study. Valencia orange essence was obtained from three different Florida commercial citrus processors having slightly different essence recovery systems. The essences were analyzed for volatile content as indicated by esters and oxygenated terpenes, Attaway et al. (1967), chemical oxygen demand (COD), Dougherty (1968) and total aldehydes, Petrus et al. (1970). The results of these analyses are listed in Table 1.
13 packs of 44.8° Brix FCOJ were prepared using the materials described above plus distilled water. Sufficient coldpressed Valencia
orange oil was added to each pack to produce a reconstituted 12.8° Brix juice having 0.019% v/v oil. Essence was added to 12 packs on the basis of total aldehydes, since total aldehydes are considered an indicator of essence strength. Each of the three essences was added to obtain levels of 5, 15, 30 and 45 mg/1 of total essence aldehydes in the reconstituted products. The 13th pack contained no essence and was used as the control. Each pack consisted of 24 6-oz cans and all packs were stored at -22.2°C until they were reconstituted for flavor evaluation.
Flavor evaluation was carried out using 12 experienced taste panel members grading samples on a nine category hedonic scale. Samples were presented to panelists in a random order. Flavor evaluations were made initially after 1.5 months of storage and at 6, 9, 12, 15 and 30 months of storage thereafter. Table 2 gives the average flavor scores for the 13 juices after each storage period and the overall mean flavor score for each juice over the 30-month period. The sample code indicates the essence (Table 1) used and the mg/1 of the essence aldehydes contained in the reconstituted juice.
RE S U LTS & D ISCU SSIO N
EACH RECOVERY system may produce an essence having different odor and flavor characteristics and chemical composition. While odor and flavor are rather intangible properties, an obvious difference in chemical composition is indicated in Table 1. If essences are to be added on the basis of total essence aldehydes in the reconstituted products it is quite evident that varying amounts of essence will be required, depending upon its source.
Analysis of variance using mean flavor values obtained from each treatment revealed that differences between two of the treatments and the control were highly significant. Samples A-30 and A-45 were found to be significantly worse than the control at the 99% confidence level. When compared with the overall mean flavor score of the control of 5.9 (like
T a b le 1 —V o la t i l e c o n t e n t o f t h r e e e s s e n c e s u s e d in f l a v o r a n d s to r -a g e s t u d y .
E s s e n c e A B C
T o ta l a ld e h y d e s (m g /l ) 5 ,0 0 0 1 ,5 0 0 3 ,8 6 0C O D (m g / l) 6 6 ,0 0 0 3 6 ,0 0 0 8 1 ,5 0 0
E s te r s (m g / l) 111 6 4 7 0
O x y g e n a te d t e r p e n e s (m g /l) 4 3 1 7 2 1 2 5
T a b le 2 —A v e ra g e f l a v o r s c o r e s f o r e s s e n c e e n h a n c e d f r o z e n c o n c e n t r a t e d o r a n g e ju ic e a f t e r p e r io d s o f s to r a g e
S to r a g e p e r io d ( m o n t h s ) n ..
S a m p le 1 .5 6 9 1 2 1 5 3 0 m e a n
A -5 5 .2 6 .6 6 .7 6 .2 6 .0 6 .3 6 .2
A -1 5 6 .6 5 .9 5 .3 6 .1 6 .3 6 .0 6 . 0
A -3 0 6 .1 4 .8 4 .8 5 .3 4 .9 5 .9 5 .3
A -4 5 4 .6 5.1 4 .6 5.1 5 .6 5.1 5 .0
B -5 5 .8 6 .2 6 .0 5 .9 5 .9 6 .0 6 .0
B -1 5 6 .4 6 .4 6 .1 5 .8 6 .1 5 .7 6 .1
B -3 0 5 .9 6 .1 4 .8 5 .5 6 .1 5 .3 5 .6
B -4 5 5 .8 5 .5 5 .6 5 .5 5 .2 5 .3 5 .5
C -5 6 .4 6 .6 6 .3 6 .2 6 .2 5 .8 6 .3
C -1 5 6 .2 6 .3 6 .3 5 .9 6 .2 6 . 0 6 .2
C -3 0 6 .4 5 .8 6 .3 5 .6 6 .4 5 .9 6 .1
C -4 5 6 .2 6 .1 6 .3 5 .8 6 .0 6 .2 6 .1
C o n t r o l 5 .9 5 .9 5 .9 5 .5 6 .2 5 .8 5 .9
Volume 39 <1974)-JOURNAL OF FOOD SCIENCE-855

856-JOURNAL OF FOOD SCIENCE-Volume 39 (1974)
slightly), these two samples had overall mean flavor grades of 5.3 (neither like nor dislike) and 5.0 (neither like nor dislike), respectively. Samples A-5 and C-5 came very close to being significantly better than the control at the 95% confidence level, while sample B-45 came very close to being significantly worse than the control at the 95% confidence level.
For essence “A,” there was no question that levels above 15 mg/1 of added aldehydes resulted in a lowering of flavor quality in the fair-flavored orange juice to which it was added. The data also showed there was reason to believe that the same was true for essence “B” when 45 mg/1 aldehydes were added. However, the data clearly indicated that for essence “C,” 5 through 45 mg/1 of added aldehydes in no way detracted from the overall quality of the fair-flavored juice to which it was added. In fact, at the 5 mg/1 level, the juice quality was found to trend higher than the control but this did not prove to be significantly so. The latter statement was also found to be true for essence “A” when added at the 5 mg/1 aldehyde level.
CO NCLUSIO NS
ORANGE ESSENCES produced by different recovery systems are distinct and differ considerably in their chemical composition and strength. The above results
and discussion suggest that in some cases there is an optimum level of essence that can be added to a fair-flavored juice to produce a better flavored juice, and that higher levels of essence can result in a lowering of flavor quality.
Analysis of variance of the data showed that there was no significant difference within treatments at different testing periods. This study also failed to support the widely-accepted idea that essence-enhanced FCOJ’s tend to lose significant amounts of essence flavor during storage, with subsequent overall flavor loss. Flavor loss did not occur during the 30 month frozen storage period and for the three different essences studied.
R EFEREN CES
A tta w a y , J .A . and W o lfo rd , R .W . 1 9 6 4 . Isolatio n and id e n tific a tio n o f vo la tile flavor com ponents in recovered orange essences using gas chrom atography. In “ Gas C hrom atog raph y, Proceedings o f the F if th Sym posium Organized by Gas C hrom atography Discussion G roup o f In s titu te o f P etro le u m ,” E d . A . G o ldu p , p. 1 7 0 . The Elsevier Publishing C om pany , A m sterdam , 1 9 6 5 .
A tta w a y , J .A ., W o lfo rd , R .W . and A lberd ing , G .E . 1 9 6 4 . Id e n tific a tio n o f alcohols and vo la tile organic acids from na tu ra l orange essence. J. A gr. F o o d C hem . 12: 118 .
A tta w a y , J .A ., W o lfo rd , R .W ., D o u g h erty , M .H . and Edw ards, G .J. 1 9 6 7 . M ethods fo r the d e te rm in a tio n o f oxygenated terpene, a ldehyde , and ester concentrations in aqueous citrus essences. J. Agr. F o o d C hem . 15: 6 88 .
A tta w a y , J .A ., W o lfo rd , R .W . and Edw ards, G .J. 1 9 6 2 . The iso lation and id e n tific a tio n o f some vo la tile carbo ny l com ponents o f orange ju ice . J. A gr. F o o d C hem . 10: 1 02 .
D oug herty , M .H . 1 9 6 8 . A m eth o d fo r m easuring the w a te r soluble vo la tile constituents o f citrus ju ices and products. Fo o d Techno l. 2 2: 1 45 5 .
Ism ail, M .A . and W o lfo rd , R .W . 1 9 7 0 . C o lo rim etric estim ation o f to ta l a ldehydes in aqueous orange essence using N -h y d ro x y - benzensulfonam ide. F o o d Sci. 35: 3 0 0 .
Petrus, D .R ., D o u g h erty , M .H . and W o lfo rd , R .W . 1 9 7 0 . A qu an tita tive to ta l aldehydes test useful in evaluating and b lending essences and concentra ted citrus products. J. Agr. Fo od C hem . 18: 9 0 8 .
W o lfo rd , R .W . and A tta w a y , J .A . 1 9 6 2 . Th e app lic a tio n o f gas chrom atography to the analysis o f flavor com ponents o f citrus ju ices. In “ Gas C h rom ato grap hy , T h ird In te rn a tio n a l S ym posium , In s tru m e n t S ociety o f A m e ric a ,” p. 4 5 7 . A cadem ic Press, N ew Y o rk .
W o lfo rd , R .W . and A tta w a y , J .A . 1 9 6 7 . A n a lysis o f recovered na tu ra l orange flavor enhancem ent m ateria ls using gas chrom atography. J. Agr. Fo od C hem . 15: 3 6 9 .
W o lfo rd , R .W ., A tk in s , C .D ., D o u g h erty , M .H . and M a cD o w ell, L .G . 1 9 6 3 . Recovered vo la tiles fro m citrus juices. Trans. C itrus E ngr. C o n f., A S M E 14: 64 .
W o lfo rd , R .W ., A tta w a y , J .A ., A lberd in g , G .E . and A tk in s , C .D . 1 9 6 3 . A nalysis o f the fla vor and arom a constituents o f F lo rid a o range juices by gas chrom ato grap hy. J. F o o d Sci. 28: 1.
W o lfo rd , R .W ., A tta w a y , J .A . and Barabas, L .J .1 9 6 5 . The system atic analysis o f vo la tile f la vor com ponents in orange juices. Proc. F la. State H o rt. Soc. 7 8 : 2 68 .
Ms received 1 /9 /7 4 ; revised 3 /2 6 /7 4 ; accepted 4 /2 /7 4 . ________________________________________
F lo rid a A g ric u ltu ra l E x p e rim en t S ta tio n Journal Series N o . 5 2 4 6 .
The assistance o f D r. Be’la Buslig in the statis tica l analysis c f the data is greatly appreciated.

J. C. U N D E R W O O D , ' J. C. K IS S IN G E R , R . A . B E L L a n d J. W . W H IT E J R .
U S D A E a s te rn R e g io n a l R esearch C e n te r , N o r th e a s te rn R e g io n , A R S , P h ila d e lp h ia , P A 1 9 1 1 8
A Research NoteCOLOR STABILITY OF MAPLE SIRUP IN
VARIOUS RETAIL CONTAINERS
IN T R O D U C T IO N
DURING recent years, the quality and availability of the traditional metal container used for retail sale of pure maple, sirup has declined, encouraging the use of plastic containers for this purpose. Two types are currently in commercial use. Reports from the maple industry suggest that maple sirup darkens while stored in these containers. Responding to the need for more definite information on color stability of maple sirup stored in containers of different materials, this paper reports the results of a study of color stability of maple sirup in four types of containers stored at three temperatures.
E X P E R IM E N T A L
Maple sirupFour samples of maple sirup were obtained
from commercial processing plants. They represented a range of color from AA to B grade on the USDA grading scale.Containers
Containers made of four materials were tested. The quart size of each was used since it is the retail volume of sirup most generally stored. These were (1) glass in the form of a round, small-mouthed, screw-capped bottle; (2) tin-plated steel represented by the standard maple sirup can; (3) a commercial container made of XT Polymer; and (4) a commercial polyethylene maple sirup jug. The tinned containers were carefully selected for top quality,i.e., freedom from rust, solder flux and the absence of thin spots on the tinning.
Each batch of maple sirup was heated to 85°C and immediately transferred to containers of each material. The containers were filled to leave a small, uniform headspace, typical of commercial canning. They were quickly capped and placed horizontally so that the hot sirup would sterilize the underside of the cap and the container’s headspace. After cooling, a container of each material with each of four sirups was stored at 4°C in a refrigerator, at 22-23°C in a cabinet, and 32°C in a heat-controlled oven.
After 6 months, the containers were removed from storage, shaken to mix their contents, and allowed to stand 24 hr at room temperature. Since the containers were filled hot and not opened during the storage period, no microbiological tests were made. The sirup samples were then evaluated for color and flavor. Color being the sirup characteristic of immediate interest, it was measured not only according
1 R etired
T a b le 1 —C o lo r o f m a p le s i r u p s t o r e d in d a r k n e s s in v a r io u s c o n t a i n e r s f o r 6 m o n t h s a t v a r io u s t e m p e r a t u r e s
S i r u p 1 S i r u p 2 S i r u p 3 S i r u p 4
M ac - M ac - M a c - M ac -A d a m U S D A A d a m U S D A A d a m U S D A A d a m U S D A
O rig in a l 1 0 0 A A 1 2 5 A 1 4 0 B 1 5 5 B
C o n ta in e r
a n d te m p .
G la ss
4 ° C 1 2 0 A 1 3 0 A 1 5 0 B 1 6 0 B2 3 ° C 1 1 5 A 1 4 5 B 1 4 5 B 1 5 5 B3 2 ° C 1 2 0 A 1 2 0 A 1 4 0 B 1 5 5 B
T in
4 ° C 1 1 5 A 1 3 0 A 1 5 0 B 1 6 5 B2 3 ° C 1 1 0 A A 1 3 0 A 1 3 0 A 1 6 0 B3 2 ° C 1 1 0 A A 1 1 0 A A 1 2 5 A 1 6 0 B
X T P o ly m e r
4 ° C 1 2 5 A 1 3 5 A 1 6 0 B 1 7 0 U n2 3 ° C 1 4 0 A 1 5 5 B 1 5 5 B 1 7 0 U n3 2 ° C 1 4 5 a 1 4 5 B 1 6 5 B 1 8 0 U n
P o ly e th y le n e
4 ° C 1 3 0 A 1 4 5 B 1 6 5 B 1 7 5 U n2 3 ° C 1 3 5 A 1 6 5 B 1 6 5 B 1 6 5 B3 2 ° C 1 4 5 B 1 6 5 B 1 8 5 U n 1 9 5 U n
a S a m p le lo st. E s t im a te d v a lu e su p p lie d to p e rm it d a ta a n a ly s is .
T a b le 2 —C o lo r in c r e a s e o f m a p le s i r u p in f o u r c o n t a i n e r s a t t h r e e
t e m p e r a t u r e s
V a r ia n c eS u m o f S q u a r e s
A n a ly s is o f V a r ia n c e
D e g re e s o f M e a n F r e e d o m S q u a r e F
T e m p e r a t u r e (T ) 5 1 .0 2 2 5 .5 0 .4 9
S ir u p 1 4 3 5 .4 3 4 7 8 .5 9 .3 4 * *
C o n t a i n e r (C ) 6 3 3 9 .6 3 2 1 1 3 .2 4 1 .2 7 * *
T X C 1 4 8 2 .3 6 2 4 7 .1 4 .8 2 * *
E r r o r 1 6 8 9 .6 3 3 5 1 .2
T o ta l 1 0 9 9 7 .9 4 7
T e m p e r a t u r e
C o n t a i n e r 4 ° C 2 2 - 2 3 ° C 3 2 ° C M e a n a
G la ss 1 4 0 1 4 0 1 3 3 .7 1 3 7 .9 a
T in 1 4 0 1 3 2 .5 1 2 6 .2 1 3 2 .9 b
X T P o ly m e r 1 4 7 .5 1 5 5 1 5 8 .7 1 5 3 .8 c
P o ly e th y le n e 1 5 3 .7 1 5 7 .5 1 7 2 .7 1 6 1 .3 d
M ea n 1 4 5 .3 A a 1 4 6 .3 A 1 4 7 .8 A
* * S ig n if ic a n t a t th e 1% p r o b a b il i ty leve l.a M e an s fo l lo w e d b y th e sa m e le tte rs d o n o t d if fe r s ig n if ic a n t ly a t th e
1% p r o b a b il i ty leve l b y D u n c a n 's M u lt ip le R a n g e T e s t (D u n c a n , 1 9 5 5 ) .
Volume 39 (1974)—JOURNAL OF FOOD SCIENCE-857

858-JOURNAL OF FOOD SC/ENCE-Vo/ume 39 (1974)
to the USDA grading procedure used by the maple industry (Willits and Underwood, 1961), but also visually by MacAaam’s numerical color scale (MacAdam, 1943). This is a series of 45 plastic plates arranged in order of increasing color from very light amber to very dark amber, numbered by fives from 0 to 220. On this scale the USDA Grade ranges are < 110, AA; 115-140, A; 145-165, B; and >165, Unclassified. This scale enables the recording of color changes within the color grades designated by the USDA grading standard color plates. Samples contained in the square bottles used in the USDA classifier were compared visually with the MacAdam plates. Flavor was judged by two of the authors, fully familiar with maple flavor characteristics. Brix values were measured with an Abbe-type refractometer with a Brix sugar scale.
RESULTS & DISCUSSION
BRIX VALUES for the sirups were 67.1,69.8, 68.2 and 69.1 respectively. The visual color evaluations of the stored sirups are recorded in Table 1. There are no tabulations for flavors o f the sirups because there was no significant change in the flavor characteristics of the four sirups during the storage under the various conditions o f the experim ent which could be ascribed to the container type. All
samples of the darker sirups (Sample 3 and Sample 4) at the highest storage tem perature developed an off-flavor which was judged not to affect salability of the sirup. No changes in Brix values were noted.
A preliminary analysis of variance including all interactions showed the container to have the greatest influence on sirup darkening (F=136.2). The significant effect of sirup (F=30.8) was found to reside entirely in sirup No. 1, which darkened significantly more than the others. The container-tem perature interaction was the most significant (F= 15.9). Therefore the data for T x S, C x S and C x S x T were pooled to provide a more stringent test of tem perature and container effects and their interaction. Results are shown in Table 2. Tem perature of storage, overall, is w ithout significant effect, although interaction between the containers and storage tem perature is seen to be highly significant.
Within the limits o f the small num ber of maple sirups used for this test, highly significant differences in the darkening of the sirup in the different containers during 6 m onths storage were observed. Greatly increased darkening occurred in
both plastic containers when compared with the tin cr glass package; indeed in these plastic containers a sirup can change sufficiently during 6 m onths storage to fall into a lower grade, since color is a grade factor. Whether this darkening of color would have an adverse effect on sales is not known. The maple sirup producer must determ ine for himself, based on his m arketing practices and customers, whether such darkening during storage is a factor to be considered in making a decision on retail containers.
R EFEREN CES
D uncan, D .B . 1 9 5 5 . M u ltip le range and m u lt iple F tests. B iom etrics 11: 1.
M acA dam , D .L . 1 9 4 3 . S pec ifica tion o f sm all c h ro m atic ity differences. J. O p t. Soc. A m . 33: 18.
W illits , C .O . and U n d e rw o o d , J .C . 1 9 6 1 . M e th ods o f analysis fo r m ap le sirup: U S D A C o lo r C om parator. J. Assoc. O ffic . A gr. C hem . 44: 330 .
Ms received 1 /2 2 /7 4 ; revised 3 /1 /7 4 ; accepted 3 / 5 / 7 4 , _________________________________ ____
The techn ica l coop era tion o f M rs. T .E . Z e ll is acknow ledged w ith thanks , as is statistical counsel fro m E . James K och .
Reference to brand o r firm nam e does no t constitu te endorsem ent by the U .S . D ep t, of A gricu ltu re over others o f a s im ilar nature n o t m entioned .

THOMAS PHILIPDept, of Dairy & Food Sciences, The University of Arizona, Tucson, AZ 85721
A Research NoteAN ANTHOCYANIN RECOVERY SYSTEM FROM GRAPE WASTES
IN T R O D U C T IO N
THE CONVENTIONAL method of anthocyanin recovery from plant materials involves extraction with an acidic alcohol, purification by ion-exchange and acid stabilization (Chiriboga and Francis,1970). The mineral acid used for the elution and stabilization of anthocyanins limits the utilization of extracted anthocyanins due to the low pH imparted when added to food products. Ion-exchange purification is tedious and the cationic resins normally used to purify the anthocyanins also concentrate metal ions in the recovered anthocyanin. Weak cationic exchangers have low pigment capacity and strong cationic exchangers, though excellent anthocyanin absorbers, require large volumes of solvent for complete elution of anthocyanins. This report describes a new procedure for anthocyanin recovery from grape wastes based on tartaric acid/methanol extraction followed by precipitation of excess tartaric acid as potassium hydrogen tartrate.
M A T E R IA L S & M ETHO DS
RED WINE grape pomace (vinifera-variety unknown) was obtained from E & J Gallo Winery, Modesto, Calif. “Centrifuge residues” were obtained in the author’s laboratory by clarifying freshly prepared Beauty Seedless grape (vini- fera) juice. Centrifuge residue and pomace had low sugar contents. Both were rich sources of anthocyanins and were wastes generated during the processing of grapes.
The centrifuge residues and pomace were dried in a vacuum oven (80° and 25 in. Hg) to moisture levels below 10%. Dried centrifuge residue (lOOg) was packed in a column (2 x 40 cm) and extracted three times with methanol containing 0.1% tartaric acid (100 ml each) at the flow rate of 5 ml per min. The dried pomace (1 kg) was extracted in the same way with methanol containing 1% tartaric acid (1 liter each) using a higher column (6 X 120 cm) and a higher flow rate of 25 ml per min.
The methanol extracts were neutralized with 40% KOH solution so that a residual acidity of 10-15% of total tartaric acid used was maintained to prevent degradation of anthocyanins. The amount of potassium hydroxide required was calculated based on the equation:
KOH + tartaric acid -*■ KH tartrate + H2 O.
The extracts were cooled to 15°C and the precipitated potassium hydrogen tartrate (cream of tartar) was filtered off. The filtrate was evaporated under vacuum at 40° C until all the methanol was removed. The aqueous anthocyanin concentrate was cooled to 10-15°C and filtered to remove potassium hydrogen tartrate precipitated during concentration.
The acceptability of the anthocyanin extract was evaluated by preparing an artificial grape drink (°Brix = 13.0 and pH = 3.3) containing water, sucrose, tartaric acid, artificial grape flavor (Firmenich 59.469/A) and colored with the anthocyanin concentrate.
RESU LTS & DISCUSSIO N
THE PROPERTIES of the recovered anthocyanin concentrate from centrifuge residues and pomace are summarized in Table 1. An artificial grape drink colored
with the concentrate (1.0—1.5 ml concentrate per 100 ml drink gave a normal red grape juice color) was found to be acceptable by a panel of three judges. The slight fermented flavor of concentrate from pomace was not objectionable in the artificial grape drink.
Ethanol can be substituted for methanol in the extraction process. The concentration of tartaric acid required for efficient extraction depends on the material to be extracted. The centrifuge residue can be extracted with a low percentage of tartaric acid, whereas pomace requires higher amounts of tartaric acid. The pomace can be dehydrated with methanol (1 liter/1 kg) instead of drying in an oven without significant loss of anthocyanins. Dehydration with methanol removes part of the flavor associated with fermented pomace. Dehydration of centrifuge residue with methanol resulted in considerable loss of anthocyanins. The acidity of the final concentrate can be controlled to the desired degree by neutralization of tartaric acid. A two-stage neutralization of acid before and after removal of methanol is preferable to a single neutralization step before the removal of methanol.
The centrifuge residue and wine grape pomace are wastes generated during the production of grape juice and wine, respectively. Their high anthocyanin and low sugar contents make it possible to recover the anthocyanins by the method described in this report. This method is amenable to continuous process and the solvent can be recovered and reused. The potassium hydrogen tartrate generated during the recovery process is a valuable by-product. The tartaric acid present in the extract is not objectionable in food products where anthocyanins can be used for coloring.
R EFEREN CES
Chiriboga, C . and Francis, F .J . 1 9 7 0 . A n anthocyan in recovery system fro m cranbery po m ace. J. A m er. Soc. H o r t Sci. 9 5 : 2 33 .
Ms received 1 /9 /7 4 ; accepted 2 /1 8 /7 4 .
Journa l paper 2 2 3 7 o f the A rizo n a A gricu ltu ra l E x p e rim en t S ta tio n .
The au tho r is g ra tefu l to M r. A rth u r C ap uti Jr., fo r supp lying w ine grape pom ace.
T a b le 1 —P r o p e r t i e s o f a n t h o c y a n i n c o n c e n t r a t e r e c o v e r e d f r o m g ra p e w a s te s
S o u r c e
Y ie ld /1 0 0 g d r y m a te r ia l
A n t h o c y a n i n c o n c / 1 0 0 m la
S o lu b le
s o l id s( ° B r ix )
A c id i ty
(% t a r t a r i c a c id )
p H o f
1 + 1 0 0 s o l u t i o n F la v o r
C e n t r i f u g ere s id u e 1 5 m l 0 .8 0 g 1 6 .0 5 .6 3 .1 N o n e
P o m a c e 2 0 m l 0 .6 5 g 1 2 .8 8 .0 3 .0 S lig h t f e r m e n te d o d o r
a A n th o c y a n in c o n c e n t ra t io n w a s c a lc u la te d as m a lv id in 3 -g lu co s id e ( E j = 5 2 4 .4 n 0 .0 1 % c o n e H C I/ M e O H a t 5 3 6 n m ) . B o th th e c o n c e n tra te s sh o w e d a b s o rp t io n m a x im a a t 5 3 6 n m in 0 .0 1 % c o n e H C I/ M e O H . T h e sp e c tra l m e a s u re m e n ts w e re ta k e n w ith a P e r k in - E lm e r 2 0 2 U V - V is ib le S p e c t ro p h o to m e te r .
Volume 39 (1974)-JOURNAL OF FOOD SCIENCE- 859

International Food Information Service (IFIS) presents...
FOOD SCIEN CE AND TECHNOLOGY ABSTRACTS. . . a monthly compilation of abstracts in 19 subject areas.O v e r 1 ,200 jo u r n a ls from o v er 50 cou n tries, p aten ts from 20 cou n tries, and b o o k s in any language are sy stem a tica lly searched , and 16,500 abstracts are p u b lish ed per year. E ach abstract co n ta in s an in d ication o f th e su b ject m atter and d eta ils o f n e w in form ation con ta in ed in th e original article, patent, or book .
A l l a b str a c ts are in E n g lish , regardless o f th e language o f th e original article. A n im p ortan t'
b o n u s is that m ore th an 50% o f th e articles abstracted are in lan gu ages o th er th an E n g lish - prim arily G erm an , R u ssian , Japanese, F rench , Italian, and P o lish . IF IS th u s p rov id es a source o f technical in form ation that is largely untapped by E n g lish -sp eak in g sc ien tists .
E a ch m o n th ly is s u e con ta in s m ore than 1,300 abstracts, an author in d ex , and a su b ject in d ex , and a cu m u la tiv e author and su b ject in d ex is p ublished annually.
T o s u b s c r i b e t o F o o d S c i e n c e a n d
T e c h n o l o g y A b s t r a c t s w r i t e t o :
C a l v e r t L . W i l l e y , E x e c u t i v e D i r e c t o r
I n s t i t u t e o f F o o d T e c h n o l o g i s t s / 2 2 1 N . L a S a l l e S t . / C h i c a g o , I L . 6 0 6 0 1

SCIENTIFIC.STATUS
SUM M ARY OF THE
I ITEXPERT PANEL SHELF LIFE
OF FOODSA S c i e n t i f i c S t a t u s S u m m a r y b y t h e I n s t i t u t e o f F o o d
T e c h n o lo g is t s ’ E x p e r t P a n e l o n F o o d S a f e t y a n d N u t r i t i o n
The period between manufacture and retail purchase o f a food product during which the product is o f satisfactory quality is commonly referred to as its “ shelf life .” A ll food products have a finite and variable shelf life. Food companies generally know the shelf lives o f their products under different environmental conditions. Storage studies are part o f every product development program, whether it includes a new product, a product improvement, or simply a change in type or specification o f an ingredient.
Attempts are made to maximize shelf life, consistent w ith costs and pattern o f handling and use by distrib u to rs , retailers, and consumers. Manufacturers, for example, package cake mixes, dessert mixes, and sauce mixes in heat-sealed pouches to protect them against oxygen and moisture absorption. They also avoid sources o f bacterial contamination and follow prescribed procedures for pasteurization o f perishable foods. Special ingredients are used as preservatives, antioxidants, emulsifiers, stabilizers, and chelating agents to retard chemical and physical changes in foods during storage.
Any deficiency in shelf life w ill result in consumer complaints which eventually w ill seriously affect acceptance and sales o f brand name products.
In a concise way, it can be stated that stability and shelf life o f foods is concerned with:
• Spoilage by bacterial or enzymatic action o f those foods not preserved by heat treatment, low water activity or chemical methods.• Spoilage by microorganisms o f dried foods such as cake mixes or dried beans.• Prevention o f insects entering or attacking packaged foods.• Loss o f functional properties o f such products as baking powder, sauce mixes, and instant puddings.• Loss of aesthetic qualities, e.g., color, flavor, aroma, texture and general appearance.
• Loss of nutrient value, that is, vitamin losses and protein breakdown.
What Is the Nature of Changes in Foods During Storage?
Foods can be divided into two main categories—perishable (including semiperishable) and shelf stable:
• Perishable Foods are those that can be held for only a short time unless
stored under refrigerated or freezing conditions to inhibit the growth o f spoilage microorganisms and action o f enzymes. Semi-perishable foods are those that are more stable because o f natural inhibitors, or those that have received some type o f mild preservation treatment for greater tolerance to environmental conditions and abuse during distribution and handling. Obviously, perishable foods are a special and sensitive group when one considers storage and shelf life.• Non-Perishable or Shelf-Stable Foods are not affected by microorganisms, because such foods are either preserved by heat sterilization, formulated as dry mixes, or processed _ to give low water activity as described by Bone (1973 ). M any unprocessed foods such as nuts and maple syrup are shelf stable because o f low water activity.
Bacteria, molds, yeast, and enzymatic breakdown are the main causes of deterioration o f perishable foods. Usually, bacterial deterioration occurs well before chemical or physical changes. Bacteria grow under a wide range o f environmental conditions and are responsible for a variety o f changes in food products. Some bacteria are associated w ith production o f acid, while others cause off-flavors or phase separation, which adversely affect the acceptability o f the food. Molds and
Volume 39 (July-August, 1974 )-JOURNAL OF FOOD SCIENCE

m
A S C I E N T I F I C S T A T U S S U M M A R Y O F T H E I F T E X P E R T r A ïn E L
yeast cause visible signs of deterioration. Enzymatic activity can be derived from microbial growth or arise from natural systems such as bruising or darkening in apples.
In the food distribution and supply system, the maintenance of chilling or freezing temperatures is an absolute requirement for perishable foods such as fresh meat and fresh juices. For semi-perishable foods, such as luncheon meats, cheese, and smoked fish, the requirements for low temperature and short shelf life are less critical. Semi-perishable foods can have a shelf life of 30-90 days under ideal conditions, depending on the food, while some perishable foods can be held only 5-7 days even under ideal conditions.
A r e
S h e l f - S t a b l e F o o d s
R e a l l y S t a b l e ?
If bacteria and enzymes are destroyed or inhibited for long-term storage, then what other changes occur in shelf stable foods? H eam e(1964) discusses some of these changes: • Oxidation, hydrolysis, and reversion in fats • Breakdown of protein structure, which can cause textural changes in foods as well as loss in waterbinding and functional properties, such as whipping, gelation, and th ic k e n in g • Browning reactions which involve sugars and amino groups found in proteins • Oxidation of pigments • Chemical deterioration of certain micronutrients.
Under extreme conditions of prolonged storage or excessively high temperatures, interactions can take place even between the food and the containers, as with can corrosion. These reactions and breakdowns are manifested by visible changes in the food such as fading of color, caking, browning, staling, softening, flocculation, cloud formation, or gelation. There would also be signs of staleness, and most likely off-flavors and odors as
well as non-typical texture and appearance.
It is difficult to generalize on loss of nutrient value of foods on storage. This concern probably has validity only for long-term storage of foods such as canned fruits and vegetables. As a result of improved methods for heat sterilization, vitamins in raw foods are retained at a high degree during processing. The 1971 Rutgers Food Stability Survey states that losses during prolonged storage are lim ited to the more vulnerable vitamins. In general, a 15-30% decrease in ascorbic acid may be expected if canned foods are stored for one year at 80°F, whereas only 5-15% is lost at 65°F, which is more representative of average storage in food warehouses in temperate climates. Depending on the pH of the food, thiamine losses are of similar order of magnitude or somewhat larger. Carotene, riboflavin, and niacin values decrease slightly on storage.
R e a c t i o n s i n F o o d s
V a r y w i t h
T e m p e r a t u r e
Various chemical' and biological reactions take place in foods, depending upon the temperature encountered during storage. Protection against oxygen can be tailored specifically either by a package system, by avoidance of pro-oxidants, or by use of antioxidants. The nature of moisture sorption and desorption in foods has been described by Labuza (1968). Protection against moisture gain or loss can be accomplished by use of packaging materials with low moisture permeability.
Kwolek and Bookwalter (1971) express stability mathematically in terms of 3 variables: Y—a measure of product quality, such as a taste score, a physical property, or the result of a chemical or microbiological assay; t - th e number of days stored; and T - the storage temperature. Approaches are
given to develop models which can be used to predict storage stability of food products from time-temperature data. The accuracy of prediction of shelf life as defined by specific quality factors is presented by Mizrahi et al. (1 9 7 0 ).-
In shelf stable foods, the rate of simple chemical reactions increases as the temperature is raised, and this relationship can be quantified in the van’t Hoff and Arrhenius equations. As a rough guide, the rate of reaction is doubled for every 10°C (18° F) rise in temperature. The effect of temperature change on a reaction in a food system is often expressed as “temperature quotient,” defined as the ratio of the rate of change at one temperature to the rate at a specified lower or higher temperature. In biochemical systems, it has been common to j*ive the temperature quotient for a 10°C temperature difference, which is designated as Q 10. In foods, the rates of reactions are more commonly quadrupled ^and may be as high as 7X) for every 10°C rise in temperature.
In some reactions in complex or non-homogeneous systems, there are often significant departures from this g e n e r a l i z a t i o n . I n f a c t , McWeeny (1968) reports reactions which have a negative temperature coefficient, i.e., the rate of reaction increases as the temperature is re d u c e d . The following reactions are given as examples:
(1) Oxidation of unsaturated fats and oils in presence of certain amines; (2) Development of oxidized flavor in milk fat; (3) Green discoloration in certain carotenized hydrogenated fats;(4) Production of free fatty acids in certain hydrogenated fats; and (5) Staling of bread and other baked goods.
Temperature and level of bacterial contamination are the most important factors which determine shelf life for perishable foods (Hobbs, 1968). Most bacteria multiply very rapidly in the temperature range of 70-100°F. At temperatures outside this range, the rate of growth is reduced. Under ideal growth conditions, bacteria can have a
J O U R N A L O F F O O D S C IE N C E -V o lu m e 39 (Ju ly-A ugust, 1974 )
2

generation time as rapid as 20 minutes. At this rate, a single bacterium could increase in number to 2,097,152 within 7 hours!
Most perishable foods clearly demonstrate highly disagreeable signs of spoilage before they become a danger to health. Nevertheless, there is always the potential danger that overaged or abused perishable foods can cause food poisoning if the spoilage is not detected and the food is consumed without heating. Charm et al. (1972) give a procedure that uses an organoleptic technique for prediction of refrigerated shelf life of fish. The amount of spoilage is measured by an odor test.
M o n i t o r i n g T i m e
a n d T e m p e r a t u r e
The total change in the quality of a food in storage is the summation of successive exposures at various temperatures during processing, warehousing, distribution, and time in retail outlets, as well as time in the home before the food is consumed. It is obvious that defects in the quality of the raw materials or defects produced as a result of processing are added to by other changes produced during shelf life.
Holding food products at elevated temperatures will cause more rapid changes, and the food will become unacceptable in a shorter time than if the product is stored at a lower temperature. So the shelf life of foods depends on both length of time and temperature. A food could have a shelf life o f only a few weeks at 100°F, but could be good for 3 years at 45°F.
The accumulated effect of a known temperature history upon a quality characteristic can be estimated, based on data from several steady temperatures in the practical range. The U.S. Department of Agriculture has conducted extensive studies on frozen foods to determine the Time- Temperature Tolerances (T-TT) of
frozen foods and the stability of quality during the various steps of distribution and marketing. The publications on T-TT for frozen foods are voluminous. An excellent review and summary is given by Van Arsdel et al.(1969).
The program undertaken by the USDA for the frozen food industry represents a logical, systematic, and scientific endeavor to resolve many complex problems related to maintenance of quality between the time of manufacture and consumer use. The approaches taken in this program can be applied to other segments of the food industry.
The underlying purpose of the T-TT studies was to determine how much deviation from ideal conditions a product can tolerate without visible and significant changes in quality. It is obvious that information from these studies could be translated into weeks or months o f “shelf life” or “storage life,” or expressed as shipping dates, pu ll dates, or expiration dates- provided some method is used to monitor temperature during storage and distribution.
Considerable progress is being made in the development of temperature and time-temperature monitoring devices for frozen foods that can be attached to shipping containers, cases, or even individual packages. A review of this subject is given in Chapter 13 of Van Arsdel et al. (1969) and more recently by Hayakawa (1972).
Temperature devices are available which show whether the temperature of frozen food has ever reached a specific level. Several time-temperature devices are available which integrate temperature intervals. One device in the range 0-80°F operates on an electrolytic battery principle. As the temperature increases, the activity of the battery increases and is indicated by a moving color band. Another device for frozen food utilizes an enzyme system which produces a color change as the temperature increases:
A device that operates in the range of 45-130°F was developed by theU.S. Army Laboratories (Hu, 1972). It is constructed as a pouch made of a
plastic film, permeable to oxygen. A chemical system which changes color upon oxidation is contained in the pouch. Since oxygen permeation through the film is time-temperature- dependent, the extent of the reaction is controlled by the time and temperature exposure.
As yet, these time-temperature monitoring devices are too expensive for use in anything other than bulk shipments.
C o n s u m e r s
C o n c e r n e d A b o u t
F r e s h n e s s
The New Jersey State Legislature, in February 1968, was the first legislative group to recognize the problem of deterioration of foodstuffs and the losses incurred by consumers as well as the possible danger to health. In response to these concerns, a comprehensive survey was conducted on the shelf life and stability of food products to determine the need to improve procedures along the supply and distribution lines to assure high quality food products for the consumer. The USDA published the results of this survey in two volumes (Rutgers,1971).
In 1971, the USDA conducted a study to measure the extent o f consumer concern about food freshness and to determine which foods are most troublesome (USDA, 1973). One important question in the survey was: “T h in k in g b a c k o v e r th e p a s t tw o w e e k s , h a v e y o u b o u g h t a n y f o o d th a t y o u th o u g h t w as g o o d , b u t th a t sp o ile d o r b e c a m e s ta le b e fo r e y o u th o u g h t i t s h o u ld ? ”
Percent of total
answeringFood category "Yes'Fresh dairy products 5.6Fresh vegetables 5.1Fresh meat, pou ltry , and fish 4.2Fresh fru it 3.5Processed meat 2.5Baked goods 2.1A ll other 1.8
Volum e 39 (Ju ly-A ugust, 1 9 7 4 ) - J O U R N A L O F F O O D SCIENCE
3

About one-half of the spoiled food incidents were noticed by the consumer on the day of purchase. The rest were discovered after the food had been stored for one or more days in the home.
Should the food industry be concerned because as many as 25% of our consumers are not completely satisfied with the freshness of the food they buy? The supermarket and consumer protection groups think this is a large number, and food manufacturers, packers, and distributors agree. So some action has been taken by the practice of dating packaged foods, particularly dairy products, fresh and processed meats and fish, and bakery products.
I s O p e n D a t i n g a
S a t i s f a c t o r y A n s w e r ?
Consumer groups and supermarket organizations advocate open dating so that the shopper can select and purchase on the basis of a date. Currently, some foods have a date stamped on the label. The dates are indicated, for example, as 0825 or Aug. 25, with the former more widely used.
However, surveys showed that there is considerable confusion as to whether this date is the date the product is to be removed from the supermarket shelves ( “pull date”) or the date after which it should not be used by the consumer (“expiration date”) . '
Consumers are generally learning to use open dating in the overall process of decision-making and purchase along with unit pricing and other label information. The manufacturer can aid in this process by stating on the label, “ Do not se ll after Aug. 25,” or “Do not u se after Aug. 25,” or words to that effect.
Will open dating aid the consumer in determining freshness? Invariably, the answer from consumers polled is “Yes,” but it requires understanding and responsible attention by all parties in the complicated systems of food distribution and retailing. Processors,
distributors, and retailers have the responsibility to follow good procedures by holding shipments under prescribed storage conditions. Only under these circumstances will open dates have any validity. Abuse of a product with the date “0825” , for example, may cause the product to become stale or unacceptable earlier than expected, leaving the 0825 date with no validity.
Also, the consumer has the responsibility to handle and store the product in a proper manner until the product is used in the home. In many in s tan ces manufacturers give instructions on the label if special storage conditions are needed.
However, the consumer should not trust the date alone to judge that food is fresh. The consumer has to be alert to signs of spoilage or staleness. Open dating is a g u id e lin e , not a guarantee. In some cases, the product could be satisfactory but be discarded because it is past the date indicated. This would be an economic loss to the retailer and the consumer.
Open dating can be another step in the development of new awareness and understanding of foods by the corn sumer for better health and living.
REFERENCES
Bone, D. 1973. Water activity in intermediate moisture foods. Food Technol. 27: 71.
Charm, S.E., Learson, F J . , Ronsivalli,L.J., and Schwartz, M. 1972. Organoleptic technique predicts refrigeration shelf life of fish. Food Technol. 26: 65.
Hayakawa, K. 1972. An evaluation of frozen food indicators now on the market. Quick Frozen Foods 35: 73.
Hearne, J.F. 1964. Long-term storage of foods. Food Technol. 18: 318.
Hobbs, B.C. 1968. “Food Poisoning and Food Hygiene,” 2nd ed. Edward Arnold Ltd., London, England.
Hu, K.H. 1972. Time-temperature indicating system of product shelf life. Food Technol. 26: 56.
Kwolek, W.F. and Bookwalter, G.N. 1971. Predicting storage stability from time-temperature data. Food Technol. 25: 51.
Labuza, T P . 1968. Sorption phenomena in foods. Food Technol. 22: 263.
McWeeny, D J . 1968. Reactions in food systems: Negative temperature coefficients and other abnormal tem p e ra tu re effects. J. Food Technol. 3: 15.
Mizrahi, S., Labuza, T.P., and Karel,M. 1970. Com puter-aided predictions of extent of browning in d ehydra ted cabbage. J. Food Science 35: 799.
R u tg e rs . 1971. “Food Stability Survey” (in cooperation with theU.S. Department of Agriculture), Vols. 1 and 2. Rutgers Univ., New Brunswick, N.J.
USDA. 1973. Food dating: Shoppers’ reaction and the impact on retail foodstores. Marketing Research Report No. 984. Economic Research Service., U.S. Dept, o f Agriculture, Washington, D.C.
Van Arsdel, W.B., Copley, M.J., and Olson, R.L. 1969. “Quality and Stability of Frozen Foods, Time- Temperature Tolerance and Its S ignificance.” Wiley-Interscience New York.
ADDITIONAL SOURCES
ASHRAE. 1971. “ Guide and Data Book, Applications,” Am. Soc. of Heating, Refrigeration, and Air-Conditioning Engineers, New York, N.Y.
Food Standards Committee Report on the Date Marking of Food. 1972. Ministry of Agriculture, Fisheries and Food, Her Majesty’s Stationery Office, London, England.
Yearbooks of Agriculture: “Food,” 1959; “Protecting Our Food,” 1963; “Food For Us All,” 1969.U.S. Department of Agriculture, Washington, D.C.
J O U R N A L O F F O O D S C IE N C E -V o lu m e 39 (Ju ly-A ugust, 1 9 74 )
4
Related Documents