Journal of Agriculture and Rural Development in the Tropics and Subtropics Supplement 86

Welcome message from author
This document is posted to help you gain knowledge. Please leave a comment to let me know what you think about it! Share it to your friends and learn new things together.
Transcript

1
Journal of Agriculture and Rural Development in the Tropics and Subtropics Supplement 86

2

3
Resource Use and Agricultural Sustainability: Risks and Consequences of Intensive Cropping in China Lin Zhen and Michael Zoebisch

4
Herausgeber der Schriftenreihe: Deutsches Institut für Tropische und Subtropische Landwirtschaft GmbH, Witzenhausen Gesellschaft für Nachhaltige Entwicklung mbH, Witzenhausen Institut für tropische Landwirtschaft e.V., Leipzig Universität Kassel, Fachbereich Ökologische Agrarwissenschaften (FB11), Witzenhausen Hochschulverband Witzenhausen (VTW e.V.), Witzenhausen Redaktion: Hans Hemann, Witzenhausen
Korrektes Zitat Lin Zhen and Michael Zoebisch, 2006: Resource Use and Agricultural Sustainability: Risks and Consequences of Intensive Cropping in China, Beiheft Nr. 86 zu Journal of Agriculture and Rural Development in the Tropics and Subtropics, kassel university press GmbH Bibliografische Information Der Deutschen Bibliothek Die Deutsche Bibliothek verzeichnet diese Publikation in der Deutschen Nationalbibliografie; detaillierte bibliografische Daten sind im Internet über http://dnb.ddb.de abrufbar Verlag: kassel university press GmbH www.upress.uni-kassel.de ISSN: 1613-8422 ISBN-10: 3-89958-221-7 ISBN-13: 978-3-89958-221-5 URN: urn:nbn:de:0002-2211 Umschlaggestaltung: Melchior v. Wallenberg, Nürnberg Druck und Verarbeitung: Unidruckerei der Universität Kassel June 2006

5
CONTENTS PREFACE 13 1 INTRODUCTION 14 1.1 Research Rationale 15 1.2 Conceptual Framework 17 1.3 Research Objectives 18 1.4 Scope of the Study 20 1.5 The Study Area 21 2 CONCEPTS AND THEORIES OF SUSTAINABLE DEVELOPMENT 24 2.1 Agriculture and Rural Development 25 2.2 The Concept of Sustainable Agriculture 27 2.3 Defining Farming Practices 30 2.4 Factors Influencing Agricultural Sustainability 31 Water resource management 31 Soil-fertility management 32 Plant nutrient resources Soil nutrient balance Rational use of external inputs Pest and disease management 36 Agricultural extension 37 Marketing 40 Credit Services 40 3 PRACTICES AND POLICIES FOR SUSTAINABLE AGRICULTURE IN CHINA 42 3.1 Sustainable Agriculture in the Context of the North China Plain 42

6
3.2 Key Issues of Sustainable Agriculture in China 43 Population pressure and food security 43 Intensive use of external inputs 44 Environmental degradation 44 Case 1. Drying up of the Yellow River due to overuse in the upper reaches
Case 2. Diminishing water tables of the 3-H region and degradation of water quality
Case 3. Water pollution due to overuse of chemical fertilizers and pesticides Case 4. Degradation of the Northern China grasslands Case 5. Desertification 3.3 Sustainable Agricultural Practices in China 46 Biological agriculture 46 Integrated pest management (IPM) 47 Water conservation agriculture 47 Control of grassland degradation in northwestern China 48 3.4 Agricultural Policies and Practices in China 48 Land policy 49 Policy of land reservation for food grains 50 Farm price policy 50 Marketing policy 51 Water and soil conservation policy 52 4 MEASURING AGRICULTURAL SUSTAINABILITY 53 4.1 Sustainability Indicators 53 Sustainability indicators proposed by different scientists 54 Sustainability indicators practically applied 56

7
4.2 Criteria for Indicator Selection 59 4.3 Operational Indicators for Measuring Agricultural Sustainability in Developing Countries 60 Economic indicators 60 Social indicators 62 Ecological indicators 63 5 RESEARCH DESIGN 65 5.1 Sampling 66 Determination of sample size 66 Sampling methods 67 5.2 Data Collection Methods 68 Secondary data 68 Primary data 68 Field reconnaissance survey Household survey Interviews of key informants Observations Focus group discussion Groundwater test 5.3 Data Analysis 71 Quantitative analysis 71 Qualitative analysis 75 Sensitivity analysis 75 5.4 Selection of Indicators 76 6 GROUNDWATER USE 81 6.1 Groundwater-use Practices 81

8
Irrigation methods 81 Irrigation frequency 82 Gap between actual and recommended rates of irrigation 83 6.2 Farmers’ Awareness of Groundwater Conservation 84 6.3 Environmental Implications of Groundwater-use Practices 85 6.4 Water-use Efficiency 89 6.5 Future Water Demand and Supply 90 Water demand analysis 90 Water supply analysis 91 6.6 Institutional Arrangements for the Management of Groundwater Resources 92 7 SOIL-FERTILITY MANAGEMENT 94 7.1 Use of Organic Fertilizers 94 Farmyard manure (FYM) 94 Crop residues 95 7.2 Use of Chemical Fertilizers 97 Frequency and methods of fertilizer application 97 Amount of fertilizer application 98 7.3 Appropriateness of Fertilizer Use 99 The gap between recommended and actual fertilizer applications 99 Farmers’ perceptions of fertilizer application 101 Farmers’ perceptions of soil fertility 102 7.4 Nutrient Balance in the Farming System 103

9
7.5 Soil-fertility Analysis 104 Soil pH 105 Organic matter 106 Nitrogen 106 Phosphorus 107 Potassium 108 7.6 Environmental Implications of Fertilizer Application 109 Groundwater contamination 109 Nitrate (NO3
-) pollution of products 111 8 PEST AND DISEASE MANAGEMENT 112 8.1 Farmers’ Management of Pests and Diseases 112 Frequency and dosage of pesticide application 112 Methods of pesticide application 115 Farmers’ perceptions on pesticide application 115 Farmers’ perceptions on the beneficial and harmful effects of pesticides 116 8.2 Impacts of Pesticide Use 117 Human health hazards 118 Environmental and social costs 119 9 ECONOMIC SUSTAINABILITY 121 9.1 Analysis of Crop Productivity 121 9.2 Per Capita Food-grain Production 122 9.3 Stability of Crop Yield 123 9.4 Farmers’ Perceptions of the Causes of Yield Increase 124

10
9.5 Profitability of Crop Production 125 Financial analysis procedure 125 Information collection Valuation of production Cost estimation Financial benefit-cost analysis 127 9.6 Environmental and Social Cost of Farming Practices 129 9.7 Fertilizer Use and Crop Yield 131 Wheat yield and nitrogen application 131 Maize yield and nitrogen application 132 Cotton yield and nitrogen application 133
Chive yield and nitrogen application 134 9.8 Determinants of Crop Yield 135 Wheat model 135 Maize model 138 Cotton model 139 Chive model 141 9.9 Sensitivity Analysis 142 Procedures of sensitivity analysis 142 Analysis and discussion 144 Scenario 1 — 10 percent increase in input costs. Scenario 2 — 10 percent fall in output prices.
Scenario 3 — 10 percent increase in input costs and 10 percent fall in output prices.
Scenario 4 — Irrigation cost will double due to a diminishing groundwater table.
Scenario 5 — 20 percent decrease in crop yields. Scenario 6 — Fall in input costs if farmers adopt recommended rates of fertilizers and groundwater application.

11
9.10 Risks and Uncertainties 147 10 SOCIAL AND INSTITUTIONAL SUSTAINABILITY 150 10.1 Household Food Security 150 10.2 Agricultural Marketing Services 151 10.3 Accessibility to Agricultural Extension 152 Agricultural Extension Workers (AEWs) 153 Farmers’ satisfaction with extension services 155 Private entrepreneurs in extension services 157 10.4 Accessibility to Agricultural Training 157 10.5 Farmers’ Knowledge of Sustainable Farming Practices 160
Farmers’ ranking of indicators 160 Farmers’ knowledge about the use of inputs 161 Sources of farmers’ knowledge of sustainable farming practices 162 10.6 Farmers’ Willingness to Cultivate Additional or Other Crops 163 Farmers’ preferred ranking on the cultivation of additional or other crops 163 Farmers’ motives behind not cultivating additional or other crops 164 10.7 Farmers’ Perceived Problems with Crop Production 165 11 FINDINGS, CONCLUSIONS AND RECOMMENDATIONS 168 11.1 Assessment of Environmental Sustainability 168 Sustainability of groundwater management practices 169 Sustainability of soil-fertility management practices 170 Sustainability of pest and disease management 171

12
11.2 Assessment of Economic Sustainability 171 11.3 Assessment of Socio-institutional Sustainability 172 11.4 Salient Features of Sustainable and Non-sustainable Farmers 175 11.5 Modelling Sustainable Farming Practices 177 11.6 Conclusions 180 11.7 Recommendations for Implementation 184 Government policies 184 Enhance coordination Drinking water standards Grain production and distribution policies Groundwater management 186 Framework for sustainable groundwater management Water pricing Control of well construction Adoption of water conservation agriculture Soil-fertility management 187 Expand use of farmyard manure Expand use of crop residues Reduce excessive application of chemical fertilizer Pest and disease management 189 Extension services 189 Public education and training programmes Reform extension services Enhance on-farm demonstrations Agricultural information centres Research needs 191 12 BIBLIOGRAPHY 193

13
PREFACE
The North China Plain (NCP) is a food-grain bowl of the country. To feed the growing population, farmers in the area have been using high rates of inputs to increase crop yields. Researchers, planners and decision-makers are debating the sustainability of these input-intensive farming practices. This case study attempts to provide an insight into this dimension of agriculture by assessing local farming practices from three aspects: environmental, economic and socio-institutional sustainability. To assess the sustainability of the farming practices in the study area, 16 location-specific indicators covering the three aspects of sustainability were selected. Locally defined threshold levels for these indicators have been used. Data were collected from both secondary and primary sources, including relevant government agencies, households, focus groups, key informants, own field observations, and soil and water quality analysis. Data evaluation included descriptive analysis, statistical tests, financial analysis, weighted average index construction, correlation and multiple regression, and sensitivity analysis. The study attempts to provide the answers for (1) environmental sustainability as reflected by groundwater use, soil fertility and pests & disease management of the local people; (2) economic sustainability measured by the productivity of major crops and per-capita food-grain production of the households; (3) socio-institutional sustainability using the criteria of food self-sufficiency, income, extension services and farmers’ knowledge, technologies and perceptions. Finally, recommendations are made for a more sustainable use and management of agricultural resources. This publication is the extended outcome of a dissertation research project undertaken by the first author, which was co-supervised by the second author. The authors sincerely hope that professionals and researchers around the world will find the publication useful in addressing and evaluating agricultural sustainability in intensive farming systems. The authors are indebted to the Katholischer Akademischer Ausländer-Dienst (KAAD), Germany, for the research scholarship. They are grateful to the Asian Institute of Technology (AIT), the Norwegian University of Science and Technology (AIT-NTNU) Cooperation Project, and the FAO Regional Office for Asia and the Pacific (FAORAP) for financial support. Sincere thanks are extended to Prof. Dr. Jayant Routray, Dr. Soparth Pongquan and Prof. Dr. Gopal Thapa for their invaluable advice and support, and to Prof. Dr. George Axinn, Michigan State University, USA, and Dr. Malcolm Hazelman, of FAORAP for their generous support and constructive comments. Thanks are also due to Robin N. Leslie, Bangkok, for language editing.

14
1. INTRODUCTION In the developing world, agriculture is central to progress. High population densities — caused by rapid population growth over the past decades — have led to increased pressure on farmland. As a result, farm sizes have decreased, fallow periods have shortened, the use of production inputs has intensified and deforestation has increased, with concomitant land degradation and contamination of water resources (Lo and Xing, 1999). This threatens the long-term production capacity of the land. Scientists and production communities face the challenge of developing a new paradigm for agriculture, which captures the concept of sustainability. Sustainability has become a highly significant issue given the importance of agriculture as the ultimate provider of food, fibre and shelter. In a developing-country context, no other sector has a greater role for sustainable development (Smith and McDonald, 1998). The challenge is to enhance production — both in terms of quantity and quality — to feed growing populations without degradation of the production resources and the environment (Brklacich et al., 1991). China faces serious challenges. As one of the most densely populated countries in the world, China has to feed 24 percent of the world’s total population with food production on only 7 percent of the world’s total arable land. Agriculture is the predominant sector of the Chinese economy and accounts for 53 percent of the gross domestic product (GDP); over 70 percent of the population depends on it as a major source of income and for livelihoods. To feed the growing population, the Chinese Government formerly adopted the policy of increasing production at all costs through intensive use of irrigation and external inputs such as hybrid seeds and fossil energy-derived inputs such as synthetic fertilizers and pesticides. Currently the country is experiencing a noticeable shortage of major natural resources for agriculture and serious environmental degradation (Lo and Xing, 1999). The future of the entire rural economy and the food security of the populace will be determined by agricultural sustainability and the effective management of natural resources. Sustainable agriculture has become a popular issue in China. The government and populace have realized that sustainable agriculture can increase profitability and production efficiency through integrated farm management and conservation of soil, water, energy and other biological and productive resources. It can meet subsistence needs and enhance agricultural resource management systems. Likewise, it can minimize the variable costs of external inputs. From the social point of view, it can increase self-reliance among farmers and rural people through better use of indigenous knowledge and farmers’ skills.

15
Recognizing the importance of sustainable development, the Chinese Government has accorded high priority to the agriculture sector in the successive five-year plan periods. A number of laws and regulations have been formulated in response to sustainable agricultural development, including, Law of Agriculture, Law of Agricultural Environmental Protection, Law of Environmental and Resource Conservation, Law of Soil and Water Conservation and Law of Land Management. The main components of these laws are concerned with the importance of environmental and natural resource protection, and the role of the government and people in the environmental conservation process. Therefore, in the context of China, increasing crop production for a rapidly growing population without further damaging the degraded ecosystem has been a major issue in recent years. Although significant achievements have been made in developing agricultural production in the North China Plain (NCP), some serious problems remain that restrict its sustainable development (CAS, 2000):
1) The threat of drought owing to the area's monsoon climate. 2) Insufficient water resources — with agricultural and economic
development, the shortage of water resources is a serious threat to sustainable agricultural development.
3) The development of enterprises for food-grain production is rudimentary
and farmers’ incomes are low. 4) Mounting environmental problems generated by detrimental human
activities such as intensive use of groundwater, fertilizers and pesticides. These factors limit the sustainable development of agriculture and the overall development of rural areas. In future, this area will be expected to produce more and more of the nation's agricultural output, placing increasing stress on the environment. Therefore, it is high time to examine environmental impacts under current input levels. 1.1 Research Rationale The sustainability of farming practices in the NCP remained outside the research agenda for a long time. The plains are considered the major base for food-grain production in the country because of their large proportion of arable land and the ease with which level areas can be cultivated in comparison with hilly and mountainous lands. The NCP has about one-fifth of the country’s arable land and produces one-fourth of the country’s food grain. Its critical role in ensuring

16
food security for the entire country has been acknowledged. Agricultural development efforts in the plains have focused on the refinement of intensive production systems such as the use of high-yielding varieties (HYVs), fertilizers, pesticides, irrigation technologies and mechanized crop production (Wen and David, 1992). Development policies that emphasize food production goals and targets that require intensive use of inputs further exacerbate the situation. As these policies have not been accompanied by incentives for conservation and environmental protection, the natural resource base has been degraded, particularly in areas with high potential for food production. The sustainability of farming practices in the NCP was only recognized with alarm by researchers, planners and decision-makers in 1992, when the concept of sustainable agricultural development was introduced in China. Based on this concern, some institutions conducted studies to examine the availability of agricultural resources for further production purposes. Inter alia, the research comprised:
1) Macro level studies, which covered the concept and theory of sustainable agricultural development; overviews of the sustainability of Chinese agriculture — the problems, potentials, challenges and hopes for sustainable agricultural systems. Most of these researches were strongly theoretical and fundamental, without rigorous analysis of farming sustainability in the context of specific sites.
2) Subject-oriented researches, which included analysis of crop productivity,
production potential, soil fertility and groundwater table and quality monitoring. Most of these researches were academic in nature, and disconnected from each other.
This study attempts to provide insights apropos assessment of the current state of farming practices using multidisciplinary approaches by using primary and secondary data; this has not been done for this area in the past. It assesses sustainability by employing location-specific, locally significant and possible indicators for making quantitative measurement of sustainability possible at farm levels. The study predicts the economic sustainability of farming practices by using sensitivity analysis; this is very useful for drawing a comprehensive picture of sustainability.

17
It adopts an integrated approach by blending people’s perceptions and attitudes with environmental, economic and socio-institutional conditions; the approach is vital for the identification of areas of intervention. Any effort to manage natural resources in a prudent and productive manner needs to be adjusted to local conditions with due consideration to environmental, economic and socio-institutional aspects. Policy-makers, planners and researchers need to understand the condition of production resources and associated causes, as well as the possible effects of existing policies and interventions. Farmers need to be aware of the critical state of resources and the importance of adopting environmentally friendly farming practices. Application of the case- and site-specific indicators is extremely important to achieve these targets. The findings of this study will facilitate the promotion of sustainable agricultural development by policy-makers, planners, researchers and farmers. 1.2 Conceptual Framework Analysing agricultural sustainability initially entails defining sustainable agriculture. Many views have evolved on agricultural sustainability over the last two decades. Each view is different in subtle ways, variously emphasizing different values, priorities and goals (Pretty and Hine, 2000). Some underscore ecological aspects such as maintaining agro-ecological health (e.g. Altieri, 1992; Edwards et al., 1993; Conway and Edwards, 1990), biodiversity, integrated nutrient management (Edwards and Grove, 1993) and landscape quality. Sustainable farming seeks to make the best use of nature’s goods and services, whilst not damaging the environment (Pretty and Hine, 2000). It does this by integrating natural processes such as nutrient cycling, nitrogen fixation, soil regeneration and natural enemies of pests into production processes. Lynam and Herdt (1989) and Smith and McDonald (1998) — among others — attach importance to the economic aspects of sustainability, such as net present value, benefit–cost ratio and profitability. Environmental degradation and its potential impacts on ecological and food production systems appears to be at the heart of agricultural sustainability (Brklacich et al., 1991). Despite the diversity of concepts on sustainable agriculture, there is a consensus on its three basic features. These are:
1) Maintenance of environmental quality. 2) Stable plant and animal productivity. 3) Social acceptability.

18
Consistent with these features, Cai and Smith (1994) have also suggested that agricultural sustainability should be assessed from the perspectives of ecological soundness, social acceptability and economic viability. “Ecological soundness” refers to the preservation and improvement of the natural environment. “Economic viability” refers to maintenance of yields and productivity of crops and livestock and “social acceptability” refers to self-reliance, equality and improved quality of life. Rasul and Thapa (2004) share these views. Based on the review of contributions, sustainable agriculture in this study is conceptualized as follows (Figure 1):
• Improved land-use efficiency and productivity via diverse cropping patterns (intercropping, mixed cropping and multiple cropping) for efficient use of soil nutrients, reduction of crop vulnerability to severe damage by insects and decreasing risks of food shortage and economic loss among farmers.
• Maximum use of internal resources, including indigenous knowledge and
practices, and balanced use of external resources to prevent land and water degradation, to raise farmers’ profit margins, to enhance agricultural contribution to the local economy and to reduce the risk of health hazards.
• Stable production systems arising from the balanced use of internal and
external resources to prevent possible shortage of food and loss of investment.
• Greater adoption of resource conservation technologies to control or
prevent degradation of soil and water resources. 1.3 Research Objectives The overall aim of this study is to assess the sustainability of current farming practices from environmental, economic and socio-institutional perspectives, specifically:
• Current farming practices in the context of groundwater management, soil-fertility management and pest/disease management.
• The profitability of major field crops.

19
• Support services such as extension agencies and farmers’ knowledge about sustainable farming practices.
The study also aims to recommend appropriate strategies and approaches for sustainable farming practices.
ENVIRONMENTAL SUSTAINABILITY
Figure 1. Conceptual framework
SOCIAL AND INSTITUTIONAL SUSTAINABILITY
ECONOMIC SUSTAINABILITY
Biophysical • Topography• Climate • Soil
• Groundwater management • Soil-fertility management • Pest/disease management
• Productivity • Stability • Profitability
• Amount of groundwater irrigation
• Amount of fertilizer use • Amount of pesticide use • Soil pH • Soil organic matter content • Soil nutrients (NPK) content • Depth to groundwater table • Water-use efficiency • Nitrate content of
groundwater • Nitrate content of chive
plants
• Crop productivity • Per capita grain production • Net farm income and
benefit–cost ratio
• Sufficiency of food grains • Farmers’ contact with
extension and training • Farmers’ knowledge and attitudes
DISCIPLINE FACTORS INDICATORS
AG
RIC
UL
TU
RA
L SU
STA
INA
BIL
ITY
• Food security• Extension and training • Farmers’ knowledge and attitudes

20
1.4 Scope of the Study Farming in Ningjin County is characterized by the monocropping of food grains and intensive use of external inputs. But little is known about the sustainability of the respective farming practices. This study sheds light on this less studied field by making a comprehensive assessment of the existing farming practices from environmental, economic and socio-institutional aspects. Components of farming practices in this study cover:
• Cultivation of winter wheat, summer maize, cotton and chives. • Groundwater use. • Soil-fertility management practices. • Pest/disease management practices.
The assessment of farming practices includes three dimensions of agricultural sustainability:
• Environmental sustainability. • Economic sustainability.
• Socio-institutional sustainability.
A careful selection of indicators for these dimensions has been done. Finally a total of 20 location-specific indicators have been selected: They include:
• Amount of groundwater, fertilizer and pesticide use. • Depth of groundwater table. • Water-use efficiency. • Soil pH.
• Soil organic matter content.
• Soil N, P and K content.

21
• Maximum allowable concentration of nitrate in groundwater and vegetables.
Indicators selected for economic sustainability assessment are:
• Food-grain productivity. • Per capita food-grain production.
• Net return from crop production and benefit–cost ratio.
Socio-institutional indicators include:
• Food self-sufficiency. • Accessibility to extension and training services. • Farmers’ knowledge and technologies. • Farmers’ perceptions and satisfaction apropos farming practices and
environmental conservation and extension services. Locally well-defined threshold values for respective indicators are used for the assessment. Implications of threshold levels are used for interpretation of the selected indicators. These indicators are the most significant and there is scope to measure them in the study area. 1.5 The Study Area Under Chinese conditions the selection of the study area at the lowest level is normally based on the political division, i.e. the county. A county consists of communes. Each commune consists of different numbers of villages depending on the geographical location of the villages. Under the current planning procedure, communes are the lowest level of formal planning units. Commune level development plans are incorporated into the county development plan, which ultimately goes to the District Development Plan (DDP). The DDP will be further incorporated into the Provincial Development Plan (PDP) where the final decisions are taken. The PDP will reach the county planning body and be further implemented at the county and commune levels.

22
The selection of the study area was based on the following criteria: Geographically the county of Ningjin is located at the centre of the NCP. The NCP has been defined as the food-grain production base of the country. It produces one-fourth of the country’s cereal products. Agricultural production in the area plays an important role in ensuring national food security. The county has been adopting high-input farming practices in order to ensure and maintain stable production. The sustainability of these intensive production practices has increasingly attracted the attention of academics, researchers, planners and decision-makers. Ningjin County can represent the general situation of the NCP in terms of biophysical and socio-economic conditions, as well as agricultural production conditions. The selected villages of Dongliu, Daliu, Dagen and Dongcui represent the general production situation of Ningjin County in terms of geographic and socio-economic conditions, cropping patterns and farming practices. The main reasons for the selection of the four villages are:
1) The Chinese Academy of Sciences (CAS) completed a project entitled "Evaluation of Agricultural Resource Utilization" in these villages during 1998 to 2000. The location-specific findings of the project such as availability of existing soil and water resources and current level of resource utilization by agricultural, industrial and domestic sectors can be used for the research.
2) The four villages have been selected as many of the sample sites for soil
survey and groundwater table and groundwater quality monitoring have been located here. Soil surveys have been conducted by the Soil Survey Office of Dezhou District (SSOD) with the assistance of the Soil Survey Station of Ningjin County since 1982. Groundwater table measurement and water quality monitoring have been conducted by the Irrigation Bureau of the district since 1973. The availability of site-specific data established strong bases for the investigation of change trends among soil and water resources.
No research on the sustainability of farming practices has been conducted in the area. This research will help to understand the effects of current farming practices on the sustainability of farming practices.

23
In-depth and multidisciplinary research is urgently needed so that the output of this research can be applied to the rest of the NCP.

24
2. CONCEPTS AND THEORIES OF SUSTAINABLE DEVELOPMENT The concept of sustainable development has been in circulation in various guises for several years. It acquired popular momentum with the publication of Our Common Future, the report of the World Commission for Environment and Development (WCED, 1987). The report addresses the growing tensions between environment and economy, and advocates “sustainable development as the only viable route to world political and ecological stability”. The WCED thus defined sustainable development as: “development that meets the needs of the present without compromising the ability of future generations to meet their own needs”. To make the concept more pragmatic and attainable, many authors present a variety of definitions from different perspectives. Conway (1987) provided the best-known definition of sustainability as the ability of a system to maintain productivity when subjected to a major disturbing force (stress or shock). Conway’s concept of the sustainability of any agricultural system relies on the ability of that system to recover, in terms of levels of productivity, from environmental shocks. By reviewing the definitions, it can be stated that sustainability is the ability of a system to “continue”. Some scholars indicated that there are always three distinct development processes under way at the local level as far as sustainable development is concerned: economic development, social development and ecological development. Sustainable development is the process of bringing these three development processes into balance with each other (Barbier, 1987; ICLEI, 1996; Smith and McDonald, 1998; Chen, 2000). Barbier (1987) proposes a unique set of human-ascribed goals for each system:
• Biological system (goals: genetic diversity, resilience, biological productivity).
• Economic system (goals: satisfying basic needs, equity-enhancement,
increasing useful goods and services). • Social system (goals: cultural diversity, institutional sustainability, social
justice, participation).

25
ICLEI (1996) reported that the development imperatives of the current economic system favour market expansion, externalization of costs and sustained private profit. The current imperatives of community development are:
• To meet basic human needs. • Increase economic and social equity. • Guarantee participation. • Create community self-reliance.
The imperatives of ecological development are established in natural order. Humans can support ecological development by limiting the consumption of natural resources to a rate that allows nature to regenerate resources and by reducing the production of waste to levels that can be absorbed by natural processes. This discussion has provided a basic understanding about the concept of sustainable development. It is a location- and time-specific concept. To keep the development process sustainable, one must take into consideration ecological sustainability, economic sustainability, social and institutional sustainability. The components of each aspect vary according to the status quo in different cases. 2.1 Agriculture and Rural Development The terms “agriculture” and “agricultural system” are used to encompass various aspects of the production of plant and animal materials. For many analysts, the terms are limited to the cultivation of soil and growth of plants. But for others the terms also include the processing, marketing and distribution of agricultural products, health, nutrition, food consumption as well as use and conservation of land and water resources (Cai and Smith, 1994). In a broader interpretation, agriculture is a complex process that takes place within a framework comprising biophysical, techno-economic and socio-political aspects. Each aspect has its own special implications for agriculture and for agriculture to be sustainable it must be biophysically possible, economically and technically feasible and socially acceptable. Agriculture is the basic economic activity of the world’s poorest countries. It employs 70 to 90 percent of the labour force and 30 to 60 percent of the Gross

26
Domestic Product (GDP) in low-income developing countries. The major agricultural roles in promoting economic development are:
• Increasing food supply for domestic consumption and releasing the labour needed for industrial employment.
• Enlarging the size of the domestic market for the manufacturing sector.
• Increasing the supply of domestic savings. • Providing foreign exchange from agricultural exports (Farhsad and Zinck,
1993). Its development would also enable farmers to pay the costs of health services and education. Agriculture is multi-functional within landscapes and economies — it produces food, a range of public goods and has many unique non-food functions that cannot be produced by other sectors (Pretty and Hine, 2000). Thus, agricultural growth is not only an instrument for maintaining an effective food security system but also a catalyst for income and employment generation in rural areas. However, in most developing countries, the agriculture sector has been “squeezed” (Staatz and Eicher, 1984) or “milked” (Schiff and Valdes, 1995). Policy-makers believe that promoting industry at the expense of agriculture sacrifices little in output. Thus the agriculture sector receives a relatively small share of national investment. As a result, agriculture has stagnated in some countries, and in others failed to grow fast enough to meet the food needs of a rapidly increasing population. This, in turn, has generated food deficits, malnutrition and widespread rural poverty that have characterized the developing world to this day. Finally, it was recognized that food deficits could be reduced, the incomes of the rural poor increased and the economies of rural regions strengthened only by raising agricultural productivity and creating new sources of off-farm employment. There was a strong conviction that agriculture, rather than urban industrialization, was the key to both economic growth and reduction of poverty in the vast majority of developing countries (Rondinelli, 1986). Development in predominantly rural economies should not depend on “squeezing” or “milking” agriculture for capital to be invested in export-oriented manufacturing, but focus

27
on increasing agricultural productivity and rural household income through the promotion of sustainable agricultural development. 2.2 The Concept of Sustainable Agriculture Sustainable agriculture has been referred to as an umbrella term encompassing several ideological approaches to agriculture, including organic farming, biological agriculture, alternative agriculture (Hansen, 1996; Tisdell, 1996; Sands and Podmore, 2000); ecological agriculture, low-input agriculture (Webster, 1997); resource-conserving agriculture (Francis and King, 1988); and regenerative agriculture (Altieri, 1992; Pretty, 1996; Tisdell, 1996). For the sake of simplicity, the term sustainable is commonly used by most of the researchers. The pioneers of “sustainable agriculture” were Franklin King, Lord Northbourne and Lady Eve Balfour. In 1911, King published Farmers of Forty Centuries: Permanent Agriculture in China, Korea and Japan. He indicated that agriculture could not be sustained over 4 000 years in economic, biological, or cultural terms unless it was “rooted firmly in frugality and recycling of fertilizer elements and organic materials” (Stenholm and Wagner, 1990). The concept of sustainable agriculture became popular in the 1980s. At least 70 more definitions have been constructed, each different in subtle ways and emphasizing different values, priorities and goals. Attempting to arrive at more precise, operational and absolute definitions of sustainable agriculture is extremely problematic, partly because there is such a range and number of parties involved in this debate (Pretty and Hine, 2000; Rigby and Caceres, 2001) and partly because of the different dimensions and conforming levels to assess and implement sustainability in agriculture (Wiren-Lehr, 2001) (Table 1). Table 1. Basic dimensions and conforming levels to assess agricultural sustainability Dimensions Levels Normative Spatial Temporal
Ecological aspects Economic aspects Social aspects Local Regional National Long term Short term
Source: Wiren-Lehr, 2001. Moreover, the concept emphasizes different aspects in the context of different countries and regions. As cited by Bowers (1995), in developed countries, the

28
main sustainability issues are diversification away from a limited range of commodities and the satisfaction of environmental pressure groups, particularly with respect to the large flows of nutrients and pesticides currently used. In developing countries the imperative is to maintain food production, while preserving the underlying resource base. The variety of meanings acquired by sustainability as applied to agriculture has been classified according to the issues motivating concern, their historical and ideological roots and the hierarchical levels of systems considered (Figure 2).
As an Ideology:
Sustainable agriculture concerns the long-term impact of human activities on the environment. It concerns ecological and social
realities and one’s ability to take effective action.
As a Set of Strategies
The strategy most
frequently linked to sustainability is the
reduction or the elimination of the use of
processed chemicals, particularly fertilizers and pesticides. The strategy that will facilitate the
substitution of biological technology for chemical
technology.
As the Ability to Fulfil a Set of Goals
The goals generally include some
expression of maintenance of the natural environment, provision of human food needs, economic viability and social
welfare.
As an Ability to Continue
Sustainability is the length of time that a
system can be maintained. The
ability of the system to remain the
dominant land use, maintain some level of output, to meet
human needs and to withstand
disturbances.
Sustainable Agriculture
Figure 2. Scope of sustainable agriculture (modified from Hansen, 1996)

29
Precise and absolute definitions of sustainability, and therefore of sustainable agriculture, are impossible (Pretty, 1996). Sustainability itself is a complex and contested concept. To some it implies persistence and the capacity of something to continue for a long time (Hansen and Jones, 1996; Smith and McDonald, 1998). To others, it implies resilience and the ability to bounce back after unexpected difficulties (Smith and McDonald, 1998). With regard to environmental protection, it involves refraining from damaging or degrading natural resources (Barbier, 1987; Francis and King, 1988; Simon, 1989; Altieri, 1992; Wen and David 1992; Cai and Smith, 1994; Bowers, 1995; Tisdell, 1996; Pretty and Hine, 2000). Some researchers (Pretty, 1996; Hansen and Jones, 1998) have pointed out that it is important to clarify what is being sustained, for how long, for whose benefit and at whose cost, over what area and measured by what criteria in the context of sustainable agricultural development. A sustainable agricultural system is any system of food or fibre production that systematically pursues the following goals (Pretty, 1996):
• More thorough incorporation of natural processes such as nutrient cycling, nitrogen fixation and pest–predator relationships into agricultural production processes.
• Reduction in the use of those off-farm, external and non-renewable inputs
with the greatest potential to damage the environment or harm the health of farmers and consumers, and more targeted use of remaining inputs used with a view to minimizing variable costs.
• More equal access to productive resources and opportunities, and
progress towards more socially just forms of agriculture. • Greater productive use of local knowledge and practices, including
innovative approaches not yet fully understood by scientists or widely adopted by farmers.
• An increase in self-reliance among farmers and rural people through the
better use of the knowledge and skills of farmers. • An improvement in the match between cropping patterns and the
productive potential and environmental constraints of climate and landscape to ensure long-term sustainability of current production levels.
• Profitable and efficient production with an emphasis on integrated farm
management, and the conservation of soil, water, energy and biological resources.

30
When these goals are combined, agriculture becomes sustainable (Conway, 1987; Altieri, 1992; Pretty, 1996). As such, farming and research are not concerned with high yields of a particular commodity, but rather with the optimization of the system as a whole. 2.3 Defining Farming Practices Farming practices are defined as farmers’ operations in the production system (crops, soils and animals). They are human activities that manage the use of controllable factors in order to maintain the farm in harmony with the overall purpose of farming (Sorensten and Kristensen, 1992). According to Altieri (1992), farmers can improve the biological stability of the system by choosing more suitable crops or developing methods of cultivation that improve yields. The land can be irrigated, mulched, manured or rotated, or crops can be grown in combinations to improve the resilience of the system. Pesticides can be replaced by biological and mechanical methods for controlling pests, weeds and diseases; inorganic fertilizers can be substituted for livestock manure, composts and nitrogen-fixing crops. Research conducted in the humid tropics (NRC, 1993) shows that the wide array of specific farming practices associated with sustainable agriculture includes the following elements:
• Low-impact land-clearing techniques.
• Mulches, cover crops and understorey crops.
• Moderate use of fertilizers and soil amendments.
• Zero- and low-tillage planting techniques.
• Increased use of legumes as feed crops, as cover crops and in fallows.
• Improved fallow management.
• Greater use of specially bred and alternative crops, grasses, shrubs and trees (especially those tolerant of acid, saline, and high aluminium soil conditions).
• Contour cropping and terracing.

31
• Biological and integrated pest management strategies.
• Agroforestry systems.
• Intercropping and mixed cropping methods that allow for more efficient
use of farm resources. Many practices are being applied in different parts of the world. The particular methods that are most appropriate in any given locality will vary both within and among the world’s regions. Local needs and opportunities, ecological circumstances, economic opportunities and social and cultural mores, as well as the status of land and water resources will determine which methods are most suitable. Sustainable agricultural systems cannot, in this sense, be imported. 2.4 Factors Influencing Agricultural Sustainability Water resource management Effective water conservation, equity in water sharing and efficiency in water delivery and use are important for sustainable management of available surface and groundwater resources. Irrigation is considered to be a costly but important investment in less developed countries. It acts not only as an input but also more importantly as a catalyst for advancing agricultural technology. In many parts of the world, attempts to maintain an adequate supply have led to overexploitation of groundwater resources that causes long-term lowering of groundwater levels (Khepar and Sondhi, 1999; Liu et al., 2001). Lowered groundwater levels also lead to increased costs of groundwater pumping, failure of borehole supplies and deterioration of water quality by saline intrusion. The impacts of overexploitation are thus not only environmental, but also extend into economic and social fields. Water quality is also essential for irrigation. In many cases, brackish or low quality water is used as the only source of water available for irrigation. This has resulted in several environmental impacts such as soil modification, changes in ground- and surface water, socio-economic impacts, public health issues and effects on flora and fauna (Kandiah, 1990). In India, for instance, waterlogging and salinity have taken place in many canal command areas, resulting in a drastic decrease in crop yields (Khepar and Sondhi, 1999). All these effects are threatening the sustainability of the system and call for special efforts to achieve sustainable use of water.

32
Soil-fertility management Plant nutrient resources There are 16 essential nutrients for satisfactory growth and development of crops. Nitrogen, phosphorus and potassium (NPK) — mostly deficient in soils — are needed in large amounts for crop growth, development and higher production. They are called macro elements or primary nutrients. The secondary nutrients such as calcium, magnesium and sulphur are needed in lesser quantity and micronutrients — boron, chlorine, copper, iron, manganese, molybdenum and zinc are important to plant life but needed in very small quantities. The major source of plant nutrients is soil but soils have limited reserves of these nutrients. In arable farming where continuous cropping is a regular practice, many nutrients are removed during harvesting. Unless they are replenished through internal and external inputs, soils become degraded resulting in decreased soil fertility and crop productivity. The major supply sources of plant nutrients are plant residues and organic manure including animal wastes, legumes and inorganic fertilizers. Water and air are also the source of some nutrients such as carbon, hydrogen and oxygen. Soil nutrient balance The balance of the basic nutrient pool in the agro-ecosystem is very important in sustainable agricultural systems. Plant nutrients in agro-ecosystems are lost mainly via crop harvesting, leaching, runoff, volatilization and fixation (Figure 3). In general, through inefficient management of purchased inputs many resources are lost. Consequently, nutrient levels of soil ecosystems tend to decline rapidly if they are not replaced. In conventional agriculture nutrient replenishment is made mainly with inorganic commercial fertilizer. Rational use of external inputs The necessity and level of external inputs are always points of argument. One point is that high-external input agriculture (HEIA) is unsustainable because it uses excessive and unbalanced artificial inputs that have serious ecological, economic and socio-political repercussions and it depends heavily on artificial chemical inputs (Tisdell, 1996; Gyaltshen, 2000; Huda, 2000; Chen, 2000; Cao and Jiang, 2000; Koma, 2000). Another point debates the sustainability of low-external-input agriculture (LEIA). Many scientists argue that minimum but not zero levels of external inputs are optimal. An increase of external inputs is ecologically benign or beneficial if it maintains the nutrient levels and organic material of soil and is a necessary condition for agricultural sustainability (Barbier, 1987; Webster, 1997; Huda, 2000). Studies in Mali, Benin, Zambia and Tanzania provide examples of resource degradation due to inadequate chemical inputs (Hansen, 1996).

33
Figure 3. Conceptual model showing major nutrient gains and losses in agro-ecosystems (Modified after Follett et al., 1987) Therefore any farming system — whether chemically intensive or natural — can be considered in some aspects to be resource-conserving and in other aspects to be wasteful, environmentally unsound or polluting. Careful consideration must be given to agricultural practices that help to minimize environmental pollution while simultaneously enhancing the sustainability of food production systems.
Biological nitrogen fixation
Compost Green manure
Farmyard manure
Mineral fertilizers
Crop residue
Nutrient balance in a farming system
Erosion losses Removal by crops
Losses by runoff
Leaching losses Volatilization
+
-

34
The relationships between inputs used and the sustainability of agriculture can be identified (Table 2). Table 2. Contingency table for inferring sustainability based on trends of system inputs and outputs
Outputs Inputs Decreasing Constant Increasing
Decreasing Constant Increasing
Indeterminate Sustainable Sustainable
Unsustainable Sustainable Sustainable
Unsustainable Unsustainable Indeterminate
Source: Smith and McDonald, 1998. An optimum input level is required to ensure production while conserving production resources. The optimal level of input (fertilizer, for example) use is the amount at which the marginal product (MP) is equal to the price of the unit of input to a unit of yield. In other words the optimal level of input use occurs at the point where the added benefits are equal to the added costs. This relationship is illustrated in Figure 4. The total production (TP) is divided into three zones by two points — the point at which average production (AP) is maximum (at X2 level) and the point where marginal production (MP) is zero at X3 (Figure 4b). The first stage that occurs from the origin 0 to X1 is the region where TP is increasing at an increasing rate. The second stage starts from X2 at which AP is maximum (B′) and continues to the point where MP declines to zero (C′) at X3 input level. The TP in this zone is increasing at a decreasing rate. The third stage that covers the area beyond the X3 input level is where TP is declining and/or MP is negative. Zone I is called the irrational zone of production for a rational producer as TP is increasing at an increasing rate and a smaller quantity of input can give greater total output. Similarly Stage III is also known as the irrational zone because MP is negative hence each additional unit of input brings a decrease in total output. It is a case of overutilization or wastage of input resources relative to increase in yield. A corrective measure could be made in both irrational zones, for example by increasing more of the input in Zone I and by using less of the inputs in Zone III. The only area where a producer can avoid the irrationality is Zone II. Even if AP and MP are falling in Zone II, TP keeps on increasing which clearly suggests the zone’s economic relevance. An efficient farmer can locate any point within the second point of inflection (B) up to the third inflection point (C) where TP is the

35
highest. It is therefore recommended that the most profitable level is not that level at which total yield is greatest
Figure 4. Three stages of production for one variable of input holding other inputs constant Source: Dahal, 1996

36
Pest and disease management The widespread and intensive use of agrochemicals, especially pesticides, has emerged as a central issue in sustainable agricultural development. Largely, this is because chemical control now dominates pest management in many developing countries and many farmers routinely apply pesticides in attempts to eradicate pests. As pests — whether they are vertebrates (mammals, birds), arthropods, nematodes, fungi, bacteria, or weeds — are all living organisms, all chemical pesticides that are designed to control them are, therefore, of necessity biocides in some ways. Some (e.g. organo-chlorine insecticides) are extremely stable compounds and can persist in the environment for many years while others, such as fumigant nematicides, may break down in a few hours or days. The negative effects arising from excessive use of pesticides are numerous; many are well established while additional new threats have emerged recently. They include effects on pest ecology, effects on domestic species, wildlife and other living organisms, reduction and loss of biodiversity, pesticide contamination of food and food chains, environmental pollution, impacts on humans and concomitant hormonal effects. Pertaining to harm on human health, for instance, both acute and chronic poisoning have long been reported, although death may not frequently result. For example, 28 percent of 153 vegetable growers surveyed in Malaysia suffered poisoning symptoms, including headache, dizziness, nausea, and general fatigue soon after spraying operations (Dhaliwal et al., 1999). Research shows that farmer health costs increased by 0.74 percent for every 1 percent increase in insecticide dose (Soon, 1999). The health impairments included eye, skin, lung, cardiovascular and neurological diseases. Today, pesticide contaminants in food and food chains have been found in many market products, particularly fresh fruit and vegetables. The widespread occurrence suggests that many unsurveyed produce may contain excessive residues. Contamination of the environment has also resulted because many pesticides do not reach their targets but instead end up in the crops, other vegetation, animals, soils, or water. Persistent pesticides usually end up in soils or aquatic sediments in waterbodies (Soon, 1999). The adverse impacts of pesticides are generating great concern because new instances are increasingly being reported as more researches and studies are being carried out. Integrated Pest Management (IPM) is commonly advocated and most widely adopted. IPM attempts to integrate available pest control methods to achieve the most effective, economical and sustainable combination

37
for farmers in a particular local situation. Emphasis is placed on biological control, plant resistance, cultural control and other non-polluting methods. Pesticides are used only as a last resort and only when benefit–cost analyses show that their use is truly justifiable and acceptable alternatives are absent. Agricultural extension As defined by Maunder in the Food and Agriculture Organization (FAO) reference manual, agricultural extension is “a service or system which assists farm people, through educational procedures, in improving farming methods and techniques, increasing production efficiency and income, bettering their levels of living, and lifting the social and educational standard of rural life” (1973, cited in Axinn, 1988). Agricultural extension is commonly identified with activity whereby agricultural workers interact with and teach farmers improved farming practices, new techniques and more productive or more efficient technologies or packages of technologies (Axinn, 1988). The basic philosophy of agricultural extension is to help improve the quality of life of rural farmers through educational means, convincing and motivating them to make wise use of scarce farm resources. It is also a vital linkage between research and farmers or scientific inquiry and practical application. The link between research and farmers is shown in Figure 5. A necessary condition for sustainable agriculture is the motivations, skills and knowledge of individual farm households (Pretty, 1996). Farmers need to know how soil fertility can be improved, how farm resources can be used more efficiently, how pests and diseases can be controlled and how farm resources can be combined to have the greatest possible synergetic effects. Such knowledge and technologies, being generated by research, have to be transferred to farmers through agricultural extension workers. Extension personnel facilitate the dissemination of messages, not only about improved seed varieties, but also about fertilizer and water requirements, and other necessary cultural practices (Axinn, 1988). Different countries have adopted many approaches to extension. There are eight major approaches introduced by FAO (Axinn, 1988):
1) The general agricultural extension approach.

38
2) The specialized commodity approach. 3) The training and visit approach. 4) The agricultural extension participatory approach. 5) The project approach. 6) The farming systems development approach. 7) The cost-sharing approach. 8) The educational institution approach.
Each approach was conceived as appropriate for particular circumstances, and each has its own advantages and disadvantages. The adoption of a specific approach should be based on local situations and the advantages of the approach. However, despite great successes in agricultural extension in different part of the world, it has faced many problems and constraints. As summarized by Axinn (1988), the main constraints can be derived from both internal and external sources. Major internal constraints include the dearth of technologies that fit local situations, and which, if adopted, will result in a significant increase in production, a reduction in cost, or other ways that benefit potential users. It is difficult to develop an extension programme that is relevant to the needs and interests of farmers throughout the area covered; moreover professional field staff of most agricultural extension systems have to be nurtured vis à vis knowledge, remuneration and motivation. External constraints mainly concern the effectiveness of the extension system and its financing. Due to manifold constraints, few farmers in developing countries accept extension workers’ recommendations. There is a loose linkage between research, extension and client systems and more evidently the research sub-system is effectively insulated from direct contact with farmers.

39
Technology Generation Transfer of Technology Application of Technology System
Process
Goal
RESEARCH • Institute/U
niversity
EXTENSION • Extension
Officers
FARMERS
Support Services
Infrastructure
Feedback
INCREASED PRODUCTION
IMPROVED QUALITY OF LIFE FOR RURAL PEOPLE
Figure 5. Extension — the link between research and farmers (modified from Dahal, 1996)

40
Marketing The development of agricultural markets is essential for agricultural production because they can ensure input supply for and financial benefit from production. Despite technical breakthroughs in agriculture in the Asian region during the last few decades, it seems that the economic reward reaped from increased productivity was hardly enough to compensate the farmers for their efforts owing to inadequate marketing activities. When the marketing system does not function smoothly, small farmers suffer tremendous economic losses despite large harvests. Input supply in the market, in particular fertilizers and pesticides, is a major factor influencing agricultural development as diversified agricultural production requires a package of input supplies. Easy access to markets (compared to subsistence farming) favours high-input agriculture. In many cases, increased access to markets reduces the use of conservation farming practices. In Xishuangbanna, China, for example, a number of hilltribes grow maize on sloping lands to obtain cash supplements to their subsistence income, thereby generating increased soil erosion. On the sloping coastal lands of Queensland, access to markets has encouraged the planting of bananas, sugarcane and pineapples at the expense of cattle grazing and forestry, thereby adding to soil erosion from such land (Tisdell, 1996). However, difficult access to markets often causes inadequate input supply and application, which limits yield increase and food supply (Dahal, 1996; Rahman, 1998). Major marketing problems faced by Asian farmers are: Small-scale farming: Most farms are small with less than one hectare of land in scattered areas. Therefore, direct marketing by individual farmers becomes impossible due to the difficult access to the markets. Poor physical infrastructure: Farm and market road links are underdeveloped in most developing countries. This makes it difficult for farmers to take the products to markets and therefore leads to insufficient commodity supply in the markets on the one hand, and deterioration of products on the other. Lack of market facilities: Most rural markets lack physical facilities such as market outlets, permanent stalls, storage facilities and sanitary facilities. Farmers have difficulties in such markets where there are no potential buyers. Credit services Transfer of technology to farmers depends on timely availability of inputs including credit. Farm credit has been a key policy measure in the modernization of agriculture. It has not only facilitated the adoption of new technology but also

41
hastened the commercialization of the rural economy by providing the financial resources needed for productivity development. Credit may be informal or formal, private or state in origin. Informal credit channels refer to financial resources provided by moneylenders (rich farmers, traders, and others in the rural economy who lend money on the basis of personal knowledge of each transaction). Formal credit channels are those bound by national legal regulations; they include private banks, registered cooperatives, and a host of other operations. In Thailand, the farm credit situation is dominated by commercial banks and the Bank of Agriculture and Agricultural Cooperatives (BAAC), which altogether account for 85 percent of total farm credit. The remainder is drawn from other sources, both private and public financial institutions, including individuals. The aforesaid banks have catered to the needs of farmers and agribusiness enterprises; in particular, the BAAC, which concentrates on farmer clients, agricultural cooperatives and farmers’ groups (APO, 1996).

42
3. PRACTICES AND POLICIES FOR SUSTAINABLE AGRICULTURE IN CHINA 3.1 Sustainable Agriculture in the Context of the North China Plain (NCP) Agricultural production in the NCP is characterized by input-intensive production. Agricultural sustainability in the context of the NCP is defined as the farming practices that grow crops at a profit while minimizing negative impact on the environment. Moreover, sustainable agriculture should also emphasize the ability of the system to continue into the future. Specifically, it should imply the following (Figure 6):
• Crop intensification, respecting the land’s carrying capacity. • A rational use of external inputs such as chemical fertilizers,
pesticides and groundwater. • The inherent qualities of soil and water resources are maintained or
improved and no drift of nutrients, chemicals or sediment occurs from the system.
• Profitable and stable production with an emphasis on increasing
production, per capita products and net farm income. • Strengthened institutional support. • Improved knowledge and technologies regarding resource
conservation.
Rational use of external inputs and maintained and/or
improved soil and water quality
Crop intensification respectingthe land’s carrying capacity
Profitable and stable production
Improved conservation
knowledge and technologies
Strengthened institutional support
Sustainable Agriculture
Figure 6. A sustainable agriculture model for the North China Plain

43
3.2 Key Issues of Sustainable Agriculture in China Population, environment and development are three of the most important issues confronting the global society. China is facing major challenges from population pressure and environmental degradation in its development process. Agriculture, as a fundamental sector for producing food for a population totalling 1.2 billion, is playing a very important role in China's social and economic development. After more than 40 years of development, the Chinese conventional agricultural development pattern, which is highly dependent upon resource consumption and manufactured agricultural inputs, has encountered a critical stage where resources and the environment have become fragile and unsustainable (Liu, 1995). Facing this resource and environmental challenge, the Chinese Government, development researchers and planners have to reconsider the development patterns over the last decades. The concept of sustainable agriculture was introduced into Chinese agriculture in the early-1990s. Since then, a number of policies and technical operations have been implemented to rehabilitate degraded resources and the polluted environment. Despite these efforts, agricultural resources and the environment are still under the threat of further degradation. This section reviews key issues and practices of sustainable agricultural development in China. Population pressure and food security The question of “Who will feed China” has galvanized policy-makers and policy seekers, alike. The average share of arable land, forestland and grassland per capita in China is only 0.11, 0.17 and 0.22 ha, respectively. This is significantly lower than the world average, or 35, 19 and 32 percent of the world average of arable land, forestland and grassland per capita. In addition, average amounts of water resources per capita in China are about 2 500 cm, or 25 percent of the world average. However, China's population is growing at a rate of about 15 million per year. This growing population, combined with changing demand for food, is already exerting enormous pressure on the limited natural resource base for agriculture and rural development. Food grains constitute the principal crop grown in China; the main food grains are rice, wheat, maize, millet and sorghum. Sweet potatoes, more popular than white potatoes, are widely grown for food throughout China, as are rapeseed, peanuts and soybeans, from which oil and other foods are produced. The most important commercial crop is cotton.

44
The socio-economic aspect stressed by the definition of “sustainability” brings in the question of food security that has been advocated to ensure self-sufficiency in food grains. Examination of the aggregate time series data shows that, with some fluctuations, and possibly with changes in contributory factors, the long-term growth of food-grain production has been sustained at about 2 percent a year over the last four and half decades. Analysis further indicates that about 20 percent of this growth occurred owing to an increase in cultivation area; about 80 percent was contributed by rising productivity (Zhang, 1995). Thus, it is the yield increase that played a major role in the growth of food-grain production, because the area under arable cropping became stagnant after the mid-1960s. Per capita food-grain production reflects the food security situation. The consensus is that per capita food-grain production has increased from 208 kg per capita per year in 1949 to 387 kg per capita per year in 1999, which is still below the national standard of 400 kg per capita per year. As far as population growth is concerned, the total population will inevitably increase and will reach 1.4 billion by 2020 and 2.5 billion by 2050 (He, 1991). However, according to estimations, China’s food production can support only 1.66 billion by 2050 (CNRII, 1991). Therefore, food self-sufficiency will be a huge problem in the years to come. Intensive use of external inputs In China, agricultural production and production systems have been examined from the angle of sustainability since the late 1980s. The obvious step seems to increase domestic production in the country through intensive use of external inputs such as fertilizers, pesticides, irrigation and labour. Accordingly, the cost of the production of major field crops is higher in China than in other countries. Out of the total production cost, for instance, the cost of chemical inputs such as fertilizers and pesticides in China is higher than other countries. The labour cost for crop production is also significantly higher than other countries (Huang and Ma, 2000). Environmental degradation Limited resources and growing population are basic causes of resource and environmental degradation (Qu and Li, 1992). While development policies have successfully increased food production and industrial output over the past 15 years it is apparent that this has been achieved at a significant environmental cost. Depletion and pollution of water resources, land degradation, soil erosion, loss of biodiversity, desertification and deforestation are now sufficiently

45
widespread that they constrain further economic growth in the agriculture sector. The following cases illustrate the major aspects of environmental degradation. Case 1 — Drying up of the Yellow River due to overuse in the upper reaches: The Yellow River has been viewed as the cradle of Chinese civilization. However, over the last 20 years, water exploitation in the provinces of the upper reaches has caused the river to dry up many times in the provinces of the lower reaches, such as provinces located in the NCP. The duration of the river’s desiccation has increased from 40 days in the early 1990s to 200 days in 1997. This seriously affects agricultural production in these regions. Case 2 — Diminishing water tables of the 3-H region and degradation of water quality: The Huang, Hui and Hai rivers or the 3-H region is located in the North and Middle China Plain, which is the food-grain production base of the country; it is characterized by intensive farming systems and high population density. Over the past 30 years, through the introduction of new technologies and land transformation, the level of production in this region has doubled. To attain this high level of production, farmers have had to intensively pump groundwater in order to supplement natural rainfall. The total reserve of groundwater has therefore been in decline for long time. According to a recent resource survey, the groundwater table in this area has decreased by 150 cm annually in the last five years (Huang and Ma, 2000). It is estimated that each metre drop in the groundwater level will double the pumping cost over the next ten years. The area of land subsidence and land fissures has also increased here (Liu et al., 2001). Groundwater depletion has affected interaction between fresh and saline groundwater, and as a result, some farmland areas can no longer be irrigated and have gradually become saline. Case 3 — Water pollution due to overuse of chemical fertilizers and pesticides: Intensive use of N fertilizers has caused serious N pollution of groundwater in some farming areas. This is already threatening potable water both for humans and animals (Huang et al., 2000). It has also seriously polluted the surface water in coastal areas. An alarming number of species, such as sweet water crabs and native fish in the Chili Bay area are extinct due to intensive use of DDT and other organophosphate and chloride pesticides. Moreover, about 24 percent of the total cropland is polluted by pesticides, depending on the measured residues (NBCARG, 1998). High pesticide residues have also been identified in agricultural products, especially in vegetables and fruit, in intensive farming areas. Case 4 — Degradation of the Northern China grasslands: According to a recent resource survey, about 50 percent of the Northern China grassland is threatened

46
by desertification, wind erosion and serious quality and productivity degradation due to overstocking of livestock on grassland, improper grazing management and sandification. Desertification and degradation have affected the local climate negatively and the basic livelihoods of herders. Under such fragile biological conditions, livestock production systems are unsustainable. Case 5 — Desertification: According to estimations (Qu and Li, 1992), about 2 000 km2 of land are desertified annually and become wasteland. Desertification is now seriously affecting farming areas and basic ecological conditions. The reasons for desertification are exploitation of grassland areas by farming, damage to natural vegetation in the hilly areas and overgrazing of grassland. The consequences of deforestation have been soil and water erosion and desertification of the land. According to estimates, the total erosion area in China is 1.8 million km2. 3.3 Sustainable Agricultural Practices in China Faced with serious resource and environmental degradation, researchers specializing in development, resources and the environment as well as government officials have begun to question how long available resources and the environment can continue to support conventional agricultural development systems. To combat degradation, biological agriculture patterns were developed and demonstrated in some areas at the end of the 1970s and early 1980s. In 1994, as a follow up to the International Environment and Development Conference held in Rio de Janeiro, the Chinese Government formulated an interministerial Agenda to deal with population, environment and development issues. At the same time, relevant action has been implemented in different sectors under the guidelines set forth in the Agenda. Some examples of these efforts are presented hereunder. Biological agriculture A pattern of biological agriculture was developed and put into practice at the beginning of the 1970s by Chinese agronomists and farmers. The basic philosophy of this pattern is to harmonize the relationship between agriculture and natural resources and the environment by adopting traditional, indigenous farming technologies and introducing modern technologies. The main approach to biological agriculture follows resource re-cycling and food chain principles to coordinate farming system and production activities. Trying to use and re-use natural energy, natural biological resources and

47
harmonize the conflict between production output and resource inputs are key considerations. Up to the mid-1980s, 458 biological agriculture demonstration projects had been successfully implemented. Now about 1 200 pilot projects exist throughout the whole country, covering 6.67 million ha of arable land. Integrated Pest Management (IPM) From the 1950s to the 1970s, pest management in China mainly relied upon conventional chemical methods. This caused a number of environmental pollution problems, and had a negative effect on the population of pests’ natural enemies and quality of water. In 1975, after a reconsideration of conventional pest and disease management patterns, the Ministry of Agriculture introduced the IPM concept into the plant protection policy. In 1986, the Ministry of Agriculture proposed IPM, and pilot projects involving 6.7 million ha were implemented in different provinces. The main components of these projects were biological pest management, crop resistance breeding, altered cropping patterns and improved cultivation technologies for reducing pest and disease epidemics, and genetic engineering technologies for changing the genetic characteristics of the pests, inducing their death. Water conservation agriculture China has very limited water resources for agriculture, especially in the NCP. To avoid conflicts, agronomists and farmers have jointly developed and adopted different kinds of water conservation technologies since the mid-1980s. Demonstration projects have been implemented in the 3-H region with very good results. The introduced measures are:
• Improving irrigation schema for increasing the efficiency of irrigation water. Introducing water conservation irrigation technologies.
• Using plastic film in the field to prevent water evaporation from the soil.
• Cultivation technologies that use available water resources more
effectively.
• Drought-resistant breeding and farming systems. Through the application of integrated water conservation technologies, the use of water for irrigation can be reduced by 30 to 50 percent. This technology is particularly effective in the 3-H region.

48
Control of grassland degradation in northwestern China Since the mid-1980s, with international support (FAO, UNDP, ADB, IFAD), central and local governments have implemented several grassland rehabilitation projects. Recommendations have been made to local institutions and herders. The main thrust of the recommendations is to strengthen grazing management at the community level and implement grassland laws and regulations, close degraded grassland for rehabilitation, establish artificial pasture and rehabilitation through seeding and increase the supply of inputs and reduce the stocking rate through linking grassland livestock production with feedlots in the farming areas. 3.4 Agricultural Policies and Plans in China Since 1949, China has had a centrally planned economy based on the Stalinist model. From 1953 to 1990, seven five-year plans were implemented to coordinate economic development. The First Five-Year Plan (1953–1957) concentrated on the development of heavy industry financed with Soviet assistance; a minor objective had generally been to increase agricultural production through the establishment of agricultural cooperatives. The Second Five-Year Plan (1958–1962) emphasized the establishment of rural communes and the need to develop agricultural sectors by enhancing agricultural research. The Third and Fourth Five-Year plans (1966–1970 and 1971–1975) were disrupted by the Cultural Revolution. An ambitious Ten-Year Plan (1976–1985) calling for modernization in all sectors was initialized in 1978 but was soon abandoned in favour of new adjustments and reforms. The Fifth Five-Year Plan (1976–1980) addressed balanced development between agricultural and industrial sectors. The first to fifth five-year plans were made during a period when China adopted a planned economic system; the sixth, seventh, eighth and ninth five-year plans were carried out in a transitional period when China switched from central planning to a market economy system. The Sixth and Seventh Five-Year plans (1981–1985 and 1986–1990) were designed to attain long-term strategic goals to increase the nation’s agricultural output. During the 1980s the government also pursued a series of reform policies to increase productivity in agriculture through decentralization and to open the door to foreign investment. It was only in the Sixth Plan period that output targets were fixed. Agricultural production was planned to increase by 4 percent — mainly food grains and cotton. In September 1982 the government adopted a new programme designed to quadruple the gross annual value of the nation's agricultural output by the year 2000. In the Seventh Plan period, increase of agricultural production aimed to be 6.7 percent.

49
The Eighth Plan (1991–1995) focused on intensification, diversification and commercialization of agricultural development. The Ninth Plan (1996–2000) emphasized the stable increase of food-grain, cotton and oil crop production. Major strategies addressed reservation of arable land for food grains, enhanced agricultural research and extension, increased adoption of agricultural technologies, increased supply of agricultural inputs, including chemical fertilizers, pesticides and HYVs, improved quality of products and consolidated development of agricultural markets. The Tenth Plan (2001–2005) is a "dividing line" in the history of China's five-year plans. A new feature of the Tenth Plan is that great prominence has been given to the conservation of soil and water resources, apart from the emphasis on the increase of food-grain production and promotion of diversified crop production. In particular, the government spent 8 billion yuan (US$963 million) during the Tenth Plan to update agricultural technology. Updated technology will improve agricultural productivity, increase farmers' income and hone their skills. Water conservation irrigation methods, high-yielding crop cultivation, farm produce processing, higher production in the animal husbandry sector, pest prevention and fighting diseases will be the priority areas for technology development. It is obvious that the Plan considers the most vital components of sustainable agricultural development such as irrigation, production enhancement and resource conservation. Apart from government plans, the government has promulgated policies in order to improve agricultural production, ensure food self-sufficiency and conserve production resources such as soil and water. These policies are elaborated on hereunder. Land policy Land policy has a major impact on agricultural development. The most successful dimension of rural reform in China has been the development of farm households as the major production unit. In the short span from 1979 to 1984, China metamorphosed from contracting output to households to contracting the whole production process to households. By the end of 1984, farm households became the basic units of agricultural production and the foundation of the rural economy.

50
Landownership is vested in the national government but the user rights of farmland were transferred from the collective, i.e. the brigade under the people’s commune, to individual households under a system of contracts. This is the so-called household contract responsibility system. Farmers can possess land usufruct rights through land contracts. The term of land contracting can be extended by another 30 years and a turnover mechanism for land-use rights has been established for the first time in history. The collectives may adjust land distribution and use according to the local situation. The sale, rent and transfer of land owned by the collectives are banned unless the government, at least at the county level, officially designates land for non-agricultural use. Under this land policy, rural land has been distributed among farmers according to their family size. Plots are further divided to ensure fair distribution of good quality land. Each family bears sole responsibility for tilling the land. Land allocation schemes are not homogenous across China’s provinces or regions. Upper level officials mostly have left the details of land allocation to the localities, and the rules of allocation vary widely from village to village. Based on the amount of land they are allocated, the households have to sell a predetermined quota that is purchased by the state or collective. All the production above the quota is at the disposal of the households for their own consumption or for private sale. Policy for land reservation for food grains Food-grain production is underscored by reserving more than 80 percent of arable land for food grains, according to the policy. The purpose of this policy is to ensure sufficient food production and therefore, food security. Farmers cannot transfer such reserved areas into other uses such as construction and industry. The grain quota is assigned from the top through communes to the households. The household is the ultimate generator of production. Upon completion of the grain quota to the state, the remaining staple grain belongs to the household. In principle, the households have the autonomy to decide what and how much to grow as long as the production task is fulfilled and have the right to select varieties to fit the local situation. In reality, the direct planning of the production, particularly food-grain production in the NCP, always leaves no margin to the households for flexible use of limited production resources. Farm price policy Due to the dominant role of food grains in the Chinese economy, the policy decisions pertaining to food-grain prices, particularly wheat, rice and maize

51
prices, have been the central issue in the farm price policy and the term “food-grain price policy” has been virtually synonymous with “farm price policy” in China. The objectives of farm price policy have been stated in many different ways with shifting emphasis depending on the general economic situation and the stage of economic reforms in the country. The market system for food grains has also experienced many changes over time, such as from complete control to free-market transactions, from free-market to partial control, back to complete control. Currently, purchasing and marketing of food grains (mainly rice, wheat and maize) and cotton are monopolized by the state. The government creates the floor price for food grains and cotton and controls the purchase and sale of these products mainly to ensure food security and economic and social stability nationwide. All other agricultural products are traded on the open market with production adjustments being determined by market forces. The problem of determining government purchase prices for major grains is closely related to such aspects of the economy as farm income, consumer welfare, the general price level and rural incentives for increased production. Policy-makers are particularly sensitive to the effects of grain prices on urban consumers’ living costs and the general price level. Therefore, the government’s major emphasis is directed towards maintaining low prices for urban consumers rather than towards farm income support. The farm-gate price remains very low, which is the main constraint for farming income. Marketing policy To provide more food, China adopted a more open market to reform its agricultural system. After 1992, with the establishment of the objectives of building a market economy structure and rapid growth of the national economy, there have been increasing opportunities for the reform and development of agriculture. The government encourages people to participate in trade and service sectors in order to ensure the flow of goods and services. Farmers can market their products directly in the markets and decide production activities according to market demand. One important feature of market policy is the marketing of food grains. The government supports standardized central and regional food-grain wholesale markets, and establishes food-grain reserves that can retain a large stock of food grains against market-instability. The government also controls grain imports and exports to moderate production fluctuation.

52
After China entered the World Trade Organization in 2001, an expanded overseas market was opened to farmers. Farmers have more opportunities and challenges to compete with international markets. Water and soil conservation policy The policy addresses rationale use of agricultural resources such as soil and water for more productive use and conservation of the resources. Surface water, such as river water, should be used according to the quota allocated to different areas, groundwater use should be based on the supply situation and overexploitation should be strictly prohibited, according to the policy. Soil should be used in a balanced way in terms of soil nutrient removal and addition. Soil utilization without proper conservation should be prohibited.

53
4. MEASURING AGRICULTURAL SUSTAINABILITY A fundamental step to formulate policies for sustainable agricultural development is finding quantitative indicators; otherwise, it is impossible to judge the exact nature of change — whether increasing or decreasing the order of development (Lo and Xing 1999). According to Senanayake (1991), developing a quantitative measure of sustainability is an important prerequisite to the development of legislative measures for agriculture, such as those being enacted in many countries today. Sustainability indicators are the most prolific, available method for sustainability evaluation within the literature. 4.1 Sustainability Indicators Sustainability indicators are defined as indicators that provide information, directly or indirectly, about the future viability of specified levels of social objectives such as material welfare, environmental quality and natural amenity (Braat, 1991). Pretty (1995) argued that: “At the farm or community level, it is possible for actors to weigh up, trade off and agree on these criteria for measuring trends in sustainability. But as we move to high levels of the hierarchy, to district, regions and countries, it becomes increasingly difficult to do this at any meaningful way”. Pretty goes on to say that when specific parameters or criteria are selected, it is possible to say whether certain trends are steady, going up or going down. At the farm level, for example, practices causing soil to erode can be considered to be unsustainable relative to those that conserve soil. Practices that remove the habitats of insect predators or kill them directly are unsustainable compared with those that do not. Forming a local group as a forum for more effective collective action is likely to be more sustainable than individuals trying to act alone. Many indicators that assess agricultural sustainability are found in development, economic and environmental literature. Walker and Reuter (1996) recognized that they fall into two types: condition indicators and trend indicators. Condition indicators are those that define the state of the system relative to a desired state, or those that can be used to assess the condition of the environment. Trend indicators are those that measure how the system has changed, or those that can be used to monitor trends in conditions over time. This type of indicator may be used to detect historical development trends or sudden shifts in the past, i.e. retrospective evaluation in a more general sense. The indicators need to be placed within the local context and cover ecological, economic and social aspects.

54
Sustainability indicators proposed by different scientists Barbier (1987) introduced genetic diversity, biological productivity, equity enhancing, social justice and participation, based on his review of the concept of sustainable economic development as applied in the Third World. For instance, in rural settings, increased productivity of agro-ecosystems and its equitable distribution among livelihoods is considered to be sustainable. Lynam and Herdt (1989) proposed net present value (NPV) from benefit–cost analysis as the conservation criterion in the research identifying differences of agricultural systems. They believed that a sustainable system has a non-negative trend in total productivity over the period of concern. Thus, their measure of output is the economic value of output divided by the value of inputs, and will depend not only on physical productivity but also on prices. If the NPV is greater or equal to one, then the system is sustainable from the economic perspective, and the farming enterprise would not operate at an economic loss. However, this measurement was challenged by Tisdell (1996), as not reflecting the profit that is very important from the economic perspective because conservation projects will not be sustainable unless they are economic and remain so. He then proposed a parallel indicator: the ratio of output value less input value and divided by input value. This indicator must satisfy the constraint or side condition that it be equal to or greater than zero, otherwise the projects are not economically sustainable. Simon (1989) clarified the performance indicators of agro-ecological systems based on his review on sustainability thinking (Table 3). He considered sustainability as the central focus, linking the physical environment to local human activity and the wider political economy. He believed that the land tenure system can reflect social equity. Brklacich et al. (1991) summarized six perspectives in assessing sustainable food production systems. Sustained yield and production viability perspectives drawn upon economic views of resources, which refer to output levels that can be maintained continuously and the capacity of primary producers to remain in agriculture, respectively. Product supply and security focuses on the adequacy of food supplies. Equity is concerned with the spatial and temporal distribution of products derived from resource use. The environmental accounting and carrying capacity perspectives are rooted in the resource stewardship or land ethic view of resources. Environmental accounting identifies biophysical limits for agricultural production, and carrying capacity refers to the maximum population levels that can be supported in perpetuity. Many studies of sustainable agriculture cover more than one of these perspectives, indicating the concept is complex and embraces issues relating to biophysical, social and economic environments.

55
Table 3. Sustainability indicators proposed by different scientists
Sources Environmental Economic Social Barbier (1987)
• Genetic diversity
• Increased productivity
• Equity enhancing • Social justice • Participation
Lynam and Herdt (1989)
- • Net Present Value
-
Simon (1989)
• The variety of crops kept
• Land-carrying capacity
• Yield • The productive technology used
• The land tenure systems
Brklacich et al. (1991)
• Environmental accounting
• Carrying capacity
• Sustained yield
• Production viability
• Product supply and security
• Equity
Tisdell (1996)
- • (output–input)/input
-
Smith and McDonald (1998)
• Land capacity • Nutrient
balance • Soil erosion • Use of
fertilizers/pesticides
• Water-use efficiency
• Production cost
• Product prices • Net farm
income
• Access to resources • The skills and
knowledge base available to the farmers
• Public awareness of conservation
• Planning capacity of farmers
Chen (2000)
• Use of external inputs
• Groundwater quality
• Soil erosion • Per capita
disaster loss • Multicropping
index
• Total agricultural products
• Per capita food production
• Net farm income
• Per capita food supply
• Land tax • Participation in
decision-making
In Assessing the Sustainability of Agriculture at the Planning Stage, Smith and McDonald (1998) proposed some important indicators to assess the sustainability of farming practices in Australia. They argued that from an economic point of view, profitability — such as total production and net farm income — is the primary indicator of agricultural sustainability. From an environmental point of view, they focused on trends in land and water use because these affect long-term production. Increasing water-use efficiency, nutrient replacement, maintenance of biodiversity and declining soil loss were viewed as potential sustainability indicators. The system would become more sustainable if it adopted practices like rotations without legumes, fragmented

56
cultivation and bare fallow, but would become less sustainable if it adopted practices like excessive fertilizer and pesticide use, excessive irrigation and resultant waterlogging. Chen (2000) recommended indicators to assess agricultural sustainability in the Chinese context. The challenge in his opinion, is that one must consider balanced development between environmental, population, economic and social components. Inter alia, per capita food production and food security, net farm income, farmers’ participation in decision-making, land tax, input use, groundwater quality and soil erosion were prioritized indicators to measure sustainability. Sustainability indicators practically applied The Food and Agriculture Organization of the United Nations (FAO, 2000) applied indicators such as ratio of agricultural land to agricultural population, gross production of food products and share of agriculture in the GDP to assess the general situation of agricultural production in developing countries (Table 4). Sands and Podmore (2000) applied the Environmental Sustainability Index (ESI) as an indicator to assess the sustainability of agricultural systems and applied it to farms in the southeastern corner of Colorado in the United States. The ESI represents a group of 15 sustainability sub-indices including soil (P) and water (GW) sub-indices, losses from the agricultural system via surface processes (S) and the leaching process (L). Topsoil depth, soil organic carbon, bulk density and depth to groundwater were among a group of 15 indicators derived from long-term simulation. The ESI, as proposed, reflected the degree of unsustainability when greater than “0”, while a “0” ESI value reflected a condition of sustainability, according to the previously described axiomatic framework for sustainability. The results showed that bulk density and available water holding capacity sub-indices are clearly the most influential sub-index components for representing differences in sustainability among the case study crop management systems. Tellarini and Caporali (2000) used the measures of monetary value and energy value to compare the sustainability of two farms, one using high inputs and the other using low inputs, in Central Italy. It was recognized that structural and functional agro-ecosystem performance indicators calculated according to energy, rather than monetary values, were more meaningful in both the design of sustainable farming systems and in decision-making processes. They concluded that a farm with low inputs contributed less to the production of goods and services for final consumption but provided higher quality energy in the form of animal products. It also consumed fewer non-renewable resources.

57
Table 4. Sustainability indicators practically applied
Sources Indicators FAO (2000) Tellarini and Caporali (2000) Sands and Podmore (2000) Morse et al. (2001)
• Ratio of agricultural land to agricultural population • Irrigation land as proportion of agricultural land • Gross production of food products • Gross livestock products • Share of agriculture in GDP
• Monetary input and output • Energy input and output
• Topsoil depth • Soil organic carbon • Bulk density • Depth to groundwater • Gross annual aquifer recharge budget • Specific yield of the aquifer formation
• Crop protection • Fuelwood and water resources • Crop/tree/production • Labour • Credit
Morse et al. (2001) in Sustainability Indicators: The Problem of Integration, discussed sustainability indicator integration by drawing upon the results of a six-year research project based in a village in Nigeria. They chose some indicators to provide a mix of components pointing towards sustainability and unsustainability. Indicators labelled as sustainable were crop protection (less pesticide used in the late 1990s and less pest attack), water resources (improved availability, consumption and quality, and water-harvesting techniques), labour participation (increased participation) and credit provision (healthy and a positive force for sustainability). Indicators labelled as unsustainable were crop production (in this research, cereal–legume dynamics appear to be a good indicator of unsustainability as increasing legume cultivation would seem to point towards an increasing problem with soil quality) and decline in the quality of fuelwood. These recent contributions imply that progress is being made in the development and critical analysis of sustainability indicators. However, in many cases the existing or proposed indicators are not the most sensitive or useful measures for

58
developing countries; moreover some useful indicators cannot be practised at the local level due to the lack of threshold values. Use of fertilizers and pesticides, for example, is proposed as an ecological indicator. However, there is no universal threshold value for this indicator. The quantity and time of application depend on local conditions such as soil nutrient status, crops cultivated and the type of fertilizers and pesticides. Therefore, a threshold value is required to evaluate the nature of fertilizer and pesticide use at a specific farm site. A threshold value is normally absent at the local level. Some ecologists have criticized the use of carrying capacity or potential yield to assess sustainability because of difficulties in establishing the appropriate threshold measures (Liverman et al., 1988). Similarly, percentage of fallow land is not applicable as an indicator for sustainability in developing countries. Pressure on land has led to deforestation, reduced fallow, decreased farm size and erosion (Ndiaye and Sofranko, 1994). In China, per capita land area is only 0.115 ha, compared with 1.736 ha in Canada, 0.762 ha in the United States, 0.198 ha in India and 0.278 ha world-wide (Cai and Smith, 1994). In order to feed a large population, land is used very intensively and fallow systems do not exist in areas like the NCP. Sustainability is not an absolute concept but there is potential for systems to be more or less sustainable (Atkinson and McKinlay, 1997). For example, many researchers believe that organic farming has an overall positive effect on landscape and natural production (Rasul, 1999; MacNaeidhe and Culleton, 2000; Rossi and Nota, 2000). However, Edwards and Howells (2001) argued in their research on the sustainability of crop protection in organic farming systems that organic farming systems are not sustainable in the strictest sense. Considerable amounts of energy are needed in organic farming systems; most compounds utilized in crop protection are derived from non-renewable sources and incur processing and transport costs prior to application. Further, these compounds have toxic hazards on ecology or humans. Despite these problems, it is concluded that organic farming is more sustainable than conventional farming in a biophysical sense. However, it is apparent from the literature that many of the proposed indicators are related to the author’s specific field of expertise. Many proposed indicators are technical, and of the qualitative “raising awareness” type, rather than the quantitative “ongoing management” type. Meanwhile, diversified indicators also reflect the absence of any clear idea about what sustainability indicators should be used for and how. On the other hand, indicators shown in Tables 3 and 4 are only suitable for the specific areas where the research has been conducted. They cannot be applied directly for the cases where the natural condition is quite different. Therefore, more valuable and suitable indicators should be detected and developed for specific studies.

59
4.2 Criteria for Indicator Selection The selection of effective indicators is the key to the overall success of any monitoring programme (Dale and Beyeler, 2001). Based on a review of relevant researches, the following criteria have been suggested for the selection of indicators for assessment of farming practices: Relative ease of capturing and using data: The indicator should be straightforward and relatively inexpensive to measure (Dale and Beyeler, 2001). It needs to be easy to understand, simple to apply and able to provide information to managers and policy-makers that is relevant, scientifically sound, easily documented and cost-effective. Sensitivity to stresses on the system: As addressed by Dale and Beyeler (2001), the most useful indicator is one that displays high sensitivity to a particular and, perhaps, subtle stress, thereby serving as an early indicator of reduced system integrity; some indicators may respond to dramatic changes in the system. For example, the gopher tortoise (Gopherus polyphemus) is highly sensitive to soil disturbances, and its absence in otherwise suitable sites suggests past physical disturbances. Be aware of indicators: Indicators selected should have common awareness in the area concerned (Morrison et al. 2001). High awareness of sustainable indicators implies their critical importance in the development process. Existence of threshold values and guidelines: The evaluation of each indicator should be based on the threshold values given or established locally by research institutes, government agencies and NGOs working at local levels. Threshold values are defined as analytically-based reference values, for example, a maximum allowable ambient concentration of sulphur dioxide (Braat, 1991). There are three types of threshold values that can be used to evaluate indicator values (Walker and Reuter, 1996): historical levels (pre-farming, pre-disturbance), desired levels (set by research groups) and potential levels and threshold levels (set by biophysical constraints, or from tables compiled from research and measurement). The threshold guidelines and the overall ranges expected for each indicator should also be identified. The indicators thus can take into account local conditions and acceptable ranges for the area. Be predictive: An indicator should predict changes that can be averted by management action, and can provide direct information about the future state

60
and development of relevant socio-economic and environmental variables. This information constitutes the basis for anticipatory planning and management. Time series can be used in predictive extrapolation or simulation modelling; global modellers have used a combination of empirical estimates and theoretical assumptions to warn of potentially “non-sustainable” futures (Meadows et al., 1972). Appropriate data transformation: Data transformations are often useful in designing sustainability indicators (Liverman et al., 1988). Raw data, such as the area of forest in a country, do not indicate very directly whether the system is sustainable. The ratio of forest loss per annum in relation to original or existing forest area may be a better indicator. Integrating ability: The full suite of indicators for a site should integrate across key environmental gradients across the ecological systems (e.g. gradients across soils, vegetation types, temperature, space, time, etc. [Dale and Beyeler, 2001]). For example, no single indicator is applicable across all spatial scales of concern. Potential indicators for soil erosion, for example, include measures of soil structure, slopes, cropping intensity and natural situations such as wind and rainfall strength. In some studies of sustainability, researchers have adopted a quantitative integration approach whereby the indicators are given numerical values and are integrated mathematically to produce a value for sustainability (Walker and Reuter, 1996). Be quantifiable: The data on the structure or behaviour of the system represented by the indicator must be available or obtainable with the present technology. 4.3 Operational Indicators for Measuring Agricultural Sustainability in Developing Countries A set of operational indicators for measuring agricultural sustainability at the farm level in developing countries was proposed by Zhen and Routray (2003) (Figure 7). Economic indicators Economic indicators are used to measure the productivity, profitability and stability of farming activities. Productivity is the efficiency of input on output. Productivity is measured from two standpoints: technical efficiency of resources, expressed in terms of physical amounts, and economic efficiency in terms of monetary value (Rasul, 1999).
61

62
Figure 7. Operational indicators for measuring agricultural sustainability in developing countries (Zhen and Routray, 2003) Yield per hectare is used to measure the productivity of the land. Non-declining crop productivity is an important indicator for measuring sustainable agricultural development from an economic point of view. Net farm income implies income from crop production, which should be greater than zero in order to satisfy conditions for sustainability. In other words, gross income of production should be able to cover total variable costs per unit of land area — then crop production is profitable. Likewise, the benefit–cost ratio (BCR) of production also reflects the profitability of crop production. From the perspective of sustainability, the BCR must satisfy the condition that it be greater than one. Per capita food-grain production can be used to reflect food self-sufficiency, as it can be compared with the value of per capita food-grain consumption. Increased per capita grain production strengthens food security. Social indicators Food self-sufficiency is measured to analyse the food security situation of individual farmers. Concerns over food security extend beyond whether supplies will be sufficient to meet dietary and consumption requirements; self-sufficiency is often included in the assessment of sustainable agriculture. Increasingly, it is being recognized that a secure food supply, meaning one accessible to all members of a society, is a vital component of a sustainable food production system (Brklacich et al. 1991). Equality in food and income distribution among farmers can reflect social equality. There should not be too great a gap between large and small farmers regarding income and food distribution. Equal access to resources such as per capita availability of arable land, irrigation water and support services such as extension and training services, marketing and credit services among farmers are considered as underlying factors for ensuring sustainability. In developing countries, access to extension and credit services usually favours large farmers (Axinn 1988). With many developing countries having a high proportion of small farmers, equality in accessing support services can ensure social stability and encourage farmers to improve production while conserving resources. Although farmers' knowledge and awareness of resource conservation cannot be assessed quantitatively due to difficulties in identifying thresholds, these are important factors motivating farmers' adoption of environmentally sound and economically profitable farming practices.
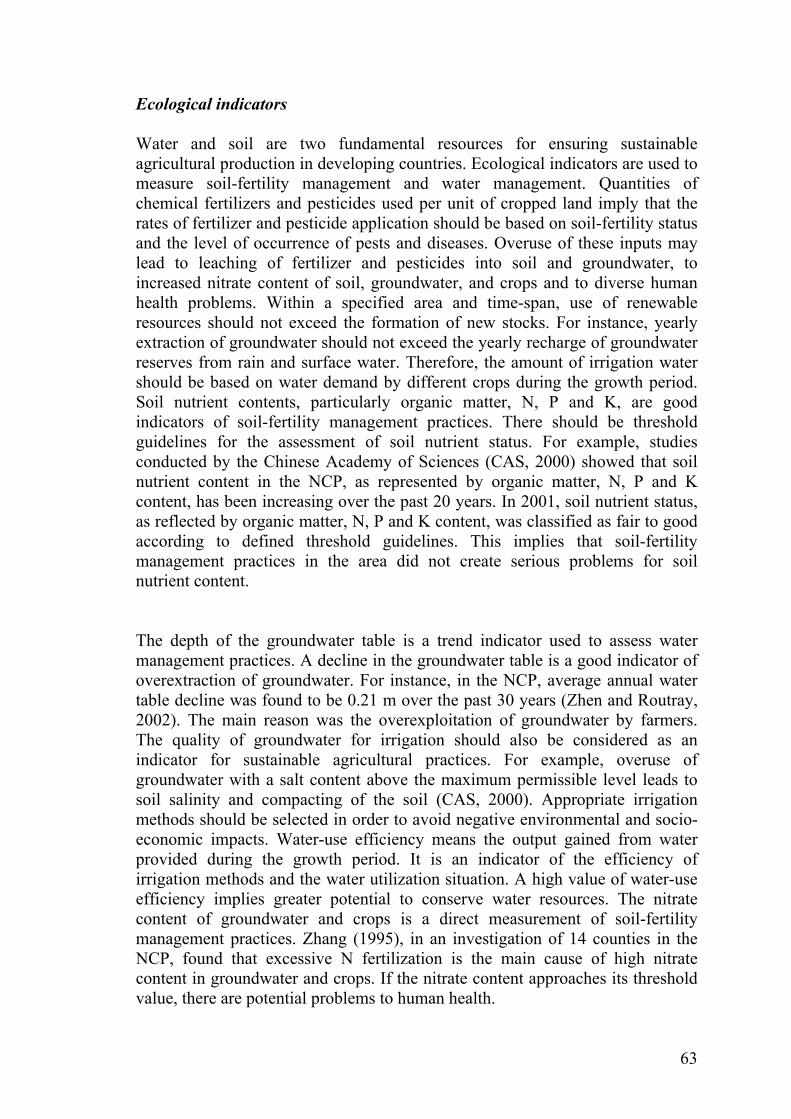
63
Ecological indicators Water and soil are two fundamental resources for ensuring sustainable agricultural production in developing countries. Ecological indicators are used to measure soil-fertility management and water management. Quantities of chemical fertilizers and pesticides used per unit of cropped land imply that the rates of fertilizer and pesticide application should be based on soil-fertility status and the level of occurrence of pests and diseases. Overuse of these inputs may lead to leaching of fertilizer and pesticides into soil and groundwater, to increased nitrate content of soil, groundwater, and crops and to diverse human health problems. Within a specified area and time-span, use of renewable resources should not exceed the formation of new stocks. For instance, yearly extraction of groundwater should not exceed the yearly recharge of groundwater reserves from rain and surface water. Therefore, the amount of irrigation water should be based on water demand by different crops during the growth period. Soil nutrient contents, particularly organic matter, N, P and K, are good indicators of soil-fertility management practices. There should be threshold guidelines for the assessment of soil nutrient status. For example, studies conducted by the Chinese Academy of Sciences (CAS, 2000) showed that soil nutrient content in the NCP, as represented by organic matter, N, P and K content, has been increasing over the past 20 years. In 2001, soil nutrient status, as reflected by organic matter, N, P and K content, was classified as fair to good according to defined threshold guidelines. This implies that soil-fertility management practices in the area did not create serious problems for soil nutrient content. The depth of the groundwater table is a trend indicator used to assess water management practices. A decline in the groundwater table is a good indicator of overextraction of groundwater. For instance, in the NCP, average annual water table decline was found to be 0.21 m over the past 30 years (Zhen and Routray, 2002). The main reason was the overexploitation of groundwater by farmers. The quality of groundwater for irrigation should also be considered as an indicator for sustainable agricultural practices. For example, overuse of groundwater with a salt content above the maximum permissible level leads to soil salinity and compacting of the soil (CAS, 2000). Appropriate irrigation methods should be selected in order to avoid negative environmental and socio-economic impacts. Water-use efficiency means the output gained from water provided during the growth period. It is an indicator of the efficiency of irrigation methods and the water utilization situation. A high value of water-use efficiency implies greater potential to conserve water resources. The nitrate content of groundwater and crops is a direct measurement of soil-fertility management practices. Zhang (1995), in an investigation of 14 counties in the NCP, found that excessive N fertilization is the main cause of high nitrate content in groundwater and crops. If the nitrate content approaches its threshold value, there are potential problems to human health.

64
An indicator's selection and application must be both space- and time-specific, due to spatial and temporal characteristics of the indicator. Indicators representing the three dimensions of sustainability (economic, social and ecological) should be prioritized according to the spatial characteristics under concern (Table 4). For short-term development, indicator selection at national, regional and local levels in developing countries should first take into consideration economic and social aspects, and then the ecological aspect, as the main purpose of production is to maintain livelihoods in the short term. For medium-term development, indicator selection at the national and regional levels should first take into consideration the ecological aspect and then give equal priority to economic and social aspects. At the local level, indicator selection should consider the economic aspect first, and then give equal priority to social and ecological aspects, because increased economic benefit is still the basic concern for developing countries, particularly at the local level. For long-term development, however, indicator selection at different levels should give equal priority to all three dimensions of sustainability. By doing so, agricultural sustainability could be achieved while providing for current subsistence.
65
5. RESEARCH DESIGN The research was conducted in Ningjin County of Shandong Province (Map 1). The province is located in the east of the country and the centre of the NCP. Ningjin County is located in the northwest part of Shandong Province. The county consists of 18 communes (Map 2) that include altogether 856 villages. It has a total land area of 822 km2 and a population of 440 000. The average population density is 535/km2. Topographically the area is a plain and has a continental monsoon climate. The average annual rainfall is 540 mm and annual evaporation is 1 319 mm.
Map 1. Shandong Province and Ningjin County The county is identified as the food-grain bowl of the NCP because more than 80 percent of the total land area is devoted to cereal crop production. More than 80 percent of the people in the area are involved in agricultural production. Farmers in the area mainly practise small-scale and subsistence agriculture. They
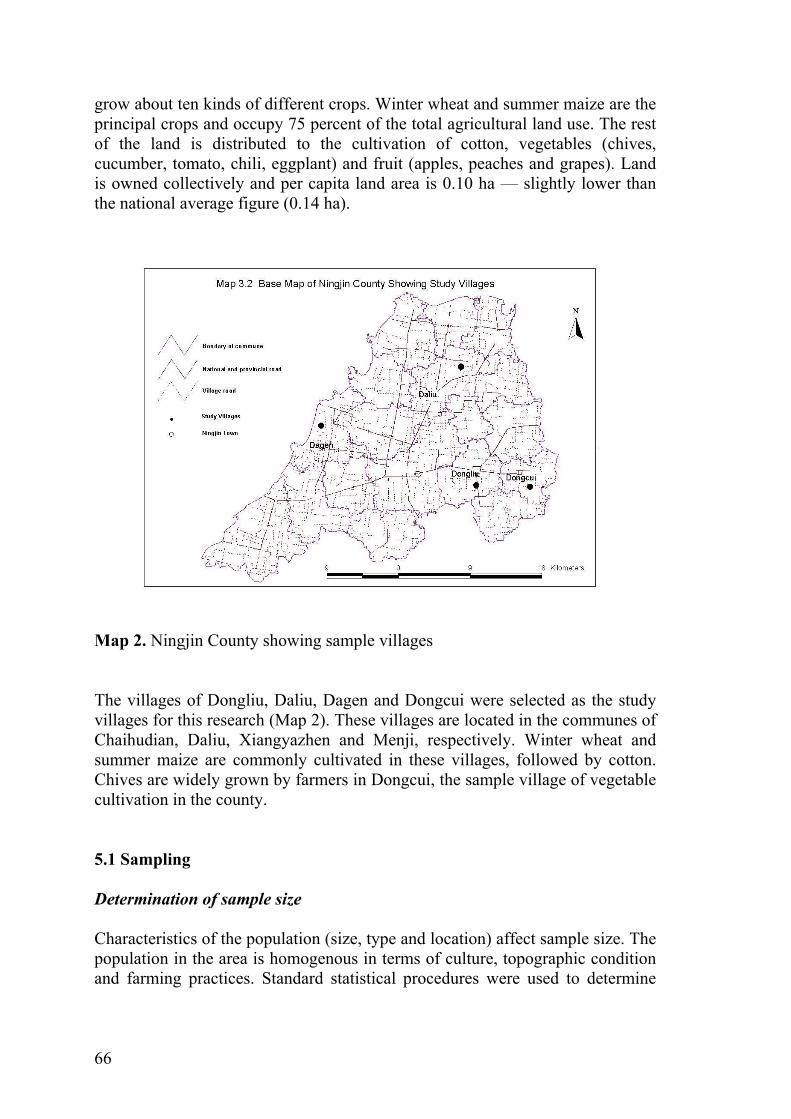
66
grow about ten kinds of different crops. Winter wheat and summer maize are the principal crops and occupy 75 percent of the total agricultural land use. The rest of the land is distributed to the cultivation of cotton, vegetables (chives, cucumber, tomato, chili, eggplant) and fruit (apples, peaches and grapes). Land is owned collectively and per capita land area is 0.10 ha — slightly lower than the national average figure (0.14 ha). Map 2. Ningjin County showing sample villages The villages of Dongliu, Daliu, Dagen and Dongcui were selected as the study villages for this research (Map 2). These villages are located in the communes of Chaihudian, Daliu, Xiangyazhen and Menji, respectively. Winter wheat and summer maize are commonly cultivated in these villages, followed by cotton. Chives are widely grown by farmers in Dongcui, the sample village of vegetable cultivation in the county. 5.1 Sampling Determination of sample size Characteristics of the population (size, type and location) affect sample size. The population in the area is homogenous in terms of culture, topographic condition and farming practices. Standard statistical procedures were used to determine

67
sample size. Standard sampling procedure for the selection of households was followed. The sample size was determined on the basis of total households in the study area (Table 5).
1) Four communes were selected through purposive sampling. 2) One village from each of the communes was selected according to the
criteria for the selection of the study area.
3) At least 36 percent of the households was selected from each village by
using the simple random sampling method for questionnaire surveys. Accordingly, a total of 270 households were selected. Considering the probability that some of the respondents might not be available for interview for various reasons, a reserve of 10 percent was used. Table 5. Sample design by communes and villages
Commune Population HHs per commun
e
Selected villages
HHs per
village
No. of sampled
HHs
Percentage of HHs
sampled Chaihudian 24 904 6 887 Dongliu 198 73 37 Daliu 29 828 8 657 Daliu 185 70 38 Xiangyazhen
15 894 7 698 Dagen 194 77 40
Menji 24 811 4 567 Dongcui 130 50 38 Total 95 437 27 809 - 707 270 38
HHs: households Sampling methods A simple random sampling method was used to select households for the questionnaire survey. In order to identify the total sample household population, the names of the households were taken from the registration book of the respective villages. After identification of the households, they were numbered and the sample households were determined using the simple random sampling method. Therefore, selection of the villages within each commune was done purposively while the households were sampled on the basis of simple random sampling.

68
5.2 Data Collection Methods In order to produce empirical evidence to fulfill the set of objectives, data collection is necessary in a particular location. This required primary as well as secondary data which had to be collected using appropriate methods and techniques, including household survey and rapid rural appraisal methods and application of analytical tools. Household survey, designed to assess farmers’ existing cropping patterns, management of soil and water resources, adoption of resource conservation knowledge and technologies, was one of the major sources of information and was carried out using a standard questionnaire. Each individual household, defined as a unit of family members living together (normally a joint family with two or three generations) and jointly sharing the costs and benefits, in the study area was considered as a sampling unit. General information on farming practices was obtained by interviewing key informants and through focus group discussion (FGD) with members of cereal crop production groups, the vegetable production cooperative, the livestock development group, old people’s associations and women’s associations. Before field data collection, considerable time was spent at the libraries of the Asia Institute of Technology and Chinese Academy of Sciences on literature review to develop a strong theoretical background for the study. The literature review helped the researcher in defining and correctly focusing on issues that need further explanation and answers to questions, which were not addressed previously. In particular, a set of indicators was identified and selected for supporting the research. The experience of researchers, farmers, planners, and extension workers was integrated to fill identified knowledge gaps. Secondary data Secondary data were obtained from relevant government agencies, research institutions, various technical centres, district and village organizations and private companies that were involved in the production or selling of farming inputs. Table 6 lists the source institutions and the type of data acquired. Primary data Primary data include the information collected through field surveys. In line with the objectives of the study, information was collected on farmers’ socio-economic characteristics, their production situation including cropping patterns, cropping diversification, soil and water resource management, pest and disease management, crop yield and net farm income. Information on farmers’ practices and assessment of their appropriateness, problems and production needs were collected from household surveys, key informants and FGDs using prepared
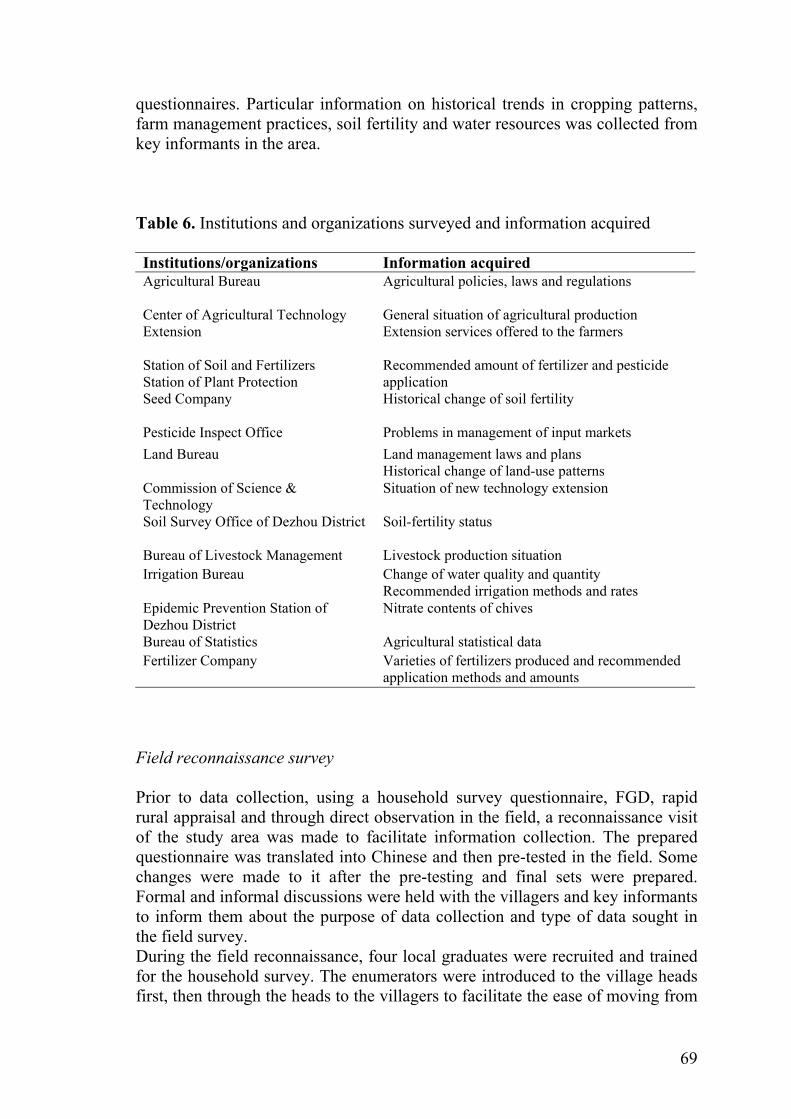
69
questionnaires. Particular information on historical trends in cropping patterns, farm management practices, soil fertility and water resources was collected from key informants in the area. Table 6. Institutions and organizations surveyed and information acquired Institutions/organizations Information acquired Agricultural Bureau Center of Agricultural Technology Extension Station of Soil and Fertilizers Station of Plant Protection Seed Company Pesticide Inspect Office
Agricultural policies, laws and regulations General situation of agricultural production Extension services offered to the farmers Recommended amount of fertilizer and pesticide application Historical change of soil fertility Problems in management of input markets
Land Bureau Land management laws and plans Historical change of land-use patterns
Commission of Science & Technology
Situation of new technology extension
Soil Survey Office of Dezhou District Bureau of Livestock Management
Soil-fertility status Livestock production situation
Irrigation Bureau Change of water quality and quantity Recommended irrigation methods and rates
Epidemic Prevention Station of Dezhou District Bureau of Statistics
Nitrate contents of chives Agricultural statistical data
Fertilizer Company
Varieties of fertilizers produced and recommended application methods and amounts
Field reconnaissance survey Prior to data collection, using a household survey questionnaire, FGD, rapid rural appraisal and through direct observation in the field, a reconnaissance visit of the study area was made to facilitate information collection. The prepared questionnaire was translated into Chinese and then pre-tested in the field. Some changes were made to it after the pre-testing and final sets were prepared. Formal and informal discussions were held with the villagers and key informants to inform them about the purpose of data collection and type of data sought in the field survey. During the field reconnaissance, four local graduates were recruited and trained for the household survey. The enumerators were introduced to the village heads first, then through the heads to the villagers to facilitate the ease of moving from

70
one household to the other and acquiring information related to their farming practices and income situation. Household survey A household list from selected villages was given to the enumerators. The survey work of the enumerators was regularly monitored by working together and telephone communication and the results were confirmed by re-interviewing some of the households surveyed by the enumerators. The household survey was conducted from the first week of June to the last week of July, and continued from the first week till the third week of September. Therefore, the survey covered the most important agricultural period of the year. Being the peak agricultural season, all farmers were busy with wheat harvesting and maize sowing during the first phase survey, and land preparation and maize harvesting and wheat sowing during the second phase survey. Hence, the household heads were interviewed in the early afternoon before they went to the farms after their lunch break and in the evening. Interviews of key informants Apart from the household survey, village heads, leaders of farmers’ associations, leaders of women’s associations, old people and local progressive farmers were interviewed. Key informants also included extension workers, government officials involved in agricultural management activities, wholesalers and retailers of farm inputs such as seed, fertilizers, pesticides/insecticides and farming equipment like power tillers, pumps and pesticide sprayers. Precision information about changing cropping patterns, the changing trend of input use and soil and water quality, as well as the main problems in crop production and environment conservation was obtained from key informants. Observations Field observation was conducted throughout the field surveys. Information about land-use patterns, cropping patterns, crop diversification, tillage practices, irrigation methods, use of chemical and organic fertilizers, soil and water quality and livestock and poultry rearing was collected. In addition to direct field observations, 12 farms were also visited through participating in the farm work to become familiar with the farming activities. Focus group discussion Focus group discussion was conducted with farmers to obtain their opinions and attitudes towards the production situation and environmental conditions, and

71
their problems and suggestions for further improvement. Information was recorded using a prepared checklist. Altogether ten FGDs were carried out including three cereal crop production groups (CCPG), one vegetable production cooperative (VPC), four old people’s associations (OPA) and two women’s associations (WA). Groundwater test The nitrate content of groundwater was tested in this study. A total of 20 groundwater samples (12 samples from wells that were used for the irrigation of wheat and maize, four samples from wells that were used for the irrigation of cotton fields and four samples from wells that were used for chive irrigation) were collected. Each water sample of about 1 litre was kept in plastic bottles. The water samples were selected so that they directly corresponded with soil samples collected for the study. In other words, water samples were taken from shallow irrigation wells for plots from which some of the soil samples were also collected. Water samples were taken to the Irrigation Bureau of Dezhou District for analysis. 5.3 Data Analysis Quantitative analysis Data collected from the field survey were analysed by using the analytical software SPSS for Windows. Excel was used wherever necessary. The data were of two types: a set of secondary data drawn from available statistics at the local and national level, and a set of data collected in the field. Most of the analysis was based on different cropping patterns, study villages and farm size. Descriptive statistics, particularly maximum and minimum distribution, mean, standard deviation, percentage and frequencies were computed according to requirements. Specifically, this method is used for the analysis of groundwater, soil fertility, crop production and accessibility to support services such as extension and training. Appropriate statistical tests (t-test, ANOVA-test) were used to test the relationships between the variables. Linear relationships between variables were determined by using the correlation coefficient whereas cross tabulations were used to determine associations. Financial analysis was applied to determine the profitability of cropping patterns under study using input and output levels under farmers’ existing conditions. Specifically, net farm return and benefit–cost ratio were obtained by calculating total production costs and returns.

72
Multiple regression analysis was applied to identify the determinants of yield of wheat, maize, cotton and chives. The dependent variable is the yield of respective crops. Altogether 16 independent variables thought to be important to crop yield were included in the multiple regression analysis. They are defined below:
1. The age of respondents is the actual age of the respondent at the time of interview. 2. The educational attainment of respondents is the highest level of education attained by respondents at the time of interview. It was recorded as 1, 2, 3 and 4, representing illiteracy, low level, middle level and high level, respectively. 3. The total land-holding size is the total land area allocated to the households. 4. The total area under respective crops is the actual area for wheat, maize, cotton and chive cultivation, respectively. 5. Total labour used was measured by asking the respondents the actual hours they spent annually on different farming activities for respective crops, and then converting the hours into workdays according to a conversion factor of eight hours equals one working day.
6. Irrigation frequency was defined as the total frequency of irrigation per cultivation season by asking farmers the actual frequency at which they irrigated respective crops in the year preceding the survey.
7. Groundwater applied was the total quantity of groundwater irrigated per unit of land area per year. 8. The total amount of groundwater irrigated was obtained by asking farmers the actual hours they spent per irrigation event, then multiplied by irrigation events, irrigation hours per event and the well yield, measured by the Irrigation Bureau of the county. 9. The total quantity of nutrients from crop residues remaining in the field was obtained by asking farmers the percentage of crop residues remaining, and converting the percentage into actual quantity of residues by multiplying the total quantity of residues produced, then converting the quantity of crop residues used into nutrient (NPK) amounts by using the conversion factors defined by Fan and Fen (1999) and Lu and Shi (1982). For wheat, quantity of

73
maize residue was taken into consideration while wheat residue was used for maize.
10. The total amount of nutrients (NPK) from farmyard manure (FYM) applied was calculated on the basis of the actual amount of FYM used for wheat, cotton and chives and the conversion factors.
11. The amount of NPK applied to the fields was converted from the total amount of chemical fertilizers applied — mainly urea, di-ammonium phosphate (DAP) and potassium sulphate (PS) using conversion factors. 12. Cost of pesticides was defined as the total amount of money spent on purchasing pesticides. More than 50 varieties of pesticides were available to farmers in the local markets. Farmers are free to choose pesticides according to their effects and prices. Therefore, it was difficult to calculate the total quantity of pesticides applied.
13. The total amount of money spent on pesticides was considered here as an independent variable. 14. Soil pH, organic matter content and NPK content of soils were actual measurements of these variables in the soils of wheat–maize rotational cropping fields. A soil test was conducted after the maize harvest; therefore, the nutrient content of soils reflects soil-fertility status after wheat and maize production within a cultivation season. 15. Off-farm income was defined as the total earnings of farm households from salary, wages, business etc. other than crop production. It was calculated using information provided by the respondents on the total off-farm income during the year preceding the survey. 16. Income from livestock rearing was measured by asking the respondents the actual amount gained from selling of livestock or livestock products during the year prior to the household survey.
The Weighted Average Index (WAI) was applied to analyse farmers’ satisfaction, perceptions, agreement and preference (Miah, 1993). Construction of the index is an important technique for the analysis of field data. According to the nature of this study, some data sets were qualitative in nature. This necessitated transformation of attributes through aggregation and quantification by weighing, scoring and computing index values. In order to make the comparison easier and clearer, a WAI was employed to analyse farmers’ level of satisfaction on extension services, their perceptions of impacts of farming practices on the environment and human health, agreement on soil and water resource conservation and preference in crop selection. The index value was obtained by

74
multiplying the statement to its corresponding weight and dividing it by the total number of responses, which may be stated as follows: I = ΣFiWi / N Where, I = WAI Fi = frequency of responses to a particular statement Wi = weightage of statement N = total no. of responses Indices employed in the data analysis are summarized hereunder: Index of satisfaction with extension services Index = (F1W1+ F2W2+F3W3+F4W4+F5W5)/N Where, F1 to F5 represent the frequency of response ranked “strongly satisfied”, “satisfied”, “neutral”, “dissatisfied” and “strongly dissatisfied” respectively. W1 to W5 represent corresponding weights applied to different ranked classes as mentioned above, specifically, W1 = 2, W2 = 1, W3 = 0, W4 = -1 and W5 = -2. N = total no. of responses. Index of farmers’ preferences for training and perceived problems in crop production Index = (F1W1+ F2W2+F3W3)/N Where, F1, F2 and F3 represent the frequency of responses ranked “first preference” and “important problem”, “second preference” and “less important problems” and “third preference” and “no problems”, respectively. W1, W2 and W3 represent corresponding weights applied to different ranked classes as mentioned above, specifically, W1 = 1.00, W2 = 0.66 and W3 = 0.33. N = total number of responses.

75
Index of farmers’ perceptions about environmental impacts of groundwater use and ranking of indicators for assessment of farming practices Index = (F1W1+ F2W2+ F3W3+ F4W4+ F5W5) / N Where, F1 to F5 represent the frequency of responses ranked “very high”, “high”, “medium”, “low”, and “very low” cases, respectively. W1 to W5 represent corresponding weights applied to different ranked classes as mentioned above. Specifically W1= 1.0, W2= 0.8, W3= 0.6, W4= 0.4, and W5= 0.2; and N = total no. of responses. Soil nutrient measurement. Nutrient contents of FYM, crop residues and chemical fertilizers applied to farmlands were converted into macronutrients — nitrogen (N), phosphorus (P2O5) and potassium (K2O), abbreviated to NPK. The conversion factors for FYM, crop residues, chemical fertilizers and crop products were adopted from the Updated Fertilizer Handbook (UFH) (Fan and Fen, 1999). Similarly, the nutrient uptake rate by different crops was based on crop yield and crop residue that was adopted from the Agricultural Chemical Handbook for the NCP (Lu and Shi, 1982). Based on nutrients applied by farmers and removed by crops, a gap between supply and uptake was identified to assess nutrient status in farmland. Qualitative analysis Qualitative data were obtained from open-ended questions, informal discussion, FGD and observations. Qualitative analysis was used to substantiate quantitative data on socio-economic aspects. It is useful to understand farmers’ perceptions, agreement and preference, farming practices, extension services and training provided to farmers, and marketing. A problem loop was employed to analyse the inter-relationship of several factors contributing to the sustainability of farming practices. Sensitivity analysis This method is consistent with interpreting sustainability as an ability to continue. It is the ability of a system to maintain its productivity when subject to stress. Originally, sensitivity analysis was created to deal simply with uncertainties in the input variables and model parameters. It provides a very

76
useful method for analysis of future scenarios of the system, it is a very useful method to analyse the change of output associated with the variation of selected inputs. In this research, sensitivity analysis deals with change in input costs and output prices and crop yield in the future, the change of net farm return and benefit–cost ratio from crop production. The assumptions —“scenarios” — used for the sensitivity analysis in this study are listed below:
• Scenario 1 — 10 percent increase in production costs.
• Scenario 2 — 10 percent fall in output price.
• Scenario 3 — 10 percent increase in production costs and 10 percent fall in price.
• Scenario 4 — Irrigation cost will double due to a diminishing
groundwater table.
• Scenario 5 — 20 percent decrease in crop yields, and
• Scenario 6 — Fall in costs if farmers adopt the recommended amount of fertilizers and groundwater.
5.4 Selection of Indicators Most indicators proposed in the literature were developed for use in the area with specific spatial and temporal features. While conducting the study, it was evident that some of the basic conditions were different from the situation in other areas. Finally, a set of environmental, economic, and socio-institutional indicators was selected. The steps taken for indicator selection were: Identify local problems and issues Based on the review of relevant literature and documents, the major problems and issues in the study area were related to groundwater management, soil-fertility management, pest/disease management, farm income, support services available to farmers, farmers’ knowledge and technologies for sustainable farming practices. As these aspects were considered to be the main focus of the research; the selection of indicators thus focused on them.

77
Review relevant indicators conceptualized and used by different scholars A review of literature relevant to identified research problems and issues was conducted and indicators theoretically proposed and practically applied by different scholars were summarized for further consideration in this research. Select operational indicators according to principles identified in the literature review Following the principles of indicator selection, proposed and applied indicators were selected primarily for the consideration of this research. Special attention was paid to availability of data and local threshold guidelines so results could be interpreted properly. Evaluate the effectiveness of indicators by interviewing professionals and experts Primary selected indicators were reviewed and evaluated through discussion with relevant professionals. Altogether seven professionals or experts involved in agricultural production and resource conservation activities were interviewed. The copy of the indicator list was distributed among them and comments regarding the effectiveness of the indicators were received. Based on the comments, the list of indicators was modified and new indicators, such as nitrate content of crops, were added to the list. Discuss list of indicators with the local community The local community knows the local situation better than outsiders. The list of indicators evaluated by the professionals was further revised through FGD conducted in the study villages. The environmental effects of farming practices such as soil quality, fluctuation of groundwater tables, groundwater quality, crop quality, health problems related to application of pesticides, as well as increasing production costs and accessing extension services were addressed during discussions and were considered as the most important indicators for assessing sustainability. Take remedial action and revise indicators Remedial action was taken according to the opinions of the experts and the local community. Indicators that can reflect the local agricultural situation were selected for the assessment of agricultural sustainability.

78
Identify threshold guidelines for selected indicators Thresholds are indicator levels beyond which the system is thought to become unsustainable. Threshold guidelines and the overall ranges expected for each indicator were identified based on the research findings conducted in the area or the general guidelines defined for the NCP (Table 7 and Table 8). The indicators thus took into account local conditions and acceptable ranges for the area. Implications and assumptions of the ranges of each indicator in relation to sustainability are explained hereunder: • “Very good” and “good” mean that there is no indication of a problem or
problematic trend. • “Fair” means borderline condition for sustainability. Some action is needed
to address the problem or more detailed information should be sought to suggest how to stop a decline in condition.
• “Poor” and “very poor” mean that there is indication of a problem or
problematic trend. Urgent action is needed to prevent the condition. Identify recommended values for input application Recommended values (ranges) for application of groundwater, fertilizers and pesticides by crops were identified and are shown in Table 8. These values were used for the evaluation of farmers’ practices, either above, equal or below recommended ranges so that farmers’ practices could be assessed. Based on the above steps, the most important indicators were selected, and the values of each indicator were measured. These values were then compared against accepted threshold values for respective indicators; farmers’ practices or causes linked to each indicator were examined, and judgements made about the sustainability of farming practices. Table 7 and Table 8 present the selected indicators and give threshold guidelines and recommended ranges of input use. These thresholds have been used in the assessment of the sustainability of the present agricultural land use in the study area.

Soil
pH 1
In
dica
tes
acid
ity/a
lkal
inity
of
a so
il. I
t can
ref
lect
so
il nu
trien
t ava
ilabi
lity
to c
rops
.
6.0–
7.0
7.0–
7.5
7.5–
8.0
8.0–
8.5
>8.5
Soil
orga
nic
mat
ter
(OM
) co
nten
t (%
)1 >1
.5
1.0–
1.5
0.8–
1.0
0.6–
0.8
<0.6
Soil
N c
onte
nt (m
g/kg
) 1 >9
0 75
–90
60–7
5 45
–60
<45
Soil
P co
nten
t (m
g/kg
) 1 >1
5 10
–15
5–10
3–
5 <3
So
il K
con
tent
(mg/
kg) 1
Pres
ence
of
OM
& e
ssen
tial
nutri
ents
(N
PK)
in
the
soil.
Hig
h va
lue
(>Fa
ir) im
plie
s so
il is
in g
ood
nutri
ent
cond
ition
an
d cu
rren
t pr
oduc
tion
activ
ities
are
not
deg
radi
ng so
il fe
rtilit
y.
>150
10
0–15
075
–10
0 50
–75
<50
Wat
er-u
se e
ffic
ienc
y (W
UE)
(kg
/m3 )
2
Rat
io o
f yi
eld
at f
inal
har
vest
to th
e to
tal a
mou
nt
of w
ater
app
lied
(rai
nfal
l+irr
igat
ion)
dur
ing
the
who
le p
erio
d of
cro
p gr
owth
.
>2.5
2.
0–2.
5 1.
5–2.
0 1.
0–1.
5 <1
.0
Max
imum
allo
wab
le c
once
ntra
tion
of
nitra
te in
gro
undw
ater
(mg/
l) 3
< 50
<
50
50
> 50
>
50
Max
imum
allo
wab
le c
once
ntra
tion
of
nitra
te in
veg
etab
les (
mg/
kg) 3
Nitr
ate
(NO
3-)
cont
ent
in
grou
ndw
ater
an
d ve
geta
bles
is
cons
ider
ed t
o be
a n
egat
ive
impa
ct
of
ferti
lizer
ap
plic
atio
n.
Gro
undw
ater
an
d ve
geta
bles
that
con
tain
NO
3- e
xcee
ding
allo
wab
le
leve
ls w
ill c
ause
hum
an h
ealth
pro
blem
s.
< 70
0 <
700
700
> 70
0 >
700
Net
retu
rn o
f cro
p pr
oduc
tion
(NR
) 4
NR
>0 i
mpl
ies
that
cro
p pr
oduc
tion
is f
inan
cial
ly
viab
le.
- >0
0
<0
-
Ben
efit–
cost
rat
io o
f cr
op p
rodu
ctio
n (B
CR
) 4 B
CR
>1 im
plie
s th
at c
rop
prod
uctio
n is
fina
ncia
lly
viab
le.
-
>1
1 <1
-
Th
e im
plic
atio
ns o
f thr
esho
ld g
uide
lines
are
as
follo
ws
(Wal
ker a
nd R
eute
r, 19
96):
“Ver
y go
od”
and
“goo
d” m
ean
that
ther
e is
no
indi
catio
n of
a p
robl
em
or p
robl
emat
ic tr
end.
“Fa
ir” m
eans
bor
derli
ne c
ondi
tion
for
sust
aina
bilit
y. S
ome
actio
n is
nee
ded
to a
ddre
ss th
e pr
oble
m o
r m
ore
deta
iled
info
rmat
ion
shou
ld b
e so
ught
to s
ugge
st h
ow to
sto
p a
decl
ine
in c
ondi
tion.
“Po
or”
and
“ver
y po
or”
mea
n th
at th
ere
is in
dica
tion
of a
pro
blem
or
prob
lem
atic
tren
d.
Urg
ent a
ctio
n is
nee
ded
to p
reve
nt th
e co
nditi
on. 1 W
ang
and
Xin
, 199
8; 2 C
AS,
200
0; 3 Z
hang
, 199
5; 4
Zhan
g, 2
000.
79

Freq
uenc
y of
irrig
atio
n 1
Freq
uenc
y of
irr
igat
ion
that
sho
uld
be a
dopt
ed
durin
g th
e cu
ltiva
tion
seas
on o
f a sp
ecifi
c cr
op.
4–5
3–4
4–5
17–2
0
Qua
ntity
of g
roun
dwat
er
(m3 /m
u/fr
eque
ncy)
1 Q
uant
ity o
f gro
undw
ater
that
sho
uld
be a
pplie
d pe
r un
it of
land
per
irrig
atio
n fr
eque
ncy.
40
–50
35–4
5 40
–50
50–6
0
Rat
e of
ferti
lizer
use
(kg/
mu)
2 O
rgan
ic m
anur
e C
hem
ical
ferti
lizer
N
P K
Am
ount
of f
ertil
izer
s th
at s
houl
d be
use
d pe
r uni
t of
land
are
a.
4 20
0–7
200
27–3
4 14
–17
6–8
7–9
- 22–2
8 11
–14
6–7
5–7
4 20
0–6
000
24–3
0
13
–15
4–6
7–9
6 00
0–8
400
105–
136
42–5
4 28
–37
35–4
5
Rat
e of
pes
ticid
e us
e (g
/mu)
3 O
met
hoat
e Ju
zhi
Para
thio
n Ph
orat
e Le
sibe
n
Am
ount
of p
estic
ides
that
shou
ld b
e us
ed p
er u
nit o
f la
nd a
rea.
50
–75
25–5
0 50
–75
- -
50–7
5 25
–50
50–8
0 - -
60–8
0 25
–50
50–7
5 - -
- - - 100–
150
100–
120
1 IB
NC
, 199
6. 2 S
SOD
D, 1
999.
3 Sta
tion
of P
lant
Pro
tect
ion
of N
ingj
in C
ount
y, 2
001.
1 h
a =
15 m
u
80

81
6. GROUNDWATER USE The “seed–fertilizer–water” technology — generated by the Green Revolution — relies on water control. This is particularly true in the NCP where agricultural production depends on irrigation using groundwater resources. Sustainable agriculture in Ningjin requires the restoration of groundwater balance and efficient use of groundwater resources. Agriculture in Ningjin consumes more than 80 percent of total groundwater. Many studies show that the county is facing a critical situation in groundwater recharge. This chapter aims to assess groundwater management. Selected indicators for assessment are:
• Amount of groundwater used for irrigation.
• Depth to the groundwater table.
• Salt concentration of groundwater.
• Water-use efficiency. Other environmental problems generated by current groundwater-use practices are also covered in this analysis. Future scenarios relevant to irrigation water demand and supply are discussed. 6.1 Groundwater-use Practices The source of irrigation water in the study area is groundwater pumped from shallow tubewells (for lifting water from a depth of less than 60 m). The physical irrigation system consists of a collection point for water, a conveyance system to move the water from the source to the fields and a technique for applying water to crops. Irrigation methods Results from the field survey show that each of the sampled households has equal access to and share of groundwater resources. All irrigation systems in the county are small scale and constructed by farmers using locally available materials and skills. Normally, farmers prefer to dig wells very close to their plots using local materials and skills, and use water guided by their own demand and convenience. Every ten households own one well that is used for extracting water by several pumps. The average distance from the well to the fields is 120

82
m with a range of between 1 to 500 m. The density of pump wells had reached more than 20/km2 in 2001. All of the sampled households reported that they draw water from the wells either by using diesel or electrical submersible pumps. Water is conveyed to the fields through a plastic tube with a diameter of 11 cm called the “Small White Dragon” (SWD) by local people. Each farm household has its own pumps and SWD that lifts water from its own wells. During irrigation periods, farmers convey the pump and the SWD to the fields. The SWD is placed in the wells with one end (inlet) connected to the submersible pump that is completely submerged inside the water of the wells and the other end (outlet) is placed in the fields. Through pump action, water passes through the SWD. Surface irrigation is the predominant irrigation system in the area. Water enters the fields from one end or from a corner and spreads over the fields. As water must take time to cover the entire plot, the depth of water absorbed is different at different points of the plots. To allow adequate irrigation throughout the field more water has to be applied than what is required. Farmers in the study area start to irrigate the field in the early morning and stop once the entire plot is covered with the water. In this fashion, excessive water volume is used for the irrigation. Meanwhile, as no fee is charged for groundwater use, farmers extract as much groundwater as possible in order to meet their irrigation requirements. Irrigation frequency Normally farmers decide on the irrigation period according to their experience. Visible symptoms of water stress are used to time irrigation, of which wilting of the leaves is the most obvious. Results from the field survey show that out of the total wheat households, about 68 percent irrigated winter wheat three times in the cultivation season, 22 percent did so twice and about 10 percent irrigated only once. Among maize households, about 55 percent irrigated summer maize only once, and the rest did so twice during the cultivation season. As for cotton irrigation, about 20 percent of the total cotton households irrigated only once, 56 percent twice and the rest thrice during the cultivation season. Regarding specific periods for irrigation, all of the sampled households reported that they irrigated wheat only during the critical growth periods of jointing, flowering and milk ripeness in early March, early to middle May and early June, respectively. Maize was irrigated during the growth period of jointing and grain filling at the end of July and the middle of August, respectively. Cotton was irrigated during formulation of branches, flowering and bolling in the middle of May, early August and the middle of September, respectively.

83
Chives were cultivated in Dongcui. Average irrigation frequency was 15 times during the cultivation season with minimum frequency of 10 and maximum frequency of 21 events. Significant difference was found in irrigation frequency among chive households (p<0.01) meaning that irrigation frequency is different among chive farmers. Gap between actual and recommended rates of irrigation Based on the research on water requirement for different crops, the Irrigation Bureau of Ningjin County has recommended amounts of groundwater for major crops in the area. The recommended rate includes irrigation frequency per cultivation season, amount of groundwater that should be applied per event and the total amount of groundwater that should be used for each cultivation season for the major crops in the area (Table 9). Results from the field survey show that the average frequency of irrigation adopted by farmers for wheat, maize, cotton and chives was 3, 2, 2 and 15 events, respectively. However the recommended irrigation frequency for these crops is 4, 3, 4 and 20 events, respectively. The quantity of water used by farmers for each mu of wheat, maize, cotton and chives per irrigation event was 65, 63, 67 and 71 m3, respectively, which is higher than the recommended amount of 47, 33, 45 and 60 m3, respectively. In other words, the irrigation frequency adopted by farmers was less than the recommendation, but the quantity of groundwater used for each irrigation event was higher than the recommended amount. It can be said that in general, reduced irrigation frequency led to insufficient irrigation water supply for crop growth. Table 9. Irrigation water applied by farmers versus recommended rates
Wheat Maize Cotton Chives Items Act. Rec. Act. Rec. Act. Rec. Act. Rec.
Irrigation frequency per cultivation season
3 4–6 2 3–5 2 4–6
15 17–20
Amount of groundwater per irrigation event (m3/mu)
65 40–50 63 35–45 67 40–50
71 50–60
Total amount of groundwater (m3/mu/season)
170 190 95 100 135
180 1 039 1 200
Note: Act. = actual amount applied by farmers. Rec. = recommended rate. 1 ha = 15 mu. Source: IBNC (1996) and field survey data. In order to investigate overuse of groundwater for irrigation among farm households, farmers were divided into three groups namely the low-use group, the medium-use group and the high-use group. The low-use group used less groundwater for each application than the minimum recommended amount. The

84
medium-use group’s application matched the recommended amount. The high-use group’s application exceeded the maximum recommended amount. The field survey found that more than 80 percent of the farmers overused groundwater for wheat, maize, cotton and chives during each irrigation event; the average quantity of groundwater used was 69, 69, 72 and 80 m3/mu, respectively. Next was medium use of groundwater — 16, 17, 16 and 14 percent of households for wheat, maize, cotton and chives, respectively. The rest or only about 4 percent of wheat farmers, 2 percent of maize farmers, 2 percent of cotton farmers and 6 percent of chive farmers applied low quantities of groundwater for respective crops. Results from the ANOVA test show that there is significant difference among the amount of groundwater used by different user groups; meaning groundwater is significantly overused at each irrigation event for major crops in the area. Table 10. Amount of groundwater use by crops (m3/mu per irrigation)
Wheat*** Maize*** Cotton*** Chives*** Water user groups
Qty % of HH
Qty % of HH
Qty % of HH Qty % of HH
Low use 13 4 27 2 30 2 44 6 Medium use
45 16 44 17 45 16 56 14
High use 69 80 69 81 72 82 80 80 *** ANOVA significant at 0.001 level. HH = household. Low use = amount of groundwater used for each irrigation event is less than the recommended amount. Medium use = amount of groundwater used for each irrigation event is within the range of the recommended amount. High use = amount of groundwater used for each irrigation event is above the recommended amount. 6.2 Farmers’ Awareness of Groundwater Conservation All sampled households reported that water resources are renewable and not exhaustible. Regarding sufficiency of groundwater for future irrigation if the current irrigation scheme continues, about 56 percent of the sampled households believed that it is sufficient for future irrigation. About 39 percent of the farmers reported insufficiency of groundwater supply for irrigation, and the rest had no opinion. This finding implies that most of the farmers have poor awareness about the scarcity of groundwater resources. They take groundwater resources for granted and consider that they cannot be exhausted. Regarding farmers’ attitudes towards conservation of groundwater resources, 82 percent of the total households agreed with conservation in this respect. Approximately 7 percent did not agree, indicating that irrigation is very

85
important for ensuring crop production and food security, groundwater is renewable and inexhaustible and conservation does not require attention. About 11 percent of the households had no opinion. 6.3 Environmental Implications of Groundwater-use Practices A “declining groundwater table” tops the list of adverse environmental effects caused by current groundwater management practices and is considered to be a very serious problem according to the index value; it is followed by “declining groundwater quality” and “increasing irrigation cost”. These two impacts are considered to be serious problems in the area. “Increasing soil salinity” and “compacted/hardened soil” are considered to be middling problems and “increasing land subsidence” is not a significant problem in the area (Table 11). However, in general, the impact of groundwater management practices on the environment is serious. Evidence from both primary and secondary sources is used to support farmers’ perceptions. Table 11. Ranking of farmers’ perception of environmental effects of groundwater use Effects of groundwater use Index value Declining groundwater table 0.87 Declining groundwater quality 0.78 Increasing irrigation cost 0.65 Increasing soil salinity 0.60 Compacted/hardened soil 0.54 Increasing land subsidence 0.32 All effects 0.63
Note: Interpretation of index values: 0.01–0.20 = very low; 0.21–0.40 = low; 0.41–0.60 = medium; 0.61–0.80 = high; 0.81–1.00 = very high. The declining groundwater table can be substantiated by farmers’ observations and the trend analysis of the groundwater table. Out of the total respondents, 97 percent noted the decline of the groundwater table. The indicator used by the farmers is the reduction of the depth of groundwater, which makes pumping of groundwater increasingly a complex and expensive process. About 43 percent of the respondents believe that the depth of groundwater has been reduced, as the water-drawing distance at present has increased by 13 m. This figure was reported to be 7 m by 31 percent of the respondents and 18 m by 8 percent of the respondents. The rest could not provide proper evidence.

86
Farmers’ perceptions conform with the measurement of the groundwater table. According to the data from 50 shallow wells in the study area, it was observed that the average depth from the ground to the water level is increasing over time due to the decreasing depth of the groundwater table. In 1970, the average depth from the ground to the water level in the wells was 3.68 m, which increased to 7.51 m in 2000. The average depth of the groundwater table in 1970 was 12.36 m, which was subsequently reduced to 7.73 m in 2000, indicating approximately an average annual water table decline of 0.21 m. In addition, one-tenth of the total wells tend to dry up temporarily during the summer season, and a few are abandoned due to the lack of water. The level of water table decline also varies by seasons. Seasonal change of the depth from the ground to the water table over the past 30 years shows that the water table remains at 5.34 m in February. However, the water table starts to decline sharply in May and the depth from the ground to the water level increases at 6.77 m. In fact April and May are peak months to irrigate winter wheat and cotton. During this season, farmers in the area abstract as much water as possible to irrigate their wheat and cotton fields. It should be noted that almost all the farmers in the area irrigate the land at the same time, exerting high pressure on the groundwater resource. Intensive consumption of groundwater by irrigation leads to a sharp lowering of the water table in May. The water table rises in August (5.85 m) because of less irrigation demand during this period and groundwater is recharged during the rainy season starting in June. The water table remains relatively stable in November (6.03 m), as there is not much demand for irrigation consumption. These data are also supported by farmers’ perceptions as most farmers experienced difficulty in pumping groundwater during the summer. The implications of the fluctuation of groundwater levels are twofold. First, crop irrigation consumes most groundwater resources and induces seasonal change of water levels. Surface water resources such as channels and streams have not been available since the early 1990s. Crop production in the study area relies on groundwater for irrigation. Second, continuous decline of water levels over the past years is an indicator of imbalance between abstractions and recharge. Rainfall is the only major water source for groundwater recharge in the area. As discussed earlier, in Ningjin County, irrigation consumes most of the groundwater, generating more abstraction than recharge. If this situation continues, groundwater will become seriously overexploited and exhausted. Declining groundwater quality is perceived to be the second most important impact of groundwater management practices. Water quality refers to the characteristics of water in relation to its intended use (Kandiah, 1990). Currently, water quality guidelines that are used are those proposed by FAO (Ayers and Westcot, 1985, cited in Kandiah, 1990). As suggested, for irrigation, water

87
quality can be assessed in terms of total dissolved salt (TDS) concentration, concentration of individual ions, heavy metals and trace elements. In other words, water quality for irrigation depends on the content of silt and salt constituents present in the water. Crops such as rice, sorghum, wheat, cotton and barley begin to experience yield reduction when irrigated with water with TDS concentrations of 1 200, 1 600, 2 400, 3 100 and 3 200 mg/l respectively. In the context of the NCP, the salt content of groundwater (total dissolved solid content of groundwater such as Ca++, Mg++, K+, Na+, Cl -, SO4- and HCO3-) is taken as the most important indicator for irrigation water quality (MOA, 1996). It is considered in general that the total dissolved salt content of groundwater for irrigation purposes should be less than 1 000 mg/l. For the NCP, the threshold values of salt content of groundwater for irrigation are identified and shown in Table 7 (CAS, 2000). Results from wells show that the average salt content of groundwater in the study area is 1 427 mg/l ranging between 1 195 and 1 817 mg/l. With reference to the aforesaid threshold values, crops irrigated with this kind of water should have good salt tolerance; a drainage system should be available in the field, or alternative freshwater irrigation should be available. However, the dominant crops are wheat and maize. As classified by Mass (1984) and Kandiah (1990), wheat is moderately salt-tolerant while maize is moderately salt-sensitive; cotton is tolerant and chives are sensitive. Therefore, a drainage system is required for irrigation of these crops. However, groundwater with high salt content is the only source of irrigation water in the area. Drainage systems are not available in the fields. Results from the household survey and FGDs indicate that in some cases maize would shrivel or fail if irrigated twice with groundwater. As defined by the farmers, current irrigation water is “dangerous water”. The household survey showed that about 64 percent of farmers believe that salt concentration in groundwater is higher than it was ten years earlier, based on the changing taste of groundwater. The researcher also tasted brackish water in the field. Increasing irrigation cost was ranked as the third most important effect. Irrigation cost includes well construction, pumps, tubes, diesel and labour cost. Equipment and material costs such as those spent on well construction, pumps and tubes were counted on an annual basis by using the depreciation rate of equipment and tools. Diesel cost is the actual cost spent on purchasing diesel. Labour cost for irrigation is converted from workdays and the local wage rate.

88
Overexploitation of groundwater results in a progressive decline in well yields due to an increase in suction lift and drying of excavated wells. Results from monitoring of wells show that the well yield decreased from an average of 35 m3/hour in 1973 to 17 m3/hour in 2000. Correspondingly, time spent on fetching water increased from 1.5 hours in 1973 to 2.7 hours in 1990, 3.0 hours in 1995 and 4.0 hours in 2000 for irrigating 1 mu of cropland. The cost of pumping water has increased due to increased consumption of diesel and electricity and labour costs. The household survey revealed that the cost of irrigation has been increasing over recent years. During the household survey, farmers were asked to recall the amount they spent on irrigation in 1990, 1995 and 2000. For wheat and maize rotational cropping, for instance, the cost for irrigating 1 mu of wheat and maize increased from 71 and 46 yuan in 1990 to 86 and 49 yuan in 1995 and 105 and 59 yuan in 2000, respectively. Correspondingly, the percentage of irrigation cost to total production cost increased from 20 and 17 percent in 1990 to 25 and 19 percent in 1995 and to 29 and 21 percent in 2000, respectively. This implies that farmers have to spend about one-quarter of the total production cost on irrigation currently. Similarly, the cost for irrigating 1 mu of cotton also increased from 43 yuan in 1990 to 56 yuan in 1995 and to 77 yuan in 2000; the percentage of irrigation cost to total production cost increased. This trend was also applicable to chives — total irrigation cost increased from 159 yuan in 1995 to 182 yuan in 2000 comprising 4 percent and 6 percent of the total production cost, respectively. Increasing soil salinity and compacted/hardened soil were ranked as the fourth and fifth major effects of groundwater extraction, respectively. Salinization is the most widespread and serious water quality issue facing the NCP in general and the study area in particular. Salinity is directly related to water quality and irrigation management becomes a problem if the salt contained in irrigation water is allowed to accumulate to a concentration that reduces the yields of crops. When pumping is started, the salt water rises in a cone in response to pumping action. Leaching is the only practical way to remove salts but is effective only where there is an impermeable layer beneath the root zone. In other words, leaching requires a drainage system to carry away the dissolved salts and avoid toxic buildup. The risk of soil salinization increases when saline water is used in the field (ESCAP, 2000). However, excess amounts of saline water were used to irrigate the farmland in the study area. Under brackish water conditions, salt accumulates in the soil via irrigation. White patches, which normally reflect salt concentration in the soil, mark some fields, and were also reported by 81 percent of the sampled
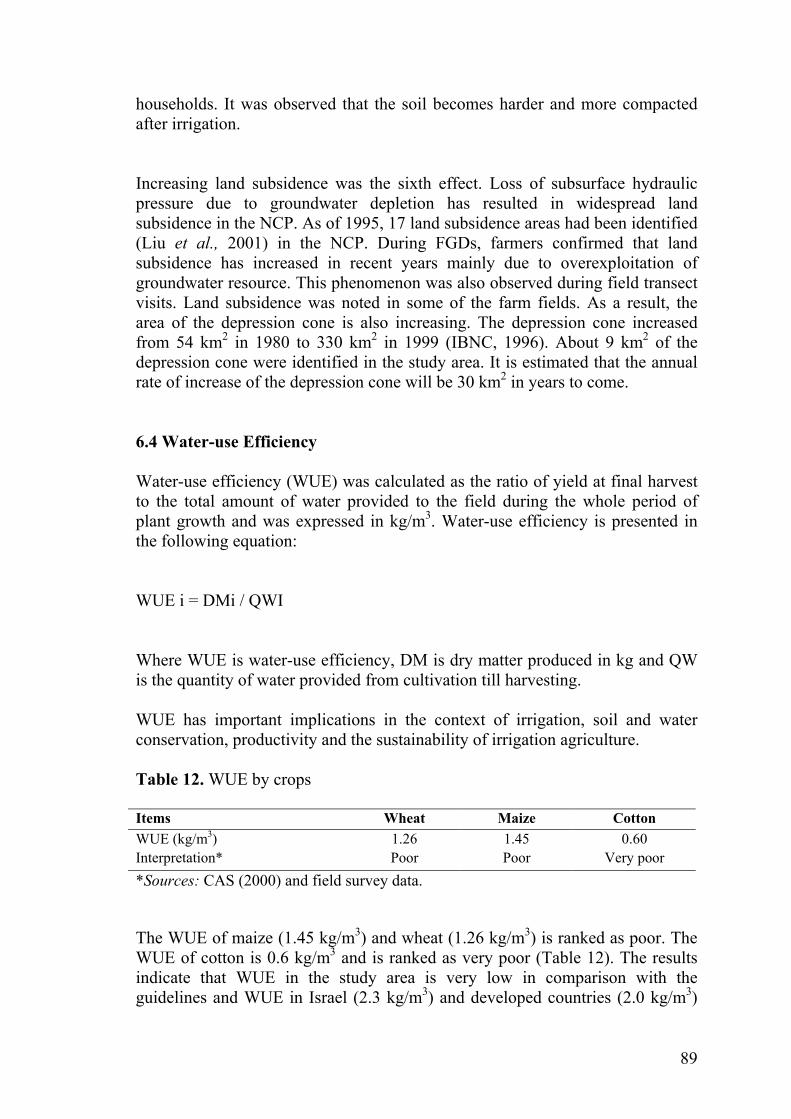
89
households. It was observed that the soil becomes harder and more compacted after irrigation. Increasing land subsidence was the sixth effect. Loss of subsurface hydraulic pressure due to groundwater depletion has resulted in widespread land subsidence in the NCP. As of 1995, 17 land subsidence areas had been identified (Liu et al., 2001) in the NCP. During FGDs, farmers confirmed that land subsidence has increased in recent years mainly due to overexploitation of groundwater resource. This phenomenon was also observed during field transect visits. Land subsidence was noted in some of the farm fields. As a result, the area of the depression cone is also increasing. The depression cone increased from 54 km2 in 1980 to 330 km2 in 1999 (IBNC, 1996). About 9 km2 of the depression cone were identified in the study area. It is estimated that the annual rate of increase of the depression cone will be 30 km2 in years to come. 6.4 Water-use Efficiency Water-use efficiency (WUE) was calculated as the ratio of yield at final harvest to the total amount of water provided to the field during the whole period of plant growth and was expressed in kg/m3. Water-use efficiency is presented in the following equation: WUE i = DMi / QWI Where WUE is water-use efficiency, DM is dry matter produced in kg and QW is the quantity of water provided from cultivation till harvesting. WUE has important implications in the context of irrigation, soil and water conservation, productivity and the sustainability of irrigation agriculture. Table 12. WUE by crops Items Wheat Maize Cotton WUE (kg/m3) 1.26 1.45 0.60 Interpretation* Poor Poor Very poor *Sources: CAS (2000) and field survey data. The WUE of maize (1.45 kg/m3) and wheat (1.26 kg/m3) is ranked as poor. The WUE of cotton is 0.6 kg/m3 and is ranked as very poor (Table 12). The results indicate that WUE in the study area is very low in comparison with the guidelines and WUE in Israel (2.3 kg/m3) and developed countries (2.0 kg/m3)

90
(CAS, 2000). Food grains have more potential to conserve water and provide better yields, while cotton has very low potential. 6.5 Future Water Demand and Supply Water demand analysis It is estimated that the total irrigated area of major crops will be 750 000 mu in 2010, including 370 000 mu of cereal crops such as winter wheat and summer maize, 180 000 mu of cotton and 100 000 mu of vegetables (CAS, 2000). Water demand for irrigation can be calculated with the formula (CAS, 2000): n Y = ∑ (xiai)(2-u) i=1 Where, Y = amount of irrigation water supply (m3) xi = irrigation area of i crop (mu) ai = water requirement of i crop (m3/mu) u = WUE The irrigation area and water requirement of respective crops is based on increasing food demand by 2010. Current WUE is calculated according to actual WUE of respective crops (Table 13). Improved WUE is estimated as WUE after the adoption of water conservation techniques (CAS, 2000). Irrigation water demand is calculated based on two scenarios: WUE remains the same and WUE improves by up to 90 percent when water conservation techniques are adopted (CAS, 2000). Table 13. Irrigation water demand by crops by 2010 in Ningjin County
Items Wheat–maize Cotton Vegetables
Total
Irrigated area (million mu) 0.37 0.18 0.10 0.75 Water demand per mu (m3) 290 180 800 Scenario 1. Under current WUE 0.66 0.58 0.82 Total water demand (million m3) 143.78 46.01 94.40 284.19 Scenario 2. Under improved WUE 0.90 0.90 0.90 Total water demand (million m3) 118.03 35.64 88.00 241.67
Sources: CAS (2000), IBNC (1996) and field survey data.

91
This shows that if current WUE continues in the future, total water demand for irrigation will be 284 million m3 by the 2010. If water conservation techniques such as drop irrigation and sprinkling are adopted, WUE can be increased up to 0.90 (CAS, 2000). Under this scenario, total water demand for irrigation will be 242 million m3 by 2010. Water supply analysis Water supply consists of two sources: surface water and groundwater. Surface water is mainly runoff and rivers such as the Yellow River. It is estimated that total surface water supply will be 77 million m3 including 13 million m3 from runoff and 64 million m3 from the river by 2010. Groundwater resources consist of rainfall seepage and irrigation seepage. About 147 million m3 of groundwater are available; this includes 111 million m3 of rainfall seepage and 37 million m3 of irrigation seepage. Therefore, total water supply from both surface and groundwater resources will be 216 million m3 by 2010 (Table 14). Table 14. Water supply by 2010 in Ningjin County
Water source Quantity (million m3) Surface water supply Runoff 13.24 River 64.00 Total 77.24 Groundwater supply Rainfall seepage 110.59 Irrigation seepage 36.66 Total 147.25 Groundwater evapotranspiration 8.48 Total water supply 216.01 Source: Computed from the data of CAS (2000) and IBNC (1996). It is obvious from the above analysis that by 2010, the total water requirement for crop production will be about 284 and 242 million m3 under different WUE, while total water supply will be only 216 or 152 million m3 depending on the availability of water from the Yellow River. Even if river water is available for irrigation, the gap between water demand and supply will still be 68 and 26 million m3, respectively. Therefore, water supply cannot meet irrigation demand in the future.

92
Ministry of Irrigation Ministry of Agriculture
Department of Irrigation
Bureau of Water Resource Survey
National People’s Congress
Irrigation Bureau
Agricultural Bureau
Department of Agriculture
Irrigation Bureau Agricultural Bureau
Bureau of Water Resource Survey
Farmers
Figure 8. Institutional arrangements for groundwater management
National
Provincial
District
County
State Council
Apart from water consumption by the agriculture sector, it has been estimated that by 2010, water demand from the industry sector will be 60 million m3, and demand from domestic consumption will be 10 million m3. Therefore, a water deficit will be critical in the future. The area will face the critical challenge to recharge groundwater resources. Future agricultural development in the county will be depressed and unsustainable if the current water-use scenario and attitudes of farmers persist. This critical situation warrants the rational management of groundwater for irrigation in order to minimize adverse effects on scarce water resources and soil. 6.6 Institutional Arrangements for the Management of Groundwater Resources Effective management of groundwater includes an integrated policy for conjunctive and appropriate use of groundwater as well as the implementation of this policy by the institutions involved in the management of groundwater resources. The main institutions involved directly in groundwater management are shown in Figure 8.

93
The National People’s Congress can formulate water laws and regulations and development plans for the country. The State Council approves these laws, regulations and plans. National government agencies such as the Ministry of Irrigation and Ministry of Agriculture are responsible for organizing the implementation of the laws and regulations and passing on these laws and regulations to the line agencies. At the provincial level, the Department of Irrigation and Department of Agriculture work together to make local plans and regulations for groundwater management by taking into consideration water quantity and quality monitoring results from the Bureau of Water Resource Survey, apart from the implementation of national laws and regulations. Similarly, the District Irrigation Bureau, the Bureau of Water Resource Survey and the Agricultural Bureau assume responsibilities for local groundwater management supervised by provincial institutions. The main thrust of the local regulations is that groundwater should be used rationally according to actual demand and supply; uncontrolled use should be strictly prevented and penalized; technologies that consume more power to draw water and pollute water should be eliminated; water conservation technologies such as micro, drop and sprinkler irrigation should be disseminated to the farmers; and further extraction should be banned in areas affected by overexploitation of groundwater. In Ningjin County, the Irrigation Bureau and Agricultural Bureau are the two institutions responsible for groundwater management. They implement the local laws and regulations and monitor farmers’ groundwater use. However, due to administrative reform and reduction of budget, it seems that no one in either institution is actually assuming responsibility for the implementation of laws and regulations apropos groundwater management. Moreover, there is no clear indication of the responsibility and right for groundwater utilization and conservation in the present set of laws and regulations. Strategies, strict monitoring and reporting methods are also missing. This makes it difficult for the local institutions to implement laws and regulations. Farmers are also scantily informed about regulations. They consider groundwater to be a free gift and use it according to their own demand and benefit.

94
7. SOIL-FERTILITY MANAGEMENT Soil productivity is essential to sustain a rural economy on which the livelihoods of millions of the rural population depend. The improvement of soil fertility therefore depends primarily on soil-fertility management practices. This chapter attempts to provide an insight into soil-fertility management practices and environmental implications through the application of soil-fertility indicators and shallow groundwater quality indicators at the specific farm site. Contributing factors to soil fertility such as the application of organic fertilizers and chemical fertilizers, soil pH, organic matter content and NPK content, as well as farmers’ awareness have been taken into consideration in the assessment of soil-fertility management practices. 7.1 Use of Organic Fertilizers Farmyard manure (FYM) Farmyard manure (FYM) and compost are the major repositories for plant nutrition. The main sources of FYM in the study area were cattle, pigs, chickens, donkeys and sheep. Farmers collect FYM monthly and deposit it in a large pit near the field where the FYM usually decomposes through microbial action in the soil. Normally, FYM is transported to the field during land preparation as basic fertilizer for all crops. FYM is also purchased from suppliers. The major suppliers are farmers in the neighbouring counties who raise large numbers of livestock, or fertilizer dealers. During the land preparation period, the suppliers come to the villages carrying FYM on trucks or animal-driven vehicles. Farmers purchase FYM according to their willingness and the availability of cash. Very often, farmers purchase FYM without knowing the demand of the soils. The quantity of FYM applied varied with the crops under cultivation. It was found that 94 percent of wheat farmers applied FYM to their plots. The average amount used per mu was 2 247 kg for each cultivation season. Due to rotational cropping of winter wheat and summer maize, normally farmers did not apply FYM for maize. About 96 percent of sampled cotton households used FYM. The average quantity applied was 2 855 kg/mu. All the vegetable farmers applied FYM at 3 300 kg/mu for each cultivation season (Table 15). These data show that cash crops like cotton and chives are intensively manured. Cash crops grown in the area receive priority for manuring as they assure family income. The analysis shows that FYM is still the major source of plant nutrition in the study area. FYM application for wheat and cotton was higher in Daliu than in other villages (Table 15) because the number of livestock reared in Daliu is significantly

95
higher than in other villages. Farmers in Daliu take advantage of this and apply more FYM on their plots. Apropos FYM application by crop, the highest amount of FYM was used for chives owing to its high economic return in comparison with other crops; this was followed by cotton and wheat. However, the quantity of FYM used for each crop was less than the recommended amount indicating that FYM is applied insufficiently to all major crops in the area. Table 15. FYM application by crops and study villages (kg/mu) Crops Dongliu Daliu Dagen Dongcui All villages Recommended amount
Wheat 2 395 2 479 1 851 2 265 2 247 4 200–7 200 Cotton 2 778 3 065 2 584 2 868 2 855 4 200–6 000 Chives - - - 3 257 3 257 6 000–8 400 Sources: SSOD (2000) and field survey data. Most (95 percent) farmers think that the amount of FYM available is inadequate to fertilize their soils. The reason being that although the number of livestock reared has been increasing over the years, the production of FYM from reared livestock is still far from meeting demand. Another reason is that as animals are not stall-fed much manure is distributed outside cultivated land during grazing, mostly on canal bunds and roadsides. Due to insufficient production of FYM, some farmers have to purchase it from suppliers. In general, spreading and mixing FYM quickly into the soil by ploughing is the common practice for wheat, maize, cotton and chive cultivation, as practised by more than 60 percent of the farmers. Others just spread FYM on fallow land for days or place it in heaps for drying. Farmers do not spread FYM daily; they usually spread FYM only once before the sowing time for wheat, maize and cotton, and two to three times for chives during the cultivation season. Crop residues Mulching with crop residues is a widely used practice. Over the years, this practice has been increasing and has been used on a large scale in recent years. Farmers reported that due to the overall increase in crop residues remaining in the field, high amounts of green materials are being used as mulch in the soil. Biologically, mulching materials increase the activities of soil organisms, including earthworms. Mulching minimizes soil erosion by reducing raindrop impact on the soil. During the field visit it was found that most of the crop residues of winter wheat were left in the field. About 77 percent of wheat farmers left 60 percent of the
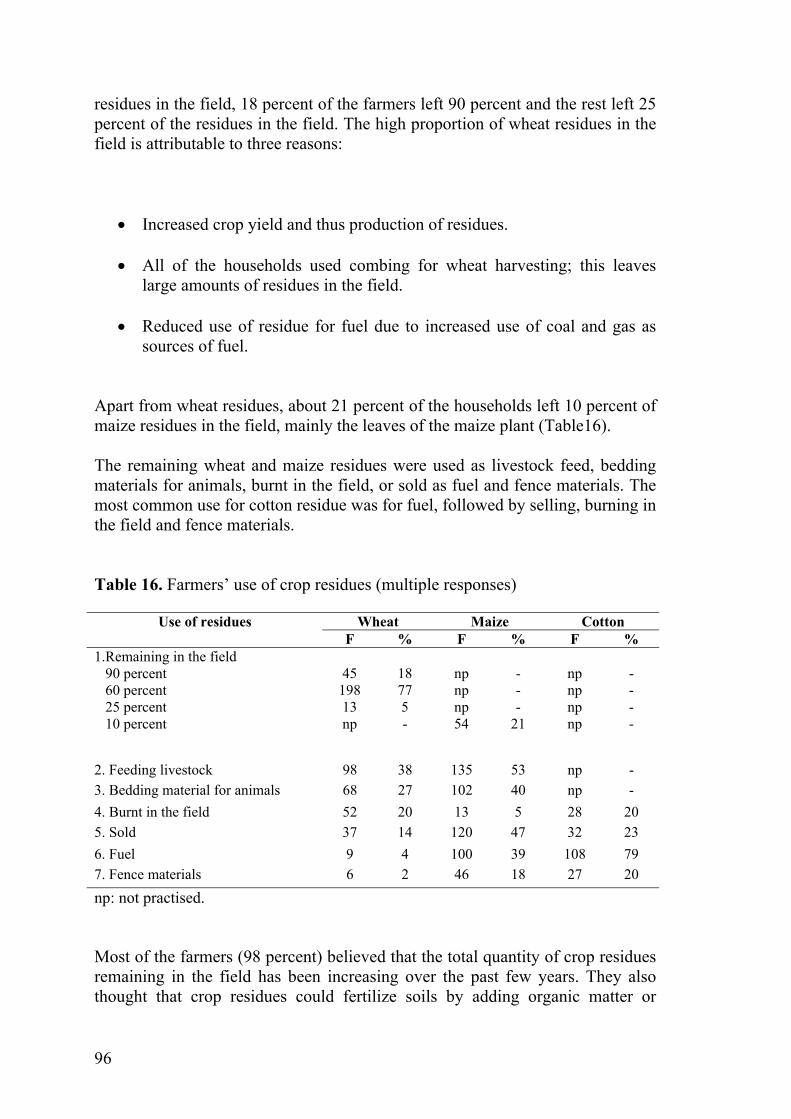
96
residues in the field, 18 percent of the farmers left 90 percent and the rest left 25 percent of the residues in the field. The high proportion of wheat residues in the field is attributable to three reasons:
• Increased crop yield and thus production of residues. • All of the households used combing for wheat harvesting; this leaves
large amounts of residues in the field. • Reduced use of residue for fuel due to increased use of coal and gas as
sources of fuel. Apart from wheat residues, about 21 percent of the households left 10 percent of maize residues in the field, mainly the leaves of the maize plant (Table16). The remaining wheat and maize residues were used as livestock feed, bedding materials for animals, burnt in the field, or sold as fuel and fence materials. The most common use for cotton residue was for fuel, followed by selling, burning in the field and fence materials. Table 16. Farmers’ use of crop residues (multiple responses)
Wheat Maize Cotton Use of residues F % F % F %
1.Remaining in the field 90 percent 60 percent 25 percent 10 percent
45
198 13 np
18 77 5 -
np np np 54
- - -
21
np np np np
- - - -
2. Feeding livestock 98 38 135 53 np - 3. Bedding material for animals 68 27 102 40 np - 4. Burnt in the field 52 20 13 5 28 20 5. Sold 37 14 120 47 32 23 6. Fuel 9 4 100 39 108 79 7. Fence materials 6 2 46 18 27 20 np: not practised. Most of the farmers (98 percent) believed that the total quantity of crop residues remaining in the field has been increasing over the past few years. They also thought that crop residues could fertilize soils by adding organic matter or

97
conserving soil moisture. Maize is sown just after the wheat harvest. Wheat residues normally mulch the maize field till the first irrigation and ploughing. The residues are thus ploughed into the soil and decompose gradually. Farmers have realized the importance of crop residues for improving soil fertility, soil structure and moisture; they are willing to leave crop residue in the field, instead of using it for other purposes such as animal feed and fuel. 7.2 Use of Chemical Fertilizers Chemical fertilizers are the most important externally applied source of plant nutrition in the NCP. Discussions and field observations revealed that more and more farmers are applying fertilizers for all crops including wheat, maize, cotton and vegetables. Each farm household can access chemical fertilizers easily. Every village has two to three small fertilizer shops owned by local villagers. Farmers can purchase fertilizers from these shops at compatible market prices. There are also some larger fertilizer shops located in the commune centre and town centre of the county where more variety of fertilizers is available. Farmers are free to choose fertilizers according to their preference and financial situation. Results show that all of the sampled households (100 percent) have been applying chemical fertilizers for wheat, cotton and chives. The majority (96 percent) of sampled households has been using mineral fertilizers for maize. The main varieties of fertilizer materials used in the cropping systems were urea, DAP and potassium sulphate (PS). These fertilizers are the most commonly used commercial fertilizers in China due to high concentration of nutrients and cheap prices. Nevertheless, these fertilizers are available everywhere in the area with small fluctuations in prices. Farmers can easily purchase the fertilizers according to their needs and willingness. The combination of fertilizers was different between crops. The popular combination was urea+DAP, practised by 72 percent and 84 percent of wheat and maize farmers, respectively. Urea alone was applied by many maize farmers (61 percent) and a small percentage of wheat (9 percent) and cotton (16 percent) farmers. Only a small percentage of wheat (16 percent) and maize (2 percent) farmers followed a more balanced fertilizer combination (urea+DAP+PS). All of the chive farmers used a balanced fertilizer combination. Frequency and methods of fertilizer application

98
More than half of the wheat farmers applied fertilizers twice, about 40 percent three times and the rest one to four times during the cultivation season. About half of the maize farmers fertilized only once, 46 percent did so twice and the rest three times. More than half of the cotton farmers fertilized cotton three times, about 27 percent did so four times and the rest twice, five times and once. Fertilizers were used more frequently for chive cultivation. About 44 percent of the households applied fertilizers ten times, the rest applied six to 16 times during the cultivation period. Both broadcasting at planting and topdressing applications were done by hand. Broadcasting at planting and topdressing are often suitable for N fertilizers; however for phosphate and potassium fertilizers, the placement method is more beneficial but it is not practised in the area. Table 17. Farmers’ methods of fertilizer application by crops
Broadcast at planting Topdressing Both Crops F % F % F %
Wheat 12 5 152 59 92 36 Maize 4 2 163 67 76 31 Cotton 5 4 107 78 25 18 Chives 0 0 0 0 50 100
Topdressing is done by most of the farmers. All the sampled farmers applied fertilizers just before irrigation or before the rains arrive. Most farmers indicated that fertilizer scheduling was the same as that for irrigation scheduling. Farmers believed that this kind of “traditional fertilization timing” could help fertilizers leach into the soil quickly, reduce volatilization of fertilizers on the soil surface and thus increase efficiency of fertilizer utilization. Amount of fertilizer application Fertilizer use is more relatively expressed in terms of kilograms of nutrients per mu of cultivated land during the growth period. Therefore, amounts of different fertilizers applied were converted into nutrient content of NPK. This gives an impression of the intensity of nutrients used. Among food grains, wheat received the highest amount of nutrient per mu being about 38 kg and higher than the provincial average level of 21 kg and the national average of 17 kg (FAO, 2000); next was cotton that consumed about 32 kg of fertilizer per mu. The least quantity was for maize — about 18 kg per mu —because farmers consider maize to be an extra harvest from the field; fewer inputs in terms of chemical fertilizer

99
are used for maize production. For chives, about 158 kg of fertilizer were applied per mu during the cultivation season — lower than the provincial average level of 231 kg/mu. Among total nutrients applied, N accounted for more than 67 percent of the total nutrients applied for wheat, maize and cotton (44 percent for chives). The main sources of N were urea and DAP. Farmers still prefer to use high amounts of urea on their farmland because N concentration in urea is high and the price is relatively lower than other fertilizers. Also, unlike other fertilizers, the quality of urea remains relatively stable over time. Phosphorus accounted for 16 to 27 percent of the total nutrients applied for all crops. Only a small fraction or about 7 percent and 4 percent of the total nutrients was used by K for wheat and maize, respectively. No K fertilizer was applied for cotton. However, comparatively higher amounts of K were used for chives owing to their high commercial value. The percentage of K used for chives accounted for 27 percent of the total nutrients. Sources of P and K were DAP and PS, respectively. 7.3 Appropriateness of Fertilizer Use The gap between recommended and actual fertilizer application The amount of fertilizers applied by farmers varied with recommended amounts (Table 18). The average amount of N applied was higher than the maximum amount recommended. The average amount of P applied also exceeded recommended amounts for all crops except for maize (P use was below the optimum recommended level). Unlike N and P application, farmers applied small amounts of K for wheat, maize and cotton. Average amounts of K were less than the optimum dosage recommended (Table 18). The t-test result showed that the amount of fertilizer used is significantly different between farm households (p<0.01). Table 18. Recommended and actual amount of fertilizer application by crops (kg/mu)
N P K Total Crops R. D. A.D. R. D. A.D. R. D. A.D. R. D. A.D.
Wheat 14–17 25** 68 10** 79 3** 27–34 38** Maize 11–14 16** 67 3** 57 1** 22-28 18** Cotton 13–16 24** 46 7** 79 na 24–31 31** Chivesa 40–50 69** 25–35 44** 35–45 43** 105–135 156** R.D. = recommended dosage, A.D.= actual dosage applied by farmers. a = dosage applied per mu of land per year. na = not applied ** One-sample t-test significant at the 0.01 level. Sources: SSOD (1999) and field survey data.

100
Nitrogen fertilizer is widely and heavily used in the area due to its high nutrient concentration, cheap price and relatively reliable quality. Farmers consider N fertilizer to be a staple nutrient for crops. They usually ensure initial N application in the field, then consider the use of P and K. It is thus necessary to examine the amount of N used by crops and study villages. Table 19 shows that the dosage of N fertilizer used is above the recommended threshold values for all the crops in the study villages. In order to examine N application among farmers, farmers were divided into three groups based on the amount of N used. The low-use group included farmers using less than the recommended amount. The medium-use group consisted of farmers using the recommended amount. The high-use group included farmers using quantities above the maximum recommended amount. Table 19. Amounts of N used by crops (kg/mu)
Wheat*** Maize*** Cotton*** Chives*** Fertilizer user groups Qty % of
HH Qty % of
HH Qty % of
HH Qty % of
HH Low use 12 15 9 7 - - - - Medium use 16 20 12 28 - - 15 30 High use 24 65 18 65 24 100 78 70 *** ANOVA significant at the 0.001 level. Table 19 shows that 65 percent of wheat farmers overused N fertilizer; the average amount used by this high-use group was about 24 kg/mu. Only 20 percent of the farmers belonged to the medium-use group. The rest or 15 percent of the farmers used less than the recommended amount of N. The situation for maize was similar. Approximately 65 percent of maize farmers overapplied N. The average amount used was about 18 kg/mu. Nearly 28 percent of the farmers were in the medium-use group. The rest applied less than the recommended amount. Regarding cotton, all of the farmers overused N and the average amount used was 24 kg/mu. As for chives, nearly 70 percent of the farmers overapplied N, the average amount being 78 kg/mu. Thirty percent of the farmers applied N according to the recommended amount. Results from the ANOVA test show that there is significant difference between the amounts of N fertilizer used by the different user groups. As N was overused by more than 65 percent of the sample households, the result of the above analysis implies that N is significantly overused for the major crops in the area. Why does such a large gap exist in the actual and recommended doses of fertilizers and thus overuse of fertilizers?. The most site-specific reasons are discussed briefly hereunder.

101
• None of the farmers knew about the nutrient status of soils in their fields. Although soil tests had been conducted in some of the farmers’ fields, the results had not been disseminated.
• None of the sampled farmers knew about crop-specific recommended
amounts of fertilizers from the Soil Survey Office of Dezhou District (SSOD).
• Most of the sampled farmers (>95 percent) were not aware of the
importance of appropriate doses of fertilizer recommended for particular locations. They believed that the more fertilizer they applied, the more yield they obtained. This made farmers use high doses of fertilizers on their fields.
Farmers’ perceptions of fertilizer application Farmers reported that increasingly higher amounts of FYM, crop residues and chemical fertilizers had being applied to the fields in recent years. The main reasons being increased food supply, enhanced farm household economies, more livestock and more production of crop residues. More than 90 percent of the households believed that the amounts of FYM, crop residues and chemical fertilizer had been increasing over the past ten years. Increased livestock population contributes largely to increased FYM application, and increased production and mechanization of farming production has increased the quantity of crop residues remaining in the field. Moreover, farmers’ adoption of HYVs in recent years has significantly increased the application of chemical fertilizers, which in turn increases the total production of biomass and the amount of crop residues. It was also found that 57 percent of the households considered the present dosage of chemical fertilizer applied to be excessive in comparison with their previous experience. About 35 percent of the sampled households thought the amount they applied was just appropriate. Only about 6 percent mentioned that the amount they used was insufficient. The rest of the farmers had no opinion. Significant difference was found between farmers’ perceptions of fertilizer use (p<0.001). Although the amount of fertilizers adopted by the majority of the farmers was above the recommended value, about half of the farmers considered their application to be appropriate. Unawareness of excessive use of fertilizers is an important reason for continuous overuse of chemical fertilizers, particularly N.

102
In terms of fertilizer application, most households (65 percent) preferred combined application of FYM and chemical fertilizers. The main reasons listed were:
• The combination of both organic and chemical fertilizers can increase crop yield better than individual fertilizers.
• Improved soil tilth and thus improved soil structure and aeration.
• Increased water-holding capacity of the soil.
• Increase drought resistance capacity.
About 23 percent of the farmers preferred to use FYM because it is cheap and nutrition effects last longer than chemical fertilizers. The remaining 12 percent liked to use chemical fertilizers because of their rapid effects and ease of application. However, FYM production is not sufficient in the area. Some farmers have to buy it from suppliers. High prices and unreliable quality (for instance, low nutrient content) of purchased FYM restricts applying more FYM on the land. Chemical fertilizers are still the dominant nutrient source for the majority of the farmers. Farmers’ perceptions of soil fertility Farmers strongly believed that soil fertility had increased since the implementation of the household responsibility system in 19831. The researchers and extension workers in the area expressed similar views. Analysis shows that more than 60 percent of the sampled farmers perceived that soil fertility had increased over the years. About one-fourth of the farmers mentioned that soil fertility had not changed. The rest reported decreased soil fertility over the years. Farmers indicated the main reasons for increased soil fertility were increased levels of FYM, crop residues and chemical fertilizer application as well as increased time spent on taking care of the land since implementation of the household responsibility system. In Daliu about 73 percent of the households indicated increased soil fertility over the years, citing increased application of FYM in particular. Farmers were confident about improving soil quality and fertility through increased use of both organic and chemical fertilizers. Increased use of chemical fertilizers can add nutrients directly to the soil, production of biomass increases, which in turn increases the amount of crop residues 1 Since the implementation of the household responsibility system, farmers have the right to use the land for long (or indefinite) periods of time. This encourages farmers to invest more in the land. The productivity of the land is related directly to farmers’ benefit.

103
remaining in the fields; this contributes positively to soil fertility and structural improvement. Some farmers felt that chemical fertilizers contributed to crop yield increase in the initial years due to the addition of nutrients to the soil. However, continuous use of fertilizers compacted and hardened the soil. Other causes were declining fallow periods and in-situ manuring, reduced crop diversification, using HYVs that extract more nutrients from the arable land and increased irrigation using groundwater resources coupled with traditional irrigation methods. 7.4 Nutrient Balance in the Farming System The nutrient balance in the farming system was investigated and considered various channels of nutrient gains and losses in the soil ecosystem. In prevailing farming systems the single factor most responsible for nutrient loss from the soil ecosystem is crop harvesting (Uexkull, 1988; Tandon, 1993). The nutrient balance of each agro-ecosystem was computed as the difference between input applied and extracted by net harvest, erosion + runoff, leaching and volatilization + denitrification. Soil erosion is not a nutrient loss factor in flat lands like the study area of this research. Leaching may be serious in light-textured and well-drained soil; volatilization and denitrification losses are thought to be very low considering the existing soil conditions. As these losses are extremely site-specific and could not be empirically estimated, the major nutrient loss here is attributable to crop removal only. The nutrient gains were largely attributed to the addition of FYM, crop residues and chemical fertilizers in the study area. Therefore, different types of fertilizers applied were converted into NPK using conversion factors defined for local areas, to examine the aggregate amount of nutrients applied to farmlands. Similarly, NPK extracted by crops was estimated based on their yields. Nutrient status was analysed by deducting uptakes from inputs. Table 20 shows that there is net positive supply of N and P in crop fields. The highest amount of net positive supply of these nutrients was found in chive fields (the input/output ratios of N and P were 11.15 and 17.30, respectively), followed by cotton (9.04 and 3.15, respectively), wheat (2.29 and 2.81, respectively) and maize (1.48 and 1.33, respectively). Therefore, the amount of N and P removed by crops is replenished in the fields. The positive balance of N and P implies that current practices using urea and DAP fertilizers are probably not economical particularly for the farmers who have already high to very high levels of these nutrients in their soils
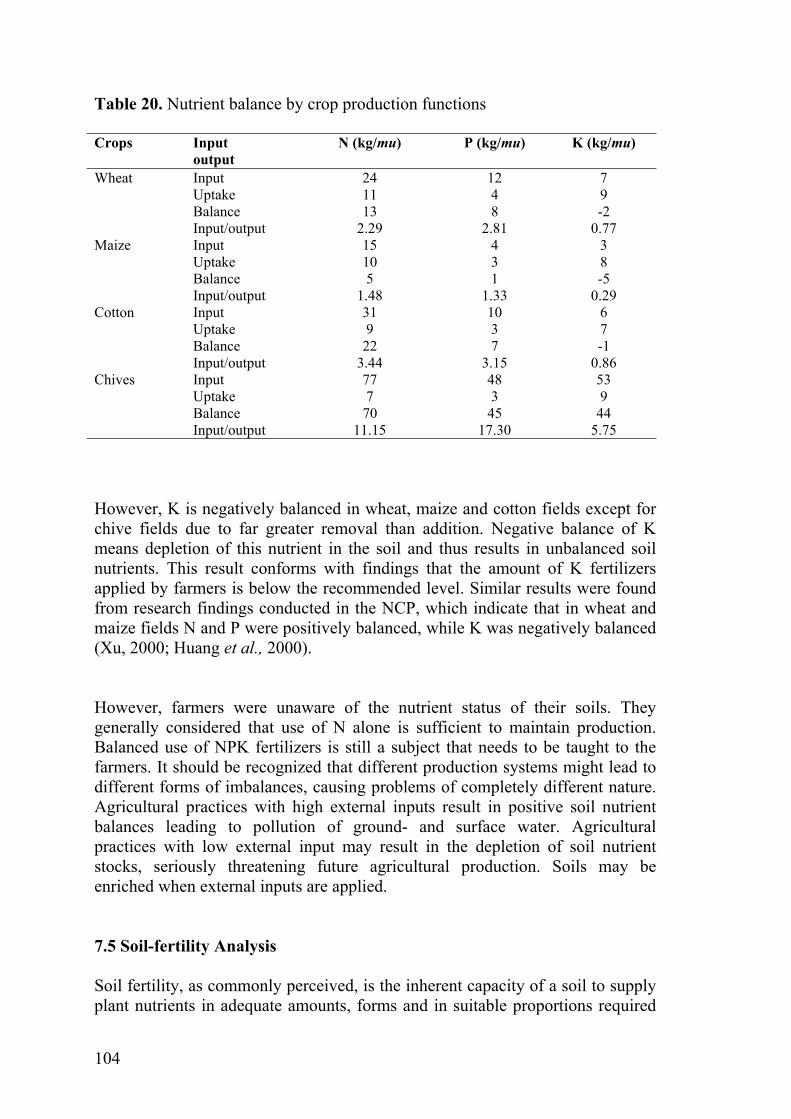
104
Table 20. Nutrient balance by crop production functions Crops Input
output N (kg/mu) P (kg/mu) K (kg/mu)
Input 24 12 7 Uptake 11 4 9 Balance 13 8 -2
Wheat
Input/output 2.29 2.81 0.77 Input 15 4 3 Uptake 10 3 8 Balance 5 1 -5
Maize
Input/output 1.48 1.33 0.29 Input 31 10 6 Uptake 9 3 7 Balance 22 7 -1
Cotton
Input/output 3.44 3.15 0.86 Input 77 48 53 Uptake 7 3 9 Balance 70 45 44
Chives
Input/output 11.15 17.30 5.75 However, K is negatively balanced in wheat, maize and cotton fields except for chive fields due to far greater removal than addition. Negative balance of K means depletion of this nutrient in the soil and thus results in unbalanced soil nutrients. This result conforms with findings that the amount of K fertilizers applied by farmers is below the recommended level. Similar results were found from research findings conducted in the NCP, which indicate that in wheat and maize fields N and P were positively balanced, while K was negatively balanced (Xu, 2000; Huang et al., 2000). However, farmers were unaware of the nutrient status of their soils. They generally considered that use of N alone is sufficient to maintain production. Balanced use of NPK fertilizers is still a subject that needs to be taught to the farmers. It should be recognized that different production systems might lead to different forms of imbalances, causing problems of completely different nature. Agricultural practices with high external inputs result in positive soil nutrient balances leading to pollution of ground- and surface water. Agricultural practices with low external input may result in the depletion of soil nutrient stocks, seriously threatening future agricultural production. Soils may be enriched when external inputs are applied. 7.5 Soil-fertility Analysis Soil fertility, as commonly perceived, is the inherent capacity of a soil to supply plant nutrients in adequate amounts, forms and in suitable proportions required
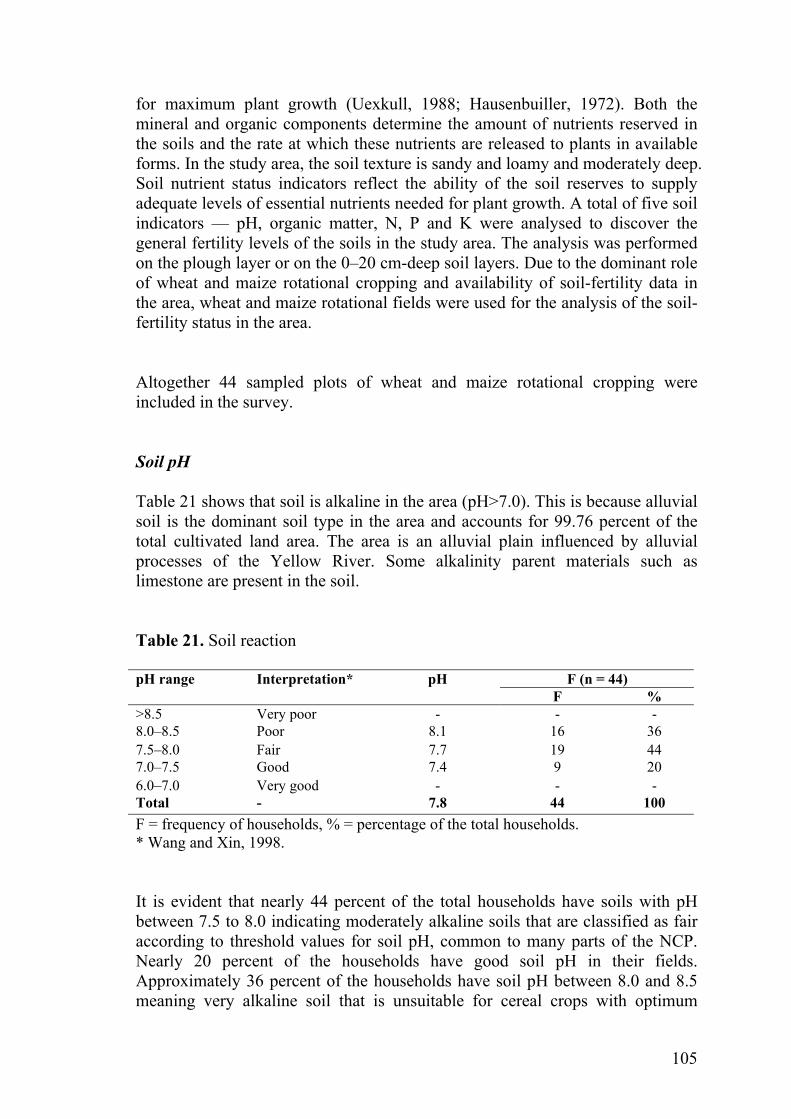
105
for maximum plant growth (Uexkull, 1988; Hausenbuiller, 1972). Both the mineral and organic components determine the amount of nutrients reserved in the soils and the rate at which these nutrients are released to plants in available forms. In the study area, the soil texture is sandy and loamy and moderately deep. Soil nutrient status indicators reflect the ability of the soil reserves to supply adequate levels of essential nutrients needed for plant growth. A total of five soil indicators — pH, organic matter, N, P and K were analysed to discover the general fertility levels of the soils in the study area. The analysis was performed on the plough layer or on the 0–20 cm-deep soil layers. Due to the dominant role of wheat and maize rotational cropping and availability of soil-fertility data in the area, wheat and maize rotational fields were used for the analysis of the soil-fertility status in the area. Altogether 44 sampled plots of wheat and maize rotational cropping were included in the survey. Soil pH Table 21 shows that soil is alkaline in the area (pH>7.0). This is because alluvial soil is the dominant soil type in the area and accounts for 99.76 percent of the total cultivated land area. The area is an alluvial plain influenced by alluvial processes of the Yellow River. Some alkalinity parent materials such as limestone are present in the soil. Table 21. Soil reaction
F (n = 44) pH range
Interpretation* pH F %
>8.5 Very poor - - - 8.0–8.5 Poor 8.1 16 36 7.5–8.0 Fair 7.7 19 44 7.0–7.5 Good 7.4 9 20 6.0–7.0 Very good - - - Total - 7.8 44 100 F = frequency of households, % = percentage of the total households. * Wang and Xin, 1998. It is evident that nearly 44 percent of the total households have soils with pH between 7.5 to 8.0 indicating moderately alkaline soils that are classified as fair according to threshold values for soil pH, common to many parts of the NCP. Nearly 20 percent of the households have good soil pH in their fields. Approximately 36 percent of the households have soil pH between 8.0 and 8.5 meaning very alkaline soil that is unsuitable for cereal crops with optimum

106
yields. No significant variations were observed in soil pH by study villages. It should be noted here that despite alkaline parent materials present in the soils and continuous overuse of N fertilizer like urea, increased use of organic fertilizers can adjust soil acidity and alkalinity. Further improvement of soil pH is required to increase production and soil conservation. Organic matter Organic matter (OM) constitutes only a small fraction (3–5% by weight) of mineral soils but it has a profound influence on fertility management particularly by exerting major impacts on physico–chemical and biological properties of soils. It is thus an important indicator of soil fertility. Organic matter chiefly consists of plant and animal residues that are usually at different stages of decomposition and caused by many kinds of micro-organisms in the soil. Table 22. OM content of soils
F (n = 44) OM range (%)
Interpretation* OM (%) F %
<0.6 Very poor 0.32 1 2 0.6–0.8 Poor 0.74 2 4 0.8–1.0 Fair 0.91 4 9 1.0–1.5 Good 1.18 31 71 >1.5 Very good 1.57 6 14 Total - 1.17 44 100 F = frequency of households, % = percentage of the total households. * Wang and Xin, 1998. Average OM content of the soils was 1.17 percent, ranked as good. Most or about 71 percent of the farm households have OM content of 1.0 to 1.5 percent in their soil, ranked as good (Table 22). About 14 percent has soil OM content of above 1.5 percent, ranked as very good. Nearly 9 percent has soil OM content of 0.8 to 1.0 percent, ranked as fair. Approximately 4 percent and 2 percent have OM content of 0.6 to 0.8 percent and below 0.6 percent in the soil, ranked as poor and very poor, respectively. High content of OM in the soils in general is most probably attributed to the massive return of crop residues to the fields and increased application of FYM. There is still a need to increase organic fertilizer use. Nitrogen The major source of N in the soil is provided by urea that accounts for 78 percent and 91 percent of total N for wheat and maize growth, respectively. The

107
rest of N required by crop growth was provided by OM such as FYM and crop residues. Average N content of the soils in the study area was about 68 mg/kg, ranked as fair. Nearly 60 percent of sample households had N content of 60 to 75 percent in their soil, ranked as fair. About 25 percent of the households had high N levels (75–90 percent) in their fields, ranked as good. The rest had very high (2 percent), low (7 percent) and very low (7 percent) levels of N, ranked as very good, poor and very poor, respectively (Table 23). Table 23. Nitrogen content of soils
F (n = 44) N range (mg/kg)
Interpretation* N content (mg/kg) F %
<45 Very poor 35.85 3 7 45–60 Poor 54.72 3 7 60–75 Fair 67.30 26 59 75–90 Good 81.02 11 25 > 90 Very good 98.05 1 2 Total - 68.43 44 100
F = frequency of households, % = percentage of the total households. * Wang and Xin, 1998. Phosphorus In the study area, the major source of phosphorus is DAP, which provides more than 79 percent and 84 percent of phosphorus for wheat and maize, respectively. Organic matter is another source of soil P and provides the rest of P in the soil. The soil test results for P revealed that the average level of this nutrient in the study area was about 13 mg/kg, ranked as good (Table 24). Most or 64 percent of the households had P content in their soils falling in the good category according to thresholds. About 21 percent of the households had P content of above 15 mg/kg, ranked as very good. The rest had P content of 5 to 10 percent, ranked as poor. Table 24. Phosphorus contents of soils
F (n = 44) P range (mg/kg)
Interpretation P content (mg/kg) F %
<3 Very poor 0 0 0 3–5 Poor 0 0 0 5–10 Fair 8.74 7 15 10–15 Good 12.34 28 64 >15 Very good 16.62 9 21 Total - 12.62 44 100
F = frequency of households, % = percentage of the total households. * Wang and Xin, 1998.

108
Potassium The major source of K was OM such as crop residues and FYM. FYM alone provided 60 percent of total K to wheat fields and wheat residues alone provided 69 percent of total K to maize fields. This was followed by potassium sulphate that provided 39 percent and 31 percent of the total K to wheat and maize, respectively. Table 25. Potassium content of soils
F (n = 44) K range (mg/kg)
Interpretation* K content (mg/kg) F %
<50 Very poor 0 0 0 50–75 Poor 67.67 9 20 75–100 Fair 87.64 22 50 100–150 Good 126.91 13 30 >150 Very good 0 0 0 Total - 95.16 44 100
F = frequency of households, % = percentage of the total households. * Wang and Xin, 1998. Potassium content in the soils was fair in the study area. About half of the total households had fair levels of K (75–100 mg/kg) in their fields. Nearly 30 percent had good K content (100–150 mg/kg) and the rest had about 50 to 75 mg/kg in their fields, ranked as poor (Table 25). The relationship between fertilizer use and soil fertility is shown in Figure 9.
• Overuse of N • Overuse of P
Increased use of crop
residues
Increased/ insufficient use of FYM
• Positive balance of N • Positive balance of P
Increased residue
production
Farmers’ preference of organic
& chemical fertilizer
combination
• Improved soil fertility • Stable soil pH • Improved soil structure
Figure 9. Relationship between fertilizer use and soil fertility

109
7.6 Environmental Implications of Fertilizer Application Groundwater contamination In the NCP, much emphasis is placed on groundwater exploitation for both drinking water as well as irrigation. Previously there was no concern about the quality of water for either uses and related testing. Only during the mid-1990s, when excessive content of NO3- was found in groundwater extracted by tubewells that lift water from a depth of 60 m in some areas, was there concern over water quality, particularly for drinking. It is reported that out of the total 130 large lakes in China, more than 60 are already polluted mainly due to the movement of N and P from different sources (Wen, 1988). In Lansi Lake of Shandong Province, where the study area is located, 35 percent of N and 68 percent of P pollution stems from overfertilization (Gu and Gao, 2000). Results from investigation of 14 counties in the NCP show that nitrate pollution of groundwater and drinking water due to excessive N fertilization has become a serious problem. Over half of the investigated wells have nitrate concentration that is above the allowable maximum concentration for drinking water. Analysis of N fertilizer development in China shows that increased application of N fertilizer is one of the main reasons for nitrate pollution in groundwater (Zhang, 1995). It is reported that in areas where N fertilizer application exceeds 33 kg/mu and the ratio of N input and uptake by crops is below 40 percent, nitrate concentration in groundwater exceeds the threshold value. In developing countries, the quality of shallow groundwater used for domestic purposes by the rural poor is threatened by contamination with nitrate and residues of pesticides used in agriculture. Table 26 shows nitrate contents of groundwater. Out of the 20 sampled wells, 16 wells contained nitrate exceeding the maximum allowable limit for drinking water defined by the World Health Organization (WHO, 1984). Analysis shows that there is significant negative relationship between the ratio of N uptake and input and nitrate content of groundwater (-0.775**, p<0.01). This implies that the higher the N uptake by crops, the lower the nitrate content of groundwater. Significant positive relationship was noticed between N use and nitrate content in groundwater (0.701**, p<0.01). Therefore, excessive application of N fertilizer causes high nitrate content in the groundwater. Excessive use of N fertilizer, both organic and chemical, together with intensive irrigation causes severe nitrate pollution of groundwater in the area. Chen (1995) found that when N application is 10 kg/mu, the amount of irrigation is more than
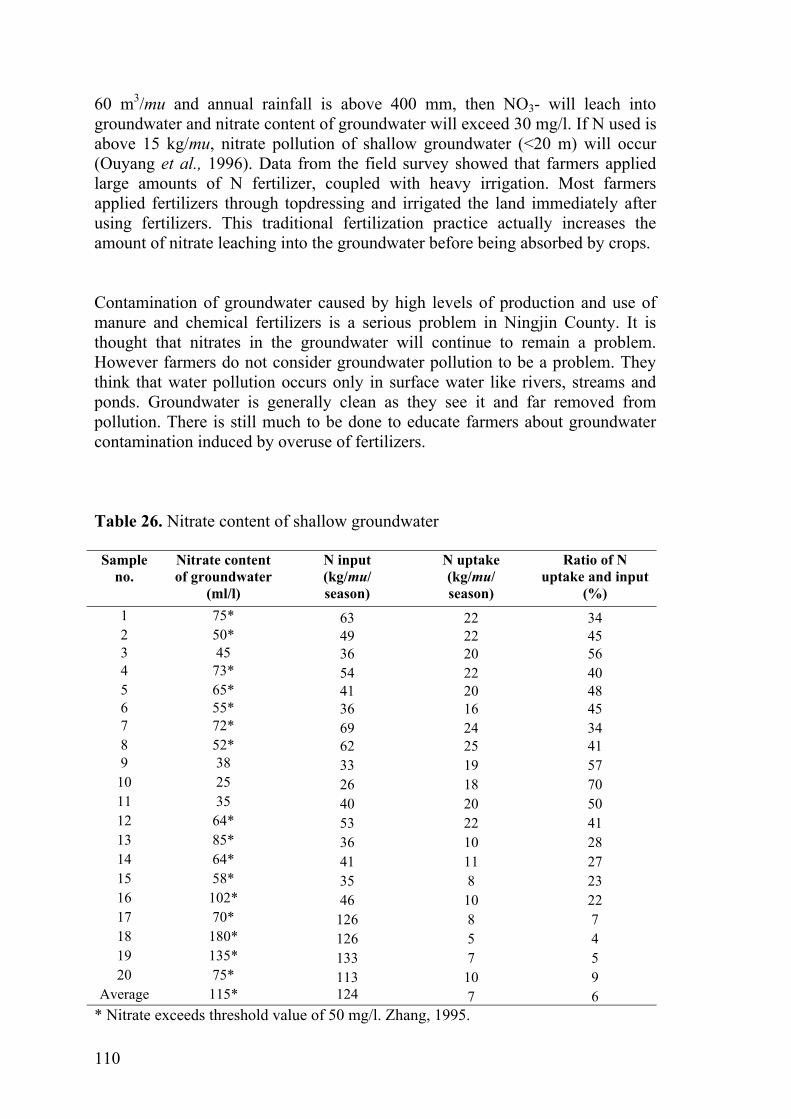
110
60 m3/mu and annual rainfall is above 400 mm, then NO3- will leach into groundwater and nitrate content of groundwater will exceed 30 mg/l. If N used is above 15 kg/mu, nitrate pollution of shallow groundwater (<20 m) will occur (Ouyang et al., 1996). Data from the field survey showed that farmers applied large amounts of N fertilizer, coupled with heavy irrigation. Most farmers applied fertilizers through topdressing and irrigated the land immediately after using fertilizers. This traditional fertilization practice actually increases the amount of nitrate leaching into the groundwater before being absorbed by crops. Contamination of groundwater caused by high levels of production and use of manure and chemical fertilizers is a serious problem in Ningjin County. It is thought that nitrates in the groundwater will continue to remain a problem. However farmers do not consider groundwater pollution to be a problem. They think that water pollution occurs only in surface water like rivers, streams and ponds. Groundwater is generally clean as they see it and far removed from pollution. There is still much to be done to educate farmers about groundwater contamination induced by overuse of fertilizers. Table 26. Nitrate content of shallow groundwater Sample
no. Nitrate content of groundwater
(ml/l)
N input (kg/mu/ season)
N uptake (kg/mu/ season)
Ratio of N uptake and input
(%) 1 75* 63 22 34 2 50* 49 22 45 3 45 36 20 56 4 73* 54 22 40 5 65* 41 20 48 6 55* 36 16 45 7 72* 69 24 34 8 52* 62 25 41 9 38 33 19 57
10 25 26 18 70 11 35 40 20 50 12 64* 53 22 41 13 85* 36 10 28 14 64* 41 11 27 15 58* 35 8 23 16 102* 46 10 22 17 70* 126 8 7 18 180* 126 5 4 19 135* 133 7 5 20 75* 113 10 9
Average 115* 124 7 6 * Nitrate exceeds threshold value of 50 mg/l. Zhang, 1995.
111
Nitrate (NO3
-) pollution of products Nitrate (NO3
-) pollution of products due to excessive use of N fertilizer has become a serious problem in China in recent years (Cao and Jia, 2001), aside from the contamination of groundwater. Significant positive relationship was found between the nitrate content of vegetables and amounts of N fertilizer applied. The nitrate content of vegetables that are treated with excessive amounts of N fertilizer was 80 to 160 times higher than those without N fertilizer treatment (Wang and Ju, 1998). Research conducted in Ningbo City of Zhejiang Province shows that when the amount of N applied reached 50 kg/mu, NO3- content of vegetables reached 4 930 mg/kg — more than seven times higher than the maximum nitrate concentration tolerated for vegetables (Wang and Xin, 1998). Vegetables are the main source of NO3- intake in human beings (Cao and Jia, 2001). High quantity of N fertilizer application will cause potential problems for human health. To protect human health, China has regulated nitrate content in vegetables. It is now specified that the maximum allowable nitrate concentration of vegetables is 700 mg/kg (fresh weight) (Hu et al., 1996). Chives are popular vegetables in the study area. A vegetable, in particular for chives, wholesale and retail market is located here. Chives are sold not only to local people, but also to other cities and provinces. In 1999, one case of poisoning was attributable to eating chives in the area. This warranted a check of the nitrate content of chives. In May 2000, the Epidemic Prevention Station of Dezhou District (EPSDD) carried out a test of nitrate content of chive leaves. The samples were taken from chive fields of the village. It was evident that the level of NO3-concentration in sampled chives was very high, except for only one case where the NO3-concentration was below the threshold value of 700 mg/kg. Also, the average NO3-content of chives was more than twice that of the threshold values. Significant positive relationship was found between the amount of N input and nitrate (NO3-) content of chives (r=0.855**, p<0.01). None of the farmers understood nitrate pollution and the potential hazards to human health. Likewise, farmers had no concept about the relationship between N fertilizer application and the nitrate content of agricultural products. This could be another important cause of intensive use of N fertilizer.

112
8. PEST AND DISEASE MANAGEMENT In the past, farmers controlled pests mainly through cultural, mechanical and physical methods. Examples included weeding and removing of diseased or infected plants, land fallowing or periodic removal of crops to remove the food sources of insect pests, suitable land preparation techniques and use of pest-resistant or tolerant varieties. In the 1940s, the discovery and introduction of synthetic pesticides began a new era in pest control. Insecticides like DDT and herbicides like 2,4-D were extremely effective against a range of pests and were inexpensive to produce. Many farmers in the study area now adopt various new technologies. In particular the widespread and intensive use of agrochemicals, especially pesticides, has emerged as a central issue. The socio-economic changes resulting from this process have caused much concern because of the emerging adverse impacts, particularly the decline in biodiversity, degeneration in natural resources, destruction of the environment, agrochemical pollution and health hazards. Use of pesticides in crops is dependent on the disease and pest infestations and also the type of crops grown. There is widespread acceptance that modern varieties of wheat, maize, cotton and chives are much more prone to insect, pest and disease infestations. Currently aphids, bollworm, red spider, ground worm, zuanxinchun, leafhopper, leaf rust, mildew, whitefly and leaf-eating larvae are the major insects and diseases frequently attacking crops in the area. Aphids (plant lice) and bollworms (Heliothis) are the common insects that affect wheat, maize and cotton. Zuanxinchun is another insect that attacks maize and chives. Groundworm attacks chives frequently. With so many pests and diseases to consider it is important to realize that many of them are likely to occur together on the same crop. Therefore, farmers normally apply different kinds of pesticides that can control most of the important insects and diseases 8.1 Farmers’ Management of Pests and Diseases Frequency and dosage of pesticide application Pest/disease attack is becoming a serious problem in crop production. All of the sampled households have been applying pesticides for wheat, maize, cotton and chives. Major varieties of pesticides used in the cropping systems were omethoate, juzhi and parathion for wheat, maize and cotton, and phorate and lesiben for chives. Farmers usually applied both single pesticides and a combination of different varieties of pesticides. Omethoate is the most commonly used pesticide for wheat, applied by about 51 percent of wheat

113
farmers. Omethoate + juzhi were used by 25 percent of the wheat farmers. Juzhi and parathion are the most commonly used pesticides for maize (28 and 20 percent of maize farmers, respectively). Omethoate + parathion and juzhi + parathion were combinations for about 16 percent of the maize farmers. About 70 percent of the cotton farmers used juzhi and the rest used omethoate + juzhi. As for chive production, about 62 percent of the farmers applied phorate + lesiben, 22 percent used phorate and the rest used lesiben only. Frequency of pesticide use is determined by the frequency of pest/disease occurrence during the cultivation season. More than 60 percent of wheat and maize farmers applied pesticides twice, more than 17 percent used them once and the rest did so more than three times during the cultivation season. A similar pattern was found for cotton. About 46 percent of cotton farmers applied pesticides twice, the rest applied once (32 percent), thrice (21 percent) and four times (1 percent). Pesticides were used more frequently for chives. About 30 percent of chive farmers made six applications, 18 percent seven applications and the rest two to five applications. There is no major difference of frequency of pesticide application between wheat, maize and cotton. However, relatively higher pesticide-use frequency was adopted by chive farmers in Dongcui. Farmers pay much attention to chives, particularly in terms of pest and disease control. Any slight pest/disease attack leads farmers to apply pesticides. The hazardous effects of chive pesticides are relatively lower compared to those used for field crops. Farmers consider these pesticides to have minimal toxicity to human health so excessive doses are used to control pests/diseases. According to the World Health Organization (WHO, 1984), omethoate, parathion and phorate are organophosphate pesticides that are highly hazardous. Juzhi is a cyanide compound that is classified as extremely hazardous by the Ministry of Agriculture of China (MOA, 1999). Lesiben is a pyrithroid that is defined as slightly hazardous by the MOA. These pesticides are permissible in the Chinese pesticide market currently. However, users are required to use appropriate dosages and apply them at appropriate times; they must also wear protective clothing. Pesticide use is generally expressed in terms of grams of pesticides applied per mu of cultivated land per application. Among food-grain crops, maize received the highest amount of pesticides per mu — about 347 g, followed by wheat (about 338 g/mu). In comparison, relatively small amounts of pesticides were used for cotton (214 g/mu). This is because farmers have adopted insect-resistant

114
cotton varieties that require fewer amounts of pesticides. More pesticide was used for chives — 555 g/mu (Table 27). Table 27. The gap between actual and recommended dosage of pesticide (g/mu)
Wheat Maize Cotton Chives Pesticides R. D. A.D. R. D. A.D. R. D. A.D. R. D. A.D.
Omethoate 50–70 137* 50–60 111* 60–80 119* - - Juzhi 25–50 69* 25–50 92* 25–50 95* - - Parathion 50–60 132* 50–60 144* 50–75 - - - Phorate - - - - - - 100–150 312* Lesiben - - - - - - 100–120 243*
Total 120–180 338* 120–170 347* 130–200 214* 200–270 555*
* Overuse of pesticides compared to recommended amount. R.D. = recommended dosage, A.D. = actual dosage applied by farmers. Source: Field survey data and data from the Crop Protection Station of Ningjin County. Relatively high amounts of omethoate were used for wheat (137 g/mu), followed by parathion and juzhi (132 g and 69 g/mu, respectively). High dosage of parathion was used for maize (144 g/mu), followed by omethoate (111 g/mu). Omethoate was applied at 119 g/mu by cotton farmers, followed by juzhi (95 g/mu). Approximately 312 g of phorate and 243 g of lesiben were used per mu of chive fields. Farmers normally use whatever pesticides are available for crops, regardless of the type of pest or disease. This reduces the effectiveness of pesticides used. Nevertheless, due to the general availability of pesticides and the very cheap prices, farmers normally change the brands from time to time and from crop to crop until they feel that pests and diseases are under control. Increased pest/disease resistance of crops and poor quality of pesticides force farmers to apply excessive dosages of pesticides, normally two to three times the recommended amount. Relatively high dosage of pesticides was used for chives (444 g/mu), followed by cotton (183 g/mu), wheat (161 g/mu) and maize (115 g/mu). There are distinct differences among the villages regarding pesticide use. Dagen uses pesticides intensively for wheat and maize compared to other villages. Dongliu uses higher rates of pesticides for cotton than those applied elsewhere. This was because farmers in Dongliu bought poor quality cotton seeds that were subsequently discovered to be non-resistant to pests. Therefore, pest and disease infestation, such as aphids and bollworm, was very serious in this village during the year preceding the survey. Farmers had no choice but to increase the dosage of pesticides. Pesticide use in Daliu is generally lower for all crops. High dosage was always adopted by farmers throughout the cultivation season regardless of the degree of occurrence of pests or diseases. Village-wide analysis

115
showed that except for Daliu, all the other villages overused pesticides for wheat and maize. All the villages overused pesticides for cotton. The average rate of pesticide used for chives was 443 g/mu — almost double the recommended amount. No significant difference was found between pesticide use and different farm size. This indicates that farm size is not a determinant in the rate of pesticide application. Methods of pesticide application All of the farmers in the study area used knapsack sprayers to spray pesticides by hand, as the capital cost is relatively small and spraying can be carried out by the farmer himself or his family. The simplest form of sprayer has a lance fitted with one or two nozzles and a reciprocating pump incorporated in the handle. The pump is operated by moving a slider with one hand while the other hand holds the lance; pesticides are carried in a container on the back of the operator. The most common type of knapsack sprayer tank is made from plastic, with an air reservoir, which is pressurized by a handle at the side operating a pump below or inside the tank. While in use the pressure should be kept fairly constant. A typical knapsack sprayer holds 15 kg of spray, and will need to be filled about twice (30 kg) to spray one mu of fully grown crops. The activity of the pests/diseases will determine where the pesticide should be placed. Farmers sprayed pesticides directly on crops to combat insects. To kill pests attacking the roots of plants such as ground maggots on chives, farmers applied pesticides to the soil rather than to the plants. Farmers normally determine the spraying time according to their own field observations and experience. Once they find pest or disease attack in their fields, they apply pesticides. The distribution of the spray is monitored by the coverage of spray on the crops. When the spray covers most parts of the plants, farmers stop spraying. Farmers’ perceptions on pesticide application More than 95 percent of the households believed that the amount of pesticide application has been increasing over the past ten years. Sixty-four percent of the households considered the present dosage of pesticides applied to be excessive. About 25 percent of the sampled households thought the amount they applied was just appropriate. Only 6 percent indicated that the amount they used was insufficient and the rest had no opinion. Significant difference was found in farmers’ perceptions about dosage of pesticide application.

116
Except for Daliu, more than 65 percent of farmers in other villages said that their use of pesticides was excessive, or two to three times higher than the recommended dosage. Particularly in Dongcui, 88 percent of the farmers believed that the dosage of pesticides they used for field crops, especially for chives was too high. As farmers perceive the critical overuse of pesticides, why do they continue to overuse them? Focus group discussion and interview of key informants revealed that farmers lack comprehensive information about pesticides. Farmers want to avoid risk and gain maximum benefit and pesticides may help to reduce the risk of catastrophic loss generated by pests. They perceive pest control as a continuous battle against competitors. The level of tolerance to crop injury has become very low and farmers’ ignorance about the negative effects of pesticides exacerbates the situation. Therefore, farmers still believe that the higher the dosage of pesticides applied, the better the effects. Studies in the Philippines (Pingali, 1995), Vietnam and elsewhere in Asia have shown that after farmers receive information about the true effect of pesticides, they decrease their use, often dramatically. Another argument for overuse of pesticides as raised by farmers is declining quality of pesticides and increased pest/disease resistance of the crops. There are more than 100 varieties of pesticides available at local markets. Farmers reported that pest/disease infestation could not be controlled if they used the same dosage of pesticides as they did five years earlier. Farmers have to use double dosage of pesticides or more, defying product instructions. Cheap prices, availability of many brands and easy access to input markets all encourage farmers to use excessive doses of pesticides. The last reason is reduced toxic effects on human health. Twenty years earlier, highly toxic pesticides such as DDT and “666” were widely used in the area generating many health problems during or after spraying. New pesticides have fewer toxic effects on human health. Therefore, farmers are no longer afraid of health problems resulting from overuse of pesticides. Farmers’ perceptions on the beneficial and harmful effects of pesticides The major beneficial effect of pesticide use as perceived by farmers is destruction of insects and consequent increase in production (59 percent and 55 percent of total sample farmers respectively). Other positive effects are decreased disease infestation (38 percent) and good plant growth (28 percent).

117
These positive attitudes are because farmers believe that weeds or diseases cannot be tolerated in their fields; at the slightest sign of symptoms the crop is considered “sick” and needs to be nursed back to health. In local language, pesticides are called “medicine” a contradictory connotation for these ingredients that should actually be labelled “poison”. Apart from the beneficial effects of pesticides, farmers also reported harmful effects. Awareness of the negative health effects of pesticide use is profound and damage to health was listed as the most important harmful effect by 38 percent of the farmers. Next was plant damage caused by toxic pesticides (25 percent). In some cases, pesticide residues were observed on maize and cotton leaves. About 20 percent of the farmers linked the use of pesticides to reduced taste in products such as wheat, maize and chives. Only about 5 percent of farmers reported pesticide water pollution, and about 4 percent linked the use of pesticide to deteriorating soil fertility. Beneficial effects were considered to be greater than harmful impacts. Farmers still prefer to use high doses of pesticide to control insects. Apart from chemical methods, households also used biological practices to protect plants. These included use of healthy seeds, weeding properly and punctual planting. About 65 or 24 percent of the households adopted manual removal of insects, and 38 or 14 percent used ash to control pests. The adoption of this cultural practice has declined over time because it employs much labour and time and is not efficacious if pest/disease attack is serious. 8.2 Impacts of Pesticide Use Pingali (1995) noted that indiscriminate use of pesticides can result in one or more of the following:
1) Health impairment due to exposure to hazardous chemicals. 2) Contamination of ground- and surface water through runoff and seepage. 3) Contamination of food and the food chain ultimately reaching human
consumers. 4) Increase in the resistance of pest populations to pesticide thereby
generating outbreaks and poor control. 5) Reduction of beneficial insects and predators.

118
6) Reduction in the populations of micro-organisms in the soil and water that assist in sustaining soil fertility.
With high rates of pesticide use and the negative externalities associated with such levels, there is concern about whether pesticide use has reached levels at which direct contributions to crop productivity are minor, or perhaps even negative In China, field and laboratory studies have shown that increasing resistance in pest populations to high rates of pesticide use has decreased the effectiveness of pesticides (Su and Tan, 1991). Human health hazards Due to toxic pesticides, operators must be taught to handle pesticides with care, avoiding any direct contact with bare skin and the inhalation of fumes or spray. The hands and face should be washed with soap and water after handling, especially before eating and smoking. The use of protective clothing is necessary. Ideally anyone handling insecticides should wear overalls, gumboots, gloves and a mask; overalls and gloves should be washed regularly-and immediately if insecticide is spilt over them. The individual farmer should be made aware of these dangers. All spraying equipment must be thoroughly washed out at the end of each day’s spraying, as spray residues are difficult to remove if they are allowed to dry, and will cause blockages in the spray lines. However, all of the farmers in the study area neglect the use of safety clothing while spraying or handling pesticides, although they are always reminded to do so by pesticide retailers and media such as television programmes. The poor quality of knapsack sprayers also created health problems while in use. It was reported from a wholesale market survey that none of the knapsack sprayers has passed quality inspection (SDTV, 2002). Some farmers complained that pesticides leaked from the sprayers, sometimes when they were spraying. Chronic poisonings have long been reported, although deaths may not often result. Farmers in the study area suffered from the following symptoms:
• Headache. • Dizziness. • Nausea. • Stomach pain. • Skin rashes and dermatitis. • General fatigue soon after spraying.

119
Fatigue occurred more frequently across the study villages accounting for 21 to 36 percent of the total sampled respondents in different villages. Next were headaches and dizziness (14 to 24 percent of total sampled farmers, respectively). Nausea, skin rashes and dermatitis were also prevalent. Stomach pain was reported by 6 to 12 percent of the farmers in the study villages. Moreover, 14 out of the total sampled households needed hospitalization for a number of days due to health problems such as skin rashes and dermatitis caused by improper handling of pesticides. During FGDs, farmers reported often about the negative effects of pesticide use, particularly on their health. However, no one seemed to take it seriously. Instead, farmers considered these problems as normal effects of pesticide use; some of them even considered health problems caused by pesticide to be a good indicator for the identification of the quality of pesticides used. Farmers did not worry about health problems induced by pesticides because most of the problems can be overcome simply by taking a short rest at home. Environmental and social costs During FGDs and interviews with key informants such as senior farmers in the villages, several environmental problems were raised in the context of current pesticide application. Most of the farmers (63 percent) reckoned that pesticides and chemical fertilizers were contaminating water resources. Mentioned indicators were the declining population of frogs and other natural predators in comparison to ten years ago. About 29 percent of the farmers cited diarrhea in animals that had drunk from sources near their fields. Twenty percent of farmers also found pesticide residues in vegetables. Field observation revealed that pesticide residues could easily be seen in some vegetables. The researcher also experienced diarrhea and stomach pain after eating chives in the study area. In Dongcui, pesticide residues were easily detected on chive plants. This was also applicable to cucumber, chili, tomato, watermelon, peaches and apples. Research indicated omethoate residue in vegetables. The average content of omethoate residue in chives was 0.09 mg/kg (EPSDD, 2000). While use of pesticides helps to protect plants from various pests and diseases, their injudicious use leads to environmental pollution and human health hazards. Such use of pesticides imposes external costs on society as well. Frequent and overuse of pesticides to control pests and diseases without considering their effects on the environment and human health has become a cause for concern. As farmers do not need to pay the external cost they induce during the use of

120
pesticides, they use pesticides intensively even without considering the economic threshold.
121
9. ECONOMIC SUSTAINABILITY A sustainable farming practice must be profitable for adoption by farmers. Profitability depends upon the yields or productivity and the type of inputs used and output gained. This chapter therefore analyses the economic sustainability of farming systems in terms of productivity and net return. Indicators used for the assessment are crop productivity as reflected by total production per unit of land area, per capita food-grain production, net return and the benefit–cost ratio of crop production. 9.1 Analysis of Crop Productivity Productivity is the efficiency of input on output. Productivity is measured from two standpoints, technical efficiency of resources, expressed in terms of physical amount and economic efficiency in terms of monetary value. In other words, it is commonly measured as annual yield or net income per mu or man-hour or unit of energy or investment. It has already been mentioned that the major thrust of agricultural development policies for the past four decades has been in achieving self-sufficiency in food production, particularly food-grain production. The target has been mainly to keep food production at par with population growth. In this section, the productivity of major crops like winter wheat, summer maize, cotton and chives has been analysed with special emphasis on food grains. The field survey revealed that the majority or 256 (95 percent) of sampled households adopted wheat and maize rotational cropping systems and thus also allocated larger area of their land for the production of these crops. About 137 or 50 percent of the households cultivated cotton and 19 percent of the households cultivated chives. The average yield of wheat and maize is higher than the national average level, cotton yield is slightly lower than the national average level and chive yield is higher than the provincial average level. As a food-grain bowl, the NCP produces about 25 percent of the total grain products of the country. Productivity of food grains therefore has a strong influence on food security and stability of the country in general and the study area in particular. Productivity of food grains2 was classified into three levels based on existing land resources and population pressure. According to threshold values, productivity of food grains that is above 340 kg/mu is defined as “high”, which implies that if the average yield of food grains is high, then the production under existing arable land is surplus for feeding the current population.
2 The term “food grains” refers to domestic production of basic staples (cereals, pulses, roots and tubers). Although these are the principal subsistence crops, they are also often marketed (Beets, 1990). Winter wheat and summer maize are the staples in the study area of this research. Farmers cultivate these food grains for home consumption and sale as well.

122
Productivity of food grains that is between 300 to 340 kg/mu is ranked as “medium”, which means that to feed the current population, food-grain productivity should reach a medium level. Productivity that is below 300 kg/mu is ranked as “low” meaning that food-grain production cannot meet the food demand of the current population and causes food deficiency for the area. In order to examine the level of food-grain productivity in terms of sufficiency to support the current population, the average productivity of wheat and maize has been taken into account. Farmers were divided into three groups based on average productivity of wheat and maize (Table 28). These groups are called the high yield group, the medium yield group and the low yield group. The high yield group includes households with average yield of wheat and maize above the “high” level (>340 kg/mu). The medium yield group includes households with average yield of wheat and maize within the “medium” level (300–340 kg/mu) and the low yield group includes households with average yield of wheat and maize below the “low” level (<300 kg/mu). About 73 percent of farmers in the area produce surplus food grains with average productivity of 404 kg/mu (Table 28), about 22 percent is “medium” (324 kg/mu) and the remaining 5 percent is below the “medium” level (273 kg/mu). The average yield of wheat and maize in the area is 379 kg/mu, ranked as “high”. Therefore, although 5 percent of the households has low yield of food grains, this does not affect the overall productivity of food grains in the area. Table 28. Average yield of food grains Yield groups* Average yield
(kg/mu) Yield
evaluation** Number of households
Percentage to total households
Low yield 273 Low 15 5 Medium yield 324 Medium 55 22 High yield 404 High 186 73 Average 379 High 256 100
* Low yield: average yield is <300 kg/mu. Medium yield: average yield is 300–340 kg/mu. High yield: average yield is >340 kg/mu. ** Sources: Chen (1992) and field survey data. 9.2 Per Capita Food-grain Production Given high population pressure and limited land resources, food security in the Chinese context is normally analysed by using the indicator of per capita grain production. Per capita grain production increased from 208 kg in 1949 to 387 kg in 1999 in China. The annual increase rate is about 4 kg. The highest value of per capita grain production reached 393 kg in 1993 and declined slightly in 1993 and 1999. In Ningjin County, however, per capita grain production shows a

123
steadily increasing trend over the past 50 years. The annual increase rate was about 14 kg per capita from 1949 to 1999. In 1999, per capita grain production reached 854 kg, more than double the national average. According to the thresholds (Table 29), if per capita grain production is above 400 kg, this implies that food-grain production in the area is surplus. If it is between 350 and 400 kg, food-grain production is just sufficient to meet local demand. If it is below 300 kg per capita per year, then food-grain production cannot provide adequate food for local people. Table 29. Per capita food-grain production
Threshold values (kg/year/capita)
Implications* Number of households
Percentage of total households
<350 Low - - 350–400 Medium 18 7
>400 High 238 93 Total - 256 100
* Sources: Chen (1992) and field survey data. Results from the field survey show that average per capita grain production in the year preceding the survey was about 882 kg, more than double the threshold value at the “high” level. Nearly 93 percent of the households produced surplus grains for home consumption. Seven percent of the households produced adequate food grains for home consumption. None of the households produced insufficient food grains. Therefore, the economic indicator as reflected by per capita food-grain production shows that in the study area, food-grain production can meet local demand. 9.3 Stability of Crop Yield Stability is the consistency of production under a given set of environmental, economic and management conditions. It is the degree to which productivity remains constant despite small-scale socio-economic and environmental pressures or variability. In general, wheat yield increased from 52 kg/mu in 1952 to 404 kg/mu in 2000; the annual increase rate is about 7 kg/mu. Wheat yield has increased rapidly since 1982; the increase trend remained consistent and reached 404 kg/mu in 2000. Apart from the increase of wheat yield, total costs including material cost and labour cost also increased from about 8 yuan/mu in 1952 to 400 yuan/mu in

124
2000. Regarding net return from wheat production, a negative trend occurred from 1957 to 1977 mainly due to low productivity, low price of the products and high input cost during that period. Net return became positive from 1982 and increased rapidly and reached 84 yuan/mu in 2000. This increased trend of net return is based on rapid increase in yield since 1982 and increased market price for wheat. Moreover, land reform and economic reform since 1978 have motivated farmers to produce crops more efficiently and the market economy also made varieties of inputs available to the farmers. Farmers could manage production with lower cost of inputs compared to gross return from production. A similar trend was found for return to labour that increased positively from 1982 and reached 10 yuan in 2000. Maize yield increased from 62 kg/mu in 1952 to 426 kg/mu in 2000 with an annual increase rate of about 8 kg/mu. Rapid increase in yield occurred from 1982. Total cost of production also increased from 6 yuan/mu in 1952 to 322 yuan/mu in 2000. It is very important to note here that the total cost of production increased over the years and net return also changed from negative to positive and reached 110 yuan/mu in 2000. Therefore, like the trend in wheat production, the cost of maize production increased over the years; accordingly, net return also increased. 9.4 Farmers’ Perceptions of the Causes of Yield Increase When asked about the causes for increase in crop yields, most of the sampled households (99 percent) indicated that it is due to the introduction of HYVs in the area followed by increased use of fertilizers (98 percent) (Table 30). Almost 75 percent of the households attributed the contribution of pesticides to yield increase, 62 percent of the households indicated the importance of improved soil fertility. The rest of the households mentioned that increased irrigation area plays an important role in crop yield increase. Table 30. Farmers’ perceptions of the causes of crop yield increase (multiple responses)
Perceptions F % of total HHs Adoption of HYVs 268 99 Increased used of fertilizers 264 98 Increased use of pesticides 203 75 Improved soil fertility 168 62 Increased irrigation area 164 61
F = frequency of households; HHs = households Another important factor contributing to yield increase is the change of land-use policy. During the “people’s commune” period before the 1980s, all the farmers

125
in the village had to work together on public land. The benefits derived from crop production in terms of food grains or money were distributed to farmers according to the frequency of participation in farm work, or accumulated work points in a year. Farmers did not have incentives to work and their working efficiency was very low. This factor in association with inadequate use of inputs caused low yields during that time. Implementation of the household responsibility system in the early 1980s allocated public land to farm households. The introduction of the system changed the motivation mechanism of the rural economy and stimulated the farmers’ working enthusiasm and production efficiency to an unprecedented height. The production efficiency in this sense means that the labour productivity per working hour has improved, because rural people spend fewer hours in the field, unlike previously in the people’s commune, when they worked from 4 am to 9 pm during the harvest period, often just loitering. The output gained from production is now related directly to the benefit of farmers. Therefore, in order to increase production from limited land area, farmers work very hard in their farm fields. They also take care of their land very carefully by, for example, increasing use of FYM and crop residues. 9.5 Profitability of Crop Production To be economically sustainable, farm crops must generate a reliable profit margin every season. Farm households are mainly concerned about net returns. In other words, financial analysis of agricultural activities indicates the level of farm profit by calculating the net farm return and benefit–cost ratio (BCR) of crop production. According to threshold values, if the net return from crop production is greater than zero or the BCR is greater than one, then the production is profitable and sustainable from the financial point of view. Financial analysis procedure A financial analysis begins with a list of the expected costs and benefits, which will occur year by year (Dixon et al., 1989). Being representative of the grain production base in China, farming systems in Ningjin County consist of crops, livestock and off-farm employment. These activities are managed in a mixed and interactive manner. At the farm level, field crops overwhelmingly dominate the farming system and provide a variety of products for subsistence and substitution of some purchased goods. Financial analyses were based on costs and returns that farmers faced. Prices were collected from farmers and from local markets. All the inputs and their costs are calculated on a per mu basis.

126
Information collection All of the sampled households were asked about information on inputs used and outputs produced per unit of land area in the year preceding the survey. Data on various outputs produced and inputs used within one agricultural year from parcels of land were collected. The analysis was carried out using farm-level prices that are actually faced by the farmers. This case study had to rely on farmers’ recall of data. Farmers in the study area do not maintain farm records. For this reason, only one-year data was asked from the farmers. The figures on costs and returns given by the farmers are considered accurate with minimum variation because they could easily recall the data covering the previous year. Valuation of production Production data representing major crops such as food grains, cotton and chives, and crop residues were converted into monetary value by multiplying the actual amount of production of each crop by its respective farm-gate prices. Finally average financial benefit per unit area of land was calculated. The returns are calculated from all the possible outputs produced from a single parcel of land under study within an agricultural year. The output prices used were those of local prices prevailing in the study area. Farm-gate price and the ceiling price of wheat, maize and cotton are set by the government during harvest time. Farmers have to contribute a certain quota of products to the government as land tax, then they are left with a sufficient amount of grains for home consumption in the coming year. For the rest of the harvests, farmers either sell them to the particular outlets located in the communes right after crop harvest or to the middlemen who come and collect the products in the villages. Financial returns from crop production were calculated based on farm-gate prices and actual total production of the crops within a cultivation season of respective crops. The farm-gate price for chives fluctuates with market demand and harvest seasons therefore the average farm-gate price of a year was taken for the calculation of financial returns. Cost estimation Information on costs of field crop cultivation was obtained through a standard questionnaire survey. The major items that were expected to involve expenses were labour, seeds, irrigation, FYM, chemical fertilizers, pesticides, power tillers and land tax. Material cost for hot-bed construction in chive cultivation was calculated based on annual depreciation of the materials. Labour included only family labour because currently no household is hiring labour for their farm work. Farmers conducted farm work by themselves. The cost of family labour

127
was also included in the production cost, as there is opportunity cost of labour used on own farms. If the farmer does not work in his/her own farm, she/he can engage in non-farm activities. The possibility of engaging in non-farm activities was probed by asking farmers. Thus, the cost of family labour was calculated on the basis of opportunity cost and the prevailing local wage rate. The valuation of labour use for the system was done by asking farmers to give figures on labour required for different crops grown in a year in the particular parcels under study from land preparation to postharvest activities. Farmers were able to recall these figures very well due to their many years of experience. Other costs include the purchase of seeds, fertilizers and pesticides that were calculated according to the actual amount farmers paid in the year. The cost of organic fertilizers was calculated on the basis of the prevailing market for both home-produced and purchased organic fertilizers. Irrigation cost includes material cost for well construction, tube cost for conveying water from well to the field, pump cost and diesel cost. Diesel cost was calculated according to actual amount paid, while the rest of the costs for irrigation were calculated based on their annual depreciation. Cost for power tillers was the actual amount paid for land preparation, harvesting and/or threshing of the products. Land tax was paid based on the amount fixed by the village committee as it is slightly different between villages. Financial benefit–cost analysis The analysis is based on the primary information collected through the household survey, input and output recording and FGD with farmers involved in field crop production. The specific financial indicators used to analyse the profitability of the farming system are net returns and benefit–cost ratio (BCR)3. The benefit–cost analysis can estimate costs and benefits over the lifetime of an investment, and can be used to assess the profitability of specific farming practices (Franzel et al., 2001). A total farm analysis was carried out taking into account outputs produced, inputs used and other costs within one agricultural year, as discussed in the preceding sections. The cost of agricultural inputs such as labour, seeds, FYM, chemical fertilizers, pesticides, irrigation, power tillers and land tax constitutes the total costs. Total returns from production activity include returns from products and residues. As shown in Table 31, chives had the highest production cost per unit of land (2 525 yuan/mu), followed by cotton (462 yuan/mu), wheat (369 yuan/mu) and maize (300 yuan/mu). Farmers injected high inputs for chive production, which 3 Net returns = total returns–total costs, benefit–cost ratio (BCR) = total returns/total costs.

128
led to high cost of production. For instance, labour cost for chive production was more than a hundred times that of wheat. Seeds and FYM cost more than seven times that of wheat. Fertilizer, pesticide and irrigation costs of chives were four, 20 and twice that of wheat, respectively. Maize had the lowest production cost among other crops mainly due to the low cost of fertilizers and irrigation. Regarding returns in major crop production, chives had the highest net return (4 750 yuan/mu) in comparison with wheat, maize and cotton because of both its high productivity and high market prices. Next were cotton (365 yuan/mu), maize (143 yuan/mu) and wheat (76 yuan/mu). The BCR for the major crops was calculated. All the crops had a BCR greater than one. Therefore, all major crops grown in the area were financially viable. Among the crops, wheat performance was the poorest due to its lowest BCR (1.21:1). Conversely, chives were more profitable than other crops since its BCR was the highest (2.88:1); next were cotton (1.79:1) and maize (1.48:1). Therefore, from the economic standpoint, cash crops like chives and cotton are more beneficial than food-grain crops like wheat and maize. Table 31. Average costs and returns per unit of land of major crops by study villages Crops Villages Total
return (yuan/mu)
Total cost (yuan/mu)
NR (yuan/mu) BCR
Dongliu 463 390 73 1.19 Daliu 446 367 79 1.22 Dagen 419 366 53 1.14 Dongcui 468 397 71 1.18
Wheat
Total 445 369 76 1.21 Dongliu 476 336 140 1.42 Daliu 448 288 160 1.56 Dagen 394 286 108 1.38 Dongcui 475 290 185 1.64
Maize
Total 443 300 143 1.48 Dongliu 823 491 332 1.68 Daliu 849 453 396 1.87 Dagen 736 425 311 1.73 Dongcui 832 470 362 1.77
Cotton
Total 827 462 365 1.79 Chives Dongcui 7 276 2 526 4 750 2.88
Village-wide analysis found that distinct difference exists between net returns of wheat, maize and cotton by study villages (P<0.05 for wheat, P<0.001 for maize and cotton, respectively by study villages). Daliu has the highest net return and

129
BCR from wheat and cotton in comparison to other villages; Dongcui has the highest net return and BCR from maize. However, Dagen had the lowest net return and BCR from all three major crops — wheat, maize and cotton. It can be said from this analysis that for wheat, maize and cotton, the highest input is not associated with the highest net returns. For instance, the input cost of wheat in Dongliu is the highest, but net return is third from highest. 9.6. Environmental and Social Cost of Farming Practices A financial analysis uses the actual prices at which inputs are purchased and outputs are sold. It examines the potential benefits to the farmer. However, it does not look at a wider set of effects such as off-site environmental and social impacts even though these impacts are often not valued in monetary terms. A financial analysis omits these environmental costs because they do not involve any actual monetary transfers. Financial profitability is one of the primary indicators of agricultural sustainability, the issue being to ensure that agriculture is profitable but not at the expense of the environment, and to recognize that farm profitability might be increased by preventing or repairing environmental degradation (Smith and McDonald, 1998). A more narrowly defined concept of environmentally sustainable economic development is “sustainable economic development involves maximizing the net benefits of economic development, subject to maintaining the services and quality of natural resources over time” (Beets, 1990). Therefore, environmental and social cost must be taken into consideration while conducting economic assessment. Environmental and social cost analysis takes a wider view than simply estimating monetary returns. It looks at a wider set of effects than a financial analysis. Some of them, such as off-site environmental impacts, affect social welfare even if they are often not valued in monetary terms. In this study, net farm income and BCR are considered as economic indicators of farming practices in terms of financial profitability. According to threshold values determined for these two indicators, all the major crops grown in the area are financially viable. However, if we look at environmental aspects, the situation would not be so optimistic. Intensive use of groundwater, fertilizers and pesticides for maintaining high yield levels are generating problems for the environment. Based on the discussions in the previous chapters, the obvious negative effects

130
of the current farming practices on the environment can be summarized from three perspectives:
1. Depletion of the groundwater table due to improper use of groundwater. Groundwater consumption is greater than recharge. The continuation of current groundwater-use practices causes continuous decline of the groundwater table and depletion of the groundwater. This is considered as the most serious environmental expense of the present practices. Correspondingly, irrigation cost in terms of time spent on irrigation and monetary cost like expenditure on diesel and electricity also increase. Besides, a declining groundwater table generates problems for domestic and industrial use of water that imposes social cost as well. For instance, water fees for domestic and industrial use have been increasing over the years because of shortage of groundwater and increased cost in pumping it.
2. Contamination of groundwater and vegetables because of leaching of fertilizers and pesticides into the groundwater. Irrigation water and fertilizers generate pollution in the form of agricultural runoff, which affects groundwater. Nitrate pollution of groundwater and chives is serious in the study area. Overuse of groundwater not only wastes water resources and money, but also increases leaching of accumulated fertilizers and pesticides into groundwater. Moreover, inappropriate use of fertilizers and pesticides also leads to human health problems and wildlife mortality.
3. The third environmental cost is compaction of soils and increased land subsidence, which is associated with improper and overuse of brackish groundwater.
Irrigation, fertilizer and pesticide inputs all increase crop production effectively, but do so with a growing array of environmental and social problems. Part of the reason is also associated with agricultural policies that emphasize higher yields, but ignore environmental and socio-economic concerns. The effect of this trend has been the promotion of uniform production technologies. Some of the attractiveness of modern technologies to the individual farmers stems from the fact that most of the resulting social and environmental costs of technological application are borne by the agriculture sector collectively or by society at large (Liebman, 1983; Altieri, 1992).

131
It must be noted that cash crops gain higher benefit than food grains. But external inputs applied for cash crops are also very high compared to food grains. Particularly, large amounts of fertilizers, pesticides and groundwater are used for cash crop production. The positive soil nutrient balance in chive and cotton fields is significantly higher than that in wheat and maize fields. Based on the significant negative effects of excessive fertilizer application on the nitrate concentration in groundwater, high amounts of fertilizers used for chives and cotton create more problems for resources like groundwater than wheat and maize. Similarly, excess use of pesticides also leaves high pesticide residue in chives and creates problems for the environment and human health. Compared to food grains, large amounts of groundwater are used for chive and cotton production, which not only waste groundwater resources and increase irrigation cost, but also drain accumulated fertilizer back into the groundwater. Therefore, the high financial return from cash crop production in the area comes at high cost to the environment, which must be taken into consideration when assessing the economic sustainability of crop production. In all cases, the analyst must consider the wider effects of the current farming practices, not only the financial benefit, but environmental and social cost as well. In this study area, financial benefit obtained is based on the high environmental and social cost. Therefore, financial sustainability is not juxtaposed with environmental sustainability. From this point of view, one cannot simply say that the existing farming practices are economically sustainable, or cash crop production is more sustainable than food grains. 9.7 Fertilizer Use and Crop Yield Nitrogen is the most widely and heavily used chemical fertilizer in the area. It is important for a farmer to be able to identify the most rational point or zone in the input–output curve that can best satisfy farmer’s production goals. This is analysed in the following section by examining the relationships between N used and yield, holding other variables as constants. Wheat yield and nitrogen application The relationships between N used and wheat yield are divided into two parts. The first occurs from the lowest yield level (212 kg/mu) to the yield level of 411 kg/mu where the yield is rising at an increasing rate of N application implying that the application of N fertilizer contributes positively to the increase of yield. Increase in quantity of N can increase yield. About 76 percent of sampled households fell into this zone; this implies that these households were obtaining increased yield from increased application of N (Figure 10).

132
However, in the second part — yield level of 411 kg/mu to the highest yield (453 kg/mu) — the yield is increasing with the decreasing level of N application meaning that each additional unit of N input in this zone brings decrease in the yield. In other words, increase in fertilizer use does not increase the yield from this point. It is a case of overutilization or wastage of N fertilizer relative to increase in yield. About 24 percent of the sampled households were operating within this zone. Maize yield and nitrogen application For maize, the relationship between yield and N fertilizer application can also be divided into two zones. The first starts from the lowest level of yield that is 253 kg/mu to a yield level of 360 kg/mu where the maize yield is increasing with the increasing rate of N fertilizer application. An increase in the quantity of N can give an increased yield. About 45 percent of the maize farmers fell into this category meaning that these farmers were obtaining increased yield from increased application of N (Figure 10). However, in the second zone — yield of 360 kg/mu to the highest yield (469 kg/mu) — yield is increasing with the decreasing level of N application. This implies that each additional unit of N input in this category brings decreased yield. In other words, the application of N fertilizer in this zone does not contribute positively to the increase of maize yield. About 55 percent of the farmers were in this zone meaning that these farmers were obtaining increased yield although the application of N fertilizer was decreasing. The above findings can be linked to preceding discussions that N was balanced positively in the soils meaning that quantity of N applied is more than what is required by the crops. This raises the question of the efficiency of N fertilizer use. Research conducted in the study area shows that the efficiency of N fertilizer is only about 30 percent for wheat and maize rotational cropping (CAS, 2000), which is the lowest among the three major nutrients applied (fertilizer-use efficiency is 24 percent for P and 19 percent for K). On the basis of the above analysis, N fertilizer starts to contribute negatively to wheat yield from the second to the highest yield, while it is third to the highest yield for maize. Thus, the positive effect of N fertilizer on yield is longer for wheat than for maize. The reason might be that in wheat and maize rotational cropping systems, maize is planted after wheat; the FYM applied to wheat and wheat residues remains in maize fields and could still provide nutrients for maize growth. Therefore, additional nutrient requirements from chemical fertilizers would be lower for maize than for wheat. This calls for rational use of N fertilizer; i.e. the required quantity of nutrients is temporal, using appropriate methods, employing

133
improved cultural practices and reliable irrigation to ensure adequate moisture in the soil and effective control of pests and diseases.
Figure 10. Yield of wheat and maize as affected by N levels Cotton yield and nitrogen application Figure 11 shows the relationship between cotton yield and the amount of N applied. It is observed that for the lower yield levels, increased amount of N fertilizer can increase the yield as the amount of N use increased from 21 kg/mu to 24 kg/mu and cotton yield increased from 139 to 169 kg/mu. Appropriately 32 percent of the farmers were operating under this situation. However, when cotton yield reached high levels or above 169 kg/mu, yield increase no longer depended on increased use of N, as yield increased continuously up to 218 kg/mu but the amount of N used remained the same. Nearly 68 percent of the farmers were operating under this situation, or they were obtaining increased yield without increasing the amount of N fertilizer. It is therefore very clear that N fertilizer contributes to cotton yield increase at the initial stages when yield is at low levels; when the yield reaches high levels, N fertilizer does not contribute significantly to yield increase.
Figure 7 Yield of Wheat and Maize as Affected by the Levels of Nitrogen
1 14 30 36 19 3 8 25 364 24
050
100150200250300350400450500
11 12 13 15 17 18 19 24 25 27 28
Nitrogen (kg/mu )
Yie
ld (k
g/m
u)
% HHMaizeWheat

134
Figure 11. Cotton yield as affected by N levels Chive yield and nitrogen application Similar to cotton, chive yield rose with increased use of N fertilizer at relatively lower yield levels (Table 32). For instance, when N use increased from 62 kg/mu to 65 kg/mu, chive yield also increased from 1 627 kg/mu to 2 560 kg/mu. In particular, a sharp increase in N use, i.e. from 65 kg/mu to 89 kg/mu, occurred when chive yield increased from 2 560 kg/mu to 2 885 kg/mu. This implies that increased use of N is needed to reach high yield levels. However, at high yield levels, yield increase did not respond significantly to the increase in N use, as chive yield increased from 2 885 kg/mu to 3 250 kg/mu but the amount of N used was the same at both yield levels. Appropriately 24 percent of households were operating under this situation. Table 32. Yield of chives and N used
Yield groups (kg/mu)
Average yield (kg/mu) N use (kg/mu)
Percentage of HH
<1 800 1 627 62 22 1 801–2 100 2 005 61 18 2 101–2 400 2 276 62 26 2 401–2 700 2 560 65 10 2 701–3 000 2 885 89 20
>3 001 3 250 90 4
F igu re 8 Y ield of C otton a s A ffec ted b y the L evels o f N itrogen
31 8 1 1
2 9 3 9
0
5 0
1 0 0
1 5 0
2 0 0
2 5 0
2 1 2 2 2 4 2 4 2 4
N itrogen (kg /m u )
Yie
ld (k
g/mu
)
% H HC otton
135
9.8 Determinants of Crop Yield It is essential, from the sustainability point of view, to explore the determinants of crop yield so that appropriate recommendations can be made to ensure productivity while conserving production resources. The following sections address this purpose through multiple correlation followed by regression analysis. The dependent variable (crop yield) and 16 independent variables for multiple regression analysis were defined in Section 5.3. This section discusses the correlation and inter-relationship between yield and independent variables for wheat, maize, cotton and chives. Wheat model Of all the variables for wheat included in the analysis, only educational attainment of respondents and soil pH were negatively related to yield, while the other variables were positively related to the yield. The significant variables positively correlated to wheat yield are total labour used (0.663**), irrigation frequency (0.814**) and quantity of groundwater used (0.792**), nutrients from maize residue (0.343**) and FYM (0.696**), chemical N (0.262**), P (0.219**) and K applied (0.215**), off-farm income (0.145*) and income from livestock rearing (0.564**). This means these variables are important and an increase in them may enhance the productivity of wheat. In particular, irrigation frequency and total groundwater applied are the variables with the highest correlation coefficient. This implies that irrigation has directly affected crop yield. Although farmers have been trying to irrigate land as much as possible, insufficient water supply for irrigation has limited farmers from irrigating land as required. Total nutrients (NPK) from FYM and crop residues related significantly to yield. FYM and crop residues are the only source of organic fertilizer in the area. The role of FYM and residues in improving soil quality and increasing yield has been widely accepted by farmers. Farmers were trying to apply as much organic fertilizer as possible to increase crop production while conserving soil fertility. As a result, high amounts of applied organic fertilizers contributed to yield increase. Total labour used has a significant positive relationship with yield. Tiller power has already been widely used for land preparation, sowing, harvesting and

136
threshing in the area. However, due to small land holdings and fragmentation of farmland, many farm tasks like application of fertilizers and pesticides, irrigation and weeding still depend on labour. It was observed in the field that households using more labour for crop production had better crop growth and production was higher. Amounts of chemical NPK applied also affected wheat yield significantly in general. There is still scope to increase yield through increased use of chemical fertilizers, particularly through increased use of P and K fertilizers because, as discussed in preceding sections, N fertilizer did not produce the highest yield as the yield showed a decreased trend with increase in N fertilizer application. Increase in off-farm income and income from livestock rearing enable farmers to purchase more inputs that are important to increase yield. High income from livestock rearing also implies the high number of livestock reared and high amount of FYM produced that contributes positively to yield. To see whether the independent variables are correlated, auto-correlation analysis was done. Strong auto-correlation was found between frequency of irrigation and total quantity of water applied (0.869**), between total quantity of nutrients (NPK) from FYM applied and income from livestock rearing (0.222**). To avoid auto-correlation, frequency of irrigation and income from livestock rearing were dropped from the analysis. The multiple regression model employed is presented in the following equation: Y = a + b5 X5 + b7 X7 + b8 X8 + b9 X9 + b10 X10 + b11 X11 + b12 X12 + b19 X19 Yw = wheat yield (kg/mu) a = constant b = regression coefficient, magnitude of change in y for a unit change in Xi X5 = total labour used (workdays/mu) X7 = total groundwater irrigation during the cultivation season (m3/mu) X8 = total nutrients from maize residues (kg/mu) X9 = total nutrients from FYM (kg/mu)
137
X10 = N used (kg/mu) X11 = P used (kg/mu) X12 = K used (yuan/mu) X19 = off-farm income (yuan) The step-wise method was employed for the selection of the most important independent variables determining the yield. The regression shows that three independent variables were significant predictors of wheat yield. These were total labour used (X5), total groundwater irrigated (X7) and total nutrients from FYM (X9). The regression model is: Yw = 215.35 + 3.554 X5 + 0.414 X7 + 1.137 X9 The combined effect of all four independent variables shown in the equation shows that the model is highly significant (P<0.001). The computed coefficient of multiple correction (R) value of these four independent variables and the dependent variable was 0.868 and 0.754 (R2). In other words, about 75 percent of the variation in the yield can be accounted for by the combined effect of these four independent variables. The rest (25 percent) of the variation in the yield is determined by other variables. The regression shows that the yield of wheat is significantly increasing with the increase in total labour used, total quantity of groundwater irrigated and FYM applied. The influence of total groundwater irrigation could indicate that water supply is one of the constraints for crop production. Those who applied more groundwater during the cultivation season obtained higher yield. The positive effects of FYM on crop yield are mainly due to its role in improving soil-fertility conditions and continuous provision of long-term nutrients for crops. Under the household responsibility system, the significant change is that each household has to work on the land using its own labour or hired labour. Thus, labour used for crop cultivation affects the final output, particularly for staples like wheat and maize. If more labour is used, the management of field tasks such as timely weeding, use of fertilizers and pesticides and irrigation improves.
138
Maize model Out of the total variables concerned, three of them — age of respondents, total area under maize cultivation and soil pH — had a very weak negative relationship with maize yield. Other variables had a positive relationship. The significant variables positively correlated to maize yield are total labour used (0.631**), irrigation frequency (0.782**) and quantity of groundwater used (0.793**), quantity of nutrients (NPK) from wheat residue left in the field (0.367**), chemical N (0.206**) and K applied (0.193**), cost of pesticides (0.237**), off-farm income (0.502*) and income from livestock rearing (0.194**). This means these variables are important and an increase in them may enhance the productivity of maize. The importance of these variables apropos increasing maize yield is similar to that of wheat. In addition, due to frequent pest/disease infestation in the year preceding the interview, use of pesticides became a significant variable affecting maize yield. Farmers in the area selected varieties of pesticides according to their effects and their cost. It was found that expensive pesticides had better effects and less negative impacts on the environment and human health. It is very important to note here that variables related to soil characteristics such as soil pH (X14), N (X14), P (X14) and K (X14) content and organic matter content (X18) did not appear to be significant variables correlating to the yield of wheat and maize. The reason was that the soil content of these elements has already reached certain levels in the area due to intensive use of fertilizers. As discussed in Chapter 6, soil pH is ranked as fair, organic matter content is good, and NPK are ranked as fair, good and fair, respectively; they are not the main constraints vis à vis yield increase. Secondly, most farmers in the area had similar levels of soil fertility, soil pH and organic matter content in their soils. The soil type was also homogenous among the households. Therefore, soil characteristics as reflected by these elements do not affect yield significantly. There is potential to increase crop yield by supplementing soil organic matter content and NPK content. Strong auto-correlation was found between the frequency of irrigation and total quantity of groundwater applied (0.916**). To avoid auto-correlation, the frequency of irrigation was dropped from the analysis. The multiple regression model employed is presented in the equation below: Ym = a + b5 X5 + b7 X7 + b8 X8 + b10 X10 + b12 X12 + b13 X13 + b19 X19 + b20 X20 Ym = maize yield (kg/mu)

139
a = constant b = regression coefficient, magnitude of change in y for a unit change in Xi X5 = total labour used (workdays/mu) X7 = total groundwater irrigation during the cultivation season (m3/mu) X8 = total nutrients from wheat residues (kg/mu) X10 = N used (kg/mu) X12 = K used (yuan/mu) X13 = cost of pesticides (yuan/mu) X19 = off-farm income (yuan) X20 = income from livestock rearing (yuan) Similar to the yield regression analysis for wheat, a step-wise method was also employed for the selection of the most important independent variables determining maize yield. The regression shows that three independent variables were significant predictors of maize yield. These were total labour used (X5), total groundwater irrigation (X7) and cost of pesticides (X13). The regression model is: Ym = 273.715 + 3.912 X5 + 0.810 X7 + 1.584 X13 The model is highly significant (P<0.001). The coefficient of multiple correlation (R) value of these three independent variables is 0.820 and 0.672 (R2). This implies that these three variables determine about 67 percent of the variation in the yield, and about 33 percent of the variations in yield are determined by other variables. A similar explanation in the context of labour used and groundwater used for wheat yield can be afforded to maize. Pesticides applied to maize reduced the damage to maize from pests and disease infestation; therefore, they contributed positively to yield increase of maize. Cotton model Out of the total variables analysed, total land-holding size had a weak negative relationship with cotton yield (-0.008); total area under cotton cultivation had a

140
significant negative correlation with yield (-0.169*) implying that the smaller cotton area can produce relatively higher yield compared to larger areas. Other variables had positive correlation with the yield. Variables having positive relationship with yield are total labour used (0.657**), irrigation frequency (0.563**), total groundwater applied (0.497**), FYM applied (0.645**), N used (0.307**), P used (0.230**) and cost of pesticides (0.283**). Cotton is a labour-consuming crop during production and harvest. The more labour used, the higher the yield. Irrigation frequency and total amount of groundwater applied affected cotton yield directly due to limited groundwater supply for irrigation. Amount of FYM used related significantly to the yield — increased use of FYM will contribute positively to yield increase. Application of chemical fertilizers, particularly N and P fertilizers related significantly to the yield. Cost of pesticides also has a significant positive relationship with yield indicating that application of pesticides is necessary for yield increase. There are altogether eight variables related significantly to cotton yield. To avoid auto-correlation, frequency of irrigation was dropped from the analysis as it has a strong relationship with total amount of groundwater applied (0.780**). The multiple regression model used is given hereunder: Yc = a + b4 X4 + b5 X5 + b7 X7 + b9 X9 + b10 X10 + b11 X11 + b13 X13 Yc = cotton yield (kg/mu) a = constant b = regression coefficient, magnitude of change in y for a unit change in Xi X4 = total area under cotton (mu) X5 = total labour used (workdays/mu) X7 = total groundwater irrigation during cultivation season (m3/mu) X9 = FYM used (kg/mu) X10 = N used (kg/mu) X11 = P used (kg/mu) X13 = cost of pesticides (yuan/mu)
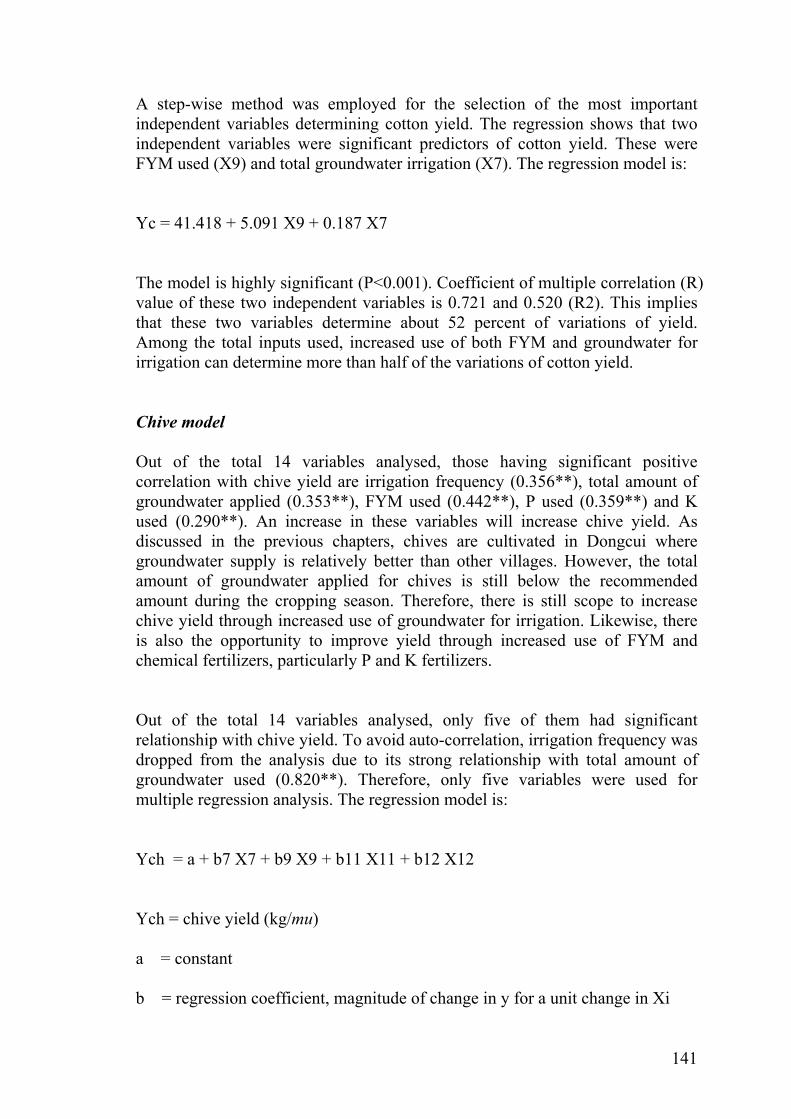
141
A step-wise method was employed for the selection of the most important independent variables determining cotton yield. The regression shows that two independent variables were significant predictors of cotton yield. These were FYM used (X9) and total groundwater irrigation (X7). The regression model is: Yc = 41.418 + 5.091 X9 + 0.187 X7 The model is highly significant (P<0.001). Coefficient of multiple correlation (R) value of these two independent variables is 0.721 and 0.520 (R2). This implies that these two variables determine about 52 percent of variations of yield. Among the total inputs used, increased use of both FYM and groundwater for irrigation can determine more than half of the variations of cotton yield. Chive model Out of the total 14 variables analysed, those having significant positive correlation with chive yield are irrigation frequency (0.356**), total amount of groundwater applied (0.353**), FYM used (0.442**), P used (0.359**) and K used (0.290**). An increase in these variables will increase chive yield. As discussed in the previous chapters, chives are cultivated in Dongcui where groundwater supply is relatively better than other villages. However, the total amount of groundwater applied for chives is still below the recommended amount during the cropping season. Therefore, there is still scope to increase chive yield through increased use of groundwater for irrigation. Likewise, there is also the opportunity to improve yield through increased use of FYM and chemical fertilizers, particularly P and K fertilizers. Out of the total 14 variables analysed, only five of them had significant relationship with chive yield. To avoid auto-correlation, irrigation frequency was dropped from the analysis due to its strong relationship with total amount of groundwater used (0.820**). Therefore, only five variables were used for multiple regression analysis. The regression model is: Ych = a + b7 X7 + b9 X9 + b11 X11 + b12 X12 Ych = chive yield (kg/mu) a = constant b = regression coefficient, magnitude of change in y for a unit change in Xi

142
X7 = total groundwater irrigation during the cultivation season (m3/mu) X9 = FYM used (kg/mu) X11 = P used (kg/mu) X12 = K used (yuan/mu) A step-wise method was employed for the selection of the most important independent variables determining chive yield. The regression shows that three independent variables were significant predictors of chive yield. These were P used (X11), total groundwater irrigation (X7) and FYM used (X9). The regression model is: Ych = 28.867 + 11.352 X11 + 59.289 X7 + 32.454 X9 The model is highly significant (P<0.001). The coefficient of multiple correlation (R) value of these three independent variables is 0.663 and 0.439 (R2). This implies that these three variables determine about 44 percent of the variations of yield. Nearly 56 percent of yield variation of chives is determined by other variables. It is interesting to note here that unlike wheat, maize and cotton, P appears as one of the most important determinants of chive yield, which indicates the importance of balanced use of fertilizers for yield increase of chives. 9.9 Sensitivity Analysis Sensitivity analysis is consistent with interpreting sustainability as the ability to continue. In this context, sustainability is defined as the ability of a system to maintain its productivity when subject to stress (Smith and McDonald, 1998). As sustainability deals with the future, it cannot be readily observed. Sensitivity analysis provides a very useful method for the analysis of the future scenario of the system. This section provides a projection of the future scenario of sustainability based on sensitivity analysis. It deals with the change in inputs associated with the change in outputs of crop production. Procedures in sensitivity analysis The general procedures for sensitivity analysis include the selection of an appropriate time-frame for analysis, identifying failure criteria, making assumptions about the future behaviour of system inputs and hypothesizing

143
constraints (Hansen and Jones, 1996). The application of these procedures in this study is explained hereunder. Selecting a time frame: Sustainability has meaning only in the context of a specific time-frame. The time-frame for analysing the sustainability of a farming system should be longer than several months to a few years typical of crop and animal production cycles. Lynam and Herdt (1989) suggested that five to 20 years is a relevant time-frame for analysis of farming system sustainability. Hansen and Jones (1996) recommended ten to 15 years for analysis. In this study, ten years is considered as the time-frame for analysis, consistent with the analysis of future demand and supply of groundwater resources. Assumptions about input cost and output price: Analysis of farm sustainability requires assumptions about the future behaviour of inputs (Hansen and Jones, 1996). In the study area, use of inputs is usually the major concern in the farming system. To assess the financial viability of crop production, major crops and all households have been used for sensitivity analysis. The details of inputs used and associated costs and outputs produced under the existing farming practices are considered for analysis. Input cost is fluctuated with the market prices and the amount of inputs used. Therefore, assumptions about total input cost are made for the analysis. Moreover, output price changes are based on the change in total production and market price that in turn affects the benefit from crop production. Therefore, assumptions about change in input cost and output price in the coming ten years are made for the analysis. The computations were done for wheat, maize, cotton and chives by study villages. Farm failure criteria: As the farmer’s livelihood is the primary purpose of most farming systems, criteria for farm failure can be expressed in terms of minimum levels of livelihood goals (Hansen and Jones, 1996). Agriculture fails if production falls below the levels necessary for profitability in a cash economy. Profitability is one of the primary indicators of agricultural sustainability. Therefore, the farm failure criterion in this study is assumed as the negative value in net farm income or the value of BCR that is less than one (1). In other words, in comparison with the current situation, farming practices that bring greater net farm income and BCR under respective assumptions will be considered as non-failure and sustainable from the financial point of view. Moreover, environmental and social cost is taken into consideration while assessing economic sustainability. Hypothesizing constraints: For this study, change in inputs associated with change in outputs is included in the sensitivity analysis of crop production. It is reckoned that change in inputs could constrain sustainability because it can affect the environment and farm benefit.
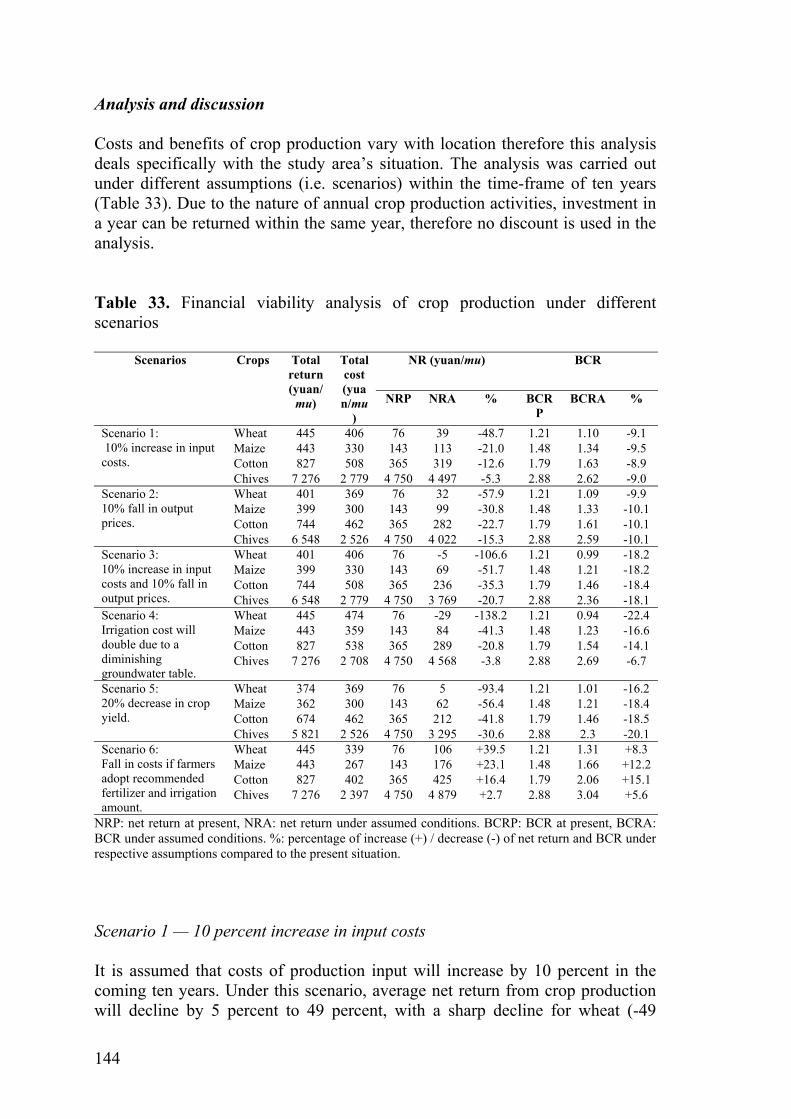
144
Analysis and discussion Costs and benefits of crop production vary with location therefore this analysis deals specifically with the study area’s situation. The analysis was carried out under different assumptions (i.e. scenarios) within the time-frame of ten years (Table 33). Due to the nature of annual crop production activities, investment in a year can be returned within the same year, therefore no discount is used in the analysis. Table 33. Financial viability analysis of crop production under different scenarios
NR (yuan/mu) BCR Scenarios Crops Total return (yuan/
mu)
Total cost (yuan/mu
) NRP NRA % BCR
P BCRA %
Wheat 445 406 76 39 -48.7 1.21 1.10 -9.1 Maize 443 330 143 113 -21.0 1.48 1.34 -9.5 Cotton 827 508 365 319 -12.6 1.79 1.63 -8.9
Scenario 1: 10% increase in input costs.
Chives 7 276 2 779 4 750 4 497 -5.3 2.88 2.62 -9.0 Wheat 401 369 76 32 -57.9 1.21 1.09 -9.9 Maize 399 300 143 99 -30.8 1.48 1.33 -10.1 Cotton 744 462 365 282 -22.7 1.79 1.61 -10.1
Scenario 2: 10% fall in output prices.
Chives 6 548 2 526 4 750 4 022 -15.3 2.88 2.59 -10.1 Wheat 401 406 76 -5 -106.6 1.21 0.99 -18.2 Maize 399 330 143 69 -51.7 1.48 1.21 -18.2 Cotton 744 508 365 236 -35.3 1.79 1.46 -18.4
Scenario 3: 10% increase in input costs and 10% fall in output prices. Chives 6 548 2 779 4 750 3 769 -20.7 2.88 2.36 -18.1
Wheat 445 474 76 -29 -138.2 1.21 0.94 -22.4 Maize 443 359 143 84 -41.3 1.48 1.23 -16.6 Cotton 827 538 365 289 -20.8 1.79 1.54 -14.1
Scenario 4: Irrigation cost will double due to a diminishing groundwater table.
Chives 7 276 2 708 4 750 4 568 -3.8 2.88 2.69 -6.7
Wheat 374 369 76 5 -93.4 1.21 1.01 -16.2 Maize 362 300 143 62 -56.4 1.48 1.21 -18.4 Cotton 674 462 365 212 -41.8 1.79 1.46 -18.5
Scenario 5: 20% decrease in crop yield.
Chives 5 821 2 526 4 750 3 295 -30.6 2.88 2.3 -20.1 Wheat 445 339 76 106 +39.5 1.21 1.31 +8.3 Maize 443 267 143 176 +23.1 1.48 1.66 +12.2 Cotton 827 402 365 425 +16.4 1.79 2.06 +15.1
Scenario 6: Fall in costs if farmers adopt recommended fertilizer and irrigation amount.
Chives 7 276 2 397 4 750 4 879 +2.7 2.88 3.04 +5.6
NRP: net return at present, NRA: net return under assumed conditions. BCRP: BCR at present, BCRA: BCR under assumed conditions. %: percentage of increase (+) / decrease (-) of net return and BCR under respective assumptions compared to the present situation. Scenario 1 — 10 percent increase in input costs It is assumed that costs of production input will increase by 10 percent in the coming ten years. Under this scenario, average net return from crop production will decline by 5 percent to 49 percent, with a sharp decline for wheat (-49

145
percent) followed by maize (-21 percent), cotton (-13 percent) and chives (-5 percent) (Table 33). This implies that food grains are more sensitive to increase in input costs than cash crops because net return from food grains is lower compared to cash crops and the ability to withstand changes in input costs is lower. Likewise, the BCR of different crops decreases nearly 9 percent. Therefore, if production costs increase in the future, net benefit from crop production will decline compared to the present situation, which will threaten the financial profitability of crop production. Scenario 2 — 10 percent fall in output prices It is assumed that output price will decrease by 10 percent in the coming ten years due to market uncertainty. Analysis shows that under this scenario, net return from crop production will decrease by 15 percent to 60 percent. Wheat has the greatest fall in net return (-59 percent), followed by maize (-31 percent), cotton (-23 percent) and chives (-15 percent). The BCR also decreases by about 10 percent for all the major crops. In comparison with the first assumption, the profitability of crop production is more sensitive to fall in output prices than increase in input costs. Scenario 3 — 10 percent increase in input costs and 10 percent fall in output prices This assumes that input costs will increase by 10 percent and output prices will fall by 10 percent in the coming ten years. Analysis indicates that under this scenario, both net return and BCR of the major crops show a decline trend. Especially, net return of wheat production becomes negative (-5 yuan) implying that wheat production will no longer be beneficial under this situation for the villages under study. Apart from wheat, maize has the second highest decrease in net return (-52 percent), followed by cotton (-35 percent) and chives (-21 percent). The BCR falls by nearly 18 percent for all the crops. Scenario 4 — Irrigation cost will double due to a diminishing groundwater table It is assumed that the groundwater table will diminish continuously due to intensive exploitation of groundwater for irrigation; the irrigation cost will double in the next ten years compared to current levels. Under this scenario, total production cost also increases. Table 33 shows that net return of major crops will decrease; in particular, net return for wheat will be negative meaning that wheat production will suffer loss. Likewise, the BCR will also decrease by 7 percent to 22 percent. Wheat has the greatest decline in net return (-138 percent) and BCR (-22 percent), followed by maize (-41 percent net return and -17 percent BCR respectively), cotton (-21 percent net return and -14 percent BCR)

146
and chives (-4 percent net return and -7 percent BCR). Therefore, intensive irrigation using groundwater resources will diminish the groundwater table and correspondingly increase irrigation cost and reduce the net return and BCR of crop production. Scenario 5 — 20 percent decrease in crop yields Intensive use of groundwater resource will definitely reduce groundwater supply for irrigation and lead to a decrease in crop yield in the future. It is assumed that crop yield will decrease by 20 percent as a result of reduced groundwater supply and the influence of other factors such as drought, pest/disease infestation and reduction in FYM and chemical fertilizer use. Under this scenario, the net return of respective crops will decline by 93 percent for wheat, 56 percent for maize, 42 percent for cotton and 31 percent for chives. The BCR also decreases by 16 percent for wheat, 18 percent for maize, 19 percent for cotton and 20 percent for chives. Except for Daliu, where wheat production is beneficial in terms of net return and BCR, the other three villages will cultivate wheat with negative net return indicating that wheat production in these villages will suffer loss. Scenario 6 — Fall in input costs if farmers adopt recommended rates of fertilizers and groundwater application It is assumed that farmers will use recommended amounts of fertilizers and groundwater, instead of continuously overusing them in the future. Also, they will be willing to accept recommended dosages of N fertilizer in the future, and the costs of fertilizer will decrease. Regarding the combination of both cases — rational use of N fertilizer and groundwater — input costs will be reduced and net return will be increased by 3 percent to 40 percent. Wheat will have the greatest increase in net return (40 percent), followed by maize (23 percent), cotton (16 percent) and chives (3 percent); the BCR also increases by 6 to 15 percent. Production of maize, cotton and chives is financially viable under assumptions 1, 2, 3, 4 and 5. However, wheat production will suffer loss under assumptions 3 and 5. For all the major crops under study, production is more sensitive to fall in output price than increase in input costs. However, it should be noted that although all crops under assumptions 1 and 2 and maize, cotton and chives under assumptions 3, 4 and 5 have positive net return and BCR that is greater than one,

147
the values of net return and BCR decrease compared to current values. Therefore, either increase in input costs or decrease in output prices, or decrease in crop yield in the future will threaten the financial viability of crop production. The profitability of crop production will be threatened in the future. However, in assumption 6, when all farmers adopt recommended amounts of fertilizers and groundwater, the costs for irrigation and fertilization will be reduced. In this case, farmers can increase net return and BCR from production. Therefore, there is still scope to increase financial benefit through rational use of groundwater and fertilizers, which is not only financially viable, but also environmentally sound. 9.10 Risks and Uncertainties Risks and uncertainties are very high in the agriculture sector, particularly for crop production. One of the goals of sustainable agriculture is to minimize these risks. In developing countries, small farmers place a higher value on reducing risk than on maximizing production (Altieri, 1992). Farmers employ a range of management strategies, such as working off-farm, maintaining areas for subsistence crops and reducing the risks of crop failure during difficult times. In the study area, crop yield is affected most by factors like drought, pest and disease infestations. Risks cannot be avoided totally, but they can be minimized by the following methods (Rasul, 1999):
• Spreading investment over different agricultural enterprises so that the loss in one enterprise can be compensated by other enterprises.
• Cropping diversification, loss due to damage of one crop can be
minimized by other crops. The last measure, crop diversification, is not widely adopted in the area due to commercialization of wheat and maize rotational cropping systems. However, farmers are wise to reduce risks and uncertainties by involving themselves in different kinds of agricultural enterprises. In the case of crop failure or fluctuation of market prices, farmers could reduce risks at the lowest level by using income from other activities such as crop production, livestock rearing, off-farm activities and others like cultivation of vegetables in small areas. Most farmers obtained income from food grains (95 percent), followed by cotton (51 percent). About 19 percent of the farmers obtained income from chive

148
cultivation — the highest income among the other sources. Moreover, nearly 41 percent of the farmers obtained income from cultivation of different varieties of vegetables such as cucumber, eggplant, tomato and chili, and fruits like apples and grapes. Annual income from this source was only 210 yuan per household. But as farmers mentioned, this small income was sufficient to buy cooking oil, salt, soy sauce and vinegar. Of the total number of farmers, 44 percent earned some income from livestock rearing. Income from livestock was mainly from sale of livestock and products such as meat and milk. The average amount earned from livestock was 1 029 yuan per household in 2000. Farmers normally sell livestock at local markets. Daliu had the highest income (2 167 yuan) from livestock rearing because the number of livestock reared in this village is the highest among the other villages. The high income from selling livestock and off-farm activities is undoubtedly influenced by the fact that Ningjin is located in the NCP; a growing population and well-developed infrastructure such as road, markets and urbanization trend make it possible and easier for the farmers to sell products. About 49 percent of the farmers earn income from off-farm activities. Off-farm activities include the following:
1. A “small business” operated either by respondents themselves or spouses; these businesses comprise operating a grocery, selling crafts, tailoring, selling foodstuffs.
2. Employment in local factories such as carpet and sweater factories, local construction work, and restaurants and hotels. An attempt to obtain the actual amount of income from each of these off-farm items proved to be futile, and was therefore abandoned. Therefore, the total average amount gained from these off-farm activities was counted for the analysis. It was found that the average income from off-farm items was 1 802 yuan in 2000. Dongcui had the highest off-farm income (2 475 yuan) compared to other villages. Availability of a wholesale and retail vegetable market in this village provides employment opportunities for the farmers. They can find small jobs in the market as inspectors, tax collectors and cleaners. Besides, local farmers operate restaurants and groceries around the market area, which are also a major source of off-farm income in the village. Apart from off-farm income gained locally, farmers also earn money from urban areas both inside and outside the county.
It is possible that there will be a greater shift of farmers and family members into rural off-farm employment in order to supplement low farm income. Survey

149
results show that already off-farm employment and earnings are important for many households. However, it is very important to note also that farm income was not the major source of income for the majority of the farmers in the area, but farming activities, especially food-grain production, will still remain the major activities for local people. Although the income from crop cultivation is not high compared with other sources, the harvests from crop production offer security regardless of what happens in the future. On the other hand, farmers minimize risks and maximize benefits by diversifying income sources. Cash crop cultivation and rearing of livestock, apart from food-grain production are sourced from the farm. From non-farm sources, farmers involve themselves in other economic activities such as small businesses locally or in urban areas, or work in factories. All these activities help farmers to secure food and fulfill other subsistence requirements.

150
10. SOCIAL AND INSTITUTIONAL SUSTAINABILITY Farmers in the study area have been doing their best to use their existing agricultural resources efficiently under the given constraints. Improvements in existing farming systems could be made through agricultural support services because local people are not in a position to increase agricultural productivity to a desirable level by themselves. There is an urgent need to improve input use and to disseminate technically sound, economically profitable and environmentally friendly practices, which will ensure greater production volume as well as higher income than current practices. Improved practices must ensure not only higher yield and income but also a better environment. The effectiveness of the most common and ongoing two support services, agricultural extension and marketing, is analysed in this section. 10.1 Household Food Security Food security is the most important social impact of sustainable agricultural development. It is a broad and a crucial issue that has direct linkages with different sectors of the economy, including the agriculture sector. Food security has been defined by the World Food Summit (WFS, 1996) as a situation “when all people, at all times, have physical and economic access to sufficient, safe, and nutritious food, and to meet their dietary needs and food preference for an active and healthy life.” The three dimensions underlying this definition are adequacy of food (effective supply), ample access to food (i.e. the ability of the individual to acquire sufficient food or effective demand), and reliability of both supply and access (equity of food distribution) (UN-PAK, 2000). Food security is an important indicator reflecting social sustainability as it indicates whether the current production can meet increased food demand. Given high population pressure and limited land resources, food security in the context of the NCP is measured by using the indicator of per capita annual grain production, i.e. adequacy of food production. The indicator is compared with the standard level of per capita annual food requirement. Wheat and maize are considered to be the main contributors to food security. Farmers were asked about the adequacy of food grains that they produced to fulfill their requirements. All sampled farmers responded that they produced surplus food grains, and food security is no longer a problem in the area at the present time. In recent years, per capita grain production in the area has more than doubled per capita consumption. Food production can meet local demand and food supply is secured and sustained. The growth trend in food-grain production is based on the following reasons:

151
Firstly, relatively higher yields of food grains produced in the study villages in comparison with the national average yield of food grains. The introduction of Green Revolution technologies in the mid-1960s and early 1970s, especially fertilizers and responsive high-yielding wheat and maize varieties played an important role in enhancing crop production. Consequently, wheat productivity has increased more than tenfold and maize productivity has increased more than threefold. Per capita grain production has increased more than sixfold. Secondly, high concentration on production also derived from agricultural policies that emphasized high yields. To feed the growing population, cultivation has been extended to areas that are ecologically unsuitable for crops, especially in some of the marginal lands where cultivation should be withheld. Therefore, as the food-grain bowl of the country, reservation of arable land for food grain is being increasingly addressed by the government to ensure stable food supply. Thirdly, farmers’ traditional thinking that “food is the life of human beings”. Farmers feel that their lives are safe and stable if they have enough food storage at home. Therefore, farmers in the area are also willing to allocate their land for food grains. They have been using high inputs to maintain or improve production. 10.2 Agricultural Marketing Services Market uncertainty is another factor influencing net returns from crop production and farmers’ motivations apropos crop cultivation (Altieri, 1992). There are two types of marketing services in the area: the agricultural commodity market and the input market. Commodity markets are mainly food-grain markets and cotton markets set and monopolized by the state and vegetable and fruit markets that are established by the local government and market management authorities; these markets are available everywhere in the area. Farmers normally leave sufficient food grains for home consumption in the coming year and sell the rest in the markets. During the harvest season, the local government (normally the commune committee) sets up outlets in the commune centre or several villages to collect food grains from the farmers. The government creates the floor price for food grains and controls the purchase and sale of the products. Farmers have to give a certain quota of their products to the government as land tax. For the remaining food grains, farmers can either sell them to outlets of the government or to businessmen who come to the villages or farm fields to collect the products. Similarly, farmers sell cotton to the outlets set by the government with the farm-gate price predetermined by the government during the harvest season. The purpose of controlling food grains and cotton markets is to keep a large stock of food grains and cotton against natural disaster, market instability and other uncertain factors that may affect production.

152
As for the marketing of chives, it is estimated that farmers were consuming less than 1 percent of the total harvested chives, and the rest of the chives was sold at the wholesale and retail markets located in the villages. Farmers can carry chives from their fields to the market. Farmers can also sell chives at markets located elsewhere. Apart from marketing of major crops, farmers purchase agricultural inputs such as seeds, fertilizers and pesticides and other supplies from input markets located either in the village, commune centres or urban areas. Farmers can select varieties of inputs from input markets according to their preference and willingness. 10.3 Accessibility to Agricultural Extension Farmers need to know the soil-fertility status in their fields and how soil fertility can be improved, how farm resources can be used more efficiently, how pests and diseases can be controlled, and how farm resources can be combined to have the greatest possible synergetic effects. They need to know about the future prospects for resources like water and soil under the current farming practices. They need information about markets to decide when and where to sell their products and from where and when to buy agricultural inputs. Therefore, contact between extension workers and farmers and extension services offered to the farmers are important components in improving farming practices. In Ningjin County, almost all local governmental agents are involved in agricultural extension services. Moreover, some national and provincial and district level extension workers also provide services to the farmers. For instance, China Agricultural University (CAU) visited Daliu in 2000 to promote a new variety of fertilizers. During the meeting with farmers, CAU introduced knowledge and technology about crop nutrient requirements and proper use of specific fertilizers to the farmers. Similar services were also offered to the farmers through different organizations. As reported by the farmers, such extension services may be useful if farmers purchase the commodities being promoted. Unfortunately, these organizations are located far from the farmers; farmers have difficulties in accessing them if needs arise. Agricultural extension should transfer technology to farmers. The constraints faced by these extension institutions are manifold ranging from lack of skilled manpower, budget and infrastructure to staff bureaucracy and ineffective field administration. For instance, the index of agricultural researchers and extension workers to farm labour force has been decreasing since the early 1980s in China

153
in general and in the study area in particular. As of 2000, the total number of extension workers in different local government agents was 31 (15 senior and 16 junior staff), while the whole farm labour force was 150 100. These disparities weaken the agricultural support system. In order to assess services provided to farmers and the efficiency of services, some open-ended questions relating to visits of extension workers and training received by farmers, and the extent of services were asked. Agricultural Extension Workers (AEWs) Agricultural extension workers (AEWs) work in government agencies with the responsibility of disseminating information and technology to farmers, with the Center of Agricultural Technology Extension as the main extension agent. During the household survey, farmers were asked about the visits of the AEWs to farmers and farmers’ visits to AEWs. Table 34 clearly reveals that the contact between farmers and AEWs is very weak in the villages under survey. Only 20 percent of the farmers were visited by the AEWs in the year preceding the survey. The percentage of farmers visiting the AEWs is equally very small (18 percent). Focus group discussion found that the majority think extension services are unnecessary because they already have the knowledge and skills related to crop production. Farmers prefer to get information about crop production from other sources like TV programmes and fellow farmers, instead of AEWs. The better educational background of the farmers also encourages them to access these information sources. Table 34. Visits of agricultural extension workers by villages
Number and percent of households Dongliu Daliu Dagen Dongcui All
villages
Number of visits made in the previous year
F % F % F % F % F % AEWs making visits to the villages Once 7 10 6 9 7 9 15 30 35 13 Twice to thrice 3 4 4 6 3 4 7 14 17 6 Above four times - - - - - - 3 6 3 1 No visits by AEWs to farmers
63 86 60 86 67 87 25 50 215 70
Farmers making visits to AEWs Once 6 8 7 10 8 10 20 40 41 15 Twice to thrice 1 1 1 1 2 3 2 4 6 2 Above four times - - - - - - 1 2 1 0.3 No visits by farmers to AEWs
66 90 62 89 67 87 27 56 222 82
Total households 73 100 70 100 77 100 50 100 270 100 Contact between farmers and AEWs is not uniform across the study villages. In Dongliu, Daliu and Dagen, contact is almost negligible. The number of visits

154
made by the AEWs to these villages is less than 10 percent. Similarly, the visits made by farmers to the AEWs are very low, only between 8 to 10 percent, respectively. In Dongcui, visits by the AEWs are slightly higher (50 percent) than other villages and the number of farmers making visits to the agricultural extension office is also higher (44 percent) in this village because the majority of farmers cultivate vegetables, which require more advice from the AEWs. The high literacy rate, proximity to town centres and easy access to a well-developed transportation system encourage farmers in this village to visit the extension office by themselves whenever the need rises. It should be noted that the AEWs here refer to AEWs at all levels ranging from the commune to the national level. During the interview, farmers were also asked about the extent of extension services provided by the AEWs (Table 35). This included 27 percent of the households for crop pest/disease identification and use of pesticides. The highest percentage of households included was in Dongcui (48 percent), followed by Dagen (19 percent), Daliu (19 percent) and Dongliu (15 percent). The second service provided is related to crop production such as selection of variety of seeds, especially cotton seed, which covered about 21 percent of the households surveyed. Apart from the highest percentage found in Dongcui (50 percent), the second highest percentage was found in Dongliu (21 percent). This is because poor quality cotton seed was sold in this village during the year preceding the survey; farmers here were concerned about cotton production in the cultivation season. The third service is information about market price and input supply (nearly 16 percent of the households). The fourth was use of fertilizers (only 15 percent of the total households). The fifth was livestock rearing (13 percent of the households). The highest percentage was found in Daliu (34 percent) as the livestock population in this village is higher than other villages. The sixth service is hot-bed construction accounting for only 9 percent of the households in Dongcui. Table 35. Extent of services provided by AEWs (multiple responses)
Dongliu Daliu Dagen Dongcui All villages Services
F % F % F % F % F % Crop pest/disease control 10 15 12 19 12 19 31 48 65 27 Use of fertilizers 8 22 9 24 6 16 14 38 37 15 Crop production 11 21 6 12 9 17 26 50 52 21 Livestock rearing 4 13 11 34 7 22 10 31 32 13 Information on market/price 5 13 6 15 8 21 20 51 39 16 Hotbed construction - - - - - - 18 100 18 7 Total 38 16 44 19 42 17 119 49 243 100F = frequency of households, % = percentage of the total households.

155
Farmers’ satisfaction with extension services All study villages were very close to commune extension stations, enabling easy access to these stations. Easy access to county extension services in terms of short distance, well-developed roads and convenient public and private bus services to each village enable farmers to visit any extension office according to their willingness. However, extension agents rarely had contact with the farmers. Although some farmers had a chance to visit an extension agent, they found that the services provided by the extension agent did not meet their expectations. Most farmers were dissatisfied (50 percent) or even strongly dissatisfied (23 percent) with the present extension system and its workers (Table 36). Only about 8 percent of the sampled households were satisfied with the extension services and 19 percent were neutral. The index value of satisfaction with the extension system and its workers was calculated. The result shows that the index of satisfaction is negative in the study area (-0.87) meaning that the services in general are not satisfactory. Among the study villages, the index of satisfaction is slightly higher in Dagen (-1) and Dongcui (-1), but lower in Daliu (-0.94) and Dongliu (-0.81). This also shows that farmers in the study villages are dissatisfied with current extension services. Table 36. Satisfaction of farmers with extension workers’ services
Dongliu Daliu Dagen Dongcui All villages Satisfaction level F % F % F % F % F % Strongly satisfied - - - - - - - - - - Satisfied - - 6 9 2 3 14 28 22 8 Neutral 16 22 12 17 15 19 9 18 52 19 Dissatisfied 39 53 32 46 41 53 22 44 134 50 Strongly dissatisfied 18 25 20 29 19 25 5 10 62 23 Total 73 100 70 100 77 100 50 100 270 100 Further analysis has shown that the main reason for dissatisfaction with the extension services was lack of services, as perceived by 20 percent of the farmers. Other reasons reported were low usefulness of the services (19 percent), no participation of the farmers in extension services (19 percent), insufficient number of AEWs (17 percent), high commercial orientation of the services (15 percent) and low working efficiency of the AEWs (10 percent). This result is also supported by research finding as only about 20 percent of the farmers were visited by the AEWs in the year preceding the survey; the percentage of farmers making visits to AEWs is equally small (18 percent). Some farmers do not know that extension services are available and they can visit the AEWs if they wish. It

156
is interesting to note that some farmers cannot distinguish between the AEWs and input dealers due to the similarities of the services provided and the payment involved in offering services. The main aspects of the AEWs’ poor performance can be linked with management problems. There are many governmental agents involved in extension activities. Their major responsibilities are overlapping. Necessary collaboration among these extension agents is missing. Extension agents generally do not have planned schedules of work in the area. The work programmes themselves are often ill-defined and inadequately supported; in addition, work priorities are changed frequently. The responsibilities of the AEWs are simply too broad and vague. Moreover, under the current economic reform policy, the government offers only partial salary to the AEWs; the other part of the salary has to be earned by the AEWs themselves. The field allowance that was available previously has been cut down. No housing and transportation allowances are provided to the AEWs neither are they equipped with necessary instruments and inputs. Training of extension staff is usually inadequate in terms of its frequency, timeliness and relevance. The meager salary and worse working conditions result in an extension service with a low status, low morale and low motivation. They are unable to reach the farmers. Some of the AEWs have already shifted from extension services to other jobs, which has led to a serious dearth of personnel. The problem is more serious at the commune level. A Station of Agricultural Extension is located in each commune, but none functions. There are no permanent staff and specific offices in the stations. Another factor contributing to dissatisfaction with the extension service is lack of participation of local farmers. Farmers mentioned that in most cases, extension programmes often concentrate on production increases such as recommendations on varieties of seeds, fertilizers and pesticides that should be used, and other such matters that are assigned by high level managers. The AEWs often come to the villages with their own brands of inputs and motivate or even force the farmers to buy them. They do not ask farmers about their needs and what they think they need to learn. They do not discuss the problems faced by the farmers and identify their needs. For instance, in Dagen, some farmers were planning to cultivate vegetables; they wanted to know the feasibility on the basis of soil and water conditions and the market situation. Some farmers also wanted to know the appropriateness of their current input management practices. However, they could not get proper information. The services provided to the farmers sometimes do not match farmers’ needs. Therefore, only farmers who seek advice are in contact with the AEWs. The AEWs spend most of their time in the office, instead of with the farmers. The current extension service lacks two-way flow of information. Communication about farmers’ problems, needs and interests does not flow up. The AEWs try to encourage farmers to adopt practices that do not “fit” the needs of the local farmers. The AEWs are also not

157
efficient in their assigned work. Given financial constraints, most of the extension services, if not all, are becoming expensive. Private entrepreneurs in extension services There is no formal private extension agent in the county. However, private entrepreneurs are involved in agriculture and related businesses and are very active in demonstrating and providing information and technologies to farmers. These private entrepreneurs are normally wholesalers and retailers of new varieties of seeds, chemical fertilizers, pesticides, animal medicines and farming facilities both from local and from other areas. They provide services either at farm sites or in their business outlets. These input dealers normally get related information from producers or companies in the form of booklets, posters and brochures. Therefore, farmers can obtain certain information and technologies about input use when they patronize the shops. For instance, fruit seedling sellers will introduce the techniques of tree cultivation, management, harvesting and storage to the farmers before they start to sell seedlings to them. There are more than 60 input shops owned by private entrepreneurs in the whole county. During the field survey, input dealers repeatedly reported their important role in disseminating relevant information and technologies to farmers in association with business activities. Every farm household has to visit input dealers several times a year. Therefore, dissemination of production information and technologies by private entrepreneurs is very common and useful for farmers. 10.4 Accessibility to Agricultural Training Information on appropriate use of external inputs and resource conservation technologies will have to be communicated to the farmers, and appropriate skills will have to be taught. In this regard, training of the farmers is also essential to communicate technologies and information and improve farming practices. When asked whether they had received any training related to agricultural production in the past three years farmers revealed that about 14 percent of the total households received training; the majority or 86 percent of the households did not receive any training. Village-wide analysis shows that except for Dongcui where about 52 percent of the farmers received training, negligible numbers of farmers in Dongliu, Daliu and Dagen had received any formal training (Table 37). The percentage of farmers receiving training in these villages was only about 3 to 7 percent. This is another indication of persistent lack of support for sustainable agricultural production activities by the extension office.

158
Regarding training received by topic, the highest percentage was related to crop production (11 percent) followed by fertilizer application (7 percent) and pesticide application (6 percent). Among the four villages under survey, Dongcui received the highest percentage of training (20–44 percent) on all topics implying that the farmers are more serious about cultivation of cash crops due to high benefit involved in cash crop cultivation. It should be noted here that among the training programmes offered, topics related to groundwater management are missing. The aforementioned training courses offered to the farmers are related closely to the economic benefit of the trainees, rather than technical purposes per se. Therefore, this is commercial orientation. Farmers have to pay for the training course. But they are trained on how to use a particular kind of input such as fertilizers or pesticides that are produced by contract companies. Farmers are also persuaded to buy these inputs during the training period. Many farmers have lost interest in participating in training courses. Another reason for low participation in training is unequal opportunity among farmers in the study area. No training has been offered in the villages. All training has been offered either in the outlets of extension offices or in commune centres or neighbouring counties. Participants in the training programme normally attend on behalf of their villages. Village committees are in charge of identifying training courses in other areas and selecting participants among the farmers. Therefore, those who are better off economically and have good relations with the village headman will receive priority to attend training courses. Table 37. Type of training received by farmers in the past three years (multiple responses)
Dongliu Daliu Dagen Dongcui All villages Type of training
F % F % F % F % F % Crop production 4 6 3 4 2 3 22 44 31 11 Fertilizer application 2 3 3 4 2 3 13 26 20 7 Pesticide application 2 3 2 3 1 1 10 20 15 6 Farmers not receiving training
69 95 65 93 75 97 24 48 233 86
Total households 73 100 70 100 77 100 50 100 270 100 Training is necessary to disseminate information about improved farming methods and techniques. Farmers recognize a need for rational application of external inputs to solve many of their irrigation, soil-fertility and pest/disease infestation problems. Yet most farmers are short of cash, are not heavily
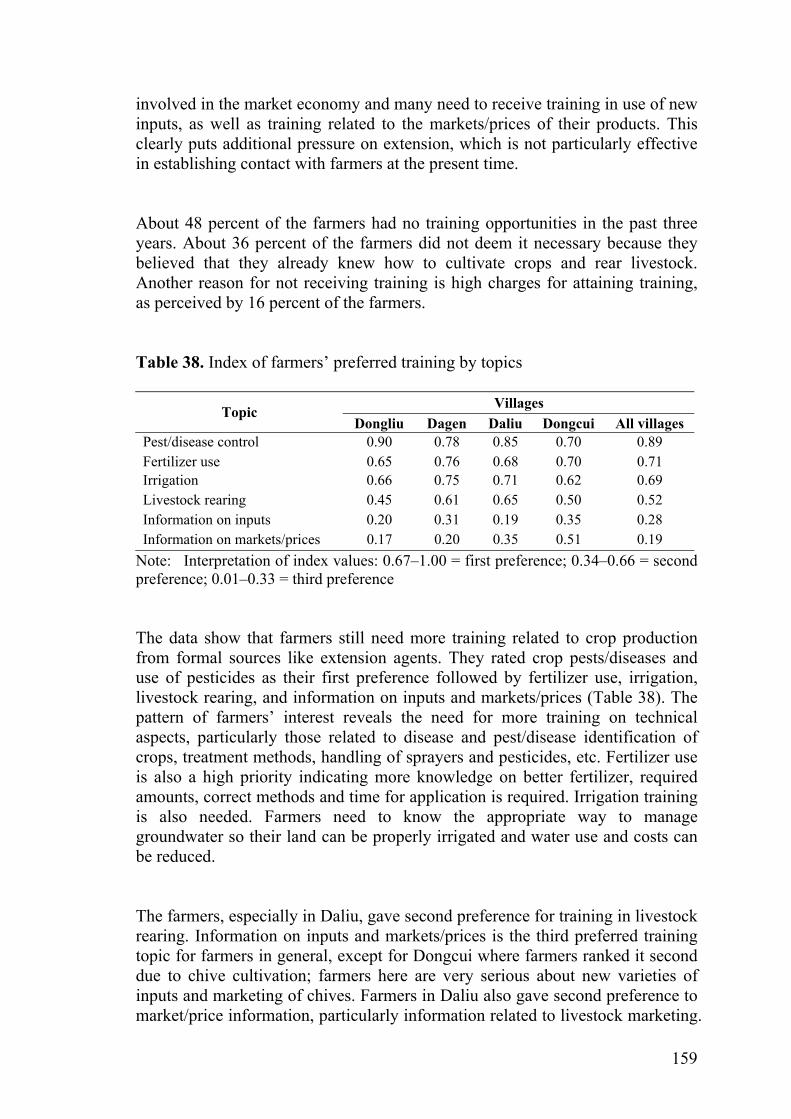
159
involved in the market economy and many need to receive training in use of new inputs, as well as training related to the markets/prices of their products. This clearly puts additional pressure on extension, which is not particularly effective in establishing contact with farmers at the present time. About 48 percent of the farmers had no training opportunities in the past three years. About 36 percent of the farmers did not deem it necessary because they believed that they already knew how to cultivate crops and rear livestock. Another reason for not receiving training is high charges for attaining training, as perceived by 16 percent of the farmers. Table 38. Index of farmers’ preferred training by topics
Villages Topic Dongliu Dagen Daliu Dongcui All villages
Pest/disease control 0.90 0.78 0.85 0.70 0.89 Fertilizer use 0.65 0.76 0.68 0.70 0.71 Irrigation 0.66 0.75 0.71 0.62 0.69 Livestock rearing 0.45 0.61 0.65 0.50 0.52 Information on inputs 0.20 0.31 0.19 0.35 0.28 Information on markets/prices 0.17 0.20 0.35 0.51 0.19
Note: Interpretation of index values: 0.67–1.00 = first preference; 0.34–0.66 = second preference; 0.01–0.33 = third preference The data show that farmers still need more training related to crop production from formal sources like extension agents. They rated crop pests/diseases and use of pesticides as their first preference followed by fertilizer use, irrigation, livestock rearing, and information on inputs and markets/prices (Table 38). The pattern of farmers’ interest reveals the need for more training on technical aspects, particularly those related to disease and pest/disease identification of crops, treatment methods, handling of sprayers and pesticides, etc. Fertilizer use is also a high priority indicating more knowledge on better fertilizer, required amounts, correct methods and time for application is required. Irrigation training is also needed. Farmers need to know the appropriate way to manage groundwater so their land can be properly irrigated and water use and costs can be reduced. The farmers, especially in Daliu, gave second preference for training in livestock rearing. Information on inputs and markets/prices is the third preferred training topic for farmers in general, except for Dongcui where farmers ranked it second due to chive cultivation; farmers here are very serious about new varieties of inputs and marketing of chives. Farmers in Daliu also gave second preference to market/price information, particularly information related to livestock marketing.

160
Farmers face problems and difficulties in selecting appropriate inputs for their production because of the availability of plenty of inputs and variation of prices in input markets. Training on relevant knowledge and technologies will be very useful in helping farmers to decide about input use. Although most farmers did not receive training over the past three years, they still wanted training from formal sources such as extension agents. Farmers consider the information from formal sources to be reliable. Their training needs are a great motivation for the implementation of training programmes. What should be noted is that farmers currently restrict their training needs vis à vis their current farming practices. They are trying to improve this situation but they have few suggestions for training topics. 10.5 Farmers’ Knowledge of Sustainable Farming Practices Farmers’ ranking of indicators During the field survey, the farmers were asked to rank the indicators selected for the assessment of farming practices; the same questions were also asked to 11 agricultural researchers and extension workers in the area. Five scores, 5 (very important), 4 (important), 3 (less important), 2 (not sure), and 1 (not important), were given for the evaluation. A weighted average index was calculated for the comparison of rankings between farmers and researchers/extension workers. Table 39 shows that ranking as reflected by index values between farmers and researchers/extension workers is different. Food security (0.88) and increased farm income (0.84) were ranked as very important indicators by farmers. Table 39. Ranking of indicators by farmers and researchers/extension workers
Farmers Researchers/extension workers Indicators
Index Index Food security 0.88 0.93 Increased farm income 0.84 0.80 Improved technologies 0.65 0.76 Groundwater and soil conservation 0.58 0.96 Improved awareness of farmers 0.54 0.89 Reduced use of chemicals 0.53 0.76 Increased use of manure 0.50 0.75 Improved extension services 0.41 0.76 Crop diversification 0.38 0.72
Note: Interpretation of index values: 1.00–0.80 = very important; 0.79-0.60 = important; 0.59–0.40 = less important; 0.39–0.20 = not sure; 0.19–0.00 = not important

161
Improved technologies (0.65), groundwater and soil conservation (0.58), improved awareness of farmers (0.54), reduced use of chemicals (0.53), increased use of manure (0.50), and improved extension services (0.41) were ranked as important indicators while farmers were not sure about the role of crop diversification (0.38) in sustainable farming practices. Results from researchers and extension workers indicated that groundwater and soil conservation (0.96), food security (0.93), improved awareness of farmers (0.89), increased farm income (0.80) were very important indicators for the assessment of farming practices, while all the rest of the indicators were ranked as important. Thus farmers considered improvement of their economic situation as the most important component for sustainable farming. They put more emphasis on short-term economic benefit. There is still scope to improve farming practices by increasing farmers’ awareness of soil and groundwater conservation and enhancing the dissemination of knowledge and technology is relevant to input use and resource conservation. Farmers’ knowledge about the use of inputs Farmers were asked to provide information about their fundamental knowledge on input use. This knowledge, should consider the water requirements of specific crops and the water supply situation, application of fertilizers based on crop requirements and soil-fertility status, selection of pesticides and their application based on types of pests/diseases. Most knowledge was on pesticide (76 percent) and fertilizer (72 percent) application followed by use of irrigation water (25 percent). This is perhaps because farmers usually acquire knowledge about pesticide and fertilizer application from instructions on product packages, input dealers and extension workers. However, knowledge on irrigation management can only be received through farmers’ visits to relevant agents (only 25 percent of the sampled households). A relatively high percentage of farmers in Dongcui knew about input use in comparison with other villages because more farmers attended training and visited the AEWs compared with other villages. Although most of the farmers have knowledge about inputs, they overuse them. This is because: (1) traditional norms dictate that the higher the inputs used, the higher the outputs gained (96 percent ). (2) Poor quality of inputs (42 percent). (3) Although they apply appropriate amounts of inputs to the fields, overuse by neighbouring farmers has negative effects on their plots (39 percent). Therefore, it is difficult to reduce side-effects induced from excessive use of external inputs if only a few farmers adopt appropriate input-use techniques.

162
Most farmers considered the effects of inputs were the most important criteria for the selection of fertilizer and pesticide, followed by the cost of inputs. Impacts on health and environment were listed as third and fourth criteria for fertilizer and pesticide selection. Farmers need high benefits from production. They cannot tolerate pest/disease infestation on their crops. They always try to apply strong pesticides to control pests/diseases. Usually they change varieties of pesticides from one to another until pests/diseases are under control. They disregard health hazards and environmental contamination caused by improper pesticide use. Sources of farmers’ knowledge of sustainable farming practices Extension workers’ low frequency of farm visits probably does not reflect the inefficiency of extension in toto because this is only one kind of extension method implemented in the area among many. The high literacy rate of the farmers could help farmers to use other sources of extension such as printed materials, radio programmes, and visits to input dealers and market centres. Seventy-one percent of the respondents received information from printed materials such as newspapers, booklets and instructions or guidelines for the users on the product package, or from radio and television programmes. Other informal sources, fellow-farmers, fertilizer/pesticide dealers and personal experience were also the major sources of knowledge of most farmers in the area, as reported by 64 percent, 57 percent and 50 percent of the farmers, respectively. Only about 21 percent received information from contact with AEWs and about 14 percent from training. The knowledge obtained from printed materials and radio/TV is not very practical in the area as information from these media is unsuitable for local situations, as they tend to lack site specificity. For instance, a cucumber disease was reported by a TV programme during the cultivation season; many farmers bought pesticide to control it. However, it was found later on that this disease did not occur in the study area at all. The knowledge transferred by fellow farmers and from farmers’ own experience may not be reliable, especially if the source is not well informed about the latest scientific knowledge due to poor extension services. The knowledge gained through fertilizer/pesticide dealers may also be unreliable, especially if they have not attended any formal agricultural training. Moreover, they have stakes to advise higher doses of fertilizers in relation to their volume of sales and profits. New knowledge and technology about input use and farming practices should be superior to the current practices they intend to replace. The relative advantage is often expressed in terms of economic gains. Farmers are risk-minimum and
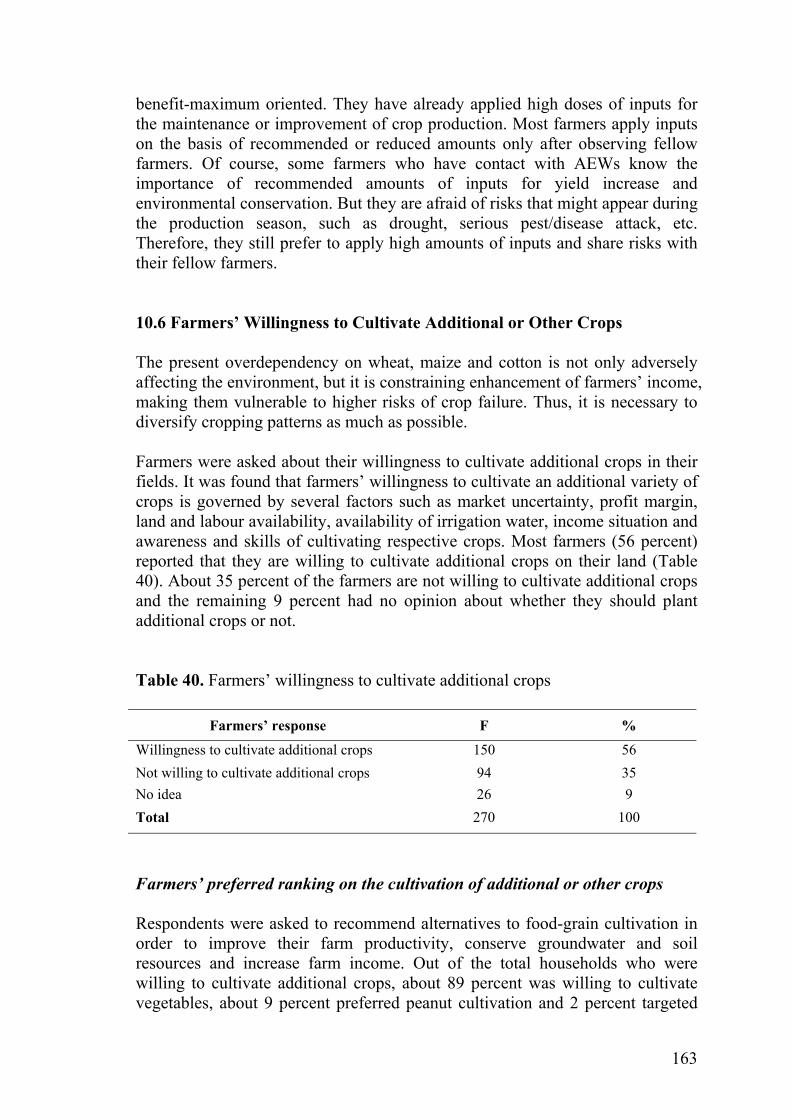
163
benefit-maximum oriented. They have already applied high doses of inputs for the maintenance or improvement of crop production. Most farmers apply inputs on the basis of recommended or reduced amounts only after observing fellow farmers. Of course, some farmers who have contact with AEWs know the importance of recommended amounts of inputs for yield increase and environmental conservation. But they are afraid of risks that might appear during the production season, such as drought, serious pest/disease attack, etc. Therefore, they still prefer to apply high amounts of inputs and share risks with their fellow farmers. 10.6 Farmers’ Willingness to Cultivate Additional or Other Crops The present overdependency on wheat, maize and cotton is not only adversely affecting the environment, but it is constraining enhancement of farmers’ income, making them vulnerable to higher risks of crop failure. Thus, it is necessary to diversify cropping patterns as much as possible. Farmers were asked about their willingness to cultivate additional crops in their fields. It was found that farmers’ willingness to cultivate an additional variety of crops is governed by several factors such as market uncertainty, profit margin, land and labour availability, availability of irrigation water, income situation and awareness and skills of cultivating respective crops. Most farmers (56 percent) reported that they are willing to cultivate additional crops on their land (Table 40). About 35 percent of the farmers are not willing to cultivate additional crops and the remaining 9 percent had no opinion about whether they should plant additional crops or not. Table 40. Farmers’ willingness to cultivate additional crops
Farmers’ response F %
Willingness to cultivate additional crops 150 56 Not willing to cultivate additional crops 94 35 No idea 26 9 Total 270 100
Farmers’ preferred ranking on the cultivation of additional or other crops Respondents were asked to recommend alternatives to food-grain cultivation in order to improve their farm productivity, conserve groundwater and soil resources and increase farm income. Out of the total households who were willing to cultivate additional crops, about 89 percent was willing to cultivate vegetables, about 9 percent preferred peanut cultivation and 2 percent targeted

164
legume cultivation. Eggplant, tomato, cucumber, chili and broad beans were mentioned by the respondents. Vegetable cultivation was preferred because of its high commercial values and thus higher income than other crops (farmers consider economic benefit as the most important indicator for sustainable agricultural development). The small percentage for legume cultivation implies that farmers are not concerned about environmental benefit when making their choices for alternative crops. In fact, most farmers consider land for production only. In comparison with the past, current soil-fertility management has already added sufficient nutrients to the soil; it is therefore not necessary to change to other practices such as legume cultivation. Farmers’ motives behind not cultivating additional or other crops Although farmers preferred additional crop varieties, particularly vegetables, to cultivate, only very few farmers have planted them. It is important to examine the reasons behind not cultivating these crops. Table 41 shows that the first reason listed by the farmers is insufficient land-holding size, as average per capita land holding was only 1.47 mu or about 0.1 ha, as of 2001. Farmers must cultivate food grains on their land according to land-use policy. Therefore, farmers could not cultivate alternative crops, as they desired, on such small portions of land. About 21 percent of the farmers considered market uncertainty as the major reason for not cultivating additional crops, particularly unstable market prices. About 15 percent of the farmers responded that “insufficient and poor quality groundwater” was one of the main reasons behind not planting additional crops. Additional crops, especially vegetables, according to the farmers, require high amounts of irrigation water in comparison with other field crops. But insufficient groundwater supply and poor quality of groundwater limit farmers who want to cultivate these additional crops. Table 41. Farmers’ reasons for not cultivating preferred crops (multiple responses) Reasons F % Small land holding 39 26 Market uncertainty 32 21 Insufficient and poor quality irrigation water 22 15 Insufficient labour force 20 13 High cost 18 12 Lack of skills 10 7 High pest/disease infestation 9 6 Total 150 100

165
The findings also show that around 13 percent of the farmers did not cultivate additional crops due to insufficient labour. Nearly 12 percent reported that they could not cultivate additional crops because of the high cost of cultivation. This is mainly because these additional crops require more inputs and care than currently planted crops like wheat, maize and cotton. The rest (7 percent) reported lack of skills and high pest and disease incidence during cultivation. This is a topic that still needs further research. 10.7 Farmers’ Perceived Problems with Crop Production A set of problems was identified in a group discussion with the farmers during the pre-testing of structured questionnaires. Problems were read out to the respondents who were asked to respond. Subsequently, respondents were asked to rank the problems in a three-point scale — important, less important and no problem. The most pressing problem perceived by farmers was inadequate irrigation (Table 42). In irrigated farming, availability of irrigation water from both surface and ground sources always limits productivity and the number of annual crops grown in a particular area. The problem becomes still more serious when the efficiency of the existing irrigation system is extremely low and no efforts are made to ensure a reliable source of water for the producers. This seems quite relevant in the study area where only groundwater is available for irrigation, and all cultivated land is irrigated by groundwater that is showing a declining trend over the years. Farmers’ perceptions follow analysis results, as the amount of groundwater used is one of the determinants of the yields of all major crops. Table 42. Problems with crop production perceived by farmers
Problem Index Inadequate irrigation 0.90 Pest/disease infestation 0.84 Low price of farm products 0.71 Insufficient organic fertilizer 0.70 Poor quality of irrigation water 0.67 Inadequate visits by extension workers 0.64 Lack of proper training 0.62 Poor quality of fertilizer/pesticide 0.51 Unavailability of quality seeds 0.47 Land fragmentation 0.38 Small land holding 0.35 Instability of input price 0.30 Lack of technical skills 0.24 Inadequate marketing facilities 0.19
Note: Interpretation of index values: 0.67–1.00 = important problem; 0.34–0.66 = less important problem; 0.01–0.33 = no problem.
166
The second most important problem is pest/disease infestation. Although it is not known exactly to what extent production loss has been incurred by pest and disease attack in the study area this problem generally intensified with the increased application of improved seeds, irrigation, fertilizers and other production inputs. The use of high levels of pesticides by farmers in the study area indicates this problem has been a major threat to crop production. Farmers reported that the loss of production induced by pest and disease attack can be reduced by applying high doses of pesticides; however, environmental and health problems from overuse of pesticides bring more challenges for the sustainability of farming practices. Low price of farm products was perceived as the third most important problem by the farmers. It implies that increasing the amount of farm produce that is being sold in local markets generates low price in comparison with the prices of industrial products that farmers expect to buy in exchange. The farm-gate price for wheat, maize and cotton is still set by the government; the low price of these products affects farmers’ motivation to grow crops with more attention and at the same time to consider the conservation of agricultural resources. The fourth problem was insufficient organic fertilizer supply and application. Although the amount of organic fertilizer application has been increasing over the years, farmers still consider that organic fertilizer is insufficient due to short supply in the area. The fifth problem is related to quality of groundwater for irrigation. According to the classification of salt content of groundwater, the suitability of groundwater for irrigation is “fair” to “poor”. As noted during the field survey, white patches, which reflect salt concentration in the soil, marked some fields after irrigation meaning poor quality or highly saline water was used for irrigation. The sixth and seventh problems addressed were related to training and extension services to update their farming skills for the selection and application of external inputs. It was observed that farmers’ access to formal training and scientific knowledge was very low. Efficient use of production inputs cannot be improved without allowing farmers to participate in training and receiving knowledge from extension agents. Other problems were poor quality of seeds, fertilizers and pesticides, land fragmentation and small land holdings. However, instability of input price, lack

167
of technical skills and inadequate marketing facilities were not perceived to be problems as indicated by their low index score.

168
11. FINDINGS, CONCLUSIONS AND RECOMMENDATIONS The main findings of this study address in summary the selected indicators of environmental sustainability, economic sustainability and socio-institutional sustainability. The findings, conclusions and recommendations are based on the field survey and farmers’ perceptions and are supplemented by review of the overall situation in the study area using rigorous qualitative and quantitative analyses. Farming activities in the study area include cultivation of crops and animal husbandry. The specific farming practices associated with crop production include rotational cropping of winter wheat and summer maize, cultivation of cotton, hot-bed chive cultivation, mulching with crop residues, groundwater extraction from shallow wells for irrigation, application of organic fertilizers and chemical fertilizer for soil-fertility management and pest/disease management with pesticides. Juxtaposing these farming practices, 20 indicators were identified in order to assess the sustainability of these practices. They are broadly grouped into environmental, economic and socio-institutional indicators (Table 43). The threshold values for respective indicators were identified based on the research findings of scholars including the Chinese Academy of Sciences (CAS) in order to define the condition of sustainability. Each indicator and respective threshold value is location-specific and significant to the local situation. Farmers’ perceptions were taken into consideration whenever and wherever the assessment was made. It is important to note that these indicators and associated thresholds are not universal; they have both space and time limitations. 11.1 Assessment of Environmental Sustainability Out of 15 environmental indicators selected, ten could not satisfy a minimum standard for sustainability, and five could satisfy this. Indicators that could not meet the sustainability condition were quantity of groundwater applied per irrigation event, amount of organic fertilizer, chemical fertilizer (NPK) and pesticide used, depth to groundwater table, water-use efficiency and maximum concentration of nitrate in groundwater and chives. Indicators that could satisfy the sustainability standard were soil pH, organic matter (OM), NPK content of soils. These particular soil characteristics are above the specified threshold level or safe minimum standards, which were defined as fair in this study.

169
Sustainability of groundwater management practices Groundwater is the only source of irrigation water in the area. An important indicator for groundwater resource management is depth to the groundwater table. The study found that depth of the groundwater table has been diminishing over the years (Table 43). Irrigation consumes most of the groundwater in the study area. Seasonal fluctuation of the groundwater table is associated with irrigation water consumption. All the farmers use the traditional surface irrigation method that consumes a large amount of groundwater. The amount of groundwater applied per irrigation event is significantly higher than the recommended amount for all the crops under study, irrespective of farm size and well yield. Farmers are free to dig wells very close to their plots using local materials and skills, and extract groundwater by using diesel or electrical submersible pumps. Overapplication of groundwater by farmers is encouraged and no charges are made. Groundwater costs cover only the costs of pumping and distribution; there is no “capital” charge for the water itself. Therefore, in order to ensure crop production in a small land holding, farmers apply as much groundwater as possible to irrigate the land. Expectation of high benefit from crop production motivated farmers to apply higher amounts of groundwater for cash crops than food grains. However, water-use efficiency was very low. It is very important to note here that farmers schedule irrigation in association with the use of fertilizers; they irrigate the fields immediately after application of fertilizers. Most farmers, regardless of villages and kind of crops cultivated, agreed with the conservation of groundwater, but they did not realize the scarcity of groundwater resources, indicating that groundwater is renewable and inexhaustible. This belief has led them to use groundwater more intensively for short-term benefits and they have not been guided to reduce wasteful use. Institutional support for proper groundwater management is weak in the area. Several negative environmental impacts occur in the area due to improper management of poor quality (brackish) groundwater resources, coupled with a non-existent drainage system. The impacts in priority order, as perceived and graded by local farmers and supported by research results, are declining groundwater levels, declining groundwater quality, increasing irrigation cost, increasing soil salinity, compaction of soil and increasing land subsidence. Current groundwater management practices are degrading this scarce resource and inducing environmental problems that are not related to sustainable practice. It is estimated that if the current water-use practices continue in the future, groundwater will face a critical challenge and be depleted further.

170
Sustainability of soil-fertility management practices When farmers can use fertilizers both economically and physically, they use organic and chemical fertilizers very intensively in order to maximize benefit from small land holdings. Analysis indicates that the major source of nutrients in the farming system is chemical fertilizer followed by farmyard manure (FYM) and crop residues. Chemical fertilizers are available everywhere in the area. Farmers have cash to purchase these inputs according to their willingness and preference. Topdressing is used for chemical fertilizer application. The main source of FYM is livestock reared by households followed by FYM purchased from suppliers. FYM is applied to the field during land preparation. Crop residues are mainly wheat residues remaining in the field for maize cultivation. Small amounts of maize residues also available for wheat cultivation. FYM and K are insufficiently used, while N and P are overused. In particular, N is significantly overused for all crops under study. Farmers (except for chive farmers) use more FYM and fewer chemical fertilizers. A strong positive correlation was found to exist between chemical fertilizers applied and soil-fertility levels, except for K due to small amounts used. Specifically, the higher the amount of N and P used, the higher the soil content of N and P. Results of the soil nutrient balance test show that N and P are surplus while K is deficient (except for chive fields). This finding indicates that current N and P use is not economical, particularly for farmers who have already high to very high levels of these nutrients in their soils. It should be noted here that there is no significant difference of amount of fertilizer application by farm size. Soil fertility as reflected by indicators of soil content of organic matter (OM) and NPK has been improving over the past 20 years. Soil test results show that soil OM content and P content are “good”. Soil pH, N and K content are “fair”, according to threshold guidelines. Therefore, major soil-fertility indicators can meet the minimum standards for sustainability; current farming practices do not lead to soil nutrient exhaustion and soil degradation in terms of soil pH, OM content and NPK content. This information is important, particularly when soil test values are calibrated to explain the impacts of current fertility management practices on soil-fertility status. The major causes are increased use of both organic fertilizers and chemical fertilizers, as also perceived by the local farmers. Increased use of chemical fertilizers not only adds more nutrients to the soil, but also increases biomass and hence crop residue production. Increased use of FYM and crop residues contributes directly to soil pH maintenance, soil nutrient addition, improvement of soil structure and increase in soil OM content. The study revealed that farmers prefer to use a combination of both organic and chemical fertilizers. However, insufficient FYM supply restricts farmers from

171
using more FYM on their fields. Farmers can access input outlets easily; they are also able to purchase inputs according to their willingness and demand. Easy access to input markets, both physically and economically, encourage farmers to apply more chemical fertilizers, particularly N and P. It should be noted that farmers do not know how to use chemical fertilizers properly in terms of application methods and amount to be applied. They normally apply fertilizers in association with irrigation that often intensifies leaching of fertilizers into the groundwater. Moreover, farmers are not guided about appropriate and balanced use of fertilizers based on existing soil-fertility conditions and the NPK nutrient requirement of specific crops. The study found that excessive use of fertilizers causes groundwater contamination and chive pollution. Groundwater is seriously contaminated by nitrates exceeding the maximum allowable concentration for drinking water. Similarly, nitrate concentration in chives also exceeds the maximum allowable level for human consumption. Significant positive correlation between amount of N use and nitrate concentration indicates that overapplication of N is the main cause of groundwater and chive contamination. The problem is very serious but farmers have not yet realized this critical situation. Sustainability of pest and disease management Pest/disease attack is a serious problem that farmers face in the area. Farmers use high doses of pesticides to reduce damage from pest/disease attack and ensure stable production on their small land area. Farmers have expressed increasing concern over human health and environmental contamination by overuse and improper handling of pesticides. However, they still prefer to use high doses of pesticides because beneficial effects outweigh harmful effects. Analysis shows that the negative impacts of pesticide use are related directly to high doses of pesticides. Chive farmers use higher doses of pesticides and the frequency of human health problems is higher with this practice. As farmers do not need to pay external costs (i.e. environmental and social costs) they incur by using pesticides, they use pesticides intensively. 11.2 Assessment of Economic Sustainability Productivity of food grains shows an increased trend over the past 48 years. Under current farming practices, most households have medium to high yield of food grains. Per capita food-grain production indicates that all the households produce surplus food grains. Farmers also reported an increased trend of yield of cotton and chives over time. Most farmers consider that stable crop production is attributable to increased use of inputs. It is logical for farmers to use more inputs considering their small land holdings and rising populations.

172
All major crops grown in the area are financially viable. Cash crops have higher net farm return and BCR compared to food grains. However, considering environmental and social cost, crop production is not economically viable in a strict sense. The study found that there is still scope for optimizing the yield and benefit of crops with increased use of inputs, with the exception of chemical fertilizers. An increase in N fertilizer application does not always provide an increased yield. The main determinants for wheat yield are total amount of groundwater applied during the cultivation season, amount of FYM used, labour force used and off-farm income; determinants for maize yield are total amount of groundwater irrigated during the cultivation season, labour force used and cost of pesticides. For cash crops, amount of FYM used and total amount of groundwater applied are major determinants of cotton yield, while amount of P used, total amount of groundwater applied and FYM used are determinants of chive yield. In terms of source of income, most food-grain and cotton farmers considered income from off-farm activities as the major source of income due to low income from crop production, while chive farmers rely heavily on farm income. High dependence on off-farm income could reduce the risks and uncertainties of crop production. Sensitivity analysis indicated that increase in input costs or decrease in output price, or both, occur simultaneously; decrease in future yield and financial return from crop production will decline in comparison with the current situation. Crop production is more sensitive to fall in output price than increase in input costs. Net return from wheat production will be negative if input costs increase and output prices decrease simultaneously, or yield decreases in the future. However, if farmers adopt recommended amounts of fertilizers, pesticides and groundwater in the future, input costs can be reduced and net return and BCR can be increased. Under this scenario, financial benefit from crop production can be improved. 11.3 Assessment of Socio-institutional Sustainability The study revealed that the area has already achieved self-sufficiency in food production. Crop production is safeguarded by growing more than one crop or variety over space and time in a field. Regarding extension services, eight state-run agents under the umbrella of the County Commission are involved in extension activities. Some private entrepreneurs such as agricultural input dealers are also involved in extension activities in association with their business. The results show that contact among agricultural extension workers and farmers

173
is very weak. Agricultural training is equally poor in the area. Information and technology that are disseminated by extension workers is confined to application of fertilizers and pesticides, and livestock rearing, while dissemination of relevant information about groundwater use and conservation, crop diversification, health hazards related to current input use, and adverse environmental impacts of existing farming practices is non-existent. Farmers are dissatisfied with extension services in general. Lack of services, low usefulness of the services, no participation of the farmers in extension activities, insufficient extension workers, high commercial orientation of the services and low working efficiency of the AEWs are ranked by the farmers and researcher’s findings as the major deficiencies. Problems facing extension services are manifold. The most serious problems are linked with management problems such as overlapping of extension services offered by different agents, ill-defined and unstable working programmes, the vague responsibilities of extension workers, financial constraints and the poor professional background of the AEWs. The main sources of information were printed materials, radio/television, fellow farmers, input entrepreneurs and personal experience. However, farmers felt that information from these sources was not practical and to some extent not reliable, thus, they are still expecting improved extension services and training from government agents so that their farming practices can be guided in a sustainable manner. Farmers considered improvement of their economic situation as the most important component for sustainable farming. Chive farmers tend to have more contact with extension services and training, followed by cotton farmers and food-grain farmers due to higher benefits obtained from chive and cotton production compared to food grains. Nevertheless, most farmers, especially chive farmers, had fundamental knowledge and technologies related to input use and crop production. However, they do not generally apply such knowledge and technologies. Farmers expect high benefit from high inputs, but they are not aware of the effectiveness of the inputs used and negative impacts generated by overuse of inputs. Alternative crops that farmers are willing to cultivate are vegetables. The main constraints to cultivating these crops are small land holding, market uncertainty, insufficient irrigation water supply and lack of labour, as reported by the farmers. The study discovered that farmers have many production problems. The most important problems as perceived by the farmers are inadequate groundwater for irrigation, pest/disease infestation, low price of farm products, insufficient organic fertilizer supply and poor quality of groundwater.

174
Table 43. Summary of indicators, findings and implications for sustainability
Indicators with recommended threshold values*
Findings and implications
Recommended amount of groundwater per irrigation frequency (m3) 40–50 for wheat and cotton 35–45 for maize 50–60 for chives
Groundwater is overused for all the crops. For instance, the amount used for wheat is 65 m3/mu/event. Overuse of groundwater causes groundwater depletion, soil salinity and compaction, land subsidence, increasing irrigation cost and leaching of fertilizers into groundwater.
Recommended amount of FYM (kg/mu) 4 200–7 200 for wheat 4 200–6 000 for cotton 6 000–8 400 for chives
FYM is insufficiently used for all the crops. Amount used for wheat, cotton and chives was 2 247, 2 855 and 3 257 kg/mu, respectively. Farmers applying high amounts of FYM use fewer amounts of chemical fertilizers.
Recommended amount of N (kg/mu) 14–17 for wheat • 3–16 for cotton 11–14 for maize • 40–50 for chives
Overused for all the crops. For instance, the amount used for wheat and chives is 25 kg/mu and 69 kg/mu, respectively. Leaching of accumulated N into groundwater results in groundwater contamination.
Recommended amount of P (kg/mu) 6–8 for wheat • 4–6 for cotton 6–7 for maize • 25–35 for chives
Overused for chives, wheat and cotton, and insufficiently used for cotton. Soil P is positively balanced.
Recommended amount of K (kg/mu) 7–9 for wheat • 7-9 for cotton 5–7 for maize • 35–45 for chives
Appropriately used for chives, insufficiently used for wheat and maize, not used for cotton. Soil K is negatively balanced in wheat, maize and cotton fields, and positively balanced in chive fields.
Recommended amount of pesticides (g/mu) 120–200 for wheat and maize 130–200 for cotton 200–270 for chives
Significantly overused for all the crops. For instance, dosage used for wheat is 338 g/mu. Human health hazards and water pollution are found.
Depth to groundwater table (m) Non-diminishing trend
Declining by 0.21 m annually. Seasonal change of groundwater table is associated with irrigation. Groundwater abstraction is greater than recharge imposing problems for future use.
Water-use efficiency (kg/m3) Fair to very good
WUE of maize and wheat are both ranked as poor, cotton has very poor WUE. Low WUE is one important cause of groundwater depletion.
Soil pH Fair to very good
Average soil pH is fair. Nearly 43 percent of households have fair soil pH and 21 percent have good soil pH.
Soil OM content (%) Fair to very good
Average OM content is good. Nearly 85 percent of the households have good and very good soil OM content.
Soil N content (mg/kg) Fair to very good
Average N content is fair. Nearly 59 percent of the households have fair N content, and 27 percent have good and very good N content.
Soil P content (mg/kg) Fair to very good
Average P content is good. Nearly 85 percent of the households have good and very good soil P content, the rest have fair P content.
Soil K content (mg/kg) Fair to very good
Average K content is fair. Nearly 50 percent of the households have fair K content and 30 percent have good K content.
Maximum allowable concentration of nitrate in groundwater (mg/l) ≤ 50 mg/l
Nitrate exceeds maximum allowable concentration and groundwater is contaminated. High nitrate concentration was found in the wells located in the plots where N application is high.
Maximum allowable concentration of nitrate in chives (mg/l) ≤ 700 mg/l
Nitrate is double the maximum allowable concentration. The higher the N used in chive fields, the higher the nitrate concentration in chives.
Food-grain productivity (kg/mu/year) Non-declining trend Productivity level is medium to high
Stable increase of food-grain yield was found over the past 48 years. Approximately 73 percent of the households have high yield, 22 percent have medium yield and 5 percent have low yield.

175
Table 43. continued
Indicators with recommended threshold values*
Findings and implications
Per capita food-grain production (kg/ year/capita) Medium to high
Per capita food-grain production is high (93% of the total households) and medium (7%). sufficient to meet food demand.
NR and BCR NR > 0 BCR > 1
NR is positive and BCR is greater than one for all the crops. Cash crops have high NR and BCR compared to food grains. Crop production is financially viable. However, financial benefit from crop production comes at environmental and social costs.
Food sufficiency
All households have adequate food supply. They can access food both physically and economically.
Extension services Adequacy and effectiveness of the
services in ensuring sustainable farming practices
Extension was inadequate and ineffective in disseminating knowledge, information and technology necessary for environmentally friendly and economically viable farming practices.
*Refer to Table 7 and Table 8 for threshold values and implications for sustainability of respective indicators. 11.4 Salient Features of Sustainable and Non-sustainable Farmers Scholars have identified two major types of sustainability problems in agriculture. The first one arises from overuse of such inputs as fertilizer and irrigation water in large-scale commercial agriculture. Some sustainability problems arise from too much input such as fertilizer and insecticide, rather than too much output (Axinn and Axinn, 1997). This is particularly true in the study area. Analysis of groundwater management, soil-fertility management and pesticide management clearly revealed that groundwater, chemical fertilizers and pesticides are the major external inputs used in the farming systems of the study area. They are also the major sources of problems apropos water and soil resources and human health. Previous research shows that excessive input levels degrade natural resources through accumulation while inadequate levels degrade resources through exhaustion (Hansen, 1996). Balanced and integrated use of inputs is considered an appropriate way to assure long-term productivity with sufficient economic returns. Therefore, recommended amounts of input use based on scientific research have been proposed for the farmers in order to reduce side-effects imposed by improper use of inputs. It was found from the study that farmers are not uniform in applying inputs. Therefore, farmers were classified into two groups — sustainable farmers (SFs) and non-sustainable farmers (NSFs) by using indicators of amount of input used. Taking wheat–maize farmers as an example, out of the total farmers surveyed, 16 of them used groundwater, and chemical fertilizers and pesticides based on recommended amounts, which are considered environmentally sound and economically profitable. Therefore, these farmers are classified as SFs. The rest of the farmers who use either fewer or greater amounts of inputs in comparison with recommended amounts are classified as NSFs.

176
Table 44. Salient features of sustainable and non-sustainable farmers
Indicators Sustainable farmers (SFs)
(n=16)
Non-sustainable farmers (NSFs)
(n=240) Age of respondents* 38 44 Land holding size (mu) 5.1 5.3 No. labour force used (workdays/mu) 3 3 Amount of groundwater used (m3/mu)** 89 136 Amount of N used (kg/mu)** 28 36 Amount of pesticide used (g/mu)** 320 390 Amount of FYM used (kg/mu)** 2 582 1 921 Soil pH 7.7 7.8 OM content of soil (%) 1.2 1.2 N content of soil (mg/kg) 65 68 P content of soil (mg/kg) 13 11 K content of soil (mg/kg)* 98 86 Input cost (yuan/mu)** 533 602 Farm income (yuan) 930 938 Off-farm income (yuan)** 1 400 1 761 Average yield of wheat and maize (kg/mu)** 660 722 Percentage of farmers having contact with extension workers (%)**
88 27
* P<0.05, ** P<0.01 (t - Test). Note: Indicators used for classification of sustainable farmers and non-sustainable farmers are the amounts of groundwater used, N used and pesticide used in comparison with the recommended doses (Table 8). Only wheat and maize rotational cropping farmers have been included in the analysis. It is clear from Table 44 that out of the total 17 indicators examined, ten of them distinguish SFs from NSFs based on the significant difference of these indicators between SFs and NSFs. A close look at the characteristics of SFs show that they are younger than NSFs and active in acquiring new knowledge and technology and in accepting innovations on their farms. SFs generally have knowledge and technology about rational use of inputs and environmental problems stemming from improper input use. Amount of groundwater, N fertilizer and pesticide used by SFs is within the range of the recommended amount. Soil K content is relatively higher in the fields of SFs (98 mg/kg) than that of NSFs (86 mg/kg) implying more balanced use of NPK fertilizers by SFs. SFs use high amounts of FYM. The gap in FYM use between sustainable and non-sustainable farmers is 661 kg/mu. Ten out of sixteen SFs come from Daliu as livestock rearing is very popular in the village and the amount of FYM applied in the field is also high in comparison with other villages. The other six SFs come from Dagen; they also rear livestock and use relatively high amounts of FYM in the field. The input cost of SFs (533 yuan/mu) is lower than NSFs (602 yuan/mu). SFs use recommended amount of inputs that are generally lower than amounts used by NSFs; leading to low production costs. The average yield of food grains (wheat

177
and maize) of SFs is relatively lower (660 kg/mu) than NSFs (722 kg/mu). It is important to note this result because sustained level of production is the key issue in sustainable farming practices rather than attaining high levels of production. SFs rely mainly on crop production; their income from off-farm activities is smaller than NSFs, and the average difference of off-farm income is 400 yuan/year. Contact with extension services was important for SFs. The results show that 88 percent of the SFs have used extension services either through visits to extension offices or extension workers’ visits to them, while this figure is only 27 percent for NSFs. It is very important to note that SFs normally accept and practice the knowledge and technology on input use gained from extension workers. While NSFs who contacted extension workers generally are not serious about applying relevant knowledge and technology in their farming activities, or sometimes the services provided by extension workers do not match their needs. All these factors combined resulted in better production performance of SFs as well as resource conservation. Farmers in the study area consider financial benefit to be the main purpose of crop production. SFs adopted recommended amounts of inputs because they realized that additional costs derived from overused inputs cannot be compromised by increased outputs (if any) induced from overused inputs. 11.5 Modelling Sustainable Farming Practices There is no universal recipe for sustainable farming practices. To assess the sustainability of farming practices, one must identify the key aspects of agricultural sustainability and the associated indicators that should be measured (Rigby and Caceres, 2001). When specific indicators are selected, it is possible to say whether certain trends are steady, going up or going down (Pretty, 1996). Following the summary of findings, a more comprehensive model of farming practices in the light of the three dimensions of sustainability can therefore be formulated; this entails the consideration of all major components of sustainability in farming practices in the study area (Figure 12). This figure shows that crop production in the area is financially profitable. However, financial benefit is gained from intensive use of inputs that not only degrade water and soil resources, creating problems for human health, but also increase production, environmental and social costs. Naturally, farm income is limited and farmers do not have motivation in their farm work. Besides, inadequate and ineffective extension services fail to provide incentives and knowledge and

178
technologies to the farmers. Farmers’ lack of information about input use and environmental conservation incurs wasteful use of resources for short-term benefit. This vicious cycle is threatening the overall sustainability of the system. The model shows that farming practices in the NCP are becoming unsustainable due to overuse of inputs (fertilizers and pesticides) and increasing dependence on groundwater use for irrigation. Farmers recognize the impacts of unsustainable farming, but they are highly motivated to maximize production for monetary benefits; this is juxtaposed by population pressure and securing food supply according to government policy. Farmers need continuous training and education to improve their awareness and adoption of resource conservation technologies; this cannot be achieved without adequate government support and strengthened extension services. By ignoring these factors, the present methods of groundwater use and soil and pest/disease management have exposed farmers to high risk of resource degradation; this also generates economic loss. Planners, decision-makers and other stakeholders should also examine all these aspects while drawing up development plans and interventions.

Incr
ease
d pr
oduc
tion
cost
Lim
ited
net
farm
inco
me
Farm
ers’
poo
r aw
aren
ess
of s
carc
ity o
f gr
ound
wat
er a
nd n
egat
ive
impa
cts
of in
put
Food
sel
f-suf
ficie
ncy
Inad
equa
te e
xten
sion
serv
ices
Figu
re 1
2. S
usta
inab
le fa
rmin
g pr
actic
es’ m
odel
SUST
AIN
AB
ILIT
Y O
F FA
RM
ING
PR
AC
TIC
ES
Dec
linin
g gr
ound
wat
er
qual
ity
Dec
linin
gde
pth
of g
roun
dwat
er
tabl
e
Hum
an
heal
th
haza
rds
Exce
ss n
itrat
e co
ncen
tratio
n in
gr
ound
wat
er
Red
uced
no
. of f
rogs
&
locu
sts
Pest
icid
e re
sidu
e in
ch
ives
Exce
ss n
itrat
e co
ncen
tratio
n in
chi
ves
Ove
ruse
of p
estic
ides
O
veru
se o
f gro
undw
ater
per
irr
igat
ion
freq
uenc
y
Inad
equa
te ir
rigat
ion
Insu
ffic
ient
irrig
atio
n fo
r cro
p gr
owth
Ove
ruse
of N
and
P
ferti
lizer
s
Incr
ease
d/in
suff
icie
nt u
se
ofor
gani
c fe
rtili
zers
Posi
tive
bala
nce
of N
and
P in
soil
Impr
oved
soil
nutri
ent c
onte
nt
and
stab
le p
H
Inad
equa
te fa
rmer
s’
train
ing
Poor
ext
ensi
on
serv
ices
Lim
ited
BC
R
Surp
lus
food
grai
ns
Surf
ace
irrig
atio
n m
etho
d Im
prop
er h
andl
ing
of
pest
icid
es
Lim
ited
yiel
d in
crea
se
179

180
11.6 Conclusions The North China Plain (NCP) is the food bowl of the country. It has one-fifth of the country’s total arable land and produces one-fourth of the country’s total food grains; 84 percent of the population is involved in agricultural production activities. In order to maintain production and ensure food security, farmers in the area have adopted yield increasing-, external input-requiring production technologies such as use of high yielding varieties of crops, intensive use of chemical fertilizers and pesticides, and irrigation using groundwater resources in the past decades. Based on causal observation of the situation, intensive use of these inputs has increased crop yield and contributed significantly to food self-sufficiency of the people in the country in general and in the study area in particular. The sustainability of such intensive farming practices has increasingly attracted the attention of researchers, planners and decision-makers. In order to achieve improved agriculture while conserving production resources like water and soil, it is necessary to examine the sustainability of current farming practices in terms of environmental sustainability, economical sustainability and socio-institutional sustainability. The study revealed that farmers in the area have been continuously employing the same practices in somewhat similar fashion in terms of variety of crops cultivated, areas covered, irrigation management, soil-fertility management and pest/disease management. Farmers are homogenous in terms of land-holding size and socio-cultural systems. Most farm households depend on subsistence agriculture with cultivation of winter wheat, summer maize, cotton and chives as major farming activities. In order to obtain high production from small land holdings, farmers, regardless of land-holding size and crops cultivated, have adopted input-intensive farming practices such as overuse of poor quality groundwater for irrigation, overuse of chemical fertilizers, particularly N fertilizer for soil-fertility management and pesticides for pest/disease control. These external inputs are used more intensively for cash crops like chives and cotton than food grains due to higher economic benefit involved in cash crop production. Overuse of inputs, coupled with improper methods in input handling cause serious environmental problems. Among them are declining depth of the groundwater table — insufficient for irrigation and domestic use now and in the future — declining groundwater quality, increasing irrigation cost, soil salinization and compaction, land subsidence, nitrate pollution of groundwater and chive plants and water pollution due to overuse of pesticide. It was observed during the field survey that although farmers are aware of the existing status quo regarding input overuse, they have been unable to introduce changes in current practices. They feel too vulnerable and insecure to opt for a shift from present systems. Therefore, farmers still prefer high amounts of inputs. The main reasons are expectation of high yield from small land holdings, lack of

181
good information about productivity and proper handling of inputs, insufficient institutional support for input use, poor awareness of scarcity of resources and contamination of groundwater and chives due to input overuse, traditional thinking of the local farmers and easy access to inputs both physically and economically. One important discovery of this study is degradation of groundwater because of overexploitation of groundwater for crop irrigation. The area is facing a critical problem in recharging groundwater resources. This critical situation exists also in other areas of the NCP. Crop production relies on irrigation that consumes more than 80 percent of groundwater resource (Liu et al., 2001). It is estimated that each metre drop in groundwater table will double pumping costs over the next ten years (Li, 1997). The future of agricultural development in the area will be depressed and unsustainable if the current scenario of groundwater use, attitudes of farmers and weak institutional management and improper implementation of policies and regulations continues. Soil-fertility management is the basis for sustainability in every agricultural production system. Over the centuries, plains’ farmers have adopted different soil-fertility management practices, such as increased use of organic manure including farmyard manure and crop residues, and chemical fertilizers. The study found that soil pH, OM content and soil fertility as represented by NPK contents have been improving over the past 20 years and current soil fertility, as reflected by these indicators, is within the borderline for sustainability. It is concluded that soil fertility is not deteriorating under the current management practices. However, the study revealed unbalanced use of fertilizers in the area. Organic fertilizer and K are insufficiently used while N and P are overused. SFs tended to apply higher amounts of FYM than NSFs. Excess N fertilizer application does not always increase yield. The continuation of this practice will not only contaminate water resources and vegetables, but also degrade soil fertility and productivity in the long run. Therefore, integrated and intensive use of both organic fertilizers and chemical fertilizers is required in the area. Integration of both organic and chemical fertilizers is essential for yield increase and resource conservation in heavily populated countries like China. Some scholars argue that organic farming or low-external-input agriculture is sustainable while high-external input agriculture is not sustainable (Rodale, 1990; Tisdell, 1996; MacNaeidhe and Culleton, 2000; Rossi and Nota, 2000). However, Dahal (1996) and Rahman (1998) found that organic farming without proper use of chemical fertilizers and pesticides leads to negative soil nutrient balance and low yield that threaten environmental and economic sustainability. Likewise, emphasis on yield and income increase and therefore economic sustainability through intensive use of chemical fertilizers (Altieri, 1992) will cause environmental degradation such as soil deterioration and water contamination

182
and threaten the environmental sustainability of farming practices. China has successfully sustained the productivity level of wheat and rice for over 100 years by meeting 50 percent of the N requirement through organic sources. Therefore, balanced and integrated use of chemical fertilizers with organic fertilizers on soil test-based recommendations assures long-term productivity with sufficient economic returns. Moreover, for maintenance of soil fertility on a sustainable basis in intensively cropped areas, greater emphasis has to be placed on residue management, and legumes as intercrops for food grains. Profitability is one of the primary indicators of agricultural sustainability. Therefore, the issue is to ensure that agriculture is profitable but not at the expense of the environment, and to recognize that farm profitability might be increased by preventing or repairing environmental degradation (Smith and McDonald, 1998). It is concluded from this study that crop production is financially profitable in the area. Cash crops achieved higher financial benefit than food grains. Although the net return and BCR for crop production could satisfy conditions for sustainability in this study, it is achieved through much higher input use. Being highly dependent on these external inputs makes the financial profitability of crop production very sensitive to change in input costs and output prices. If the cost of groundwater depletion, water pollution, soil salinity, soil compaction, increased health care and loss of predators is taken into consideration, then undoubtedly crop production would not be economically sustainable. The results showed that with the adoption of recommended amounts of groundwater, fertilizers and pesticides, production costs will be reduced; accordingly, environmental costs induced from overuse of inputs will also be reduced. To become economically sustainable, in the true sense, environmental cost should be considered, as environmental degradation is not cost free. The degradation of natural and environmental resources reduces productivity and longevity of these resources and ultimately affects the sustainability of the system adversely. The trade-off between financial sustainability and environmental sustainability threatens the economic sustainability of farming practices in the area. Sustainability assessment considering only financial profitability without considering environmental and social cost, such as case studies conducted in Jinxian County of the NCP (Wu, 1998) and Wuwei County in Northwest China (Chen, 2000) lead to the conclusion that intensive farming practices are sustainable. These results are very biased in a strict sense. Thus, emphasis should be shifted from heavy dependency on agrochemicals to integration of resources, nutrient recycling and to better management of land and water and better use of available human resources and knowledge so land, water and other productive resources can be conserved and productivity can be

183
increased on a sustainable basis. Research, extension credit and other support services need to be re-oriented accordingly. Under the economic reform and market economy policy, extension services and training provided by local government agents is inadequate in the dissemination of knowledge and technology related to proper use of inputs. So far, these agents have not been effective in providing services to farmers due mainly to top-down planning and implementation and weak financial capacity. The research indicates that farmers obtained knowledge and technology relevant to crop production from printed materials, TV/radio programmes, fellow farmers and input dealers; this sometimes misleads farmers about appropriate use of inputs. Farmers, although they are dissatisfied with current extension services, still expect efficient extension services from government agents. Private entrepreneurs such as input dealers have much potential to become important and active components of extension services in the area. Their vital role in provision of input-handling technologies should be recognized and enhanced. The study found that SFs tended to have more contact with extension workers and most importantly, they applied knowledge and technologies obtained from extension workers to their farm work and this guided them in proper use of inputs. This calls for the improvement of government-led extension services. Moreover, easy access to input markets stimulates and encourages farmers to purchase and use high amounts of inputs. Management of input markets appears to be an urgent task for local government. In addition, the government’s present policy to attain food self-sufficiency and put every effort, including research, extension, chemical fertilizers, pesticides and diesel into promoting food-grain production in the NCP is also a constraint to sustainable agricultural development. In the short run, it is profitable for a farmer to maximize production by applying higher amounts of irrigation water, chemical fertilizers and pesticides. Moreover, as the external costs are not internalized, farmers do not think about external and social costs. The cost of a declining groundwater table, increasing irrigation cost, increasing soil salinity, increasing soil compaction, and ever-increasing pest and disease problems are not realized in the short term. In general, when both output and input increase, sustainability will be indeterminate (Smith and McDonald, 1998). In this study, increases in inputs led to increasing yields and adverse impacts on the environment. The farming practices in the area are not sustainable. There is no simple, single, broad applicable solution to revolutionize sustainable farming practices in the NCP. There is a need to formulate and implement a holistic approach and strategy to farm development. This should have special emphasis on environmental sustainability including proper use of external inputs, economic sustainability
184
including increased production and net return and reduced environmental cost, and socio-institutional sustainability including improved extension and marketing services, and farmers’ groups as well. 11.7 Recommendations for Implementation While development policies have successfully increased food production over the past years it is apparent that this has been achieved at a significant environmental cost. Based on the conclusions drawn from the analysis of the field survey and the critical observations and comprehension of the tangible situation, the following recommendations are made. Though targeted specifically for the study area, the recommendations may be applicable to many other areas in the NCP with similar biophysical, environmental and socio-economic conditions. Government policies Enhance coordination There is a need to enhance coordination between agricultural and environmental policy. The challenge is to design policies that maintain food security goals but enhance the productivity of both human and natural resources. To resolve the problems and constraints related to sustainable agriculture requires inter-sector policy coordination at national, provincial and local levels that addresses policy adjustment, strengthening of human and institutional capacity, management of natural resources and the sound use of external inputs. Current economic development and agricultural policies need to be re-examined in the light of the environmental impacts they cause, along with an assessment of the costs of the impacts. There is a clear need for better and more effective integration and coordination between agricultural policy and environmental policies. Environmental protection and natural resource conservation should be included in the development and planning process at all levels. Specific criteria for assessing agricultural sustainability in terms of environmental sustainability, economic sustainability and socio-institutional sustainability should be added to agricultural development policies and environmental protection policies. This suggests the need for coordination between agricultural and environmental policies. This coordination can be brought about in two different ways. (1) Environmental regulation treats agricultural policy as fixed and directly introduces environmental policy, which is distinct from agricultural policy. (2) It is not possible to directly introduce environmental policy, but the parameters of agricultural policy can be adjusted to take environmental consideration into account. Thus, the adjustment of agricultural policy can be regarded as a surrogate for environmental policy.

185
Drinking water standards Existence of drinking water standards, for instance, forces water management authorities to act. Whether they like it or not, they become part of a water policy network. Water management authorities need to address the regulation gap that exists and the farmers that are polluting resources. To narrow this gap, they also need to negotiate with agricultural policy authorities (Figure 13). Grain production and distribution policies National grain production and distribution policies have a major effect on agricultural practices and production resources. There is actually little economic rationale for reserving large areas for food grains due to already surplus food-grain production in the area, and low economic benefit compared with cash crops. In this regard, it is suggested that present delivery quotas of food grains should be phased out and markets to determine outputs are allowed to continue. Local government might reduce land acreage reserved for food grains and consider introducing integrated measures including livestock rearing, cash crops and fruit tree cultivation. The focus should be on improving the management of land already under cultivation, both to increase yields and to mitigate adverse environmental effects. The government should provide incentives to farmers in terms of provision of quality seeds and guaranteed market prices for diversified production.
Figure 13. Regulation gap between water management authorities and farmers
Groundwater
Farmers
Farming activities
Soil
Drinking water policy
Water quality
Water management authorities
Agricultural policy
Regulation gap
Incorporating environmental policy

186
Groundwater management Framework for sustainable groundwater management The establishment of a framework for sustainable groundwater management is highly recommended for the county. Mid- to long-term plans should be drawn up based on scientific estimation of water supply and demand for each sector. The rights of the users should be very clear. Most importantly, the plans should be demonstrated down to water managers and enforced and regularly practised by the farmers. The Irrigation Bureau of Ningjin County (IBNC) is in a position to take this responsibility. Water pricing Pricing policy is strongly recommended. Water pricing is likely to be an important aspect of water policy in the future (Biswas, 2001). Water consumption above the standard and defined level would lead to additional surcharges. An area-based pricing approach (Abu-Zeid, 2001) can be adopted in the area. This approach involves pricing water according to the areas served. It is possible to monitor water use among farmers by limiting the time for irrigation of each unit of land. Pricing will be based on the time consumed. Alternatively, the charges can be related to the volume of crop production or the value of crop income for each irrigated land area. Fees collected can be used for external support of corresponding governmental agents such as the IBNC. Control of well construction To control overexploitation of groundwater, there should also be a plan for estimation of shallow wells according to groundwater potential and construction of the wells in order to control proliferation of wells and further to avoid consequential problems. In this regard, it is necessary to introduce the “permission card” for well construction. The IBNC can be responsible to deliver the cards to users. Construction of wells should strictly follow scientific design. The government needs to regulate overuse, for example, by defining the water table level beyond which extraction of water must be closed. The basis for such regulation should be linked with well density and the salt content of groundwater. The IBNC, with the help of ABN could take complete responsibility for implementation of the laws, regulations and plans.

187
Adoption of water conservation agriculture In-situ conservation. The strategy is to save every drop of rainfall where it occurs. Rainfall and surface canal water during the rainy season could be stored in farm service reservoirs wherever feasible and economical, or could be harvested in micro-catchments constructed in the field, farmers’ yard, or other convenient places. Adoption of sprinkler and drip irrigation. In Ningjin County, adoption of these two technologies could save water by 65 percent, save land by 2 percent and increase crop yield by 20 percent (CAS, 2000). Drip irrigation can use saline water for irrigation; it has fewer negative effects on the soil than other irrigation methods (Kandiah, 1990). A feasibility study and plans for adoption of sprinkler and drip irrigation have already been made. The IBNC can take the chief responsibility for the implementation of the plans. A working group consisting of experts from relevant institutions could make action possible. Smaller but more frequent irrigation should be introduced to farmers. The study revealed that the average salt content of groundwater exceeds the standard and brackish water is overused for irrigation. This practice is very harmful to water and soil resources. Sensitivity analysis shows that if farmers adopt the recommended amount of water for irrigation, water saved can be used for reducing the recharge gap. Therefore, as a strategy to increase groundwater-use efficiency, farmers should adopt recommended amounts of groundwater. Soil-fertility management Although soil pH, N and K content are fair, OM and P content are good, so there is still a need to improve soil-fertility management in order to improve the “fair” condition, which is the borderline for sustainability, and to maintain and improve the good condition. Moreover, unbalanced use of organic and chemical fertilizers and NPK fertilizers also requires optimum and balanced fertilization. The following aspects should be taken into consideration in soil-fertility management practices. Expand use of farmyard manure Farmyard manure (FYM) is an important source of soil nutrient input; its share in the farming system must be raised. Organic sources of nutrients are inadequate compared to recommended amounts. The study has proved that farmers who raised more livestock applied more FYM to their fields and tended to use less chemical fertilizers in the field; this contributes positively to the

188
water-holding capacity of the soils and reduced irrigation requirement, improved soil structure and aeration and reduced soil-borne disease. The practice should be recommended and enhanced in the area. However, local FYM supply cannot meet the demand. It was observed during the fieldwork that a substantial portion of FYM and its nutrients are lost due to careless handling and open dumping in the field for a long time before incorporation in the field. Better composting would reduce nutrient loss and provide opportunities to include household organic wastes of different types to increase the supply of organic fertilizers. Another possibility to increase organic fertilizer supply is to increase the livestock population. It is suggested that policies should provide incentives and training to encourage livestock rearing; the local government is in a position to provide market information in regard to the sale of livestock products. Despite potential for causing environmental degradation, development of the livestock industry could have a significant multiplier effect on the rural economy by increasing farm income and a net positive effect on land quality. Legume rotations and green manuring programmes should be encouraged in farming systems through price support and efficient market mechanisms. Expand use of crop residues Crop residue is an important source of soil nutrients, especially K in the soil. It was found in this study that increased amounts of crop residue remaining in the field are a major factor in yield increase and soil-fertility improvement. This practice should be continued and further expanded. In fact, farmers in the area could depend solely on coal or gas for cooking purposes. It is necessary to advise farmers to reduce the collection and reservation of crop residues for fuel. Apart from wheat residue, more and more maize residue should be returned to the field after processing and treatment. The relevant techniques have already been developed and should be used in the area. Increased application of maize residue can reduce FYM use. Reduce excessive application of chemical fertilizer In view of the positive balance of N and P in the soil, the present practice of applying urea and P is not an economic and environmental choice. Therefore it is not imperative to maintain high levels of N fertilizer in the area. Its use must be reduced according to recommended amounts. Use of K fertilizer should be stressed for food grains and cotton due to deficiency of this nutrient in the soil. However, K used in chive fields should be reduced due to higher addition than removal. The proportion of fertilizers, particularly NPK, is very important. Balanced fertilization should be promoted in the area through the joint efforts of extension and research.

189
Pest and disease management Farmers depend heavily on chemical pesticides to control pests/diseases. Improper handling and overuse of pesticides cause environmental pollution and health hazards. Nevertheless, pest/disease resistance to pesticides also increases along with intensive use of chemicals. It seems that little can be done in the area to improve pest/disease management except for a strong recommendation for the adoption of IPM. Despite the fact that IPM still allows the use of pesticides, the IPM principle is based on ecological processes, and IPM’s current focus is on biodiversity in the agro-ecosystem for a strong link with sustainable agriculture. Extension services Extension service is vital for teaching farmers about improved farming practices. There is a need for the local government to strengthen the role and capacity of state-run extension services by assigning clear responsibility to each of the extension agents. It is suggested that the Center of Agricultural Technology Extension of the Agricultural Bureau should play a central role in providing extension and training services to the farmers. The County Commission should provide support in terms of finance and training to AEWs of the centre. Salary and field allowance must be provided to the AEWs to motivate their work. For the key staff of the centre, training should be provided on agricultural extension methods, particularly on technical activities undertaken in the area including the principles and techniques of agricultural extension, transfer of technology to farmers and demonstration plot techniques. Prioritized suggestions that should be considered in extension and training programmes are given hereunder: Public education and training programmes Public education and training programmes are important ways to disseminate information and inform the public about decisions. Education activities should range from formal educational programmes in primary and secondary schools to continuing education of the public. They should also range from providing general information on general water issues (hydrological cycles and scarcity of groundwater), soil fertility and fertilization issues and pest/disease issues, to specific information and education campaigns relating to specific activities. Particularly, farmers’ consciousness of agricultural impacts on groundwater quality has to be raised to the same level as for pollution problems such as surface water impairment due to effluent discharges from large and readily

190
identifiable point sources. The farmers who are using high doses of fertilizers and pesticides and presumed to be contributing to groundwater contamination should be responsible for groundwater quality. Training is needed at different levels, i.e. for government officials, government extension workers and farmers. There should be equal opportunities and accessibility to training programmes for the farmers. Government support in terms of scheduling of training courses, assignment of trainers and delivery of materials is expected. Some initiatives that could be taken are:
• Preparation of posters, brochures, booklets and educational videos both on general water and soil issues and on specific proposals.
• Workshops and short courses for resource managers, teachers and farmers
to exchange information on new technologies and innovative management approaches.
Reform extension services The present “top-down” extension practice is carried out without farmers being consulted. Effective extension cannot be achieved without the active participation of the farmers themselves, as well as research and related services (Axinn, 1988). Therefore, the participatory approach with concerned research institutions, extension agents and farmers is considered to be efficient and effective for the area. Group-based farmer-to-farmer extension would be the most appropriate and cost-effective approach to transfer known technologies to farmers. This will increase farmers’ participation in planning and management by strengthening linkages between research, extension and individual farmers. In view of the government’s inability to provide adequate extension workers and training to the farmers, it would be appropriate for commune committees to provide support in terms of personal and financial sources. The participation of entrepreneurs such as input dealers in extension should be highly encouraged. Regular training should be offered to the private sector in order to improve the quality of services. Linkage among governmental extension agents, the private sector and farmers should be established. In this regard, the role of the Agricultural Extension Station located in each commune should be strengthened as it is located at the grassroots level and staff in the station knows local needs. They can easily access local people and address local problems in extension. Each village committee should have at least one part-time extension officer to take care of input use and monitor local input markets. Existing local people’s groups such as food-grain and vegetable production groups and livestock rearing groups should be reorganized and motivated to participate in extension activities. For instance, chive cultivation in

191
Dongcui is motivated by local farmers who witnessed achievements in Shouguang County of the province. Regarding groundwater management, formulation of water-user groups is strongly recommended for the area. Local farmers should be trained as water-user groups, with the responsibilities of planning among themselves and use of available water. Each village should establish at least one water-user group to organize local people to participate in water management activities, to monitor water use, to resolve conflicts among users and to charge water-use fees. The group could have close links with government agencies involved in water resource management. Regulatory or legal structures should be introduced in order to motivate less willing farmers to cooperate. Enhance on-farm demonstrations Establishment of on-farm demonstration plots and their use for training purposes should be the integral part of the extension programme. Demonstration plots should be available in food-grain fields, cotton and chive fields. The demonstration should be designed so that high use, medium use and low use of fertilizers, pesticides and irrigation water are reflected. Farmers could observe crop growth situations under different input levels through participation in demonstration activities. Soil testing and quality inspection of products should be done after harvesting. Seasonal change of the groundwater table should also be demonstrated to farmers. Agricultural information centres Establishment of “information centres for farmers” is a very useful and practical way for dissemination of reliable and timely information to farmers. This practice has already been adopted in some provinces of the country, and should be introduced to the study area. Research needs The study points to the need for further studies in a number of areas, which could include: Environmental and social costs are important in determining the economic sustainability of farming practices. It is therefore necessary to conduct in-depth environmental and social benefit–cost analysis by quantifying groundwater contamination, pollution of farm products by chemicals, human health hazards caused by input use and other externalities.

192
A detailed feasibility study on water conservation techniques such as sprinkler and drip irrigation is necessary for the area. The design and implementation of the feasibility study should be adapted to the local situation such as availability of groundwater and local people’s financial capacity. Economic and environmental benefit should be taken into account during the feasibility study period.

193
12. BIBLIOGRAPHY
Abu-Zeid, M. (2001). Water pricing in irrigated agriculture. Water Resources
Development, 17(4): 527–538. Altieri, M.A. (1992). Preface on Special Issue of Sustainable Agriculture.
Agriculture Ecosystems and Environment, Vol. 39, pp. vii. APO (Asian Productivity Organization). (1996). Transaction costs of farm credit
in Asia. Tokyo. In Dang, N.V. (2001). Farm Household Development in the Midlands of Vietnam: A Case Study of Doan Hung District, Phu Tho Province. Master’s thesis, Asian Institute of Technology.
Atkinson, D. and McKinlay, R.G. (1997). Crop protection and its integration
within sustainable farming systems. Agriculture, Ecosystems and Environment, 64: 87–93.
Axinn, G.H. (1988). Guide on Alternative Extension Approaches. Food and Agriculture Organization of the United Nations, Rome.
Ayers, R.S. and Westcot, D.W. (1985). Water quality for agriculture. FAO
Irrigation and Drainage Paper No. 29, Rev 1, FAO, Rome. In Kandiah, A. (1990). Water Quality Management for Sustainable Agricultural Development. Natural Resources Forum,14(1): 22–32.
Barbier, E.B. (1987). The concept of sustainable economic development.
Environmental Conservation, 14(2): 101–110. Beets, W.C. (1990). Raising and Sustaining Productivity of Smallholder
Farming Systems in the Tropics, A Handbook of Sustainable Agricultural Development. AgBe Publishing, Holland.
Biswas, A.K. (2001) Water policies in the developing world. Water Resources
Development, 17(4): 489–499. Bowers, J. (1995). Sustainability, agriculture, and agricultural Policy.
Environment and Planning, 27: 1231–1243. Braat, L. (1991). The predictive meaning of sustainability indicators. In Onno,
K. and Harmen, V. (1991). In Search of Indicators of Sustainable Development. Kluwer Academic Publishers.

194
Brklacich, M., Bryany, C.R. and Smith, B. (1991). Review and appraisal of concept of sustainable food production systems. Environmental Management, 15: 1–14.
Cai, Y.L. and Smith, B. (1994). Sustainability in Chinese agriculture: challenge
and hope. Agriculture, Ecosystems and Environment, 49: 279–288. Cao, M.H. and Jiang, M.X. (2000). Discussions on the evaluation systems of
Chinese sustainable development in 21st Century. The Future and Development. pp. 52–55.
Cao, R.L. and Jia, X.K. (2001). The problems and countermeasures of nitrogen
pollution in agriculture of China. Journal of Soil and Fertilizer, 3: 3–6. CAS (Chinese Academy of Sciences). (2000). Summary Report of Efficient
Utilisation and Management of Agricultural Resources, a Case in Ningjin County, Shangdong Province, P.R. China. Beijing, CAS. (In Chinese.)
Chen, B.M. (1992). Chinese Land, Grain Production and Population. Press of
People’s University of China, Beijing. Chen, G.B. (2000). On the Sustainability of Agricultural Development in
Zhangye City. Master’s thesis. Gansu Agricultural University. Gansu, P.R. China.
Chen, S.K. (2000). The establishment of evaluation and indices system for
Chinese sustainable development. World Environment, pp.1–9. (In Chinese.)
Chen, Z.M. (1995). Effects of N Fertilization on N utilization and yield. Journal
of Soil and Fertilizer, 4: 36–42. (In Chinese.) Cheng, X. and Han, C. (1997). Sustainable agricultural development in China.
World Development, 20(8): 1127–1144. CNRII (Commission of Natural Resources Integrated Investigation). (1991). A
Study on Productivity and Population Carrying Capacity of Land Resources in China. People’s University Press, Beijing. (In Chinese.)
Conway, G.R. (1987). The properties of agrosystems. Agricultural Systems, 1–
35. Conway, R.G. and Edward, B.B. (1990). After the Green Revolution:
Sustainable Agriculture for Development. Earthscan Publications Limited, 120 Pentonville Road, London N1 9JN.

195
Dahal, H. (1996). Ecological Approach to Sustainable Agriculture through Integrated Nutrient Resource Management: A Micro-level Study in the Eastern Tarai Farming System, Nepal. PhD dissertation, Asian Institute of Technology, Bangkok.
Dale, V.H. and Beyeler, S.C. (2001). Challenges in the development and use of
ecological indicators. Ecological Indicators, 1: 3–10. Dhaliwal, G.S., Arora, R. and Dhawan, A.K. (1999). Emerging Trends in
Sustainable Agriculture. Food and Agriculture Organization of the United Nations, Rome, Italy.
Dixon, J.A., James, D.E. and Sherman, P.B. (1989). The Economics of Dryland
Management. Earthscan Publications Ltd. London. Edwards, C.A., Grove, T.L., Harwood, R.R. and Pearce, C.J. (1993). The role of
agroecology and integrated farming systems in agricultural sustainability. Agriculture, Ecosystems and Environment, 46: 99–121.
Edwards, J.G. and Howells, O. (2001). The origin and hazard of inputs to crop
protection in organic farming systems: Are they sustainable? Agricultural Systems, 67: 31–47.
EPSDD (Epidemic Prevention Station of Dezhou District). (2000). Report of
Crop Test. Dezhou, Shandong, PR China. ESCAP (Economic and Social Commission for Asia and the Pacific). (2000).
Sustainable Agricultural Development Strategies for the Least Developed Countries of the Asian and the Pacific Region. ESCAP.
Fan, X.L. and Fen, T.F. (1999). Handbook of Fertilizer Application. Farmer’s
Press of the North China Plain, Zhenzhou. FAO (2000). Selected Indicators of Food and Agriculture Development in Asia-
Pacific Region, 1989-99. RAP Publication, RAP/FAO, Bangkok. Farshad, A. and Zinck, J.A. (1993). Seeking agricultural sustainability.
Agriculture, Ecosystems and Environment, 47(1): 215–230. Follett, R.F., Gupta, S.C. and Hunt, P.G. (1987). Conservation practices: relation
to the management of plant nutrients for crop production. In SSSA Special Publication no. 19, Soil Fertility and Organic Matter as Critical Components of Production Systems, Madison, WI USA.
Francis, C.A. and King, J.W. (1988). Cropping systems based on farm-derived,
renewable resources. Agricultural Systems, 27: 67–75.

196
Franzel, S., Coe, R., Cooper, P., Place, F. and Scherr, S.J. (2001). Assessing the
adoption potential of agroforestry practices in Sub-Saharan Africa. Agricultural Systems, 69: 37–62.
Gu, J. and Gao, H. (2000). Techniques to increase the efficiency of fertilizer
utilization. Journal of Agricultural Engineering, 16(2): 17–20. (In Chinese.)
Gyaltshen, S. (2000). Bhutan case. In ESCAP, (2000). Sustainable Agricultural
Development Strategies for the Least Developed Countries of the Asian and the Pacific Region.
Hansen, J.W. (1996). Is agricultural sustainability a useful concept? Agricultural
Systems, 50: 117–143. Hansen, J.W. and Jones, J.W. (1996). A systems framework for characterizing
farm sustainability. Agricultural Systems, 51: 185-201. Hausenbuiller, R.L. (1972). Soil Sciences Principles and Practices. WMC,
Brown Company Publishers Dubuque, Iowa. He, B.C. (1991). China on the Edge. China Books and Periodicals, San
Francisco, CA. Hu, C.X., Deng, B.R. and Liu, T.Q. (1996). Effects of nitrogen fertilization on
vegetable quality. Journal of Soil and Fertilizer, 3: 34–36. (In Chinese.) Huang, J.K. and Ma, H.Y. (2000). Production costs of Chinese agricultural
products in comparison with international standards. Journal of Strategies and Management, 6: 86–95. (In Chinese.)
Huang, S.W., Jin, J.Y., Zuo, Y.B., Yang, L.P. and Chen, M.F. (2000). Nutrient
balance of agricultural soils and their evaluation. Journal of Soil Fertility, 6:14–19. (In Chinese.)
Huda, A.T.M.S. (2000). Bangladesh case study. In ESCAP (2000). Sustainable
Agricultural Development Strategies for the Least Developed Countries of the Asian and the Pacific Region. ESCAP, Thailand, pp. 41–51.
IBNC (Irrigation Bureau of Ningjin County). (1996). Utilization and
Development of Groundwater Resource in Ningjin. IBNC, Ningjin County. (In Chinese.)
IBNC. (2001). Statistic of Water Resources in Ningjin. IBNC, Ningjin.

197
ICLEI. (1996). The Local Planning Guide. ICLEI – Local Governments for Sustainability, Toronto.
Ikerd, J.E. (1996). The Economist’s Role in the Agricultural Sustainability
Paradigm. San Antonio, TX. Kandiah, A. (1990). Water quality management for sustainable agricultural
development. Natural Resources Forum, 14(1): 22–32. Khepar, S.D. and Sondhi, S.K. (1999). Water management strategies for
sustainable irrigated agriculture. In Dhaliwal, G.S., Ramesh Arora, and Dhawan, A.K., eds. Emerging Trends in Sustainable Agriculture. New Delhi, Commonwealth Publishers.
Koma, Y.S. (2000). Cambodia case. In ESCAP, (2000). Sustainable Agricultural
Development Strategies for the Least Developed Countries of the Asian and the Pacific Region. ESCAP, Thailand, pp. 65–78.
Liebman, E. (1983). California farmland: A history of large agricultural
landholdings. Rowmand and Allanheld, New Jersey. In Altieri M.A., (1992). Agroecological Foundations of Alternative Agriculture in California. Agriculture, Ecosystems and Environment, 39: 23–53.
Liu, C.M., Yu, J.J. and Kendy, E. (2001). Groundwater exploitation and its
impact on the environment in the North China Plain. Water International, 26(2): 265–272.
Liu, X.H. (1995). Issues on the sustainable agricultural development.
Agricultural Modernization, 2: 3–6. (In Chinese.) Liverman, D.M., Hanson, M.E., Brown, B.J. and Merideth, R.W. Jr., (1988).
Global sustainability: towards measurement. Environmental Management, 12: 133–143.
Lo, F.C. and Xing, Y.Q. (1999). China’s Sustainable Development Framework-
Summary Report. The United Nations University, the Institute of Advanced Studies. Tokyo, Japan.
Lu, R.K. and Shi, T.J. (1982). Handbook of Agri-chemistry. Science Press,
Beijing. Lynam, J.K. and Herdt, R.W. (1989). Sense and sustainability, sustainability as
an objective in international agricultural research. Agricultural Economics, 3: 381–398.

198
MacNaeidhhee, F.S. and Culleton. N. (2000). The application of parameters designed to measure nature conservation and landscape development on Irish farms. Agriculture, Ecosystems and Environment, 77: 65–78.
Mass, E.V. (1984). Salt tolerance of plants. In Kandiah, A., (1990). Water
Quality Management for Sustainable Agricultural Development. Natural Resources Forum,14 (1): 22–32.
Meadows, D.H., Meadows, D.L., Randers, J. and Behrens, W.W. (1972). The
Limits to Growth. Signet, New York. Miah, M.Q. (1993). Applied Statistics for Human Settlement Planning. Asian
Institute of Technology (AIT), Bangkok, Thailand. MOA (Ministry of Agriculture). (1996). National Standard for Agricultural
Input Use. MOA, Beijing. MOA (Ministry of Agriculture). (1999). Standards of Pesticide Use. MOA,
Beijing. MOA (Ministry of Agriculture). (2000). Agricultural Information Network of
China. MOA, Beijing. Morrison, G., Fatoki, O.S., Zinn, E., and Jacobsson, D., (2001). Sustainable
Development Indicators for Urban Water Systems: A Case Study Evaluation of King William’s Town, South Africa, and the Applied Indicators. Water SA, 27(2):219-232.
Morse, S.N., McNamara, M.A. and Okwoli, B. (2001). Sustainability indicators:
the problem of integration. Sustainable Development, 9: 1–15. NBCARG (National Basic Conditions Analysis and Research Group). (1990).
Subsistence and Development-The Systematic Study on the Problems Regarding Long-term Rural Development in China. Science Press, Beijing. (In Chinese.)
Ndiaye, S.M. and Sofranko, A.J. (1994). Farmers’ perceptions of resource
problems and adoption of conservation practices in a densely populated area. Agriculture, Ecosystems and Environment, 48: 35–47.
NRC (National Research Council). (1993). Sustainable Agriculture and the
Environment in the Humid Tropics. National Academy Press, Washington, D.C.

199
Ouyang, X.H., Zhu, M.Q. and Cui, J., (1996). Fertilization in conserved water sources and control of water pollution. Journal of Conservation of Agricultural Environment, 15 (3): 107–110. (In Chinese.)
Pingali P.L., (1995). Health Cost of Long-term Pesticide Exposure in the
Philippines – A Medical and Economic Analysis: IRRI Social Science Division. Paper No. 90-04, Los Baños, Laguna, Philippines.
Pretty, J. (1996). Regenerating Agriculture, Policies and Practices for
Sustainability and Self-Reliance. Earthscan Publication Limited, London. National Academy Press, Washington D.C., Action Aid, Bangalore.
Pretty, J. and Hine R. (2000). The promising spread of sustainable agriculture in
Asia. Natural Resources Forum, 24: 107–121. Qu, G.P. and Li, J.C. (1992). Population and the Environment in China. Lynne
Rienner Publishers. Boulder, Colorado. Rahman, S. (1998). Socio-economic and Environmental Impacts of
Technological Change in Bangladesh Agriculture. PhD Dissertation, Asian Institute of Technology, Bangkok.
Rasul, G. (1999). Sustainability Analysis of Modern and Ecological Farming
Systems in Delduar Thana, Bangladesh. Master’s thesis, Asian Institute of Technology.
Rasul, G. and Thapa, G. (2004). Sustainability of ecological and conventional
agricultural systems in Bangladesh: an assessment based on environmental, economic and social perspectives. Agricultural Systems, 79: 327–351.
Rigby, D. and Caceres, D. (2001). Organic farming and the sustainability of
agricultural systems. Agricultural Systems, 68: 21–40. Rodale, R. (1990). Sustainability: an opportunity for leadership. In Edwards,
C.A. et al., eds. (1990). Sustainable Agricultural Systems. St. Lucie Press, 100E. Linton Blvd., Florida 33483.
Rondinelli, D.A. (1986). The urban transition and agricultural development:
implications for international assistance policy. Development and Change, 17: 234–239.
Rossi, R. and Nota, D. (2000). Nature and landscape production potentials of
organic types of agriculture: a check of evaluation criteria and parameters in two Tuscan farm-landscapes. Agriculture, Ecosystems and Environment, 77: 53–64.

200
Sands, G.R. and Podmore, T.H. (2000). A generalized environmental
sustainability index for agricultural systems. Agriculture, Ecosystems and Environment, 79: 29–41.
Schiff, M. and Valdes, A. (1995). The plundering of agriculture in developing
countries. Finance and Development, pp: 44–47. SDTV. (2002). Report on Market Survey of Farming Equipment Supply.
Shandong Television Channel, Jinan, Shandong Province, PRC. Senanayake, R. and Sustain, J. (1991). Sustainable agriculture: definition and
parameters for measurement. Journal of Sustainable Agriculture, 1(4): 7–28. In Sands, G.R. and Podmore, T.H. (2000). A Generalized Environmental Sustainability Index for Agricultural Systems. Agriculture, Ecosystems and Environment, 79: 29–41.
Simon, D. (1989). Sustainable development. Theoretical construct or attainable
goal? Environmental Conservation, 16(1): 41–48. Smith, C.S. and McDonald, G.T. (1998). Assessing the sustainability of
agriculture at the planning stage. Journal of Environmental Management, 52: 15–37.
Soon, L.G. (1999). Integrated pest management in developing countries. In
Dhaliwal, G.S., Arora, R., and Dhawan, A.K. (1999). Emerging Trends in Sustainable Agriculture. Food and Agriculture Organization of the United Nations, Rome, Italy.
Sorensten, J.T. and Kristensen, E.S. (1992). Global Appraisal of Livestock
Farming Systems and Study on Their Organizational Levels: Concept, Methodology and Result. Commission of European Communities, pp 45–57.
SSODD (Soil Survey Office of Dezhou District). (1999). Soil Survey Report in
Ningjin County. SSODD, Dezhou, Shandong Province, PRC. Staatz, J.M. and Eicher, C.E. (1984). Agriculture development ideas in historical
perspectives. In Agriculture Development in the Third World. Baltimore: Johns Hopkins University Press.
Stenholm, C.W. and Wagner, D.B. (1990). Low-input, sustainable agriculture:
myth or method? Journal of Soil and Water Conservation, 45: 13–17. Su, J. and Tan, F. (1991). Study on the pesticide resistance of brown planthopper.
Journal of Agricultural Pesticides, 30: 7–8.

201
SWRSDD (Station of Water Resource Survey of Dezhou District). (2001).
Annual Report of Groundwater Resource in Ningjin County. SWRSDD, Ningjin.
Tandon, H.L.S. (1993). Agronomic evaluation and calibration of soil tests. In
Proceedings of the FADINAP Regional Workshop on Cooperation in Soil Testing for Asia and the Pacific. Bangkok.
Tellarini, V. and Caporali, F. (2000). An input-output methodology to evaluate
farms as sustainable agroecosystems: an Application of indicators to farms in Central Italy. Agriculture, Ecosystems and Environment, 77: 111–123.
UN-PAK (The United Nations System in Pakistan). (2000). United Nations
Statement on Food Security in Pakistan. The United Nations System in Pakistan Publication, No. UN-PAk/FAO/2000/1.
Tisdell, C. (1996). Economic indicators to assess the sustainability of
conservation farming projects: an evaluation. Agriculture, Ecosystems and Environment, 57: 117–131.
Uexkull, H.R. (1988). Nutrient Cycling in Soil Management and Small Holder
Development in the Pacific Islands. Proceedings No. 8, IBSRAM. Walker, J. and Reuter, D.J. (1996). Indicators of Catchment Health: A Technical
Perspective. CSIRO Australia. Wang, J.F. and Xin, S.Z. (1998). Negative effects of fertilization and
countermeasures. Journal of Conservation of Agricultural Environment, 17 (1): 40–43. (In Chinese.)
Wang, Y.W. and Ju, Z.C. (1998). Constraints, potentials and measurements for
the development of sustainable agriculture in Shandong Province. In Qing, D.H., (1998). Exploration of Sustainable Development Strategy. China Environmental Science Press, Beijing.
WCED (World Commission on Environment and Development). (1987). Our
Common Future. Oxford University Press, Oxford, New York. Webster, J.P.G. (1997). Assessing the economic consequences of sustainability
in agriculture. Agriculture, Ecosystems and Environment, 64: 95–102. Wen, D. (1988). Low input agriculture: the final selection of the agriculture in
China. Agricultural Modernization Research, 9(5): 1–4.
202
Wen, D.Z. and David, P. (1992). Ecological resource management to achieve a productive, sustainable agricultural system in Northeast China. Agriculture, Ecosystems and Environment, 41: 215–230.
WFS (World Food Summit). (1996). Rome Declaration on World Food Security
and World Food Summit Plan of Action. Rome, Italy. In UN-PAK, (2000). United Nations Statement on Food Security in Pakistan. The United Nations System in Pakistan Publication, No. UN-Pak/FAO/2000/1.
WHO (World Health Organization). (1995). Evaluation of Certain Food
Additives and Contaminants. Joint FAO/WHO Expert Committee on Food Additives (JECFA).
WHO (World Health Organization). (1984). Paraquat and Disquat:
Environmental Health Criteria 38. Geneva: World Health Organization.
Wiren-Lehr, S. von, (2001). Sustainability in agriculture — an evaluation of principal goal-oriented concept to close the gap between theory and practice. Agriculture, Ecosystems and Environment, 84:115–129.
Wu, D.F. (1998). On the Sustainability of Intensive Agricultural System: A Case
Study in Jingxian County. PhD Dissertation, Chinese Agricultural University. Beijing, P.R. China.
Xu, Y. (2000). Indicators and evaluation modelling of the utilization of
agricultural resources: a case in Ningjin County of Shandong Province. In Summary Report of High Efficiency Utilization of Agricultural Resources (1). Chinese Academy of Sciences, Beijing. (In Chinese.)
Zhang, B.Z., (2000). Sustainable Agricultural Development in China (in
Chinese). Shandong Press of Science and Technology. Jinan, Shandong, 225 pp.
Zhang, W.L. (1995). Investigation of nitrate pollution in groundwater due to
nitrogen fertilization in agriculture in North China. Journal of Plant Nutrition and Fertilizer Sciences, 1(2): 80–87. (In Chinese.)
Zhen and Routray. (2002). Environmental impacts of groundwater exploitation in the North China Plain's agriculture: farmers perceptions and remedial measures. Asia-Pacific Journal of Rural Development (APJORD), Vol. XII, No.2, 14–32. Zhen and Routray. (2003). Operational indicators for measuring agricultural sustainability in developing countries. Environmental Management, 32 (1): 34–46.
Related Documents