JOIN THE CONVERSATION #50x2030

Welcome message from author
This document is posted to help you gain knowledge. Please leave a comment to let me know what you think about it! Share it to your friends and learn new things together.
Transcript

JOIN THE CONVERSATION #50x2030

2
AGENDAOpening Remarks
Christophe Duhamel, 50x2030 Program Manager a.i.
Presenters
“Mapping CAADP BR data using the UNFSS framework” John Ulimwengu, Senior Research Fellow (IFPRI)
“CAADP Biennial Review Data Challenges and Gaps and ReSAKSS’ Efforts to Improve Data Quality and Fill Data Gaps” Greenwell Matchaya, ReSAKSS Coordinator for Southern Africa
“CAADP BR Demand for Agricultural Surveys” Anatole Goundan, Senior Associate Scientist, AKADEMIYA2063
Discussants
Chiara Brunelli, 50x2030 Data Production Component Manager a.i., Food and Agriculture Organization of the United Nations
Michael Steiner, 50x2030 Data Use Component Manager, International Food for Agricultural Development
Simplice Nouala, Head, Division of Agriculture and Food Security, African Union Commission
Q&A JOIN THE CONVERSATION #50x2030

MAPPING CAADP BR DATA USING THE UNFSS FRAMEWORK
JOHN M. ULIMWENGU
SENIOR RESEARCH FELLOW (IFPRI)

4
TABLE OF CONTENTS
• CAADP BR overall structure
• UN Food System Summit’s Framework
• Mapping BR and Food System: Action Tracks
• Mapping BR and Food System: FS components
• Main findings and recommendations

5
CAADP/ MALABO BR PERFORMANCE CATEGORIES AND INDICATORS
Thematic area (TA) Number of
Performance
categories
(PCs)
Indicators (Is)
TA 1: Recommitting to CAADP process 3 3
TA 2: Enhancing investment finance in agriculture 4 6
TA 3: Ending hunger by 2025 6 21
TA 4: Halving poverty through agriculture by 2025 4 8
TA 5: Boosting intra-African trade in agriculture commodities and services 2 3
TA 6: Enhancing resilience to climate variability 2 3
TA 7: Mutual accountability for actions and results 3 3
Total 24 47

6
UN FOOD SYSTEM FRAMEWORK
ACTION TRACKS
• Action Track 1 – Ensure Access to Safe
and Nutritious Food for All
• Action Track 2 – Shift to Healthy and
Sustainable Consumption Patterns
• Action Track 3 – Boost Nature-Positive
Food Production at Scale
• Action Track 4 – Advance Equitable
Livelihoods and Value Distribution
• Action Track 5 – Build Resilience to
Vulnerabilities, Shocks and Stresses

7
Number of BR performance indicators by the UN Food System Summit’s Action Tracks
11
6
17
13
14
0
2
4
6
8
10
12
14
16
18
Action Track 1:
Access to safe &
nutritious food for
all
Action Track 2: Shift
to sustainable
consumption
patterns
Action Track 3:
Boost nature-
positive production
Action Track 4:
Advance equitable
livelihoods
Action Track 5:
Build resilience to
vulnerabilities,
shocks and stress
Countries progress by the UN Food System Summit’s Action Tracks (2019 BR)
10
15
0 0
5
0
2
4
6
8
10
12
14
16
Action Track 1 –
Ensure Access to
Safe and Nutritious
Food for All
Action Track 2 –
Shift to Healthy and
Sustainable
Consumption
Patterns
Action Track 3 –
Boost Nature-
Positive Food
Production at Scale
Action Track 4 –
Advance Equitable
Livelihoods and
Value Distribution
Action Track 5 –
Build Resilience to
Vulnerabilities,
Shocks and
Stresses
2_1i Public agriculture expenditure as share of total public expenditure; 2_1ii Public Agriculture
Expenditure as % of agriculture value added; 2_1iii ODA disbursed to agriculture as % of
commitment; 2_2 Ratio of domestic private sector investment to public investment in
agriculture; 2_3 Ratio of foreign private direct investment to public investment in agriculture;
3_1i Fertilizer consumption (kilogram of nutrients per hectare of arable land); 3_1ii Growth rate
of the size of irrigated areas from its value of the year 2000

8
Number of BR performance indicators by the UN Food System Summit’s Components
Countries progress by the UN Food System Summit’s Components (2019 BR)
5
5
0
4
3
3
2
3
3
8
4
7
0 1 2 3 4 5 6 7 8 9
Inputs
Production
Processing
Distribution
Food safety
Ag services
Environment and climate change
Inclusion (youth and women)
Investment
Politics and Leadership
Poverty
Nutrition and Health outcomes
1
4
25
24
9
25
18
8
4
0
3
0 5 10 15 20 25 30
Inputs
Production
Distribution
Food safety
Ag services
Environment and climate change
Inclusion (youth and women)
Investment
Politics and Leadership
Poverty
Nutrition and Health outcomes
PC Indicators
6_1ii Share of agriculture land under sustainable land management practices,
3_1ii Growth rate of the size of irrigated areas from its value of the year 2000
3_1iiiGrowth rate of the ratio of supplied quality agriculture inputs (seed, breed, fingerlings) to the total national inputs
requirements for the commodity
3_1vi Proportion of farm households with ownership or secure land rights
3_1i Fertilizer consumption (kilogram of nutrients per hectare of arable land)
• Processing and packaging
• Storage
• Transportation and logistics
• Retail and marketing

9
MAIN FINDINGS AND RECOMMENDATIONS
• By adopting the CAADP Agenda, African leaders have already set the foundation for taking a food systems approach to achieving their national development objectives.
• There are still whole in the food system in terms of reporting coverage;
• Countries are at different stages with respect to food system action tracks and components;
• The momentum created by the UN Food System Summit is an opportunity to substantially improve on the implementation of the CAADP/Malabo Agenda.
• The BR and AATS may be supplemented with additional indicators (e.g., processing and distribution stages of the food system) for a more comprehensive planning, implementation, and tracking of transforming Africa’s food systems.
• Continued improvement of countries’ statistical systems.

CAADP BIENNIAL REVIEW (BR) DATA CHALLENGES AND GAPS AND RESAKSS’ EFFORTS TO IMPROVE DATA QUALITY AND FILL DATA GAPS
GREENWELL MATCHAYA
RESAKSS COORDINATOR FOR SOUTHERN AFRICA
AKADEMIYA2063

11
THE AFRICAN CAADP BR PROCESS
• Comprehensive Africa Agriculture Development Programme(CAADP)
• Africa's policy framework for agriculture-led development and transformation since 2003.
• Aimed at reducing poverty and increasing food security and nutrition on the continent.
• Reinforced in 2014 through the Malabo Declaration on Agricultural Transformation
• Through the Malabo, CAADP now focuses on 7 commitments, one on mutual accountability emphasizes on Biennial Reviews

12
THE 7 COMMITMENTS WITHIN CAADP

13
MANY COUNTRIES PARTICIPATING BUT PERFORMANCE IS WEAK AND POOR DATA IS PART OF THE PROBLEM

14
EFFORTS BY ReSAKSS TO FIX DATA ISSUES
• With funding from the Gates Foundation and in collaboration with its implementing partners,
• Initiated a partnership framework for strengthening evidence-based planning and implementation in five African countries (Kenya, Malawi, Mozambique, Senegal, and Togo) in 2019 during the second round of the BR process.
• Expanded to Zimbabwe, Botswana, Uganda, Benin, and Burkina Faso, in 2021 during the 3rd round of BR.
• The capacity-strengthening activities focused on working with the country BR team to:
• assess the inaugural or 2018 BR process and identify the data gaps;
• constitute and train members of data clusters to compile and check the data;
• and then validate and submit the data to the AU.

The BR process and support activities in the intervention countries
Source: Benin, Karugia, Matchaya and Mbaye, 2020Notes: ASWG = agriculture sector working group. eBR = electronic or online BR system. RECs = Regional Economic Communities. AUC-TWG = African Union Commission-Technical Working Group.

16
COUNTRY SELECTION
• The main criteria for purposely selecting the were three:
1. Having a SAKSS or SAKSS-like function;
2. Willingness to participate in the pilot project and openly and proactively put all of its data challenges on the table and work with AKADEMIYA/IFPRI-ReSAKSS to identify and address the gaps; and
3. That the effect of the pilot on the 2020 BR score is irrelevant.
• Reporting/data missing rates and data quality changes are then used to track any effects of the country activities
Emerging results
• There is an overall improvement in
data reporting rate from 2017 to
2019
• The capacity-strengthening
activities conducted in the pilot
countries seem to have helped
those countries to achieve better
results.
• Benin, Karugia, Matchaya and
Mbaye (2020) documents details
on this.
• https://ebrary.ifpri.org/digital/colle
ction/p15738coll2/id/133715

17
DIFFERENCES IN REPORTING ACROSS THE 3 BRs AND PILOT AND NON-PILOT COUNTRIES
.
BR
2019
pilot
countries
2021
new pilot
countries
All pilot
countrie
s
Non-pilot
countries
Reporting
Rates
2017 83 82,8 82,9 72,8
2019 84 83 84 72,4
2021 86 91,1 88 74,8
Difference-
2021-2017 3 8 6 2
DID 1 6 4
Pilot countries appear to have improved reporting rates more

BR2019 2021 BR
Reportin
g rate-%
Total missing
some data
parameters Missing all
Missing
some
Reporting
rate-%
Total missing
some
parameters Missing all
Missing
some Improvement
DR Congo 50 31 10 21 89,2 10 0 10 21
South Sudan 53 27 13 14 88,9 8 3 5 19Djibouti 36 34 21 13 72,1 17 6 11 17Gabon 71 23 2 21 88,6 7 1 6 16
Botswana 59 25 11 14 89,6 9 1 8 16
Mozambique 75 24 3 21 91,6 9 1 8 15Nigeria 78 17 4 13 96,3 4 0 4 13Lesotho 60 29 7 22 75,7 19 5 14 10
Tanzania 81 12 5 7 97,9 4 0 4 8
Mauritania 81 12 4 8 96,6 4 0 4 8Congo 64 23 9 14 72,4 16 8 8 7
Zimbabwe 80 14 4 10 90,0 9 1 8 5Sudan 62 30 7 23 69,6 25 6 19 5Kenya 88 8 3 5 97,0 4 0 4 4Gambia 84 10 4 6 91,8 6 2 4 4
Morocco 78 15 3 12 85,7 11 1 10 4
Cabo Verde 75 17 5 12 81,6 13 3 10 4
Top 15 countries to have reduced indicators with missing data parameters in 2021

BR2019 2021 BR
Reportin
g rate-%
Total
missing
some
parameter
s Missing all
Missing
some
Reporting
rate-%
Total
missing
some
parameter
s Missing all
Missing
some Improvement
Equatorial Guinea 28 36 26 10 32,2 34 27 7 2Djibouti 36 34 21 13 72,1 17 6 11 17Somalia 37 32 23 9 32DR Congo 50 31 10 21 89,2 10 0 10 21Sudan 62 30 7 23 69,6 25 6 19 5Lesotho 60 29 7 22 75,7 19 5 14 10Eritrea 49 28 17 11 43,5 31 20 11 -3Guinea-Bissau 51 27 16 11 50,5 27 16 11 0South Sudan 53 27 13 14 88,9 8 3 5 19Mauritius 64 27 8 19Niger 64 26 8 18 51,3 31 14 17 -5Botswana 59 25 11 14 89,6 9 1 8 16Mozambique 75 24 3 21 91,6 9 1 8 15Congo 64 23 9 14 72,4 16 8 8 7Gabon 71 23 2 21 88,6 7 1 6 16
Top 15 countries with missing data in 2019 and changes in 2021
2019 2021
Total missing
some
parameters
Miss
ing
all
Missi
ng
some
Total missing
some
parameters
Missin
g all
Missing
some
Improv
ed
3_6iii Trade aspect of food safety (food safety trade index) 42 29 13 31 22 9 11
5_1 Growth rate of the value of trade of agricultural commodities and services within Africa 42 6 36 8 8 0 34
3_6ii Health aspect of food safety (food safety health index) 41 12 29 30 8 22 11
4_1v Reduction rate of the gap between the wholesale price and farmgate price 34 29 5 21 18 3 13
3_5v Growth rate of the proportion of Minimum Dietary Diversity-Women 33 27 6 51 25 26 -18
4_3 Percentage of youth that is engaged in new job opportunities in agriculture value chains 32 13 19 51 13 38 -19
4_4 Proportion of rural women that are empowered in agriculture 32 22 10 20 14 6 12
4_2Number of priority agricultural commodity value chains for which a public-private partnership
(PPP) is established with strong linkage to smallholder agriculture 29 22 7 20 19 1 9
3_5vi Proportion of 6-23 months old children who meet the Minimum Acceptable Diet 27 15 12 21 13 8 6
3_5viiReduction in the prevalence (%) of adult individuals (15 years or older) found to be food
insecure 27 18 9 19 10 9 8
5_2i Trade Facilitation Index 26 1 25 31 7 24 -5
4_1iii Reduction rate of poverty headcount ratio, at national poverty line (% of population) 25 0 25 15 0 15 10
3_2i Growth rate of agriculture value added per agricultural worker 24 3 21 21 3 18 3
6_1iPercentage of farm, pastoral, and fisher households that are resilient to climate and weather-
related shocks 24 11 13 18 12 6 6
6_2Existence of government budget-lines to respond to spending needs on resilience building
initiatives 24 3 21 15 2 13 9
Top 15 indicators with missing data parameters and improvements in 2021

21
KEY MESSAGES I
• There is an overall improvement in data reporting rate from 2017 to 2019, and 2021
• The capacity-strengthening activities conducted in the pilot countries seem to have helped those countries to achieve better results.
• For the pilot countries, the largest improvements in reporting rates between 2017 and 2019 were
• In Togo (12.2 %pts) and Senegal (10.9 %pts),
• Followed by Kenya (3.8 %pts) and Malawi (3.0 %pts), and then Mozambique (0.6 %pts).
• Between 2019 and 2021 the top 15 countries to have reduced indicators with missing data parameters included 4 pilot countries –Botswana, Kenya, Zimbabwe and Mozambique
• Quality of data reported, (the percent of the data
reported that had issues in 2019)
• The best-performing pilot country was Senegal, with
the least issues (2.3%), followed by Kenya and
Malawi (2.8% each), and then Togo (6.1%).
• On average, the pilot countries performed better than
the like-pilot countries.
• Should be noted that there was also technical support
from ReSAKSS and partners,
• through virtual meetings and physical missions
with/to countries
• These have contributed to general reporting
improvements in non pilot countries too
• The eBR deployment again facilitated reporting and
improved data quality

22
KEY MESSAGES II
• For the pilot countries it would appear that
• The assessment activities followed by trainings and cluster strengthening as well as leadership are crucial for success
• This raises the question of how to sustain the data clusters to strengthen the trust among the members
• To continuously update the data for the next rounds of the BR and reporting in 2023, and 2025.
• Broaden the composition of the core BR team and data clusters to include relevant non-state and non-agricultural-sector actors.
• Strengthen country and regional data validation processes of
data to improve quality
• Strengthen the role of Joint sector reviews (JSR) in BRs
by incorporating BR indicators in JSRs
• Strengthen BR results utilization in planning and
resource allocation at the country levels.
• Many of the capacity strengthening activities require
funding- increase funding toward data collection,
management and M&E

CAADP BR DEMAND FOR AGRICULTURAL SURVEYS
ANATOLE GOUNDAN
SENIOR ASSOCIATE SCIENTIST, AKADEMIYA2063
24
OUTLINE
❖Introduction
❖CAADP BR Demand for Ag Surveys
❖Supply of Ag Surveys: Senegal Example
❖ Lessons and Call to Action
25
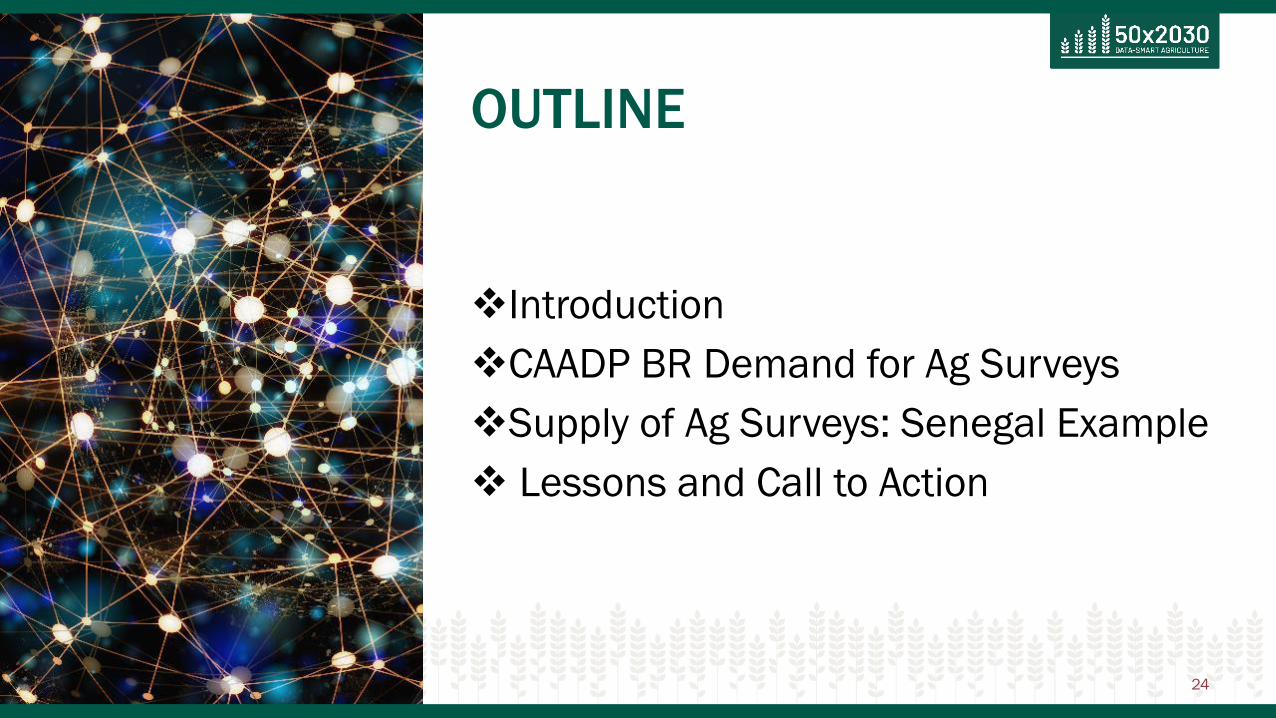
THE CAADP BIENNIAL REVIEW
• The CAADP Biennial Review (BR) held in 2017, 2019, and 2021 (ongoing)
• The first two BRs (2017 and 2019) have underscored data challenges faced by African countries
• Data on several of the BR indicators and parameters were missing or had measurement
issues (Benin et al. 2018)
• From Matchaya et al. 2018, other data challenges:
• Lack of a centralized agricultural database,
• Lack of awareness of available data sources,
• Inadequate capacities for data collection, processing, and analysis,
• Poor data management,
• Lack of funding, etc.
• The BRs have also underscored urgent need to strengthen data systems in Africa

26
THE CAADP BIENNIAL REVIEW: DEMAND FOR AG SURVEYS
Data is required across 266 parameters to inform 47 indicators and 7 Malabo thematic areas
Theme Indicators Data parameters
All themes 47 266
Theme 1: Recommitment to CAADP process 3 27
Theme 2: Enhancing investment in agriculture 6 28
Theme 3: Ending hunger 21 153
Theme 4: Halving poverty through agriculture 8 29
Theme 5: Boosting intra-African agricultural trade 3 16
Theme 6: Enhancing resilience to climate change 3 8
Theme 7: Enhancing mutual accountability 3 5

Top 10 BR indicators with missing data: by number of countries
❖ For the ten, > 50% of the reporting countries had some missing data parameter
❖ For five indicators, all data parameters were missing in > 40% of the countries
THE CAADP BIENNIAL REVIEW: DEMAND FOR AG SURVEYS

Missing data parameters for selected indicators that can be met by Ag survey data
THE CAADP BIENNIAL REVIEW: DEMAND FOR AG SURVEYS

29
THE CAADP BIENNIAL REVIEW: DEMAND FOR AG SURVEYS
• Finding reliable data sources on food security and nutrition indicators is tough in many countries
• For example, in Cabo Verde, the most recent DHS available is for 2005
• LSMS-ISA can help fill some BR indicators, howeveronly 8 African countries are covered
• 50x2030 Initiative may help fill only about 9 BR Indicators
• There is a need for targeted surveys to collect the mostchallenging BR indicators

30
SUPPLY OF AG SURVEYS: SENEGAL EXAMPLE
• Several rounds of DHS are available (2019, 2018, 2017, …)
• Senegal Agricultural Policy Project (PAPA) Project (http://www.papa.gouv.sn/) which collected several survey data in 2017
• Several value chains were covered from dry cereals, irrigated rice, horticulture, seed, fertilizers, trade, processing etc.
• PAPA relied on a Local Analytical Network (LAN) to create a collaborative team around data collection and analysis

31
SUPPLY OF AG SURVEYS: SENEGAL EXAMPLEStructure of local analytical network

32
LESSONS AND CALL TO ACTION
• Need to support to countries with missing BR data:
• For countries not covered by LSMS-ISA and 50x2030, support countries to implement lightersurveys on the relevant BR indicators
• For other challenging BR indicators, explore to how to work with countries and other partners to conduct surveys for the data
• Work with technical partners to develop/adaptmethodologies for computing BR indicators usingexisting data
• PAPA-like initiative needs to be replicated in more African countries
33
AGENDAOpening Remarks
Christophe Duhamel, 50x2030 Program Manager a.i.
Presenters
“Mapping CAADP BR data using the UNFSS framework” John Ulimwengu, Senior Research Fellow (IFPRI)
“CAADP Biennial Review Data Challenges and Gaps and ReSAKSS’ Efforts to Improve Data Quality and Fill Data Gaps” Greenwell Matchaya, ReSAKSS Coordinator for Southern Africa
“CAADP BR Demand for Agricultural Surveys” Anatole Goundan, Senior Associate Scientist, AKADEMIYA2063
Discussants
Chiara Brunelli, 50x2030 Data Production Component Manager a.i., Food and Agriculture Organization of the United Nations
Michael Steiner, 50x2030 Data Use Component Manager, International Food for Agricultural Development
Simplice Nouala, Head, Division of Agriculture and Food Security, African Union Commission
Q&A JOIN THE CONVERSATION #50x2030

34
DISCUSSANT
CHIARA BRUNELLI50x2030 Data Production Component
Manager a.i.Food and Agriculture Organization of the
United Nations

35
DISCUSSANT
MICHAEL STEINER50x2030 Data Use Component Manager
International Fund for Agricultural Development

36
DISCUSSANT
SIMPLICE NOUALAHead, Division of Agriculture and Food
SecurityAfrican Union Commission
CAADP BR PROCESS:
STRENGTHENING GOVERNANCE FOR
IMPROVING AG STATISTICAL SYSTEMS

37
OUTLINE
I. Introduction
II. Data quality issues
III. Recommendations

38
INTRODUCTION
❑July 2003 - Maputo, Mozambique : CAADP was launched during the 2nd Ordinary Session of the Assembly of African Union (AU). Heads of state and government launched the Comprehensive African Agriculture Development Programme;
❑ June 2014 - Malabo, Equatorial Guinea: Malabo Declaration on Accelerated African Agricultural Growth and Transformation for Shared Prosperity and Improved Livelihood;

39
Recommitment to the Principles and Values of the
CAADP process
Enhancing Investment Finance in Agriculture
Ending Hunger by 2025
Halving Poverty through Agriculture by 2025
Boosting Intra-African Trade in Agricultural Commodities & Services
Enhancing Resilience to Climate Variability
Enhancing Mutual Accountability for Actions and Results
INTRODUCTION

40
Reporting Guidance provided by the Malabo Declaration
INTRODUCTION

7 Performances Areas
23 Performances Categories
47 Performances Indicators
CAADP BR DATA
❑Quality of CAADP BR Reporting Tools: Technical Guidelines, Country Reporting Template and Technical Note;
❑Data collected and validated at country level
❑ Data entered in the e-BR;❑Data Submission Control
❑Data Entry Module
❑Data visualization
CAADP BR DATA
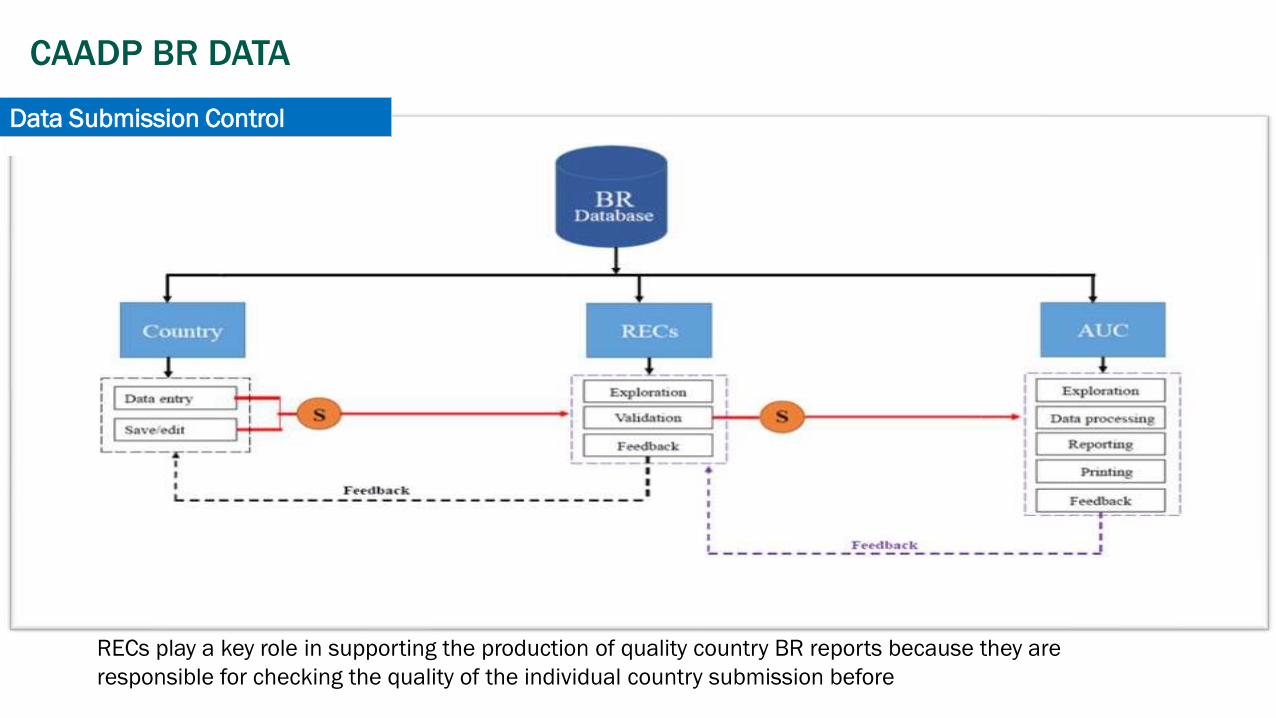
Data Submission Control
RECs play a key role in supporting the production of quality country BR reports because they are
responsible for checking the quality of the individual country submission before
CAADP BR DATA

The first 2 BR reports have recommended to strengthen data systems at country level to Improve the quality (accuracy, consistency, traceability, and validity) of the data and reporting
• CAADP BR data are collected or originated from different sectors and administration at country level
• The BR should be or is highly participatory data collection, validation, analysis, and learning process
• The BR process is quite expensive as it required both adequate human and financial resources that are already limited
WHAT ARE ISSUES

• Integrate the BR data collection process into existing national and regional systems for agr. data collection
• Ensure/strengthen dialogue with the Bureau of Statistics to integrate more BR data into the National Statistical to avoid duplication of data, to maximize of scarce resources, and to ensure uniformity
• Strengthen dialogue between the Ministry of Agriculture and Ministries to Institutionalize an inter-ministerial and multi-sectoral team to support the BR process
• Establish/strengthen public-private partnerships in the area of data generation, analysis
• Develop regional standards protocol for CAADP BR data collection, verification, validation;
• Enhance the participation of statistical departments/divisions at regional and continental levels in the BR process to ensure consistency with definitions of data ordinarily collected and published routinely by regional and continental institutions.
HOW DO WE IMPROVE DATA QUALITY THROUGH STRENGTHENING GOVERNANCE OF DATA SYSTEMS

46
QUESTIONS
&
ANSWERS
JOIN THE CONVERSATION
#50x2030

50x2030.ORG
47
Related Documents