Stochasticity in Gene Expression John Fricks Physics 597a March 30, 2006 based on Stochasticity in Gene Expression: From Theories to Phenotypes by Mads Kærn, Timothy Elston, William Blake and James Collins

Welcome message from author
This document is posted to help you gain knowledge. Please leave a comment to let me know what you think about it! Share it to your friends and learn new things together.
Transcript

Stochasticity in Gene Expression
John FricksPhysics 597a
March 30, 2006
based on Stochasticity in Gene Expression: From Theories to Phenotypes by Mads Kærn, Timothy Elston, William Blake and James Collins

Stochasticity
• Important when the number of proteins, mRNAs, etc is small.
• Hopefully, understanding the small level models will give insight into how these feed into larger models.
• The models and how to simulate them.
• Interplay between the models and the biology.
• Theoretical exploration of the models.

Deterministic Model of Gene Expression
©!!""#!Nature Publishing Group!
!
Repressed promoter (R)
kon sA
sR
sP
!M !Pkoff
mRNA (M) Protein (P)Active promoter (A)
d [M]
dt=
kon + ko!
A
V+
kon + ko!
R
V" M
[ ]on o!k ks sM#
d [P ]
dt= sP [M ] ]" P[P#
the random formation and decay of single molecules and multi-component complexes explicitly. As a result, the deterministic approach cannot capture the poten-tially significant effects of factors that cause stochasticity in gene expression.
In certain circumstances, deterministic simula-tions of the model in FIG. 1 predict intracellular protein concentrations that are similar to those predicted by stochastic simulations. The conditions that need to be satisfied for the predictions of the two approaches to be similar are large system size (high numbers of expressed mRNA and proteins, and large cell vol-umes) and fast promoter kinetics (BOX 1; see below).
These conditions are met in the example illustrated in FIG. 2a, in which the protein concentration (the overall measure of gene expression) predicted by a stochastic simulation fluctuates with very low amplitude around the average level predicted by a deterministic simula-tion. Correspondingly, the relative deviation from the average, measured by the ratio " of the standard deviation # to the mean N, is quite small. This ratio " (or, alternatively, "2) is typically referred to as the coefficient of variation, or the noise.
When the conditions required for good agreement between deterministic and stochastic simulations are not fulfilled, the effects of molecular-level noise can
Figure 1 | A model of the expression of a single gene. Each step represents several biochemical reactions, which are associated with mRNA and protein production, transitions between promoter states and the decay of mRNA and protein. kon, koff, sA, sR, sP, !M and !P are the rate constants associated with these steps, as indicated. These reactions involve binding and dissociation events that occur at random at the molecular level. This is ignored in deterministic models of gene expression, which typically describe the different steps in terms of reaction rates. Stochastic models generally describe each step as a single random event, with a reaction time that shows an exponential distribution. All steps are assumed to obey first-order kinetics. The ratios sP /!M (the average number of proteins produced per mRNA) and sA/koff (the average number of mRNA produced between successive promoter activation and inactivation events) are referred to as the translational and transcriptional efficiency, respectively.
Box 1 | Deterministic rate equations and stochastic models of gene expression
Rate equations One mathematical framework for describing gene expression uses deterministic rate equations to calculate the concentrations of mRNA [M] and proteins [P]. For the model in FIG. 1, with a single gene copy, these equations are:
(1)
(2)
where V is the cell volume; the terms !M[M] and !P[P] are the degradation rates for mRNA and proteins, respectively; and the term sP[M] is the rate of protein synthesis. The rate constants kon and koff govern transitions between the active and repressed states of the promoter. Therefore, the ratios kon/(koff + kon) and koff /(kon + koff) in equation 1 are the fraction of time that the gene spends in the active and repressed states, respectively (that is, the promoter is assumed to be in chemical equilibrium). Consequently, mRNA production occurs at a constant rate, which is given by the weighted average of the activated synthesis (sA) and repressed synthesis (sR) mRNA synthesis rates.
The macroscopic limit and promoter kineticsThe above equations represent a valid approximation of the stochastic description when two limits are satisfied (FIG. 2a). The first is the macroscopic limit in which sR, sA and V become large, with the ratios sR/V and sA/V remaining constant. The second is the limit of fast chemical kinetics in which kon and koff become large, with their ratio remaining constant. Note that these limits do not alter equations 1 and 2. In FIG. 2b, the limit of fast chemical kinetics is satisfied, whereas fluctuations that are due to small system size are large (see main text). The reverse is true in FIGS 3a,b, where the number of expressed molecules is high, but the transitions between promoter states occur less frequently. Typically, concentration fluctuations scale in the form 1/$V for small system size effects (corresponding to 1/$N scaling, as [N] = N/V), and in the form 1/$koff + kon for slow chemical kinetic effects19.
452 | JUNE 2005 | VOLUME 6 www.nature.com/reviews/genetics
R E V I EWS
dM(t)
dt=
kon
kon + koffsA +
koff
kon + koffsR ! !MM(t)
dP (t)
dt= sP M(t) ! !P P (t)
d[M ](t)
dt=
kon
kon + koff
sA
V+
koff
kon + koff
sR
V! !M [M ](t)
or as a concentration
d[P ](t)
dt= sP [M ](t) ! !P [P ](t)
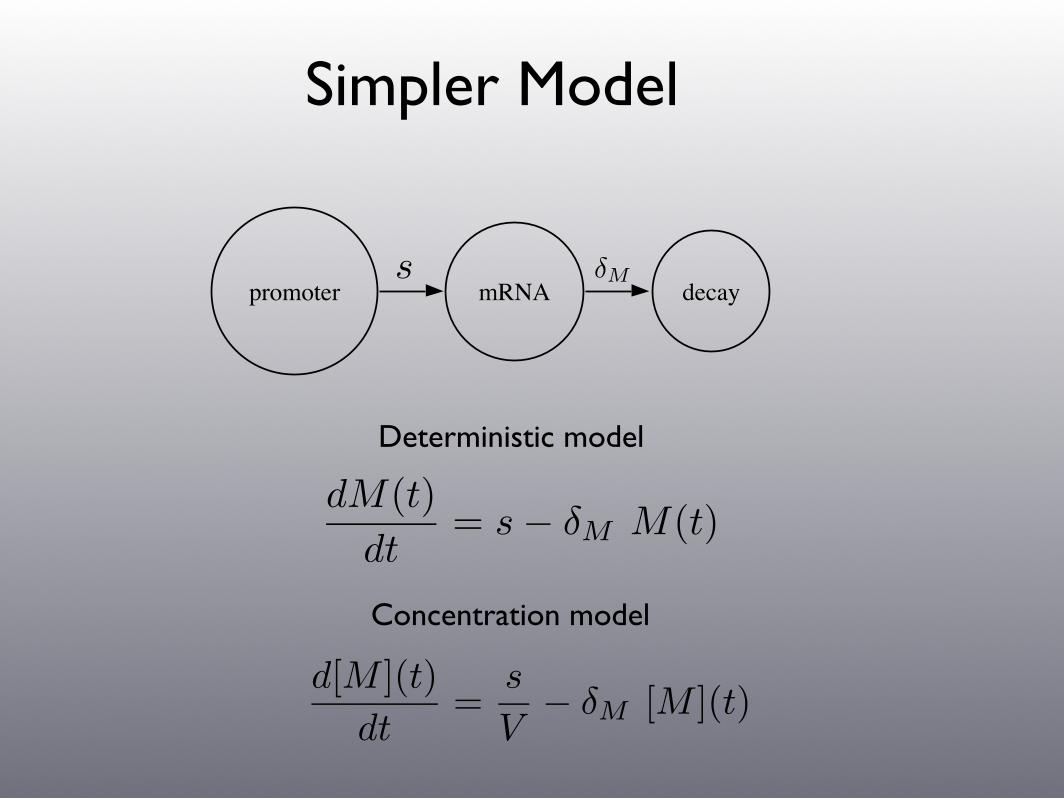
Simpler Model
promoter mRNA decay!Ms
Deterministic model
dM(t)
dt= s ! !M M(t)
d[M ](t)
dt=
s
V! !M [M ](t)
Concentration model

Simpler Model
M(t + !) ! M(t) + !
! = 1 with prob s!
= 0 with prob 1 ! (s + "M M(t))!
= !1 with prob "M M(t)!
E(M(t + !) ! M(t)) " (s ! !M M(t))!
Notice that the local mean matches the deterministic system.
promoter mRNA decay!Ms
Stochastic Model (Continuous Time Markov Chain)
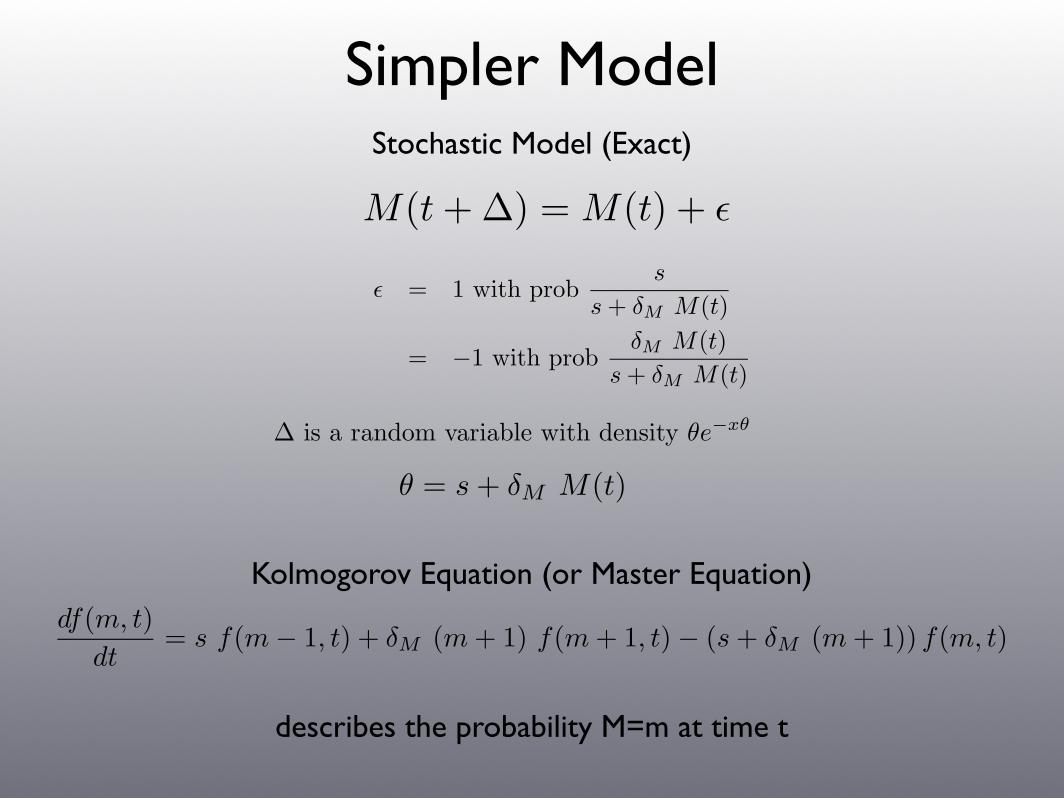
Stochastic Model (Exact)
M(t + !) = M(t) + !
! = 1 with probs
s + "M M(t)
= !1 with prob"M M(t)
s + "M M(t)
! is a random variable with density !e!x!
! = s + "M M(t)
df(m, t)
dt= s f(m ! 1, t) + !M (m + 1) f(m + 1, t) ! (s + !M (m + 1)) f(m, t)
Kolmogorov Equation (or Master Equation)
describes the probability M=m at time t
Simpler Model

Simpler Model
[M ](t + !) = [M ](t) + !
! is a random variable with density !e!x!
! = s + "M V [M ](t)
Stochastic Model (concentration)
! = 1/V with probs
s + "M V [M ](t)
= !1/V with prob"M V [M ](t)
s + "M V [M ](t)
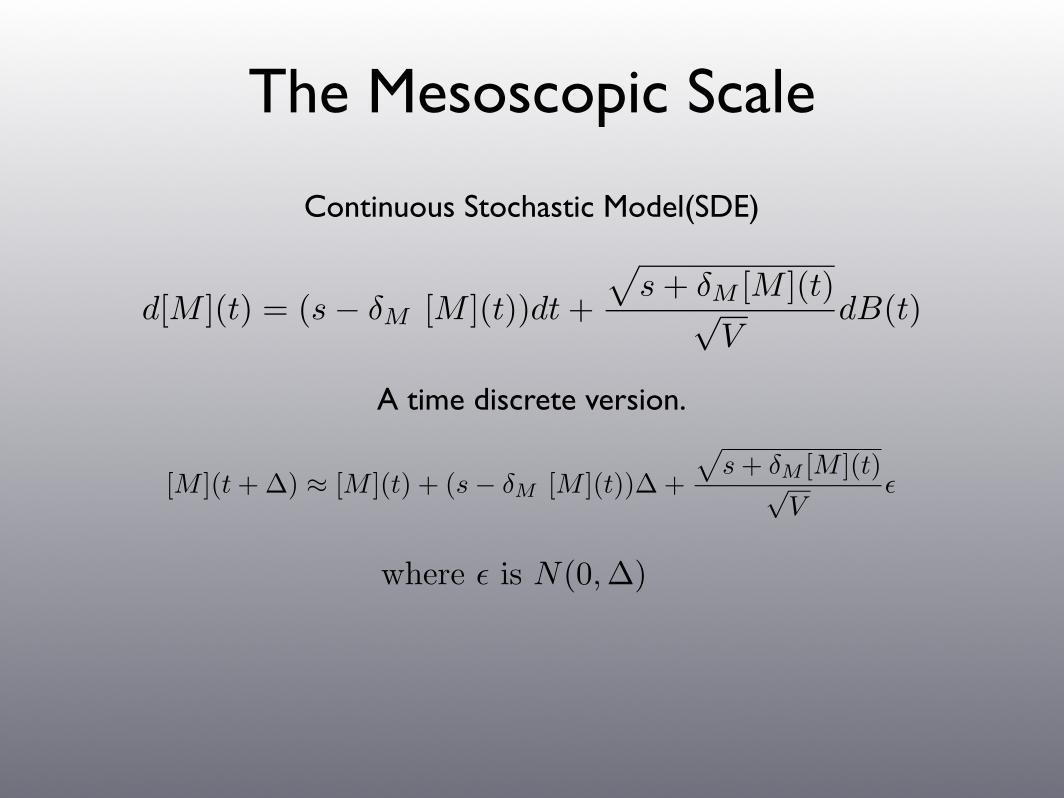
The Mesoscopic Scale
d[M ](t) = (s ! !M [M ](t))dt +
!
s + !M [M ](t)"
VdB(t)
where ! is N(0,!)
[M ](t + !) ! [M ](t) + (s " !M [M ](t))! +
!
s + !M [M ](t)#
V"
Continuous Stochastic Model(SDE)
A time discrete version.
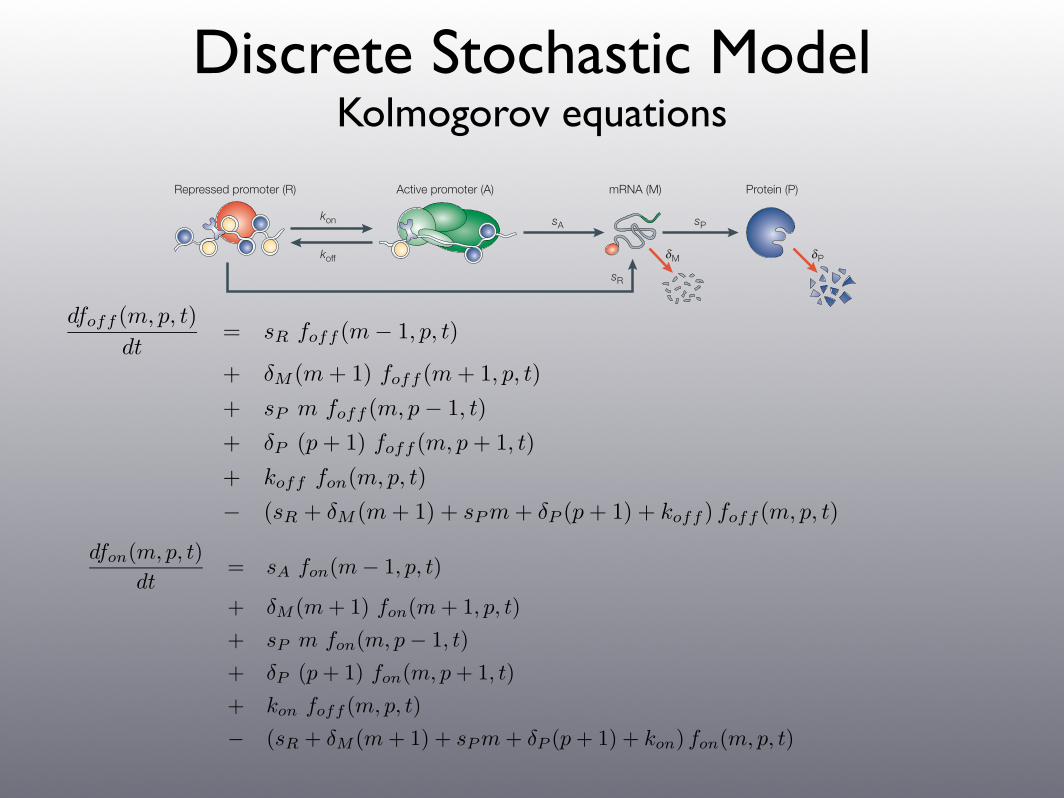
Discrete Stochastic ModelKolmogorov equations
©!!""#!Nature Publishing Group!
!
Repressed promoter (R)
kon sA
sR
sP
!M !Pkoff
mRNA (M) Protein (P)Active promoter (A)
d [M]
dt=
kon + ko!
A
V+
kon + ko!
R
V" M
[ ]on o!k ks sM#
d [P ]
dt= sP [M ] ]" P[P#
the random formation and decay of single molecules and multi-component complexes explicitly. As a result, the deterministic approach cannot capture the poten-tially significant effects of factors that cause stochasticity in gene expression.
In certain circumstances, deterministic simula-tions of the model in FIG. 1 predict intracellular protein concentrations that are similar to those predicted by stochastic simulations. The conditions that need to be satisfied for the predictions of the two approaches to be similar are large system size (high numbers of expressed mRNA and proteins, and large cell vol-umes) and fast promoter kinetics (BOX 1; see below).
These conditions are met in the example illustrated in FIG. 2a, in which the protein concentration (the overall measure of gene expression) predicted by a stochastic simulation fluctuates with very low amplitude around the average level predicted by a deterministic simula-tion. Correspondingly, the relative deviation from the average, measured by the ratio " of the standard deviation # to the mean N, is quite small. This ratio " (or, alternatively, "2) is typically referred to as the coefficient of variation, or the noise.
When the conditions required for good agreement between deterministic and stochastic simulations are not fulfilled, the effects of molecular-level noise can
Figure 1 | A model of the expression of a single gene. Each step represents several biochemical reactions, which are associated with mRNA and protein production, transitions between promoter states and the decay of mRNA and protein. kon, koff, sA, sR, sP, !M and !P are the rate constants associated with these steps, as indicated. These reactions involve binding and dissociation events that occur at random at the molecular level. This is ignored in deterministic models of gene expression, which typically describe the different steps in terms of reaction rates. Stochastic models generally describe each step as a single random event, with a reaction time that shows an exponential distribution. All steps are assumed to obey first-order kinetics. The ratios sP /!M (the average number of proteins produced per mRNA) and sA/koff (the average number of mRNA produced between successive promoter activation and inactivation events) are referred to as the translational and transcriptional efficiency, respectively.
Box 1 | Deterministic rate equations and stochastic models of gene expression
Rate equations One mathematical framework for describing gene expression uses deterministic rate equations to calculate the concentrations of mRNA [M] and proteins [P]. For the model in FIG. 1, with a single gene copy, these equations are:
(1)
(2)
where V is the cell volume; the terms !M[M] and !P[P] are the degradation rates for mRNA and proteins, respectively; and the term sP[M] is the rate of protein synthesis. The rate constants kon and koff govern transitions between the active and repressed states of the promoter. Therefore, the ratios kon/(koff + kon) and koff /(kon + koff) in equation 1 are the fraction of time that the gene spends in the active and repressed states, respectively (that is, the promoter is assumed to be in chemical equilibrium). Consequently, mRNA production occurs at a constant rate, which is given by the weighted average of the activated synthesis (sA) and repressed synthesis (sR) mRNA synthesis rates.
The macroscopic limit and promoter kineticsThe above equations represent a valid approximation of the stochastic description when two limits are satisfied (FIG. 2a). The first is the macroscopic limit in which sR, sA and V become large, with the ratios sR/V and sA/V remaining constant. The second is the limit of fast chemical kinetics in which kon and koff become large, with their ratio remaining constant. Note that these limits do not alter equations 1 and 2. In FIG. 2b, the limit of fast chemical kinetics is satisfied, whereas fluctuations that are due to small system size are large (see main text). The reverse is true in FIGS 3a,b, where the number of expressed molecules is high, but the transitions between promoter states occur less frequently. Typically, concentration fluctuations scale in the form 1/$V for small system size effects (corresponding to 1/$N scaling, as [N] = N/V), and in the form 1/$koff + kon for slow chemical kinetic effects19.
452 | JUNE 2005 | VOLUME 6 www.nature.com/reviews/genetics
R E V I EWS
dfoff (m, p, t)
dt= sR foff (m ! 1, p, t)
+ !M (m + 1) foff (m + 1, p, t)
+ sP m foff (m, p ! 1, t)
+ !P (p + 1) foff (m, p + 1, t)
+ koff fon(m, p, t)
! (sR + !M (m + 1) + sP m + !P (p + 1) + koff ) foff (m, p, t)
dfon(m, p, t)
dt= sA fon(m ! 1, p, t)
+ !M (m + 1) fon(m + 1, p, t)
+ sP m fon(m, p ! 1, t)
+ !P (p + 1) fon(m, p + 1, t)
+ kon foff (m, p, t)
! (sR + !M (m + 1) + sP m + !P (p + 1) + kon) fon(m, p, t)

Some Important Quantities
• Translational Efficiency--average number of proteins per mRNA
• Transcriptional Efficiency--average number of mRNA per active/repressed cycles
• Translational Bursting--increased rate of translation accompanied by a decreased rate of transcription.
• Transcriptional Bursting--increased rate of transcription accompanied by a decreased rate of translation.
©!!""#!Nature Publishing Group!
!
Repressed promoter (R)
kon sA
sR
sP
!M !Pkoff
mRNA (M) Protein (P)Active promoter (A)
d [M]
dt=
kon + ko!
A
V+
kon + ko!
R
V" M
[ ]on o!k ks sM#
d [P ]
dt= sP [M ] ]" P[P#
the random formation and decay of single molecules and multi-component complexes explicitly. As a result, the deterministic approach cannot capture the poten-tially significant effects of factors that cause stochasticity in gene expression.
In certain circumstances, deterministic simula-tions of the model in FIG. 1 predict intracellular protein concentrations that are similar to those predicted by stochastic simulations. The conditions that need to be satisfied for the predictions of the two approaches to be similar are large system size (high numbers of expressed mRNA and proteins, and large cell vol-umes) and fast promoter kinetics (BOX 1; see below).
These conditions are met in the example illustrated in FIG. 2a, in which the protein concentration (the overall measure of gene expression) predicted by a stochastic simulation fluctuates with very low amplitude around the average level predicted by a deterministic simula-tion. Correspondingly, the relative deviation from the average, measured by the ratio " of the standard deviation # to the mean N, is quite small. This ratio " (or, alternatively, "2) is typically referred to as the coefficient of variation, or the noise.
When the conditions required for good agreement between deterministic and stochastic simulations are not fulfilled, the effects of molecular-level noise can
Figure 1 | A model of the expression of a single gene. Each step represents several biochemical reactions, which are associated with mRNA and protein production, transitions between promoter states and the decay of mRNA and protein. kon, koff, sA, sR, sP, !M and !P are the rate constants associated with these steps, as indicated. These reactions involve binding and dissociation events that occur at random at the molecular level. This is ignored in deterministic models of gene expression, which typically describe the different steps in terms of reaction rates. Stochastic models generally describe each step as a single random event, with a reaction time that shows an exponential distribution. All steps are assumed to obey first-order kinetics. The ratios sP /!M (the average number of proteins produced per mRNA) and sA/koff (the average number of mRNA produced between successive promoter activation and inactivation events) are referred to as the translational and transcriptional efficiency, respectively.
Box 1 | Deterministic rate equations and stochastic models of gene expression
Rate equations One mathematical framework for describing gene expression uses deterministic rate equations to calculate the concentrations of mRNA [M] and proteins [P]. For the model in FIG. 1, with a single gene copy, these equations are:
(1)
(2)
where V is the cell volume; the terms !M[M] and !P[P] are the degradation rates for mRNA and proteins, respectively; and the term sP[M] is the rate of protein synthesis. The rate constants kon and koff govern transitions between the active and repressed states of the promoter. Therefore, the ratios kon/(koff + kon) and koff /(kon + koff) in equation 1 are the fraction of time that the gene spends in the active and repressed states, respectively (that is, the promoter is assumed to be in chemical equilibrium). Consequently, mRNA production occurs at a constant rate, which is given by the weighted average of the activated synthesis (sA) and repressed synthesis (sR) mRNA synthesis rates.
The macroscopic limit and promoter kineticsThe above equations represent a valid approximation of the stochastic description when two limits are satisfied (FIG. 2a). The first is the macroscopic limit in which sR, sA and V become large, with the ratios sR/V and sA/V remaining constant. The second is the limit of fast chemical kinetics in which kon and koff become large, with their ratio remaining constant. Note that these limits do not alter equations 1 and 2. In FIG. 2b, the limit of fast chemical kinetics is satisfied, whereas fluctuations that are due to small system size are large (see main text). The reverse is true in FIGS 3a,b, where the number of expressed molecules is high, but the transitions between promoter states occur less frequently. Typically, concentration fluctuations scale in the form 1/$V for small system size effects (corresponding to 1/$N scaling, as [N] = N/V), and in the form 1/$koff + kon for slow chemical kinetic effects19.
452 | JUNE 2005 | VOLUME 6 www.nature.com/reviews/genetics
R E V I EWS
sP /!M
sA/koff
Noise
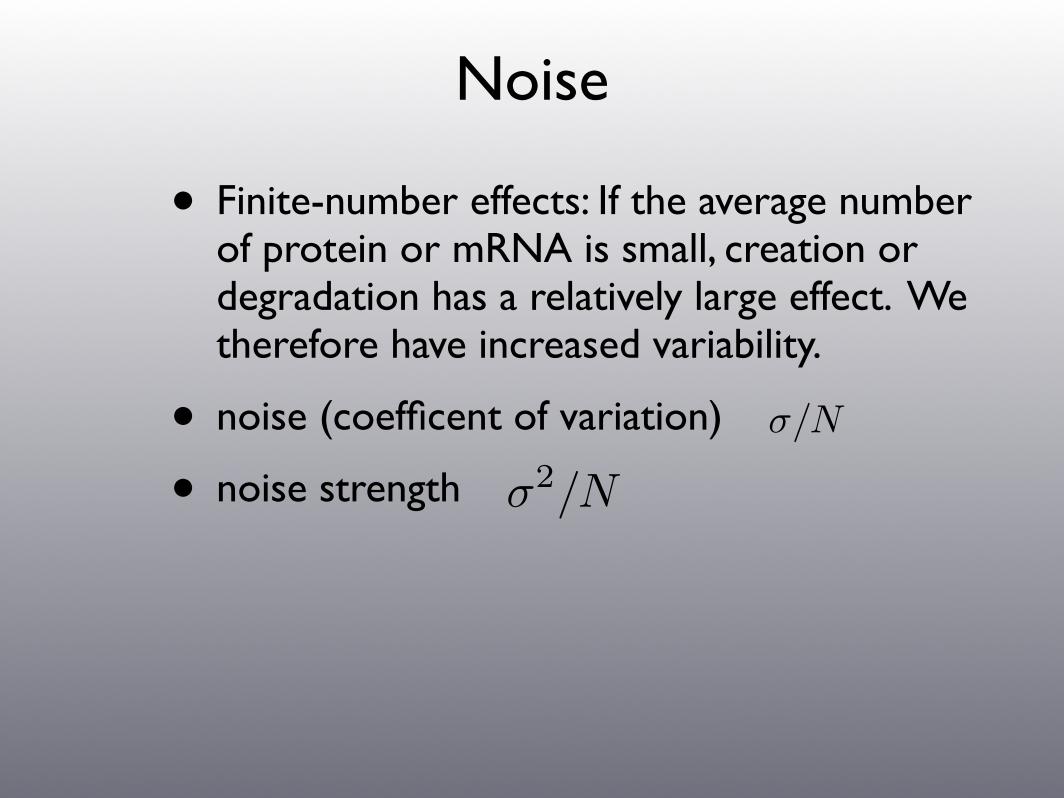
• Finite-number effects: If the average number of protein or mRNA is small, creation or degradation has a relatively large effect. We therefore have increased variability.
• noise (coefficent of variation)
• noise strength
!/N
!2/N

Analysis of Noise
©!!""#!Nature Publishing Group!
!
0.15
0.10
0.05
0.000 4 8
Time (h)
Abu
ndan
ce (µ
M)
Probability12 16 0.25 0.50
0.15
0.10
0.05
0.000 4 8
Time (h)
Abu
ndan
ce (µ
M)
Probability12 16 0.1 0.2
0.15
0.10
0.05
0.000 4 8
Time (h)
Abu
ndan
ce (µ
M)
Probability12 16 0.1 0.2
>10%deviation
a b c
ed
150 200
0.10
250 3503000.05
0.15
0.20
100 100
Average protein number NAverage protein number NN
oise
stre
ngth
(
2 /N
)
Noi
se
(/N
)
200
4
250 3503002
6
8
150
Translational efficiency varied
Transcription rate varied
! " #
"
be large. The simulations discussed below show how molecular-level noise can have pronounced effects on gene expression, and provide insights into factors that contribute to fluctuations in the abundance of expressed protein.
Finite-number effects and translational bursting. System size is an important factor contributing to sto-chasticity in gene expression. The effects of decreas-ing the cell volume are illustrated by the time series shown in FIG. 2b. These were obtained from stochastic and deterministic simulations for which the volume of the cell and the average rate of transcription were decreased 100-fold compared with the simulations in FIG. 2a. This proportional change in parameters does not affect the rate equations, and the average mRNA and protein concentrations remain the same. Comparison of the stochastic simulation results in FIGS 2a,b therefore demonstrates the effects of a smaller system size at fixed concentrations. In FIG. 2b, the pro-tein concentration fluctuates with increased amplitude, causing significant deviations from that predicted by
the deterministic model. This also causes a broader distribution of protein abundance and, therefore, increased population heterogeneity.
These results highlight a fundamental relation-ship between system size and noise50: namely that noise tends to increase when the size of the system is decreased. To understand this relationship, consider a protein that can move freely between the nucleus and cytoplasm. At equilibrium, the nuclear and cytoplasmic concentrations are, on average, equal. However, because the volume of the nucleus is less than that of the cytoplasm, translocation of a protein molecule across the nuclear membrane has a more significant effect on the nuclear concentration than on the concentration in the cytoplasm. If 10 molecules are present in the nucleus and 1,000 in the cytoplasm, the translocation of 1 molecule causes a 10% change in nuclear concentration, but only a 0.1% change in cytoplasmic concentration. This differential effect arises from the different number of molecules in the two compartments and is referred to as the ‘finite-number effect’. In general, when N denotes average
Figure 2 | Finite-number effects and translational bursting. a–c | Time series of protein concentrations generated from deterministic and stochastic simulations (blue and red curves, respectively). Histograms that show the probability that a cell will have a given intracellular protein concentration are also shown (right-hand panels). The parameters used yield protein concentrations in the µM range. The rate of promoter transitions is high (koff = kon = 10 per min). a | Low-amplitude fluctuations with high numbers of expressed mRNA and protein molecules (~3,000 and ~10,000, respectively) and a large cell volume (200 µm3). The other parameter values are sA = 50, sR = 5, sP = 0.2, $M = 0.1 and $P = 0.05 in units per min. b | Increased fluctuations in protein concentration are due to a decrease in the number of expressed mRNA and protein molecules (to ~30 and ~100, respectively). The transcription rates and cell volume were decreased 100-fold compared with a (sA = 0.5 units per min, sR = 0.05 units per min, V = 2 µm3). c | Large fluctuations in protein abundance are due to low mRNA abundance (~30 molecules). Transcription rates were decreased 100-fold compared with a (sA = 0.5 units per min, sR = 0.05 units per min) and the translation rate was increased correspondingly (sP = 20 units per min) to keep the protein abundance at ~10,000 molecules. The difference between b and c is a 100-fold increase in the average number of expressed proteins. Because low mRNA abundance is the dominant source of noise in gene expression (as described in the main text), the fluctuation amplitude and population distribution are almost the same in the two simulations. The ‘bar-code’ above the graph is obtained by drawing a vertical line at each time point where the protein concentration deviates by more than 10% from the average. d,e | The predicted dependencies of the coefficient of variation !, defined as the standard deviation " over the mean N (the noise) (d), and the noise strength #, defined as the variance "2 over the mean N (e), on the average protein abundance when the transcription rate and translational efficiency are increased. The initial parameters are as in part b.
NATURE REVIEWS | GENETICS VOLUME 6 | JUNE 2005 | 453
R E V I EWS
d. Dependency of Noise on average protein number --Noise is more sensitive to
changes in transcription.
e. Noise strength qualitatively different as a function of average protein number.

Transcriptional Induction
1. Decrease rate of promoter deactivation.(red)
2. Increase rate of promoter activation.(blue)
3. Increase transcription rate in the active state. (green)
©!!""#!Nature Publishing Group!
!
Average protein abundance (µM)
Noi
se s
treng
th (µ
M–1
)
a b
c d
0 4 8Time (h)
Abu
ndan
ce (µ
M)
Probability Time (h) Probability12 16 0.1 0.2
0.20
0.15
0.10
0.05
0.00
0 4 8
Abu
ndan
ce (µ
M)
12 16 0.1 0.2
0.20
0.15
0.10
0.05
0.00
1/[Average protein abundance] (µM–1)
Noi
se !
2 (%
)
molecular abundance, a decrease in abundance results in a characteristic 1/"N scaling of the noise (! ~1/"N and !2 ~1/N). The finite-number effect is perhaps the most commonly recognized manifestation of molecular-level noise in cellular regulation.
Comparing FIGS 2a,c highlights how finite-number effects at the level of mRNA comprise a second impor-tant factor contributing to gene-expression noise. In FIG. 2c, the rate of transcription is decreased 100-fold (compared with FIG. 2a) without changing the cell volume (in contrast to FIG. 2b). Moreover, the rate of translation is increased 100-fold, such that the average protein concen-tration (and the number of expressed protein molecules) remains the same as in FIG. 2a. This proportional change in transcription and translation rates captures a ‘transla-tional bursting’ mechanism12,20,21, in which the amplitude of fluctuations in protein abundance depends on the
number of proteins produced per mRNA, referred to as the burst parameter21 or translational efficiency23,29,36. According to this mechanism21, for two genes expressed at the same average abundance, the one with the higher translational efficiency and lower mRNA abundance is predicted to display greater fluctuations in protein concentration and a broader population distribution than the gene with the lower translational efficiency and higher mRNA abundance. Because the average number of protein molecules and the cell volume are kept fixed, this increased gene-expression noise is attributable to increased fluctuations in mRNA abundance, causing increased fluctuations in the rate of protein synthesis.
Although finite-number effects at the protein level do contribute to stochasticity in gene expression, it is generally expected that variability is more strongly linked to changes in the number of mRNAs than of protein molecules. This can be seen by comparing the three simulations in FIG. 2a–c. Although a 100-fold dif-ference in the average number of mRNAs at a fixed pro-tein abundance causes a large change in the fluctuation amplitude and protein distribution (compare FIGS 2a,c), a 100-fold difference in the average number of protein molecules at a fixed mRNA abundance causes only a minor effect (compare FIGS 2b,c). Correspondingly, as illustrated in FIG. 2d, varying the rate of transcription causes a greater change in gene-expression noise than varying the translational efficiency.
Translational bursting and noise strength. The relative deviation from the average, measured as the stand-ard deviation divided by the mean (! = # /N), is the most direct and unambiguous measure of gene-expres-sion noise (FIG. 2d). However, it is sometimes advanta-geous to use a different measure, the noise strength, which is defined by the variance divided by the mean ($ = # 2/N). This measure is used primarily to reveal trends that would otherwise be obscured by the char-acteristic 1/"N scaling of noise arising from finite-number effects21. For example, in FIG. 2d, varying the rate of transcription and the translational efficiency yields qualitatively identical dependencies of the noise on the average protein abundance. On the other hand, measurements of noise strength, as described below, might yield dependencies that differ qualitatively, depending on how the abundance of expressed pro-tein is varied. For example, the translational bursting mechanism predicts that the noise strength should increase linearly with the average protein abundance when translational efficiency is increased, but remain constant when the rate of transcription is increased21 (FIG. 2e). Because of its ability to discriminate between these situations, the noise-strength measure has proved useful as a tool to interpret experimental data.
It is important, however, to note that increased noise strength does not imply that the relative variability (the coefficient of variation !) is also increased. This is clear when comparing FIGS 2d,e, which were obtained from the same data set using the two different noise measures. In fact, for two genes characterized by low and high noise-strength measures, it can only be concluded that the
Figure 3 | Slow promoter transitions and transcriptional bursting. a,b | Time series and histograms were obtained as in FIG. 2. The parameters used were as follows: sA = 50, sR = 5, sP = 0.2, %M = 0.1 and %P = 0.05. Parameters are given as units per min. High numbers of expressed mRNA and protein molecules (~3,000 and ~10,000, respectively) and a large cell volume (200 µm3) were used. a | A decrease in the half-life of the two promoter states from ~4 seconds (FIG. 2) to ~1 minute (kon = koff = 0.7 per min) yields an increase in fluctuation amplitude that is comparable with those obtained following a 100-fold decrease in the number of expressed molecules. b | Promoter-transition rates that correspond to stable promoter states (half-life ~1 hour) yield random transitions between low and high expression states and a bimodal distribution in protein concentration. c | The curves show the predicted dependencies of the noise strength on the average protein abundance with different modes of transcriptional induction. The rate of transcription varies owing to changes in: (mode I) the promoter-deactivation rate (koff) (red curve), (mode II) the promoter-activation rate (kon) (blue curve), and (mode III) the transcription rate from the active promoter state (sA) (green curve). No change is observed when the transitions are fast (yellow curve), regardless of how the average transcription rate is varied. d | The qualitative differences seen in c are less apparent in more traditional plots34 of the noise (measured as !2) against the average protein abundance (plotted as 1/N). Note that the average protein abundance decreases from left to right in this figure. Data in d and c were generated by the equation derived by Raser and O’Shea36 for the model in FIG. 1, with sR = 0. A general form of this equation is given by Paulsson34. Identical dependencies were observed in the model by Blake et al.29.
454 | JUNE 2005 | VOLUME 6 www.nature.com/reviews/genetics
R E V I EWS

Different Regimes
a. Where stochastic is near deterministic, the switching is fast and the transcription/translation rates and cell volume are large.
©!!""#!Nature Publishing Group!
!
0.15
0.10
0.05
0.000 4 8
Time (h)
Abu
ndan
ce (µ
M)
Probability12 16 0.25 0.50
0.15
0.10
0.05
0.000 4 8
Time (h)A
bund
ance
(µM
)Probability
12 16 0.1 0.2
0.15
0.10
0.05
0.000 4 8
Time (h)
Abu
ndan
ce (µ
M)
Probability12 16 0.1 0.2
>10%deviation
a b c
ed
150 200
0.10
250 3503000.05
0.15
0.20
100 100
Average protein number NAverage protein number N
Noi
se s
treng
th
(2 /
N)
Noi
se
(/N
)
200
4
250 3503002
6
8
150
Translational efficiency varied
Transcription rate varied
! " #
"
be large. The simulations discussed below show how molecular-level noise can have pronounced effects on gene expression, and provide insights into factors that contribute to fluctuations in the abundance of expressed protein.
Finite-number effects and translational bursting. System size is an important factor contributing to sto-chasticity in gene expression. The effects of decreas-ing the cell volume are illustrated by the time series shown in FIG. 2b. These were obtained from stochastic and deterministic simulations for which the volume of the cell and the average rate of transcription were decreased 100-fold compared with the simulations in FIG. 2a. This proportional change in parameters does not affect the rate equations, and the average mRNA and protein concentrations remain the same. Comparison of the stochastic simulation results in FIGS 2a,b therefore demonstrates the effects of a smaller system size at fixed concentrations. In FIG. 2b, the pro-tein concentration fluctuates with increased amplitude, causing significant deviations from that predicted by
the deterministic model. This also causes a broader distribution of protein abundance and, therefore, increased population heterogeneity.
These results highlight a fundamental relation-ship between system size and noise50: namely that noise tends to increase when the size of the system is decreased. To understand this relationship, consider a protein that can move freely between the nucleus and cytoplasm. At equilibrium, the nuclear and cytoplasmic concentrations are, on average, equal. However, because the volume of the nucleus is less than that of the cytoplasm, translocation of a protein molecule across the nuclear membrane has a more significant effect on the nuclear concentration than on the concentration in the cytoplasm. If 10 molecules are present in the nucleus and 1,000 in the cytoplasm, the translocation of 1 molecule causes a 10% change in nuclear concentration, but only a 0.1% change in cytoplasmic concentration. This differential effect arises from the different number of molecules in the two compartments and is referred to as the ‘finite-number effect’. In general, when N denotes average
Figure 2 | Finite-number effects and translational bursting. a–c | Time series of protein concentrations generated from deterministic and stochastic simulations (blue and red curves, respectively). Histograms that show the probability that a cell will have a given intracellular protein concentration are also shown (right-hand panels). The parameters used yield protein concentrations in the µM range. The rate of promoter transitions is high (koff = kon = 10 per min). a | Low-amplitude fluctuations with high numbers of expressed mRNA and protein molecules (~3,000 and ~10,000, respectively) and a large cell volume (200 µm3). The other parameter values are sA = 50, sR = 5, sP = 0.2, $M = 0.1 and $P = 0.05 in units per min. b | Increased fluctuations in protein concentration are due to a decrease in the number of expressed mRNA and protein molecules (to ~30 and ~100, respectively). The transcription rates and cell volume were decreased 100-fold compared with a (sA = 0.5 units per min, sR = 0.05 units per min, V = 2 µm3). c | Large fluctuations in protein abundance are due to low mRNA abundance (~30 molecules). Transcription rates were decreased 100-fold compared with a (sA = 0.5 units per min, sR = 0.05 units per min) and the translation rate was increased correspondingly (sP = 20 units per min) to keep the protein abundance at ~10,000 molecules. The difference between b and c is a 100-fold increase in the average number of expressed proteins. Because low mRNA abundance is the dominant source of noise in gene expression (as described in the main text), the fluctuation amplitude and population distribution are almost the same in the two simulations. The ‘bar-code’ above the graph is obtained by drawing a vertical line at each time point where the protein concentration deviates by more than 10% from the average. d,e | The predicted dependencies of the coefficient of variation !, defined as the standard deviation " over the mean N (the noise) (d), and the noise strength #, defined as the variance "2 over the mean N (e), on the average protein abundance when the transcription rate and translational efficiency are increased. The initial parameters are as in part b.
NATURE REVIEWS | GENETICS VOLUME 6 | JUNE 2005 | 453
R E V I EWS
b. Finite-number effects. Volume and transcription/translation rates are decreased.
c. Translational bursting. Transcription rates are decreased while translation rates are increased. Same mean number of proteins as (a) while numbers of
mRNA’s are small and therefore more variable.

Promoter Kinetics
©!!""#!Nature Publishing Group!
!
Average protein abundance (µM)
Noi
se s
treng
th (µ
M–1
)
a b
c d
0 4 8Time (h)
Abu
ndan
ce (µ
M)
Probability Time (h) Probability12 16 0.1 0.2
0.20
0.15
0.10
0.05
0.00
0 4 8
Abu
ndan
ce (µ
M)
12 16 0.1 0.2
0.20
0.15
0.10
0.05
0.00
1/[Average protein abundance] (µM–1)
Noi
se !
2 (%
)
molecular abundance, a decrease in abundance results in a characteristic 1/"N scaling of the noise (! ~1/"N and !2 ~1/N). The finite-number effect is perhaps the most commonly recognized manifestation of molecular-level noise in cellular regulation.
Comparing FIGS 2a,c highlights how finite-number effects at the level of mRNA comprise a second impor-tant factor contributing to gene-expression noise. In FIG. 2c, the rate of transcription is decreased 100-fold (compared with FIG. 2a) without changing the cell volume (in contrast to FIG. 2b). Moreover, the rate of translation is increased 100-fold, such that the average protein concen-tration (and the number of expressed protein molecules) remains the same as in FIG. 2a. This proportional change in transcription and translation rates captures a ‘transla-tional bursting’ mechanism12,20,21, in which the amplitude of fluctuations in protein abundance depends on the
number of proteins produced per mRNA, referred to as the burst parameter21 or translational efficiency23,29,36. According to this mechanism21, for two genes expressed at the same average abundance, the one with the higher translational efficiency and lower mRNA abundance is predicted to display greater fluctuations in protein concentration and a broader population distribution than the gene with the lower translational efficiency and higher mRNA abundance. Because the average number of protein molecules and the cell volume are kept fixed, this increased gene-expression noise is attributable to increased fluctuations in mRNA abundance, causing increased fluctuations in the rate of protein synthesis.
Although finite-number effects at the protein level do contribute to stochasticity in gene expression, it is generally expected that variability is more strongly linked to changes in the number of mRNAs than of protein molecules. This can be seen by comparing the three simulations in FIG. 2a–c. Although a 100-fold dif-ference in the average number of mRNAs at a fixed pro-tein abundance causes a large change in the fluctuation amplitude and protein distribution (compare FIGS 2a,c), a 100-fold difference in the average number of protein molecules at a fixed mRNA abundance causes only a minor effect (compare FIGS 2b,c). Correspondingly, as illustrated in FIG. 2d, varying the rate of transcription causes a greater change in gene-expression noise than varying the translational efficiency.
Translational bursting and noise strength. The relative deviation from the average, measured as the stand-ard deviation divided by the mean (! = # /N), is the most direct and unambiguous measure of gene-expres-sion noise (FIG. 2d). However, it is sometimes advanta-geous to use a different measure, the noise strength, which is defined by the variance divided by the mean ($ = # 2/N). This measure is used primarily to reveal trends that would otherwise be obscured by the char-acteristic 1/"N scaling of noise arising from finite-number effects21. For example, in FIG. 2d, varying the rate of transcription and the translational efficiency yields qualitatively identical dependencies of the noise on the average protein abundance. On the other hand, measurements of noise strength, as described below, might yield dependencies that differ qualitatively, depending on how the abundance of expressed pro-tein is varied. For example, the translational bursting mechanism predicts that the noise strength should increase linearly with the average protein abundance when translational efficiency is increased, but remain constant when the rate of transcription is increased21 (FIG. 2e). Because of its ability to discriminate between these situations, the noise-strength measure has proved useful as a tool to interpret experimental data.
It is important, however, to note that increased noise strength does not imply that the relative variability (the coefficient of variation !) is also increased. This is clear when comparing FIGS 2d,e, which were obtained from the same data set using the two different noise measures. In fact, for two genes characterized by low and high noise-strength measures, it can only be concluded that the
Figure 3 | Slow promoter transitions and transcriptional bursting. a,b | Time series and histograms were obtained as in FIG. 2. The parameters used were as follows: sA = 50, sR = 5, sP = 0.2, %M = 0.1 and %P = 0.05. Parameters are given as units per min. High numbers of expressed mRNA and protein molecules (~3,000 and ~10,000, respectively) and a large cell volume (200 µm3) were used. a | A decrease in the half-life of the two promoter states from ~4 seconds (FIG. 2) to ~1 minute (kon = koff = 0.7 per min) yields an increase in fluctuation amplitude that is comparable with those obtained following a 100-fold decrease in the number of expressed molecules. b | Promoter-transition rates that correspond to stable promoter states (half-life ~1 hour) yield random transitions between low and high expression states and a bimodal distribution in protein concentration. c | The curves show the predicted dependencies of the noise strength on the average protein abundance with different modes of transcriptional induction. The rate of transcription varies owing to changes in: (mode I) the promoter-deactivation rate (koff) (red curve), (mode II) the promoter-activation rate (kon) (blue curve), and (mode III) the transcription rate from the active promoter state (sA) (green curve). No change is observed when the transitions are fast (yellow curve), regardless of how the average transcription rate is varied. d | The qualitative differences seen in c are less apparent in more traditional plots34 of the noise (measured as !2) against the average protein abundance (plotted as 1/N). Note that the average protein abundance decreases from left to right in this figure. Data in d and c were generated by the equation derived by Raser and O’Shea36 for the model in FIG. 1, with sR = 0. A general form of this equation is given by Paulsson34. Identical dependencies were observed in the model by Blake et al.29.
454 | JUNE 2005 | VOLUME 6 www.nature.com/reviews/genetics
R E V I EWS
©!!""#!Nature Publishing Group!
!
0.15
0.10
0.05
0.000 4 8
Time (h)
Abu
ndan
ce (µ
M)
Probability12 16 0.25 0.50
0.15
0.10
0.05
0.000 4 8
Time (h)
Abu
ndan
ce (µ
M)
Probability12 16 0.1 0.2
0.15
0.10
0.05
0.000 4 8
Time (h)
Abu
ndan
ce (µ
M)
Probability12 16 0.1 0.2
>10%deviation
a b c
ed
150 200
0.10
250 3503000.05
0.15
0.20
100 100
Average protein number NAverage protein number N
Noi
se s
treng
th
(2 /
N)
Noi
se
(/N
)
200
4
250 3503002
6
8
150
Translational efficiency varied
Transcription rate varied
! " #
"
be large. The simulations discussed below show how molecular-level noise can have pronounced effects on gene expression, and provide insights into factors that contribute to fluctuations in the abundance of expressed protein.
Finite-number effects and translational bursting. System size is an important factor contributing to sto-chasticity in gene expression. The effects of decreas-ing the cell volume are illustrated by the time series shown in FIG. 2b. These were obtained from stochastic and deterministic simulations for which the volume of the cell and the average rate of transcription were decreased 100-fold compared with the simulations in FIG. 2a. This proportional change in parameters does not affect the rate equations, and the average mRNA and protein concentrations remain the same. Comparison of the stochastic simulation results in FIGS 2a,b therefore demonstrates the effects of a smaller system size at fixed concentrations. In FIG. 2b, the pro-tein concentration fluctuates with increased amplitude, causing significant deviations from that predicted by
the deterministic model. This also causes a broader distribution of protein abundance and, therefore, increased population heterogeneity.
These results highlight a fundamental relation-ship between system size and noise50: namely that noise tends to increase when the size of the system is decreased. To understand this relationship, consider a protein that can move freely between the nucleus and cytoplasm. At equilibrium, the nuclear and cytoplasmic concentrations are, on average, equal. However, because the volume of the nucleus is less than that of the cytoplasm, translocation of a protein molecule across the nuclear membrane has a more significant effect on the nuclear concentration than on the concentration in the cytoplasm. If 10 molecules are present in the nucleus and 1,000 in the cytoplasm, the translocation of 1 molecule causes a 10% change in nuclear concentration, but only a 0.1% change in cytoplasmic concentration. This differential effect arises from the different number of molecules in the two compartments and is referred to as the ‘finite-number effect’. In general, when N denotes average
Figure 2 | Finite-number effects and translational bursting. a–c | Time series of protein concentrations generated from deterministic and stochastic simulations (blue and red curves, respectively). Histograms that show the probability that a cell will have a given intracellular protein concentration are also shown (right-hand panels). The parameters used yield protein concentrations in the µM range. The rate of promoter transitions is high (koff = kon = 10 per min). a | Low-amplitude fluctuations with high numbers of expressed mRNA and protein molecules (~3,000 and ~10,000, respectively) and a large cell volume (200 µm3). The other parameter values are sA = 50, sR = 5, sP = 0.2, $M = 0.1 and $P = 0.05 in units per min. b | Increased fluctuations in protein concentration are due to a decrease in the number of expressed mRNA and protein molecules (to ~30 and ~100, respectively). The transcription rates and cell volume were decreased 100-fold compared with a (sA = 0.5 units per min, sR = 0.05 units per min, V = 2 µm3). c | Large fluctuations in protein abundance are due to low mRNA abundance (~30 molecules). Transcription rates were decreased 100-fold compared with a (sA = 0.5 units per min, sR = 0.05 units per min) and the translation rate was increased correspondingly (sP = 20 units per min) to keep the protein abundance at ~10,000 molecules. The difference between b and c is a 100-fold increase in the average number of expressed proteins. Because low mRNA abundance is the dominant source of noise in gene expression (as described in the main text), the fluctuation amplitude and population distribution are almost the same in the two simulations. The ‘bar-code’ above the graph is obtained by drawing a vertical line at each time point where the protein concentration deviates by more than 10% from the average. d,e | The predicted dependencies of the coefficient of variation !, defined as the standard deviation " over the mean N (the noise) (d), and the noise strength #, defined as the variance "2 over the mean N (e), on the average protein abundance when the transcription rate and translational efficiency are increased. The initial parameters are as in part b.
NATURE REVIEWS | GENETICS VOLUME 6 | JUNE 2005 | 453
R E V I EWS
The first (a) is from before--where stochastic dynamics are near deterministic.
The plot in the middle is a 15 fold decrease in the switching rate.
The last plot is a 60 fold decrease in the switching rate. This is similar to random switching between deterministic models.
Slowing promoter kinetics has a similar effect of transcriptional bursting. We are changing the transcriptional efficiency.
It is speculated that slow promoter kinetics is more common in eukaryotic organisms because of DNA packing, chromatin, etc.
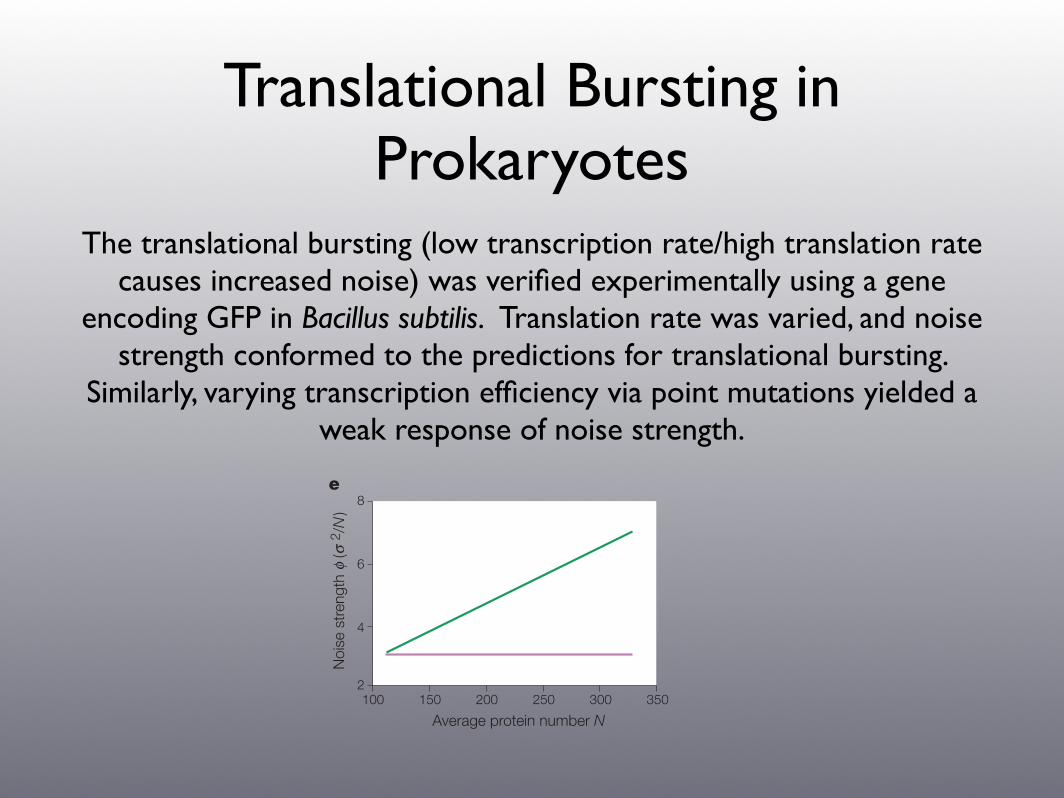
Translational Bursting in Prokaryotes
The translational bursting (low transcription rate/high translation rate causes increased noise) was verified experimentally using a gene
encoding GFP in Bacillus subtilis. Translation rate was varied, and noise strength conformed to the predictions for translational bursting.
Similarly, varying transcription efficiency via point mutations yielded a weak response of noise strength.
©!!""#!Nature Publishing Group!
!
0.15
0.10
0.05
0.000 4 8
Time (h)
Abu
ndan
ce (µ
M)
Probability12 16 0.25 0.50
0.15
0.10
0.05
0.000 4 8
Time (h)
Abu
ndan
ce (µ
M)
Probability12 16 0.1 0.2
0.15
0.10
0.05
0.000 4 8
Time (h)
Abu
ndan
ce (µ
M)
Probability12 16 0.1 0.2
>10%deviation
a b c
ed
150 200
0.10
250 3503000.05
0.15
0.20
100 100
Average protein number NAverage protein number N
Noi
se s
treng
th
(2 /
N)
Noi
se
(/N
)
200
4
250 3503002
6
8
150
Translational efficiency varied
Transcription rate varied
! " #
"
be large. The simulations discussed below show how molecular-level noise can have pronounced effects on gene expression, and provide insights into factors that contribute to fluctuations in the abundance of expressed protein.
Finite-number effects and translational bursting. System size is an important factor contributing to sto-chasticity in gene expression. The effects of decreas-ing the cell volume are illustrated by the time series shown in FIG. 2b. These were obtained from stochastic and deterministic simulations for which the volume of the cell and the average rate of transcription were decreased 100-fold compared with the simulations in FIG. 2a. This proportional change in parameters does not affect the rate equations, and the average mRNA and protein concentrations remain the same. Comparison of the stochastic simulation results in FIGS 2a,b therefore demonstrates the effects of a smaller system size at fixed concentrations. In FIG. 2b, the pro-tein concentration fluctuates with increased amplitude, causing significant deviations from that predicted by
the deterministic model. This also causes a broader distribution of protein abundance and, therefore, increased population heterogeneity.
These results highlight a fundamental relation-ship between system size and noise50: namely that noise tends to increase when the size of the system is decreased. To understand this relationship, consider a protein that can move freely between the nucleus and cytoplasm. At equilibrium, the nuclear and cytoplasmic concentrations are, on average, equal. However, because the volume of the nucleus is less than that of the cytoplasm, translocation of a protein molecule across the nuclear membrane has a more significant effect on the nuclear concentration than on the concentration in the cytoplasm. If 10 molecules are present in the nucleus and 1,000 in the cytoplasm, the translocation of 1 molecule causes a 10% change in nuclear concentration, but only a 0.1% change in cytoplasmic concentration. This differential effect arises from the different number of molecules in the two compartments and is referred to as the ‘finite-number effect’. In general, when N denotes average
Figure 2 | Finite-number effects and translational bursting. a–c | Time series of protein concentrations generated from deterministic and stochastic simulations (blue and red curves, respectively). Histograms that show the probability that a cell will have a given intracellular protein concentration are also shown (right-hand panels). The parameters used yield protein concentrations in the µM range. The rate of promoter transitions is high (koff = kon = 10 per min). a | Low-amplitude fluctuations with high numbers of expressed mRNA and protein molecules (~3,000 and ~10,000, respectively) and a large cell volume (200 µm3). The other parameter values are sA = 50, sR = 5, sP = 0.2, $M = 0.1 and $P = 0.05 in units per min. b | Increased fluctuations in protein concentration are due to a decrease in the number of expressed mRNA and protein molecules (to ~30 and ~100, respectively). The transcription rates and cell volume were decreased 100-fold compared with a (sA = 0.5 units per min, sR = 0.05 units per min, V = 2 µm3). c | Large fluctuations in protein abundance are due to low mRNA abundance (~30 molecules). Transcription rates were decreased 100-fold compared with a (sA = 0.5 units per min, sR = 0.05 units per min) and the translation rate was increased correspondingly (sP = 20 units per min) to keep the protein abundance at ~10,000 molecules. The difference between b and c is a 100-fold increase in the average number of expressed proteins. Because low mRNA abundance is the dominant source of noise in gene expression (as described in the main text), the fluctuation amplitude and population distribution are almost the same in the two simulations. The ‘bar-code’ above the graph is obtained by drawing a vertical line at each time point where the protein concentration deviates by more than 10% from the average. d,e | The predicted dependencies of the coefficient of variation !, defined as the standard deviation " over the mean N (the noise) (d), and the noise strength #, defined as the variance "2 over the mean N (e), on the average protein abundance when the transcription rate and translational efficiency are increased. The initial parameters are as in part b.
NATURE REVIEWS | GENETICS VOLUME 6 | JUNE 2005 | 453
R E V I EWS

Translational/Transcriptional Bursting in Eukaryotes
The translational bursting hypothesis was also confirmed for Saccharomyces cerevisiael.
Using mutations and a two reporter assay, the average protien number was increased and decreased by controlling rate of activation and repression of the
promoter. Noise strength vs average protein confirmed the prediction
©!!""#!Nature Publishing Group!
!
Average protein abundance (µM)
Noi
se s
treng
th (µ
M–1
)
a b
c d
0 4 8Time (h)
Abu
ndan
ce (µ
M)
Probability Time (h) Probability12 16 0.1 0.2
0.20
0.15
0.10
0.05
0.00
0 4 8
Abu
ndan
ce (µ
M)
12 16 0.1 0.2
0.20
0.15
0.10
0.05
0.00
1/[Average protein abundance] (µM–1)N
oise
!2
(%)
molecular abundance, a decrease in abundance results in a characteristic 1/"N scaling of the noise (! ~1/"N and !2 ~1/N). The finite-number effect is perhaps the most commonly recognized manifestation of molecular-level noise in cellular regulation.
Comparing FIGS 2a,c highlights how finite-number effects at the level of mRNA comprise a second impor-tant factor contributing to gene-expression noise. In FIG. 2c, the rate of transcription is decreased 100-fold (compared with FIG. 2a) without changing the cell volume (in contrast to FIG. 2b). Moreover, the rate of translation is increased 100-fold, such that the average protein concen-tration (and the number of expressed protein molecules) remains the same as in FIG. 2a. This proportional change in transcription and translation rates captures a ‘transla-tional bursting’ mechanism12,20,21, in which the amplitude of fluctuations in protein abundance depends on the
number of proteins produced per mRNA, referred to as the burst parameter21 or translational efficiency23,29,36. According to this mechanism21, for two genes expressed at the same average abundance, the one with the higher translational efficiency and lower mRNA abundance is predicted to display greater fluctuations in protein concentration and a broader population distribution than the gene with the lower translational efficiency and higher mRNA abundance. Because the average number of protein molecules and the cell volume are kept fixed, this increased gene-expression noise is attributable to increased fluctuations in mRNA abundance, causing increased fluctuations in the rate of protein synthesis.
Although finite-number effects at the protein level do contribute to stochasticity in gene expression, it is generally expected that variability is more strongly linked to changes in the number of mRNAs than of protein molecules. This can be seen by comparing the three simulations in FIG. 2a–c. Although a 100-fold dif-ference in the average number of mRNAs at a fixed pro-tein abundance causes a large change in the fluctuation amplitude and protein distribution (compare FIGS 2a,c), a 100-fold difference in the average number of protein molecules at a fixed mRNA abundance causes only a minor effect (compare FIGS 2b,c). Correspondingly, as illustrated in FIG. 2d, varying the rate of transcription causes a greater change in gene-expression noise than varying the translational efficiency.
Translational bursting and noise strength. The relative deviation from the average, measured as the stand-ard deviation divided by the mean (! = # /N), is the most direct and unambiguous measure of gene-expres-sion noise (FIG. 2d). However, it is sometimes advanta-geous to use a different measure, the noise strength, which is defined by the variance divided by the mean ($ = # 2/N). This measure is used primarily to reveal trends that would otherwise be obscured by the char-acteristic 1/"N scaling of noise arising from finite-number effects21. For example, in FIG. 2d, varying the rate of transcription and the translational efficiency yields qualitatively identical dependencies of the noise on the average protein abundance. On the other hand, measurements of noise strength, as described below, might yield dependencies that differ qualitatively, depending on how the abundance of expressed pro-tein is varied. For example, the translational bursting mechanism predicts that the noise strength should increase linearly with the average protein abundance when translational efficiency is increased, but remain constant when the rate of transcription is increased21 (FIG. 2e). Because of its ability to discriminate between these situations, the noise-strength measure has proved useful as a tool to interpret experimental data.
It is important, however, to note that increased noise strength does not imply that the relative variability (the coefficient of variation !) is also increased. This is clear when comparing FIGS 2d,e, which were obtained from the same data set using the two different noise measures. In fact, for two genes characterized by low and high noise-strength measures, it can only be concluded that the
Figure 3 | Slow promoter transitions and transcriptional bursting. a,b | Time series and histograms were obtained as in FIG. 2. The parameters used were as follows: sA = 50, sR = 5, sP = 0.2, %M = 0.1 and %P = 0.05. Parameters are given as units per min. High numbers of expressed mRNA and protein molecules (~3,000 and ~10,000, respectively) and a large cell volume (200 µm3) were used. a | A decrease in the half-life of the two promoter states from ~4 seconds (FIG. 2) to ~1 minute (kon = koff = 0.7 per min) yields an increase in fluctuation amplitude that is comparable with those obtained following a 100-fold decrease in the number of expressed molecules. b | Promoter-transition rates that correspond to stable promoter states (half-life ~1 hour) yield random transitions between low and high expression states and a bimodal distribution in protein concentration. c | The curves show the predicted dependencies of the noise strength on the average protein abundance with different modes of transcriptional induction. The rate of transcription varies owing to changes in: (mode I) the promoter-deactivation rate (koff) (red curve), (mode II) the promoter-activation rate (kon) (blue curve), and (mode III) the transcription rate from the active promoter state (sA) (green curve). No change is observed when the transitions are fast (yellow curve), regardless of how the average transcription rate is varied. d | The qualitative differences seen in c are less apparent in more traditional plots34 of the noise (measured as !2) against the average protein abundance (plotted as 1/N). Note that the average protein abundance decreases from left to right in this figure. Data in d and c were generated by the equation derived by Raser and O’Shea36 for the model in FIG. 1, with sR = 0. A general form of this equation is given by Paulsson34. Identical dependencies were observed in the model by Blake et al.29.
454 | JUNE 2005 | VOLUME 6 www.nature.com/reviews/genetics
R E V I EWS

Intrinsic/Extrensic Noise
• How much of the noise is inherent in these random reactions(intrinsic), and how much is due to the changing environment (extrensic)?
• Experiments with virtually identical fluorescent protein products and expressed from two identical promoters within the same prokaryotic cell.
noise was much larger in the presence of theLacI plasmid because of reduced transcriptionrate, but it fell substantially as IPTG wasadded. !int is expected to decrease as !int
2 "(c1/m) # c2, where m is the fluorescenceintensity of the cell (assumed to be propor-tional to the average number of transcripts),and c1 and c2 are constants given by themicroscopic parameters (7). This form fits
the data, with strain D22 exhibiting higheramounts of intrinsic noise than M22 at alllevels of expression (Fig. 3, B and C).
The extrinsic noise, !ext, behaves very dif-ferently as a function of IPTG concentration.Whereas !int decreases monotonically, !ext dis-plays a maximum at intermediate rates of tran-scription. As a result, total cell-cell variability(!tot) does not uniquely determine intrinsic
noise. The presence of a maximum in !ext maybe explained as a result of cell-cell variation inthe concentration of LacI (13). Interestingly,!ext is substantially smaller in cells carrying achromosomal copy of lacI than it is in cellscarrying a plasmid-borne copy of the gene (atcomparable expression levels; see Table 1 andFig. 3). This is consistent with greater variabil-ity in copy number for the plasmid-borne lacI
Table 1. Measurements of noise in selected strains.
Modification* Strain† Intensity‡ Intrinsic noise, !int§¶($10%2)
Extrinsic noise, !ext§($10%2)
Total noise, !tot§($10%2)
Constitutive (lacI%) M22 1 5.5 (5.1–6) 5.4 (4.8–5.9) 7.7 (7.4–8.1)JM22 0.88 5.0 (4.6–5.4) 6.1 (5.5–6.7) 7.9 (7.4–8.4)MRR 1.21 5.1 (4.7–5.4) 5.6 (5.1–6.2) 7.6 (7.2–7.9)
Wild type (lacI#) MG22 0.057 19 (18–21) 32 (29–35) 37 (35–40)RP22 0.030 25 (22–27) 33 (30–35) 41 (39–43)
Wild type (LacI#), #IPTG RP22 1.00 6.3 (5.8–6.9) 9.8 (9.0–11) 11.7 (11–12.3)lacI%, Repressilator M22 0.18 12 (11–13) 42 (37–45) 43 (39–47)
MRR 0.16 11 (9.8–12) 57 (52–62) 58 (53–63)&recA, lacI% D22 0.81 10.5 (9.6–11.4) 4.6 (2.8–5.8) 11.4 (10.8–12.1)
M22&A 0.99 13 (12–15) 2.4 (0–5.3) 13.6 (12.8–14.5)JM22&A 0.92 14 (11–17) 2.5 (0–7.3) 15 (12–16.4)
&recA, lacI# #IPTG RP22&A 1.22 17 (15–20) 12 (8.8–14) 21 (20–22)
*Repressilator refers to SpectR version of plasmid in (16); #IPTG indicates growth in the presence of 2 mM IPTG. †The following strain backgrounds were used: MC4100 (22) forM22, MRR, and M22&A; DY331 (23) for D22; JM2.300 (E. coli Genetic Stock Center) for JM22 and JM22&A; MG1655 for MG22; and RP437 (24) for RP22 and RP22&A. Each straincontains twin PLlacO1 promoters (9), except MRR, which contains twin 'PR promoters (25). ‡Mean CFP value, relative to the intensity of strain M22. §95% confidence limitsare in parentheses; see (7). ¶CFP and YFP are stable in E. coli (26); effective noise levels for unstable proteins would be greater (for example, a doubling of noise level for a proteinhalf-life of (0.3 cell cycle) (8).
Fig. 3. Quantification of noise. (A) Plot of fluorescence in two strains: onequiet (M22) and one noisy (D22). Each point represents the mean fluo-rescence intensities from one cell. Spread of points perpendicular to thediagonal line on which CFP and YFP intensities are equal corresponds tointrinsic noise, whereas spread parallel to this line is increased by extrinsicnoise. (B) Noise versus rate of transcription in strain M22 (recA#, lacI–),with LacI supplied by plasmid pREP4 (7). Fluorescence levels (x axis) arepopulation means. The rightmost point represents the strain withoutpREP4 and therefore is fully induced; its value, set to 1.0, was used tonormalize all fluorescence intensities. IPTG (0 to 2 mM) was added tocultures and !tot, !int, and !ext were measured. Error bars are 95%confidence intervals. Dashed line fits !int
2 " (c1/m) # c2, where m )fluorescence intensity (x axis), c1 ) 7 $ 10%4, and c2 ) 3 $ 10%3. (C)Noise versus induction level in recA–lacI– strain D22, containing plasmidpREP4. All notations are as in (B). In the fit, c1 ) 5 $ 10%4 and c2 ) 1 $10%2.
R E P O R T S
www.sciencemag.org SCIENCE VOL 297 16 AUGUST 2002 1185
Feedback
©!!""#!Nature Publishing Group!
!
P1
S1
I1
p1
P2
S2
I2
rep
P1
S1
I1
P2
a b
d e
c
Regulatory geneReporter gene
Regulatory gene
Cel
l cou
nts
Low input noise
High input noise
Regulator abundance
Cel
l cou
nts
Weak feedback
Strong feedback
Rep
orte
r abu
ndan
ce
Highlysensitive
Inducing signal S2 Reporter abundance
Ste
p 2
Ste
p 1
gene-intrinsic and extrinsic noise36,62 have further demonstrated that there are factors extrinsic to the bio-chemical processes of gene expression that contribute significantly to fluctuations and population heterogene-ity in protein abundance. One such factor is variability in gene-regulatory signals. It is therefore also important to investigate gene-expression noise in the context of gene-regulatory networks, as we discuss below.
Stochasticity in gene networksGenes and proteins are organized into extensive networks that allow cells to respond and adapt to their environment. The complexity of these systems can hinder attempts to study how the architecture of regulatory networks enables cells to deal with or take advantage of unreliable, fluctuating signals. Here, we focus on engineered genetic cascades29,63,64 and synthetic gene networks that involve negative and positive auto-regulation65–67. Studies of these networks have allowed more direct investigations of how stochastic effects at different parts of a network affect expression outcomes. Further insights can be gained from studies of synthetic gene networks that are based on different design strategies; these designs are not discussed in detail here, but an overview is given in BOX 3.
Stochastic effects in gene-regulatory cascades. To study noise propagation, Blake et al.29 engineered a transcriptional cascade with two regulatory steps in S. cerevisiae (FIG. 5a). In this system, the expression of
a target reporter gene depends on the activity of an upstream transcriptional regulator. The level of noise in the expression of the transcriptional regulator and its average activity can be controlled independently to study the effects of noise in a gene-regulatory cascade. As the level of transcriptional induction was increased, the population-averaged expression level was observed to follow a non-linear dose-response curve, with the greatest change occurring at intermediate levels of induction (FIG. 5b). Increased noise in the transcriptional regulatory signal increased the population heterogene-ity in this range, but had little or no effect at high and low induction levels. This is perhaps intuitive, as the observed population-averaged dose-response curve (FIG. 5b) predicts that the rate of transcription should be most sensitive to variations in the regulatory signal at intermediate induction levels.
Interestingly, in the same study, a high level of regulatory noise gave rise to population distributions with distinctly separated high and low expression states (a binary response)29. By contrast, a low level of noise in the regulatory input yielded unimodal distributions, regardless of the induction level. This indicates that the binary response is directly linked to variability in the level of transcriptional regulatory signal received by the downstream promoter. Indeed, as illustrated in FIG. 5c, a steep dose-response curve for the regulatory input, coupled with large differences among cells in the regulatory signal, is sufficient to generate bimodal population distributions and all-or-nothing responses in single cells68.
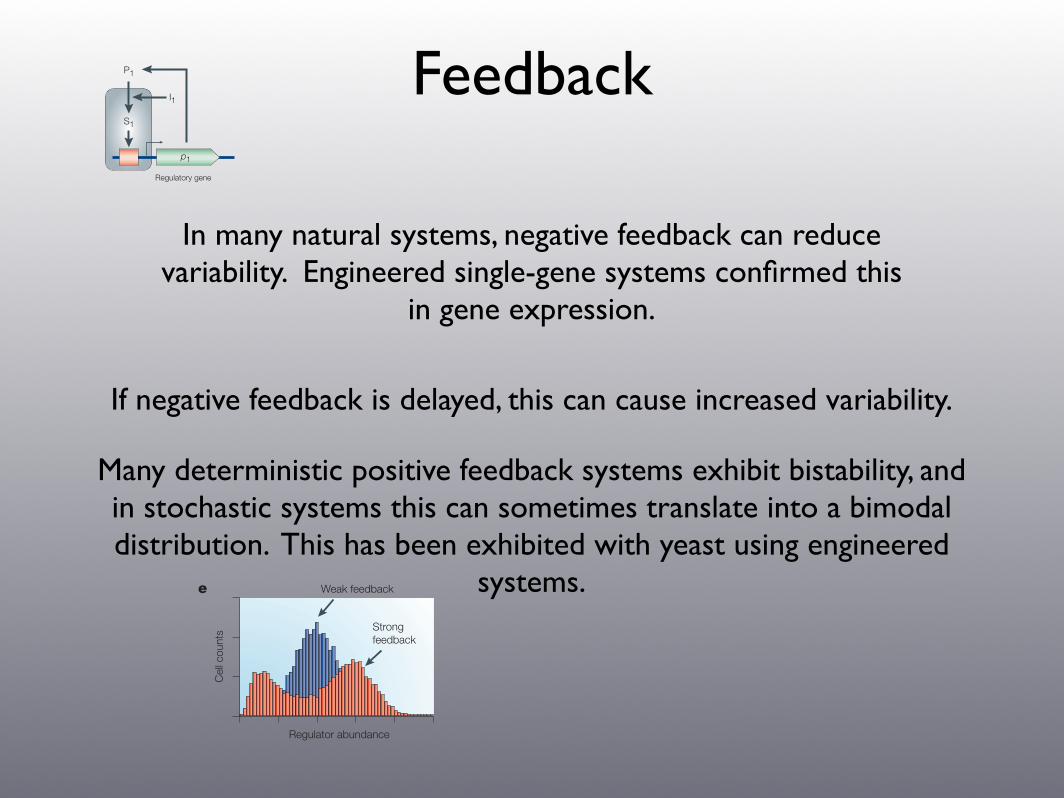
Figure 5 | Noise in gene networks. a | This shows a transcriptional cascade that has two regulatory steps. P1 and P2 represent regulatory proteins, I1 and I2 are their inducers, and S1 and S2 represent the effective activities of the regulatory proteins. b | The population-averaged dose response to transcriptional induction by S2 is shown. The highest signal sensitivity occurs at intermediate values of the input signal where the dose-response curve has the highest slope. c | Increased variability in the S2 signal in the region of high signal sensitivity causes a transition from a unimodal to a bimodal population distribution. The population histograms were obtained by simulations of the model in FIG. 1, with the noisy signal S2 having a non-linear effect on the rate of promoter deactivation. Similar effects are observed experimentally29. d | An auto-regulatory single-gene network is shown. e | The effects of varying the strength of the positive-feedback loop in d are shown. A unimodal population distribution that is obtained in the presence of weak feedback becomes bimodal when the strength of the feedback is increased. The histograms were obtained from simulations of the model in FIG. 1, with the gene product P1 acting as a noisy signal that affects the rate of promoter activation. Similar effects have been observed experimentally66,67.
NATURE REVIEWS | GENETICS VOLUME 6 | JUNE 2005 | 459
R E V I EWS
In many natural systems, negative feedback can reduce variability. Engineered single-gene systems confirmed this
in gene expression.
If negative feedback is delayed, this can cause increased variability.
Many deterministic positive feedback systems exhibit bistability, and in stochastic systems this can sometimes translate into a bimodal distribution. This has been exhibited with yeast using engineered
systems.
©!!""#!Nature Publishing Group!
!
P1
S1
I1
p1
P2
S2
I2
rep
P1
S1
I1
P2
a b
d e
c
Regulatory geneReporter gene
Regulatory gene
Cel
l cou
nts
Low input noise
High input noise
Regulator abundance
Cel
l cou
nts
Weak feedback
Strong feedback
Rep
orte
r abu
ndan
ce
Highlysensitive
Inducing signal S2 Reporter abundance
Ste
p 2
Ste
p 1
gene-intrinsic and extrinsic noise36,62 have further demonstrated that there are factors extrinsic to the bio-chemical processes of gene expression that contribute significantly to fluctuations and population heterogene-ity in protein abundance. One such factor is variability in gene-regulatory signals. It is therefore also important to investigate gene-expression noise in the context of gene-regulatory networks, as we discuss below.
Stochasticity in gene networksGenes and proteins are organized into extensive networks that allow cells to respond and adapt to their environment. The complexity of these systems can hinder attempts to study how the architecture of regulatory networks enables cells to deal with or take advantage of unreliable, fluctuating signals. Here, we focus on engineered genetic cascades29,63,64 and synthetic gene networks that involve negative and positive auto-regulation65–67. Studies of these networks have allowed more direct investigations of how stochastic effects at different parts of a network affect expression outcomes. Further insights can be gained from studies of synthetic gene networks that are based on different design strategies; these designs are not discussed in detail here, but an overview is given in BOX 3.
Stochastic effects in gene-regulatory cascades. To study noise propagation, Blake et al.29 engineered a transcriptional cascade with two regulatory steps in S. cerevisiae (FIG. 5a). In this system, the expression of
a target reporter gene depends on the activity of an upstream transcriptional regulator. The level of noise in the expression of the transcriptional regulator and its average activity can be controlled independently to study the effects of noise in a gene-regulatory cascade. As the level of transcriptional induction was increased, the population-averaged expression level was observed to follow a non-linear dose-response curve, with the greatest change occurring at intermediate levels of induction (FIG. 5b). Increased noise in the transcriptional regulatory signal increased the population heterogene-ity in this range, but had little or no effect at high and low induction levels. This is perhaps intuitive, as the observed population-averaged dose-response curve (FIG. 5b) predicts that the rate of transcription should be most sensitive to variations in the regulatory signal at intermediate induction levels.
Interestingly, in the same study, a high level of regulatory noise gave rise to population distributions with distinctly separated high and low expression states (a binary response)29. By contrast, a low level of noise in the regulatory input yielded unimodal distributions, regardless of the induction level. This indicates that the binary response is directly linked to variability in the level of transcriptional regulatory signal received by the downstream promoter. Indeed, as illustrated in FIG. 5c, a steep dose-response curve for the regulatory input, coupled with large differences among cells in the regulatory signal, is sufficient to generate bimodal population distributions and all-or-nothing responses in single cells68.
Figure 5 | Noise in gene networks. a | This shows a transcriptional cascade that has two regulatory steps. P1 and P2 represent regulatory proteins, I1 and I2 are their inducers, and S1 and S2 represent the effective activities of the regulatory proteins. b | The population-averaged dose response to transcriptional induction by S2 is shown. The highest signal sensitivity occurs at intermediate values of the input signal where the dose-response curve has the highest slope. c | Increased variability in the S2 signal in the region of high signal sensitivity causes a transition from a unimodal to a bimodal population distribution. The population histograms were obtained by simulations of the model in FIG. 1, with the noisy signal S2 having a non-linear effect on the rate of promoter deactivation. Similar effects are observed experimentally29. d | An auto-regulatory single-gene network is shown. e | The effects of varying the strength of the positive-feedback loop in d are shown. A unimodal population distribution that is obtained in the presence of weak feedback becomes bimodal when the strength of the feedback is increased. The histograms were obtained from simulations of the model in FIG. 1, with the gene product P1 acting as a noisy signal that affects the rate of promoter activation. Similar effects have been observed experimentally66,67.
NATURE REVIEWS | GENETICS VOLUME 6 | JUNE 2005 | 459
R E V I EWS

References
•Kaern, M., W. Blake, T.C. Elston and J. Collins. 2005. Stochasticity in gene expression. Nat. Gen., 6 :451-464.
•Kepler, T and T. Elston. 2001. Stochasticity in transcriptional regulation: origins, consequences, and mathematical representations. Biophys. J. 81: 3116-3136
• Swain, P. S., Elowitz, M. B. & Siggia, E. D. Intrinsic andextrinsic contributions to stochasticity in gene expression. Proc. Natl Acad. Sci. USA 99, 12795–12800 (2002).
Related Documents
![Dialectica aplicado a_la_educacon[1]](https://static.cupdf.com/doc/110x72/55af15791a28ab8d278b4623/dialectica-aplicado-alaeducacon1.jpg)