Welcome message from author
This document is posted to help you gain knowledge. Please leave a comment to let me know what you think about it! Share it to your friends and learn new things together.
Transcript
i
Report No. DOT HS 810 614
2. Government Accession No. 3. Recipient’s Catalog No.
4. Title and Subtitle National Evaluation of Graduated Driver Licensing Programs
5. Report Date June 2006
6. Performing Organization Code n/a
7. Author(s) Susan P. Baker, M.P.H.; Li-Hui Chen, M.S., Ph.D.; and
Guohua Li, M.D, Dr.P.H.
8. Performing Organization Report No n/a
9. Performing Organization Name and Address Johns Hopkins School of Public Health Center for Injury Research and Policy 624 N. Broadway, Baltimore MD 21205
10. Work Unit No.
11. Contract or Grant No. DTNH22-97-H-05278
12. Sponsoring Agency Name and Address National Highway Traffic Safety Administration 400 7th St., SW, Washington DC 20590
13. Type of Report and Period Covered NHTSA Technical Report
. 14. Sponsoring Agency Code
15. Supplementary Notes Paul J. Tremont, PhD, was the Contracting Officer’s Technical Representative (COTR) for this project. 16. Abstract Context. Implementation of Graduated Driver Licensing (GDL) programs is associated with lower fatal crash involvement rates of young drivers, but the contribution of specific components of GDL programs is not known. Objective. To determine which types of GDL programs are associated with reductions in fatal crashes involving 16-year-old drivers. Design, Setting, and Population. A retrospective study of involvement of 16-year-old drivers in fatal crashes in the United States from 1994 through 2004 using data obtained from the Fatality Analysis Reporting System (FARS) and the US Census Bureau. The association of various GDL programs with fatal crashes involving 16-year-old drivers was examined and compared to results for 20-24 and 25-29-year-old drivers. Analysis was based on the total number of quarters of the year in all States (“State-quarters”) with or without specific GDL programs, excluding the four quarters before and the four quarters after a law was changed. Main Outcome Measures. Incidence Rate Ratio (IRR) for fatal crashes involving 16-year-old drivers in relation to GDL programs. Results. Overall, State-quarters having GDL programs (combined results, including weaker programs) were associated with an 11% lower [IRR 0.89, 95% confidence interval (CI) 0.80, 0.99)] fatal crash involvement rate for16-year-old drivers, than State-quarters without GDL programs. When State-quarters without any of the 7 GDL components are compared to State-quarters with GDL programs, only those programs having five or more components experienced a significant reduction (18%-21%) in fatal crash involvement rates for 16-year-old drivers. Reductions of 16% to 21% occurred with programs that included age requirements plus: 3 or more months of waiting before the intermediate stage, nighttime driving restriction, and either supervised driving of at least 30 hours or passenger restriction. The finding that GDL is associated with reductions in fatal crash involvements is strengthened by the observation that drivers aged 20-24 or 25-29 years did not experience similar reductions in fatal crash involvement rates. Conclusion. The most comprehensive GDL programs are associated with reductions of about 20% in 16-year-old drivers’ fatal crash involvement rates. Based on existing programs that were sufficiently common for analysis, the greatest benefit appears to be in programs that include age requirements plus: 3 or more months of waiting before the intermediate stage, nighttime driving restriction, and either supervised driving of at least 30 hours or a passenger restriction. 17. Key Words: GDL, Teenage driver, Evaluation, Crash
18. Distribution Statement This report is available from the National Technical Information Service, Springfield, VA 22161
19. Security Classif. (of this report) Unclassified
20. Security Classif. (of this page) Unclassified
21. No. Pages 22. Price

ii
iii
TABLE OF CONTENTS
EXECUTIVE SUMMARY .............................................................................................. v I. INTRODUCTION...................................................................................................... 1 II. METHOD .............................................................................................................. 2
A. Data............................................................................................................................ 2
B. Analysis ..................................................................................................................... 3
III. RESULTS .............................................................................................................. 5 IV. DISCUSSION ........................................................................................................ 9
A. National Reductions................................................................................................ 9
B. Comparing Specific Programs .............................................................................. 10
C. Limitations ............................................................................................................ 11
V. CONCLUSION.......................................................................................................... 12 REFERENCES................................................................................................................ 13 Appendix A: List of All States Used in the Analyses ................................................... 15
iv
LIST OF FIGURE AND TABLES Figure 1. Percent Change in Fatal Crash Involvement Rate in Relation to Number of GDL Program Components, Compared to State-Quarters With None of the Seven Components in Table 1. 1994-2004. ....................................................................................................................7 Table 1. Definition of GDL Components Studied .....................................................................3 Table 2. Percentages of State-Quarters with Specified GDL Restrictions, and 16-Year-Old Drivers Involved in Fatal Crashes in Relation to GDL Programs, United States, 1994-2004. ..................................................................................................................................6 Table 3. Incidence Rate Ratios (IRRs) and 95 Percent Confidence Intervals (CIs) for Fatal Crashes Involving 16-Year-Old Drivers in Relation to GDL Program Components, Excluding Age Requirements, Compared to Older Drivers in the Same States. United States, 1994-2004........................................................................................................................8
v
EXECUTIVE SUMMARY Background In the United States in 2004, 16-year-old drivers were involved in 957 fatal crashes that killed 1,111 people. Graduated Driver Licensing (GDL) is an increasingly popular approach to reducing the excess risk of motor vehicle crashes for novice drivers. This study was undertaken to examine the fatal crash involvement rates of 16-year-old drivers in relation to implementation of GDL programs in the various States. GDL allows novice drivers to build experience incrementally before they are exposed to more hazardous driving situations. The first phase of GDL is a learner’s period with supervised training. This is followed by an intermediate period where unsupervised driving is limited to less hazardous situations, and a final stage without restrictions. By the end of 2004, 41 States and the District of Columbia had GDL programs that included all three stages, although these programs vary substantially in the number and strictness of the restrictive provisions. To date, several individual GDL programs have been evaluated, and a national evaluation of GDL effectiveness has been conducted; however, a comparison of GDL programs with differing components has not previously been reported. Approach An investigation was undertaken to:
1. Assess the overall effectiveness of GDL programs across the United States in
reducing fatal crashes involving 16-year-old drivers, and 2. Compare the safety benefits of GDL programs with different components.
Data on fatal crashes were obtained from the Fatality Analysis Reporting System (FARS) of the National Highway Traffic Safety Administration and population data were obtained from the U.S. Census Bureau. The research analyzed the changes in fatal crash involvement rates of 16-year-old drivers in relation to the characteristics of the various GDL programs, which differ among the States. The research focused on 43 of the 48 contiguous States, using data for 1994 through 2004. Method Incidence Rate Ratios (IRRs) of fatal motor vehicle crashes involving 16-year-old drivers from 1994 through 2004 were calculated for each type of GDL program, adjusted for State and year. Results for 16-year-olds were compared to rates for drivers ages 20-24 and 25-29 in order to minimize the effects of time trends and changes in the driving environment and policies that were not related to GDL. Analysis was based on the total number of quarters of the year in all States (“State-quarters”) with or without specific GDL programs, excluding the four quarters before and the four quarters after enactment of any program.
vi
Results 1. When State-quarters where GDL programs were implemented are compared to State-quarters where they were not implemented, those State-quarters with GDL programs had an 11 percent lower fatal crash rate involving 16-year-olds. This overall reduction reflects the combined results for all States, some of which have relatively weak GDL requirements, and therefore underestimates the impact of stronger programs. 2. Fatal crash involvement rates of 16-year-old drivers were 18 percent lower in State-quarters with any five of the seven GDL components and 21 percent lower for State-quarters with 6 or 7 components compared to State-quarters without any of the seven components. 3. Compared to programs without any of the seven components, fatal crash involvement rates were 16 percent to 21 percent lower in programs that included age requirements plus: 3 or more months of waiting before the intermediate stage, nighttime driving restriction, and either supervised driving of at least 30 hours or passenger restriction. 4. Drivers ages 20-24 or 25-29 years did not experience similar reductions in fatal crash involvement rates in the State-quarters with GDL programs compared to State-quarters without GDL programs. This absence of an observed effect on drivers not exposed to GDL increases confidence that the reductions observed in 16-year-old fatal crashes are attributable to GDL.
Conclusions The most comprehensive GDL programs are associated with fatal crash involvement rates for 16-year-old drivers that are about 20 percent lower than programs without any of the seven GDL components. Based on existing programs that were sufficiently common for analysis, the greatest benefit appears to be associated with programs that include age requirements and:
• a waiting period of at least three months before the intermediate stage, • a restriction on nighttime driving, and either • thirty or more hours of supervised driving or • a restriction on carrying passengers.

1
I. INTRODUCTION In the United States in 2004, 16-year-old drivers were involved in 957 fatal crashes that killed 1,111 people. Sixteen-year-old drivers have an especially high risk of crash involvement. Per mile driven, their crash rate is almost 10 times the rate for drivers ages 30-59 and more than twice the rate of 18- to 19-year-old drivers.1 Graduated Driver Licensing (GDL) is one increasingly popular approach to managing the serious problem of high rates of fatal and nonfatal crashes among beginning drivers. GDL allows beginning drivers to build experience incrementally before they are exposed to more hazardous driving situations. It achieves this by increasing licensing age, requiring more supervision in the initial phases of driving, and reducing exposure to high-risk situations such as carrying teen passengers and nighttime driving. The first phase of GDL is a learner’s period with supervised training. This is followed by an intermediate period where unsupervised driving is limited to less hazardous situations and a final stage without restrictions. By the end of 2004, 41 States and the District of Columbia had instituted some form of GDL that included an intermediate stage. Prior evaluation studies of GDL programs comparing rates before and after GDL implementation in individual States have reported reductions in fatal crash rates of novice drivers that ranged from 11 percent to 32 percent.2-10 More recently, Dee et al.11 reported a 6-percent reduction nationally in crash fatalities of 15- to 17-year-olds associated with GDL programs. The greatest reductions (19%) were in States with programs ranked “good” by the Insurance Institute for Highway Safety using a system based on the presence and strength of components considered as desirable.11 12 However, the type of analysis used by Dee et al. does not make it possible to compare programs with different combinations of program components. Other prior evaluations have not taken advantage of the unique environment of the United States that makes it possible to compare programs among States, with attention to their specific components. State GDL programs differ with respect to which components are included and in the specific requirements of each component, such as the required number of hours of supervised driving. However, evaluation of the individual components of GDL separately is not possible because in most States several components have been introduced or changed simultaneously, and their effects cannot be separated. Although a study of the effectiveness of individual GDL components was not possible, it is still possible to determine empirically which types of GDL programs are associated with the greatest reduction in crashes of 16-year-old drivers. A nationwide study was therefore undertaken to assess the overall impact of GDL programs on fatal crashes of 16-year-old drivers, and to determine what types of GDL programs are associated with lower fatal crash involvement rates for 16-year old drivers. The research, based on 43 of the 48 contiguous States and using data for 1994 through 2004, analyzed changes in fatal crash involvement rates of 16-year-old drivers in relation to the characteristics of the various GDL programs, which differ among the States. Appendix A presents a list of all States used in the analyses.

2
II. METHOD A. Data Data on fatal crashes and population were obtained from two Federal sources: the Fatality Analysis Reporting System (FARS) of the National Highway Traffic Safety Administration (NHTSA) 13 and the U.S. Census Bureau.14 FARS is a census of all fatal traffic crashes within the United States that involve a motor vehicle traveling on a public road and result in a death within 30 days of the crash. The numbers of drivers age 16 and ages 20-29 involved in fatal crashes in each State for each month from 1994 through 2004 were obtained from FARS. Cases where two 16-year-old drivers were involved in the same crash were counted as two events. Midyear population estimates for each State from 1994 to 2004 were obtained from the U.S. Census Bureau. Information on GDL programs and their effective dates was obtained from the Insurance Institute for Highway Safety (IIHS),15 State government Web sites, and personal contacts with State personnel. IIHS has been tracking GDL programs since 1996, the earliest year in which any State adopted graduated licensing programs. Three lists were obtained from IIHS: a list of components of graduated licensing programs for each State in 1996; a list including enacted, effective dates and details of licensing amendments for States that have changed their programs since 1996; and a list of components of graduated licensing programs for each State in 2005 (IIHS 2005). State government Web sites were used to confirm the programs, resolve inconsistencies, and in some cases obtain the dates of changes in the programs. Although each GDL program has some distinct features, the main provisions in the various GDL programs generally fall into seven categories: minimum age for a learner permit; mandatory waiting period before applying for intermediate license; minimum hours of supervised driving; minimum age for intermediate license; nighttime restriction; passenger restriction; and minimum age for full licensing (Table 1). To avoid small numbers, related provisions were collapsed into dichotomous variables, for example, “nighttime driving restrictions, yes/no.” The seven components of GDL programs were coded into quarters of the year based on their effective month. For example, in Alabama unsupervised driving was prohibited from midnight to 6 a.m. beginning October 1, 2002; the first three quarters of 2002 were coded as “not exposed to the nighttime driving restriction” and the fourth quarter coded as “exposed.” If a restriction became effective at any time during a quarter, that entire quarter was coded as “exposed.” Quarters were used rather than calendar years because GDL programs became effective at different times of the year. The unit of analysis therefore became the State-quarter, which represents one State having a specified combination of GDL components for a given quarter of the year. Excluded from analysis were four quarters after the effective date of each GDL program or component, because licensing restrictions would not affect teenagers who already had their licenses when legislation took effect. After a restriction goes into effect, it can be as long as a full year before all 16-year-old drivers in a State are driving under that

3
restriction. Four quarters before the effective date were also excluded because some teenagers might hasten to get their licenses before the law changed, leading to an increased number of crashes in those quarters. Thus a total of eight quarters were excluded from the analysis for each GDL program changed or enacted. Table 1. Definition of GDL Components Studied Minimum age for learner permit
- Minimum age 15 ½ years for obtaining a learner permit - Reference: less than 15 ½ years
Mandatory waiting period - Minimum 3 month waiting period after obtaining a learner
permit before applying for an intermediate license - Reference: no mandatory waiting period of at least 3 months
Minimum hours of supervised driving - Minimum 30 hours of supervised driving - Reference: no required supervised driving or required less
than 30 hours Minimum entry age for intermediate stage
- Minimum age 16 years for obtaining intermediate stage license
- Reference: less than 16 years Minimum age for full licensing
- Minimum age 17 years for full licensing - Reference: less than 17 years
Nighttime restriction - Any nighttime restriction - Reference: no nighttime restriction
Passenger restriction - Any passenger restriction - Reference: no passenger restriction
B. Analysis We examined States that had GDL programs at any time during 1994-2004, with the objective of determining whether some programs appeared to be associated with greater reductions in fatal crash involvement rates than others. This was a cross-sectional analysis, examining the experience of 16-year-olds in each of the study years, rather than a cohort analysis, which would have followed 16-year-olds in 1994 until they were 26 years old in 2004. The analyses included 43 States in the continental United States; of these, 36 had GDL programs for at least part of the studied period. The District of Columbia was excluded from analysis since its crash data were heavily influenced by neighboring States. Maine, New Hampshire, Rhode Island, Utah, and Virginia were excluded because they changed their laws more than twice between 1994 and 2004, thus complicating any analysis.
4
The number of person-years for each quarter in each State was estimated using the mid-year population of 16-year-olds divided by four. The same method was used to calculate comparison group data, i.e., person-years in each State-quarter for drivers ages 20-24 and 25-29. Within the 11-year period 1994 through 2004, 1,480 State-quarters were examined. The association between GDL programs and fatal crash incidence was assessed using negative binomial regression models based on generalized estimating equations (GEE).16 17 The negative binomial distribution approximates the counts of fatal crashes within State-quarters and the GEE approach takes into account the correlation among quarterly counts of fatal crashes in a given State. Statistical software SAS® was used for the analysis.18 Independent Variables The independent variable of primary interest was the presence or absence of GDL and its provisions. Three different approaches were used to characterize the GDL programs. In the first approach, whether a State included an intermediate phase in its licensing system was used to determine the presence or absence of GDL programs as a dichotomous variable. The reference group for this comparison was State-quarters without three-stage GDL programs. This comparison is useful because it tells you the combined effect of all GDL programs and reflects the results for all States. Some States, however, have relatively weak GDL requirements, and the results therefore underestimate the impact of stronger programs. In the second approach, the licensing system for young drivers in each State-quarter was characterized on the basis of how many of the seven GDL components studied were contained in the licensing restrictions, regardless of which specific components are included in the count. The reference group was State-quarters that did not meet the requirements of any of the seven components that we examined. This approach made it possible to examine the impact of programs that only partially met the GDL definition. This was a simple count of components that did not depend upon the effect of each one. It addressed the question, “How many components are needed in order to have an effective program?” The third approach helped to identify the specific components of a good GDL program. As with the second approach, categorization of programs was based solely on their components, without considering whether the programs included an intermediate phase that would have qualified them as GDL programs. Again, the reference group was State-quarters that did not meet the requirements of any of the seven components. In this approach, the licensing systems for young drivers were grouped based on combinations of the four GDL program components not related to age of licensing: minimum waiting period of at least three months before applying for an intermediate license, minimum supervised driving of 30 hours, any nighttime restriction, and any passenger restriction. One program grouping, for example, included all State-quarters with a combination of a waiting period of at least three months, a nighttime driving restriction and a passenger-carrying restriction. Programs with only age restrictions were treated as a separate category. If a program grouping existed in fewer than 50 State-quarters then it was not
5
treated as a separate category but was combined with other groupings that occurred too infrequently for separate analysis. Three models based on the three approaches described above were fitted for each of the three age groups studied: drivers age 16, 20-24, and 25-29. The focus of our study was on 16-year-old drivers. However, fatal-crash-involved drivers ages 20-24 and 25-29 were also analyzed to allow comparison between GDL-exposed and non-GDL-exposed drivers. Theoretically, GDL programs will not affect the older age groups and therefore their Incidence Rate Ratios (IRRs) should be equal to one. Dependent Variable The outcome variable was the natural logarithm (the unit used for all negative binomial models) of the number of fatal crashes involving any drivers in our target age groups in a given State-quarter. States and quarters as dummy variables and year as a continuous variable were included in each model. The State variables controlled for State-specific unmeasured variations that might affect fatal crash counts, such as weather, traffic environment, regulations other than GDL, and socioeconomic conditions. The quarter variables controlled seasonal variations and the year variable controlled for variation in fatal crash counts over the time period studied. The sum of person-years in each State-quarter was considered as exposure and was included in each model. Fatal crash involvement of drivers was used rather than driver fatalities because it allowed more cases to be included for study. Person-years based on the population of 16-year-olds were used because the licensing rate might have changed due to implementation of GDL programs. Also, the overall benefit to the population, regardless of the licensing rate, was of primary interest. III. RESULTS From 1994 to 2004, 8,953 16-year-old drivers were involved in fatal crashes in the 43 States examined; 64 percent of the drivers were male and 36 percent were female. During this 11-year period, one-third (34%) of all fatal crashes involving 16-year-old drivers occurred in State-quarters in which GDL programs had been implemented (Table 2). The restrictions in effect for the smallest proportion of State-quarters were a requirement of at least 30 hours of supervised driving (19% of State-quarters) and restrictions related to carrying passengers (15%). With adjustment for changes over time and differences among States that were unrelated to GDL, implementation of GDL programs was associated with an overall 11 percent lower fatal crash involvement rate for 16-year-old drivers [Incidence Rate Ratio (IRR) 0.89, 95% CI 0.80, 0.99] when compared to fatal crash involvement rates in States without GDL programs. This overall difference is based upon comparison of fatal crash involvement rates for State-quarters with and State-quarters without GDL programs. The reduction reflects the combined results for all States, some of which have relatively weak GDL requirements, and therefore underestimates the impact of stronger programs. There was no significant change for drivers aged 20-24 (IRR 0.97, 95% CI 0.92, 1.03) and 25-29 (IRR 0.99, 95% CI 0.93, 1.05).

6
Table 2. Percentages of State-Quarters With Specified GDL Restrictions, and 16-Year-Old Drivers Involved in Fatal Crashes in Relation to GDL Programs in the United States, 1994-2004.
Categories No. (%) of States1
No. (%) of State-quarters (Total 1,480)
N (%) of 16-year-old drivers (Total 8,953)
Rates2
GDL programs Yes 36 (84) 507 (34) 3,230 (36) 25 No 7 (16) 973 (66) 5,723 (64) 32 Minimum age 15 ½ yrs 13 (30) 517 (35) 2,761 (31) 22 for learner <15 yrs 6 30 (70) 963 (65) 6,192 (69) 35 months Mandatory 3+ months 37 (86) 663 (45) 3,946 (44) 27 waiting period None or 6 (14) 817 (55) 5,007 (56) 31 <3 months Minimum 30+ hours 18 (42) 285 (19) 1,775 (20) 24 of supervised None or <30 25 (58) 1,19 (81) 7,178 (80) 31 driving hours Minimum age 16+ years 29 (67) 458 (31) 3,164 (35) 23 intermediate None or 14 (33) 1,02 (69) 5,789 (65) 35 stage <16 years Minimum age 17+ years 23 (53) 492 (33) 3,273 (37) 22 full licensing < 17 years 20 (47) 988 (67) 5,680 (63) 37 Nighttime Any 31 (72) 581 (39) 3,820 (43) 23 restriction None 12 (28) 899 (61) 5,133 (57) 36 Passenger Any 21 (49) 221 (15) 1,198 (13) 21 restriction None 22 (51) 1,25 (85) 7,755 (87) 31 Total 1,48 (100) 8,953 (100 29
1 As of 2004, for the 43 States studied. 2 Driver fatal crash involvement rate – the number of crashes per 100,000 person-years for relevant State-quarters.

7
-35%
-30%
-25%
-20%
-15%
-10%
-5%
0%
5%
10%
15%
Perc
ent C
hang
e in
Ann
ual F
atal
Cra
sh
Invo
lvem
ent R
ates
1620-2425-29
The relationship between the fatal crash involvement rate and the total number of GDL program components is shown in Figure 1. State-quarters with and without any of the seven specified GDL components were compared. Only programs with five or more components experienced a significant reduction in fatal crash involvement rate of 16-year-old drivers. The reduction for 16-year-old drivers was 18 percent for programs with five components and 21 percent for those with six or seven components. Figure 1. Percent Change in Annual Fatal Crash Involvement Rate in Relation to Number of GDL Program Components, Compared to State-Quarters With None of the Seven Components in Table 1, for Drivers Age 16, 20-24, and 25-29; United States, 1994-2004. Vertical Lines Represent 95-Percent Confidence Limits.
Number of GDL Components (in any combination)
The lower fatal crash involvement rates associated with novice licensing systems varied with the provisions included in the laws. Compared to State-quarters with none of the seven specified GDL components, State-quarters with only age restrictions did not show an association with a significantly reduced rate of fatal crashes involving 16-year-old drivers. This is shown in Table 3 below.
One Two Three Four Five Six/Seven
Driver Age

8
GDL programs B through H with various combinations of four major components (other than age components) were also compared to State-quarters having none of the seven GDL program components. Significant reductions of 16-21 percent in fatal crashes involving 16-year-old drivers were associated only with three types of GDL programs, all of which contained a minimum waiting period of at least three months after obtaining a learner permit and a nighttime restriction, plus either:
• passenger restrictions, 21-percent reduction (IRR 0.79, 95% CI 0.66, 0.94); or
• 30 hours of supervised driving in the learner period, 18-percent reduction (IRR 0.82, 95% CI 0.71, 0.95); or
• both, 16-percent reduction (IRR 0.84, 95% CI 0.74, 0.96).
These GDL-associated reductions in fatal crash involvement rates of 16-year-old drivers were not seen for drivers ages 20-24 and 25-29, who were not affected by GDL. The percent reductions for these three types of programs did not differ significantly from one another. Table 3. Incident Rate Ratios (IRRs) and 95-Percent Confidence Intervals (CIs) for Fatal Crashes Involving 16-Year-Old Drivers in Relation to GDL Program Components, Excluding Age Requirements, Compared to Older Drivers in the Same States. United States, 1994-2004.
Program Components # State-quarters
IRRs (95% CIs)
Lear
ner
3+
mon
ths
Supe
rvis
ed
30+
hrs
Nig
httim
e re
stric
tion
Pass
enge
r re
stric
tion
Age 16 Age 20-24 Age 25-29
A1 186 0.95(0.85-1.08) 0.94(0.87-1.02) 0.96(0.87-1.06) B Yes 143 0.96(0.83-1.11) 0.94(0.89-1.00) 0.91(0.82-1.01) C Yes 184 1.01(0.87-1.16) 0.97(0.91-1.04) 0.99(0.89-1.11) D Yes Yes 99 0.96(0.81-1.14) 0.97(0.89-1.05) 0.98(0.90-1.06) E2 Yes Yes Yes 95 0.79(0.66-0.94) 1.00(0.91-1.09) 0.97(0.89-1.07) F2 Yes Yes Yes 141 0.82(0.71-0.95) 0.92(0.86-1.00) 0.94(0.86-1.02) G2 Yes Yes Yes Yes 83 0.84(0.74-0.96) 0.93(0.85-1.01) 0.93(0.84-1.02)
H3 Other combinations of components
1.07(0.85-1.36) 0.89(0.82-0.96) 0.94(0.84-1.05)
Reference4 No No No No 468 1Programs having age restrictions but none of these four components. 2Confidence limits for age 16 do not include 1. 3Programs with too few State-quarters for analysis. 4State-quarters with none of the seven components in Table 1, which included three age- related restrictions as well as the four restrictions in this table.
9
Reading Table 3: Program type F, for example, has three components and was in effect in 141 State-quarters. Sixteen-year-old drivers exposed to Program F experienced a statistically significant 18-percent reduction (i.e., 1-0.82) in those 141 State-quarters, compared to State-quarters with none of the seven components in Table 1. For drivers ages 20-24 and 25-29 the reductions were only 8 percent and 6 percent, respectively, (comparing their fatal crash involvement rates in those 141 quarters with fatal crash involvement rates in State-quarters with none of the seven components) and were not statistically significant since the confidence intervals included 1. IV. DISCUSSION
A. National Reductions Results of this research provide a national overview of the association between various GDL programs and fatal crash involvement rates of 16-year-old drivers – the drivers most affected by GDL implementation. The most comprehensive programs were associated with reductions of about 20 percent in fatal crash involvement rates of 16-year-old drivers, compared to programs without any of the seven GDL components that were analyzed. Results were adjusted for differences over time and among States. For all full GDL programs combined, implementation was associated with an 11-percent reduction in fatal crashes involving 16-year-old drivers when compared to State-quarters without GDL. This overall reduction reflects the combined results for all three-stage GDL programs. Including States with relatively weak programs dilutes the reduction; even so, 11 percent is a substantial and important overall reduction. Other investigators interested in crashes of teenage drivers have taken different approaches to assessing progress. Williams and colleagues,19 analyzing the trend in per capita fatal crash rates of 16-year-old drivers in the United States between 1993 and 2003, without regard for GDL implementation, reported a 26-percent drop during this decade. The finding by Dee and colleagues 11 of a reduction of only 6 percent associated with GDL programs may underestimate the effectiveness of GDL in reducing fatalities because 16- and 17-year-old drivers were affected very differently by GDL programs. This may be a smaller reduction than would have been found specifically for 16-year-olds, due to combining results for 16- and 17-year-old drivers. Moreover, the authors did not exclude results for the four quarters after GDL restrictions took effect, and given that GDL programs do not impact 16-year-olds already licensed, their finding may underestimate the effect. Shope and Molnar 5 pointed out that in the first year following implementation the law applied to only about two-thirds of the 16-year-old drivers. Our analyses showed that programs having fewer than five of the seven major components (including programs that did not qualify for three-stage GDL programs) were not associated with significant reductions in fatal crash rates of 16-year-old drivers when compared to State-quarters with none of the seven components, while a reduction of 18-21 percent was associated with programs having at least five components. This result is similar to the 19-percent reduction reported for programs meeting the IIHS criteria for ‘good’ programs.11 12

10
B. Comparing Specific Programs
Unlike most other countries, in the United States GDL programs vary among States. This offers a special opportunity for comparing the impact of GDL programs with different combinations of restrictions. This is the first time that analysis of the association between fatal crash involvement rates and GDL programs with specific groups of components has been reported. Our analysis of programs with specified groupings of components (without considering age criteria) revealed that programs that included a mandatory waiting period of at least three months before the intermediate phase, a requirement of 30 or more hours of supervised driving, and passenger and nighttime driving restrictions were associated with reductions of 16-21 percent in fatal crash involvement rates of 16-year-old drivers, compared to programs with none of the seven components in Table 1. Drivers ages 20-24 and 25-29 did not experience significant reductions in fatal crash involvement rates, suggesting that the reductions in fatal crashes of 16-year-old drivers were independent of non-GDL changes in policies or the driving environment that affected all drivers. GDL programs with only age criteria were not associated with reductions in fatal crash involvement rates. According to Williams and Ferguson,20 the effectiveness of GDL programs in reducing crash risk depends upon addressing both age and inexperience. They suggested three mechanisms underlying the safety benefit of GDL programs: raising the licensing age, increasing the length of the low-risk supervised learner period,21 and reducing high-risk driving after initial licensure. Research on individual States suggests that the minimum age components are associated with crash reductions because they delay age of full licensure and therefore reduce 16-year-old drivers’ exposure to driving. For example, Shope et al.3 found a substantial reduction in the number of 16-year-olds obtaining licenses after Michigan adopted a GDL program. It is clear that part of the safety benefit of GDL is due to reduced exposure to driving,22 which by itself can be expected to lead to reduced crashes and injuries.23 Our analysis of the number of components of driver licensing systems also suggested that age of licensure is important. Indeed, without age components a program would not have five or more components, the number needed to make a significant difference. In addition, of course, the age components delay licensure, which is important because it can reduce exposure of 16-year-olds. Our analysis indicates that GDL components intended to reduce high-risk driving at night or with teenage passengers after initial licensure contribute to the effectiveness of GDL programs. It is not possible to discern whether the association we observed is directly due to enforcement of the nighttime driving and passenger restrictions, or whether parent-imposed limits on high-risk driving of 16-year-olds are stricter in States with more restrictive programs. The importance of parental involvement cannot be overestimated, and Simons-Morton states that future reductions in teen driver crashes may depend upon increasing parental management.23 Hartos and colleagues 24 reported that parents appear better able to establish and enforce teenage driving restrictions when State laws support them. Whatever the mechanism by which nighttime and passenger restrictions are associated with crash reductions, a program with those components is clearly advantageous.
11
C. Limitations In the absence of data on age-specific driver populations and time spent in driving, we were unable to determine the extent to which GDL-associated reductions in fatal crashes involving 16-year-old drivers were due to reduced exposure associated with decreased licensure or to decreased driving time and distance. Also, it was not possible to determine whether a law was effective due to enforcement or to public support and other factors affecting compliance with the law. When a particular GDL program is not associated with a reduction in crash involvement, it is likely that compliance is low and this could be due to flaws in the policy or to the environment of the policy, such as publicity, enforcement, and parental involvement. Some restrictions are easier to enforce than others. Requirement of a 3- or 6-month waiting period is virtually always enforced because it is an integral part of how the licensing system functions, rather than depending upon the actions of tens of thousands of individual parents, while certified supervised driving will largely depend on the willingness and ability of parents to supervise. A night driving restriction is far easier for parents to enforce than a passenger restriction. Goodwin and Foss25 surveyed teenagers and their parents in North Carolina and confirmed that violation of restrictions without parental knowledge was more common for passenger restrictions than nighttime restrictions. Another limitation was that some groups of GDL components were present in too few State-quarters for analysis, which could have prevented identification of successful programs. For example, it is possible that a program with only nighttime and passenger restrictions would have been effective, but there were too few State-quarters when such programs were in effect to test this hypothesis. Also, small numbers made it impossible to use more detailed categories for GDL components. For example, we were not able to determine whether results varied with the number of passengers allowed or the permitted age for supervisors. Previous studies have indicated that crash risk of teenage drivers increased with the number of passengers.26 27 The importance of supervisor age is underscored by data from Chen et al.,27 who found the highest case-fatality rates of 16-year-old drivers in crashes when passengers ages 20-29 were present. This might be related to the fact that older passengers may legally buy alcohol and (illegally) provide it to underage drinkers, although Rice et al.28 indicated that the presence of adults ages 20-29 was associated with severe or fatal injury among 16- and 17-year-old drivers even when alcohol use was controlled. Williams and Shabanova 29 reported that teen drivers were less likely to use safety belts when passengers were in their twenties, and recommended that passenger restrictions not be waived unless there is a supervisor at least 30 years of age. This recommendation is reasonable because mature passengers are more likely to take some responsibility for the safety of a trip. Finally, our findings may underestimate the benefit of GDL because we assumed that a restriction imposed at any time during a three-month period became effective at the beginning of the period. Any effect of this assumption is likely to be small because most restrictions do, in fact, become effective at the beginning of a calendar quarter, and because the analysis excluded data for the entire year following the effective date of each GDL requirement.

12
V. CONCLUSION GDL programs as a whole are associated with substantial reductions in 16-year-old drivers’ fatal crash involvement rates. The most comprehensive programs appeared to be associated with the greatest benefit. That benefit amounted to about a 20-percent reduction, (comparing State-quarters having comprehensive GDL programs to those without GDL programs), and it suggests that effective GDL programs need to be comprehensive. Among existing programs that were sufficiently common for analysis, significantly lower fatal crash involvement rates for 16-year old drivers were associated with programs having five or more components, including age requirements and:
- a waiting period of at least three months before the intermediate stage, - a restriction on nighttime driving, and either - thirty or more hours of supervised driving or - a restriction on carrying passengers.
Public health agencies, members of the public, and physicians can play a useful role by working to achieve comprehensive GDL programs and encouraging parents of beginning drivers to enforce GDL requirements.

13
REFERENCES
1. Williams AF. Teenage drivers: patterns of risk. J Safety Res. Jan 2003;34(1):5-15. 2. McKnight AJ, Peck RC. Graduated driver licensing: what works? Inj Prev. Sep
2002;8 Suppl 2:ii32-36; discussion ii36-38. 3. Shope JT, Molnar LJ, Elliott MR, Waller PF. Graduated driver licensing in
Michigan: early impact on motor vehicle crashes among 16-year-old drivers. JAMA. Oct 3 2001;286(13):1593-1598.
4. Shope JT, Molnar LJ. Graduated driver licensing in the United States: evaluation results from the early programs. J Safety Res. Jan 2003;34(1):63-69.
5. Shope JT, Molnar LJ. Michigan's graduated driver licensing program: evaluation of the first four years. J Safety Res. 2004;35(3):337-344.
6. Foss RD, Feaganes JR, Rodgman EA. Initial effects of graduated driver licensing on 16-year-old driver crashes in North Carolina. JAMA. Oct 3 2001; 286(13):1588-1592.
7. Cooper D, Atkins F, Gillen D. Measuring the impact of passenger restrictions on new teenage drivers. Accid Anal Prev. Jan 2005;37(1):19-23.
8. Hedlund J, Compton R. Graduated driver licensing research in 2004 and 2005. Accid Anal Prev. 2005;36:108-119.
9. Hedlund J, Compton R. Graduated driver licensing research in 2003 and beyond. Journal of Safety Research. 2004;35(1):5-11.
10. Simpson HM. The evolution and effectiveness of graduated licensing. J Safety Res. Jan 2003;34(1):25-34.
11. Dee TS, Grabowski DC, Morrisey MA. Graduated driver licensing and teen traffic fatalities. J Health Econ. May 2005;24(3):571-589.
12. Morrisey M, Grabowski D, Dee T, Campbell C. The strength of graduated drivers license programs and fatalities among teen drivers and passengers. Accid Anal Prev. 2006;36:135-141.
13. National Highway Traffic Safety Administration. Fatality Analysis Reporting System (FARS) Web-Based Encyclopedia. Accessed March 2005. Available at: http://www-fars.nhtsa.dot.gov/.
14. US Census Bureau. US Census Bureau, Population estimates, entire data set. Accessed March 2005. Available at: http://www.census.gov/popest/datasets.html.
15. Insurance Institute for Highway Safety. US licensing systems for young drivers. Accessed April 2005. Available at: http://www.iihs.org/laws/state_laws/pdf/us_licensing_systems.pdf
16. Diggle P, Heagerty P, Liang K-Y, Zeger S. Analysis of longitudinal data. 2nd ed. New York: Oxford University Press; 2002.
17. Hardin J, Hilbe J. Generalized Estimating Equations. Boca Raton, FL: Chapman & Hall/CRC; 2003.
18. The SAS System for Windows [computer program]. Version 9.1. Cary, NC: SAS Institute Inc; 2003.
19. Williams A, Ferguson S, Wells J. Sixteen-year-old drivers in fatal crashes, United States, 2003. Traffic Inj Prev. 2005;6(3):202-206.
20. Williams AF, Ferguson SA. Rationale for graduated licensing and the risks it should address. Inj Prev. Sep 2002;8 Suppl 2:ii9-14; discussion ii14-16.
14
21. Mayhew DR, Simpson HM, Pak A. Changes in collision rates among novice drivers during the first months of driving. Accid Anal Prev. Sep 2003;35(5):683-691.
22. Hedlund J, Shults RA, Compton R. What we know, what we don't know, and what we need to know about graduated driver licensing. J Safety Res. Jan 2003;34(1):107-115.
23. Simons-Morton B. Increasing parental management of novice teen drivers: Is it possible? Does it matter? Proceedings of the Association for the Advancement of Automotive Medicine. 2005.
24. Hartos JL, Simons-Morton BG, Beck KH, Leaf WA. Parent-imposed limits on high-risk adolescent driving: are they stricter with graduated driver licensing? Accid Anal Prev. May 2005;37(3):557-562.
25. Goodwin AH, Foss RD. Graduated driver licensing restrictions: awareness, compliance, and enforcement in North Carolina. J Safety Res. 2004;35(4):367-374.
26. Preusser DF, Ferguson SA, Williams AF. The effect of teenage passengers on the fatal crash risk of teenage drivers. Accid Anal Prev. Mar 1998;30(2):217-222.
27. Chen LH, Baker SP, Braver ER, Li G. Carrying passengers as a risk factor for crashes fatal to 16- and 17-year-old drivers. JAMA.. Mar 22-29 2000;283(12):1578-1582.
28. Rice TM, Peek-Asa C, Kraus JF. Nighttime driving, passenger transport, and injury crash rates of young drivers. Inj Prev. Sep 2003;9(3):245-250.
29. Williams AF, Shabanova VI. Responsibility of drivers, by age and gender, for motor-vehicle crash deaths. J Safety Res. 2003;34(5):527-531.
15
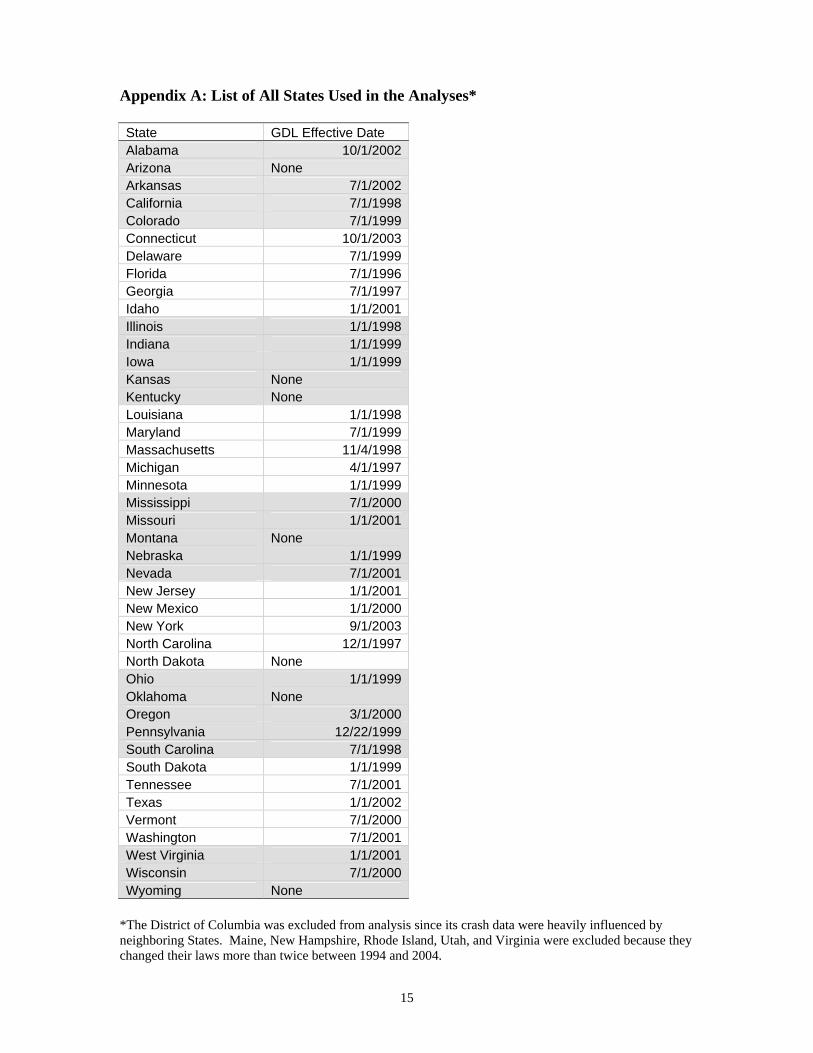
Appendix A: List of All States Used in the Analyses* State GDL Effective Date Alabama 10/1/2002Arizona None Arkansas 7/1/2002California 7/1/1998Colorado 7/1/1999Connecticut 10/1/2003Delaware 7/1/1999Florida 7/1/1996Georgia 7/1/1997Idaho 1/1/2001Illinois 1/1/1998Indiana 1/1/1999Iowa 1/1/1999Kansas None Kentucky None Louisiana 1/1/1998Maryland 7/1/1999Massachusetts 11/4/1998Michigan 4/1/1997Minnesota 1/1/1999Mississippi 7/1/2000Missouri 1/1/2001Montana None Nebraska 1/1/1999Nevada 7/1/2001New Jersey 1/1/2001New Mexico 1/1/2000New York 9/1/2003North Carolina 12/1/1997North Dakota None Ohio 1/1/1999Oklahoma None Oregon 3/1/2000Pennsylvania 12/22/1999South Carolina 7/1/1998South Dakota 1/1/1999Tennessee 7/1/2001Texas 1/1/2002Vermont 7/1/2000Washington 7/1/2001West Virginia 1/1/2001Wisconsin 7/1/2000Wyoming None
*The District of Columbia was excluded from analysis since its crash data were heavily influenced by neighboring States. Maine, New Hampshire, Rhode Island, Utah, and Virginia were excluded because they changed their laws more than twice between 1994 and 2004.

Related Documents