© CSO Insights No portion of these materials may be reproduced or distributed in any form without the prior written permission of the authors Jason Angelos Partner, Analytics & Marketing Services Accenture Lorna Heynike Senior Vice President, Marketing Callidus Software

Welcome message from author
This document is posted to help you gain knowledge. Please leave a comment to let me know what you think about it! Share it to your friends and learn new things together.
Transcript

© CSO Insights No portion of these materials may be reproduced or distributed in any form without the prior written permission of the authors
Jason Angelos Partner, Analytics & Marketing Services Accenture
Lorna Heynike Senior Vice President, Marketing Callidus Software

© CSO Insights No portion of these materials may be reproduced or distributed in any form without the prior written permission of the authors
A Quick View of How It’s Working Today
Introduce the Concept of “ROI Leakage”
Tools to Help Visualize What’s Happening


Copyright © 2011 Accenture All Rights Reserved. Accenture, its logo, and High Performance Delivered are trademarks of Accenture.
Accenture Analytics & Marketing Services Money for Nothing?! How to Maximize Return on Your Sales Comp Investment December 14, 2011
Copyright © 2010 Accenture All Rights Reserved.
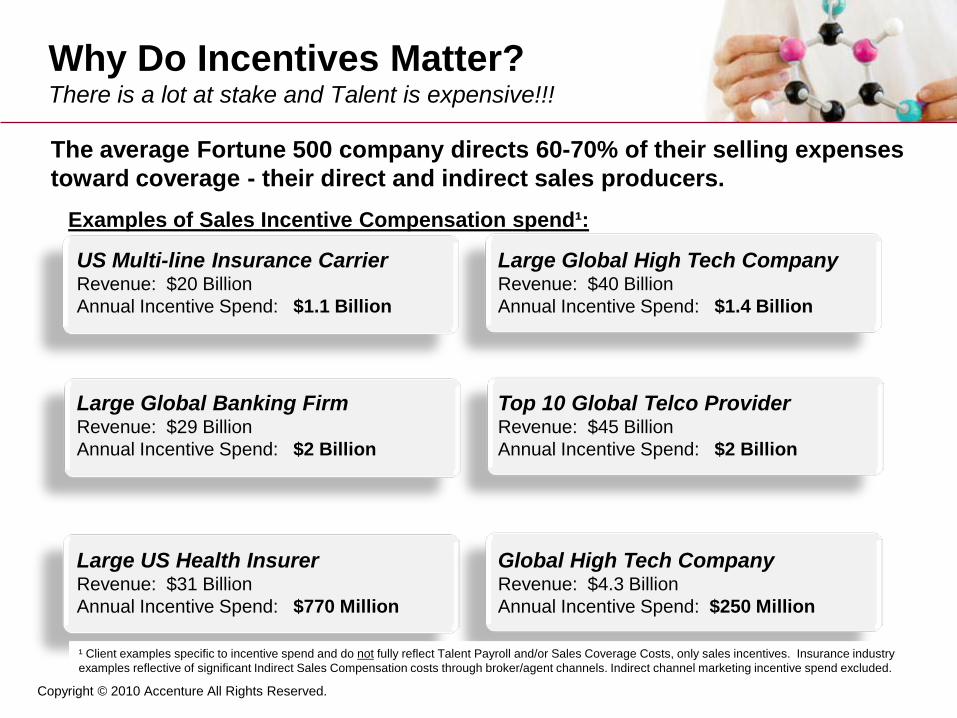
US Multi-line Insurance Carrier Revenue: $20 Billion Annual Incentive Spend: $1.1 Billion
Large Global High Tech Company Revenue: $40 Billion Annual Incentive Spend: $1.4 Billion
Large Global Banking Firm Revenue: $29 Billion Annual Incentive Spend: $2 Billion
Top 10 Global Telco Provider Revenue: $45 Billion Annual Incentive Spend: $2 Billion
Large US Health Insurer Revenue: $31 Billion Annual Incentive Spend: $770 Million
Global High Tech Company Revenue: $4.3 Billion Annual Incentive Spend: $250 Million
Examples of Sales Incentive Compensation spend¹:
¹ Client examples specific to incentive spend and do not fully reflect Talent Payroll and/or Sales Coverage Costs, only sales incentives. Insurance industry examples reflective of significant Indirect Sales Compensation costs through broker/agent channels. Indirect channel marketing incentive spend excluded.
The average Fortune 500 company directs 60-70% of their selling expenses toward coverage - their direct and indirect sales producers.
Why Do Incentives Matter? There is a lot at stake and Talent is expensive!!!
Copyright © 2010 Accenture All Rights Reserved. 9
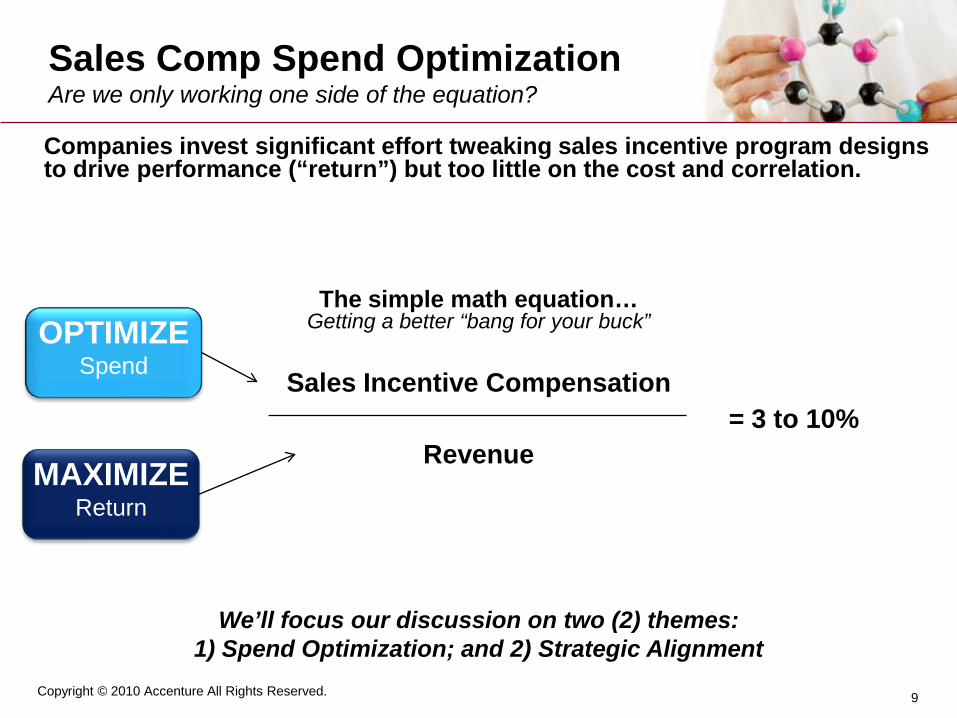
OPTIMIZE Spend
MAXIMIZE Return
Sales Incentive Compensation
Revenue = 3 to 10%
Companies invest significant effort tweaking sales incentive program designs to drive performance (“return”) but too little on the cost and correlation.
Sales Comp Spend Optimization Are we only working one side of the equation?
The simple math equation… Getting a better “bang for your buck”
We’ll focus our discussion on two (2) themes: 1) Spend Optimization; and 2) Strategic Alignment

Copyright © 2010 Accenture All Rights Reserved.
Enhance Sales Productivity
• Reduce operational support requirements from compensation administrators and IT personnel (improved automation)
• Re-purpose time from data validation to value-added analysis • Enhance self-service capabilities for the Field • Reduce labor costs via consolidation
40 – 60% of ICM ops spend
Optimize Comp Spend
Decrease Operations Cost
Value Levers Improvement Opportunities Typical Benefit
Reduce Overpayments
5 – 8% of Incentive Spend
• Automate and streamline system updates and processes • Enforce plan policies in processes and tools to improve compliance • Enhance quota management process • Close incentive plan design / policy loopholes
3 – 12% of Incentive Spend
• Refine sales credit participation and validate compensation eligibility (Coverage model, Credit Policies/ Rules, Governance)
• Re-align pay mix and refine pay for performance guidelines; examine appropriate use of thresholds, caps, and accelerators
• Rationalize SPIFFs – potential to consolidate incentive plans • Ensure bonus programs are aligned to award incremental performance
3%+ increase in Revenue
• Strategically align incentive programs, at a role-level, to reinforce behaviors and drive desired outcomes for CDW
• Ability to introduce more targeted incentive programs • Deliver timely, accurate and transparent crediting • Enable flexibility and speed to market for plan changes • Improved insight to measure effectiveness of incentive programs and
increase strategic alignment
1
2
3
4
10
Art of the Possible with Spend Optimization The business / opportunity case is significant!
The benefit opportunity for optimizing your incentive program.

Copyright © 2010 Accenture All Rights Reserved.
Comp Eligibility
Non Core Variable
Pay Alignment/ Quota Setting
Optimize Spend
Personnel (HR) Changes
Sales Coverage Assignment Changes
Manual Pay Adjustments
Sales Credit Policy & Practices
Reduce Overpayments
Quota Management
• Balance of trade approaches 1:1 (Payout vs Recovery) • Default administration of bonus programs via manual adjustments
• Synchronization of process, systems, and data – HR and Sales Coverage (key input to sales credit and calculation)
• Retroactive processing (e.g. broker of record changes) • Implication to overlay and roll-up
• Individual quota managed in accordance with in-year changes to territory, accounts, assignments, and capacity / coverage model
Process Context Scenarios Industry Examples
Value Lever
Insurance • Commissions (1-size fits all) - flat commissions with low ratio of bonus
inhibits pay for performance • Appointment fees - reimbursed for little to no production; $150 impact for
the Broker, $6M for the Carrier Banking • Source of lead (multi-channel customer experience) – corresponding
differentiation / alignment in compensation Technology [and B2B Telco] • Sales credit participation – contribution vs participation; 90+ people credited
for deals averaging $150K • Eligibility – particularly for Prof Services and Business Development Mgrs • MBOs / SPIFFs – limited governance and extreme participation = entitlement
Improved Accuracy
11
Spend Optimization
Approach to Optimize Sales Comp Spend Typical root cause scenarios that can get comp spend “out of sync”
2
1
Not Exhaustive

Copyright © 2010 Accenture All Rights Reserved.
1. Complexity builds over time – incremental “tinkering” approach to plan design only adds complexity; proliferation of products / solutions; M&A activity
2. Plans implemented as designed – but not as fully intended. Process and system limitations lead to situations where companies “overpay on purpose”.
3. Manual administration – of incentive programs / rules and in the tracking of HR and Sales Coverage assignment events that affect sales credit.
4. Capacity and budget – traditional [and rightful] focus on driving sales performance; incentive compensation management and analytics viewed through a more narrow lens
5. Timely insight to data – lack thereof contributes to administration challenges on the front end (e.g. overpayments) and delays ROI analysis until its post mortem
12
Spend Optimization
Typical Barriers to Spend Optimization Why haven’t we sorted this before?
It’s easy to understand how we got here and why most companies have not assigned a priority focus to this in the past. Top reasons include…
Copyright © 2010 Accenture All Rights Reserved.
Strategic Alignment
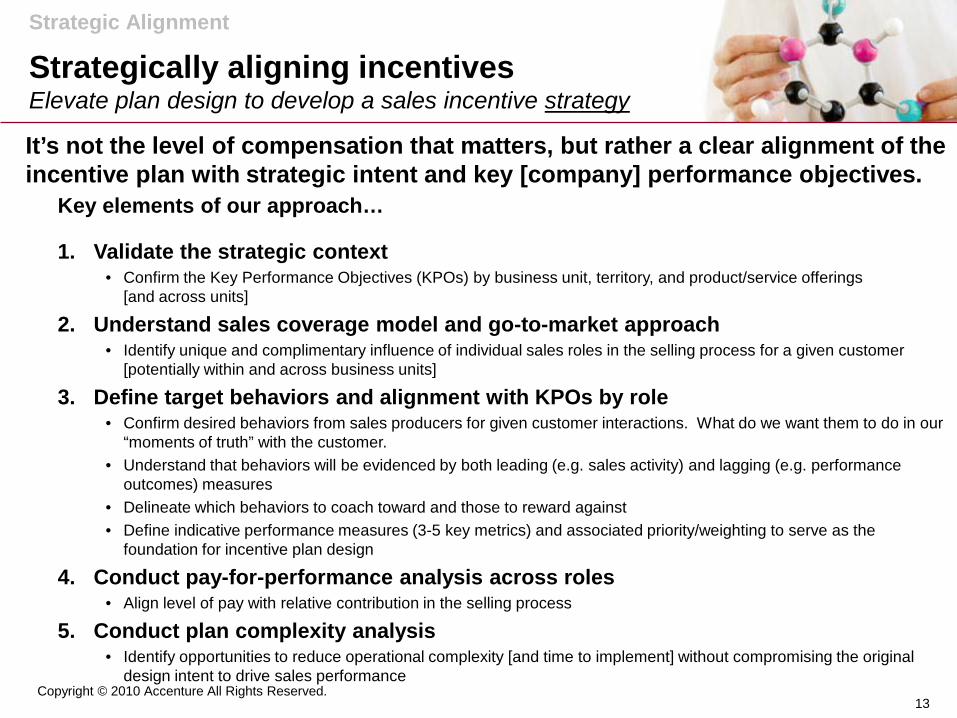
Strategically aligning incentives Elevate plan design to develop a sales incentive strategy
Key elements of our approach…
1. Validate the strategic context • Confirm the Key Performance Objectives (KPOs) by business unit, territory, and product/service offerings
[and across units]
2. Understand sales coverage model and go-to-market approach • Identify unique and complimentary influence of individual sales roles in the selling process for a given customer
[potentially within and across business units]
3. Define target behaviors and alignment with KPOs by role • Confirm desired behaviors from sales producers for given customer interactions. What do we want them to do in our
“moments of truth” with the customer. • Understand that behaviors will be evidenced by both leading (e.g. sales activity) and lagging (e.g. performance
outcomes) measures • Delineate which behaviors to coach toward and those to reward against • Define indicative performance measures (3-5 key metrics) and associated priority/weighting to serve as the
foundation for incentive plan design
4. Conduct pay-for-performance analysis across roles • Align level of pay with relative contribution in the selling process
5. Conduct plan complexity analysis • Identify opportunities to reduce operational complexity [and time to implement] without compromising the original
design intent to drive sales performance
It’s not the level of compensation that matters, but rather a clear alignment of the incentive plan with strategic intent and key [company] performance objectives.
13

Copyright © 2010 Accenture All Rights Reserved.
Ability
Motivation
Context & Tools
Right Skills to Perform Target
Behaviors
Right Knowledge to Perform Target
Behaviors
Right Person into the Right Role
Right Work Assigned to
the Right People
Behaviour
Right Place at the Right
Time to the exhibit target
behaviour
Right Tools to easily access information
required
Right Information to support target
behaviour
Right Performance Specified and measured
Correctly Motivated to show target behaviours
Correctly Incentivised to show target behaviours
Designing for Sales Performance An integrated approach to bring it all together
Incentives (aka Motivation) are 1 of the 3 primary levers that drive behavior and sales performance results, working in tandem with sales force Ability, Context & Tools.
Focus of our discussion to this stage: sales comp spend optimization and strategic alignment 14
© 2011 Callidus Software Inc. – Proprietary & Confidential
Name: first, last Date
Money for Nothing?!
Lorna Heynike CallidusCloud
December 14, 2011

© 2011 Callidus Software Inc. – Proprietary & Confidential
Incentives get attention, but do they ensure success?
Driving Strategic Alignment

© 2011 Callidus Software Inc. – Proprietary & Confidential
Is the Conventional Wisdom of Insiders Right?
How do you identify what works?

© 2011 Callidus Software Inc. – Proprietary & Confidential
Tracing Activities that Matter
What do the best in class really do differently?
Sales Activities
Opportunity Management
Proposals, Pricing, Quoting
Results
Prospecting
Prospect Qualification
Value-Based Selling
Objection Handling
Negotiation
Closing

© 2011 Callidus Software Inc. – Proprietary & Confidential
Tracing Activities that Matter
© 2011 Callidus Software Inc. – Proprietary & Confidential
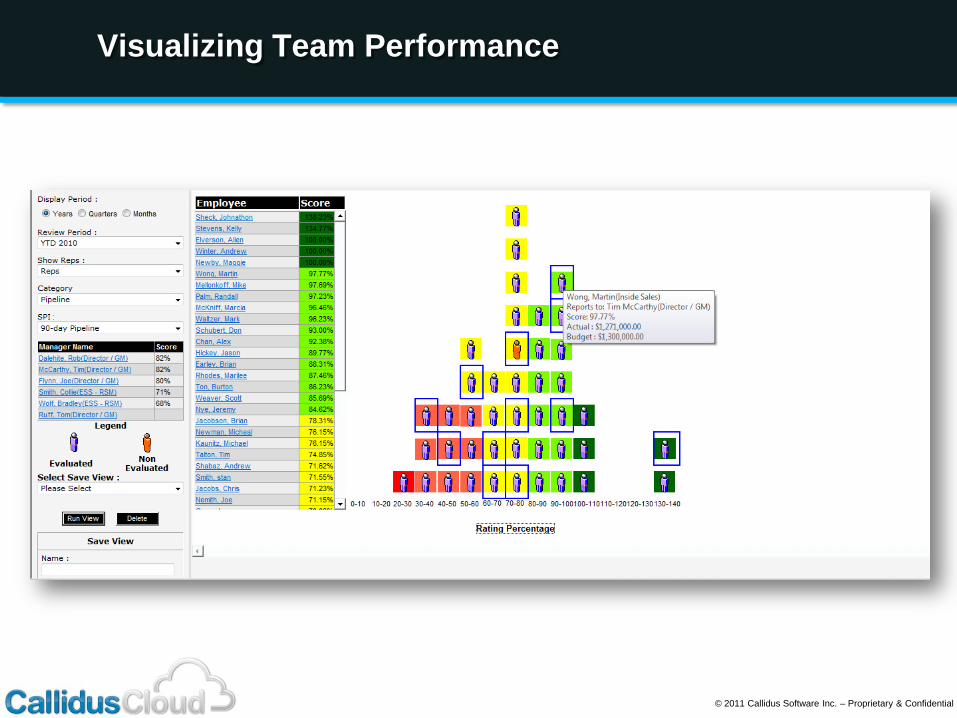
Visualizing Team Performance
© 2011 Callidus Software Inc. – Proprietary & Confidential
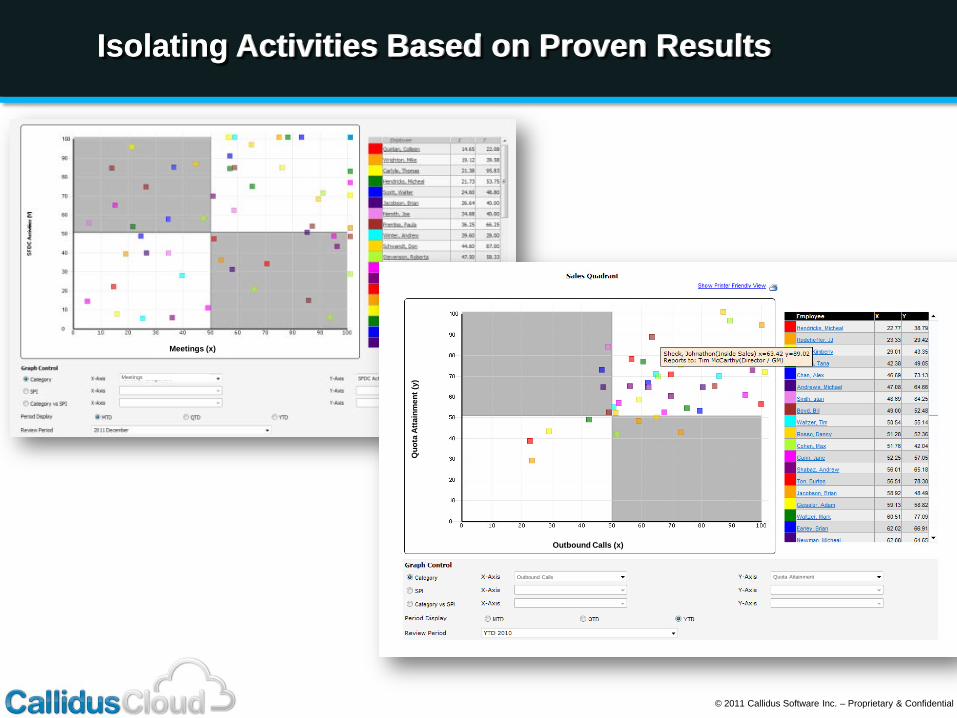
Isolating Activities Based on Proven Results Isolating Activities Based on Proven Results
Meetings
Outbound Calls Quota Attainment
Outbound Calls (x)
Quo
ta A
ttain
men
t (y)
Meetings (x)
© 2011 Callidus Software Inc. – Proprietary & Confidential
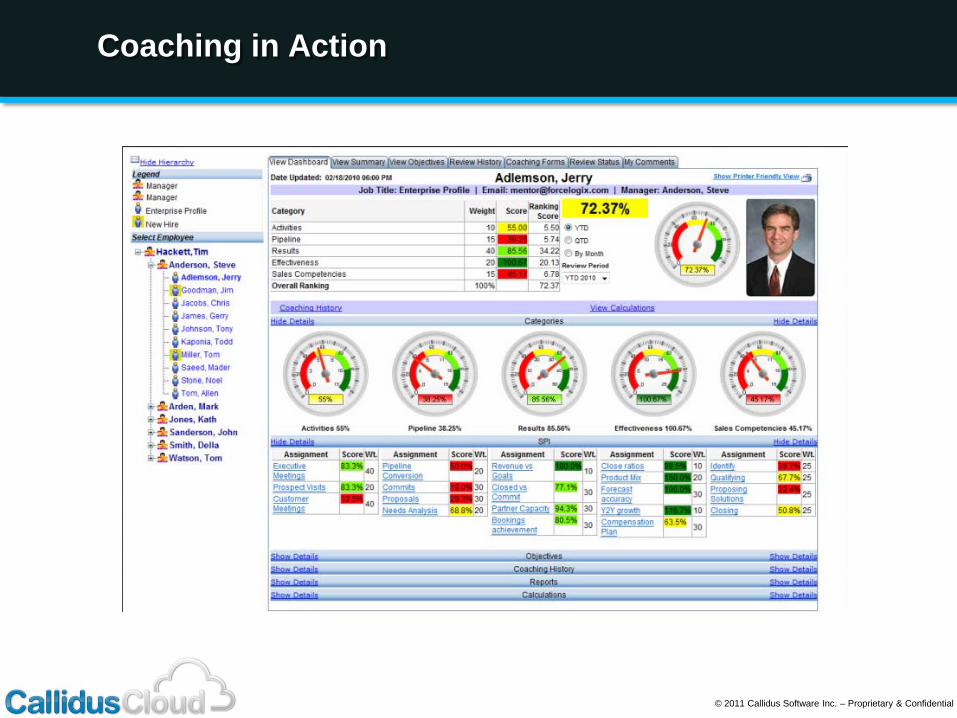
Coaching in Action
© 2011 Callidus Software Inc. – Proprietary & Confidential
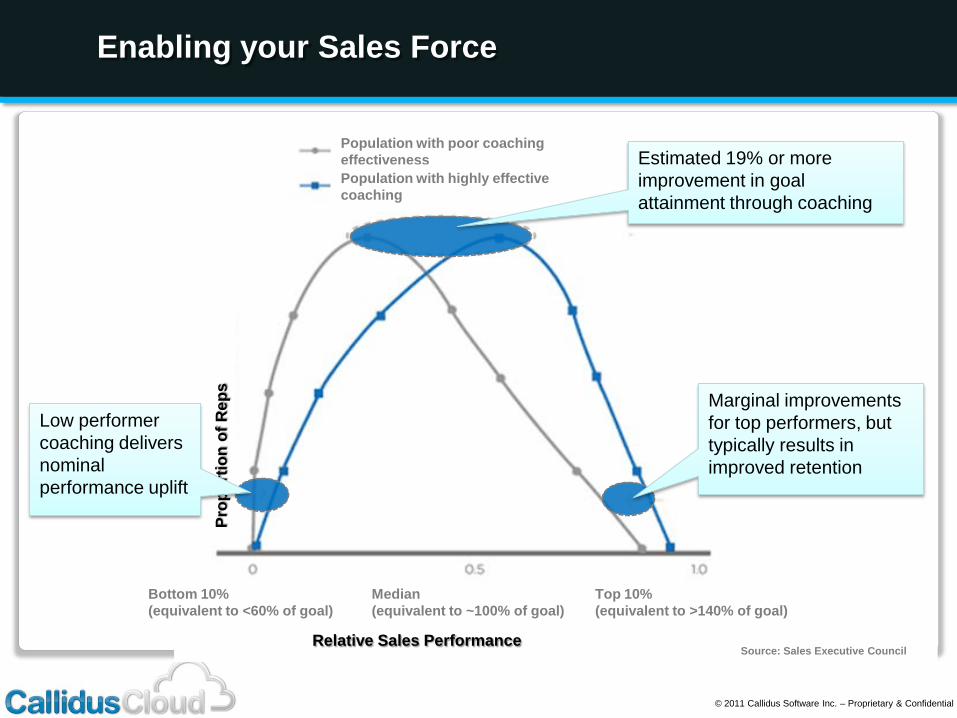
Enabling your Sales Force
Population with poor coaching effectiveness
Bottom 10% (equivalent to <60% of goal)
Median (equivalent to ~100% of goal)
Top 10% (equivalent to >140% of goal)
Population with highly effective coaching
Relative Sales Performance
Prop
ortio
n of
Rep
s
Source: Sales Executive Council
Low performer coaching delivers nominal performance uplift
Marginal improvements for top performers, but typically results in improved retention
Estimated 19% or more improvement in goal attainment through coaching

© 2011 Callidus Software Inc. – Proprietary & Confidential
About CallidusCloud
Motivation Skills Knowledge People
Related Documents