January 26, 2009 • Conventional Energy Sources, continued

January 26, 2009 Conventional Energy Sources, continued.
Dec 21, 2015
Welcome message from author
This document is posted to help you gain knowledge. Please leave a comment to let me know what you think about it! Share it to your friends and learn new things together.
Transcript

January 26, 2009
• Conventional Energy Sources, continued

U.S. Coal Flow Diagram
If we want to reduce coal use, and the problems associated with it, what sector of the economy should we increase the efficiency of?


http://www.eia.doe.gov/cneaf/coal/reserves/chapter1.html

Coal deposits are found in “seams” that can range in
size from inches to hundreds of feet
thick.

• Extraction of coal– Open pit mining
– Mountain top removal
– Deep mining
• Transport of coal
Use of Coal• Air and Water Pollution
– Heavy metals
– Sulfur
– Residual waste
• Waste Heat Pollution
• Coal Ash Spill in E. TN• http://www.youtube.com/watch?
v=BZhT4jx2XZ8
• http://www.youtube.com/watch?v=ats3dClc0No&NR=1

U.S. Natural Gas Flow Diagram
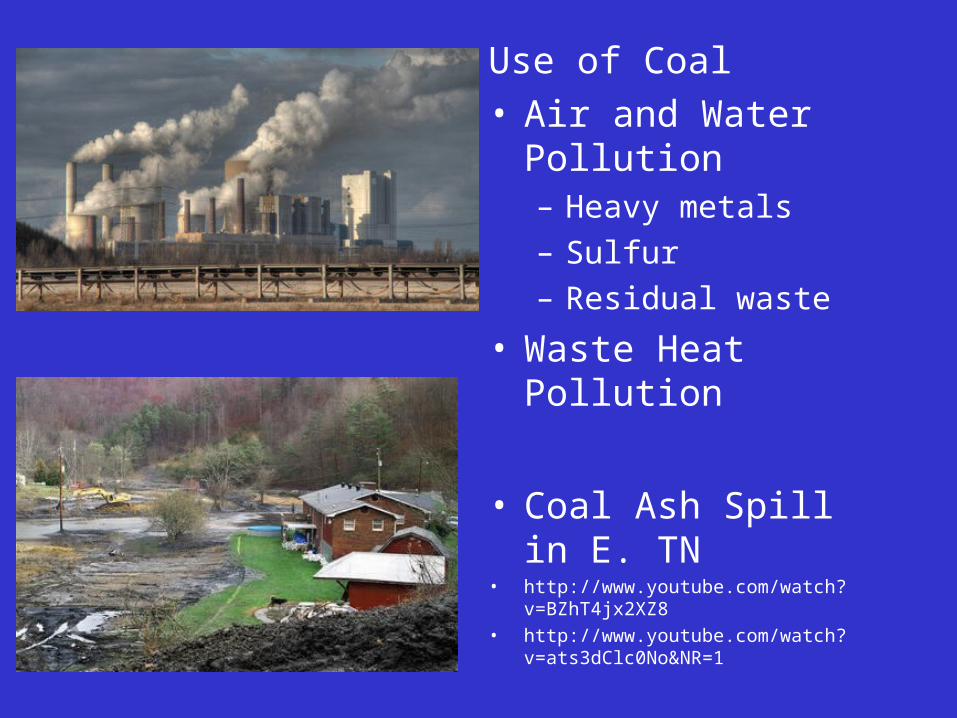
Where Natural Gas is Found and US Production

U.S. Electricity Flow Diagram, 2007

http://www.eia.doe.gov/cneaf/electricity/epa/figes1.html

Reserves to Production Ratio
Oil – 40 years
Natural Gas – 67 years
Coal – 180 years
Energy Return on Investment declining!

Challenges with Conventional Energy Sources
1. Environmental impacts of extraction, transport and refining
2. Environmental impacts of combustion:• Local and regional air pollution• Global climate change
3. Non-renewable nature / long-term availability of supplies
4. Security of supplies (esp. crude oil)


Overview of Topics
• Pollutants• Primary and secondary pollutants• Scales of Air Pollution
– Local: photochemical smog– Local: Gray-Air or Industrial Smog– Regional: acidic deposition– Clean Air Act– Global: Ozone Depletion and Global climate
change

Pollutants• chemicals in the atmosphere in quantities and
duration that are harmful to human health and the environment

Types of air pollutants
– Primary pollutants -
– Secondary pollutants -

Pollutants
1. CO
2. SO2
3. NOx (NO and NO2)
4. Particulate Matter
5. Photochemical oxidants in smog (O3, PANs, H2O2)
6. Lead

• Damages Organs• Affects:
– Brain and Nerves
– Heart and Blood
– Plants and Animals
– Fish

Primary vs. SecondaryPrimary Pollutants
Secondary Pollutants
Sources
Natural
Stationary
CO CO2
SO2 NO NO2
Most hydrocarbons
Most suspendedparticles
SO3
HNO3 H2SO4
H2O2 O3 PANs
Most and saltsNO3–
Mobile
SO42 –

Classic Smog City: Los Angeles• Sunny climate• Light winds• Mountains on three sides• Ocean on the other side• Thermal inversions
(www.chitambo.com)

Temperature Inversions

Pollutants vs. Time of DayNitric oxide Nitrogen dioxide Ozone
40
30
20
10
06 7 8 9 10 11 12 1 2 3 4 5 6 7 8A.M. Noon P.M.
Time
Par
ts p
er m
illi
on

Pollution from China??????
• http://the.honoluluadvertiser.com/article/2006/Jul/30/bz/FP607300313.html

Top Ozone Cities

Best Cities

Effects of photochemical oxidants such as O3
• Damage lungs and stress the heart
• Cause loss of immune system function
• Kill plant cells: brown spots
• Reduce tree growth and make them more susceptible to other damages
• Corrode and destroy materials such as paint, rubber.
Related Documents