Colleran, Sun, Pickle, Kim, 1 Risk and Profitability Analysis of FNJN Holdings Inc. Jack Colleran, John Sun, Benny Pickle, and Harris Kim December 4, 2018 1 1

Welcome message from author
This document is posted to help you gain knowledge. Please leave a comment to let me know what you think about it! Share it to your friends and learn new things together.
Transcript

Colleran, Sun, Pickle, Kim, 1
Risk and Profitability Analysis of FNJN Holdings Inc.
Jack Colleran, John Sun, Benny Pickle, and Harris Kim
December 4, 2018
1
1
V
V
�
V
Jack Colleran, Harris K. Kim, Benjamin C. Pickle, John Sun
Colleran, Sun, Pickle, Kim, 2
Finjan Holdings, Inc. (Finjan) is a cyber security firm who holds patents for softwares
that help detect potential threats online. Started in 1995, the firm believes in innovation,
investments and strategic partnerships as a business model2.
Finjan has three separate businesses, Finjan Mobile, Finjan Blue and CybeRisk. These
companies target different consumers and specialize in different softwares. According to Finjan’s
2018 10-K, “we generate revenues and related cash flows by granting intellectual property
licenses for the use of patented technologies that we own” and suing companies who infringe on
their patents. They make and enforce licensing agreements through negotiation and litigation.
Licenses sold are paid with a lump sum license fee instead of royalties which are not necessarily
paid immediately. When negotiating these fees, Finjan takes into account how much the firm has
made off their software already and how much they will make in the future.
In 2017, Finjan completed four separate lawsuits. According to footnotes in their 2017
10-K, these lawsuits earned Finjan approximately $90 million dollars. Of this, $65 million is to
be paid in 2018 and will not show up on the 2017 financial statements. Finjan earns a significant
portion of its revenue from lawsuits and license agreements in which they lack customers. The
customers that they do have tend to be cyber security firms who have licensed their software.
However, Finjan mentions in their 10-K that would like to expand their CybeRisk business
which has a consumer customer base. This poses as a risk as it is a change to their current
business model. This could result in potential cost increases in the future as the firm is not used
to this kind of business with a stable consumer base.
COGS only represented 12% of their revenues in 2017, which is typical for cyber-
security companies. Net income including SGA expenses total to 55% of revenue in 2017.
2 Finjan, 2018 10-k, 3
Colleran, Sun, Pickle, Kim, 3
However, such large margins are not normally the case. In 2016, Finjan had $18 million in
revenue but only $350 thousand in net income. Even though there was a huge difference in net
income year over year, gross margins were nearly constant. Over the last three years have all
been between 80% and 88%. A lucrative year in litigation and licencing fees is the difference
between a successful and unsuccessful year for the firm. The company's assets are mostly
intangible in the form of patents. Thus, their revenue is derived from lawsuits and licencing fees.
This business model makes the footnotes of the 10-K extremely important. Without
knowing where the firm stands in their legal proceedings, it is very hard to paint an accurate
picture of the firm. Looking at Finjan’s financial statements does little to project their future
performance. In order to judge future success, the footnotes are needed. For example, the
footnotes showing lawsuits on the horizon that can provide a windfall for Finjan, is far more
useful than looking at previous years net income, for example. Finjan’s inventory turnover ratio
reveals nothing.
An issue arising for Finjan is that they are dependent on expiring patents and have not
acquired enough new ones according to page 13. Their business will collapse unless they change
their business model to a non-patent trolling enterprise or acquire new patents. Even non-
expiring patents based on older technologies have value converging to zero because new
technologies will replace them3. In perspective, they have 3 patent-pending.
Their 10-K continues to mention how they are heavily reliant on “lengthy and uncertain”
legal process. If the lawsuits do not go their way, Finjan is highly susceptible to incur a losses.
Finjan recognises the future of their company could be in jeopardy. This is the reason
they are investing in CybeRisk. They are doing this through cash investments while avoiding
3 Finjan, 2018 10-k, 13
Colleran, Sun, Pickle, Kim, 4
raising debt. They believe that raising debt would limit their flexibility if they were to incur a
loss during a long period of time.
Resources and Funding Sources
Finjan follows policies of keeping track of possible impairment of long-term assets.
Finjan creates an allowance for doubtful accounts. They estimate the amount of the allowance
for doubtful accounts using predictors including “historical experience, credit quality, the age of
the accounts receivable balances, and current economic conditions that may affect a customer’s
ability to pay.”4 However, Finjan did not record bad debt expense for 2017, 2016, and 2015 as it
was nonexistent, indicating that they follow up on getting its receivables.
When accounting for accumulated depreciation of property and equipment, it is
calculated on the straight-line method over the estimated useful lives of the related assets, which
range from 3 to 7 years. Costs of betterments and additions are accounted with expenditures
being expense in the period until the items of property and equipment are sold or retired. When
sold/retired, “the related costs and accumulated depreciation are removed from the accounts and
any gain or loss is included in income.”5 Accumulated depreciation in 2017 was $179 thousand
which brought property and equipment down from $319 thousand to $140 thousand. 2016’s
accumulated depreciation of $116 thousand indicated a bigger drain of maintaining long-term
assets.
Most of Finjan long term intangible assets come from the issues of patents. When issuing
patents, Finjan “owns or possesses licenses to use its patents. The cost of maintaining the patents
are expense as incurred.” From February 2016, the Financial Accounting Standards Board issued
Accounting Standards Update No. 2016-02 “Leases” “that requires a lessee to recognize the
4 Finjan, 2018 10-k, F-9 5 ibid
Colleran, Sun, Pickle, Kim, 5
assets and liabilities that arise from operating leases….For leases with a term of 12 months or
less, a lessee is permitted to make an accounting policy election by class of underlying asset not
to recognize lease assets and lease liabilities” until December 15, 2018.6 Their intangible assets
amount to $7.748 million from 0 on December 31, 2017 out of $61 million in total assets.
The following long-term tangible assets decreased: Property and equipment (net)
decreased from $203 thousand to $140 thousand, Investments from $2.745 million to $2.618
million and other non-current assets from $321 thousand to 0.7 However, deferred income taxes,
which are non-current assets, increased from 0 to $6.201 million. While every other long-term
assets, that does not involve patents, decreased, Finjan relies on deferred income taxes due to its
contractual obligations.
Despite Finjan’s increased focus on intangible assets, its main key asset is from its cash
and other cash equivalents which amount for $41.169 million out of $61.247 million in total
assets.8 Its policy “considers all highly liquid instruments with original maturities of three
months or less when purchased to be cash equivalents. Included in cash and cash equivalents are
demand deposits and money market accounts.”9 Although its cash assets surpass FDIC capital
insurance policies, it has not experienced losses on its credit accounts.
Business deployment of Finjan’s long-term assets generated revenues and produce
products/services. With LTAs, grants from licenses to Finjan’s patented cyber-security
technology and settlements under the company’s patent policies. To recognize the value of their
revenue from its issue of patents, the arrangement with the licensee has been signed which is put
into effect. For example, Finjan invested $5 million to Jerusalem Venture Partners (JVP), with
6 Finjan, 2018 10-k, F-13 7 Finjan 2018 10-k, F-15 8 Finjan, 2018 10-k, F-34 9 Finjan, 2018 10-k, F-9
Colleran, Sun, Pickle, Kim, 6
only $2.2 million remaining in its commitment to the company by December 31, 2017. In
addition to its $2.8 million repaid from JVP, “On June 8, 2015, the Company received a cash
distribution of $826 thousand as a portion of a gross entitlement of approximately $1.271 million
from its investment in the JVP Fund.10” From that, the fair value of the patent would be recorded
as revenue from their deployments of long-term assets.
While Finjan consolidated its revenue from payments of their licensees, the company must
pay rents that they also utilized from outside companies. An example of its long-term debts comes
from its rental of former headquarters in New York since 2013, paying in five-year annual
payments of $139 thousand on a monthly basis of $12 thousand. Rent expense was $754 thousand
in 2017 with an additional $36 thousand in rental payable, which is accounted in current liabilities
of the balance sheet.11 Finjan, with its successor Finjan mobile, also gained licensing agreements
Avira, Inc. in which “Avira will provide its Virtual Private Network (“VPN”) platform and
technical support (“VPN Platform”) to Finjan Mobile, and Finjan Mobile will use the VPN
Platform as part of its Vital Security™ suite of product offerings….As of December 31, 2017, the
Company has a $3.3 million contractual obligation due over the next 10 quarters.”12 Even though
Finjan grants its own licensing patents to their licensees, it must also pay its own rents that they
have which balances out.
10 Finjan, 2018 10-k, F-16 11 Ibid 12 Ibid
Colleran, Sun, Pickle, Kim, 7
Three year time series analysis
As revenues grew significantly from 2015 to 2017, gross margin % remained generally
constant, (83% in 2015 and 2016, and 88% in 2017)13. Thus, gross margin $ naturally grew at a
similar pace to revenue. Gross margin $ grew 1,048% from 2015-17, for a total of a $40.603
million increase in gross margin. The fact that as revenue grew, gross margin % remained
generally constant means Finjan’s business model and management can generate large revenue
growth without large expenses, a good indicator that Finjan will be able to maintain profitability
in the future. NOPAT grew during 2015-2017, from $-11.104 million to $11.526 million. Profit
margin, adjusted profit margin, and operating profit margin also grew during these three years,
from -269% to 45%, -237% to 23%, and -269% to 33% respectively. Thus, from 2015 to 2017,
Finjan moved significantly in the right direction in every measure of profitability. However, this
improvement is measured against a very poor base year of 2015. Thus, it is quite doubtful that
Finjan can continue to grow at their current rates as they will likely soon run into economies of
scale, slowing down their growth. In November of 2009 Finjan signed a confidential non-
compete agreement with M86 Security; which expired in March of 2015. Finjan subsequently
began to develop mobile security software and an advisory services section of its business14.
These new developments contributed to the large losses and high expenses of 2015. 2015 was a
poor year for Finjan, as they took a net loss of $12.602 million and all forms of profit margins
were in the -200% range. Unusually high operating expenses contributed to Finjan’s 2015 losses.
2015 operating expenses ($17.753 million) and revenues ($4.687 million) were above those in
the previous and successive years15. Thus 2015 was an unusually unprofitably year. 2016 began
13 Finjan, 2018 10-k, 32-33 14 Finjan, 2016 10-k, 5 15 Finjan, 2015 10-k, F-4
Colleran, Sun, Pickle, Kim, 8
the turnaround for Finjan after a poor 2015. Profit measures like operating profit margin, profit
margin, and adjusted profit margin were a dismal 2% across the board. However, this represents
a large increase from their poor 2015 performance mentioned above. 2016 $ value profitability
measures tell a similar story to the % measures: small positive values, but a large improvement
from 2015. While net income was small, its 2016 value is a massive step in the right direction
after a $12.602 million net loss in 201516. Finian's 2016 was a year of transition and should be
remembered as a year where net income grew by nearly $13 million, not the year where net
income was $350 thousand17. 2017 was by far the most profitable year for Finjan as gross margin
$, net income, EBIT, and NOPAT all grew enormously18. Additionally, all forms of profit
margin grew significantly into double digits from their 2% performance across the board in
2016. A significant portion (27%) of Finjan’s $22.811 million net income in 2017 comes in the
form of a $6.16 million income tax benefit due to $12.5 million in net operating losses
carryforwards. Finjan believes these net operating losses carryforwards will provide tax benefits
until 202619. With more than a quarter of net income coming as repayment for previous losses,
Finjan’s 2017 profitability measures that involve net income (profit margin) should not be taken
at face value. However, the other % and $ profitability measures remain impressive regardless.
From 2015 to 2017, cash flows from operations rose by an average of nearly $14 million
per year, cash flows from investing declined by an average of $837 thousand per year, and cash
flows from financing rose an average of $6.362 million per year. In total, Finjan saw a $23.664
million increase in cash and cash equivalents, less than the total cap raises during this period:
16 Finjan, 2015 10-k, F-4 17 Finjan, 2016 10-k, F-4 18 Finjan, 2017 10-k, F-3 19 Finjan, 2017 10-k, F-43
Colleran, Sun, Pickle, Kim, 9
explained by a $11.404 million cash outflow in 2015 to expand their business20. During 2016
Finjan saw a net increase in cash and cash equivalents of $7.577 million, largely made up of a
cash inflow of $6.808 million from financing activities21. On May 20, 2016 Finjan issued 102
thousand shares of Series A prefered stock to Halcyon LDRII in a non dilutive private placement
resulting in a net cash infusion of $9.49 million22. Finjan also had a cash inflow of $1.328
million from operations during 2016, a $12 million increase from the previous year23. Thus, 2016
cash flows from operations tell the same story as 2016 profit measures: modest figures showing
progress. In 2017 Finjan saw a large increase in net cash provided by operating activities; driven
by $22.811 million in net income. This large cash inflow is a continuation of previous increases
that should reassure investors that the business model works, and that the management team has
implemented it effectively. The $2 million cash outflow from investing activities in 2017 is the
first of four payments totaling $8.5 million to IBM in exchange for a series of patents24. During
2017 Finjan redeemed the remainder of their Series A Preferred shares issued the year prior for a
cash outflow of $13.778 million. However, Finjan once again raised capital through stock
issuances, generating $14.375 million and $11.952 million from issuances of Series A-1
Preferred shares and common shares respectively25. Finjan cannot continue to issue stock
indefinitely, and some will dismiss Finjan’s growth as due to a massive and unsustainable
infusion of capital totalling $35.817 million. However, the combination of strong growth in net
cash provided by operations and the expiration of Finjan’s non-compete agreement in 2015
indicate that the capital infusions did not drive the impressive returns, but rather that investors
20 Finjan, 2015 10-k, F-6 21 Finjan, 2016 10-k, F-6 22 Finjan, 2016 10-k, 36 23 Finjan, 2016 10-k, F-6 24 Finjan, 2017 10-k, 10 25 Finjan, 2017 10-k, F-6
Colleran, Sun, Pickle, Kim, 10
flocked to the returns. Furthermore, the swift and total redemption of all Series A Preferred
shares means Finjan essentially took out a one year loan before quickly paying it back, indicating
strong financial health of the company.
Unit and price information is not applicable to Finjan’s patent troll business model.
Finjan saw massive increases in revenues from 2015-2017 of $45.797 million total. Each year
their revenue more than doubled, increasing 977% over the three year period. From 2015-2017
more than half Finjan’s revenue came from lawsuits or settlements of lawsuits to enforce their
patents. This composition of revenue indicates Finjan’s reliance on current patent law and the
quality of their legal council. In 2015 Finjan won a $39.5 million lawsuit but have not (as of the
2017 10-k) recognized or received any of this revenue, leaving doubts about its collectability26.
During 2016 total operating expenses fell, however, Finjan believes this reduction in SGA
expenses came from the timing of their lawsuits rather than their ability to reduce costs on their
own27. Importantly, as revenue grew 175% in 2017, cost of revenues only grew 97%; meaning
Finjan has yet to hit economies of scale, and will likely continue to see strong growth in
profitability measures during the coming years before slowing down. However, the inability of
Finjan to control the timing and amount of their expenses should worry investors.
The slight increase in LTA from 2015 to 2016 stemmed from funding of Finjan’s $5
million commitment to Jerusalem Venture Partners (JVP)28. The large increase in LTA from
2016 to 2017 was due to Finjan realizing $6.201 million in a deferred income tax asset as well as
the $8.5 million acquisition of patents from IBM. In 2015 and 2016, the vast majority of LTA
were investments in a venture capital fund run by JVP. During 2015 JVP returned $1.271 million
26 Finjan, 2016 10-k, 7 27 Finjan, 2016 10-k, 39 28 Finjan, 2016 10-k, F-13
Colleran, Sun, Pickle, Kim, 11
to Finjan. This return came when Finjan had only invested $1 million, yielding a 127% return
over two years. This impressive return demonstrates JVP is a valuable long term asset that will
likely provide cash to Finjan in the future. Importantly, 11 of the 27 patents held by the company
in 2015 expired by the end of 2017, yet Finjan’s revenue and profitability grew over this period,
and so did the number of patent owned by Finjan. These facts indicate Finjan developed or
acquired profitable patents over this three year period that can continue to provide revenue in
future years. During 2015 and 2016 long term liabilities were less than 5% and 3% of total
liabilities, respectively. Neither the 2016 nor 2015 10-K elaborate on the makeup of these more
or less insignificant liabilities. In 2017 long term liabilities rose to $5.5 million, comprising
almost 40% of total liabilities. This dramatic rise in long term liabilities is due to the long term
portion of Finian's commitment to pay $8.5 million over 4 years to IBM in exchange for a series
of patents.
A $17.606 million accumulated deficit provides the most significant drag on Equity in
2015. Total and average (of 2015-2014) equity were $6.342 and $12.233 million respectively29.
This large disparity between actual and average equity in 2015 is due to high equity 2014. When
the inflated ave equity in 2015 is compared to the ave equity of 2016, there appears to be a
$8.619 million drop. However, the true drop in equity is $5.456 million, almost exclusively
driven by a reduction in APIC due to $6.789 million accretion of their newly issued Series A
Preferred stock30. This accretion is an increase in the book value of Series A Preferred stock and
represents a part of the costs of the capital infusion from Series A Preferred. In this way, the
accretion is similar to interest payments on debt, however, there is no actual outflow of cash.
29 Finjan, 2016 10-k, F-3 30 Finjan, 2016 10-k, F-3
Colleran, Sun, Pickle, Kim, 12
Finjan pays no dividends from 2015-2017 and thus net income is equal to retained earnings31. So
while 2016 net income of $350 thousand was a large increase from net income in 2015, it did
very little to reduce the $17.606 million accumulated deficit that Finjan began 2016 with. This
large accumulated deficit is a significant drag on 2016 equity. In 2017, equity increased for the
first time in this three year time series, rising by $27.64 million. This large increase in equity was
partially driven by 2017 net income of $22.811 million, allowing Finjan to eliminate their
previous years accumulated deficit. Sale of common stock also provided the company with
nearly $12 million, further contributing to Finian's large growth in equity32. The composition of
Finjan’s equity tells a similar story to other ratios and metrics explored above: the story of a
comeback. Each year the composition of Finjan’s equity moved in the right direction;
accumulated deficits decreased and were eventually eliminated, meanwhile, the company raised
more and more money through stock issuances, providing a helpful cash ifusion.
Despite Finjan’s poor performance in 2015, liquidity measures indicated no liquidity
trouble for the company. Finjan’s current and quick ratio were 2.35 and 2.23 respectively. The
small difference between current and quick ratios (A/R=0) represents a cash heavy composition
of current assets that is good for liquidity. Furthermore, Finjan’s long term liabilities were
minimal, and current assets more than doubled total liabilities, another indicator of a liquid
business. As revenue and profits rose in 2016, so too did liquidity. Finjan’s current ratio rose to
4.95 and their quick ratio increased to 3.75. Current assets almost tripled while total liabilities
only rose by 37%. Finjan’s liquidity measures reaffirm the strong growth made by the company
from 2015-2017. In 2017 Finjan’s liabilities grew by almost $10 million, rising 249%33.
31 Finjan, 2017 10-k, 25 32 Finjan, 2017 10-k, F-5 33 Finjan, 2017 10-k, F-6
Colleran, Sun, Pickle, Kim, 13
However, this is no cause for concern, since current and non-current assets grew as well. The
current and quick ratios rose to 5.39 and 5.3 respectively. Finjan’s ability to increase liquidity
while also increasing revenue and net income stems from their large capital raises. These large
capital raises allow Finjan to finance growth without taking on debt. From 2015-2017 the quick
and current ratios rose each year; meaning that future debt payments will not bring Finjan’s
growth to a screeching halt.
From 2015-2017 the company’s financial health strengthened. All measures of
profitability and revenue grew significantly each year. The company’s net cash provided by
operating activities and total assets also saw impressive yearly growth. Importantly, none of this
growth was financed by debt; and thus liquidity and equity grew over the three year period as
well. Finjan states that their revenue increases were driven primarily by increased courtroom
success in enforcing infringement on their patents34. Finjan’s courtroom based business model
will likely continue to yield success for the company. From 2015-2017 the number of lawsuits
Finjan brought and the revenues from those lawsuits increased, this trend will undoubtedly
attract higher quality attorneys to represent Finjan; thus increasing their potential for revenue.
Additionally, the number of tech companies is on the rise, and this trend will continue to be for
the foreseeable future. While this can be seen as a source of competition for Finjan, it can also be
seen as a source of revenue; as more and more companies can possibly infringe on Finjan’s
patents.
Cross-Sectional Analysis
Like Finjan, NTIP also has litigations pending against companies including Microsoft as
a result of not receiving royalty payments35. Based on CF Ops and Free Cash Flows, FNJN is in
34 Finjan, 2016 10-k, 39 35 NTIP, 2017 10-K, 11
Colleran, Sun, Pickle, Kim, 14
a growth phase. NTIP is in a steady growth phase, IDCC and DLB are in Maturity. The CF Ops
metric and FCF metric agrees with the founding dates of these companies. DLB is more stable in
its CF Ops than IDCC. FNJN has had the most risky and least consistent profit margins ranging
from -269% to 45% presumably as a result of its age and growth position.
IDCC has the risks of negative free cash flows36, inability to pay of debts37, liable to
changes in dividends paid which would drive investors away38. Luckily, free cash flows have
been positive since 2015. The risk of negative cash flows comes from its heavy spending
business model: the company needs cash to finance its infrastructure39. Its product depends on
people’s belief in the safety of mobile devices with its RF frequency risks40. Problematically,
18% of its “recurring revenue” comes from Huawei and it is in lawsuit by “Chinese Anti
Monopoly” law from “making proposals for royalties from Huawei that the court believed were
excessive41”.
As a result of its losing streak at lawsuits, FNJN had negative economic profit and profit
margin until 2016. FNJN has had a cyclical pattern of revenue as a result of its businesses model
of patent trolling. Every company peaked in 2016 but FNJN improved the most in 2016 as a
result of their motto.
According to FNJN’s 10-K its research and development expenses are fluctuate and also
continue to vacuum its revenue. IDCC and the other competitors of FNJN also have risks that
affect their profit margins, but those listed for example on IDCC’s 10-K including “currency
36 IDCC, 2017 10-K, 13 37 IDCC, 2017 10-K, 21 38 ibid 39 IDCC, 2017 10-K, 14 40 IDCC, 2017 10-K, 5 41 IDCC, 2017 10-K, 24
Colleran, Sun, Pickle, Kim, 15
fluctuations42” given its overseas business, litigation risk, quality of services, and liabilities on
products it sells with warranties have not mattered43.
IDCC has a current ratio of around 3 making it prepared to pay liabilities and undergo
expected regular litigations. FNJN is a “patent troll” as a result of its inability to receive patent
royalties, in the words of Linwood Downs. Unfortunately, FNJN counts litigation expenses
resulting from patent infringements as its SGA expense, which makes up more than half to four
times its revenue over the past three years. FNJN’s competitor, IDCC, has an advantage over
FNJN, in that it does not need to spend as much money on litigation as FNJN. The users of
IDCC’s patent pay their royalties that account for one fifth of its revenue. Whereas FNJN has
had ongoing expense to litigate to protect its patents, IDCC has had a decrease in operating costs
resulting from litigation of $“16.1” million. In perspective, FNJN has had negative revenue
resulting from litigation operating expenses whereas IDCC’s revenue has never been affected
severely by operating expenses that continue to decrease by about one million from 2015 to
201744. Because younger FNJN has less cash, its failure to protect its patents may be more
significant than that of IDCC. Although FNJN is less risky than IDCC according to its beta
value, IDCC is less risky than FNJN as a result of its longer history and more stable profit
margins and its non zero economic profit. Although IDCC has many current advantages over
FNJN in its stable profitability, this advantage is short-lived. IDCC’s 2016 10-K noted that
FASB mandated it to estimate “royalty revenues45” and change their timing of recording. This
mandate will devalue IDCC’s source of revenue and make its periodic income seem artificially
42 IDCC, 2017 10-k, 19 43 Ibid 44 IDCC, 2017 10-k 56 45 IDCC, 2016 10-K, 12
Colleran, Sun, Pickle, Kim, 16
unstable46. IDCC lists in its 2016 report that it needs to lure qualified engineers and technology
people to effectively run its business. The company with the highest current ratio that also
requires educated personnel has the most capacity to hire bright minds. NTIP would have more
competitive advantage than all with its highest current ratio with excess cash to hire the most
qualified people however the effect of hiring talented minds takes time to develop. In the
meantime, Dolby seems the best option to invest but NTIP seems promising.
Out of the companies, Dolby is the company with the best overall financial and operation
health. According to the table that accounted its financial statements for the past three years, Dolby
has stable profit margins that generates a revenue in the billions, the only company in ten figures.
46 Ibid
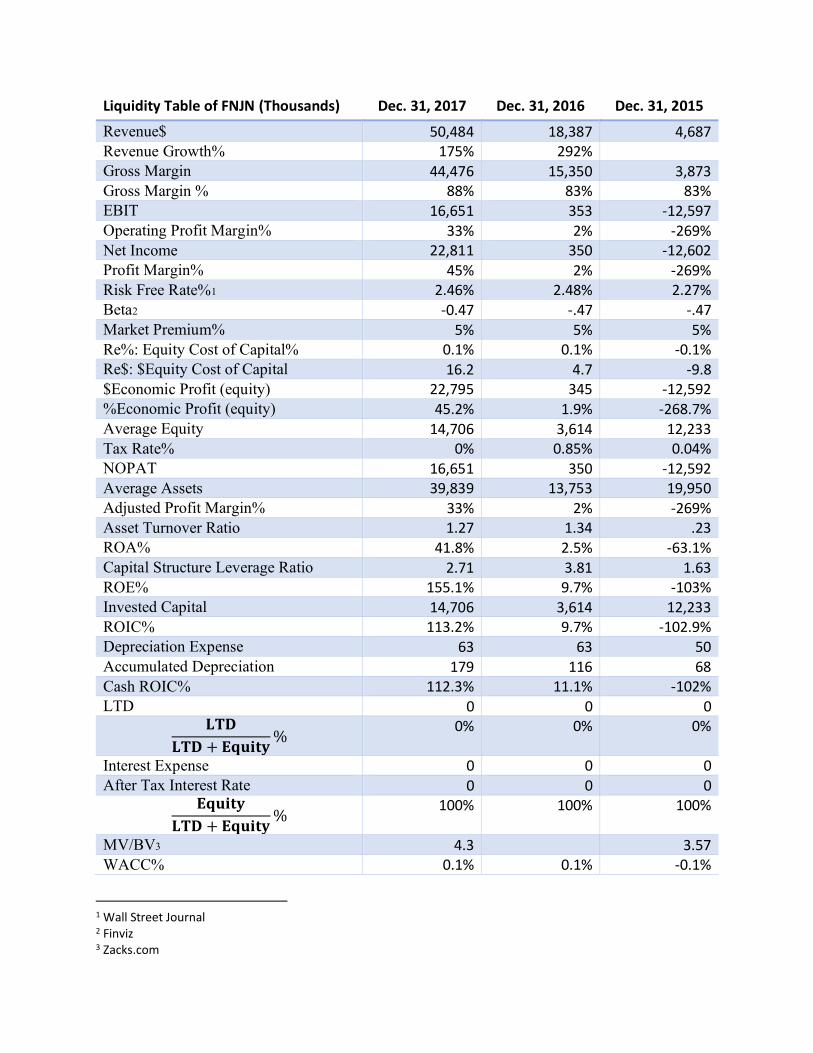
Liquidity Table of FNJN (Thousands) Dec. 31, 2017 Dec. 31, 2016 Dec. 31, 2015
Revenue$ 50,484 18,387 4,687 Revenue Growth% 175% 292% Gross Margin 44,476 15,350 3,873 Gross Margin % 88% 83% 83% EBIT 16,651 353 -12,597 Operating Profit Margin% 33% 2% -269% Net Income 22,811 350 -12,602 Profit Margin% 45% 2% -269% Risk Free Rate%1 2.46% 2.48% 2.27% Beta2 -0.47 -.47 -.47 Market Premium% 5% 5% 5% Re%: Equity Cost of Capital% 0.1% 0.1% -0.1% Re$: $Equity Cost of Capital 16.2 4.7 -9.8 $Economic Profit (equity) 22,795 345 -12,592 %Economic Profit (equity) 45.2% 1.9% -268.7% Average Equity 14,706 3,614 12,233 Tax Rate% 0% 0.85% 0.04% NOPAT 16,651 350 -12,592 Average Assets 39,839 13,753 19,950 Adjusted Profit Margin% 33% 2% -269% Asset Turnover Ratio 1.27 1.34 .23 ROA% 41.8% 2.5% -63.1% Capital Structure Leverage Ratio 2.71 3.81 1.63 ROE% 155.1% 9.7% -103% Invested Capital 14,706 3,614 12,233 ROIC% 113.2% 9.7% -102.9% Depreciation Expense 63 63 50 Accumulated Depreciation 179 116 68 Cash ROIC% 112.3% 11.1% -102% LTD 0 0 0
𝐋𝐓𝐃𝐋𝐓𝐃 + 𝐄𝐪𝐮𝐢𝐭𝐲 % 0% 0% 0%
Interest Expense 0 0 0 After Tax Interest Rate 0 0 0
𝐄𝐪𝐮𝐢𝐭𝐲𝐋𝐓𝐃 + 𝐄𝐪𝐮𝐢𝐭𝐲 % 100% 100% 100%
MV/BV3 4.3 3.57 WACC% 0.1% 0.1% -0.1%
1 Wall Street Journal 2 Finviz 3 Zacks.com
($𝐖𝐀𝐀𝐂)(𝐈𝐂)𝐖𝐀𝐂𝐂% 0.01% 0.01% -0.01% $𝐄𝐜𝐨𝐧𝐨𝐦𝐢𝐜 𝐏𝐫𝐨𝐟𝐢𝐭𝐅𝐢𝐫𝐦 16,635 345 -12,582 %𝐄𝐜𝐨𝐧𝐨𝐦𝐢𝐜 𝐏𝐫𝐨𝐟𝐢𝐭𝐅𝐢𝐫𝐦 113.1% 9.6% -102.9%
Current Ratio 5.3948 4.9525 2.3544 Tie Ratio: Interest Coverage N/A CF Ops 16,586 1,328 -11,259 LT Liabilities 5,500 119 130
𝐂𝐅 𝐎𝐏𝐬𝐋𝐓 𝐋𝐢𝐚𝐛𝐢𝐥𝐢𝐭𝐢𝐞𝐬
3.02 11.16 -86.61
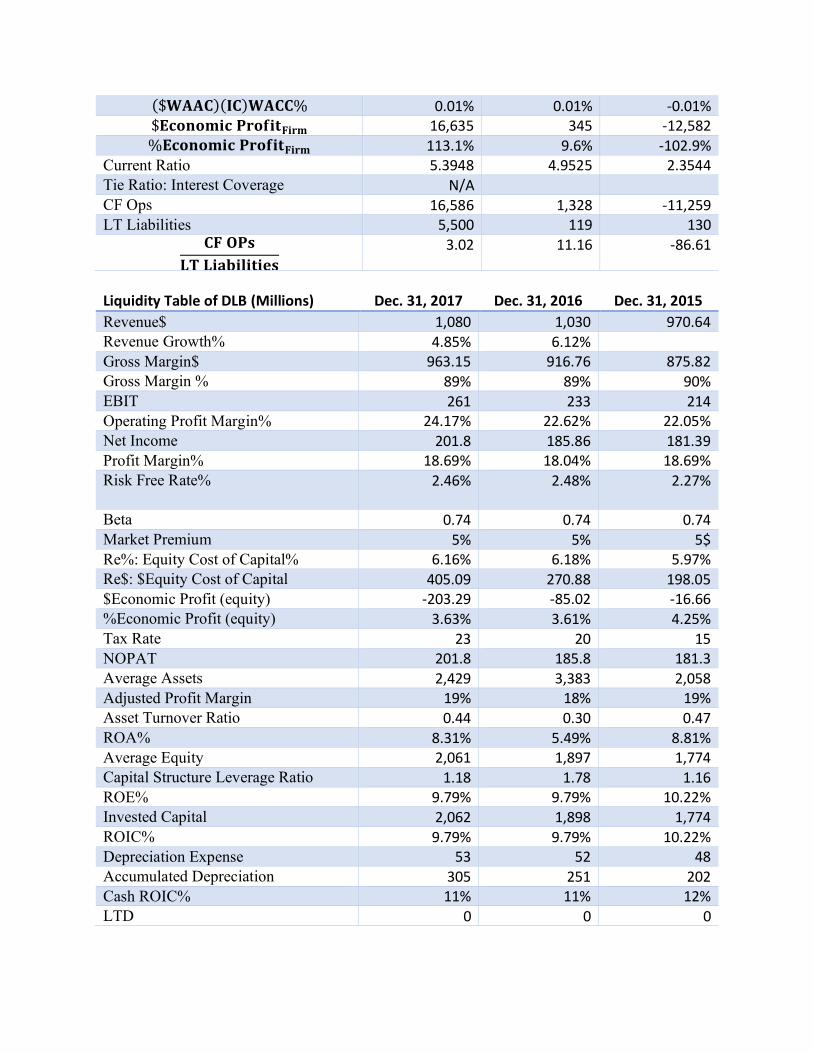
Liquidity Table of DLB (Millions) Dec. 31, 2017 Dec. 31, 2016 Dec. 31, 2015 Revenue$ 1,080 1,030 970.64 Revenue Growth% 4.85% 6.12% Gross Margin$ 963.15 916.76 875.82 Gross Margin % 89% 89% 90% EBIT 261 233 214 Operating Profit Margin% 24.17% 22.62% 22.05% Net Income 201.8 185.86 181.39 Profit Margin% 18.69% 18.04% 18.69% Risk Free Rate% 2.46% 2.48% 2.27%
Beta 0.74 0.74 0.74 Market Premium 5% 5% 5$ Re%: Equity Cost of Capital% 6.16% 6.18% 5.97% Re$: $Equity Cost of Capital 405.09 270.88 198.05 $Economic Profit (equity) -203.29 -85.02 -16.66 %Economic Profit (equity) 3.63% 3.61% 4.25% Tax Rate 23 20 15 NOPAT 201.8 185.8 181.3 Average Assets 2,429 3,383 2,058 Adjusted Profit Margin 19% 18% 19% Asset Turnover Ratio 0.44 0.30 0.47 ROA% 8.31% 5.49% 8.81% Average Equity 2,061 1,897 1,774 Capital Structure Leverage Ratio 1.18 1.78 1.16 ROE% 9.79% 9.79% 10.22% Invested Capital 2,062 1,898 1,774 ROIC% 9.79% 9.79% 10.22% Depreciation Expense 53 52 48 Accumulated Depreciation 305 251 202 Cash ROIC% 11% 11% 12% LTD 0 0 0
𝐋𝐓𝐃𝐋𝐓𝐃 + 𝐄𝐪𝐮𝐢𝐭𝐲 0 0 0
Interest Expense 0.13 0.13 0.18 After Tax Interest Rate 0 0 0
𝐄𝐪𝐮𝐢𝐭𝐲𝐋𝐓𝐃 + 𝐄𝐪𝐮𝐢𝐭𝐲 % 100% 100% 100%
MV/BV 3.19 2.31 1.87 WACC% 6.16% 6.18% 5.97%
($𝐖𝐀𝐀𝐂)(𝐈𝐂)𝐖𝐀𝐂𝐂% 127 117 106 $𝐄𝐜𝐨𝐧𝐨𝐦𝐢𝐜 𝐏𝐫𝐨𝐟𝐢𝐭𝐅𝐢𝐫𝐦 74.81 68.59 75.48 %𝐄𝐜𝐨𝐧𝐨𝐦𝐢𝐜 𝐏𝐫𝐨𝐟𝐢𝐭𝐅𝐢𝐫𝐦 3.63% 3.61% 4.25%
Current Ratio 4.12 3.57 4.38 Tie Ratio: Interest Coverage 2,007.7 1,792.3 1,188.9 CF Ops 371.05 356.84 309.38 LT Liabilities 151 125 107
𝐂𝐅 𝐎𝐏𝐬𝐋𝐓 𝐋𝐢𝐚𝐛𝐢𝐥𝐢𝐭𝐢𝐞𝐬 2.46 2.85 2.89
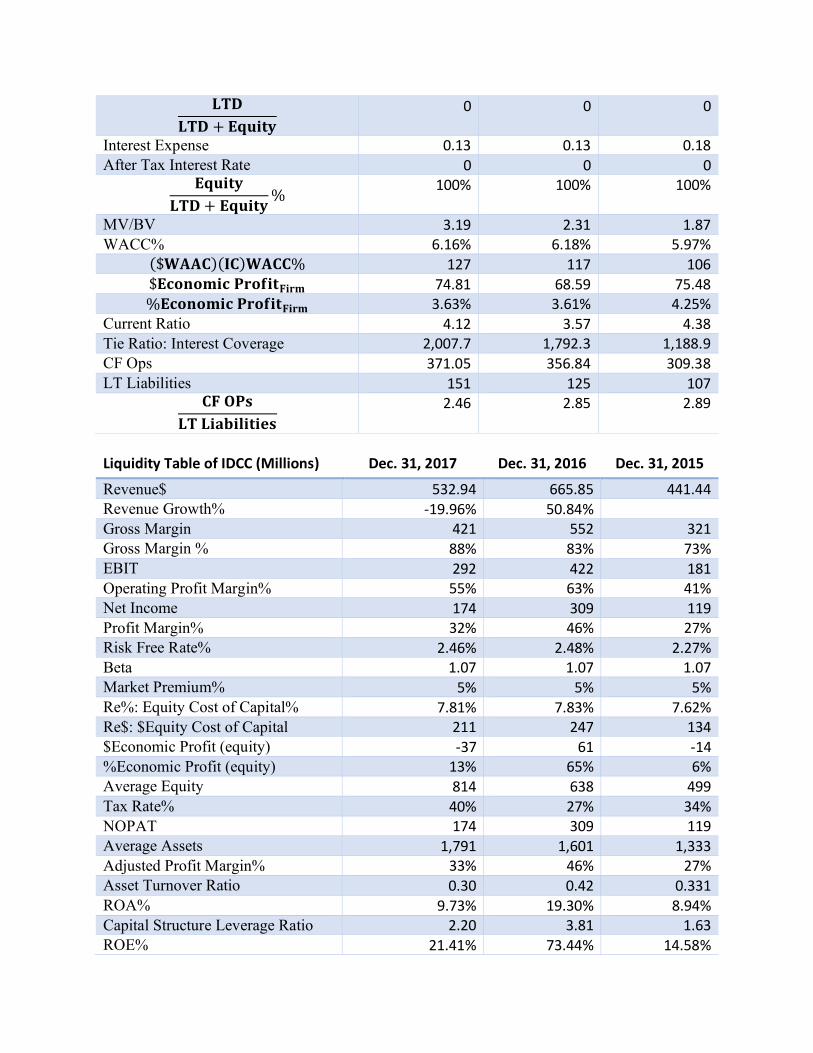
Liquidity Table of IDCC (Millions) Dec. 31, 2017 Dec. 31, 2016 Dec. 31, 2015
Revenue$ 532.94 665.85 441.44 Revenue Growth% -19.96% 50.84% Gross Margin 421 552 321 Gross Margin % 88% 83% 73% EBIT 292 422 181 Operating Profit Margin% 55% 63% 41% Net Income 174 309 119 Profit Margin% 32% 46% 27% Risk Free Rate% 2.46% 2.48% 2.27% Beta 1.07 1.07 1.07 Market Premium% 5% 5% 5% Re%: Equity Cost of Capital% 7.81% 7.83% 7.62% Re$: $Equity Cost of Capital 211 247 134 $Economic Profit (equity) -37 61 -14 %Economic Profit (equity) 13% 65% 6% Average Equity 814 638 499 Tax Rate% 40% 27% 34% NOPAT 174 309 119 Average Assets 1,791 1,601 1,333 Adjusted Profit Margin% 33% 46% 27% Asset Turnover Ratio 0.30 0.42 0.331 ROA% 9.73% 19.30% 8.94% Capital Structure Leverage Ratio 2.20 3.81 1.63 ROE% 21.41% 73.44% 14.58%
Invested Capital 1,099 910 758 ROIC% 15.85% 33.95% 15.7% Depreciation Expense 4 4.1 3.8 Accumulated Depreciation 28 24 51 Cash ROIC% 16% 34% 15% LTD 285 272 260
𝐋𝐓𝐃𝐋𝐓𝐃 + 𝐄𝐪𝐮𝐢𝐭𝐲 0.1 0.08 0.13
Interest Expense 17 21 30 After Tax Interest Rate% 3.7% 5.7% 7.7%
𝐄𝐪𝐮𝐢𝐭𝐲𝐋𝐓𝐃 + 𝐄𝐪𝐮𝐢𝐭𝐲 0.90 0.92 0.87
MV/BV 3.33 4.96 3.53 WACC% 7.42% 7.66% 7.63%
($𝐖𝐀𝐀𝐂)(𝐈𝐂)𝐖𝐀𝐂𝐂% 82 70 58 $𝐄𝐜𝐨𝐧𝐨𝐦𝐢𝐜 𝐏𝐫𝐨𝐟𝐢𝐭𝐅𝐢𝐫𝐦 96 239 61 %𝐄𝐜𝐨𝐧𝐨𝐦𝐢𝐜 𝐏𝐫𝐨𝐟𝐢𝐭𝐅𝐢𝐫𝐦 8.43% 26.29% 8.09%
Current Ratio 3.7 2.87 2.53 Tie Ratio: Interest Coverage 16 19 5 CF Ops 316 434 116 LT Liabilities 605 548 553
𝐂𝐅 𝐎𝐏𝐬𝐋𝐓 𝐋𝐢𝐚𝐛𝐢𝐥𝐢𝐭𝐢𝐞𝐬 0.52 0.79 0.21
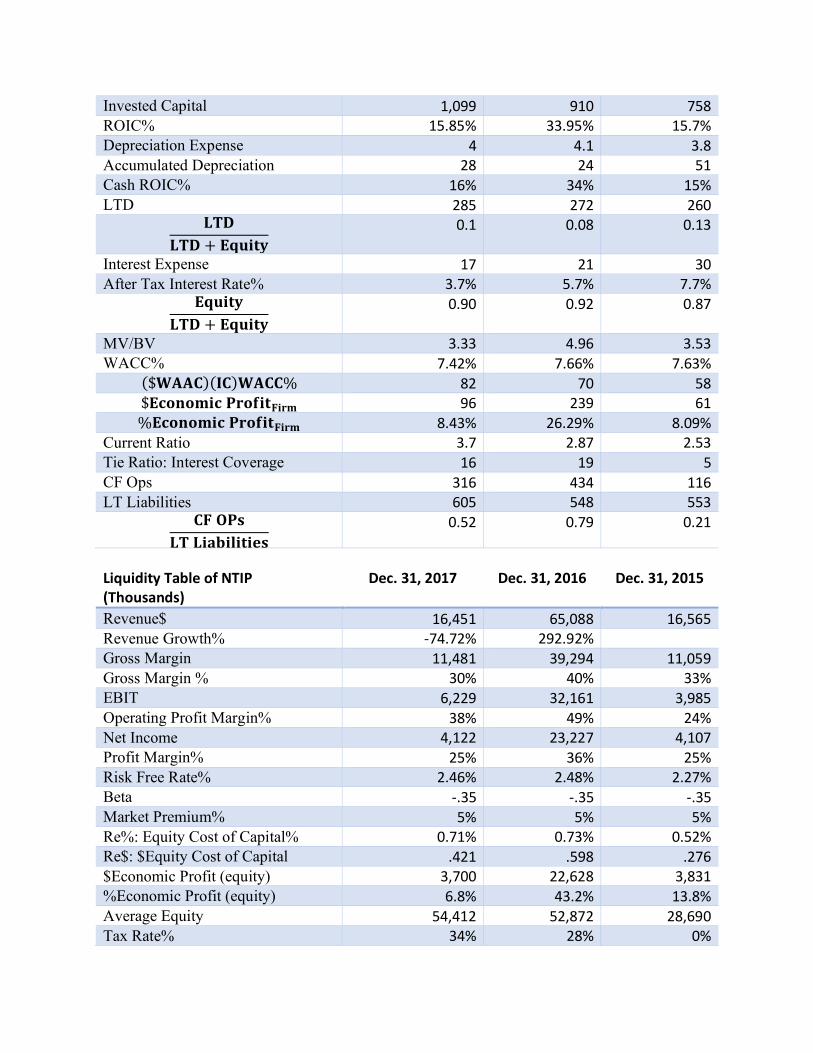
Liquidity Table of NTIP (Thousands)
Dec. 31, 2017 Dec. 31, 2016 Dec. 31, 2015
Revenue$ 16,451 65,088 16,565 Revenue Growth% -74.72% 292.92% Gross Margin 11,481 39,294 11,059 Gross Margin % 30% 40% 33% EBIT 6,229 32,161 3,985 Operating Profit Margin% 38% 49% 24% Net Income 4,122 23,227 4,107 Profit Margin% 25% 36% 25% Risk Free Rate% 2.46% 2.48% 2.27% Beta -.35 -.35 -.35 Market Premium% 5% 5% 5% Re%: Equity Cost of Capital% 0.71% 0.73% 0.52% Re$: $Equity Cost of Capital .421 .598 .276 $Economic Profit (equity) 3,700 22,628 3,831 %Economic Profit (equity) 6.8% 43.2% 13.8% Average Equity 54,412 52,872 28,690 Tax Rate% 34% 28% 0%
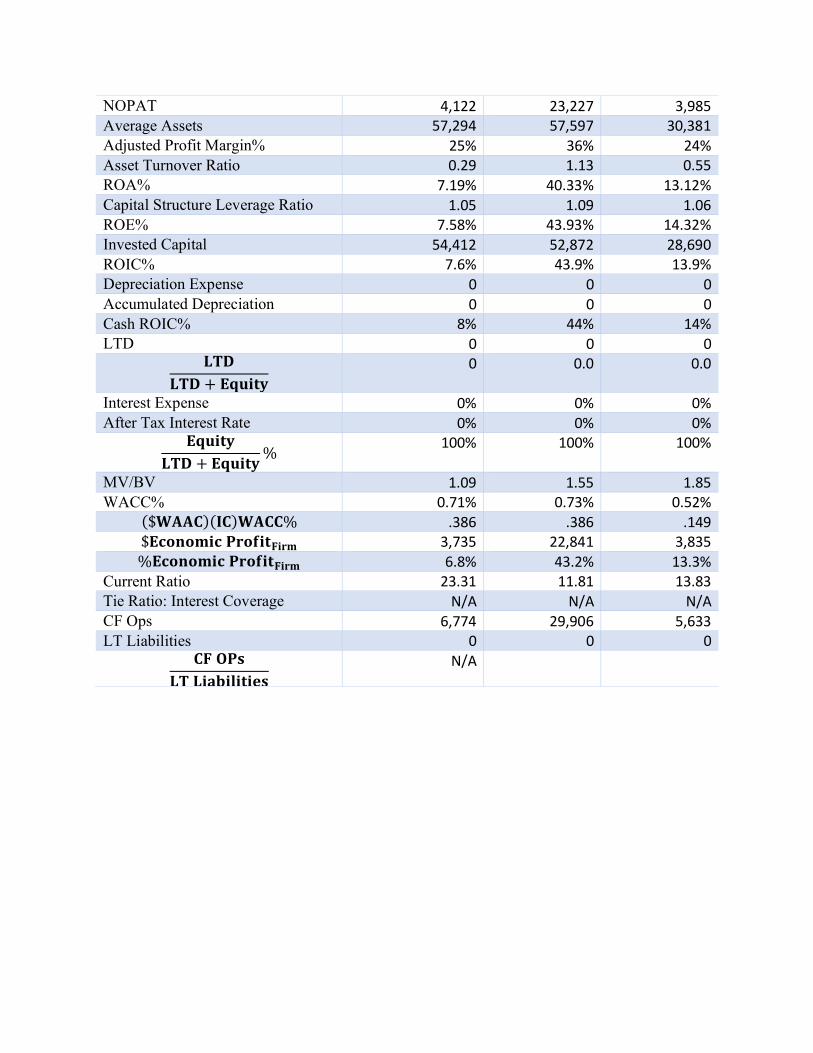
NOPAT 4,122 23,227 3,985 Average Assets 57,294 57,597 30,381 Adjusted Profit Margin% 25% 36% 24% Asset Turnover Ratio 0.29 1.13 0.55 ROA% 7.19% 40.33% 13.12% Capital Structure Leverage Ratio 1.05 1.09 1.06 ROE% 7.58% 43.93% 14.32% Invested Capital 54,412 52,872 28,690 ROIC% 7.6% 43.9% 13.9% Depreciation Expense 0 0 0 Accumulated Depreciation 0 0 0 Cash ROIC% 8% 44% 14% LTD 0 0 0
𝐋𝐓𝐃𝐋𝐓𝐃 + 𝐄𝐪𝐮𝐢𝐭𝐲 0 0.0 0.0
Interest Expense 0% 0% 0% After Tax Interest Rate 0% 0% 0%
𝐄𝐪𝐮𝐢𝐭𝐲𝐋𝐓𝐃 + 𝐄𝐪𝐮𝐢𝐭𝐲 % 100% 100% 100%
MV/BV 1.09 1.55 1.85 WACC% 0.71% 0.73% 0.52%
($𝐖𝐀𝐀𝐂)(𝐈𝐂)𝐖𝐀𝐂𝐂% .386 .386 .149 $𝐄𝐜𝐨𝐧𝐨𝐦𝐢𝐜 𝐏𝐫𝐨𝐟𝐢𝐭𝐅𝐢𝐫𝐦 3,735 22,841 3,835 %𝐄𝐜𝐨𝐧𝐨𝐦𝐢𝐜 𝐏𝐫𝐨𝐟𝐢𝐭𝐅𝐢𝐫𝐦 6.8% 43.2% 13.3%
Current Ratio 23.31 11.81 13.83 Tie Ratio: Interest Coverage N/A N/A N/A CF Ops 6,774 29,906 5,633 LT Liabilities 0 0 0
𝐂𝐅 𝐎𝐏𝐬𝐋𝐓 𝐋𝐢𝐚𝐛𝐢𝐥𝐢𝐭𝐢𝐞𝐬 N/A
Colleran, Sun, Pickle, Kim, 17
Bibliography
“Finjan. (2018). Annual report 2018. Retrieved from https://ir.finjan.com/annual-reports#
“Finjan. (2017). Annual Report 2017. Retrieved from
https://www.sec.gov/Archives/edgar/data/1366340/000136634017000029/fnjn-20161231
x10k.htm
Dolby. (2017) Annual Report 2017.
https://www.sec.gov/Archives/edgar/data/1308547/000162828018014390/a10-kfy18q4.ht
m
“Finjan. (2016). Annual Report 2016. Retrieved from
https://www.sec.gov/Archives/edgar/data/1366340/000136634017000029/fnjn-
20161231x10k.htm
“FNJN: Great Q4, Full Year 2016, and Current Q1 2017 For Finjan.” Yahoo! Finance, Yahoo!,
29 Mar. 2017, finance.yahoo.com/news/fnjn-great-q4-full-2016-170000378.html.
“Finjan Holdings, Inc.” Finjan Holdings, Inc., www.finjan.com/.
“Finjan Holdings, Inc. Competitors.” NASDAQ.com, www.nasdaq.com/symbol/fnjn/competitors.
LibGuides: Citing Guide for Business Majors (APA 6th Ed.): Annual Report/10-K.” Annual
Report/10-K - Citing Guide for Business Majors (APA 6th Ed.) - LibGuides at Butler
University, libguides.butler.edu/c.php?g=34156&p=217445.
“U.S. 10 Year Treasury Note.” The Wall Street Journal, Dow Jones & Company,
quotes.wsj.com/bond/BX/TMUBMUSD10Y?mod=mdc_bnd_dtabnk.
NTIP. (2018). Annual report 2018. Retrieved from
https://www.sec.gov/Archives/edgar/data/1065078/000107261318000258/0001072613-
18-000258-index.htm
Colleran, Sun, Pickle, Kim, 18
Documents
“IDCC. (2017). Annual report 2017. Retrieved from
https://www.sec.gov/Archives/edgar/data/1405495/000140549518000015/idcc-
2017x10k.htm
Zacks Investment Research. “InterDigital, Inc. (IDCC) Price Book Value - Zacks.com.” Zacks
Investment Research, Zacks Investment Research, 4 Dec. 2018,
www.zacks.com/stock/chart/IDCC/fundamental/price-book-value.
Zacks Investment Research. “Finjan Holdings, Inc. (FNJN) Price Book Value - Zacks.com.”
Zacks Investment Research, Zacks Investment Research, 4 Dec. 2018,
www.zacks.com/stock/chart/FNJN/fundamental/price-book-value.
Related Documents