Stability and Electronic Properties of TiO 2 Nanostructures With and Without B and N Doping D. J. Mowbray,* J. I. Martinez, J. M. Garcı ´a Lastra, K. S. Thygesen, and K. W. Jacobsen Center for Atomic-scale Materials Design, Department of Physics, Technical UniVersity of Denmark, DK-2800 Kgs. Lyngby, Denmark ReceiVed: January 8, 2009 We address one of the main challenges to TiO 2 photocatalysis, namely band gap narrowing, by combining nanostructural changes with doping. With this aim we compare TiO 2 ’s electronic properties for small 0D clusters, 1D nanorods and nanotubes, 2D layers, and 3D surface and bulk phases using different approximations within density functional theory and GW calculations. In particular, we propose very small (R j 5 Å) but surprisingly stable nanotubes with promising properties. The nanotubes are initially formed from TiO 2 layers with the PtO 2 structure, with the smallest (2,2) nanotube relaxing to a rutile nanorod structure. We find that quantum confinement effects, as expected, generally lead to a widening of the energy gap. However, substitutional doping with boron or nitrogen is found to give rise to (meta-)stable structures and the introduction of dopant and midgap states which effectively reduce the band gap. Boron is seen to always give rise to n-type doping while depending on the local bonding geometry, nitrogen may give rise to n-type or p-type doping. For undercoordinated TiO 2 surface structures found in clusters, nanorods, nanotubes, layers and surfaces nitrogen gives rise to acceptor states while for larger clusters and bulk structures donor states are introduced. 1. Introduction Motivated by the world’s ever increasing need for cleaner burning fuels and more viable forms of renewable energy, hydrogen production via photocatalysis has been intensely researched as a possible candidate for addressing these issues. Since the first experimental formation of hydrogen by photo- catalysis in the early 1980s, 1 TiO 2 has been the catalyst of choice. Reasons for this include the position of TiO 2 ’s conduc- tion band above the energy of hydrogen formation, the relatively long lifetime of excited electrons which allows them to reach the surface from the bulk, TiO 2 ’s high corrosion resistance compared to other metal oxides, and its relatively low cost. 2-4 However, the large band gap of bulk TiO 2 (≈3 eV) means that only high energy UV light may excite its electrons. This effectively blocks most of the photons which pierce the atmosphere, typically in the visible range, from participating in any bulk TiO 2 based photocatalytic reaction. On the other hand, the difference in energy between excited electrons and holes, i.e. the band gap, must be large enough (J1.23 eV) to dissociate water into hydrogen and oxygen. For these reasons it is of great interest to adjust the band gap ε gap of TiO 2 into the range 1.23 j ε gap j 2.5 eV, while maintaining the useful properties mentioned above. 5 With this aim, much research has been done on the influence of TiO 2 nanostructure 6-10 and dopants 5,11-17 on photocatalytic activity. For low dimensional nanostructured materials, electrons and holes have to travel shorter distances to reach the surface, allowing for a shorter quasi-particle lifetime. However, due to quantum confinement effects, lower dimensional TiO 2 nano- structures tend to have larger band gaps. 18 On the other hand, although doping may introduce midgap states, recent experi- mental studies have shown that boron and nitrogen doping of bulk TiO 2 yields band gaps smaller than the threshold for water splitting. 11,12 This suggests that low dimensional structures with band gaps larger than about 3.0 eV may be a better starting point for doping. The experimental synthesis and characterization of nano- structured materials is in general a costly and difficult task. On the other hand, modern electronic structure modeling has reached a level where large-scale calculations can provide realistic descriptions of structure and electronic properties. Based on our investigation, we suggest as a promising candidate small (R j 5 Å) TiO 2 nanotubes, with a hexagonal ABC PtO 2 structure (HexABC), which we find to be surprisingly stable, even in the boron and nitrogen doped forms. This stability may be attributed to their structural similarity to bulk rutile TiO 2 , with the smallest nanotube having the same structure as a rutile nanorod. A further difficulty for any photocatalytic system is control- ling how electrons and holes travel through the system. 19 For this reason, methods for reliably producing both n-type and p-type TiO 2 semiconducting materials are highly desirable. So far, doped TiO 2 tends to yield only n-type semiconductors. We propose that p-type TiO 2 semiconducting materials may be obtained by nitrogen doping surface sites of low dimensional materials. In this study we report the results of density functional theory (DFT) and GW calculations of the energetic stability and electronic structure of recently suggested (TiO 2 ) n clusters (n e 9) 6 and novel (n,n) TiO 2 nanotubes (n e 4) in the undoped, boron doped, and nitrogen doped forms. The formation energy E form , density of states (DOS), and energy gap ε gap , for these systems are compared with that for 2D HexABC and anatase layers, and 3D TiO 2 anatase surface, anatase bulk, and rutile bulk phases. Furthermore, we analyze how boron and nitrogen doping influences the DOS for these systems, and how their nanostructure may determine whether the resulting semiconduc- tor is n-type or p-type. * To whom correspondence should be addressed. E-mail: dmowbray@ fysik.dtu.dk. J. Phys. Chem. C XXXX, xxx, 000 A 10.1021/jp904672p CCC: $40.75 XXXX American Chemical Society

Welcome message from author
This document is posted to help you gain knowledge. Please leave a comment to let me know what you think about it! Share it to your friends and learn new things together.
Transcript

Stability and Electronic Properties of TiO2 Nanostructures With and Without B andN Doping
D. J. Mowbray,* J. I. Martinez, J. M. Garcıa Lastra, K. S. Thygesen, and K. W. JacobsenCenter for Atomic-scale Materials Design, Department of Physics, Technical UniVersity of Denmark,DK-2800 Kgs. Lyngby, Denmark
ReceiVed: January 8, 2009
We address one of the main challenges to TiO2 photocatalysis, namely band gap narrowing, by combiningnanostructural changes with doping. With this aim we compare TiO2’s electronic properties for small 0Dclusters, 1D nanorods and nanotubes, 2D layers, and 3D surface and bulk phases using different approximationswithin density functional theory and GW calculations. In particular, we propose very small (R j 5 Å) butsurprisingly stable nanotubes with promising properties. The nanotubes are initially formed from TiO2 layerswith the PtO2 structure, with the smallest (2,2) nanotube relaxing to a rutile nanorod structure. We find thatquantum confinement effects, as expected, generally lead to a widening of the energy gap. However,substitutional doping with boron or nitrogen is found to give rise to (meta-)stable structures and the introductionof dopant and midgap states which effectively reduce the band gap. Boron is seen to always give rise ton-type doping while depending on the local bonding geometry, nitrogen may give rise to n-type or p-typedoping. For undercoordinated TiO2 surface structures found in clusters, nanorods, nanotubes, layers and surfacesnitrogen gives rise to acceptor states while for larger clusters and bulk structures donor states are introduced.
1. Introduction
Motivated by the world’s ever increasing need for cleanerburning fuels and more viable forms of renewable energy,hydrogen production via photocatalysis has been intenselyresearched as a possible candidate for addressing these issues.Since the first experimental formation of hydrogen by photo-catalysis in the early 1980s,1 TiO2 has been the catalyst ofchoice. Reasons for this include the position of TiO2’s conduc-tion band above the energy of hydrogen formation, the relativelylong lifetime of excited electrons which allows them to reachthe surface from the bulk, TiO2’s high corrosion resistancecompared to other metal oxides, and its relatively low cost.2-4
However, the large band gap of bulk TiO2 (≈3 eV) meansthat only high energy UV light may excite its electrons. Thiseffectively blocks most of the photons which pierce theatmosphere, typically in the visible range, from participatingin any bulk TiO2 based photocatalytic reaction. On the otherhand, the difference in energy between excited electrons andholes, i.e. the band gap, must be large enough (J1.23 eV) todissociate water into hydrogen and oxygen. For these reasonsit is of great interest to adjust the band gap εgap of TiO2 into therange 1.23 j εgap j 2.5 eV, while maintaining the usefulproperties mentioned above.5
With this aim, much research has been done on the influenceof TiO2 nanostructure6-10 and dopants5,11-17 on photocatalyticactivity. For low dimensional nanostructured materials, electronsand holes have to travel shorter distances to reach the surface,allowing for a shorter quasi-particle lifetime. However, due toquantum confinement effects, lower dimensional TiO2 nano-structures tend to have larger band gaps.18 On the other hand,although doping may introduce midgap states, recent experi-mental studies have shown that boron and nitrogen doping ofbulk TiO2 yields band gaps smaller than the threshold for water
splitting.11,12 This suggests that low dimensional structures withband gaps larger than about 3.0 eV may be a better startingpoint for doping.
The experimental synthesis and characterization of nano-structured materials is in general a costly and difficult task. Onthe other hand, modern electronic structure modeling has reacheda level where large-scale calculations can provide realisticdescriptions of structure and electronic properties.
Based on our investigation, we suggest as a promisingcandidate small (R j 5 Å) TiO2 nanotubes, with a hexagonalABC PtO2 structure (HexABC), which we find to be surprisinglystable, even in the boron and nitrogen doped forms. This stabilitymay be attributed to their structural similarity to bulk rutile TiO2,with the smallest nanotube having the same structure as a rutilenanorod.
A further difficulty for any photocatalytic system is control-ling how electrons and holes travel through the system.19 Forthis reason, methods for reliably producing both n-type andp-type TiO2 semiconducting materials are highly desirable. Sofar, doped TiO2 tends to yield only n-type semiconductors. Wepropose that p-type TiO2 semiconducting materials may beobtained by nitrogen doping surface sites of low dimensionalmaterials.
In this study we report the results of density functional theory(DFT) and GW calculations of the energetic stability andelectronic structure of recently suggested (TiO2)n clusters (n e9)6 and novel (n,n) TiO2 nanotubes (n e 4) in the undoped,boron doped, and nitrogen doped forms. The formation energyEform, density of states (DOS), and energy gap εgap, for thesesystems are compared with that for 2D HexABC and anataselayers, and 3D TiO2 anatase surface, anatase bulk, and rutilebulk phases. Furthermore, we analyze how boron and nitrogendoping influences the DOS for these systems, and how theirnanostructure may determine whether the resulting semiconduc-tor is n-type or p-type.
* To whom correspondence should be addressed. E-mail: [email protected].
J. Phys. Chem. C XXXX, xxx, 000 A
10.1021/jp904672p CCC: $40.75 XXXX American Chemical Society

In section 2 we describe the DFT and GW methodologiesused to obtain the energies and electronic structure of the studiedsystems. We compare the energetic stability of the systems insection 3. In section 4 we discuss the electronic structures ofthe systems, showing the DOS and energy gaps, followed by aconcluding section.
2. Methodology
All DFT calculations have employed the RPBE exchangecorrelation (xc)-functional.20 The plane-wave code DACAPO21,22
was used for structural minimization, the real-space codeOCTOPUS23 for charged calculations, and YAMBO24 withABINIT25 or PWscf26 for GW calculations. A plane-wave cutoffof 340 eV was used, with a Monkhorst-Pack k-point samplingof 1 × 1 × 12 for TiO2 nanotubes, where the nanotube axis isparallel to the z-axis, 12 × 12 × 1 for TiO2 layers and surfaces,where the normal direction is parallel to the z-axis, and 12 ×12 × 12 for TiO2 bulk phases. All structures have been relaxeduntil a maximum force below 0.04 eV/Å was obtained. Theoccupation of the one electron states was calculated at atemperature of kBT ≈ 0.1 eV for the periodic systems and kBT≈ 0.01 eV for the clusters, with all energies extrapolated to T) 0 K. Spin unpolarized calculations have been performed forthe undoped TiO2 systems, while spin polarized calculationshave been performed for all doped TiO2 systems, since the unitcells for the doped systems contain an odd number of electrons.
Doping of (TiO2)n clusters has been modeled by substitutinga single boron or nitrogen atom in each geometrically inequiva-lent oxygen site of the most stable isomer to determine the moststable doping site. Only clusters of sufficient size to obtainexperimentally realizable doping fractions j10% (5 e n e 9)have been considered.11-15
To model TiO2 nanotube doping, we have repeated theminimal unit cell four times along the tube axis, and substituteda single boron or nitrogen atom in each geometrically inequiva-lent oxygen site to obtain the most stable doped structure. Inthis way, dopant-dopant interactions are minimized by main-taining a dopant separation of approximately 12 Å. Thiscorresponds to experimentally realizable doping fractions of3.1%, 2.1%, and 1.6% for TiO2 (2,2) nanorods, (3,3) nanotubes,and (4,4) nanotubes, respectively.
Doping of TiO2 layers, surfaces, and bulks has been similarlymodeled by repeating the minimal unit cell twice in eachperiodic direction, and substituting a single boron or nitrogenatom in each geometrically inequivalent oxygen site to obtainthe most stable structure. Experimentally realizable dopingfractions of 5.6%, 3.1%, and 3.1% were thus obtained for thelayers, surfaces, and bulks respectively.
3. Energetic Stability
We define the formation energy Eform for a given structureconsisting of n TiO2 functional units as
where E[TinO2n-p-qBpNq] is the total energy for the system,E[TiO2] is the energy of an isolated TiO2 molecule, and E[O],E[B], and E[N] are the respective energies with reference togas phase species for O, B, and N. These have been obtainedusing the experimental doping reactions
where the formation reaction enthalpies are ∆H[H2O] ≈ -2.506eV and ∆H[B2H6] ≈ 0.377 eV, as taken from ref 27. This avoidsdifficulties associated with modeling isolated atoms and thetriplet state of molecular oxygen.
Figure 1 shows DFT calculated formation energies Eform forundoped, boron doped, and nitrogen doped forms of 0D (TiO2)n
clusters (n e 9), 1D (n,n) nanotubes (n e 4), 2D HexABC andanatase layers, and 3D anatase surface, anatase bulk, and rutilebulk phases.
From the formation energies, we see that (TiO2)n clustersbecome generally more stable with increasing size, as expected.On the other hand, the formation energies of the (n,n) TiO2
nanotubes (n e 4) suggest that they are all surprisingly stable,being more stable than the 2D structures and within ap-
Eform ) 1n
E[TinO2n-p-qBpNq] - E[TiO2]
-1n
(pE[B] + qE[N] - (p + q)E[O])(1)
E[O] ) E[H2O] - E[H2] - ∆H[H2O] (2)
E[B] ) 12
(E[B2H6] - 3E[H2] - ∆H[B2H3]) (3)
E[N] ) 12
E[N2] (4)
Figure 1. Formation energy Eform in eV per TiO2 functional unit versusTiO2 structure for 0D (TiO2)n clusters (n e 9), 1D TiO2 (2,2) nanorods,(3,3) nanotubes, and (4,4) nanotubes, 2D HexABC and anatase layers,and 3D anatase surface, anatase bulk, and rutile bulk phases. DFTcalculations using RPBE for the undoped (O, red), nitrogen doped (0,blue), and boron doped (∆, magenta) systems are shown. Note the sp2
character of oxygen in the more stable rutile and (2,2) nanorod structure,and the sp3 character of oxygen in the less stable layer and largernanotube structures.
B J. Phys. Chem. C, Vol. xxx, No. xx, XXXX Mowbray et al.
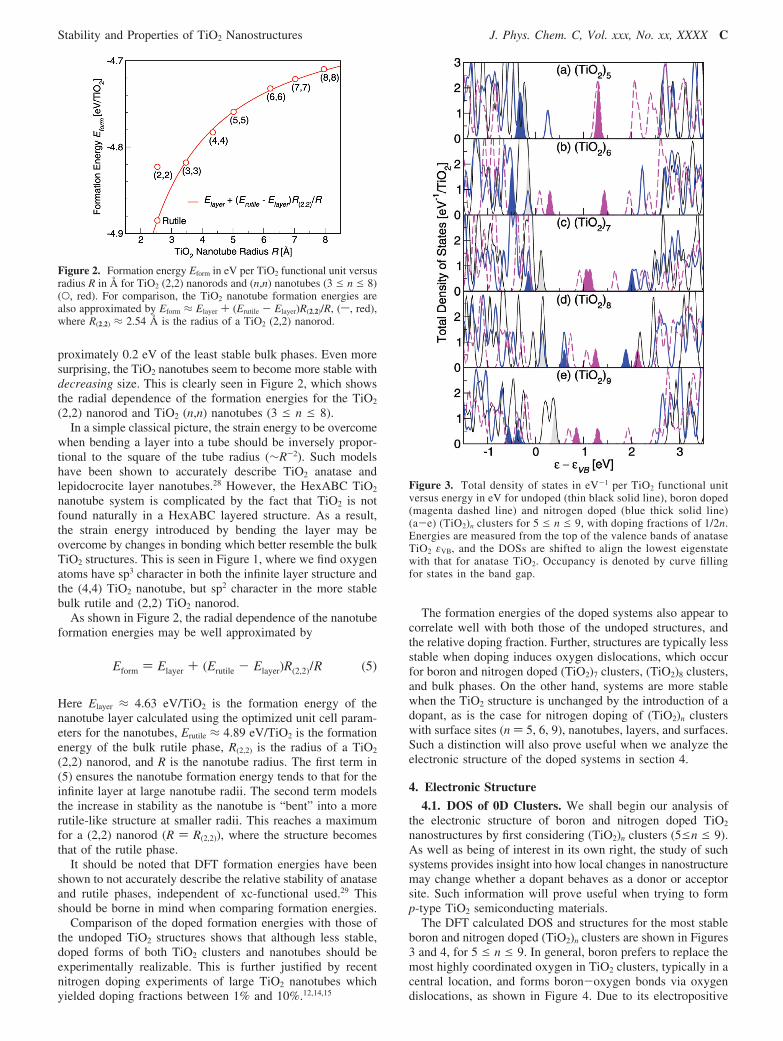
proximately 0.2 eV of the least stable bulk phases. Even moresurprising, the TiO2 nanotubes seem to become more stable withdecreasing size. This is clearly seen in Figure 2, which showsthe radial dependence of the formation energies for the TiO2
(2,2) nanorod and TiO2 (n,n) nanotubes (3 e n e 8).In a simple classical picture, the strain energy to be overcome
when bending a layer into a tube should be inversely propor-tional to the square of the tube radius (∼R-2). Such modelshave been shown to accurately describe TiO2 anatase andlepidocrocite layer nanotubes.28 However, the HexABC TiO2
nanotube system is complicated by the fact that TiO2 is notfound naturally in a HexABC layered structure. As a result,the strain energy introduced by bending the layer may beovercome by changes in bonding which better resemble the bulkTiO2 structures. This is seen in Figure 1, where we find oxygenatoms have sp3 character in both the infinite layer structure andthe (4,4) TiO2 nanotube, but sp2 character in the more stablebulk rutile and (2,2) TiO2 nanorod.
As shown in Figure 2, the radial dependence of the nanotubeformation energies may be well approximated by
Here Elayer ≈ 4.63 eV/TiO2 is the formation energy of thenanotube layer calculated using the optimized unit cell param-eters for the nanotubes, Erutile ≈ 4.89 eV/TiO2 is the formationenergy of the bulk rutile phase, R(2,2) is the radius of a TiO2
(2,2) nanorod, and R is the nanotube radius. The first term in(5) ensures the nanotube formation energy tends to that for theinfinite layer at large nanotube radii. The second term modelsthe increase in stability as the nanotube is “bent” into a morerutile-like structure at smaller radii. This reaches a maximumfor a (2,2) nanorod (R ) R(2,2)), where the structure becomesthat of the rutile phase.
It should be noted that DFT formation energies have beenshown to not accurately describe the relative stability of anataseand rutile phases, independent of xc-functional used.29 Thisshould be borne in mind when comparing formation energies.
Comparison of the doped formation energies with those ofthe undoped TiO2 structures shows that although less stable,doped forms of both TiO2 clusters and nanotubes should beexperimentally realizable. This is further justified by recentnitrogen doping experiments of large TiO2 nanotubes whichyielded doping fractions between 1% and 10%.12,14,15
The formation energies of the doped systems also appear tocorrelate well with both those of the undoped structures, andthe relative doping fraction. Further, structures are typically lessstable when doping induces oxygen dislocations, which occurfor boron and nitrogen doped (TiO2)7 clusters, (TiO2)8 clusters,and bulk phases. On the other hand, systems are more stablewhen the TiO2 structure is unchanged by the introduction of adopant, as is the case for nitrogen doping of (TiO2)n clusterswith surface sites (n ) 5, 6, 9), nanotubes, layers, and surfaces.Such a distinction will also prove useful when we analyze theelectronic structure of the doped systems in section 4.
4. Electronic Structure
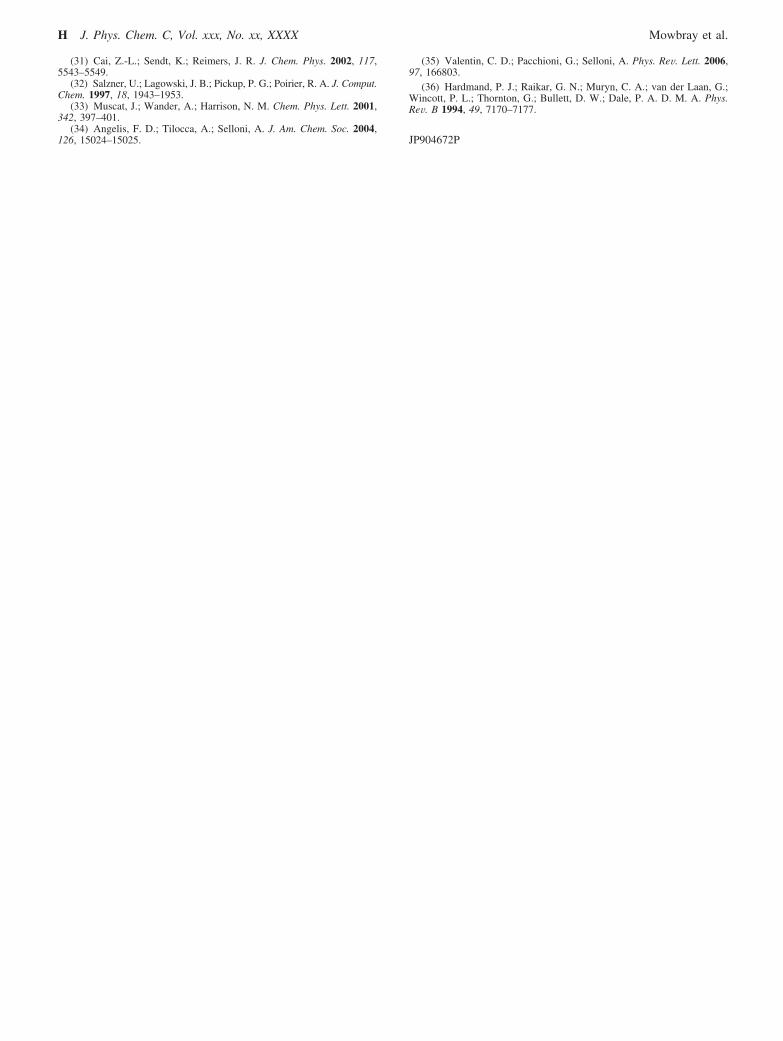
4.1. DOS of 0D Clusters. We shall begin our analysis ofthe electronic structure of boron and nitrogen doped TiO2
nanostructures by first considering (TiO2)n clusters (5en e 9).As well as being of interest in its own right, the study of suchsystems provides insight into how local changes in nanostructuremay change whether a dopant behaves as a donor or acceptorsite. Such information will prove useful when trying to formp-type TiO2 semiconducting materials.
The DFT calculated DOS and structures for the most stableboron and nitrogen doped (TiO2)n clusters are shown in Figures3 and 4, for 5 e n e 9. In general, boron prefers to replace themost highly coordinated oxygen in TiO2 clusters, typically in acentral location, and forms boron-oxygen bonds via oxygendislocations, as shown in Figure 4. Due to its electropositive
Figure 2. Formation energy Eform in eV per TiO2 functional unit versusradius R in Å for TiO2 (2,2) nanorods and (n,n) nanotubes (3 e n e 8)(O, red). For comparison, the TiO2 nanotube formation energies arealso approximated by Eform ≈ Elayer + (Erutile - Elayer)R(2,2)/R, (s, red),where R(2,2) ≈ 2.54 Å is the radius of a TiO2 (2,2) nanorod.
Eform ) Elayer + (Erutile - Elayer)R(2,2)/R (5)
Figure 3. Total density of states in eV-1 per TiO2 functional unitversus energy in eV for undoped (thin black solid line), boron doped(magenta dashed line) and nitrogen doped (blue thick solid line)(a-e) (TiO2)n clusters for 5 e n e 9, with doping fractions of 1/2n.Energies are measured from the top of the valence bands of anataseTiO2 εVB, and the DOSs are shifted to align the lowest eigenstatewith that for anatase TiO2. Occupancy is denoted by curve fillingfor states in the band gap.
Stability and Properties of TiO2 Nanostructures J. Phys. Chem. C, Vol. xxx, No. xx, XXXX C

character, boron acts as a donor, introducing three occupiedmidgap states near the lowest unoccupied molecular orbital(LUMO), as seen in Figure 3.
However, for (TiO2)n clusters the influence of nitrogendopants is not as straightforward. As with rutile TiO2 surfaces,16,17
nitrogen prefers to occupy sites which are 3-fold coordinatedto titanium. For clusters consisting only of surface sites (n ) 5,6, 9), oxygen is tightly constrained, and no significant changesin the cluster’s structure occur via oxygen dislocations, as shownin Figure 4. As with rutile TiO2 surfaces,16,17 nitrogen acts asan acceptor, introducing an unoccupied midgap state near thehighest occupied molecular orbital (HOMO).
For clusters where the nitrogen dopant’s oxygen neighborsoccupy interior/bulk sites (n ) 7, 8), oxygen is more mobile,and may form new nitrogen-oxygen bonds, as shown in Figure4. Since oxygen is more electronegative than nitrogen, nitrogenmay transfer charge to the bonding oxygen through these bonds.In this case, nitrogen instead acts as a donor, introducingoccupied states near the LUMO.
In general, we find when dopants form bonds with oxygenatoms via oxygen dislocations they act as donor sites. On theother hand, when dopants such as nitrogen leave the TiO2
structure unchanged, they act as acceptor sites, yielding a
somewhat more stable structure. We shall find such a descriptionuseful in understanding why nitrogen dopants behave differentlyin low dimensional systems and bulk systems.
4.2. DOS of 1D Nanorods and Nanotubes. We shall nowdiscuss how boron and nitrogen doping influences the electronicstructure of stable 1D nanorods and nanotubes. Although themost stable doping sites are the same as those obtained for dopedTiO2 rutile surface and bulk phases,5,16,17 the influence of dopantson the DOS is rather different.
Figure 5 shows the DFT calculated DOS and Figure 6 thestructures of the most stable boron doped and nitrogen dopedTiO2 (2,2) nanorods, (3,3) nanotubes, and (4,4) nanotubes. Thehighest occupied state is also shown as isosurfaces of (0.05e/Å3 in the side views of the doped structures.
As with TiO2 clusters, the influence of boron dopants on TiO2
nanorods and nanotubes may be understood in terms of boron’sweak electronegativity, especially when compared with thestrongly electronegative oxygen. We find that boron prefers tooccupy oxygen sites which are 2-fold coordinated to neighboringtitanium atoms. However, as with the 0D clusters, boron’srelatively electropositive character induces significant structuralchanges in the 1D structures, creating a stronger third bond toa neighboring 3-fold coordinated oxygen via an oxygen disloca-tion, as shown in Figure 5. This yields three occupied midgapstates localized on the boron dopant, which overlap both thevalence band O 2pπ and conduction band Ti 2dxy states, as shownin Figure 5. Boron dopants thus yield donor states near theconduction band, which may be photocatalytically active in thevisible region. However, the quantum confinement inherent inthese 1D structures may stretch these gaps, as found for theGW calculated DOS shown in Figure 7.
On the other hand, we find nitrogen dopants prefer to occupyoxygen sites which are 3-fold coordinated to Ti, as waspreviously found for the rutile TiO2 surface.16,17 This yields oneoccupied state at the top of the valence band and one unoccupiedmidgap state in the same spin channel. Both states are localized
Figure 4. Schematics of undoped (left), boron doped (middle), andnitrogen doped (right) (TiO2)n clusters for 5 e n e 9, with dopingfractions of 1/2n. Note the circled nitrogen-oxygen bonds in thenitrogen doped structures for n ) 7 and 8, where nitrogen acts as adonor.6
Figure 5. RPBE calculation of the total density of states in eV-1 perTiO2 functional unit versus energy in eV for undoped (thin black solidline), boron doped (magenta dashed line) and nitrogen doped (blue thicksolid line) TiO2 (a) (2,2) nanorods, (b) (3,3) nanotubes, and (c) (4,4)nanotubes, with 3.1%, 2.1%, and 1.6% doping respectively. Energiesare measured from the top of the valence bands of anatase TiO2 εVB,and the DOSs are shifted to align the lowest eigenstate with that foranatase TiO2. Occupancy is denoted by curve filling for states in theband gap.
D J. Phys. Chem. C, Vol. xxx, No. xx, XXXX Mowbray et al.

on the nitrogen dopant but overlap the valence band O 2pπ states,as shown in Figure 6. Nitrogen dopants thus act as acceptors,providing localized states well above the valence band, as isalso found for the GW calculated DOS shown in Figure 7.
Although we find nitrogen dopants act as acceptors in TiO2
1D structures, such large gaps between the valence band andthe unoccupied midgap states would not yield p-type semicon-ductors. This may be attributed to the substantial quantumconfinement in these 1D structures. However, for 2D and 3D
systems, we find it is possible to produce both p-type and n-typeclassical semiconductors.
4.3. DOS of 2D Layers, 3D Surfaces, and Bulks. Todetermine the reliability of our DFT and GW electronic structurecalculations, we now consider the influence of boron andnitrogen doping on the DOS for 2D and 3D TiO2 structures,which may be compared with recent experiments.
For the HexABC layer shown in Figure 8(a) and Figure 9,boron and nitrogen dopants act as donors and acceptorsrespectively, as was the case for the TiO2 nanotubes. However,for these 2D structures the doping states are sufficiently closein energy to the conduction band or valence band to allow chargetransfer for classical n-type or p-type doping by boron ornitrogen dopants, respectively. A similar behavior is found forthe anatase surface, shown in Figure 8(b) and Figure 9. Thissuggests boron and nitrogen doped 2D TiO2 layers or surfacesmay potentially be used for TiO2 based electronics.
On the other hand, for bulk anatase boron and nitrogendopants both yield n-type semiconductors, as is seen experi-mentally.13 We attribute this difference to the nitrogen-oxygenbond shown in Figure 8(c), which may arise due to oxygen’sgreater structural flexibility in the bulk. As a result, boron andnitrogen doping both yield midgap occupied Ti 2dxy conductionband states with little weight on the doping sites. Here, thedopants donate their valence electrons fully to the conductionband, as seen in Figure 8(c).
Nitrogen thus acts as a donor for bulk-like clusters andanatase, in agreement with recent findings for nitrogen dopingof both bulk anatase and thick bulk-like anatase nanopores.13
This suggests that n-type or p-type semiconductors may beproduced by nitrogen doping depending on whether nearbyoxygen atoms occupy lower-coordinated surface or higher-coordinated bulk sites.
Further, we also find that the highest occupied states for boronand nitrogen doped systems become increasingly localized asthe structure is dimensionally constrained from bulkf surfacef layer f nanotube f nanorod. This may have important
Figure 6. Schematics of boron doped (left) and nitrogen doped (right)TiO2 (2,2) nanorods, (3,3) nanotubes, and (4,4) nanotubes, with 3.1%,2.1%, and 1.6% doping, respectively. The highest occupied states forboron and nitrogen doped TiO2 1D structures are depicted by isosurfacesof (0.05 e/Å3.
Figure 7. GW calculation of the total density of states in eV-1 perTiO2 functional unit versus energy in eV for undoped (thin black solidline), boron doped (magenta dashed line) and nitrogen doped (blue thicksolid line) TiO2 (2,2) nanorods with 3.1% doping. Energies are measuredfrom the top of the valence bands of the undoped TiO2 nanorod εVB,and the DOSs are shifted to align the lowest eigenstate with that forthe undoped TiO2 nanorod. Occupancy is denoted by curve filling forstates in the band gap.
Figure 8. Total density of states in eV-1 per TiO2 functional unit versusenergy in eV for undoped (thin black solid line), boron doped (magentadashed line) and nitrogen doped (blue thick solid line) (a) TiO2 HexABClayer, (b) TiO2 anatase surface, and (c) bulk anatase, with 5.6%, 3.1%,and 3.1% doping respectively. Energies are measured from the top ofthe valence bands of anatase TiO2 εVB, and the DOSs are shifted toalign the lowest eigenstate with that for anatase TiO2. Occupancy isdenoted by curve filling for states in the band gap.
Stability and Properties of TiO2 Nanostructures J. Phys. Chem. C, Vol. xxx, No. xx, XXXX E

consequences for the photocatalytic activity of these morelocalized states in lower dimensional structures. On the otherhand, this may be partially alleviated by having these stateslocated on the structure’s surface. In this way, electron-holepairs need not travel significantly, as is the case for bulkmaterials.
4.4. Energy Gaps. To analyze the qualitative trends inphotocatalytic activity of boron and nitrogen doped TiO2
nanostructures, we shall now compare the energy gaps obtainedusing different approximations within DFT, GW calculations,and experiment.
The DFT calculated energy gaps εgap, for (TiO2)n clusters (ne 9) and band gaps for TiO2 (2,2) nanorods, (3,3) nanotubes,and (4,4) nanotubes, in the undoped, boron doped, and nitrogendoped forms, are shown in Figure 10. For the clusters, the gapis estimated by both the difference in energy between theHOMO and LUMO, and the difference between the ionizationpotential and electron affinity energies Ip - Ea. The band gapfor TiO2 nanorods, nanotubes, layers, surfaces and bulk phasesis approximated by the indirect band gap between highestoccupied and lowest unoccupied states. Although not as relevant
for photoabsorption as the direct gap, the large size requiredfor the doped super cells, shown in Figure 6 and Figure 9, leavesindirect and direct gaps indistinguishable. For the undopednanorods and nanotubes and bulk rutile we find the band gap isdirect, while for the undoped HexABC layer and anatasestructures we find the band gap is indirect. For the samestructures we also provide B3LYP band gaps, GW calculations,and experimental results for comparison.
As previous studies have shown, standard DFT tends tounderestimate band gaps for bulk TiO2 by approximately 1 eV,due in part to self-interaction errors.31,32 This may be partiallyaddressed by the use of hybrid functionals such as B3LYP,which generally seem to improve band gaps for bulk systems.33-35
However, B3LYP calculations for TiO2 clusters largely under-estimate the gap relative to the more reliable Ip - Ea, while forthe bulks the gap is overestimated by approximately 0.4 eVrelative to experiment. Also, B3LYP and RPBE calculationsprovide the same qualitative description of the trends in theenergy gaps for TiO2.
GW is probably the most successful and generally applicablemethod to calculate quasi-particle gaps. For clusters it agreeswell with Ip - Ea, but for bulk systems GW seems tooverestimate the experimental gap like B3LYP. This overesti-mation by GW may be attributed to excitonic effects, whichare not included in GW, or the role played by oxygen defects.36
Figure 9. Schematics of the boron doped (left) and nitrogen doped(right) HexABC layer, anatase surface, and anatase bulk phases, with5.6%, 3.1%, and 3.1% doping respectively. The highest occupied statesfor boron and nitrogen doped TiO2 2D and 3D structures are depictedby isosurfaces of (0.05 e/Å3. Note the circled nitrogen-oxygen bondsin the nitrogen doped structures for the bulk phase, where nitrogenacts as a donor.6
Figure 10. Energy gap εgap in eV versus TiO2 structure for 0D (TiO2)n
clusters (n e 9), 1D TiO2 (2,2) nanorods, (3,3) nanotubes, (4,4)nanotubes, 2D HexABC and anatase layers, and 3D anatase surface,anatase bulk, and rutile bulk phases. DFT calculations using RPBE ofthe highest occupied and lowest unoccupied state gaps/Ip - Ea for the(a) undoped (O/b, red), (b) boron doped (∆/2, magenta), and (c)nitrogen doped (0/9, blue) systems are compared with undoped B3LYP(1), GW (right pointing triangle), and experimental ([) results.6,12,18,30
Small open symbols denote transitions between highest fully occupiedstates and the conduction band.
F J. Phys. Chem. C, Vol. xxx, No. xx, XXXX Mowbray et al.

For these reasons, GW and DFT calculations are best used asupper and lower bounds for optical band gaps.
Figure 10 shows that for both 3D and 2D systems, RPBEgaps underestimate the experimental results by approximately1 eV. For 1D and 0D systems, we find a much larger differenceof about 4 and 5 eV, respectively, between the RPBE gaps andthe Ip - Ea and GW results. We may attribute this increasingdisparity to the greater quantum confinement and chargelocalization in the 1D and 0D systems, which yield greater self-interaction effects. We find B3LYP gaps also underestimate thiseffect, simply increasing the RPBE energy gaps for both 0Dand 3D systems by about 1.4 eV.
On the other hand, we find the RPBE gaps reproducequalitatively the structural dependence of the Ip - Ea, GW, andexperimental results for a given dimensionality, up to a constantshift. This is true even for 3D bulk systems, where standardDFT does not predict rutile to be the most stable,29 as shown inFigure 1.
Whether calculated using RPBE, Ip - Ea or GW, the energygaps for both boron and nitrogen doped TiO2 nanostructuresare generally narrowed, as shown in Figure 10b,c. However,for nitrogen doped (TiO2)n clusters where nitrogen acts as anacceptor (n ) 5, 6, 9), the energy gap is actually increased whenspin is conserved, compared to the undoped clusters in RPBE.This effect is not properly described by the N f N + 1transitions of Ip - Ea, for which spin is not conserved for thesenitrogen doped clusters. On the other hand, when nitrogen actsas a donor (n ) 7, 8) the smallest gap between energy levelsdoes conserve spin.
The boron doped TiO2 nanorods and nanotubes have perhapsthe most promising energy gap results of the TiO2 structuresconsidered herein, as seen in Figure 5b. Boron dopants introducein the nanorods localized occupied states near the conductionband edge in both RPBE (cf. Figures 5 and 6) and GW (cf.Figure 7) calculations. On the other hand, nitrogen doping ofnanorods and nanotubes introduces well-defined midgap states,as shown in Figure 5c. However, to perform water dissociation,the energy of the excited electron must be above that forhydrogen evolution, with respect to the vacuum level. This isnot the case for such a midgap state. This opens the possibilityof a second excitation from the midgap state to the conductionband. However, the cross section for such an excitation maybe rather low.
For boron doping of 2D and 3D structures, the highestoccupied state donates its electron almost entirely to theconduction band, yielding an n-type semiconductor. Thus at verylow temperatures, the RPBE band gap is very small. The sameis true for n -type nitrogen doped bulk anatase. For these reasons,we also provide the energy gap between the highest fullyoccupied state and the conduction band, which may be morerelevant for photoabsorption. We find these RPBE gaps are stillgenerally smaller than those for their undoped TiO2 counterparts.
In summary, for both boron and nitrogen doped clusters wefind RPBE gaps differ from Ip - Ea by about 3 eV, while fornitrogen doped anatase the RPBE gap differs from experimentby about 0.6 eV. Given the common shift of 1 eV for undoped2D and 3D structures, this suggests that both boron and nitrogendoped 2D TiO2 structures are promising candidates for photo-catalysis. Further, the boron and nitrogen doped 1D nanotuberesults also warrant further experimental investigation.
5. Conclusion
In conclusion, we have demonstrated how the electronicproperties of TiO2 may be “tailored” using nanostructural
changes in combination with boron and nitrogen doping.While boron doping tends to produce smaller band gap n-typesemiconductors, nitrogen doping produces p-type or n-typesemiconductors depending on whether or not nearby oxygenatoms occupy surface sites. This suggests that a p-type TiO2
semiconductor may be produced using nitrogen doping inconjunction with surface confinement at the nanoscale.
Acknowledgment. We thank S. In, Z.-W. Qu, G.-J. Kroes,T. Jaramillo, and J. K. Nørskov for useful discussions. Theauthors acknowledge financial support from NABIIT and theDanish Center for Scientific Computing. J.I.M. acknowledgesthe financial support of the STREP EU APOLLON-B Projectthrough Grant No. NMP3-CT-2006-033228. The Center forAtomic-scale Materials Design (CAMD) is sponsored by theLundbeck Foundation.
References and Notes
(1) Heller, A. Science 1984, 223, 1141–1148.(2) Gratzel, M. Nature 2001, 414, 338–344.(3) Hoffmann, M. R.; Martin, S. T.; Choi, W. Y.; Bahnmann, D. W.
Chem. ReV. 1995, 95, 69.(4) Khan, S. U. M.; Al-Shahry, M.; Ingler, W. B. Science 2002, 297,
2243.(5) Gai, Y.; Li, J.; Li, S.-S.; Xia, J.-B.; Wei, S.-H. Phys. ReV. Lett.
2009, 102, 036402.(6) Qu, Z.-W.; Kroes, G.-J. J. Phys. Chem. B 2006, 110, 8998–9007.(7) Zhai, H.-J.; Wang, L.-S. J. Am. Chem. Soc. 2007, 129, 3022–3026.(8) Imai, H.; Takei, Y.; Shimizu, K.; Matsuda, M.; Hirashima, H. J.
Mater. Chem. 1999, 9, 2971–2972.(9) Kasuga, T.; Hiramatsu, M.; Hoson, A.; Sekino, T.; Niihara, K. AdV.
Mater. 1999, 11, 1307–1311.(10) Mogilevsky, G.; Chen, Q.; Kulkarni, H.; Kleinhammes, A.; Mullins,
W. M.; Wu, Y. J. Phys. Chem. C 2008, 112, 3239–3246.(11) In, S.; Orlov, A.; Berg, R.; Carcıa, F.; Pedrosa-Jimenez, S.; Tikhov,
M. S.; Wright, D. S.; Lambert, R. M. J. Am. Chem. Soc. 2007, 129, 13790–13791.
(12) Liu, G.; Li, F.; Wang, D.-W.; Tang, D.-M.; Liu, C.; Ma, X.; Lu,G. Q.; Cheng, H.-M. Nanotechnology 2008, 19, 025606.
(13) Asahi, R.; Morikawa, T.; Ohwaki, T.; Akoki, K.; Taga, Y. Science2001, 298, 269–271.
(14) Ghicov, A.; Macak, J. M.; Tsuchiya, H.; Kunze, J.; Hæublein, V.;Kleber, S.; Schmuki, P. Chem. Phys. Lett. 2006, 419, 426–429.
(15) Chen, Y.; Zhang, S.; Yu, Y.; Wu, H.; Wang, S.; Zhu, B.; Huang,W.; Wu, S. J. Dispersion Sci. Technol. 2008, 29, 245–249.
(16) Nambu, A.; Graciani, J.; Rodriguez, J. A.; Wu, Q.; Fujita, E.; Sanz,J. F. J. Chem. Phys. 2006, 125, 094706.
(17) Graciani, J.; Alvarez, L. J.; Rodriguez, J. A.; Sanz, J. F. J. Phys.Chem. C 2008, 112, 2624–2631.
(18) Bavykin, D. V.; Friedrich, J. M.; Walsh, F. C. AdV. Mater. 2006,18, 2807–2824.
(19) Khaselev, O.; Turner, J. A. Science 1998, 280, 425–427.(20) Hammer, B.; Hansen, L. B.; Norskov, J. K. Phys. ReV. B 1999, 59,
7413–7421.(21) wiki.fysik.dtu.dk/dacapo.(22) Bahn, S. R.; Jacobsen, K. W. Comput. Sci. Eng. 2002, 4, 56–66.(23) Marques, M.; Castro, A.; Bertsch, G. F.; Rubio, A. Comput. Phys.
Commun. 2003, 151, 60–78.(24) Marini, A.; Hogan, C.; Gruning, M.; Varsano, D. Comput. Phys.
Commun. . in press.(25) Gonze, X.; Beuken, J.-M.; Caracas, R.; Detraux, F.; Fuchs, M. G.-
M.; Rignanese, L. S.; Verstraete, M.; Zerah, G.; Jollet, F.; Torrent, M.;Roy, A.; Mikami, M.; Ghosez, P.; Raty, J.-Y.; Allan, D. Comput. Mater.Sci. 2002, 25, 478–492.
(26) Baroni, S.; Corso, A. D.; de Gironcoli, S.; Giannozzi, P.; Cavazzoni,C.; Ballabio, G.; Scandolo, S.; Chiarotti, G.; Focher, P.; Pasquarello, A.;Laasonen, K.; Trave, A.; Car, R.; Marzari, N.; Kokalj, A. QUANTUM-ESPRESSO package, 2005. www.quantum-espresso.org/.
(27) Lide, D. Handbook of Chemistry and Physics, 87th ed.; CRC-Press:Boca Raton, FL, 2007.
(28) Enyashin, A. N.; Seifert, G. Phys. Stat. Sol. B 2005, 242, 1361–1370.
(29) Labat, F.; Baranek, P.; Doman, C.; Minot, C.; Adamo, C. J. Chem.Phys. 2007, 126, 154703.
(30) Thulin, L.; Guerra, J. Phy. ReV. B 2008, 77, 195112.
Stability and Properties of TiO2 Nanostructures J. Phys. Chem. C, Vol. xxx, No. xx, XXXX G
(31) Cai, Z.-L.; Sendt, K.; Reimers, J. R. J. Chem. Phys. 2002, 117,5543–5549.
(32) Salzner, U.; Lagowski, J. B.; Pickup, P. G.; Poirier, R. A. J. Comput.Chem. 1997, 18, 1943–1953.
(33) Muscat, J.; Wander, A.; Harrison, N. M. Chem. Phys. Lett. 2001,342, 397–401.
(34) Angelis, F. D.; Tilocca, A.; Selloni, A. J. Am. Chem. Soc. 2004,126, 15024–15025.
(35) Valentin, C. D.; Pacchioni, G.; Selloni, A. Phys. ReV. Lett. 2006,97, 166803.
(36) Hardmand, P. J.; Raikar, G. N.; Muryn, C. A.; van der Laan, G.;Wincott, P. L.; Thornton, G.; Bullett, D. W.; Dale, P. A. D. M. A. Phys.ReV. B 1994, 49, 7170–7177.
JP904672P
H J. Phys. Chem. C, Vol. xxx, No. xx, XXXX Mowbray et al.
Related Documents


![Time-dependent density-functional theory in massively parallel …nano-bio.ehu.es/files/articles/X._Andrade_JPCM_2012_810.pdf · Libxc [21]. This library is now completely independent](https://static.cupdf.com/doc/110x72/5f26dc61695f1c359a2718eb/time-dependent-density-functional-theory-in-massively-parallel-nano-bioehuesfilesarticlesxandradejpcm2012810pdf.jpg)
