IV RURAL CONSUMER BEHAVIOUR TOWARDS CONSUMER DURABLES................ 79-137 4.1 Introduction 79 4.2 Socio economic characteristics of selected respondents .............................................................. 81 4.3 Pre purchase behaviour of rural consumers towards consumer durables. .................................... 86 4.4 Purchase behaviour of rural consumers towards consumer durables ................................................... 110 4.5 Post purchase behaviour of consumers towards consumer durables. .................................................. 125 4.6 Concluding remarks.................................................. 136

Welcome message from author
This document is posted to help you gain knowledge. Please leave a comment to let me know what you think about it! Share it to your friends and learn new things together.
Transcript

IV RURAL CONSUMER BEHAVIOUR TOWARDS CONSUMER DURABLES................ 79-137
4.1 Introduction 79
4.2 Socio economic characteristics of selected respondents..............................................................
81
4.3 Pre purchase behaviour of rural consumers towards consumer durables. ....................................
86
4.4 Purchase behaviour of rural consumers towards consumer durables ...................................................
110
4.5 Post purchase behaviour of consumers towards consumer durables. ..................................................
125
4.6 Concluding remarks.................................................. 136

CHAPTER IV
RURAL CONSUMER BEHAVIOUR TOWARDS CONSUMER DURABLES
4.1 INTRODUCTION: In the earlier chapter we have seen that the characteristics
and behaviour of rural areas are different from urban areas and
hence consumer behaviour in rural areas deserve special attention.
Thus dynamics of rural consumer behaviour is the theme of the
present study. One of the objectives of the proposed study is to
examine the pre purchase, purchase and post purchase behaviour of
rural consumers towards consumer durable. This is attempted in this
chapter.
To examine the consumer behaviour towards consumer
durables in rural areas through a primary survey opinions were
collected from the households from the selected three zones namely
southern (Trivandrum District) Central (Thrissur District) and
Northern zone (Wayanad district). (The districts profile is given in
table 4.1.) The analysis was done under four main heads viz. Socio
economic profile of respondents, pre purchase behaviour, purchase
behaviour and post purchase behaviour.
79

Table 4.1 Profile of the Selected districts (2005)
Districts
Indicators Trivandrum Thrissur Wayanad
Human development
Index 0.773 0.795 .753
Rank 9 5 13
Population size in lakhs 32.35 29.75 7.87
Percentage share and total population
10.2 9.3 2.5
Area Sq. km. 21.92 30.32 21.31
Urban population (%) Rural population (total
33.78 28.21 3.76
Density of population 1476 981 369
Literacy rate 89.4 92.6 85.5
Gender related Development index 0.743 0.766 0.736
No. of Block Panchayats 12.0 17.0 3.0
No. of Grama Panchayats 78 92 25
No. of villages 116 151 49
Real per capita inland (PPDS) 3402 3717 2909
Work participation ratio 32.0 32.2 39.3
Household with pucca House (%) 42.6 68.1 60.4
Access to Electricity (%) 74.9 73.3 42.0
Source: Centre for Development Studies, 2005. Human development index, Centre for Development Studies, Kerala.
80

4.2 SOCIO ECONOMIC CHARACTERISTICS OF SELECTED
RESPONDENTS
Socio economic characteristics of consumers play a crucial
role in their behaviour towards consumption. The income,
education, sex, age and type of family influence their purchase
decisions both for essential goods and other comforts of life.
Therefore it is worthwhile to assess the socio economic profile of the
selected respondents before proceeding to the analyses of the
objectives.
Tables 4.2 to 4.7 represent the socio economic profile of the
respondents.
Sex -wise classification of respondents
Table 4.2 Sex -wise classification of Sample households
Sex Trivandrum Thrissur Wayanad Total percent to total
Male 76 48 73 197 65.7
Female 24 52 27 103 34.3
Total 100 100 100 300 100
Source: Primary data
Table 4.2 reveals the sex wise classification of the
respondents. It can be noticed that 65 percent of the respondents
represent males. In central zone, the female respondents are more
than the male respondents.
81

Age-wise classification of Respondents
Table 4.3 Age-wise classification of Sample households
Age Trivandrum Thrissur Wayanad Total percent to total
Below 20 Nil 4 Nil 4 2.6
20 to 30 28 31 8 67 22.3
30 to 40 34 25 28 87 29.0
40 to 50 25 21 42 86 28.7
50 and above 15 19 22 56 19.0
Source : Primary data
Age wise representation shows that majority of them belong
to the age group of 30 to 50 (57 percent) followed by 20 to 30 (22
percent) and 50 and above (19 percent) age group. Further it can be
noticed that majority of the people are in higher age group (40 to 50
group) in the case of northern region whereas in central zone and
south zone majority of the respondents are in lower age group i.e. in
between 20 to 30. The general classification reveals that all
respondents are matured enough to respond towards their behaviour
towards purchases.
82

Income-wise distribution of respondents
Table 4.4 Income-wise distribution of Sample households
Income
(Rs.) Trivandrum Thrissur Wayanad Total
percent
to total
Below 25,000 30 16 7 53 17.70
25,000 – 50,000 26 4 33 100 34.00
50,000 – 75,000 9 15 40 64 21.3
75,000 – 1,00,000 5 8 12 25 11.3
Above 1,00,000 30 18 8 56 18.7
Total 100 100 100 300 100
Source: Primary data.
Table 4.4 reveals that 30 percent of respondents in South
zone (SZ) came under the category of income below Rs.25,000 and
above one lakh followed by 26 percent under the category between
Rs.25,000 and 50,000 whereas in central zone (CZ), 43 percent
came under the category of Rs.25000 to Rs.50000 and 18 percent
under above 1 lakh. Only 16 percent came under below Rs.25,000/-.
The analysis of the respondents of northern region reveals that
majority of them (40 percent) came under the category of Rs.50,000
to Rs.75,000. Further 33 percent came under the category between
Rs.25,000 to Rs.50,000 followed by 12 percent under the category of
Rs.75,000 to one lakh. While, looking into the total respondents,
majority of them came under the category of Rs.25,000 to Rs.50,000
(34 percent) followed by Rs.50,000 to Rs.75,000 category (21.3
percent) and above one lakh category (18.7 percent). It can be
inferred from the table that majority of the respondents have an
income below Rs.75000 (78 percent) per annum.
83

Occupation -wise distribution of respondents
Table 4.5 Occupation -wise distribution of Sample households
Occupation Trivandrum Thrissur Wayanad Total Percent to total
Farmer 18 15 30 36 21.0
Labourers 31 24 5 60 20.0
Govt. Employees 21 12 21 54 18.0
Emigrant 15 8 26 49 16.3
Businessmen 5 5 3 13 4.3
Others 10 36 15 61 21.3
Total 100 100 100 300 100
Source : Primary data.
Table 4.5 depicts that farmers (21 percent) and labourers (20
percent) are the major occupation classes among the sample
respondents. Government employees represent 18 percent followed
by business people (16.3 percent). The rest of the respondents are
house-wives.
Region wise analysis of the respondents shows that labourers
are the major category (31 percent) in south zone, whereas, farmers
constitute majority in northern zone. In central zone, housewives
represent 36 percent of respondents followed by labourers (24
percent) and farmers (15 percent).
84

Education-wise classification of respondents
Table 4.6 Education -wise classification of Sample households
Particulars Trivandrum Thrissur Wayanad Total percent to total
Not literate Nil Nil 4 4 1.3
Upper Primary 15 8 2 25 11.3
High School 55 45 53 153 51.0
Graduates 24 46 53 103 34.3
Post-graduate 6 1 8 15 5.0
Total 100 100 100 300 100
Source: Primary data.
Educational status of the respondents influences the
perception and attitude towards the products to be selected. Table
4.6 depicts occupation wise classification. Out of the total
respondents 51 percent of them have education up to high school
level and 34.3 percent of them are graduates. This shows the high
level of literacy in rural areas. It can also be noticed that only 1.3
percent respondents are illiterate that too in northern region only.
The area-wise analysis does not show much difference in the
level of education in south, north and central zones.
85

Classification based on family size
The consumption pattern and behaviour of the households
normally vary with the family size. Details of the types of family in
which the respondents belong is shown in table 4.7
Table 4.7 Family size of Sample households
Family size Trivandrum Thrissur Wayanad Total percent to
total
Nuclear 64 51 62 177 59.0
Joint 36 49 38 123 41.0
Total 100 100 100 300 100.0
Source: Primary data
Table 4.7 represents that 59 percent of respondents belong
to nuclear family and the rest from joint family. Area-wise analysis
also shows the dominance of nuclear family over joint family.
With this background of socio economic profile of respondents
the study focused on the assessment of consumer behaviour towards
consumer durables.
4.3 PRE PURCHASE BEHAVIOUR OF CONSUMERS TOWARDS CONSUMER DURABLES
The consumer behaviour starts with the process involved
before making a purchase decision. Pre purchase behaviour actually
includes the understanding of a set of decisions viz. what, why,
when, how, where, how much and how often consumers are related
to the product. In this section the variables like market search of
consumers, decision maker in the family, motivation towards
86

purchase, awareness about the product and brands, sources of
awareness etc. are assessed for examining the pre purchase
behaviour. Separate analyses for different zones were also made to
find out inter regional differences.
Market Search of Respondents (Area wise)
Consumers in the new market economies are faced with an abundance
of choice never before experienced. Pre-purchase search occurs in response
to problem recognition, the major goal to make better purchase decision. So
the market search is a critical aspect for judgment and decision making
process.
Market search is assessed by collecting the opinions of
respondents with respect to the collection of information regarding
the quality and price of the products, available brands in the market,
the market outlets, opinion of the friends/relatives, the various
models available etc. Tables 4.8, 4.9 and 4.10 present the results of
the survey with respect to three zones.
87

Table 4.8 Market search towards selected consumer durables in South zone
(Figures in percentage)
Items/ Products
TV N=85
PC N=62
GS N=65
WW N=85
Fan N=100
Quality 94 84 63 58 98
Price 98 72 86 95 95
Brands 83 41 37 64 78
Marketing outlets 74 26 18 12 26
Enquiry friends/relatives/dealers 66 84 90 48 36
Habit of checking Model 48 18 12 52 8
Source: Primary data
It is clear from the table that more than 80 per cent of
respondents made a search of quality, price and brands available in
the case of TV, while price search is made by on an average 89 per
cent of the consumers for all the products. The brand search is
limited in the case of pressure cooker and gas stove. On an average
53 percent of consumers collected information from friends, relatives
and dealers before taking a purchase decision. For the purchase of
TV, the search of marketing outlets was more when compared to
other products. For gas stove consumers are much concerned about
the opinion of their friends, relatives and dealers.
88

Table 4.9 Market search towards consumer durables in Central zone
(Figures in percentage)
Items/
Products
TV
N=74
PC
N=62
GS
N=72
WW
N=100
Fan
N=100
Quality 99 55 85 90 95
Price 98 86 90 98 100
Brands 95 24 25 74 38
Marketing outlets 86 25 15 22 55
Enquiry friends/relatives/dealers 80 85 78 56 35
Habit of checking Model 75 10 12 48 12
Source : Primary data
In the central zone more than 85 per cent of the consumers
made market search on quality and price though an exception was
there for pressure cooker for which 85 percent of consumers enquire
to friends/relatives/dealers for getting information. It is because
mainly housewives are dealing with pressure cooker and they are
more accessible to get information from friends/relatives. It can be
further inferred that overall market search is more for TV compared
to other products. Habit of checking the model of the selected
products was comparatively less except in the case of TV. As TV is
a most expensive item among the selected products the consumers
may involve in an extensive decision making process.
89

Table 4.10 Market search towards consumer durables in North zone
(Figures in percentage)
Items/ Products
TV N=90
PC N=70
GS N=78
WW N=100
Fan N=100
Quality 98 64 70 78 90
Price 95 98 84 95 98
Brands 86 25 10 58 45
Marketing outlets 80 16 28 35 36
Enquiry friends/relatives/dealers 75 74 75 80 25
Habit of checking Model 48 20 15 65 5
Source : Primary data
Results of the market research in the north zone are
represented in Table 4.10. The percentage analysis showed that
majority of the respondents (i.e. above 90 per cent) searched for
price followed by the quality of the product. It also showed that for
the purchase of TV consumers collected information more about its
brand availability and marketing outlets. Only around 50 per cent of
respondents enquired to friends, relatives, about different models
available in the market. For the purchase of Pressure Cooker, Gas
Stove and Wrist Watch more than 75 per cent of the respondents
made an enquiry with their friends and relatives. Thus, the zone
wise analysis showed that irrespective of the area majority of the
consumers collected information on price and quality of the product
because they want to make a wise decision on purchase of durables
with their limited income.
90

Market search towards selected consumer durables (Total)
An analysis with respect to the total consumers selected in
relation to market search is presented in Table 4.11
Table 4.11 Market search towards consumer durables (Total) (Figures in percentage)
Items/ Products
TV N=249
PC N=194
GS N=215
WW N=285
Fan N=300
Quality 97 67 73 75 94
Price 97 85 80 96 98
Brands 88 30 24 65 54
Marketing outlets 81 22 20 23 39
Enquiry friends/relatives/dealers 68 81 81 61 22
Habit of checking Model 57 16 13 55 8
Source : Primary data
It can be observed from the table that market search with
respect to the selected durables was very high in the case of TV
when compared to other durables followed by wrist watch. This is
due to the availability of more sources of information about these two
products. Moreover with respect to TV as it is very expensive,
extensive problem solving will take place in the minds of rural
consumers. A variable wise analysis revealed that price was the
mostly searched variable followed by quality. The search for various
models and the market outlets was comparatively less. However it is
interesting to note that rural consumers were (63 percent) enquired
the various aspects of the products very often to their friends and
relatives before taking a decision on purchase.
Thus it can be observed that the consumer’s especially rural
consumers are involved in searching information about the different
91

aspects of a durable product before taking a purchase decision. As
opined by skinner (1990)1 when a consumer purchases an unfamiliar
expensive product he uses large number of criteria to evaluate
alternative brands and spends a great deal of time seeking
information and deciding on purchase.
Motivation behind the purchase of selected consumer durables
Motivation is the driving force within that causes a person to
take action to satisfy specific goals. Motives is defined as, “those
influences or considerations which provide the impulse to buy,
induce action or determine choices in the purchase of goods and
services. The motivation behind the purchase of durable products
may vary from product to product based on the nature of the product
and the services that provides to the consumer.
Tables 4.12, 4.13 and 4.14 exhibit the results of the primary
data related to motivation behind the purchase.
Table 4.12 Motivation behind the purchase of selected consumer durables (south zone)
Durables
Credit
Compulsion
Status
FestivalSeason
Necessity
Total
Television
9 (10)
--
15
(18)
12
(14)
49
(58)
85
(100)
Pressure Cooker
2
(3)
13
(21)
--
3
(5)
44
(71)
62
(100)
Gas Stove
5
(8)
2 (3)
--
--
58
(89)
65
(100)
Wrist Watch
--
--
--
--
85 (100)
85 (100)
Fan
19 (19)
2 (2) -- 12
(12) 67
(67) 100
(100)
Figures in brackets indicate percentage total. Source : Primary data.
92

It is observed from table 4.12 that, with respect to the
selected five durable items majority of the households opined that
they consider these products are necessary for life. But in case of
TV, only 58 percent of consumers considered it as a necessary item.
For others status and festival season offers also give motivation to
purchase. In the case of Pressure Cooker, their decision on
purchase is also influenced by the compulsion from the family
members. For fan 19 percent of the respondents were attracted by
the credit facility extended to them.
Table 4.13 Motivation behind the purchase of selected
consumer durables in Central zone
Products Credit Compulsion Necessary Total
Television 23 (31)
5 (7)
46
(62)
74 (100)
Pressure Cooker
--
--
62
(100)
62 (100)
Gas Stove
18 (25)
--
54
(75)
72 (100)
Wrist Watch --
--
100
(100)
100 (100)
Fan --
--
100
(100)
100 (100)
Figures in brackets indicate percentage total. Source : Primary data.
Table 4.13 revealed that the rural consumers consider all the
selected durables as essential for their daily life. In the case of TV
and Gas Stove, the credit facility offered also plays a major role in
motivating their purchase decisions. In the central zone, the agents
of various consumers are making door-to-door sale of Gas Stove on
an instalment basis to rural consumers as a part of their rural market
penetration. For other durables, the role of consumer credit,
93

compulsion, status and festival season as motivational factors were
very limited.
Table 4.14 Motivation behind the purchase of selected consumer
durables in North zone
Durables
Credit
Compulsion
Status
Festival Season
Necessary
Total
Television
2
(2)
7
(8)
10
(11)
3
(3)
68
(76)
90
Pressure Cooker
--
--
--
--
70
(100)
70
Gas Stove
5 (6
10
(13 )
--
--
63
(81 )
78
Wrist Watch
--
7
(7)
--
--
93
(93)
100
Fan
--
--
--
--
100
(100)
100
Figures in brackets indicate percentage to total. Source : Primary data.
The results presented in table 4.14 showed that necessity is
the major reason for purchase of selected durables. However, in
case of TV other factors like status (11 percent) and compulsion (10
percent) also have a role in influencing the consumers. For the
purchase of gas stove and Wrist Watch, compulsion was also a
factor that motivated the purchase decisions.
A comparison of the motivational factors of different zones
revealed that major motivation to purchase the selected products is
its essentiality. However, the ‘compulsion’ plays a role in the
southern and northern regions but not in central zone. It is due to
the fact that the major buyer in the case of these two zones are
mainly male members of the family and the purchase decisions with
94

respect to Pressure Cooker and Gas Stove are mainly taken by the
female members.
A consolidated picture of the total selected consumers with
respect to the motivation behind the purchase presented in table
4.15
Table 4.15 Motivation behind the purchase of selected
consumer durables of total respondents
Durables
Credit
Compulsion
Status
FestivalSeason
Necessary
Total
Television
34 (14)
12 (4)
25 (10)
15 (6)
163 (66)
249 (100)
Pressure Cooker
13 (7)
2 (1) -- 3
(2) 176 (90)
194 (100)
Gas Stove
28 (13)
12 (6) -- -- 125
(81) 215
(100)
Wrist Watch
-- 7 (2) -- -- 278
(98) 285
(100)
Fan
19 (6)
2 (1) -- 12
(4) 267 (89)
300 (100)
Figures in brackets indicate percentage to total. Source : Primary data.
Table reveals that necessity of the product was the major
motivation behind the purchase of selected consumer durables.
Availability of consumer credit also played a significant role in the
case of TV and Gas Stove, i.e. 14 and 13 percent respectively. In
the case of TV, status was the motivational factor for 10 percent of
the consumers. Compulsion and festival seasons motivated only few
respondents.
95

As a whole, rural people consider the selected consumer
durables as necessity of life. Many of these items considered either
a luxury earlier and now become essential item of life. This reveals
the dynamics in consumer behaviour and changing perceptions and
standard of living of the rural people.
Brand awareness towards selected consumer durables
A brand is a name, term, symbol or design or a combination of
them, which intended to identify the goods or services of one seller or a
group of sellers and to differentiate them from those of competitor. The
information regarding the awareness among the consumers about the
number of brands for each product will help the marketing men to
evaluate their strategies to create awareness among the consumers and
to identify their weakness.
For the purpose of the study the rural consumers asked
to recall the brands known to them on the selected products and
based on that, the following inferences are made with respect to
selected zones.
Brand Awareness of Sample Households of South Zone
The results revealed that the awareness about the BPL brand
of TV comes to 64 percent followed by Philips (56 percent) and
Sansui (52 percent) and Samsung (44 percent). The brands like
Onida, Videocon, Sony, Keltron and Solidaire also recalled only by
more than 30 percent of the respondents. Very few respondents
recall other brands. However, as a whole the consumers identified
around 18 brands of TV.
The major brands of Pressure Cooker identified by the
consumers of South zone include Prestige (41 percent) Hawkins (38
96

percent) and Chakson (16 percent). Only few respondents recalled
the brands like Miss Mary, Futura, Alfa and Butterfly.
The brand awareness towards Gas Stove revealed that
majority of the respondents is familiar with the Butterfly and
Jeevajyothi followed by Sunflame (18 percent), Mitaso (16 percent)
and supreme. Few respondents knew other brands like Hitachi,
Suvidha, Prestige, Agni and Sanyo.
Among the various brands of Wrist Watch it can be noticed
that ‘HMT’ (80 percent ) followed by Titan (64 percent) are the
mostly known brands. Other brands like seiko, sonato, timex, etc are
also familiar among a noticeable percentage of consumers.
The analysis on the brand awareness towards Fan revealed
that Usha (94) followed by Kaithan (32), Bajaj (28) and Polar (28)
are the most popular brands. Almost 14 brands of Fans are familiar
in this zone.
97
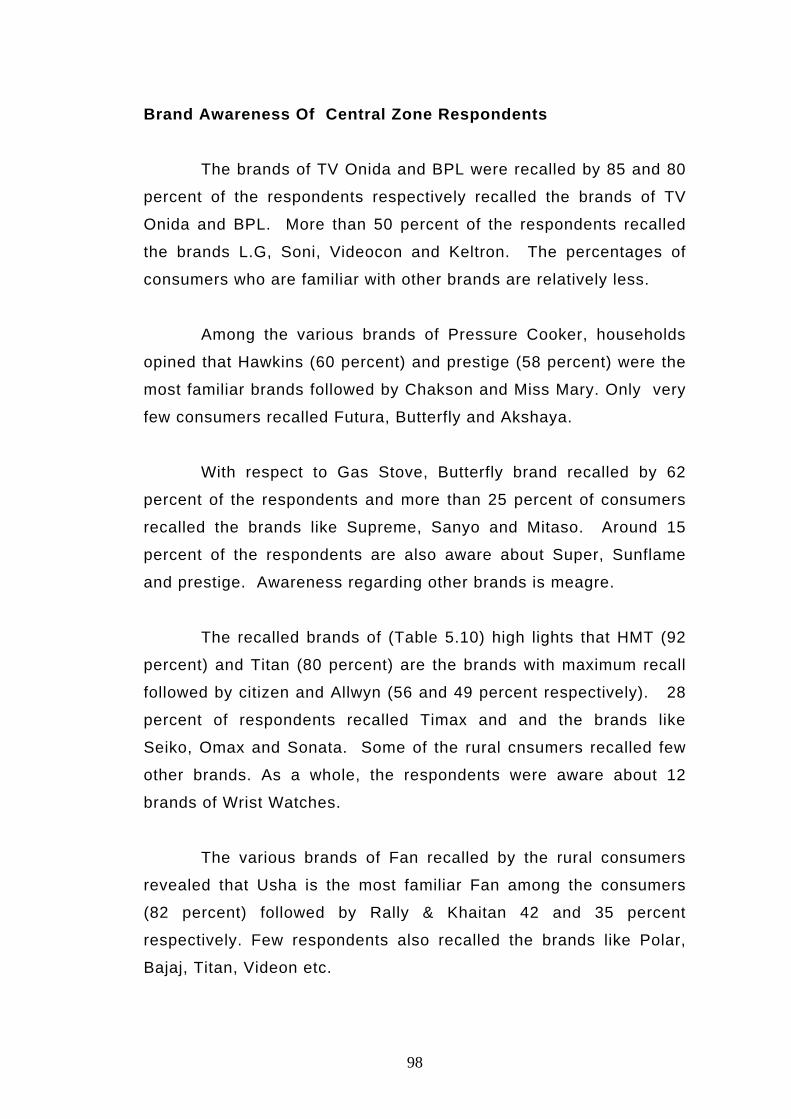
Brand Awareness Of Central Zone Respondents The brands of TV Onida and BPL were recalled by 85 and 80
percent of the respondents respectively recalled the brands of TV
Onida and BPL. More than 50 percent of the respondents recalled
the brands L.G, Soni, Videocon and Keltron. The percentages of
consumers who are familiar with other brands are relatively less.
Among the various brands of Pressure Cooker, households
opined that Hawkins (60 percent) and prestige (58 percent) were the
most familiar brands followed by Chakson and Miss Mary. Only very
few consumers recalled Futura, Butterfly and Akshaya.
With respect to Gas Stove, Butterfly brand recalled by 62
percent of the respondents and more than 25 percent of consumers
recalled the brands like Supreme, Sanyo and Mitaso. Around 15
percent of the respondents are also aware about Super, Sunflame
and prestige. Awareness regarding other brands is meagre.
The recalled brands of (Table 5.10) high lights that HMT (92
percent) and Titan (80 percent) are the brands with maximum recall
followed by citizen and Allwyn (56 and 49 percent respectively). 28
percent of respondents recalled Timax and and the brands like
Seiko, Omax and Sonata. Some of the rural cnsumers recalled few
other brands. As a whole, the respondents were aware about 12
brands of Wrist Watches.
The various brands of Fan recalled by the rural consumers
revealed that Usha is the most familiar Fan among the consumers
(82 percent) followed by Rally & Khaitan 42 and 35 percent
respectively. Few respondents also recalled the brands like Polar,
Bajaj, Titan, Videon etc.
98

Brand awareness of North Zone respondents Brand awareness towards T.V. revealed that BPL (86
percent) and Samsung ((70 percent) were the brands of TV recalled
by majority of the respondents followed by Onida, LG and Sansui; 68
percent, 65 percent and 65 percent respectively. As a whole, the
consumers identified around 18 brands but the number of people
who were aware about other brands was very few.
The brands of Pressure Cooker recalled by the respondents
revealed that average respondents were aware about 7 brands of
Pressure Cooker, Hawkins was the most familiar to them (56
percent) followed by prestige (43 percent). They also recalled the
brands like Chakson, Miss Mary, Futura, Alfa and Butterfly.
Majority of the respondents recalled Butterfly brand of gas
stove. 20, 18 and 17 percent of the consumers respectively recalled
brands BPL, Sanyo and Surya. Only few respondents recalled other
brands.
Cent percent of the respondents recalled HMT and 92
percent recalled Titan. Among others, comparatively popular brands
were Seiko (54 percent), Citizen (42 percent) and Timex 36 percent).
Very few respondents identified the rest of the brands.
In the case of Fan the rural consumers identified on an
average 11 brands. Among them Usha (84 percent) followed by
Khaitan (52 percent) recalled by majority of the respondents. 34, 26
and 27 percent of respondents also identified Crompton, Bajaj and
Polar.
Brand awareness of total Selected Households toward consumer
durables
An examination of brand awareness towards TV, revealed that
BPL (77percent) Onida (64 percent) and L.G. (51 percent) are the
most familiar brands among the rural consumers. A significant
99

percentage of consumers were also aware about the brands like
Soni, Videocon, Philips, Samsung and Sansui.
Among the brands of Pressure Cooker, the most familiar ones
were Hawkins (51 percent) Prestige (47 percent) and Chakson (25
percent). The awareness level was very low with respect to other
brands.
Butterfly brand of Gas Stove (56 percent) was the most
familiar brand followed by Supreme and Sanyo.
Brand Awareness with respect to Wrist Watch showed that
‘HMT’ brand known to 91 percent of consumers followed by Titan
(79 percent). The awareness regarding the brands like Citizen,
Seiko, Timex and Allwyn found to be high among the consumers.
The rural consumers identified almost 12 brands of fan.
Among them majority (87 percent) recalled ‘Usha” followed by
Khaitan (40 percent), Polar (27 percent), Crompton (25 percent) and
Rally (24 percent). Number of consumers who recalled other brands
were very few.
The brand awareness among the consumers was almost the
same in all the zones though these are minor variations. It is also
observed that the majority of respondents easily recalled the mostly
advertised brands. For instance for TV, BPL, Onida, for Pressure
Cooker, Hawkins and Prestige, for Gas Stove, Butterfly, for Wrist
Watch HMT and Titan and for FAN, Usha and Khaitan etc. The
knowledge about the awareness regarding the brands in the market
will help the marketers to chock out the brand awareness
programmes wherever necessary.
100

Sources of Information about the Consumer Durables The study with respect to the different sources of information
to rural consumers enables the marketers to know about the reach of
different media to rural areas. In the study an analysis was made to
know the different sources of information regarding the
products/brands and sources of availability and presented in
separate tables for three zones of Kerala.
Sources of Information about the Consumer Durables (Area wise)
Source of information of South Zone respondents
The sources of information with respect to the selected
durables are presented in table 4.16.
Table 4.16 Sources of Information of Selected households of South Zone
Sources of Information
TelevisionN = 85
PressureCooker N = 62
Gas StoveN = 65
Wrist Watch
N = 85
Fan
N = 100
Advertisement
37 (44)
45 (73)
40 (62)
49 (58)
53 (53)
Friends & Relatives
20 (24)
10 (16)
19 (29)
19 (22)
12 (12)
Neighbours
18 (21)
6 (10)
5 (8)
11 (12)
5 (5)
Agents
13 (15)
5 (8)
11 (17)
- 16 (16)
Dealers
8 (9)
11 (18)
- 18 (21)
14 (14)
Point of purchase 4 (5)
18 (29)
10 (15)
11 (12)
7 (7)
Total 85 62 65 85 100
Figures in brackets indicate percentage total (As the total responses is more that total respondents percentage may not equal to 100)
101

Source : Primary data It is observed from the table that Advertisement was the
major source of information for all durables. In the case of TV, Gas
Stove and Wrist Watch majority of the consumers gathered
information from friends and relatives. Neighbours and agents also
acted as a source of information for 29 percent of the consumers in
the case of Pressure Cooker. But for all other durables very few
consumers collected information from agent’, neighbours and
dealers.
Sources of Information of Central Zone respondents The results with respect to the sources of information in
central zone are presented in Table 4.17 Table 4.17 Sources of information of selected households of Central
zone
Sources of Information
TelevisionN=74
PressureCooker N=62
Gas Stove N=72
Wrist Watch N=100
Fan
N = 100 Advertisement
66 (89)
51 (82)
24 (33)
44 (44)
80 (80)
Friends & Relatives
22 (27)
18 (29)
32 (44)
29 (29)
10 (10)
Neighbours
10 (14)
7 (11)
7 (10)
5 (5)
5 (5)
Agents 12 (16)
2 (3)
-- 3 (3)
-
Dealers 8 (11)
3 (5)
8 (11)
12 (12)
12 (12)
Point of purchase
10 (14)
4 (6)
21 (29)
23 (23)
8 (8)
(Brackets indicate percentage of responses to total respondents. As the total responses is more than the number of respondents the percentage may not be equal to 100) Source : Primary data
It was clear from the table that similar to the south zone
advertisement was the main source of information for majority of the
rural consumers, except for Gas Stove. Second major source of
102

information was friends and relatives for all durable items. For Gas
Stove friends and relatives were the major source of information
followed by advertisement and point of purchase. Point of purchase
was also an information source for Television and Wrist Watch.
Gathering of information from other sources was limited for almost
all products.
Sources of information of North Zone respondents
Table 4.18 depicts the different sources of information for
consumers in the north zone.
Table 4.18 Sources of information of selected households of
north zone
Sources of Information
TelevisionN=90
PressureCookerN=70
GasStoveN=78
WristWatch N=100
Fan N=100
Advertisement 40(44) 31(44) 1(1) 55(55) 60(60)
Friends & Relatives
35(40) 14(20) 17(22) 24(24) 14(14)
Neighbours 1(1) 1(1) 1(1) 1(1) 12(12)
Agents 4(4) 2(3) 2(3) 2(2) 2(12)
Dealers 1(1) 1(1) 43(55) 5(5) 1(1)
Point of purchase
9(10) 13(19) 14(18) 13(13) 11(11)
Figures in bracket indicate percentage. Source : Primary data
It is clear from the table that for TV, Pressure Cooker, Wrist
Watch and Fan advertisement was the major source of information
for majority of the consumers. In the case of Gas Stove majority
depend on dealers (55 percent) as a source of information. Friends
and relatives were the second major source of all the consumer
durables. Point of purchase also contributed to provide information
103

on durables to consumers. Information collection from other sources
like dealers neighbours and agents were very limited.
While comparing the three zones of Kerala not many
variations noticed with respect to the different sources of
information. It may be because the marketers are providing
information about their products and brands by using almost same
media of communication and they are not concerned about using
different communication strategies for different regions.
Sources of Information of Total Selected rural households
Table 4.19 Sources of Information of Total selected rural households
Sources of Information
TelevisionN = 249
PressureCooker N=194
Gas Stove N=215
Wrist Watch
N =285
Fan N=300
Total N=1243
Advertisement 143 (57)
152 (78)
65 (30)
148 (52)
193 (64)
701 (56)
Friends & Relatives
77 (31)
42 (22)
68 (31)
22 (25)
36 (12)
295 (24)
Neighbours 29 (12)
14 (7)
10 (5)
17 (6)
22 (7)
92 (7)
Agents 29 (12)
9 (5)
13 (6)
5 (2)
18 (61)
74 (6)
Dealers 17 (7)
15 (8)
51 (24)
35 (12)
27 (9)
145 (12)
Point of purchase
23 (9)
35 (18)
46 (21)
47 (16)
26 (9)
177 (14)
Source : Primary data Note: Percentage does not tally due to the more than one source reported by the consumers.
It is very clear from table 4.19 that almost for 50 percent of the
selected consumers advertisement was the major source of
information followed by friends and relatives. This is similar to the
findings of Rodge (2001)2 that the rural consumers gave more
importance to the advertisement and its impact as compared to
urban consumers. Bhavaniprasad and Sitakumary (1987)3 also
104

observed that friends are the major source of influence followed by
advertisement for the consumer durables. Irrespective of the
improvements in the literacy, income and other socio economic
aspects rural consumers still depend upon their friends and relatives
as a source of information. It implies the need for collecting
feedback from the existing customers and for reducing post purchase
dissonance among them.
Decision makers
The person who decides the purchase normally influences pre
purchase behaviour of any product. Marketers have to concentrate
on decision makers while framing their promotional strategies. An
area wise analysis of the decision maker is shown in tables 4.20,
4.21 and 4.22.
105

Table 4.20 Decision makers on the purchase of consumer
durables in South zone
Products
Total
Father
Mother
Children
Both Father
and Mother
Father, Mother & Children
Mother &
Children
Television
85
22
(26)
-
--
42 (49)
19 (22)
2 (2)
Pressure Cooker
62
10 (16)
15 (24)
3 (5)
29 (47)
1 (2) 4 (6)
Gas Stove
65
10 (15)
15 (24)
3 (5)
23 (38)
11 (17)
3 (5)
Wrist Watch
85
18 (21)
7 (8)
15 (18)
32 (38)
11 (13)
2 (2)
Fan
100
13 (13)
11 (11)
15 (15)
48 (48)
13 (13)
-
Figures in bracket indicate percentage. Source : Primary data
It is revealed from table 4.20 that in the case of Television
mainly both father and mother take the decision to purchase (49
percent) followed by father alone (26 percent) and joint decision. In
the case of other products also decisions are taken by father and
mother jointly. In the case of Pressure Cooker and Gas Stove
‘mother alone’ plays a major role in taking the purchase decision (24
percent). ‘Father alone’ and sometimes ‘children alone’ influenced
the purchase decision on Wrist Watch. It is because of the fact that
Wrist Watch is purchased for individual use, users preference
dominate over others. In the case of Fan though majority of the
decisions are taken by father and mother jointly children also play a
role in the decision making process.
106

Table 4.21 Decision makers on the purchase of consumer
durables in Central zone
Products
Total
Father
Mother
Children
Both Father
& Mother
Father, Mother
& Children
Father &
Children
Mother &
Children
Television 74 (100)
18 (24)
-- 5 (7)
18 (24)
27 (37)
4 (5)
2 (3)
Pressure Cooker
62 9 (14)
11 (18)
6 (10)
34 (55)
-- -- 2 (3)
Gas Stove
72 8 (14)
2 (3)
4 (6)
41 (57)
10 (11)
1 (1)
6 (8)
Wrist Watch
100 51 (51)
2 (2)
8 (8)
33 (33)
2 (2)
3 (3)
1 (1)
Fan
100 84 (84)
2 (2)
5 (5)
9 (9)
-- -- --
Figures in bracket indicate percentage. Source : Primary data
The results of the survey in table 4.21 revealed that for the
purchase of TV majority of the respondents make joint decisions (37
percent) followed by father and mother jointly and father alone (24
percent each). In the case of ‘Pressure Cooker’ father and mother
jointly decide (55 percent) and for 18 percent of the households’
mother alone take the purchase decision. The decision maker in the
case of Gas Stove also was father and mother jointly. It is noticed
that father alone plays a major role in the decision regarding the
purchase. For the purchase of wrist watch it is clear from the table
that father alone was the major decision maker (51 percent) followed
by joint decision of father and mother.
North zone
Decision makers in the case of selected consumer durables
in the north zone depicted in table 4.22.
107

Table 4.22 Decision makers on the purchase of consumer
durables in north zone
Products Total Father Mother Children
Both
Father &
Mother
Father, Mother
& Children
Father & Children
Mother &
Children
Television 90 17
(19)
7
(8)
- 37
(41)
24
(27)
2
(2)
3
(3)
Pressure Cooker
70 12
(17)
4
(6)
-- 32
(46)
15
(21)
4
(6)
3
(4)
Gas Stove
78 15
(19)
3
(4)
- 31
(40)
20
(26)
5
(6)
3
(4)
Wrist Watch
100 19 (19)
12
(12)
4
(4)
33
(33)
24
(24)
3
(3)
5
(5)
Fan
100 21
(21)
6
(6)
5
(5)
37
(37)
21
(21)
3
(31)
7
(7)
Figures in bracket indicate percentage. Source : Primary data
The results revealed that in majority of the cases the joint
decisions are taken by father and mother with respect to the
purchase of all the selected durables The role of children and
mother alone seemed to be meagre in all cases.
108

Decision makers at All Kerala level
Decision makers at All Kerala level are presented in table
4.23 taking the total of all consumers of three zones.
Table 4.23 Decision makers on the purchase of consumer
durables by total respondents
Products
Total
Father
Mother
Child-
ren
Both Father
& Mother
Father, Mother & Children
Father &
Children
Mother&
Children
Television 249 57 (23)
7 (3)
5 (2)
97 (39)
70 (28)
6 (2)
7 (3)
Pressure Cooker
194 31 (16)
30 (15)
9 (5)
95 (49)
16 (8)
4 (2)
9 (5)
Gas Stove
215 33 (16)
20 (9)
7 (3)
95 (44)
41 (19)
6 (3)
12 (6)
Wrist Watch
285 88 (31)
21 (7)
27 (10)
98 (34)
37 (13)
6 (2)
8 (3)
Fan
300 118 (49)
19 (6)
25 (89)
94 (31)
34 (11)
3 (1)
7 (2)
Total
1243 327 (26)
97 (8)
73 (6)
479 (39)
198 (16)
25 (2)
43 (3)
Figures in bracket indicate percentages Source : primary data
It is observed from table 5.26 that both father and mother
together took the decision regarding the purchase of TV, Pressure
Cooker, Wrist Watch and Gas Stove. However, in the case of Fan
‘father alone’ took the decision in majority of the cases (40 percent)
followed by father and mother together. In the case of TV in about
28 percent cases the family members jointly took the decision. For
all other durables father alone dominated over mother and children
alone.
109

It may be inferred from the above tables that the differences
with respect to decision makers within three zones were marginal.
However, while looking into product wise it can be noticed that in the
case of TV family members together take the decisions in majority of
cases. In the case of Pressure Cooker and Gas Stove father and
mother took majority of the decisions whereas for Wrist Watch and
Fan father dominate the decision making. While taking the selected
durables as a whole (Table 4.23) domination of ‘father and mother’
together followed by father alone can be noticed.
Thus it can be concluded that family members are jointly
involving in the decision making process than the earlier concept of
the ‘head’ of the family making complete decisions as it is evident
from the findings of Xavier (1991)4 that in more than half of the
households husband is the major decision maker. The role of
women alone is not increasing up to the expectations though their
literacy level and social status is increasing. In a few cases father
consults with children for taking the purchase decisions.
The findings of the analysis confirmed the study of
Venkateswara and Rao (2000)5 that in the case of durables both
husband and wife together take the purchase decision.
4.4 PURCHASE BEHAVIOUR OF RURAL CONSUMERS TOWARDS CONSUMER DURABLES
Purchase is a consumer commitment for a product. It is the terminal
stage in the buying decision process. It occurs as either a trial and/or
adoption. If a consumer is buying something for the first time, a trial, and if
this experience is positive in terms of satisfaction derived, then repeat
purchase may occur. However, the possibility of a trial purchase is not
possible in the case of consumer durables. It is because of the fact that
once a product is purchased, it has to be adopted and repeatedly used.
110

Adoption means a consumer decision to commit to a fall or further use of
product. Therefore, consumer durables normally are not open for trial
purchase but will have to adopt only.
The analysis with respect to the behaviour of rural consumers
at the time of purchase of consumer durables was done with respect
to the indicators like, the possession of the durables; source of
purchase, actual buyer, mode of purchase, brand choice, reasons
behind the brand choice etc. by using percentages and ranks. This
will highlight the psyche of rural consumers at the time of purchase.
Actual Buyer of Consumer durables
Actual buyer is the person who makes actual purchase. As the
person who makes the purchase decision assumes importance in the
stages to decide upon what, for, how much, from where and how etc.
actual buyer of the product will have an influence on these factors.
So actual buyer’s behaviour at the time of purchase may influence
above decisions if the decision maker and the actual buyer were not
the same because the convenience of the buyer, his or her interest
towards a particular store/brand, personal relationships, availability
at the time of purchase etc. will also influence the purchase of the
products.
Actual buyer of consumer durables (Area wise)
South zone
Actual Buyer in the case of consumer durables of South zone
is depicted in Table 4.24.
111
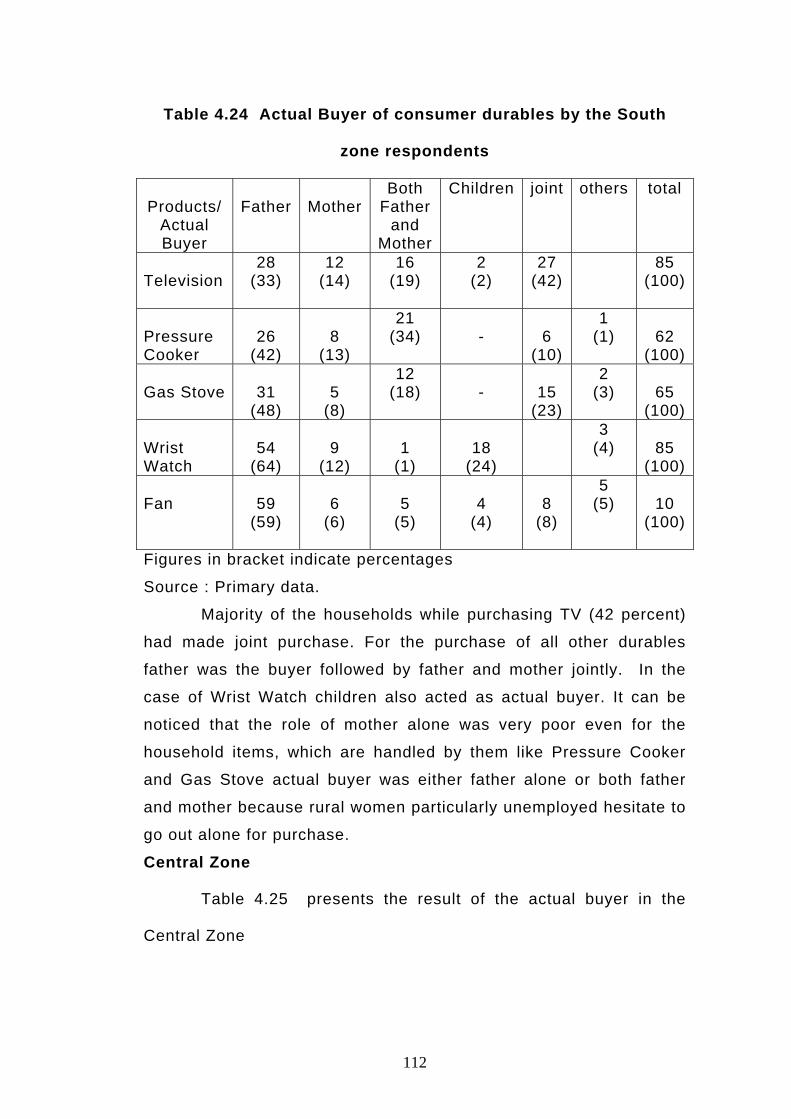
Table 4.24 Actual Buyer of consumer durables by the South
zone respondents
Products/
Actual Buyer
Father
Mother
Both Father
and Mother
Children joint others total
Television
28 (33)
12 (14)
16 (19)
2 (2)
27 (42)
85 (100)
Pressure Cooker
26
(42)
8
(13)
21 (34)
-
6
(10)
1 (1)
62
(100) Gas Stove
31
(48)
5
(8)
12 (18)
-
15
(23)
2 (3)
65
(100) Wrist Watch
54
(64)
9
(12)
1
(1)
18
(24)
3 (4)
85
(100) Fan
59
(59)
6
(6)
5
(5)
4
(4)
8
(8)
5 (5)
10
(100)
Figures in bracket indicate percentages
Source : Primary data.
Majority of the households while purchasing TV (42 percent)
had made joint purchase. For the purchase of all other durables
father was the buyer followed by father and mother jointly. In the
case of Wrist Watch children also acted as actual buyer. It can be
noticed that the role of mother alone was very poor even for the
household items, which are handled by them like Pressure Cooker
and Gas Stove actual buyer was either father alone or both father
and mother because rural women particularly unemployed hesitate to
go out alone for purchase.
Central Zone
Table 4.25 presents the result of the actual buyer in the
Central Zone
112

Table 4.25 Actual Buyer of consumer durables by the central zone
respondents
Products/ Actual Buyer
Father
Mother
Children
Father and
motherJoint Others Total
Television
13 (18)
2 (3)
--
35 (47)
24 (32)
--
74 (100)
Pressure Cooker
15
(24)
21
(34)
--
12
(19)
14
(23)
--
62
(100) Gas Stove
21
(29)
20
(28)
--
6
(8)
25
(35)
--
72
(100) Wrist Watch
52
(52)
5
(5)
8 (8)
-
35 (35)
--
100
(100) Fan
20
(20)
2
(2)
--
56
(56)
-
22
(22)
100
(100)
Figures in bracket indicate percentages Source : primary data
It is evident from table 4.25 that actual buyer of selected
consumer durables vary as the products vary. For television, actual
purchase made mainly by father and mother together followed jointly
by the members of the family. Further it can be noticed that in the
case of Pressure Cooker mother alone (34percent) was the actual
buyer. With respect to Gas Stove, the actual purchase is mainly
made ‘jointly’. Father alone and mother alone made the actual
purchase in certain cases i.e. 29 and 28 percent respectively. It can
be further noted from the table that watch is purchased mainly by
father alone (52 percent) followed by ‘jointly’. Eight percent of
children also engaged in the actual purchase. The role of mother in
this regard is only negligible. In the case of Fan for majority of the
cases actual buyer was father and mother together. It is interesting
to note from the analysis that neighbours and friends of the
respondents also act as actual buyer on behalf of the consumer.
113

North Zone
Table 4.26 presents actual buyers of selected consumer
durables in Wayanad region.
Table 4.26 Actual Buyer of consumer durables by the north zone
respondents
Products/ Actual Buyer
Father
Mother
Both Father and Mother
Children joint others total
Television
26 (28)
8 (9)
32 (36)
6 (7)
18 (20)
-
90 (100)
Pressure Cooker
10
(14)
9
(13)
36 (51)
2
(3)
11
(16)
2 (3)
70
(100)
Gas Stove
24 (31)
5
(6)
28 (36)
-
19
(24)
2 (3)
78
(100)
Wrist Watch
36
(36)
7
(7)
17
(17)
22
(22)
10
8 100
(100)
Fan 22
(22) 11
(11) 41
(41) 2
(2) 26
(26) 5
(5)
100 (100)
Figures in bracket indicate percentage to total Source : primary data
It is evident from table 5.29 that actual purchase of TV, Pressure
Cooker, Gas Stove and Fan mainly done by father and mother together. In the
case of Wrist Watch father alone mainly acts as actual buyer (36 percent)
followed by Children. (22 percent)
A comparison between the three zones reflects the
differences in the domination of consumers in the buying process. It
can be noticed from the above analysis that in the case of south and
north zones domination of ‘father’ can be noted in the actual
114

purchase but in central zone actual purchase is mainly made by
father and mother together.
The reason may be the socio economic profile of the respondents
of central zone. As noted in table 4.4 majority of the respondents were
female and their level of education was very high when compared to
other selected regions.
After making a comparison of the three zones in Kerala, it is
worthwhile to look into the overall behaviour of consumers with
respect to ‘actual buyer’.
Actual Buyer of consumer durables (Total)
Table 4.27 Actual Buyer of consumer durables by Total respondents
Products/ Actual Buyer
Father
Mother
Both Father and Mother
Children
Joint
Others
Total
Television
67 (27)
22 (9)
83 (33)
8 (3)
69 (28)
-
249 (100)
Pressure Cooker
51 (26)
38 (20)
69 (36)
2 (1)
31 (16)
3 (1)
194 (100)
Gas Stove
76 (35)
330 (14)
46 (21)
-
59 (27)
4 (3)
215 (100)
Wrist Watch
142 (77)
21 (7)
10 (6)
48 (17)
45 (16)
11 (4)
285 (100)
Fan
101 (34)
12 (4)
115 (38)
6 (2)
34 (11)
32 (11)
300 (100)
Total 437 (35)
123 (10)
331 (27)
64 (5)
238 (19)
50 (4)
1243 (100)
Figures in bracket indicate percentages Source : primary data It seems from table 4.27 that when considering the rural
consumers as a whole father and mother together made the
purchase in the case of TV, Pressure Cooker and Fan in the case of
majority of the households. In the case of Gas Stove and Wrist
115

Watch, father dominates. A noticeable percentage of respondents
also made purchase ‘jointly’ with their family members. Table further
revealed that the role of women alone and children is only marginal
as actual buyer except in the case of Pressure Cooker (20 percent
women alone) and Wrist Watch (17 percent children). Kulkarni and
Murali (1996)6 in their study on purchase practices of consumers
pointed that in the case of majority of the household’s, purchases
are done either by husband alone or by husband and wife together.
From the above discussion, it is clear that even with the high rate of
literacy and increasing employment among women, the role of
women, as an actual buyer is not so encouraging. It is also clear
from the analysis that the tendency for joint purchase is increasing
among rural folk. This is because of small size of family and
increased infrastructure and transportation facilities in rural areas.
Source of Purchase of Consumer durables
Source of purchase is a part of purchase behaviour of
consumers. The decisions regarding the sources of purchase
depends on many factors like availability, convenience, proximity,
availability of credit and so on. As far as rural consumer is
concerned, the shops dealing with consumer durables are rare due
to the lack of infrastructure to keep and maintain the durables.
Moreover, rural people did not mind to visit the nearby towns to
purchase on expensive item.
The following table gives the details regarding the preferences
for the sources of purchase of rural people in selected 3 zones of
Kerala.
South zone
Table 4.28 exhibits the preferred sources of purchase of rural
consumers
116

Table 4.28 Source of purchase of consumer durables by South
zone respondents
Source
Durables
Television
Pressure Cooker
Gas
Stove
Wrist
Watch
Fan
Town
72 (85)
58 (94)
60 (92)
61 (72)
84 (84)
Village shop
NIL
NIL
NIL
9 (11)
6 (6)
Abroad 8
(9)
NIL
NIL 8
(9)
NIL
Others
5 (6)
4 (6)
5 (8)
7 (8)
10 (10)
Total 85
(100) 62
(100) 65
(100) 85
(100) 100
(100)
Figures in bracket indicate percentages Source : primary data
The results presented in table 4.28 revealed that irrespective
of the nature of durables majority of the respondents preferred to
purchase the durables from town. Very few, that too only in the case
of Wrist Watch and Fan made purchase from village shops. Some of
the consumers brought the durables from abroad. Few got it as gift.
In certain cases, door delivery by agents was also done.
Central zone
The sources of purchase of consumer durables at Central
region consumers are exhibited in table 4.29.
117

Table 4.29 Source of purchase of consumer durables by Central
zone respondents
Source
Durables
Television
Pressure Cooker
Gas Stove
Wrist Watch
Fan
Town
61 (82)
62 (100)
42 (58)
59 (59)
68 (68)
Village shop
9 (12)
NIL
NIL
22 (22)
6 (6)
Abroad
4 (6)
NIL
6 (8)
12 (12)
1 [1]
Others
- - 24 (35)
7 (7)
25 (25]
Total
74 (100)
62 (100)
72 (100)
100 (100)
100 (100)
Figures in bracket indicate percentages Source : primary data
Similar to the results in Trivandrum, in Thrissur region also
consumers expressed their preference to purchase the durables from
the town shops. In case of TV, 12 percent of consumers purchase
from village shop. It is because there is a TV showroom not so far
from the villagers in that area. They are even offering TV on credit
even to the unemployed persons. For Wrist Watch 59 percent prefer
shops located in towns and 22 percent, village shops. For Pressure
Cooker cent percent of consumers preferred town shops whereas for
Gas Stove 33 percent purchased from ‘others’ i.e. from the agents
who directly brought the item at their homes.
North zone
Table 4.30 gives the results of preferred sources of purchase
in northern region.
118

Table 4.30 Source of purchase of selected consumer durables by
north zone respondents
Source
Durables
Television
Pressure Cooker
Gas
Stove
Wrist Watch
Fan
Town 75 (83)
68 (97)
60 (47)
52 (52)
74 (74)
Village shop
6 (7) --- 10
(13) 24
(24) --
Abroad 9 (10)
2 (3)
2 (3)
16 (16)
4 (4)
Others -- -- 6 (7)
8 (8)
22 (22)
Total 90 70 78 100 100 Figures in bracket indicate percentages Source : primary data
Town shops are selected by majority of the respondents in
the case of purchase of all durables selected. A noticeable share of
respondents preferred village shops for the purchase of Wrist Watch
(24 percent) and Gas Stove (13 percent). In the case of Fan 22
percent of the consumers purchased from other agencies. In this
area, there are agencies that supply selected items of home
appliances through their monthly kuri schemes.
A comparison of the sources of purchase of the 3 selected
zones revealed that, there is no difference among the regions
regarding the sources of purchase. Majority of them preferred to
purchase from town shops. The reason may be the non-availability
of the durables in their village shops and even if it is available,
choice of preferred brands may not be easy.
119

Sources of purchase of selected consumer durables (Total)
Table 4.31 Source of purchase of consumer durables (Total)
Source
Durables
TV
Pressure Cooker
Gas
Stove
Wrist
Watch
Fan
Town
208 (84)
188 (97)
162 (75)
172 (60)
226 (75)
Village shop
15 (6)
--
10 (5)
55 (19)
6 (2)
Abroad
21 (8)
2 (1)
8 (4)
36 (13)
11 (4)
Others
5 (2)
4 (2)
35 (16)
22 (8)
57 (19)
Total
249 (100)
194 (100)
215 (100)
285 (100)
300 (100)
Figures in bracket indicate percentages Source : primary data
It can be inferred from table 4.31 that majority of the rural
consumers prefer to buy consumer durables from town shops rather
than from village shops. i.e. it is above 60 per cent in all cases and
97 percent in the case of Pressure Cooker. The reason behind this
is the absence of village shops dealing with the selected durables
and even if the shops are there, the brand choice may be less. It
can be further noted that the preference towards the village shops
are comparatively high in the case of Wrist Watch (19 per cent)
because there are large number of watch dealers and repairers in
the sample area. The rural consumers having low income may
prefer these shops, since they are price conscious than quality or
brand.
In the light of the above analysis it can be concluded that
rural consumers preferred to purchase the durable items from town
shops. This calls for the need of exclusive showrooms and dealers
of durable items in rural areas.
120

Mode of Purchase
Mode of purchase means how consumers make their purchases by
paying the entire amount at a time or on credit. Consumer durables
normally considered as high value products compared to the non-
durables or consumables. As far as rural consumer is concerned, their
level of income is low and their affordability to purchase expensive
durable items is limited. However, all depends upon the policy of the
marketers as whether to offer credit facility to rural consumers and if so to
whom it offered under what conditions.
121

Mode of purchase (Area wise)
The preferred mode of purchase of consumer durable in South,
Central and North Zones are analysed below.
Mode of purchase of South zone respondents
Table 4.32 reveals the mode of purchase of selected durables in
South Zone.
Table 4.32 Mode of Purchase of sample households of south zone
Products Cash Credit/instalments Total
TV
51 (60)
34 (40)
85 (!00)
Pressure Cooker
62 (!00) -- 62
(!00)
Gas Stove
53 (82)
12 (18)
65 (!00)
Wrist Watch
85 (100) -- 85
(!00)
Fan
79 (79)
21 (21)
100 (100)
Figures in bracket indicate percentages Source : primary data
It can be inferred from table 4.32 that irrespective of the
category of the durables selected, majority of the respondents
preferred cash purchase. In the case of Pressure Cooker and Wrist
Watch it is cent percent. With respect to TV, 40 percent of
consumers preferred credit purchase. The reasons are high cost
and less affordability by rural consumers. For Gas Stove and Fan 18
and 21 percent of respondents respectively made credit purchase.
122

Central Zone
Mode of purchase of consumers in Central zone is presented in
table 4.33. Table 4.33 Mode of Purchase of sample households of central
zone.
Durables/Mode Cash Credit/instalments Total
Television
51 (69)
23 (31)
74 (100)
Pressure Cooker
62 (!00)
-- 62 (100)
Gas Stove
52 (72)
20 (28)
72 (100)
Wrist Watch
94 (94)
6 (6)
100
(100)
Fan
82 (82)
18 (18)
100 (100)
Figures in bracket indicate percentages Source : primary data
It is evident from table 4.33 that majority of the consumers preferred
cash purchase to credit purchase. It may be because of the lack of availability
of credit to low income group consumers. For the purchase of Pressure
Cooker cent percent paid in lump sum and for Wrist Watch only 6 percent
gone for credit purchase. In the case of TV, Gas Stove and Fan 31 percent,
28 percent and 18 percent respectively depend on credit purchase. It is also
observed that credit availability for TV is mainly extended for employed group
only. With respect to gas stove, agents of the product visit the doorsteps of
the rural consumers, made demonstrations and offered the items on credit.
Further, there are certain shops that offer consumer credit to purchase Fan
mainly based on personal relationships.
123

North zone
The results with respect to the mode of purchase of
consumer durables of northern region is given in table 4.34
Table 4.34 Mode of Purchase of sample households of north
zone
Products Cash Credit/instalments Total
Television
80 (89)
10 (11)
90 (100)
Pressure Cooker
70 (100) -- 70
(100) Gas Stove
78 (100) -- 78
(100)
Wrist Watch
100 (100) -- 100
(100) Fan
92 (92)
8 (8)
100 (100)
Figures in bracket indicate percentages Source : primary data
It is deduced from the table that except for the purchase of
TV and Fan all other selected durables are purchased for cash
payment. For TV and Fan 10 percent and 8 percent of consumers
respectively made credit purchase. However, as a whole the number
of persons opted for credit purchase was very less. While making a
comparison between the modes of purchase of three zones, in all
three regions consumers preferred cash purchase to credit purchase.
Credit purchase was preferred mainly in the case of TV in all cases.
Further, for the purchase of Pressure Cooker and Wrist Watch the
entire consumers preferred mostly cash purchase.
It is clear from the above discussions that irrespective of the
differences in the level of income among the consumers of the
selected regions, the mode of purchase did not vary. The reason
124

may be the similar type of sales policies adopted by marketers in all
the regions.
Mode of purchase of rural consumers in Kerala
A consolidated table is also preferred to get an over all idea
about the mode of purchase of rural consumers in Kerala.
Table 4.35 Mode of Purchase of total sample households
Products Cash Credit/ Instalments
Total
Television
182 (73)
67 (27)
249 (100)
Pressure Cooker
194 (!00)
-- 194 (100)
Gas Stove
183 (85)
32 (15)
215 (100)
Wrist Watch
279 (98)
6 (2)
285 (100)
Fan
253 (84)
47 (16)
300
(100) Figures in bracket indicate percentages Source : primary data
Table 4.35 clearly showed that majority of the respondents
made ready payments at the time of purchase of consumer durables.
The respondents resort to credit purchases is very few and maximum
credit purchase was made in the case of TV (27 percent) followed by
Fan (16 percent). The probable reason is that the consumer credit
facility is not offered to all sections of rural consumers evenly.
Another reason is that the income of the rural consumers is
increasing and they can afford the purchase of most of the durables.
4.5 POST PURCHASE BEHAVIOUR ANALYSIS
Post purchase behaviour refers to the behaviour of a
consumer after commitment to a product. It originates out of
125

consumer experiences regarding the use of the product and is
indicated in terms of satisfaction. This behaviour reflected in repeat
purchases or abstinence from further purchase. Consumers
sometimes develop post purchase decision dissonance as an
attempt to either confirm or disconfirm expectation by actually
engaging in acquisition, consumption or disposition. It can influence
consumer behaviour because it creates anxiety (an uncomfortable
feeling).
In this section an analysis of post purchase behaviour of rural
consumers with respect to consumer durables are made by analyzing
the satisfaction level of consumers towards the various attributes of
the selected durables like quality, price, durability, after sales
service, availability of component parts, Model of the product and
servicing cost. Moreover, the period of possession of the durables
and the intentions to shift the brand is also studied to know the
brand loyalty of the consumers.
Brand Loyalty
Brand loyalty occurs when consumers make a conscious
evaluation that a brand or Service satisfies their needs to a great
extent than others and because of this, they buy the same brand
repeatedly. Brand loyalty represents the most desirable situation for
marketers. They can build brand loyalty by offering high quality
product as well as by providing special incentives to the consumer
for repeat purchase. As far as consumer durables are concerned
changes in the technologies and arrival of different brands with
different product features will motivate the customers to own new
brands. Therefore, marketers should try hard to develop positive
post purchase behaviour among the consumers.
Brand loyalty was analysed in the study by taking into
consideration the period of possession of currently using brands and
126
by identifying the respondents having intentions to shift and actually
switched over to other brands.
Period of possession of currently using brand of selected durables An examination of how long a particular brand of a product is
in use by the consumers would reveal their brand loyalty. Period of
possession of the durables of 3 selected zones of Kerala is depicted
in tables, 4.36, 4.37 and 4.38.
Period of possession of durables in South Zone Table 4.36 depicts the results of south zone
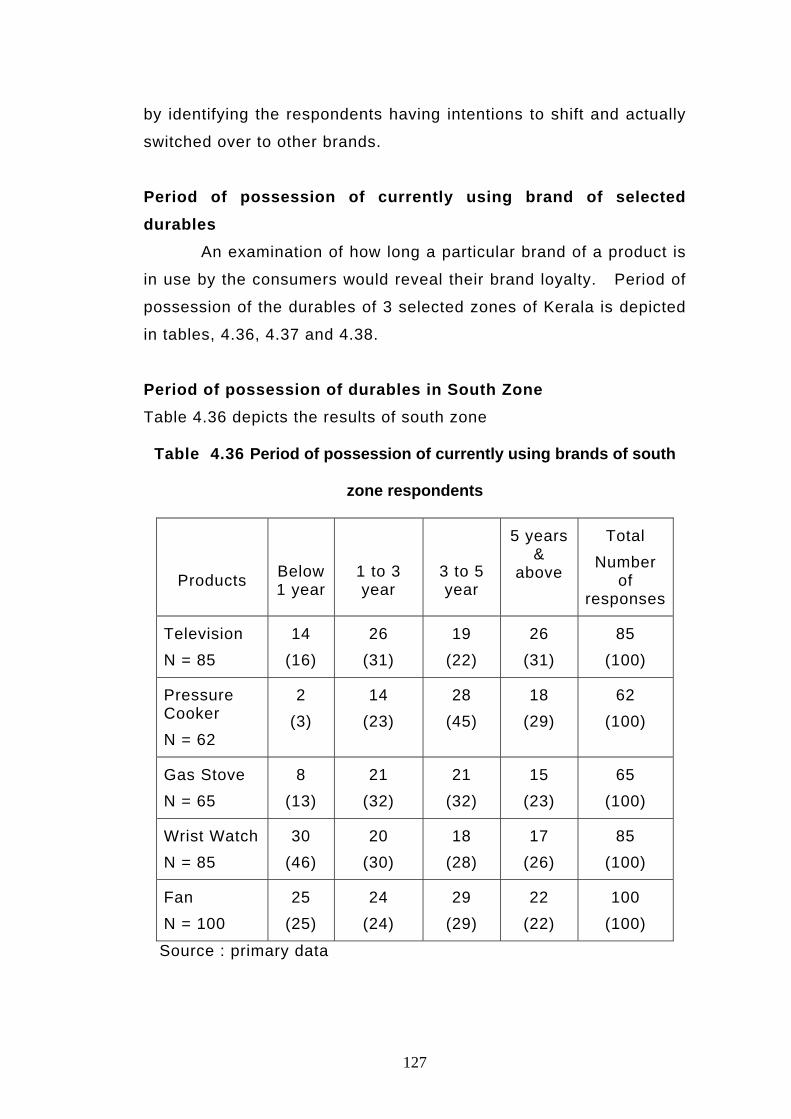
Table 4.36 Period of possession of currently using brands of south
zone respondents
Products
Below 1 year
1 to 3 year
3 to 5 year
5 years &
above
Total Number
of responses
Television N = 85
14 (16)
26 (31)
19 (22)
26 (31)
85 (100)
Pressure Cooker N = 62
2 (3)
14 (23)
28 (45)
18 (29)
62 (100)
Gas Stove N = 65
8 (13)
21 (32)
21 (32)
15 (23)
65 (100)
Wrist Watch N = 85
30 (46)
20 (30)
18 (28)
17 (26)
85 (100)
Fan N = 100
25 (25)
24 (24)
29 (29)
22 (22)
100 (100)
Source : primary data
127
It is clear from table 4.36 that 31 percent of the Television
users were using the same brand for a period of five years and
above and 1 to 3 years each and 22 percent of them were using the
same brand for 3 to 5 years recent users of TV (i.e. below 1 year)
account about 16 percent. In the case of Pressure Cooker, majority
of the consumers are using the same brand for a period of 3 to 5
years (45 percent) followed by the category 5 years and above (29
percent).
An analysis of the period of possession of Gas Stove revealed
that around 64 percent are using the same brand for 1 to 5 years and
23 percent of them come under ‘5 years above’ category.
The period of possession of currently using brands of wristwatch
showed that 46 percent of respondents are using the same brand for
below 1 year duration and around 30 percent of them are using it for
below 1 - 3 years duration.
With respect to the usage of various brands of Fan, the
percentage of consumers under various categories spread almost
equally. i.e. around 20 to 30 percent. Thus it can be inferred from
the table that same brand of fan was used by majority of the
respondents for a long period
128

Period of possession currently using brand of durables in Central zone
Table 4.37 Period of possession of currently using brands by sample respondents of central zone
Products Below 1
year 1 to 3 year
3 to 5 year
5 years & above
Total Number of responses
Television N = 74
4 (5)
20 (27)
16 (22)
34 (46)
74 (100)
Pressure Cooker N = 62
2 (3)
10 (16)
19 (31)
31 (50)
62 (100)
Gas Stove N = 72
23 (32)
27 (38)
10 (14)
12 (16)
72 (100)
Wrist Watch N = 100
22 (32)
10 (10)
36 (36)
32 (32)
100 (100)
Fan N = 100
12 (12)
85 (85)
22 (22)
33 (33)
152* (100)
Figures in brackets represents percentage to total number of respondents (N) Source : primary data
* Some respondents were using more than one brand.
It is evident from table 4.37 that in the case of TV 46 percent
come under the category of 5 years and above followed by 1 to 3
years (27 percent). With respect to Pressure Cooker, majority of the
consumers (50 percent) are using the same brand for 5 years and
above followed by the category of 3 to 5 years.
Regarding Gas Stove 38 percent possessed the same brand
for the last 1 to 3 years and 32 percent come under below 1-year
category. The percentage of consumers using same brand for more
than 3 years are limited
An analysis with respect to Wrist Watch showed that majority
of the consumers (36 percent) are using the same brand for a period
of 3 to 5 years followed by under the category of 5 years (32
percent).
129

The analysis with respect to Fan revealed that majority of the
consumers (85 percent) is using the same brand for duration of 1 to
3 years followed by the duration of 5 years by 33 percent of
consumers.
Period of possession of currently using brands in North zone
Table 4.38 exhibits the data with respect to north zone
Table 4.38 Period of possession of currently using brands by selected
households of north zone
Products Below 1 year
1 to 3 year
3 to 5 year
5 years & above
Total Number of responses
Television N = 90
5 (6)
22 (24)
38 (42)
25 (28)
90
Pressure Cooker N = 70
4 (6)
21 (30)
33 (47)
12 (17)
70
Gas Stove N = 78
12 (15)
18 (23)
32 (41)
16 (21)
78
Wrist Watch N = 100
11 (11)
18 (18)
45 (45)
26 (26)
100
Fan N = 100
28 (23)
23 (19)
37 (31)
32 (27)
120*
Parenthesis indicate percentage to total number of respondents (N) Source : primary data * More than one brand was used by some respondents
It is clear from table 4.38 that on an average 40 percent of
respondents are using the same brand of all the selected durables
for a period of 3 to 5 years . In the case of TV 28 percent comes
under the category of 5 years and above and 24 percent in the 1 to 3
years category. For Pressure Cooker and Gas Stove majority of the
consumers belong to one to 3 years duration. The period of
possession of currently using brand of Fan revealed that 85 percent
130

of the consumers are using the same brand for duration of 1 to 3
years.
Period of possession of consolidated table of rural consumers
(Total).
An overall analysis of the 3 zones are also made and depicted in
table 4.39.
Table 4.39 Period of possession of currently using brands by the total selected households
Products Below 1 year
1 to 3 years
3 to 5 years
5 years & above
Total responses
Television N = 249
23 (9)
68 (28)
73 (29)
85 (34)
249 (100)
Pressure Cooker N = 194
8 (4)
45 (23)
80 (41)
61 (32)
194 (100)
Gas Stove N = 215
43 (20)
66 (31)
63 (29)
43 (20)
215 (100)
Wrist Watch N = 285
63 (22)
48 (17)
99 (34)
75 (26)
285 (100)
Fan N = 300
65 (22)
32 (44)
88 (29)
87 (29)
372 (100)
Total N = (1243)
143 (12)
259 (21)
408 (33)
404 (33)
1315 (100)
Figures in bracket indicate percentages Source : primary data
From the table it can be inferred that majority of the users of
TV possess the same brand for more than 5 years (34 percent)
followed by 3 to 5 years category (29 percent) and also 1 to 3 years
category (28 percent). In the case of Pressure Cooker 3 to 5 years
131
category was more (i.e. 41 percent) followed by 1 to 5 years and
above category.
For Gas Stove majority of the users come under the category
of 3 to 5 years followed by 5 years and above. In the case of Wrist
Watch possession of a brand extended for the period up to 3 to 5
years for 34 per cent of rural consumers followed by 5 years and
above category.
The period of possession of Fan revealed that majority come
under the category of 1 to 3 years (44 per cent) followed by next two
categories i.e. 29 percent each.
In the light of the above analysis, it can be inferred that wide
variations cannot be noticed either with respect to the selected
consumer durables or with respect to different zones. However, it
can be noticed that brand loyalty towards TV was more as it is
evident from the Table that majority of the consumers were in
possession of currently using brand for more than 5 years. The
reason behind this may be that among the selected durable items,
TV is the most durable and expensive item considering the income
levels of rural consumers (refer Table 4.4). With respect to other
categories of durables, rural consumers showed a tendency to
change the brand. The persons engaged in the marketing of these
items should try to analyse the reasons behind this.
The analysis of brand loyalty will be incomplete without knowing
the brand shift among the consumers. Therefore, an attempt was also
made to analyse the consumers either shifted or intended to shift the
currently using brand.
132

Brand shift of consumer durables
As mentioned earlier, repeated purchase occurs with respect
to a particular brand only when consumers are satisfied with the
using brand. If his satisfaction is positive, he will stick on to his
brand and if it is negative, he will shift to alternative brands.
Although the products selected are durables the products undergo
changes day by day with respect to the model, product features,
size, colour and even in the use of the product. In these
circumstances whether consumer shifted the brand while purchasing
one more, or if he has any intention to shift, the using brand is a
matter to be examined.
Table 4.40 exhibited the brand shift/intention to shift the
brand of selected durables of selected regions.
133

Table 4.40
Brand shift of selected consumer durables by the selected rural households
South zone Central zone North zone Total
Durables
Intention to shift
the brand
Shifted the
brand for last5 years
Total
Intentionto shift
the brand
Shiftedthe
brand for last5 years
Total
Intentionto shift
the brand
Shifted the
brand for last5 years
Total
Intentionto shift
the brand
Shifted the
brand for last 5 years
Total
TV 22 (26)
16 (19)
38 (45)
7 (9)
11 (15)
18 (24)
11 (12)
16 (17)
27 (29)
40 (16)
43 (17)
83 (43)
Pressure Cooker
12 (19)
9 (15)
21 (34)
-- 8 (13)
8 (13)
-- 12 (17)
12 (17)
12 (6)
29 (15)
41 (21)
Gas Stove
10 (15)
5 (8)
15 (23)
-- 7 (16)
7 (10)
10 (13)
6 (8)
16 (21)
20 (9)
18 (8)
38 (17)
Wrist Watch
10 (15)
7 (11)
17 (26)
15 (15)
13 (13)
28 (28)
18 (18)
14 (14)
32 (32)
43 (15)
34 (12)
77 (27)
Fan 16 (16)
13 (13)
29 (29)
12 (12)
28 (28)
40 (40)
20 (20)
16 (16)
36 (36)
48 (16)
57 (19)
105 (35)
Figures in bracket indicate percentages Source : primary data
134

It is observed from the table that on an average 45 percent of
the consumers of Trivandrum region either have the intention to shift
the currently using brand or already shifted their brand of T.V. The
results in this respect are 24 percent in Thrissur region and 29
percent in northern region. With respect to Pressure Cooker, the
brand shift/intention to shift is around 34 percent, 13 percent and 17
percent in southern, central and northern regions respectively.
An analysis of brand shift with regard to Gas Stove showed
that the percentage of consumers intended to shift or shifted the
brand was low in central and comparatively better in other regions.
In the case of Wrist Watch, around 30 percent of respondents
are shifted or indented to shift the brand. Much difference not
noticed between regions. With respect to Fan, the percentage of
brand shift is 36 percent and 40 percent respectively in northern and
central zones and it is comparatively less in southern region.
Table 4.40 also gives a picture of the total selected rural
consumers of Kerala. It can be inferred from the table that the
shifted/intention to shift the brand is below 50 percent for all the
selected durables. This indicates that more than 50 percent of the
consumers are brand loyal. Among the durables, percentage of
brand shift is more in the case of TV and Fan (43 and 35 percent
respectively).
From the region wise analysis it can be inferred that, Central
zone consumers are more brand loyal in the case of the selected
durables except for Fan. It is further evident that southern zone
consumers are less brand loyalty is less compared to other regions.
However, an overall analysis reflects the fact that brand loyalty of
rural consumers is high as is evident from table 5.47 that on an
average below 40 percent of the respondents are either shifted or
intended to shift their currently using brand.
135
Concluding Remarks
From this chapter on the pre purchase and post purchase
behaviour of rural consumers towards consumer durables following
conclusions are made.
Pre purchase behaviour towards consumer durables revealed
that rural consumers are more concerned about the conformation search
regarding the quality, price, and availability of the durable items. The
role of advertisement as a major source of information also noticed from
the study. The shift from traditional beliefs of decision maker as head of
the family to the joint decision of father and mother also inferred in the
case of the purchase of durable items.
Rural consumers preference towards town shops is noticed from
the purchase behaviour of rural consumers. Even with the offer of
consumer credit, rural consumers preferred cash payments to credit
purchases. Rural consumers preference towards a specific brand
depends upon the quality and price of the brands.
Brand loyalty examined as part of post purchase behaviour
exhibited variations over regions. Central zone consumers are seen to
be more brand loyal and south zone consumers are less compared to
other regions. Further, the study revealed high level satisfaction with
respect to all the selected products. However inter regional variations
are also noticed over the regions.
List of Selected References
1. Skinner (1996). Marketing. Houghton Miffin Company, Boston. P.
689.
2. Rodge T.R. (2001). Influence of advertisement on consumer of
different age groups and areas. Indian Jl. Of Marketing Vol. 3 (4),
pp. 10-15.
136

3. Bhawani Prasad G.V. and Sitakumari, K.(1987). Impact of
advertising on consumer durable market. Indian Jl. Of Marketing
Vol.63, pp.19-31.
4. Xavier (1991). The Colour television buying decision – A Post
purchase analysis of Onida T.V. purchases. MBA project report,
School of Management Studies, Cochin University of Science and
Technology, Cochin p.121.
5. Venkteswaralu,H and Rao P.P. (2000). Women as consumer.
Vol.39.pp. 60-68.
6. Kulkarni M.S. and Murali D (1996). Study of purchasing practices
of consumers of Prabhani Town. Indian Jl. of Marketing.
Vol25(11)p.30.
________
137
Related Documents