Italy Private Equity Confidence Survey Outlook per il secondo semestre 2019 Outlook for the second semester 2019

Welcome message from author
This document is posted to help you gain knowledge. Please leave a comment to let me know what you think about it! Share it to your friends and learn new things together.
Transcript

Italy Private Equity Confidence Survey
Outlook per il secondo semestre 2019Outlook for the second semester 2019
A maggio 2018, Deloitte ha lanciato ufficialmente in Italia Deloitte Private, una business solution strategica che si colloca in un ampio spettro di iniziative dedicate alle aziende del Mid Market*, a testimonianza della grande attenzione e del significativo valore che Deloitte riconosce a questo segmento.
Partendo dall’ascolto dei bisogni, Deloitte affianca l’imprenditore posizionandosi come Trusted Business Advisor. In tale contesto, è in grado di fornire soluzioni multidisciplinari per:
• I Private Equity, nel loro approccio alle Piccole e Medie Imprese.
• Le imprese familiari e gli imprenditori.
• I Family Office e gli investitori privati.
• Le Piccole e Medie Imprese quotate e non quotate.
• Le micro-imprese.
Tra le varie iniziative sviluppate in ambito Deloitte Private, si inserisce la trentaseiesima edizione dell'Italy Private Equity Confidence Survey che fornisce indicazioni in merito alle attese dei principali operatori sull’andamento del settore per il secondo semestre 2019, sulla base dell’analisi condotta da Deloitte Financial Advisory S.r.l..
* Deloitte include in tale definizione le Piccole e Medie Imprese (“PMI”) e tutte quelle imprese che pur non essendo PMI ne posseggono i requisiti qualitativi (struttura proprietaria e di governance, mercati di riferimento, modelli organizzativi e manageriali, ecc.).
In May 2018, Deloitte officially launched in Italy Deloitte Private, a strategic business solution that is part of a wide range of initiatives dedicated to Mid-Market enterprises*, reflecting the great attention and significant value that Deloitte recognizes in this segment.
By first listening to its customers’ needs, Deloitte supports entrepreneurs and aims to position itself as a Trusted Business Advisor, providing tailored multi-disciplinary solutions for:
• Private equity firms, in their approach to SMEs
• Family businesses and entrepreneurs
• Family offices and private investors
• Public and private SMEs
• Micro-enterprises.
Among the initiatives developed under Deloitte Private sub-brand, there is the thirty-sixth edition of the Italy Private Equity Confidence Survey. The research, conducted by Deloitte Financial Advisory S.r.l., highlights the trends which should characterize the outlook of the sector for the months ahead, from the view point of the PE operators surveyed.
* Deloitte includes in this definition the Small and Medium-sized Enterprises ("SMEs") and all those companies that, although not SMEs, possess the qualitative requisites (ownership structure and governance, reference markets, organizational and managerial models, etc.).

Contenuti | Contents
4 Andamento del settore del PE in Italia nel primo semestre 2019
A snapshot of the activity in the Italian PE industry during the first semester of 2019
5 I risultati dello studio: Deloitte PE Index e le tendenze attese nel settore in Italia per il secondo semestre 2019
The Survey’s results: Deloitte PE Index and key trends expected in Italy for the second semester of 2019
7 Quadro macroeconomico e mercato del PE
Macroeconomic environment and PE market
9 Prossime attività degli operatori
Forthcoming activities of operators
10 Attività d'investimento: caratteristiche delle aziende target
Investment activity: target company characteristics
12 Attività d'investimento: caratteristiche dell'investimento
Investment activity & characteristics
14 Financing delle acquisizioni
Acquisition financing
16 Attività di disinvestimento
Divesting activity
17 Valore e rendimento dei portafogli
Portfolio value and return
3
Italy Private Equity Confidence Survey Outlook per il secondo semestre 2019 | Outlook for the second semester 2019

21 25 2519 21
1626
3237
29
46 42 43 42 41 39
54 5221
2216
1421
12
22
27
30
32
29 34 32 3228
22
21 26
4247
41
33
42
28
48
59
6761
75 76 75 7469
61
75 78
-
10
20
30
40
50
60
70
80
-
2
4
6
8
10
12
14
16
18
20
2S
2010
1S
2011
2S
2011
1S
2012
2S
2012
1S
2013
2S
2013
1S
2014
2S
2014
1S
2015
2S
2015
1S
2016
2S
2016
1S
2017
2S
2017
1S
2018
2S
2018
1S
2019
# d
eals
€bn
# of acquisition # of divestments Total Deal Value*
23
16
34
23
5
7
5
3
21
9 98
13
9
2 21
0
4
0
5
10
15
20
25
Industrial products
and services
Other consumer Other
manufacturing
Foods Other services TMT Energy Transportation Chemicals and
materials
Automotive Medical
# o
f deals
2S2018 1S2019
A snapshot of the activity in the Italian PE industry as of the first semester of 2019
4
The most active sector during the first semester of 2019 was the Industrial Products and Services, followed by Other Services and TMT.
The deals that generated the highest deal value during the last semester were:• The sale of DOC Generici S.p.A., by CVC Capital
Partners, which has been acquired by Capital Group Plc and Merieux Equity Partners S.A.S for a value of €1,1bn;
• The sale of Forgital S.p.A., by NB Aurora S.A. SICAF-RAIF, which has been acquired by the US PE firm Carlyle for a value of €1,0bn;
• The sale of Nuova Castelli S.p.A. by CharterhouseCapital Partners LLP, which has been acquired by Lactalis group for a value of €0,3bn;
Finally, a lower number of transactions in the Consumer, Chemical and Automotive sectors are observed compared to the second semester of 2018.
Durante il primo semestre 2019 sono state registrate complessivamente 78 operazioni condotte dagli operatori del PE in Italia per un controvalore complessivo* pari a circa € 7,6bn.Si osserva un numero di transazioni in crescita rispetto ai volumi registrati nel semestre precedente mentre il valore complessivo delle stesse risulta in leggera riduzione.
During the first semester of 2019, 78 transactions have been conducted in the Italian PE industry for a total deal value* of about € 7,6bn. The number of deals registered is slightly higher compared with the volumes observed in the last semesters while the total deal value is decreasing.
Inoltre il settore che ha visto gli operatori PE maggiormente coinvolti nel primo semestre 2019 è stato quello dei Prodotti e Servizi Industriali, seguito da quello degli Altri Servizi e dal TMT.
Tra le operazioni che hanno generato il maggior deal value nello scorso semestre sono da menzionare: • La cessione da parte del fondo CVC Capital Partners
della partecipazione in DOC Generici S.r.l., acquisita da Intermediate Capital Group Plc e Merieux Equity Partners S.A.S. per un valore di €1,1bn;
• La cessione da parte di NB Aurora S.A. SICAF-RAIF della partecipazione in Forgital S.p.A. acquisita dal fondo americano Carlyle per €1,0bn;
• La cessione di Nuova Castelli S.p.A al gruppo Lactalis S.A. da parte del fondo CharterhouseCapital Partners LLP per €0,3bn.
Infine, si osservano in diminuzione, rispetto al secondo semestre del 2018, il numero di operazioni avvenute nei settori Consumer, Chimico e dell’Automotive.
Andamento del settore del PE in Italia al primo semestre 2019
PE transactions breakdown by industry in Italy 2S2018 - 1S2019
Source: MergerMarket
PE transactions trend in Italy 2S2010 - 1S2019
Source: Mergermarket
*Only transactions with disclosed deal value
*
Italy Private Equity Confidence Survey Outlook per il secondo semestre 2019 | Outlook for the second semester 2019

I risultati dello studio: Deloitte PE Index e le tendenze attese nel settore in Italia per il secondo semestre 2019
Dall’analisi delle aspettative degli operatori circa le variabili critiche che influenzeranno il mercato del PE durante il secondo semestre del 2019, emergono segnali di stabilità in merito all’attuale ciclo congiunturale e ai volumi di attività di PE rispetto al semestre precedente.
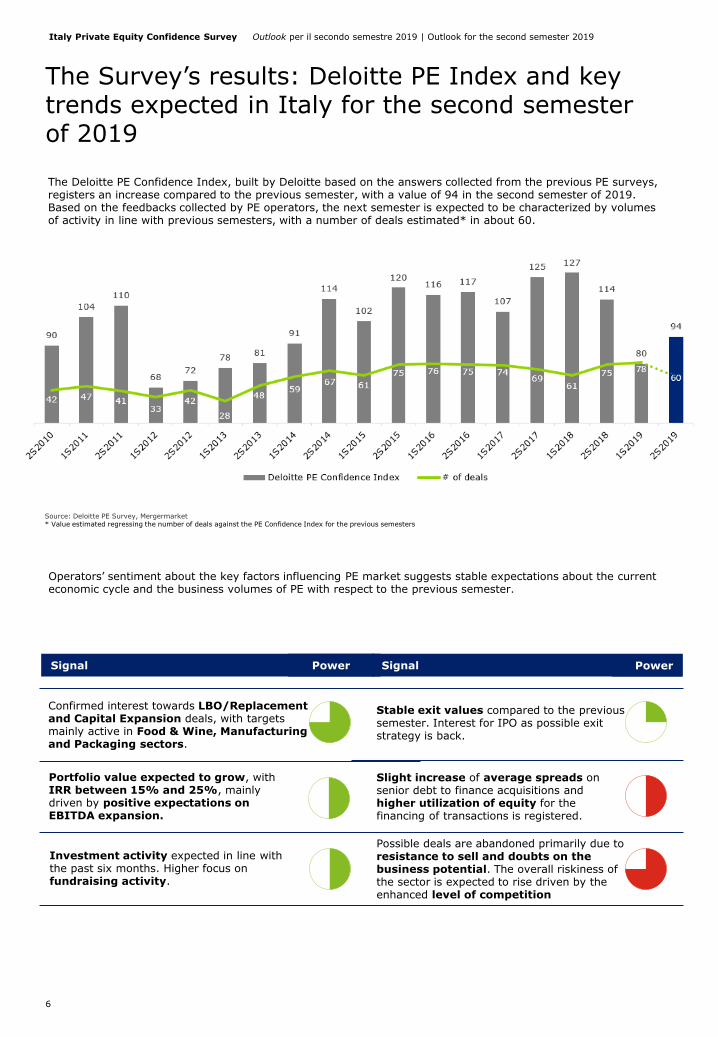
Il Deloitte PE Confidence Index, costruito sulla base dei dati raccolti nelle PE Survey condotte dal 2010 ad oggi, mostra un miglioramento rispetto al semestre precedente, riportando un valore di 94 per il secondo semestre 2019.Sulla base delle risposte raccolte tra gli operatori PE, i prossimi sei mesi saranno caratterizzati da un volume di attività in linea rispetto ai livelli dei semestri precedenti, stimato* in circa 60 operazioni.
Source: Deloitte PE Survey, Mergermarket* Valore stimato regredendo il numero di operazioni sul valore del PE Confidence Index dei precedenti semestri
5
Italy Private Equity Confidence Survey Outlook per il secondo semestre 2019 | Outlook for the second semester 2019
Segnale Forza
Tenuta dei valori di cessione rispetto al semestre precedente e rinnovato interesse verso le IPO come strategia di exit.
Si osserva un leggero aumento degli spread medi applicati nell’ambito di finanziamenti di operazioni di PE, e l’utilizzo di una maggiore percentuale di equity nel financing delle transazioni.
Valore dei portafogli atteso in crescita, con IRR attesi compresi tra il 15% e il 25%, principalmente legati ad attese positive sull’EBITDA expansion.
Operazioni scartate prevalentemente per dubbi emersi sulle potenzialità del business. Livello di rischio in aumento nel settore a causa dell’incremento atteso del livello di competizione.
Attività di investimento attesa almeno pari al semestre precedente. Maggior focus verso l’attività di fundraising.
Conferma dell’interesse verso operazioni di LBO/Replacement e Capital Expansion con aziende attive nei settori Food & Wine, Manifatturiero e del Packaging.
Segnale Forza
*
The Survey’s results: Deloitte PE Index and key trends expected in Italy for the second semester of 2019
6
The Deloitte PE Confidence Index, built by Deloitte based on the answers collected from the previous PE surveys, registers an increase compared to the previous semester, with a value of 94 in the second semester of 2019. Based on the feedbacks collected by PE operators, the next semester is expected to be characterized by volumes of activity in line with previous semesters, with a number of deals estimated* in about 60.
Operators’ sentiment about the key factors influencing PE market suggests stable expectations about the current economic cycle and the business volumes of PE with respect to the previous semester.
Source: Deloitte PE Survey, Mergermarket* Value estimated regressing the number of deals against the PE Confidence Index for the previous semesters
Italy Private Equity Confidence Survey Outlook per il secondo semestre 2019 | Outlook for the second semester 2019
Signal Power
Possible deals are abandoned primarily due to resistance to sell and doubts on the business potential. The overall riskiness of the sector is expected to rise driven by the enhanced level of competition
Slight increase of average spreads on senior debt to finance acquisitions and higher utilization of equity for the financing of transactions is registered.
Portfolio value expected to grow, with IRR between 15% and 25%, mainly driven by positive expectations on EBITDA expansion.
Stable exit values compared to the previous semester. Interest for IPO as possible exit strategy is back.
Investment activity expected in line with the past six months. Higher focus on fundraising activity.
Confirmed interest towards LBO/Replacement and Capital Expansion deals, with targets mainly active in Food & Wine, Manufacturingand Packaging sectors.
Signal Power
45
40
*
8,8% 7,9% 8,1% 5,4% 9,3% 7,9%
44,1%26,3% 18,9% 21,6%
41,9%26,3%
23,5%
18,4%16,2% 18,9%
18,6%34,2%
8,8%
7,9% 13,5%
14,0%7,9%
14,7%
39,5%56,8%
40,5%16,3%
23,7%
0%
20%
40%
60%
80%
100%
1S 2017 2S 2017 1S 2018 2S 2018 1S 2019 2S 2019
Question 3 - I expect the effects of the economic and financial crisis to influence the PE market until:
The next 6 months The next 12 months
The next 18 months Beyond the next 18 months
No longer influencing
Quadromacroeconomicoe mercato del PE
Macroeconomicenvironmentand PE market
Outlook macroeconomico stabile rispetto al semestre precedente e aspettative positive relativamente all’attività d’investimento.
Stable sentiment regarding the macroeconomic scenario compared to the previous semester and positive expected level of investment activity.
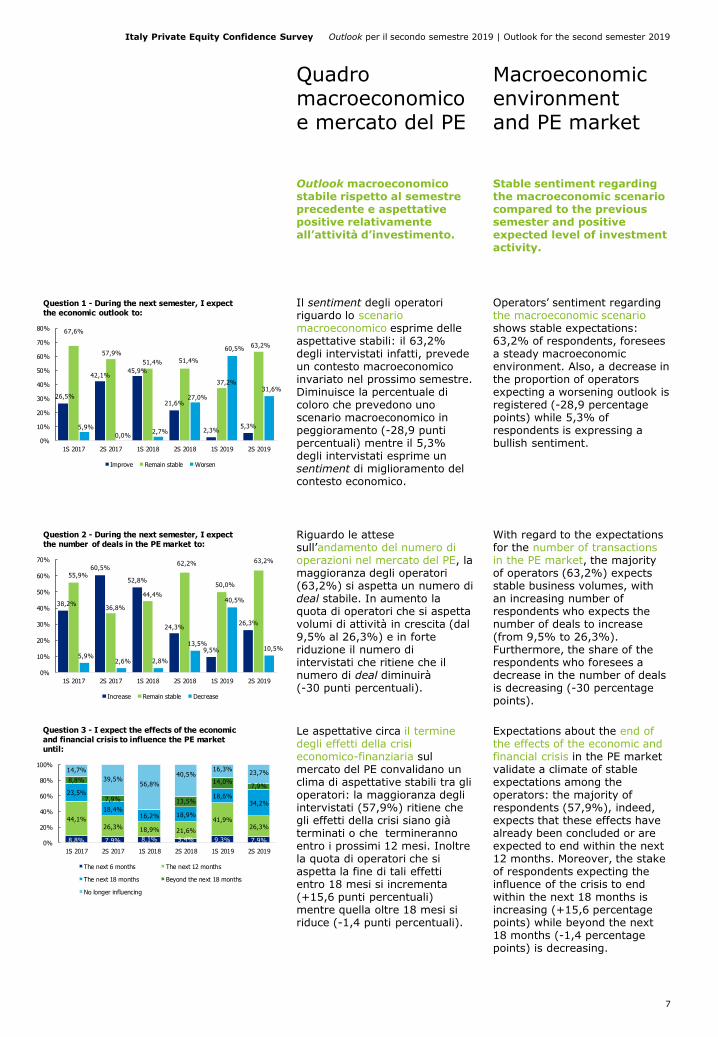
Il sentiment degli operatori riguardo lo scenario macroeconomico esprime delle aspettative stabili: il 63,2% degli intervistati infatti, prevede un contesto macroeconomico invariato nel prossimo semestre. Diminuisce la percentuale di coloro che prevedono uno scenario macroeconomico in peggioramento (-28,9 punti percentuali) mentre il 5,3% degli intervistati esprime un sentiment di miglioramento del contesto economico.
Operators’ sentiment regarding the macroeconomic scenario shows stable expectations: 63,2% of respondents, foresees a steady macroeconomic environment. Also, a decrease in the proportion of operators expecting a worsening outlook is registered (-28,9 percentage points) while 5,3% of respondents is expressing a bullish sentiment.
Riguardo le attese sull’andamento del numero di operazioni nel mercato del PE, la maggioranza degli operatori (63,2%) si aspetta un numero di deal stabile. In aumento la quota di operatori che si aspetta volumi di attività in crescita (dal 9,5% al 26,3%) e in forte riduzione il numero di intervistati che ritiene che il numero di deal diminuirà (-30 punti percentuali).
With regard to the expectations for the number of transactions in the PE market, the majority of operators (63,2%) expects stable business volumes, with an increasing number of respondents who expects the number of deals to increase (from 9,5% to 26,3%). Furthermore, the share of the respondents who foresees a decrease in the number of deals is decreasing (-30 percentage points).
Le aspettative circa il termine degli effetti della crisi economico-finanziaria sul mercato del PE convalidano un clima di aspettative stabili tra gli operatori: la maggioranza degli intervistati (57,9%) ritiene che gli effetti della crisi siano già terminati o che termineranno entro i prossimi 12 mesi. Inoltre la quota di operatori che si aspetta la fine di tali effetti entro 18 mesi si incrementa (+15,6 punti percentuali) mentre quella oltre 18 mesi si riduce (-1,4 punti percentuali).
Expectations about the end of the effects of the economic and financial crisis in the PE market validate a climate of stable expectations among the operators: the majority of respondents (57,9%), indeed, expects that these effects have already been concluded or are expected to end within the next 12 months. Moreover, the stake of respondents expecting the influence of the crisis to end within the next 18 months is increasing (+15,6 percentage points) while beyond the next 18 months (-1,4 percentage points) is decreasing.
7
Italy Private Equity Confidence Survey Outlook per il secondo semestre 2019 | Outlook for the second semester 2019
26,5%
42,1%45,9%
21,6%
2,3%5,3%
67,6%
57,9%
51,4% 51,4%
37,2%
63,2%
5,9%
0,0% 2,7%
27,0%
60,5%
31,6%
0%
10%
20%
30%
40%
50%
60%
70%
80%
1S 2017 2S 2017 1S 2018 2S 2018 1S 2019 2S 2019
Question 1 - During the next semester, I expect the economic outlook to:
Improve Remain stable Worsen
38,2%
60,5%
52,8%
24,3%
9,5%
26,3%
55,9%
36,8%
44,4%
62,2%
50,0%
63,2%
5,9% 2,6% 2,8%
13,5%
40,5%
10,5%
0%
10%
20%
30%
40%
50%
60%
70%
1S 2017 2S 2017 1S 2018 2S 2018 1S 2019 2S 2019
Question 2 - During the next semester, I expect the number of deals in the PE market to:
Increase Remain stable Decrease

11,8% 10,5%21,6% 16,7% 9,3%
21,1%8,8% 2,6%
5,6%4,7%
2,6%
55,9% 60,5% 51,4% 50,0%
44,2%
52,6%
14,7% 13,2% 8,1% 13,9%23,3%
10,5%
8,8% 13,2% 18,9% 13,9% 18,6% 13,2%
0%
20%
40%
60%
80%
100%
1S 2017 2S 2017 1S 2018 2S 2018 1S 2019 2S 2019
Question 6 - The differentiating factors among PE funds that, in case of competition, determine the choice of one fund instead of another are:
Reputation Network
Prices & terms Expertise in the industry
Speed and flexibility
Intervistati sui principali trendattesi nel mercato del PE, crescono di 8,2 punti percentuali gli operatori che si aspettano un ruolo più attivo nella gestione delle società partecipate da parte dei fondi di PE. In crescita anche la quota di rispondenti che evidenzia una ripresa nell’attività di raccolta fondi (dal 2,9% al 7,3%). In forte calo invece gli operatori che segnalano un limitato utilizzo della quotazione come modalità di exit (-10,7 punti percentuali). Rilevante inoltre la riduzione percentuale di coloro che si aspettano un rallentamento o sospensione dell’attività di investimento a causa delle attuali condizioni generali di mercato (-5,5 punti percentuali).
When asked about the key trends expected in the PE market, the number of operators mentioning an increase in the level of involvement in the management of the portfolio companies increases by 8,2 percentage points. A growing number of operators also expects an increase of the recovery of fundraising activity (from 2,9% to 7,3%). Decreases instead the number of respondents mentioning a limited use of the IPO as exit strategy (-10,7% percentage points). It is also worth mentioning the reduction in operators who expect a slowdown or interruption of the investment activity due to market condition (-5,5 percentage points).
Con riferimento alle nuove opportunità d’investimento, la maggior parte degli operatori (56,8%) si aspetta un livello di competizione nel mercato del PE stabile. Rispetto alla precedente survey sono invece in aumento (dal 33,3% al 43,2%) gli intervistati che hanno aspettative in aumento mentre pari a zero quelli che prevedono minore competizione nel mercato.
With regard to new investmentopportunities, the majority of operators (56,8%) expects the competition level in the PE market to remain stable. Compare with the past semester, the percentage of respondent foreseeing an increase of competition is increasing (from 33,3% to 43,2%), while the share of operators expecting a decrease in the level of competition is null.
Riguardo ai fattori di differenziazione che, a parere degli operatori di PE, determinano il successo nel completamento delle operazioni, più della metà degli intervistati (52,6%) ha confermato come elementi principali il prezzo e le condizioni contrattuali offerte alla controparte.Inoltre, crescono il fattore "reputazione" (+11,8 punti percentuali) a fronte di un calo dei fattori "expertise nella industry", "velocità e flessibilità", e "network" (rispettivamente -12,8 punti, -5,4 punti e -2,1 punti).
In terms of differentiating factors which, in the view of PE operators, determine their success in completing deals, more than half of them (52,6%) confirmed that the key factor is the price and the contractual terms offered to the counterparty. In addition, the factors “reputation” increases its relevance (+11,8 percentagepoints) while the factors“expertise in the industry”, “speed and flexibility” and “reputation” and “network”(respectively -12,8 points, -5,4 points and -2,1 points).
8
Italy Private Equity Confidence Survey Outlook per il secondo semestre 2019 | Outlook for the second semester 2019
41,2%
60,5%
69,4% 70,3%
33,3%
43,2%
55,9%
34,2%
25,0%29,7%
59,5%56,8%
2,9% 5,3% 5,6%
0,0%
7,1%
0,0%0%
10%
20%
30%
40%
50%
60%
70%
80%
1S 2017 2S 2017 1S 2018 2S 2018 1S 2019 2S 2019
Question 5 - The current competition level related to the new investment opportunities is:
Increasing Stable Decreasing
18,3%
8,3%
5,5%
11,0%
14,7%
7,3%
18,3%
7,3%
0,9%8,3%
Question 4 - During the next semester, I expect the more significant market trends to be:
Increase in the price divergence Slowdown or interruption of the
investment activity due to
market condition
Interest for turnaround operations Limited choice of listing as exit strategy
Increase of the average holding period Decrease in use of financial leverage
in acquisitions
Increase in the level of involvement
in the management of the
participated companies
Recovery of fundraising activity
Problems connected with committed
capital repayment
Decrease in the number of small-medium
operators and starting of
concentration phenomenon
Other
2S 20191S 2019
15,2%
13,8%
4,3%
21,7%
17,4%
8,7%
10,1%
2,9% 0,7%5,1%
39,4%42,1%
54,1%
38,9%
45,2%
56,8%
45,5%
39,5%37,8%
44,4%42,9%
37,8%
15,2% 18,4%
8,1%
16,7%
11,9%
5,4%
0%
10%
20%
30%
40%
50%
60%
1S 2017 2S 2017 1S 2018 2S 2018 1S 2019 2S 2019
Question 8 - During the next semester, will you be involved in fundraising activity?
Yes No Later
23,5%21,1%
35,1%
16,7%
11,6%
18,4%
52,9% 52,6% 54,1%
66,7%62,8% 60,5%
11,8%10,5% 11,1% 11,6%
5,3%11,8%
15,8%
10,8%5,6%
14,0% 15,8%
0%
10%
20%
30%
40%
50%
60%
70%
1S 2017 2S 2017 1S 2018 2S 2018 1S 2019 2S 2019
Question 7 - During the next semester, I expect to focus the most part of my time on:
Fundraising activity Scouting for new investment
opportunities
Exit Portfolio management
Prossime attivitàdegli operatori
Forthcomingactivities ofoperators
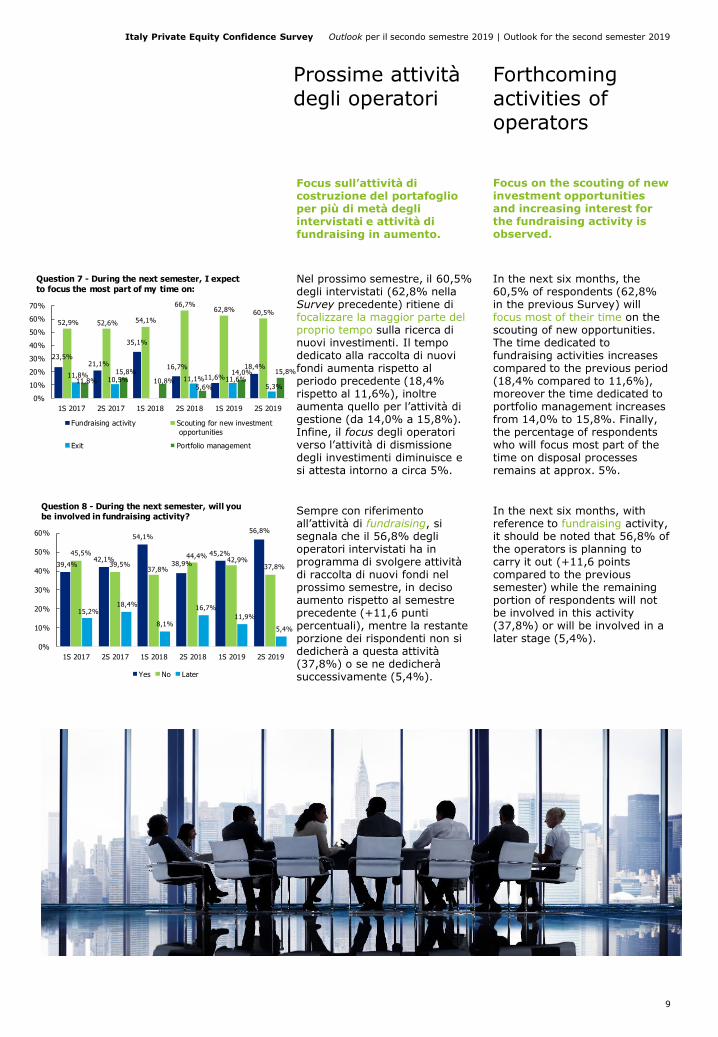
Focus sull’attività di costruzione del portafoglio per più di metà degli intervistati e attività di fundraising in aumento.
Focus on the scouting of new investment opportunities and increasing interest for the fundraising activity is observed.
Nel prossimo semestre, il 60,5% degli intervistati (62,8% nella Survey precedente) ritiene difocalizzare la maggior parte del proprio tempo sulla ricerca di nuovi investimenti. Il tempo dedicato alla raccolta di nuovi fondi aumenta rispetto al periodo precedente (18,4% rispetto al 11,6%), inoltre aumenta quello per l’attività di gestione (da 14,0% a 15,8%). Infine, il focus degli operatori verso l’attività di dismissione degli investimenti diminuisce e si attesta intorno a circa 5%.
In the next six months, the 60,5% of respondents (62,8% in the previous Survey) will focus most of their time on the scouting of new opportunities. The time dedicated to fundraising activities increases compared to the previous period (18,4% compared to 11,6%), moreover the time dedicated to portfolio management increases from 14,0% to 15,8%. Finally, the percentage of respondents who will focus most part of the time on disposal processes remains at approx. 5%.
Sempre con riferimento all’attività di fundraising, si segnala che il 56,8% degli operatori intervistati ha in programma di svolgere attività di raccolta di nuovi fondi nel prossimo semestre, in deciso aumento rispetto al semestre precedente (+11,6 punti percentuali), mentre la restante porzione dei rispondenti non si dedicherà a questa attività (37,8%) o se ne dedicherà successivamente (5,4%).
In the next six months, with reference to fundraising activity, it should be noted that 56,8% of the operators is planning to carry it out (+11,6 points compared to the previous semester) while the remaining portion of respondents will not be involved in this activity (37,8%) or will be involved in a later stage (5,4%).
9
Italy Private Equity Confidence Survey Outlook per il secondo semestre 2019 | Outlook for the second semester 2019

5,9% 5,4% 2,8% 4,7% 2,6% 8,8%
2,6% 2,7% 8,3% 7,0% 5,3%
23,5%
28,9% 27,0% 22,2% 16,3% 18,4%
29,4% 31,6% 24,3%
36,1%
23,3% 34,2%
23,5% 31,6% 24,3%
19,4%
37,2% 31,6%
8,8% 5,3% 16,2% 11,1% 11,6% 7,9%
0%
10%
20%
30%
40%
50%
60%
70%
80%
90%
100%
1S 2017 2S 2017 1S 2018 2S 2018 1S 2019 2S 2019
Question 9 - The average turnover of my portfolio companies is:
< € 5M € 5-15M € 16-30M € 31-50M € 51-100M > € 100M
Attivitàd’investimento:caratteristichedelle aziende target
Investmentactivity: targetcompanycharacteristics
Più della metà del campione detiene un portafoglio di società di medio-piccola dimensione (fatturato fino a 50 milioni di Euro). In aumento l’interesse verso i settori Food & Wine e Packaging
More than half of the sample holds a portfolio of SMEs with an average turnover up to 50 million Euro. Growing interest towards Food & Wine and Packaging.
Il 60,5% degli operatori intervistati dichiara di avere investimenti in portafoglio con un fatturato medio fino a 50 milioni di Euro. Il restante 39,5% invece, dichiara di avere un portafoglio concentrato in società con ricavi superiori a 50 milioni di Euro (di cui il 7,9% oltre i 100 milioni di Euro).
60,5% of surveyed operators declares to have investments in their portfolios with an average turnover up to 50 million Euro. Moreover, 39,5% of respondents declares to have a portfolio focused on companies with revenues over 50 million Euro (of which 7,9% over 100 million Euro).
Riguardo alle aspettative sulledimensioni medie degli investimenti attesi, il 57,9% degli operatori ha aspettative di sostanziale stabilità, mentre il 28,9% dei rispondenti si attende un aumento delle dimensioni medie, in aumento rispetto al periodo precedente la percentuale di chi si attende una riduzione delle dimensioni medie (+13,2 punti percentuali).
Regarding the average size of future investments, 57,9% of the operators have stable expectations, while a decreasing number of respondents, equal to 28,9%, expects the average turnover to increase. Finally there is an increasing portion of who forsees a decrease in the the average size of future investments (+13,2 percentage points).
In aumento, rispetto all’ultimo semestre analizzato dalla Survey, gli investimenti nei portafogli degli operatori nei settori Food & Wine (da 6,6% a 10,2%) e Chimico (da 0,8% a 2%) e quello dei Prodotti industriali (da 14,0% a 15,7%). Registrano invece una riduzione le partecipazioni nei settori Manifatturiero (-1,6 punti), dei Servizi Finanziari (-2,4 punti) e Real Estate (-1,7 punti).
Compared to the previous semester, operators hold a higher amount of investments in portfolio operating in Food & Wine (from 6,6% to 10,2%), Chemical (from 0,8% to 2%) and Industrial products (from 14,0% to 15,7%). A reduction was observed in Manufacturing (-1,6 points), Financial services (-2,4 points) and Real Estate sectors (-1,7 points).
10
Italy Private Equity Confidence Survey Outlook per il secondo semestre 2019 | Outlook for the second semester 2019
52,9%
50,0% 48,6%
40,0%37,2%
28,9%
47,1%50,0% 51,4%
57,1%
62,8%
57,9%
0,0% 0,0% 0,0% 2,9% 0,0%
13,2%
0%
10%
20%
30%
40%
50%
60%
70%
1S 2017 2S 2017 1S 2018 2S 2018 1S 2019 2S 2019
Question 10 - During the next semester, I expect the average turnover of the future portfolio companies to:
Increase Remain stable Decrease
0%
2%
4%
6%
8%
10%
12%
14%
16%
18%
20%
Agricu
lture
Appare
l
Auto
motive
Chem
ical
Const
ruct
ion
Publis
hin
g
Food &
win
e
IT (
Softw
are
& H
ard
ware
)
Leis
ure
& H
osp
italit
y
Life S
cience
s &
Healthca
re
Luxury
Manufa
ctu
ring
Media
& C
om
munic
ation
Packa
gin
g
Ele
ctro
nic
s
Indust
rial pro
duct
s
Real Est
ate
Reta
il
Non F
inanci
al Serv
ices
Fin
anci
al Serv
ices
TLC
Utilit
ies
Question 11 - My portfolio companies operate mainly in the following industries:
1S 2019 2S 2019
35,3%
39,5% 48,6%55,6%
39,5% 34,2%
58,8% 47,4%37,8%
33,3%
41,9% 57,9%
2,9% 7,9% 10,8%
2,8% 11,6% 2,6%
2,6%2,8%
2,9% 2,6%
2,7% 5,6% 7,0% 5,3%
0%
10%
20%
30%
40%
50%
60%
70%
80%
90%
100%
1S 2017 2S 2017 1S 2018 2S 2018 1S 2019 2S 2019
Question 13 - During the last semester, I evaluated investment opportunities mainly focused in:
North West North East Center South Abroad
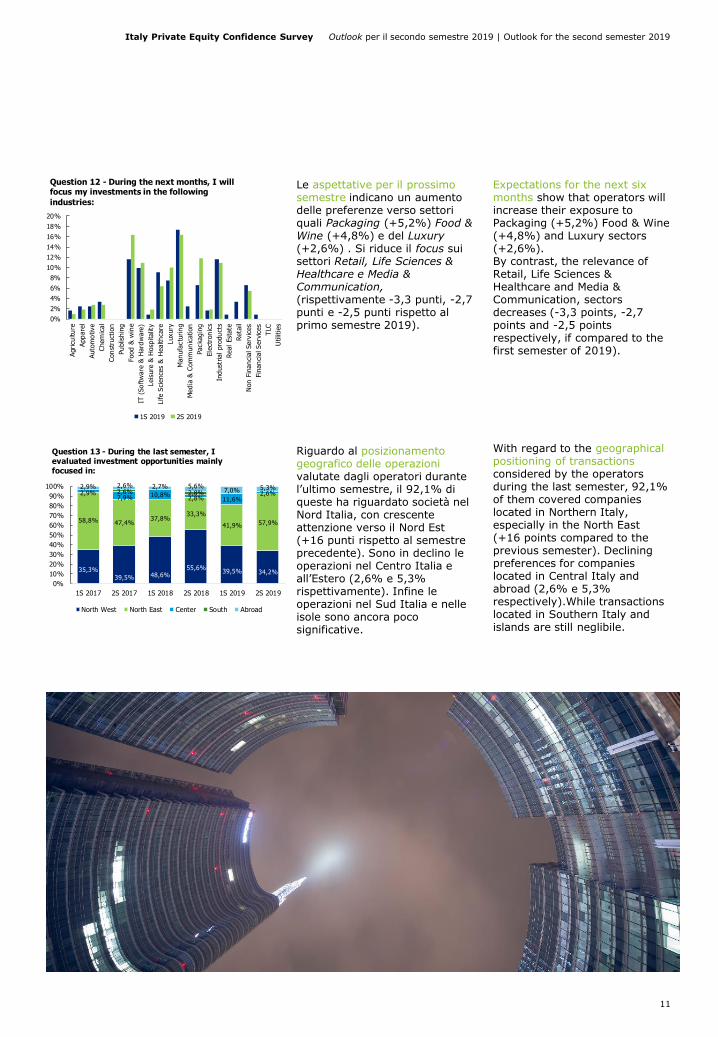
Le aspettative per il prossimosemestre indicano un aumento delle preferenze verso settori quali Packaging (+5,2%) Food & Wine (+4,8%) e del Luxury(+2,6%) . Si riduce il focus sui settori Retail, Life Sciences & Healthcare e Media & Communication,(rispettivamente -3,3 punti, -2,7 punti e -2,5 punti rispetto al primo semestre 2019).
Expectations for the next six months show that operators will increase their exposure to Packaging (+5,2%) Food & Wine (+4,8%) and Luxury sectors (+2,6%).By contrast, the relevance of Retail, Life Sciences & Healthcare and Media & Communication, sectors decreases (-3,3 points, -2,7 points and -2,5 pointsrespectively, if compared to the first semester of 2019).
Riguardo al posizionamento geografico delle operazioni valutate dagli operatori durante l’ultimo semestre, il 92,1% di queste ha riguardato società nel Nord Italia, con crescente attenzione verso il Nord Est (+16 punti rispetto al semestre precedente). Sono in declino le operazioni nel Centro Italia e all’Estero (2,6% e 5,3% rispettivamente). Infine le operazioni nel Sud Italia e nelle isole sono ancora poco significative.
With regard to the geographicalpositioning of transactions considered by the operators during the last semester, 92,1% of them covered companies located in Northern Italy, especially in the North East (+16 points compared to the previous semester). Declining preferences for companies located in Central Italy and abroad (2,6% e 5,3% respectively).While transactionslocated in Southern Italy and islands are still neglibile.
11
Italy Private Equity Confidence Survey Outlook per il secondo semestre 2019 | Outlook for the second semester 2019
0%
2%
4%
6%
8%
10%
12%
14%
16%
18%
20%
Agricu
lture
Appare
l
Auto
motive
Chem
ical
Const
ruct
ion
Publis
hin
g
Food &
win
e
IT (
Softw
are
& H
ard
ware
)
Leis
ure
& H
osp
italit
y
Life S
cience
s &
Healthca
re
Luxury
Manufa
ctu
ring
Media
& C
om
munic
ation
Packa
gin
g
Ele
ctro
nic
s
Indust
rial pro
duct
s
Real Est
ate
Reta
il
Non F
inanci
al Serv
ices
Fin
anci
al Serv
ices
TLC
Utilit
ies
Question 12 - During the next months, I will focus my investments in the following
industries:
1S 2019 2S 2019
9,1% 5,3% 8,3% 5,6% 2,3% 10,5%
24,2% 28,9% 25,0%22,2%
18,6%
18,4%
30,3%21,1%
16,7% 25,0%30,2%
34,2%
24,2%
23,7%
16,7%22,2%
16,3%
15,8%
6,1%15,8%
25,0%22,2%
23,3%
15,8%
6,1% 5,3% 8,3% 2,8% 9,3%
5,3%
0%
10%
20%
30%
40%
50%
60%
70%
80%
90%
100%
1S 2017 2S 2017 1S 2018 2S 2018 1S 2019 2S 2019
Question 15 - The average size of investments (deal value) planned for the next six months is:
< € 5M € 5-15M € 16-30M € 31-50M € 51-100M > € 100M
9,1% 2,6% 2,7% 2,8% 4,7% 2,6%
18,2% 26,3% 21,6% 27,8% 16,3% 23,7%
15,2%18,4%
16,2%13,9%
11,6%13,2%
54,5% 50,0%54,1% 52,8%
60,5%
55,3%
3,0% 2,6% 5,4% 2,8% 7,0% 5,3%
0%
10%
20%
30%
40%
50%
60%
70%
80%
90%
100%
1S 2017 2S 2017 1S 2018 2S 2018 1S 2019 2S 2019
Question 16 - The most frequent type of deal in my current portfolio is:
Start up Financing Expansion Capital Support to MBO/MBI
LBO/Replacement Turnaround
17,6%8,1%
13,9%5,6%
11,6% 13,2%
23,5%29,7%
25,0%
25,0%20,9% 13,2%
26,5% 29,7%16,7% 27,8% 25,6% 42,1%
20,6% 21,6%
19,4%27,8%
16,3%
13,2%
5,9% 8,1%
19,4%
8,3%20,9% 13,2%
5,9% 2,7% 5,6% 5,6% 4,7% 5,3%
0%
10%
20%
30%
40%
50%
60%
70%
80%
90%
100%
1S 2017 2S 2017 1S 2018 2S 2018 1S 2019 2S 2019
Question 14 - The average size of investments (deal value) in my portfolio is:
< € 5M € 5-15M € 16-30M € 31-50M € 51-100M > € 100M
Attivitàd’investimento:caratteristichedell’investimento
Investment activity & characteristics
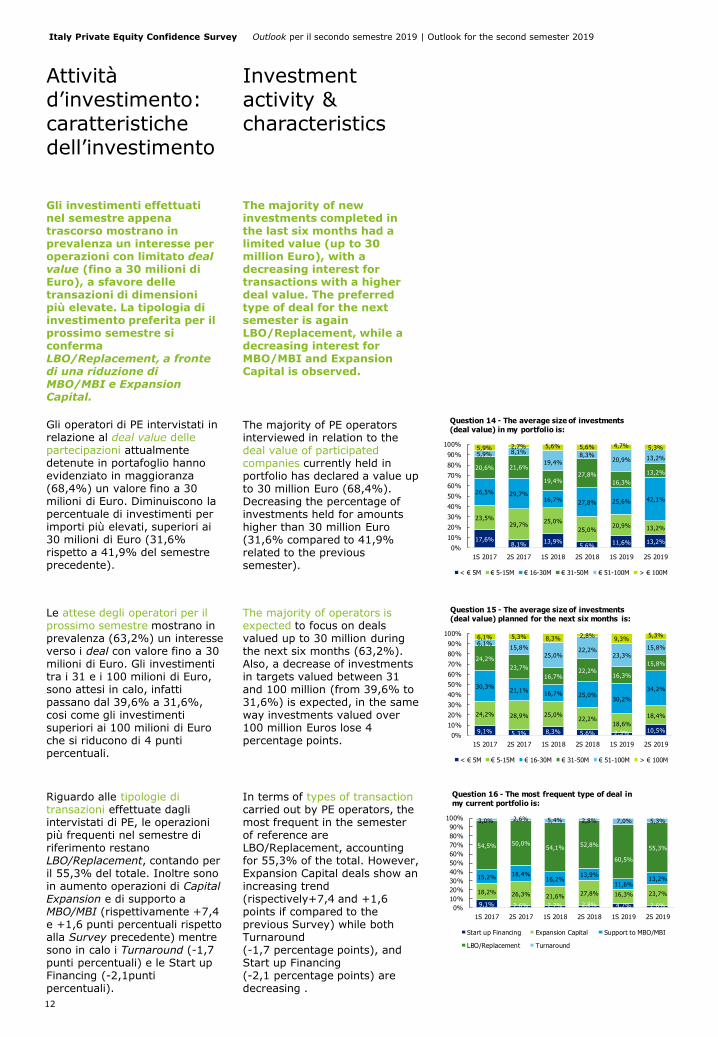
Gli investimenti effettuati nel semestre appena trascorso mostrano in prevalenza un interesse per operazioni con limitato deal value (fino a 30 milioni di Euro), a sfavore delle transazioni di dimensioni più elevate. La tipologia di investimento preferita per il prossimo semestre si conferma LBO/Replacement, a fronte di una riduzione di MBO/MBI e Expansion Capital.
The majority of new investments completed in the last six months had a limited value (up to 30 million Euro), with a decreasing interest for transactions with a higher deal value. The preferred type of deal for the next semester is again LBO/Replacement, while a decreasing interest for MBO/MBI and Expansion Capital is observed.
Gli operatori di PE intervistati in relazione al deal value delle partecipazioni attualmente detenute in portafoglio hanno evidenziato in maggioranza (68,4%) un valore fino a 30 milioni di Euro. Diminuiscono la percentuale di investimenti per importi più elevati, superiori ai 30 milioni di Euro (31,6% rispetto a 41,9% del semestre precedente).
The majority of PE operatorsinterviewed in relation to the deal value of participated companies currently held in portfolio has declared a value up to 30 million Euro (68,4%). Decreasing the percentage of investments held for amounts higher than 30 million Euro (31,6% compared to 41,9% related to the previous semester).
Le attese degli operatori per il prossimo semestre mostrano in prevalenza (63,2%) un interesse verso i deal con valore fino a 30 milioni di Euro. Gli investimenti tra i 31 e i 100 milioni di Euro, sono attesi in calo, infatti passano dal 39,6% a 31,6%, cosi come gli investimenti superiori ai 100 milioni di Euro che si riducono di 4 punti percentuali.
The majority of operators is expected to focus on deals valued up to 30 million during the next six months (63,2%). Also, a decrease of investments in targets valued between 31 and 100 million (from 39,6% to 31,6%) is expected, in the same way investments valued over 100 million Euros lose 4 percentage points.
Riguardo alle tipologie di transazioni effettuate dagli intervistati di PE, le operazioni più frequenti nel semestre di riferimento restano LBO/Replacement, contando per il 55,3% del totale. Inoltre sono in aumento operazioni di Capital Expansion e di supporto a MBO/MBI (rispettivamente +7,4 e +1,6 punti percentuali rispetto alla Survey precedente) mentre sono in calo i Turnaround (-1,7 punti percentuali) e le Start up Financing (-2,1punti percentuali).
In terms of types of transactioncarried out by PE operators, the most frequent in the semester of reference are LBO/Replacement, accounting for 55,3% of the total. However,Expansion Capital deals show an increasing trend (rispectively+7,4 and +1,6points if compared to the previous Survey) while bothTurnaround(-1,7 percentage points), and Start up Financing(-2,1 percentage points) are decreasing .
12
Italy Private Equity Confidence Survey Outlook per il secondo semestre 2019 | Outlook for the second semester 2019

2,9% 5,3% 2,8% 2,8% 2,3% 5,3%17,6%
26,3% 19,4% 27,8% 23,3% 18,4%
20,6%
21,1%
19,4%19,4%
16,3%10,5%
55,9%42,1%
50,0%44,4%
48,8% 60,5%
2,9% 5,3% 8,3% 5,6% 9,3% 5,3%
0%
20%
40%
60%
80%
100%
1S 2017 2S 2017 1S 2018 2S 2018 1S 2019 2S 2019
Question 17 - During the next semester, I expect to focus my attention on the following type of deal:
Start up Financing Expansion Capital Support to MBO/MBI
LBO/Replacement Turnaround
Riguardo alle aspettative degli operatori per i prossimi sei mesi, le operazioni di LBO/Replacement si prospettano rimanere la tipologia di maggior interesse, in aumento di 11,7 punti percentuali. In calo il focussu future MBO/MBI e Expansion Capital (-5,8 e -4,9 punti percentuali).
With regard to operators’ expectations for the next six months, LBO/Replacement transactions are expected to remain the primary investment category, increasing by 11,7 percentage points. The focus on support to MBO/MBI and Expansion Capital transactions decreases (-5,8 and -4,9 percentage points) instead.
Riguardo alle tipologie di partecipazioni nei portafogli degli operatori, sono in riduzione gli investimenti di maggioranza (da 81,4% all’attuale 76,3%) cosi come le operazioni di co-investment con altri fondi (-2,1 punti percentuali). Registrano un aumento, invece, gli investimenti di minoranza (+7,1 punti percentuali).
In terms of type of investments in the operators’ portfolios, the interest towards majority investments decreases if compared to the previous semester (from 81,4% to 76,3%) as well as the co-investments with other funds decreased by 2,1 percentage points. By contrast, the percentage of minority investments registered an increase (+7,1 percentage points)
In leggero aumento la presenza in portafoglio di investimenti di minoranza, con stabile interesse verso quelli di maggioranza.
The presence of minority investments in portfolio is slightly increasing with a stable interest towards majority stakes.
Le attese in merito alla composizione dei portafogli per il prossimo semestre, sono sostanzialmente stabili rispetto al precedente semestre. Quello in quote di maggioranza costituisce la tipologia di investimento verso cui gli operatori mostrano il maggior interesse (84,2%)
Expectations about the make-up of portfolios for the next six months are almost stable comparing with the last semester. In particular the most operators mostly show interest towards majority stakes (84,2%)
La causa principale di abbandono di un’opportunità d’investimento è riconducibile ai dubbi emersi in relazione alla potenzialità del business, indicata dal 52,6% degli intervistati, seguita dallaresistenza manifestata dai soggetti venditori (incluse divergenze intermini di prezzo) segnalata dal 39,5% degli intervistati.
The main reasons which have led investors to abandon possible deals regard primarily doubts on the business potentialwhich has been stated by 52,6% of respondents, followed by the resistance to sell (including disagreement over the price) by the entrepreneurs, pointed out by 39,5% of the sample.
13
Italy Private Equity Confidence Survey Outlook per il secondo semestre 2019 | Outlook for the second semester 2019
73,5%
67,6%
74,3%71,4%
81,4%76,3%
20,6%27,0%
22,9% 20,0%14,0%
21,1%
5,9% 5,4% 2,9% 8,6%
4,7% 2,6%
0%
10%
20%
30%
40%
50%
60%
70%
80%
90%
1S 2017 2S 2017 1S 2018 2S 2018 1S 2019 2S 2019
Question 18 - The majority of the investments in my current portfolio are:
Majority Minority Co-investment with other funds (Minority)
76,5%78,9% 80,0%
71,4%
85,7% 84,2%
23,5%18,4%
14,3%17,1%
14,3% 13,2%
0,0% 2,6%
5,7% 11,4%
0,0% 2,6%
0%
10%
20%
30%
40%
50%
60%
70%
80%
90%
1S 2017 2S 2017 1S 2018 2S 2018 1S 2019 2S 2019
Question 19 - During the next semester, I expect to focus my attention on:
Majority Minority Co-investment with other funds (Minority)
8,8% 5,4% 2,9% 7,0% 2,6%
44,1%
51,4% 43,2% 48,6%48,8%
39,5%
41,2%43,2%
37,8%42,9% 34,9%
52,6%
5,9% 5,4%8,1%
5,7% 9,3% 2,6%5,4%
2,6%
0%
10%
20%
30%
40%
50%
60%
70%
80%
90%
100%
1S 2017 2S 2017 1S 2018 2S 2018 1S 2019 2S 2019
Question 20 - In the last six months, the main factors that led me to abandon potential opportunities were related to:
Doubts on the management reliability Resistance to sell by the entrepreneurs
Doubts on the business potential Excessive financial resources necessary
to relaunch the business activity
Difficulties in debt funding for
the specific deal
Other
Financing delleacquisizioni
Acquisitionfinancing
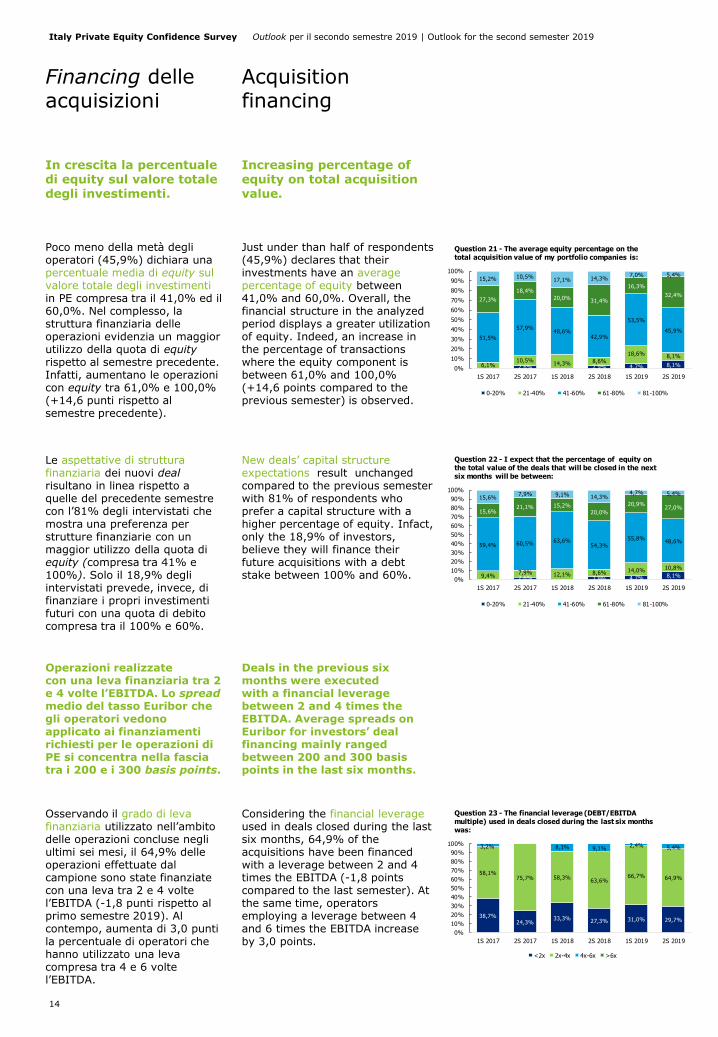
In crescita la percentuale di equity sul valore totale degli investimenti.
Increasing percentage of equity on total acquisition value.
Poco meno della metà degli operatori (45,9%) dichiara una percentuale media di equity sul valore totale degli investimentiin PE compresa tra il 41,0% ed il 60,0%. Nel complesso, la struttura finanziaria delle operazioni evidenzia un maggior utilizzo della quota di equityrispetto al semestre precedente. Infatti, aumentano le operazioni con equity tra 61,0% e 100,0% (+14,6 punti rispetto al semestre precedente).
Just under than half of respondents (45,9%) declares that their investments have an average percentage of equity between 41,0% and 60,0%. Overall, the financial structure in the analyzed period displays a greater utilization of equity. Indeed, an increase in the percentage of transactions where the equity component is between 61,0% and 100,0% (+14,6 points compared to the previous semester) is observed.
Le aspettative di struttura finanziaria dei nuovi deal risultano in linea rispetto a quelle del precedente semestre con l’81% degli intervistati che mostra una preferenza per strutture finanziarie con un maggior utilizzo della quota di equity (compresa tra 41% e 100%). Solo il 18,9% degli intervistati prevede, invece, di finanziare i propri investimenti futuri con una quota di debito compresa tra il 100% e 60%.
New deals’ capital structure expectations result unchanged compared to the previous semester with 81% of respondents who prefer a capital structure with a higher percentage of equity. Infact, only the 18,9% of investors, believe they will finance their future acquisitions with a debt stake between 100% and 60%.
Osservando il grado di leva finanziaria utilizzato nell’ambito delle operazioni concluse negli ultimi sei mesi, il 64,9% delle operazioni effettuate dal campione sono state finanziate con una leva tra 2 e 4 volte l’EBITDA (-1,8 punti rispetto al primo semestre 2019). Al contempo, aumenta di 3,0 punti la percentuale di operatori che hanno utilizzato una leva compresa tra 4 e 6 volte l’EBITDA.
Considering the financial leverage used in deals closed during the last six months, 64,9% of the acquisitions have been financed with a leverage between 2 and 4 times the EBITDA (-1,8 points compared to the last semester). At the same time, operators employing a leverage between 4 and 6 times the EBITDA increase by 3,0 points.
Operazioni realizzatecon una leva finanziaria tra 2 e 4 volte l’EBITDA. Lo spreadmedio del tasso Euribor che gli operatori vedono applicato ai finanziamenti richiesti per le operazioni di PE si concentra nella fascia tra i 200 e i 300 basis points.
Deals in the previous six months were executed with a financial leverage between 2 and 4 times the EBITDA. Average spreads on Euribor for investors’ deal financing mainly ranged between 200 and 300 basis points in the last six months.
14
Italy Private Equity Confidence Survey Outlook per il secondo semestre 2019 | Outlook for the second semester 2019
2,6% 2,9% 4,7% 8,1%6,1%10,5%
14,3% 8,6%
18,6% 8,1%
51,5%
57,9%48,6%
42,9%
53,5%
45,9%
27,3%
18,4%
20,0%31,4%
16,3%
32,4%
15,2% 10,5%17,1% 14,3%
7,0% 5,4%
0%
10%
20%
30%
40%
50%
60%
70%
80%
90%
100%
1S 2017 2S 2017 1S 2018 2S 2018 1S 2019 2S 2019
Question 21 - The average equity percentage on the total acquisition value of my portfolio companies is:
0-20% 21-40% 41-60% 61-80% 81-100%
2,6% 2,9% 4,7% 8,1%9,4%7,9% 12,1% 8,6% 14,0% 10,8%
59,4% 60,5%63,6%
54,3%
55,8%48,6%
15,6%21,1% 15,2%
20,0%
20,9%27,0%
15,6%7,9% 9,1% 14,3%
4,7% 5,4%
0%
10%
20%
30%
40%
50%
60%
70%
80%
90%
100%
1S 2017 2S 2017 1S 2018 2S 2018 1S 2019 2S 2019
Question 22 - I expect that the percentage of equity on the total value of the deals that will be closed in the next six months will be between:
0-20% 21-40% 41-60% 61-80% 81-100%
38,7%24,3%
33,3% 27,3% 31,0% 29,7%
58,1%75,7% 58,3%
63,6%66,7% 64,9%
3,2% 8,3% 9,1%2,4% 5,4%
0%
10%
20%
30%
40%
50%
60%
70%
80%
90%
100%
1S 2017 2S 2017 1S 2018 2S 2018 1S 2019 2S 2019
Question 23 - The financial leverage (DEBT/EBITDA multiple) used in deals closed during the last six months was:
<2x 2x-4x 4x-6x >6x

80,0%88,9%
81,8%90,9%
76,2%83,8%
6,1% 3,0%
2,4%
2,8% 2,7%
3,3% 7,1% 5,4% 10,0%
5,6% 9,1%
3,0%
11,9%8,1%6,7%
2,8% 3,0% 3,0% 2,4%
0%
10%
20%
30%
40%
50%
60%
70%
80%
90%
100%
1S 2017 2S 2017 1S 2018 2S 2018 1S 2019 2S 2019
Question 26 - The main debt facilities that I'm planning to use in the next six months for acquisitions are:
Senior debt Mezzanine financing
Junior debt / high-yield bond Vendor’s note / convertible bonds
Shareholders loan Other
74,2%
86,1% 82,4%85,3% 79,1% 86,5%
3,2%
5,9% 2,9% 2,3%
2,7% 2,8% 2,9%
7,0% 2,7%
12,9%
8,3% 8,8%2,9% 11,6%
8,1%9,7%
2,8% 2,9% 5,9%
0%
20%
40%
60%
80%
100%
1S 2017 2S 2017 1S 2018 2S 2018 1S 2019 2S 2019
Question 25 - The main debt facilities that I used in the deals closed in the last six months were:
Senior debt Mezzanine financing
Junior debt / high-yield bond Vendor’s note / convertible bonds
Shareholders loan Other
80,0% 85,7%73,5%
81,3% 80,0%72,2%
6,7%11,4%
5,9%
9,4%7,5% 16,7%
6,7% 8,8%3,1% 5,0% 5,6%
6,7%2,9% 8,8%
6,3% 5,0% 5,6%
0%
10%
20%
30%
40%
50%
60%
70%
80%
90%
100%
1S 2017 2S 2017 1S 2018 2S 2018 1S 2019 2S 2019
Question 27 - The main debt providers for the deals closed in the last six months were:
Commercial banks Investment banks Mezzanine Funds
Syndication financing Other
6,9% 16,7% 16,7%
25,0% 10,0% 11,4%
51,7%
50,0% 36,7%
37,5%
45,0% 42,9%
17,2%
22,2%
30,0%
31,3%
25,0% 28,6%
24,1% 11,1% 16,7%
6,3% 20,0% 17,1%
0%
10%
20%
30%
40%
50%
60%
70%
80%
90%
100%
1S 2017 2S 2017 1S 2018 2S 2018 1S 2019 2S 2019
Question 24 - The average spread on Euribor applied to Senior Debt in the acquisitions made in the last six months was included between:
<200 bp 200-250 bp 251-300 bp >300 bp
Gli operatori di PE intervistati segnalano in generale un andamento stabile degli spread medi applicati rispetto al semestre precedente. Il 42,9% degli operatori intervistati (45% nella scorsa edizione della Survey) ha finanziato le proprie operazioni con uno spread sull’Euribor compreso tra i 200-250 basis points. Aumentano di 3,6 punti gli operatori che dichiarano di essersi finanziati con uno spreadsull’Euribor compreso tra 251-300 basis points.
A stable trend of the average spreads on senior debt to finance acquisitions is registered compared to the last survey. 42,9% of the investors (45% in the last edition of the Survey) has been financing its acquisitions with an average spread on Euribor between 200-250 basis points. The Survey also shows an increasing number of respondents (+3,6 percentage points) who declare an average spread on Euribor between 251-300 basis points.
Il Senior debt rappresenta anche nel corso dell’ultimo semestre la modalità di finanziamento più diffusa, confermando la tendenza emersa nelle precedenti edizioni (86,5% dei casi). Segue, in misura significativamente minore, il finanziamento soci segnalato dall’8,1% dei rispondenti.
Senior debt is once again the mostpopular financing option, confirming the trend observed in the last semesters (86,5% of responses). Then, with a significantly lower share of preferences, shareholders loan is identified as alternative debt facility stated by the 8,1% of respondents.
Operazioni finanziateprevalentemente tramite ricorso al Senior debt, erogato dalle banche commerciali.
Deals mostly financed withSenior debt by commercialbanks.
Anche con riferimento alle attese circa le principali tipologie di indebitamento utilizzate nel prossimo semestre, la maggioranza degli operatori prevede di ricorrere prevalentemente al Senior debt(83,8%). Seguono, in misura minore, il finanziamento soci e le obbligazioni convertibili (rispettivamente segnalati dall’8,1% e dal 5,4% dei rispondenti).
Considering the expectations onfinancing options to fund acquisitions during the next six months, almost all investors still believe to rely on Senior debt (83,8%). Then, in a lower proportion on shareholders loans and convertible bonds (financing options identified by the 8,1% and 5,4% of respondents, respectively).
In leggera diminuzione la percentuale di investitori PE intervistati che individua nelle banche commerciali la fonte principale di finanziamento (da 80% a 72,2%). In diminuzione anche i finanziamenti mezzanini (-2,5 punti percentuali) a favore di finanziamenti concessi da banche di investimento (+9,2 punti percentuali rispetto alla precedente Survey).
The share of investors that declares to mostly rely on commercial banks for their financing needs is slightly decreasing with respect to the previous semester (from 80% to 72,2%). Also, mezzanine funds are becoming less popular (-2,5 percentage points), while the use of investment banks sources is increasing (+9,2 percentage points compared to the previous Survey).
15
Italy Private Equity Confidence Survey Outlook per il secondo semestre 2019 | Outlook for the second semester 2019

55,9% 54,1% 54,1%
41,7%
9,3%
23,7%
38,2%43,2%
45,9%50,0%
67,4%71,1%
5,9% 2,7%
0,0%
8,3%
23,3%
5,3%
0%
10%
20%
30%
40%
50%
60%
70%
80%
1S 2017 2S 2017 1S 2018 2S 2018 1S 2019 2S 2019
Question 28 - During the next semester, I expect the divestment activity in the PE market to:
Increase Remain stable Decrease
29,4% 31,6%42,4%
28,6% 27,9% 24,3%
17,6% 15,8%
9,1%
8,6%14,0% 18,9%
2,9% 7,9%2,7%
12,1%
8,6%5,4%
50,0% 44,7% 36,4% 54,3% 58,1% 48,6%
0%
10%
20%
30%
40%
50%
60%
70%
80%
90%
100%
1S 2017 2S 2017 1S 2018 2S 2018 1S 2019 2S 2019
Question 29 - During the next semester, I expect the most common way-out strategies to be:
SBO MBO/buy-back Write-off IPO Trade sale
Attività didisinvestimento
Divesting activity
Stabili l’attività di dismissione dellepartecipazioni e i valori di cessione previsti per il prossimo semestre. In calo l’interesse per il Trade salecome strategia di disinvestimento.
Expectations of stable divestment activity and stable exit values are registered. Decreasing interest for Trade sale as possible exit strategy.
Con riferimento all’attività didisinvestimento delle partecipazioni detenute in portafoglio, la maggioranza del campione prevede che l’attività rimarrà stabile nel periodo di riferimento (71,1%). Rilevante la crescita di rispondenti che si aspetta un incremento nelle attività di disinvestimento (-14,4 punti percentuali).
Regarding divestments of current portfolio companies, the majority of the sample foresees stable volumes (71,1%). Also, a relevant increase in the number of respondents who expect an increase in the divestment activity is registered (-14,4 percentage points).
Riguardo alle possibili strategie di way-out, quasi la maggioranza degli operatori (48,6%) prevede di effettuare disinvestimenti principalmente attraverso Trade sale (-9,5 punti rispetto al semestre precedente). In diminuzione la quota di operatori che segnala la possibilità di disinvestire tramite SBO (da 27,9% a 24,3%).
Among possible way-out strategies, most investors (48,6%) believe they will exit investments by trade sale (-9,5 percentage points compared to the previous semester). A slight decline in the number of respondents highlighting SBO as way-out strategy is registered (from 27,9% to 24,3%).
Per quanto riguarda i valori di cessione previsti nel prossimo semestre, si evidenzia una sostanziale crescita nel numero di operatori che si aspettano valori stabili (+2,4 punti percentuali rispetto allo scorso semestre) o in aumento (+6,4 punti percentuali).
As far as exit prices are concerned, an increase is registered in the number of respondents who expect stable valuation (+2,4 percentage points compared to the previous semester) or increasing ones (+6,4 percentage points).
16
Italy Private Equity Confidence Survey Outlook per il secondo semestre 2019 | Outlook for the second semester 2019
35,3%
47,4%50,0%
34,3%
4,7%
11,1%
58,8%52,6%
50,0%
57,1%
69,8%72,2%
5,9%
0,0% 0,0%
8,6%
25,6%
16,7%
0%
10%
20%
30%
40%
50%
60%
70%
80%
1S 2017 2S 2017 1S 2018 2S 2018 1S 2019 2S 2019
Question 30 - In the next six months, I expect the divestment values to:
Increase Remain stable Decrease

8,8% 5,3% 10,8% 5,6% 2,4% 5,3%
44,1%
28,9%29,7% 38,9%
40,5%28,9%
32,4%
52,6%45,9%
50,0%
38,1% 52,6%
8,8%13,2% 13,5% 2,8%
14,3% 7,9%
5,9% 2,8% 4,8% 5,3%
0%
10%
20%
30%
40%
50%
60%
70%
80%
90%
100%
1S 2017 2S 2017 1S 2018 2S 2018 1S 2019 2S 2019
Question 32 - The return (IRR) defined acceptable is:
<15% 15%-20% 21%-25% 26%-30% >30%
73,5% 71,1% 75,0% 69,4%
90,7% 89,5%
17,6% 15,8% 22,2% 27,8%
2,3% 10,5% 8,8% 13,2% 2,8% 2,8% 7,0%
0%
20%
40%
60%
80%
100%
120%
1S 2017 2S 2017 1S 2018 2S 2018 1S 2019 2S 2019
Question 33 - In the next six months, I expect the main return (IRR) driver to be:
EBITDA expansion Multiple expansion Leverage
Valore erendimento deiportafogli
Portfolio valueand return
Aspettative di crescita per lamaggioranza degli operatori,unite ad una concentrazionedegli IRR obiettivo nella fascia media (15%-25%). Il principale driver di rendimento è individuato nell’EBITDA expansion.
Positive expectations by most investors, alongside anoverall satisfaction for potential average IRRs in the range of 15%-25%. Returns are going to be mostly driven by EBITDA expansion.
Il valore dei portafogli degli operatori di PE sarà, ad avviso del 55,6% degli intervistati, in aumento rispetto ai valori di acquisto. La maggior parte dei restanti operatori prevede un valore stabile dei propri investimenti.
The overall value of investors’ portfolios will be, according to 55,6% of respondents, higher than the entry amount. While the remaining part of the sample expects the value to remain stable.
Riguardo agli obiettivi di rendimento (IRR) giudicati accettabili, la maggior parte degli operatori (81,5%) colloca le aspettative nella fascia intermedia (15,0%-25,0%), con una maggiore concentrazione nella fascia 21,0%-25,0%. La tendenza generale rimane stabile rispetto al precedente semestre.
Concerning the level of acceptablereturns (IRR), the majority of the investors (81,5%) are satisfied with a rate between 15,0% and 25,0%, with a greater concentration in the range of 21,0%-25,0%. The resulting trend shows overall stable expectations with respect to the previous semester.
Nel corso del prossimo semestre, il principale driver di rendimento (IRR) previsto dagli operatori intervistati viene riconosciuto nell’EBITDA expansion (89,5% delle risposte). In aumento anche le aspettative di creazione di valore generate da multipli di uscita (+8,2 punti percentuali), a fronte di un calo delle aspettative sulla creazione di valore tramite la leva finanziaria (-7,0 punti).
During the next semester, the most relevant driver for returns (IRR) predicted by the operators will be the EBITDA expansion, according to 89,5% of investors. The multiple expansion driver increases (+8,2 points with respect to the previous semester). While the relevance of leverage is dropping (-7,0 percentage points).
17
Italy Private Equity Confidence Survey Outlook per il secondo semestre 2019 | Outlook for the second semester 2019
61,8%
78,4% 81,1%
63,9%
48,8%55,6%
38,2%
21,6% 18,9%
36,1%
46,5%44,4%
0,0% 0,0% 0,0% 0,0% 4,7%
0,0%0%
10%
20%
30%
40%
50%
60%
70%
80%
90%
1S 2017 2S 2017 1S 2018 2S 2018 1S 2019 2S 2019
Question 31 - Within six months, I expect that, compared to its acquisition cost, the value of my portfolio will be:
Higher Stable Lower

Corporate Finance Advisory & Private Equity Transaction Services Team
Elio MilantoniHead of Corporate Finance Advisory+39 02 [email protected]
Lorenzo ParriniPartner Corporate Finance Advisory+39 02 [email protected]
Daniele CandianiPartner Corporate Finance - Debt Advisory+39 02 [email protected]
Andrea CasellaHead of Private Equity Transaction Services+39 02 [email protected]
Marco BastasinPartner Private Equity Transaction Services+39 [email protected]
Davide GanzerPartner Private Equity Transaction Services+39 02 [email protected]
Tamara LaudisioPartner Private Equity Transaction Services+39 02 [email protected]
Luca ZesiPartner Private Equity Transaction Services+39 02 [email protected]
Pietro FavaleAssistant Manager Corporate Finance Advisory+39 02 [email protected]
Giuseppe DianaConsultant Corporate Finance Advisory+39 02 [email protected]
Deloitte Financial Advisory S.r.l. in Italy
MilanVia Tortona, 2520144 MilanTel: +39 02 83325111
BolognaPiazza Malpighi, 4/240123 BolognaTel.: + 39 051 65811
RomeVia Camilluccia, 589/A00135 RomeTel: +39 06 367491
TurinGalleria San Federico, 5410121 TurinTel: +39 011 55971
Si ringraziano per la partecipazione tutti i contribuenti alla Survey | We appreciate the contribution of all Survey respondents
21 Investimenti SGR S.p.A.Alcedo SGR S.p.A.Aliante Partners SGRAlkemia Capital Partners Sgr S.p.A.Alto Partners SGR S.p.A.Antares Private Equity S.p.A.Ardian ItalyArgos WityuArmonia SGR S.p.A.Augens Capital S.r.l.AVM Associati S.p.A.Fondo Italiano d'Investimento SGRFriulia S.p.AGradiente SGR S.p.A.Green Arrow Capital SGR S.p.A.Hat Orizzonte SGR S.p.A.H.I.G. European Capital Partners Italy S.r.l.IGI SGR S.p.A.Insec Equity Partners SGR S.p.A.J. Hirsch & Co.LBO FranceMandarin Advisory S.r.l.Mittel S.p.AMutares AGOpera SGR S.p.A.P101 SGR S.p.A.PFH S.p.APillarstone Italy S.p.A.PM&Partners SGR S.p.A.Private Equity Partners SGR S.p.A.Progressio SGR S.p.A.Riello Investimenti Partners SGR S.p.A.Sagittafin S.r.l.Star Capital SGR S.p.A.Trilantic Capital PartnersWhite Bridge Investments S.p.A.Wise SGR S.p.A.Xenon Private Equity S.a.r.l.
Tutti i dati e le informazioni contenuti nella presente pubblicazione hanno carattere meramente informativo e divulgativo e non implicano alcuna garanzia da parte di Deloitte Financial Advisory S.r.l. in merito alla loro esattezza e/o completezza.
All data and information contained in this document are presented for publicity and educational purposes. Deloitte Financial Advisory does not guarantee on the correctness and completeness of said data and information.
Deloitte Private
Ernesto LanzilloDeloitte Private Leader - Italy +39 02 833 22 [email protected]
Elio Milantoni"Finance for growth" Solution Responsible+39 02 833 25 [email protected]
Deloitte Private [email protected]


Il nome Deloitte si riferisce a una o più delle seguenti entità: Deloitte Touche TohmatsuLimited, una società inglese a responsabilità limitata (“DTTL”), le member firm aderenti al suo network e le entità a esse correlate. DTTL e ciascuna delle sue member firmsono entità giuridicamente separate e indipendenti tra loro. DTTL (denominata anche “Deloitte Global”) non fornisce servizi ai clienti. Si invita a leggere l’informativa completa relativa alla descrizione della struttura legale di Deloitte Touche TohmatsuLimited e delle sue member firm all’indirizzo www.deloitte.com/about.
© 2019 Deloitte Financial Advisory S.r.l.
Related Documents