Welcome message from author
This document is posted to help you gain knowledge. Please leave a comment to let me know what you think about it! Share it to your friends and learn new things together.
Transcript

ISSN: 2247-6172, ISSN-L :2247-6172
Review of Applied Socio- Economic Research ( Volume 19, Issue 1 /2020 ), pp. 2
URL: http://www.reaser.eu e-mail: [email protected]
2
-------------------------------------------------------------------------------------------------------------
Copyright ©2019 Pro Global Science Association All rights reserved. No part of this publication may be reproduced, stored,
transmitted or disseminated, in any form, or by any means, without prior written permission from Pro Global Science Association, to whom all
requests to produce copyright material should be directed, in writing. -----------------------------------------------------------------------------------------------------------
Editors: Cristina Barna Manuela Epure
ISSN: 2247-6172, ISSN-L :2247-6172
Review of Applied Socio- Economic Research ( Volume 19, Issue 1 /2020 ), pp. 3
URL: http://www.reaser.eu e-mail: [email protected]
3
Table of content
1. Epure, Manuela, Editorial Forward …………………………………………………..….4
2. Abdallah, Ahmad Adel Jamil - The Role of Audit Committee in Improving Voluntary Disclosure “Field Study on Jordanian Insurance Companies”…………..…..………...5
3. Afifa, Malik Abu, Fares Alsufy, Mohammed Zakaria Soda - Mediating Effects of Liquidity in the Relationship between Earnings Quality and Market Value of the Share Price: Evidence from Jordan………………………………………………….....17
4. Al-Assaf, Ahmed -The Impact of Intellectual Capital on the Competitive Advantage in Jordanian TELECOM Companies:"A Case Study on ORANGE Company"..……..33
5. Fokam, Dieu Ne Dort Talla, Ningaye Paul, Nembua, Celestin Chameni - Ethnic Diversity Management and Poverty in Developing Countries………………………………………47
6. Kengdo, Arsène Aurelien Njamen, Nchofoung, Tii Njivukuh - Determinants of ethical behavior in social networks in Cameroon: case of group « Kerel Kongossa !!!! » on Facebook ………………………………………………………………………………………. 61
7. Ridha, Mahmood, Ismail Ab del-Rahman, Abdul Sattar H. Yousif - Investigating the Mediating Role of Organization’s Sustainability in The Relationship between Using Greening Technology Information Tools and Organization’s General Performance: A Field Study on A Group of Jordanian Business Organization………………………...75
8. Book review - Exploring Agriscience (5th ed.) book by Dr. Ray V. Herren; reviewed by Wandra Arrington……………………………………………………………85
ISSN: 2247-6172, ISSN-L :2247-6172
Review of Applied Socio- Economic Research ( Volume 19, Issue 1 /2020 ), pp. 4
URL: http://www.reaser.eu e-mail: [email protected]
4
Editorial Foreword
Dear Readers,
We are inviting you to discover new interesting topics in our Review of Applied Socio-Economic Research, Volume 19, Issue 1/2020 which may enrich your knowledge and broadening your horizons and, hopefully, become inspirational for your future research.
This issue presents the research results of authors coming from Middle –East, Africa, and the USA which ensures you, as readers, a different perspective on topics such as the impact of intellectual capital on competitive advantage, the role of the audit committee and the organization’s sustainability and the relationship between using greening technology information tools and organization’s general performance.
Moreover, you will discover new perspectives on ethnic diversity management and poverty in developing countries, and you are invited to identify the determinants of ethical behavior in social networks such as Facebook, revealed through an interesting case study from Cameroon.
The diversity of topics of the current issue maybe will make you curious to explore new fields of research and will enhance your confidence in developing an interdisciplinary approach of your current research interests.
We would like to thank you to all our reviewers for their dedicated commitment to assisting, guiding authors, and supporting their efforts to publish valuable research papers.
Finally, we are delighted to inform you that our publication has been accepted for indexing in SCOPUS – Elsevier which will offer our authors the chance to enhance their work’s visibility worldwide.
Enjoy your reading!
Manuela Epure Managing Editor
ISSN: 2247-6172, ISSN-L :2247-6172
Review of Applied Socio- Economic Research ( Volume 19, Issue 1 /2020 ), pp. 5-16
URL: http://www.reaser.eu e-mail: [email protected]
5
The Role of the Audit Committee in Improving Voluntary Disclosure
“Field Study on Jordanian Insurance Companies"
Ahmad Adel Jamil Abdallah1+, Jumana Yousef Ahmad Musallam 2, Ayman Bader3
1Accounting Department, Faculty of Business, Al-Zaytoonah University of Jordan, Jordan 2Accounting program, Al-Zaytoonah University of Jordan, Jordan
3Accounting Department, Faculty of Business, Al-Zaytoonah University of Jordan, Jordan
Abstract. The audit committee plays a major role in corporate governance regarding the organization’s direction, control, and accountability. As a representative of the board of directors and the main part of the corporate governance mechanism, the audit committee is involved in the organization’s both internal and external audits, internal control, accounting, and financial reporting, regulatory compliance, and risk management. This study aims to provide and explain the relationship between audit committee roles and voluntary disclosure, and how audit committee tries to enhance her role in voluntary disclosure among Jordanian insurance companies listed in Amman stock exchange (24 company). We concentrated on two roles, reviewing accounting policies and risk management used to improve the voluntary disclosure, through questionnaires distributed to all audit committee members in insurance companies (84 members), (75) questionnaire was accepted and used in the pilot analysis of the originally distributed questionnaires at (percentage of 89.3%) through use One-Sample T-Test and verify the validity of this hypothesis, the arithmetic means and standard deviations of the items concerning for the audit committee role we found that these two roles influence the level of voluntary disclosure among insurance companies. audit committee followed specific procedures in reviewing, supervising, and control of the company accounting policies to improve the voluntary disclosure. Moreover, about risk management, the study concluded that the audit committee covers all aspects of the company's operations and sets clear methods for each type of risk and how to deal with them by the voluntary disclosure of the company.
Keywords: Audit Committee, Voluntary disclosure, reviewing accounting policies, Risk management
JEL Codes: M40, M41, M42
1. Introduction In recent years, the role of the Audit Committees as a mechanism for corporate governance has
increased (Hesiany et al., 2013), especially after the financial crises between1980s and 1990s, regulators have tried to boost the laws, specifically concerning the transparency and independence of the Audit Committee (AC) (Samaha et al., 2012). These financial crises which caused in the collapse of highly _________________________________________________
+Corresponding author email: [email protected]
ISSN: 2247-6172, ISSN-L :2247-6172
Review of Applied Socio- Economic Research ( Volume 19, Issue 1 /2020 ), pp. 5-16
URL: http://www.reaser.eu e-mail: [email protected]
6
competitive companies like Enron, Parmalat, and WorldCom have resulted in the overthrow in investors’ confidence in financial markets (Delgado-García et al., 2010) Audit Committees plays a key role in monitoring and controlling of the internal mechanism of an organization as they assist efficiently the board of directors in the decision-making process (Talpur et al., 2018).
Alsafadi, (2015) analyzes voluntary disclosure Orientations in financial reports on Rationalize investors' decisions in the listed industrial companies on Amman stock exchange. The study results explain that the Sectorial information and Information on employees one of the most important voluntary disclosure items affecting investor decisions. Previous studies evaluate meetings number (Delgado-García et al., 2010) the independence influence (Zhang et al., 2007), existence (Alves, 2013), size (Madi et al., 2014), and financial expertise (Liu et al., 2014) of the audit committee. Other studies assessed the audit committee influence on earnings quality (Hamdan et al., 2013) found that there was an influence of some standard characteristics of audit on earnings quality, for earning management (Inaam and Khamoussi, 2016) found that the audit committee attributes have a negative relationship with earnings management, moreover for agency cost (Cai et al., 2015) examine the role of audit committees in mitigating the agency costs, more studies concentrated on the relationship between the corporate governance and voluntary disclosure like (Talpur et al., 2018) found that audit committee size, independence, and meetings are the factors that influence the voluntary corporate-level governance disclosure, while (Alfraih and Almutawa, 2017) examined the eight corporate governance mechanisms and found Cross directorship, the board size, and role duality are negatively related to voluntary disclosure, while government ownership is positively related to voluntary disclosure. In contrast, the proportion of non-executive directors, family members on the board, the presence of an audit committee, and the presence of the ruling family on the board have an insignificant influence on voluntary disclosure practices. Even so, the role of the audit committee in enhancing the voluntary disclosure level is still mysterious.
2. Voluntary Disclosure Motivation
The Financial Accounting Standard Board (FASB, 2000) describes “voluntary disclosures” as “information primarily outside of the financial statements that are not explicitly required by accounting rules or standards” In Jordan, the voluntary disclosure items were defined as those items that are not regulated by Jordanian reporting forces (the Companies Law No. 35 of 2002, the accounting profession, the Securities Law No. 35 of 2002) (Al Shattarat et al., 2010), And/ Or additional information provided by a company, beyond the statutory and legal requirements by regulatory bodies like (Jordan Securities Commission Law No.17 of 2017), etc. These disclosures enhance the quality and quantity of information not be disclosed which could be sufficient for making a decision. In other words, this information is not mandatory to be disclosed but still disclosed by a company (Setiany et al., 2017).
ISSN: 2247-6172, ISSN-L :2247-6172
Review of Applied Socio- Economic Research ( Volume 19, Issue 1 /2020 ), pp. 5-16
URL: http://www.reaser.eu e-mail: [email protected]
7
3. Incentive of Study
Audit committee related disclosure and reporting is a necessary element for assessing the
effectiveness of audit committee function (lin et al., 2008). Previous studies that examined the role of audit committees on disclosure are still relatively scant. A study was conducted by (Arifin et al., 2001) on 153 annual reports of companies listed on Indonesian Stock Exchange (IDX) in 1999 that linked the role of audit committees on disclosure in Indonesia through using the attendance rate of audit committee’s members in audit committees meetings as a proxy for audit committees. The research concluded that audit committees do not have a significant effect on voluntary financial disclosure presented by the company.
In Jordan, corporate governance instructions for insurance companies article No.7 of 2006 identified the board of directors shall establish an audit committee according to specific functions and authorities (Securities depository center, 2006). In recent years, the Jordanian legislator has adopted several legislations and laws that have played a major role in highlighting the importance and organization of audit committees and the characteristics that should be provided in audit committees. A part of these legislations and laws related to voluntary disclosure which may discover some of important information that the companies may not be disclosed in their financial reports (Alshaer, 2019), This study problem focus on the role of audit committees on voluntary disclosure as a tool to improve the level of voluntary disclosure about any information’s may effect on decision making for financial statements users and how audit committee can enhance their roles in the fields of reviewing accounting policies and risk management, moreover this study also contributes to clarifying the effectiveness of the audit committees on the one hand, and on the other hand by evaluating the role of the audit committees in improving the voluntary disclosure. Over the year 2018 of Jordanian insurance companies listed in Amman stock exchange (ASE), through the distribution of a questionnaire to the audit committees operating in these companies to know the role of their audit committees.
4. Hypothesis development
Based on the above-discussed motivations, this study aimed to achieve two objectives:
First, to examine the role of the audit committee in the field of reviewing accounting policies in Jordanian Insurance Companies listed in Amman stock exchange; second to examine the role of the audit committee in the field of risk management in Jordanian Insurance Companies listed in Amman stock exchange
In the following sections, the role of Audit Committee variables are reviewed through previous studies to provide their impact on voluntary disclosures to formulate the hypotheses used to achieve the objective.
ISSN: 2247-6172, ISSN-L :2247-6172
Review of Applied Socio- Economic Research ( Volume 19, Issue 1 /2020 ), pp. 5-16
URL: http://www.reaser.eu e-mail: [email protected]
8
4.1.Reviewing accounting policies
As we discussed previously, audit committees play a key role by supporting the board of directors in internal control of the company. In his article (Al mobarak,2016) explain that the audit committees aim to ensure that the reports and data required by the Company have been prepared following generally accepted accounting policies and are not limited to the general acceptance of the applicable methods. Moreover (Al-Baidhani, 2016) examined the role of audit committees in financial and accounting reports and their compliance with local laws and legislations. The general acceptance of policies is intended to ensure that these policies receive appropriate use and user support. The audit committees should ensure that these accounting policies are checked two important matters:
1- Include procedures for the preparation and presentation of reports, data, and unbiased, and to reflect as accurately as possible the data provided by accounting policies to users.
2- Determine the effect of using the accounting policies adopted and the correct principles, and companies use the proper and appropriate basis to achieve the data and reports required for the companies.
Therefore, consistent with the previous literature, this study has formulated the first hypothesis as follow:
H01: There is no statistically significant role, at the significance level of 0.05≤ α , for the audit committee's role in reviewing the accounting policies used to improving the voluntary disclosure in Jordanian insurance companies.
4.2.Risk management
Corporate governance instructions for insurance companies article No.8 of 2006 identified that the company must have a written risk management policy compatible with the company business size and nature of its business. Covers all aspects of the Company's operations and set clear standards and limits for each type of risk and procedures to deal with it in addition to monitoring the company's compliance with the risk management policy and regular assessment of risk management procedures and policies (Securities depository center, 2006) moreover (Musallam,2018) found there is a significant positive relationship of the existence of risk management, audit committee meeting and audit committee size with CSR disclosure in Palestinian listed companies, which mean there is a role for an audit committee on risk management. In his study (Al-btosh,2015) found that there is a relationship between the role of the audit committees improving the internal audit efficiency. And the relationship between the internal audit efficiency and the ability of the Jordanian electricity companies to risk management. This role we will try to discuss in the second hypothesis which formulated as follow:
H02: There is no statistically significant role at the significance level of 0.05≥α for the audit committee's role on risk management to improving the voluntary disclosure in Jordanian insurance companies.
5. Methodology
ISSN: 2247-6172, ISSN-L :2247-6172
Review of Applied Socio- Economic Research ( Volume 19, Issue 1 /2020 ), pp. 5-16
URL: http://www.reaser.eu e-mail: [email protected]
9
5.1.Sample and data resources
To get the primary data, the researchers used the analytical descriptive method to collect data, analyze and test the hypotheses by relying on questionnaires distributed to the audit committee members (84 members) operating in Jordanian insurance companies (24 company) (Insurance commission.2019), In which the members were asked to state the likelihood (on a 5-point scale: [5] strongly agree; [4] agree; [3] neutral; [2] disagree; [1] strongly disagree). Questionnaires distributed to all these (84) member, (77) questionnaires were returned (percentage of 91.6%); (2) Questionnaires were excluded for incomplete filling and clear randomization during filling at (percentage of 2.3%) the rest of 75 copies were accepted and used in the pilot analysis of the originally distributed questionnaires at (percentage of 89.3%). Secondary data is collected from different articles published by the well-known periodicals, books, and dissertations related to the audit committee and voluntary disclosure.
6. Data Analysis and Findings
6.1.Reliability Test
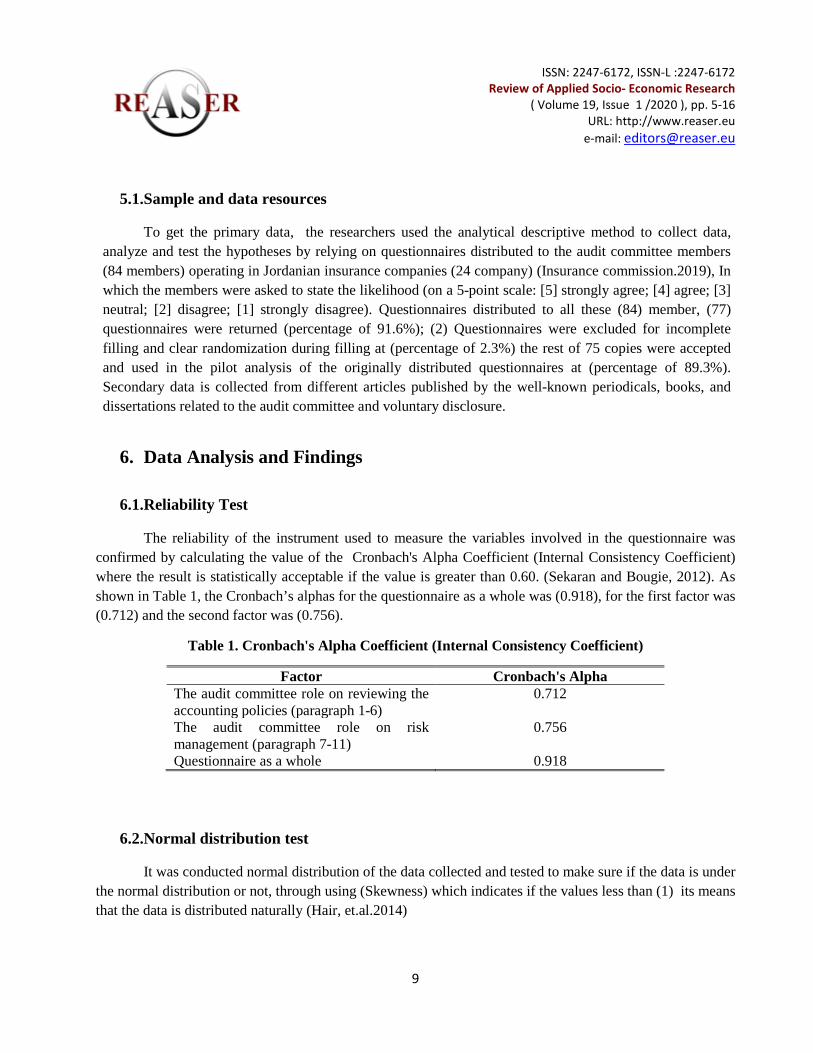
The reliability of the instrument used to measure the variables involved in the questionnaire was confirmed by calculating the value of the Cronbach's Alpha Coefficient (Internal Consistency Coefficient) where the result is statistically acceptable if the value is greater than 0.60. (Sekaran and Bougie, 2012). As shown in Table 1, the Cronbach’s alphas for the questionnaire as a whole was (0.918), for the first factor was (0.712) and the second factor was (0.756).
Table 1. Cronbach's Alpha Coefficient (Internal Consistency Coefficient)
Factor Cronbach's Alpha The audit committee role on reviewing the accounting policies (paragraph 1-6)
0.712
The audit committee role on risk management (paragraph 7-11)
0.756
Questionnaire as a whole 0.918
6.2.Normal distribution test
It was conducted normal distribution of the data collected and tested to make sure if the data is under the normal distribution or not, through using (Skewness) which indicates if the values less than (1) its means that the data is distributed naturally (Hair, et.al.2014)
ISSN: 2247-6172, ISSN-L :2247-6172
Review of Applied Socio- Economic Research ( Volume 19, Issue 1 /2020 ), pp. 5-16
URL: http://www.reaser.eu e-mail: [email protected]
10
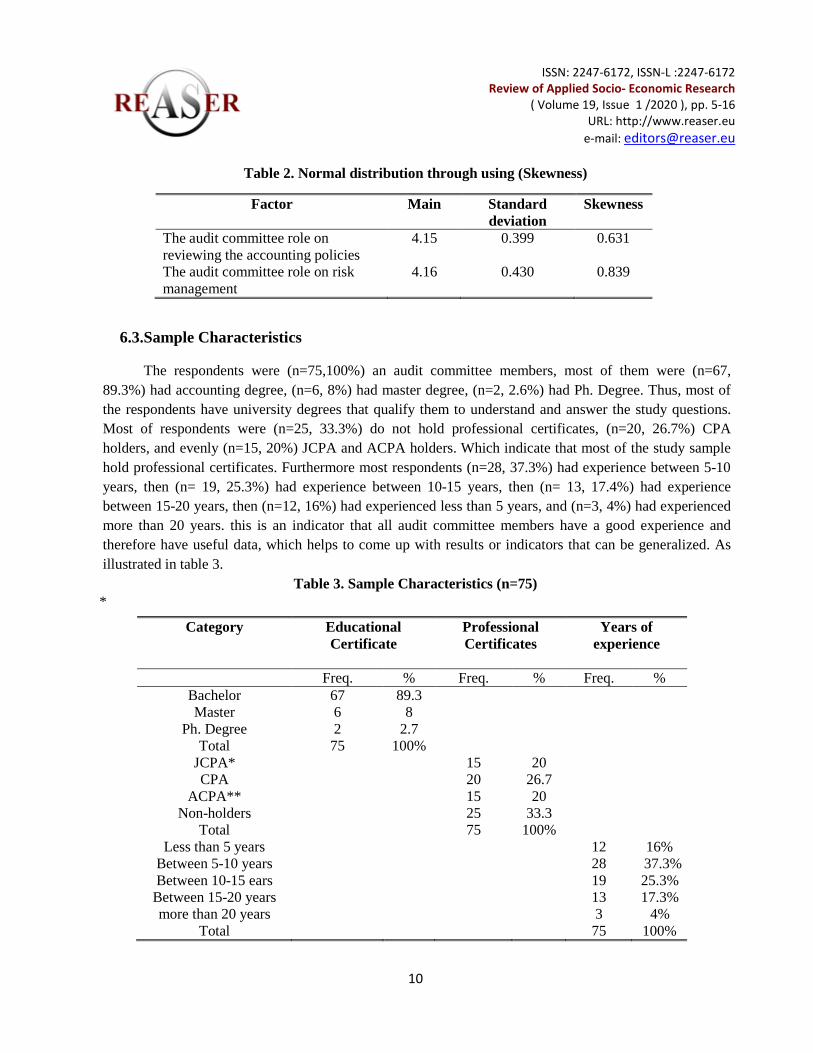
Table 2. Normal distribution through using (Skewness)
Factor Main Standard deviation
Skewness
The audit committee role on reviewing the accounting policies
4.15 0.399 0.631
The audit committee role on risk management
4.16 0.430 0.839
6.3.Sample Characteristics
The respondents were (n=75,100%) an audit committee members, most of them were (n=67, 89.3%) had accounting degree, (n=6, 8%) had master degree, (n=2, 2.6%) had Ph. Degree. Thus, most of the respondents have university degrees that qualify them to understand and answer the study questions. Most of respondents were (n=25, 33.3%) do not hold professional certificates, (n=20, 26.7%) CPA holders, and evenly (n=15, 20%) JCPA and ACPA holders. Which indicate that most of the study sample hold professional certificates. Furthermore most respondents (n=28, 37.3%) had experience between 5-10 years, then (n= 19, 25.3%) had experience between 10-15 years, then (n= 13, 17.4%) had experience between 15-20 years, then (n=12, 16%) had experienced less than 5 years, and (n=3, 4%) had experienced more than 20 years. this is an indicator that all audit committee members have a good experience and therefore have useful data, which helps to come up with results or indicators that can be generalized. As illustrated in table 3.
Table 3. Sample Characteristics (n=75) *
Category Educational Certificate
Professional Certificates
Years of experience
Freq. % Freq. % Freq. %
Bachelor 67 89.3 Master 6 8
Ph. Degree 2 2.7 Total 75 100%
JCPA* 15 20 CPA 20 26.7
ACPA** 15 20 Non-holders 25 33.3
Total 75 100% Less than 5 years 12 16%
Between 5-10 years 28 37.3% Between 10-15 ears 19 25.3%
Between 15-20 years 13 17.3% more than 20 years 3 4%
Total 75 100%
ISSN: 2247-6172, ISSN-L :2247-6172
Review of Applied Socio- Economic Research ( Volume 19, Issue 1 /2020 ), pp. 5-16
URL: http://www.reaser.eu e-mail: [email protected]
11
Jordan certified public accountant
** Arab Certified Professional Accountant
6.4.Hypotheses Test In this part of the study, through review the hypothesis test, the hypotheses were subjected to the
test (One-Sample T-Test)
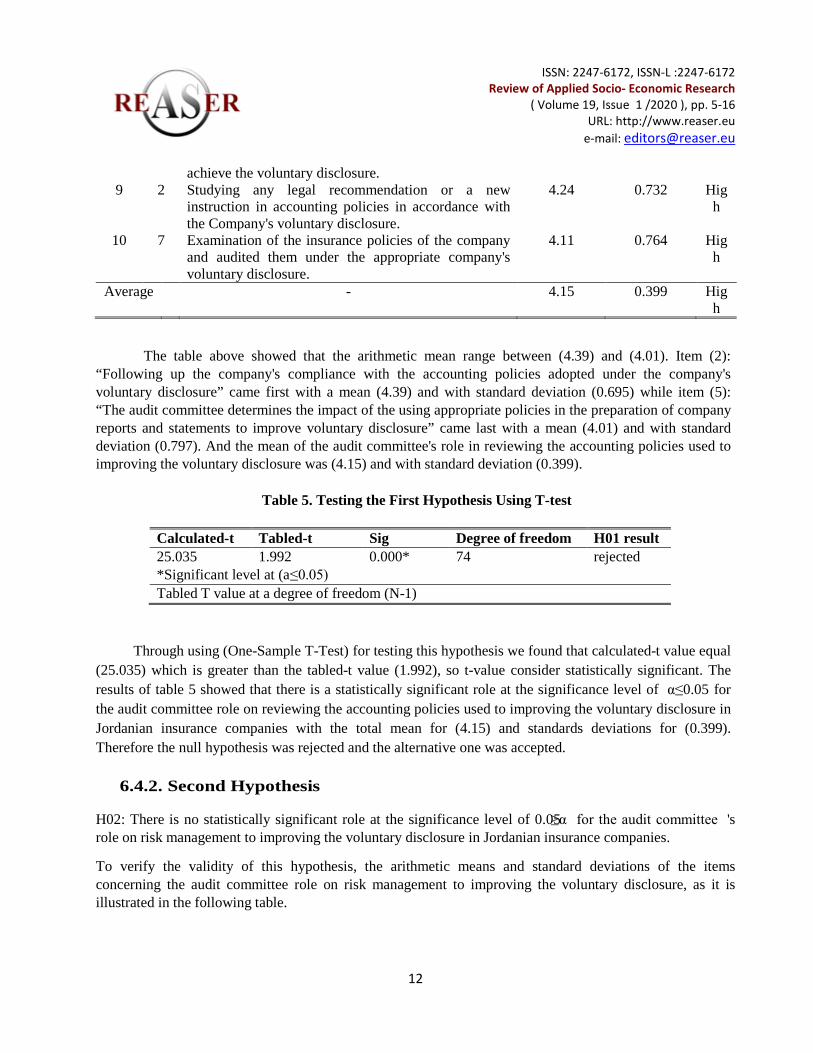
6.4.1. First Hypothesis H01: There is no statistically significant role at the significance level of 0.05≤α for the audit committee's role in reviewing the accounting policies used to improving the voluntary disclosure in Jordanian insurance companies. To verify the validity of this hypothesis, the arithmetic means and standard deviations of the items concerning for the audit committee role on reviewing the accounting policies used to improving the voluntary disclosure, as it is illustrated in the following table
Table 4. The arithmetic means and standard deviations of the items concerning for the audit committee role on reviewing the accounting policies used to improving the voluntary disclosure
Rank N Items Mean Std. Sig. 1 8 Reviewing the accounting policies to enhance the
internal control related to the company's voluntary disclosure
4.09 0.756 High
2 1 Following up on the company's compliance with the accounting policies adopted in accordance with the company's voluntary disclosure.
4.39 0.695 High
3 3 Supervising and controlling the company's business in relation to the accounting policies of the voluntary disclosure.
4.21 0.703 High
4 6 The audit committee expresses its opinion as to whether the policies adopted are consistent/appropriate with the company's voluntary disclosure.
4.15 0.800 High
5 10 The audit committee determines the impact of using appropriate policies in the preparation of company reports and statements to improve voluntary disclosure
4.01 0.797 High
6 5 Discussing matters relating to the accuracy of the accounting procedures and matters relating to the preparation of Company reports and statements in accordance with the applicable policies in the Company for voluntary disclosure.
4.15 0.748 High
7 9 Management follows up any changes to the Company's accounts and any changes in accounting policies as a result of the auditor's suggestion related to the voluntary disclosure.
4.04 0.796 High
8 4 Reviewing the accounting policies and selects those policies that appropriate to the work nature required, to
4.16 0.772 High
ISSN: 2247-6172, ISSN-L :2247-6172
Review of Applied Socio- Economic Research ( Volume 19, Issue 1 /2020 ), pp. 5-16
URL: http://www.reaser.eu e-mail: [email protected]
12
achieve the voluntary disclosure. 9 2 Studying any legal recommendation or a new
instruction in accounting policies in accordance with the Company's voluntary disclosure.
4.24 0.732 High
10 7 Examination of the insurance policies of the company and audited them under the appropriate company's voluntary disclosure.
4.11 0.764 High
Average - 4.15 0.399 High
The table above showed that the arithmetic mean range between (4.39) and (4.01). Item (2): “Following up the company's compliance with the accounting policies adopted under the company's voluntary disclosure” came first with a mean (4.39) and with standard deviation (0.695) while item (5): “The audit committee determines the impact of the using appropriate policies in the preparation of company reports and statements to improve voluntary disclosure” came last with a mean (4.01) and with standard deviation (0.797). And the mean of the audit committee's role in reviewing the accounting policies used to improving the voluntary disclosure was (4.15) and with standard deviation (0.399).
Table 5. Testing the First Hypothesis Using T-test
Calculated-t Tabled-t Sig Degree of freedom H01 result 25.035 1.992 0.000* 74 rejected *Significant level at (a≤0.05) Tabled T value at a degree of freedom (N-1)
Through using (One-Sample T-Test) for testing this hypothesis we found that calculated-t value equal
(25.035) which is greater than the tabled-t value (1.992), so t-value consider statistically significant. The results of table 5 showed that there is a statistically significant role at the significance level of 0.05≤α for the audit committee role on reviewing the accounting policies used to improving the voluntary disclosure in Jordanian insurance companies with the total mean for (4.15) and standards deviations for (0.399). Therefore the null hypothesis was rejected and the alternative one was accepted.
6.4.2. Second Hypothesis
H02: There is no statistically significant role at the significance level of 0.05≥α for the audit committee 's role on risk management to improving the voluntary disclosure in Jordanian insurance companies.
To verify the validity of this hypothesis, the arithmetic means and standard deviations of the items concerning the audit committee role on risk management to improving the voluntary disclosure, as it is illustrated in the following table.

ISSN: 2247-6172, ISSN-L :2247-6172
Review of Applied Socio- Economic Research ( Volume 19, Issue 1 /2020 ), pp. 5-16
URL: http://www.reaser.eu e-mail: [email protected]
13
Table 6. The arithmetic means and standard deviations of the items concerning for the audit committee role on risk management to improving the voluntary disclosure
Rank N Items Mean Std. Sig. 1 3 Following up and monitoring how the company
compliance with the risk management policies and risk limits, related to the voluntary disclosure.
4.21 0.622 High
2 6 The Audit Committee contributes to the evaluation of risk management policies and their limits in the light of the risk of the problems that may be faced to improve to voluntary disclosure.
4.16 0.806 High
3 8 Contributing through periodic review to know the effectiveness of the most important financial risks that may be company exposed and related to the company's voluntary disclosure.
4.04 0.761 High
4 4 Cover all aspects of the company's operations and set clear standards and methods for each type of risk and how to deal with them under the company's voluntary disclosure.
4.21 0.810 High
5 7 Following procedures to ensure that information reaches at the right time, and know the necessary steps to address the risks that the company may face.
4.15 0.817 High
6 1 Contribute to the plan's development to reduce the risks faced by various departments of the company's business under the company's voluntary disclosure.
4.24 0.589 High
7 2 The audit committee provides direct communication channels between the head of risk management and the internal audit department to ensure transparency in improving voluntary disclosure.
4.24 0.803 High
8 5 The audit committee recommends to the Board of Directors regarding the company's ability to facing the risks that may be exposed and related to voluntary disclosure
4.19 0.730 High
9 9 Review the irregularities with management and the head of risk management, follow up the management's reactions and proposed corrective actions to deal with them to improve the level of voluntary disclosure.
4.03 0.677 High
Average - 4.16 0.430 High
ISSN: 2247-6172, ISSN-L :2247-6172
Review of Applied Socio- Economic Research ( Volume 19, Issue 1 /2020 ), pp. 5-16
URL: http://www.reaser.eu e-mail: [email protected]
14
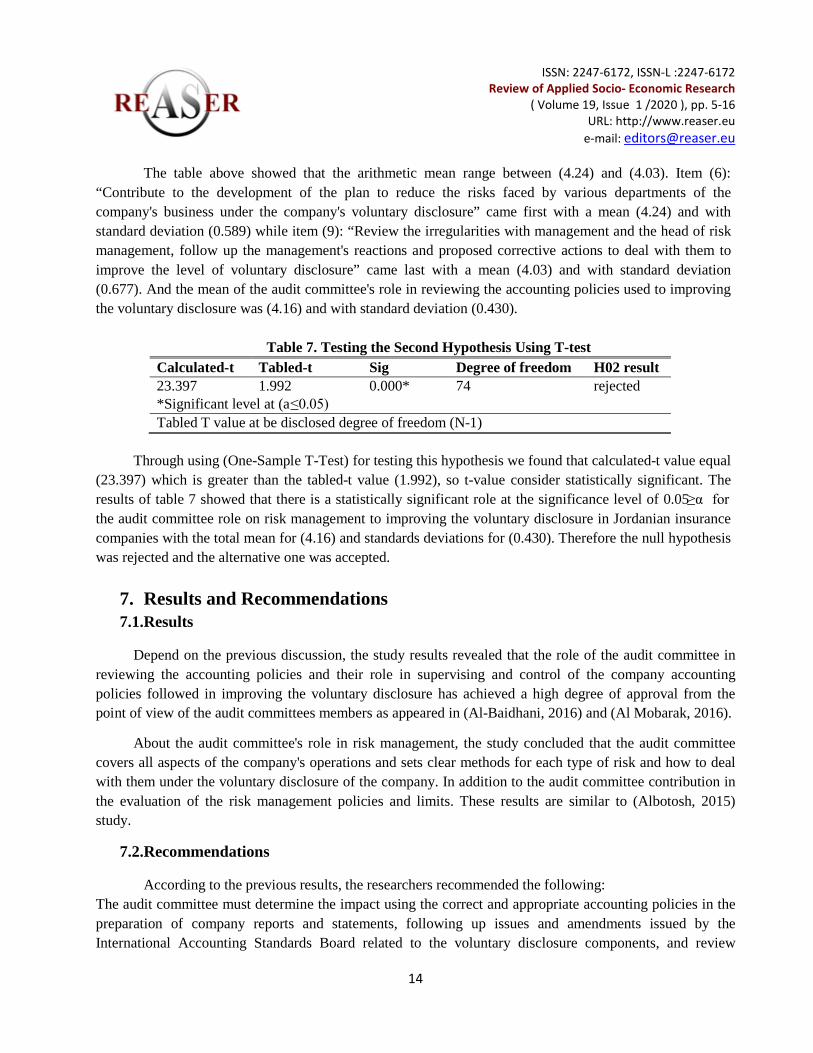
The table above showed that the arithmetic mean range between (4.24) and (4.03). Item (6): “Contribute to the development of the plan to reduce the risks faced by various departments of the company's business under the company's voluntary disclosure” came first with a mean (4.24) and with standard deviation (0.589) while item (9): “Review the irregularities with management and the head of risk management, follow up the management's reactions and proposed corrective actions to deal with them to improve the level of voluntary disclosure” came last with a mean (4.03) and with standard deviation (0.677). And the mean of the audit committee's role in reviewing the accounting policies used to improving the voluntary disclosure was (4.16) and with standard deviation (0.430).
Table 7. Testing the Second Hypothesis Using T-test Calculated-t Tabled-t Sig Degree of freedom H02 result 23.397 1.992 0.000* 74 rejected *Significant level at (a≤0.05) Tabled T value at be disclosed degree of freedom (N-1)
Through using (One-Sample T-Test) for testing this hypothesis we found that calculated-t value equal
(23.397) which is greater than the tabled-t value (1.992), so t-value consider statistically significant. The results of table 7 showed that there is a statistically significant role at the significance level of 0.05≥α for the audit committee role on risk management to improving the voluntary disclosure in Jordanian insurance companies with the total mean for (4.16) and standards deviations for (0.430). Therefore the null hypothesis was rejected and the alternative one was accepted.
7. Results and Recommendations 7.1.Results
Depend on the previous discussion, the study results revealed that the role of the audit committee in reviewing the accounting policies and their role in supervising and control of the company accounting policies followed in improving the voluntary disclosure has achieved a high degree of approval from the point of view of the audit committees members as appeared in (Al-Baidhani, 2016) and (Al Mobarak, 2016).
About the audit committee's role in risk management, the study concluded that the audit committee covers all aspects of the company's operations and sets clear methods for each type of risk and how to deal with them under the voluntary disclosure of the company. In addition to the audit committee contribution in the evaluation of the risk management policies and limits. These results are similar to (Albotosh, 2015) study.
7.2.Recommendations
According to the previous results, the researchers recommended the following: The audit committee must determine the impact using the correct and appropriate accounting policies in the preparation of company reports and statements, following up issues and amendments issued by the International Accounting Standards Board related to the voluntary disclosure components, and review
ISSN: 2247-6172, ISSN-L :2247-6172
Review of Applied Socio- Economic Research ( Volume 19, Issue 1 /2020 ), pp. 5-16
URL: http://www.reaser.eu e-mail: [email protected]
15
irregularities with management and risk management department and follow up corrective proposed actions to improve voluntary disclosure.
8. References [1] Al-Baidhani ، Ahmed. “The Role of Audit Committee in Corporate Governance: Descriptive Study”. University Putra Malaysia - Putra Business School Researched, Malaysia. 2016.
[2] Al-btosh, Khaldon. “The role of audit committees in improving the efficiency of internal auditing to manage the risk”, non-published master thesis, Middle East University, Jordan. 2015. [3] Alfraih, M, M. and Almutawa, A. M. "Voluntary disclosure and corporate governance: empirical evidence from Kuwait", International Journal of Law and Management. 2017, 59 (2), 217-236, Uhttps://doi.org/10.1108/IJLMA-10-2015-0052U. [4] Almobarak, Abdalhameed. “definition of review-objective-categories-standards”, Alfajer aljadeed for accounting and review and regulations. (Uhttp://mobarknew.blogspot.com/2016/06/blog-post_18.html U), 2016.
[5] Arifin, H, H, and Daing N, I. “Consensus between users and preparers on the importance of the voluntary disclosure items in annual reports: an Indonesian study”. Proceedings the Fourth Asian Academy Management Conference. Johor Bahru. Malaysia, 2001, 458-468.. [6] Al-safady, H. ,”The impact of voluntary accounting disclosure in the financial reports to rationalize the investors decisions in the industrial companies listed in amman stock exchange (field study)”., non-published master thesis, Zarqa University. Jordan. 2015. [7] Al-shae'r, S., “The impact of audit committee characteristics on voluntary disclosure ''an applied study on the banks listed on the Palestine exchange''”, non-published master thesis, The Islamic University of Gaza. Palestine. 2019. [8] Al Shattarat, W. K. and Haddad, A. E. and Al-Hares, O.M., “The Extent of Voluntary Disclosure in an Emerging Capital Market: The Case of Jordan”, Journal of Modern Accounting and Auditing, 6, (10), 39-50. 2010. [9] Alves, S., “The impact of audit committee existence and external audit on earnings management: evidence from Portugal”, Journal of Financial Reporting & Accounting, 2013, 11 (2), 143-165. [10] Cai, C.X., Hillier, D., Tian, G. and Wu, Q., “Do audit committees reduce the agency costs of ownership structure?” , Pacific-Basin Finance Journal, 2015, 35, (Part A), 225-240. [11] Delgado-García, J.B., Quevedo-Puente, D., La Fuente-Sabaté, D. and Manuel, J., “The impact of ownership structure on corporate reputation: evidence from Spain”, Corporate Governance: An International Review, 2010, 18 (6), 540-556. [12] Financial Accounting Standard Board (FASB), Business Reporting Research Project, FASB, New York, NY, available at: Uwww.fasb.org. U2000.
[13] Hair, Jr. Black,W.J. Babin, B. J. Anderson, R.E., . Multivariate Data Analysis, (7th edition): Prentice Hall. 2014. [14] Hamdan, A.M.M Mushtaha, S.M.S; and Al-Sartawi, A.M., “The Audit Committee Characteristics and Earnings Quality: Evidence from Jordan”, Australasian Accounting Business and Finance Journal, 2013, 7 (4), 51-80 2013, 51-80.
ISSN: 2247-6172, ISSN-L :2247-6172
Review of Applied Socio- Economic Research ( Volume 19, Issue 1 /2020 ), pp. 5-16
URL: http://www.reaser.eu e-mail: [email protected]
16
[15] Hesiany,A., Hawas,S. (), "Audit committees and their development under the laws and reports issued by professional bodies at the international and local levels, Journal of the Economic Sciences Institute",2013, 17 (5), 217-235.
[16] Inaam, Z. and Khamoussi, H. , “Audit committee effectiveness, audit quality and earnings management: a meta-analysis”, International Journal of Law and Management, 2016, 58 (2), 179-196. [17] Jordan Insurance Commission, annual report 2019. [18] Lin, Z. J., Xiao J. Z., Tang, Q. "The roles, responsibilities and characteristics of audit committee in China", Accounting, Auditing & Accountability Journal, 2008, 21 (5), 721-751, https:// doi.org/10.1108/09513570810872987. [19] Liu, M.H.C., Tiras, S.L. and Zhuang, Z., “Audit committee accounting expertise, expectations management, and nonnegative earnings surprises”, Journal of Accounting and Public Policy, 2014, 33 (2), 145-166. [20] Madi, H.K., Ishak, Z. and Manaf, N.A.A., “The impact of audit committee characteristics on corporate voluntary disclosure”, Procedia-Social and Behavioral Sciences, 2014, 164, 486-492. [21] Musallam, S. , "The direct and indirect effect of the existence of risk management on the relationship between audit committee and corporate social responsibility disclosure", Benchmarking: An International Journal, 2018, 25 (9), 4125-4138. https://doi.org/10.1108/BIJ-03-2018-0050. [22] Samaha, K., Dahawy, K., Hussainey, K. and Stapleton, P., “The extent of corporate governance disclosure and its determinants in a developing market: the case of Egypt”, Advances in Accounting, 2012, 28 (1), 168-178.
[23] Securities depository center, Corporate Governance Instructions for Insurance Company, . U2006. [24] Sekaran, U.and Bougie, R., . Research Methods for Business: A Skill Building Approach, (6th Edition), NY: John Wiley & Sons Inc, New York. 2012. [25] Setiany E., Hartoko, S., Suhardjanto, D., Honggowati, D. “ Audit Committee Characteristics and Voluntary Financial Disclosure”, Review of Integrative Business and Economics Research, 2017, 6, (3), 239-253.. [26] Talpur, S., Lizam, M. and Zabri, S. , "Do audit committee structure increases influence the level of voluntary corporate governance disclosures?", Property Management, 2018, 36 (5), 544-561. https://doi.org/10.1108/PM-07-2017-0042.
[27] Zhang, Y., Zhou, J. and Zhou, N., “Audit committee quality, auditor independence, and internal control weaknesses”, Journal of Accounting and Public Policy, 2007, 26 (3), 300-327. ____________________________________
Manuscript received: 08.11.2019 Manuscript received in revised form: 01.03.2020 Manuscript accepted: 21.06.2020
ISSN: 2247-6172; ISSN-L: 2247-6172
Review of Applied Socio- Economic Research ( Volume 19 Issue 1/2020 ), pp. 17-32
URL: http://www.reaser.eu e-mail: [email protected]
17
Mediating Effects of Liquidity in the Relationship between Earnings Quality and Market Value of the Share Price: Evidence from Jordan
Fares Alsufy 1 +, Malik Abu Afifa2 and “Mohammed Zakaria” Soda1 1 Faculty of Business, Isra University, Amman, Jordan
2 Faculty of Business, Al-Zaytoonah University of Jordan, Amman, Jordan
Abstract. The current study aims to investigate the effect of earnings quality on the market value of the share price, and then the role of liquidity as a mediating effect in the relationship between earnings quality and the market value of the share price. This study provides some empirical evidence from an emerging market, especially from Jordanian market. The framework of this study is developed by the classical valuation theory that discusses the factors that affect the market value of the shares prices. Also, this study is a quantitative study using a panel data analysis. The study population includes all Jordanian industrial public shareholding companies listed in the Amman Stock Exchange (ASE) during the year 2012 to the year 2017, where there are 62 industrial companies listed in ASE during this period. The study sample is all targeted companies that are included in the study population. In other words, it uses a comprehensive sample method. In conclusion, a high earnings quality and more liquidity in Jordanian industrial public shareholding companies increase their market value of the shares prices. At the same time, liquidity mediates the relationship between earnings quality and the market value of the shares prices of those companies. Moreover, the level of Jordanian market controlling of earnings quality and liquidity is a good one. The study recommended to continually investigating the relationship between organizational factors and earnings management, which may have a positive effect on the market value of the shares prices.
Keywords: Information opacity, Earnings quality, Investor protection, Emerging market shares, Industrial Companies.
JEL Codes: M41, G40, G41, G32.
1. Introduction Earnings quality is one of the most important matters for evaluating the financial situation. Earnings
quality concept is a catch-all term for the relevance and reliability of the information contained in the financial statements (Dempster & Oliver, 2019). It provides great benefits for investors, creditors, financing suppliers, and other users (Schipper & Vincent, 2003; Abdelghany, 2005; Das, Shroff, & Zhang, 2009; Lambert, Leuz, & Verrecchia, 2007; Dempster & Oliver, 2019). Francis, LaFond, Olsson, and Schipper (2002) discussed that the information of earnings quality is the main factor used by creditors, where there is a negative relationship between earnings quality and cost of capital (Francis, LaFond, Olsson, & Schipper, 2004; Easley & O’Hara, 2004). The companies with a good earnings quality enjoy discounts in their costs of debt, as well as in their costs of equity relative to companies with the poorest earnings quality (Dechow & Dichev, 2002; Easley & O’Hara, 2004; Ecker, Francis, Kim, Olsson, & Schipper, 2006).
Chan, Chen-K, Chen-T, and Yu (2015) documented that high earnings quality works on increasing investors' confidence in earnings information through reducing financial misstatements (Cheng, Dinh, Schultze, & Assel, 2019). Beyer, Guttman, and Marinovic (2019) confirmed that earnings quality works on managing the magnitude of investors' uncertainty via providing information about future earnings and the
ISSN: 2247-6172; ISSN-L: 2247-6172
Review of Applied Socio- Economic Research ( Volume 19 Issue 1/2020 ), pp. 17-32
URL: http://www.reaser.eu e-mail: [email protected]
18
company assets in place (Perotti & Wagenhofer, 2014). Furthermore, Mitra (2016) noted that company-specific return volatility is highly correlated with earnings quality, where economic fundamentals and managerial discretionary behavior have an impact on company-specific return volatility. This is because current earnings are useful for predicting future earnings and are an important indicator of future dividend-paying ability (Schipper & Vincent, 2003; Dempster & Oliver, 2019). Moreover, earnings quality refers to the “ability of reported earnings to reflect true earnings, as well as the usefulness of reported earnings to predict future earnings” (Bellovary, Giacomino, & Akers, 2005), and thereby a high earnings quality will indicate lower company-specific return volatility (Mitra, 2016).
However, Healy and Whalen (1999) reported that “investors view earnings as value-relevant data” to assess the prospects of company enterprises. This is because earnings and earnings quality affected by management are related to accounting methods, judgments, and estimates made, as well as decisions by standard setters (Teets, 2002). Dempster and Oliver (2019) discussed that smoothing patterns of earnings can be used to communicate superior earnings for investors (Thomas & Zhang, 2002; Tan & Jamal, 2006), raise stock prices (Barth, Elliott, & Finn, 1999), and beat analysts’ expectations (Fields & Keys, 2003). They also added that earnings quality represents an important and expensive aspect of managerial behavior that should be controlled by investors, and it’s an ethical issue (Dempster & Oliver, 2019).
In other words, one can say that earnings quality is a good factor that investors can use to predict future earnings, and then take their investment decisions. Investors consider earnings quality as one of the most important and reliable elements in the decision-making process and in preparing financial forecasts about the returns (Mitra, 2016). According to Abdelghany (2005), the company that manages earnings sends a message to its financial information users that bending the truth is an acceptable price, and this is contributing to creating an ethical environment in which suspicious activities may occur. Thereby, the relationship between earnings quality and the market value of the share price claims involves important aspects of business ethics, accounting standard setting, and economic theory (Dempster & Oliver, 2019; Li, 2014).
The current study develops an econometric model of the relationship between earnings quality and market value of the share price to explore the level of market controlling of earnings quality, as empirical evidence from Jordanian market. Then, this study uses the liquidity factor as a mediator in the relationship between earnings quality and market value of the share price. This is because the liquidity is a variable which is affected by a range of factors, the most important of which is the earnings quality and earnings management (Hsu & Yu, 2015). Chae (2005) indicated that there is a negative relationship between liquidity and information asymmetry before earnings announcements, at the same time there is a positive relationship after the earnings announcement. Besides, numerous studies explore the effect of liquidity on the required return of the stock, such as Pastor and Stambaugh (2003), Deng and Ong (2014), and Hsu and Yu (2015).
Moreover, the contribution of this study is twofold. The first contribution lies in the fact that it increases the body of the knowledge about the relationship between earnings quality and market value of the share price in an emerging market (Jordanian market). In addition to, the role of the liquidity as a mediator factor in the relationship between earnings quality and market value of the share price. The second contribution of this study is that it identifies the level of market controlling of earnings quality and then provides some evidence about it, especially from an emerging market (Jordanian market). This means that the perceptions of earnings management will reduce market equity value.
ISSN: 2247-6172; ISSN-L: 2247-6172
Review of Applied Socio- Economic Research ( Volume 19 Issue 1/2020 ), pp. 17-32
URL: http://www.reaser.eu e-mail: [email protected]
19
2. Literature Review and Hypothesis Design The researchers disagree about earnings quality concept. Hamdan, Mushtaha, and Al-Sartawi (2013)
indicated that earnings quality means persistence of cash flow in more than persistent in accruals, as the lower non-ordinary accruals percentage in accounting profit refers to more earnings quality. Conversely, Ball, and Shivakumar (2005) see that earnings quality is providing accurate information about the operating and future performance for companies by focusing on information quality like relevance and credibility that gives the ability to forecast and determine company fair valuation. Kamarudin and Ismail (2014) indicated that earnings quality is the earnings ability to provide investors and creditors with information about cash flow sources in harmony with general accounting principles. They also noted that there is a positive relationship between earnings and cash flows, as the more positive in this relationship indicates better earnings quality.
On the other hand, Persakisa and Iatridis (2018) indicated that earnings quality is the earnings that genuinely and credibly represent real earnings. The earnings must exist and must not be fraudulent. Thereby, earnings quality will be high if it is accountable and conservative, as well as there’s no window dressing and earnings management (Hamdan, Mushtaha, & Al-Sartawi, 2013).
Besides, several existing studies of earnings quality and the market value of share indicate that earnings quality and the market value of share are important issues, especially with environmental uncertainty that affects companies’ performance (Dechow, 1994; Ball & Shivakumar, 2005; Burgstahler, Hail, & Leuz, 2006; Davis-Friday, Eng, & Liu, 2006; Dechow, Ge, & Schrand, 2010; Dichev, Graham, Harvey, & Rajgopal, 2013; Martowidjojo, Valentincic, & Warganegara, 2019). Martowidjojo, Valentincic, and Warganegara (2019) noted that there is a negative relationship between earnings quality and the market values of equity of companies listed on the Jakarta Stock Exchange during the years 1995-2015. This means that high earnings quality will improve the market values of shares. Machdar, Manurung, and Murwaningsari (2017) noted that there are relationships between earnings quality, accounting reservations, and real earnings management. The high accounting reservation will improve the relevance value of accounting information, and then it will increase the earnings quality. Furthermore, earnings quality positively affects the operating performance of the company, and thus there is a negative relationship between real earnings management and the company’s performance.
Aguguom and Salawu (2018) discussed the relationship between earnings quality and companies’ book value evidence from 51 Nigerian companies listed in the Nigerian Stock Exchange for the period (2000-2016). They noted that companies’ book value is significantly affected by earnings quality, where ensure information disclosure enhances earnings quality and credibility of reported book value, and this is also supported by Aguguom, Dada, and Nwaobia (2019). Besides, Chan-K., Chan-L., Jegadeesh, and Lakonishok (2006) noted that earnings quality significantly affects stock returns, where there is a negative relationship between earnings quality and earnings management, and low-earnings management will increase stock returns.
Ma (2017) documented that higher earnings quality and related public companies reduce a company's systematic market risk, and then the company’s stock price increases. This result is supported by the theoretical framework of Lambert, Leuz, and Verrecchia (2007). Machdar, Manurung, and Murwaningsari (2017) noted the company’s performance positively affected by earnings quality, and it’s negatively affected by real earnings management. Challen and Siregar (2012) also noted that real earnings management has a negative effect on company’s value. In other words, real earnings management means low-earnings quality, and the company’s value decreases. Besides, Fatemi, Glaum, and Kaiser (2018) concluded that good
ISSN: 2247-6172; ISSN-L: 2247-6172
Review of Applied Socio- Economic Research ( Volume 19 Issue 1/2020 ), pp. 17-32
URL: http://www.reaser.eu e-mail: [email protected]
20
performance strengths increase company’s value and that weaknesses decrease it (Sardo & Serrasqueiro, 2017).
Moreover, Latif, Bhatti, and Raheman (2017) concluded that earnings quality contributes positively to maximizing the value of 214 non-financial companies listed in Pakistan for the period 2003-2014. Gao (2018) added that earnings quality significantly affects information related to shares prices, and this result is related to the findings of Hutagaol, Valentincic, and Warganegara (2019). Additionally, Wijesinghea and Kehelwalatennab (2017) indicated that there’s no statistically significant effect of earnings quality on manufacturing companies’ shares returns. Antonio, Laela, and Darmawan (2019) indicated the earnings quality rule as a mediator factor in the relationship between corporate governance and market response for Islamic and un-Islamic shares listed in the Indonesian financial market. Earnings quality drop leads to increasing market response for shares which affects shares market prices.
Al Deeb (2018) documented that there is an impact of earnings quality as a mediator factor in the relationship between returns variability, earnings management, and corporate governance, with shares performance in the Egyptian financial market. Lee (2019) indicated that there is an impact of non-operating earnings quality on market returns in Taiwan's biotechnology companies.
Classical valuation theory presents that the market value of the shares prices equals the present value of expected future cash flows (Miller & Modigliani, 1961). Kormendi and Lipe (1987) suggested that the returns earnings association consists of earnings persistence, and it measures the extent to which current earnings are correlated to future earnings. These findings suggest that there is a relationship between returns earnings association and earnings quality. Additionally, the returns earnings association is linked to the quality of stock prices. Likewise, returns earnings association and earnings quality will work on investor protection through helping them to make the right investment decisions and predict future returns (Cahan, Emanuel, & Sun, 2009).
However, one can note that there has been relatively little work by the researchers in the relationship between earnings quality and market value of the share price, specifically in emerging markets such as Jordanian market. Furthermore, previous studies did not investigate the liquidity factor as a mediator in the relationship between earnings quality and market value of the share price, while research has been abundant into the prevalence and indications of earnings management. At the same time, there is variation in the effect of earnings quality, and it has been under-explored in the literature. Thereby, this study investigates the direct relationship between earnings quality and market value of the share price, and indirect relationship by liquidity factor as a mediator, empirical evidence from Jordanian market, as an emerging market.
In Jordan, market prices showed an irregular trend in the shares prices, specifically in the shares prices of Jordanian industrial public shareholding companies which are listed in the Amman Stock Exchange (ASE). The mean of the shares prices of Jordanian industrial public shareholding companies which are listed in ASE was JD 2.50 for the year 2012, and it was JD 2.12 for the year 2015, as well as it changed to JD 1.94 in the year 2017, although that mean of earning per share for the same companies was 10 percent for the year 2012, and 7 percent for the years 2013 and 2014. For the years 2016 and 2017, earning per share was 3 percent and 1 percent respectively (ASE).
Finally and from the above discussions, we can present the study hypotheses as follows: - First Hypothesis: High earnings quality increases the market value of the shares prices. - Second Hypothesis: High earnings quality improves liquidity. - Third Hypothesis: Liquidity affects in increase the market value of the shares prices.
ISSN: 2247-6172; ISSN-L: 2247-6172
Review of Applied Socio- Economic Research ( Volume 19 Issue 1/2020 ), pp. 17-32
URL: http://www.reaser.eu e-mail: [email protected]
21
- Fourth Hypothesis: Liquidity mediates the relationship between earnings quality and the market value of the shares prices.
3. Methodology
3.1. Population and the Study Sample The study population will be composed of 62 Jordanian industrial public shareholding companies, which
are listed in the Amman Stock Exchange (ASE) from 2012 to 2017. Official reports from government entities, such as Central Bank of Jordan recently released that the industrial sector in Jordan is an important sector, where it contributes about 25.2% of the gross domestic product (GDP), and the value of the industrial sector in Jordan was about 3.25 JD-billions, as well as it occupies about 21% of the Jordanian workforce. The industrial sector in Jordan is also a major driver in the Jordanian economy for various other economic sectors. Thus, this study focused it aims to look at this sector through investigating the relationship between earnings quality and market value of the share price, and the role of liquidity as a mediator, as a piece of empirical evidence from Jordanian industrial public shareholding companies. As well, the study sample is all Jordanian industrial public shareholding companies listed in ASE during the study period (comprehensive survey method).
3.2. Study Data and Analysis Method This study uses a panel data analysis based on financial disclosures related to the Jordanian industrial
public shareholding companies during the study period. The unit of analysis is the organization. Besides, the study uses SPSS v.20 to test the study data using many statistical tests, which are a match with the study needs.
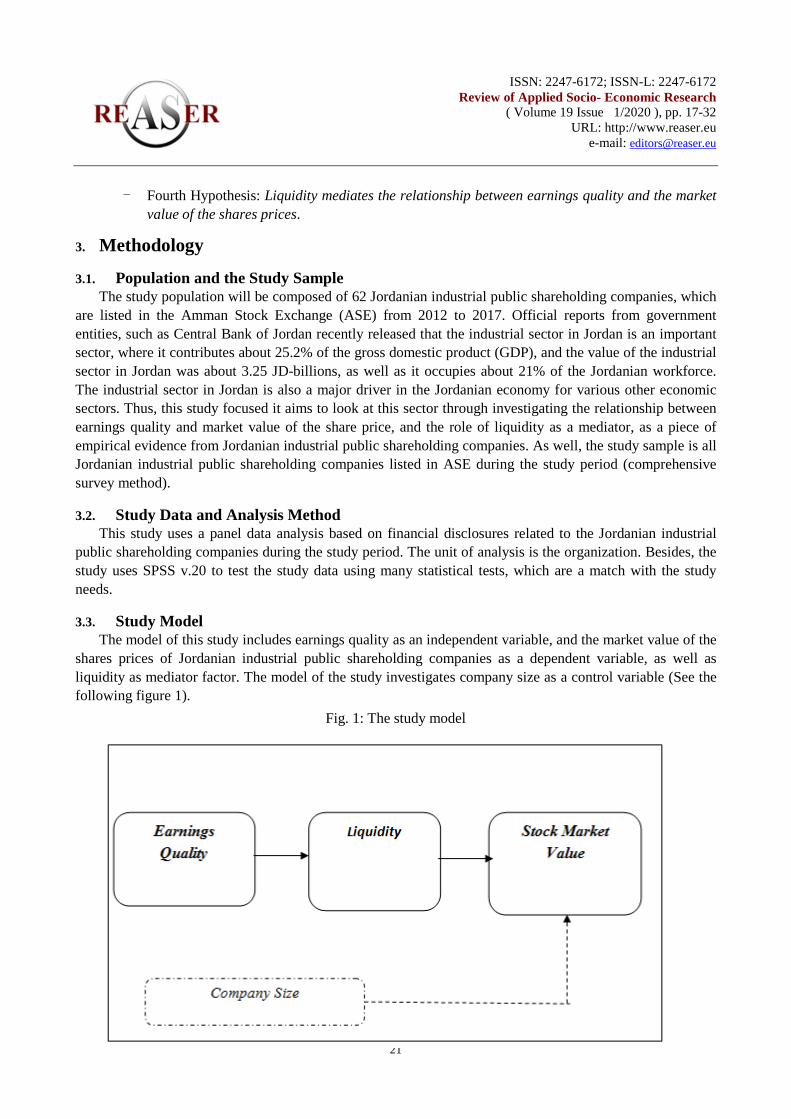
3.3. Study Model The model of this study includes earnings quality as an independent variable, and the market value of the
shares prices of Jordanian industrial public shareholding companies as a dependent variable, as well as liquidity as mediator factor. The model of the study investigates company size as a control variable (See the following figure 1).
Fig. 1: The study model
ISSN: 2247-6172; ISSN-L: 2247-6172
Review of Applied Socio- Economic Research ( Volume 19 Issue 1/2020 ), pp. 17-32
URL: http://www.reaser.eu e-mail: [email protected]
22
3.4. Measurements of the Study Variables The framework of this study includes earnings quality as an independent variable, liquidity as a mediate
variable, and the market value of the shares prices as a dependent variable. Regarding the measurement of earnings quality, the researchers disagree about earnings quality measurement which has many measurements, which is related to the diversity of financial statements users, and goals knowing to form these statements. Thereby, we can note that earnings quality measured by earnings persistence and earnings free from earnings management practices and through revenues and expenses match. In the studies of Abu Ali, Dabai, and Abu Nassar (2011) and Jafari (2016), the cash approach was used as a measure of earnings quality; where the closer the accounting profits to cash reflect higher the quality. By dividing the operating cash flow ratio of total assets by the percentage of gross assets, the closer the ratio is to the one that is true, higher the quality of earnings and this model was adopted in our study because it is concerned with measuring the predictive power of earnings quality (EQ). It is measured by the operating cash flow to total assets ratio (OCFTA), to the net income to total assets ratio (NITA), as the following equation:
𝐸𝑄 = 𝑂𝐶𝐹𝑇𝐴
𝑁𝐼𝑇𝐴………………………………………………………………………………….(1)
Liquidity (Quick liquidity ratio QLR) is expressed as a percentage and equals total current assets after
subtracting inventories (QTCA) against current liabilities (CL). As a formula: (Talebnia & Arabi, 2014) 𝑄𝐿𝑅 = 𝑂𝑇𝐶𝐴
𝐶𝐿………………………………………………………………………………….(2)
The market value of the shares prices (SP) is the share prices at the end of each year during the study
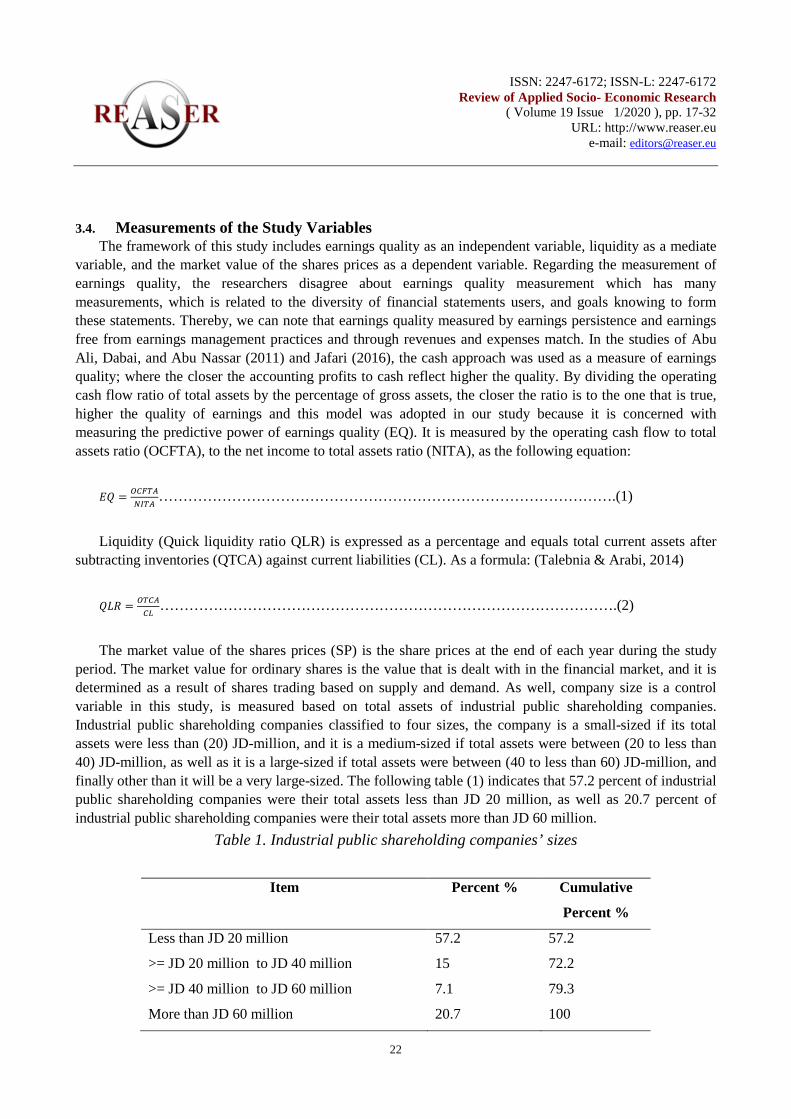
period. The market value for ordinary shares is the value that is dealt with in the financial market, and it is determined as a result of shares trading based on supply and demand. As well, company size is a control variable in this study, is measured based on total assets of industrial public shareholding companies. Industrial public shareholding companies classified to four sizes, the company is a small-sized if its total assets were less than (20) JD-million, and it is a medium-sized if total assets were between (20 to less than 40) JD-million, as well as it is a large-sized if total assets were between (40 to less than 60) JD-million, and finally other than it will be a very large-sized. The following table (1) indicates that 57.2 percent of industrial public shareholding companies were their total assets less than JD 20 million, as well as 20.7 percent of industrial public shareholding companies were their total assets more than JD 60 million.
Table 1. Industrial public shareholding companies’ sizes
Item Percent % Cumulative
Percent %
Less than JD 20 million 57.2 57.2
>= JD 20 million to JD 40 million 15 72.2
>= JD 40 million to JD 60 million 7.1 79.3
More than JD 60 million 20.7 100
ISSN: 2247-6172; ISSN-L: 2247-6172
Review of Applied Socio- Economic Research ( Volume 19 Issue 1/2020 ), pp. 17-32
URL: http://www.reaser.eu e-mail: [email protected]
23
4. Data Analysis and Findings
4.1. Diagnostic Analysis Initially, anomalies' values were removed from the study data to increase the relevancy of the statistical
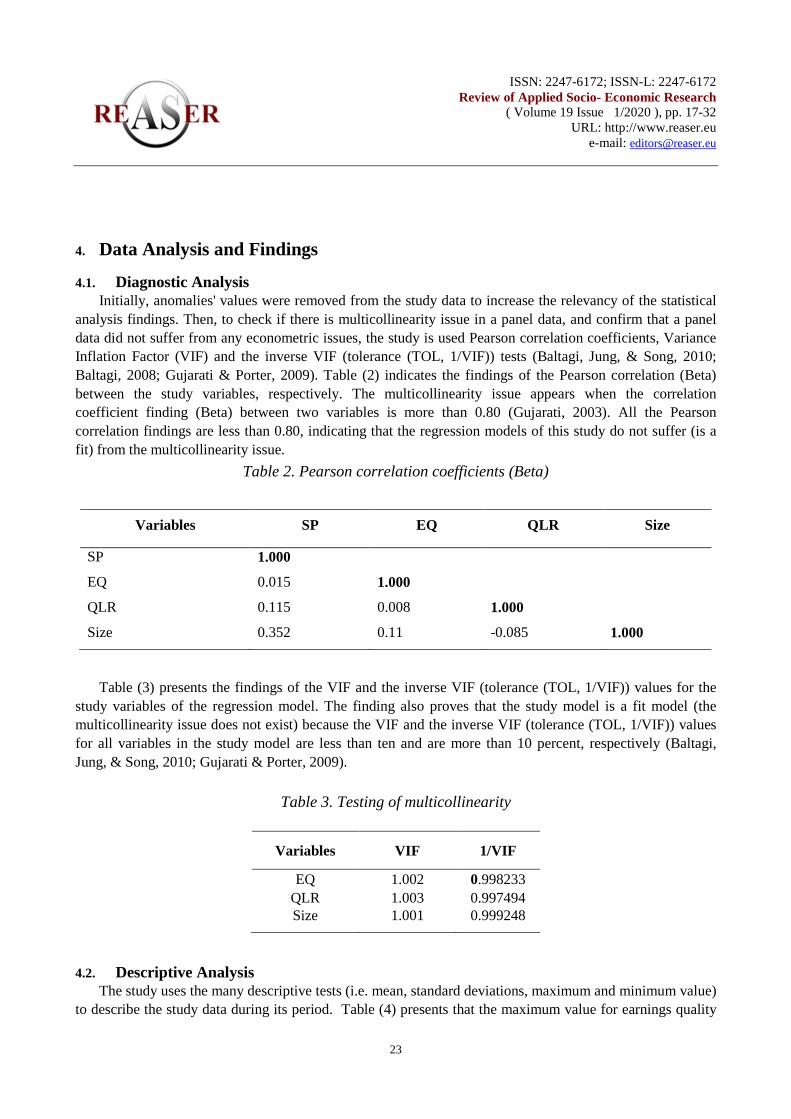
analysis findings. Then, to check if there is multicollinearity issue in a panel data, and confirm that a panel data did not suffer from any econometric issues, the study is used Pearson correlation coefficients, Variance Inflation Factor (VIF) and the inverse VIF (tolerance (TOL, 1/VIF)) tests (Baltagi, Jung, & Song, 2010; Baltagi, 2008; Gujarati & Porter, 2009). Table (2) indicates the findings of the Pearson correlation (Beta) between the study variables, respectively. The multicollinearity issue appears when the correlation coefficient finding (Beta) between two variables is more than 0.80 (Gujarati, 2003). All the Pearson correlation findings are less than 0.80, indicating that the regression models of this study do not suffer (is a fit) from the multicollinearity issue.
Table 2. Pearson correlation coefficients (Beta)
Table (3) presents the findings of the VIF and the inverse VIF (tolerance (TOL, 1/VIF)) values for the study variables of the regression model. The finding also proves that the study model is a fit model (the multicollinearity issue does not exist) because the VIF and the inverse VIF (tolerance (TOL, 1/VIF)) values for all variables in the study model are less than ten and are more than 10 percent, respectively (Baltagi, Jung, & Song, 2010; Gujarati & Porter, 2009).
Table 3. Testing of multicollinearity
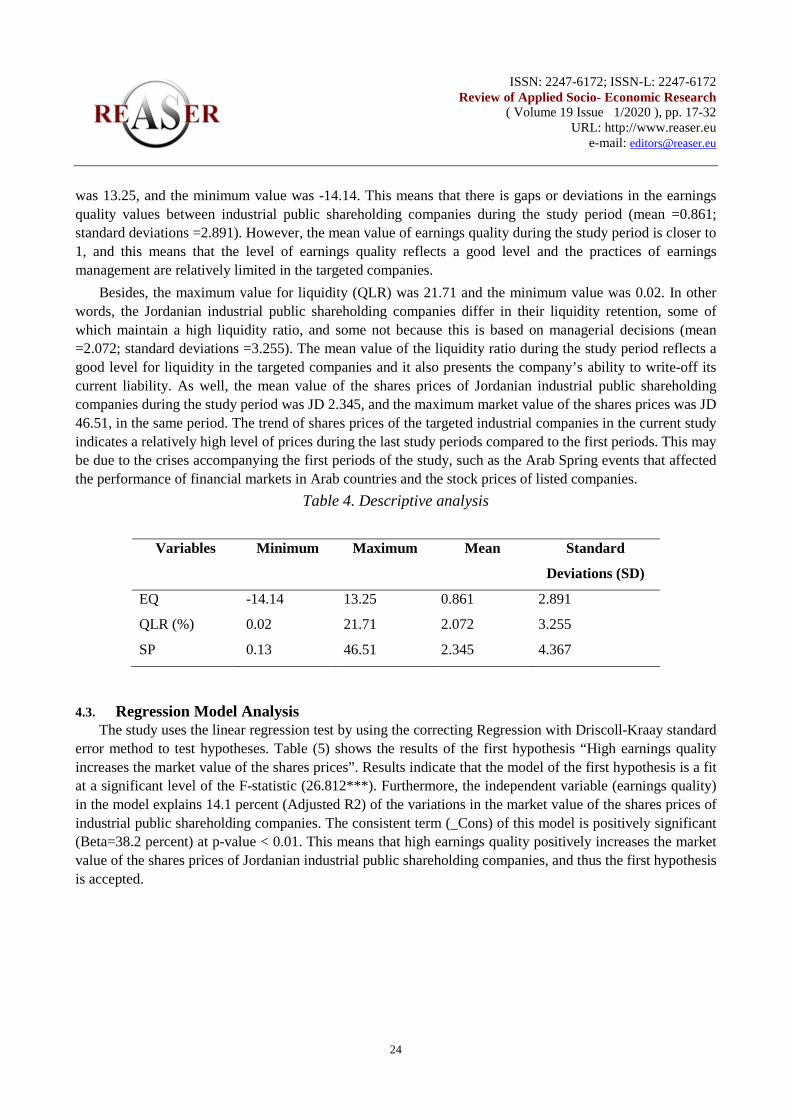
4.2. Descriptive Analysis The study uses the many descriptive tests (i.e. mean, standard deviations, maximum and minimum value)
to describe the study data during its period. Table (4) presents that the maximum value for earnings quality
Variables SP EQ QLR Size
SP 1.000
EQ 0.015 1.000
QLR 0.115 0.008 1.000
Size 0.352 0.11 -0.085 1.000
Variables VIF 1/VIF
EQ 1.002 0.998233 QLR 1.003 0.997494 Size 1.001 0.999248
ISSN: 2247-6172; ISSN-L: 2247-6172
Review of Applied Socio- Economic Research ( Volume 19 Issue 1/2020 ), pp. 17-32
URL: http://www.reaser.eu e-mail: [email protected]
24
was 13.25, and the minimum value was -14.14. This means that there is gaps or deviations in the earnings quality values between industrial public shareholding companies during the study period (mean =0.861; standard deviations =2.891). However, the mean value of earnings quality during the study period is closer to 1, and this means that the level of earnings quality reflects a good level and the practices of earnings management are relatively limited in the targeted companies.
Besides, the maximum value for liquidity (QLR) was 21.71 and the minimum value was 0.02. In other words, the Jordanian industrial public shareholding companies differ in their liquidity retention, some of which maintain a high liquidity ratio, and some not because this is based on managerial decisions (mean =2.072; standard deviations =3.255). The mean value of the liquidity ratio during the study period reflects a good level for liquidity in the targeted companies and it also presents the company’s ability to write-off its current liability. As well, the mean value of the shares prices of Jordanian industrial public shareholding companies during the study period was JD 2.345, and the maximum market value of the shares prices was JD 46.51, in the same period. The trend of shares prices of the targeted industrial companies in the current study indicates a relatively high level of prices during the last study periods compared to the first periods. This may be due to the crises accompanying the first periods of the study, such as the Arab Spring events that affected the performance of financial markets in Arab countries and the stock prices of listed companies.
Table 4. Descriptive analysis
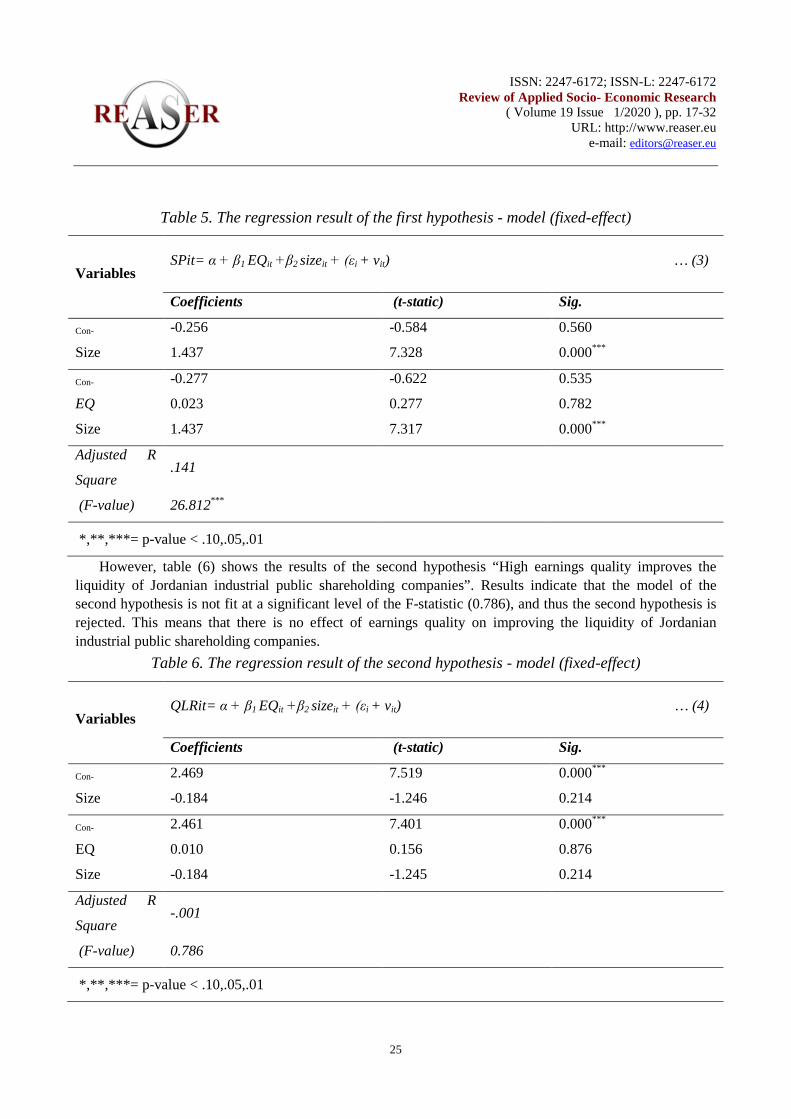
4.3. Regression Model Analysis The study uses the linear regression test by using the correcting Regression with Driscoll-Kraay standard
error method to test hypotheses. Table (5) shows the results of the first hypothesis “High earnings quality increases the market value of the shares prices”. Results indicate that the model of the first hypothesis is a fit at a significant level of the F-statistic (26.812***). Furthermore, the independent variable (earnings quality) in the model explains 14.1 percent (Adjusted R2) of the variations in the market value of the shares prices of industrial public shareholding companies. The consistent term (_Cons) of this model is positively significant (Beta=38.2 percent) at p-value < 0.01. This means that high earnings quality positively increases the market value of the shares prices of Jordanian industrial public shareholding companies, and thus the first hypothesis is accepted.
Variables Minimum Maximum Mean Standard
Deviations (SD)
EQ -14.14 13.25 0.861 2.891
QLR (%) 0.02 21.71 2.072 3.255
SP 0.13 46.51 2.345 4.367
ISSN: 2247-6172; ISSN-L: 2247-6172
Review of Applied Socio- Economic Research ( Volume 19 Issue 1/2020 ), pp. 17-32
URL: http://www.reaser.eu e-mail: [email protected]
25
Table 5. The regression result of the first hypothesis - model (fixed-effect)
Variables SPit= α + β1 EQit +β2 sizeit + (εi + vit) … (3)
Coefficients (t-static) Sig.
Con- -0.256 -0.584 0.560
Size 1.437 7.328 0.000***
Con- -0.277 -0.622 0.535
EQ 0.023 0.277 0.782
Size 1.437 7.317 0.000***
Adjusted R
Square .141
(F-value) 26.812***
*,**,***= p-value < .10,.05,.01
However, table (6) shows the results of the second hypothesis “High earnings quality improves the liquidity of Jordanian industrial public shareholding companies”. Results indicate that the model of the second hypothesis is not fit at a significant level of the F-statistic (0.786), and thus the second hypothesis is rejected. This means that there is no effect of earnings quality on improving the liquidity of Jordanian industrial public shareholding companies.
Table 6. The regression result of the second hypothesis - model (fixed-effect)
Variables QLRit= α + β1 EQit +β2 sizeit + (εi + vit) … (4)
Coefficients (t-static) Sig.
Con- 2.469 7.519 0.000***
Size -0.184 -1.246 0.214
Con- 2.461 7.401 0.000***
EQ 0.010 0.156 0.876
Size -0.184 -1.245 0.214
Adjusted R
Square -.001
(F-value) 0.786
*,**,***= p-value < .10,.05,.01
ISSN: 2247-6172; ISSN-L: 2247-6172
Review of Applied Socio- Economic Research ( Volume 19 Issue 1/2020 ), pp. 17-32
URL: http://www.reaser.eu e-mail: [email protected]
26
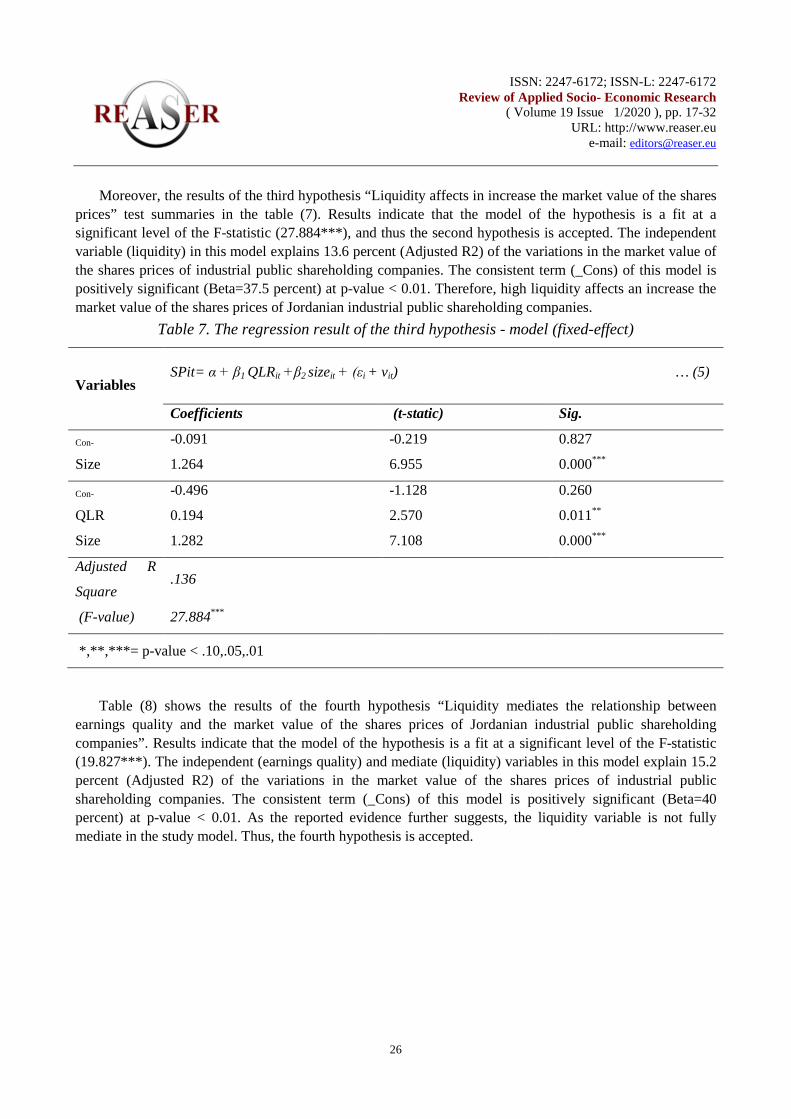
Moreover, the results of the third hypothesis “Liquidity affects in increase the market value of the shares prices” test summaries in the table (7). Results indicate that the model of the hypothesis is a fit at a significant level of the F-statistic (27.884***), and thus the second hypothesis is accepted. The independent variable (liquidity) in this model explains 13.6 percent (Adjusted R2) of the variations in the market value of the shares prices of industrial public shareholding companies. The consistent term (_Cons) of this model is positively significant (Beta=37.5 percent) at p-value < 0.01. Therefore, high liquidity affects an increase the market value of the shares prices of Jordanian industrial public shareholding companies.
Table 7. The regression result of the third hypothesis - model (fixed-effect)
Variables SPit= α + β1 QLRit +β2 sizeit + (εi + vit) … (5)
Coefficients (t-static) Sig.
Con- -0.091 -0.219 0.827
Size 1.264 6.955 0.000***
Con- -0.496 -1.128 0.260
QLR 0.194 2.570 0.011**
Size 1.282 7.108 0.000***
Adjusted R
Square .136
(F-value) 27.884***
*,**,***= p-value < .10,.05,.01
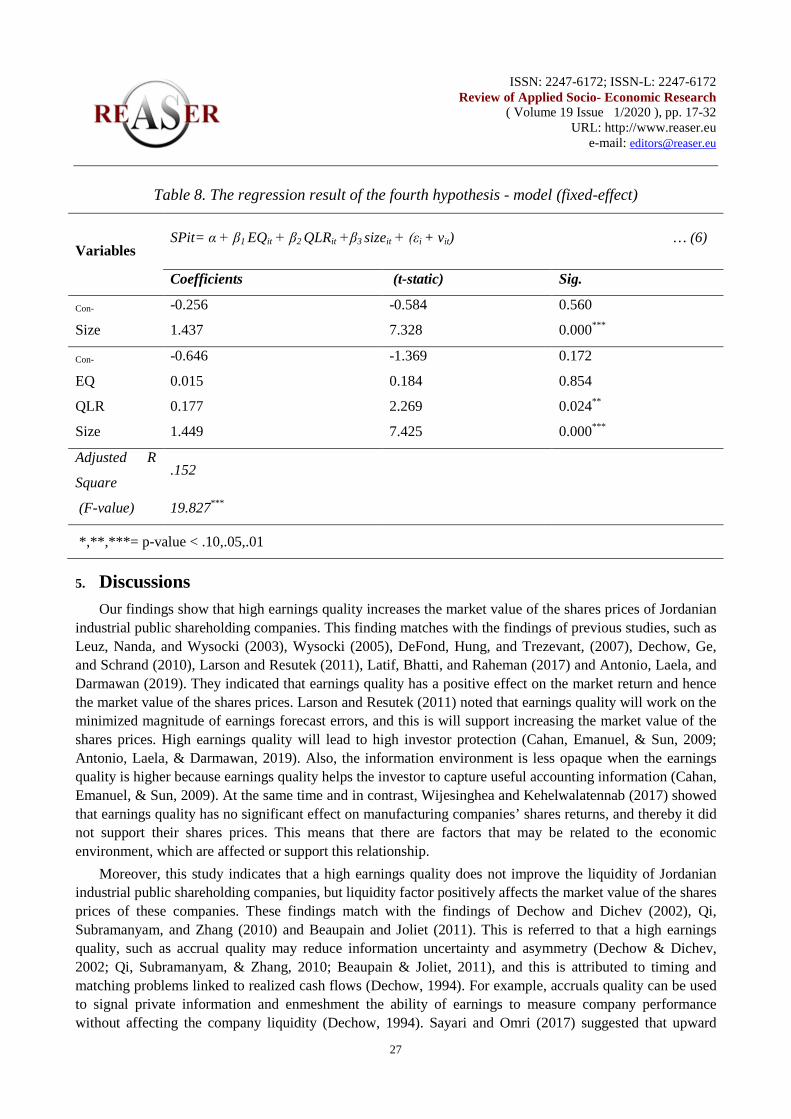
Table (8) shows the results of the fourth hypothesis “Liquidity mediates the relationship between earnings quality and the market value of the shares prices of Jordanian industrial public shareholding companies”. Results indicate that the model of the hypothesis is a fit at a significant level of the F-statistic (19.827***). The independent (earnings quality) and mediate (liquidity) variables in this model explain 15.2 percent (Adjusted R2) of the variations in the market value of the shares prices of industrial public shareholding companies. The consistent term (_Cons) of this model is positively significant (Beta=40 percent) at p-value < 0.01. As the reported evidence further suggests, the liquidity variable is not fully mediate in the study model. Thus, the fourth hypothesis is accepted.
ISSN: 2247-6172; ISSN-L: 2247-6172
Review of Applied Socio- Economic Research ( Volume 19 Issue 1/2020 ), pp. 17-32
URL: http://www.reaser.eu e-mail: [email protected]
27
Table 8. The regression result of the fourth hypothesis - model (fixed-effect)
Variables SPit= α + β1 EQit + β2 QLRit +β3 sizeit + (εi + vit) … (6)
Coefficients (t-static) Sig.
Con- -0.256 -0.584 0.560
Size 1.437 7.328 0.000***
Con- -0.646 -1.369 0.172
EQ 0.015 0.184 0.854
QLR 0.177 2.269 0.024**
Size 1.449 7.425 0.000***
Adjusted R
Square .152
(F-value) 19.827***
*,**,***= p-value < .10,.05,.01
5. Discussions Our findings show that high earnings quality increases the market value of the shares prices of Jordanian
industrial public shareholding companies. This finding matches with the findings of previous studies, such as Leuz, Nanda, and Wysocki (2003), Wysocki (2005), DeFond, Hung, and Trezevant, (2007), Dechow, Ge, and Schrand (2010), Larson and Resutek (2011), Latif, Bhatti, and Raheman (2017) and Antonio, Laela, and Darmawan (2019). They indicated that earnings quality has a positive effect on the market return and hence the market value of the shares prices. Larson and Resutek (2011) noted that earnings quality will work on the minimized magnitude of earnings forecast errors, and this is will support increasing the market value of the shares prices. High earnings quality will lead to high investor protection (Cahan, Emanuel, & Sun, 2009; Antonio, Laela, & Darmawan, 2019). Also, the information environment is less opaque when the earnings quality is higher because earnings quality helps the investor to capture useful accounting information (Cahan, Emanuel, & Sun, 2009). At the same time and in contrast, Wijesinghea and Kehelwalatennab (2017) showed that earnings quality has no significant effect on manufacturing companies’ shares returns, and thereby it did not support their shares prices. This means that there are factors that may be related to the economic environment, which are affected or support this relationship.
Moreover, this study indicates that a high earnings quality does not improve the liquidity of Jordanian industrial public shareholding companies, but liquidity factor positively affects the market value of the shares prices of these companies. These findings match with the findings of Dechow and Dichev (2002), Qi, Subramanyam, and Zhang (2010) and Beaupain and Joliet (2011). This is referred to that a high earnings quality, such as accrual quality may reduce information uncertainty and asymmetry (Dechow & Dichev, 2002; Qi, Subramanyam, & Zhang, 2010; Beaupain & Joliet, 2011), and this is attributed to timing and matching problems linked to realized cash flows (Dechow, 1994). For example, accruals quality can be used to signal private information and enmeshment the ability of earnings to measure company performance without affecting the company liquidity (Dechow, 1994). Sayari and Omri (2017) suggested that upward
ISSN: 2247-6172; ISSN-L: 2247-6172
Review of Applied Socio- Economic Research ( Volume 19 Issue 1/2020 ), pp. 17-32
URL: http://www.reaser.eu e-mail: [email protected]
28
earnings management and earnings quality will result in higher liquidity costs because aggressive earnings management reflects low accounting information quality. Besides, on the one hand, managers in public shareholding companies may be able to opportunistically manipulate income, with earnings becoming a less reliable measure of firm performance, and this matches with the findings of Dechow (1994).
At the same time, good liquidity will enhance investor confidence in the company's ability to meet its future obligations and emergency conditions, and thereby increase the market value of the shares prices, and this is supported by the study of Asle, Valahzaghard, and Ahranjani (2013) and Talebnia and Arabi (2014). As well as and from this study, the liquidity factor mediates the relationship between earnings quality and the market value of the shares prices of targeted companies. This means that a high earnings quality with good liquidity will improve the market value of the shares prices because earnings quality and liquidity are important factors that motivate investors to purchase stocks or reduce their ownership (Sayari & Omri, 2017).
6. Conclusions In conclusion, the market value of the shares prices of Jordanian industrial public shareholding
companies affected by earnings quality. This means that high earnings quality positively affects the market value of the shares prices. With the role of liquidity as a mediator factor in the study framework, liquidity and earnings quality positively affect the market value of the shares prices, but it is not a full mediator. This is because there is no relationship between earnings quality and liquidity in this study, while there is a positive relationship between earnings quality and liquidity.
Finally, we can note from the previous findings of this study that, the level of Jordanian market (related to Jordanian industrial public shareholding companies) controlling earnings quality and liquidity is good. This is because earnings quality with liquidity factor explains 15.2 percent of the market value of the shares prices in this study. Then, the study recommended continuing to investigate the relationship between organizational factors, earnings management, and earnings quality, which are maybe a positive effect on the market value of the shares prices.
7. References [1] Abdelghany, K. (2005). Measuring the Quality of Earnings. Managerial Auditing Journal, 20, 1001-1015.
https://doi.org/10.1108/02686900510625334
[2] Abu Ali, S., Al-Dibai, M., & Abu Nassar, M. (2011). The Impact of Accounting Profit Quality on Borrowing Costs in accordance with International Financial Reporting Standards: An Empirical Study on Industrial and Service Public Shareholding Companies Listed in Amman Stock Exchange. Jordan Journal of Business Administration, 7 (3), 67-94.
[3] Aguguom, A. & Salawu, R. (2018). Earnings quality and firms book value: An empirical evidence from the listed firms in Nigeria. Journal of Internet Banking and Commerce, 23, 1-23.
[4] Aguguom, A., Dada, S., & Nwaobia, A. (2019). Earnings Persistence and Firm Performance: Implications of Analysts’ Accurate Forecast Ability from the Emerging Market of Nigeria. Int J Account Res, 7 (1), 197-214.
[5] Al Deeb, M. S. (2018). The Impact of Earnings Quality on the Stock Performance in the Stock Exchange Market: Evidence from Egypt. Journal of commercial and environmental studies, Faculty of Commerce, 2, 1-34.
[6] Antonio, M., Laela, S., & Darmawan, R. (2019). Corporate Governance, Earnings Quality and Market Response: Comparison of Islamic and Non-Islamic Stock in the Indonesian Capital Market. Academy of Accounting and Financial Studies Journal, 23 (1), 1-22.
ISSN: 2247-6172; ISSN-L: 2247-6172
Review of Applied Socio- Economic Research ( Volume 19 Issue 1/2020 ), pp. 17-32
URL: http://www.reaser.eu e-mail: [email protected]
29
[7] Asle, H., Valahzaghard, M., & Ahranjani, B. (2013). A survey on the relationship between stock liquidity with firm performance: A case study of Tehran Stock Exchange. Management Science Letters, (3), 635-640.
[8] Ball, R. & Shivakumar, L. (2005). Earnings Quality in UK Private Firms: Comparative Loss Recognition Timeliness. Journal of Accounting and Economics, 39 (1), 83–128. https://doi.org/10.1016/j.jacceco.2004.04.001.
[9] Baltagi, B. H. (2008). Econometric analysis of panel data, 4th edition. John Wiley & Sons, Ltd.
[10] Baltagi, B. H., Jung, B. C., & Song, S. H. (2010). Testing for heteroskedasticity and serial correlation in a random effects panel data model. Journal of Econometrics, 154(2), 122-124. https://doi.org/10.1016/j.jeconom.2009.04.009
[11] Barth, M., Elliott, J., & Finn, M. (1999). Market Rewards Associated with Patterns of Increasing Earnings. Journal of Accounting Research, 37, 387-413. https://doi.org/10.2307/2491414
[12] Beaupain, R. & Joliet, R. (2011). Corporate drivers of market liquidity on the Warsaw stock exchange. Dans Economies International, 1 (125), 83 – 104.
[13] Bellovary, J.L., Giacomino, D.E. & Akers, M.D. (2005). Earnings Quality: It’s Time to Measure and Report. The CPA Journal, 75, 32-37.
[14] Beyer, A., Guttman, I., & Marinovic, I. (2019). Earnings Management and Earnings Quality: Theory and Evidence. The Accounting Review, 94 (4), 77-101.
[15] Burgstahler, D.C., Hail, L., & Leuz, C. (2006). The Importance of Reporting Incentives: Earnings Management in European Private and Public Firms. The Accounting Review, 81(5), 983–1016. https://doi.org/10.2308/accr.2006.81.5.983.
[16] Cahan, S., D., Emanuel, D., & Sun, J. (2009). The effect of earnings quality and country-level institutions on the value relevance of earnings. Review of Quantitative Finance and Accounting, 33 (4), 371-391.
[17] Chae, J. (2005). Trading volume, information asymmetry, and timing information. The Journal of Finance, 60(1), 413-442. http://dx.doi.org/10.1111/j.1540-6261.2005.00734.x
[18] Challen, A. & Siregar, S. (2012). Audit quality on earnings management and firm value. Finance and Banking Journal, 14 (1), 30-43.
[19] Chan, L., Chen-K., Chen-T., & Yu, Y. (2015). Substitution between Real and Accruals-Based Earnings Management after Voluntary Adoption of Compensation Clawback Provisions. The Accounting Review, 90, 147-174. https://doi.org/10.2308/accr-50862
[20] Chan-K., Chan-L., K. C., Jegadeesh, N., & Lakonishok, J. (2006). Earnings Quality and Stock Returns. The Journal of Business, 79 (3), 1041-1082.
[21] Cheng, M. M., Dinh, T., Schultze , W., & Assel, M.. (2019). The Effect of Bonus Deferral on Managers' Investment Decisions. Behavioral Research in Accounting, 31 (2), 31-49.
[22] Das, S., Shroff, P.K., & Zhang, H. (2009). Quarterly Earnings Patterns and Earnings Management. Contemporary Accounting Research, 26, 797-831. https://doi.org/10.1506/car.26.3.7
[23] Davis-Friday, P., Eng, L.L., & Liu, C. (2006). The Effects of the Asian Crisis, Corporate Governance and Accounting System on the Valuation of Book Value and Earnings. The International Journal of Accounting, 41, 22–40.
[24] Dechow, P. & Dichev, I. (2002). The quality of accruals and earnings: The role of accrual estimation errors. The Accounting Review, 77(4), 35–59.
[25] Dechow, P.M. (1994). Accounting Earnings and Cash Flows as Measures of Firm Performance: The Role of Accounting Accruals. Journal of Accounting and Economics, 18 (1), 3–42. https://doi.org/10.1016/0165-
ISSN: 2247-6172; ISSN-L: 2247-6172
Review of Applied Socio- Economic Research ( Volume 19 Issue 1/2020 ), pp. 17-32
URL: http://www.reaser.eu e-mail: [email protected]
30
4101(94)90016-7.
[26] Dechow, P.M., Ge, W., & Schrand, C. (2010). Understanding earnings quality: A review of the proxies, their determinants and their consequences. Journal of Accounting and Economics, 50 (2-3), 344-401.
[27] Dechow, P.M., Ge, W., & Schrand, C. (2010). Understanding Earnings Quality: A Review of the Proxies, Their Determinants and Their Consequences. Journal of Accounting and Economics, 50 (2–3), 344–401. http://doi.org/10.1016/j.jacceco.2010.09.001.
[28] DeFond, M., Hung, M., & Trezevant, R. (2007). Investor protection and the information content of annual earnings announcements: International evidence. Journal of Accounting and Economics, 43(1), 37-67.
[29] Dempster, G. & Oliver, N. (2019). Financial Market Pricing of Earnings Quality: Evidence from a Multi-Factor Return Model. Open Journal of Business and Management, 7, 312-329. doi: 10.4236/ojbm.2019.71021.
[30] Deng, X. & Ong, S. E. (2014). Real earnings management, liquidity and reits SEO dynamics. AREUEA-ASSA annual meeting, Philadelphia, PA, 3-5 January
[31] Dichev, I.D., Graham, J.R., Harvey, C.R., & Rajgopal, S. (2013). Earnings Quality: Evidence from the Field. Journal of Accounting and Economics, 56 (2–3), 1–33.
[32] Easley, D. & O’Hara, M. (2004). Information and the Cost of Capital. Journal of Finance, 59, 1553-1583. https://doi.org/10.1111/j.1540-6261.2004.00672.x
[33] Ecker, F., Francis, J., Kim, I., Olsson, P., & Schipper, K. (2006). A Returns-Based Representation of Earnings Quality. The Accounting Review, 81, 749-780. https://doi.org/10.2308/accr.2006.81.4.749
[34] Fatemi, A., Glaum, M., & Kaiser, M. (2018). ESG performance and firm value: The moderating role of disclosure. Global Finance Journal, 38, 45-64.
[35] Fields, M. & Keys, P. (2003). The Emergence of Corporate Governance from Wall St. to Main St.: Outside Directors, Board Diversity, Earnings Management, and Managerial Incentives to Bear Risk. The Financial Review, 38, 1-24. https://doi.org/10.1111/1540-6288.00032
[36] Francis, J., LaFond, R., Olsson, P. & Schipper, K. (2002). The market pricing of earnings quality. Working paper, Duke University, University of Wisconsin and the FASB.
[37] Francis, J., LaFond, R., Olsson, P., & Schipper, K. (2004). Cost of Capital and Earnings Attributes. The Accounting Review, 79, 967-1010.
[38] Gao, Y. (2018). Board Gender Diversity, Earnings Quality and Stock Price Informativeness. American Journal of Industrial and Business Management, 8, 306-312.
[39] Gujarati, D. N. & Porter, D. C. (2009). Basic Econometrics, 5th edition, New York McGraw-Hill.
[40] Gujarati, D. N. (2003). Basic Econometrics. New York: McGrawhill Companies
[41] Hamdan, A., Mushtaha, S., & Al-Sartawi, A. (2013). The Audit Committee Characteristics and Earnings Quality: Evidence from Jordan. Journal of Accounting Business and Finance, 7 (4), 51-80. doi:10.14453/aabfj.v7i4.5
[42] Healy, P.M. & Whalen, J.M. (1999). A Review of the Earnings Management Literature and Its Implications for Standard Setting. Accounting Horizons, 13, 365-383. https://doi.org/10.2308/acch.1999.13.4.365
[43] Hsu, M. & Yu, J. (2015). The Influence of Earnings Quality and Liquidity on the Cost of Equity. International Business Research, 8 (4), 194-209.
[44] Hutagaol, Y., Valentincic, A., & Warganegara, D. (2019). Earnings Quality and Market Values of Indonesian Listed Firms. Australian Accounting Review, 88 (29), 95-111.
[45] Jafari, H. (2016). Financial reporting quality, Debt maturity investment Efficiency. Bulletin de la Société des Sciences de Liège, 85, 1283-1296.
ISSN: 2247-6172; ISSN-L: 2247-6172
Review of Applied Socio- Economic Research ( Volume 19 Issue 1/2020 ), pp. 17-32
URL: http://www.reaser.eu e-mail: [email protected]
31
[46] Kamarudin, K. & Ismail, W. (2014). The risk of earnings quality impairment. Procedia - Social and Behavioral Sciences, 145, 226 – 236.
[47] Kormendi R. & Lipe, R. (1987). Earnings innovations, earnings persistence, and stock returns. Journal of Business, 60 (3), 323-345
[48] Lambert, R., Leuz, C., & Verrecchia, R. (2007). Accounting information, disclosure, and the cost of equity. Journal of Accounting Research, 45 (2), 385–420. doi:10.1111/j.1475-679X.2007.00238.
[49] Larson, C. & Resutek, R. (2011). How does earnings quality affect the equity market? An alternative measure and a new perspective. Paper presented in Accounting Seminars, Columbia.
[50] Latif, K., Bhatti, A., & Raheman, A. (2017). Earnings Quality: A Missing Link between Corporate Governance and Firm Value. Business & Economic Review, 9 (2), 255-280.
[51] Lee, J. (2019). Regional heterogeneity among non-operating earnings quality, stock returns, and firm value in biotech industry. Agricultural Economics – Czech, 65 (1), 10–20.
[52] Leuz, C., Nanda, D., & Wysocki, P. (2003). Earnings management and institutional factors: an international comparison. Journal of Financial Economics, 69(3), 505-527
[53] Li, H. (2014). Top executives’ ability and earnings quality: Evidence from the Chinese capital markets. International Journal of Financial Research, 5(4), 79-86.
[54] Ma, M.S. (2017). Economic Links and the Spillover Effect of Earnings Quality on Market Risk. The Accounting Review, 92 (6), 213-245.
[55] Machdar, N. D., Manurung, A., & Murwaningsari, E. (2017). The Effects of Earnings Quality, Conservatism, and Real Earnings Management on the Company’s Performance and Information Asymmetry as a Moderating Variable. International Journal of Economics and Financial Issues, 7 (2), 309-318.
[56] Miller, M. & Modigliani, F. (1961). Dividend policy, growth and valuation of shares. Journal of Business, 34(4), 411-433
[57] Mitra, R. (2016). The Association between Earnings Quality and Firm-Specific Return Volatility: Evidence from Japan. Review of Accounting and Finance, 15, 294-316. https://doi.org/10.1108/RAF-08-2015-0100
[58] Pastor, L. & Stambaugh, R. F. (2003). Liquidity risk and expected stock returns. Journal of Political Economy, 111, 642-685. http://dx.doi.org/10.1086/374184
[59] Perotti, P. & Wagenhofer, A. (2014). Earnings Quality Measures and Excess Returns. Journal of Business Finance and Accounting, 41, 545-571. https://doi.org/10.1111/jbfa.12071
[60] Persakisa, A. & Iatridis, G. (2015). Cost of capital, audit and earnings quality under financial crisis: A global empirical investigation. Journal of International Financial Markets, Institutions and Money, 38, 3-24.
[61] Qi, C., Subramanyam, K., & Zhang, J. (2010). Accrual quality, bond liquidity, and cost of debt. Working paper, University of Southern California.
[62] Sardo, F. & Serrasqueiro, Z. (2017). A European empirical study of the relationship between firms’ intellectual capital, financial performance and market value. Journal of Intellectual Capital, 18 (4), 771-788. https://doi.org/10.1108/JIC-10-2016-0105
[63] Sayari, S. & Omri, A. (2017). Earnings Management, Accruals and Stock Liquidity. Journal of Finance and Bank Management, 5 (1), 17-28.
[64] Schipper, K. & Vincent, L. (2003). Earnings Quality. Accounting Horizons, 17, 97-110. https://doi.org/10.2308/acch.2003.17.s-1.97
[65] Talebnia, G. & Arabi, M. (2014). Study of Relationship between Liquidity Risk and Stock Returns in Tse. A
ISSN: 2247-6172; ISSN-L: 2247-6172
Review of Applied Socio- Economic Research ( Volume 19 Issue 1/2020 ), pp. 17-32
URL: http://www.reaser.eu e-mail: [email protected]
32
Journal of Economics and Management, 3 (10), 96-104.
[66] Tan, H. & Jamal, K. (2006). Effect of Accounting Discretion on Ability of Managers to Smooth Earnings. Journal of Accounting and Public Policy, 5, 554-573. https://doi.org/10.1016/j.jaccpubpol.2006.07.007
[67] Teets, W.R. (2002). Quality of Earnings: An Introduction to the Issues in Accounting Education. Issues in Accounting Education (Special Issue), 17, 355-360
[68] Thomas, J.K. & Zhang, H. (2002). Inventory Changes and Future Returns. Review of Accounting Studies, 7, 163-187. https://doi.org/10.1023/A:1020221918065
[69] Wijesinghea, M. R. P. & Kehelwalatennab, S. (2017). The Impact of Earnings Quality on the Stock Returns of Listed Manufacturing Companies in the Colombo Stock Exchange. Colombo Business Journal, 8(2), 68-89.
[70] Wysocki, P. (2005). Assessing earnings and accruals quality: U.S. and international evidence. Working paper. MIT Sloan School of Management.
_______________________________________ Manuscript received: 21.04.2020 Manuscript received in revised form: 27.05.2020 Manuscript accepted: 21.06.2020
ISSN: 2247-6172; ISSN-L: 2247-6172
Review of Applied Socio- Economic Research ( Volume 19, Issue 1/2020 ), pp. 33-46
URL: http://www.reaser.eu e-mail: [email protected]
33
Impact of Intellectual Capital on the Competitive Advantage in Jordanian Telecom Companies: "A Case Study on Orange Company"
Ahmed Hashem Al Assaf 11
1 Business school, Business Administration Department Al - Zaytouna University, Amman, Jordan
Abstract. The present study aimed to recognize the impact of intellectual capital in achieving competitive advantage in Jordanian telecommunications companies. The study sample consisted of(245) employees, who were selected by a simple random method, and it represents about(42.3%) of the overall study population. The study adopted a descriptive field survey methodology. Two instruments were developed by the researcher to measure the intellectual capital and the competitive advantage variables. The study aimed to answer the following two questions: - Does the intellectual capital with its dimensions (human capital, structural capital, overhead capital) exist in Jordanian telecom companies? - Is there an impact of intellectual capital with its dimensions (human capital, structural capital, and capital) on achieving a competitive advantage with its dimensions to the Jordanian telecom companies?. The population of the study represented all the employees of Orange Mobile Telecommunication Companies in Jordan and the sample of the study consisted of (245 )employees. After the data has been collected and analyzed the following results have been found: - There is a significant impact of intellectual capital dimensions(human capital) on competitive advantage in the Jordanian telecommunications companies, and the value of Beta indicates a positive direction of the relationship. - There is a significant impact on the intellectual capital dimensions(structural capital) on competitive advantage in Jordanian telecommunications companies. And the value of Beta indicates a positive direction of the relationship. - There is a significant impact of the intellectual capital dimensions(relational capital) on competitive advantage Jordanian telecommunications companies, and the value of Beta indicates for a positive direction of the relationship.
Keywords: Intellectual Capital, Competitive Advantage, Jordanian telecom companies, Orange Company
JEL Codes: O34, D21
The environment of business organizations faces complex challenges of intense competition and rapid change. The constant transformation of the modern business environment, as a result of the use of the Internet, electronic networks and information technology, has led to an increase in the demand for highly qualified and skilled workers with expertise and skills in the best use of information technology. Successful business organizations attract, select and develop working people to enable them to lead those organizations. Therefore, the main challenge for business organizations is ensure availability of outstanding individuals, and train them, develop their abilities and their skills.
1 Corresponding author email : [email protected]
ISSN: 2247-6172; ISSN-L: 2247-6172
Review of Applied Socio- Economic Research ( Volume 19, Issue 1/2020 ), pp. 33-46
URL: http://www.reaser.eu e-mail: [email protected]
34
And the need for knowledge of business organizations, the growing need to acquire, develop, and utilize them has become the most effective way to achieve the effectiveness of the activities and operations of these organizations. Intellectual Capital has become a competitive advantage for organizations to compete for and compete to acquire and get it. At the beginning of the twenty-first century, several studies have been launched to explore the possibility of benefiting from the success of business organizations in intellectual capital and to measure and transfer it to all sectors to achieve a competitive advantage, to improve the chances for organizations to succeed.
The present study aims at identifying the effect of intellectual capital on achieving competitive advantage and applying it to the telecommunications companies in the Hashemite Kingdom of Jordan. This is important for the national economy, which contributes to the gross national product and its results in the comprehensive development and raising the standard of living of Jordanian citizens.
1.1 The study problem and the research questions
The study aims to identify the impact of intellectual capital with its dimensions (human capital, structural capital, and relational capital) in achieving the competitive advantage of the Jordanian telecom companies.
1.2 Purpose of the Study The purpose of the study can be achieved by answering the following questions: - Does the intellectual capital with its dimensions (human capital, structural capital, overhead capital)
exist in Jordanian telecom companies? - Is there an impact of intellectual capital with its dimensions (human capital, structural capital, and
capital) on achieving a competitive advantage with its dimensions to the Jordanian telecom companies?
1.3 The importance of the study The study derives its importance from the following aspects:
The business environment is continuously changing due to intense competition, therefore organizations face complex challenges which impose HR departments new tasks, including attracting new quality of human resources characterized by knowledge and high awareness.
- The importance of the study for the community represented by the Jordanian Telecom companies resides in the vitality of this sector in the national economy, specifically in the Jordanian telecom companies.
- The study is a cornerstone point for academics to build on it mainly because it provides an analysis of the intellectual capital impact in achieving the competitive advantage of Jordanian Telecom companies in the Hashemite Kingdom of Jordan.
1.4 The Hypotheses This study attempts to test the following hypotheses: H1: “There is not any impact of intellectual capital with its dimensions (human capital, structural
capital, relational capital) on achieving the competitive advantage of Jordanian telecom companies”. It has the following sub-assumptions:
ISSN: 2247-6172; ISSN-L: 2247-6172
Review of Applied Socio- Economic Research ( Volume 19, Issue 1/2020 ), pp. 33-46
URL: http://www.reaser.eu e-mail: [email protected]
35
- H1.1 There is not any impact of intellectual capital (human capital) on achieving competitive advantage in Jordanian telecom companies.
- H1.2 There is not any impact of intellectual capital (structural capital) on achieving competitive advantage in Jordanian telecom companies.
- H1.3 There is not any impact of intellectual capital (relative capital) on achieving competitive advantage in Jordanian telecom companies.
1.5 Procedural Definitions The following variables were identified for study: Independent variable: Intellectual Capital: Sullivan (1999) argues that intellectual capital is knowledge that can be converted
into value. In the present study, it can be defined as intangible assets the outcome of the interactions between the expertise and the knowledge of all human resources in the organization which contribute to improving the efficiency of the internal operations of the company and includes three main elements as follows:
Human capital: Bontis et al. (2000) believes that human capital is the individual storage of the organization which is expressed by workers, generating intellectual capital through their skills (skills, education), their attitudes (work behaviors), and the speed of intellectual intuition that enables them from thinking creatively to solve the problems.
Structural Capital: (McElroy, 2002) refers to structural capital as all things that support human capital but remains in the company when employees leave their jobs. In the present study, it can be defined as the company's organizational capabilities, which include databases, research and development, organizational structure, regulations and procedures, which contribute to the creation of intellectual property generated from human capital, serving the organization and its internal and external interests.
Relative capital: (Bontis, 1998) defines it as all relationships established by the company with stakeholders (customers, suppliers, partners, and government). Stewart (1997) explained that the purpose of the relationship with external stakeholders is to transfer it to funds.
Dependent variable: Competitive advantage: A dynamic concept based on self-effort and creativity, and the addition of new
to superior competitors through quality, high technology and marketing to attract buyers of the product. It is a milestone recognized by the customer in the facility or in the product, which gives it an added advantage over its competitors.
1.6 The limits of the study For each practical study or theory of spatial boundaries, temporal limits as well as human boundaries,
spatial boundaries are represented in the study sample institutions. The temporal boundary represents the time period extended from the beginning of work on this study to its end, as follows:
1. The spatial boundaries of this study represented by Orange Telecom.

ISSN: 2247-6172; ISSN-L: 2247-6172
Review of Applied Socio- Economic Research ( Volume 19, Issue 1/2020 ), pp. 33-46
URL: http://www.reaser.eu e-mail: [email protected]
36
2. Time Limits: The time limits of this study ranged from the beginning of the work of this research until the end of this research, during the period of October 2016 to December 2017.
3. Human boundaries: The Human boundaries of this study represented by Orange employees, in various administrative functions.
1. Literature review
Al-Hawajra (2010) conducted a study entitled "Studying the correlation between capital investment strategies and the competitive performance of institutions". This study aimed at analyzing the relationship between Strategies for investment in the knowledge capital by the performance of Jordanian insurance companies. The study concluded that there is a strong positive relationship between investment strategies in intellectual capital and competitive performance of the surveyed companies,The study also pointed out that there is a Interrelated relationship between the knowledge institution and competitive performance in a number of areas Such as the adoption of mechanisms for the documentation, registration and classification of knowledge, indicating that these companies pay great attention to knowledge capital and solidify their knowledge base and put it into proper implementation Thereby enhancing their administrative and managerial capacity.
Al-Saed (2008) conducted a study entitled "The Impact of Intellectual Capital and Internal Audit on
Institutional Governance in Jordanian Industrial Companies". The aim of this study was to identify the impact of intellectual capital and internal auditing on the institutional governance of the 64 Jordanian industrial joint-stock companies. A random sample of 20 companies was selected from the point of view of the internal audit manager, the board of directors, executives, And the Audit Committee). The study concluded with a set of results: that intellectual capital represents the most valuable asset in the twenty-first century under the so-called knowledge economy, and represents an effective and capable scientific force to make fundamental changes in the course of companies and their various activities, thus contributing to the improvement of the efficiency of corporate governance. The study also concluded that the concept of intellectual capital is a concept used by corporate departments and that there is an impact of intellectual capital and the internal audit profession on corporate governance, on the effectiveness of its activities and on achieving its objectives. The study showed that there is an impact of intellectual capital on institutional governance, which benefited the researcher in formulating the objectives of the present study.
Al-Sherbati (2008) discussed the impact of intellectual capital on the performance of Jordan's
pharmaceutical industry organizations, it aimed at examining the impact of intellectual capital on the performance of Jordan's pharmaceutical industry organizations. The study sought to uncover the interrelationship between the three elements of intellectual capital: Human capital, structural capital, and relative capital (as independent variables) and their relationship with the performance of Jordanian pharmaceutical industry organizations (as a dependent variable). The study included executives, senior management and middle managers working in Jordan's fifteen pharmaceutical industry organizations in Jordan, which number about 200 managers.The study concluded with a number of results, the most important of which was: The existence of a direct and positive relationship between the intellectual capital and the performance of Jordanian pharmaceutical industry organizations. And pharmaceutical organizations focus more on human capital and the relational capital more than their concentration on structural capital. There are strong relationships, interactions and linkages between the three main components of intellectual
ISSN: 2247-6172; ISSN-L: 2247-6172
Review of Applied Socio- Economic Research ( Volume 19, Issue 1/2020 ), pp. 33-46
URL: http://www.reaser.eu e-mail: [email protected]
37
capital. And that the performance of the organization's intellectual capital can clearly explain productivity and profitability rather than market value.
Clarke, et al (2010) conducted a study entitled "Intellectual Capital and Firm Performance in
Australia" The study aimed to measure the impact of intellectual capital on the performance of companies in Australia, listed from 2004-2008. The study uses the value- added coefficient of general intellectual capital and its components (human capital, structural capital, relative capital) as an independent variable and their relationship to performance (asset returns, profitability returns, input growth, and employee productivity). The study concluded that there is a direct relationship between intellectual capital and performance, especially the effectiveness of capital use and less effective than human capital, a positive relationship between human and structural capital and their effect on performance in the surveyed years. As well as the existence of a moderate relationship between intellectual capital and physical and financial capital, which affect the performance of companies.
Ngah& Ibrahim (2009) conducted a study in Malaysia entitled "The Relationship of Intellectual
Capital ،Innovation and Organizational Performance: a Preliminary Study in Malaysian SMEs" Aimed to measure the relationship between the components of intellectual capital and innovation on the organizational performance of Malaysian small and medium enterprises, through the ability of these companies to invest their knowledge assets and innovative skills to serve them for survival and continuity. The study concluded that knowledge assets play a large role in increasing SMEs' ability to innovate new goods and products. However, the knowledge capital of these companies is in the stage of childhood.
Huang &Hsueh (2007) conducted a study entitled "The Relationship between Intellectual capital and
Business Performance in the Engineering Consulting Industry: A Path Analysis " The study aimed to analyze the relationship between intellectual capital and institutional performance in the engineering consultancy industry: a path analysis. The study sought to uncover the interrelationship between the three elements of intellectual capital: human capital, structural capital, and relative capital as an independent variable, and their relationship with institutional performance in the engineering consulting industry as a dependent variable. The study included (101) companies. The study concluded with a number of results: Engineering consulting companies based on structural capital and relative capital showed better performance than those based on human capital. And that human capital has an impact on structural capital and relative capital but the relative capital has a direct impact on the performance of the institution.
While Wang Chang (2005) conducted a study entitled "Intellectual Capital and Performance in Causal
Models: Evidence from the Information Technology Industry .in Taiwan" Intellectual Capital and Performance in Causal Models: Evidence from the IT Industry in Taiwan. The study aimed to investigate the influence of the elements of intellectual capital on business performance and finding the relationship between the four elements of intellectual capital(human capital, creative capital, operational capital, and structural capital) From a causal perspective and how they affect performance.The study concluded a number of results, including: That human capital has no direct impact on performance but has a direct impact on other intellectual capital components and thus affects performance. Creative capital, operational capital have a direct impact on performance. The study also found that human capital affects creative capital and processes, creative capital and processes that affect performance, and creative capital directly affects relational capital.
ISSN: 2247-6172; ISSN-L: 2247-6172
Review of Applied Socio- Economic Research ( Volume 19, Issue 1/2020 ), pp. 33-46
URL: http://www.reaser.eu e-mail: [email protected]
38
Rindova&Fombrun (1999) conducted a study entitled "Building Competitive Advantage" , This study attempts to describe the competitive environment through four factors that help in building and achieving competitive advantage, which is a network linking the physical and human factors in the institution, and then discuss the six operations carried out by the institution in order to link the four factors referred to, and examine the role of each factor in the achievement of competitive advantage, and has been clarified these factors and dynamics and discuss the case of (IBM)for the computer industry. The study concluded that economic theories that pointed to competitive advantage neglected the human aspects, and that competition can be clarified through a complex network of producers, suppliers and customers. According to this model, this network is based on the analysis of physical and human factors and determining the role of managers and its impact in identifying strategic Alternatives Depending on the surrounding environment and the field of competition in which the institution operates, not only by focusing on different suppliers and markets and their potential relationships but also focusing on knowledge and expectations and creating a sense of organization for the surrounding environment.
2. Methodology Using a descriptive field survey methodology to suit the current survey and its hypotheses, the
following is a description of the elements of the study methodology.
3.1 Population of the Study The population is composed of all the employees of Orange Mobile Telecommunication Companies in
Jordan. The statistics indicate that their total number (578) according to 2011 statistics, distributed in the main management and branches in the city of Amman.
3.2 The study sample The sample of the study consisted of 245 employees and administrators in the simple random way,
representing about (42.3%) of the total study population of (578) employees and administrators working in the orange company main management and branches located in the city of Amman. The following table shows the distribution of the sample population by demographic variables.
Table (1): Distribution of Study Sample Population by Demographic Variables
3.3 The questionnaire
Variable Category Frequency Percentage
Experience Less than 5 years 128 52.2 5-10 years 79 32.2 10 years and more 38 15.5
Academic qualification
Bachelor and less 100 40.8 Postgraduate 107 43.7
Administrative position
Employee 38 15.5 Head of the Department 225 91.8
Manager 20 8.2
ISSN: 2247-6172; ISSN-L: 2247-6172
Review of Applied Socio- Economic Research ( Volume 19, Issue 1/2020 ), pp. 33-46
URL: http://www.reaser.eu e-mail: [email protected]
39
The study tool ( do you refer at the Questionnaire as a tool to collect data?) was developed based on theoretical literature on intellectual capital in addition to a number of questionnaires used in previous studies related to the subject of the study to achieve the objective of the study which is represented in the impact of intellectual capital and competitive advantage:
- First part was customize to identify demographics of respondents of the telecommunications company (gender, age, years of experience, educational qualification, job location).
- The second part was dedicated to terms covering the study variables which are to identify the impact of intellectual capital in its three dimensions on the achievement of competitive advantage in telecommunications companies. The researchers used the Likert five metric scale (strongly agree, agree, neutral, disagree, and strongly disagree)to respond to the paragraphs of the questionnaire.
3.3.1 Validity of the Study Tool ( questionnaire) To ensure the validity of the tool it was presented to a group of experienced and competent faculty
members in Jordanian universities, Where the arbitrators made a number of observations concerning the formulation of some paragraphs to be more appropriate within the variables that measure them, and relied on the criteria of 80% or more as a criterion for accepting the amendments proposed by the arbitrators.
3.3.2 Reliability of study tool In order to verify the reliability of the study tools, the Kronbach Alpha equation was used. It was
found that the reliability of the variables of the study was (0.82, 0.79, 0.75) for the intellectual capital variables (Human, structural, relational) respectively, for the questionnaire of competitive advantage of Coefficient of constancy was (0.85), and that all reliability coefficients were appropriate and fulfill the current study purposes.
3. Results The present study aimed at identifying the impact of intellectual capital on the competitive advantage of Jordanian telecom companies. In order to answer the study questions and testing the hypotheses, the data was reviewed.
Results related to the first question: What is the availability of intellectual capital with its dimensions (human capital, structural capital, relational capital) in the Jordanian telecom companies?
To answer this question, the arithmetical averages, standard deviations were calculated and tables (2, 3, 4,5) showing the results associated with this question.
Table (2) Calculation of averages and standard deviations of respondents' responses to the human capital domain
Item Mean Standard deviation Rank Level
The staff holds high academic and professional certificates 4.20 0.94 1 High
The employees of the company have the skills to carry out studies and research necessary to develop the work.
4.02 0.95 2 High
ISSN: 2247-6172; ISSN-L: 2247-6172
Review of Applied Socio- Economic Research ( Volume 19, Issue 1/2020 ), pp. 33-46
URL: http://www.reaser.eu e-mail: [email protected]
40
Staff has the ability to apply and use knowledge, and transfer it to practical application. 3.93 1.00 3
High
The company does its utmost to retain employees with high knowledge of work specifications. 3.91 0.93 4 High
Management believes that experience and training are the best ways to acquire practical skills. 3.90 0.98 5 High
Most of the company's knowledge is placed in databases and Manuals 3.89 1.01 6 High
The employees have the skills to solve the problems they face. 3.84 0.97 7 High
The employees have sufficient experience to perform their work efficiently. 3.72 0.96 8
High
The employees of the company know their knowledge and are in line with the latest developments.
3.56 0.89 9 Medium
General average 3.89 0.54 High
Table (2) shows that the mathematical averages ranged between (3.56 - 4.20) The highest average arithmetic was for the paragraph "the workers have high academic and vocational certificates", which averaged 4.20 and a standard deviation (0.94). And that the least arithmetic average was for the paragraph "The employees of the company know their knowledge in proportion to the latest developments" with an average of 3.56 and a standard deviation of 0.89, a general average of 3.89 and a standard deviation of 0.54, which is within the high level.
Table (3) the arithmetical averages and standard deviations of respondents' responses
to the structural capital domain.
Item Mean Standard deviation Rank Level
The company has modern equipment to facilitate the completion of work. 4.25 0.85 1 High
The company provides an electronic system to monitor the performance of its employees and to maintain the level of services provided.
4.18 0.92 2 High
The company's management information systems are accurate, modern and timely. 4.09 0.93 3 High
The company documents its achievements through periodic bulletins and brochures. 4.08 0.95 4 High
The company provides sufficient computers to complete the various works. 4.03 0.94 5 High
The company has a sophisticated service system. 4.01 0.96 6 High
The company relies on a large degree and a variety of software in its work. 3.86 0.97 7
High
The company provides systems to evaluate its relationship with the client 3.74 0.96 8
High

ISSN: 2247-6172; ISSN-L: 2247-6172
Review of Applied Socio- Economic Research ( Volume 19, Issue 1/2020 ), pp. 33-46
URL: http://www.reaser.eu e-mail: [email protected]
41
The police have a detailed database of their customers and needs 3.62 0.94 9
High
The company provides a system to address the personal and administrative needs of employees. 3.56 0.86 10 Medium
General average 3.94 0.46 High
From Table (3) it is clear that the mathematical averages ranged between (3.56-4.25) and that the highest average was for the paragraph "The company has modern equipment to facilitate the completion of work", which averaged 4.25 and a standard deviation (0.85). And that the least arithmetic average was for the paragraph "The company provides a system to address the employees personal and administrative needs .The overall average is 3.94 and a standard deviation of 0.46 is within the high level.
Table (4) the arithmetical averages and the standard deviations of the responses of the study sample members to the relative capital domain items
Item Mean Standard deviation Rank Level
The company has a clear vision of enhancing customer loyalty. 4.15 0.96 1 High
The company works to maintain communication with customers 4.06 0.99 2 High
Customers of the Company express their satisfaction with the services provided. 3.99 0.97 3
High
The company maintains special programs to maintain contact with its customers 3.95 0.99 4
High
The company provides new services to meet the needs of customers 3.92 0.98 5
High
The company is keen to quickly implement the services provided to customers 3.87 0.98 6
High
There are several ways to communicate with customers and hear their opinions 3.85 1.01 7
High
The company gives special privileges to customers in order to maintain contact with them 3.60 0.90 8 Medium
General average 3.93 0.52 High
Table (4) shows that the mathematical averages ranged between (3.60-4.15) The highest arithmetic
average was for the paragraph "the company adopts a clear vision about enhancing the affiliation of its customers" which averaged 4.15 and a standard deviation (0.96), and that the least arithmetic average was for the paragraph "The company gives special privileges to customers in order to maintain contact with them" with an average of 3.60 and a standard deviation of 0.90, and a general average of 3.93 and a standard deviation of 0.52, which is within the high level.

ISSN: 2247-6172; ISSN-L: 2247-6172
Review of Applied Socio- Economic Research ( Volume 19, Issue 1/2020 ), pp. 33-46
URL: http://www.reaser.eu e-mail: [email protected]
42
Table (5) The arithmetical averages and standard deviations of respondents' responses to the items of competitive advantage.
No Item Mean Standard deviation Rank Level
1. The company enjoys a distinct position in the local market. 4.32 0.91 1 High
2. High-end technology is used to gain a competitive advantage 4.25 0.85 2
High
3. Growth of the market share of the domestic market 4.18 0.97 3
High
4. Competition in the company requires the presence of modern technologies in providing new and diverse services to customers.
4.18 0.92 4 High
5. Diversity and renewal of ways and methods of work 4.08 0.95 5
High
6. Sales growth in general 4.07 0.99 6 High
7. The company's distinctive position in the local market 4.04 0.97 7
High
8. The quality of the services provided in the company is positively reflected on the competitive advantage
4.01 0.96 8 High
9. Innovation of new services contributes to competitive advantage 3.86 0.97 9 High
10. There are positions in the company that need to make creative decisions that contribute to the achievement of competitive advantage.
3.74 0.96 10 High
11. The company poses for more than one product 3.71 0.95 11 High
12. There is innovation for new products 3.63 0.90 12 Medium
13. The use of advanced technology helps to achievea competitive advantage in the company.
3.56 0.86 13 Medium
General average 3.96 0.48 High
Table (5) shows that the mathematical averages ranged between (3.56-4.32) and the highest arithmetic average was for the paragraph "The company has a distinct position in the local market" which averaged 4.32 and a standard deviation (0.91). and that the least arithmetic average was for the paragraph "The use of advanced technology helps to achieve a competitive advantage in a large and extensive in the company" with
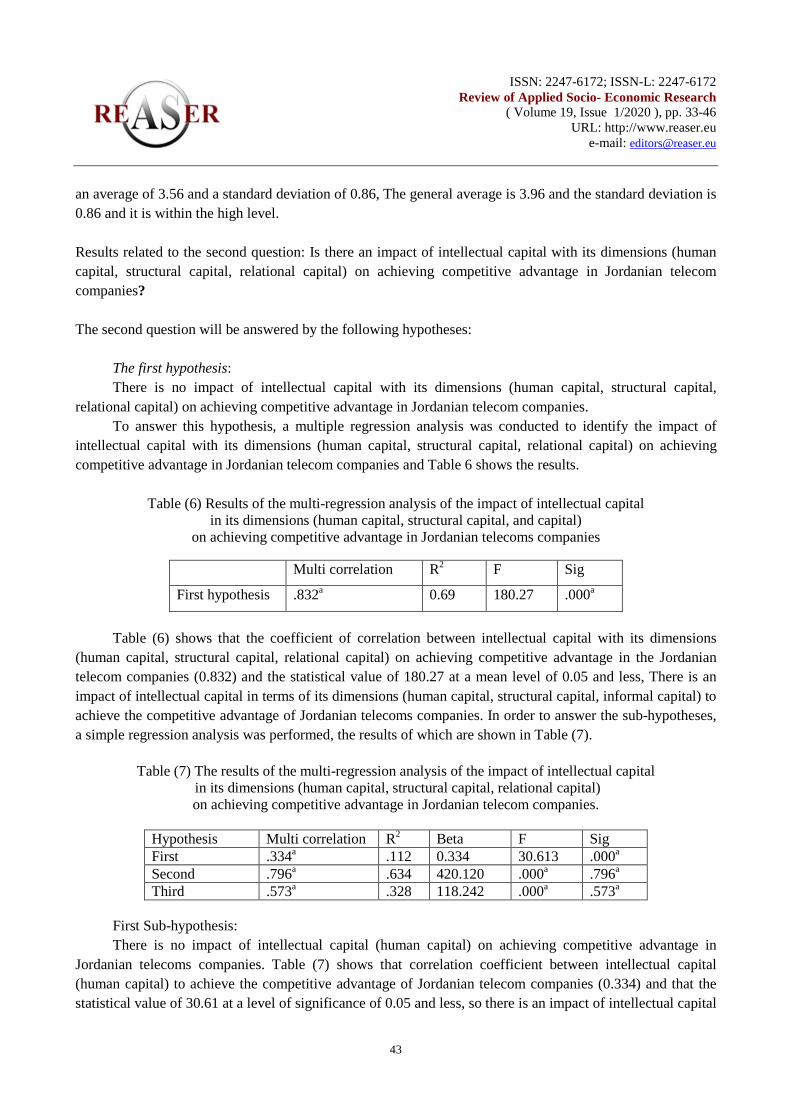
ISSN: 2247-6172; ISSN-L: 2247-6172
Review of Applied Socio- Economic Research ( Volume 19, Issue 1/2020 ), pp. 33-46
URL: http://www.reaser.eu e-mail: [email protected]
43
an average of 3.56 and a standard deviation of 0.86, The general average is 3.96 and the standard deviation is 0.86 and it is within the high level. Results related to the second question: Is there an impact of intellectual capital with its dimensions (human capital, structural capital, relational capital) on achieving competitive advantage in Jordanian telecom companies? The second question will be answered by the following hypotheses:
The first hypothesis: There is no impact of intellectual capital with its dimensions (human capital, structural capital,
relational capital) on achieving competitive advantage in Jordanian telecom companies. To answer this hypothesis, a multiple regression analysis was conducted to identify the impact of
intellectual capital with its dimensions (human capital, structural capital, relational capital) on achieving competitive advantage in Jordanian telecom companies and Table 6 shows the results.
Table (6) Results of the multi-regression analysis of the impact of intellectual capital
in its dimensions (human capital, structural capital, and capital) on achieving competitive advantage in Jordanian telecoms companies
Table (6) shows that the coefficient of correlation between intellectual capital with its dimensions
(human capital, structural capital, relational capital) on achieving competitive advantage in the Jordanian telecom companies (0.832) and the statistical value of 180.27 at a mean level of 0.05 and less, There is an impact of intellectual capital in terms of its dimensions (human capital, structural capital, informal capital) to achieve the competitive advantage of Jordanian telecoms companies. In order to answer the sub-hypotheses, a simple regression analysis was performed, the results of which are shown in Table (7).
Table (7) The results of the multi-regression analysis of the impact of intellectual capital
in its dimensions (human capital, structural capital, relational capital) on achieving competitive advantage in Jordanian telecom companies.
Hypothesis Multi correlation R2 Beta F Sig First .334a .112 0.334 30.613 .000a Second .796a .634 420.120 .000a .796a Third .573a .328 118.242 .000a .573a
First Sub-hypothesis: There is no impact of intellectual capital (human capital) on achieving competitive advantage in
Jordanian telecoms companies. Table (7) shows that correlation coefficient between intellectual capital (human capital) to achieve the competitive advantage of Jordanian telecom companies (0.334) and that the statistical value of 30.61 at a level of significance of 0.05 and less, so there is an impact of intellectual capital
Multi correlation R2 F Sig
First hypothesis .832a 0.69 180.27 .000a

ISSN: 2247-6172; ISSN-L: 2247-6172
Review of Applied Socio- Economic Research ( Volume 19, Issue 1/2020 ), pp. 33-46
URL: http://www.reaser.eu e-mail: [email protected]
44
with its dimensions (Human capital) to achieve the competitive advantage of Jordanian telecoms companies. The beta force indicates that the direction of the relationship is positive.
Second Sub-hypothesis: There is no impact of intellectual capital (structural capital) on achieving competitive advantage in
Jordanian telecoms companies. Table (7) shows that the coefficient of correlation between intellectual capital (structural capital) to achieve the competitive advantage of Jordanian telecommunications companies (0.796) and that the statistical value of 420.12 at a level of significance of 0.05 and less, so there is an impact of intellectual capital with its dimensions (Structural capital) to achieve the competitive advantage of Jordanian telecom companies. The beta value indicates that the direction of the relationship is positive.
Third Sub-hypothesis: There is no impact of intellectual capital (relative capital) on achieving competitive advantage in
Jordanian telecoms companies. Table (7) shows that correlation coefficient between intellectual capital (relative capital) to achieve the competitive advantage of Jordanian telecom companies (0.328) and that the statistical value of 118.24 at a level of significance of 0.05 and less, so there is an impact of intellectual capital with its dimensions (Related capital) to achieve the competitive advantage of Jordanian telecoms companies. The beta value indicates that the direction of the relationship is positive.
4.1 Discussion of the Results The results concerning the field of human capital showed that the highest arithmetic average was for
the paragraph "The staff have high academic and professional certificates", and the lowest arithmetic average was for the paragraph "The employees of the company develop their knowledge and adapt to the latest developments". Results of the structural capital showed that the highest arithmetic mean was for the paragraph "the company has modern equipment to facilitate the completion of the work" and the lowest average was for the paragraph "The company provides a system to address the employees personal and administrative needs".
As for the results related to the responses of the study sample members on the paragraphs of the area
of Relational capital, the general level is at the high level, the highest average was for the paragraph "The Company adopts a clear vision on enhancing the affiliation of its customers. The lowest average was for the paragraph "company gives a special privilege to customers in order to maintain contact with them".
The results in relation to the responses of the study sample members on the paragraphs of the field of competitive advantage occurred at the general level within the high level. The highest average account was for the paragraph "the company enjoys a privileged position in the local market" and that the lowest average was for the paragraph "The use of advanced technology helps to achieve a competitive advantage vastly and extensively in the company".
With regard to the hypotheses of the study, the results were as follows: The first hypothesis: There is not any impact of intellectual capital with its dimensions (human capital, structural capital,
relational capital) on achieving competitive advantage in Jordanian telecoms companies. The results
ISSN: 2247-6172; ISSN-L: 2247-6172
Review of Applied Socio- Economic Research ( Volume 19, Issue 1/2020 ), pp. 33-46
URL: http://www.reaser.eu e-mail: [email protected]
45
indicated that there is an impact of intellectual capital with its dimensions (human capital, structural capital , Relational Capital) to achieve the competitive advantage of Jordanian telecoms companies.
First Sub-hypothesis: There is not any impact of intellectual capital (human capital) To achieve the competitive advantage
of Jordanian telecom operators. The results of this hypothesis indicate that there is an impact of intellectual capital with its dimensions (human capital) on achieving competitive advantage in Jordanian telecom companies. The beta value indicates that the direction of the relationship is positive.
Second Sub-hypothesis: There is not any impact of intellectual capital (structural capital) on achieving competitive advantage
in Jordanian telecoms companies. While the results showed that there is an impact of intellectual capital with its dimensions (structural capital) on achieving the competitive advantage of Jordanian telecom companies. The beta value indicates that the direction of the relationship is positive.
Third Sub-hypothesis: There is not any impact of intellectual capital (relative capital) on achieving the competitive advantage
of Jordanian telecom companies. The results showed that there is an impact of intellectual capital with its dimensions (relational capital) on achieving the competitive advantage of Jordanian telecom companies. The beta value indicates that the direction of the relationship is positive.
The second hypothesis There is not any impact of intellectual capital with its dimensions (human capital, structural capital,
relational capital) on achieving the competitive advantage of Jordanian telecom companies. The results indicated that there is an impact of intellectual capital with its dimensions(human capital, structural capital, relational capital) on achieving the competitive advantage of Jordanian telecom companies. 5. References [1] Al-Hawajra, K. (2010) Studying the Linkage of Capital Investment Strategies to the Competitive
Performance of Institutions, Journal of the University of Sharjah for Humanities and Social Sciences, Volume 7, Second Issue, pp. 279-309
[2] Al-Saed, A. (2008) The impact of intellectual capital and internal audit on its institutional governors, unpublished PhD dissertation, Amman Arab University for Graduate Studies, Amman, Jordan.
[3] Bontis, Nick, (1998) "Intellectual capital: an exploratory study that develops measures and models", Management Decision, Vol. 36 Iss:2
[4] Clarke, Martin. DynaSeng and Rosalind H. Whiting, (2010). "Intellectual Capital and Firm Performance in Australia" Department of Accountancy and Business Law, Working paper series no 12.
[5] Huang &Hsueh (2007) "A Study on the relationship between Intellectual Capital and Business Performance on the Engineering, Consulting Industry: Path Analysis", Journal of Civil Engineering and Management, Vol. XIII, No 4, 265–271.
[6] McElroy, M.W. (2002) Social innovation capital. Journal of Intellectual Capital, 3(1), 30-39.
ISSN: 2247-6172; ISSN-L: 2247-6172
Review of Applied Socio- Economic Research ( Volume 19, Issue 1/2020 ), pp. 33-46
URL: http://www.reaser.eu e-mail: [email protected]
46
[7] Ngah, Rohana. Ibrahim, Abdul Razak (2009) The Relationship of Intellectual Capital, Innovation and Organizational Performance: a Preliminary Study in Malaysian SMEs, Journal of Management Research,Vol. 1, No. 1p9
[8] Rindova, P. &Fombrun, J. (1999) Constructing competitive advantage: the role of firm–constituent interactions. Strategic Management Journal, Volume 20, Issue 8, pages 691–710.
[9] Sherbati, A. (2008) The impact of intellectual capital on performance in the Jordanian pharmaceutical industries, unpublished PhD dissertation, Amman Arab University for Graduate Studies, Amman, Jordan.
[10] Stewart, T. A., (1997). Intellectual Capital: the New wealth of Organization, Doubleday Currency, New York, NY
[11] Sullivan, P.H. (1999), “Profiting from intellectual capital”, Journal of Knowledge Management,Vol. 3, pp. 132-42.
[12] Wang, W.Y. and Chang, (2005).“Intellectual capital and performance in causal Models: Evidence from the information technology industry in Taiwan”, Journal o Intellectual Capital, Vol. 6 No. 2, pp. 222-236.
[13] McElroy, M.W. (2002) "Social innovation capital", Journal of Intellectual Capital, Vol. 3, No. 1, pp. 30-39.
____________________________________ Manuscript received: 15.09.2019 Manuscript received in revised form: 08.03.2020 Manuscript accepted: 22.06.2020
ISSN: 2247-6172; ISSN-L: 2247-6172
Review of Applied Socio- Economic Research ( Volume 19, Issue 1/2020 ), pp. 47-60
URL: http://www.reaser.eu e-mail: [email protected]
47
Ethnic Diversity Management and Poverty in Developing Countries
Dieu Ne Dort Talla Fokam 1+
1 Dschang School of Economics and Management, University of Dschang, P.O. Box. 110 Dschang, Cameroon
, Paul Ningaye 1 and Celestin Chameni Nembua 2
2 Faculty of Economics and Management, University of Yaoundé Soa, Cameroon
Abstract. The main objective of this research is to analyse the effect of ethnic diversity management on poverty in developing countries. The literature review explained the relationship between ethnic diversity management and poverty on the one hand and provided a measure of ethnic diversity management on the other. Based on a sample of 62 developing countries, empirical analysis with two-stage least square (2SLS) estimator shows that ethnic diversity management affects poverty in developing countries. Effective management of ethnic diversity leads to social cohesion and improves the monetary and non-monetary well-being of households. However, ineffective management of ethnic diversity is a source of social exclusion and conflict, with perverse effects on the standard of living and living conditions of households.
Keywords: diversity management, ethnic diversity, poverty
JEL Codes: Z10, Z13, I31, I32
1. Introduction The need to eradicate poverty has given rise to several reflections in recent decades. It is in this regard
that the United Nations has made it a global priority by placing it at the forefront of the Millennium Development Goals and the Sustainable Development Goals. However, achieving such a goal requires first and foremost identifying the different causes of poverty. A number of researchers have examined this problem and many economic, political, institutional, social and cultural causes have been identified.
At the economic level, Ravallion (1995), Dollar and Kraay (2002) and Adams (2004) point out that economic growth has a negative impact on the different aspects of poverty, which are monetary poverty and non-monetary poverty. The low economic performance of some developing countries would justify their high rates of poverty which, in addition, are struggling to decrease. However, economic growth remains a necessary but not sufficient condition for reducing poverty. Several factors such as the composition of government spending, inequalities, the dynamics of labour market, the level of industrialization and the level of involvement in international trade, also affect the level of poverty and can influence the effect of economic growth on poverty (Agénor et al., 2008; Akoum, 2008; Beck et al., 2005; Datt & Ravallion, 1992; Fan et al., 2000; Augustin Kwasi Fosu, 2017; Klasen et al., 2007). Indeed, the contexts marked by a strong orientation of public expenditure towards social investments, in particular roads and electricity, generally achieve inclusive economic growth and reduced poverty levels (Sasmal & Sasmal, 2016). In addition, other studies have found a negative link between the level of industrialization of the economy and poverty rates (Kimura & Chang, 2017). The increase in the level of industrialization of the economy is accompanied by an improvement in national income, investment and productive employment.
+ Corresponding author. Tel.: +237 695 156 248 E-mail address: [email protected]

ISSN: 2247-6172; ISSN-L: 2247-6172
Review of Applied Socio- Economic Research ( Volume 19, Issue 1/2020 ), pp. 47-60
URL: http://www.reaser.eu e-mail: [email protected]
48
At the political and institutional level, the quality of institutions and governance are, among other things, the main factors contributing to the explanation of poverty in countries. Countries with high rates of poverty are generally characterized by undemocratic practices, corruption, embezzlement of public funds, domination of the executive over the judiciary and legislature (Chong & Calderón, 2000; Perera & Lee, 2013; Tebaldi & Mohan, 2010).
At the social level, the causes of poverty are numerous and concern the socio-demographic characteristics of individuals or households. These include, for example, the place of residence, the size of the household, the sex of the head of household, his level of education, and his occupation (Grootaert, 1997; Mukherjee & Benson, 2003). Poverty is higher in rural households, households headed by women, or those in which the head is in precarious employment.
At the cultural level, many authors have questioned the role of culture in explaining aspects of poverty. Akerlof and Kranton (2000) relied on the concept of identity to develop a model in which individuals have preferences for behaviour that is specific to their cultural identity and derive their utility from that behaviour. Guiso, Sapienza, and Zingales (2006) develop a model in which beliefs and norms within groups affect individual preferences, which in turn affect their resources and economic decision-making. These practices are in part sources of social inequality. Ningaye (2011) analyses the effect of cultural values on multidimensional poverty in Cameroon and shows that differences in the dimensions of poverty result significantly, but not exclusively, from differences in cultural valuation systems between groups.
Beyond the above causes, other authors have analysed the impact of ethnic diversity on poverty. Miguel (2006) compares the effect of ethnic diversity on poverty in two districts in Kenya and Tanzania. Presenting collective action as all forms of action organized and undertaken by a group of individuals with a view to achieving common objectives and sharing profits, Miguel (2006) concludes that ethnic diversity is negatively linked to local collective action (and by extension poverty reduction) in the Kenya District, but not in the Tanzania District. The main explanation for this result is that ethnic diversity is more important in local public life in Kenya than in Tanzania. Churchill and Smyth (2017) examine the relationship between ethnic diversity and poverty through a panel of 60 countries. Contrary to the approach taken by Miguel (2006), they establish a direct relationship between ethnic diversity and poverty. By measuring ethnic diversity by the Fractionalization Index1
This research joints the literature on the causes of poverty. It contributes to this literature by providing a new orientation to the analysis of the causes of poverty. In effect, few attention has been paid to the effect of ethnic diversity management on poverty. Past studies of Miguel (2006) and Churchill and Smyth (2017) have highlighted the impact of ethnic diversity on poverty. The main criticism addressed to these studies is that diversity does not allow to explain or predict the relationships between identities. Identity relationships are largely determined by the nature of the socio-economic and political arrangements that govern societies. When such arrangements are likely to marginalise certain identities, relations between identity groups may be conflicting. In addition, there is hardly any country in the world that is not characterized by diversity, yet all countries do not have the same problems related to diversity. Therefore, problems that may arise from the existence of several ethnic identities within a country can be attributed to the management of diversity (Economic Commission for Africa, 2011; Horowitz, 2000).
, they indicate that ethnic diversity contributes to increasing levels of poverty, as well as levels of deprivation and multidimensional vulnerability. Overall, this work provides a new direction for explaining poverty.
1 The fractionalization index provides the probability that two randomly chosen individuals in a given country belong to different ethnic groups
ISSN: 2247-6172; ISSN-L: 2247-6172
Review of Applied Socio- Economic Research ( Volume 19, Issue 1/2020 ), pp. 47-60
URL: http://www.reaser.eu e-mail: [email protected]
49
The rest of the paper is organized as follows. The following section presents the definition and the measurement indicator of ethnic diversity management. Section 3 analyses the transmission channels through which ethnic diversity management can transit to affect poverty. Section 4 shows the stylized facts. Section 5 presents the data and the empirical method. Section 6 presents and discusses the results and Section 7 concludes the paper.
2. Definition and Measurement of Ethnic Diversity Management
2.1. Definition of the concept of ethnic diversity management Ethnic diversity refers to the plurality of ethnic groups living in the same country (Deng, 2008). As a
development actor, ethnic groups compete for political and cultural power and economic resources. Such competition creates conflicts of interest and ideas which, according to the Economic Commission for African, can be managed peacefully by an effective system of governance that ensures that competition takes place within legal limits, and in addition, which provide equitable citizenship rights and equitable access to opportunities and resources for the development of all identity groups (Economic Commission for Africa, 2011). Without effective governance, ethnic groups can engage in violent conflict. Leaders, depending on their behaviour, can also cause ethnic conflicts. These are mainly the “ethnocratic” leaders who grant the privilege to the development of their ethnic groups (Mazrui, 1975) and the selfish autocrats who have as their main concern their continuance in power. It is within this framework of reflection that researchers indicate that diversity management refers to the consideration, by the public authorities and the various institutions, of the specificities of different identity groups and sub-groups (Economic Commission for Africa, 2011; Gagnon & Jouve, 2009). For fair management in a diversified context, the proposed responses must, according to the Economic Commission for Africa, be specific to the specific needs of the groups (Economic Commission for Africa, 2011).
Following this definition, it is important to consider how diversity is managed in the different countries. Diversity management incorporates three main elements: compliance with the legal and institutional provisions on non-discrimination and equal opportunity, the definition of a governance model, or a form of the State, which takes into account the participation of different ethnic groups in the decision-making process and respect for democratic rules.
With regard to legal and institutional arrangements for diversity management, several countries have defined laws that govern the effective management of their diversity. The international conventions on human rights and freedoms to which several countries have ratified are also part of this framework for diversity management.
Diversity governance models refer to territorial and administrative modes of organization. The main models are: the participatory model, the federalist model and the multicultural model. The participatory model is based on the mechanisms of proportional representation of identity (or ethnic) groups in different decision-making spheres (Commercio, 2011). The federalist model is based on the creation of federated states on the basis of differences that are generally ethnic. It guarantees a balance of power between states and ethnic autonomy. The multicultural model consists in including all ethnic groups in administrative management without legally determining the rules of balance within the institutions. However, the adoption of one of these models is based on several factors including the size of minorities, the level of geographical concentration of minorities, and the level of tension between ethnic groups (Commercio, 2011; Cornell, 2002; Malloy, 2005).
Respect for democratic rules is just as important. The Economic Commission for Africa highlights the important role of elections in the diversity management process (Economic Commission for Africa, 2013).
ISSN: 2247-6172; ISSN-L: 2247-6172
Review of Applied Socio- Economic Research ( Volume 19, Issue 1/2020 ), pp. 47-60
URL: http://www.reaser.eu e-mail: [email protected]
50
maxmax min
itit
ET ETmedET ET
−=
−
She indicates that several identity crises in Africa have arisen in the aftermath of the elections and are the result of challenges to electoral results. Moreover, the alternation in power and the holding of free and transparent elections are crucial for the maintenance of social cohesion.
2.2. Measuring ethnic diversity management The variable “diversity management” is not directly observable. Following the work of Horowitz (2000),
Barron, Kaiser, and Pradhan (2009) and Wimmer, Cederman, and Min (2009), diversity management can be equated to the quality of relationships between identity groups. In effect, effective management of ethnic diversity leads to social cohesion and ensures equal access to rights, institutions and resources for all different ethnic identities. On the other hand, ineffective management of ethnic diversity is a source of social exclusion and inter-ethnic conflict. The marginalisation of minorities leads to polarization of groups, ethnic tensions and in extreme cases to conflicts. Considering this definition, we have used the level of ethnic tension as a proxy for measuring ethnic diversity management.
International Country Risk Guide (ICRG) provides data for ethnic tension. According to the methodology used by the ICRG, ethnic tension is “an assessment of the degree of tension in a country attributable to racial or linguistic divisions2
(1)
”. The ICRG assigns a score between 0 and 6 to each country to assess levels of ethnic tension. A score of 0 is allocated to high tension countries (ethnic conflict) and a score of 6 is allocated to countries that do not face ethnic tensions. To obtain the indicator “ethnic diversity management (med)” used in this work, we reversed the original value provided by ICRG using the following formula:
Where minET and maxET are respectively the minimum and maximum value of the ethnic tension, and
ETit is the initial value of the ethnic tension of country i on date t. This transformation gives a variable whose values are between 0 and 1. Contrary to the initial indicator, the values of this variable increase with the associated level of ethnic tension, that is, the value 0 represents a low level of ethnic tension (effective management of ethnic diversity) and 1 represents a high level of ethnic tension characterizing ineffective management of ethnic diversity (presence of ethnic conflicts).
3. Ethnic Diversity Management and Poverty: Transmission Channels Poverty goes beyond the monetary aspect and integrates the living conditions of households (access to
housing, health, household equipment, etc.). The literature analyses several channels through which ethnic diversity management can be used to affect the change in poverty rates in a country. Two main effects of diversity management are expected depending on whether the management is effective or ineffective. Effective ethnic diversity management leads to social cohesion, mutual trust and living together. When ethnic diversity is well managed, it becomes a potential source of competitiveness and innovation. Indeed, areas where creative people with different cultures meet are more likely to generate new combinations of ideas and resources; which in turn encourages innovation, business creation, employment creation and economic growth (N. Lee, 2011; S. Y. Lee et al., 2004; Ozgen et al., 2011). Quigley (1998) and Glaeser, Kolko, and Saiz (2001) present the diversity of goods and services available as one of the attractive features of cities composed of several identity groups sharing cultural values. Montalvo and Reynal-Querol (2017) stress that ethnic diversity is positively associated with economic growth through its contribution to economic diversification. All these assets are likely to reduce poverty through their contribution to household 2 For more details see http://www.prsgroup.com/ICRG_Methodology.aspx.
ISSN: 2247-6172; ISSN-L: 2247-6172
Review of Applied Socio- Economic Research ( Volume 19, Issue 1/2020 ), pp. 47-60
URL: http://www.reaser.eu e-mail: [email protected]
51
income and living conditions. However, when managing ethnic diversity is ineffective, ethnic fractionalization can lead to economic, social and human damage with severe effects on poverty.
Barr and Oduro (2002) point out that ethnic fractionalization promotes discrimination and segregation in the labour market. Some people, because of their ethnic origin, may accumulate disadvantages in terms of employment, remuneration or promotion. These imperfections in the labour market exacerbate inequalities with adverse consequences for the well-being of households (Baye, 2006). Other work has indicated that ethnic fractionalization is associated with low economic growth and poor public policy performance (Easterly & Levine, 1997; Pecher, 2018). There are many reasons for this. Among them are the discouragement of investors and the inefficiency of public spending. Investors are generally attracted by the contexts that guarantee the security of their investments. Where such security is not guaranteed, investors tend to either reduce the volume of their investments to limit the risk of loss in the event of political instability, or to direct their investments towards secure contexts (Mauro, 1995). Alesina, Baqir, and Easterly (1999) and Miguel and Gugerty (2005) show that ethnic diversity negatively influences public goods provisions for education and employment. Inadequate or unevenly distributed public goods across the national territory can increase inequalities that in turn contribute to increasing poverty.
Ethnic diversity management can also have an effect on social capital, particularly trust and social networking (Alesina & Zhuravskaya, 2011; Dincer, 2011; Leigh, 2006; Sturgis et al., 2011). While it is generally demonstrated that in situations of imperfect information, the social network can provide benefits to agents with better social connections (Kranton 1996), several authors have indicated that ethnic polarization negatively affects social cohesion and consequently the expansion of the social network of individuals (Fafchamps, 1998; Miguel, 2006). Therefore, some people may lose opportunities in the labour market because of their ethnicity.
4. Stylized Facts The fight against poverty is a central concern of the United Nations. Listed as the first of the Millennium
Development Goals, it maintains the same rank in the Sustainable Development Goals. Multiple efforts by researchers and political actors around the world have led to a considerable reduction in poverty, although it is still high in some regions. According to the United Nations Development Programme (UNDP), the share of the world’s population living below the international poverty line, set at $1.90 per person per day, moved from 1.9 billion in 1990 to 836 million in 2015 (United Nations Development Programme, 2016). In addition to this monetary aspect of poverty, infant mortality has also declined significantly and household living conditions have improved significantly. In fact, the number of deaths of children under five years of age dropped from 12.7 million to 6 million between 1990 and 2015, more than 2.6 billion people accessed an improved source of drinking water and 2.1 billion people have access to improved sanitation.
These progresses in global well-being and living conditions are unevenly distributed regionally; developing countries have the greatest disadvantage with the highest poverty rates. In 2015, sub-Saharan Africa and South Asia accounted for more than 85% of the world’s poor. The poverty rate in Sub-Saharan Africa is about 41% compared to 5% in the Middle East and North Africa (MENA) region in 2015. One of the main causes of continuing poverty in the MENA region is related to the conflict that some countries in this region have experienced over the past two decades (United Nations Development Programme, 2016).
Figures 1 to 6 show the scatter plots between ethnic tensions on the one hand and poverty measurement indicators on the other hand. These scatter plots predict a positive relationship between ethnic tensions and poverty.
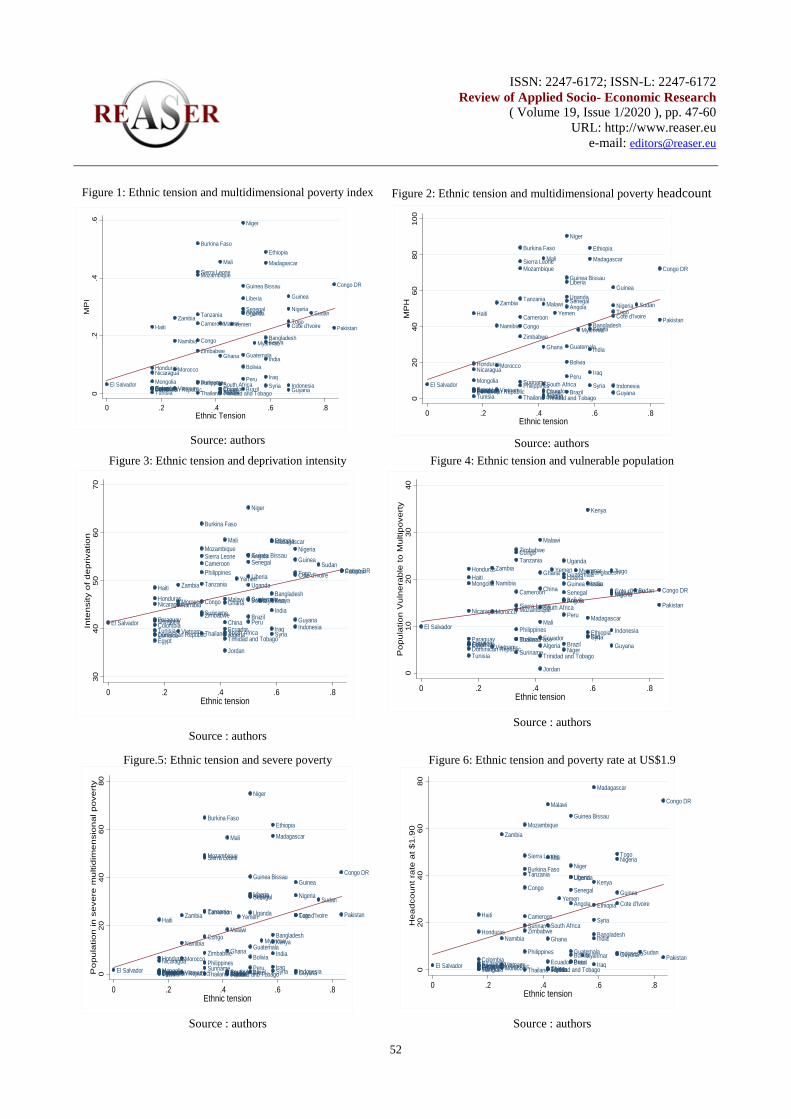
ISSN: 2247-6172; ISSN-L: 2247-6172
Review of Applied Socio- Economic Research ( Volume 19, Issue 1/2020 ), pp. 47-60
URL: http://www.reaser.eu e-mail: [email protected]
52
Algeria
Angola
Bangladesh
Bolivia
Brazil
Burkina Faso
Cameroon
ChinaColombia
Congo
Congo DR
Cote d'Ivoire
Dominican Republic EcuadorEgyptEl Salvador
Ethiopia
Ghana Guatemala
GuineaGuinea Bissau
Guyana
Haiti
HondurasIndia
IndonesiaIraq
Jamaica Jordan
Kenya
Liberia
Madagascar
Malawi
Mali
Mongolia
Morocco
Mozambique
MyanmarNamibia
Nicaragua
Niger
Nigeria
Pakistan
ParaguayPeruPhilippines
Senegal
Sierra Leone
South Africa
Sudan
Suriname Syria
Tanzania
Thailand
Togo
Trinidad and TobagoTunisia
Uganda
Vietnam
YemenZambia
Zimbabwe
0.2
.4.6
MP
I
0 .2 .4 .6 .8Ethnic Tension
Algeria
Angola
BangladeshBolivia
Brazil
Burkina Faso
Cameroon
ChinaColombia
Congo
Congo DRCote d'Ivoire
Dominican RepublicEcuador
Egypt
El Salvador
Ethiopia
Ghana Guatemala
GuineaGuinea Bissau
Guyana
HaitiHonduras
India
IndonesiaIraqJamaica
Jordan
Kenya
Liberia
Madagascar
Malawi
Mali
Mongolia
Morocco
Mozambique
MyanmarNamibiaNicaragua
Niger
Nigeria
Pakistan
Paraguay Peru
PhilippinesSenegal
Sierra Leone
South Africa
Sudan
Suriname
Syria
Tanzania
Thailand
Togo
Trinidad and TobagoTunisia
Uganda
Vietnam
YemenZambia
Zimbabwe
3040
5060
70In
ten
sity
of
de
priv
atio
n
0 .2 .4 .6 .8Ethnic tension
Algeria
Angola
Bangladesh
Bolivia
BrazilBurkina Faso
CameroonChina
Colombia
Congo
Congo DRCote d'Ivoire
Dominican RepublicEcuador
Egypt
El SalvadorEthiopia
Ghana Guatemala
GuineaGuinea Bissau
Guyana
HaitiHonduras
India
IndonesiaIraq
Jamaica
Jordan
Kenya
Liberia
Madagascar
Malawi
Mali
Mongolia
Morocco Mozambique
Myanmar
Namibia
Nicaragua
Niger
NigeriaPakistan
Paraguay
Peru
Philippines
Senegal
Sierra LeoneSouth Africa
Sudan
Suriname
Syria
Tanzania
Thailand
Togo
Trinidad and TobagoTunisia
Uganda
Vietnam
YemenZambia
Zimbabwe
010
2030
40P
opul
atio
n V
ulne
rabl
e to
Mul
tipov
erty
0 .2 .4 .6 .8Ethnic tension
Algeria
Angola
Bangladesh
Bolivia
Brazil
Burkina Faso
Cameroon
ChinaColombia
Congo
Congo DR
Cote d'Ivoire
Dominican Republic EcuadorEgyptEl Salvador
Ethiopia
Ghana Guatemala
GuineaGuinea Bissau
Guyana
Haiti
Honduras
India
Indonesia
Iraq
JamaicaJordan
Kenya
Liberia
Madagascar
Malawi
Mali
Mongolia
Morocco
Mozambique
MyanmarNamibia
Nicaragua
Niger
Nigeria
Pakistan
Paraguay
PeruPhilippines
Senegal
Sierra Leone
South Africa
Sudan
Suriname Syria
Tanzania
Thailand
Togo
Trinidad and TobagoTunisia
Uganda
Vietnam
YemenZambia
Zimbabwe
020
4060
8010
0M
PH
0 .2 .4 .6 .8Ethnic tension
Algeria
Angola
Bangladesh
Bolivia
Brazil
Burkina Faso
Cameroon
ChinaColombia
Congo
Congo DR
Cote d'Ivoire
Dominican Republic EcuadorEgyptEl Salvador
Ethiopia
Ghana Guatemala
GuineaGuinea Bissau
Guyana
Haiti
HondurasIndia
IndonesiaIraqJamaica Jordan
Kenya
Liberia
Madagascar
Malawi
Mali
Mongolia
Morocco
Mozambique
MyanmarNamibia
Nicaragua
Niger
Nigeria
Pakistan
Paraguay PeruPhilippines
Senegal
Sierra Leone
South Africa
Sudan
Suriname Syria
Tanzania
Thailand
Togo
Trinidad and TobagoTunisia
Uganda
Vietnam
YemenZambia
Zimbabwe
020
40
60
80
Po
pu
latio
n in
se
vere
mu
ltid
ime
nsi
on
al p
ove
rty
0 .2 .4 .6 .8Ethnic tension
Algeria
Angola
Bangladesh
BoliviaBrazil
Burkina Faso
Cameroon
ChinaColombia
Congo
Congo DR
Cote d'Ivoire
Dominican Republic EcuadorEgyptEl Salvador
Ethiopia
Ghana
Guatemala
Guinea
Guinea Bissau
Guyana
Haiti
HondurasIndia
IndonesiaIraqJamaica Jordan
KenyaLiberia
Madagascar
Malawi
Mali
Mongolia Morocco
Mozambique
Myanmar
Namibia
Nicaragua
NigerNigeria
PakistanParaguay Peru
Philippines
Senegal
Sierra Leone
South Africa
Sudan
SurinameSyria
Tanzania
Thailand
Togo
Trinidad and TobagoTunisia
Uganda
Vietnam
Yemen
Zambia
Zimbabwe
020
4060
80H
ea
dco
un
t ra
te a
t $
1.9
0
0 .2 .4 .6 .8Ethnic tension
Figure 1: Ethnic tension and multidimensional poverty index
Source: authors
Figure 2: Ethnic tension and multidimensional poverty headcount
Source: authors Figure 3: Ethnic tension and deprivation intensity
Source : authors
Figure 4: Ethnic tension and vulnerable population
Source : authors
Figure.5: Ethnic tension and severe poverty
Source : authors
Figure 6: Ethnic tension and poverty rate at US$1.9
Source : authors
ISSN: 2247-6172; ISSN-L: 2247-6172
Review of Applied Socio- Economic Research ( Volume 19, Issue 1/2020 ), pp. 47-60
URL: http://www.reaser.eu e-mail: [email protected]
53
i i i ipov med Xα β δ ε= + + +
5. Methodology
5.1. Data and variables Data relate to 62 developing countries in 2015. Indeed, 2015 is the most recent year for which there is
sufficient data to estimate global poverty. The data come from various sources, including: United Nations Development Programme databases, World Bank database, International Country Risk Guide, Worldwide Governance Indicators and World Development Indicators3
The main dependent variable is poverty. According to Churchill and Smyth (2017), we have captured poverty in developing countries by seven (07) indicators that are: the multidimensional poverty index (mpi), the Multidimensional poverty headcount (mph), Intensity of deprivation of multidimensional poverty (idmp), Population vulnerable to multidimensional poverty (pvmp), Population in severe multidimensional poverty (psmp), poverty rate at the US$1.90 per day threshold (headcount) and the poverty gap at the US$1.90 per day (povgap). Taking all these indicators into account makes it possible not only to analyse the impact of ethnic diversity management on the monetary and non-monetary aspects of poverty, but also on vulnerability to poverty and the level of deprivation.
.
The variable of interest is ethnic diversity management (med). It is measured by the level of ethnic tension. Its values range from 0 (absence of ethnic tension, reflecting effective ethnic diversity management) to 1 (strong ethnic tensions, reflecting ineffective ethnic diversity management).
The control variables are: quality of the institutions (goq), gross domestic product per capita (gdp), the literacy rate (liter), the income inequality measured by the Gini index (gini) and the urbanization rate (urb). These variables are used by Churchill and Smyth (2017) to analyze the effect of ethnic diversity on poverty. With reference to the work of Easterly (2007), the quality of institutions is captured by the average of the six indicators for measuring the quality of institutions of the worldwide governance indicators.
5.2. Specifying the econometric model The main objective of this work is to analyse the effect of ethnic diversity management on poverty. This
section presents the empirical methodology developed for this purpose. Our econometric model is formulated as follows.
(2) Where i (i = 1, …, 62) symbolizes countries, pov represents the measure of poverty; med represents
ethnic diversity management, X is a vector of explanatory variables likely to affect the level of poverty in a country and ε is a residual term. Churchill and Smyth (2017) use a similar model for the analysis of the effect of ethnic diversity on poverty.
This model can be estimated using the Ordinary Least Square (OLS) method. But the OLS estimator has limitations when problems of endogeneity arise. These problems may result from unobservable values that influence the variable to be explained and certain explanatory variables. In addition, many countries often face widespread poverty, which disproportionately affects certain ethnic groups. This type of poverty poses serious risks of social instability and can pose endogeneity problems in econometric analyses.
3 List of countries that constitute our sample: Algeria, El Salvador, Liberia, Philippines, Sudan, Dominican Republic, Angola, Ethiopia, Madagascar, Senegal, Suriname, Trinidad and Tobago, Bangladesh, Ghana, Malawi, Sierra Leone, Syria, Guinea Bissau, Bolivia, Guatemala, Mali, South Africa, Tanzania, Vietnam, Brazil, Guinea, Mongolia, Namibia, Thailand, Yemen, Burkina Faso, Guyana, Morocco, Nicaragua, Togo, Zambia, Cameroon, Haiti, Mozambique, Niger, Tunisia, Zimbabwe, China, Honduras, Myanmar, Nigeria, Uganda, Ecuador, Colombia, India, Jamaica, Paraguay, Pakistan, Egypt, Congo, Indonesia, Cote d'Ivoire, Peru, Congo DR, Jordan, Iraq, Kenya
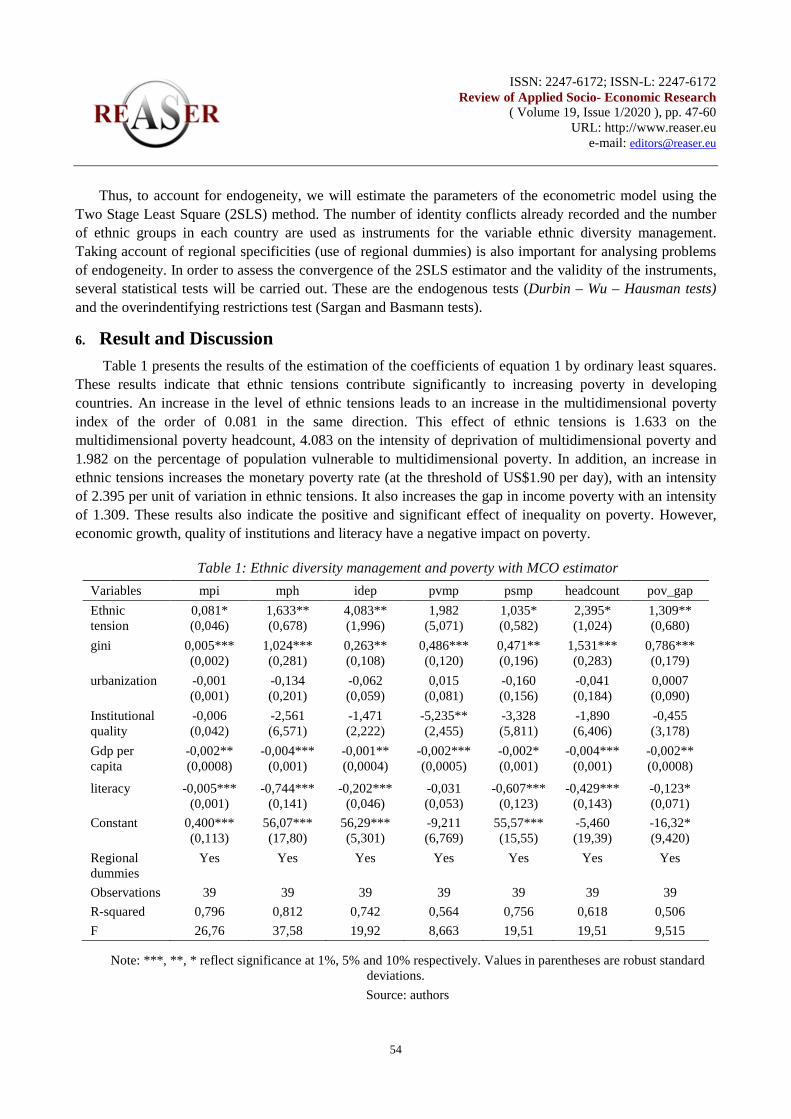
ISSN: 2247-6172; ISSN-L: 2247-6172
Review of Applied Socio- Economic Research ( Volume 19, Issue 1/2020 ), pp. 47-60
URL: http://www.reaser.eu e-mail: [email protected]
54
Thus, to account for endogeneity, we will estimate the parameters of the econometric model using the Two Stage Least Square (2SLS) method. The number of identity conflicts already recorded and the number of ethnic groups in each country are used as instruments for the variable ethnic diversity management. Taking account of regional specificities (use of regional dummies) is also important for analysing problems of endogeneity. In order to assess the convergence of the 2SLS estimator and the validity of the instruments, several statistical tests will be carried out. These are the endogenous tests (Durbin – Wu – Hausman tests) and the overindentifying restrictions test (Sargan and Basmann tests).
6. Result and Discussion Table 1 presents the results of the estimation of the coefficients of equation 1 by ordinary least squares.
These results indicate that ethnic tensions contribute significantly to increasing poverty in developing countries. An increase in the level of ethnic tensions leads to an increase in the multidimensional poverty index of the order of 0.081 in the same direction. This effect of ethnic tensions is 1.633 on the multidimensional poverty headcount, 4.083 on the intensity of deprivation of multidimensional poverty and 1.982 on the percentage of population vulnerable to multidimensional poverty. In addition, an increase in ethnic tensions increases the monetary poverty rate (at the threshold of US$1.90 per day), with an intensity of 2.395 per unit of variation in ethnic tensions. It also increases the gap in income poverty with an intensity of 1.309. These results also indicate the positive and significant effect of inequality on poverty. However, economic growth, quality of institutions and literacy have a negative impact on poverty.
Table 1: Ethnic diversity management and poverty with MCO estimator Variables mpi mph idep pvmp psmp headcount pov_gap Ethnic tension
0,081* (0,046)
1,633** (0,678)
4,083** (1,996)
1,982 (5,071)
1,035* (0,582)
2,395* (1,024)
1,309** (0,680)
gini 0,005*** (0,002)
1,024*** (0,281)
0,263** (0,108)
0,486*** (0,120)
0,471** (0,196)
1,531*** (0,283)
0,786*** (0,179)
urbanization -0,001 (0,001)
-0,134 (0,201)
-0,062 (0,059)
0,015 (0,081)
-0,160 (0,156)
-0,041 (0,184)
0,0007 (0,090)
Institutional quality
-0,006 (0,042)
-2,561 (6,571)
-1,471 (2,222)
-5,235** (2,455)
-3,328 (5,811)
-1,890 (6,406)
-0,455 (3,178)
Gdp per capita
-0,002** (0,0008)
-0,004*** (0,001)
-0,001** (0,0004)
-0,002*** (0,0005)
-0,002* (0,001)
-0,004*** (0,001)
-0,002** (0,0008)
literacy -0,005*** (0,001)
-0,744*** (0,141)
-0,202*** (0,046)
-0,031 (0,053)
-0,607*** (0,123)
-0,429*** (0,143)
-0,123* (0,071)
Constant 0,400*** (0,113)
56,07*** (17,80)
56,29*** (5,301)
-9,211 (6,769)
55,57*** (15,55)
-5,460 (19,39)
-16,32* (9,420)
Regional dummies
Yes Yes Yes Yes Yes Yes Yes
Observations 39 39 39 39 39 39 39 R-squared 0,796 0,812 0,742 0,564 0,756 0,618 0,506 F 26,76 37,58 19,92 8,663 19,51 19,51 9,515
Note: ***, **, * reflect significance at 1%, 5% and 10% respectively. Values in parentheses are robust standard deviations. Source: authors
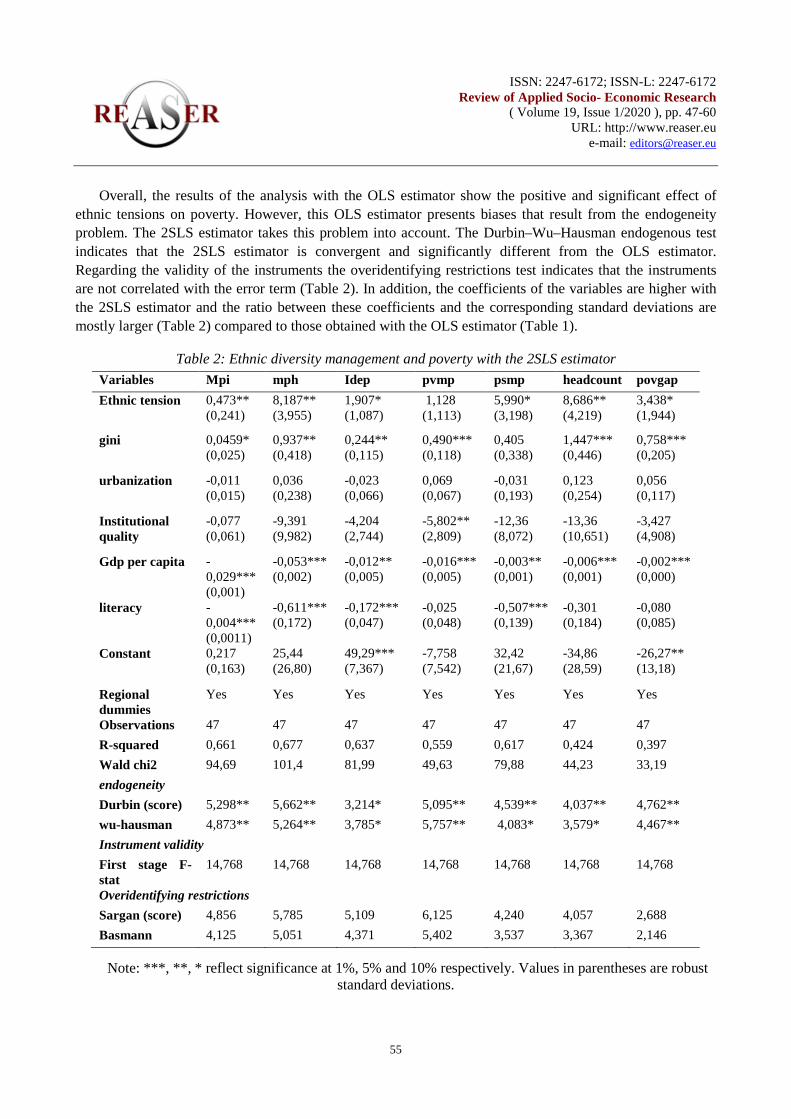
ISSN: 2247-6172; ISSN-L: 2247-6172
Review of Applied Socio- Economic Research ( Volume 19, Issue 1/2020 ), pp. 47-60
URL: http://www.reaser.eu e-mail: [email protected]
55
Overall, the results of the analysis with the OLS estimator show the positive and significant effect of ethnic tensions on poverty. However, this OLS estimator presents biases that result from the endogeneity problem. The 2SLS estimator takes this problem into account. The Durbin–Wu–Hausman endogenous test indicates that the 2SLS estimator is convergent and significantly different from the OLS estimator. Regarding the validity of the instruments the overidentifying restrictions test indicates that the instruments are not correlated with the error term (Table 2). In addition, the coefficients of the variables are higher with the 2SLS estimator and the ratio between these coefficients and the corresponding standard deviations are mostly larger (Table 2) compared to those obtained with the OLS estimator (Table 1).
Table 2: Ethnic diversity management and poverty with the 2SLS estimator Variables Mpi mph Idep pvmp psmp headcount povgap Ethnic tension 0,473**
(0,241) 8,187** (3,955)
1,907* (1,087)
1,128 (1,113)
5,990* (3,198)
8,686** (4,219)
3,438* (1,944)
gini 0,0459* (0,025)
0,937** (0,418)
0,244** (0,115)
0,490*** (0,118)
0,405 (0,338)
1,447*** (0,446)
0,758*** (0,205)
urbanization -0,011 (0,015)
0,036 (0,238)
-0,023 (0,066)
0,069 (0,067)
-0,031 (0,193)
0,123 (0,254)
0,056 (0,117)
Institutional quality
-0,077 (0,061)
-9,391 (9,982)
-4,204 (2,744)
-5,802** (2,809)
-12,36 (8,072)
-13,36 (10,651)
-3,427 (4,908)
Gdp per capita -0,029*** (0,001)
-0,053*** (0,002)
-0,012** (0,005)
-0,016*** (0,005)
-0,003** (0,001)
-0,006*** (0,001)
-0,002*** (0,000)
literacy -0,004*** (0,0011)
-0,611*** (0,172)
-0,172*** (0,047)
-0,025 (0,048)
-0,507*** (0,139)
-0,301 (0,184)
-0,080 (0,085)
Constant 0,217 (0,163)
25,44 (26,80)
49,29*** (7,367)
-7,758 (7,542)
32,42 (21,67)
-34,86 (28,59)
-26,27** (13,18)
Regional dummies
Yes Yes Yes Yes Yes Yes Yes
Observations 47 47 47 47 47 47 47 R-squared 0,661 0,677 0,637 0,559 0,617 0,424 0,397 Wald chi2 94,69 101,4 81,99 49,63 79,88 44,23 33,19 endogeneity Durbin (score) 5,298** 5,662** 3,214* 5,095** 4,539** 4,037** 4,762** wu-hausman 4,873** 5,264** 3,785* 5,757** 4,083* 3,579* 4,467** Instrument validity First stage F-stat
14,768 14,768 14,768 14,768 14,768 14,768 14,768
Overidentifying restrictions Sargan (score) 4,856 5,785 5,109 6,125 4,240 4,057 2,688 Basmann 4,125 5,051 4,371 5,402 3,537 3,367 2,146
Note: ***, **, * reflect significance at 1%, 5% and 10% respectively. Values in parentheses are robust standard deviations.
ISSN: 2247-6172; ISSN-L: 2247-6172
Review of Applied Socio- Economic Research ( Volume 19, Issue 1/2020 ), pp. 47-60
URL: http://www.reaser.eu e-mail: [email protected]
56
The results in Table 2 show that the increase in inequality, captured by the Gini index, leads to an increase in the level of poverty. The impact of inequalities is of the order of 1.447 on the incidence of monetary poverty and of 0.0459 on the multidimensional poverty index. This finding is consistent with previous research, notably (Baye, 2006; Augustin Kwasi Fosu, 2017). According to them, inequality is one of the factors that cause and sustain poverty. The results in Table 2 also show that institutional quality, economic growth and literacy each have a negative effect on poverty. An improvement in the quality of institutions has an effect of -0.077 on the multidimensional poverty index, of -5.802 on the percentage of population vulnerable to multidimensional poverty and of -13.36 on the poverty rate at the $1.90 threshold; although the effect is not statistically significant on all poverty measurement indicators. However, the effect of economic growth is statistically significant and negative on all poverty indicators. It is in the order of -0.029 on the multidimensional poverty index, -0.006 on the monetary poverty rate and -0.002 on the income poverty gap. This result supports the argument that economic growth is important for poverty reduction (Adams, 2004; Dollar & Kraay, 2002; Ravallion, 1995). Overall, there is a mixed effect of urbanization on poverty in developing countries. Indeed, unplanned urbanization as seen in recent decades in several developing countries may not be accompanied by improved living conditions for households (Chen et al., 2014; Lipton, 1977). The main cause is the lack of decent employment and difficulties in accessing housing, drinking water and basic social infrastructure in urban areas.
Regarding the effect of ethnic diversity management on poverty, the results in Table 2 present the level of ethnic tension as an explanatory factor of poverty in developing countries. An increase in the level of ethnic tension leads to an increase in poverty. The effect is of the order of 0.473 on the multidimensional poverty index, of 8.187 on the multidimensional poverty headcount, of 1.91 on the intensity of deprivation of multidimensional poverty, 5.99 on the percentage of population in severe multidimensional poverty, 8.686 on the poverty rate at the US$1.90 per day threshold, and 3.438 on the monetary poverty gap. According to the literature, it is generally presented that ethnic tensions are accompanied by the risks of ethnic conflicts, and thus generate negative externalities that affect the attractiveness of investments, tourism, and the efficiency of public expenditures (Bardhan, 1997; Augstin Kwasi Fosu, 2003; Stavenhagen, 1996). When ethnic tensions lead to conflict, the consequences are greater, including employment losses, the closure of certain businesses, involuntary migration, and human and material losses. Thus, developing countries need to develop effective ethnic diversity management mechanisms in order to improve the effectiveness of anti-poverty policies. As the Economic Commission for Africa states, effective diversity management must be achieved through a number of practices, including the application of democratic principles, non-discrimination, the equitable allocation of state resources and improving the quality of institutions (Economic Commission for Africa, 2013). Practices to boost economic growth and literacy are also necessary for poverty reduction.
7. Conclusions The main objective of this research was to analyse the impact of ethnic diversity management on poverty in developing countries. A review of the existing literature has explained the relationship between ethnic diversity management and poverty. This suggests that ethnic diversity management can have two distinct effects on household poverty. On the one hand, when diversity management is effective, it leads to social cohesion, living together and avoiding social tensions. This contributes to the reduction of poverty through mechanisms such as the attractiveness of investors, innovation and tourism. On the other hand, when diversity management is not effective, it leads to social exclusion, ethnic polarization and conflict, with harmful consequences for household income and living conditions. The sample consists of 62 developing countries in 2015. The 2SLS estimator is used to correct endogeneity problems in the
ISSN: 2247-6172; ISSN-L: 2247-6172
Review of Applied Socio- Economic Research ( Volume 19, Issue 1/2020 ), pp. 47-60
URL: http://www.reaser.eu e-mail: [email protected]
57
econometric model. Since the variable “ethnic diversity management” is not directly observable, we approximated it by the level of ethnic tension. Thus, mismanagement of ethnic diversity results in strong ethnic tensions while good management of ethnic diversity is characterized by the absence of ethnic tensions. The main results show that ethnic tensions are deteriorating the well-being and living conditions of households. Increased levels of ethnic tension are accompanied by increased poverty. Thus, diversity management, which tends to promote social cohesion, is favourable for the improvement of household living conditions and hence for the reduction of poverty.
8. References [1] Adams, R. H. (2004). Economic Growth, Inequality and Poverty: Estimating the Growth Elasticity of Poverty.
World Development, 32(12), 1989–2014. https://doi.org/10.1016/j.worlddev.2004.08.006 [2] Agénor, P.-R., Bayraktar, N., & El Aynaoui, K. (2008). Roads out of poverty? Assessing the links between aid,
public investment, growth, and poverty reduction. Journal of Development Economics, 86(2), 277–295. https://doi.org/10.1016/j.jdeveco.2007.07.001
[3] Akerlof, G. A., & Kranton, R. E. (2000). Economics and Identity. The Quarterly Journal of Economics, 115(3), 715–753. https://doi.org/10.1162/003355300554881
[4] Akoum, I. F. (2008). Globalization, growth, and poverty: The missing link. International Journal of Social Economics. https://doi.org/10.1108/03068290810854529
[5] Alesina, A., Baqir, R., & Easterly, W. (1999). Public Goods and Ethnic Divisions. The Quarterly Journal of Economics, 114(4), 1243–1284. https://doi.org/10.1162/003355399556269
[6] Alesina, A., & Zhuravskaya, E. (2011). Segregation and the Quality of Government in a Cross Section of Countries. American Economic Review, 101(5), 1872–1911. https://doi.org/10.1257/aer.101.5.1872
[7] Bardhan, P. (1997). Method in the madness? A political-economy analysis of the ethnic conflicts in less developed countries. World Development, 25(9), 1381–1398. https://doi.org/10.1016/S0305-750X(97)00052-1
[8] Barr, A., & Oduro, A. (2002). Ethnic fractionalization in an African labour market. Journal of Development Economics, 68(2), 355–379. https://doi.org/10.1016/S0304-3878(02)00017-2
[9] Barron, P., Kaiser, K., & Pradhan, M. (2009). Understanding Variations in Local Conflict: Evidence and Implications from Indonesia. World Development, 37(3), 698–713. https://doi.org/10.1016/j.worlddev.2008.08.007
[10] Baye, F. M. (2006). Growth, Redistribution and Poverty Changes in Cameroon: A Shapley Decomposition Analysis. Journal of African Economies, 15(4), 543–570. https://doi.org/10.1093/jae/ejk010
[11] Beck, T., Demirguc-Kunt, A., & Levine, R. (2005). SMEs, Growth, and Poverty: Cross-Country Evidence. Journal of Economic Growth, 10(3), 199–229. https://doi.org/10.1007/s10887-005-3533-5
[12] Chen, M., Zhang, H., Liu, W., & Zhang, W. (2014). The Global Pattern of Urbanization and Economic Growth: Evidence from the Last Three Decades. PLOS ONE, 9(8), e103799. https://doi.org/10.1371/journal.pone.0103799
[13] Chong, A., & Calderón, C. (2000). Institutional quality and poverty measures in a cross-section of countries. Economics of Governance, 1(2), 123–135. https://doi.org/10.1007/PL00021678
[14] Churchill, S. A., & Smyth, R. (2017). Ethnic Diversity and Poverty. World Development, 95, 285–302. https://doi.org/10.1016/j.worlddev.2017.02.032
[15] Commercio, M. E. (2011). Russian Minority Politics in Post-Soviet Latvia and Kyrgyzstan, The Transformative Power of Informal Networks. University of Pennsylvania Press. https://doi.org/10.9783/9780812204704
[16] Cornell, S. E. (2002). Autonomy as a Source of Conflict: Caucasian Conflicts in Theoretical Perspective. World Politics, 54(2), 245–276. JSTOR. https://www.jstor.org/stable/25054184
ISSN: 2247-6172; ISSN-L: 2247-6172
Review of Applied Socio- Economic Research ( Volume 19, Issue 1/2020 ), pp. 47-60
URL: http://www.reaser.eu e-mail: [email protected]
58
[17] Datt, G., & Ravallion, M. (1992). Growth and redistribution components of changes in poverty measures: A decomposition with applications to Brazil and India in the 1980s. Journal of Development Economics, 38(2), 275–295. https://doi.org/10.1016/0304-3878(92)90001-P
[18] Deng, F. (2008). Identity, Diversity, and Constitutionalism in Africa. United States Institute of Peace. [19] Dincer, O. C. (2011). Ethnic Diversity and Trust. Contemporary Economic Policy, 29(2), 284–293.
https://doi.org/10.1111/j.1465-7287.2010.00215.x [20] Dollar, D., & Kraay, A. (2002). Growth is Good for the Poor. Journal of Economic Growth, 7(3), 195–225.
https://doi.org/10.1023/A:1020139631000 [21] Easterly, W. (2007). Inequality does cause underdevelopment: Insights from a new instrument. Journal of
Development Economics, 84(2), 755–776. https://doi.org/10.1016/j.jdeveco.2006.11.002 [22] Easterly, W., & Levine, R. (1997). Africa’s Growth Tragedy: Policies and Ethnic Divisions. The Quarterly Journal
of Economics, 112(4), 1203–1250. https://doi.org/10.1162/003355300555466 [23] Economic Commission for Africa. (2011). Diversity Management in Africa: Findings from the African Peer
Review Mechanism and a Framework for Analysis and Policy-Making (report. UN. ECA). ECA. http://repository.uneca.org/handle/10855/23308
[24] Economic Commission for Africa. (2013). African governance report III: Elections and the management of diversity. Oxford University Press. http://dag.un.org/handle/11176/89921
[25] Fafchamps, M. (1998). Market Emergence, Trust and Reputation (No. 96016; Working Papers). Stanford University, Department of Economics. https://ideas.repec.org/p/wop/stanec/96016.html
[26] Fan, S., Hazell, P., & Thorat, S. (2000). Government Spending, Growth and Poverty in Rural India. American Journal of Agricultural Economics, 82(4), 1038–1051. https://doi.org/10.1111/0002-9092.00101
[27] Fosu, Augstin Kwasi. (2003). Political Instability and Export Performance in Sub-Saharan Africa. The Journal of Development Studies, 39(4), 68–83. https://doi.org/10.1080/713869426
[28] Fosu, Augustin Kwasi. (2017). Growth, inequality, and poverty reduction in developing countries: Recent global evidence. Research in Economics, 71(2), 306–336. https://doi.org/10.1016/j.rie.2016.05.005
[29] Gagnon, A. G., & Jouve, B. (Eds.). (2009). Facing cultural diversity: Cities under stress. Presses universitaires de Lyon, DL 2009.
[30] Glaeser, E. L., Kolko, J., & Saiz, A. (2001). Consumer city. Journal of Economic Geography, 1(1), 27–50. https://doi.org/10.1093/jeg/1.1.27
[31] Grootaert, C. (1997). The Determinants of Poverty in Côte d’Ivoire in the 1980s. Journal of African Economies, 6(2), 169–196. https://doi.org/10.1093/oxfordjournals.jae.a020925
[32] Guiso, L., Sapienza, P., & Zingales, L. (2006). Does Culture Affect Economic Outcomes? Journal of Economic Perspectives, 20(2), 23–48. https://doi.org/10.1257/jep.20.2.23
[33] Horowitz, D. L. (2000). Ethnic Groups in Conflict, Updated Edition With a New Preface (2nd edition). University of California Press.
[34] Kimura, F., & Chang, M. S. (2017). Industrialization and poverty reduction in East Asia: Internal labor movements matter. Journal of Asian Economics, 48, 23–37. https://doi.org/10.1016/j.asieco.2016.10.005
[35] Klasen, S., Grimm, M., & Mckay, A. (2007). Determinants of pro-poor growth: Analytical issues and findings from country cases. Houndmills: Palgrave Macmillan. http://sro.sussex.ac.uk/id/eprint/1489/
[36] Kranton, R. E. (1996). Reciprocal Exchange: A Self-Sustaining System. The American Economic Review, 86(4), 830–851. https://www.jstor.org/stable/2118307
[37] Lee, N. (2011). Ethnic diversity and employment growth in English cities. Urban Studies, 48(2), 407–425.
ISSN: 2247-6172; ISSN-L: 2247-6172
Review of Applied Socio- Economic Research ( Volume 19, Issue 1/2020 ), pp. 47-60
URL: http://www.reaser.eu e-mail: [email protected]
59
[38] Lee, S. Y., Florida, R., & Acs, Z. (2004). Creativity and Entrepreneurship: A Regional Analysis of New Firm Formation. Regional Studies, 38(8), 879–891. https://doi.org/10.1080/0034340042000280910
[39] Leigh, A. (2006). Trust, Inequality and Ethnic Heterogeneity. The Economic Record, 82(258), 268–280. https://ideas.repec.org/a/bla/ecorec/v82y2006i258p268-280.html
[40] Lipton, M. (1977). Why poor people stay poor: A study of urban bias in world development. Temple Smith ; Australian National University Press. https://openresearch-repository.anu.edu.au/handle/1885/114902
[41] Malloy, T. H. (2005). National Minority Rights in Europe. Oxford University Press. http://www.oxfordscholarship.com/view/10.1093/acprof:oso/9780199274437.001.0001/acprof-9780199274437
[42] Mauro, P. (1995). Corruption and Growth. The Quarterly Journal of Economics, 110(3), 681–712. https://doi.org/10.2307/2946696
[43] Mazrui, A. A. (1975). Soldiers and kinsmen in Uganda: The making of a military ethnocracy. Sage Publications. [44] Miguel, E. (2006). Ethnic Diversity and Poverty Reduction. In A. V. Banerjee, R. Bénabou, & D. Mookherjee
(Eds.), Understanding Poverty. Oxford University Press. https://www.oxfordscholarship.com/view/10.1093/0195305191.001.0001/acprof-9780195305197-chapter-12
[45] Miguel, E., & Gugerty, M. K. (2005). Ethnic diversity, social sanctions, and public goods in Kenya. Journal of Public Economics, 89(11), 2325–2368. https://doi.org/10.1016/j.jpubeco.2004.09.004
[46] Montalvo, J. G., & Reynal-Querol, M. (2017). Ethnic diversity and growth: Revisiting the evidence (No. 1585; Economics Working Papers). Department of Economics and Business, Universitat Pompeu Fabra. https://ideas.repec.org/p/upf/upfgen/1585.html
[47] Mukherjee, S., & Benson, T. (2003). The Determinants of Poverty in Malawi, 1998. World Development, 31(2), 339–358. https://doi.org/10.1016/S0305-750X(02)00191-2
[48] Ningaye, P. (2011). Ethno‐cultural diversity and multidimensional poverty differential in Cameroon. International Journal of Development Issues. https://doi.org/10.1108/14468951111149078
[49] Ozgen, C., Nijkamp, P., & Poot, J. (2011). Immigration and Innovation in European Regions (No. 5676; IZA Discussion Papers). Institute of Labor Economics (IZA). https://ideas.repec.org/p/iza/izadps/dp5676.html
[50] Pecher, P. (2018). Ethnic divisions and the effect of appropriative competition intensity on economic performance. Economics of Governance, 19(2), 165–193. https://doi.org/10.1007/s10101-018-0203-6
[51] Perera, L. D. H., & Lee, G. H. Y. (2013). Have economic growth and institutional quality contributed to poverty and inequality reduction in Asia? Journal of Asian Economics, 27, 71–86. https://doi.org/10.1016/j.asieco.2013.06.002
[52] Quigley, J. M. (1998). Urban Diversity and Economic Growth. Journal of Economic Perspectives, 12(2), 127–138. https://ideas.repec.org/a/aea/jecper/v12y1998i2p127-38.html
[53] Ravallion, M. (1995). Growth and poverty: Evidence for developing countries in the 1980s. Economics Letters, 48(3), 411–417. https://doi.org/10.1016/0165-1765(94)00620-H
[54] Sasmal, R., & Sasmal, J. (2016). Public expenditure, economic growth and poverty alleviation. International Journal of Social Economics. https://doi.org/10.1108/IJSE-08-2014-0161
[55] Stavenhagen, R. (1996). Ethnic Conflict and Economic Development. In R. Stavenhagen (Ed.), Ethnic Conflicts and the Nation-State (pp. 139–163). Palgrave Macmillan UK. https://doi.org/10.1007/978-1-349-25014-1_6
[56] Sturgis, P., Brunton-Smith, I., Read, S., & Allum, N. (2011). Does Ethnic Diversity Erode Trust? Putnam’s ‘Hunkering Down’ Thesis Reconsidered. British Journal of Political Science, 41(1), 57–82. https://doi.org/10.1017/S0007123410000281
[57] Tebaldi, E., & Mohan, R. (2010). Institutions and Poverty. The Journal of Development Studies, 46(6), 1047–1066. https://doi.org/10.1080/00220380903012730
ISSN: 2247-6172; ISSN-L: 2247-6172
Review of Applied Socio- Economic Research ( Volume 19, Issue 1/2020 ), pp. 47-60
URL: http://www.reaser.eu e-mail: [email protected]
60
[58] United Nations Development Programme. (2016). Rapport Sur le Developpement Humain 2015: Le Travail au Service du Developpement Humain. United Nations.
[59] Wimmer, A., Cederman, L.-E., & Min, B. (2009). Ethnic Politics and Armed Conflict: A Configurational Analysis of a New Global Data Set. American Sociological Review, 74(2), 316–337. https://www.academia.edu/6538208/Ethnic_Politics_and_Armed_Conflict_A_Configurational_Analysis_of_a_New_Global_Data_Set
__________________________________________
Manuscript received: 01.02.2019 Manuscript received in revised form: 21.02.2020 Manuscript accepted: 21.06.2020
ISSN: 2247-6172; ISSN-L: 2247-6172
Review of Applied Socio- Economic Research ( Volume 19, Issue 1/2020 ), pp. 61-74
URL: http://www.reaser.eu e-mail: [email protected]
61
Determinants of ethical behavior in social networks in Cameroon: the case of group « Kerel Kongossa !!!! » on Facebook
NJAMEN KENGDO Arsène Aurelien1
1,2 Dschang School of Economics and Management (LAREFA), University of Dschang, Cameroon
, Tii Njivukuh NCHOFOUNG2
Abstract. The objective of this paper is to determine the explanatory factors of ethical behavior in social networks in Cameroon. To do this a study based on the posts of members of a group on Facebook called Kerel Kongossa!!!! was conducted. The data are obtained from 1000 posts recorded during the periods of April to August 2019. The methodology focuses on the analysis of descriptive statistics and logistic regression. Two main results are obtained from this research. On one hand, among the variables retained, posts of an educational nature, social events, funny, visible and intelligible posts have a positive and significant impact on the ethical behavior of individuals (determinants of moral behavior). On the other hand, insulting posts and unwanted content rather have a negative impact on the ethical behavior of individuals (determinants of amoral behavior). Overall, there is a gradual and accentuated depravity of mores in relation to the shared content and the interactivities of members of the group. The main beneficiaries of this research are young people in particular, and society as a whole in general. Given the ever-increasing internet penetration rate among the population, it is essential to place special emphasis on controlling published content in other to limit the proliferation of deviant behaviors. This involves (i) the meticulous examination of applications for membership to the group to detect false profiles that are vectors of deviant behaviors, (ii) to increase the number of administrators / moderators to coordinate interactions in the group. The choice of these administrators / moderators should also take into consideration the days and times they can be connected online.
Keywords: ethical behavior, moral, amoral, social networks, kerel Kongossa !!!!, Facebook
JEL Codes: Z13
Warning: The author wishes to reassure the members of the group “Kerel Kongossa !!!!” regarding anonymity in the process of gathering information.
1. Introduction Social networks! These fantastic social networks that occupy our days; or who fill in the dead time, for
those who are less addicted. One can complain about wasting our time, eyes fixed on our screen as if every second an event of the highest importance was going to happen; we go back every day, irremediably, as if it was the first time (Le Breton, 2016).
A social network refers to a collection of people or organizations that are linked together by social interaction (Fayon, 2008; Magdalena and Jacek, 2013). In other words, social networks refer to all the websites that make it possible to form a network of friends or professional knowledge and provide their members with tools and interfaces for interaction, presentation, and communication. At the end of the 1990s,
1 Corresponding author Email: [email protected] , Tel: +237 696 143 338; P.O. Box. 110 Dschang, Cameroon The authors are grateful to anonymous referees, Steve Keudem, Steve Kwatcho and Kaffo Fotio Hervé for their comments and suggestions.
ISSN: 2247-6172; ISSN-L: 2247-6172
Review of Applied Socio- Economic Research ( Volume 19, Issue 1/2020 ), pp. 61-74
URL: http://www.reaser.eu e-mail: [email protected]
62
social networks appeared on the Internet, bringing people together through personalized exchange services (Magdalena and Jacek, op.cit.).
With digital development, we are witnessing the multiplicity of these social networks. Making friends and staying in contact are facilitated by social networks, in a form of anonymity more or less displayed. More and more, private social networks are being created on the internet. They are in one way or another “private” clubs for seniors, singles but also families and many audiences often selected by personal interests based on the principle of homophily2
Facebook has a particularity that gives the user this impression of living a second life. This is associated with the fact that this network permits us to connect with our friends we have lost contact with and even those we have never met. However, we can play with the identity, create it, control what we want to reveal to the public. In this connection, we have in recent years been witnessing a growing phenomenon, which is the development of discussion groups. These groups bring together individuals, depending on their specific interests, who change and share experiences and concerns in specific areas. Thus we find for example the group Economics for the followers of the economic sciences, or the group classical music for classical music fans. These specific groups participate in creating a sense of fulfillment because we can exchange with individuals with whom we share the same passion. Besides, there are also entertainment groups of another kind, called “fourretout”. The particularity of this is that the shared content is not controlled, everyone is free to publish what he wants, hence the tendency to deviant behaviors, coupled with insults of any kind. In the African context in general and Cameroonian in particular, the most popular entertainment groups are Kmer-kongossa et kerel NO stress (dans la paix), Kerel kongossa !!!!, LE CAMEROUN c’est le CAMEROUN, Kmer NO LIMIT Plus, Kongossa VIP. Among these groups, attention is focused on Kerel kongossa!!!! because of the number of subscribers, the frequency of interventions, but also the diversity of shared content.
(McPherson and Smith-Lovin, 1987). Some social networks on the Internet bring together real-life friends, others help to create a circle of friends, find business partners or a job and there are social networking services, such as Facebook, Twitter, Instagram, LinkedIn or WhatsApp, the list is not exhaustive. Statistics of 2018 show that Facebook is the most used social network with 2.27 billion active users per month, compared to 1.7 billion users for YouTube, 1.5 billion for WhatsApp, 1 billion for Instagram, 326 million for Twitter, 300 million for Skype and 188 million for Snapchat (Viard, 2018).
The contribution of this study is on at least two folds. Firstly, this study, to our knowledge, is the first to focus on the ethical analysis of the behavior in social networks in Cameroon. Secondly, this study has the merit of modeling these behaviors in order to highlight the different interactions between the specific characteristics of each participant. Thus, the objective of this paper is to highlight the determinants of the ethical behavior of members of the group Kerel kongossa !!!! through the characteristics of the published content. To do this, we will, first of all, make a general presentation of the group Kerel kongossa !!!! (section 2); then, undertake a review of the literature on the behavior of individuals on social networks (section 3); describe the methodology of the study (section 4) and finally present the results and implications (section 5).
2. Presentation of the group Kerel kongossa !!!!
Kerel kongossa !!!! is a “closed” group on Facebook created on July 24, 2013. It had 334.979 and 356.483 members respectively in June and November 2019, active in 128 countries and spread across the five continents. The members are mainly Cameroonian, and from African countries in general. The group is supervised by two administrators, assisted by five moderators. Group membership is on request, subject to 2 In social networks, homophily refers to tendency for similar persons to maintain relationships with people who are similar to themselves, as characterized by age, gender, race, religion, or profession (Matthew, 2010)
ISSN: 2247-6172; ISSN-L: 2247-6172
Review of Applied Socio- Economic Research ( Volume 19, Issue 1/2020 ), pp. 61-74
URL: http://www.reaser.eu e-mail: [email protected]
63
the assessment of the administrators and / or moderators. The motto of the group is “To everyone his madness but respects his neighbor”. This means that everyone is free to publish what he wants, when he wants and how he wants while respecting others.
The posts of the members touch as many fields as societal facts, religion, culture, education, health, and asides, all destined to individuals according to their humor and expectations. These posts are commented on or liked by other members of the group. Most often, comments go in all directions, usually without any logic: insults, hilarities, moral lessons; all this in a language sometimes misunderstood by people not used to this kind of discussion. Group members are found in all social classes (adolescents, adults, students, academics, workers, unemployed, rich, poor, etc.). The frequency of publication in the group is 995 posts on average per day, 85% of the members are active in the group with about 10 million interactions per month (publications, comments and reactions). The group receives about 1000 applications for membership per day; and according to its ethical policy, on average 700 members are suspended per month for misbehavior and deviant behavior (since its creation, 11719 members have been excluded from the group). We are therefore facing a phenomenon that is gaining momentum on the Internet, favored by digital development.
In this regard, World Bank data (2017) show an increasing evolution of Internet access and mobile telephony in Cameroon. In fact, subscriptions for mobile phones have gone from about one telephone per 100 inhabitants in 2000 to about 82 telephones per 100 inhabitants in 2017; this in a context where the Internet penetration rate in the population is on a rise. As an illustration, the rate of Internet users as a percentage of the country's population increased from 0.25% in 2000 to 23.20% in 2017. One can question the significance of these statistics of Cameroon compared to other countries. Thus, when comparing the situation of Cameroon with the rest of the countries of the CEMAC sub-region (Central African Economic and Monetary Community), for example, it is quickly realized that digital development is more advanced. In fact, mobile phone subscriptions in CEMAC account for 70.25 telephones per 100 inhabitants, while the rate of internet users was estimated at 10.86% in 2017; significantly lower than Cameroon's statistics. Given that we connect to social networks using telephony (phone, tablet, PC) and an internet connection, these statistics confirm the ever-growing digital development in the Cameroonian environment.
From these analyses, it is clear that Cameroon offers a representative environment for analyzing the cognitive content of information and interactions between individuals in social networks. Before going further in the construction of our reasoning, it is widely accepted that all research must be based on a theoretical foundation, through the works that support the research process. The following section situates the theoretical foundation of this research, based mainly on the works of Shaw (1964) and Ajzen (1991).
3. Literature review and research trends
Theoretical discussions about the study of social networks can be summarized in the analysis of communication networks or networks of groups. The theoretical underpinnings of such an approach date back to the 1950s and 1960s with the work of pioneering authors such as Heyns (1958), Gilchrist (1959), Mulder (1963), Shaw (1964), and many others. The works of these authors concern the networks of groups because at that time the Internet did not exist yet. However, the content of this work can be transposed to the analysis of networks of virtual groups (social networks) by assuming that the behaviors expressed in these networks could have repercussions in real life.
Indeed, Heyns (1958) had already been interested in the relationship between social conduct and personality characteristics. The prediction of social behavior from the personality variables gives rise to important work, but which faces methodological difficulties in relation to the nature of the instruments of measurement of the personality and the insufficient specification of the social context where these behaviors
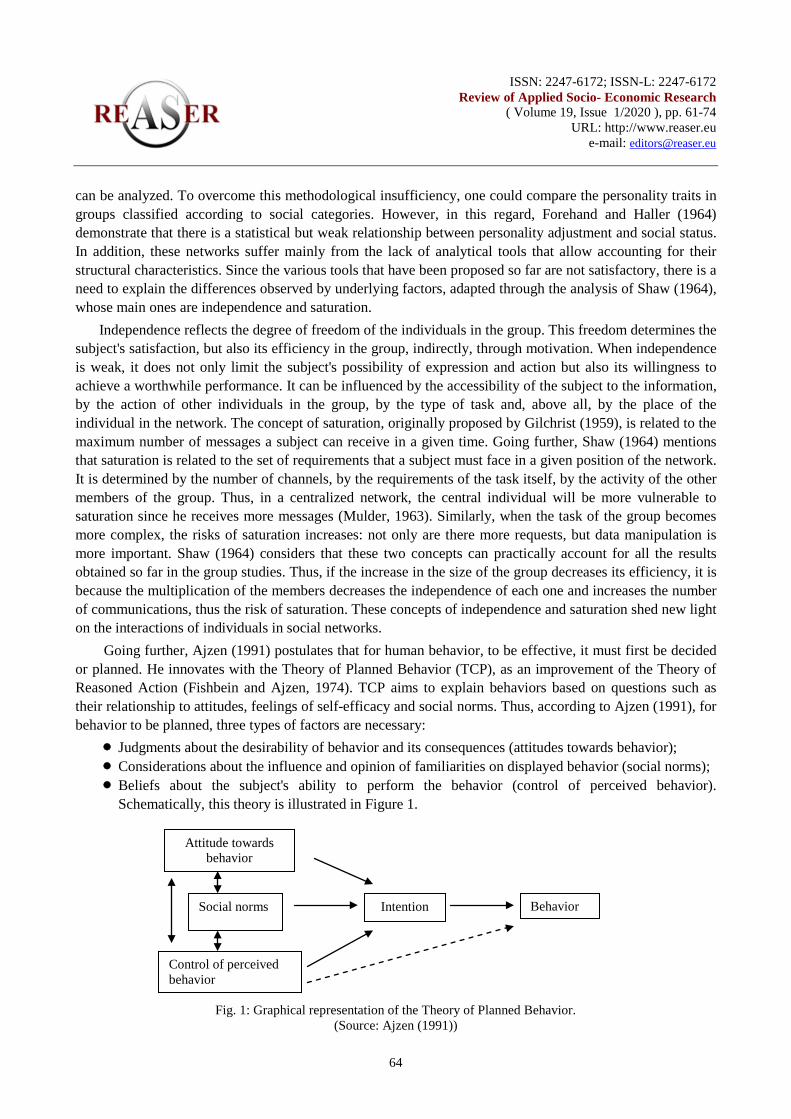
ISSN: 2247-6172; ISSN-L: 2247-6172
Review of Applied Socio- Economic Research ( Volume 19, Issue 1/2020 ), pp. 61-74
URL: http://www.reaser.eu e-mail: [email protected]
64
can be analyzed. To overcome this methodological insufficiency, one could compare the personality traits in groups classified according to social categories. However, in this regard, Forehand and Haller (1964) demonstrate that there is a statistical but weak relationship between personality adjustment and social status. In addition, these networks suffer mainly from the lack of analytical tools that allow accounting for their structural characteristics. Since the various tools that have been proposed so far are not satisfactory, there is a need to explain the differences observed by underlying factors, adapted through the analysis of Shaw (1964), whose main ones are independence and saturation.
Independence reflects the degree of freedom of the individuals in the group. This freedom determines the subject's satisfaction, but also its efficiency in the group, indirectly, through motivation. When independence is weak, it does not only limit the subject's possibility of expression and action but also its willingness to achieve a worthwhile performance. It can be influenced by the accessibility of the subject to the information, by the action of other individuals in the group, by the type of task and, above all, by the place of the individual in the network. The concept of saturation, originally proposed by Gilchrist (1959), is related to the maximum number of messages a subject can receive in a given time. Going further, Shaw (1964) mentions that saturation is related to the set of requirements that a subject must face in a given position of the network. It is determined by the number of channels, by the requirements of the task itself, by the activity of the other members of the group. Thus, in a centralized network, the central individual will be more vulnerable to saturation since he receives more messages (Mulder, 1963). Similarly, when the task of the group becomes more complex, the risks of saturation increases: not only are there more requests, but data manipulation is more important. Shaw (1964) considers that these two concepts can practically account for all the results obtained so far in the group studies. Thus, if the increase in the size of the group decreases its efficiency, it is because the multiplication of the members decreases the independence of each one and increases the number of communications, thus the risk of saturation. These concepts of independence and saturation shed new light on the interactions of individuals in social networks.
Going further, Ajzen (1991) postulates that for human behavior, to be effective, it must first be decided or planned. He innovates with the Theory of Planned Behavior (TCP), as an improvement of the Theory of Reasoned Action (Fishbein and Ajzen, 1974). TCP aims to explain behaviors based on questions such as their relationship to attitudes, feelings of self-efficacy and social norms. Thus, according to Ajzen (1991), for behavior to be planned, three types of factors are necessary:
• Judgments about the desirability of behavior and its consequences (attitudes towards behavior); • Considerations about the influence and opinion of familiarities on displayed behavior (social norms); • Beliefs about the subject's ability to perform the behavior (control of perceived behavior).
Schematically, this theory is illustrated in Figure 1.
Fig. 1: Graphical representation of the Theory of Planned Behavior.
(Source: Ajzen (1991))
Attitude towards behavior
Social norms Intention
Control of perceived behavior
Behavior
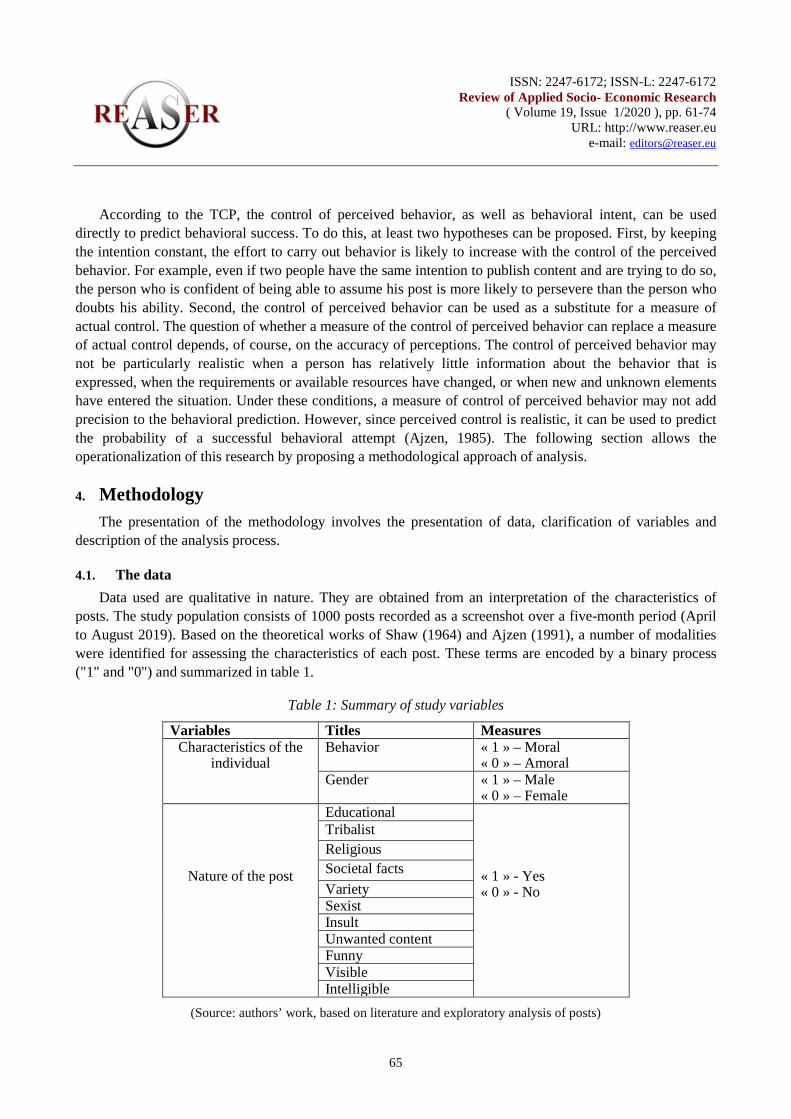
ISSN: 2247-6172; ISSN-L: 2247-6172
Review of Applied Socio- Economic Research ( Volume 19, Issue 1/2020 ), pp. 61-74
URL: http://www.reaser.eu e-mail: [email protected]
65
According to the TCP, the control of perceived behavior, as well as behavioral intent, can be used
directly to predict behavioral success. To do this, at least two hypotheses can be proposed. First, by keeping the intention constant, the effort to carry out behavior is likely to increase with the control of the perceived behavior. For example, even if two people have the same intention to publish content and are trying to do so, the person who is confident of being able to assume his post is more likely to persevere than the person who doubts his ability. Second, the control of perceived behavior can be used as a substitute for a measure of actual control. The question of whether a measure of the control of perceived behavior can replace a measure of actual control depends, of course, on the accuracy of perceptions. The control of perceived behavior may not be particularly realistic when a person has relatively little information about the behavior that is expressed, when the requirements or available resources have changed, or when new and unknown elements have entered the situation. Under these conditions, a measure of control of perceived behavior may not add precision to the behavioral prediction. However, since perceived control is realistic, it can be used to predict the probability of a successful behavioral attempt (Ajzen, 1985). The following section allows the operationalization of this research by proposing a methodological approach of analysis. 4. Methodology
The presentation of the methodology involves the presentation of data, clarification of variables and description of the analysis process.
4.1. The data Data used are qualitative in nature. They are obtained from an interpretation of the characteristics of
posts. The study population consists of 1000 posts recorded as a screenshot over a five-month period (April to August 2019). Based on the theoretical works of Shaw (1964) and Ajzen (1991), a number of modalities were identified for assessing the characteristics of each post. These terms are encoded by a binary process ("1" and "0") and summarized in table 1.
Table 1: Summary of study variables
(Source: authors’ work, based on literature and exploratory analysis of posts)
Variables Titles Measures Characteristics of the
individual Behavior « 1 » – Moral
« 0 » – Amoral Gender « 1 » – Male
« 0 » – Female
Nature of the post
Educational « 1 » - Yes « 0 » - No
Tribalist Religious Societal facts Variety Sexist Insult Unwanted content Funny Visible Intelligible
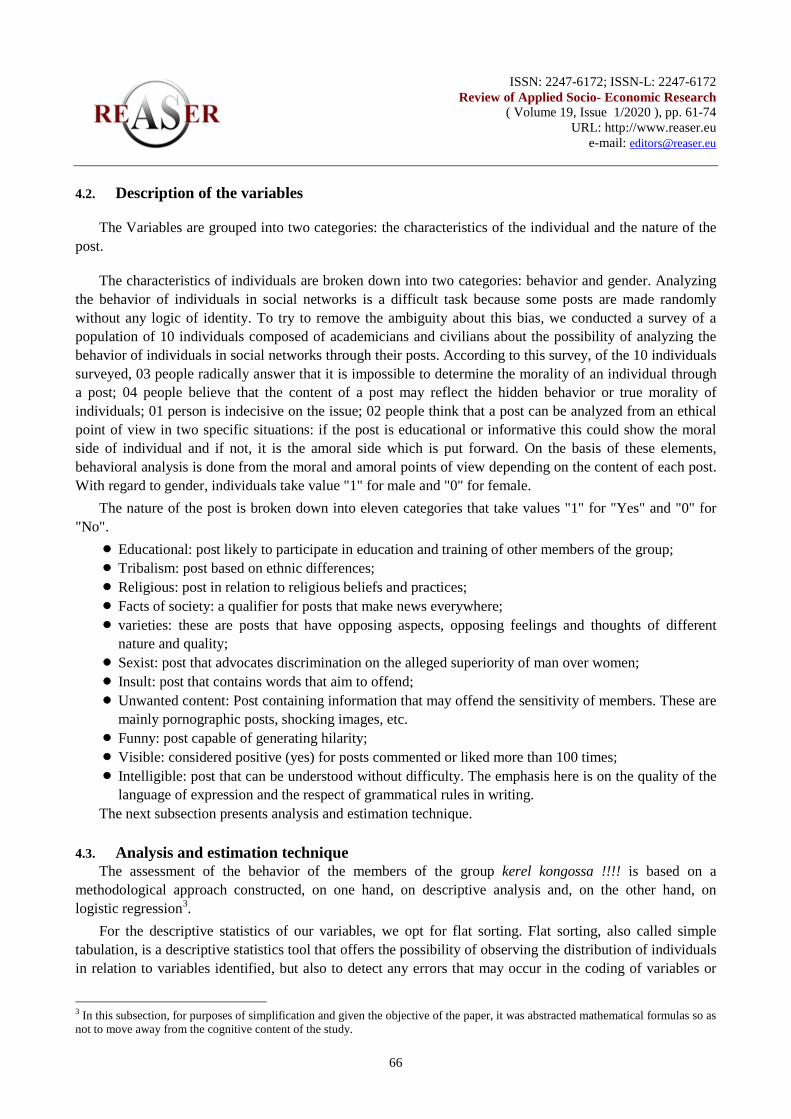
ISSN: 2247-6172; ISSN-L: 2247-6172
Review of Applied Socio- Economic Research ( Volume 19, Issue 1/2020 ), pp. 61-74
URL: http://www.reaser.eu e-mail: [email protected]
66
4.2. Description of the variables
The Variables are grouped into two categories: the characteristics of the individual and the nature of the post.
The characteristics of individuals are broken down into two categories: behavior and gender. Analyzing the behavior of individuals in social networks is a difficult task because some posts are made randomly without any logic of identity. To try to remove the ambiguity about this bias, we conducted a survey of a population of 10 individuals composed of academicians and civilians about the possibility of analyzing the behavior of individuals in social networks through their posts. According to this survey, of the 10 individuals surveyed, 03 people radically answer that it is impossible to determine the morality of an individual through a post; 04 people believe that the content of a post may reflect the hidden behavior or true morality of individuals; 01 person is indecisive on the issue; 02 people think that a post can be analyzed from an ethical point of view in two specific situations: if the post is educational or informative this could show the moral side of individual and if not, it is the amoral side which is put forward. On the basis of these elements, behavioral analysis is done from the moral and amoral points of view depending on the content of each post. With regard to gender, individuals take value "1" for male and "0" for female.
The nature of the post is broken down into eleven categories that take values "1" for "Yes" and "0" for "No".
• Educational: post likely to participate in education and training of other members of the group; • Tribalism: post based on ethnic differences; • Religious: post in relation to religious beliefs and practices; • Facts of society: a qualifier for posts that make news everywhere; • varieties: these are posts that have opposing aspects, opposing feelings and thoughts of different
nature and quality; • Sexist: post that advocates discrimination on the alleged superiority of man over women; • Insult: post that contains words that aim to offend; • Unwanted content: Post containing information that may offend the sensitivity of members. These are
mainly pornographic posts, shocking images, etc. • Funny: post capable of generating hilarity; • Visible: considered positive (yes) for posts commented or liked more than 100 times; • Intelligible: post that can be understood without difficulty. The emphasis here is on the quality of the
language of expression and the respect of grammatical rules in writing. The next subsection presents analysis and estimation technique.
4.3. Analysis and estimation technique
The assessment of the behavior of the members of the group kerel kongossa !!!! is based on a methodological approach constructed, on one hand, on descriptive analysis and, on the other hand, on logistic regression3
For the descriptive statistics of our variables, we opt for flat sorting. Flat sorting, also called simple tabulation, is a descriptive statistics tool that offers the possibility of observing the distribution of individuals in relation to variables identified, but also to detect any errors that may occur in the coding of variables or
.
3 In this subsection, for purposes of simplification and given the objective of the paper, it was abstracted mathematical formulas so as not to move away from the cognitive content of the study.
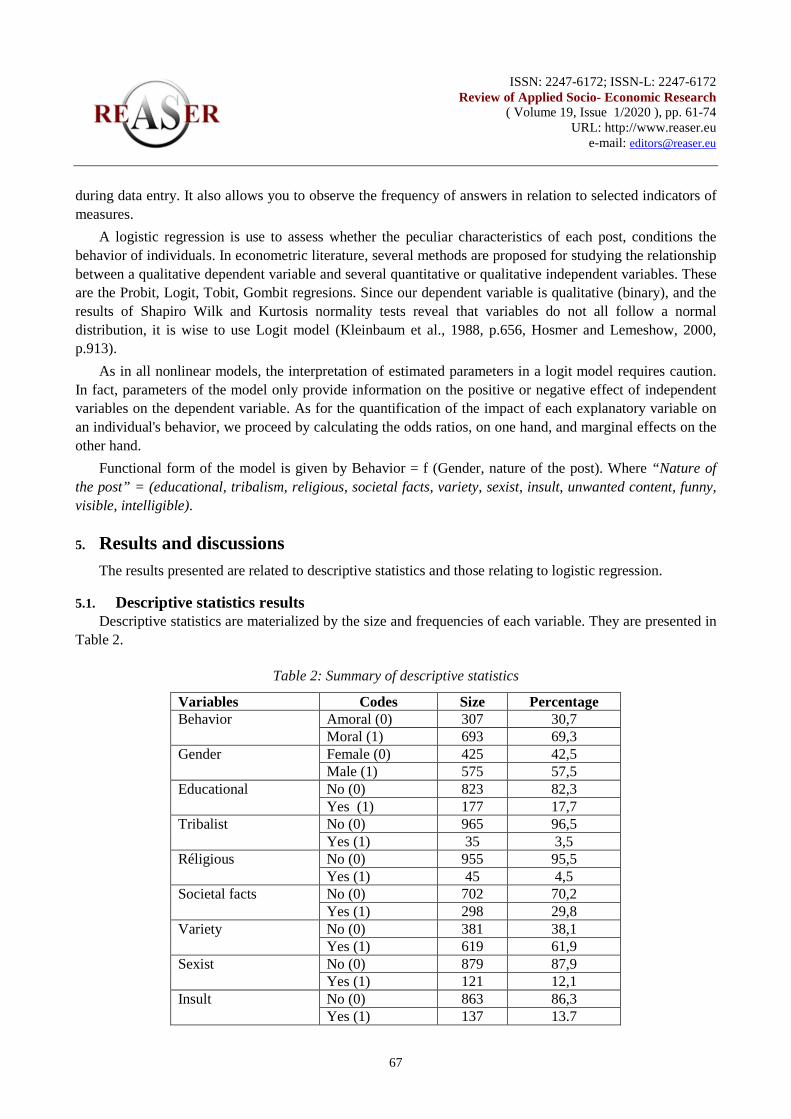
ISSN: 2247-6172; ISSN-L: 2247-6172
Review of Applied Socio- Economic Research ( Volume 19, Issue 1/2020 ), pp. 61-74
URL: http://www.reaser.eu e-mail: [email protected]
67
during data entry. It also allows you to observe the frequency of answers in relation to selected indicators of measures.
A logistic regression is use to assess whether the peculiar characteristics of each post, conditions the behavior of individuals. In econometric literature, several methods are proposed for studying the relationship between a qualitative dependent variable and several quantitative or qualitative independent variables. These are the Probit, Logit, Tobit, Gombit regresions. Since our dependent variable is qualitative (binary), and the results of Shapiro Wilk and Kurtosis normality tests reveal that variables do not all follow a normal distribution, it is wise to use Logit model (Kleinbaum et al., 1988, p.656, Hosmer and Lemeshow, 2000, p.913).
As in all nonlinear models, the interpretation of estimated parameters in a logit model requires caution. In fact, parameters of the model only provide information on the positive or negative effect of independent variables on the dependent variable. As for the quantification of the impact of each explanatory variable on an individual's behavior, we proceed by calculating the odds ratios, on one hand, and marginal effects on the other hand.
Functional form of the model is given by Behavior = f (Gender, nature of the post). Where “Nature of the post” = (educational, tribalism, religious, societal facts, variety, sexist, insult, unwanted content, funny, visible, intelligible). 5. Results and discussions
The results presented are related to descriptive statistics and those relating to logistic regression.
5.1. Descriptive statistics results Descriptive statistics are materialized by the size and frequencies of each variable. They are presented in
Table 2.
Table 2: Summary of descriptive statistics
Variables Codes Size Percentage Behavior Amoral (0) 307 30,7
Moral (1) 693 69,3 Gender Female (0) 425 42,5
Male (1) 575 57,5 Educational No (0) 823 82,3
Yes (1) 177 17,7 Tribalist No (0) 965 96,5
Yes (1) 35 3,5 Réligious No (0) 955 95,5
Yes (1) 45 4,5 Societal facts No (0) 702 70,2
Yes (1) 298 29,8 Variety No (0) 381 38,1
Yes (1) 619 61,9 Sexist No (0) 879 87,9
Yes (1) 121 12,1 Insult No (0) 863 86,3
Yes (1) 137 13.7
ISSN: 2247-6172; ISSN-L: 2247-6172
Review of Applied Socio- Economic Research ( Volume 19, Issue 1/2020 ), pp. 61-74
URL: http://www.reaser.eu e-mail: [email protected]
68
Unwanted content No (0) 789 78.9 Yes (1) 211 21.1
Funny No (0) 663 66.3 Yes (1) 337 33.7
Visible No (0) 434 43.4 Yes (1) 566 56.6
Intelligible No (0) 298 29.8 Yes (1) 702 70.2
(Source: Primary data)
The experimental approach that we conducted on a sample of 1000 posts shows that 69.3% of these refer to moral behavior, against 30.7% for amoral behaviors. That is to say that in the group Kerel Kongossa!!!!, it is the moral character of individuals which is highlighted in their publication. However, this observation must be put into perspective. Indeed, man is a moral being only because he lives in society since morality consists of being in solidarity with a group and varies with this solidarity. Make all social life vanish, and the moral life fainting at the same time, having no object to be taken (Durkheim, 1893).
With regard to gender, the test sample is dominated by men, with 57.5%. Nevertheless, we note a significant and non-negligible place reserved for women (42.5%). This result could be explained by the problem of women's access to ICT (Joueet, 2003). Thus, despite the development of ICT, women are still marginal, especially in rural areas.
Statistics show that very few posts are educational in the group "kerel kongossa!!!!". Only 17.7% of educational posts are observed. This very interesting result is not really surprising; individuals go on social networks, usually for entertainment and passing time. Rarely, it is a question of educating oneself.
There is a latent rise of tribalism in social networks in Cameroon. The posts related to it, certainly, represents only 3,5% but should draw the attention on drifts that it can cause if the phenomenon came to be generalized. This percentage is relatively low because this type of post is removed by the administrators/moderators within minutes to avoid upsetting the sensitivity of the members of the group. Cameroonians live relatively in harmony. But for some time now, ethnic issues have come to the fore. It has become an open war in social networks between "Bamileke4" and "Bulus5
Religious posts are also very rare. They represent only 4.5%. But the peculiarity of these is that they are the most commented (significant visibility), despite their limited number. Societal facts are poorly represented in the test sample with 29.8%.
" under the terms of "sadinards" and "tontinards". The proliferation of this phenomenon challenges us about the risks of transposing this tribal divergence into real life.
A significant portion of posts refers to "Variety" with 61.9%. The varieties generally go in all directions, sometimes in the most unsuspected and surprising fields. Here it can be admired the ingenuity of Cameroonians on subjects as interesting as shameless. This leads most often to sexist conversations (12.1%) specifically relating to discrimination against women; resulting in insults of any kind representing 13.7% of posts. These insults, in connection with the posts tribalism and sexist lead to unwanted content (21.1%) materialized by shocking images, heartbreaking statements, and obscene videos.
As for fun, funny posts are at the rendezvous with 33.7%. Of the 1000 posts recorded, 337 are funny in nature. The majorities of posts are visible and represent 56.6%. This implies that on the sample of 1000, 566 posts have interactivities greater than 100 (comments and likes). The highlight is that 70.2% of posts are 4 Origins of the west region of Cameroon 5 Origins of the South region of Cameroon
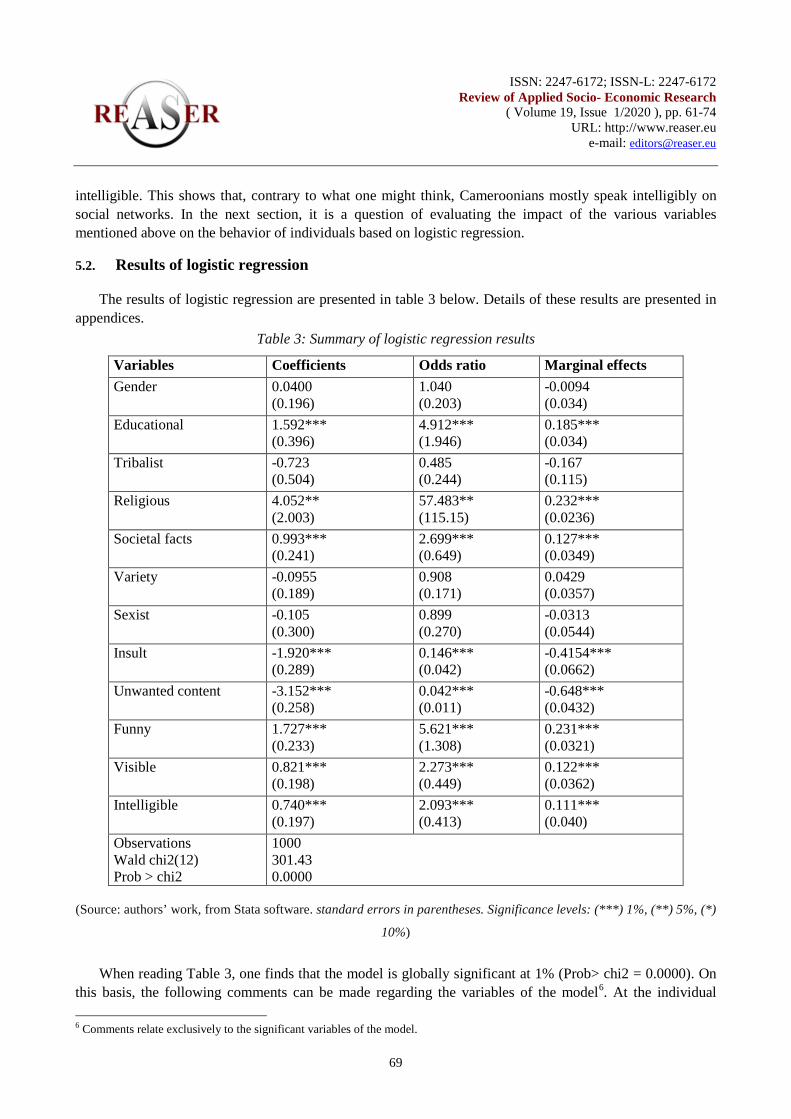
ISSN: 2247-6172; ISSN-L: 2247-6172
Review of Applied Socio- Economic Research ( Volume 19, Issue 1/2020 ), pp. 61-74
URL: http://www.reaser.eu e-mail: [email protected]
69
intelligible. This shows that, contrary to what one might think, Cameroonians mostly speak intelligibly on social networks. In the next section, it is a question of evaluating the impact of the various variables mentioned above on the behavior of individuals based on logistic regression.
5.2. Results of logistic regression
The results of logistic regression are presented in table 3 below. Details of these results are presented in appendices.
Table 3: Summary of logistic regression results
Variables Coefficients Odds ratio Marginal effects Gender 0.0400
(0.196) 1.040 (0.203)
-0.0094 (0.034)
Educational 1.592*** (0.396)
4.912*** (1.946)
0.185*** (0.034)
Tribalist -0.723 (0.504)
0.485 (0.244)
-0.167 (0.115)
Religious 4.052** (2.003)
57.483** (115.15)
0.232*** (0.0236)
Societal facts 0.993*** (0.241)
2.699*** (0.649)
0.127*** (0.0349)
Variety -0.0955 (0.189)
0.908 (0.171)
0.0429 (0.0357)
Sexist -0.105 (0.300)
0.899 (0.270)
-0.0313 (0.0544)
Insult -1.920*** (0.289)
0.146*** (0.042)
-0.4154*** (0.0662)
Unwanted content -3.152*** (0.258)
0.042*** (0.011)
-0.648*** (0.0432)
Funny 1.727*** (0.233)
5.621*** (1.308)
0.231*** (0.0321)
Visible 0.821*** (0.198)
2.273*** (0.449)
0.122*** (0.0362)
Intelligible 0.740*** (0.197)
2.093*** (0.413)
0.111*** (0.040)
Observations Wald chi2(12) Prob > chi2
1000 301.43 0.0000
(Source: authors’ work, from Stata software. standard errors in parentheses. Significance levels: (***) 1%, (**) 5%, (*)
10%)
When reading Table 3, one finds that the model is globally significant at 1% (Prob> chi2 = 0.0000). On this basis, the following comments can be made regarding the variables of the model6
6 Comments relate exclusively to the significant variables of the model.
. At the individual
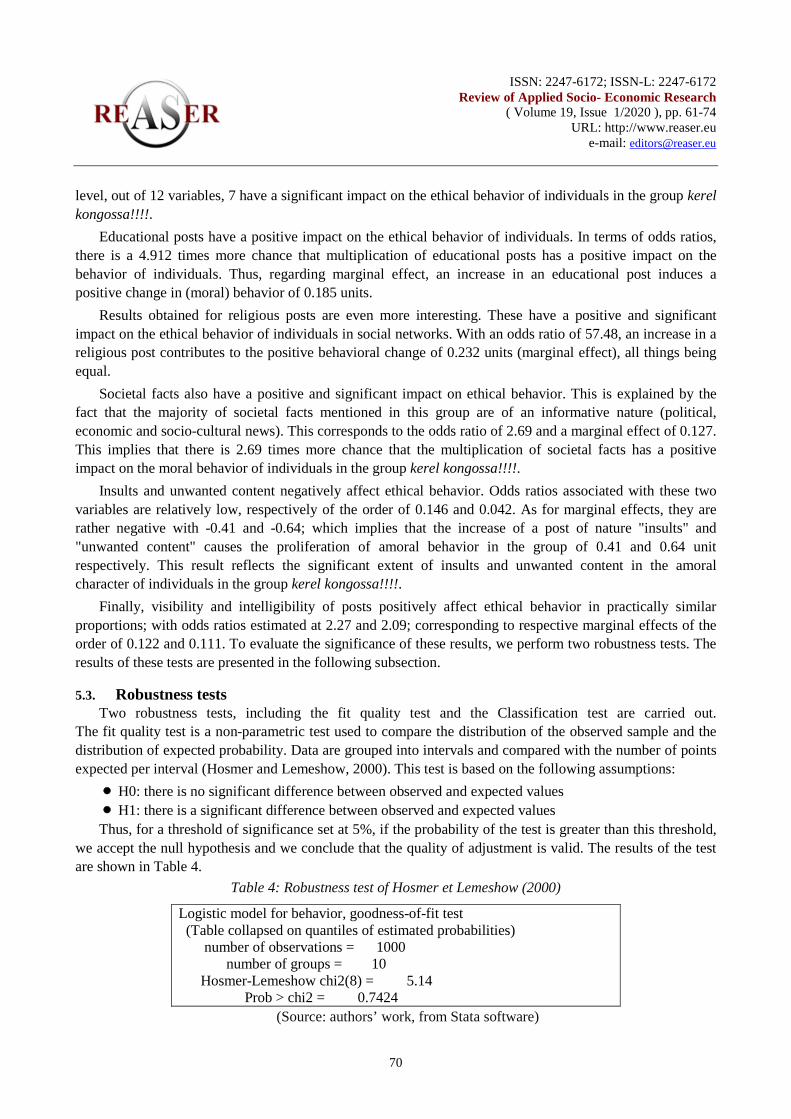
ISSN: 2247-6172; ISSN-L: 2247-6172
Review of Applied Socio- Economic Research ( Volume 19, Issue 1/2020 ), pp. 61-74
URL: http://www.reaser.eu e-mail: [email protected]
70
level, out of 12 variables, 7 have a significant impact on the ethical behavior of individuals in the group kerel kongossa!!!!.
Educational posts have a positive impact on the ethical behavior of individuals. In terms of odds ratios, there is a 4.912 times more chance that multiplication of educational posts has a positive impact on the behavior of individuals. Thus, regarding marginal effect, an increase in an educational post induces a positive change in (moral) behavior of 0.185 units.
Results obtained for religious posts are even more interesting. These have a positive and significant impact on the ethical behavior of individuals in social networks. With an odds ratio of 57.48, an increase in a religious post contributes to the positive behavioral change of 0.232 units (marginal effect), all things being equal.
Societal facts also have a positive and significant impact on ethical behavior. This is explained by the fact that the majority of societal facts mentioned in this group are of an informative nature (political, economic and socio-cultural news). This corresponds to the odds ratio of 2.69 and a marginal effect of 0.127. This implies that there is 2.69 times more chance that the multiplication of societal facts has a positive impact on the moral behavior of individuals in the group kerel kongossa!!!!.
Insults and unwanted content negatively affect ethical behavior. Odds ratios associated with these two variables are relatively low, respectively of the order of 0.146 and 0.042. As for marginal effects, they are rather negative with -0.41 and -0.64; which implies that the increase of a post of nature "insults" and "unwanted content" causes the proliferation of amoral behavior in the group of 0.41 and 0.64 unit respectively. This result reflects the significant extent of insults and unwanted content in the amoral character of individuals in the group kerel kongossa!!!!.
Finally, visibility and intelligibility of posts positively affect ethical behavior in practically similar proportions; with odds ratios estimated at 2.27 and 2.09; corresponding to respective marginal effects of the order of 0.122 and 0.111. To evaluate the significance of these results, we perform two robustness tests. The results of these tests are presented in the following subsection.
5.3. Robustness tests Two robustness tests, including the fit quality test and the Classification test are carried out.
The fit quality test is a non-parametric test used to compare the distribution of the observed sample and the distribution of expected probability. Data are grouped into intervals and compared with the number of points expected per interval (Hosmer and Lemeshow, 2000). This test is based on the following assumptions:
• H0: there is no significant difference between observed and expected values • H1: there is a significant difference between observed and expected values
Thus, for a threshold of significance set at 5%, if the probability of the test is greater than this threshold, we accept the null hypothesis and we conclude that the quality of adjustment is valid. The results of the test are shown in Table 4.
Table 4: Robustness test of Hosmer et Lemeshow (2000)
Logistic model for behavior, goodness-of-fit test (Table collapsed on quantiles of estimated probabilities) number of observations = 1000 number of groups = 10 Hosmer-Lemeshow chi2(8) = 5.14 Prob > chi2 = 0.7424
(Source: authors’ work, from Stata software)
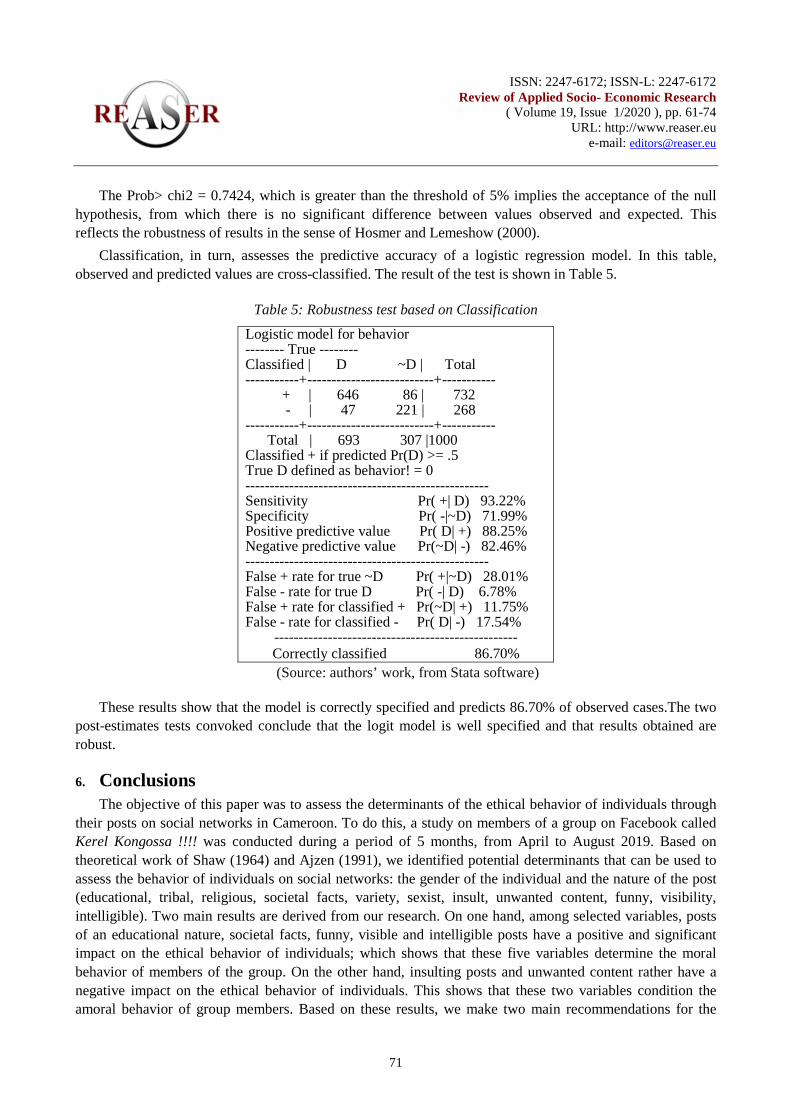
ISSN: 2247-6172; ISSN-L: 2247-6172
Review of Applied Socio- Economic Research ( Volume 19, Issue 1/2020 ), pp. 61-74
URL: http://www.reaser.eu e-mail: [email protected]
71
The Prob> chi2 = 0.7424, which is greater than the threshold of 5% implies the acceptance of the null hypothesis, from which there is no significant difference between values observed and expected. This reflects the robustness of results in the sense of Hosmer and Lemeshow (2000).
Classification, in turn, assesses the predictive accuracy of a logistic regression model. In this table, observed and predicted values are cross-classified. The result of the test is shown in Table 5.
Table 5: Robustness test based on Classification
Logistic model for behavior -------- True -------- Classified | D ~D | Total -----------+--------------------------+----------- + | 646 86 | 732 - | 47 221 | 268 -----------+--------------------------+----------- Total | 693 307 |1000 Classified + if predicted Pr(D) >= .5 True D defined as behavior! = 0 -------------------------------------------------- Sensitivity Pr( +| D) 93.22% Specificity Pr( -|~D) 71.99% Positive predictive value Pr( D| +) 88.25% Negative predictive value Pr(~D| -) 82.46% -------------------------------------------------- False + rate for true ~D Pr( +|~D) 28.01% False - rate for true D Pr( -| D) 6.78% False + rate for classified + Pr(~D| +) 11.75% False - rate for classified - Pr( D| -) 17.54%
-------------------------------------------------- Correctly classified 86.70% (Source: authors’ work, from Stata software)
These results show that the model is correctly specified and predicts 86.70% of observed cases.The two post-estimates tests convoked conclude that the logit model is well specified and that results obtained are robust.
6. Conclusions
The objective of this paper was to assess the determinants of the ethical behavior of individuals through their posts on social networks in Cameroon. To do this, a study on members of a group on Facebook called Kerel Kongossa !!!! was conducted during a period of 5 months, from April to August 2019. Based on theoretical work of Shaw (1964) and Ajzen (1991), we identified potential determinants that can be used to assess the behavior of individuals on social networks: the gender of the individual and the nature of the post (educational, tribal, religious, societal facts, variety, sexist, insult, unwanted content, funny, visibility, intelligible). Two main results are derived from our research. On one hand, among selected variables, posts of an educational nature, societal facts, funny, visible and intelligible posts have a positive and significant impact on the ethical behavior of individuals; which shows that these five variables determine the moral behavior of members of the group. On the other hand, insulting posts and unwanted content rather have a negative impact on the ethical behavior of individuals. This shows that these two variables condition the amoral behavior of group members. Based on these results, we make two main recommendations for the
ISSN: 2247-6172; ISSN-L: 2247-6172
Review of Applied Socio- Economic Research ( Volume 19, Issue 1/2020 ), pp. 61-74
URL: http://www.reaser.eu e-mail: [email protected]
72
administrators and moderators of this group. The first is the meticulous examination of applications for membership to the group to detect false profiles that are most often than not, vectors of deviant behavior. In the second place, and this in relation to the number of members and the frequency of interactivity in the group, it becomes urgent to increase the number of administrator/moderator to coordinate interactions in the group. There is also the need to redefine the objectives of the group focusing on factors that promote moral behaviors and further educating members on this.
Limits of research This research was however carried out with some limits. These include the problem of identification.
Indeed, it is difficult to have accurate information about individuals through their profiles on social networks because some are false profiles. There is also a proliferation of identity theft, which could cause considerable bias in the process of data collection and analysis. However, these limits do not compromise the relevance of results obtained in this paper because of the number of posts studied, the process of treating information that comes from these posts and the estimation method used.
7. References [1] Ajzen, Icek. 1985. “From intentions to actions: A theory of planned behavior”, In J. Kuhi &J.Beckmann (dir.),
Action—control: From cognition to behavior, pp.11-39.
[2] Ajzen, Icek. 1991. “The Theory of Planned Behavior”, Organizational behavior and human decision processes, n°50, pp.179-211.
[3] Durkheim, Emile. 1893.De la division du travail social, Presse Universitaire de France, Paris, réimpression Paris, Felix Alcan, 416p.
[4] Fayon, David. 2008. Web 2.0 et au-delà, nouveaux internautes : du surfeur à l‘acteur, Economia, 204p.
[5] Fishbein, Martin and Ajzen Icek. 1974. “Attitudes toward objects as predictors of single and multiple behavioral Criteria’, Psychological Review, n°81, pp.59-74.
[6] Forehand, Garlie and Haller Gilmer. 1964. “Environmental variation in studies of organizational behavior”, Psychological Bulletin 62(6), pp.361-382.
[7] Gilchrist J C. 1959. “Social psychology and group processes”, Annual Review of Psychology 10, pp.233-264.
[8] Heyns R. 1958. “Social psychology and group processes”, Annual Review of Psychology 9, pp.419-452.
[9] Hosmer, David and Lemeshow Stanley. 2000. Applied logistic regression, Wiley Series in Probability and Mathematical Statistics, 397p.
[10] Jodelet Denise, Viet Jean and Besnard Philippe. 1970. La psychologie sociale, une discipline en mouvement, préface de Serge Moscovici, Paris - La Haye, 470p.
[11] Joueet Josiane. 2003. “Technologies de communication et genre”, Réseaux, n°120, pp. 53-86.
[12] Kleinbaum David, Kupper Lawrence, MulleR Keith and Azhar Nizam. 1988. Applied regression analysis and other multivariate methods, PWS-KENT Publishing Company, Boston, 787p.
[13] Le Breton Marine. 2016.Réseaux sociaux : 5 manières dont ils influencent nos comportements, consulté le 10 février 2019, https://www.huffingtonpost.fr/2014/04/10/reseaux-sociaux-influencecomportement_n_5123479.html
[14] Magdalena, Grebosz and Jacek Otto. 2013. “L’impact des réseaux sociaux sur le comportement des jeunes consommateurs”, Studia Ekonomiczne, vol 151, pp.47-56.
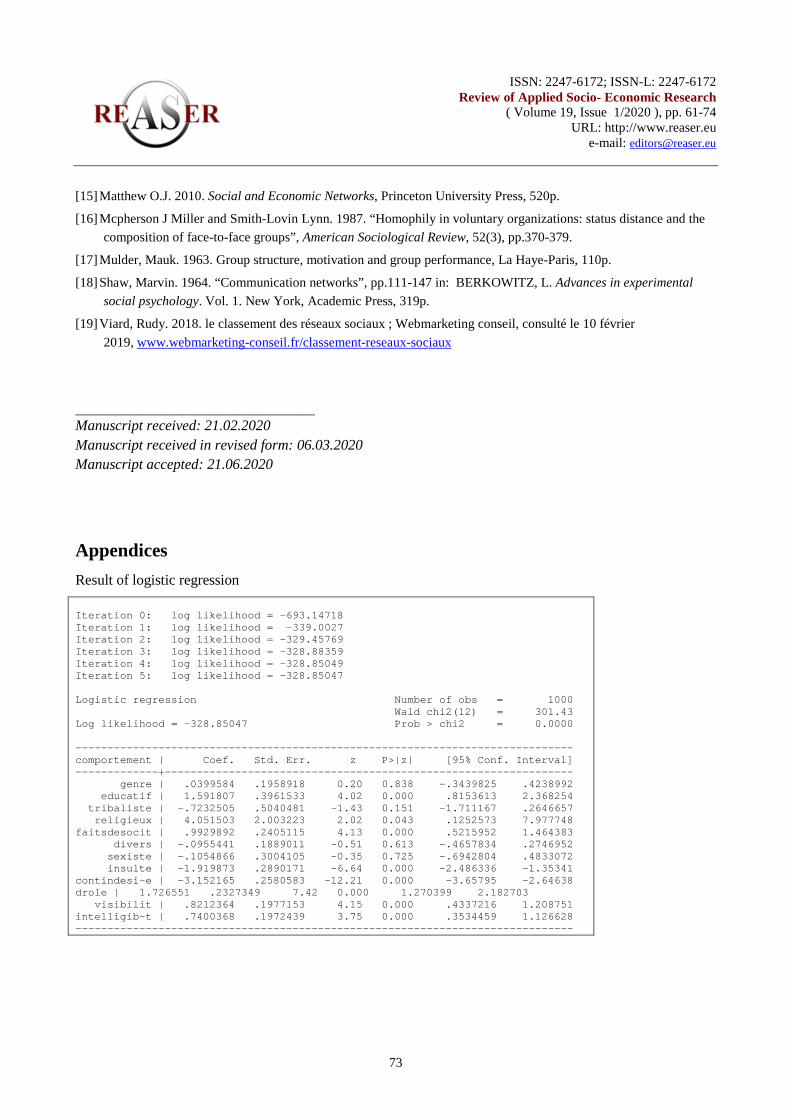
ISSN: 2247-6172; ISSN-L: 2247-6172
Review of Applied Socio- Economic Research ( Volume 19, Issue 1/2020 ), pp. 61-74
URL: http://www.reaser.eu e-mail: [email protected]
73
[15] Matthew O.J. 2010. Social and Economic Networks, Princeton University Press, 520p.
[16] Mcpherson J Miller and Smith-Lovin Lynn. 1987. “Homophily in voluntary organizations: status distance and the composition of face-to-face groups”, American Sociological Review, 52(3), pp.370-379.
[17] Mulder, Mauk. 1963. Group structure, motivation and group performance, La Haye-Paris, 110p.
[18] Shaw, Marvin. 1964. “Communication networks”, pp.111-147 in: BERKOWITZ, L. Advances in experimental social psychology. Vol. 1. New York, Academic Press, 319p.
[19] Viard, Rudy. 2018. le classement des réseaux sociaux ; Webmarketing conseil, consulté le 10 février 2019, www.webmarketing-conseil.fr/classement-reseaux-sociaux
____________________________________ Manuscript received: 21.02.2020 Manuscript received in revised form: 06.03.2020 Manuscript accepted: 21.06.2020
Appendices Result of logistic regression Iteration 0: log likelihood = -693.14718 Iteration 1: log likelihood = -339.0027 Iteration 2: log likelihood = -329.45769 Iteration 3: log likelihood = -328.88359 Iteration 4: log likelihood = -328.85049 Iteration 5: log likelihood = -328.85047 Logistic regression Number of obs = 1000 Wald chi2(12) = 301.43 Log likelihood = -328.85047 Prob > chi2 = 0.0000 ------------------------------------------------------------------------------ comportement | Coef. Std. Err. z P>|z| [95% Conf. Interval] -------------+---------------------------------------------------------------- genre | .0399584 .1958918 0.20 0.838 -.3439825 .4238992 educatif | 1.591807 .3961533 4.02 0.000 .8153613 2.368254 tribaliste | -.7232505 .5040481 -1.43 0.151 -1.711167 .2646657 religieux | 4.051503 2.003223 2.02 0.043 .1252573 7.977748 faitsdesocit | .9929892 .2405115 4.13 0.000 .5215952 1.464383 divers | -.0955441 .1889011 -0.51 0.613 -.4657834 .2746952 sexiste | -.1054866 .3004105 -0.35 0.725 -.6942804 .4833072 insulte | -1.919873 .2890171 -6.64 0.000 -2.486336 -1.35341 contindesi~e | -3.152165 .2580583 -12.21 0.000 -3.65795 -2.64638 drole | 1.726551 .2327349 7.42 0.000 1.270399 2.182703 visibilit | .8212364 .1977153 4.15 0.000 .4337216 1.208751 intelligib~t | .7400368 .1972439 3.75 0.000 .3534459 1.126628 ------------------------------------------------------------------------------
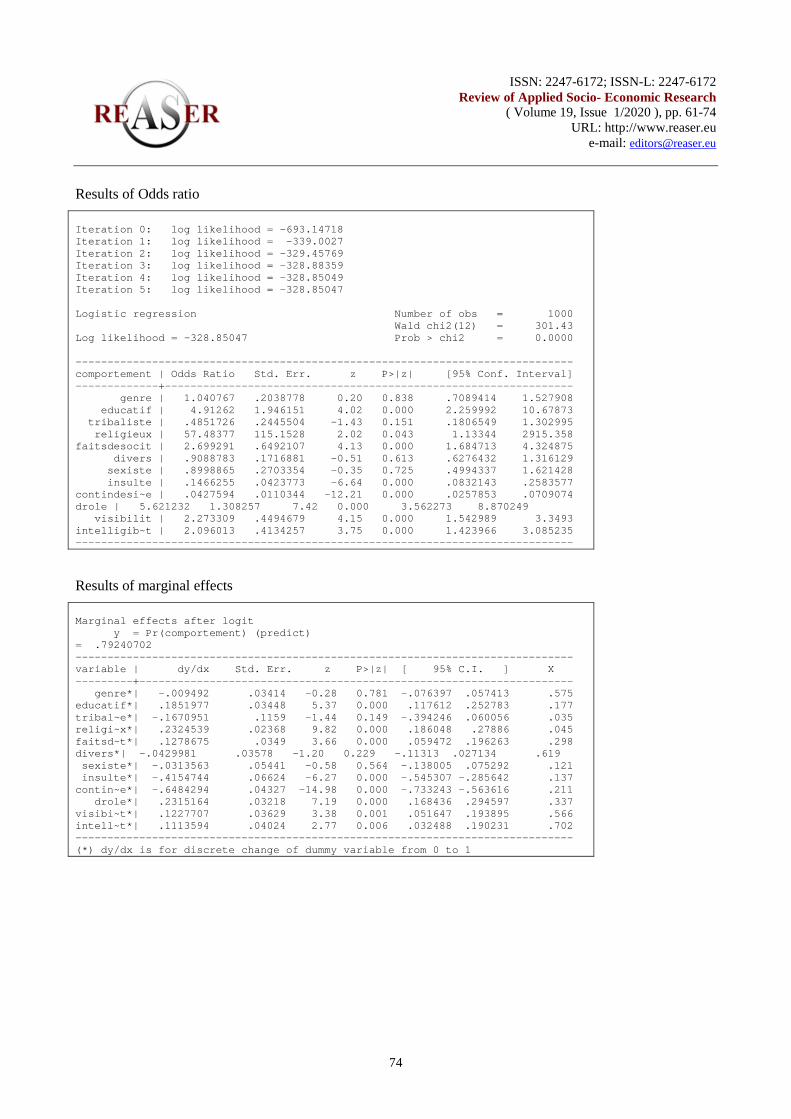
ISSN: 2247-6172; ISSN-L: 2247-6172
Review of Applied Socio- Economic Research ( Volume 19, Issue 1/2020 ), pp. 61-74
URL: http://www.reaser.eu e-mail: [email protected]
74
Results of Odds ratio Iteration 0: log likelihood = -693.14718 Iteration 1: log likelihood = -339.0027 Iteration 2: log likelihood = -329.45769 Iteration 3: log likelihood = -328.88359 Iteration 4: log likelihood = -328.85049 Iteration 5: log likelihood = -328.85047 Logistic regression Number of obs = 1000 Wald chi2(12) = 301.43 Log likelihood = -328.85047 Prob > chi2 = 0.0000 ------------------------------------------------------------------------------ comportement | Odds Ratio Std. Err. z P>|z| [95% Conf. Interval] -------------+---------------------------------------------------------------- genre | 1.040767 .2038778 0.20 0.838 .7089414 1.527908 educatif | 4.91262 1.946151 4.02 0.000 2.259992 10.67873 tribaliste | .4851726 .2445504 -1.43 0.151 .1806549 1.302995 religieux | 57.48377 115.1528 2.02 0.043 1.13344 2915.358 faitsdesocit | 2.699291 .6492107 4.13 0.000 1.684713 4.324875 divers | .9088783 .1716881 -0.51 0.613 .6276432 1.316129 sexiste | .8998865 .2703354 -0.35 0.725 .4994337 1.621428 insulte | .1466255 .0423773 -6.64 0.000 .0832143 .2583577 contindesi~e | .0427594 .0110344 -12.21 0.000 .0257853 .0709074 drole | 5.621232 1.308257 7.42 0.000 3.562273 8.870249 visibilit | 2.273309 .4494679 4.15 0.000 1.542989 3.3493 intelligib~t | 2.096013 .4134257 3.75 0.000 1.423966 3.085235 ------------------------------------------------------------------------------
Results of marginal effects Marginal effects after logit y = Pr(comportement) (predict) = .79240702 ------------------------------------------------------------------------------ variable | dy/dx Std. Err. z P>|z| [ 95% C.I. ] X ---------+-------------------------------------------------------------------- genre*| -.009492 .03414 -0.28 0.781 -.076397 .057413 .575 educatif*| .1851977 .03448 5.37 0.000 .117612 .252783 .177 tribal~e*| -.1670951 .1159 -1.44 0.149 -.394246 .060056 .035 religi~x*| .2324539 .02368 9.82 0.000 .186048 .27886 .045 faitsd~t*| .1278675 .0349 3.66 0.000 .059472 .196263 .298 divers*| -.0429981 .03578 -1.20 0.229 -.11313 .027134 .619 sexiste*| -.0313563 .05441 -0.58 0.564 -.138005 .075292 .121 insulte*| -.4154744 .06624 -6.27 0.000 -.545307 -.285642 .137 contin~e*| -.6484294 .04327 -14.98 0.000 -.733243 -.563616 .211 drole*| .2315164 .03218 7.19 0.000 .168436 .294597 .337 visibi~t*| .1227707 .03629 3.38 0.001 .051647 .193895 .566 intell~t*| .1113594 .04024 2.77 0.006 .032488 .190231 .702 ------------------------------------------------------------------------------ (*) dy/dx is for discrete change of dummy variable from 0 to 1
ISSN:2247-6172; ISSN-L:2247-6172
Review of Applied Socio- Economic Research (Volume 19, Issue 1/2020 ), pp. 75-84
URL: http://www.reaser.eu e-mail: [email protected]
75
Investigating the Mediating Role of Organization’s Sustainability in The Relationship between Using Greening Technology Information Tools and Organization’s General Performance: A Field Study on A
Group of Jordanian Business Organization
Mahmood B Ridha 1, 0F
+ Abdel-Rahman Ismail 2 and Abdul Sattar H Yousif 3 1 Associate Professor, Department of Business Administration, Faculty of Business
Al-Zaytoonah University of Jordan, Jordan 2 Assistant Professor, Department of Management Information Systems, Faculty of Economics and
Administrative Sciences Zarqa University, Jordan
3 Part-time Instructor, Department of Business Administration, Faculty of Business, Al-Zaytoonah University of Jordan, Jordan
Abstract. This study aims at investigating, the mediating role of business organization sustainability in the relationship and impact of the use of IT Tools on Organizational performance. A selective sample of 110 managers from 30 Jordanian business organizations were the participants of this study. Four parts, 22 statements questionnaire was used to gather the required data. The statistical testing and analysis results of the collected data have indicated that there is a strong positive and statistically significant relationship between the use of IT tools and organization performance. Its tool utilization also has a strong positive impact on organizational performance. The mediating role of organization sustainability was positive in terms of the relationship and impact of using IT tools and business organization performance. The results of this study were consistent with many other previous studies.
Keywords: Green Technology; IT tools, Corporate Sustainability; Information Technology (IT); Cloud Computing and organization performance
JEL, Codes: M1, M15, M19
1. Introduction Information Technology (IT) has become a very reliable strategic business partner that facilitates the
accomplishment of organizational strategic goals such as operational excellence, efficient decision-making processes, and competitiveness to maintain organizational survival [l], [2], [3]. Organizations nowadays are under social and governmental pressures to implement all possible means and methods to be able to carry out their ethical, social, and environmental responsibilities. Therefore, this situation has led to the appearance of the corporate citizenship concept. (it is also known as corporate sustainability) [4]. Organizational leaders, today, are more emphasizing than before to pursue their plans to transform their organizations to be sustainable [5]. Large multinational organizations such as; Coca-Cola, Wal-Mart, and Nestle, have urged their suppliers to implement sustainability practices in their operations. Therefore, for the majority of
+ Corresponding author. Tel.: + (962-777-476064), E-mail address: [email protected]
ISSN:2247-6172; ISSN-L:2247-6172
Review of Applied Socio- Economic Research (Volume 19, Issue 1/2020 ), pp. 75-84
URL: http://www.reaser.eu e-mail: [email protected]
76
business organizations consider corporate sustainability as a key strategic organizational practice that must be implemented to become a socially responsible organization. Corporate sustainability initiatives and its reporting is no longer a troublesome task for corporate leaders, but it has become a continuous practice as a part of the normal daily business operations [6]. It might be relevant to mention that advances in technologies and telecommunications have generated a new set of global challenges in the early twenty-first century. A survey conducted by CIO magazine in 2008 on 280 IT executives, has indicated that they are moving towards adopting the “greening” policy in their IT operations. According to that survey, executives have emphasized that two principal reasons are behind their adoption of such practices which are: cost-cutting by utilizing the energy consumption and to be more socially responsible. Grant conducted a survey of more than 500 business executives, has found that all of the business executives surveyed have agreed that maintaining an organization’s sustainability will certainly positively impact the organization’s reputation, its ability to meet its strategic goals, and its profitability. The survey also indicated that 77% of the executives surveyed believe that their organizations’ sustainability initiatives will have a significant impact on their business strategies for years to come. The role of IT in facilitating organizations' achievement of corporate sustainability has been investigated and researched during recent years. However, the amount of research, that has been allocated to determine which specific IT tool and technology is more effective to assist an organization to become sustainable, was very little. Nevertheless, the role of IT in assisting organizations in meeting their sustainability objectives has been effective in enhancing the organization’s capabilities to improve its economic and its environmental performance [7]. Furthermore, IT was also considered as an enabler of ecological competence according to its role in sustainable activities such as efficient energy consumption, efficient logistics, and transportation [8]. Based on what previously stated, the goal of this study is considering some specific “greening” IT tools and technologies, to measure their efficiency in adopting a successful sustainable policy.
2. Literature Review
2.1. Organizational Performance Measurement A performance indicator or key performance indicator (KPI) is a measure of a business organization's
general performance. KPIs usually, assess the actual achievement (i.e. success or failure) of a business organization or any other kind of activities, such as, tasks, functions, products, projects, and programs, in which this organization is engaged [9], [10], [11].
Performance measures could be classified into two basic kinds: those correlated with final results (i.e. the outputs or outcomes, such as competitiveness or financial performance and multiple expansion) and those addressed the determinants of the final results (i.e. the inputs such as quality, flexibility, resource utilization, and innovation). A performance measure is a quantified description of assigned work and the actual outcome of that work. The major base for organizational Performance measurements is data, where its analysis would tell the real story about whether a work, activity or effort have achieved its objectives and if significant progress is made to attain the organizational goals [9], [12], [13], [14].
2.2 Sustainability concept The concept of Corporate Sustainability (CS) which is also referred to as Corporate Social
Responsibility (CSR) is not a new concept in the business field literature. According to Marrewijk and Were

ISSN:2247-6172; ISSN-L:2247-6172
Review of Applied Socio- Economic Research (Volume 19, Issue 1/2020 ), pp. 75-84
URL: http://www.reaser.eu e-mail: [email protected]
77
[15], the corporate sustainability denotes to a deliberate organizational undertaking, which is often voluntary, that focus on the level of realization of the societal and ecological apprehensions of the organizational processes and transactions [16]. The Green IT and Green Computing are both referred to as the utilization of IT resources and tools in an ecologically sustainable way, which will encourage and assist an organization to become socially responsible. The IT research that addressing the impact of Green Computing on business sustainability has been directed towards how to make IT and its tools more energy-efficient and more environmentally protecting. Meanwhile, no much research has been devoted to the practices that organizations must undertake to utilize IT as an enabler for business sustainability. Murugesan [17] has stated that green computing should focus on the practices of developing, engineering, utilizing, and adopting relevant IT hardware such as computers, monitors, and storage devices competently and responsibly that will not negatively impact the environment. In other words, the question which needs to be asked is: Should “Green IT” be manufactured or it should be utilized in a “Green” manner to accomplish business sustainability? In this context, green IT is seen as being the responsibility of the IT-related tools and equipment manufacturers as well as the end-users (the organizations) for such tools and equipment. According to Molla et al. [18], the role of IT in smoothing out organizations' efforts to meet their sustainability aims can be approached based on a standpoint that IT plays an important role in decreasing the negative environmental impacts of the organization’s computing infrastructure. Brooks et al. [19] have proclaimed that the utilization of such infrastructure needs conducting changes to the way that an organization running its daily business to ensure an improvement of energy consumption; which will eliminate the negative environmental impacts of the organization’s computing infrastructure. Based on reviewing the related literature, several green IT tools and practices can be identified. Those tools & practices are, widely, considered as of major positive impact in assisting organizations to become sustainable. The above-mentioned greening IT tools and practices can be summarized as follows:
2.3 Collaboration tools (CT) Collaboration tools are used to boost team productivity and competence while providing the means for
an organized and effective project management operation. However, this study has adopted a subset of what has been considered as collaboration tools and software that could have a positive impact on organizational sustainability. This subset includes remote and online collaboration tools and software such as Skype, Zoom, Slack, etc. [20].
A- Cloud computing for power management and resource optimization (CCPM)
Cloud computing (CC) has been known for its positive impact on organizational sustainability through
the reduction of excessive electric energy consumption, which is usually, related to the traditional data centers [21]. The increasing demand for cloud computing services led to the prediction that cloud computing providers might need to add many kinds of new servers to be able to handle such expected demand changes which will most likely cause an increase in the carbon footprint [22]. Therefore, a more sustainable cloud computing power management will decrease energy consumption; therefore, reducing through the utilization of solar renewable energy and making use of the excessive heat generated by the cloud computing servers [23].
ISSN:2247-6172; ISSN-L:2247-6172
Review of Applied Socio- Economic Research (Volume 19, Issue 1/2020 ), pp. 75-84
URL: http://www.reaser.eu e-mail: [email protected]
78
B-Automation of workstation shutdown when not in use (AWS) Business organizations are one of the major users for many kinds of electric devices especially PCs and
monitors that are known by their excessive consumption of energy. Moorefield [24] stated that PCs and monitors account for 66% of the total energy consumed by office devices. The utilization of technologies that automatically shut down PCs and monitors when they are out of use for any reason (ie. during breaks, holidays, employee vacation, and a slowdown of business operations) will certainly aid the organization to highly reduce its consumption of energy. C-Workflow technologies (WT)
Workflow technologies help organizations in leveraging their product management efforts by providing relevant means for coordinated, collaborative, and integrated processes. Workflow management relies on a workflow engine that helps in generating and adjusting different tasks that must be performed to complete these processes efficiently. This will eliminate any duplication of the processes and reduce overhead. The workflow engine also provides the ability to automate these tasks and processes which will eliminate paperwork and human efforts required for completing these tasks and processes [25]. D-Virtual Networking (VN)
A virtual network is not a machine that acts as a server on a network, but it is a specialized software that is developed and to act as a physical server providing highly efficient networking services. Virtual networking smooths out the creation of data centers that provide an appropriate and resourceful networking platform through the utilization of software instead of physical hardware and servers. Such virtualization of data centers reduces organizational overhead and the energy consumption level to run such data centers [26]. E-Virtual Private Networks (VPN)
Virtual Private Networks (VPNs) help organizations to ensure private connections (using encrypted connections) with their employees using local public networking infrastructure. The use of VPNs is the base for the deployment of what so-called “work at home” concept. VPNs make it possible for employees to connect remotely with their organization’s network infrastructure and perform their assigned tasks as if they were physically present in their job posts. VPNs, also, help boost employee productivity and efficiency, and it eliminates the need for physical attendance of an employee at the workplace; which will reduce traffic congestion, transportation cost, and fuel consumption [27]. F-Electronic Mail (Email) (EM)
Pitney Bowes [28] has estimated that 19% of the “world’s total annual wood harvest is used to produce approximately 355 million tons of paper and paperboard products.” One of the major benefits of email service is the drastic reduction of paper consumption that led to the reduction of the negative impact caused by deforestation. The use of email service has significantly reduced the amounts of waste produced by using the traditional mail system. Charlton [29] has suggested that the utilization of email as marketing means has accounted for about 23% of business organizations' total sales compared to 18% in 2013. G-Video Conferencing (VC)
Video conferencing is an effective means for business organizations to successfully implement their economic sustainability initiatives and achieve adopted corporate social responsibility objectives. Utilizing video conferencing technologies can help business organizations to reduce employee travel expenses and the
ISSN:2247-6172; ISSN-L:2247-6172
Review of Applied Socio- Economic Research (Volume 19, Issue 1/2020 ), pp. 75-84
URL: http://www.reaser.eu e-mail: [email protected]
79
associated costs considerably. According to Lee [30], the utilization of video conferencing technologies can be an energy-efficient alternative for business organizations which can drastically decrease the level of carbon emissions created by business travel.
Advanced technology and IT have eased the implementation of the sustainable strategy by business organizations. Yes, using high-technology is costly for small and medium sizes companies but, it is not so, for big organizations that have to be pioneers in this context. Sustainability policies and, efforts adopted by business organizations have become a very critical social need because it is been considered as an effective mean for protecting our environment from pollution and securing human life.
3. Methodology This study concentrates on the re-engineering of the business organization’s process as a necessity to
maintain business efficiency and consolidate competitive advantage. It seeks to examine the relationship between the business’s process re-engineering dimensions (BPRD) and employee’s performance at a group of Jordanian public shareholding companies.
3.1. Variables of the study The main variables of this study are the following:
• The Independent Variable is “the use of IT technology tools “ • The Dependent variable is “organization general performance”. • The Mediator Variable is “business organization sustainability”.
3.2. Study Hypotheses The main hypotheses of this study were formulated as follow:
Based on previous studies and literature review and specified variables of the study, the main hypotheses were formulated as follows: • First hypothesis -There is a statistically positive significant relationship between the use of IT technology
tools and business organization general performance. • Second hypothesis -The use of IT technology tools has an appositive significant effect on business
organization general performance. • Third hypothesis -Business organization sustainability has a positively significant role in enhancing both
the relationship and impact of the use of IT technology on business organization general performance.
3.3. Participants The participants of this study were all managers at the 30 Jordanian companies under study. The
researchers have made several visits to the headquarters of these companies to get the official permission for conducting the study and ensuring the managers' participation in the study. A selective sampling was used as 102 managers were chosen as a study sample. To gather the required data a four parts questionnaire was designed, reviewed, evaluated, refereed, modified, and finalized .102 questionnaires were distributed 74 were completed and returned (i.e. the return percentage was 72.5%), which were used for the intended
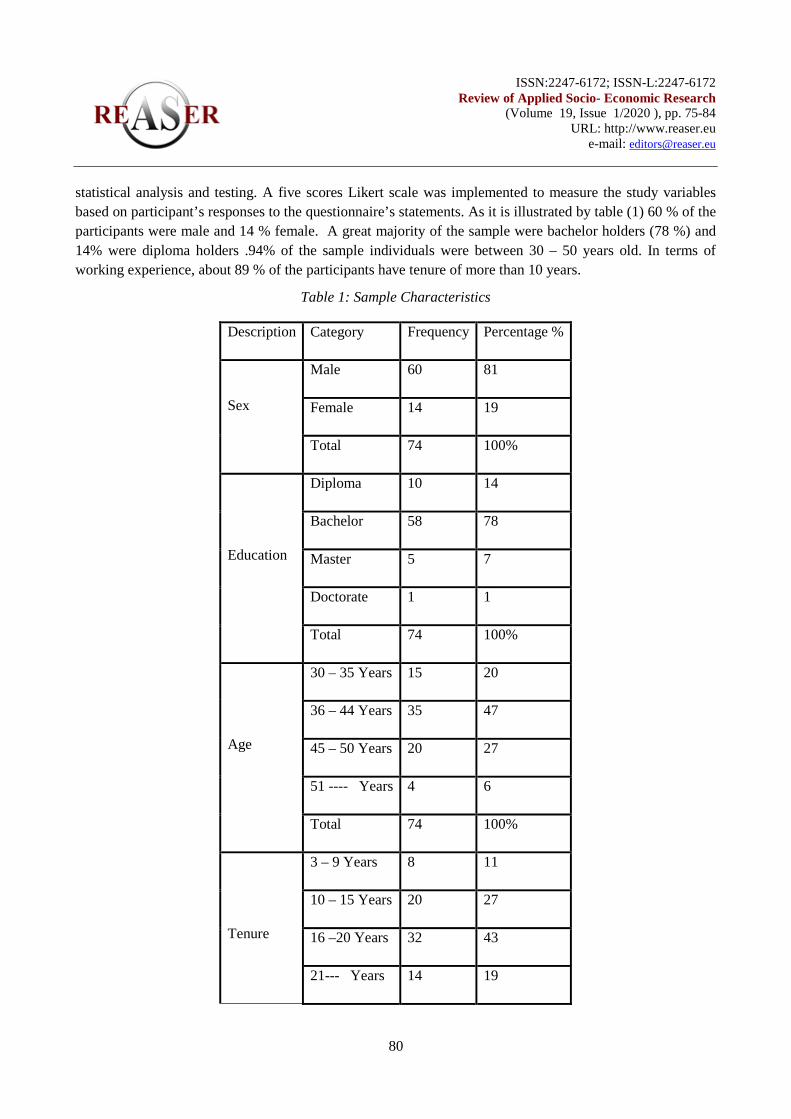
ISSN:2247-6172; ISSN-L:2247-6172
Review of Applied Socio- Economic Research (Volume 19, Issue 1/2020 ), pp. 75-84
URL: http://www.reaser.eu e-mail: [email protected]
80
statistical analysis and testing. A five scores Likert scale was implemented to measure the study variables based on participant’s responses to the questionnaire’s statements. As it is illustrated by table (1) 60 % of the participants were male and 14 % female. A great majority of the sample were bachelor holders (78 %) and 14% were diploma holders .94% of the sample individuals were between 30 – 50 years old. In terms of working experience, about 89 % of the participants have tenure of more than 10 years.
Table 1: Sample Characteristics
Description Category Frequency Percentage %
Sex
Male 60 81
Female 14 19
Total 74 100%
Education
Diploma 10 14
Bachelor 58 78
Master 5 7
Doctorate 1 1
Total 74 100%
Age
30 – 35 Years 15 20
36 – 44 Years 35 47
45 – 50 Years 20 27
51 ---- Years 4 6
Total 74 100%
Tenure
3 – 9 Years 8 11
10 – 15 Years 20 27
16 –20 Years 32 43
21--- Years 14 19

ISSN:2247-6172; ISSN-L:2247-6172
Review of Applied Socio- Economic Research (Volume 19, Issue 1/2020 ), pp. 75-84
URL: http://www.reaser.eu e-mail: [email protected]
81
Total 74 100%
3.4. Procedures A four parts questionnaire was used to obtain the required data. Each questionnaire consists of 45
statements that describe and measure the variables of the study. Participants were briefly instructed to read each statement of the questionnaire and place an “X” in the score-cell that he or she believes it is relevant. Likert’s five scales were used to quantify the participants' responses to the questionnaire’s statements, where the highest possible score was 5 which indicates highly agreed against the lowest score of 1 that indicates highly disagreed. The obtained data were reviewed and deliberately checked out before it was used for the intended statistical analysis and testing. A validity test was conducted to ensure the consistency of the questionnaire statements and its appropriateness to measure the study variables.
To examine the relationships between the variables of the study and find out the impact of the independent variable on the dependent variable, correlation and regression tests were carried out. To determine the mediating role of the organization’s sustainability (if any) on the relationship and impact of the independent variable on the dependent variable both tests were re-carried out with the inserting of the mediator variable. To ensure the validity and reliability of the data collection mean Cronbach alfa and KMO coefficients were calculated.
3.5. Validity and Reliability To ensure the validity and reliability of the research instrument utilized for this research effort, a pre-test
pilot was conducted which included 30 participating large Jordanian companies. These companies were selected to participate in this study due to their large IT operations. Limiting the participants to for-profit organizations was to aid in the validity of the study since non-for-profit organizations might not be concerned with being competitive which is mandatory for this study. Reliability and validity testing results presented by table (2) have indicated that Cronbach alfa values were varied between 0.73 and 0.83 while the KMO values were between 0.35 and 0.704 which assure that the implanted research instrument used for data collection was reliable and valid.
Table 2: Reliability Statistics
Variable Cronbach's
Alpha
KMO
Independent variables green it
tools
.83 .704
Dependent variable
organizational benefits
.77 .681
Moderator variable
Organizational commitment
and their perception of
.73 .635
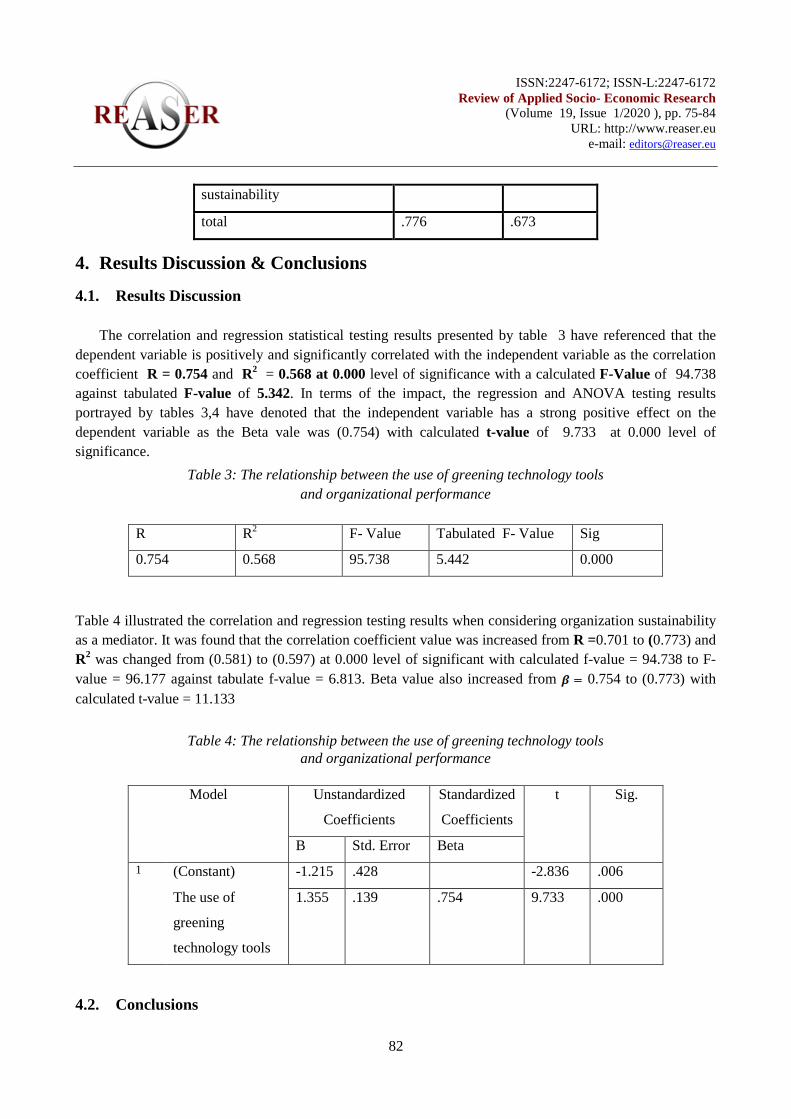
ISSN:2247-6172; ISSN-L:2247-6172
Review of Applied Socio- Economic Research (Volume 19, Issue 1/2020 ), pp. 75-84
URL: http://www.reaser.eu e-mail: [email protected]
82
sustainability
total .776 .673
4. Results Discussion & Conclusions
4.1. Results Discussion The correlation and regression statistical testing results presented by table 3 have referenced that the
dependent variable is positively and significantly correlated with the independent variable as the correlation coefficient R = 0.754 and R2 = 0.568 at 0.000 level of significance with a calculated F-Value of 94.738 against tabulated F-value of 5.342. In terms of the impact, the regression and ANOVA testing results portrayed by tables 3,4 have denoted that the independent variable has a strong positive effect on the dependent variable as the Beta vale was (0.754) with calculated t-value of 9.733 at 0.000 level of significance.
Table 3: The relationship between the use of greening technology tools and organizational performance
R R2 F- Value Tabulated F- Value Sig
0.754 0.568 95.738 5.442 0.000
Table 4 illustrated the correlation and regression testing results when considering organization sustainability as a mediator. It was found that the correlation coefficient value was increased from R =0.701 to (0.773) and R2 was changed from (0.581) to (0.597) at 0.000 level of significant with calculated f-value = 94.738 to F-value = 96.177 against tabulate f-value = 6.813. Beta value also increased from 0.754 to (0.773) with calculated t-value = 11.133
Table 4: The relationship between the use of greening technology tools
and organizational performance
Model Unstandardized
Coefficients
Standardized
Coefficients
t Sig.
B Std. Error Beta 1 (Constant) -1.215 .428 -2.836 .006
The use of
greening
technology tools
1.355 .139 .754 9.733 .000
4.2. Conclusions
ISSN:2247-6172; ISSN-L:2247-6172
Review of Applied Socio- Economic Research (Volume 19, Issue 1/2020 ), pp. 75-84
URL: http://www.reaser.eu e-mail: [email protected]
83
Relying upon the discussion of the statistical analysis results, it would be reasonable to mention that the general performance of the existing business organization is considerably affected by the utilization of greening IT tools. There is a clear and justified dependency between the two elements. Company sustainability a major part of its reputation and competitive advantage because customers are nowadays highly concerned about it. It might be relevant to suggest that the Jordanian companies understudy in particular, and all business organizations, in general, are invited to expend their sustainability efforts and invest more in greening IT tools utilization with relevant training programs to maintain a rational application of these tools.
5. References [1] J.C´espedes-Lorente, A.Mag´an-D´ıaz, E.Mart´ınez- Ros, (2018), Information Technologies and Downsizing:
Examining their Impact on Economic Performance, Information &Management, 2019, Volume 56, Issue 4.
[2] H.Chae, C. Koh, K. Park, Information Technology Capability and Firm Performance: Role of Industry, Information &Management, 2018, Volume 55, Issue 5.
[3] L. Hae Lim, T. Stratopoulos, T. Wirjantom, (2012), Role of IT executives in the firm's ability to achieve competitive advantage through IT capability, International Journal of Accounting Information Systems, 2012, Volume 13, Issue 1.
[4] R.Gouvea, D.Kapelianis, D & S.Kassicieh , Assessing the nexus of sustainability and information & communications technology. Technological Forecasting and Social Change, 2017, http://dx.doi.org/10.1016/j.techfore.2017.07.023.
[5] S.Benn., M..D. Dunphy, & A.Griffiths, Organizational Change for Corporate Sustainability, New York, Routledge, 2014.
[6] D.Baskin, Sustainability goals and reporting, Financial Executive Research Foundation, 2014.
[7] P.Ekins, Economic Growth and Environmental Sustainability: The Prospects for Green Growth, London/New York, Routledge, 2000.
[8] T.Hill Jr, Finding value in nature, Environmental Values, 15(3), 2006.
[9] A.Gubin, Developing performance measurement for the Russian Customs Service, World Customs Journal, Volume 5, Number 2, 2011.
[10] B.Marr, Key Performance Indicators: The 75 Measures Every Manager Needs to Know, London, Financial Times Press, 2012.
[11] D.Parmenter, Key Performance Indicators, New Jersey John Wiley & Sons, 2007.
[12] P.Kueng, Process performance measurement system: a tool to support process-based organizations, Total Quality Management, 2000, Vol. 11, No. 1.
[13] S.Modell, Performance measurement and institutional processes: a study of managerial responses to public sector reform, Management Accounting Research, 2001, Vol 12, No 4.
[14] M.Orlitzky, F.Schmidt,S. Rynes, Corporate Social and Financial Performance: A Meta-analysis, Organization Studies, 2003, Vol 24, No 3.
[15] M.Marrewijk, M.Werre, Multiple Levels of Corporate Sustainability, Journal of Business Ethics, 2003, 44(2-3).
[16] M.Burnham), Wal-Mart Requires Suppliers to Reveal Environmental Impacts, Scientific American, July 16, 2009. https://www.scientificamerican.com.

ISSN:2247-6172; ISSN-L:2247-6172
Review of Applied Socio- Economic Research (Volume 19, Issue 1/2020 ), pp. 75-84
URL: http://www.reaser.eu e-mail: [email protected]
84
[17] S.Murugesan, G. Gangadharan , Harnessing Green IT: Principles and practices, New Jersey John Wiley & Sons, 2012..
[18] A.Molla, , V.Cooper, & others, E-readiness to greediness: Developing a green information technology readiness framework., Proceedings of the 19 Australasian Conference on Information Systems, Christchurch, 2008, New Zealand.
[19] S.Brooks, X.Wang, & S.Sarker , Unpacking green IT: A review of the existing literature, Proceedings of the Americas Conference on Information Systems , AMCIS2010, Lima, Peru.
[20] M.Dávideková & J. Hvorecký, Collaboration Tools for Virtual Teams in Terms of the SECI Model, Interactive Collaborative Learning: Proceedings of the 19th ICL Conference, 2017, Volume 1.
[21] Y.Sharma, B.Javadi, ,W.Si and D. Sun, Reliability and energy efficiency in cloud computing systems: Survey and taxonomy, Journal of Network and Computer Applications, 2016, Vol. 74, pp. 66-85
[22] H.Dou, Y.Qi, W.Wei and H.Song , Carbon-Aware Electricity Cost Minimization for Sustainable Datacenters, IEEE Transactions on Sustainable Computing, 2017,Vol. 2, No. 2, pp. 211-223
[23] X.Li.., P. Garraghan, X. Jiang, Z. Wu, and J.Xu, Holistic virtual machine scheduling in cloud datacenters towards minimizing total energy , IEEE Transactions on Parallel and Distributed Systems, 2018, Vol 29, Issue 6.
[24] L.Moorefield, B. Frazer and P. Bendt, Office Plug Load Field Monitoring Report, 2008 Portland, OR.
[25] G. Bolcer & R. Taylor, Advanced Workflow Management Technologies, Software Process: Improvement and Practice, 1998, Volume 4, No 3.
[26] N. Chowdhury, M. Rahman & R.Boutaba , Virtual Network Embedding with Coordinated Node and Link Mapping, IEEE INFOCOM 2009 proceedings.
[27] T.Sobh & V.Aly., Effective and Extensive Virtual Private Network, Journal of Information Security, 2011, Vol 2, No 1.
[28] P.Robbertz, The Environmental Impact of Mail: A Baseline, Stamford, Pitney Bowes Inc., 2008.
[29] G.Charlton, Email remains the best digital channel for ROI, March 31st 2014 Retrieved from, https://econsultancy.com/email-remains-the-best-digital-channel-for-roi/, December 11, 2018.
[30] L.Lee and A.Shanahan, Carbon Disclosure Project Study 2010 The Telepresence Revolution, Retrieved from, https://www.att.com/Common/about_us/files/pdf/Telepresence/CDP_Telepresence_Report_Final.pdf
, November 12, 2018.
____________________________________ Manuscript received: 24.09.2019
Manuscript received in revised form: 27.05.2020
Manuscript accepted: 21.06.2020
ISSN: 2247-6172; ISSN-L: 2247-6172
Review of Applied Socio- Economic Research (Volume 19, Issue 1 /2020 ), pp. 85-86
URL: http://www.reaser.eu e-mail: [email protected]
85
Book review
Exploring Agriscience (5th ed.) Book by: Dr. Ray V. Herren
Review by: Dr. Wandra Arrington1
1Department of Agriculture, School of Agriculture and Applied Sciences
Alcorn State University Lorman, Mississippi, USA
Working with students majoring in Agriculture is a challenging and rewarding task for instructors. However, Ray Herren’s (2017) textbook, “Exploring Agriscience” (5th Ed.) provides instructors a framework for educating high school and college students in the rapidly changing science of agriculture. Exploring Agriscience, Fifth Edition is intended to introduce you to the dynamic industry of agriculture. The book is divided into 27 chapters that address the different aspects of the agriculture industry and the main areas of agriculture that have made the industry great. The reader is able to clearly understand the basic agriculture concepts and the impact on Agriculture society. Throughout the book, the Chapters feature appropriate and useful materials, including Reader-friendly narratives; Hands-on exploratory science-based approach to agriscience; Full-color photos, Illustrations, and design of key points; Spotlight FFA activities; and Chapter Reviews that include questions and activities. Herren has updated the fifth edition to include an all new Chapter “Urban Agriculture” that reflects the growing importance of locally-sourced food and the benefits of community gardens and natural surroundings in an urban environment. Students will also find more Chapters fun facts throughout the readings on the topics under discussion and full-colored images that show modern industry equipment and practices in agriculture. The author’s most beneficial feature of the book is the “Companion Site”. The Companion Site features tools to support learning and facilitate teaching such as Answers to Review Questions, Answers to Lab Manual, Lesson Plans, PowerPoints, Testing Powered by Cognero, All-New Projects for Students and Image Gallery. Overall, the book has up-to-date information for high school and college students entering the exciting field of agriscience. It is very in-depth and focuses on providing information for those students in learning the essential information needed to continue their exploration into the exciting field of agriscience. Instructors will also enjoy how the book assists them in planning and implementing their instructional program for the 1 Coresponding author email: [email protected]
ISSN: 2247-6172; ISSN-L: 2247-6172
Review of Applied Socio- Economic Research (Volume 19, Issue 1 /2020 ), pp. 85-86
URL: http://www.reaser.eu e-mail: [email protected]
86
most efficient use of time and other resources. The book companion site resources are easy to follow and enable students to make a connection between knowledge and practice. The quality and accessibility of the content is excellent. This textbook differs from other textbooks because it is well-structured, the exercises and exams are manageable and the textbook content is updated information. The textbook also comes in eBook format. Reference: Herren, R.V. (2017). Exploring Agriscience (5th ed., pp. 608). Cengage Learning, Inc. Publisher. ISBN 10: 1305949706; ISBN 13: 9781305949706 Bibliographic Information Title: Exploring Agriscience Author: Dr. Ray V. Herren Edition: 5th edition Publisher: Cengage Learning, Inc. Publication Date: January 27, 2017 Publication City/County Mason, OH, United States Language: English ISBN 10: 1305949706 ISBN 13: 9781305949706 Length/Format: 608 pages (Hardcover) Dimensions: 8.5 x 1 x 11 inches Item Weight: 3.25 pounds Cost: $131.95 Subjects: Science / Life Sciences / Horticulture
Related Documents