Atmos. Chem. Phys., 10, 5343–5357, 2010 www.atmos-chem-phys.net/10/5343/2010/ doi:10.5194/acp-10-5343-2010 © Author(s) 2010. CC Attribution 3.0 License. Atmospheric Chemistry and Physics Isotope effect in the formation of H 2 from H 2 CO studied at the atmospheric simulation chamber SAPHIR T. R¨ ockmann 1 , S. Walter 1 , B. Bohn 2 , R. Wegener 2 , H. Spahn 2 , T. Brauers 2 , R. Tillmann 2 , E. Schlosser 2,* , R. Koppmann 3 , and F. Rohrer 2 1 Institute for Marine and Atmospheric research Utrecht, Utrecht University, Utrecht, The Netherlands 2 Institut f ¨ ur Chemie und Dynamik der Geosph¨ are ICG-2, Forschungszentrum J¨ ulich GmbH, J ¨ ulich, Germany 3 Faculty of Mathematics and Natural Sciences, University of Wuppertal, Wuppertal, Germany * now at: Institut f¨ ur Meteorologie und Klimaforschung, Karlsruhe Institute of Technology, Karlsruhe, Germany Received: 4 November 2009 – Published in Atmos. Chem. Phys. Discuss.: 25 November 2009 Revised: 26 April 2010 – Accepted: 11 May 2010 – Published: 16 June 2010 Abstract. Formaldehyde of known, near-natural isotopic composition was photolyzed in the SAPHIR atmosphere simulation chamber under ambient conditions. The iso- topic composition of the product H 2 was used to determine the isotope effects in formaldehyde photolysis. The experi- ments are sensitive to the molecular photolysis channel, and the radical channel has only an indirect effect and cannot be effectively constrained. The molecular channel kinetic isotope effect KIE mol , the ratio of photolysis frequencies j (HCHO→CO+H 2 )/j (HCDO→CO+HD) at surface pres- sure, is determined to be KIE mol = 1.63 +0.038 -0.046 . This is similar to the kinetic isotope effect for the total removal of HCHO from a recent relative rate experiment (KIE tot =1.58±0.03), which indicates that the KIEs in the molecular and radical photolysis channels at surface pressure (≈100 kPa) may not be as different as described previously in the literature. 1 Introduction Molecular hydrogen (H 2 ) is the second most abundant re- duced gas in the atmosphere after methane with a global average mixing ratio of roughly 500 ppb. Interest in its at- mospheric cycle has strongly increased in the past years be- cause of its potential future large-scale use as energy carrier. Since use of H 2 only produces H 2 O, a future hydrogen econ- omy is expected to ameliorate many of the present climate Correspondence to: T. R ¨ ockmann ([email protected]) and air quality related problems (Schultz et al., 2003). How- ever, it is expected that unavoidable leaks in the production, storage, transport and use of H 2 would considerably increase the atmospheric content of H 2 . Although H 2 is not a green- house gas, it affects the concentration of the greenhouse gas methane and many other species via a feedback from its re- moval reaction with the hydroxyl (OH) radical (Schultz et al., 2003). In the stratosphere, increased levels of H 2 will lead to higher levels of stratospheric water vapor, which will change the radiative budget of the stratosphere. Enhanced levels of stratospheric aerosol may also alter ozone chem- istry, e.g., through enhanced N 2 O 5 hydrolysis affecting the catalytic O 3 destruction cycles. In Polar Regions, enhanced water can lead to an increase in the occurrence of polar strato- spheric clouds (PSC) in winter (Schultz et al., 2003; Tromp et al., 2003; Warwick et al., 2004; Feck et al., 2008). PSC play a key role in the halogen-catalyzed destruction of ozone (the ozone hole), and thus increased H 2 levels are expected to delay the recovery of the polar ozone hole. H 2 has a peculiar latitudinal distribution in the atmosphere with higher mixing ratios in the Southern Hemisphere (SH) compared to the Northern Hemisphere (NH) (Steele et al., 1996; Novelli et al., 1999; Ehhalt and Rohrer, 2009). This is because the main H 2 removal process is deposition to soils, and there is much more soil surface in the NH. The sec- ond important removal process is oxidation by the OH rad- ical. H 2 is produced mainly by three classes of processes: 1) combustion processes (fossil fuel burning and biomass burning) 2) photolysis of formaldehyde (HCHO), which is a relatively stable intermediate in the atmospheric oxidation chains of CH 4 and non-methane hydrocarbons (NMHC) and Published by Copernicus Publications on behalf of the European Geosciences Union.

Welcome message from author
This document is posted to help you gain knowledge. Please leave a comment to let me know what you think about it! Share it to your friends and learn new things together.
Transcript
Atmos. Chem. Phys., 10, 5343–5357, 2010www.atmos-chem-phys.net/10/5343/2010/doi:10.5194/acp-10-5343-2010© Author(s) 2010. CC Attribution 3.0 License.
AtmosphericChemistry
and Physics
Isotope effect in the formation of H2 from H 2CO studied at theatmospheric simulation chamber SAPHIR
T. Rockmann1, S. Walter1, B. Bohn2, R. Wegener2, H. Spahn2, T. Brauers2, R. Tillmann2, E. Schlosser2,*,R. Koppmann3, and F. Rohrer2
1Institute for Marine and Atmospheric research Utrecht, Utrecht University, Utrecht, The Netherlands2Institut fur Chemie und Dynamik der Geosphare ICG-2, Forschungszentrum Julich GmbH, Julich, Germany3Faculty of Mathematics and Natural Sciences, University of Wuppertal, Wuppertal, Germany* now at: Institut fur Meteorologie und Klimaforschung, Karlsruhe Institute of Technology, Karlsruhe, Germany
Received: 4 November 2009 – Published in Atmos. Chem. Phys. Discuss.: 25 November 2009Revised: 26 April 2010 – Accepted: 11 May 2010 – Published: 16 June 2010
Abstract. Formaldehyde of known, near-natural isotopiccomposition was photolyzed in the SAPHIR atmospheresimulation chamber under ambient conditions. The iso-topic composition of the product H2 was used to determinethe isotope effects in formaldehyde photolysis. The experi-ments are sensitive to the molecular photolysis channel, andthe radical channel has only an indirect effect and cannotbe effectively constrained. The molecular channel kineticisotope effect KIEmol, the ratio of photolysis frequenciesj (HCHO→CO+H2)/j (HCDO→CO+HD) at surface pres-sure, is determined to be KIEmol = 1.63+0.038
−0.046. This is similarto the kinetic isotope effect for the total removal of HCHOfrom a recent relative rate experiment (KIEtot=1.58±0.03),which indicates that the KIEs in the molecular and radicalphotolysis channels at surface pressure (≈100 kPa) may notbe as different as described previously in the literature.
1 Introduction
Molecular hydrogen (H2) is the second most abundant re-duced gas in the atmosphere after methane with a globalaverage mixing ratio of roughly 500 ppb. Interest in its at-mospheric cycle has strongly increased in the past years be-cause of its potential future large-scale use as energy carrier.Since use of H2 only produces H2O, a future hydrogen econ-omy is expected to ameliorate many of the present climate
Correspondence to:T. Rockmann([email protected])
and air quality related problems (Schultz et al., 2003). How-ever, it is expected that unavoidable leaks in the production,storage, transport and use of H2 would considerably increasethe atmospheric content of H2. Although H2 is not a green-house gas, it affects the concentration of the greenhouse gasmethane and many other species via a feedback from its re-moval reaction with the hydroxyl (OH) radical (Schultz etal., 2003). In the stratosphere, increased levels of H2 willlead to higher levels of stratospheric water vapor, which willchange the radiative budget of the stratosphere. Enhancedlevels of stratospheric aerosol may also alter ozone chem-istry, e.g., through enhanced N2O5 hydrolysis affecting thecatalytic O3 destruction cycles. In Polar Regions, enhancedwater can lead to an increase in the occurrence of polar strato-spheric clouds (PSC) in winter (Schultz et al., 2003; Trompet al., 2003; Warwick et al., 2004; Feck et al., 2008). PSCplay a key role in the halogen-catalyzed destruction of ozone(the ozone hole), and thus increased H2 levels are expectedto delay the recovery of the polar ozone hole.
H2 has a peculiar latitudinal distribution in the atmospherewith higher mixing ratios in the Southern Hemisphere (SH)compared to the Northern Hemisphere (NH) (Steele et al.,1996; Novelli et al., 1999; Ehhalt and Rohrer, 2009). This isbecause the main H2 removal process is deposition to soils,and there is much more soil surface in the NH. The sec-ond important removal process is oxidation by the OH rad-ical. H2 is produced mainly by three classes of processes:1) combustion processes (fossil fuel burning and biomassburning) 2) photolysis of formaldehyde (HCHO), which isa relatively stable intermediate in the atmospheric oxidationchains of CH4 and non-methane hydrocarbons (NMHC) and
Published by Copernicus Publications on behalf of the European Geosciences Union.
5344 T. Rockmann et al.: Isotope effect in the formation of H2 from H2CO
3) biological processes in the soil or the ocean. The thirdgroup is likely of minor importance, but there are still largeerror bars on the quantitative estimates of all sources andsinks of H2.
Isotope studies can yield valuable insight into the relativestrengths of sources and sinks of atmospheric H2. H2 emit-ted from different sources usually carries a distinct isotopecomposition and the kinetic isotope effects in the two sinksdiffer strongly (Gerst and Quay, 2000, 2001; Rahn et al.,2003, 2002a, b; Rhee et al., 2004, 2005, 2008; Brenninkmei-jer et al., 2003; Rockmann et al., 2003, 2010; Vollmer etal., 2010). In the case of hydrogen the isotope effects areparticularly large due to the 100% relative mass differencebetween1H and 2H (deuterium, in the following denotedD). The isotope ratio is measured as a ratio of the rare iso-tope D to the abundant isotope H and expressed as differ-ence to the isotope ratio of Standard Mean Ocean Water(V-SMOW, (D/H)VSMOW=1.56×10−4) given in per mil units(δD=[(D/H)Sa/(D/H)VSMOW-1]). The average isotopic com-position of atmospheric H2 is roughly +130‰. Emissionsfrom the ocean and nitrogen fixation in soils are expectedto have the lowest D content (δD∼ −700‰), due to the equi-librium fractionation between water and H2 (Bottinga, 1968).δD values between−200 and−300‰ have been determinedfor H2 from biomass and fossil fuel burning (Gerst and Quay,2001; Rahn et al., 2002b; Rockmann et al., 2010; Vollmeret al., 2010). Atmospheric oxidation processes must havean enriched isotope signature to balance the isotope budget,as first postulated by Gerst and Quay (2001). Recent in-vestigations have confirmed this on samples from the strato-sphere, where CH4 oxidation is the only significant in-situsource and can be studied without interference from the sur-face sources (Rahn et al., 2003; Rockmann et al., 2003; Rheeet al., 2006). Nevertheless, it is not straightforward to applythose stratospheric results to the troposphere. Basically noinformation is available on isotope effects for H2 formationfrom the oxidation of non-methane hydrocarbons.
In addition to the stratospheric studies, also laboratorystudies have investigated the isotope effects in the oxidationchain from CH4 to H2 (Gierzak et al., 1997; Feilberg et al.,2004, 2005b, 2007a, b; Rhee et al., 2008; Nilsson et al.,2007, 2010). As usual for isotope effects, the most importantfractionations occur where there are branching steps in thereaction mechanism. The series of rate constants of methaneand deuterated methanes with OH determined by Gierzak etal. (1997) indicates that the abstraction probability for H andD in CH3D are 96% and 4%, respectively, so D abstraction ismuch less than the statistically expected value of 25%. Re-cent measurements have shown that in the second abstractionstep (CH2DO+O2), the abstraction probability of D is 11%,again much less than the statistically expected 33% (Nilssonet al., 2007). As D abstraction is much slower than H ab-straction, most of the D from the original CH4 stays in theoxidation chain, whereas the total number of H atoms is re-duced by a factor of 2 from CH4 to H2. This leads to a strong
enrichment in the D/H ratio, and thus theδD value.The third step where branching occurs is production of H2
from formaldehyde. Reactions (R1)–(R3) remove formalde-hyde, two photolysis channels and the reaction with OH.Only the so-called molecular photolysis channel (R1) pro-duces H2. Therefore, the fractionation between HCHO andH2 in the atmosphere depends on the fractionation constantof Reaction (R1) relative to the flux-weighted fractionationin the total removal of HCHO.
HCHO+hν → H2+CO (R1)
HCHO+hν → H+HCO (R2)
HCHO+OH→ H2O+HCO (R3)
The fractionation constant in Reaction (R3) was determinedin a laboratory experiment (Feilberg et al., 2004) to beKIEOH =1.28±0.01, where KIE is the ratio of rate constantsof the non-deuterated and deuterated molecules KIE=kH/kD.For HCHO photolysis, different studies have reported differ-ing values. Feilberg et al. (2007b) carried out measurementsat the European Photoreactor Facility EUPHORE in Valen-cia, Spain, and found KIEs for the molecular Reaction (R1)and radical Reaction (R2) channel of KIEmol =1.82±0.07and KIErad=1.1±0.06. Rhee et al. (2008) carried out photol-ysis experiments in a glass bulb under natural insolation andfound KIEmol =2.00±0.04 and KIErad= 4.54+2.60
−1.21. WhereasKIEmol values are in reasonable agreement, the values forKIErad disagree strongly. However, in none of the experi-ments this KIErad was measured directly, only inferred. Inthe case of Feilberg et al. (2007b), the combined KIEtotwas determined directly by absorption spectroscopy using D-labeled reaction mixtures. Furthermore,δD of the (extremelyenriched, because of the labeled H2CO precursor) H2 prod-uct was measured by isotope ratio mass spectrometry, andthese results were used in a photochemical model to deter-mine KIEmol and KIErad. Rhee et al. (2008) derived KIEmolfrom theδD(H2) at small reaction yields, where the secondorder effect of the radical channel is negligible. They deter-mined KIEradby total conversion of HCHO and mass balanceconsiderations.
Here we report an independent study of the hydrogen iso-tope effect in the production of H2 from HCHO. The exper-iments were carried out in the SAPHIR atmosphere simula-tion chamber at Forschungszentrum Julich under almost am-bient conditions and using natural isotope abundance HCHOreactant.
2 Experimental
The experiments were carried out in the atmospheric simu-lation chamber SAPHIR at Forschungszentrum Julich, Ger-many. SAPHIR is a large (5 m diameter, 18 m length,270±10 m3 volume) cylindrical chamber made of double-walled FEP film suspended in a steel frame allowing to study
Atmos. Chem. Phys., 10, 5343–5357, 2010 www.atmos-chem-phys.net/10/5343/2010/
T. Rockmann et al.: Isotope effect in the formation of H2 from H2CO 5345
atmospheric reactions under ambient radiation conditions.At the same time, the gas mixture in the SAPHIR chambercan be carefully selected to study only the reactions of inter-est. A mixture of N2 and O2 (>99.9999% purity) is used asultra-clean bath gas. The space between the two Teflon wallsof the reactor is constantly flushed with clean N2, thus H2cannot leak in from outside. Air losses due to consumptionby the analytical instruments and small leaks are compen-sated automatically by a replenishment flow of pure syntheticair (3–4 m3 h−1) into the chamber maintaining constant pres-sure (50 Pa above ambient) in the chamber. The dilution ratefor trace gases during the experiments is derived from themeasured replenishing flow. Photolysis inside the chamberis provided by sunlight. The FEP foil has a high transmis-sion for visible light, UV-A, and UV-B (Bohn et al., 2005),while a roof-system allows fast shadowing of the chamber ifrequired.
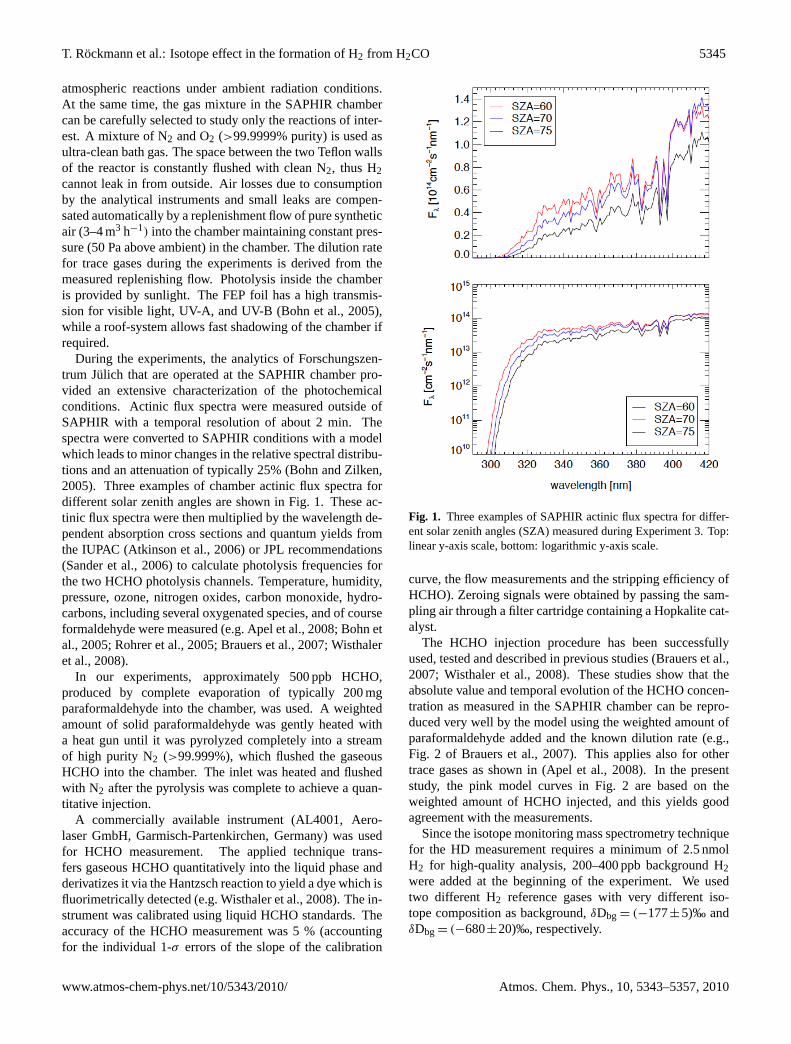
During the experiments, the analytics of Forschungszen-trum Julich that are operated at the SAPHIR chamber pro-vided an extensive characterization of the photochemicalconditions. Actinic flux spectra were measured outside ofSAPHIR with a temporal resolution of about 2 min. Thespectra were converted to SAPHIR conditions with a modelwhich leads to minor changes in the relative spectral distribu-tions and an attenuation of typically 25% (Bohn and Zilken,2005). Three examples of chamber actinic flux spectra fordifferent solar zenith angles are shown in Fig. 1. These ac-tinic flux spectra were then multiplied by the wavelength de-pendent absorption cross sections and quantum yields fromthe IUPAC (Atkinson et al., 2006) or JPL recommendations(Sander et al., 2006) to calculate photolysis frequencies forthe two HCHO photolysis channels. Temperature, humidity,pressure, ozone, nitrogen oxides, carbon monoxide, hydro-carbons, including several oxygenated species, and of courseformaldehyde were measured (e.g. Apel et al., 2008; Bohn etal., 2005; Rohrer et al., 2005; Brauers et al., 2007; Wisthaleret al., 2008).
In our experiments, approximately 500 ppb HCHO,produced by complete evaporation of typically 200 mgparaformaldehyde into the chamber, was used. A weightedamount of solid paraformaldehyde was gently heated witha heat gun until it was pyrolyzed completely into a streamof high purity N2 (>99.999%), which flushed the gaseousHCHO into the chamber. The inlet was heated and flushedwith N2 after the pyrolysis was complete to achieve a quan-titative injection.
A commercially available instrument (AL4001, Aero-laser GmbH, Garmisch-Partenkirchen, Germany) was usedfor HCHO measurement. The applied technique trans-fers gaseous HCHO quantitatively into the liquid phase andderivatizes it via the Hantzsch reaction to yield a dye which isfluorimetrically detected (e.g. Wisthaler et al., 2008). The in-strument was calibrated using liquid HCHO standards. Theaccuracy of the HCHO measurement was 5 % (accountingfor the individual 1-σ errors of the slope of the calibration
40
830
Figure 1: Three examples of SAPHIR actinic flux spectra for different solar zenith
angles (SZA) measured during experiment 3. Top: linear y-axis scale, bottom:
logarithmic y-axis scale.
Fig. 1. Three examples of SAPHIR actinic flux spectra for differ-ent solar zenith angles (SZA) measured during Experiment 3. Top:linear y-axis scale, bottom: logarithmic y-axis scale.
curve, the flow measurements and the stripping efficiency ofHCHO). Zeroing signals were obtained by passing the sam-pling air through a filter cartridge containing a Hopkalite cat-alyst.
The HCHO injection procedure has been successfullyused, tested and described in previous studies (Brauers et al.,2007; Wisthaler et al., 2008). These studies show that theabsolute value and temporal evolution of the HCHO concen-tration as measured in the SAPHIR chamber can be repro-duced very well by the model using the weighted amount ofparaformaldehyde added and the known dilution rate (e.g.,Fig. 2 of Brauers et al., 2007). This applies also for othertrace gases as shown in (Apel et al., 2008). In the presentstudy, the pink model curves in Fig. 2 are based on theweighted amount of HCHO injected, and this yields goodagreement with the measurements.
Since the isotope monitoring mass spectrometry techniquefor the HD measurement requires a minimum of 2.5 nmolH2 for high-quality analysis, 200–400 ppb background H2were added at the beginning of the experiment. We usedtwo different H2 reference gases with very different iso-tope composition as background,δDbg = (−177±5)‰ andδDbg= (−680±20)‰, respectively.
www.atmos-chem-phys.net/10/5343/2010/ Atmos. Chem. Phys., 10, 5343–5357, 2010
5346 T. Rockmann et al.: Isotope effect in the formation of H2 from H2CO
41
Figure 2: Experimental and model results of the formaldehyde photolysis experiments 835
in the SAPHIR chamber. Top panels show the concentration (left scale) and isotopic
composition (rights scale) of formaldehyde. Middle panels show the H2 concentration,
bottom panels show the isotopic composition of H2, shifted in positive direction by
the listed offsets in order to subtract the effect from the different bath gases used.
Symbols represent measurement results (blue: concentration, black: δD). Lines 840
represent model results as follows: pink: concentration; red: δD for KIE rad = KIEmol
=1.63 (line 1 in Table 2); grey shaded area: KIErad varied by ±0.5; light blue shaded
area: KIEmol varied by ±0.1; black dashed line: KIE rad =1.00, KIEmol =1.60 (line 8 in
Table 2); green solid line: Feilberg et al. (2007b); green dashed line: Rhee et al.
(2008). 845
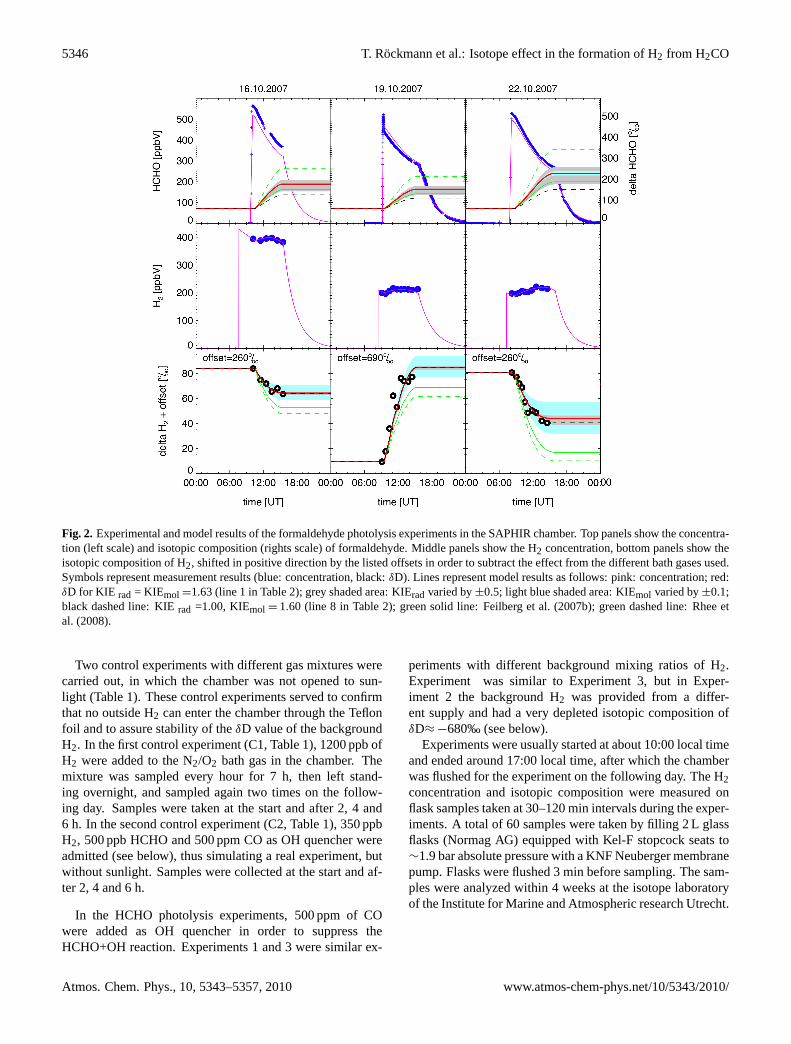
Fig. 2. Experimental and model results of the formaldehyde photolysis experiments in the SAPHIR chamber. Top panels show the concentra-tion (left scale) and isotopic composition (rights scale) of formaldehyde. Middle panels show the H2 concentration, bottom panels show theisotopic composition of H2, shifted in positive direction by the listed offsets in order to subtract the effect from the different bath gases used.Symbols represent measurement results (blue: concentration, black:δD). Lines represent model results as follows: pink: concentration; red:δD for KIE rad = KIEmol =1.63 (line 1 in Table 2); grey shaded area: KIErad varied by±0.5; light blue shaded area: KIEmol varied by±0.1;black dashed line: KIErad =1.00, KIEmol = 1.60 (line 8 in Table 2); green solid line: Feilberg et al. (2007b); green dashed line: Rhee etal. (2008).
Two control experiments with different gas mixtures werecarried out, in which the chamber was not opened to sun-light (Table 1). These control experiments served to confirmthat no outside H2 can enter the chamber through the Teflonfoil and to assure stability of theδD value of the backgroundH2. In the first control experiment (C1, Table 1), 1200 ppb ofH2 were added to the N2/O2 bath gas in the chamber. Themixture was sampled every hour for 7 h, then left stand-ing overnight, and sampled again two times on the follow-ing day. Samples were taken at the start and after 2, 4 and6 h. In the second control experiment (C2, Table 1), 350 ppbH2, 500 ppb HCHO and 500 ppm CO as OH quencher wereadmitted (see below), thus simulating a real experiment, butwithout sunlight. Samples were collected at the start and af-ter 2, 4 and 6 h.
In the HCHO photolysis experiments, 500 ppm of COwere added as OH quencher in order to suppress theHCHO+OH reaction. Experiments 1 and 3 were similar ex-
periments with different background mixing ratios of H2.Experiment was similar to Experiment 3, but in Exper-iment 2 the background H2 was provided from a differ-ent supply and had a very depleted isotopic composition ofδD≈ −680‰ (see below).
Experiments were usually started at about 10:00 local timeand ended around 17:00 local time, after which the chamberwas flushed for the experiment on the following day. The H2concentration and isotopic composition were measured onflask samples taken at 30–120 min intervals during the exper-iments. A total of 60 samples were taken by filling 2 L glassflasks (Normag AG) equipped with Kel-F stopcock seats to∼1.9 bar absolute pressure with a KNF Neuberger membranepump. Flasks were flushed 3 min before sampling. The sam-ples were analyzed within 4 weeks at the isotope laboratoryof the Institute for Marine and Atmospheric research Utrecht.
Atmos. Chem. Phys., 10, 5343–5357, 2010 www.atmos-chem-phys.net/10/5343/2010/
T. Rockmann et al.: Isotope effect in the formation of H2 from H2CO 5347
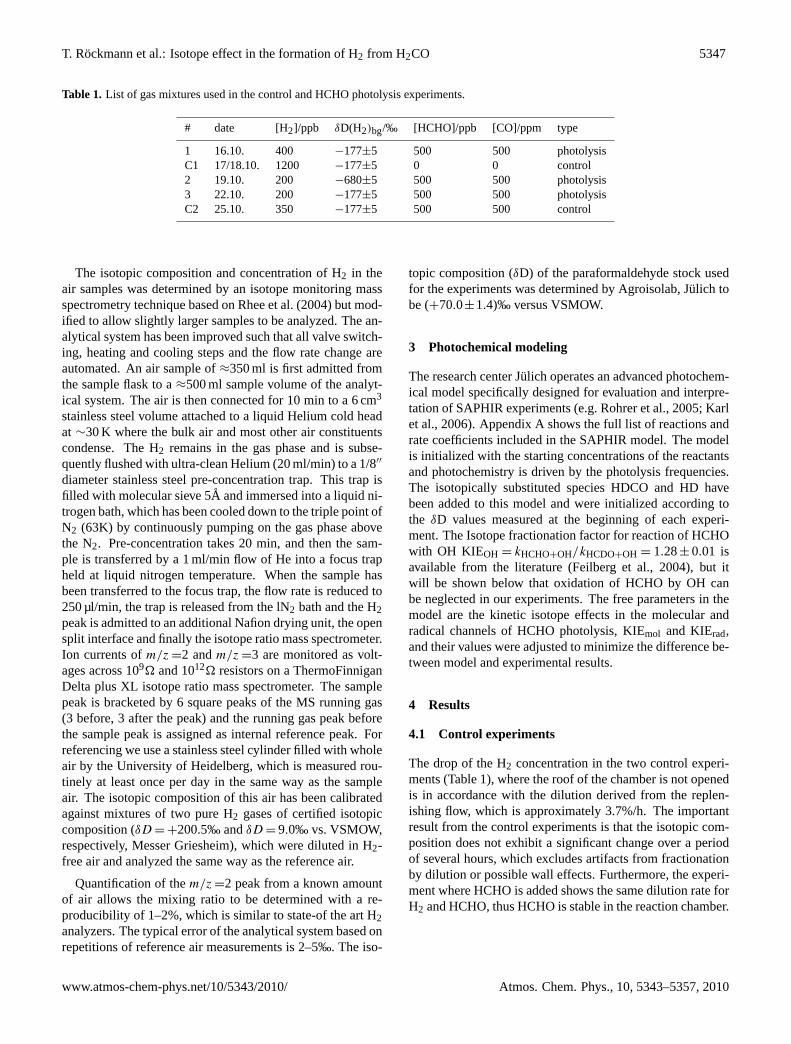
Table 1. List of gas mixtures used in the control and HCHO photolysis experiments.
# date [H2]/ppb δD(H2)bg/‰ [HCHO]/ppb [CO]/ppm type
1 16.10. 400 −177±5 500 500 photolysisC1 17/18.10. 1200 −177±5 0 0 control2 19.10. 200 −680±5 500 500 photolysis3 22.10. 200 −177±5 500 500 photolysisC2 25.10. 350 −177±5 500 500 control
The isotopic composition and concentration of H2 in theair samples was determined by an isotope monitoring massspectrometry technique based on Rhee et al. (2004) but mod-ified to allow slightly larger samples to be analyzed. The an-alytical system has been improved such that all valve switch-ing, heating and cooling steps and the flow rate change areautomated. An air sample of≈350 ml is first admitted fromthe sample flask to a≈500 ml sample volume of the analyt-ical system. The air is then connected for 10 min to a 6 cm3
stainless steel volume attached to a liquid Helium cold headat ∼30 K where the bulk air and most other air constituentscondense. The H2 remains in the gas phase and is subse-quently flushed with ultra-clean Helium (20 ml/min) to a 1/8′′
diameter stainless steel pre-concentration trap. This trap isfilled with molecular sieve 5A and immersed into a liquid ni-trogen bath, which has been cooled down to the triple point ofN2 (63K) by continuously pumping on the gas phase abovethe N2. Pre-concentration takes 20 min, and then the sam-ple is transferred by a 1 ml/min flow of He into a focus trapheld at liquid nitrogen temperature. When the sample hasbeen transferred to the focus trap, the flow rate is reduced to250 µl/min, the trap is released from the lN2 bath and the H2peak is admitted to an additional Nafion drying unit, the opensplit interface and finally the isotope ratio mass spectrometer.Ion currents ofm/z =2 andm/z =3 are monitored as volt-ages across 109� and 1012� resistors on a ThermoFinniganDelta plus XL isotope ratio mass spectrometer. The samplepeak is bracketed by 6 square peaks of the MS running gas(3 before, 3 after the peak) and the running gas peak beforethe sample peak is assigned as internal reference peak. Forreferencing we use a stainless steel cylinder filled with wholeair by the University of Heidelberg, which is measured rou-tinely at least once per day in the same way as the sampleair. The isotopic composition of this air has been calibratedagainst mixtures of two pure H2 gases of certified isotopiccomposition (δD = +200.5‰ andδD = 9.0‰ vs. VSMOW,respectively, Messer Griesheim), which were diluted in H2-free air and analyzed the same way as the reference air.
Quantification of them/z =2 peak from a known amountof air allows the mixing ratio to be determined with a re-producibility of 1–2%, which is similar to state-of the art H2analyzers. The typical error of the analytical system based onrepetitions of reference air measurements is 2–5‰. The iso-
topic composition (δD) of the paraformaldehyde stock usedfor the experiments was determined by Agroisolab, Julich tobe (+70.0±1.4)‰ versus VSMOW.
3 Photochemical modeling
The research center Julich operates an advanced photochem-ical model specifically designed for evaluation and interpre-tation of SAPHIR experiments (e.g. Rohrer et al., 2005; Karlet al., 2006). Appendix A shows the full list of reactions andrate coefficients included in the SAPHIR model. The modelis initialized with the starting concentrations of the reactantsand photochemistry is driven by the photolysis frequencies.The isotopically substituted species HDCO and HD havebeen added to this model and were initialized according tothe δD values measured at the beginning of each experi-ment. The Isotope fractionation factor for reaction of HCHOwith OH KIEOH = kHCHO+OH/kHCDO+OH = 1.28± 0.01 isavailable from the literature (Feilberg et al., 2004), but itwill be shown below that oxidation of HCHO by OH canbe neglected in our experiments. The free parameters in themodel are the kinetic isotope effects in the molecular andradical channels of HCHO photolysis, KIEmol and KIErad,and their values were adjusted to minimize the difference be-tween model and experimental results.
4 Results
4.1 Control experiments
The drop of the H2 concentration in the two control experi-ments (Table 1), where the roof of the chamber is not openedis in accordance with the dilution derived from the replen-ishing flow, which is approximately 3.7%/h. The importantresult from the control experiments is that the isotopic com-position does not exhibit a significant change over a periodof several hours, which excludes artifacts from fractionationby dilution or possible wall effects. Furthermore, the experi-ment where HCHO is added shows the same dilution rate forH2 and HCHO, thus HCHO is stable in the reaction chamber.
www.atmos-chem-phys.net/10/5343/2010/ Atmos. Chem. Phys., 10, 5343–5357, 2010
5348 T. Rockmann et al.: Isotope effect in the formation of H2 from H2CO
42
Figure 3: Comparison of model and measurement results for the photochemically
important species NO, NO2 and O3.
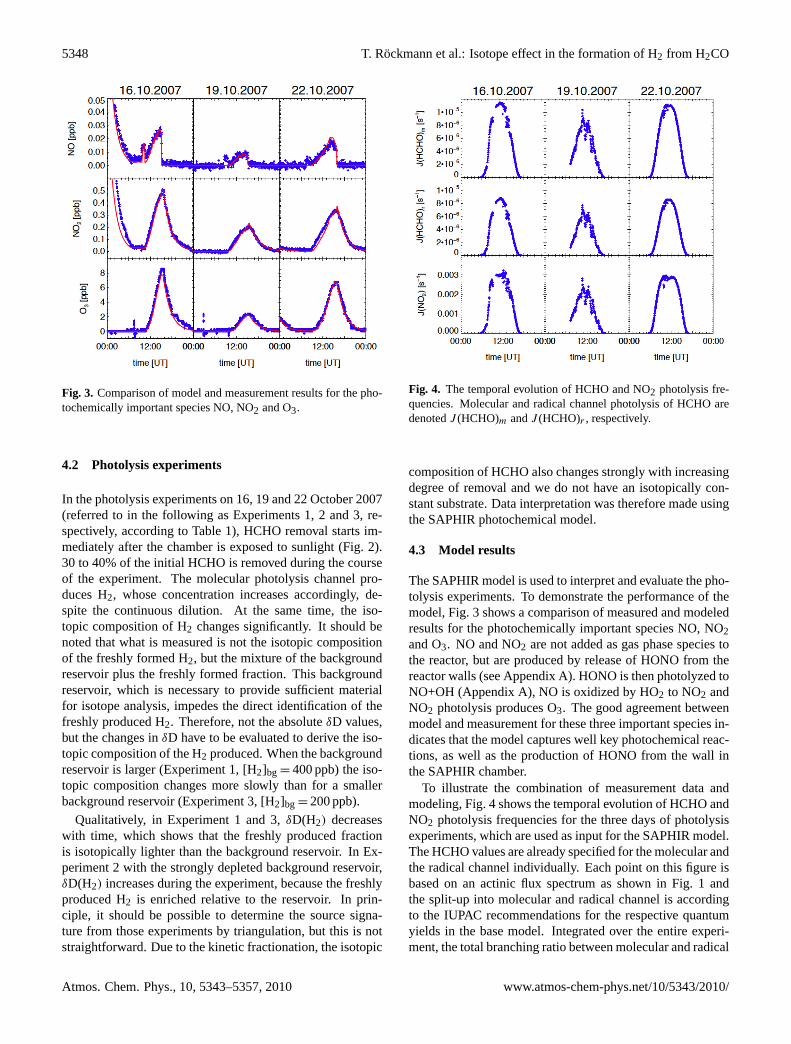
Fig. 3. Comparison of model and measurement results for the pho-tochemically important species NO, NO2 and O3.
4.2 Photolysis experiments
In the photolysis experiments on 16, 19 and 22 October 2007(referred to in the following as Experiments 1, 2 and 3, re-spectively, according to Table 1), HCHO removal starts im-mediately after the chamber is exposed to sunlight (Fig. 2).30 to 40% of the initial HCHO is removed during the courseof the experiment. The molecular photolysis channel pro-duces H2, whose concentration increases accordingly, de-spite the continuous dilution. At the same time, the iso-topic composition of H2 changes significantly. It should benoted that what is measured is not the isotopic compositionof the freshly formed H2, but the mixture of the backgroundreservoir plus the freshly formed fraction. This backgroundreservoir, which is necessary to provide sufficient materialfor isotope analysis, impedes the direct identification of thefreshly produced H2. Therefore, not the absoluteδD values,but the changes inδD have to be evaluated to derive the iso-topic composition of the H2 produced. When the backgroundreservoir is larger (Experiment 1, [H2]bg = 400 ppb) the iso-topic composition changes more slowly than for a smallerbackground reservoir (Experiment 3, [H2]bg= 200 ppb).
Qualitatively, in Experiment 1 and 3,δD(H2) decreaseswith time, which shows that the freshly produced fractionis isotopically lighter than the background reservoir. In Ex-periment 2 with the strongly depleted background reservoir,δD(H2) increases during the experiment, because the freshlyproduced H2 is enriched relative to the reservoir. In prin-ciple, it should be possible to determine the source signa-ture from those experiments by triangulation, but this is notstraightforward. Due to the kinetic fractionation, the isotopic
43
Figure 4: The temporal evolution of HCHO and NO2 photolysis frequencies. 850
Molecular and radical channel photolysis of HCHO are denoted J(HCHO)m and
J(HCHO)r, respectively.
Fig. 4. The temporal evolution of HCHO and NO2 photolysis fre-quencies. Molecular and radical channel photolysis of HCHO aredenotedJ (HCHO)m andJ (HCHO)r , respectively.
composition of HCHO also changes strongly with increasingdegree of removal and we do not have an isotopically con-stant substrate. Data interpretation was therefore made usingthe SAPHIR photochemical model.
4.3 Model results
The SAPHIR model is used to interpret and evaluate the pho-tolysis experiments. To demonstrate the performance of themodel, Fig. 3 shows a comparison of measured and modeledresults for the photochemically important species NO, NO2and O3. NO and NO2 are not added as gas phase species tothe reactor, but are produced by release of HONO from thereactor walls (see Appendix A). HONO is then photolyzed toNO+OH (Appendix A), NO is oxidized by HO2 to NO2 andNO2 photolysis produces O3. The good agreement betweenmodel and measurement for these three important species in-dicates that the model captures well key photochemical reac-tions, as well as the production of HONO from the wall inthe SAPHIR chamber.
To illustrate the combination of measurement data andmodeling, Fig. 4 shows the temporal evolution of HCHO andNO2 photolysis frequencies for the three days of photolysisexperiments, which are used as input for the SAPHIR model.The HCHO values are already specified for the molecular andthe radical channel individually. Each point on this figure isbased on an actinic flux spectrum as shown in Fig. 1 andthe split-up into molecular and radical channel is accordingto the IUPAC recommendations for the respective quantumyields in the base model. Integrated over the entire experi-ment, the total branching ratio between molecular and radical
Atmos. Chem. Phys., 10, 5343–5357, 2010 www.atmos-chem-phys.net/10/5343/2010/
T. Rockmann et al.: Isotope effect in the formation of H2 from H2CO 5349
channel photolysis of HCHO is≈ 58%: 42%, which is im-portant for the discussion below.
In Fig. 2 the measurements of HCHO mixing ratio, H2mixing ratio andδD(H2) are compared to values modeledwith the SAPHIR model. In all cases the model captures theevolution of the mixing ratios very well, which is expectedsince formaldehyde photolysis is well understood as regardschanges in concentration.
The new feature in this work is the incorporation of iso-tope information. HCHO and HCDO are modeled as sepa-rate species and the kinetic isotope effects KIEmol and KIEradin the two photolysis channels of HCHO and HCDO (Reac-tions R1 and R2) are included and can be adjusted to matchthe observations.
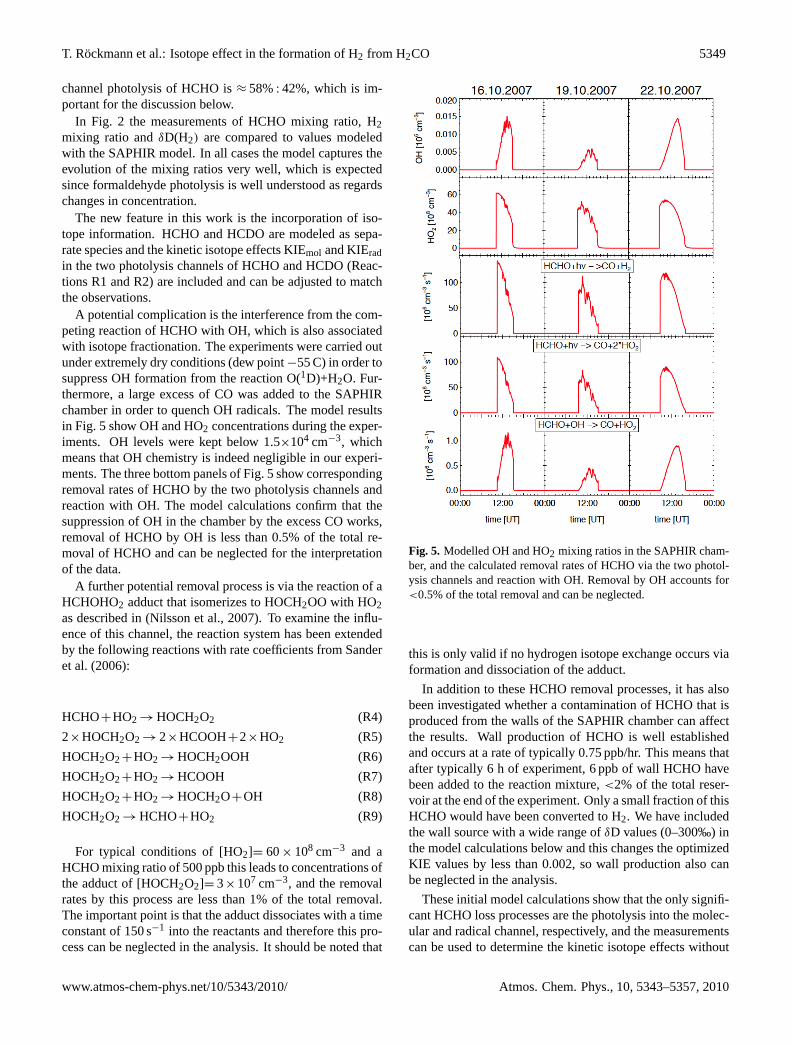
A potential complication is the interference from the com-peting reaction of HCHO with OH, which is also associatedwith isotope fractionation. The experiments were carried outunder extremely dry conditions (dew point−55 C) in order tosuppress OH formation from the reaction O(1D)+H2O. Fur-thermore, a large excess of CO was added to the SAPHIRchamber in order to quench OH radicals. The model resultsin Fig. 5 show OH and HO2 concentrations during the exper-iments. OH levels were kept below 1.5×104 cm−3, whichmeans that OH chemistry is indeed negligible in our experi-ments. The three bottom panels of Fig. 5 show correspondingremoval rates of HCHO by the two photolysis channels andreaction with OH. The model calculations confirm that thesuppression of OH in the chamber by the excess CO works,removal of HCHO by OH is less than 0.5% of the total re-moval of HCHO and can be neglected for the interpretationof the data.
A further potential removal process is via the reaction of aHCHOHO2 adduct that isomerizes to HOCH2OO with HO2as described in (Nilsson et al., 2007). To examine the influ-ence of this channel, the reaction system has been extendedby the following reactions with rate coefficients from Sanderet al. (2006):
HCHO+HO2 → HOCH2O2 (R4)
2×HOCH2O2 → 2×HCOOH+2×HO2 (R5)
HOCH2O2+HO2 → HOCH2OOH (R6)
HOCH2O2+HO2 → HCOOH (R7)
HOCH2O2+HO2 → HOCH2O+OH (R8)
HOCH2O2 → HCHO+HO2 (R9)
For typical conditions of [HO2]= 60× 108 cm−3 and aHCHO mixing ratio of 500 ppb this leads to concentrations ofthe adduct of [HOCH2O2]= 3×107 cm−3, and the removalrates by this process are less than 1% of the total removal.The important point is that the adduct dissociates with a timeconstant of 150 s−1 into the reactants and therefore this pro-cess can be neglected in the analysis. It should be noted that
44
855
Fig. 5. Modelled OH and HO2 mixing ratios in the SAPHIR cham-ber, and the calculated removal rates of HCHO via the two photol-ysis channels and reaction with OH. Removal by OH accounts for<0.5% of the total removal and can be neglected.
this is only valid if no hydrogen isotope exchange occurs viaformation and dissociation of the adduct.
In addition to these HCHO removal processes, it has alsobeen investigated whether a contamination of HCHO that isproduced from the walls of the SAPHIR chamber can affectthe results. Wall production of HCHO is well establishedand occurs at a rate of typically 0.75 ppb/hr. This means thatafter typically 6 h of experiment, 6 ppb of wall HCHO havebeen added to the reaction mixture,<2% of the total reser-voir at the end of the experiment. Only a small fraction of thisHCHO would have been converted to H2. We have includedthe wall source with a wide range ofδD values (0–300‰) inthe model calculations below and this changes the optimizedKIE values by less than 0.002, so wall production also canbe neglected in the analysis.
These initial model calculations show that the only signifi-cant HCHO loss processes are the photolysis into the molec-ular and radical channel, respectively, and the measurementscan be used to determine the kinetic isotope effects without
www.atmos-chem-phys.net/10/5343/2010/ Atmos. Chem. Phys., 10, 5343–5357, 2010
5350 T. Rockmann et al.: Isotope effect in the formation of H2 from H2CO
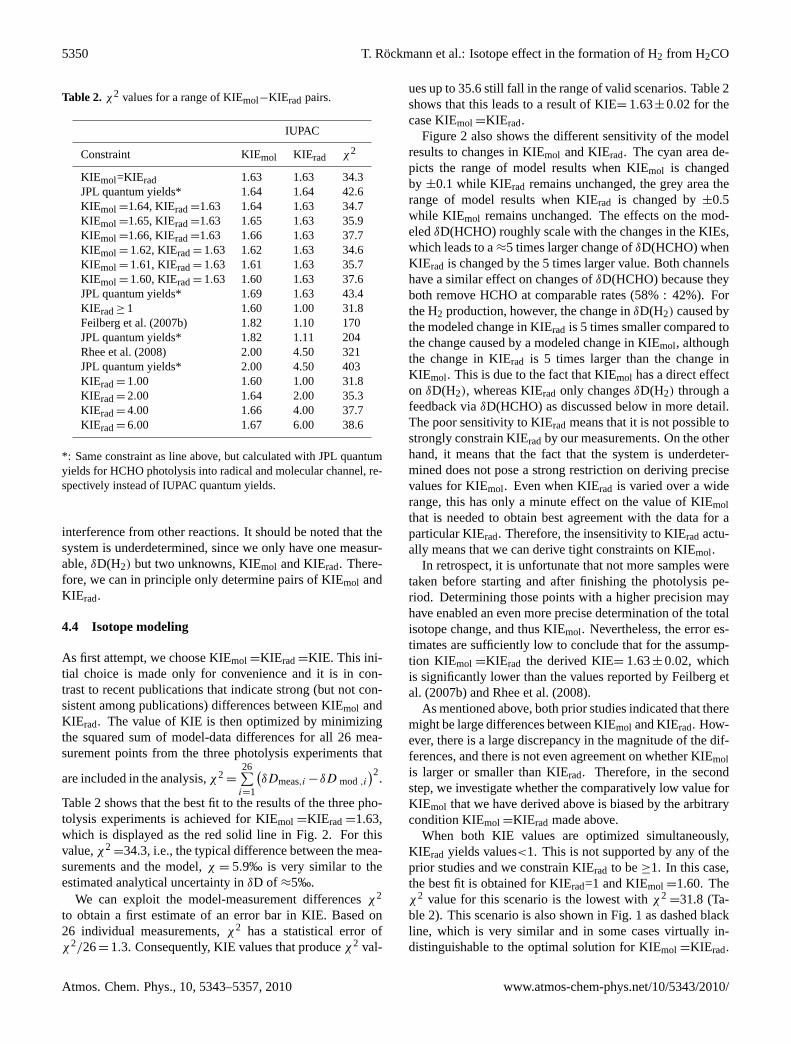
Table 2. χ2 values for a range of KIEmol−KIErad pairs.
IUPAC
Constraint KIEmol KIErad χ2
KIEmol=KIErad 1.63 1.63 34.3JPL quantum yields* 1.64 1.64 42.6KIEmol =1.64, KIErad=1.63 1.64 1.63 34.7KIEmol =1.65, KIErad=1.63 1.65 1.63 35.9KIEmol =1.66, KIErad=1.63 1.66 1.63 37.7KIEmol = 1.62, KIErad= 1.63 1.62 1.63 34.6KIEmol = 1.61, KIErad= 1.63 1.61 1.63 35.7KIEmol = 1.60, KIErad= 1.63 1.60 1.63 37.6JPL quantum yields* 1.69 1.63 43.4KIErad≥ 1 1.60 1.00 31.8Feilberg et al. (2007b) 1.82 1.10 170JPL quantum yields* 1.82 1.11 204Rhee et al. (2008) 2.00 4.50 321JPL quantum yields* 2.00 4.50 403KIErad= 1.00 1.60 1.00 31.8KIErad= 2.00 1.64 2.00 35.3KIErad= 4.00 1.66 4.00 37.7KIErad= 6.00 1.67 6.00 38.6
*: Same constraint as line above, but calculated with JPL quantumyields for HCHO photolysis into radical and molecular channel, re-spectively instead of IUPAC quantum yields.
interference from other reactions. It should be noted that thesystem is underdetermined, since we only have one measur-able,δD(H2) but two unknowns, KIEmol and KIErad. There-fore, we can in principle only determine pairs of KIEmol andKIErad.
4.4 Isotope modeling
As first attempt, we choose KIEmol =KIErad=KIE. This ini-tial choice is made only for convenience and it is in con-trast to recent publications that indicate strong (but not con-sistent among publications) differences between KIEmol andKIErad. The value of KIE is then optimized by minimizingthe squared sum of model-data differences for all 26 mea-surement points from the three photolysis experiments that
are included in the analysis,χ2=
26∑i=1
(δDmeas,i −δD mod ,i
)2.
Table 2 shows that the best fit to the results of the three pho-tolysis experiments is achieved for KIEmol =KIErad=1.63,which is displayed as the red solid line in Fig. 2. For thisvalue,χ2
=34.3, i.e., the typical difference between the mea-surements and the model,χ = 5.9‰ is very similar to theestimated analytical uncertainty inδD of ≈5‰.
We can exploit the model-measurement differencesχ2
to obtain a first estimate of an error bar in KIE. Based on26 individual measurements,χ2 has a statistical error ofχ2/26= 1.3. Consequently, KIE values that produceχ2 val-
ues up to 35.6 still fall in the range of valid scenarios. Table 2shows that this leads to a result of KIE= 1.63±0.02 for thecase KIEmol =KIErad.
Figure 2 also shows the different sensitivity of the modelresults to changes in KIEmol and KIErad. The cyan area de-picts the range of model results when KIEmol is changedby ±0.1 while KIErad remains unchanged, the grey area therange of model results when KIErad is changed by±0.5while KIEmol remains unchanged. The effects on the mod-eledδD(HCHO) roughly scale with the changes in the KIEs,which leads to a≈5 times larger change ofδD(HCHO) whenKIErad is changed by the 5 times larger value. Both channelshave a similar effect on changes ofδD(HCHO) because theyboth remove HCHO at comparable rates (58% : 42%). Forthe H2 production, however, the change inδD(H2) caused bythe modeled change in KIErad is 5 times smaller compared tothe change caused by a modeled change in KIEmol, althoughthe change in KIErad is 5 times larger than the change inKIEmol. This is due to the fact that KIEmol has a direct effecton δD(H2), whereas KIErad only changesδD(H2) through afeedback viaδD(HCHO) as discussed below in more detail.The poor sensitivity to KIErad means that it is not possible tostrongly constrain KIErad by our measurements. On the otherhand, it means that the fact that the system is underdeter-mined does not pose a strong restriction on deriving precisevalues for KIEmol. Even when KIErad is varied over a widerange, this has only a minute effect on the value of KIEmolthat is needed to obtain best agreement with the data for aparticular KIErad. Therefore, the insensitivity to KIErad actu-ally means that we can derive tight constraints on KIEmol.
In retrospect, it is unfortunate that not more samples weretaken before starting and after finishing the photolysis pe-riod. Determining those points with a higher precision mayhave enabled an even more precise determination of the totalisotope change, and thus KIEmol. Nevertheless, the error es-timates are sufficiently low to conclude that for the assump-tion KIEmol =KIErad the derived KIE= 1.63± 0.02, whichis significantly lower than the values reported by Feilberg etal. (2007b) and Rhee et al. (2008).
As mentioned above, both prior studies indicated that theremight be large differences between KIEmol and KIErad. How-ever, there is a large discrepancy in the magnitude of the dif-ferences, and there is not even agreement on whether KIEmolis larger or smaller than KIErad. Therefore, in the secondstep, we investigate whether the comparatively low value forKIEmol that we have derived above is biased by the arbitrarycondition KIEmol =KIErad made above.
When both KIE values are optimized simultaneously,KIErad yields values<1. This is not supported by any of theprior studies and we constrain KIErad to be≥1. In this case,the best fit is obtained for KIErad=1 and KIEmol =1.60. Theχ2 value for this scenario is the lowest withχ2
=31.8 (Ta-ble 2). This scenario is also shown in Fig. 1 as dashed blackline, which is very similar and in some cases virtually in-distinguishable to the optimal solution for KIEmol =KIErad.
Atmos. Chem. Phys., 10, 5343–5357, 2010 www.atmos-chem-phys.net/10/5343/2010/
T. Rockmann et al.: Isotope effect in the formation of H2 from H2CO 5351
Since KIEmol =1.60 is the optimum valued for KIErad ≥1,we extend our first error estimate to the value of KIEmol =
1.63± 0.03 to account for possible differences betweenKIEmol and KIErad.
It is interesting, and maybe counterintuitive, that bothKIEs are shifted in the same direction when adjusted in-dependently. KIEmol directly influences the isotopic com-position of the product H2, and when KIEmol is decreased,δD(H2) increases accordingly. KIErad, on the other hand,has only an indirect effect by changing the isotopic compo-sition of the formaldehyde reservoir that remains for H2 for-mation. At the start of the experiment changing KIErad hasno effect at all. In the course of the experiment, smaller val-ues of KIErad (i.e., relatively faster HCDO removal via theradical channel) lead to a decrease ofδD(HCHO) in the re-maining formaldehyde reservoir. To make up for the lowerδD(HCHO) value, KIEmol also has to be decreased in themodel to still explain the sameδD(H2) value. This explainsthe fact that optimized pairs of KIEmol and KIErad are eitherboth higher or both lower than the value of 1.63 found forKIEmol =KIErad.
Based on these theoretical considerations, it can alreadybe deduced that it is impossible to quantitatively reconcilethe results of Feilberg et al. (2007b) with the new dataset,as KIEmol from Feilberg et al. (2007b) is significantly largerand KIErad significantly smaller than the new values derivedfor KIEmol =KIErad. The KIErad=1.10 derived in Feilberg etal. (2007b) would require a KIEmol at the low end of the errorrange (≈1.60), even increasing the discrepancy of our bestestimated to the KIEmol determined in Feilberg et al. (2007b).Concerning the results by Rhee et al. (2008) KIErad andKIEmol deviate in the same direction, but the differences arealso much larger. Even the extreme value of KIErad=4.5 isnot sufficient to compensate for the only slightly higher valueof KIEmol =2.0 because of the lack in sensitivity to KIErad.The third group of values in Table 2 shows optimized valuesof KIEmol for a wide range of KIErad values (between 1 and6). Even for these extreme cases, the optimized KIEmol onlyvaries between 1.60 and 1.66. Also, theχ2 value increaseswith increasing values for KIErad and KIEmol, thus lower val-ues are more likely. Fig. 2 also shows model results obtainedwith the parameters from Feilberg et al. (2007b) and Rhee etal. (2008), and it is clear that they do not yield satisfactoryagreement with the observations.
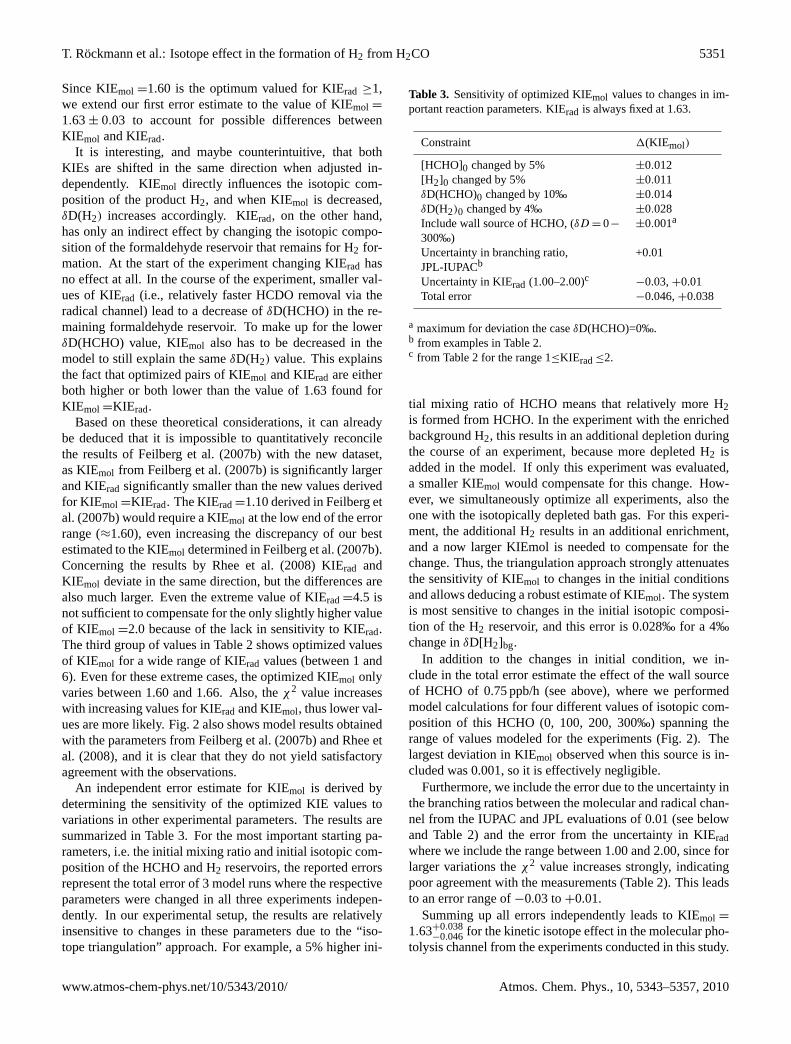
An independent error estimate for KIEmol is derived bydetermining the sensitivity of the optimized KIE values tovariations in other experimental parameters. The results aresummarized in Table 3. For the most important starting pa-rameters, i.e. the initial mixing ratio and initial isotopic com-position of the HCHO and H2 reservoirs, the reported errorsrepresent the total error of 3 model runs where the respectiveparameters were changed in all three experiments indepen-dently. In our experimental setup, the results are relativelyinsensitive to changes in these parameters due to the “iso-tope triangulation” approach. For example, a 5% higher ini-
Table 3. Sensitivity of optimized KIEmol values to changes in im-portant reaction parameters. KIErad is always fixed at 1.63.
Constraint 1(KIEmol)
[HCHO]0 changed by 5% ±0.012[H2]0 changed by 5% ±0.011δD(HCHO)0 changed by 10‰ ±0.014δD(H2)0 changed by 4‰ ±0.028Include wall source of HCHO, (δD = 0−
300‰)±0.001a
Uncertainty in branching ratio,JPL-IUPACb
+0.01
Uncertainty in KIErad (1.00–2.00)c −0.03,+0.01Total error −0.046,+0.038
a maximum for deviation the caseδD(HCHO)=0‰.b from examples in Table 2.c from Table 2 for the range 1≤KIErad≤2.
tial mixing ratio of HCHO means that relatively more H2is formed from HCHO. In the experiment with the enrichedbackground H2, this results in an additional depletion duringthe course of an experiment, because more depleted H2 isadded in the model. If only this experiment was evaluated,a smaller KIEmol would compensate for this change. How-ever, we simultaneously optimize all experiments, also theone with the isotopically depleted bath gas. For this experi-ment, the additional H2 results in an additional enrichment,and a now larger KIEmol is needed to compensate for thechange. Thus, the triangulation approach strongly attenuatesthe sensitivity of KIEmol to changes in the initial conditionsand allows deducing a robust estimate of KIEmol. The systemis most sensitive to changes in the initial isotopic composi-tion of the H2 reservoir, and this error is 0.028‰ for a 4‰change inδD[H2]bg.
In addition to the changes in initial condition, we in-clude in the total error estimate the effect of the wall sourceof HCHO of 0.75 ppb/h (see above), where we performedmodel calculations for four different values of isotopic com-position of this HCHO (0, 100, 200, 300‰) spanning therange of values modeled for the experiments (Fig. 2). Thelargest deviation in KIEmol observed when this source is in-cluded was 0.001, so it is effectively negligible.
Furthermore, we include the error due to the uncertainty inthe branching ratios between the molecular and radical chan-nel from the IUPAC and JPL evaluations of 0.01 (see belowand Table 2) and the error from the uncertainty in KIEradwhere we include the range between 1.00 and 2.00, since forlarger variations theχ2 value increases strongly, indicatingpoor agreement with the measurements (Table 2). This leadsto an error range of−0.03 to+0.01.
Summing up all errors independently leads to KIEmol =
1.63+0.038−0.046 for the kinetic isotope effect in the molecular pho-
tolysis channel from the experiments conducted in this study.
www.atmos-chem-phys.net/10/5343/2010/ Atmos. Chem. Phys., 10, 5343–5357, 2010
5352 T. Rockmann et al.: Isotope effect in the formation of H2 from H2CO
The SAPHIR model also calculatesδD(HCHO), whichcould not be determined experimentally.δD(HCHO) valuesincrease by∼100 to 200‰ in the model, depending on therelative removal fraction. These are large changes and al-though it appears to be very difficult to obtain high precisionin isotope measurements on HCHO, the precision achievedin the only publication that is available to date (±50‰; Riceand Quay, 2006) would be sufficient to detect changes of thismagnitude.
4.5 Discussion
It is intriguing that three different studies of the KIEs inthe photolysis of formaldehyde yield three different results.Therefore, in the following we attempt to explain the differ-ences. We first recall the relation between KIEmol, KIEradand KIEtot. βmol andβrad are the relative photolysis yieldsof the molecular and radical channel, respectively, and fornear-natural isotope abundance,βmol andβrad can be approx-imated by the branching ratios for the non-deuterated HCHOmolecules. In this case
1
KIEtot=
JHDCO
JHHCO
=JHDCO→HD+CO+JHDCO→H+DCO+JHDCO→D+HCO
JHHCO→HH+CO+JHHCO→H+HCO
=JHDCO→HD+CO
JHHCO→HH+CO+JHHCO→H+HCO
+JHDCO→H+DCO+JHDCO→D+HCO
JHHCO→HH+CO+JHHCO→H+HCO
=JHDCO→HD+CO
JHHCO→HH+CO×
JHHCO→HH+CO
JHHCO→HH+CO+JHHCO→H+HCO
+JHDCO→H+DCO+JHDCO→D+HCO
JHHCO→H+HCO
×JHHCO→H+HCO
JHHCO→HH+CO+JHHCO→H+HCO
=1
KIEmolβmol+
1
KIEradβrad
=1
KIEmolβmol+
1
KIErad(1−βmol)
Solving for βmol with the KIE values from Feilberg etal. (2007) returnsβmol = 0.77. Whereas there are still consid-erable uncertainties in radical and molecular channel quan-tum yields between the IUPAC and JPL recommendations(IUPAC: βmol ≈ 0.56, JPL:βmol ≈ 0.63 for typical atmo-spheric conditions) (Sander et al., 2006; Atkinson et al.,2006) both values imply a considerable lower value for themolecular channel. This indicates an overestimate of themolecular photolysis channel in Feilberg et al. (2007). Theimplications of a potential overestimate ofβmol for the deter-mination of KIEmol and KIErad can be qualitatively assessed.
The experiments of Feilberg et al. (2007) were carried outwith strongly labeled formaldehyde. Ifβmol is overestimated,this means effectively that HD production is overestimatedcompared to the present study. To compensate for the higherflux into the molecular channel, KIEmol needs to be increasedand KIErad decreased. The result is that relatively less D isdirected into the molecular channel, which counteracts thehigherβmol = 0.77. Note that due to analytical problems, noconcentration data were available for the Feilberg et al. ex-periments, so that the flux into the molecular channel couldnot be quantified by H2 measurements. Whereas the discrep-ancy in the calculated branching ratios between the two stud-ies should be investigated in detail, the effect outlined abovemay resolve at least part of the deviations between Feilberget al. (2007) and the present study.
Table 2 also lists the results of the present experimentswhen instead of the IUPAC recommendations for the branch-ing ratio between the molecular and radical channels, the JPLrecommendations are used. The results only change by 0.01and a sensitivity analysis showed that this is largely due tothe “triangulation” approach in the experiments. As the H2formed is isotopically between the light and heavy reservoirs,it can be constrained very robustly. Changes that would tendto make the model results either heavier or lighter for a sin-gle reservoir gas (by compensation of e.g. branching ratioand KIE as explained above) lead to large discrepancies forthe experiment with the other H2 reservoir. The freshly pro-duced H2 has to have a well-defined isotopic composition inbetween the two reservoirs. Finally, the higher values ofχ2
for the optimizations using the branching ratios from JPL in-dicate that the IUPAC values are in slightly better agreementwith our experimental results, but the experiments are not re-ally designed to distinguish these differences.
Rhee et al. (2008) conducted formaldehyde photolysis ex-periments in 0.1 to 3 L glass or quartz photochemical reac-tors, employing HCHO mixing ratios between 0.4 and 3 ppmand photolysis times between 1 h and 17 days. Although sta-bility was verified in one experiment for 2 days, the affinityof formaldehyde to stick to surfaces constitutes a potentialsource of error in these experiments. Furthermore, no radicalquencher was used, and the interference from radical reac-tions was only determined using a model, but without directsupporting measurements of fast photochemistry. A thirdimportant uncertainty is that the isotopic composition of theoriginal HCHO was not determined independently. Rather, itwas inferred from the H2 product after complete photolysisof pure HCHO to H2 with a mercury photolysis lamp, underthe assumption that the HCHO is quantitatively converted toH2. This means that in the absence of other reactants, alsothe products from the radical channel H and HCO recombineto form H2. This was postulated by (McQuigg and Calvert,1969), but it is possible that radical reactions with moleculesadsorbed at the reactor surface constitute another loss pro-cess. Also H2O2 can be formed in the presence of O2 viaHO2.
Atmos. Chem. Phys., 10, 5343–5357, 2010 www.atmos-chem-phys.net/10/5343/2010/
T. Rockmann et al.: Isotope effect in the formation of H2 from H2CO 5353
Whereas the partitioning between KIEmol and KIErad inFeilberg et al. (2007) may be affected by the branching ra-tios of 77%:23% between the molecular and radical chan-nel, respectively, the value of KIEtot = 1.58±0.03 was di-rectly measured by FTIR spectroscopy in a relative rate ex-periment using highly enriched HCHO-HCDO mixtures andis considered a robust measurement result. The value ofKIEmol = 1.63+0.038
−0.046 derived above agrees within the com-bined error bars with the value of 1.58±0.03 from Feilberget al. (2007b). This indicates that the value of KIErad, whichmust account for the difference, may not be as different fromKIEmol as concluded in prior studies. Exploring the best es-timates and combined error ranges of KIEtot from Feilberget al. (2007b) and KIEmol from the present study leads to avalue of KIErad= 1.51+0.13
−0.15.It is important to note that this estimate is derived from
combining results from two experiments that were done un-der different photochemical and experimental conditions.The Feilberg et al. (2007b) experiments were carried out atthe photochemical reactor EUPHORE in Valencia, Spain, inlate spring, and with isotopically labeled material.
A precise determination of the KIEs in both photolysischannels is very important for the evaluation of the globalisotope budget of molecular hydrogen (Gerst and Quay,2001; Rockmann et al., 2003; Rhee et al., 2008; Feilberget al., 2007b, 2005a, 2007a; Price et al., 2007). Even dis-regarding the feedback via the radical channel, a changeof KIEmol from 1.82 to 1.63 implies that the isotopic com-position of H2 from HCHO photolysis decreases by 117‰(1.63−1/1.82−1
−1). This is a huge change, given that pho-tochemistry via HCHO constitutes about 50% of the globalH2 source. Pieterse et al. (2009) already noted that in a sim-ple box model of the isotopic composition of atmosphericH2, it was difficult to close the isotope budget with the orig-inal values from Feilberg et al. (2007b). It was necessary todecrease the difference between KIEmol and KIErad in orderto close the budget. This is confirmed by new calculationswith the global chemical tracer model TM5 (Pieterse et al.,2010), where also the pressure effect of KIEmol has been in-cluded (Nilsson et al., 2010). The isotope budget is muchbetter closed when the parameterization of the pressure de-pendence is constrained to the value KIEmol = 1.63 at atmo-spheric pressure that is derived here. If the value of 1.82 isused, the modeled isotopic composition of atmospheric H2is far too depleted, which would imply a large uncertainty inother parts of the H2 budget.
In summary, the present study presents a well-constrainedvalue for KIEmol. Together with KIEtot from Feilberg etal. (2007b), this implies a rather small difference betweenKIEmol and KIErad, confirming the suggestion by Pieterse etal. (2009). The model calculations show that direct deter-mination ofδD(HCHO) would help constraining both frac-tionation factors from a single photolysis experiment withnon-labeled formaldehyde. However,δD measurements onformaldehyde are difficult, and the only published techniquefor atmosphericδD(HCHO) reached a precision of±50‰only (Rice and Quay, 2006), which is of the order of the mod-eled differences between the scenarios in Fig. 2. Thus, at thisprecision, such an experiment may not allow a very precisequantification.
5 Conclusions
Three formaldehyde photolysis experiments have been car-ried out in the SAPHIR atmosphere simulation chamber todetermine the associated isotope effects. This was the firststudy where both, large reactor volumes and near-naturalisotope abundance were employed. Similar results are ob-tained when using two isotopically different H2 gases asbackground. Our results allow to closely constrain the kineticisotope effect in the molecular photolysis channel (KIEmol)
to 1.63+0.038−0.046. With the present experiments, the kinetic iso-
tope effect in the radical channel (KIErad) cannot be con-strained, because H2 is not formed in this channel and theresults are not sensitive to the indirect effect via the effecton the HCHO reservoir. The value for KIEmol = 1.63+0.038
−0.046determined here is close to the reported total kinetic isotopeeffect KIEtot = 1.58±0.03 from Feilberg et al. (2007b), incontrast to the results from Feilberg et al. (2007b) and Rheeet al. (2008). So if KIEmol from this study is combined withKIEtot from Feilberg et al. (2007b), mass balance requiresthat KIErad is also not as different at atmospheric surfacepressure as concluded in the prior studies. Some of the dis-crepancy between the results from different research groupsappears to result from discrepancies in the branching ratiosbetween the molecular and radical channel of HCHO photol-ysis.
www.atmos-chem-phys.net/10/5343/2010/ Atmos. Chem. Phys., 10, 5343–5357, 2010
5354 T. Rockmann et al.: Isotope effect in the formation of H2 from H2CO
Appendix A
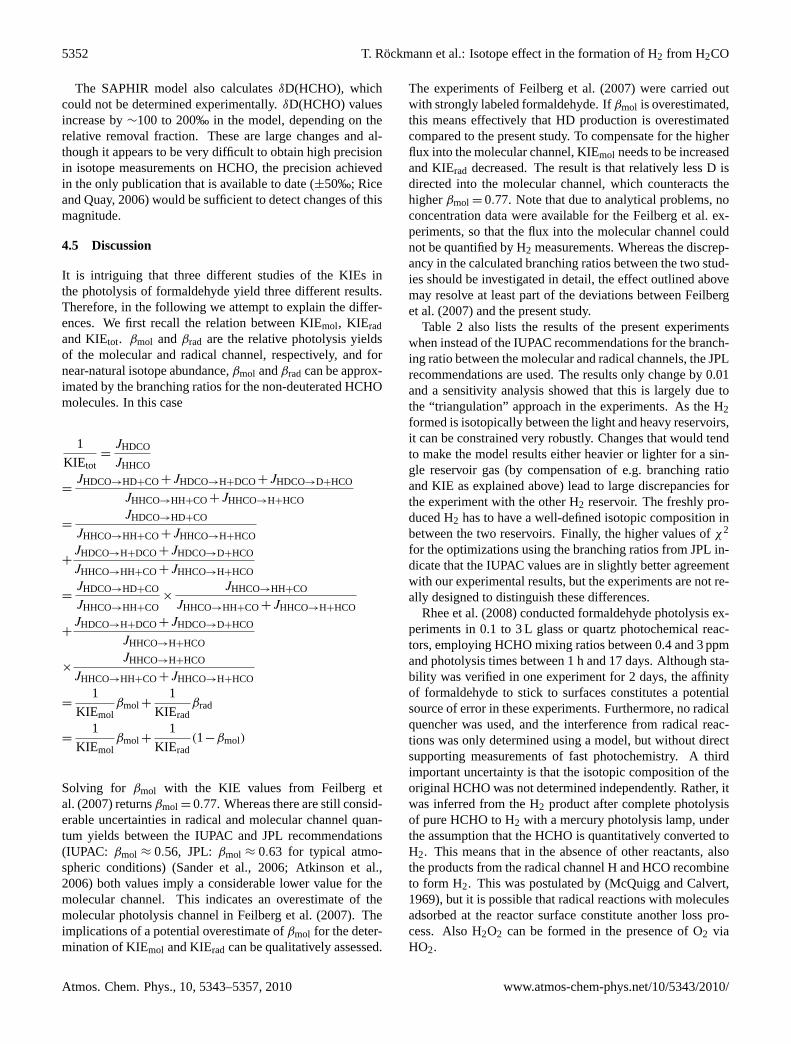
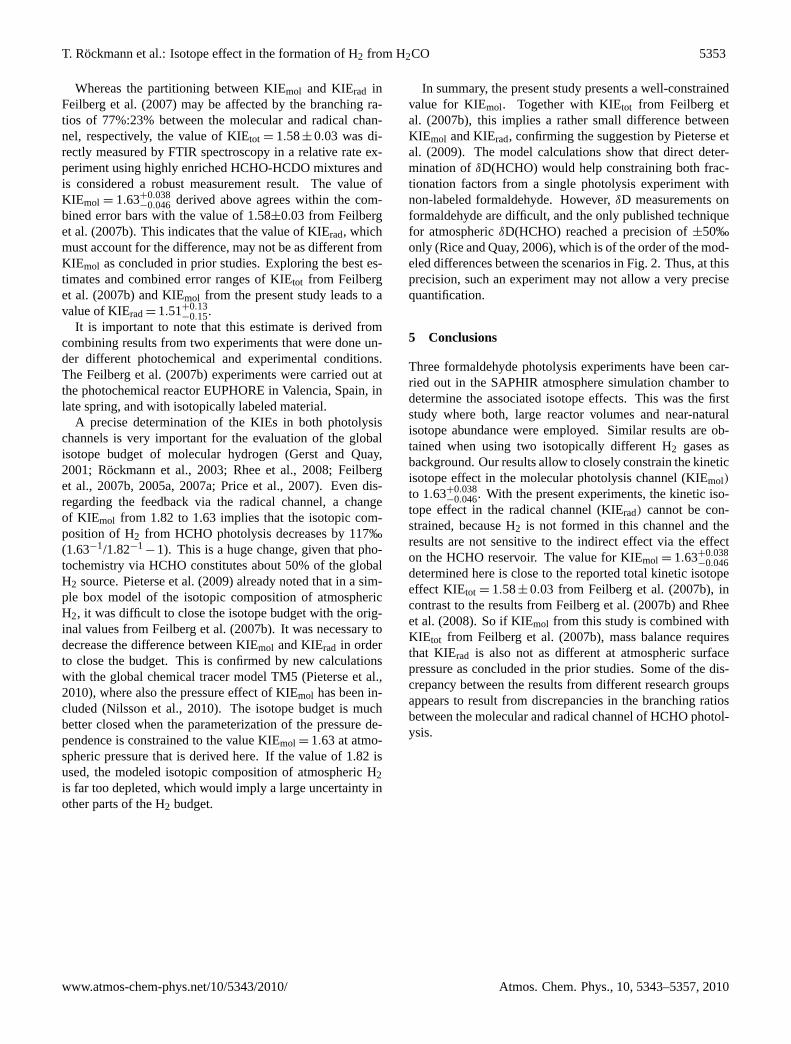
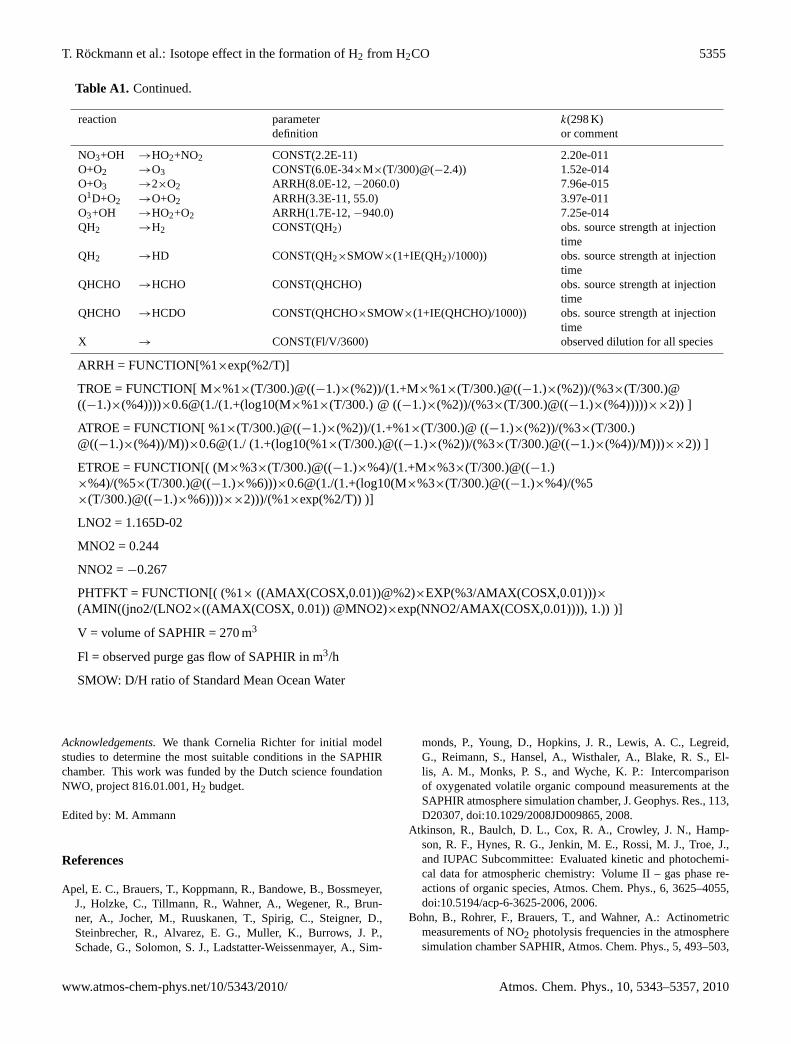
Table A1. List of reactions included in the SAPHIR photochemical model. Rate coefficients are from (Sander et al., 2006).
reaction parameter k(298 K)definition or comment
H2O2+hν →2×OH CONST(jh2o2) observedHCHO+hν →CO+2×HO2 CONST(jhchor) observedHCHO+hν →CO+H2 CONST(jhchom) observedHCDO+hν →CO+2×HO2 CONST(jhchor/kIEr) observedHCDO+hν →CO+HD CONST(jhchom/kIEm) observedHNO2+hν →NO+OH CONST(jhono) observedHNO3+hν →NO2+OH PHTFKT(9.312D−07, 1.230,−0.307) scaled to jno2HNO4+hν →0.65×HO2+0.65×NO2
+0.35×NO3+0.35×OHCONST(3.17E-6×jno2/6e-3) scaled to jno2
NO2+hν →NO+O CONST(jno2) observedNO3+hν →NO+O2 PHTFKT(2.485D-02, 0.168,−0.108) scaled to jno2NO3+hν →NO2+O PHTFKT(1.747D-01, 0.155,−0.125) scaled to jno2O3+hν →O+O2 PHTFKT(4.775D-04, 0.298,−0.080) scaled to jno2O3+hν →O1D+O2 CONST(jo1d) observedWALL+hν →HNO2 CONST(4.75×4.7e13×jno2× scaled to jno2
(1+(RH/11.6)×(RH/11.6))×exp(−3950/T))2×HO2 →H2O2+O2 CONST(3.5E-13×exp(430/T)+1.7E-
33×exp(1000/T)×M)2.70e-012
2×NO+O2 →2×NO2 ARRH(3.3E-39, 530.0) 1.95e-0382×NO3 →2×NO2+O2 ARRH(8.5E-13,−2450.0) 2.28e-016CO+OH →CO2+HO2 ATROE (1.5e-13,−0.6, 2.1e9,−6.1) 1.40e-013H2+OH →H2O+HO2 ARRH (2.8E-12,−1800.0) 6.67e-015H2O+2×HO2 →H2O+H2O2+O2 CONST(3.22E-34×exp(2800/T)+2.38E-
34×exp(3200/T)×1E-20×M)6.62e-030
H2O+O1D →2×OH ARRH(1.63E-10, 60.0) 1.99e-010H2O2+OH →H2O+HO2 CONST(1.8e-12) 1.80e-012HCDO+OH →CO+H2O+HO2 ARRH(5.5e-12/1.28,125) 6.54e-012HCHO+OH →CO+H2O+HO2 ARRH(5.5e-12, 125) 8.37e-012HD+OH →H2O+HO2 ARRH(2.8E-12/1.65,−1800.0) 4.04e-015HNO2+OH →H2O+NO2 ARRH(1.8E-11,-390.0) 4.86e-012HNO3+OH →H2O+NO3 CONST(2.4E-14×exp(460/T)+6.5E-34×exp(1335/T) 1.54e-013
×M/(1+(6.5E-34×exp(1335/T)×M)/(2.7E-17×exp(2199/T))))(1+(6.5E-34×exp(1335/T)×M)/(2.7E-17×exp(2199/T)))
HNO4+OH →H2O+NO2+O2 ARRH(1.3E-12, 380.0) 4.65e-012HNO4 →HO2+NO2 ETROE(2.1E-27, 10900.0, 2.0E-31, 3.4, 2.9E-12, 1.1) 7.12e-002HO2+NO →NO2+OH ARRH(3.5e-12, 250) 8.10e-012HO2+NO2 →HNO4 TROE(2.0E-31, 3.4,2.9E-12, 1.1) 1.15e-012HO2+NO3 →0.3×HNO3+0.7
×NO2+O2+0.7×OHCONST(3.5E-12) 3.50e-012
HO2+O3 →2×O2+OH ARRH(1.0E-14,−490.0) 1.93e-015HO2+OH →H2O+O2 ARRH(4.8E-11, 250.0) 1.11e-010N2+O1D →N2+O ARRH(2.15E-11, 110.0) 3.11e-011N2O5 →NO2+NO3 ETROE(2.7E-27, 11000.0, 2.0E-30, 4.4, 1.4E-12, 0.7) 4.07e-002NO+NO3 →2×NO2 ARRH(1.5E-11, 170.0) 2.65e-011NO+O →NO2 TROE(9.0E-32, 1.5, 3.0E-11, 0.0) 1.68e-012NO+O3 →NO2+O2 ARRH(3.0E-12,−1500.0) 1.95e-014NO+OH →HNO2 TROE(7.0E-31, 2.6, 3.6E-11, 0.1) 7.47e-012NO2+NO3 →N2O5 TROE(2.0E-30, 4.4, 1.4E-12, 0.7) 1.18e-012NO2+NO3 →NO+NO2+O2 ARRH(4.5E-14,−1260.0) 6.56e-016NO2+O →NO+O2 ARRH(5.1E-12, 210.0) 1.03e-011NO2+O →NO3 TROE(2.5E-31, 1.8, 2.2E-11, 0.7) 3.32e-012NO2+O3 →NO3+O2 ARRH(1.2E-13,−2450.0) 3.23e-017NO2+OH →HNO3 TROE(1.8E-30, 3.0, 2.8E-11, 0) 1.07e-011
Atmos. Chem. Phys., 10, 5343–5357, 2010 www.atmos-chem-phys.net/10/5343/2010/
T. Rockmann et al.: Isotope effect in the formation of H2 from H2CO 5355
Table A1. Continued.
reaction parameter k(298 K)definition or comment
NO3+OH →HO2+NO2 CONST(2.2E-11) 2.20e-011O+O2 →O3 CONST(6.0E-34×M×(T/300)@(−2.4)) 1.52e-014O+O3 →2×O2 ARRH(8.0E-12,−2060.0) 7.96e-015O1D+O2 →O+O2 ARRH(3.3E-11, 55.0) 3.97e-011O3+OH →HO2+O2 ARRH(1.7E-12,−940.0) 7.25e-014QH2 →H2 CONST(QH2) obs. source strength at injection
timeQH2 →HD CONST(QH2×SMOW×(1+IE(QH2)/1000)) obs. source strength at injection
timeQHCHO →HCHO CONST(QHCHO) obs. source strength at injection
timeQHCHO →HCDO CONST(QHCHO×SMOW×(1+IE(QHCHO)/1000)) obs. source strength at injection
timeX → CONST(Fl/V/3600) observed dilution for all species
ARRH = FUNCTION[%1×exp(%2/T)]
TROE = FUNCTION[ M×%1×(T/300.)@((−1.)×(%2))/(1.+M×%1×(T/300.)@((−1.)×(%2))/(%3×(T/300.)@((−1.)×(%4))))×0.6@(1./(1.+(log10(M×%1×(T/300.) @ ((−1.)×(%2))/(%3×(T/300.)@((−1.)×(%4)))))××2)) ]
ATROE = FUNCTION[ %1×(T/300.)@((−1.)×(%2))/(1.+%1×(T/300.)@ ((−1.)×(%2))/(%3×(T/300.)@((−1.)×(%4))/M))×0.6@(1./ (1.+(log10(%1×(T/300.)@((−1.)×(%2))/(%3×(T/300.)@((−1.)×(%4))/M)))××2)) ]
ETROE = FUNCTION[( (M×%3×(T/300.)@((−1.)×%4)/(1.+M×%3×(T/300.)@((−1.)×%4)/(%5×(T/300.)@((−1.)×%6)))×0.6@(1./(1.+(log10(M×%3×(T/300.)@((−1.)×%4)/(%5×(T/300.)@((−1.)×%6))))××2)))/(%1×exp(%2/T)) )]
LNO2 = 1.165D-02
MNO2 = 0.244
NNO2 =−0.267
PHTFKT = FUNCTION[( (%1× ((AMAX(COSX,0.01))@%2)×EXP(%3/AMAX(COSX,0.01)))×(AMIN((jno2/(LNO2×((AMAX(COSX, 0.01)) @MNO2)×exp(NNO2/AMAX(COSX,0.01)))), 1.)) )]
V = volume of SAPHIR = 270 m3
Fl = observed purge gas flow of SAPHIR in m3/h
SMOW: D/H ratio of Standard Mean Ocean Water
Acknowledgements.We thank Cornelia Richter for initial modelstudies to determine the most suitable conditions in the SAPHIRchamber. This work was funded by the Dutch science foundationNWO, project 816.01.001, H2 budget.
Edited by: M. Ammann
References
Apel, E. C., Brauers, T., Koppmann, R., Bandowe, B., Bossmeyer,J., Holzke, C., Tillmann, R., Wahner, A., Wegener, R., Brun-ner, A., Jocher, M., Ruuskanen, T., Spirig, C., Steigner, D.,Steinbrecher, R., Alvarez, E. G., Muller, K., Burrows, J. P.,Schade, G., Solomon, S. J., Ladstatter-Weissenmayer, A., Sim-
monds, P., Young, D., Hopkins, J. R., Lewis, A. C., Legreid,G., Reimann, S., Hansel, A., Wisthaler, A., Blake, R. S., El-lis, A. M., Monks, P. S., and Wyche, K. P.: Intercomparisonof oxygenated volatile organic compound measurements at theSAPHIR atmosphere simulation chamber, J. Geophys. Res., 113,D20307, doi:10.1029/2008JD009865, 2008.
Atkinson, R., Baulch, D. L., Cox, R. A., Crowley, J. N., Hamp-son, R. F., Hynes, R. G., Jenkin, M. E., Rossi, M. J., Troe, J.,and IUPAC Subcommittee: Evaluated kinetic and photochemi-cal data for atmospheric chemistry: Volume II – gas phase re-actions of organic species, Atmos. Chem. Phys., 6, 3625–4055,doi:10.5194/acp-6-3625-2006, 2006.
Bohn, B., Rohrer, F., Brauers, T., and Wahner, A.: Actinometricmeasurements of NO2 photolysis frequencies in the atmospheresimulation chamber SAPHIR, Atmos. Chem. Phys., 5, 493–503,
www.atmos-chem-phys.net/10/5343/2010/ Atmos. Chem. Phys., 10, 5343–5357, 2010
5356 T. Rockmann et al.: Isotope effect in the formation of H2 from H2CO
doi:10.5194/acp-5-493-2005, 2005.Bottinga, Y.: Hydrogen Isotope Equilibria in System Hydrogen-
Water, J. Phys. Chem., 72, 4338–4340, 1968.Brauers, T., Bossmeyer, J., Dorn, H.-P., Schlosser, E., Tillmann,
R., Wegener, R., and Wahner, A.: Investigation of the formalde-hyde differential absorption cross section at high and low spectralresolution in the simulation chamber SAPHIR, Atmos. Chem.Phys., 7, 3579–3586, doi:10.5194/acp-7-3579-2007, 2007.
Brenninkmeijer, C. A. M., Janssen, C., Kaiser, J., Rockmann, T.,Rhee, T. S., and Assonov, S. S.: Isotope effects in the chemistryof atmospheric trace gases, Chem. Rev., 103, 5125–5162, 2003.
Ehhalt, D. H. and Rohrer, F.: The tropospheric cycle of H2: a criti-cal review, Tellus B, 61, 500–535, 2009.
Feck, T., Grooss, J. U., and Riese, M.: Sensitivity of Arctic ozoneloss to stratospheric H2O, Geophys. Res. Lett., 35, L01803,doi:10.01029/02007GL031334, 2008.
Feilberg, K. L., Johnson, M. S., and Nielsen, C. J.: Relative reactionrates of HCHO, HCDO, DCDO, (HCHO)-13C, and (HCHO)-18O with OH, Cl, Br, and NO3 radicals, J. Phys. Chem. A, 108,7393–7398, 2004.
Feilberg, K. L., D’Anna, B., Johnson, M. S., and Nielsen, C. J.:Relative tropospheric photolysis rates of HCHO, (HCHO)-13C,(HCHO)-18O, and DCDO measured at the European photoreac-tor facility, J. Phys. Chem. A, 109, 8314–8319, 2005a.
Feilberg, K. L., Griffith, D. W. T., Johnson, M. S., and Nielsen, C.J.: The13C and D kinetic isotope effects in the reaction of CH4with Cl, Int. J. Chem. Kinet., 37, 110–118, 2005b.
Feilberg, K. L., D’Anna, B., Johnson, M. S., and Nielsen, C. J.:Relative tropospheric photolysis rates of HCHO, (HCHO)-13C,(HCHO)-18O, and DCDO measured at the European photoreac-tor facility J. Phys. Chem. A, 111, 992–992, 2007a.
Feilberg, K. L., Johnson, M. S., Bacak, A., Rockmann, T., andNielsen, C. J.: Relative tropospheric photolysis rates of HCHOand HCDO measured at the European photoreactor facility, J.Phys. Chem. A, 111, 9034–9046, 2007b.
Gerst, S. and Quay, P.: The deuterium content of atmosphericmolecular hydrogen: Method and initial measurements, J. Geo-phys. Res., 105, 26433–26445, 2000.
Gerst, S. and Quay, P.: Deuterium component of the global molec-ular hydrogen cycle, J. Geophys. Res., 106, 5021–5031, 2001.
Gierzak, T., Talukdar, R. K., Herndon, S. C., Vaghjiani, G. L., andRavishankara, A. R.: Rate coefficients for reactions of hydroxylradicals with methane and deuterated methanes, J. Phys. Chem.,101, 3125–3134, 1997.
McQuigg, R. D. and Calvert, J. G.: The Photodecomposition ofCH2O, CD2O, CHDO, and CH2O-CD2O Mixtures at XenonFlash Lamp Intensities, J. Am. Chem. Soc., 91, 1590–1599,1969.
Nilsson, E. J. K., Johnson, M. S., Taketani, F., Matsumi, Y., Hurley,M. D., and Wallington, T. J.: Atmospheric deuterium fractiona-tion: HCHO and HCDO yields in the CH2DO + O2 reaction, At-mos. Chem. Phys., 7, 5873–5881, doi:10.5194/acp-7-5873-2007,2007.
Nilsson, E. J. K., Andersen, V. F., Skov, H., and Johnson, M. S.:Pressure dependence of the deuterium isotope effect in the pho-tolysis of formaldehyde by ultraviolet light, Atmos. Chem. Phys.,10, 3455–3462, doi:10.5194/acp-10-3455-2010, 2010.
Novelli, P. C., Lang, P. M., Masarie, K. A., Hurst, D. F., Myers,R., and Elkins, J. W.: Molecular hydrogen in the troposphere:
Global distribution and budget, J. Geophys. Res., 104, 30427–30444, 1999.
Pieterse, G., Krol, M. C., and Rockmann, T.: A consistent molec-ular hydrogen isotope chemistry scheme based on an indepen-dent bond approximation, Atmos. Chem. Phys., 9, 8503–8529,doi:10.5194/acp-9-8503-2009, 2009.
Price, H., Jaegle, L., Rice, A., Quay, P., Novelli, P. C., andGammon, R.: Global budget of molecular hydrogen and itsdeuterium content: Constraints from ground station, cruise,and aircraft observations, J. Geophys. Res., 112, D22108,doi:22110.21029/22006JD008152, 2007.
Rahn, T., Eiler, J. M., Kitchen, N., Fessenden, J. E., and Randerson,J. T.: Concentration and dD of molecular hydrogen in borealforests: Ecosystem-scale systematics of atmospheric H2, Geo-phys. Res. Lett., 29, 1888, doi:10.1029/2002GL015118, 2002a.
Rahn, T., Kitchen, N., and Eiler, J. M.: D/H ratios of atmosphericH2 in urban air: Results using new methods for analysis of nano-molar H2 samples, Geochim. Cosmochim. Acta, 66, 2475–2481,2002b.
Rahn, T., Eiler, J. M., Boering, K. A., Wennberg, P. O., McCarthy,M. C., Tyler, S., Schauffler, S., Donnelly, S., and Atlas, E.: Ex-treme deuterium enrichment in stratospheric hydrogen and theglobal atmospheric budget of H2, Nature, 424, 918–921, 2003.
Rhee, T. S., Mak, J. E., Brenninkmeijer, C. A. M., and Rockmann,T.: Continuous-flow isotope analysis of the D/H ratio in atmo-spheric hydrogen, Rap. Commun. Mass Spectrom., 18, 299–306,2004.
Rhee, T. S., Brenninkmeijer, C. A. M., and Rckmann, T.: Theoverwhelming role of soils in the global atmospheric hydrogencycle, Atmos. Chem. Phys., 6, 1611–1625, doi:10.5194/acp-6-1611-2006, 2006.
Rhee, T. S., Brenninkmeijer, C. A. M., Brass, M., and Bruhl, C.:Isotopic composition of H2 from CH4 oxidation in the strato-sphere and the troposphere, J. Geophys. Res., 111, D23303,doi:23310.21029/22005JD006760, 2006.
Rhee, T. S., Brenninkmeijer, C. A. M., and Rckmann, T.: Hydro-gen isotope fractionation in the photolysis of formaldehyde, At-mos. Chem. Phys., 8, 1353–1366, doi:10.5194/acp-8-1353-2008,2008.
Rice, A. L. and Quay, P. D.: Isotopic analysis of atmosphericformaldehyde by gas chromatography isotope ratio mass spec-trometry, Anal. Chem., 78, 6320–6326, 2006.
Rockmann, T., Rhee, T. S., and Engel, A.: Heavy hydro-gen in the stratosphere, Atmos. Chem. Phys., 3, 2015–2023,doi:10.5194/acp-3-2015-2003, 2003.
Rockmann, T., Gomez Alvarez, C. X., Walter, S., Veen, C. v.,Wollny, A. G., Gunthe, S. S., Helas, G., Poschl, U., Keppler,F., Greule, M., and Brand, W. A.: The isotopic composition ofH2 from wood burning – dependency on combustion efficiency,moisture content andδD of local precipitation, J. Geophys. Res.,doi:10.1029/2009JD013188, in press, 2010.
Rohrer, F., Bohn, B., Brauers, T., Brning, D., Johnen, F.-J., Wah-ner, A., and Kleffmann, J.: Characterisation of the photolyticHONO-source in the atmosphere simulation chamber SAPHIR,Atmos. Chem. Phys., 5, 2189–2201, doi:10.5194/acp-5-2189-2005, 2005.
Sander, S. P., Friedl, R. R., Golden, D. M., Kurylo, M. J., Moort-gat, G. K., Keller-Rudek, H., Wine, P. H., Ravishankara, A. R.,Kolb, C. E., Molina, M. J., Finlayson-Pitts, B. J., Huie, R. E., and
Atmos. Chem. Phys., 10, 5343–5357, 2010 www.atmos-chem-phys.net/10/5343/2010/
T. Rockmann et al.: Isotope effect in the formation of H2 from H2CO 5357
Orkin, V. L.: Chemical Kinetics and Photochemical Data for Usein Atmospheric Studies, Evaluation Number 15, JPL Publication06-2, Jet Propulsion Laboratory, Pasadena, 2006.
Schultz, M. G., Diehl, T., Brasseur, G. P., and Zittel, W.: Air pollu-tion and climate-forcing impacts of a global hydrogen economy,Science, 302, 624–627, 2003.
Steele, L. P., Langenfelds, R. L., Lucarelli, M. P., Fraser, P. J.,Cooper, L. N., Spenser, D. A., Chea, S., and Broadhurst, K.:Atmospheric methane, carbon dioxide, carbon monoxide, hydro-gen, and nitrous oxide from Cape Grim air samples analysed bygas chromatography, in: Baseline Atmospheric Program Aus-tralia, 1994–1995, edited by: Francey, R. J., Dick, A. L., andDerek, N., 107–110, 1996.
Tromp, T. K., Shia, R.-L., Allen, M., Eiler, J. M., and Yung, Y. L.:Potential Environmental Impact of a Hydrogen Economy on theStratosphere, Science, 300, 1740–1742, 2003.
Vollmer, M. K., Walter, S., Bond, S. W., Soltic, P., and Rockmann,T.: Molecular hydrogen (H2) emissions and their isotopic sig-natures (H/D) from a motor vehicle: implications on atmo-spheric H2, Atmos. Chem. Phys. Discuss., 10, 3021–3051,doi:10.5194/acpd-10-3021-2010, 2010.
Warwick, N. J., Bekki, S., Nisbet, E. G., and Pyle, J. A.: Im-pact of a hydrogen economy on the stratosphere and tropo-sphere studied in a 2-D model, Geophys. Res. Lett., 31, L05107,doi:05110.01029/02003GL019224, 2004.
Wisthaler, A., Apel, E. C., Bossmeyer, J., Hansel, A., Junkermann,W., Koppmann, R., Meier, R., Mller, K., Solomon, S. J., Stein-brecher, R., Tillmann, R., and Brauers, T.: Technical Note: In-tercomparison of formaldehyde measurements at the atmospheresimulation chamber SAPHIR, Atmos. Chem. Phys., 8, 2189–2200, doi:10.5194/acp-8-2189-2008, 2008.
www.atmos-chem-phys.net/10/5343/2010/ Atmos. Chem. Phys., 10, 5343–5357, 2010
Related Documents