This PDF is a selection from an out-of-print volume from the National Bureau of Economic Research Volume Title: Trade with Japan: Has the Door Opened Wider? Volume Author/Editor: Paul Krugman, editor Volume Publisher: University of Chicago Press, 1991 Volume ISBN: 0-226-45458-4 Volume URL: http://www.nber.org/books/krug91-1 Conference Date: October 19-20, 1989 Publication Date: January 1991 Chapter Title: Is the Japanese Distribution System Really Inefficient? Chapter Author: Takatoshi Ito, Masayoshi Maruyama Chapter URL: http://www.nber.org/chapters/c8663 Chapter pages in book: (p. 149 - 174)

Welcome message from author
This document is posted to help you gain knowledge. Please leave a comment to let me know what you think about it! Share it to your friends and learn new things together.
Transcript
This PDF is a selection from an out-of-print volume from the National Bureauof Economic Research
Volume Title: Trade with Japan: Has the Door Opened Wider?
Volume Author/Editor: Paul Krugman, editor
Volume Publisher: University of Chicago Press, 1991
Volume ISBN: 0-226-45458-4
Volume URL: http://www.nber.org/books/krug91-1
Conference Date: October 19-20, 1989
Publication Date: January 1991
Chapter Title: Is the Japanese Distribution System Really Inefficient?
Chapter Author: Takatoshi Ito, Masayoshi Maruyama
Chapter URL: http://www.nber.org/chapters/c8663
Chapter pages in book: (p. 149 - 174)
5 Is the Japanese Distribution System Really Inefficient? Takatoshi It0 and Masayoshi Maruyama
5.1 Introduction
The Japanese distribution system has been criticized domestically and inter- nationally. It is well known that many Japanese consumer products, such as cameras and VCRs, are sold cheaper in New York than in Tokyo. Korean cars, successful in the United States, are virtually nonexistent in Japan. Famous brand-name goods, such as Louis Vuitton, Hermes, Chivas Regal, and Cour- voisier, imported from Europe, are sold in Japan with extraordinary premia. The “price differential between home and abroad” (Nuigui kukaku sa) has be- come an important political problem in Japan.
Suspected causes for the price differential are the so-called Japanese char- acteristics in the distribution system. Many small (family-run) retail stores, which cannot exploit scale economies, have survived thanks to the restriction on the construction and operation (store hours) of large retail (e.g., discount) stores in the neighborhood of small stores. Some of the many layers of whole- sale industry seem unnecessary. The (vertically semi-integrated) keiretsu stores carry only one (domestic) brand, discriminating against other domestic brands as well as imports. Sole representative agents for imports in many imported goods enjoy its monopolistic rents, reducing the volume (and dollar value) of imports, given that they deal with differentiated products.
The situation described above is often stereotyped as the inefficient distri- bution system that incurs unnecessary distribution costs and discriminates against imports. Two major questions and issues can be distinguished. First,
Takatoshi It0 is professor of Economics, Hitotsubashi University and the University of Minne- sota, and a research associate at the National Bureau of Economic Research. Masayoshi Maruy- ama is Associate Professor at Department of Business Administration at Kobe University.
The authors wish to thank David Flath and other conference participants for their comments. Comments from Mark Ramseyer, Kiyohiko Nishimura, and Graham Elliott were helpful in revis- ing this paper.
149
150 Takatoshi It0 and Masayoshi Maruyama
it is important to investigate whether the unique characteristics result in the “inefficiency” of the distribution system in Japan. The distribution system is said to be efficient if the distribution system does not add unnecessary costs in the pipeline from a manufacturer to a consumer.
Second, the distribution system might act as a non-tariff barrier, which lim- its competition from abroad. This could happen even if the distribution system is “efficient” in terms of the pipeline costs. Suppose that the manufacturer charges a higher domestic price than export price, and/or that importers charge higher domestic wholesale prices than their import costs, then retail prices would be higher. Put differently, if the prices charged upon entry to the pipeline are already high, then the retail prices would be high even under the same distribution margin through the pipeline.
This paper investigates the first question, namely the efficiency of the Jap- anese distribution system. Most of the discussions on the Japanese distribu- tion system have so far relied on institutional descriptions and anecdotal evi- dence, failing to substantiate the case, one way or the other, with quantitative measures. The present paper will show that the Japanese and U.S. distribution sectors are about the same in terms of value added and distribution margins. Therefore, it is not true that the distribution sector adds up unnecessary distri- bution costs or earns monopolistic operating profits.
This paper will not address the second question, namely, whether the distri- bution system is acting as a non-tariff barrier. Thus, even if the distribution sector in Japan is judged to be “efficient,” it leaves open a possibility that the distribution system works as a barrier to potential new entrants from both home and foreign manufacturers. The price differential between home and abroad can be a result of oligopolistic pricing behavior of manufacturers. Jap- anese manufacturers may set domestic wholesale prices higher than export price. Foreign manufacturers may charge higher export prices on goods bound for Japan than on those for other markets. The price differential may be rein- forced by the exclusive keiretsu distribution system. If this scenario is the case, the efficiency of the distribution system implies that the monopoly rents are not shared by the distribution sector. This paper does not verify how likely this scenario is.
The rest of the paper consists of four sections. The next section will sum- marize the conventional wisdom of the Japanese distribution system. Section 5.3 will propose several measures to judge the efficiency of the distribution system. Some preliminary investigations on the U.S .-Japan comparison will be conducted. Section 5.4 is the core of this paper. It will investigate distri- bution margins of the (comparable) three-digit wholesale and two-digit retail sectors for the United States and Japan. Interpretations of the finding will be offered in the last section.
151 Is the Japanese Distribution System Really Inefficient?
5.2 Conventional Wisdom
Perceived characteristics of the Japanese distribution system can be sum- marized as follows.
1. Many small establishments. Wholesale and retail stores are of small size both in the number of employees and in sales. They cannot adopt tech- nological advances that take advantage of scale economies. This characteristic also discriminates against imports as well as any new products because finan- cially weak establishments cannot experiment with new products at their own risk.
2. Many layers. The distribution system has “many layers and is complex,” in that there are relatively many distributors involved in the distribution sys- tem that stretches from the makers’ warehouses to the consumer. Sometimes there are three different wholesalers involved from the manufacturer to the retailer. This makes the distribution system inefficient; that is, distribution costs in the consumer price is higher than optimal.
3. Distribution keiretsu. Manufacturers develop their exclusive distribu- tion systems. For example, Panasonic stores, Sony stores, Toshiba stores, and so on carry a set of consumer electronic products, but exclusively their own brands. This vertical semi-integration makes it difficult for new entrants, in- cluding imports, to penetrate the market. The new entrant would need to es- tablish its own distributors. The operation would involve a large risk that few foreign firms would like to take.
4. Unique trading practices (i.e., returns policy, sales persons on loan, price maintenance, and rebate system). There are a number of so-called unique trading practices that makes the distribution system in Japan “compli- cated” and “inefficient.”
Returns from retail stores to the wholesaler are often allowed even if the retail stores bought the merchandise. In this sense a returns policy of unsold merchandise is said to be “liberal” (from retail to wholesale stores) (henpin sei). Many department stores and other large retail stores are staffed with “per- sons on loan” from manufacturers to retail stores. Although they are on the manufacturer’s payroll, they act as sales persons who demonstrate and pro- mote the products in the department store. Retail prices are often “main- tained” by implicit agreement between the manufacturers and the retailers via wholesalers. Rebates between retailers and wholesalers are just a means of nonlinear pricing. However, it is alleged that the terms of rebates are often not spelled out beforehand, but left to the discretion of wholesalers and manufac- turers.
5 . Dai-ten Ho. The policy using Dai-ten Ho (an acronym of the law and its implementation, concerning the restriction on the construction of and on the operating hours of large-scale retail stores) makes it difficult for large-size retail stores (discount stores, department stores, and supermarkets) to take advantage of scale economies. Since these stores carry more imports than
152 Takatoshi It0 and Masayoshi Maruyama
smaller retail stores (see 2 above), Dai-ten Ho works against benefits of for- eign makers as well as the Japanese consumers.
6. Sole representative importer. Many products are imported to Japan by sole representative importers. If the Japanese consumers have lower price elasticity for brand-name goods, then the sole representative importers of brand-name goods would find it profitable to charge a higher price for the goods in Japan than in the rest of the world. This would be not sustainable if parallel imports were permitted and costless.
7. Personal relationships and long-term contracts. It is said that, in order to make business deals, establishing a “personal relationship” is needed in addition to a long-term relationship, marked by a reliable delivery record (even if this implies expensive overtime on the part of makers and wholesale businesses) and by after-sale service.
5.2.1 Many Small Establishments
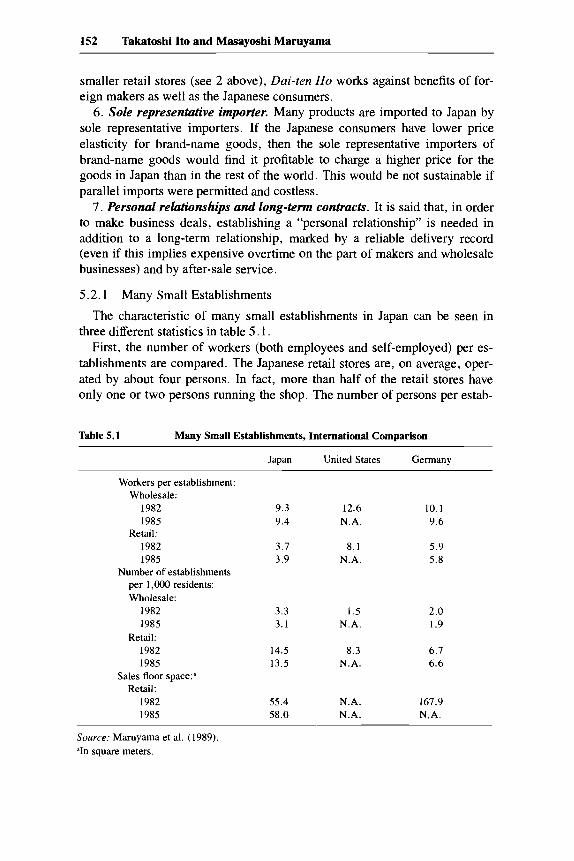
The characteristic of many small establishments in Japan can be seen in three different statistics in table 5.1 .
First, the number of workers (both employees and self-employed) per es- tablishments are compared. The Japanese retail stores are, on average, oper- ated by about four persons. In fact, more than half of the retail stores have only one or two persons running the shop. The number of persons per estab-
Table 5.1 Many Small Establishments, International Comparison
Japan United States Germany
Workers per establishment: Wholesale:
1982 I985
1982 1985
Retail:
Number of establishments per 1 ,OOO residents: Wholesale:
1982 1985
Retail: 1982 1985
Sales floor space:a Retail:
1982 1985
9.3 9.4
3 .? 3.9
3.3 3.1
14.5 13.5
55.4 58.0
12.6 N.A.
8.1 N.A.
I .5 N.A.
8.3 N.A.
N.A. N.A.
10.1 9.6
5.9 5.8
2.0 1.9
6.7 6.6
167.9 N.A.
Source: Maruyama et al. (1989). square meters.
153 Is the Japanese Distribution System Really Inefficient?
lishment is about a half of that in the United States and two-thirds that in Germany. Workers per wholesale establishment in Japan is about three-fourths of that in the United States; but it is comparable to that in Germany.
Second, the number of establishments per 1,000 residents is much higher in Japan than in the United States or Germany. This is true in both the whole- sale and retail sectors. Retailers and wholesalers in Japan are about twice as dense as in the United States or Germany.
Third, the average Japanese retailer has about one-third the floor space of the German counterpart. This could be a result of the high price of land in Japan.
These statistics confirm that the establishments are run by a smaller number of persons in Japan and there are more establishments per capita than the United States and Germany.
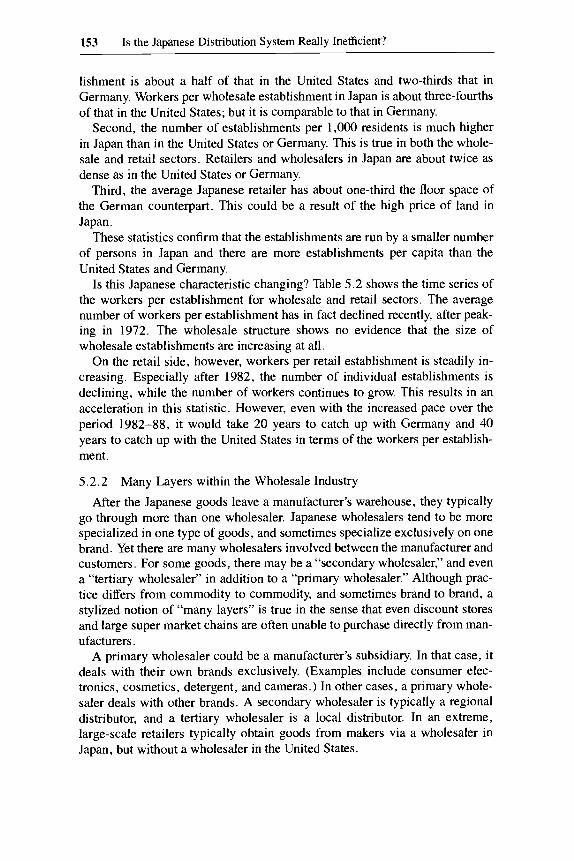
Is this Japanese characteristic changing? Table 5.2 shows the time series of the workers per establishment for wholesale and retail sectors. The average number of workers per establishment has in fact declined recently, after peak- ing in 1972. The wholesale structure shows no evidence that the size of wholesale establishments are increasing at all.
On the retail side, however, workers per retail establishment is steadily in- creasing. Especially after 1982, the number of individual establishments is declining, while the number of workers continues to grow. This results in an acceleration in this statistic. However, even with the increased pace over the period 1982-88, it would take 20 years to catch up with Germany and 40 years to catch up with the United States in terms of the workers per establish- ment.
5.2.2
After the Japanese goods leave a manufacturer’s warehouse, they typically go through more than one wholesaler. Japanese wholesalers tend to be more specialized in one type of goods, and sometimes specialize exclusively on one brand. Yet there are many wholesalers involved between the manufacturer and customers. For some goods, there may be a “secondary wholesaler,” and even a “tertiary wholesaler” in addition to a “primary wholesaler.” Although prac- tice differs from commodity to commodity, and sometimes brand to brand, a stylized notion of “many layers” is true in the sense that even discount stores and large super market chains are often unable to purchase directly from man- ufacturers.
A primary wholesaler could be a manufacturer’s subsidiary. In that case, it deals with their own brands exclusively. (Examples include consumer elec- tronics, cosmetics, detergent, and cameras.) In other cases, a primary whole- saler deals with other brands. A secondary wholesaler is typically a regional distributor, and a tertiary wholesaler is a local distributor. In an extreme, large-scale retailers typically obtain goods from makers via a wholesaler in Japan, but without a wholesaler in the United States.
Many Layers within the Wholesale Industry
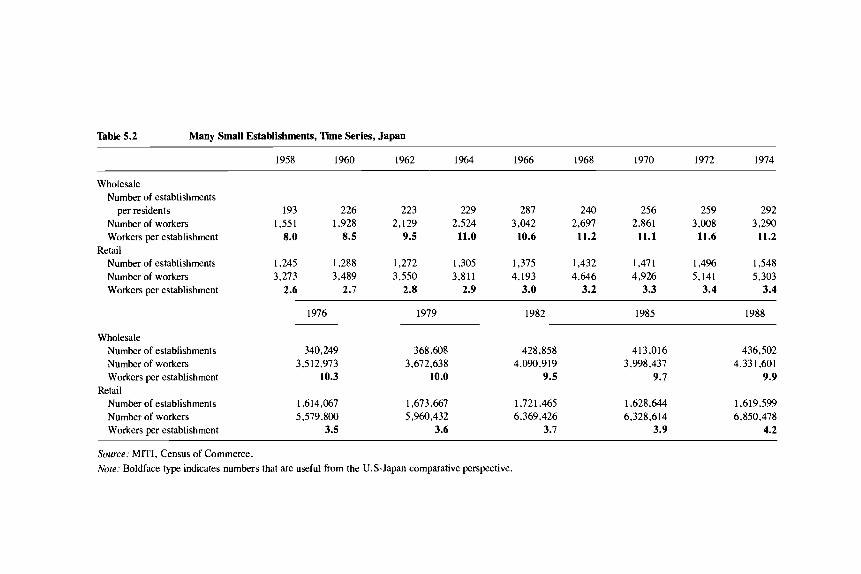
Table 5.2 Many Small Establishments, TSme Series, Japan
1958 1960 1962 1964 1966 1968 1970 1972 1974
Wholesale Number of establishments
per residents 193 226 223 229 287 240 256 259 292 Number of workers 1,551 1,928 2,129 2,524 3,042 2,697 2,861 3,008 3,290 Workers per establishment 8.0 8.5 9.5 11.0 10.6 11.2 11.1 11.6 11.2
Retail Number of establishments 1,245 1,288 1,272 1,305 1,315 1,432 1,47 1 1,496 1,548 Number of workers 3,273 3,489 3,550 3,811 4,193 4,646 4,926 5,141 5,303 Workers per establishment 2.6 2.7 2.8 2.9 3.0 3.2 3.3 3.4 3.4
1976 1979 1982 1985 1988
Wholesale Number of establishments 340,249 368,608 428,858 41 3,016 436,502 Number of workers 3,5 12,973 3,672,638 4,090,919 3,998,437 4,331,601 Workers per establishment 10.3 10.0 9.5 9.7 9.9
Retail Number of establishments 1,614,067 1,673,661 1,721,465 1,628,644 1,619,599 Number of workers 5,579,800 5,960,432 6,369,426 6,328,614 6,850,478 Workers per establishment 3.5 3.6 3.1 3.9 4.2
Source: MITI, Census of Commerce. Nore: Boldface type indicates numbers that are useful from the U.S-Japan comparative perspective.
155 Is the Japanese Distribution System Really Inefficient?
Table 5.3 Wholesale/Retail (WIR) Ratio
Japan United States Germany
WIR in sales 1982 3.53 1.09 1.61' 1985 3.44 .91b 1 .So'
1982 1.60 .82 1.17d 1985 1.55 .Sb 1.17
WIR in number of establishments: 1982 ,225 ,176 .29@ 1985 ,229 N.A. ,292'
WIR for inventories
~~
Source: Maruyama et al. (1989). Nofe: Wholesale trade data are based on merchant wholesalers. a1978. b1986. '1984. "981.
As a measure of many layers in the wholesale industry, it is popular to use the wholesaleIretai1 (WIR) sales ratio. We will explain the WIR ratio and then propose an additional measure. The WIR sales ratio in Japan is significantly higher than that in the United States or Germany (see table 5.3, row 1).
The high WIR ratio is interpreted as a reflection of many layers in the wholesale industry because sales of the same commodity are double or triple counted as wholesale sales in the multilayered wholesale industry structure.
However, a high WIR ratio may be a result of another characteristic. Instead of the wholesale level being multilayered, the retail establishments may be especially small in size. If the retail sales per establishment (discussed in the next section) is small due to its small scale of operations (implied by the work- ers per establishment data given in table 5. l), then a high WIR ratio would be obtained. Therefore, the WIR ratio alone is not conclusive evidence of the multilayered nature.
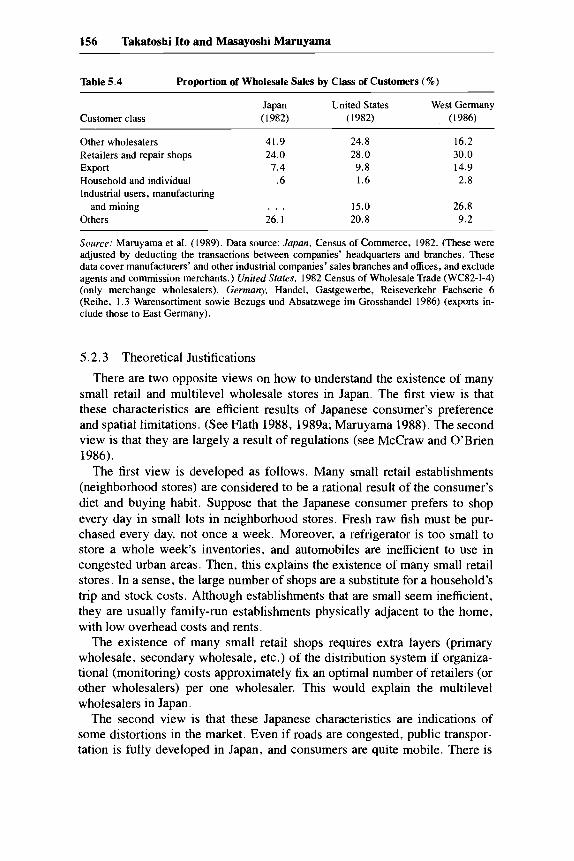
We can measure the proportion of sales to other wholesalers in total sales, as shown in table 5.4. This table clearly shows that more sales between wholesalers take place in Japan, a piece of evidence for multilayered whole- sale industry. Indeed, there are many layers in the wholesale industry.
1. Note that the WIR sales ratio can be decomposed into:
Sales per establishment, wholesale Sales per establishment, retail
Number of establishments per 1 ,OOO residents Number of establishments per 1 ,OOO residents
X
Therefore, if sales per establishment in retail in one country is extremely low, the WIR ratio would be higher, even though other components are comparable with other countries.
156 Takatoshi Ito and Masayoshi Maruyama
Table 5.4 Proportion of Wholesale Sales by Class of Customers (%)
Customer class Japan United States West Germany (1982) (1982) (1986)
Other wholesalers 41.9 24.8 16.2 Retailers and repair shops 24.0 28.0 30.0
Household and individual .6 1.6 2.8 Industrial users, manufacturing
and mining . . . 15.0 26.8 Others 26.1 20.8 9.2
Export I .4 9.8 14.9
Source: Maruyama et al. (1989). Data source: Japan, Census of Commerce, 1982. (These were adjusted by deducting the transactions between companies’ headquarters and branches. These data cover manufacturers’ and other industrial companies’ sales branches and offices, and exclude agents and commission merchants.) United States, 1982 Census of Wholesale Trade (WC82-1-4) (only merchange wholesalers). Germany, Handel, Gastgewerbe, Reiseverkehr Fachserie 6 (Reihe, 1.3 Warensortiment sowie Bezugs und Absatzwege im Grosshandel 1986) (exports in- clude those to East Germany).
5 . 2 . 3 Theoretical Justifications
There are two opposite views on how to understand the existence of many small retail and multilevel wholesale stores in Japan. The first view is that these characteristics are efficient results of Japanese consumer’s preference and spatial limitations. (See Flath 1988, 1989a; Maruyama 1988). The second view is that they are largely a result of regulations (see McCraw and O’Brien 1986).
The first view is developed as follows. Many small retail establishments (neighborhood stores) are considered to be a rational result of the consumer’s diet and buying habit. Suppose that the Japanese consumer prefers to shop every day in small lots in neighborhood stores. Fresh raw fish must be pur- chased every day, not once a week. Moreover, a refrigerator is too small to store a whole week’s inventories, and automobiles are inefficient to use in congested urban areas. Then, this explains the existence of many small retail stores. In a sense, the large number of shops are a substitute for a household’s trip and stock costs. Although establishments that are small seem inefficient, they are usually family-run establishments physically adjacent to the home, with low overhead costs and rents.
The existence of many small retail shops requires extra layers (primary wholesale, secondary wholesale, etc.) of the distribution system if organiza- tional (monitoring) costs approximately fix an optimal number of retailers (or other wholesalers) per one wholesaler. This would explain the multilevel wholesalers in Japan.
The second view is that these Japanese characteristics are indications of some distortions in the market. Even if roads are congested, public transpor- tation is fully developed in Japan, and consumers are quite mobile. There is
157 Is the Japanese Distribution System Really Inefficient?
no reason to suppose that retailers have to be close by. Even if many small retail stores are given, the ratio of wholesalers could be less in Japan, as re- tailers are located close together geographically. In short, we would expect, in more densely populated Japan, a lower ratio of stores to population. Ac- cording to this view, the wholesale/retail ratio should be less in Japan than other countries.2 The stylized facts described above should be a result of some regulations, such as Dai-ten Ho.
5.2.4
The conventional wisdom on keiretsu can be understood as follows. Kei- retsu stores in the wholesale and retail level are controlled by the respective manufacturers. In the keiretsu stores, manufacturers control decisions, such as which brands to carry, how much discount from the “standard retail price” (or retail price wished by the maker, in the literal translation) can be allowed, and how to deal with unsold inventories. In that sense, the essential part of keiretsu in the distribution sector is a package of “vertical restraints” in the sense of Flath (1 989b).
Often wholesalers and retailers exclusively deal with one manufacturer. In order to maintain resale prices, the manufacturer has to accept unsold goods as returns. Otherwise, the retail stores face too much risk in their earnings in the presense of uncertain demand. In a sense, the so-called liberal returns policy (henpin sei) and the price maintenance system can be understood as a result of a profit maximization of an oligopolist with differentiated products that has a keiretsu power to impose vertical restraints and whose retailers face an uncertain demand curve. (This point is forcefully shown in Flath 1989a and Flath and Nariu 1989.) According to this view, there is nothing “unfair” or “inefficient” about “liberal” returns policy in Japan. If there is any problem, it is an institution (or a lack of strict enforcement of fair trade law) that allows oligopolistic vertical restraints by manufacturers with differentiated products.
There is a controversy as to whether keiretsu stores are a real cause of nai- gai kakaku sa. Some argue that many keiretsu stores deal with more than one brand (Nihon Keizai Shinbunsha 1989, p. 84). However, no estimate of the number of such stores is provided.
Another “unique” business practice in Japan is worth mentioning. Namely, many department stores are staffed by “persons on loan” from manufacturers or wholesalers. The statistics shows that in 12 departments, (sales) persons on loan outnumber own (sales) persons. The Japanese department stores use their basement floors as food and grocery sections. They are usually operated and staffed as branches of small retail stores, and sales persons are usually on loan
Keiretsu and “Unique” Trading Practices
2 . David Flath drew our attention to the following fact. When the numbers of stores per thou- sand households are compared for different prefectures in Japan, both Tokyo (most densely popu- lated) and Hokkaido (most sparsely populated) record the lowest. The number of retail stores excluding eating and drinking places for Japan’s average is 45.5, while Tokyo is 35.1 and Hok- kaido is 34.1. The comparable number for the United States is 23.8.
158 Takatoshi Ito and Masayoshi Maruyama
from respective retail stores. Therefore, the department store with a larger food section, such as Keihin Tokyu, tends to have a higher ratio of sales per- sons on loan. A new branch of a department store chain also tends to have a higher ratio (see Ito and Maruyama 1989, table 2-5).
The Japanese department stores also have comers for brand-name merchan- dise, such as cosmetics, jewelry, handbags, and apparel. These sections also have a higher ratio of persons on loan. Manufacturers also send people to retail stores when they think demonstration of new merchandise would help sales.3 Another reason for manufacturers to send sales persons is to directly gather information on the customer’s reaction to the products and to utilize this information in product development.
For department stores, the significant numbers of persons on loan would cause the upward bias for their productivity (sales per person). In fact, when productivities in the retail sectors are examined by size of the establishments, those with more than 500 employees have extremely high productivities (see Maruyama et al. 1989). A significant portion of high productivities are due to the “persons on loan .”
5.2.5
In 1956, in order to curb the growth of department stores, the Department Store Law, which required a permit for new construction, was enacted. Then, large supermarkets, discount stores, and other large chain stores, which were not covered by the Department Store Law, became popular. In order to cover these new types of retail stores, the Large-Scale Retail Store Law, or Dai-ten Ho, which requires a “reporting” of constructions, replaced the Department Store Law in 1974. It was revised in 1979 to its current form.
The Dai-ten H o covers two types of stores: first, stores with 1,500 square meters or more than 3,000 square meters in large cities (seirei shitei toshi); second, stores with 500-1,500 square meters or stores with 500-3,000 square meters that are located in large cities. A construction plan of a large retail store has to be submitted to a governor (of prefecture). Then the sho cho kyo (the committee of adjusting retail activities), which is organized under the Chamber of Commerce, “discusses” the plan. For the first type of store, the report from the dai ten shin (subcommittee of large retail stores) goes to the Ministry of International Trade and Industry (MITI) minister. For the sec- ond type of store, the report goes to the governor. The “adjustment” items include the floor space, the opening day, store hours, and total days closed in a year. On appearance, when a plan is submitted, it should be discussed with neighboring shopping malls and stores and be approved in due time.
However, the law is not the whole story. The MITI issues the ministry guid-
Large-Scale Retail Store Law (Dai-ten Ho)
3. Flath (1989a) applies Telser’s (1960) argument of resale price maintenance to the vertical restraint behavior (keiretsu) among Japanese firms. However, Telser’s argument, which empha- sizes the merit of “demonstration,” can be applied to the characteristic “persons on loan” in Japan, too.
159 Is the Japanese Distribution System Really Inefficient?
ance on interpretation and implementation of the law. In fact, in the beginning of the 1980s, the implementation was significantly tightened so that it became not uncommon to take more than two years after a submission of a plan re- ceive final approval. In essense, the law and its implementation can virtually stop the construction of a large retail store if the neighboring stores oppose it.
The time required to build and operate a large-scale retail store, according to the practices of Dai-ten Ho, can be anything between two and one-half years to 10 years. First, the management of the prospective store has to “ex- plain” the plan, including the floor space and the days of operation, to local businesses as well as to the Chamber of Commerce and the local government of the prospective store site. Only after the Chamber of Commerce and the local stores “agree” to the plan may the prospective store file an application (Article 3 application) for the building permit. If the local businesses express strong opposition, it may take many years before the application is filed. This is based on the practices imposed by the MITI rather than on the letter of the law.
The governor will send the Article 3 application to the MITI minister. The MITI then asks the local Chamber of Commerce whether the proposed store would affect the existing local businesses. If the answer is no, the prospective store may file an Article 5 application to the governor and it will be approved. However, in many cases the answer is yes. Then the proposed store and the local business must meet in the “pre-council” (jizen sho cho kyo). This pro- cess takes about eight months. After the pre-council is cleared, the store can file an Article 5 application to the governor. The governor sends the Article 5 application to the MITI minister. Then the formal council (sho cho kyo), com- posed of the local businesses, the Chamber of Commerce, the store, consum- ers, and some academics, examines (i) when the store will open for business; (ii) floor space; (iii) store hours; and (iv) the number of store holidays in a year. This practice is close to a “hearing” in the U.S. case. The Chamber of Commerce may express its opinion in the council. The Large-Scale Retail Store Commission [Shingikui] examines the case, and the local government expresses its opinion. Then, following the Shingikai’s discussions, the MITI minister makes recommendations on the conditions for building the store. Fi- nally, the MITI minister will approve the plan. After the Article 5 application is filed, approval has to be given within five months.
A most time-consuming part is, in fact, not a part of the law but merely the “practices” and gyosei shido of the MITI. In particular, the “pre-explanation” is not a code or gyosei shido, but just a practice. However, some local govern- ments do not accept an Article 3 application without an agreement from the Chamber of Commerce. The local business could simply boycott the “pre- explanation” so that it could take forever before an Article 3 application could filed.
In the case of the Summit Store, Higashi Nakano, it took about seven years from the time the plan was made to the time the store actually opened. It really
160 Takatoshi It0 and Masayoshi Maruyama
took a long time before the Article 3 application was filed. (The details of the negotiation are documented in Nikkei Business [5 June 19891 and reproduced in Ito and Maruyama 1989, p. 21 .)
Let us turn to the issue of how the Dai-ten Ho affects efficiency. David Flath (1988) investigated how the number of other types of stores change as the number of department stores change in different prefectures. He finds that the number of drug stores is not affected by the number of department stores, while the number of food, liquor, and apparel stores are quite elastic. This partly but not entirely explains how the Dai-ten H o allows many small stores to survive. It should also be pointed out that Dai-ten Ho protects the “insid- ers,’’ that is, the existing department stores, from the “outsiders,” that is, the proposed department stores.
5.3 Measures of Efficiency in the Distribution Sector
There have been many studies on productivity and efficiency in the distri- bution sector. The most popular measure of the productivity and efficiency of the distribution system has been “sales per employee,” as in Ingene (1982) and Smith and Hitchens (1985). The latter compared the productivities of the U.S. and European distribution systems. When data are available, “value added per employee” is also used, as in Beckman (1957). As explained in the text, there are some conceptual difficulties in the use of these measures as a criteria for efficiency. Several authors (see Bucklin 1978; Achaval 1984) have also expressed caution against the use of these measures. The Japanese distri- bution system in the light of international comparison was studied in Tajima and Miyashita (1985), Ryutsu Keizai Kenkyusho (1988), and Maruyama et al. (1989).
This section proposes looking at the gross margin, operating expenses, operating profit, and unit labor cost. We relied on data from the commerce censuses of the United States and those of Japan, such as the Ministry of International Trade and Industry’s White Paper (1988, p. 73; Nishimura and Tsubouchi 1989 calculated the gross margin from the input-output table).
A contribution of this paper, which we will present in the next section, is that it compares not only gross margins but also operating expenses, operating profits, and unit labor costs at the three-digit wholesale and two-digit retail sectors, using the comparable commerce censuses in the United States and Japan.
Given all facts about the “uniqueness” of the Japanese distribution system, an important question from the economic point of view is whether it is an inefficient system, as is often claimed. We proposed constructing several mea- sures to evaluate the efficiency of the distribution sector.
5.3.1
“Sales per worker” or “Sales per establishment” has been a popular measure for “performance” and “efficiency.” For example, the measure was used in
Sales per worker and Sales per Establishment
161 Is the Japanese Distribution System Really Inefficient?
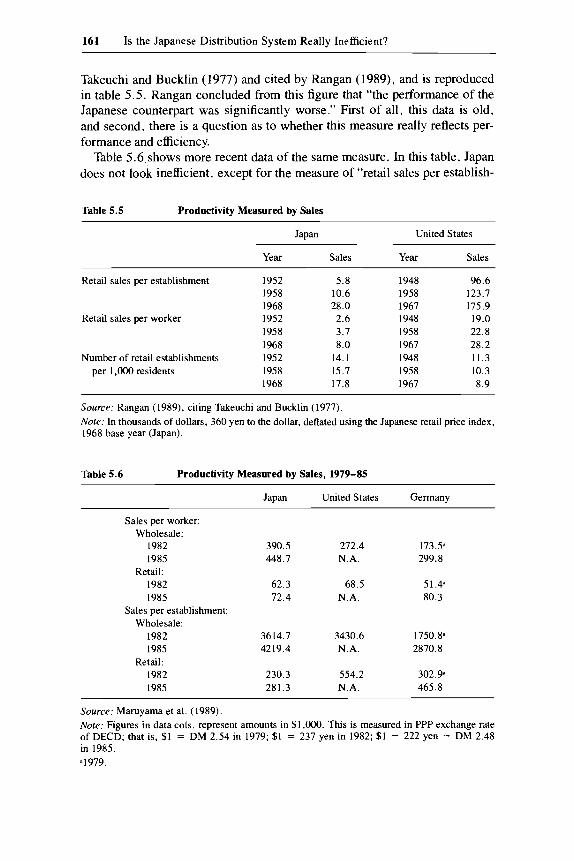
Takeuchi and Bucklin (1977) and cited by Rangan (1989), and is reproduced in table 5.5. Rangan concluded from this figure that “the performance of the Japanese counterpart was significantly worse.” First of all, this data is old, and second, there is a question as to whether this measure really reflects per- formance and efficiency.
Table 5.6,shows more recent data of the same measure. In this table, Japan does not look inefficient, except for the measure of “retail sales per establish-
Table 5.5 Productivity Measured by Sales
Japan United States
Year Sales Year Sales
Retail sales per establishment 1952 1958 1968
Retail sales per worker 1952 1958 1968
Number of retail establishments 1952 per 1 ,OOO residents 1958
1968
5.8 1948 10.6 1958 28.0 1967 2.6 1948 3.7 1958 8.0 1967
14. I 1948 15.7 1958 17.8 1967
96.6 123.7 175.9 19.0 22.8 28.2 11.3 10.3 8.9
Source: Rangan (1989). citing Takeuchi and Bucklin (1977). Note: In thousands of dollars, 360 yen to the dollar, deflated using the Japanese retail price index, 1968 base year (Japan).
Table 5.6 Productivity Measured by Sales, 1979-85
Japan United States Germany
Sales per worker: Wholesale:
1982 1985
1982 1985
Wholesale: 1982 1985
1982 1985
Retail:
Sales per establishment:
Retail:
390.5 448.7
62.3 72.4
3614.7 4219.4
230.3 281.3
272.4 N.A.
68.5 N.A.
3430.6 N.A.
554.2 N.A.
173.5’ 299.8
51.4a 80.3
1750.8” 2870.8
302.9’ 465.8
Source: Maruyama et al. (1989). Nore: Figures in data cols. represent amounts in $l,OOO. This is measured in PPP exchange rate of DECD; that is, $1 = DM 2.54 in 1979; $1 = 237 yen in 1982; $1 = 222 yen = DM 2.48 in 1985. *1979.
162 Takatoshi Ito and Masayoshi Maruyama
ment.” The wholesale sector look quite comparable to or better than other countries.
There are two caveats. First, productivity in the Japanese wholesale sector could be overestimated, because large scale trading houses (sogo shosha) are included in the wholesale sector. Trading houses engage in export, import, and international trade between third countries as well as domestic retail busi- ness. Second, the productivities in the retail sectors may be biased upward, because of the “persons on loan” in large scale department stores. (See the argument on persons on loan in sec. 5.2 above). Another contamination is the inclusion of eating and drinking places in retail business.
5.3.2 Value Added
However, the amount of sales is not a good measure of productivity. First, it does not consider any costs of input. Compare a retail store that deals with expensive products (say, diamonds) with high purchase (input) prices (from wholesale level) and a retail store that deals with less expensive products (say, toys) with low purchase (input) prices. Even if the number of workers, their wage rate, and the net profit are the same, the former category would have higher sales per worker. Moreover, double counting in the multilayered wholesale sector may cloud the f i g ~ r e . ~
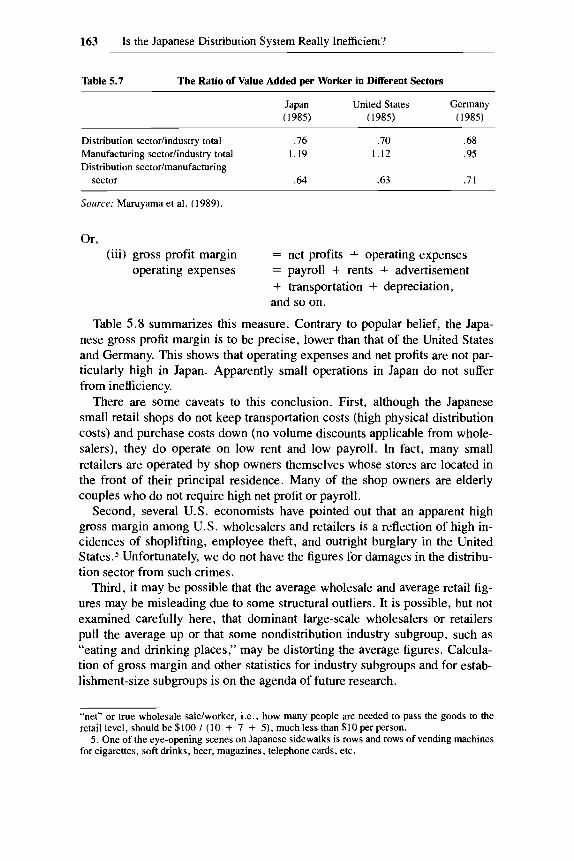
Hence, a more accurate measure of productivity is value added. Thus, we examine the value added that is net of input costs. Table 5.7 shows the value added in the distribution sector relative to that in the manufacturing sector. In this measure, the Japanese value added per worker is as high as that of the United States. In this measure, there is no evidence that the Japanese distri- bution sector is less efficient than that in the United States or Germany.
5.3.3 Gross Profit Margin
If the efficiency of the distribution is measured by how much extra a con- sumer has to pay on top of the manufacturer’s costs, the gross profit margin is an appropriate measure:
(i) gross profit margin ratio = gross profit marginhales; (ii) gross profit margin = sales - merchandise costs
merchandise costs = merchandise purchase + beginning-of-period inventories - end-of-period inventories.
4. In order to understand why the sales per worker would be an incorrect statistic in the multi- layered wholesale system, consider the following example. Suppose that $100 is charged for sales of a product from the single-layered wholesale sector to the retail sector, and that 10 people are working in the (single-layer) wholesale sector. The $10 sales per worker would be recorded as the relevant statistic in this single-layered system. Next, suppose that the same product is sold three times in the multilayered wholesale (recall fig. 5.1): $50 by 5 people in the first wholesale layer, $70 by 7 people in the second layer, and $100 by 10 people in the third layer. Then the sales per capita in each layer is still $10 per person, and is so shown in the Japanese statistic. However, the
163 Is the Japanese Distribution System Really Inefficient?
Table 5.7 The Ratio of Value Added per Worker in Different Sectors
Japan United States Germany ( 1985) (1985) (1985)
Distribution sectoriindustry total .76 .70 .68
Distribution sectorhanufactwing Manufacturing sector/industry total 1.19 1.12 .95
sector .64 .63 .71
Source: Maruyama et al. (1989).
Or, (iii) gross profit margin
operating expenses = net profits + operating expenses = payroll + rents + advertisement + transportation + depreciation, and so on.
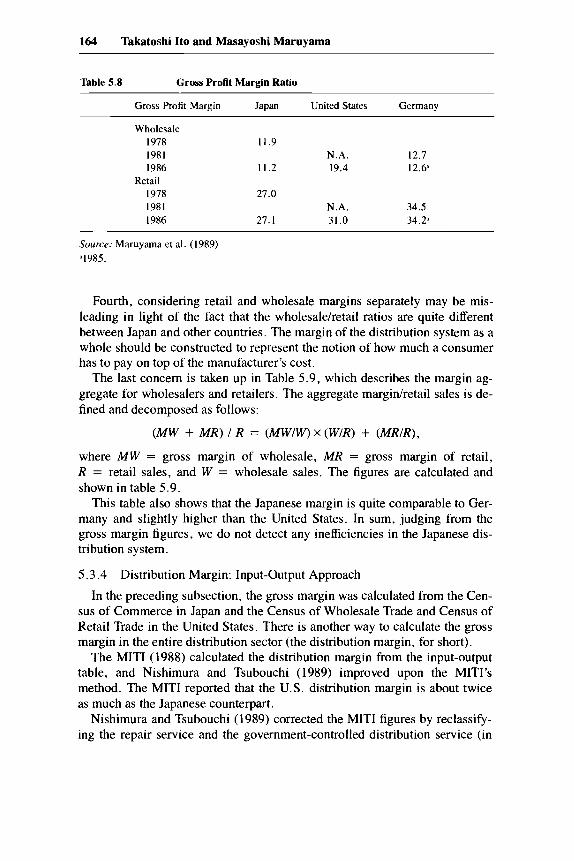
Table 5.8 summarizes this measure. Contrary to popular belief, the Japa- nese gross profit margin is to be precise, lower than that of the United States and Germany. This shows that operating expenses and net profits are not par- ticularly high in Japan. Apparently small operations in Japan do not suffer from inefficiency.
There are some caveats to this conclusion. First, although the Japanese small retail shops do not keep transportation costs (high physical distribution costs) and purchase costs down (no volume discounts applicable from whole- salers), they do operate on low rent and low payroll. In fact, many small retailers are operated by shop owners themselves whose stores are located in the front of their principal residence. Many of the shop owners are elderly couples who do not require high net profit or payroll.
Second, several U.S. economists have pointed out that an apparent high gross margin among U.S. wholesalers and retailers is a reflection of high in- cidences of shoplifting, employee theft, and outright burglary in the United States5 Unfortunately, we do not have the figures for damages in the distribu- tion sector from such crimes.
Third, it may be possible that the average wholesale and average retail fig- ures may be misleading due to some structural outliers. It is possible, but not examined carefully here, that dominant large-scale wholesalers or retailers pull the average up or that some nondistribution industry subgroup, such as “eating and drinking places,” may be distorting the average figures. Calcula- tion of gross margin and other statistics for industry subgroups and for estab- lishment-size subgroups is on the agenda of future research.
“net” or true wholesale saldworker, i.e., how many people are needed to pass the goods to the retail level, should be $100 I (10 + 7 + 5), much less than $10 per person.
5 . One of the eye-opening scenes on Japanese sidewalks is rows and rows of vending machines for cigarettes, soft drinks, beer, magazines, telephone cards, etc.
164 Takatoshi Ito and Masayoshi Maruyama
Table 5.8 Gross Profit Margin Ratio
Gross Profit Margin Japan United States Germany ~~
Wholesale 1978 11.9 1981 N.A. 12.7 I986 11.2 19.4 12.6‘
1978 27.0 1981 N.A. 34.5 1986 27.1 31.0 34.2=
Retail
Source: Maruyama et al. (1989) ’1985.
Fourth, considering retail and wholesale margins separately may be mis- leading in light of the fact that the wholesalelretail ratios are quite different between Japan and other countries. The margin of the distribution system as a whole should be constructed to represent the notion of how much a consumer has to pay on top of the manufacturer’s cost.
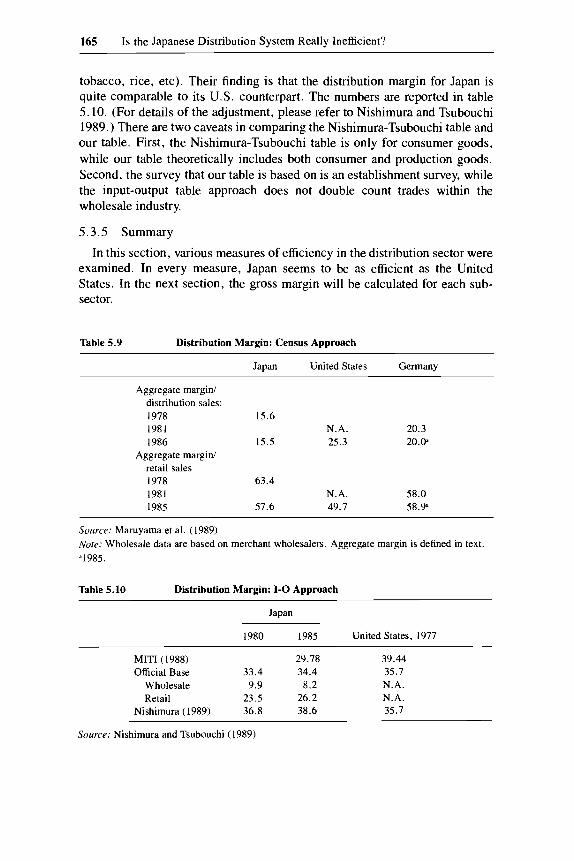
The last concern is taken up in Table 5.9, which describes the margin ag- gregate for wholesalers and retailers. The aggregate marginhetail sales is de- fined and decomposed as follows:
(MW + MR) I R = (MWIW) X (WIR) + (MRIR),
where MW = gross margin of wholesale, MR = gross margin of retail, R = retail sales, and W = wholesale sales. The figures are calculated and shown in table 5.9.
This table also shows that the Japanese margin is quite comparable to Ger- many and slightly higher than the United States. In sum, judging from the gross margin figures, we do not detect any inefficiencies in the Japanese dis- tribution system.
5.3.4 Distribution Margin: Input-Output Approach
In the preceding subsection, the gross margin was calculated from the Cen- sus of Commerce in Japan and the Census of Wholesale Trade and Census of Retail Trade in the United States. There is another way to calculate the gross margin in the entire distribution sector (the distribution margin, for short).
The MITI (1988) calculated the distribution margin from the input-output table, and Nishimura and Tsubouchi (1989) improved upon the MITI’s method. The MITI reported that the U.S. distribution margin is about twice as much as the Japanese counterpart.
Nishimura and Tsubouchi (1989) corrected the MITI figures by reclassify- ing the repair service and the government-controlled distribution service (in
165 Is the Japanese Distribution System Really Inefficient?
tobacco, rice, etc). Their finding is that the distribution margin for Japan is quite comparable to its U.S. counterpart. The numbers are reported in table 5.10. (For details of the adjustment, please refer to Nishimura and Tsubouchi 1989.) There are two caveats in comparing the Nishimura-Tsubouchi table and our table. First, the Nishimura-Tsubouchi table is only for consumer goods, while our table theoretically includes both consumer and production goods. Second, the survey that our table is based on is an establishment survey, while the input-output table approach does not double count trades within the wholesale industry.
5.3.5 Summary
In this section, various measures of efficiency in the distribution sector were examined. In every measure, Japan seems to be as efficient as the United States. In the next section, the gross margin will be calculated for each sub- sector.
Table 5.9 Distribution Margin: Census Approach
Japan United States Germany
Aggregate margin/ distribution sales: 1978 15.6 1981 N.A. 20.3 1986 15.5 25.3 20.0'
retail sales 1978 63.4 1981 N.A. 58.0 1985 57.6 49.1 58.9"
Aggregate margin/
Source: Maruyama et al. (1989) Note: Wholesale data are based on merchant wholesalers. Aggregate margin is defined in text 41985.
Table 5.10 Distribution Margin: 1-0 Approach
Japan
1980 1985 United States, 1977
MITI ( 1988) 29.78 39.44 Official Base 33.4 34.4 35.7
Wholesale 9.9 8.2 N.A. Retail 23.5 26.2 N.A.
Nishimura (1989) 36.8 38.6 35.7
Source: Nishimura and Tsubouchi (1989)
166 Takatoshi Ito and Masayoshi Maruyama
5.4 Efficiency at ’bo-Digit and Three-Digit Industry Levels
5.4.1 Gross Margin, Operating Expenses, and Profits
In this section we extend the analysis of the preceding section by two di- mensions. First, an analysis of gross margin will be conducted at the three- digit wholesale and two-digit retail industry levels. Since the Standard Indus- trial Code of Japan (JSIC) is slightly different from that of the United States (SIC), we have devised a matching table of the two SICs for the distribution sector. Second, gross margins will be decomposed into operating expenses and operating profits. To the best of our knowledge, this paper is the first to compare operating expenses and operating profit for the U.S. and Japanese two- and three-digit matching distribution subsectors.
The study of three-digit industry level is necessary in order to account for the following issues in the aggregate data. First, the Japanese wholesale in- dustry include gigantic, general trading houses (sogo shoshu), to which no institution in the United States is comparable. These Japanese trading houses engage in export, import, and trade between third countries, as well as the domestic distribution system. The same company may deal with importing F-16 fighters as well as exporting cup noodles. These trading houses are known to exploit scale economies, so that the low (operating) profit margin rate suffices for their success. They are quite different entities from those in the domestic distribution system. The effect of general trading houses can be eliminated by suppressing two-digit industry, JSIC 49.
When the retail “aggregate” statistic is constructed, the United States tends to include “eating and drinking places” (SIC 58) , while Japan excludes “eat- ing and drinking places” (general JSIC 59 or other JSIC 60). Since restaurants and fast-food outlets have quite different functions and cost characteristics from other retail shops, we would be interested in comparable retail aggre- gates without eating and drinking places.
First, let us describe how we match the two- and three-digit industries. The wholesale industry is divided into three two-digit industries in Japan and two two-digit industries (nondurables and durables) in the United States. Subdi- viding into the three-digit wholesale levels, the Japanese SIC tend to include more industries than each U.S. SIC. One exception is that textile and apparel are divided into two SICs in Japan, while those industries are aggregated into one in the United States.
Second, in the two-digit retail level, the Japanese and U.S. SICs are quite comparable. After minor reclassification on the U.S. SIC, such as classifying gasoline stations into miscellaneous instead of motor vehicle (which really is meant to indicate automobile dealers), the two SICs are quite comparable (see Ito and Maruyama 1990, table 4-1, for a summary table of matching the two SICS).
167 Is the Japanese Distribution System Really Inefficient?
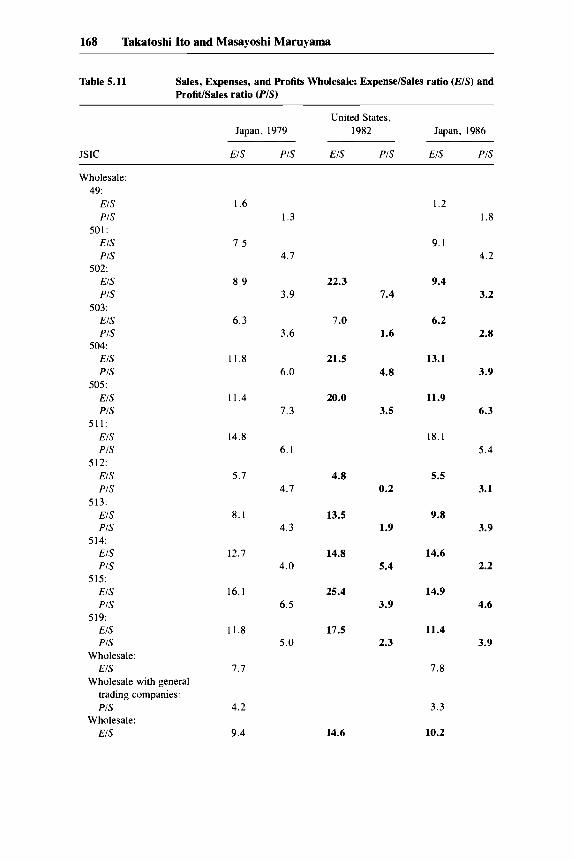
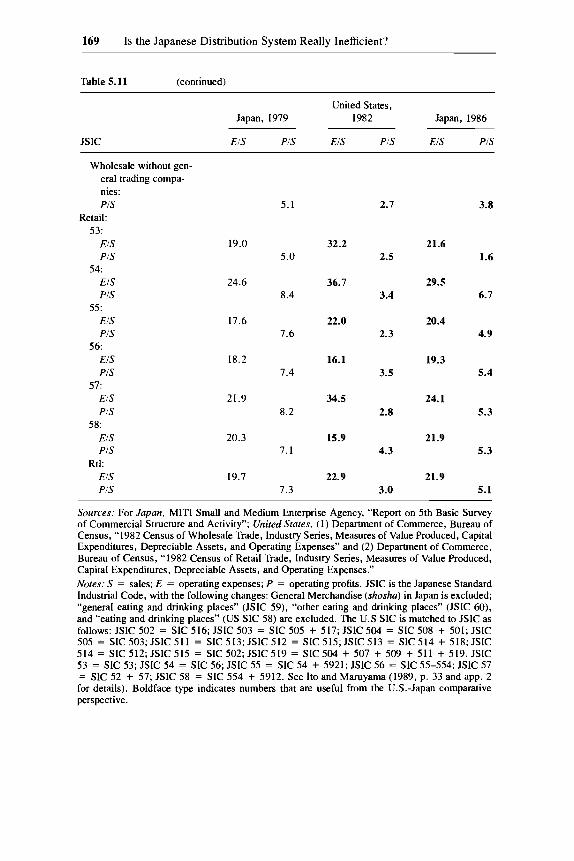
Table 5.11 shows the results of such estimates. The following points sum- marize the major findings.
1. In the wholesale sector, the gross margin ratio in the United States (17.3% in 1982) is higher than that in Japan (14.0% in 1986), while in the retail sector, the gross margin in the United States (25.9%) is lower than that in Japan (27.0% in 1986). In both sectors, the operating expense ratio is higher in the United States, while the operating profit ratio is higher in Japan.
If the general trading houses (JSIC 49) are included in the Japanese whole- sale sector, the operating expenses of the wholesale industry declines by about 1.7%-2.4% points and operating profit by 0.6%-0.9% points. Eating and drinking places are excluded in both countries.
2. Among the three-digit wholesale sectors, operating expense ratios of all but one sector in the United States are higher than the comparable sectors in Japan. In contrast, the operating profit ratios in Japan are higher than those in the United States, except in three subsectors, JSIC 502, 504, and 514.
Among the two-digit retail sectors, similar characteristics hold true. Oper- ating expense ratios of the United States are higher than those of Japan in four out of six sectors, while the operating profit ratios for the United States are lower than those of Japan in all but one sector.
In sum, the following conclusion emerges. The Japanese distribution sec- tors operate with less operating costs and earn higher operating profit. Casual arguments in the popular press, on the theme of the inefficient Japanese distri- bution system, are hardly consistent with the evidence presented in this paper.
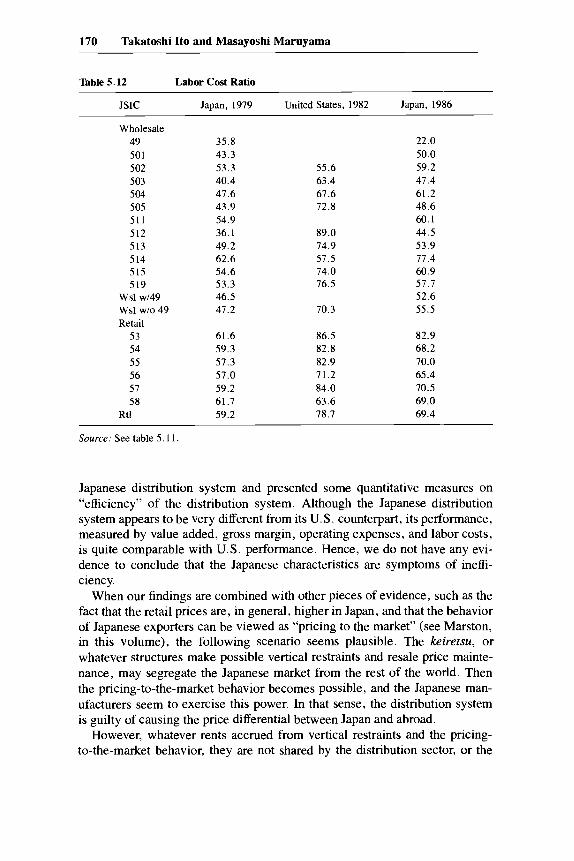
5.4.2 Labor Costs
In order to investigate the detail of the cost composition, the labor cost component is analyzed. The labor cost ratio is defined as total labor cost di- vided by the value added. (If the value added was normalized by the respective prices, the ratio would be equivalent to unit labor cost.)
Table 5.12 compares the labor cost ratio. Among the three-digit wholesale sectors, the United States has a higher labor cost ratio in all but one (JSIC 514) sector. Among the two-digit retail sectors, except for one (JSIC 58) sec- tor, the United States has a higher labor cost ratio. Therefore, it is evident that the labor share in value added is higher in the United States than in Japan.
In sum, the share of labor costs in the distribution sector in Japan is no higher than in the United States. Hence, the findings in this section shows that, with respect to many criteria, such as the distribution margin, operating expenses, and the labor cost ratio, the Japanese subsectors in the distribution industry are, in general, as efficient as their U.S. counterparts.
5.5 Concluding Remarks
Let us summarize our findings, our interpretations, and implications as well as some caveats. In this paper, we have explained major characteristics of the
168 Takatoshi Ito and Masayoshi Maruyama
Table 5.11 Sales, Expenses, and Profits Wholesale: Expense/Sales ratio (EIS) and Profithales ratio (PlS)
JSIC
United States, Japan, 1979 1982 Japan, 1986
EIS PIS EIS PIS EIS PIS
Wholesale: 49:
EIS PIS
EIS PIS
EIS PIS
EIS PIS
EIS PIS
EIS PIS
EIS PIS
EIS PIS
EIS PIS
EIS PIS
EIS PIS
EIS PIS
Wholesale: EIS
Wholesale with general trading companies: PIS
EIS
501:
502:
503:
504:
505:
511:
512:
513:
5 14:
515:
5 19:
Wholesale:
1.6
7.5
8.9
6.3
11.8
11.4
14.8
5.7
8. I
12.7
16.1
11.8
7.7
4.2
9.4
1.3
4.7
3.9
3.6
6.0
7.3
6.1
4.7
4.3
4.0
6.5
5.0
22.3
7.0
21.5
20.0
4.8
13.5
14.8
25.4
17.5
14.6
7.4
1.6
4.8
3.5
0.2
1.9
5.4
3.9
2.3
I .2
9.1
9.4
6.2
13.1
11.9
18.1
5.5
9.8
14.6
14.9
11.4
7.8
3.3
10.2
1.8
4.2
3.2
2.8
3.9
6.3
5.4
3.1
3.9
2.2
4.6
3.9
169 Is the Japanese Distribution System Really Inefficient?
Table 5.11 (continued)
United States, Japan, 1979 1982 Japan, 1986
JSIC EIS PIS EIS PIS EIS PIS
Wholesale without gen- eral trading compa- nies: PIS
Retail: 53:
EIS 19.0 PIS
EIS 24.6 PIS
EIS 17.6 PIS
EIS 18.2 PIS
EIS 21.9 PIS
EIS 20.3 PIS
EIS 19.7 PIS
54:
55:
56:
51:
58:
Rtl:
5.1
5.0
8.4
7.6
7.4
8.2
7.1
7.3
32.2
36.7
22.0
16.1
34.5
15.9
22.9
2.7
2.5
3.4
2.3
3.5
2.8
4.3
3.0
21.6
29.5
20.4
19.3
24.1
21.9
21.9
3.8
1.6
6.7
4.9
5.4
5.3
5.3
5.1
Sources: For Japan, MITI Small and Medium Enterprise Agency, “Report on 5th Basic Survey of Commercial Structure and Activity”; United States, (1) Department of Commerce, Bureau of Census, “1982 Census of Wholesale Trade, Industry Series, Measures of Value Produced, Capital Expenditures, Depreciable Assets, and Operating Expenses” and (2) Department of Commerce, Bureau of Census, “1982 Census of Retail Trade, Industry Series, Measures of Value Produced, Capital Expenditures, Depreciable Assets, and Operating Expenses.” Notes: S = sales; E = operating expenses; P = operating profits. JSIC is the Japanese Standard Industrial Code, with the following changes: General Merchandise (shoshu) in Japan is excluded; “general eating and drinking places” (JSIC 59), “other eating and drinking places” (JSIC 60), and “eating and drinking places” (US SIC 58) are excluded. The U.S SIC is matched to JSIC as follows: JSIC 502 = SIC 516; JSIC 503 = SIC 505 + 517; JSIC 504 = SIC 508 + 501; JSIC 505 = SIC 503; JSIC 511 = SIC 513; JSIC 512 = SIC515; JSIC 513 = SIC 514 + 518; JSIC 514 = SIC 512; JSIC 515 = SIC 502; JSIC 519 = SIC 504 + 507 + 509 + 511 + 519. JSIC 53 = SIC 53; JSIC 54 = SIC 56; JSIC 55 = SIC 54 + 5921; JSIC 56 = SIC 55-554; JSIC 57 = SIC 52 + 57; JSIC 58 = SIC 554 + 5912. See It0 and Maruyama (1989, p. 33 and app. 2 for details). Boldface type indicates numbers that are useful from the U.S.-Japan comparative perspective.
170 Takatoshi It0 and Masayoshi Maruyama
Table 5.12 Labor Cost Ratio
JSIC Japan, 1979 United States, 1982 Japan, 1986
Wholesale 49 50 1 502 503 504 505 51 1 512 513 514 515 5 19
Wsl wl49 Wsl WIO 49 Retail
53 54 55 56 57 58
Rtl
35.8 43.3 53.3 40.4 47.6 43.9 54.9 36.1 49.2 62.6 54.6 53.3 46.5 47.2
61.6 59.3 57.3 57.0 59.2 61.7 59.2
55.6 63.4 67.6 72.8
89.0 74.9 57.5 74.0 76.5
70.3
86.5 82.8 82.9 71.2 84.0 63.6 78.7
22.0 50.0 59.2 47.4 61.2 48.6 60.1 44.5 53.9 77.4 60.9 57.7 52.6 55.5
82.9 68.2 70.0 65.4 70.5 69.0 69.4
Source: See table 5.11,
Japanese distribution system and presented some quantitative measures on “efficiency” of the distribution system. Although the Japanese distribution system appears to be very different from its U.S. counterpart, its performance, measured by value added, gross margin, operating expenses, and labor costs, is quite comparable with U.S. performance. Hence, we do not have any evi- dence to conclude that the Japanese characteristics are symptoms of ineffi- ciency.
When our findings are combined with other pieces of evidence, such as the fact that the retail prices are, in general, higher in Japan, and that the behavior of Japanese exporters can be viewed as “pricing to the market” (see Marston, in this volume), the following scenario seems plausible. The keiretsu, or whatever structures make possible vertical restraints and resale price mainte- nance, may segregate the Japanese market from the rest of the world. Then the pricing-to-the-market behavior becomes possible, and the Japanese man- ufacturers seem to exercise this power. In that sense, the distribution system is guilty of causing the price differential between Japan and abroad.
However, whatever rents accrued from vertical restraints and the pricing- to-the-market behavior, they are not shared by the distribution sector, or the
171 Is the Japanese Distribution System Really Inefficient?
distribution sector itself does not incur extra (operating) expenses that appar- ently resulted from the Japanese characteristics. The Japanese distribution system is as efficient as its U.S. counterpart once the system receives, as an input to the “pipeline,” the goods from manufacturers.
Finally, let us comment on a U.S.-Japanese conflict with regard to the Jap- anese distribution system. An opinion that considers institutions and business practices in the Japanese distribution system as a significant non-tariff barrier is gaining momentum in the United States and is frequently mentioned in the recent “structural impediments” talks between the United States and Japan. Business leaders and government officials in the United States suspect that the Japanese distribution system discriminates against imports from the United States and other countries. By removing the barriers, it is suggested that the Japanese would import more manufactured goods and the trade imbalances would diminish.
The structural impediments initiative (SII) has recently prompted two types of reactions in Japan. First, “revisionists” in Japan, mainly reacting to attacks from the United States, emphasize that the Japanese characteristics could be a result of “rational behavior and free choices” of the Japanese consumers (see, e.g., Itoh, in this volume, and MITI 1989). Second, “reformers” consider that the Japanese characteristics do represent some sort of market imperfection, by regulations and/or by rent-seeking behavior of oligopolists.
Both domestic reformers and U.S. negotiators would regard some regula- tions, institutions, and practices as adverse to consumers’ welfare and as counterproductive to international efficiency. Reformers may welcome the U.S. demands, because they are politically helpful as a “foreign pressure” (gaiatsu) from the United States. However, reformers may be quite different from the U. S. negotiation team in assessing the effects of the structural imped- iments on trade balances or potential benefits to American firms. Reformers think that removing structural bamers might not reduce by a significant pro- portion the Japanese trade surplus, especially the bilateral trade imbalance between Japan and United States, but that it would surely improve the Japa- nese consumers’ welfare.
Both true revisionists and true reformers would not object to dismantling Dai-ten Ho, or at least to implement, on the part of MITI, the law without favoring small stores. If what revisionist claim is correct, constructing a large retail store would not affect consumers’ behavior, which prefers frequent visits to neighborhood stores. Reformers think that the Dai-ten Ho causes some distortion in the retail market. Although the retail sales per establishment is increasing, the pace of catching up to the United States and Germany is too slow. Hence, the Dai-ten H o should be significantly weakened, if not abol- ished.
This paper has, we hope, clarified with ample quantitative evidence, one particular aspect, namely efficiency, of the distribution system in Japan. It is our hope that this discussion stimulates further research in this field.
172 Takatoshi Ito and Masayoshi Maruyama
Postscript. After this paper was completed, there were notable changes with regard to the Dui-ten Ho (Large-scale Retail Store Law). In May 1990, MITI revised its ministry guidelines so that it would be possible for a store to open for business within a year and a half after the intent to do so is expressed to the MITI local office. Since previously it was common for opening to be de- layed up to three years, this revision could result in a significant shortening of the process.
In May 1991, the Diet enacted a revision of the Dui-ten Ho. Under the revised law, sho cho kyo (a local committee to review applications) was abol- ished, with the dui ten shin (a national council on large stores) now respon- sible to examine applications, applying a common national standard. How- ever, small stores are planning to pressure local business groups to establish an alternative to sho cho kyo (the alternative would be called sho mon kyo). Moreover, the revised law is not specific enough to predict whether significant change will take place. For example, dui ten shin (as of August 1991) does not specify standards for accepting or rejecting applications.
Hence, it remains to be seen whether the procedural change of May 1990 and the May 1991 revision of the law will in fact change the process in any meaningful way.
References
Achaval, D. D., ed. 1984. Special issue: Productivity in Retailing. Journal of Retail- ing 60, no. 3 (Fall).
Beckman, T. 1957. The Value Added Concept as a Measure of Output. Advanced Management 22:6-9.
Bucklin, L. 1978. Productivity in Marketing. Chicago: American Marketing Associa- tion.
Flath, David. 1988. Why Are There So Many Retail Stores in Japan? Working Paper no. 17. Center on Japanese Economy and Business, Columbia University.
. 1989a. The Economic Rationality of the Japanese Distribution System. Work- ing Paper no. 29. Center on Japanese Economy and Business. September.
. 1989b. Vertical Restraints in Japan. Japan and the World Economy. Flath, David, and Tatsuhiko Nariu. 1989. Returns Policy in the Japanese Marketing
System. Journal of the Japanese and International Economy 3 (March): 49-63. Ingene, C. A. 1982. Labor Productivity in Retailing. Journal ofMarketing 46: 75-90. Ito, Takatoshi, and Masayoshi Maruyama. 1989. Is the Japanese Distribution System
Really Inefficient? Discussion Paper no. 215. Hitotsubashi University, Institute of Economic Research, December.
McCraw, Thomas K., and Patricia A. O’Brien. 1986. Production and Distribution: Competition Policy and Industry Structure. In America versus Japan: A Cornpara- rive Study, ed. Thomas K. McCraw, Chap. 3, pp. 77-1 16. Boston: Harvard Business School Press.
Maruyama, M., Y. Togawa, K. Sakai, N. Sakamoto, andM. Arakawa. 1989. Distri- bution System and Business Practices in Japan. Paper presented in the 7th EPA
173 Is the Japanese Distribution System Really Inefficient?
International Symposium, Economic Research Institute, Economic Planning Agency, Tokyo.
Ministry of International Trade and Industry (MITI). 1988. White Paper, 1988. Tokyo: Ministry of Finance.
. 1989. The Distribution System in Japan. Mimeographed, April. Nihon Keizai Shinbunsha, ed. 1989. Nichibei Masatsu (U.S.-Japan conflicts). Tokyo:
Nihon Keizai Shinbunsha. Nishimura, Kiyohiko, and Hiroshi Tsubouchi. 1989. Commerce Margins in Japan.
Discussion Paper 89-54, Faculty of Economics, University of Tokyo, August. Rangan, V. K. 1989. Efficiency in the Distributive System. Paper presented at the 4th
MITI/RI conference, MITI, Japan. RyDtsD Keizai Kenkyusho. 1988. Ryatszigyb no Kokusai Hikaku ni Kansuru Chbsa
Kenkyzi [Research for the international comparison of distribution industry]. Smith, A. D., and D. M. W. N. Hitchens. 1985. Productivity in the Distributive
Trades: A Comparison of Britain, America, and Germany. Cambridge: Cambridge University Press.
Tajima, Y., and M. Miyashita. 1985. Ryzitsii no Kokusai Hikaku (International com- parison of distribution). Tokyo: Yuhikaku.
Takeuchi, H., and L. P. Bucklin. 1977. Productivity in Retailing: Retail Structure and Public Policy. Journal ofRetailing 53, no. 1: 35-46.
Telser, L. 1960. Why Should Manufacturers Want Fair Trade? Journal of Law and Economics 3: 86-105.

This Page Intentionally Left Blank
Related Documents


