Introduction The question of how adult weight influences the risk of chronic diseases, and promotes longevity has profound health, social, and economic implications for individuals, communities, and the population as a whole (1). Specifically in the elderly, the prevalence of overweight and obesity has become a growing concern recently (2). Not only are many older people overweight or obese but rates are also increasing rapidly, in parallel with the dramatic increase also observed in younger adults in recent years (3, 4). Obesity causes serious medical complications. Its association with cardiovascular and all-cause mortality is well documented (5). It is also thought that obesity exacerbates age-related diseases (1, 6). Recently, Flegal et al have reported findings from a systematic review and meta- analysis of associations between standard body mass index (BMI) categories for overweight (BMI ≥ 25 kg/m 2 ) and obesity (BMI ≥ 30 kg/m 2 ) (7). Based on a sample of more than 2.88 million individuals ranging in age from 20 to 80 years, the authors confirmed a significant increase in all-cause mortality compared to normal weight (18.5 ≤ BMI <25 kg/m 2 ) for overall obesity, and BMI ≥ 35 and ≥ 40 kg/m 2 respectively. However, higher all-cause mortality was not observed in individuals with BMI ≥ 30 kg/m 2 and mortality was significantly lower among those who were overweight, compared with normal weight individuals. Similar findings were observed previously (8-10). Furthermore, large epidemiological studies have observed that mortality risk associated with obesity markedly also declines with ageing (11, 12). Complementarily, some clinical studies have described a paradoxical, inverse association between the BMI and survival rates in aged adults (13-16). A similar paradox has been reported in younger adults suffering from severe comorbid conditions (1, 13) leading some authors to consider higher BMI as a marker of robustness that may act as a greater metabolic reserve (17, 18). Acute hospitalization places older adults at higher risk of functional, physical and/or mental deterioration, and ultimately, death (19). One of the triggers of these deleterious outcomes is probably the energy imbalance associated with acute diseases and/or exacerbation of chronic co-morbid conditions (20). In this context, we used the data from the SAFES cohort study, (Sujet Âgé Fragile: Évaluation et suivi – i.e. Frail elderly subjects, evaluation and follow-up) (21) to analyze the relationship between BMI categories and mortality at 6 week, 12 and 24 months respectively. Using data collected from 1306 adults aged 75 years or over, hospitalized through emergency circumstances and evaluated with comprehensive geriatric assessment, we aimed to investigate whether obesity could be considered as a marker of robustness in vulnerable aged people. IS OBESITY A MARKER OF ROBUSTNESS IN VULNERABLE HOSPITALIZED AGED POPULATIONS? PROSPECTIVE, MULTICENTER COHORT STUDY OF 1 306 ACUTELY ILL PATIENTS P.-O. LANG 1,2 , R. MAHMOUDI 3,4 , J.-L. NOVELLA 3,4 , E. TARDIEU 4 , L.-A. BERTHOLON 3,4 , P. NAZEYROLLAS 5 , F. BLANCHARD 3,4 , D. JOLLY 3,6 , M. DRAME 3,4,6 1. Translational Medicine Research group, Cranfield Health, Cranfield University, Cranfield, UK; 2. Nescens Centre of preventive medicine, Clinic of Genolier, Genolier, Switzerland 3. University of Reims Champagne-Ardenne, Faculty of Medicine, EA 3797, F-51095, Reims, France; 4. Reims Teaching Hospitals, Department of Geriatrics and Internal Medicine, F- 51092, Reims, France; 5 Reims Teaching Hospitals, Department of Cardiology, F-51092, Reims, France; 6. Reims Teaching Hospitals, Department of Research and Innovation, F-51092, Reims, France. Corresponding author: Prof. Pierre Olivier Lang, MD, MPH, PD, PhD. Nescens Centre of Preventive Medicine, Clinic of Genolier, Route du Muids, 3, CH-1272 Genolier, Switzerland, Phone: + 412236693 09 – fax: + 4122 36693 49–E-mail: [email protected] Abstract: Background: The “obesity paradox” is poorly understood in vulnerable older hospitalized populations. Objectives: To prospectively analyze the impact of body mass index (BMI) and comorbidities on early (6-week), one- and two-year mortality. Design: Prospective multicenter study with a two-year follow-up of old patients participating in the SAFES cohort study. Settings: Nine university hospitals in France. Participants: Patients aged 75 or older hospitalized in medical divisions through the emergency department. Measurement: Inpatients’ characteristics were obtained through a comprehensive geriatric assessment of inpatients, conducted in the first week of hospitalization. All-cause mortalities at 6-week, one- and two-year were determined using bivariable and multivariable Cox proportional hazard model. Results: The SAFES cohort included 1,306 patients, aged 85±6 years, with a majority of women (65%). One- and two-year mortality were inversely associated with BMI ≥30 kg/m2 while early mortality was not, and positively associated with age, burden of comorbidities, walking disorders, level of dependency and presence of a dementia syndrome. Survival rates between patients in low (< 18.0 kg/m2) and intermediate (18-24.9 and 25-29.9 kg/m2) BMI categories were not significant. Conclusion: While our findings seem to confirm the reality of the “obesity paradox” in vulnerable older hospitalized population, the exact understanding of underlying mechanisms and even the truthfulness of this paradoxical relationship are still fraught with considerable methodological, epidemiological and metabolic challenges. Key words: Body-mass index, obesity paradox, comprehensive geriatric assessment, SAFES cohort, aged adults. 1 J Nutr Health Aging THE JOURNAL OF NUTRITION, HEALTH & AGING© Received February 11, 2013 Accepted for publication April 3, 2013 LANG_04 LORD_c 27/06/13 14:04 Page1

Welcome message from author
This document is posted to help you gain knowledge. Please leave a comment to let me know what you think about it! Share it to your friends and learn new things together.
Transcript
Introduction
The question of how adult weight influences the risk ofchronic diseases, and promotes longevity has profound health,social, and economic implications for individuals, communities,and the population as a whole (1). Specifically in the elderly,the prevalence of overweight and obesity has become agrowing concern recently (2). Not only are many older peopleoverweight or obese but rates are also increasing rapidly, inparallel with the dramatic increase also observed in youngeradults in recent years (3, 4). Obesity causes serious medicalcomplications. Its association with cardiovascular and all-causemortality is well documented (5). It is also thought that obesityexacerbates age-related diseases (1, 6). Recently, Flegal et alhave reported findings from a systematic review and meta-analysis of associations between standard body mass index(BMI) categories for overweight (BMI ≥ 25 kg/m2) and obesity(BMI ≥ 30 kg/m2) (7). Based on a sample of more than 2.88million individuals ranging in age from 20 to 80 years, theauthors confirmed a significant increase in all-cause mortalitycompared to normal weight (18.5 ≤ BMI <25 kg/m2) for overallobesity, and BMI ≥ 35 and ≥ 40 kg/m2 respectively. However,higher all-cause mortality was not observed in individuals withBMI ≥ 30 kg/m2 and mortality was significantly lower amongthose who were overweight, compared with normal weightindividuals. Similar findings were observed previously (8-10).
Furthermore, large epidemiological studies have observed thatmortality risk associated with obesity markedly also declineswith ageing (11, 12). Complementarily, some clinical studieshave described a paradoxical, inverse association between theBMI and survival rates in aged adults (13-16). A similarparadox has been reported in younger adults suffering fromsevere comorbid conditions (1, 13) leading some authors toconsider higher BMI as a marker of robustness that may act asa greater metabolic reserve (17, 18).
Acute hospitalization places older adults at higher risk offunctional, physical and/or mental deterioration, and ultimately,death (19). One of the triggers of these deleterious outcomes isprobably the energy imbalance associated with acute diseasesand/or exacerbation of chronic co-morbid conditions (20). Inthis context, we used the data from the SAFES cohort study,(Sujet Âgé Fragile: Évaluation et suivi – i.e. Frail elderlysubjects, evaluation and follow-up) (21) to analyze therelationship between BMI categories and mortality at 6 week,12 and 24 months respectively. Using data collected from 1306adults aged 75 years or over, hospitalized through emergencycircumstances and evaluated with comprehensive geriatricassessment, we aimed to investigate whether obesity could beconsidered as a marker of robustness in vulnerable aged people.
IS OBESITY A MARKER OF ROBUSTNESS IN VULNERABLE HOSPITALIZEDAGED POPULATIONS? PROSPECTIVE, MULTICENTER COHORT STUDY
OF 1 306 ACUTELY ILL PATIENTS
P.-O. LANG1,2, R. MAHMOUDI3,4, J.-L. NOVELLA3,4, E. TARDIEU4, L.-A. BERTHOLON3,4, P. NAZEYROLLAS5, F. BLANCHARD3,4, D. JOLLY3,6, M. DRAME3,4,6
1. Translational Medicine Research group, Cranfield Health, Cranfield University, Cranfield, UK; 2. Nescens Centre of preventive medicine, Clinic of Genolier, Genolier, Switzerland3. University of Reims Champagne-Ardenne, Faculty of Medicine, EA 3797, F-51095, Reims, France; 4. Reims Teaching Hospitals, Department of Geriatrics and Internal Medicine, F-
51092, Reims, France; 5 Reims Teaching Hospitals, Department of Cardiology, F-51092, Reims, France; 6. Reims Teaching Hospitals, Department of Research and Innovation, F-51092,Reims, France. Corresponding author: Prof. Pierre Olivier Lang, MD, MPH, PD, PhD. Nescens Centre of Preventive Medicine, Clinic of Genolier, Route du Muids, 3, CH-1272 Genolier,
Switzerland, Phone: + 412236693 09 – fax: + 4122 36693 49–E-mail: [email protected]
Abstract: Background: The “obesity paradox” is poorly understood in vulnerable older hospitalized populations.Objectives: To prospectively analyze the impact of body mass index (BMI) and comorbidities on early (6-week),one- and two-year mortality. Design: Prospective multicenter study with a two-year follow-up of old patientsparticipating in the SAFES cohort study. Settings: Nine university hospitals in France. Participants: Patientsaged 75 or older hospitalized in medical divisions through the emergency department. Measurement: Inpatients’characteristics were obtained through a comprehensive geriatric assessment of inpatients, conducted in the firstweek of hospitalization. All-cause mortalities at 6-week, one- and two-year were determined using bivariable andmultivariable Cox proportional hazard model. Results: The SAFES cohort included 1,306 patients, aged 85±6years, with a majority of women (65%). One- and two-year mortality were inversely associated with BMI ≥30kg/m2 while early mortality was not, and positively associated with age, burden of comorbidities, walkingdisorders, level of dependency and presence of a dementia syndrome. Survival rates between patients in low (<18.0 kg/m2) and intermediate (18-24.9 and 25-29.9 kg/m2) BMI categories were not significant. Conclusion:While our findings seem to confirm the reality of the “obesity paradox” in vulnerable older hospitalizedpopulation, the exact understanding of underlying mechanisms and even the truthfulness of this paradoxicalrelationship are still fraught with considerable methodological, epidemiological and metabolic challenges.
Key words: Body-mass index, obesity paradox, comprehensive geriatric assessment, SAFES cohort, aged adults.
1
J Nutr Health Aging
THE JOURNAL OF NUTRITION, HEALTH & AGING©
Received February 11, 2013Accepted for publication April 3, 2013
LANG_04 LORD_c 27/06/13 14:04 Page1
Methods
Study populationThe population for this analysis was the SAFEs cohort,
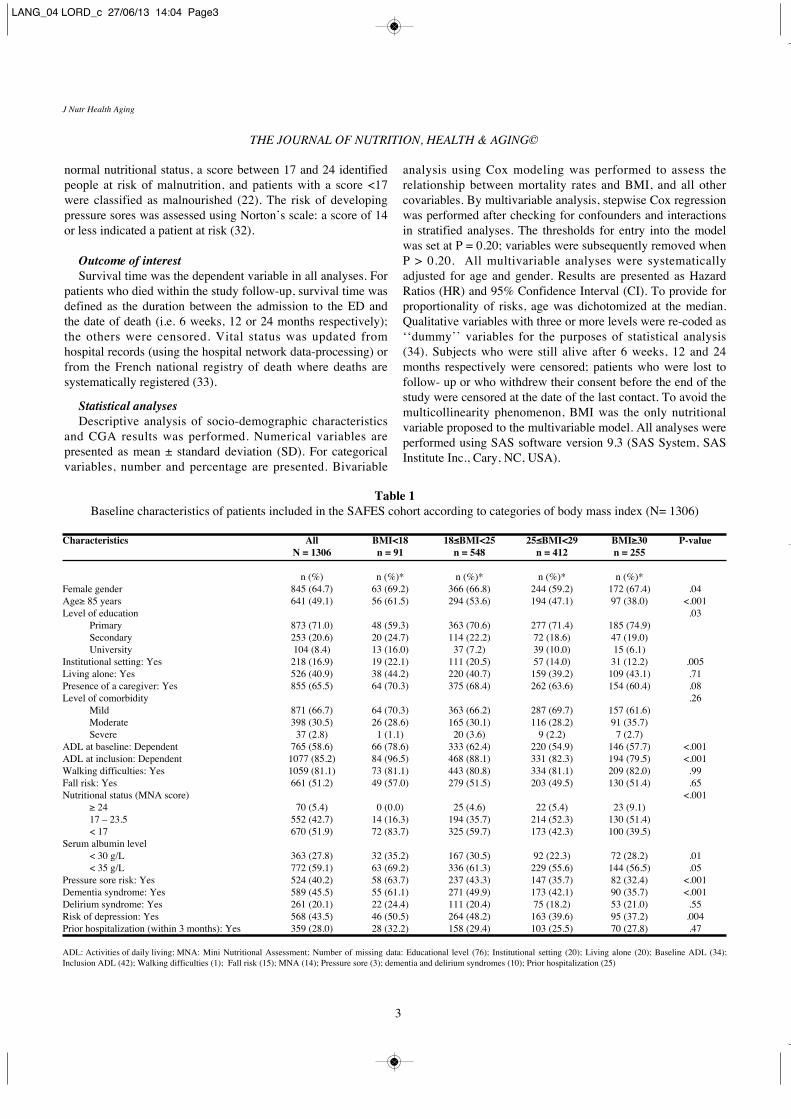
whose design, sampling methods, inclusion and non-inclusioncriteria have previously been described elsewhere (21). Briefly,1,306 subjects aged 75 or over were hospitalized through theemergency department (ED) in nine teaching hospitals inFrance (see figure 1). To be eligible, patients had to be aged 75years or over; and have been hospitalized in a medical ward inthe same hospital as the ED to which they were initiallyadmitted. Subjects were not eligible if they were admitted tointensive care unit or to a surgical department after the ED, or ifthey were discharged from hospital directly from the ED. Eachpatient included was interviewed and evaluated by ageriatrician familiar with the survey procedures. In the courseof this interview, patients were informed about the study, priorto signing the consent form. When the clinical and/or cognitivestatus of the patient precluded informed consent, consent wasobtained from the family or legal representative. Follow-up wasperformed by telephone interview after 1, 8 and 21months andby face-to-face interviews at 5, 12, 18 and 24 months afterinclusion. The study was approved by the Institutional ReviewBoard of the University Hospitals of Reims, France.
Figure 1Flow chart of the SAFES cohort population
Comprehensive Geriatric AssessmentA comprehensive geriatric assessment (CGA) was conducted
by a senior geriatrician, assisted by a member of the healthcareteam and/or the patient’s main caregiver, or both, during thefirst week of the hospital stay and periodically during the 24months follow-up (i.e. 1, 5, 8, 12, 21 and 24th month). DuringCGA, the following socio-demographic and clinical data wererecorded:
- Socio-demographic characteristics such as age, gender,place of residence, level of education (primary, secondary or
university), the presence or not of a caregiver, and whether thepatient lived alone or not.
- Body mass index (BMI), defined as [weight / (height inmeter) ²], was calculated during CGA. This item is a major itemof the Mini Nutritional Assessment (MNA) (22). For theevaluation of body weight, portable digital scales with 0.1 kgprecision and a 150 kg limit were used. Participants wereweighed wearing light clothing or a hospital gown, and withoutshoes, before breakfast. A large scales located at the floor levelwas also used to weight patients in wheelchairs. According toBMI values, patients were assigned to one of the following fourgroups (1,13): <18 kg/m2; 18–24.9 kg/m2; 25–29.9 kg/m2; and ≥30 kg/m2. For statistical analyses, 18–24.9 kg/m2 was used asreference group as this is considered to be normal BMI level. Inaddition, arm and calf circumferences were measured using astandard World Health Organization (WHO) tape measure witha precision level of one millimeter.
- Comorbidities were assessed using Charlson’s comorbidityindex (CCI) (23). CCI is a prognostic index including 17medical conditions assigned into weighted groups, of whichsome are of particular interest in this population (e.g. history ofmyocardial infarction, congestive heart failure, peripheralvascular disease, cerebrovascular disease, dementia, chronicpulmonary disease, diabetes with and without end organdamage, paraplegia, mild and moderate to severe liver disease,moderate to severe kidney disease and malignancies). Inaddition, the level of severity of patient's comorbidities, asassessed by the modified version of CCI for the ICD-10 madewas graded in three levels: mild (CCI<2), moderate (2≤ CCI≤4) and severe comorbidity (CCI ≥5) burden 524°;
- Other clinical data of interest: Functional ability wasassessed using Katz’s activities of daily living (ADL) (25).Dependency for ADLs was defined according to theability/inability of the subject to perform the followingactivities: bodily care, dressing, using the toilet, continence,moving arround and feeding. Dependency levels for ADLs atbaseline and at inclusion were recorded. Baseline ADLs weredefined as the subject’s level of dependency before the eventmotivating hospitalization (performance in ADLs 2 weeksbefore admission). Independency was defined as a patient whowas not dependent for any of the Katz’s ADL. Evaluation ofbalance disorders and risk of falling was performed using theone-leg standing balance test (26) or by reference to theoccurrence of at least one fall in the preceding 12 months. Gaitdisorders were assessed using the Timed Get-Up and Go test(27). Dementia and delirium syndromes were systematicallyrecorded by a senior geriatrician according to the Diagnosticand Statistical Manual fourth edition (DSM IV) criteria) (28).Folstein’s Mini Mental State Examination (MMSE) score wasused to grade the patient’s cognitive state (29, 30). Thepresence of mood disorders or risk of depression wasascertained using the Gilleard Scale (31) with a threshold at 14.Malnutrition or risk thereof was assessed using the MiniNutritional Assessment (MNA). A score of 24 or over indicated
IS OBESITY A MARKER OF ROBUSTNESS IN VULNERABLE HOSPITALIZED AGED POPULATIONS?
J Nutr Health Aging
2
LANG_04 LORD_c 27/06/13 14:04 Page2
normal nutritional status, a score between 17 and 24 identifiedpeople at risk of malnutrition, and patients with a score <17were classified as malnourished (22). The risk of developingpressure sores was assessed using Norton’s scale: a score of 14or less indicated a patient at risk (32).
Outcome of interestSurvival time was the dependent variable in all analyses. For
patients who died within the study follow-up, survival time wasdefined as the duration between the admission to the ED andthe date of death (i.e. 6 weeks, 12 or 24 months respectively);the others were censored. Vital status was updated fromhospital records (using the hospital network data-processing) orfrom the French national registry of death where deaths aresystematically registered (33).
Statistical analysesDescriptive analysis of socio-demographic characteristics
and CGA results was performed. Numerical variables arepresented as mean ± standard deviation (SD). For categoricalvariables, number and percentage are presented. Bivariable
analysis using Cox modeling was performed to assess therelationship between mortality rates and BMI, and all othercovariables. By multivariable analysis, stepwise Cox regressionwas performed after checking for confounders and interactionsin stratified analyses. The thresholds for entry into the modelwas set at P = 0.20; variables were subsequently removed whenP > 0.20. All multivariable analyses were systematicallyadjusted for age and gender. Results are presented as HazardRatios (HR) and 95% Confidence Interval (CI). To provide forproportionality of risks, age was dichotomized at the median.Qualitative variables with three or more levels were re-coded as‘‘dummy’’ variables for the purposes of statistical analysis(34). Subjects who were still alive after 6 weeks, 12 and 24months respectively were censored; patients who were lost tofollow- up or who withdrew their consent before the end of thestudy were censored at the date of the last contact. To avoid themulticollinearity phenomenon, BMI was the only nutritionalvariable proposed to the multivariable model. All analyses wereperformed using SAS software version 9.3 (SAS System, SASInstitute Inc., Cary, NC, USA).
THE JOURNAL OF NUTRITION, HEALTH & AGING©
J Nutr Health Aging
3
Table 1Baseline characteristics of patients included in the SAFES cohort according to categories of body mass index (N= 1306)
Characteristics All BMI<18 18≤BMI<25 25≤BMI<29 BMI≥30 P-valueN = 1306 n = 91 n = 548 n = 412 n = 255
n (%) n (%)* n (%)* n (%)* n (%)*Female gender 845 (64.7) 63 (69.2) 366 (66.8) 244 (59.2) 172 (67.4) .04Age≥ 85 years 641 (49.1) 56 (61.5) 294 (53.6) 194 (47.1) 97 (38.0) <.001Level of education .03
Primary 873 (71.0) 48 (59.3) 363 (70.6) 277 (71.4) 185 (74.9)Secondary 253 (20.6) 20 (24.7) 114 (22.2) 72 (18.6) 47 (19.0)University 104 (8.4) 13 (16.0) 37 (7.2) 39 (10.0) 15 (6.1)
Institutional setting: Yes 218 (16.9) 19 (22.1) 111 (20.5) 57 (14.0) 31 (12.2) .005Living alone: Yes 526 (40.9) 38 (44.2) 220 (40.7) 159 (39.2) 109 (43.1) .71Presence of a caregiver: Yes 855 (65.5) 64 (70.3) 375 (68.4) 262 (63.6) 154 (60.4) .08Level of comorbidity .26
Mild 871 (66.7) 64 (70.3) 363 (66.2) 287 (69.7) 157 (61.6)Moderate 398 (30.5) 26 (28.6) 165 (30.1) 116 (28.2) 91 (35.7)Severe 37 (2.8) 1 (1.1) 20 (3.6) 9 (2.2) 7 (2.7)
ADL at baseline: Dependent 765 (58.6) 66 (78.6) 333 (62.4) 220 (54.9) 146 (57.7) <.001ADL at inclusion: Dependent 1077 (85.2) 84 (96.5) 468 (88.1) 331 (82.3) 194 (79.5) <.001Walking difficulties: Yes 1059 (81.1) 73 (81.1) 443 (80.8) 334 (81.1) 209 (82.0) .99Fall risk: Yes 661 (51.2) 49 (57.0) 279 (51.5) 203 (49.5) 130 (51.4) .65Nutritional status (MNA score) <.001
≥ 24 70 (5.4) 0 (0.0) 25 (4.6) 22 (5.4) 23 (9.1)17 – 23.5 552 (42.7) 14 (16.3) 194 (35.7) 214 (52.3) 130 (51.4)< 17 670 (51.9) 72 (83.7) 325 (59.7) 173 (42.3) 100 (39.5)
Serum albumin level< 30 g/L 363 (27.8) 32 (35.2) 167 (30.5) 92 (22.3) 72 (28.2) .01< 35 g/L 772 (59.1) 63 (69.2) 336 (61.3) 229 (55.6) 144 (56.5) .05
Pressure sore risk: Yes 524 (40.2) 58 (63.7) 237 (43.3) 147 (35.7) 82 (32.4) <.001Dementia syndrome: Yes 589 (45.5) 55 (61.1) 271 (49.9) 173 (42.1) 90 (35.7) <.001Delirium syndrome: Yes 261 (20.1) 22 (24.4) 111 (20.4) 75 (18.2) 53 (21.0) .55Risk of depression: Yes 568 (43.5) 46 (50.5) 264 (48.2) 163 (39.6) 95 (37.2) .004Prior hospitalization (within 3 months): Yes 359 (28.0) 28 (32.2) 158 (29.4) 103 (25.5) 70 (27.8) .47
ADL: Activities of daily living; MNA: Mini Nutritional Assessment; Number of missing data: Educational level (76); Institutional setting (20); Living alone (20); Baseline ADL (34);Inclusion ADL (42); Walking difficulties (1); Fall risk (15); MNA (14); Pressure sore (3); dementia and delirium syndromes (10); Prior hospitalization (25)
LANG_04 LORD_c 27/06/13 14:04 Page3
4
J Nutr Health Aging
IS OBESITY A MARKER OF ROBUSTNESS IN VULNERABLE HOSPITALIZED AGED POPULATIONS?
Results
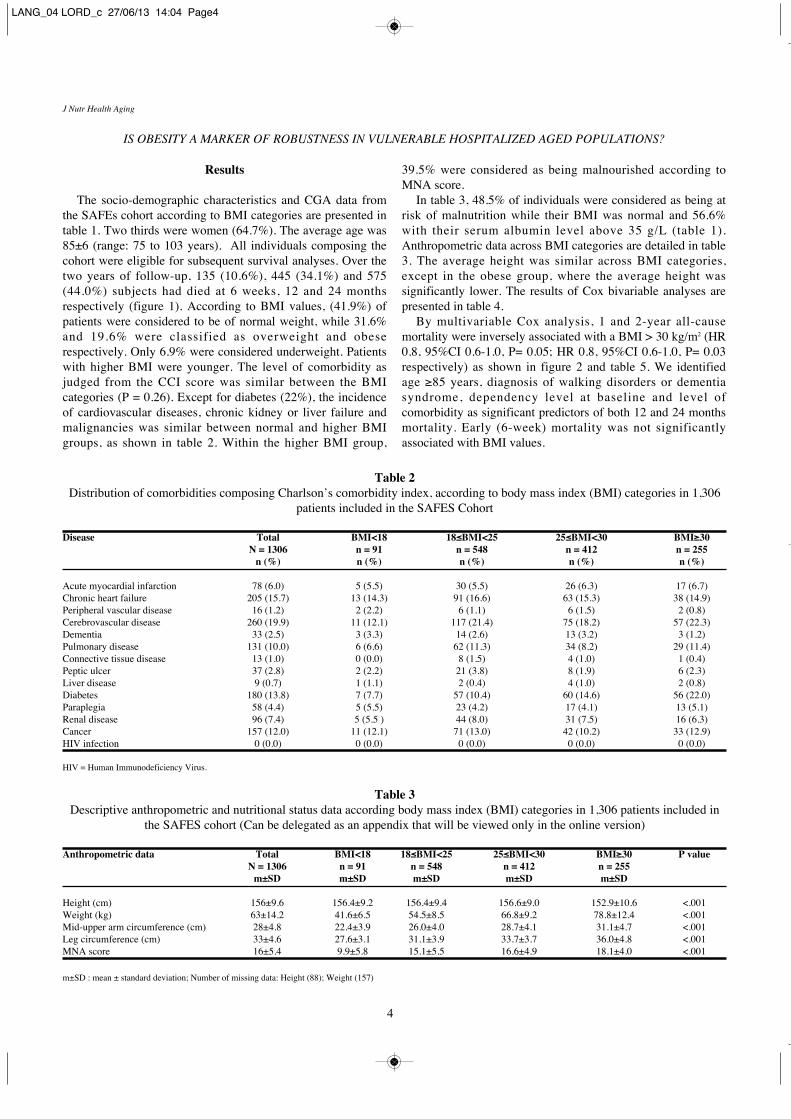
The socio-demographic characteristics and CGA data fromthe SAFEs cohort according to BMI categories are presented intable 1. Two thirds were women (64.7%). The average age was85±6 (range: 75 to 103 years). All individuals composing thecohort were eligible for subsequent survival analyses. Over thetwo years of follow-up, 135 (10.6%), 445 (34.1%) and 575(44.0%) subjects had died at 6 weeks, 12 and 24 monthsrespectively (figure 1). According to BMI values, (41.9%) ofpatients were considered to be of normal weight, while 31.6%and 19.6% were classified as overweight and obeserespectively. Only 6.9% were considered underweight. Patientswith higher BMI were younger. The level of comorbidity asjudged from the CCI score was similar between the BMIcategories (P = 0.26). Except for diabetes (22%), the incidenceof cardiovascular diseases, chronic kidney or liver failure andmalignancies was similar between normal and higher BMIgroups, as shown in table 2. Within the higher BMI group,
39.5% were considered as being malnourished according toMNA score.
In table 3, 48.5% of individuals were considered as being atrisk of malnutrition while their BMI was normal and 56.6%with their serum albumin level above 35 g/L (table 1).Anthropometric data across BMI categories are detailed in table3. The average height was similar across BMI categories,except in the obese group, where the average height wassignificantly lower. The results of Cox bivariable analyses arepresented in table 4.
By multivariable Cox analysis, 1 and 2-year all-causemortality were inversely associated with a BMI > 30 kg/m2 (HR0.8, 95%CI 0.6-1.0, P= 0.05; HR 0.8, 95%CI 0.6-1.0, P= 0.03respectively) as shown in figure 2 and table 5. We identifiedage ≥85 years, diagnosis of walking disorders or dementiasyndrome, dependency level at baseline and level ofcomorbidity as significant predictors of both 12 and 24 monthsmortality. Early (6-week) mortality was not significantlyassociated with BMI values.
Table 2Distribution of comorbidities composing Charlson’s comorbidity index, according to body mass index (BMI) categories in 1,306
patients included in the SAFES Cohort
Disease Total BMI<18 18≤BMI<25 25≤BMI<30 BMI≥30N = 1306 n = 91 n = 548 n = 412 n = 255
n (%) n (%) n (%) n (%) n (%)
Acute myocardial infarction 78 (6.0) 5 (5.5) 30 (5.5) 26 (6.3) 17 (6.7)Chronic heart failure 205 (15.7) 13 (14.3) 91 (16.6) 63 (15.3) 38 (14.9)Peripheral vascular disease 16 (1.2) 2 (2.2) 6 (1.1) 6 (1.5) 2 (0.8)Cerebrovascular disease 260 (19.9) 11 (12.1) 117 (21.4) 75 (18.2) 57 (22.3)Dementia 33 (2.5) 3 (3.3) 14 (2.6) 13 (3.2) 3 (1.2)Pulmonary disease 131 (10.0) 6 (6.6) 62 (11.3) 34 (8.2) 29 (11.4)Connective tissue disease 13 (1.0) 0 (0.0) 8 (1.5) 4 (1.0) 1 (0.4)Peptic ulcer 37 (2.8) 2 (2.2) 21 (3.8) 8 (1.9) 6 (2.3)Liver disease 9 (0.7) 1 (1.1) 2 (0.4) 4 (1.0) 2 (0.8)Diabetes 180 (13.8) 7 (7.7) 57 (10.4) 60 (14.6) 56 (22.0)Paraplegia 58 (4.4) 5 (5.5) 23 (4.2) 17 (4.1) 13 (5.1)Renal disease 96 (7.4) 5 (5.5 ) 44 (8.0) 31 (7.5) 16 (6.3)Cancer 157 (12.0) 11 (12.1) 71 (13.0) 42 (10.2) 33 (12.9)HIV infection 0 (0.0) 0 (0.0) 0 (0.0) 0 (0.0) 0 (0.0)
HIV = Human Immunodeficiency Virus.
Table 3Descriptive anthropometric and nutritional status data according body mass index (BMI) categories in 1,306 patients included in
the SAFES cohort (Can be delegated as an appendix that will be viewed only in the online version)
Anthropometric data Total BMI<18 18≤BMI<25 25≤BMI<30 BMI≥30 P valueN = 1306 n = 91 n = 548 n = 412 n = 255
m±SD m±SD m±SD m±SD m±SD
Height (cm) 156±9.6 156.4±9.2 156.4±9.4 156.6±9.0 152.9±10.6 <.001Weight (kg) 63±14.2 41.6±6.5 54.5±8.5 66.8±9.2 78.8±12.4 <.001Mid-upper arm circumference (cm) 28±4.8 22.4±3.9 26.0±4.0 28.7±4.1 31.1±4.7 <.001Leg circumference (cm) 33±4.6 27.6±3.1 31.1±3.9 33.7±3.7 36.0±4.8 <.001MNA score 16±5.4 9.9±5.8 15.1±5.5 16.6±4.9 18.1±4.0 <.001
m±SD : mean ± standard deviation; Number of missing data: Height (88); Weight (157)
LANG_04 LORD_c 27/06/13 14:04 Page4
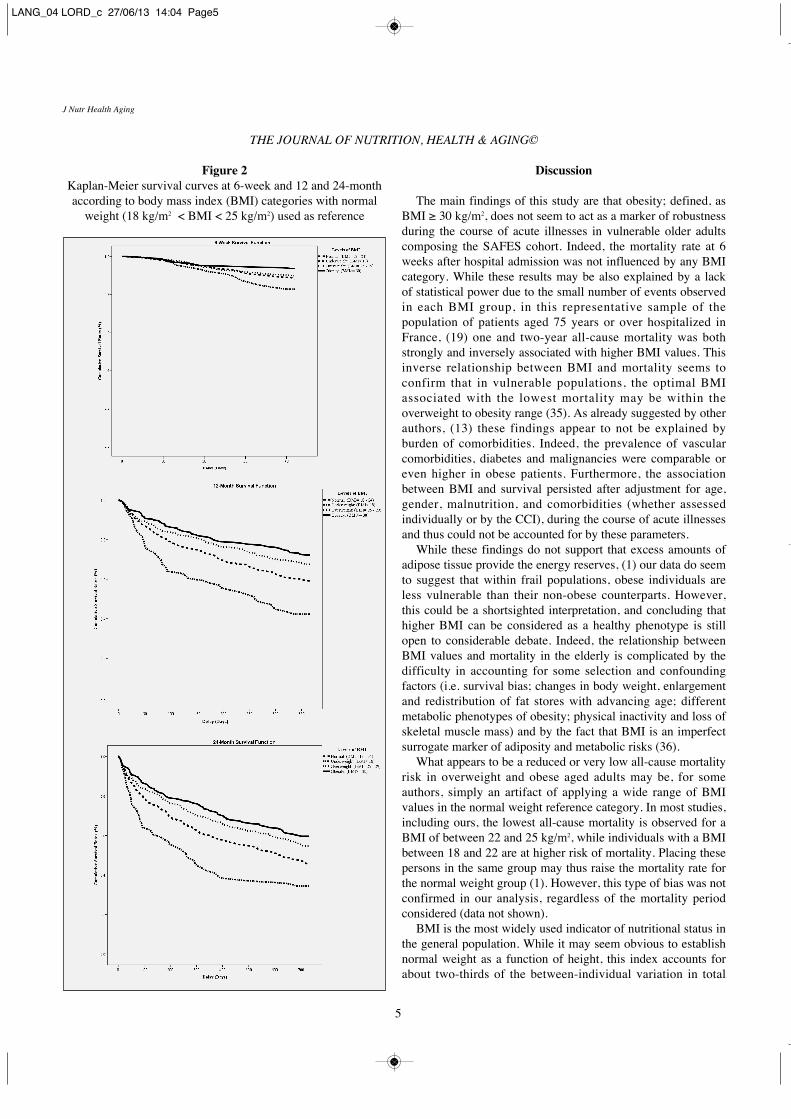
Figure 2Kaplan-Meier survival curves at 6-week and 12 and 24-monthaccording to body mass index (BMI) categories with normal
weight (18 kg/m2 < BMI < 25 kg/m2) used as reference
Discussion
The main findings of this study are that obesity; defined, asBMI ≥ 30 kg/m2, does not seem to act as a marker of robustnessduring the course of acute illnesses in vulnerable older adultscomposing the SAFES cohort. Indeed, the mortality rate at 6weeks after hospital admission was not influenced by any BMIcategory. While these results may be also explained by a lackof statistical power due to the small number of events observedin each BMI group, in this representative sample of thepopulation of patients aged 75 years or over hospitalized inFrance, (19) one and two-year all-cause mortality was bothstrongly and inversely associated with higher BMI values. Thisinverse relationship between BMI and mortality seems toconfirm that in vulnerable populations, the optimal BMIassociated with the lowest mortality may be within theoverweight to obesity range (35). As already suggested by otherauthors, (13) these findings appear to not be explained byburden of comorbidities. Indeed, the prevalence of vascularcomorbidities, diabetes and malignancies were comparable oreven higher in obese patients. Furthermore, the associationbetween BMI and survival persisted after adjustment for age,gender, malnutrition, and comorbidities (whether assessedindividually or by the CCI), during the course of acute illnessesand thus could not be accounted for by these parameters.
While these findings do not support that excess amounts ofadipose tissue provide the energy reserves, (1) our data do seemto suggest that within frail populations, obese individuals areless vulnerable than their non-obese counterparts. However,this could be a shortsighted interpretation, and concluding thathigher BMI can be considered as a healthy phenotype is stillopen to considerable debate. Indeed, the relationship betweenBMI values and mortality in the elderly is complicated by thedifficulty in accounting for some selection and confoundingfactors (i.e. survival bias; changes in body weight, enlargementand redistribution of fat stores with advancing age; differentmetabolic phenotypes of obesity; physical inactivity and loss ofskeletal muscle mass) and by the fact that BMI is an imperfectsurrogate marker of adiposity and metabolic risks (36).
What appears to be a reduced or very low all-cause mortalityrisk in overweight and obese aged adults may be, for someauthors, simply an artifact of applying a wide range of BMIvalues in the normal weight reference category. In most studies,including ours, the lowest all-cause mortality is observed for aBMI of between 22 and 25 kg/m2, while individuals with a BMIbetween 18 and 22 are at higher risk of mortality. Placing thesepersons in the same group may thus raise the mortality rate forthe normal weight group (1). However, this type of bias was notconfirmed in our analysis, regardless of the mortality periodconsidered (data not shown).
BMI is the most widely used indicator of nutritional status inthe general population. While it may seem obvious to establishnormal weight as a function of height, this index accounts forabout two-thirds of the between-individual variation in total
THE JOURNAL OF NUTRITION, HEALTH & AGING©
J Nutr Health Aging
5
LANG_04 LORD_c 27/06/13 14:04 Page5
adiposity (37). BMI does not account for sex, race, age, andfitness differences in fat mass and this even at the same bodyweight. Particularly with advancing age, the decrease in stature,accumulation of fatty tissues, reduction in lean mass, anddecrease in the amount of body fluids furthermore considerBMI as a problematic estimate of body weight and still more ofhealth risk. Factors such as cardio-respiratory fitness areindependent predictors of total mortality as well in some groupsafter controlling for BMI, waist circumference, and percentageof body fat (38). In addition, race and age both influence theassociations between disease risk during the course of acuteillnesses, mortality, and BMI (39).
Moreover, fat distribution varies widely even amongindividual at the same level of adiposity, with an abdominal fatpattern conveying the greatest health risks (36). Indeed, theassociation of obesity and the development of majorcomplications seems to be strongly linked to chronicinflammation. In particular, insulin resistance, a direct orindirect result of obesity, is characterized by a chronic state of
low-grade inflammation and inactivation of a number ofinflammatory mediators. Elevated serum concentration of C-reactive protein, interleukin–IL-6, IL-8, and tumor necrosisfactor–TNF-α are observed in obese individuals with elevatedinsulin resistance (36). A total of 24 different adipokines, whichare for the most inflammatory cytokines secreted by adipocytesthemselves, have been reported in relation to body fat andobesity (40). The levels of these adipokines are usually elevatedin obese humans, and circulating concentrations of each ofthese factors increase with the degree of obesity.36Furthermore obesity is also associated with a continuous cycleof cross-talk between adipocytes and monocytes thatcontributes to further aggravate and perpetuate this pro-inflammatory status (41, 42).
Not all obese individuals exhibit increased risk ofinflammation and not all normal-weight adults aremetabolically healthy (36). Thus, two distinct subtypes ofobesity have been suggested as metabolically healthy (MHO)and metabolically unhealthy obese (MUHO). It is interesting to
IS OBESITY A MARKER OF ROBUSTNESS IN VULNERABLE HOSPITALIZED AGED POPULATIONS?
J Nutr Health Aging
6
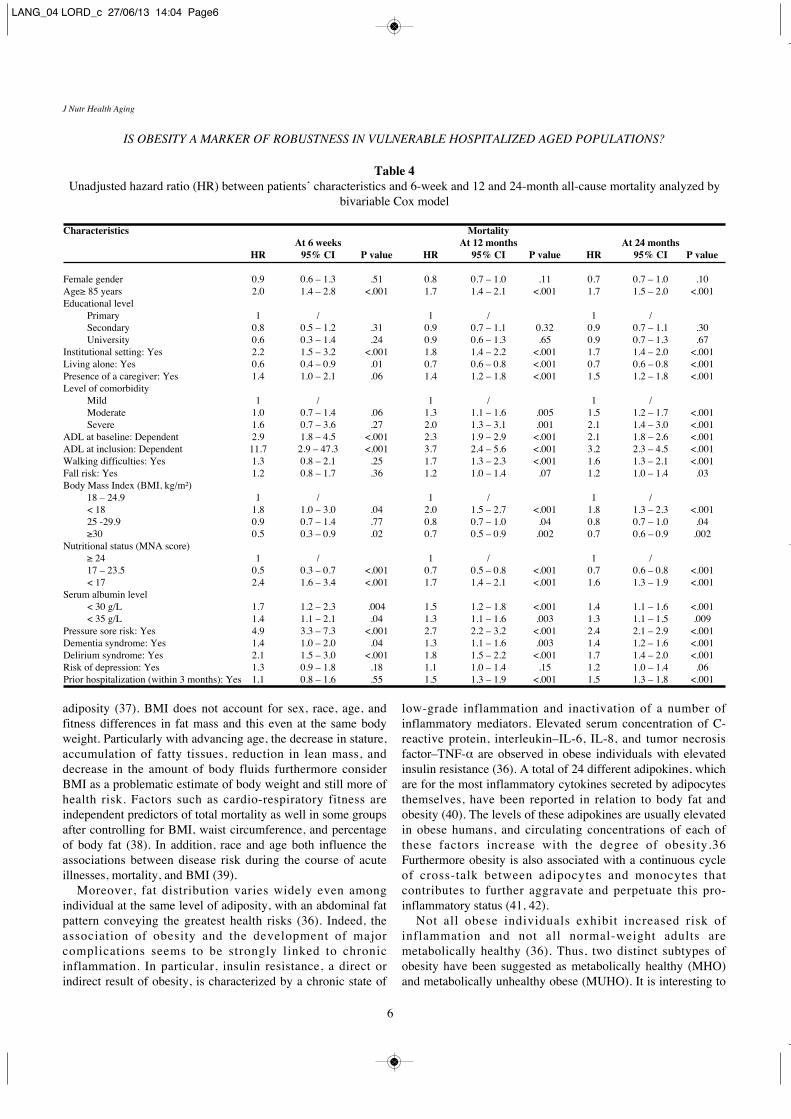
Table 4Unadjusted hazard ratio (HR) between patients’ characteristics and 6-week and 12 and 24-month all-cause mortality analyzed by
bivariable Cox model
Characteristics MortalityAt 6 weeks At 12 months At 24 months
HR 95% CI P value HR 95% CI P value HR 95% CI P value
Female gender 0.9 0.6 – 1.3 .51 0.8 0.7 – 1.0 .11 0.7 0.7 – 1.0 .10Age≥ 85 years 2.0 1.4 – 2.8 <.001 1.7 1.4 – 2.1 <.001 1.7 1.5 – 2.0 <.001Educational level
Primary 1 / 1 / 1 /Secondary 0.8 0.5 – 1.2 .31 0.9 0.7 – 1.1 0.32 0.9 0.7 – 1.1 .30University 0.6 0.3 – 1.4 .24 0.9 0.6 – 1.3 .65 0.9 0.7 – 1.3 .67
Institutional setting: Yes 2.2 1.5 – 3.2 <.001 1.8 1.4 – 2.2 <.001 1.7 1.4 – 2.0 <.001Living alone: Yes 0.6 0.4 – 0.9 .01 0.7 0.6 – 0.8 <.001 0.7 0.6 – 0.8 <.001Presence of a caregiver: Yes 1.4 1.0 – 2.1 .06 1.4 1.2 – 1.8 <.001 1.5 1.2 – 1.8 <.001Level of comorbidity
Mild 1 / 1 / 1 /Moderate 1.0 0.7 – 1.4 .06 1.3 1.1 – 1.6 .005 1.5 1.2 – 1.7 <.001Severe 1.6 0.7 – 3.6 .27 2.0 1.3 – 3.1 .001 2.1 1.4 – 3.0 <.001
ADL at baseline: Dependent 2.9 1.8 – 4.5 <.001 2.3 1.9 – 2.9 <.001 2.1 1.8 – 2.6 <.001ADL at inclusion: Dependent 11.7 2.9 – 47.3 <.001 3.7 2.4 – 5.6 <.001 3.2 2.3 – 4.5 <.001Walking difficulties: Yes 1.3 0.8 – 2.1 .25 1.7 1.3 – 2.3 <.001 1.6 1.3 – 2.1 <.001Fall risk: Yes 1.2 0.8 – 1.7 .36 1.2 1.0 – 1.4 .07 1.2 1.0 – 1.4 .03Body Mass Index (BMI, kg/m²)
18 – 24.9 1 / 1 / 1 /< 18 1.8 1.0 – 3.0 .04 2.0 1.5 – 2.7 <.001 1.8 1.3 – 2.3 <.00125 -29.9 0.9 0.7 – 1.4 .77 0.8 0.7 – 1.0 .04 0.8 0.7 – 1.0 .04≥30 0.5 0.3 – 0.9 .02 0.7 0.5 – 0.9 .002 0.7 0.6 – 0.9 .002
Nutritional status (MNA score)≥ 24 1 / 1 / 1 /17 – 23.5 0.5 0.3 – 0.7 <.001 0.7 0.5 – 0.8 <.001 0.7 0.6 – 0.8 <.001< 17 2.4 1.6 – 3.4 <.001 1.7 1.4 – 2.1 <.001 1.6 1.3 – 1.9 <.001
Serum albumin level< 30 g/L 1.7 1.2 – 2.3 .004 1.5 1.2 – 1.8 <.001 1.4 1.1 – 1.6 <.001< 35 g/L 1.4 1.1 – 2.1 .04 1.3 1.1 – 1.6 .003 1.3 1.1 – 1.5 .009
Pressure sore risk: Yes 4.9 3.3 – 7.3 <.001 2.7 2.2 – 3.2 <.001 2.4 2.1 – 2.9 <.001Dementia syndrome: Yes 1.4 1.0 – 2.0 .04 1.3 1.1 – 1.6 .003 1.4 1.2 – 1.6 <.001Delirium syndrome: Yes 2.1 1.5 – 3.0 <.001 1.8 1.5 – 2.2 <.001 1.7 1.4 – 2.0 <.001Risk of depression: Yes 1.3 0.9 – 1.8 .18 1.1 1.0 – 1.4 .15 1.2 1.0 – 1.4 .06Prior hospitalization (within 3 months): Yes 1.1 0.8 – 1.6 .55 1.5 1.3 – 1.9 <.001 1.5 1.3 – 1.8 <.001
LANG_04 LORD_c 27/06/13 14:04 Page6
note that approximately 20-30% of the obese adult populationremains MHO (43-45). They exhibit increased levels of BMIand body fat but not overweight-obesity metabolic patterns orcomplications (36). While MUHO exhibit increased levels ofinflammation compared to normal weight individuals, MHOexhibit reduced levels of inflammation compared to obeseindividuals (46, 47). In addition, MHO display mild metabolicand cardiovascular diseases risk profile with high level ofinsulin sensitivity, absence of hypertension, normal lipid,inflammation and hormonal profiles and a favorable immunephenotype (36, 48). Thus, this metabolically healthy subgroupof obese individuals appears to be more resistant, if notprotected against the development of comorbidities associatedwith obesity (49).
Secreting adipokines is closely linked to abdominal obesity,particularly to visceral adipose tissues while subcutaneous thighfat is related to more favorable inflammatory profile (36).Unfortunately we do not provide any data to demonstratewhether we have preferentially selected MHO or MUHOphenotype. However, with respect to the metabolic phenotype,individuals suffering from adiposity-related complications diedprematurely, (36, 48, 50) such that relatively fewer obesepeople survive to older ages, creating a selective survival bias.Furthermore, whether theoretically MHO and MUHO representdistinct subtypes that could be predetermined genetically, thesetwo entities may also represent transition phases in the naturalcourse of obesity, with MHO individual ultimately turning intoMUHO (36, 48).
Obesity is more prevalent in older age (3, 51) however thisdoes not necessarily mean that all those adults have grownolder as obese. This group may also represent people who havegained weight when they grew older. Indeed, normal ageing is
associated with a progressive increase in fat mass. But whetherolder adults have more body fat than younger adults, it ishowever distributed differently with a greater proportion ofintrahepatic, intramuscular, and intra-abdominal body fat.While in younger adults, such changes in body fat stores areassociated with increased insulin resistance and adversemetabolic outcomes, (36) the adverse metabolic impact of theage-related changes have not still been demonstrated (3).Finally, the use of BMI alone as a health risk phenotype mixespeople with considerable differences in nutritional status,disease and mortality risks together into similar sub-categories.Biological markers such as those representing systemic lowgrade inflammation could probably help to extend riskprediction beyond BMI scores (1). Unfortunately, our study didnot investigate either the ability of biological markers todifferentiate metabolic phenotypes of obese individuals, or themode of transition to observe the impact of obesity-relatedchronic inflammation on health outcomes.
Ageing is also associated with emergence of frailty andsarcopenia, which are partly defined by loss of muscle mass(19, 20). Thus, some older individuals convert from obesitydefined by increased BMI to obesity due to reduced muscle/fatratio but with a normal BMI value. In this regard, the normal-weight obese syndrome has been described. Interestingly, inthis population, fat mass represents up to 30% of total bodyweight and these individuals have an increased risk ofdeveloping obesity-related diseases (52). This is supported bythe prevalence of wasting-comorbidities (i.e. chronic heartfailure, diabetes, chronic renal failure, chronic pulmonarydisease, or malignancies) observed in the normal BMI groupsin the present study and by the fact that the majority ofindividuals (59.7%) in this group were at risk of malnutrition
THE JOURNAL OF NUTRITION, HEALTH & AGING©
J Nutr Health Aging
7
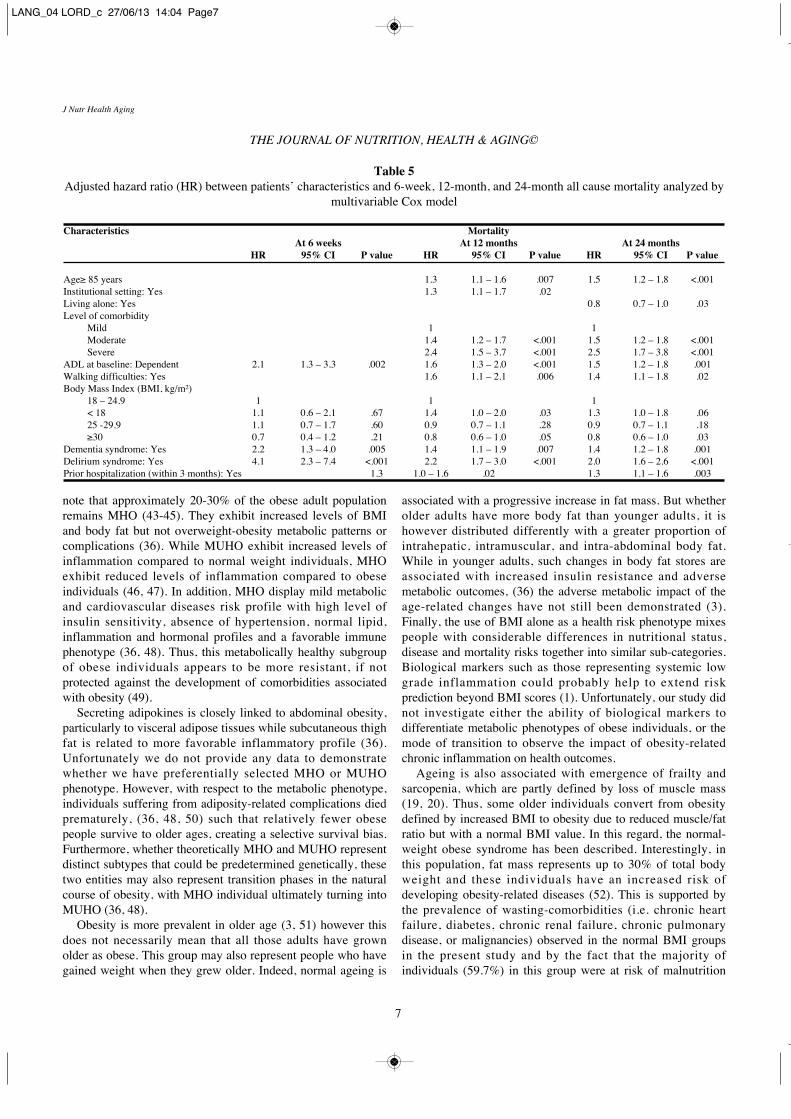
Table 5Adjusted hazard ratio (HR) between patients’ characteristics and 6-week, 12-month, and 24-month all cause mortality analyzed by
multivariable Cox model
Characteristics MortalityAt 6 weeks At 12 months At 24 months
HR 95% CI P value HR 95% CI P value HR 95% CI P value
Age≥ 85 years 1.3 1.1 – 1.6 .007 1.5 1.2 – 1.8 <.001Institutional setting: Yes 1.3 1.1 – 1.7 .02Living alone: Yes 0.8 0.7 – 1.0 .03Level of comorbidity
Mild 1 1Moderate 1.4 1.2 – 1.7 <.001 1.5 1.2 – 1.8 <.001Severe 2.4 1.5 – 3.7 <.001 2.5 1.7 – 3.8 <.001
ADL at baseline: Dependent 2.1 1.3 – 3.3 .002 1.6 1.3 – 2.0 <.001 1.5 1.2 – 1.8 .001Walking difficulties: Yes 1.6 1.1 – 2.1 .006 1.4 1.1 – 1.8 .02Body Mass Index (BMI, kg/m²)
18 – 24.9 1 1 1< 18 1.1 0.6 – 2.1 .67 1.4 1.0 – 2.0 .03 1.3 1.0 – 1.8 .0625 -29.9 1.1 0.7 – 1.7 .60 0.9 0.7 – 1.1 .28 0.9 0.7 – 1.1 .18≥30 0.7 0.4 – 1.2 .21 0.8 0.6 – 1.0 .05 0.8 0.6 – 1.0 .03
Dementia syndrome: Yes 2.2 1.3 – 4.0 .005 1.4 1.1 – 1.9 .007 1.4 1.2 – 1.8 .001Delirium syndrome: Yes 4.1 2.3 – 7.4 <.001 2.2 1.7 – 3.0 <.001 2.0 1.6 – 2.6 <.001Prior hospitalization (within 3 months): Yes 1.3 1.0 – 1.6 .02 1.3 1.1 – 1.6 .003
LANG_04 LORD_c 27/06/13 14:04 Page7
according to the MNA; one third had an albumin level < 30g/L.Finally when indices of the amount and distribution of fat
are considered, study results tend to consistently show a greaterassociation with specific and total mortality in the elderly thanwith BMI alone. Larger waist circumference or waist-to-hipratio has been shown to be significantly associated withmortality in older adults, whereas BMI alone was not (36).Central adiposity and relative loss of fat-free mass may be moreimportant than BMI in determining the health risk associatedwith obesity in the older population. Thus, the interpretation ofthe relationship between obesity and mortality rate in our studytends to highlight the role played by the loss of fat-free mass,rather than confirming the obesity paradox. Finally, in thiscohort of frail elderly patients, higher BMI values might not infact identify the sub-group most at risk of adiposity-associatedcomplications, but rather the less vulnerable, because of a morefavorable fat-free/fat ratio as compared to the normal weightsub-group.
Acknowledgments: We are grateful to (1) the French Ministry of Health for funding theNational Hospital Clinical Research Programs (PHRC 1998), the National HealthInsurance Agency for Wage Earners (CNAMTS, France) and the Institute of Longevityand Ageing (Inserm, France); and (2) Fiona Ecarnot for her editorial assistance. We alsothank the other Members of the SAFES Group: Department of Geriatrics, GrenobleTeaching Hospitals (Pascal Couturier), Clinical Gerontology Centre, Montpellier TeachingHospitals (Claude Jeandel); Department of Gerontology, Orléans Regional Hospitals (Jean-Bernard Gauvain); Department of Geriatrics, Public Assistance–Hospitals of Paris,Georges Pompidou European Hospital (Olivier Saint-Jean, Dominique Somme);Department of Geriatrics, Public Assistance–Hospitals of Paris, Sainte-Périne Hospital(Joël Ankri); Department of Clinical Gerontology, Saint-Etienne Teaching Hospitals(Regis Gonthier); Department of Internal Medicine and Geriatrics, Strasbourg TeachingHospitals (Damien Heitz); Department of Internal Medicine and Geriatrics, NimesTeaching Hospitals (Benoît de Wazières).
Conflict of Interest Disclosures: The authors have no conflicts of interest for thisarticle. The financial sponsors did not play any role in the design, execution, analysis andinterpretation of data, or the writing of the manuscript.
Author Contributions: Lang PO and Dramé M: acquisition of subjects, study design,data analysis, interpretation of data, and preparation and editing of the manuscript;Blanchard F: SAFES cohort designer and principal investigator; Novella JL and Jolly D:SAFEs cohort designers and acquisition of subjects; and Mahmoudi R, Bertholon LA,Tardieu E and Nazeyrollas P: preparation and editing of the manuscript.
Sponsor’s Role: No sponsor had a role in the design, methods, subject recruitment,data collection, analysis, or preparation of this manuscript.
References
1. Heymsfield SB, Cefalu WT. Does body mass index adequately convey a patient'smortality risk? JAMA 2013;309:87-8.
2. Oreopoulos A, Kalantar-Zadeh K, Sharma AM, Fonarow GC. The obesity paradox inthe elderly: potential mechanisms and clinical implications. Clin Geriatr Med2009;25:643-59.
3. Chapman IM. Obesity in old age. Front Horm Res 2008;36:97-106.4. Cacciatore F, Mazzela F, Napoli C, Vitale DF, Viati L, Longobardi G. The obesity
and diabetes transition in the elderly: the Italian experience in Campania from 1992to 2003. J Nutr Health Aging 2008;12(S11.4):548.
5. Dorner TE, Schwartz F, Kranz A, Freidl W, Rieder A, Gisinger C. Body mass indexand the risk of infections in institutionalized geriatric patients. Br J Nutr2010;103:1830-5.
6. Strandberg TE, Sirola J, Pitkälä KH, Tilvis RS, Strandberg AY, Stenholm S.Association of midlife obesity and cardiovascular risk with old age frailty: a 26-yearfollow-up of initially healthy men. Int J Obes (Lond) 2012;36:1153-7.
7. Flegal KM, Kit BK, Orpana H, Graubard BI. Association of all-cause mortality withoverweight and obesity using standard body mass index categories: a systematicreview and meta-analysis. JAMA 2013;309:71-82.
8. Flegal KM, Graubard BI, Williamson DF, Gail MH. Excess deaths associated with
underweight, overweight, and obesity. JAMA 2005;293:1861-7.9. McGee DL, Diverse Populations Collaboration. Body mass index and mortality. Ann
Epidemiol 2005;15:87-97.10. Orpana HM, Berthelot JM, Kaplan MS, et al. BMI and mortality. Obesity (Silver
Spring) 2010;18:214-8.11. Whitlock G, Lewington S, Sherliker P, Clarke R, Emberson J, Halsey J, Qizilbash N,
Collins R, Peto R. Body-mass index and cause-specific mortality in 900 000 adults:collaborative analyses of 57 prospective studies. Lancet 2009;373:1083-96.
12. Berrington de Gonzalez A, Hartge P, Cerhan JR, Flint AJ, Hannan L, MacInnis RJ,Moore SC, Tobias GS, Anton-Culver H, Freeman LB, Beeson WL, Clipp SL,English DR, Folsom AR, Freedman DM, Giles G, Hakansson N, Henderson KD,Hoffman-Bolton J, Hoppin JA, Koenig KL, Lee IM, Linet MS, Park Y, Pocobelli G,Schatzkin A, Sesso HD, Weiderpass E, Willcox BJ, Wolk A, Zeleniuch-Jacquotte A,Willett WC, Thun MJ. Body-mass index and mortality among 1.46 million whiteadults. N Engl J Med 2010;363:2211-9.
13. Zekry D, Herrmann FR, Vischer UM. The association between the body mass indexand 4-year all-cause mortality in older hospitalized patients. J Gerontol A Biol SciMed Sci 2012;Oct 2012 Epub ahead of print DOI:10.1093/gerona/gls207.
14. Janssen I, Katzmarzyk PT, Ross R. Body mass index is inversely related to mortalityin older people after adjustment for waist circumference. J Am Geriatr Soc2005;53:2112-8.
15. Kalmmijn S, Curb JD, Rodriguez BL, Yano K, Abbott RD. The association of bodyweight and anthropometry with mortality in elderly men: the Honolulu heartprogram. Int J Obes Relat Metab Disord 1999;23:2211-9.
16. Fried LP, Kronmal RA, Newman AB, Bild DE, Mittelmark MB, Polak JF, RobbinsJA, Gardin JM. Risk factors for 5-year mortality in older adults: the CardiovascularHealth Study. JAMA 1998;279:585-92.
17. Molnar MZ, Streja E, Kovesdy CP, Bunnapradist S, Sampaio MS, Jing J, KrishnanM, Nissenson AR, Danovitch GM, Kalantar-Zadeh K. Associations of body massindex and weight loss with mortality in transplant-waitlisted maintenancehemodialysis patients. Am J Transplant 2011;11:725-36.
18. Kalantar-Zadeh K, Horwich TB, Oreopoulos A, Kovesdy CP, Younessi H, AnkerSD, Morley JE. Risk factor paradox in wasting diseases. Curr Opin Clin Nutr MetabCare 2007;10:433-42.
19. Dramé M, Novella JL, Jolly D, Lanièce I, Somme D, Heitz D, Gauvain JB, Voisin T,De Wazières B, Gonthier R, Jeandel C, Couturier P, Saint-Jean O, Ankri J, BlanchardF, Lang PO. Rapid cognitive decline, one-year institutional admission and one-yearmortality: analysis of the ability to predict and inter-tool agreement of four validatedclinical frailty indexes in the SAFEs cohort. J Nutr Health Aging 2011;15:699-705.
20. Lang PO, Michel JP, Zekry D. Frailty syndrome: a transitional state in a dynamicprocess. Gerontology 2009;55:539-49.
21. Lang PO, Heitz D, Hedelin G, et al. Early markers of prolonged hospital stays inolder people: a prospective, multicenter study of 908 inpatients in French acutehospitals. J Am Geriatr Soc 2006;54:1031-9.
22. Kaiser MJ, Bauer JM, Ramsch C, Uter W, Guigoz Y, Cederholm T, Thomas DR,Anthony P, Charlton KE, Maggio M, Tsai AC, Grathwohl D, Vellas B, Sieber CC;MNA-International Group. Validation of the Mini Nutritional Assessment short-form(MNA-SF): a practical tool for identification of nutritional status. J Nutr HealthAging 2009;13:782-8.
23. Charlson ME, Pompei P, Ales KL, MacKenzie CR. A new method of classifyingprognostic comorbidity in longitudinal studies: development and validation. JChronic Dis 1987;40:373-83.
24. Sundararajan V, Henderson T, Perry C, Muggivan A, Quan H, Ghali WA. New ICD-10 version of the Charlson comorbidity index predicted in-hospital mortality. J ClinEpidemiol 2004;57:1288-94.
25. Katz S, Akpom CA. A measure of primary sociobiological functions. Int J HealthServ 1976;6:493-508.
26. Vellas BJ, Wayne SJ, Romero L, Baumgartner RN, Rubenstein LZ, Garry PJ. One-leg balance is an important predictor of injurious falls in older persons. J Am GeriatrSoc 1997;45:735-8.
27. Podsiadlo D, Richardson S. The timed "Up & Go": a test of basic functional mobilityfor frail elderly persons. J Am Geriatr Soc 1991;39:142-8.
28. American Psychiatry Association, ed. DSM-IV, Diagnosis and Statistical Manual ofMental Disorders. 4th ed. Washington: American Psychiatry Association; 1994.
29. Folstein MF, Folstein SE, McHugh PR. "Mini-mental state". A practical method forgrading the cognitive state of patients for the clinician. J Psychiatr Res 1975;12:189-98.
30. Viatonou S, Dramé M, Jolly D, Morrone I, Lang PO, Voisin T, Boyer FC, SchwebelG, Somme D, Blanchard F, Novella JL. Predictor of rapid cognitive decline amongdemented subjects aged 75 or more: ('Sujet Agé Fragile-Evaluation et Suivi' Cohort-SAFES). Int J Geriatr Psychiatry 2009;24:709-15.
31. Gilleard CJ, Willmott M, Vaddadi KS. Self-report measures of mood and morale inelderly depressives. Br J Psychiatry 1981;138:230-5.
32. Norton D, McLaren R, Exton-Smith A. An investigation of nursing problems inhospitals. New-York: Churchill Livingstone; 1975.
33. Dramé M, Novella JL, Lang PO, et al. Derivation and validation of a mortality-riskindex from a cohort of frail elderly patients hospitalised in medical wards via
IS OBESITY A MARKER OF ROBUSTNESS IN VULNERABLE HOSPITALIZED AGED POPULATIONS?
J Nutr Health Aging
8
LANG_04 LORD_c 27/06/13 14:04 Page8
emergencies: the SAFES study. Eur J Epidemiol 2008;23:783-91.34. Heckman J. Dummy endogenous variables in a simultaneous equation system.
Econometrica 1978;46:931-60.35. Lanscak M, von Haehling S, Doehner W et al. The obesity paradox in chronic
disease. J Cachexia Sarcopenia Muscle 2012;3:1-4.36. Alam I, Ng TP, Larbi A. Does inflammation determine whether obesity is
metabolically healthy or unhealthy? The aging perspective. Mediators Inflamm2012;2012:456456. doi: 10.1155/2012/.
37. Meeuwsen S, Horgan GW, Elia M. The relationship between BMI and percent bodyfat, measured by bioelectrical impedance, in a large adult sample is curvilinear andinfluenced by age and sex. Clin Nutr 2010;29:560-6.
38. Sui X, LaMonte MJ, Laditka JN et al. Cardiorespiratory fitness and adiposity asmortality predictors in older adults. JAMA 2007;298:2507-16.
39. Callee EE, Thun MJ, Petrelli JM et al. Body-mass index and mortality in prospectivecohort of US adults. N Eng J Med 1999;34:1097-105.
40. Fain JN. Release of inflammatory mediators by human adipose tissue is enhanced inobesity and primarily by non fat cells: a review. Mediators Inflamm2010;2010:513948. doi: 10.1155/2010/.
41. Weisberg SP, McCann D, Desai M, Rosenbaum M, Leibel RL, Ferrante Jr AW.Obesity is associated with macrophage accumulation in adipose tissue. J Clin Invest2003;112:1796-808.
42. Suganami T, Nishida J, Ogawa Y. A paracrine loop between adipocytes andmacrophages aggravates inflammatory changes: role of fatty acids and tumornecrosis factor α. Atherosclerosis 2005;25:2062-8.
43. Karelis AD, Brochu M, Rabasa-Lhoret R. Can we identify metabolically healhy but
obese individuals (MHO)? Diabetes Metabol 2004;30:569-72.44. Ruderman NB, Schneider SH, Berchtold P. Ruderman NB,, Schneider SH, Berchtold
P. The metabolically obese normal weight individual. Am J Clin Nutr 1981;34:1617-21.
45. Wildman RP, Muntner P, Reynolds K et al. The obese without Cardiometabolic riskfactors clustering and the normal weight with Cardiometabolic risk factor clustering:prevalence and correlates of 2 phenotypes among the US population (NHANES1999-2004. Archives Intern Med 2008;168:1617-24.
46. Primeau V, Coderre L, Karelis AD, et al. Characterizing the profile of obese patientswho are metabolically healthy. Int J Obes 2011;35:971-81.
47. Conus F, Rabasa-Lhoret R, Péronnet F. Characteristics of metabolically obesenormal-weight (MONW) subjects. Appl Physiol Nutr Metab 2007;32:4-12.
48. Lynch LA, O’Connell JM, Kwasnik AK, Cawood TJ, O’Farrelly C, O’Shea DB. Arenatural killer cells protecting the metabolically healthy obese patient? Obesity2009;17:601-5.
49. Karelis AD. Metabolically healthy but obese individuals. Lancet 2008;372:1281-3.50. Lutz CT, Quinn LS. Sarcopenia, obesity, and natural killer cell immune senescence
in aging: altered cytokine levels as a common mechanism. Aging 2012;4:535-46.51. Arterburn DE, Crane PK, Sullivan SD. The coming epidemic of obesity in elderly
Americans. J Am Geriatr Soc 2004;52:1907-12.52. De Lorenzo A, Del Gobbo V, Premrov MG, Bigioni M, Galvano F, Di Renzo L.
Normal-weight obese syndrome: early inflammation and oxidative stress. TheFramingham Heart Study. Circulation 2007;116:1234-41.
THE JOURNAL OF NUTRITION, HEALTH & AGING©
J Nutr Health Aging
9
LANG_04 LORD_c 27/06/13 14:04 Page9
Related Documents