ARTICLE PEDIATRICS Volume 137, number 4, April 2016:e20151202 Standardized Clinical Pathways for Hospitalized Children and Outcomes K. Casey Lion, MD, MPH, a,b Davene R. Wright, PhD, a,b Suzanne Spencer, MBA, MHA, c Chuan Zhou, PhD, a,b Mark Del Beccaro, MD, a,d Rita Mangione-Smith, MD, MPH a,b abstract BACKGROUND AND OBJECTIVE: Clinical pathways standardize care for common health conditions. We sought to assess whether institution-wide implementation of multiple standardized pathways was associated with changes in utilization and physical functioning after discharge among pediatric inpatients. METHODS: Interrupted time series analysis of admissions to a tertiary care children’s hospital from December 1, 2009 through March 30, 2014. On the basis of diagnosis codes, included admissions were eligible for 1 of 15 clinical pathways implemented during the study period; admissions from both before and after implementation were included. Postdischarge physical functioning improvement was assessed with the Pediatric Quality of Life Inventory 4.0 Generic Core or Infant Scales. Average hospitalization costs, length of stay, readmissions, and physical functioning improvement scores were calculated by month relative to pathway implementation. Segmented linear regression was used to evaluate differences in intercept and trend over time before and after pathway implementation. RESULTS: There were 3808 and 2902 admissions in the pre- and postpathway groups, respectively. Compared with prepathway care, postpathway care was associated with a significant halt in rising costs (prepathway vs postpathway slope difference –$155 per month [95% confidence interval −$246 to −$64]; P = .001) and significantly decreased length of stay (prepathway vs post-pathway slope difference –0.03 days per month [95% confidence interval −0.05 to −0.02]; P = .02), without negatively affecting patient physical functioning improvement or readmissions. CONCLUSIONS: Implementation of multiple evidence-based, standardized clinical pathways was associated with decreased resource utilization without negatively affecting patient physical functioning improvement. This approach could be widely implemented to improve the value of care provided. a Department of Pediatrics, University of Washington, Seattle, Washington; b Center for Child Health, Behavior, and Development, Seattle Children’s Research Institute, Seattle, Washington; and c Department of Clinical Effectiveness, d Seattle Children’s Hospital, Seattle, Washington Dr Lion participated in study conceptualization and design and drafted the initial manuscript; Drs Wright and Zhou participated in study conceptualization and design, performed part of the data analysis, and critically reviewed and revised the manuscript; Ms Spencer was instrumental in data acquisition, performed part of the data analysis, and critically reviewed and revised the manuscript; Dr Del Beccaro participated in study conceptualization and critically reviewed and revised the manuscript; Dr Mangione-Smith oversaw all aspects of the study, participated in study conceptualization and design, and critically reviewed and revised the manuscript; and all authors approved the final manuscript as submitted. DOI: 10.1542/peds.2015-1202 Accepted for publication Dec 22, 2015 To cite: Lion KC, Wright DR, Spencer S, et al. Standardized Clinical Pathways for Hospitalized Children and Outcomes. Pediatrics. 2016;137(4):e20151202 WHAT’S KNOWN ON THIS SUBJECT: Standardized clinical pathways have been shown to improve some aspects of care delivery for particular conditions. It is unknown whether standardized pathway use across multiple conditions can improve the value of care provided. WHAT THIS STUDY ADDS: Implementation of 15 standardized pathways across multiple general pediatric conditions was associated with increased value of care, through decreased length of stay and a halt in rising costs without negatively affecting patient physical functioning improvement or readmissions. by Steven Crouch on April 26, 2016 Downloaded from

Welcome message from author
This document is posted to help you gain knowledge. Please leave a comment to let me know what you think about it! Share it to your friends and learn new things together.
Transcript

ARTICLEPEDIATRICS Volume 137 , number 4 , April 2016 :e 20151202
Standardized Clinical Pathways for Hospitalized Children and OutcomesK. Casey Lion, MD, MPH, a, b Davene R. Wright, PhD, a, b Suzanne Spencer, MBA, MHA, c Chuan Zhou, PhD, a, b Mark Del Beccaro, MD, a, d Rita Mangione-Smith, MD, MPHa, b
abstractBACKGROUND AND OBJECTIVE: Clinical pathways standardize care for common health conditions.
We sought to assess whether institution-wide implementation of multiple standardized
pathways was associated with changes in utilization and physical functioning after
discharge among pediatric inpatients.
METHODS: Interrupted time series analysis of admissions to a tertiary care children’s
hospital from December 1, 2009 through March 30, 2014. On the basis of diagnosis codes,
included admissions were eligible for 1 of 15 clinical pathways implemented during the
study period; admissions from both before and after implementation were included.
Postdischarge physical functioning improvement was assessed with the Pediatric Quality
of Life Inventory 4.0 Generic Core or Infant Scales. Average hospitalization costs, length of
stay, readmissions, and physical functioning improvement scores were calculated by month
relative to pathway implementation. Segmented linear regression was used to evaluate
differences in intercept and trend over time before and after pathway implementation.
RESULTS: There were 3808 and 2902 admissions in the pre- and postpathway groups,
respectively. Compared with prepathway care, postpathway care was associated with a
significant halt in rising costs (prepathway vs postpathway slope difference –$155 per
month [95% confidence interval −$246 to −$64]; P = .001) and significantly decreased
length of stay (prepathway vs post-pathway slope difference –0.03 days per month [95%
confidence interval −0.05 to −0.02]; P = .02), without negatively affecting patient physical
functioning improvement or readmissions.
CONCLUSIONS: Implementation of multiple evidence-based, standardized clinical pathways was
associated with decreased resource utilization without negatively affecting patient physical
functioning improvement. This approach could be widely implemented to improve the value
of care provided.
aDepartment of Pediatrics, University of Washington, Seattle, Washington; bCenter for Child Health, Behavior,
and Development, Seattle Children’s Research Institute, Seattle, Washington; and cDepartment of Clinical
Effectiveness, dSeattle Children’s Hospital, Seattle, Washington
Dr Lion participated in study conceptualization and design and drafted the initial manuscript;
Drs Wright and Zhou participated in study conceptualization and design, performed part of the
data analysis, and critically reviewed and revised the manuscript; Ms Spencer was instrumental
in data acquisition, performed part of the data analysis, and critically reviewed and revised the
manuscript; Dr Del Beccaro participated in study conceptualization and critically reviewed and
revised the manuscript; Dr Mangione-Smith oversaw all aspects of the study, participated in study
conceptualization and design, and critically reviewed and revised the manuscript; and all authors
approved the fi nal manuscript as submitted.
DOI: 10.1542/peds.2015-1202
Accepted for publication Dec 22, 2015
To cite: Lion KC, Wright DR, Spencer S, et al. Standardized Clinical Pathways for
Hospitalized Children and Outcomes. Pediatrics. 2016;137(4):e20151202
WHAT’S KNOWN ON THIS SUBJECT: Standardized
clinical pathways have been shown to improve some
aspects of care delivery for particular conditions. It is
unknown whether standardized pathway use across
multiple conditions can improve the value of care
provided.
WHAT THIS STUDY ADDS: Implementation of 15
standardized pathways across multiple general
pediatric conditions was associated with increased
value of care, through decreased length of stay and
a halt in rising costs without negatively affecting
patient physical functioning improvement or
readmissions.
by Steven Crouch on April 26, 2016Downloaded from

LION et al
Clinical pathways, which standardize
care for common conditions, are
increasingly used as hospitals strive
to provide higher value care by
improving quality while containing
costs.1–3 Pathway development aims
to accelerate the implementation of
evidence into clinical practice, thus
decreasing unwarranted variability
in care, which is known to lead to
worse outcomes and higher costs.4, 5
Current evidence supports the
effectiveness of some individual
pathways to decrease utilization and
improve outcomes among specific
patient populations.4 However, the
impact of studied pathways varies
by location and condition, making
it difficult to know how much of the
effect is due to pathway specifics and
how much is due to standardization
and reduced variability.2
Additionally, the evidence base for
pathway use in pediatric populations
is limited.3, 6
In 2010, Seattle Children’s Hospital
(SCH) undertook a hospital-wide
initiative to develop and implement
clinical standard work (CSW)
pathways for a range of pediatric
conditions. The CSW approach
applied a standard process to
develop and implement evidence-
based clinical pathways, aiming to
improve outcomes while reducing
unnecessary utilization. The objective
of this study was to assess whether
implementation of the CSW system
was associated with hospitalization
costs, length of stay (LOS), degree of
physical functioning improvement
after hospital discharge, and
readmissions.
METHODS
CSW Development and Implementation
CSW pathway development is guided
by 3 principles: (1) treatment should
be evidence-based where possible
and otherwise consensus-based,
(2) recommendations should be
hardwired into electronic order sets
to encourage adherence, and (3)
outcome measures must be owned
and tracked by someone who is
responsible for pathway continuous
improvement.
Development of each CSW pathway
begins with a literature review.
Key stakeholders, clinicians and
experienced CSW consultants
prepare a pathway draft based on
the literature, which is then reviewed
by other clinical experts. Pathways
include an order set in the electronic
medical record, providing suggested
orders, embedded decision support,
and references. With launch of each
new pathway, relevant clinicians
must complete an online training
module and required quiz. Pathway-
related information is posted near
clinician computers, and materials
are integrated into provider and
nurse workflow to simplify pathway
use. During implementation, audit
and feedback as well as targeted
education by clinical champions are
used to increase use. Pathway order-
set use, selected clinical metrics,
and safety events are monitored
and reviewed at least quarterly,
and revisions are made as needed.
Order-set use varies by condition,
from 100% order-set activation
for eligible patients over time (eg,
neonatal jaundice), to lower levels
of use, especially immediately after
implementation (eg, croup, 38% use
in the initial 3 months and 68% use
in the most recent 3 months; Table
1). The degree to which patients
receive pathway-recommended care
when the order set is not activated
is unknown, although metrics
related to specific recommendations
indicate that pathway-recommended
care does occur without order-set
use. For example, whereas 21% of
patients eligible for the urinary tract
infection pathway had order-set
activation, 48% received pathway-
recommended discharge antibiotics.
Between 2010 and 2014, 15 new
pathways related to general pediatric
conditions were developed and
implemented as part of a larger
initiative addressing general
pediatric and subspecialty care.
Seventeen million dollars were
budgeted over 5 years for the
initiative (mostly for salary
support), including ∼1000 person-
hours dedicated to developing and
implementing each pathway and
1000 person-hours for pathway
maintenance and improvement. Full
documentation of each pathway
is available at http:// www.
2
TABLE 1 Pathway Order-Set Use in the First 3 Months After Pathway Implementation and in the Last
3 Months of Data Included in Study
PathwayOrder Set Use,
Months 1–3, %
Order Set Use in Most
Recent 3 Months of
Study, %
Number of
Postpathway Study
Months
Urinary tract infection 20 20 45
Diabetes DKA 100 96 35
Fractures: femur 94 82 31
Fractures: supracondylar 89 97 31
Spine 21 62 28
Croup 38 68 27
Neonatal jaundice 100 100 21
Depressive disorders 90 95 21
Pyloric stenosis 100 100 19
Pneumonia 42 67 18
Tonsillectomy and adenoidectomy 62 88 18
Disruptive behavior disorders 87 88 18
Diabetes non-DKA 83 89 10
Neonatal fever 41 57 8
Cellulitis and abscess 42 27 7
DKA, diabetic ketoacidosis.
by Steven Crouch on April 26, 2016Downloaded from
PEDIATRICS Volume 137 , number 4 , April 2016
seattlechildrens. org/ healthcare-
professionals/ gateway/ pathways.
Pathways are monitored after
implementation, with periodic
review and alterations as needed.
For example, for the croup pathway,
LOS, order-set usage, and percent of
patients receiving dexamethasone
are tracked quarterly. This review-
and-alteration cycle is a central
tenet of continuous performance
improvement and is considered
part of the intervention. Given the
large number of pathways, we did
not study the postimplementation
changes separately but consider them
an integral part of the postpathway
intervention period.
Study Design and Population
This was a retrospective cohort
study examining admissions
eligible for 1 of 15 general pediatric
pathways between December 1,
2009, and March 30, 2014. We did
not include admissions eligible for
pathways that predated this time
period because no preintervention
data would be available, nor did
we include admissions eligible
for pathways for children with
complex, uncommon subspecialty
conditions, such as inflammatory
bowel disease. All included
pathways were implemented
during the study time period, so the
study included pathway-eligible
admissions, both before and after
implementation, for each of the
15 pathway conditions. Pathway
eligibility was based on pathway-
specific inclusion and exclusion
criteria, including diagnosis, age,
and comorbid conditions based on
International Classification of Disease Ninth Revision, Clinical Modification
(ICD-9) codes. To identify the
“pathway eligible” cohort during
the prepathway period, we used
the same eligibility criteria that
would have qualified for care on
the pathway had the pathway been
active. We used the Pediatric Medical
Complexity Algorithm (PMCA)7
to classify children as having no
chronic conditions, noncomplex
chronic conditions, or complex
chronic conditions, on the basis of
retrospective ICD-9 codes, beginning
with the date of admission and
including up to a 3-year retrospective
lookback period. Because included
pathways were all intended for
general pediatric populations, we
excluded admissions involving
patients with complex chronic
conditions. All other pathway-eligible
admissions were included in the
analysis, regardless of whether the
relevant order set was activated, as
pathways were meant to influence
clinical care even when the order
set was not used. For patients with
multiple admissions within the study
time frame, only the first admission
per 30-day period was eligible.
Outcome Measures
Patient-level outcome measures
included total hospital costs,
LOS in days, unplanned 30-day
hospital readmissions, and physical
functioning improvement after
hospitalization.
Costs of Hospitalization and LOS
Total charges per hospital stay,
excluding physician professional fees,
and LOS data were obtained from
hospital administrative data. Charges
were converted to costs using the
hospital-specific cost-to-charge
ratio, then inflation-adjusted to 2013
US dollars using the medical care
component of the Consumer Price
Index.8, 9 The same hospital cost-to-
charge ratio was used for both study
time periods. Given the skewed
distributions, the highest 1% of costs
and LOS were truncated at the 99th
percentile.
Physical Functioning Improvement
Improvement in physical functioning
after hospital discharge was assessed
using the Pediatric Quality of Life
Inventory 4.0 Generic Core or
Infant Scales (PedsQL) physical
functioning subscale.10–12 We
only used the physical functioning
subscale because we hypothesized
that changes to clinical care would
most likely influence physical (rather
than psychosocial) functioning,
and previous research has found
the physical component to be
most responsive to posthospital
recovery.13 At SCH, the PedsQL is
administered to consenting parents
(patients aged 1 month–18 years)
and assenting patients within 72
hours of admission and again 2 to
8 weeks after discharge. Ineligible
families included those who had
completed the survey within the
past 2 months, had a child who was
immunocompromised, or who was
admitted for suspected child abuse.
In 2011–2013, 65% of eligible
families completed the admission
survey, and 58% completed the
follow-up. For analyses, parent-proxy
report was used for all patients aged
<13 years. For teens, self-report was
used when available; otherwise,
parent proxy report was used.
Scores were converted to a 0 to 100
scale, and improvement scores were
calculated as the difference between
follow-up and admission scores.
On the basis of previous research,
the minimal clinically important
difference on the 0 to 100 scale is
4.5.10
Unplanned Readmissions
Unplanned 30-day readmissions
were assessed from hospital
administrative data. Readmissions
were classified as unplanned using
the methods developed by Berry
et al, based on the ICD-9 procedure
codes determined likely to represent
a readmission related to a planned
procedure.14 Readmissions were all
cause and included both inpatient
and observation stays.
Statistical Analysis
To compare all pathways we
considered time on a relative scale,
with the month and year of pathway
implementation as the 0-point
(t0) for each of the 15 included
3by Steven Crouch on April 26, 2016Downloaded from
LION et al
pathways. We then considered all
15 pathways simultaneously, with
the time of implementation lined up
across pathways, and each pathway
contributing a variable number
of pre- and postimplementation
months based on when it was rolled
out within the study period. For
example, the pathway for diabetic
ketoacidosis was implemented in
April 2011, contributing 16 months
preimplementation (months
t–16 through t–1) and 35 months
postimplementation (months t0
through t34). We truncated groups
at 36 months pre- and postpathway
implementation, creating a “≥36
months” category given fewer
observations at the tails.
After aligning all pathways around
month of implementation, time series
data were generated by calculating
the mean value for each outcome
at each time point (ie, by month
relative to implementation).15, 16
Thus, the data point for hospital
cost in month +3 reflects average
cost of hospitalization for study
admissions from all 15 pathways
in the third month after pathway
implementation. These time
series data for each outcome
were then used in segmented
regression models, which fit a
separate regression line to each
time period (pre- and postpathway
implementation).17 This method
produced separate intercepts and
slopes for the pre-and postpathway
periods, each of which was
accompanied by a P value testing
whether it was different from 0. We
also tested whether the pre- and
postpathway period intercepts and
slopes were statistically different
from one another, using the lincom
command in Stata. This approach
allows for detection of differences in
both trends over time (ie, the slope)
and intercepts.
To explore the relative contribution
of each pathway to the overall
findings, we stratified the segmented
regression for each outcome by
individual pathway. To determine
whether changes in patient
medical complexity or frequency
of observation stays over time
influenced our findings, we used
segmented regression to evaluate
changes in the proportion of study
admissions per month with no
chronic conditions (vs noncomplex
chronic conditions) and, in a separate
model, with an inpatient stay (vs an
observation stay).
This study was approved by the
Seattle Children’s Institutional
Review Board.
RESULTS
Inclusion criteria were met for 3808
prepathway admissions and 2902
postpathway admissions. Individual
pathways contributed 7 to 44 months
of prepathway data and 7 to 45
months of postpathway data (Fig
1). Patients with pathway eligible
admissions were similar in both time
periods (Table 2).
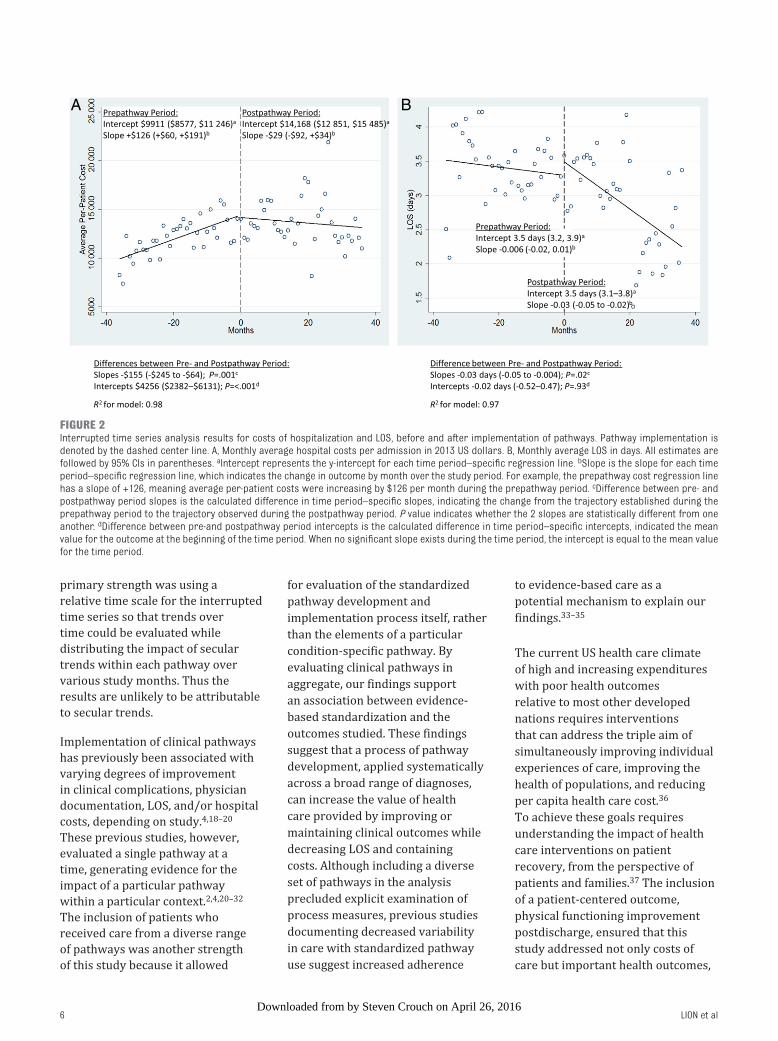
During the prepathway period,
hospital costs per admission were
steadily rising at a rate of $126 per
month (95% confidence interval
[CI] $60 to $191; Fig 2A). Pathway
implementation was associated with
a statistically significant halt in the
rate of rise in costs (postpathway
slope −29 per month [95% CI
−$100 to $34], P value for slope
difference between time periods =
.001; R2 = 0.98). Compared with the
costs per patient predicted by the
prepathway slope trajectory, the
actual postpathway costs were $155
lower per month (95% CI −$246 to
−$64; P = .001).
Using segmented regression, we
found that prepathway LOS was
stable over time, with a mean of 3.3
days and no significant slope to the
regression line (Fig 2B). Pathway
implementation was associated with
a steady decrease in LOS, at a rate
of −0.03 days (or 43 minutes) per
admission per month (95% CI −0.05
to −0.02; P value for slope difference
between time periods = .02; R2 =
0.97), which amounts to 8.6 hours
over the course of a year.
There were no significant
differences by time period in 30-day
readmissions, either in trend
over time or intercepts based on
segmented regression (Fig 3A).
During the prepathway period, there
was no significant trend in physical
functioning improvement scores (Fig
3B). After pathway implementation,
there was a significant increasing
trend over time, at a rate of 0.5 points
per month (95% CI 0.1 to 0.8), or
6 points per year, which exceeds
the minimal clinically important
difference of 4.5. However, the
difference between the pre- and
postpathway period slopes was
not statistically significant (P = .22;
model R2 = 0.86).
In analyses exploring the relative
contribution of each pathway, we
found few statistically significant
differences from the pre- to
postpathway periods, likely because
of smaller samples (Supplemental
Table 3). The individual results
for cost generally mirrored the
overall results: 8 pathways had
significantly increasing costs pre-
pathway, of which 2 demonstrated
a statistically significant decrease
in slope between pre- and post-
pathway period, whereas 5 showed
a decrease that approached
significance (P = .05 to −0.1).
Individual results for LOS and physical
functioning improvement were
more variable, with few significant
time trends for either period or the
difference between periods. There
were no significant readmission
findings for any pathway.
We found a small but significant
increase in the percent of study
patients with no chronic conditions
(45.4% prepathway, 50.1%
postpathway, P = .01), compared with
noncomplex chronic conditions, but
no significant time trends. In contrast,
4by Steven Crouch on April 26, 2016Downloaded from
PEDIATRICS Volume 137 , number 4 , April 2016
we found a significantly increasing
trend over time in the percent of study
patients with an inpatient compared
with observation stay (prepathway
slope –0.7% per month [95% CI −1.1
to −0.3], postpathway slope +0.9%
per month [95% CI 0.5 to 1.2]; pre- to
postpathway slope difference +1.5%
[95% CI 1.0 to 2.1], P < .001).
DISCUSSION
In this interrupted time series
analysis of general pediatric
inpatients, we found that
implementation of standardized,
pathway-based care was associated
with a halt in rising hospital costs,
decreased LOS, and stable physical
functioning improvement scores
over time, without detriment to
readmission rates. This study’s
5
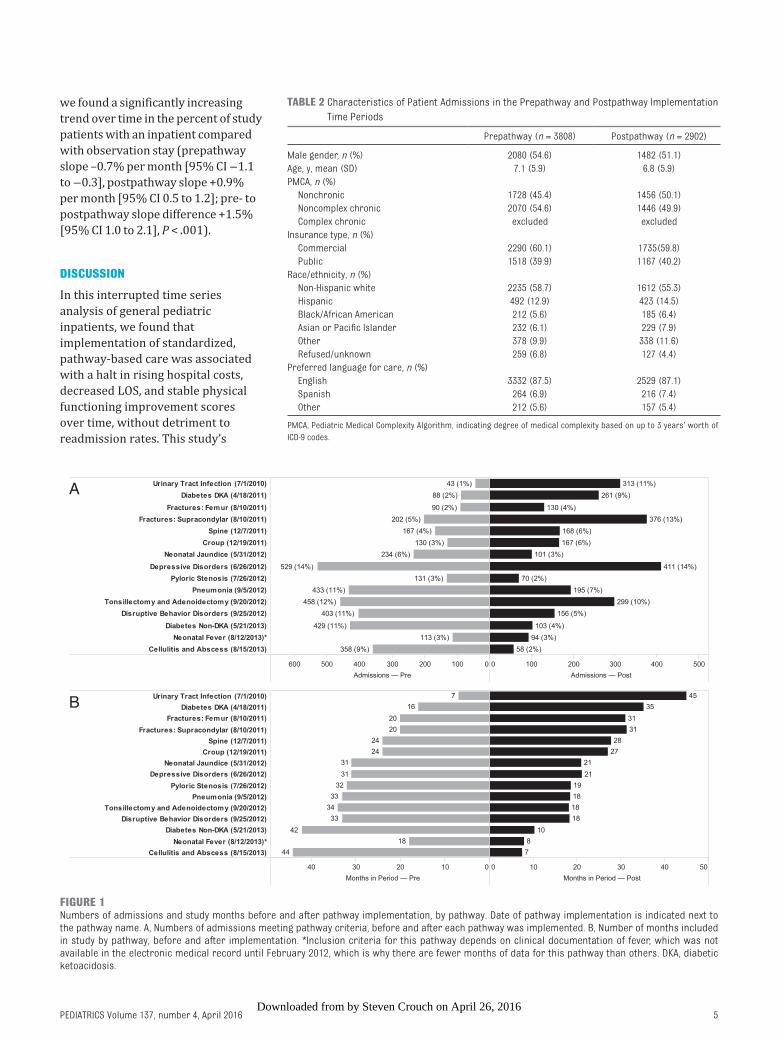
FIGURE 1Numbers of admissions and study months before and after pathway implementation, by pathway. Date of pathway implementation is indicated next to the pathway name. A, Numbers of admissions meeting pathway criteria, before and after each pathway was implemented. B, Number of months included in study by pathway, before and after implementation. *Inclusion criteria for this pathway depends on clinical documentation of fever, which was not available in the electronic medical record until February 2012, which is why there are fewer months of data for this pathway than others. DKA, diabetic ketoacidosis.
TABLE 2 Characteristics of Patient Admissions in the Prepathway and Postpathway Implementation
Time Periods
Prepathway (n = 3808) Postpathway (n = 2902)
Male gender, n (%) 2080 (54.6) 1482 (51.1)
Age, y, mean (SD) 7.1 (5.9) 6.8 (5.9)
PMCA, n (%)
Nonchronic 1728 (45.4) 1456 (50.1)
Noncomplex chronic 2070 (54.6) 1446 (49.9)
Complex chronic excluded excluded
Insurance type, n (%)
Commercial 2290 (60.1) 1735(59.8)
Public 1518 (39.9) 1167 (40.2)
Race/ethnicity, n (%)
Non-Hispanic white 2235 (58.7) 1612 (55.3)
Hispanic 492 (12.9) 423 (14.5)
Black/African American 212 (5.6) 185 (6.4)
Asian or Pacifi c Islander 232 (6.1) 229 (7.9)
Other 378 (9.9) 338 (11.6)
Refused/unknown 259 (6.8) 127 (4.4)
Preferred language for care, n (%)
English 3332 (87.5) 2529 (87.1)
Spanish 264 (6.9) 216 (7.4)
Other 212 (5.6) 157 (5.4)
PMCA, Pediatric Medical Complexity Algorithm, indicating degree of medical complexity based on up to 3 years’ worth of
ICD-9 codes.
by Steven Crouch on April 26, 2016Downloaded from
LION et al
primary strength was using a
relative time scale for the interrupted
time series so that trends over
time could be evaluated while
distributing the impact of secular
trends within each pathway over
various study months. Thus the
results are unlikely to be attributable
to secular trends.
Implementation of clinical pathways
has previously been associated with
varying degrees of improvement
in clinical complications, physician
documentation, LOS, and/or hospital
costs, depending on study.4, 18–20
These previous studies, however,
evaluated a single pathway at a
time, generating evidence for the
impact of a particular pathway
within a particular context.2, 4, 20–32
The inclusion of patients who
received care from a diverse range
of pathways was another strength
of this study because it allowed
for evaluation of the standardized
pathway development and
implementation process itself, rather
than the elements of a particular
condition-specific pathway. By
evaluating clinical pathways in
aggregate, our findings support
an association between evidence-
based standardization and the
outcomes studied. These findings
suggest that a process of pathway
development, applied systematically
across a broad range of diagnoses,
can increase the value of health
care provided by improving or
maintaining clinical outcomes while
decreasing LOS and containing
costs. Although including a diverse
set of pathways in the analysis
precluded explicit examination of
process measures, previous studies
documenting decreased variability
in care with standardized pathway
use suggest increased adherence
to evidence-based care as a
potential mechanism to explain our
findings.33–35
The current US health care climate
of high and increasing expenditures
with poor health outcomes
relative to most other developed
nations requires interventions
that can address the triple aim of
simultaneously improving individual
experiences of care, improving the
health of populations, and reducing
per capita health care cost.36
To achieve these goals requires
understanding the impact of health
care interventions on patient
recovery, from the perspective of
patients and families.37 The inclusion
of a patient-centered outcome,
physical functioning improvement
postdischarge, ensured that this
study addressed not only costs of
care but important health outcomes,
6
FIGURE 2Interrupted time series analysis results for costs of hospitalization and LOS, before and after implementation of pathways. Pathway implementation is denoted by the dashed center line. A, Monthly average hospital costs per admission in 2013 US dollars. B, Monthly average LOS in days. All estimates are followed by 95% CIs in parentheses. aIntercept represents the y-intercept for each time period–specifi c regression line. bSlope is the slope for each time period–specifi c regression line, which indicates the change in outcome by month over the study period. For example, the prepathway cost regression line has a slope of +126, meaning average per-patient costs were increasing by $126 per month during the prepathway period. cDifference between pre- and postpathway period slopes is the calculated difference in time period–specifi c slopes, indicating the change from the trajectory established during the prepathway period to the trajectory observed during the postpathway period. P value indicates whether the 2 slopes are statistically different from one another. dDifference between pre-and postpathway period intercepts is the calculated difference in time period–specifi c intercepts, indicated the mean value for the outcome at the beginning of the time period. When no signifi cant slope exists during the time period, the intercept is equal to the mean value for the time period.
by Steven Crouch on April 26, 2016Downloaded from

PEDIATRICS Volume 137 , number 4 , April 2016
thus allowing us to assess the value
of pathway implementation.
In this era of health care reform, an
intervention such as that studied
here, which was associated with
maintained or improved patient-
reported outcomes while decreasing
or containing health care costs and
LOS, could be considered by other
hospitals and provider networks
looking to increase the value of care
provided.
Although sensitivity analyses
demonstrated that the proportion of
children with no chronic conditions
increased in the postpathway period,
which could have contributed to
lower costs and shorter LOS, there
was no significant trend in this
finding over time. In addition, we
found a simultaneous increase
in inpatient versus observation
hospitalizations, which would be
expected to exert the opposite effect
on our outcomes (ie, increased LOS
and higher costs). Therefore, our
results are unlikely to merely reflect
a change in study population.
This study has several limitations.
We were unable to identify a
reasonable parallel control group
because the majority of patients with
relatively common general pediatric
diagnoses were either eligible for
1 of the 15 study pathways or for
a pathway that predated the study
period, such as asthma. Although
the relative time scale helped to
distribute secular trends within
each pathway over both the pre- and
postimplementation study periods,
there may still be external factors
influencing our results. However,
there were no changes to pay-for-
performance initiatives related to
our outcomes during the study time
period or other identifiable factors
likely to influence our results. We
were unable to determine the degree
of pathway adherence, so we likely
included patients who did not receive
pathway care; however, such cases
would bias our results toward the
null. Although combining diverse
pathways allowed evaluation of
standardization in general, it limited
our ability to measure the impact on
disease-specific clinical outcomes or
track process measures that would
indicate whether standardization
resulted in decreased variability
in care. We were also unable to
identify which particular steps
within individual pathways had the
greatest association with outcomes.
However, multifaceted interventions
like pathway implementation are
more likely to be effective than those
with only a single component, 38 so
isolating the impact of individual
steps within pathways may not
7
FIGURE 3Interrupted time series analysis results for readmissions and physical functioning improvement scores, before and after implementation of pathways. Pathway implementation is denoted by the dashed center line. A, Monthly average unplanned hospital readmissions within 30 days of index admission. B, Monthly average physical functioning improvement scores, calculated as score at follow-up minus score at hospital admission. All estimates are followed by 95% CIs in parentheses. aIntercept represents the y-intercept for each time period–specifi c regression line. bSlope is the slope for each time period–specifi c regression line, which indicates the change in outcome by month over the study period. For example, the prepathway cost regression line has a slope of +126, meaning average per-patient costs were increasing by $126 per month during the prepathway period. cDifference between pre- and postpathway period slopes is the calculated difference in time period–specifi c slopes, indicating the change from the trajectory established during the prepathway period to the trajectory observed during the postpathway period. The P value indicates whether the 2 slopes are statistically different from one another. dDifference between pre- and postpathway period intercepts is the calculated difference in time period–specifi c intercepts, indicated the mean value for the outcome at the beginning of the time period. When no signifi cant slope exists during the time period, the intercept is equal to the mean value for the time period.
by Steven Crouch on April 26, 2016Downloaded from

LION et al
be useful. In addition, combining
pathways together may have obscured
effects that are specific to an individual
pathway. However, the most prevalent
pathway (depressive disorders)
contributed <15% of admissions to
both the pre- and postimplementation
periods, making it unlikely to have
disproportionately influenced the
results. While some of the individual
pathways were more impactful than
others, the sample sizes within each
pathway were generally too small to
draw definitive conclusions about how
much each pathway contributed to the
overall findings.
CONCLUSIONS
Implementation of a large-scale
system for developing and applying
standardized care pathways across
several health conditions was
associated with decreased LOS and
costs of care, while maintaining
levels of improvement in patient
postdischarge physical functioning.
These results suggest an approach
that could be implemented broadly.
A system of clinical pathways,
integrating the best available
evidence using a rigorous process,
holds promise for meeting the
challenges facing our health care
system today: to enhance the
value of care by decreasing costs
and resource utilization while
maintaining or improving patient-
centered outcomes.
ACKNOWLEDGMENTS
The authors thank Kathy Mullin, the
entire Clinical Effectiveness team,
and the countless individuals who
have participated in developing,
implementing, and monitoring the
clinical standard work pathways and
guidelines.
REFERENCES
1. Kimberly J, de Pourourville G, d’Aunno
T. The Globalization of Managerial
Innovation in Health Care. Cambridge,
UK: Cambridge University Press; 2009
2. Saint S, Hofer TP, Rose JS, Kaufman
SR, McMahon LF Jr. Use of critical
pathways to improve effi ciency: a
cautionary tale. Am J Manag Care.
2003;9(11):758–765
3. Rotter T, Kinsman L, James E, Machotta
A, Steyerberg EW. The quality of the
evidence base for clinical pathway
effectiveness: room for improvement
in the design of evaluation trials. BMC
Med Res Methodol. 2012;12:80
4. Rotter T, Kinsman L, James E, et
al. Clinical pathways: effects on
professional practice, patient
outcomes, length of stay and hospital
costs. Cochrane Database Syst Rev.
2010;(3):CD006632
5. Kinsman L, Rotter T, James E, Snow P,
Willis J. What is a clinical pathway?
Development of a defi nition to inform
the debate. BMC Med. 2010;8:31
6. Melnyk BM, Grossman DC, Chou R, et
al; US Preventive Services Task Force.
USPSTF perspective on evidence-
based preventive recommendations
for children. Pediatrics. 2012;130(2).
Available at: www. pediatrics. org/ cgi/
content/ full/ 130/ 2/ e399
7. Simon TD, Cawthon ML, Stanford S,
et al Pediatric medical complexity
algorithm: a new method to stratify
children by medical complexity.
Pediatrics. 2014;133(6). Available at:
www. pediatrics. org/ cgi/ content/ full/
133/ 6/ e1647
8. Luce B, Manning W, Siegel J,
Lipscomb J. Estimating costs in
cost-effectiveness analysis. In: Gold
M, Siegel J, Russell L, Weinstein M,
eds. Cost-Effectiveness in Health
and Medicine. New York, NY: Oxford
University Press; 1996:176–213
9. Bureau of Labor StatisticsConsumer
Price Index. Washington, DC: US
Department of Labor; 2013. Available
at: http:// data. bls. gov/ timeseries/
CUUR0000SAM. Accessed May 18,
2015
10. Varni JW, Burwinkle TM, Seid M,
Skarr D. The PedsQL 4.0 as a pediatric
population health measure: feasibility,
reliability, and validity. Ambul Pediatr.
2003;3(6):329–341
11. Varni JW, Burwinkle TM, Seid M. The
PedsQL as a pediatric patient-reported
outcome: reliability and validity of the
PedsQL Measurement Model in 25, 000
children. Expert Rev Pharmacoecon
Outcomes Res. 2005;5(6):705–719
8
ABBREVIATIONS
CI: confidence interval
CSW: clinical standard work
ICD-9: International Classification of Disease Ninth Revision
Clinical Modification:
LOS: length of stay
PEDSQL: Pediatric Quality of Life
Inventory 4.0 Generic
Core or Infant Scales
SCH: Seattle Children’s Hospital
Address correspondence to K. Casey Lion, MD, MPH, University of Washington, and Center for Child Health, Behavior and Development, Seattle Children’s Research
Institute; M/S CW8-6, PO Box 5371, Seattle, WA 98145-5005. E-mail: [email protected]
PEDIATRICS (ISSN Numbers: Print, 0031-4005; Online, 1098-4275).
Copyright © 2016 by the American Academy of Pediatrics
FINANCIAL DISCLOSURE: The authors have indicated they have no fi nancial relationships relevant to this article to disclose.
FUNDING: This work was funded by the Department of Clinical Effectiveness, through hospital operations at Seattle Children’s Hospital.
POTENTIAL CONFLICT OF INTEREST: The authors have indicated they have no potential confl icts of interest to disclose.
by Steven Crouch on April 26, 2016Downloaded from

PEDIATRICS Volume 137 , number 4 , April 2016
12. Varni JW, Seid M, Kurtin PS. PedsQL 4.0:
reliability and validity of the Pediatric
Quality of Life Inventory version
4.0 generic core scales in healthy
and patient populations. Med Care.
2001;39(8):800–812
13. Desai AD, Zhou C, Stanford S, Haaland
W, Varni JW, Mangione-Smith RM.
Validity and responsiveness of the
pediatric quality of life inventory
(PedsQL) 4.0 generic core scales in
the pediatric inpatient setting. JAMA
Pediatr. 2014;168(12):1114–1121
14. Berry JG, Toomey SL, Zaslavsky AM, et
al. Pediatric readmission prevalence
and variability across hospitals
[published correction appears in
JAMA. 2013;309(10):986]. JAMA.
2013;309(4):372–380
15. Penfold RB, Zhang F. Use of interrupted
time series analysis in evaluating
health care quality improvements.
Acad Pediatr. 2013;13(suppl
6):S38–S44
16. Taljaard M, McKenzie JE, Ramsay CR,
Grimshaw JM. The use of segmented
regression in analysing interrupted
time series studies: an example in pre-
hospital ambulance care. Implement
Sci. 2014;9:77
17. Wagner AK, Soumerai SB, Zhang F,
Ross-Degnan D. Segmented regression
analysis of interrupted time series
studies in medication use research.
J Clin Pharm Ther. 2002;27(4):
299–309
18. Hanna E, Schultz S, Doctor D, Vural E,
Stern S, Suen J. Development
and implementation of a clinical
pathway for patients undergoing
total laryngectomy: impact on cost
and quality of care. Arch Otolaryngol
Head Neck Surg. 1999;125(11):
1247–1251
19. Jacavone JB, Daniels RD, Tyner I. CNS
facilitation of a cardiac surgery clinical
pathway program. Clin Nurse Spec.
1999;13(3):126–132
20. Mabrey JD, Toohey JS, Armstrong
DA, Lavery L, Wammack LA. Clinical
pathway management of total knee
arthroplasty. Clin Orthop Relat Res.
1997; (345):125–133
21. Jones S. A clinical pathway
for pediatric gastroenteritis.
Gastroenterol Nurs. 2003;26(1):7–18
22. Kelly CS, Andersen CL, Pestian JP, et al.
Improved outcomes for hospitalized
asthmatic children using a clinical
pathway. Ann Allergy Asthma Immunol.
2000;84(5):509–516
23. Kirk AT, Alder SC, King JD. Cue-based
oral feeding clinical pathway results in
earlier attainment of full oral feeding
in premature infants. J Perinatol.
2007;27(9):572–578
24. Kwan-Gett TS, Lozano P, Mullin K,
Marcuse EK. One-year experience
with an inpatient asthma clinical
pathway. Arch Pediatr Adolesc Med.
1997;151(7):684–689
25. Mitchell EA, Didsbury PB, Kruithof N, et
al. A randomized controlled trial of an
asthma clinical pathway for children
in general practice. Acta Paediatr.
2005;94(2):226–233
26. Norton SP, Pusic MV, Taha F, Heathcote
S, Carleton BC. Effect of a clinical
pathway on the hospitalisation rates
of children with asthma: a prospective
study. Arch Dis Child. 2007;92(1):
60–66
27. Roberts HC, Pickering RM, Onslow E,
et al. The effectiveness of
implementing a care pathway for
femoral neck fracture in older
people: a prospective controlled
before and after study. Age Ageing.
2004;33(2):178–184
28. Rome ES, Moszczenski SA, Craighill
M, et al. A clinical pathway for pelvic
infl ammatory disease for use on an
inpatient service. Clin Perform Qual
Health Care. 1995;3(4):185–196
29. Taylor KO, Goudie CM, Muller MJ.
Evaluation of a pediatric scald burn
clinical pathway. J Burn Care Rehabil.
2004;25(3):256–261
30. Wazeka A, Valacer DJ, Cooper M,
Caplan DW, DiMaio M. Impact of a
pediatric asthma clinical pathway
on hospital cost and length of stay.
Pediatr Pulmonol. 2001;32(3):211–216
31. Wilson SD, Dahl BB, Wells RD. An
evidence-based clinical pathway
for bronchiolitis safely reduces
antibiotic overuse. Am J Med Qual.
2002;17(5):195–199
32. Wolff M, Schinasi DA, Lavelle J,
Boorstein N, Zorc JJ. Management of
neonates with hyperbilirubinemia:
improving timeliness of care using
a clinical pathway. Pediatrics.
2012;130(6). Available at: www.
pediatrics. org/ cgi/ content/ full/ 130/ 6/
e1688
33. Newman RE, Hedican EB, Herigon
JC, Williams DD, Williams AR,
Newland JG. Impact of a guideline on
management of children hospitalized
with community-acquired pneumonia.
Pediatrics. 2012;129(3). Available at:
www. pediatrics. org/ cgi/ content/ full/
129/ 3/ e597
34. Ambroggio L, Thomson J, Murtagh
Kurowski E, et al Quality improvement
methods increase appropriate
antibiotic prescribing for childhood
pneumonia. Pediatrics. 2013;131(5).
Available at: www. pediatrics. org/ cgi/
content/ full/ 131/ 5/ e1623
35. Murtagh Kurowski E, Shah SS,
Thomson J, et al. Improvement
methodology increases guideline
recommended blood cultures in
children with pneumonia. Pediatrics.
2015;135(4). Available at: www.
pediatrics. org/ cgi/ content/ full/ 135/ 4/
e1052
36. Berwick DM, Nolan TW, Whittington
J. The triple aim: care, health,
and cost. Health Aff (Millwood).
2008;27(3):759–769
37. Blackwell LS, Marciel KK, Quittner
AL. Utilization of patient-reported
outcomes as a step towards
collaborative medicine. Paediatr
Respir Rev. 2013;14(3):146–151
38. Hulscher ME, Wensing M, van Der
Weijden T, Grol R. Interventions to
implement prevention in primary care.
Cochrane Database Syst Rev. 2001;
(1):CD000362
9by Steven Crouch on April 26, 2016Downloaded from
DOI: 10.1542/peds.2015-1202; originally published online March 21, 2016; 2016;137;Pediatrics
and Rita Mangione-SmithK. Casey Lion, Davene R. Wright, Suzanne Spencer, Chuan Zhou, Mark Del Beccaro
Standardized Clinical Pathways for Hospitalized Children and Outcomes
ServicesUpdated Information &
/content/137/4/peds.2015-1202.full.htmlincluding high resolution figures, can be found at:
Supplementary Material
html/content/suppl/2016/03/18/peds.2015-1202.DCSupplemental.Supplementary material can be found at:
References
/content/137/4/peds.2015-1202.full.html#ref-list-1at:This article cites 29 articles, 5 of which can be accessed free
Citations /content/137/4/peds.2015-1202.full.html#related-urls
This article has been cited by 1 HighWire-hosted articles:
Subspecialty Collections
/cgi/collection/hospital_medicine_subHospital Medicine
/cgi/collection/quality_improvement_subQuality Improvement
/cgi/collection/administration:practice_management_subAdministration/Practice Managementthe following collection(s):This article, along with others on similar topics, appears in
Permissions & Licensing
/site/misc/Permissions.xhtmltables) or in its entirety can be found online at: Information about reproducing this article in parts (figures,
Reprints /site/misc/reprints.xhtml
Information about ordering reprints can be found online:
rights reserved. Print ISSN: 0031-4005. Online ISSN: 1098-4275.Grove Village, Illinois, 60007. Copyright © 2016 by the American Academy of Pediatrics. All and trademarked by the American Academy of Pediatrics, 141 Northwest Point Boulevard, Elkpublication, it has been published continuously since 1948. PEDIATRICS is owned, published, PEDIATRICS is the official journal of the American Academy of Pediatrics. A monthly
by Steven Crouch on April 26, 2016Downloaded from

DOI: 10.1542/peds.2015-1202; originally published online March 21, 2016; 2016;137;Pediatrics
and Rita Mangione-SmithK. Casey Lion, Davene R. Wright, Suzanne Spencer, Chuan Zhou, Mark Del Beccaro
Standardized Clinical Pathways for Hospitalized Children and Outcomes
/content/137/4/peds.2015-1202.full.html
located on the World Wide Web at: The online version of this article, along with updated information and services, is
of Pediatrics. All rights reserved. Print ISSN: 0031-4005. Online ISSN: 1098-4275.Boulevard, Elk Grove Village, Illinois, 60007. Copyright © 2016 by the American Academy published, and trademarked by the American Academy of Pediatrics, 141 Northwest Pointpublication, it has been published continuously since 1948. PEDIATRICS is owned, PEDIATRICS is the official journal of the American Academy of Pediatrics. A monthly
by Steven Crouch on April 26, 2016Downloaded from
Related Documents