Copyright ©, 2020 Ala-Too International University. Eurasian Journal of Business and Economics, 13(25), 21-36, (2020). Is Capital Market Integration among the SAARC Countries Feasible? An Empirical Study Emon Kalyan CHOWDHURY * Received: January 21, 2020 Revised: April 14, 2020 Accepted: April 23, 2020. Abstract This paper aims to verify the feasibility of capital market integration among the SAARC member countries by analyzing the reaction of volatility towards the changes in economic, political, and financial factors by taking five particular SAARC countries as a sample. In order to achieve this objective, Gross Domestic Product Per Capita, Political Stability Index, Stock Market Value, Corporate Information Disclosure Index, and DGEN of Bangladesh, Sensex of India, NEPSE of Nepal, KSE100 of Pakistan, and CSE All Shares of Sri Lanka from 2003 to 2018 have been considered. All the data have been found stationary at the first difference. Pedroni, Kao, and Johansen's tests indicate the existence of cointegration among the factors. Panel Vector Error Correction Model observes both long-run and short-run impacts of selected factors on the volatility, thus confirms the possibility of capital market integration among the sample countries. The study strongly recommends market integration as it will increase market competition, reduce financial services costs, small companies can enjoy equity financing, and large companies can enjoy economies of scale. The outcome of this study enriches the international finance literature with a special focus on the regional economic bloc. Keywords: Cointegration, integration, SAARC, stock market, VECM, volatility. JEL Code Classification: C13, C23, C52, F21, O16 UDC: 336.76 DOI: https://doi.org/10.17015/ejbe.2020.025.02. * Associate Professor, CIU Business School, Chittagong Independent University, Chattogram, Bangladesh. Email: [email protected]

Welcome message from author
This document is posted to help you gain knowledge. Please leave a comment to let me know what you think about it! Share it to your friends and learn new things together.
Transcript
Copyright ©, 2020 Ala-Too International University.
Eurasian Journal of Business and Economics, 13(25), 21-36, (2020).
Is Capital Market Integration among the SAARC Countries Feasible? An Empirical Study
Emon Kalyan CHOWDHURY*
Received: January 21, 2020 Revised: April 14, 2020 Accepted: April 23, 2020.
Abstract
This paper aims to verify the feasibility of capital market integration among the SAARC member countries by analyzing the reaction of volatility towards the changes in economic, political, and financial factors by taking five particular SAARC countries as a sample. In order to achieve this objective, Gross Domestic Product Per Capita, Political Stability Index, Stock Market Value, Corporate Information Disclosure Index, and DGEN of Bangladesh, Sensex of India, NEPSE of Nepal, KSE100 of Pakistan, and CSE All Shares of Sri Lanka from 2003 to 2018 have been considered. All the data have been found stationary at the first difference. Pedroni, Kao, and Johansen's tests indicate the existence of cointegration among the factors. Panel Vector Error Correction Model observes both long-run and short-run impacts of selected factors on the volatility, thus confirms the possibility of capital market integration among the sample countries. The study strongly recommends market integration as it will increase market competition, reduce financial services costs, small companies can enjoy equity financing, and large companies can enjoy economies of scale. The outcome of this study enriches the international finance literature with a special focus on the regional economic bloc.
Keywords: Cointegration, integration, SAARC, stock market, VECM, volatility.
JEL Code Classification: C13, C23, C52, F21, O16 UDC: 336.76 DOI: https://doi.org/10.17015/ejbe.2020.025.02.
* Associate Professor, CIU Business School, Chittagong Independent University, Chattogram, Bangladesh. Email: [email protected]
Emon Kalyan CHOWDHURY
Page |22 EJBE 2020, 13(25)
1. Introduction
The South Asian Association for Regional Cooperation (SAARC) is an economic and geopolitical organization of eight countries that are primarily located in Asia. It was established in 1985. The secretariat is located in Kathmandu, Nepal. The founding members were Bangladesh, India, Nepal, Bhutan, Maldives, Sri Lanka, and Pakistan. Afghanistan was included later in 2007. The objectives of forming SAARC were to promote welfare economics, quality of life, collective self-reliance to accelerate socio-cultural development in the region. Enhancing collaboration and mutual assistance in the economic, social, cultural, technical, and scientific fields was another top priority of this bloc.
1.1. Capital Market Scenario of SAARC
The capital markets of SAARC countries are different in nature. The common difference is the size. Among the member countries, India is the largest economy and has a significant impact on relative capital market development. Among the sample countries, India witnessed significant transformation in the area of information technology, market, and regulatory structure, and inviting foreign investments. The economic stability of this region is not strong enough as the average per capita income is as low as USD 1,923 (Table 1). Since there prevails a common law-based system in all the member countries, the possibility of integrating the markets is very high. Like other economic blocs, SAARC countries are not connected economically that much as they are culturally. Although the Indian market is sound comparing to other markets, yet, foreign investors do not find this region as attractive as few European countries, Singapore, Hong Kong, and the US for investment.
Table 1. Economic data of the SAARC countries
Countries Population Annual GDP
(Million USD) GDP per capita
(USD) HDI
Deficit (%GDP)
Afghanistan 37,172,386 19,630 528 0.498 1.53%
Bangladesh 161,356,039 288,424 1,788 0.608 -4.64% Bhutan 754,394 2,582 3,423 0.612 -1.95%
India 1,352,617,328 2,718,732 2,010 0.640 -6.40%
Maldives 515,696 5,328 10,332 0.717 -4.55%
Nepal 28,087,871 29,040 1,034 0.574 -6.65%
Pakistan 200,960,000 314,588 1,565 0.562 -6.42%
Sri Lanka 21,670,000 88,901 4,102 0.770 -5.27%
Total 1,803,133,714 3,467,225 1,923
Source: The World Bank, 2019
The stock markets in the SAARC region are still underdeveloped as the number of listing is very low, and market value is very insignificant comparing to other European and American economic blocs (Table 2). The main reason is the lack of trade links among the member countries. The intermediaries of the SAARC countries remain uninformed about the status of capital markets as they do not have access to
Is Capital Market Integration among the SAARC Countries Feasible? An Empirical Study
EJBE 2020, 13(25) Page |23
information on markets in SAARC countries (Romero, Wells, and Selwyn, 2013). On the contrary, regulators and stock exchanges remain informed due to the formation of three unique blocs such as the South Asian Federation of Exchange (SAFA), International Organizations of Securities Commissions (IOSCO), and World Federation of Exchange (WFE).
Table 2. Equity Market Size of Selected SAARC Countries SAARC Member
Number of Listed Companies
Market Value (Billion USD)
Number of Brokers
Number of Stock Exchanges
Bangladesh 593 78 319 2
India 7,391 2,084 3,725 2
Nepal 226 86 50 1
Pakistan 684 92 240 3
Sri Lanka 296 16 14 1 Source: World Bank and websites of stock exchange regulatory authority of concerned countries, 2019
All the capital markets of SAARC countries ensure strict requirements for corporate disclosure and prospectus. They try to keep participants free from any sort of market abuse. Although most of the markets have accounting standards and governance codes to comply with international standards, the monitoring and enforcement standards vary from country to country. Foreign brokers are allowed to participate in SAARC countries only by establishing their local subsidiaries. The exchange control system among the countries is not strict enough to develop a sound capital market, which, however, deters long-term integration (Romero et al. 2013).
1.2. Capital Market Integration
Capital market integration allows the free flow of capital among the member countries. Investors can invest in any country where information, regulations, trading process, accounting standards, settlement systems, governance standards are similar in nature. Companies can raise their funds from both domestic and foreign countries, complying with similar types of rules and regulations. It also allows service providers to operate in any region without any country-specific restrictions. Although SAARC countries have their integrated capital markets, there is no cross-border integration among the countries. This study will examine the feasibility of capital market integration after analyzing the nature of volatility of selected countries in the SAARC region and its reaction toward the changes of economic, political, and financial factors. There is a relationship between volatility and the possibility of capital market integration. Aizenman (1995) found that the same nature of volatility and positive impact of shocks lead to the possibility of capital market integration. To achieve this objective, the following hypotheses have been developed.
1.3. Hypotheses
This study assumes the following hypotheses:
Emon Kalyan CHOWDHURY
Page |24 EJBE 2020, 13(25)
H1: The stock markets in SAARC countries are not cointegrated
H2: Volatility does not react to the changes of economic, political and financial variables
H3: There is no possibility of capital markets integration among SAARC countries
The rest of the paper is organized as follows: the second section contains the literature review, the third section contains research methodology, sources of data, and justifications for using the data. Cointegration tests and panel Vector Error Correction Model are applied to measure the level of cointegration, short-term and long-term impact of changes in economic, political, and financial variables on the volatility of selected countries followed by a comprehensive discussion on the results. The last section contains a summary and concluding observations.
2. Literature Review
It is beyond doubt that both macro and micro factors influence the fluctuations in the international stock market. Rozeff (1974) observed how changes in monetary policy affect the volatility of the stock market, whereas Campbell and Ammer (1993) analyzed the impact of the inflation rate and interest rates on the return of stocks. Ulku and Baker (2014) found an association between stock markets and macroeconomics based on the stock market beta and macroeconomic beta. Boadi and Amegbe (2017) examined the relationship between the government’s performance and stock market returns in 23 countries using a fixed-effect model. They observed a positive relationship between the government’s performance and the stock market return. De Long et al. (1990) studied how investor types and investment scales influence the volatility of the stock market. Schuppli and Bohl (2010) analyzed the impact of foreign institutional investors on the stability of the Chinese stock market, whereas Chang and Lin (2015) observed the positive impact of investment decisions on the international stock market. Pineiro-Chousa (2017) measured the influence of social media on the activities of investors and their behavior on the Chicago Stock Exchange Volatility Index. It is observed in different studies that the volatility in different stock markets is correlated. Jaffe and Westerfield (1985) observed the “weekend effect” of stock market return in the U.S, U.K, Japan, Canada, and Australian stock markets, which indicates there is a significant independent seasonal return distribution among the member countries as these markets are integrated. Fleming, Kirby, and Ostdiek (1998) studied how the volatility of stocks, bonds, and the currency markets are correlated, whereas Fleischer (2003) further studied volatilities among the stocks, currencies, and bonds markets in Australia and the United States. Pretorius (2002) explored the dynamic connection among ten emerging stock markets and pointed out that the linkage between stock markets in the same region is closer to that between other stock markets. Gupta and Donleavy (2009) empirically observed the similarity in yields patterns among emerging stock markets. Sabri (2002) observed that the number of
Is Capital Market Integration among the SAARC Countries Feasible? An Empirical Study
EJBE 2020, 13(25) Page |25
listed multinational companies and the degree of openness of the stock market lead to a positive link between the volatility of stock markets in various countries. Junior, Mullokandov, and Kenett (2015) found a positive relationship between the national stock market index and information flow in various countries. Political turbulence is uncertain and catastrophic for an economy, which creates more risk and fear among investors’ especially in emerging countries, and cannot recover as quickly as developed countries (Chau, Deesomsak, & Wang, 2014). Jorion and Goetzmann (1999) studied the impact of political instability on stock market return and its volatility and found that it affects most national bond and stock markets. Political unrest derives from strikes, and it influences economic outcomes such as firm productivity, costs, and exports (Shonchoy & Tsubota 2016), thus making the market volatile and increases the investors’ required rate of return. GDP has unidirectional and positive influence (Caporale & Spagnolo 2003), a bidirectional relationship (Leon & Filis 2008) on the volatility. Caporale and Spagnolo (2003) witnessed a positive influence on output growth volatility from the stock market volatility.
3. Methodology
In order to check the feasibility of capital market integration among the SAARC countries, the short and long run reactions of volatility toward the change of economic, political, and financial variables need to measure. Although volatility is a consequence of many factors, in this study, the focus has been given on economic progress which is represented by gross domestic products, the size of stock market which is represented by market capitalization, the political stability of the country which is represented by political stability index, the practice of corporate governance by the listed companies which is represented by corporate information disclosure of Bangladesh, India, Nepal, Pakistan, and Sri Lanka from 2003 to 2018. The reason for selecting these countries is the availability of data. Data have been collected from the websites of respective stock exchanges, and the World Bank. In order to determine the volatility of the stock market, DGEN of Bangladesh, Sensex of India, NEPSE of Nepal, KSE100 of Pakistan, CSE All Shares of Sri Lanka have been considered. The index measuring the volatility of the stock market has been divided into two parts. One is the market yield index, and the other is the market volatility index. The daily logarithmic yield has been calculated as equation 1
𝑅𝑡,𝑖 = ln 𝑖𝑛𝑑𝑒𝑥𝑡,𝑖 − ln 𝑖𝑛𝑑𝑒𝑥𝑡−1,𝑖 (1)
Where 𝑅𝑡,𝑖 denotes the logarithmic yield of national stock market 𝑖𝑛𝑑𝑒𝑥𝑖on the tth
trading day, 𝑖𝑛𝑑𝑒𝑥𝑡,𝑖 indicates the closing price of the national stock market index i on the tth trading day, and 𝑖𝑛𝑑𝑒𝑥𝑡−1,𝑖 denotes the closing price of the national stock market index i on the (t-1)th trading day. Stock market volatility measures the volatility of stock prices, which is a measure of the uncertainty of yields. The historical volatility within a specific period is calculated as equation 2:
𝑉𝑂𝐿𝑖 = √𝑆𝑆𝑆
𝑁−1. 𝑇 (2)
Emon Kalyan CHOWDHURY
Page |26 EJBE 2020, 13(25)
Where VOLi denotes the historical volatility of the national stock market index i, =∑ (𝑅𝑖,𝑗 − 𝑅𝑛
𝑗−1 ′)2 , 𝑅𝑖,𝑗 indicates the jth logarithmic yield of the national stock index i,
R′ denotes the mean of the logarithmic yield, and T indicates the number of trading days. Irfan, Nishat, and Sharif (2002) applied multiple factors influencing the stock market volatility mentioned above are taken into account in this study. The model is presented, as shown in equation 3:
𝑙𝑛𝑉𝑂𝐿𝑖,𝑡 =∝ +𝛽1𝑙𝑛𝐺𝐷𝑃𝑖𝑡 + 𝛽2𝑙𝑛𝑀𝐴𝐾𝑇𝑖𝑡 + 𝛽3𝑙𝑛𝐺𝑃𝑆𝑖𝑡 + 𝛽4𝑙𝑛𝐼𝑁𝐹𝑂𝑅𝑀𝑖𝑡 + 𝜇𝑖.𝑡 (3)
where VOLi,t denotes the historical stock volatility of the ith country in the tth year, GDPi,t indicates GDP per capita of the ith country in the tth year, MAKTi,t indicates the total market value of the ith national stock market in the tth year, GPSi,t denotes the political stability index of the ith country in the tth year, INFORMi,t indicates the corporate information disclosure level of the ith country in the tth year. The data and justification have been shown in Table 3:
Table 3. Justification for data Data Justification Source
VOL: Historical volatility of a national stock market index
Volatility depends on price fluctuations. The more prices fluctuate, the more volatile the market is.
Websites of stock exchanges
GDP: Gross domestic product per capita
The greater the gross domestic product per capita, the higher the probability that people will invest in the stock market. The indicator has a positive effect on the volatility of the stock market.
World Bank
MAKT: Stock market value
The larger the scale of the national stock market, the greater the stability of the stock market. The indicator has a negative effect on the volatility of the stock market.
World Bank
GPS: Political stability index
The more stable the national political environment, and the better the performance of the government, the more stable the stock market. The indicator has a negative effect on the volatility of the stock market.
World Bank
INFORM: Corporate information disclosure index
The index ranges from 0 to 10. The larger the value, the higher the disclosure level, and the more stable the stock market.
World Bank
4. Research Findings and Discussion
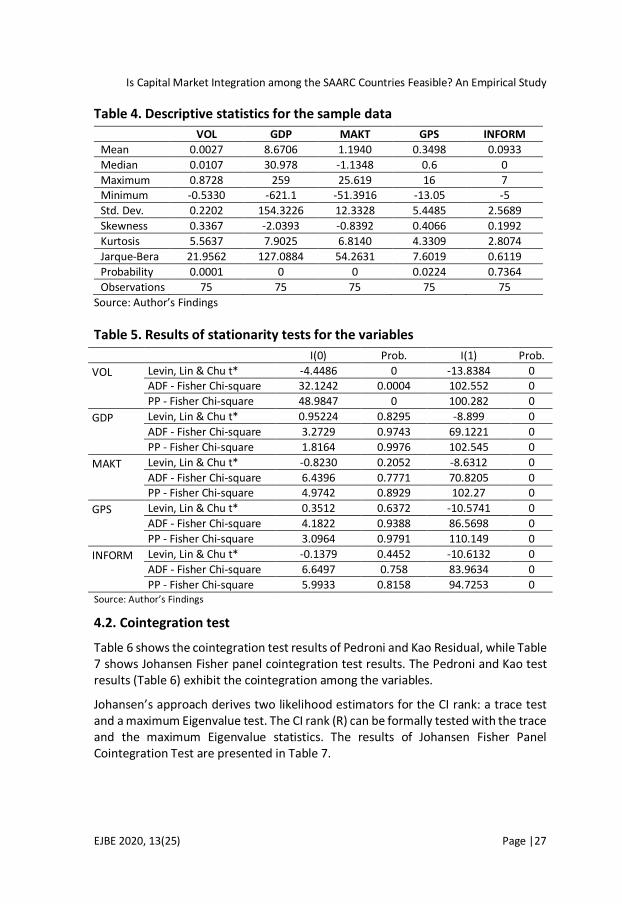
Table 4 shows the descriptive statistics for the sample data are. Key items include mean, standard deviation, minimum and maximum values.
4.1. Stationarity test
Table 5 exhibits that most of the variables are stationary at the first level I(1). The variables have been converted to the first difference. The stationarity of the data allows for the test of cointegration among the variables.
Is Capital Market Integration among the SAARC Countries Feasible? An Empirical Study
EJBE 2020, 13(25) Page |27
Table 4. Descriptive statistics for the sample data
VOL GDP MAKT GPS INFORM
Mean 0.0027 8.6706 1.1940 0.3498 0.0933
Median 0.0107 30.978 -1.1348 0.6 0
Maximum 0.8728 259 25.619 16 7 Minimum -0.5330 -621.1 -51.3916 -13.05 -5
Std. Dev. 0.2202 154.3226 12.3328 5.4485 2.5689
Skewness 0.3367 -2.0393 -0.8392 0.4066 0.1992
Kurtosis 5.5637 7.9025 6.8140 4.3309 2.8074
Jarque-Bera 21.9562 127.0884 54.2631 7.6019 0.6119
Probability 0.0001 0 0 0.0224 0.7364
Observations 75 75 75 75 75
Source: Author’s Findings
Table 5. Results of stationarity tests for the variables
I(0) Prob. I(1) Prob.
VOL
Levin, Lin & Chu t* -4.4486 0 -13.8384 0 ADF - Fisher Chi-square 32.1242 0.0004 102.552 0
PP - Fisher Chi-square 48.9847 0 100.282 0
GDP
Levin, Lin & Chu t* 0.95224 0.8295 -8.899 0
ADF - Fisher Chi-square 3.2729 0.9743 69.1221 0
PP - Fisher Chi-square 1.8164 0.9976 102.545 0
MAKT
Levin, Lin & Chu t* -0.8230 0.2052 -8.6312 0
ADF - Fisher Chi-square 6.4396 0.7771 70.8205 0 PP - Fisher Chi-square 4.9742 0.8929 102.27 0
GPS
Levin, Lin & Chu t* 0.3512 0.6372 -10.5741 0
ADF - Fisher Chi-square 4.1822 0.9388 86.5698 0
PP - Fisher Chi-square 3.0964 0.9791 110.149 0
INFORM
Levin, Lin & Chu t* -0.1379 0.4452 -10.6132 0
ADF - Fisher Chi-square 6.6497 0.758 83.9634 0
PP - Fisher Chi-square 5.9933 0.8158 94.7253 0 Source: Author’s Findings
4.2. Cointegration test
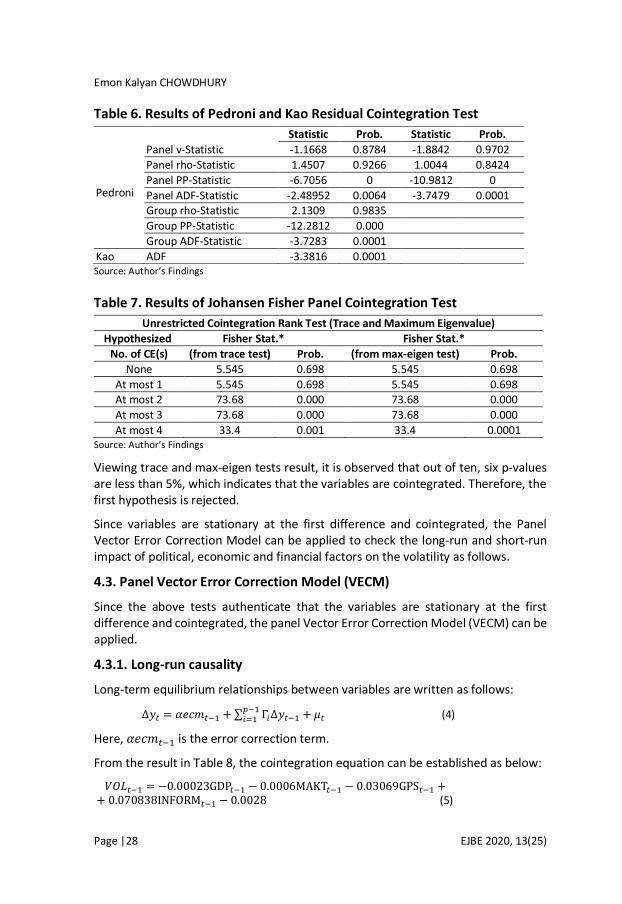
Table 6 shows the cointegration test results of Pedroni and Kao Residual, while Table 7 shows Johansen Fisher panel cointegration test results. The Pedroni and Kao test results (Table 6) exhibit the cointegration among the variables.
Johansen’s approach derives two likelihood estimators for the CI rank: a trace test and a maximum Eigenvalue test. The CI rank (R) can be formally tested with the trace and the maximum Eigenvalue statistics. The results of Johansen Fisher Panel Cointegration Test are presented in Table 7.
Emon Kalyan CHOWDHURY
Page |28 EJBE 2020, 13(25)
Table 6. Results of Pedroni and Kao Residual Cointegration Test
Source: Author’s Findings
Table 7. Results of Johansen Fisher Panel Cointegration Test
Unrestricted Cointegration Rank Test (Trace and Maximum Eigenvalue)
Hypothesized Fisher Stat.* Fisher Stat.*
No. of CE(s) (from trace test) Prob. (from max-eigen test) Prob.
None 5.545 0.698 5.545 0.698
At most 1 5.545 0.698 5.545 0.698 At most 2 73.68 0.000 73.68 0.000
At most 3 73.68 0.000 73.68 0.000
At most 4 33.4 0.001 33.4 0.0001 Source: Author’s Findings
Viewing trace and max-eigen tests result, it is observed that out of ten, six p-values are less than 5%, which indicates that the variables are cointegrated. Therefore, the first hypothesis is rejected.
Since variables are stationary at the first difference and cointegrated, the Panel Vector Error Correction Model can be applied to check the long-run and short-run impact of political, economic and financial factors on the volatility as follows.
4.3. Panel Vector Error Correction Model (VECM)
Since the above tests authenticate that the variables are stationary at the first difference and cointegrated, the panel Vector Error Correction Model (VECM) can be applied.
4.3.1. Long-run causality
Long-term equilibrium relationships between variables are written as follows:
Δ𝑦𝑡 = 𝛼𝑒𝑐𝑚𝑡−1 + ∑ Γ𝑖Δ𝑦𝑡−1 + 𝜇𝑡𝑝−1𝑖=1 (4)
Here, 𝛼𝑒𝑐𝑚𝑡−1 is the error correction term.
From the result in Table 8, the cointegration equation can be established as below:
𝑉𝑂𝐿𝑡−1 = −0.00023GDP𝑡−1 − 0.0006MAKT𝑡−1 − 0.03069GPS𝑡−1 + + 0.070838INFORM𝑡−1 − 0.0028 (5)
Pedroni
Panel v-Statistic
Statistic Prob. Statistic Prob.
-1.1668 0.8784 -1.8842 0.9702
Panel rho-Statistic 1.4507 0.9266 1.0044 0.8424
Panel PP-Statistic -6.7056 0 -10.9812 0
Panel ADF-Statistic -2.48952 0.0064 -3.7479 0.0001 Group rho-Statistic 2.1309 0.9835
Group PP-Statistic -12.2812 0.000
Group ADF-Statistic -3.7283 0.0001
Kao ADF -3.3816 0.0001
Is Capital Market Integration among the SAARC Countries Feasible? An Empirical Study
EJBE 2020, 13(25) Page |29
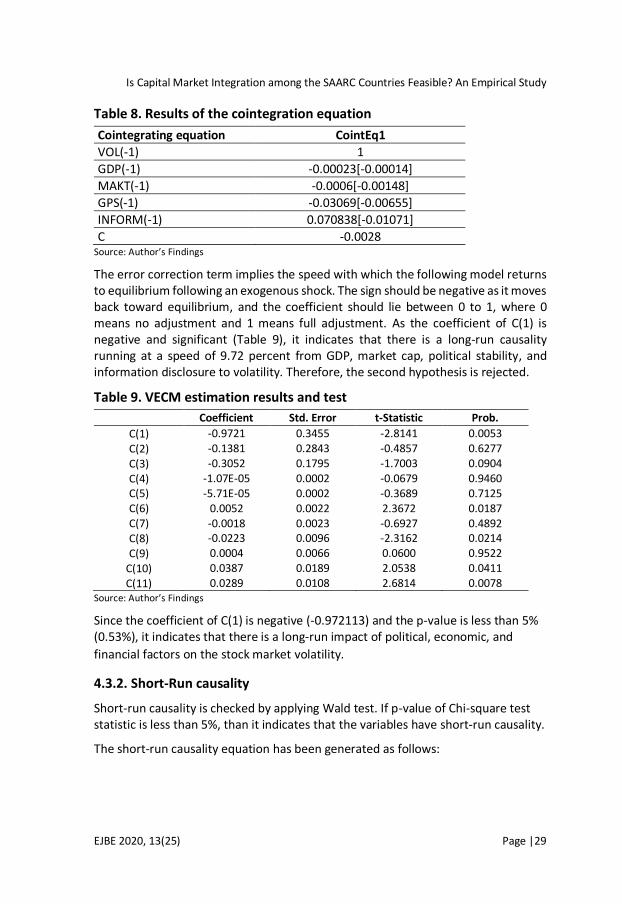
Table 8. Results of the cointegration equation
Cointegrating equation CointEq1
VOL(-1) 1
GDP(-1) -0.00023[-0.00014]
MAKT(-1) -0.0006[-0.00148]
GPS(-1) -0.03069[-0.00655]
INFORM(-1) 0.070838[-0.01071]
C -0.0028 Source: Author’s Findings
The error correction term implies the speed with which the following model returns to equilibrium following an exogenous shock. The sign should be negative as it moves back toward equilibrium, and the coefficient should lie between 0 to 1, where 0 means no adjustment and 1 means full adjustment. As the coefficient of C(1) is negative and significant (Table 9), it indicates that there is a long-run causality running at a speed of 9.72 percent from GDP, market cap, political stability, and information disclosure to volatility. Therefore, the second hypothesis is rejected.
Table 9. VECM estimation results and test
Coefficient Std. Error t-Statistic Prob.
C(1) -0.9721 0.3455 -2.8141 0.0053
C(2) -0.1381 0.2843 -0.4857 0.6277
C(3) -0.3052 0.1795 -1.7003 0.0904
C(4) -1.07E-05 0.0002 -0.0679 0.9460 C(5) -5.71E-05 0.0002 -0.3689 0.7125 C(6) 0.0052 0.0022 2.3672 0.0187 C(7) -0.0018 0.0023 -0.6927 0.4892 C(8) -0.0223 0.0096 -2.3162 0.0214
C(9) 0.0004 0.0066 0.0600 0.9522
C(10) 0.0387 0.0189 2.0538 0.0411
C(11) 0.0289 0.0108 2.6814 0.0078 Source: Author’s Findings
Since the coefficient of C(1) is negative (-0.972113) and the p-value is less than 5% (0.53%), it indicates that there is a long-run impact of political, economic, and
financial factors on the stock market volatility.
4.3.2. Short-Run causality
Short-run causality is checked by applying Wald test. If p-value of Chi-square test statistic is less than 5%, than it indicates that the variables have short-run causality.
The short-run causality equation has been generated as follows:
Emon Kalyan CHOWDHURY
Page |30 EJBE 2020, 13(25)
D(VOL) = C(1) * (VOL(-1)- 0.0002258*GDP(-1) - 0.0005993*MAKT(-1) - 0.03068926*GPS(-1) + 0.070838*INFORM(-1) - 0.002799 ) + C(2) * D(VOL(-1)) + C(3) * D(VOL(-2)) + C(4) * D(GDP(-1)) + C(5) * D(GDP(-2)) + C(6) * D(MAKT(-1)) + C(7) * D(MAKT(-2)) + C(8) * D(GPS(-1)) + C(9) * D(GPS(-2)) + C(10) * D(INFORM(-1)) + C(11) * D(INFORM(-2)) + C(12) (6)
The equation 6 indicates that the coefficients of dependent variables lie between C(3) to C(13). The null hypothesis is that all the variables jointly influence the volatility of the stock market and it is expressed as follows;
Null Hypothesis: C(3)=C(4)=C(5)=C(6)=C(7)=C(8)=C(9)=C(10)=C(11)=C(12)=C(13)=0
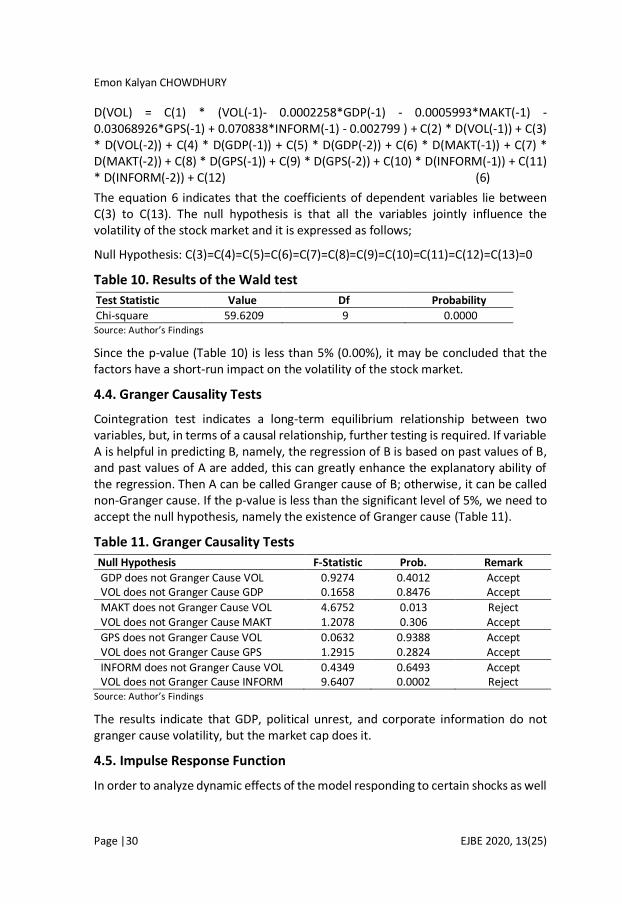
Table 10. Results of the Wald test
Test Statistic Value Df Probability
Chi-square 59.6209 9 0.0000 Source: Author’s Findings
Since the p-value (Table 10) is less than 5% (0.00%), it may be concluded that the factors have a short-run impact on the volatility of the stock market.
4.4. Granger Causality Tests
Cointegration test indicates a long-term equilibrium relationship between two variables, but, in terms of a causal relationship, further testing is required. If variable A is helpful in predicting B, namely, the regression of B is based on past values of B, and past values of A are added, this can greatly enhance the explanatory ability of the regression. Then A can be called Granger cause of B; otherwise, it can be called non-Granger cause. If the p-value is less than the significant level of 5%, we need to accept the null hypothesis, namely the existence of Granger cause (Table 11).
Table 11. Granger Causality Tests
Null Hypothesis F-Statistic Prob. Remark
GDP does not Granger Cause VOL 0.9274 0.4012 Accept VOL does not Granger Cause GDP 0.1658 0.8476 Accept
MAKT does not Granger Cause VOL 4.6752 0.013 Reject VOL does not Granger Cause MAKT 1.2078 0.306 Accept
GPS does not Granger Cause VOL 0.0632 0.9388 Accept VOL does not Granger Cause GPS 1.2915 0.2824 Accept
INFORM does not Granger Cause VOL 0.4349 0.6493 Accept VOL does not Granger Cause INFORM 9.6407 0.0002 Reject
Source: Author’s Findings
The results indicate that GDP, political unrest, and corporate information do not granger cause volatility, but the market cap does it.
4.5. Impulse Response Function
In order to analyze dynamic effects of the model responding to certain shocks as well
Is Capital Market Integration among the SAARC Countries Feasible? An Empirical Study
EJBE 2020, 13(25) Page |31
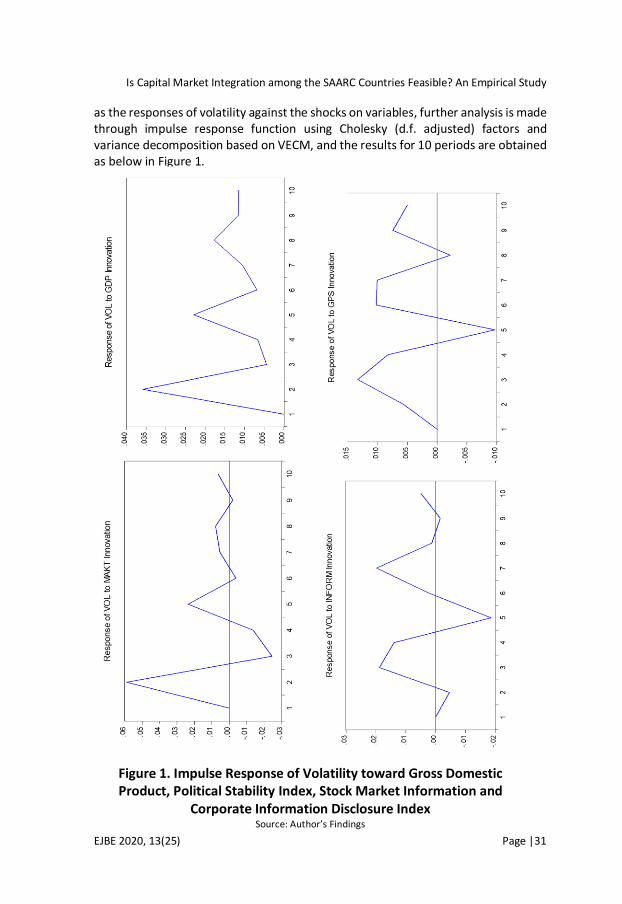
as the responses of volatility against the shocks on variables, further analysis is made through impulse response function using Cholesky (d.f. adjusted) factors and variance decomposition based on VECM, and the results for 10 periods are obtained as below in Figure 1.
Figure 1. Impulse Response of Volatility toward Gross Domestic Product, Political Stability Index, Stock Market Information and
Corporate Information Disclosure Index Source: Author’s Findings
Emon Kalyan CHOWDHURY
Page |32 EJBE 2020, 13(25)
Figure 1 shows, when a shock is given to factors, volatility acts positively at the initial stage and then acts negatively. However, the shocks result in both positive and negative throughout the period. Stock markets in SAARC countries are similar in structure and diverse in size. It is clear from the above findings that the factors have both short-run and long-run effects on the volatility in the selected countries. The cointegration among the variables indicates that there is a huge potentiality of integration and harmonization among the countries. There exist few problems among the countries which hinder the exploitation of benefits of this cointegration as well as short-run and long-run impact of variables. The markets are not efficient, and the exchange of information is not smooth at all. There is an absence of harmonized policies and standards among the markets; as a result, regulators fail to control most often. Since the expectation of investors in these markets is very high, they take higher risk and thus make the market volatile in pursuit of higher premiums. Although there is a huge investment opportunity for both local and foreign investors in these markets, lack of financial integration makes it quite difficult.
The progress of regional cooperation has been very slow in SAARC due to negative political correlation and historical bitterness. Political hostility among the member countries deters the socio-economic prospects between the countries. The disparity of natural resources hampers real growth among the member countries. However, the cointegration nature, volatility reaction toward the variables and positive shocks on volatility authenticate that there is a possibility of capital market integration among the member countries of SAARC, thus rejecting the third hypothesis. In order to integrate the capital markets, the regulatory structure and standards of all the markets are required to be harmonized. Harmonization can convert a less important market to a very attractive market, especially to foreign investors, as this has to go through a rigid set of rules and similar regulation processes. To strengthen the impact of regional harmonization, regional integration is a must. Without regional integration, the full benefits of harmonization cannot be ensured as investors from outside regions will have access to the local markets, but local investors cannot invest in the cross-border regions.
Integration among SAARC countries is not so easy as individual country has unique policies, and these are somehow very difficult to harmonize. Romero et al. (2013) found that Bangladesh has a strict exchange control system, weak surveillance system, less control over issuer discloser rule, and there is an absence of independence of the regulator. Bhutan restricts foreign issuers and investors. Government intervention in the economy is very high. India restricts foreign listing. They have a very complicated tax structure and fragmented settlement system. The national market of Maldives is not viable. Their control over disclosure practice is very weak. Although Nepal maintains a strict exchange control system, they have a
Is Capital Market Integration among the SAARC Countries Feasible? An Empirical Study
EJBE 2020, 13(25) Page |33
sporadic regulatory structure and very poor control over the disclosure practice of listed companies.
The capital market of Pakistan is under serious turbulence, and regulators cannot work independently. Surprisingly, Sri Lanka has an outdated settlement system and less control over the market abuse. Though concerned regulatory authorities are taking measures to improve the situations (Central Bank of Sri Lanka, 2019). In order to simplify capital market integration in the SAARC region, necessary changes in different aspects are essential. Such as, member countries should frame comprehensive and uniform corporate governance codes. Economic cooperation and integration bring fortune for the member countries in different ways. Miljkovic (2018) observed potential economic benefits between Serbia and member countries of the Eurasian Economic Union for the development of foreign trade relations and cooperation. To ensure listing transparency and appropriate use of funds, similar content requirements for prospectus required to be enacted. A transparent trading system will save general investors from the so-called stock market manipulators. Formulation of similar accounting standards in compliance with international standards will ensure transparency and credibility of accounting data and facts. Regulators should be free from all sorts of government interventions to control common market abuse. The clearing and settlement procedures should be standardized throughout the region. In order to make the market stable and less volatile, the behavior of brokers and security houses should be monitored regularly. The capital market integration in the SAARC region will benefit all the member countries and investors in various ways. Since the competition among the markets will increase, the cost of different financial services will decline drastically. This will help local small companies to step into the capital market, and large companies can enjoy the economies of scale. As the turnover will increase, it will make the markets more efficient and liquid. Traditional bourses can introduce new products like derivatives, which will give investors more liberty to design their portfolio in a broader way.
5. Conclusion
This study attempted to explore the feasibility of capital market integration in the SAARC region by analyzing the reaction of volatility toward changes in political, economic, and financial factors. In order to attain this objective, data from five SAARC member countries have been collected based on the availability of data. In order to measure stock market volatility, DGEN of Bangladesh, Sensex of India, NEPSE of Nepal, KSE100 of Pakistan, and CSE All Shares of Sri Lanka were considered from 2003 to 2018. Gross Domestic Product Per Capita, Political Stability Index, Stock Market Value, Corporate Information Disclosure Index of selected countries for the same period was used to measure the economic, political, and financial changes, respectively. The presence of cointegration among the countries was found by applying Pedroni, Kao, and Johansen tests. Since there exist both long-run and short-
Emon Kalyan CHOWDHURY
Page |34 EJBE 2020, 13(25)
run effects of changes in economic, political, and financial factors on the volatility, there is a possibility of capital market integration among the member countries. As the main objective of establishing SAARC was to strengthen the economic, social, and cultural ties among the member countries, the capital market integration may lay the foundation stone in forwarding this objective. Though capital market integration comes with many advantages, it is not so easy to implement due to political hostility among few member countries, different taxation systems, significant size variations of stock markets, and lack of transparency. A positive attitude of all member countries can bring turnaround change in the overall economic, political, and financial sectors of this fallen back but highly potential regional bloc.
References
Aizenman, J. (1995). Capital markets integration, volatility and persistence (No. w5241). National Bureau of Economic Research. https://doi.org/10.3386/w5241
Boadi, I., & Amegbe, H. (2017). The link between quality of governance and stock market performance: International level evidence. European Journal of Government and Economics, 6(1), 78-101. https://doi.org/10.17979/ejge.2017.6.1.4324
Campbell, J. Y., & Ammer, J. (1993). What moves the stock and bond markets? A variance decomposition for long‐term asset returns. The Journal of Finance, 48(1), 3-37. https://doi.org/10.1111/j.1540-6261.1993.tb04700.x
Caporale, G. M., & Spagnolo, N. (2003). Asset prices and output growth volatility: the effects of financial crises. Economics Letters, 79(1), 69-74. https://doi.org/10.1016/S0165-1765(02)00289-6
Central Bank of Sri Lanka. (2019). Payments and Settlements Systems, Retrieved from https://www.cbsl.gov.lk/en/financial-system/financial-infrastructure/payments-and-settlements-systems>
Chang, C. H., & Lin, S. J. (2015). The effects of national culture and behavioral pitfalls on investors' decision-making: Herding behavior in international stock markets. International Review of Economics & Finance, 37, 380-392. https://doi.org/10.1016/j.iref.2014.12.010
Chau, F., Deesomsak, R., & Wang, J. (2014). Political uncertainty and stock market volatility in the Middle East and North African (MENA) countries. Journal of International Financial Markets, Institutions and Money, 28, 1-19. https://doi.org/10.1016/j.intfin.2013.10.008
De Long, J. B., Shleifer, A., Summers, L. H., & Waldmann, R. J. (1990). Positive feedback investment strategies and destabilizing rational speculation. The Journal of Finance, 45(2), 379-395. https://doi.org/10.2307/2328662
Fleischer, P. (2003). Volatility and information linkages across markets and countries. Australian Journal of Management, 28(3), 251-272. https://doi.org/10.1177/031289620302800302
Is Capital Market Integration among the SAARC Countries Feasible? An Empirical Study
EJBE 2020, 13(25) Page |35
Fleming, J., Kirby, C., & Ostdiek, B. (1998). Information and volatility linkages in the stock, bond, and money markets. Journal of Financial Economics, 49(1), 111-137. https://doi.org/10.1016/S0304-405X(98)00019-1
Gupta, R., & Donleavy, G. D. (2009). Benefits of diversifying investments into emerging markets with time-varying correlations: An Australian perspective. Journal of Multinational Financial Management, 19(2), 160-177. https://doi.org/10.1016/j.mulfin.2008.10.001
Irfan, C. M., Nishat, M., & Sharif, H. (2002). Key Fundamental Factors and Long-run Price Changes in an Emerging Market—A Case Study of Karachi Stock Exchange (KSE) [with Comments]. The Pakistan Development Review, 517-533. https://doi.org/10.30541/v41i4IIpp.517-533
Jaffe, J., & Westerfield, R. (1985). The week‐end effect in common stock returns: The international evidence. The Journal of Finance, 40(2), 433-454. https://doi.org/10.1111/j.1540-6261.1985.tb04966.x
Jorion, P., & Goetzmann, W. N. (1999). Global stock markets in the twentieth century. The Journal of Finance, 54(3), 953-980. https://doi.org/10.1111/0022-1082.00133
Junior, L., Mullokandov, A., & Kenett, D. (2015). Dependency relations among international stock market indices. Journal of Risk and Financial Management, 8(2), 227-265. https://doi.org/10.3390/jrfm8020227
Leon, C., & Filis, G. (2008). Cyclical fluctuations and transmission mechanisms of the GDP, investment and stock exchange in Greece evidence from spectral and VAR analysis. Journal of Money, Investment and Banking, 6(5), 54-65.
Miljković, I. B. (2018). Economic Cooperation between Serbia and the Member States of the Eurasian Economic Union: Constraints and Potentials. Eurasian Journal of Business and Economics, 11(22), 105-121. https://doi.org/10.17015/ejbe.2018.022.05
Piñeiro‐Chousa, J., Vizcaíno‐González, M., & Pérez‐Pico, A. M. (2017). Influence of social media over the stock market. Psychology & Marketing, 34(1), 101-108. https://doi.org/10.1002/mar.20976
Pretorius, E. (2002). Economic determinants of emerging stock market interdependence. Emerging Markets Review, 3(1), 84-105. https://doi.org/10.1016/S1566-0141(01)00032-2
Romero-Torres, J., Wells, S., & Selwyn-Khan, S. (2013). Development of capital markets in member countries of the South Asian Association for Regional Cooperation, Asian Development Bank.
Rozeff, M. S. (1974). Money and stock prices: Market efficiency and the lag in effect of monetary policy. Journal of Financial Economics, 1(3), 245-302. https://doi.org/10.1016/0304-405X(74)90020-8
Sabri, N. R. (2002). Increasing linkages of stock markets and price volatility. Financial Risk and Financial Risk Management, 16, 349-373.
Emon Kalyan CHOWDHURY
Page |36 EJBE 2020, 13(25)
Schuppli, M., & Bohl, M. T. (2010). Do foreign institutional investors destabilize China’s A-share markets? Journal of International Financial Markets, Institutions and Money, 20(1), 36-50. https://doi.org/10.1016/j.intfin.2009.10.004
Shonchoy, A., & Tsubota, K. (2016). Economic impact of political protests (strikes) on manufacturing firms: evidence from Bangladesh, MPRA Paper No. 74146.
Ülkü, N., & Baker, S. (2014). Country world betas: The link between the stock market beta and macroeconomic beta. Finance Research Letters, 11(1), 36-46. https://doi.org/10.1016/j.frl.2013.07.002
Related Documents