HOW MANY CURRENCIES IN SAARC COUNTRIES? A MULTIVARIATE STRUCTURAL VAR APPROACH Md. Abdur Rahman Forhad* Dhaka University of Engineering and Technology, Bangladesh ABSTRACT This paper examines whether or not the South Asian Association Regional Cooperation (SAARC), can introduce a single currency across the region. A four-variable structural vector autoregressive (SVAR) model is used to identify the underlying shocks and to examine the correlation in shocks for a specified sample period of 1974-2010. The results show asymmetric correlations among domestic shocks, which do not suggest forming a common currency area across the region. The paper also finds lower factor mobility; lower degree of intra-regional trades, and lack of political cooperation, suggesting the SAARC countries are not yet ready to introduce a common currency. JEL Classifications: E52, E58, E59, F15 Keywords: SAARC, common currency, SVAR Corresponding Author’s Email Address: [email protected] INTRODUCTION The South Asian Association of Regional Cooperation (SAARC) is a regional group of countries in South Asia, established in 1985. The seven founding member countries are Bangladesh, Bhutan, India, Maldives, Nepal, Pakistan, and Sri Lanka. Afghanistan joined SAARC in 2007. The SAARC member countries comprise almost 5.13 million square kilometers, which is almost 4% of the total world surface area. About 1,567.72 million people, which is 23% of the world population live in the SAARC countries. The objectives of SAARC include promotion of socioeconomic development within the South Asian countries. One of the objectives of the formation of SAARC was to develop a cooperative environment among the member countries. For instance, the Committee on Economic Corporation (CEC) formulates and monitors the programs to facilitate the intra- regional cooperation among the member countries, and the preferential trading area, SAARC Preferential Trading Arrangement (SAPTA) signed in 1993 promotes trade. This agreement was the crucial step towards trade liberalization and economic co-operation through the reduction of tariffs among the member countries. 1 Since 2006, the SAARC member countries also have a free trade area, South Asian Free Trade Area (SAFTA), whereby the member countries are committed to a ten year plan to taking out tariffs. 2 SAFTA would be fully implemented by the end of 2016. The ultimate objective of SAFTA is to form an economic union among these countries. One of the crucial objectives is to move towards more economic integration and ultimately towards a common currency in South Asia. This was emphasized by the Prime Minister of India, Mr. Atal Bihari Bajpayee, in the twelfth SAARC Summit held in Islamabad, Pakistan on 4-6 January, 2004. A common currency among a group of countries refers to the adoption of a single currency and common monetary and exchange rate policy. The adoption of a common currency also leads a single central bank replacing the existing central banks of the member countries. Mundell (1961), first introduced the concept of Optimal Currency Area (OCA), and asked the following question: under what conditions a common currency leads to have better economic integration among the member countries. Following Mundell’s (1961) work on OCA, numerous studies have been examined the feasibility of introducing a common currency in various groups of countries, including the European Union (EU), Association of Southeast Asian Nations (ASEAN), MERCOSUR (Argentina, Brazil, Paraguay, Uruguay, and Venezuela), North America (Canada, Mexico, and the United States), and Western Africa. Mundell (1961) argues that countries with positively correlated shocks are better candidates for forming a currency union. When a country joins in a currency union, it loses its own monetary policy as a policy instrument to respond to various kinds of shocks. If these shocks are symmetric (i.e., positively correlated) among the group of member countries, then it is feasible to form a monetary union, and implement a common monetary policy. However, if these shocks are imperfectly correlated, the member countries will not be able to implement a union-wide monetary policy that would be optimal for all the member countries. The South Asian Association of Regional Cooperation (SAARC) is a regional group of countries in South Asia, established in 1985, containing seven founding members Bangladesh, Bhutan, India, Maldives, Nepal, Pakistan, and Sri Lanka. Afghanistan joined SAARC in 2007. The SAARC member countries comprise almost 5.13 million square kilometers, which is almost 4% of the total world surface area. About 1,567.72 million people, which is 23% of the world population live in the SAARC countries. The population growth rate in South Asia is

Welcome message from author
This document is posted to help you gain knowledge. Please leave a comment to let me know what you think about it! Share it to your friends and learn new things together.
Transcript
HOW MANY CURRENCIES IN SAARC COUNTRIES? A
MULTIVARIATE STRUCTURAL VAR APPROACH
Md. Abdur Rahman Forhad*
Dhaka University of Engineering and Technology, Bangladesh
ABSTRACT
This paper examines whether or not the South Asian Association Regional Cooperation (SAARC), can introduce a single
currency across the region. A four-variable structural vector autoregressive (SVAR) model is used to identify the underlying
shocks and to examine the correlation in shocks for a specified sample period of 1974-2010. The results show asymmetric
correlations among domestic shocks, which do not suggest forming a common currency area across the region. The paper
also finds lower factor mobility; lower degree of intra-regional trades, and lack of political cooperation, suggesting the
SAARC countries are not yet ready to introduce a common currency.
JEL Classifications: E52, E58, E59, F15
Keywords: SAARC, common currency, SVAR
Corresponding Author’s Email Address: [email protected]
INTRODUCTION
The South Asian Association of Regional Cooperation (SAARC) is a regional group of countries in South Asia,
established in 1985. The seven founding member countries are Bangladesh, Bhutan, India, Maldives, Nepal,
Pakistan, and Sri Lanka. Afghanistan joined SAARC in 2007. The SAARC member countries comprise almost
5.13 million square kilometers, which is almost 4% of the total world surface area. About 1,567.72 million
people, which is 23% of the world population live in the SAARC countries. The objectives of SAARC include
promotion of socioeconomic development within the South Asian countries. One of the objectives of the
formation of SAARC was to develop a cooperative environment among the member countries. For instance, the
Committee on Economic Corporation (CEC) formulates and monitors the programs to facilitate the intra-
regional cooperation among the member countries, and the preferential trading area, SAARC Preferential
Trading Arrangement (SAPTA) signed in 1993 promotes trade. This agreement was the crucial step towards
trade liberalization and economic co-operation through the reduction of tariffs among the member countries.1
Since 2006, the SAARC member countries also have a free trade area, South Asian Free Trade Area (SAFTA),
whereby the member countries are committed to a ten year plan to taking out tariffs.2
SAFTA would be fully
implemented by the end of 2016. The ultimate objective of SAFTA is to form an economic union among these
countries. One of the crucial objectives is to move towards more economic integration and ultimately towards a
common currency in South Asia. This was emphasized by the Prime Minister of India, Mr. Atal Bihari
Bajpayee, in the twelfth SAARC Summit held in Islamabad, Pakistan on 4-6 January, 2004.
A common currency among a group of countries refers to the adoption of a single currency and
common monetary and exchange rate policy. The adoption of a common currency also leads a single central
bank replacing the existing central banks of the member countries. Mundell (1961), first introduced the concept
of Optimal Currency Area (OCA), and asked the following question: under what conditions a common currency
leads to have better economic integration among the member countries. Following Mundell’s (1961) work on
OCA, numerous studies have been examined the feasibility of introducing a common currency in various groups
of countries, including the European Union (EU), Association of Southeast Asian Nations (ASEAN),
MERCOSUR (Argentina, Brazil, Paraguay, Uruguay, and Venezuela), North America (Canada, Mexico, and the
United States), and Western Africa.
Mundell (1961) argues that countries with positively correlated shocks are better candidates for
forming a currency union. When a country joins in a currency union, it loses its own monetary policy as a policy
instrument to respond to various kinds of shocks. If these shocks are symmetric (i.e., positively correlated)
among the group of member countries, then it is feasible to form a monetary union, and implement a common
monetary policy. However, if these shocks are imperfectly correlated, the member countries will not be able to
implement a union-wide monetary policy that would be optimal for all the member countries.
The South Asian Association of Regional Cooperation (SAARC) is a regional group of countries in South Asia,
established in 1985, containing seven founding members Bangladesh, Bhutan, India, Maldives, Nepal, Pakistan,
and Sri Lanka. Afghanistan joined SAARC in 2007. The SAARC member countries comprise almost 5.13
million square kilometers, which is almost 4% of the total world surface area. About 1,567.72 million people,
which is 23% of the world population live in the SAARC countries. The population growth rate in South Asia is
higher than any other economic bloc as well as the average world population growth. The population density in
South Asia is 329 persons per km2, where the average population density is 52 persons per km2 in the world.
The objectives of SAARC include promotion of socio-economic development within the South Asian
countries. One of the objectives of the formation of SAARC was to develop a cooperative environment among
the member countries. For instance, the Committee on Economic Corporation (CEC) formulates and monitors
the programs to facilitate the intra-regional cooperation among the member countries, and the preferential
trading area, SAARC Preferential Trading Arrangement (SAPTA) signed in 1993 promotes trade. This
agreement was the crucial step towards trade liberalization and economic co-operation through the reduction of
tariffs among the member countries.1 Since 2006, the SAARC member countries also have a free trade area,
South Asian Free Trade Area (SAFTA), whereby the member countries are committed to a ten year plan to
taking out tariffs.2
SAFTA would be fully implemented by the end of 2016. The ultimate objective of SAFTA is
to form an economic union among these countries. One of the crucial objectives is to move towards more
economic integration and ultimately towards a common currency in South Asia. This was emphasized by the
Prime Minister of India, Mr. Atal Bihari Vajpayee, in the twelfth SAARC Summit held in Islamabad, Pakistan
on 4-6 January, 2004.
This study reviews the economic structures of the member countries, discusses the similarities of
economic indicators among the SAARC member countries, and examines the feasibility of a common currency
based on the correlation of the shocks among the SAARC member countries. This study uses a Structural Vector
Autoregressive (SVAR) model (Bayoumi and Eichengreen, 1992), which is an extension of the variance
decomposition method of Blanchard & Quah (1989). Bayoumi & Eichengreen (1992) use the SVAR model to
determine aggregate demand and supply shocks in the European Union (formerly known as European Economic
Community). They then compare the correlation of these shocks among the countries. This study incorporates
two additional shocks; external global supply shocks and regional supply shocks of each of the member
countries. Most of the SAARC economies are moderately open; total foreign trade of most of the countries is
40-50% of GDP, except Maldives and Bhutan where it is more than 100% of GDP.
Most SAARC economies are small (except India), and their exports go to other parts of the world
which make them susceptible to external shocks. Thus, incorporating external shocks in the model is relevant.
Regional shocks are also important for the potential member countries, especially for the small economies.
Since most of the SAARC member countries are small open economies (except India); the regional shocks
would have a significant impact on the feasibility assessment of OCA.
The objective is to determine whether the dominant shocks are country-specific and therefore
uncorrelated across the region. If this is the case, then the costs associated with a loss of monetary independence
and flexible exchange rate adjustments could be high (Chow & Kim, 2003). The rest of the paper is organized as
follows. The literature review of optimal currency area is presented in section 2. Section 3 discusses the
Structural VAR (SVAR) modeling for the assessment of optimal currency area and the data which are used in
the study. Section 4 discusses the descriptive statistics of the variables and the analysis of the empirical results
from the SVAR model, and interprets the results. Section 5 concludes.
OPTIMAL CURRENCY AREA: A BRIEF LITERATURE REVIEW
The theory of optimal currency area (OCA) was first developed by Mundell (1961), and later refined by
McKinnon (1963), Kenen (1973), Fleming (1971), Corden (1972), Ishiyama (1975), Tower & Willett (1976),
Bayoumi & Eichengreen (1992), Frankel and Rose (1996), Corsetti & Pesenti (2002), and De Grauwe (2007). In
the 1990s, the proposal of the European Economic and Monetary Union (EMU) generated large number of
empirical studies on monetary unions (for example, see Bayoumi and Eichengreen (1992), Clarida and Gali
(1994), Chadha and Hudson (1998), and Kenen (2000)). The empirical analysis of OCA seeks to assess why and
how the potential member countries could form a currency area by analyzing and comparing the criteria of OCA
(Mongelli 2002). Most empirical studies on OCA incorporate the degree of labor mobility among the potential
member countries, the existence of fiscal transfers, and the role of credit and capital markets in smoothing the
impact of region-specific shocks (Lafrance & St-Amant, 1999).
There is little empirical literature on the feasibility of a currency area among SAARC countries.
Maskay (2003) examines the correlation of various macroeconomic indicators among the SAARC countries and
checks the feasibility of a monetary integration across the region. He finds that most of the pair-wise
correlations of macroeconomic indicators between two SAARC member countries are statistically insignificant.
He also finds that the SAARC economies face asymmetric shocks and concludes that these countries are not
suitable candidates for a currency union. Rasheed and Ansari (2004) examine the feasibility of introducing a
common currency for Pakistan with its major trading partners; India, Bangladesh, Saudi Arabia and Sri Lanka
by using the Generalized-Purchasing Power Parity (G-PPP). They consider the real per capita income, trade
balance, terms of trade, volumes of trade, and bilateral real exchange rate with US dollar and Japanese Yen as
base currencies. They find that the business cycles measured by output and unemployment among Pakistan,
Bangladesh and Sri Lanka are highly synchronized. However, the business cycles of Pakistan and India are
weakly synchronized. Saxena (2005) examines the criteria of OCA in South Asian countries following the
SVAR model of Bayoumi and Eichengreen (1992, 1994). She considers the demand and supply shocks and
finds that these shocks are highly correlated for most of the SAARC countries. Jayasuriya et al. (2005) evaluate
the performance of SAARC as a regional group of economic and political integration. They argue that it would
not be feasible to consider the highest level of monetary cooperation (i.e., a currency union). However, they
argue that a single SAARC currency would symbolize a major step towards a peaceful, stable and integrated
South Asia. Banik et al. (2009) investigate the feasibility of forming a common currency area in South Asian
countries by using a state space model with a stochastic trend. They find evidence for common trends in the
growth of industrial production for India, Bangladesh and Pakistan as these economies are similar in
composition, enhance considerable labor mobility, and bilateral trade. They conclude that these countries are
suitable candidates for forming an OCA.
The previous empirical studies did not discuss how the SAARC countries face the external global and
regional shocks as a common currency area. This study incorporates the external global and regional shocks to
investigate the feasibility of introducing a common currency across the region.
DATA AND METHODOLOGY
Methodology
Following Bayoumi and Eichengreen (1992) this study uses a four-variable Structural VAR (SVAR) model to
obtain the underlying shocks of the South Asian Association of Regional Cooperation (SAARC) member
countries. Economic variables of the SAARC countries can be explained using a Moving Average (MA)
representation as:
= + ∑ (1)
In matrix form it is,
(2)
where , representing the variables; the real world GDP excluding the SAARC
GDP ( ), the real SAARC GDP excluding the concerned member country’s GDP ( ), and domestic real
GDP ( ), and real effective exchange rates ( ) for each country. These variables are in the log difference
form. A is a coefficient matrix, representing the impulse response of the variables to the structural shocks.
The vector of structural shocks , consists of the external global supply shocks
( ), the regional supply shocks ( ), domestic supply shocks ( ), and exchange rate ( shocks
respectively. It is assumed that these shocks are serially uncorrelated, with a variance-covariance matrix
normalized to the identity matrix.
(3)
and
(4)
The system of equation 1 can be written as:
+
(5)
+
(6)
+
(7)
+
(8)
Therefore, we can write the equation 5 to 7 in a system as:
[
] [
]
[
]
(9)
As the vector of structural shocks, is unobservable, the system in equation 8 can’t estimate directly
because it is not possible to recover the estimates from a structural moving average model (Amisano & Gianini
1997). The equation 1 can be rewritten as a reduced Vector Autoregressive (VAR) model for as:
= (10)
where, B represents the estimated coefficients, is the vector of residuals. The equation 9 can be written as:
(11)
or, alternatively,
(12)
which can be written as:
(13)
where, , and the lead matrix of is, by construction, (Zhang et. at.,
2004) i.e., . So, by the comparison of equation 2 and 12, we can be written as:
, (14)
which implies that the vector of is linked to the structural shock vector by the coefficient matrix .
If is estimated, then the structural shocks of the model can be easily recovered. The variance- covariance
matrix, of the residuals as:
) = (15)
and
E( )= )
= (16)
..
or, alternatively
E ( ) =
= (17)
Combining the equations 2 and 12, it can be written as:
, (18)
such that
. (19)
Therefore, (20)
The equation 19 shows the relationship between the matrix of long term-term effects and equivalent matrix of
reduced-form shocks, which can be written for a VAR (1) process as:
, (21)
where the matrix of long run is effects of the structural shocks in equation 2; is the long run
coefficient matrix of the reduced-form in equation 12, and it is obtained from the reduced-form estimates.
From the equations 16 and 20, it can be written as:
, (22)
which suggest to identify by using a Cholosky-Decomposition of the left hand side that contains the
known elements. Thus the equation 20 allows us to recover the estimated as as is
known. The structural shocks can be derived as:
(23)
This methodology is used to estimate the global, regional, and domestic shocks for each member country. Then,
a pair-wise correlation matrix is computed for each type of shock to examine their symmetry across the SAARC
countries. The higher the correlation of shocks among the member countries, the more suitable the currency
union is (Blaszkiewicz & Wozniak, 2003; Soffer 2007). A positive correlation of supply shocks indicates that
countries would require a synchronous policy response (Saxena 2005).
Data
This study uses annual data for world GDP, regional GDP for each of the member country, the domestic GDP,
and real effective exchange rate for Bangladesh, Bhutan, India, Maldives, Nepal, Pakistan, and Sri Lanka during
the period 1974-2010.3
All data are from the World Development Indicators and is supplemented by
International Financial Statistics (IFS) via DataStream.4 The World GDP excludes the SAARC GDP. The
regional GDP excludes the GDP of that country from the SAARC GDP. To calculate the REER, trade relevant
data are collected from the Direction of Trade Statistics of IFS. The real effective exchange rate (REER) is
calculated by the following way. The weight for a partner country is calculated as the ratio of the trade volume
with the partner and the total trade volume with all the major partner countries. The bilateral nominal exchange
rate index of each country is transformed into real exchange rate index using the consumer price index (CPI) of
a member country and its trading partner country. Then the real effective exchange rate of each of the member
country is obtained by calculating the arithmetic weighted average value of the real exchange rate indices of
their domestic currency against the US dollar. The real effective exchange rate is converted into a single index
using 1974=100 as it is assumed the base year is 1974.
EMPIRICAL ANALYSIS
Descriptive Statistics
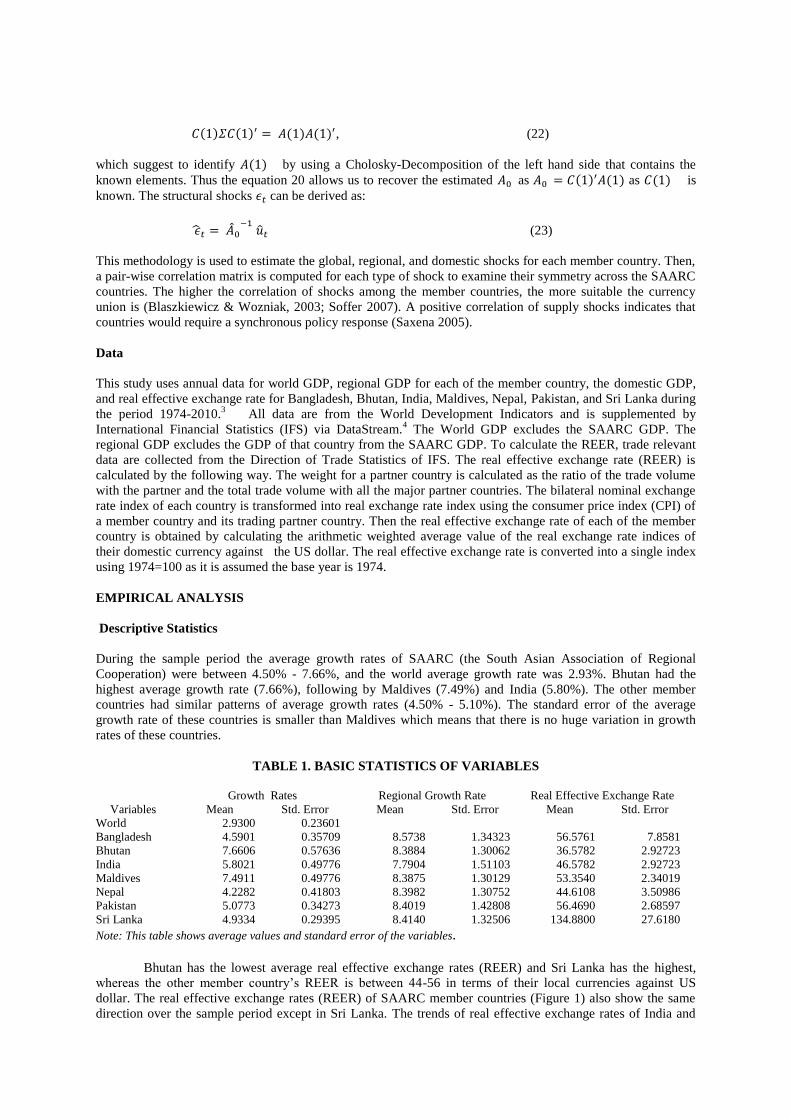
During the sample period the average growth rates of SAARC (the South Asian Association of Regional
Cooperation) were between 4.50% - 7.66%, and the world average growth rate was 2.93%. Bhutan had the
highest average growth rate (7.66%), following by Maldives (7.49%) and India (5.80%). The other member
countries had similar patterns of average growth rates (4.50% - 5.10%). The standard error of the average
growth rate of these countries is smaller than Maldives which means that there is no huge variation in growth
rates of these countries.
TABLE 1. BASIC STATISTICS OF VARIABLES
Variables
Growth Rates Regional Growth Rate Real Effective Exchange Rate
Mean Std. Error Mean Std. Error Mean Std. Error
World 2.9300 0.23601
Bangladesh 4.5901 0.35709 8.5738 1.34323 56.5761 7.8581
Bhutan 7.6606 0.57636 8.3884 1.30062 36.5782 2.92723
India 5.8021 0.49776 7.7904 1.51103 46.5782 2.92723
Maldives 7.4911 0.49776 8.3875 1.30129 53.3540 2.34019
Nepal 4.2282 0.41803 8.3982 1.30752 44.6108 3.50986
Pakistan 5.0773 0.34273 8.4019 1.42808 56.4690 2.68597
Sri Lanka 4.9334 0.29395 8.4140 1.32506 134.8800 27.6180
Note: This table shows average values and standard error of the variables.
Bhutan has the lowest average real effective exchange rates (REER) and Sri Lanka has the highest,
whereas the other member country’s REER is between 44-56 in terms of their local currencies against US
dollar. The real effective exchange rates (REER) of SAARC member countries (Figure 1) also show the same
direction over the sample period except in Sri Lanka. The trends of real effective exchange rates of India and
Pakistan were almost similar until 1999, and then the Pakistani currency is highly depreciated compared to
Indian currency; see Figure 1. The nominal exchange rate of these two countries also show the almost similar
patterns before 2000 (Khawaja 2007; Butt & Bandara, 2009), and then the State Bank of Pakistan depreciates its
currency to gain the competitiveness in international trades (Abbas 2010). Abbas (2010) also finds that the
Pakistani Rupee depreciated by more than 23% against US dollar in 2008 compared to 2007 because of its
political uncertainty, internal conflicts, and current account deficits.
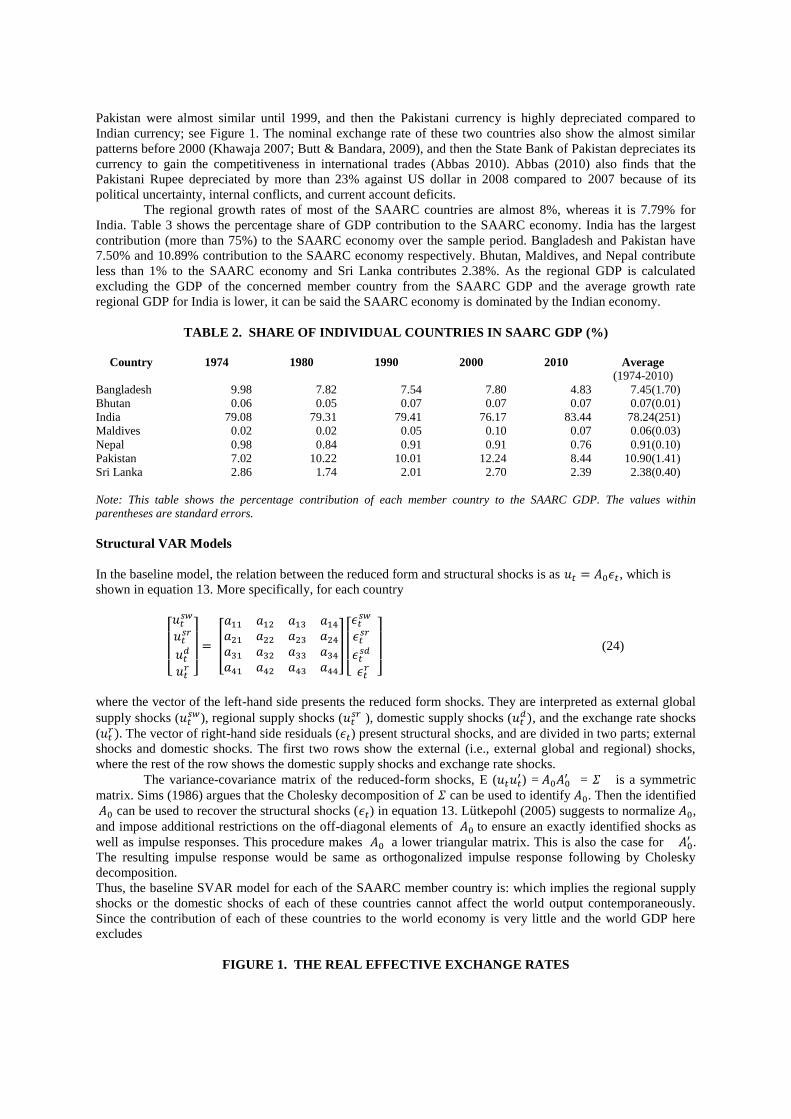
The regional growth rates of most of the SAARC countries are almost 8%, whereas it is 7.79% for
India. Table 3 shows the percentage share of GDP contribution to the SAARC economy. India has the largest
contribution (more than 75%) to the SAARC economy over the sample period. Bangladesh and Pakistan have
7.50% and 10.89% contribution to the SAARC economy respectively. Bhutan, Maldives, and Nepal contribute
less than 1% to the SAARC economy and Sri Lanka contributes 2.38%. As the regional GDP is calculated
excluding the GDP of the concerned member country from the SAARC GDP and the average growth rate
regional GDP for India is lower, it can be said the SAARC economy is dominated by the Indian economy.
TABLE 2. SHARE OF INDIVIDUAL COUNTRIES IN SAARC GDP (%)
Country 1974 1980 1990 2000 2010 Average
(1974-2010)
Bangladesh 9.98 7.82 7.54 7.80 4.83 7.45(1.70)
Bhutan 0.06 0.05 0.07 0.07 0.07 0.07(0.01)
India 79.08 79.31 79.41 76.17 83.44 78.24(251)
Maldives 0.02 0.02 0.05 0.10 0.07 0.06(0.03)
Nepal 0.98 0.84 0.91 0.91 0.76 0.91(0.10)
Pakistan 7.02 10.22 10.01 12.24 8.44 10.90(1.41)
Sri Lanka 2.86 1.74 2.01 2.70 2.39 2.38(0.40)
Note: This table shows the percentage contribution of each member country to the SAARC GDP. The values within
parentheses are standard errors.
Structural VAR Models
In the baseline model, the relation between the reduced form and structural shocks is as , which is
shown in equation 13. More specifically, for each country
[
]
[
]
[
]
(24)
where the vector of the left-hand side presents the reduced form shocks. They are interpreted as external global
supply shocks ( ), regional supply shocks (
), domestic supply shocks ( , and the exchange rate shocks
( The vector of right-hand side residuals ( ) present structural shocks, and are divided in two parts; external
shocks and domestic shocks. The first two rows show the external (i.e., external global and regional) shocks,
where the rest of the row shows the domestic supply shocks and exchange rate shocks.
The variance-covariance matrix of the reduced-form shocks, E ( ) =
= is a symmetric
matrix. Sims (1986) argues that the Cholesky decomposition of can be used to identify . Then the identified
can be used to recover the structural shocks ( ) in equation 13. L tkepohl (2005) suggests to normalize ,
and impose additional restrictions on the off-diagonal elements of to ensure an exactly identified shocks as
well as impulse responses. This procedure makes a lower triangular matrix. This is also the case for .
The resulting impulse response would be same as orthogonalized impulse response following by Cholesky
decomposition.
Thus, the baseline SVAR model for each of the SAARC member country is: which implies the regional supply
shocks or the domestic shocks of each of these countries cannot affect the world output contemporaneously.
Since the contribution of each of these countries to the world economy is very little and the world GDP here
excludes
FIGURE 1. THE REAL EFFECTIVE EXCHANGE RATES
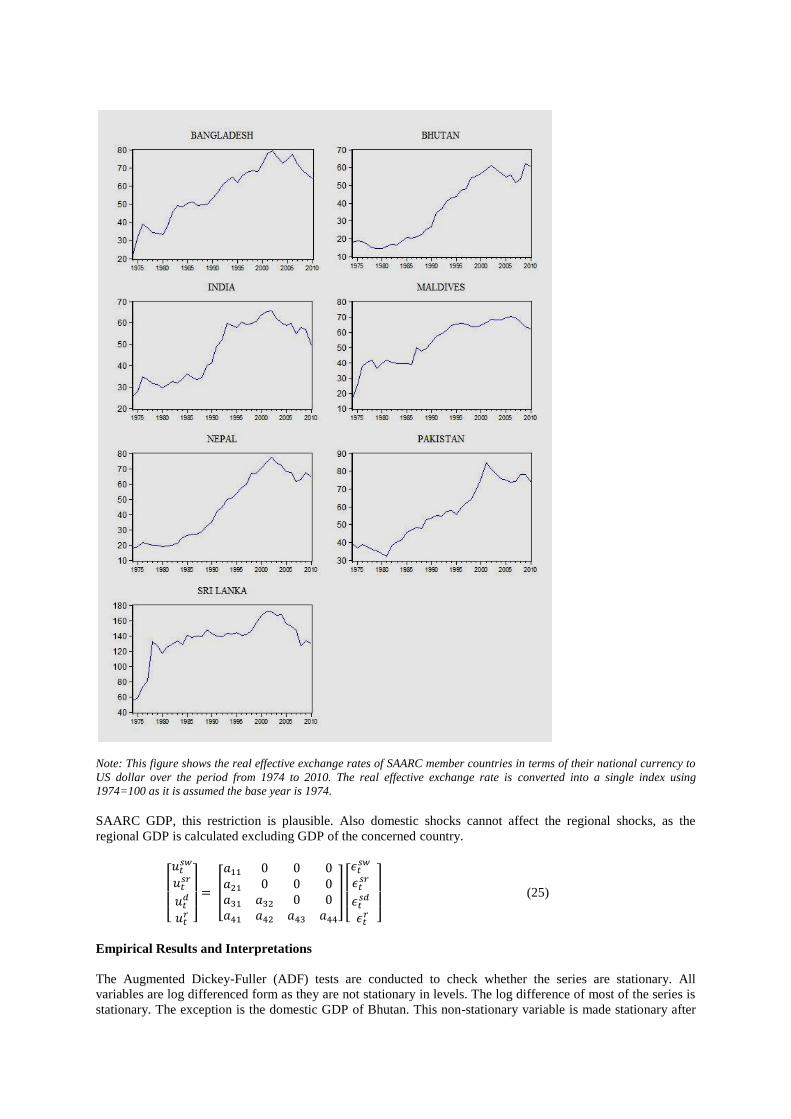
Note: This figure shows the real effective exchange rates of SAARC member countries in terms of their national currency to
US dollar over the period from 1974 to 2010. The real effective exchange rate is converted into a single index using
1974=100 as it is assumed the base year is 1974.
SAARC GDP, this restriction is plausible. Also domestic shocks cannot affect the regional shocks, as the
regional GDP is calculated excluding GDP of the concerned country.
[
]
[
]
[
]
(25)
Empirical Results and Interpretations
The Augmented Dickey-Fuller (ADF) tests are conducted to check whether the series are stationary. All
variables are log differenced form as they are not stationary in levels. The log difference of most of the series is
stationary. The exception is the domestic GDP of Bhutan. This non-stationary variable is made stationary after
taking first difference. In the following section the estimation of underlying structural shocks,
4 and how these
shocks are related among the SAARC member countries are reported.
Correlation of the Structural Shocks
To examine the degree of symmetry of the structural shocks among the SAARC member countries, this study
examines the correlation coefficients of the shocks; the external shocks (global and regional) and the domestic
supply shocks. The correlation coefficients that are positive and statistically significant correspond to symmetric
shocks, and the negative and statistically insignificant shocks correspond to asymmetric shocks. Pearson’s
correlation coefficient statistics is used to check whether the coefficients are statistically significant at 5% level.
The statistic,
√ is distributed as statistic with degree of freedom, ; where is the
coefficient of correlation, and is the number of observations. The null hypothesis is that the coefficient of
correlation is zero (i.e., ). The results for the three structural shocks are reported in Table 4 and 5. Table 3
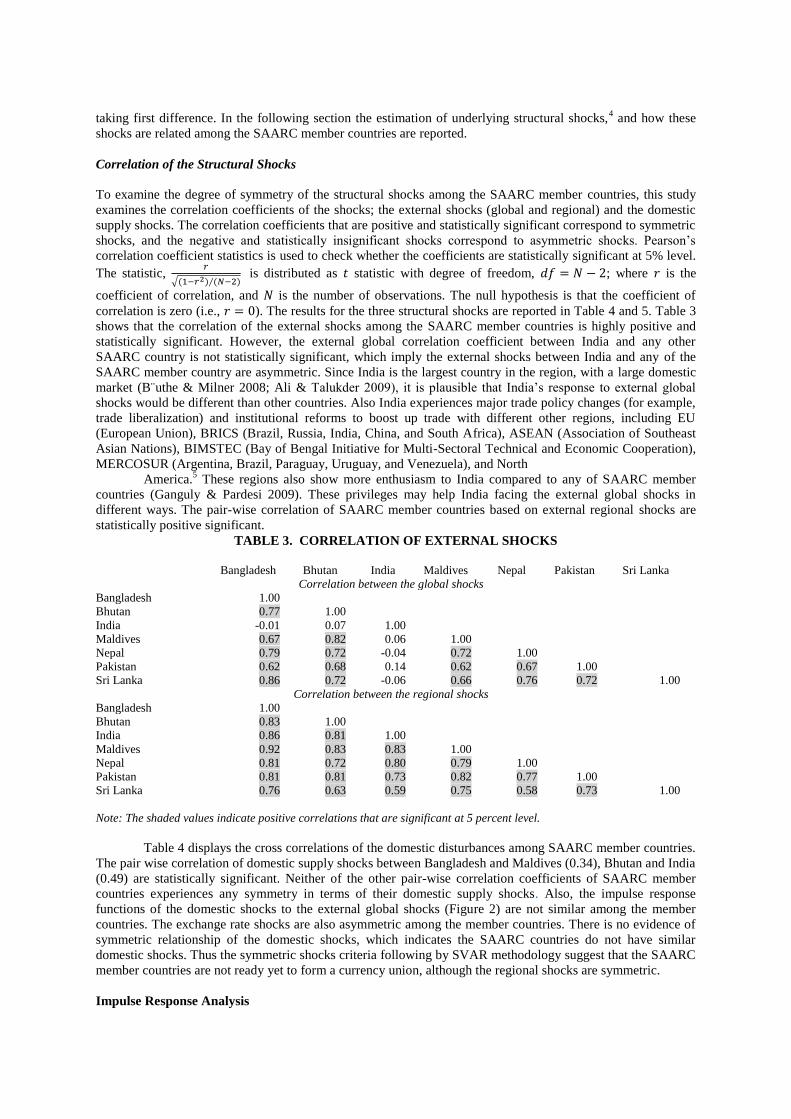
shows that the correlation of the external shocks among the SAARC member countries is highly positive and
statistically significant. However, the external global correlation coefficient between India and any other
SAARC country is not statistically significant, which imply the external shocks between India and any of the
SAARC member country are asymmetric. Since India is the largest country in the region, with a large domestic
market (B¨uthe & Milner 2008; Ali & Talukder 2009), it is plausible that India’s response to external global
shocks would be different than other countries. Also India experiences major trade policy changes (for example,
trade liberalization) and institutional reforms to boost up trade with different other regions, including EU
(European Union), BRICS (Brazil, Russia, India, China, and South Africa), ASEAN (Association of Southeast
Asian Nations), BIMSTEC (Bay of Bengal Initiative for Multi-Sectoral Technical and Economic Cooperation),
MERCOSUR (Argentina, Brazil, Paraguay, Uruguay, and Venezuela), and North
America.5 These regions also show more enthusiasm to India compared to any of SAARC member
countries (Ganguly & Pardesi 2009). These privileges may help India facing the external global shocks in
different ways. The pair-wise correlation of SAARC member countries based on external regional shocks are
statistically positive significant.
TABLE 3. CORRELATION OF EXTERNAL SHOCKS
Bangladesh Bhutan India Maldives Nepal Pakistan Sri Lanka
Correlation between the global shocks
Bangladesh 1.00
Bhutan 0.77 1.00
India -0.01 0.07 1.00
Maldives 0.67 0.82 0.06 1.00
Nepal 0.79 0.72 -0.04 0.72 1.00
Pakistan 0.62 0.68 0.14 0.62 0.67 1.00
Sri Lanka 0.86 0.72 -0.06 0.66 0.76 0.72 1.00
Correlation between the regional shocks
Bangladesh 1.00
Bhutan 0.83 1.00
India 0.86 0.81 1.00
Maldives 0.92 0.83 0.83 1.00
Nepal 0.81 0.72 0.80 0.79 1.00
Pakistan 0.81 0.81 0.73 0.82 0.77 1.00
Sri Lanka 0.76 0.63 0.59 0.75 0.58 0.73 1.00
Note: The shaded values indicate positive correlations that are significant at 5 percent level.
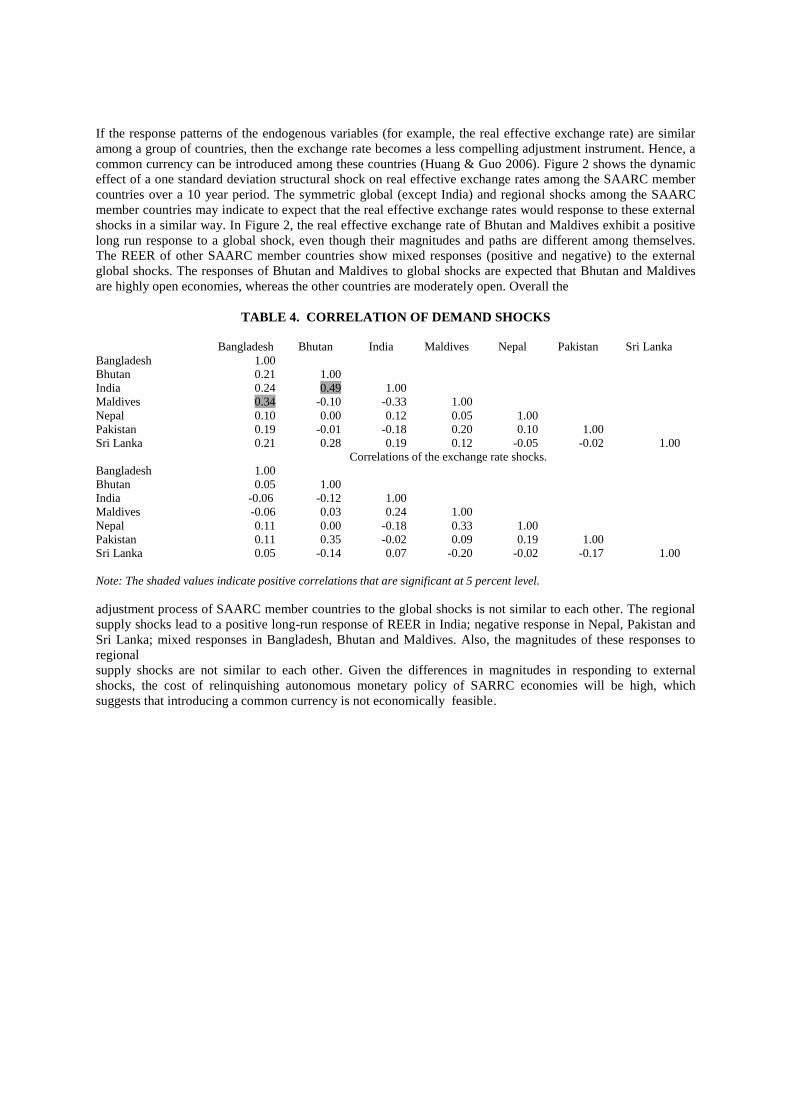
Table 4 displays the cross correlations of the domestic disturbances among SAARC member countries.
The pair wise correlation of domestic supply shocks between Bangladesh and Maldives (0.34), Bhutan and India
(0.49) are statistically significant. Neither of the other pair-wise correlation coefficients of SAARC member
countries experiences any symmetry in terms of their domestic supply shocks. Also, the impulse response
functions of the domestic shocks to the external global shocks (Figure 2) are not similar among the member
countries. The exchange rate shocks are also asymmetric among the member countries. There is no evidence of
symmetric relationship of the domestic shocks, which indicates the SAARC countries do not have similar
domestic shocks. Thus the symmetric shocks criteria following by SVAR methodology suggest that the SAARC
member countries are not ready yet to form a currency union, although the regional shocks are symmetric.
Impulse Response Analysis
If the response patterns of the endogenous variables (for example, the real effective exchange rate) are similar
among a group of countries, then the exchange rate becomes a less compelling adjustment instrument. Hence, a
common currency can be introduced among these countries (Huang & Guo 2006). Figure 2 shows the dynamic
effect of a one standard deviation structural shock on real effective exchange rates among the SAARC member
countries over a 10 year period. The symmetric global (except India) and regional shocks among the SAARC
member countries may indicate to expect that the real effective exchange rates would response to these external
shocks in a similar way. In Figure 2, the real effective exchange rate of Bhutan and Maldives exhibit a positive
long run response to a global shock, even though their magnitudes and paths are different among themselves.
The REER of other SAARC member countries show mixed responses (positive and negative) to the external
global shocks. The responses of Bhutan and Maldives to global shocks are expected that Bhutan and Maldives
are highly open economies, whereas the other countries are moderately open. Overall the
TABLE 4. CORRELATION OF DEMAND SHOCKS
Bangladesh Bhutan India Maldives Nepal Pakistan Sri Lanka
Bangladesh 1.00
Bhutan 0.21 1.00
India 0.24 0.49 1.00
Maldives 0.34 -0.10 -0.33 1.00
Nepal 0.10 0.00 0.12 0.05 1.00
Pakistan 0.19 -0.01 -0.18 0.20 0.10 1.00
Sri Lanka 0.21 0.28 0.19 0.12 -0.05 -0.02 1.00
Correlations of the exchange rate shocks.
Bangladesh 1.00
Bhutan 0.05 1.00
India -0.06 -0.12 1.00
Maldives -0.06 0.03 0.24 1.00
Nepal 0.11 0.00 -0.18 0.33 1.00
Pakistan 0.11 0.35 -0.02 0.09 0.19 1.00
Sri Lanka 0.05 -0.14 0.07 -0.20 -0.02 -0.17 1.00
Note: The shaded values indicate positive correlations that are significant at 5 percent level.
adjustment process of SAARC member countries to the global shocks is not similar to each other. The regional
supply shocks lead to a positive long-run response of REER in India; negative response in Nepal, Pakistan and
Sri Lanka; mixed responses in Bangladesh, Bhutan and Maldives. Also, the magnitudes of these responses to
regional
supply shocks are not similar to each other. Given the differences in magnitudes in responding to external
shocks, the cost of relinquishing autonomous monetary policy of SARRC economies will be high, which
suggests that introducing a common currency is not economically feasible.
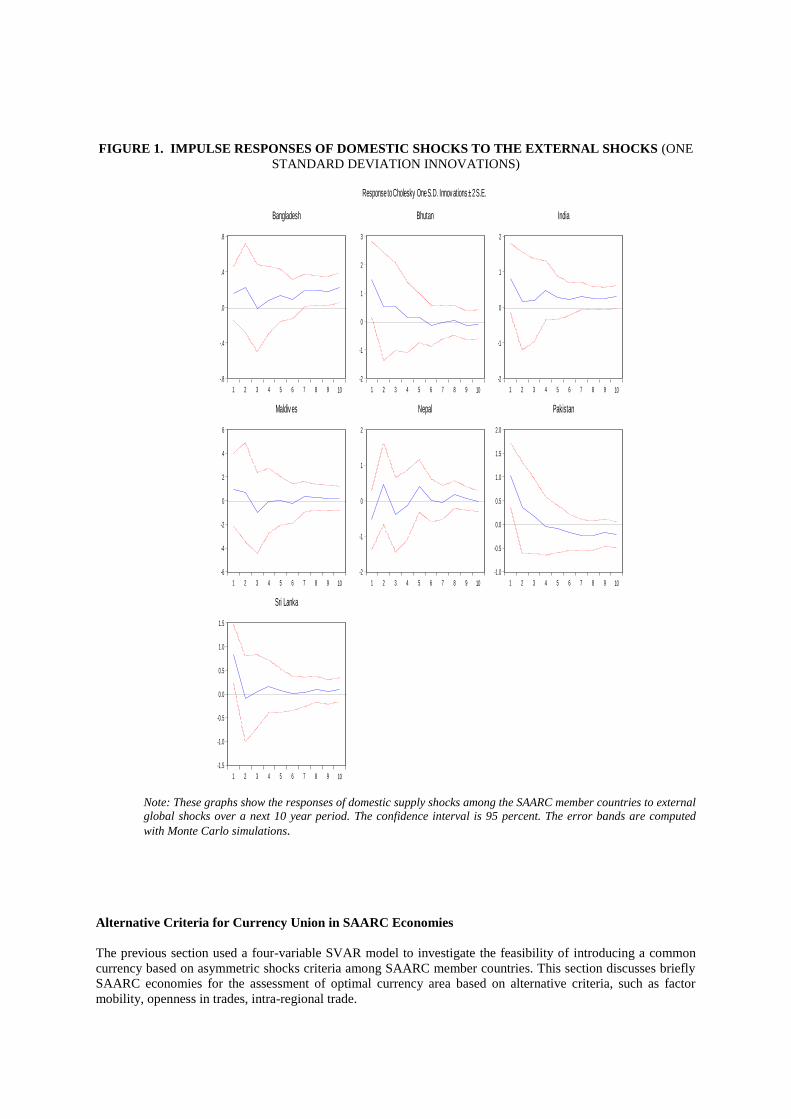
FIGURE 1. IMPULSE RESPONSES OF DOMESTIC SHOCKS TO THE EXTERNAL SHOCKS (ONE
STANDARD DEVIATION INNOVATIONS)
Note: These graphs show the responses of domestic supply shocks among the SAARC member countries to external
global shocks over a next 10 year period. The confidence interval is 95 percent. The error bands are computed
with Monte Carlo simulations.
Alternative Criteria for Currency Union in SAARC Economies
The previous section used a four-variable SVAR model to investigate the feasibility of introducing a common
currency based on asymmetric shocks criteria among SAARC member countries. This section discusses briefly
SAARC economies for the assessment of optimal currency area based on alternative criteria, such as factor
mobility, openness in trades, intra-regional trade.
-.8
-.4
.0
.4
.8
1 2 3 4 5 6 7 8 9 10
Bangladesh
-2
-1
0
1
2
3
1 2 3 4 5 6 7 8 9 10
Bhutan
-2
-1
0
1
2
1 2 3 4 5 6 7 8 9 10
India
-6
-4
-2
0
2
4
6
1 2 3 4 5 6 7 8 9 10
Maldiv es
-2
-1
0
1
2
1 2 3 4 5 6 7 8 9 10
Nepal
-1.0
-0.5
0.0
0.5
1.0
1.5
2.0
1 2 3 4 5 6 7 8 9 10
Pakistan
-1.5
-1.0
-0.5
0.0
0.5
1.0
1.5
1 2 3 4 5 6 7 8 9 10
Sri Lanka
Response to Cholesky One S.D. Innovations ± 2 S.E.
Labor mobility is one of the most important criteria for OCA as it helps the potential member countries
of a monetary union to adjust to asymmetric shocks by allowing labor mobility. There is very little evidence of
labor mobility between India and Pakistan; perfect labor mobility between India and Nepal (Saxena 2005).
However, most SAARC countries restrict labor mobility among themselves (Ali, 1995; Dubey 2005), which
suggests that the amount of labor movement among these countries is not significant for assessing OCA criteria,
see also (Saxena 2005). In addition, there are no reliable data on labor movement among SAARC countries.
Capital mobility could be another criterion for the assessment of OCA as capital is assumed to be perfectly
mobile. Mundell (1961) argues that perfect capital mobility can substitute labor mobility among the member
countries of a currency union, thereby easing the burden of symmetric policy responses to shocks when labor is
not perfectly mobile across the member countries. Most of SAARC member countries adopted various industrial
policies to attract foreign direct investment (FDI) resulting an increase net inflow of capitals during the past
decades, see Table 5. The intra-regional investment of SAARC economies is very low (1% of the total
investment) compared to other group of countries.
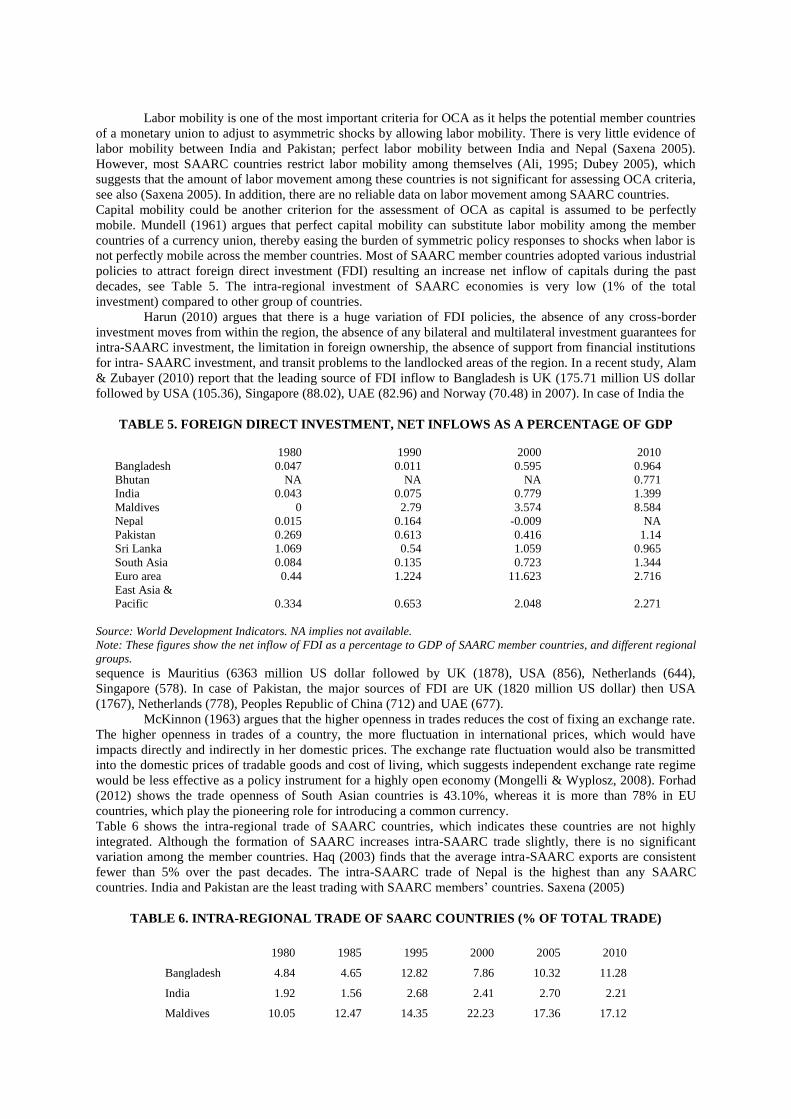
Harun (2010) argues that there is a huge variation of FDI policies, the absence of any cross-border
investment moves from within the region, the absence of any bilateral and multilateral investment guarantees for
intra-SAARC investment, the limitation in foreign ownership, the absence of support from financial institutions
for intra- SAARC investment, and transit problems to the landlocked areas of the region. In a recent study, Alam
& Zubayer (2010) report that the leading source of FDI inflow to Bangladesh is UK (175.71 million US dollar
followed by USA (105.36), Singapore (88.02), UAE (82.96) and Norway (70.48) in 2007). In case of India the
TABLE 5. FOREIGN DIRECT INVESTMENT, NET INFLOWS AS A PERCENTAGE OF GDP
1980 1990 2000 2010
Bangladesh 0.047 0.011 0.595 0.964
Bhutan NA NA NA 0.771
India 0.043 0.075 0.779 1.399
Maldives 0 2.79 3.574 8.584
Nepal 0.015 0.164 -0.009 NA
Pakistan 0.269 0.613 0.416 1.14
Sri Lanka 1.069 0.54 1.059 0.965
South Asia 0.084 0.135 0.723 1.344
Euro area 0.44 1.224 11.623 2.716
East Asia &
Pacific 0.334 0.653 2.048 2.271
Source: World Development Indicators. NA implies not available.
Note: These figures show the net inflow of FDI as a percentage to GDP of SAARC member countries, and different regional
groups.
sequence is Mauritius (6363 million US dollar followed by UK (1878), USA (856), Netherlands (644),
Singapore (578). In case of Pakistan, the major sources of FDI are UK (1820 million US dollar) then USA
(1767), Netherlands (778), Peoples Republic of China (712) and UAE (677).
McKinnon (1963) argues that the higher openness in trades reduces the cost of fixing an exchange rate.
The higher openness in trades of a country, the more fluctuation in international prices, which would have
impacts directly and indirectly in her domestic prices. The exchange rate fluctuation would also be transmitted
into the domestic prices of tradable goods and cost of living, which suggests independent exchange rate regime
would be less effective as a policy instrument for a highly open economy (Mongelli & Wyplosz, 2008). Forhad
(2012) shows the trade openness of South Asian countries is 43.10%, whereas it is more than 78% in EU
countries, which play the pioneering role for introducing a common currency.
Table 6 shows the intra-regional trade of SAARC countries, which indicates these countries are not highly
integrated. Although the formation of SAARC increases intra-SAARC trade slightly, there is no significant
variation among the member countries. Haq (2003) finds that the average intra-SAARC exports are consistent
fewer than 5% over the past decades. The intra-SAARC trade of Nepal is the highest than any SAARC
countries. India and Pakistan are the least trading with SAARC members’ countries. Saxena (2005)
TABLE 6. INTRA-REGIONAL TRADE OF SAARC COUNTRIES (% OF TOTAL TRADE)
1980 1985 1995 2000 2005 2010
Bangladesh 4.84 4.65 12.82 7.86 10.32 11.28
India 1.92 1.56 2.68 2.41 2.70 2.21
Maldives 10.05 12.47 14.35 22.23 17.36 17.12
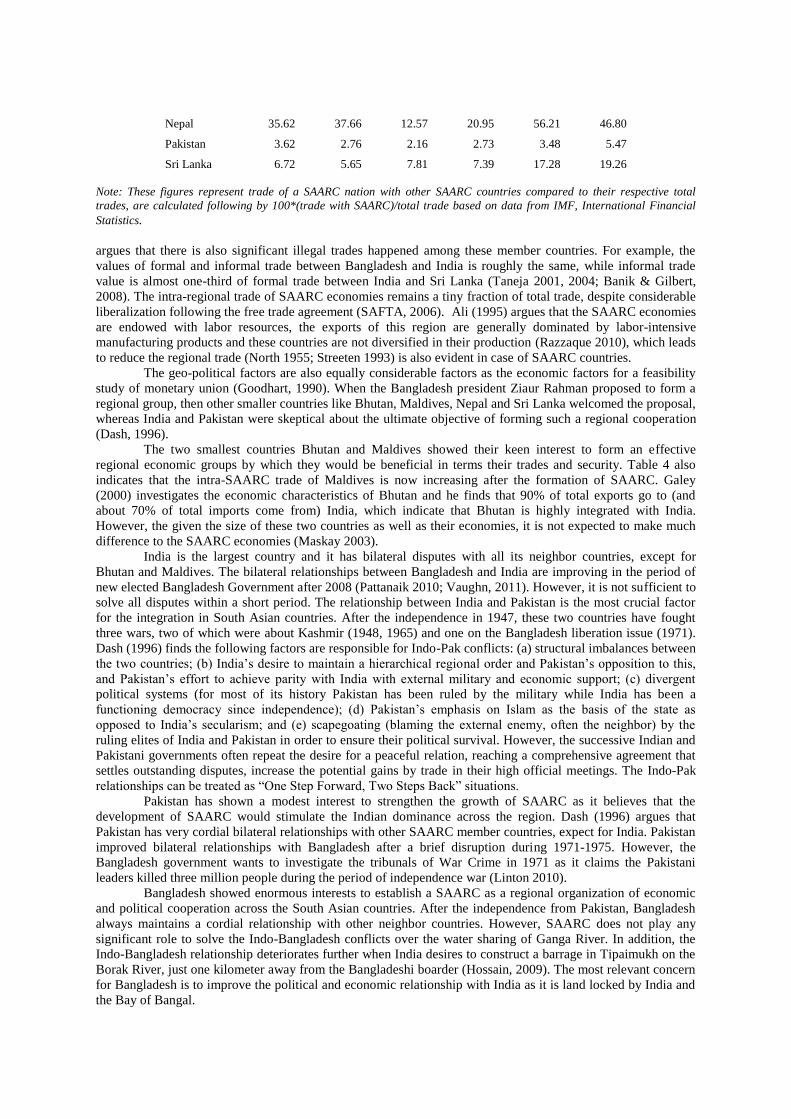
Nepal 35.62 37.66 12.57 20.95 56.21 46.80
Pakistan 3.62 2.76 2.16 2.73 3.48 5.47
Sri Lanka 6.72 5.65 7.81 7.39 17.28 19.26
Note: These figures represent trade of a SAARC nation with other SAARC countries compared to their respective total
trades, are calculated following by 100*(trade with SAARC)/total trade based on data from IMF, International Financial
Statistics.
argues that there is also significant illegal trades happened among these member countries. For example, the
values of formal and informal trade between Bangladesh and India is roughly the same, while informal trade
value is almost one-third of formal trade between India and Sri Lanka (Taneja 2001, 2004; Banik & Gilbert,
2008). The intra-regional trade of SAARC economies remains a tiny fraction of total trade, despite considerable
liberalization following the free trade agreement (SAFTA, 2006). Ali (1995) argues that the SAARC economies
are endowed with labor resources, the exports of this region are generally dominated by labor-intensive
manufacturing products and these countries are not diversified in their production (Razzaque 2010), which leads
to reduce the regional trade (North 1955; Streeten 1993) is also evident in case of SAARC countries.
The geo-political factors are also equally considerable factors as the economic factors for a feasibility
study of monetary union (Goodhart, 1990). When the Bangladesh president Ziaur Rahman proposed to form a
regional group, then other smaller countries like Bhutan, Maldives, Nepal and Sri Lanka welcomed the proposal,
whereas India and Pakistan were skeptical about the ultimate objective of forming such a regional cooperation
(Dash, 1996).
The two smallest countries Bhutan and Maldives showed their keen interest to form an effective
regional economic groups by which they would be beneficial in terms their trades and security. Table 4 also
indicates that the intra-SAARC trade of Maldives is now increasing after the formation of SAARC. Galey
(2000) investigates the economic characteristics of Bhutan and he finds that 90% of total exports go to (and
about 70% of total imports come from) India, which indicate that Bhutan is highly integrated with India.
However, the given the size of these two countries as well as their economies, it is not expected to make much
difference to the SAARC economies (Maskay 2003).
India is the largest country and it has bilateral disputes with all its neighbor countries, except for
Bhutan and Maldives. The bilateral relationships between Bangladesh and India are improving in the period of
new elected Bangladesh Government after 2008 (Pattanaik 2010; Vaughn, 2011). However, it is not sufficient to
solve all disputes within a short period. The relationship between India and Pakistan is the most crucial factor
for the integration in South Asian countries. After the independence in 1947, these two countries have fought
three wars, two of which were about Kashmir (1948, 1965) and one on the Bangladesh liberation issue (1971).
Dash (1996) finds the following factors are responsible for Indo-Pak conflicts: (a) structural imbalances between
the two countries; (b) India’s desire to maintain a hierarchical regional order and Pakistan’s opposition to this,
and Pakistan’s effort to achieve parity with India with external military and economic support; (c) divergent
political systems (for most of its history Pakistan has been ruled by the military while India has been a
functioning democracy since independence); (d) Pakistan’s emphasis on Islam as the basis of the state as
opposed to India’s secularism; and (e) scapegoating (blaming the external enemy, often the neighbor) by the
ruling elites of India and Pakistan in order to ensure their political survival. However, the successive Indian and
Pakistani governments often repeat the desire for a peaceful relation, reaching a comprehensive agreement that
settles outstanding disputes, increase the potential gains by trade in their high official meetings. The Indo-Pak
relationships can be treated as “One Step Forward, Two Steps Back” situations.
Pakistan has shown a modest interest to strengthen the growth of SAARC as it believes that the
development of SAARC would stimulate the Indian dominance across the region. Dash (1996) argues that
Pakistan has very cordial bilateral relationships with other SAARC member countries, expect for India. Pakistan
improved bilateral relationships with Bangladesh after a brief disruption during 1971-1975. However, the
Bangladesh government wants to investigate the tribunals of War Crime in 1971 as it claims the Pakistani
leaders killed three million people during the period of independence war (Linton 2010).
Bangladesh showed enormous interests to establish a SAARC as a regional organization of economic
and political cooperation across the South Asian countries. After the independence from Pakistan, Bangladesh
always maintains a cordial relationship with other neighbor countries. However, SAARC does not play any
significant role to solve the Indo-Bangladesh conflicts over the water sharing of Ganga River. In addition, the
Indo-Bangladesh relationship deteriorates further when India desires to construct a barrage in Tipaimukh on the
Borak River, just one kilometer away from the Bangladeshi boarder (Hossain, 2009). The most relevant concern
for Bangladesh is to improve the political and economic relationship with India as it is land locked by India and
the Bay of Bangal.
Nepal maintains a very cordial relationship with its neighbor, which brings unanimous support for
establishing the permanent secretariat of SAARC in Kathmandu. Dash (1996) argues that Nepal is highly
interested in a regional and economic cooperation in South Asia because of its desire to promote the security
through multilateral diplomacy, and to promote balanced interdependence as opposed to an absolute dependence
on India.
Sri Lanka is an island in the Indian Ocean, which does not have boarder with India. It shows interests
initially with Bangladesh and Nepal to form a regional economic group as it would like to maintain its
relationship with neighboring countries in two phases as: small state and large state relationship. Sri Lanka
realizes its geographical location; and the importance of its closest neighboring country, India which is superior
in size as well as economy, is interested to enhance its economic activities by forming a regional cooperation
under the SAARC framework (Dash, 1996). Sri Lanka signed several regional trade agreements (RTA’s),
including the South Asian Free Trade Agreement (SAFTA), the India-Sri Lanka Free Trade Agreement
(ISLFTA), and the Pakistan-Sri Lanka Free Trade Agreement (PSLFTA) which increase its intra-regional trade
over the last decade. Sri Lanka also shows its interest to join the Non-Aligned Movement (NAM), the Asia
Pacific Trade Agreement (APTA), and Association of Southeast Asian Nations (ASEAN).
The political cooperation among SAARC member countries remains limited after the formation of
SAARC, which is also evident in their intra-regional trade. The intra-regional exports of SAARC economies as
compared to other regional groups also remain very low and stagnant under 5%. Haq (2003) argues that the
trade flow within the SAARC region is not significant compared to the regional area. Table 5 also shows that
the intra-regional trade in South Asia is the lowest compared to other regional area. Despite SAPTA and the
SAFTA agreement, the intra-SAARC trade has been low. By 2008, there was no significant increase in the
intra-SAARC trade, which was lowest among other regional trade area. Jain and Singh (2009) argues that the
disparities of the market size could be responsible for the lower intra-SAARC trade. For example, Bhutan,
Maldives and Nepal cannot be a major exports destination of India and Pakistan.
CONCLUSIONS
Since the seminal work on OCA of Mundell (1961) & McKinnon (1963), most of the literatures have focused on
the following four inter-relationship among the potential the members that would impinge on the benefits of
adopting a common currency,8 namely: (i) the degree of labor mobility; (ii) the extent of intra-trade; (iii) the
natures of disturbances; and (iv) the risk-sharing mechanism, a federal fiscal system which ensure a regional
insurance to attenuate the impact of regional shocks on interregional income differentials.
This paper finds that the SAARC countries experience symmetric global (except in India) and regional
shocks. It also finds asymmetric domestic shocks among the member countries. This indicates that the SAARC
countries may be better off having independent monetary policy. This study concludes that given the symmetry
and magnitudes of external and domestic shocks, the SAARC countries are not yet to ready to introduce a
common currency across the region. In addition, the SAARC countries are moderately open, which is
susceptible to the policy makers to introduce a common currency across the region. The SAARC countries
signed and started to implement free trade agreements (SAPTA in 1995, and SAFTA in 2006) to increase their
mutual trades across the region. But the share of intra-regional trade among these countries has remained low
compared to the other regions. The lower degree of factor mobility, lack of political integration, lower degree of
intra-regional trade would also suggest that the desirability for a common currency is not feasible.
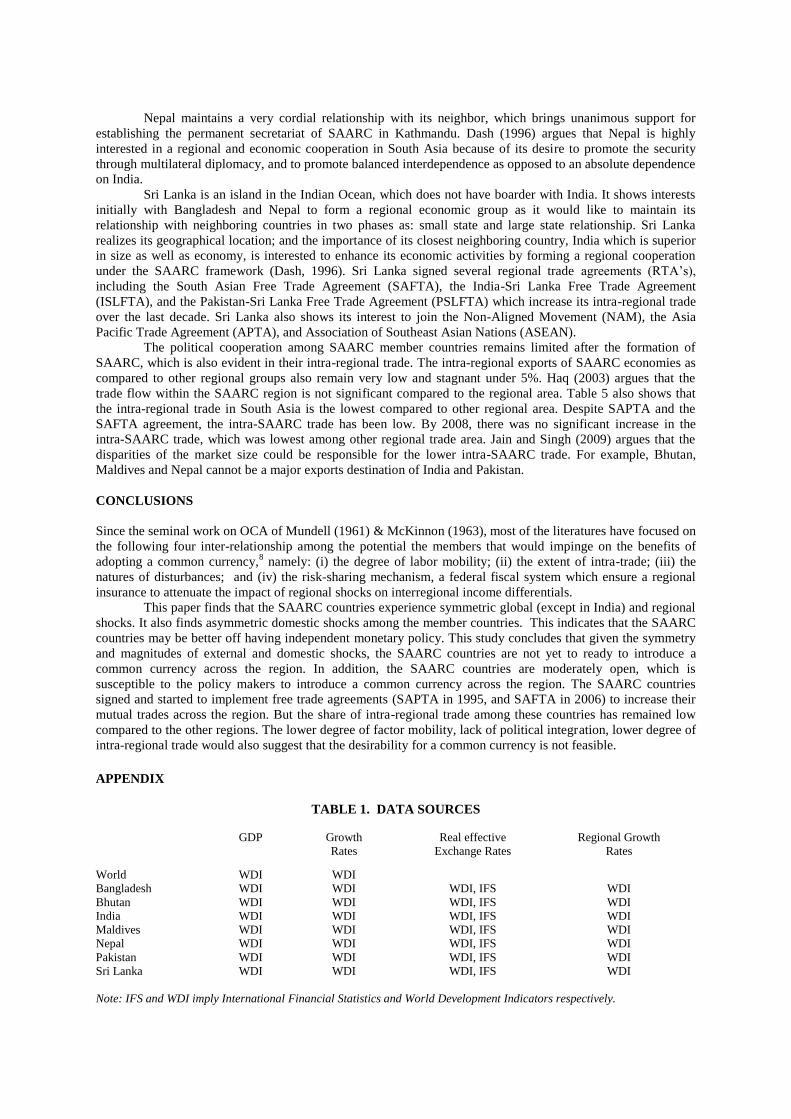
APPENDIX
TABLE 1. DATA SOURCES
GDP Growth
Rates
Real effective
Exchange Rates
Regional Growth
Rates
World WDI WDI
Bangladesh WDI WDI WDI, IFS WDI
Bhutan WDI WDI WDI, IFS WDI
India WDI WDI WDI, IFS WDI
Maldives WDI WDI WDI, IFS WDI
Nepal WDI WDI WDI, IFS WDI
Pakistan WDI WDI WDI, IFS WDI
Sri Lanka WDI WDI WDI, IFS WDI
Note: IFS and WDI imply International Financial Statistics and World Development Indicators respectively.
ENDNOTES
* Acknowledgement
I would to thank Kuan Xu, Talan Iscan, Brend Kempa, and Vu Tuan Khai for their continuous care and suggestions
throughout this working paper. I am also thankful to the anonymous referee for the useful comments. The remaining errors
are my own.
1 In November 1998, there were more than 5,000 tariffs lines out of total of 6,500 covered by this agreement. 2 The member countries are divided in two groups; least (LDCs) and non-least developed countries (NLDCs). India, Pakistan
and Sri Lanka are considered as LDCs, where the other members are considered as NLDCs. The decrease in tariffs would be
implemented in two phases. In the first phase, the NLDC’s would reduce the existing tariffs to 20% in two years from the
date of entry in the force of the agreement, whereas the LDC’s reduce the tariffs to 30% of the existing level during the same
of period of time. In the second phase, LDC’s will take another five more years (six more years for Sri Lanka) to reduce the
tariffs rates to 0-5%, where the NLDC’s will require eight more years. 3 This study excludes Afghanistan as it joins SAARC in 2007 and there is no stable economic history during the sample
period (Enterline and Greig, 2008). There is not a significant bilateral or multilateral trade relationship between any other
SAARC member country (except in Pakistan) and Afghanistan before joining in SAARC (Pandey and Dixit, 2009;
Weerakoon, 2010), although it is increasing now (Alam et al., 2011). Moreover, all the necessary data for Afghanistan are
not available during the sample period. 4 The detail sources for each country is given in Appendix 6. 5 The real effective exchange rate of Sri Lanka has become stronger after 2002. The probable reason is the peace agreement
between the Sri Lankan government and the rebel Tamil Tigers in 2002 (Schulenkorf, 2010), which ended a 19 years of
fighting. See also DeVotta (2011). In Sri Lanka, the average growth rates have been 4.60% (1974-2002) and
5.95% (2003-2010).
6 The estimation is undertaken in Eviews 7. 7 See, Aggarwal and Mukherji (2008); Henry (2008). 8 See Frankel and Rose (1996), Saxena (2005), Huang and Guo (2006).
REFERENCES (The following are examples only, please list only those cited in-text)
Holt, DH 1997, Management principles and practices of modern international business, law and accounting, Prentice Hall,
Sydney.
McCarthy, EJ, Willam, DP, and Pascale, GQ, 1997, Basic marketing and other aspects of organizational behavior and
understanding, Irwin, New York.
Milkman, R 1998, 'The new American workplace: high road or low road?' in Workplaces of the future, eds P Thompson & C
Warhurst, Macmillan Press, London, pp. 22-34.
Conley, TG & Galeson, DW 1998, 'Nativity and wealth in mid-nineteenth century cities’, Journal of Economic History, vol.
58, no. 2, pp. 468-493.
Jennings, P 1997, 'The performance and competitive advantage of small firms: a management perspective', International
Small Business Journal, vol. 15, no. 2, pp. 63-75. Available from: The University of Western Australia Library
Course Materials Online. [1 September 2004]. Improve indigenous housing now, government told, 2007.
Available from: <http://www.architecture.com.au/i-cms?page=10220>. [8 February 2009].
Related Documents