Snow Sports Trauma and Safety Irving S. Scher Richard M. Greenwald Nicola Petrone Editors Conference Proceedings of the International Society for Skiing Safety: 21st Volume

Welcome message from author
This document is posted to help you gain knowledge. Please leave a comment to let me know what you think about it! Share it to your friends and learn new things together.
Transcript
Snow Sports Trauma andSafety
Irving S. Scher Richard M. GreenwaldNicola Petrone Editors
Conference Proceedings of the International Society for Skiing Safety: 21st Volume
Snow Sports Trauma and Safety
Irving S. Scher • Richard M. Greenwald Nicola PetroneEditors
Snow Sports Trauma and SafetyConference Proceedings of the International Society for Skiing Safety: 21st Volume
ISBN 978-3-319-52754-3 ISBN 978-3-319-52755-0 (eBook)DOI 10.1007/978-3-319-52755-0
Library of Congress Control Number: 2017938285
© The Editor(s) (if applicable) and The Author(s) 2017. This book is an open access publication Open Access This book is distributed under the terms of the Creative Commons Attribution-Noncommercial 2.5 License (http://creativecommons.org/licenses/by-nc/2.5/) which permits any noncommercial use, distribution, and reproduction in any medium, provided the original author(s) and source are credited. The images or other third party material in this book are included in the work’s Creative Commons license, unless indicated otherwise in the credit line; if such material is not included in the work’s Creative Commons license and the respective action is not permitted by statutory regulation, users will need to obtain permission from the license holder to duplicate, adapt or reproduce the material.This work is subject to copyright. All commercial rights are reserved by the Publisher, whether the whole or part of the material is concerned, specifically the rights of translation, reprinting, reuse of illustrations, recitation, broadcasting, reproduction on microfilms or in any other physical way, and transmission or information storage and retrieval, electronic adaptation, computer software, or by similar or dissimilar methodology now known or hereafter developed.The use of general descriptive names, registered names, trademarks, service marks, etc. in this publication does not imply, even in the absence of a specific statement, that such names are exempt from the relevant protective laws and regulations and therefore free for general use.The publisher, the authors and the editors are safe to assume that the advice and information in this book are believed to be true and accurate at the date of publication. Neither the publisher nor the authors or the editors give a warranty, express or implied, with respect to the material contained herein or for any errors or omissions that may have been made. The publisher remains neutral with regard to jurisdictional claims in published maps and institutional affiliations.
Printed on acid-free paper
This Springer imprint is published by Springer NatureThe registered company is Springer International Publishing AGThe registered company address is: Gewerbestrasse 11, 6330 Cham, Switzerland
EditorsIrving S. ScherGuidance Engineering and Applied
ResearchSeattle, WA, USA
Applied Biomechanics LaboratoryUniversity of WashingtonSeattle, WA, USA
Nicola PetroneDepartment of Industrial EngineeringUniversity of PadovaVia Gradenigo, Padova, Italy
Richard M. GreenwaldThayer School of EngineeringDartmouth College, SimbexLebanon, NH, USA
v
Foreword
The International Congress on Ski Trauma and Safety is a biennial meeting of the International Society for Skiing Safety (ISSS), a community of physicians, engi-neers, and researchers from universities and technical institutions, skiing profes-sionals (including instructors, patrollers, and competitors), ski resort managers, lawyers, equipment manufacturers, and the general public that share the common mission of improving snow sport safety. The congress is their opportunity to update and report the state of the art of worldwide activities and researches that are oriented to the reduction of likelihood of injures. The 21st International Congress on Ski Trauma and Safety was held in San Vito di Cadore—Cortina d’Ampezzo, Italy, from 8 to 13 March 2015. This meeting was held in conjunction with the Winter School in Sports Engineering of the International Sports Engineering Association, as an opportunity to merge the activities of the members of both associations.
This collection of the papers is the 21st Volume of Snow Sport Trauma and Safety (formerly the Skiing Trauma and Safety published by ASTM International). The 16 papers in this volume were presented at the symposium and were subse-quently accepted for publication following rigorous peer review. This publication is supported by ASTM International Committee F27 on Snow Skiing.
The editors for this publication were Irving S. Scher, Ph.D., P.E., Principal at Guidance Engineering and Affiliate Scientist in the Applied Biomechanics Laboratory at the University of Washington, Seattle, Washington, USA; Richard M. Greenwald, Ph.D., President of Simbex, Lebanon, New Hampshire, USA, and Adjunct Professor, Thayer School of Engineering, Dartmouth College, Hanover, New Hampshire, USA; and Nicola Petrone, Ph.D., Department of Industrial Engineering, University of Padova, Italy.

vi
Peer Review Policy
Each paper published in this volume was evaluated by two peer reviewers. The authors addressed all the reviewers’ comments to the satisfaction of the technical editors. The quality of the papers in this publication reflects not only the obvious efforts of the authors and the technical editors but also the work of these peer reviewers. The editors acknowledge with appreciation their dedication and contri-bution of time and effort on behalf of ISSS.
Foreword
vii
Preface
The International Society for Skiing Safety (ISSS) was founded by Ejnar Eriksson, MD, of Stockholm, Sweden. After the first World Congress on Skiing Trauma and Safety that occurred in Riksgränsen, Sweden, in 1974, the ISSS was organized. The first official ISSS congress was held 3 years later in 1977 in the Sierra Nevada of Spain. After the 1977 meeting, the ISSS has held its congress every other year at or near a ski resort in many parts of the world. The congress has been held at the fol-lowing sites: Queenstown, New Zealand, in 1979; Bormio, Italy, in 1981; Keystone, Colorado, USA, in 1983; Naeba, Japan, in 1985; Chamonix, France, in 1987; Riksgränsen, Sweden, in 1989; Thredbo, Australia, in 1991; Zellam Zee, Austria, in 1993; Voss, Norway, in 1995; Whistler/Blackcomb, British Columbia, Canada, in 1997; Breuil Cervinia, Italy, in 1999; Queenstown, New Zealand, in 2001; St. Moritz/Pontresina, Switzerland, in 2003; Arai, Niigata, Japan, in 2005; Aviemore, Scotland, in 2007; Garmisch-Partenkirchen, Germany, in 2009; Keystone, Colorado, USA, in 2011; San Carlos de Bariloche, Argentina, in 2013; and Cortina-San Vito di Cadore, Italy, in 2015. The next congress will be held in Innsbruck, Austria, from 17 to 22 April 2017. The Chair, Secretary General, and Medical Head for this meet-ing will be Werner Nachbauer, Gerhard Ruedl, and Martin Burtscher.
The objective of the ISSS has been to bring together individuals from many pro-fessions to identify, evaluate, and discuss all aspects of safety concerning outdoor winter sports activities. This and previous volumes of Snow Sport Trauma and Safety (formerly the Skiing Trauma and Safety published by ASTM International) are excellent places to start if one wants to discover what is known about skiing injury and safety. These collections of peer-reviewed papers represent the most sig-nificant body of literature in the field. The articles presented in this book represent the effort and opinions of the authors based on their studies, investigations, and sometimes conjectures. It is important to note that many of these papers document research on topics under development. Each paper has been reviewed by peers of the author, meaning that the standard of the presentation and the technical work sup-porting the discussion are sufficiently high to merit presentation of the author’s work, conclusions, and opinions. Publication does not mean that the substance and conclusions represent the opinion of the reviewers, editors, or the ISSS. Most
viii
opinions and conclusions expressed in these papers should be expected to evolve and be clarified in future work.
Over 30 years ago, ski injury research was focused on reducing the incidence of tibia and fibula fractures and researchers believed that the design of releasable ski bindings was the key element to solving the injury problems in skiing. Snow sports and its equipment have changed significantly since that time. Other equipment (such as snowboards and alpine touring ski equipment), injuries (such as knee liga-ment tears and head injuries), and injury modes (such as landing from snow park jumps) have become the focus of attention. It is now recognized that the likelihood of injury is dependent on the combination of many factors, some of which not yet identified. While a reduction in the snow sport injury rates may be realized with equipment design, other factors may be just as likely to hold the key to this; factors described in the papers in this volume, such as skier behavior and race course equip-ment design, may be part of the solution. Though empirical evidence provided by injury statistics demonstrates progress in reducing the likelihood of some injuries, these same data show the need for continued attention to other injuries.
The state of the art presented in this collection of papers covers a short list of current topics in skiing research. Areas not covered include the following: national and international snow sport standards; release binding designs and adjustments; ski poles; energy management devices for collisions with fixed objects; snowboards, telemark skis, and other types of skis; helmet, goggle, and clothing design; injuries to the spine, femur, and head; competition safety practices and injuries; fatalities; and other winter sports injuries such as sunburns and hypothermia. There is no topic that has been solved completely and many are not represented in this volume. We urge all who are interested in snow sports safety to contribute to increasing our knowledge in these areas.
Preface
ix
Contents
Part I Epidemiology and Injury Assessment
Injury Trends in Recreational Skiers and Boarders in the 16-Year Period 1996–2012 ................................................................... 3Arne Ekeland, Andreas Rødven, and Stig Heir
New Zealand Snow Sports Injury Trends Over Five Winter Seasons 2010–2014 .......................................................................................... 17Brenda A. Costa-Scorse, Will G. Hopkins, John Cronin, and Eadric Bressel
Skiing and Snowboarding in Switzerland: Trends in Injury and Fatality Rates Over Time ........................................................................ 29Giannina Bianchi, Othmar Brügger, and Steffen Niemann
The Utility of Two National Injury Databases to Evaluate Snow-Sports Injuries in New Zealand .......................................................... 41Brenda Costa-Scorse, Will G. Hopkins, John Cronin, and Eadric Bressel
A Sport Concussion Assessment Tool (SCAT2) for Use in Snowsports: Can the Balance Component of the Tool Be Improved? ............................. 51G. Waddington, S. Trathen, T.J. Dickson, R. Adams, and A. Rumore
Part II Ski Bindings
Interactions of Tech Bindings with AT Boot Toe Inserts: Part I, Binding Toe-Piece Mechanics............................................................. 65Jeffrey R. Campbell, Irving S. Scher, David Carpenter, Bruce J. Jahnke, and Randal P. Ching
Interactions of Tech Bindings with AT Boot Toe Inserts: Part II Binding in Skiing Mode ..................................................................... 83Jeffrey R. Campbell, Irving S. Scher, David Carpenter, Bruce J. Jahnke, and Randal P. Ching
x
Special Design of Ski Plates May Improve Skiing Safety ............................ 95Matej Supej and Veit Senner
Self-Release of Ski Bindings: A Sex Comparison ......................................... 109Markus Posch, Gerhard Ruedl, Robert Eberle, and Martin Burtscher
Part III Impact Injury Mitigation
Computer Simulation of the Skier-Flex Pole Impact in Slalom ................. 121Kurt Schindelwig, Peter Kaps, and Werner Nachbauer
Sagittal Plane Helmet Acceleration at Pole Contact of Alpine Ski Racers is Dependent on Slalom Pole Type and Skill Level ................... 133Ronald W. Kipp and John G. Seifert
Auxetic Foam for Snow-Sport Safety Devices .............................................. 145Tom Allen, Olly Duncan, Leon Foster, Terry Senior, Davide Zampieri, Victor Edeh, and Andrew Alderson
Part IV Skier Behavior
Recorded Speed on Alpine Slopes: How to Interpret Skier’s Perception of Their Speed? ............................................................................ 163Nicolas Bailly, Sofiane Abouchiche, Catherine Masson, Thierry Donnadieu, and Pierre-Jean Arnoux
Snowsport Instructors: Their Actual Maximum Speeds, Their Estimation of Maximum Speed and Speed in Slow Zones, and Their Knowledge of Helmet Effectiveness ............................................. 175Tracey J. Dickson and F. Anne Terwiel
Factors Associated with Alcohol Intake in Mountain Top Huts Among Slope Tourers ...................................................................................... 189Anika Frühauf, Gerhard Ruedl, Christian Kickenweiz, Sepp Thöni, and Martin Kopp
To What Extent Do Attitudes Regarding Ski Helmets Change After a Period of Utilization? ......................................................................... 197Gerhard Ruedl, Elena Pocecco, Martin Niedermeier, Larissa Ledochowski, and Martin Kopp
Contents

Part IEpidemiology and Injury Assessment
3© The Author(s) 2017 I.S. Scher et al. (eds.), Snow Sports Trauma and Safety, DOI 10.1007/978-3-319-52755-0_1
Injury Trends in Recreational Skiers and Boarders in the 16-Year Period 1996–2012
Arne Ekeland, Andreas Rødven, and Stig Heir
Abstract Introduction: The Norwegian Ski Lift Association has since 1996 conducted a central registration of the injuries occurring in the major Norwegian ski resorts to survey the injury types. The aim of this study was to report injury trends in the period 1996–2012.
Material and methods: The injuries occurring in 7–16 Norwegian ski resorts were recorded by ski patrols during the 16 winter seasons 1996/1997–2011/2012 and related to a series of demographic factors. The number of skiing/boarder days was calculated from sold lift tickets (day cards), but these were only centrally recorded from the 2000/2001 season.
Results: A total of 55127 injured skiers and boarders were recorded. The injury rate dropped from 1.47 to 1.27 injuries per 1000 skier/boarder days (P < 0.001), and the skiing/boarding ability increased (P < 0.001) in the period 2000–2012. Most of the injuries occurred on groomed slopes, but an increasing number of injuries occurred in terrain parks, from only 4% in the 2000/2002 seasons to 24% in the last two seasons. More serious injuries (fractures and back injuries) were recorded in terrain parks than those occurring at other locations. Many of the injuries were simi-larly distributed among skiers and boarders, but alpine skiers suffered more lower extremity injuries, especially knee injuries (24%) compared to snowboarders (7%), whereas the reverse was observed for wrist injuries with 22% for snowboarders and 5% for alpine skiers in the last 2-year period (P < 0.001). The prevalence of knee injuries among alpine skiers has been about 25% in the period 1996–2012, but wrist injuries among snowboarders dropped from 29 to 22% (P < 0.001). The prevalence of knee injuries was twice as high for females (31%) as for males (15%), whereas the reverse was observed for shoulder injuries with 19% for males and 7% for females in the last 2-year period (P < 0.001). These differences have been observed during the whole period. Lower leg fracture for alpine skiers <13 years dropped from 20 to 13% in the period (P < 0.001), but has remained unchanged with about
A. Ekeland, M.D., Ph.D. (*) • S. Heir Orthopaedic Department, Martina Hansens Hospital, Box 823, N-1306 Sandvika, Norwaye-mail: [email protected]
A. Rødven Norwegian Ski Lift Association, Fridtjofs Nansens vei 19, N-0369 Oslo, Norway
4
4% for teenagers and adult skiers. Helmet use by injured skiers/boarders has increased from 11 to 81% in the period, and the prevalence of head injuries has dropped from 19 to 16% (P < 0.001).
Conclusion: The injury rate on Norwegian slopes dropped with 14% in the period 2000–2012. The prevalence of back injuries for injured snowboarders increased by 100% from 1996 to 2012, and this may be related to one-third of the injuries occurred in terrain parks at the end of the period. The prevalence of lower leg frac-ture in alpine children is declined by 35% in the period. Use of helmet by injured skiers/boarders increased from 11 to 81% and the prevalence of head injuries dropped with 16% during the same period.
Keywords Age • Gender • Helmets • Skiing • Skiing trauma • Skiing/boarding ability • Snowboarding • Telemarking • Tibial fractures
1 Introduction
Skiing has been a popular sport in the Nordic countries for more than a century [1], and snowboarding has gained increasing popularity during the last three decades. But skiing and boarding are not without risk, and it is important to perform epide-miological studies to identify risk factors. Most of the studies have been short-term covering 1–2 seasons [2–5], but several good long-term studies have been published from the USA and France [6–9].
The Norwegian Ski Lift Association has a central registry of the injuries occur-ring at the major Norwegian ski resorts since the season 1996/1997 [10–12]. The purpose of this study is to report the injury trends of skiing and boarding on Norwegian slopes in the 16-year period 1996/97–2011/12.
2 Material and Methods
The injuries occurring on the slopes of 7–16 major Norwegian ski resorts were recorded by ski patrols during the 16 winter seasons 1996/1997–2011/2012. These slopes accounted for about 50% of the ski lift transport in Norway during the regis-tration period. A skiing/boarding injury was defined as an injury sustained by a skier/boarder who was treated by or consulted the ski patrol after a skiing/boarding accident.
The injuries were related to the type of skiing/boarding, the type and site of acci-dent, age, and gender, skiing/boarding ability, use of protective helmet, physician or hospital treatment, and ambulance transport. Regarding skiing ability, the alpine skiers were classified by their performance of turns: expert (short turns), advanced skiers (parallel turns), intermediate skiers (stem turns), and beginners (plow turns) [13, 14]. The skill of snowboarders, telemarkers, and skiboarders was self- estimated.
A. Ekeland et al.
5
The number of skier/boarder days was calculated from sold lift tickets (day cards and season cards). The number of day cards was only recorded from the 2000/2001 season and onwards.
The results are presented as injury rates (number of injured skiers/boarders) per 1000 skier/boarder days, mean days between injuries (MDBI), and prevalences (per-centage of injured skiers and boarders in various groups). Differences were evalu-ated by Chi square and 2 × 2-table tests and considered significant when P < 0.05.
3 Results
3.1 Injury-Related Factors
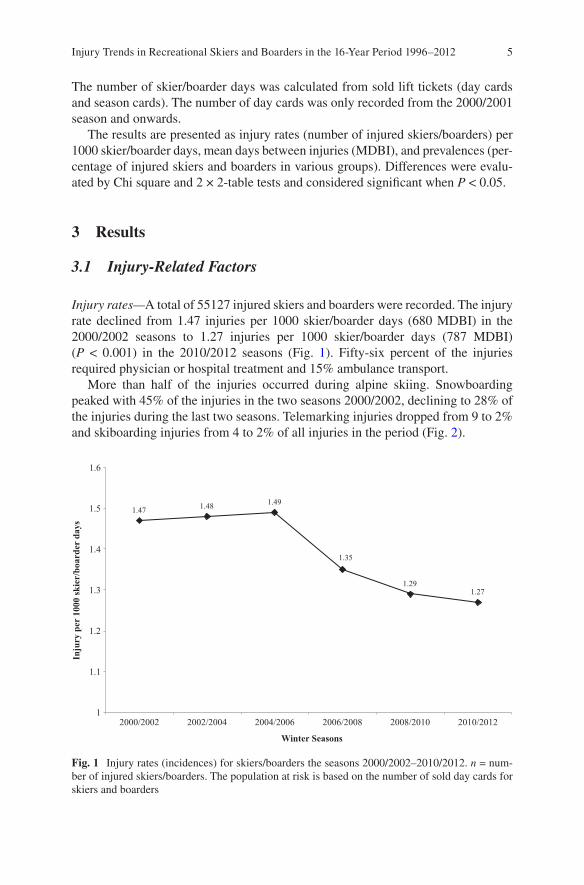
Injury rates—A total of 55127 injured skiers and boarders were recorded. The injury rate declined from 1.47 injuries per 1000 skier/boarder days (680 MDBI) in the 2000/2002 seasons to 1.27 injuries per 1000 skier/boarder days (787 MDBI) (P < 0.001) in the 2010/2012 seasons (Fig. 1). Fifty-six percent of the injuries required physician or hospital treatment and 15% ambulance transport.
More than half of the injuries occurred during alpine skiing. Snowboarding peaked with 45% of the injuries in the two seasons 2000/2002, declining to 28% of the injuries during the last two seasons. Telemarking injuries dropped from 9 to 2% and skiboarding injuries from 4 to 2% of all injuries in the period (Fig. 2).
1.47 1.48 1.49
1.35
1.29 1.27
1
1.1
1.2
1.3
1.4
1.5
1.6
2000/2002 2002/2004 2004/2006 2006/2008 2008/2010 2010/2012
Inju
ry p
er 1
000
skie
r/bo
arde
r da
ys
Winter Seasons
Fig. 1 Injury rates (incidences) for skiers/boarders the seasons 2000/2002–2010/2012. n = num-ber of injured skiers/boarders. The population at risk is based on the number of sold day cards for skiers and boarders
Injury Trends in Recreational Skiers and Boarders in the 16-Year Period 1996–2012

6
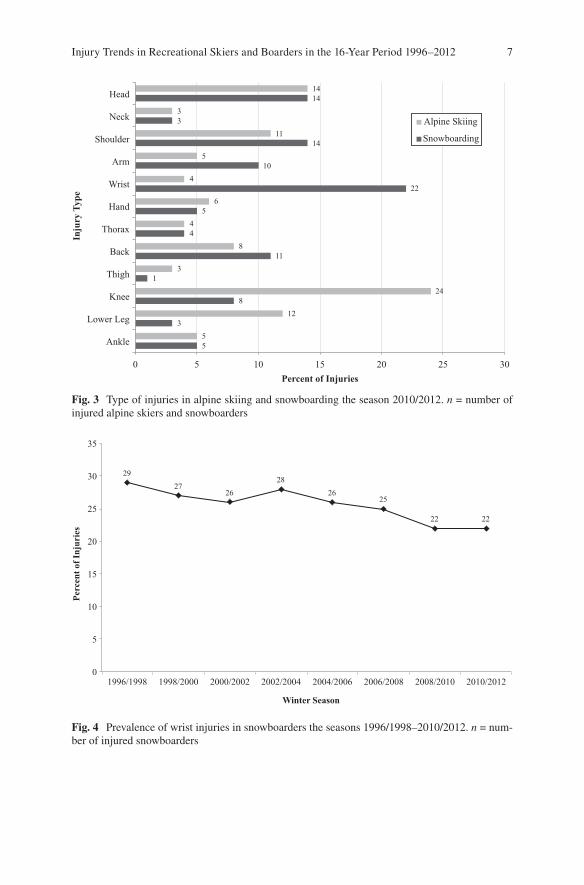
Location and type of injury—Many of the injuries were similarly distributed among skiers and boarders, but alpine skiers suffered more lower extremity injuries, espe-cially knee injuries (24%) compared to snowboarders (7%) (P < 0.001), whereas the reverse was observed for wrist injuries with 22% for snowboarders and 5% for alpine skiers (P < 0.001) in the last 2-year period (Fig. 3). The prevalence of knee injuries among alpine skiers has been about 25% throughout the period, but wrist injuries for snowboarders dropped from 29 to 22% (P < 0.001) (Fig. 4). Lower leg fracture was 5.6% for alpine skiers compared to 0.7% for snowboarders (P < 0.001) in the 2010/2012 seasons, and this difference has been almost unchanged in the 16-year period. Hand injuries among alpine skiers dropped from 11 to 6% (P < 0.001) in the same period (data not shown).
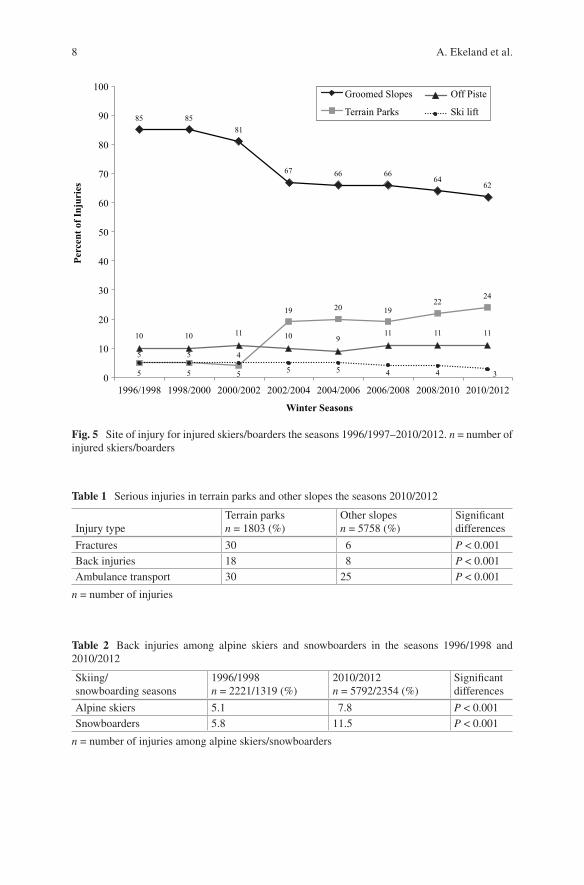
Injury site—Most of the injuries occurred on groomed slopes, but an increasing number of injuries occurred in terrain parks, from only 4% in the 2000/2002 sea-sons to 24% in the last two seasons when 35% of the snowboarders and 20% of the alpine skiers (P < 0.001) suffered their injury in terrain parks (Fig. 5). Injuries in terrain parks were more serious (more fractures, back injuries, and ambulance trans-ports) than those occurring at other locations (Table 1), and the prevalence of back injuries increased from 6 to 12% for snowboarders (P < 0.001) and from 5 to 8% for alpine skiers (P < 0.001) in the period (Table 2). Injuries suffered off pist and in ski lifts have been stable during the registration period and accounted for about 10%, respectively 5% of all injuries (Fig. 5).
57
5149 49
58
6467 68
34
4045 43 35
3129 28
9 9 6 4 3 2 2 2
4 4 3 3 2
0
10
20
30
40
50
60
70
80
90
100
1996/1998 1998/2000 2000/2002 2002/2004 2004/2006 2006/2008 2008/2010 2010/2012
Perc
ent o
f inj
ured
skie
rs/b
oard
ers
Winter Seasons
Alpine skiers
Snowboarders
Skiboarders
Telemarkers
Fig. 2 Prevalences of injured skiers/boarders as percentage of all injured on the slopes the seasons 1996/1997–2010/2012. n = number of injured skiers/boarders
A. Ekeland et al.
7
5
12
24
3
8
4
6
4
5
11
3
14
5
3
8
1
11
4
5
22
10
14
3
14
0 5 10 15 20 25 30
Ankle
Lower Leg
Knee
Thigh
Back
Thorax
Hand
Wrist
Arm
Shoulder
Neck
Head
Percent of Injuries
Inju
ry T
ype
Alpine Skiing
Snowboarding
Fig. 3 Type of injuries in alpine skiing and snowboarding the season 2010/2012. n = number of injured alpine skiers and snowboarders
29 27
26 28
26 25
22 22
0
5
10
15
20
25
30
35
1996/1998 1998/2000 2000/2002 2002/2004 2004/2006 2006/2008 2008/2010 2010/2012
Perc
ent o
f Inj
urie
s
Winter Season
Fig. 4 Prevalence of wrist injuries in snowboarders the seasons 1996/1998–2010/2012. n = num-ber of injured snowboarders
Injury Trends in Recreational Skiers and Boarders in the 16-Year Period 1996–2012
8
85 85 81
67 66 66 64
62
5 5 4
19 20 19 22
24
10 10 11 10 9 11 11 11
5 5 5 5 5 4 4 3 0
10
20
30
40
50
60
70
80
90
100
1996/1998 1998/2000 2000/2002 2002/2004 2004/2006 2006/2008 2008/2010 2010/2012
Perc
ent o
f Inj
urie
s
Winter Seasons
Groomed Slopes
Terrain Parks
Off Piste
Ski lift
Fig. 5 Site of injury for injured skiers/boarders the seasons 1996/1997–2010/2012. n = number of injured skiers/boarders
Table 1 Serious injuries in terrain parks and other slopes the seasons 2010/2012
Injury typeTerrain parks n = 1803 (%)
Other slopes n = 5758 (%)
Significant differences
Fractures 30 6 P < 0.001Back injuries 18 8 P < 0.001Ambulance transport 30 25 P < 0.001
n = number of injuries
Table 2 Back injuries among alpine skiers and snowboarders in the seasons 1996/1998 and 2010/2012
Skiing/ snowboarding seasons
1996/1998 n = 2221/1319 (%)
2010/2012 n = 5792/2354 (%)
Significant differences
Alpine skiers 5.1 7.8 P < 0.001Snowboarders 5.8 11.5 P < 0.001
n = number of injuries among alpine skiers/snowboarders
A. Ekeland et al.
9
3.2 Skier-Related Factors
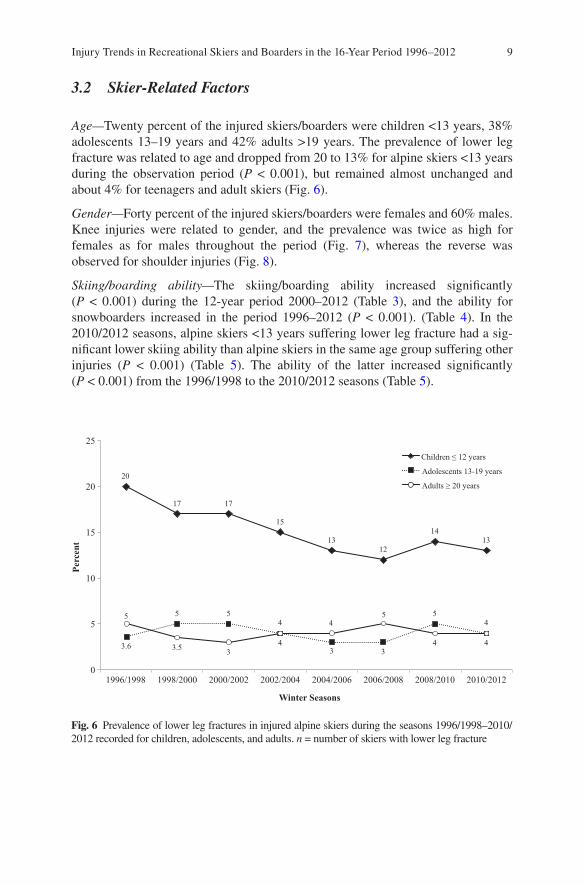
Age—Twenty percent of the injured skiers/boarders were children <13 years, 38% adolescents 13–19 years and 42% adults >19 years. The prevalence of lower leg fracture was related to age and dropped from 20 to 13% for alpine skiers <13 years during the observation period (P < 0.001), but remained almost unchanged and about 4% for teenagers and adult skiers (Fig. 6).
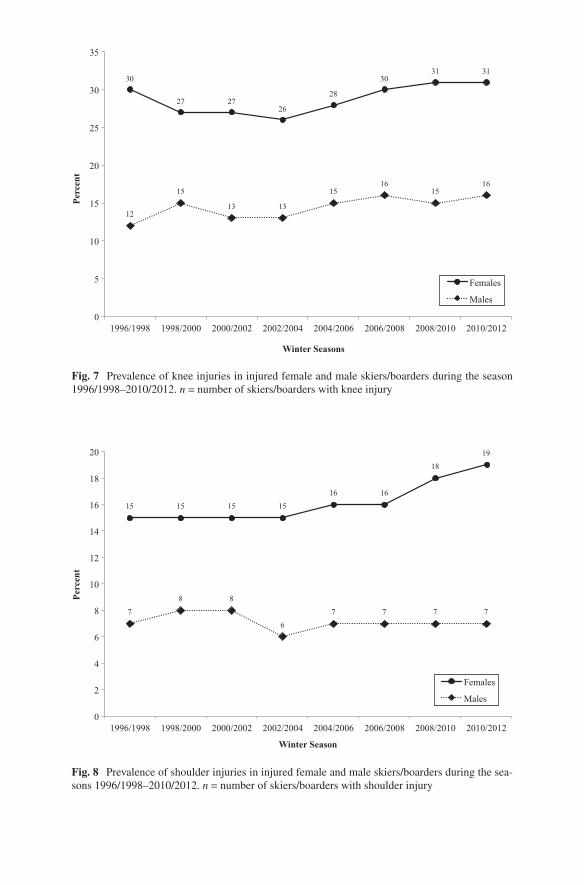
Gender—Forty percent of the injured skiers/boarders were females and 60% males. Knee injuries were related to gender, and the prevalence was twice as high for females as for males throughout the period (Fig. 7), whereas the reverse was observed for shoulder injuries (Fig. 8).
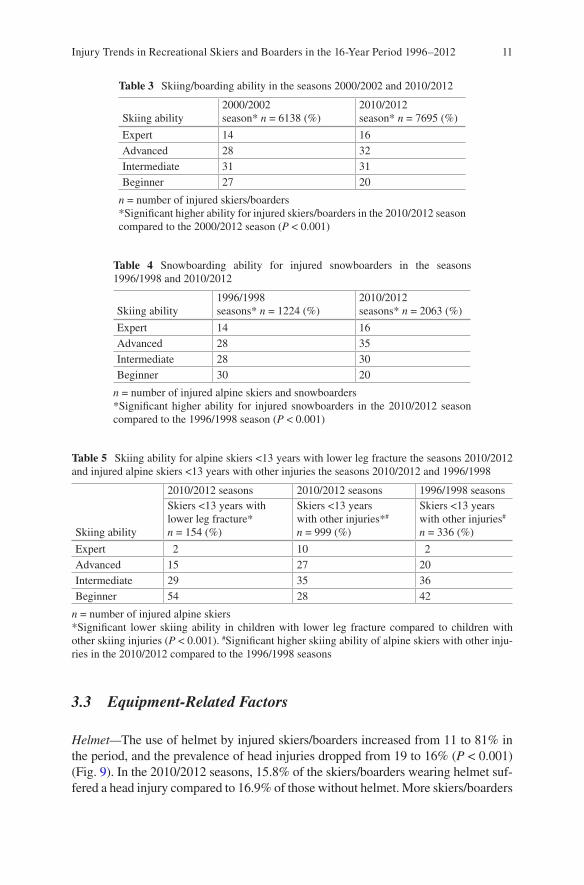
Skiing/boarding ability—The skiing/boarding ability increased significantly (P < 0.001) during the 12-year period 2000–2012 (Table 3), and the ability for snowboarders increased in the period 1996–2012 (P < 0.001). (Table 4). In the 2010/2012 seasons, alpine skiers <13 years suffering lower leg fracture had a sig-nificant lower skiing ability than alpine skiers in the same age group suffering other injuries (P < 0.001) (Table 5). The ability of the latter increased significantly (P < 0.001) from the 1996/1998 to the 2010/2012 seasons (Table 5).
20
17 17
15
13 12
14 13
3.6
5 5 4
3 3
5 4
5
3.5 3 4
4 5
4 4
0
5
10
15
20
25
1996/1998 1998/2000 2000/2002 2002/2004 2004/2006 2006/2008 2008/2010 2010/2012
Perc
ent
Winter Seasons
Children 12 years
Adolescents 13-19 years
Adults 20 years
Fig. 6 Prevalence of lower leg fractures in injured alpine skiers during the seasons 1996/1998–2010/ 2012 recorded for children, adolescents, and adults. n = number of skiers with lower leg fracture
Injury Trends in Recreational Skiers and Boarders in the 16-Year Period 1996–2012
30
27 27 26
28
30 31 31
12
15
13 13
15 16
15 16
0
5
10
15
20
25
30
35
1996/1998 1998/2000 2000/2002 2002/2004 2004/2006 2006/2008 2008/2010 2010/2012
Perc
ent
Winter Seasons
Females
Males
Fig. 7 Prevalence of knee injuries in injured female and male skiers/boarders during the season 1996/1998–2010/2012. n = number of skiers/boarders with knee injury
15 15 15 15
16 16
18
19
7
8 8
6
7 7 7 7
0
2
4
6
8
10
12
14
16
18
20
1996/1998 1998/2000 2000/2002 2002/2004 2004/2006 2006/2008 2008/2010 2010/2012
Perc
ent
Winter Season
Females
Males
Fig. 8 Prevalence of shoulder injuries in injured female and male skiers/boarders during the sea-sons 1996/1998–2010/2012. n = number of skiers/boarders with shoulder injury
11
3.3 Equipment-Related Factors
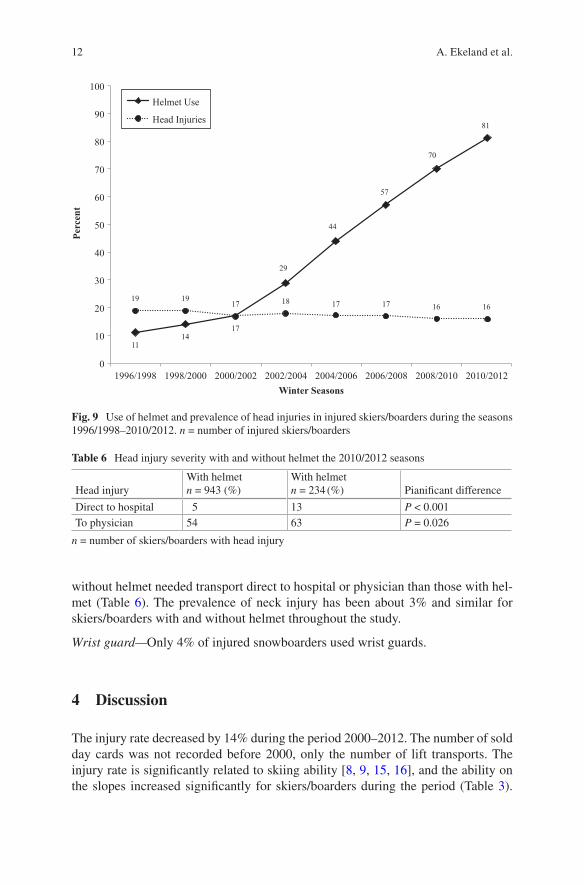
Helmet—The use of helmet by injured skiers/boarders increased from 11 to 81% in the period, and the prevalence of head injuries dropped from 19 to 16% (P < 0.001) (Fig. 9). In the 2010/2012 seasons, 15.8% of the skiers/boarders wearing helmet suf-fered a head injury compared to 16.9% of those without helmet. More skiers/boarders
Table 3 Skiing/boarding ability in the seasons 2000/2002 and 2010/2012
Skiing ability2000/2002 season* n = 6138 (%)
2010/2012 season* n = 7695 (%)
Expert 14 16Advanced 28 32Intermediate 31 31Beginner 27 20
n = number of injured skiers/boarders*Significant higher ability for injured skiers/boarders in the 2010/2012 season compared to the 2000/2012 season (P < 0.001)
Table 4 Snowboarding ability for injured snowboarders in the seasons 1996/1998 and 2010/2012
Skiing ability1996/1998 seasons* n = 1224 (%)
2010/2012 seasons* n = 2063 (%)
Expert 14 16Advanced 28 35Intermediate 28 30Beginner 30 20
n = number of injured alpine skiers and snowboarders*Significant higher ability for injured snowboarders in the 2010/2012 season compared to the 1996/1998 season (P < 0.001)
Table 5 Skiing ability for alpine skiers <13 years with lower leg fracture the seasons 2010/2012 and injured alpine skiers <13 years with other injuries the seasons 2010/2012 and 1996/1998
Skiing ability
2010/2012 seasons 2010/2012 seasons 1996/1998 seasonsSkiers <13 years with lower leg fracture* n = 154 (%)
Skiers <13 years with other injuries*# n = 999 (%)
Skiers <13 years with other injuries# n = 336 (%)
Expert 2 10 2Advanced 15 27 20Intermediate 29 35 36Beginner 54 28 42
n = number of injured alpine skiers*Significant lower skiing ability in children with lower leg fracture compared to children with other skiing injuries (P < 0.001). #Significant higher skiing ability of alpine skiers with other inju-ries in the 2010/2012 compared to the 1996/1998 seasons
Injury Trends in Recreational Skiers and Boarders in the 16-Year Period 1996–2012
12
without helmet needed transport direct to hospital or physician than those with hel-met (Table 6). The prevalence of neck injury has been about 3% and similar for skiers/boarders with and without helmet throughout the study.
Wrist guard—Only 4% of injured snowboarders used wrist guards.
4 Discussion
The injury rate decreased by 14% during the period 2000–2012. The number of sold day cards was not recorded before 2000, only the number of lift transports. The injury rate is significantly related to skiing ability [8, 9, 15, 16], and the ability on the slopes increased significantly for skiers/boarders during the period (Table 3).
11 14
17
29
44
57
70
81
19 19 17 18 17 17 16 16
0
10
20
30
40
50
60
70
80
90
100
1996/1998 1998/2000 2000/2002 2002/2004 2004/2006 2006/2008 2008/2010 2010/2012
Perc
ent
Winter Seasons
Helmet Use
Head Injuries
Fig. 9 Use of helmet and prevalence of head injuries in injured skiers/boarders during the seasons 1996/1998–2010/2012. n = number of injured skiers/boarders
Table 6 Head injury severity with and without helmet the 2010/2012 seasons
Head injuryWith helmet n = 943 (%)
With helmet n = 234 (%) Pianificant difference
Direct to hospital 5 13 P < 0.001To physician 54 63 P = 0.026
n = number of skiers/boarders with head injury
A. Ekeland et al.
13
This may partly explain the reduced injury rate at the end of the period. Also Shealy et al. [9] report a reduction of the injury rate in a ski patrol study from 14 American ski resorts in the period 2000–2010, where the injury rate was 2.6 per skier visit in 2000 and 2.5 in 2010. Kim et al. [7] found a decrease in injury rate for alpine skiers, but not for snowboarders in the period 1988–2006 in a study from Vermont, USA. Laporte et al. [8] found an overall decrease in injury rate from 2.7 to 2.43 injuries per 1000 skier/boarder days during the period 2005–2010 in a study from 32 French ski resorts. The injury rate for alpine skiers remained stable in the period, whereas that of snowboarders declined after 2006.
Most of the injuries occurred during alpine skiing, whereas snowboarding peaked with 45% of the injuries on the slopes in the 2000/2002 seasons (Fig. 2). This is not related to differences in risk for alpine skiing and snowboarding, but to the size of the population of skiers and boarders on the slope. The popularity of alpine skiing increased after the carving skis were introduced in the late 1990, with a correspond-ing sales reduction of snowboards. The popularity of telemark skiing has also grad-ually decreased during the registration period. Skiboards were introduced in 2002 but did not gain popularity with low sales of the equipment. Also Kim et al. [7] report that snowboarders peaked with 34% of the population on the slopes in 2000/2001 and then dropped to 20% the last years of their study that ended in 2006.
Alpine skiers suffer mainly knee injuries whereas snowboarders suffer mainly wrist injuries. This is in agreement with several other reports [7, 9, 17]. The preva-lence of knee injuries in alpine skiers remained almost the same during the period as also reported by Kim et al. [7] and Shealy et al. [9], but the prevalence of wrist injuries in snowboarders decreased (Fig. 4). Beginners were significantly overrep-resented among snowboarders with wrist injuries [7, 8, 12]. Snowboarding ability increased significantly during the period with less beginners on the slopes (Table 4), and this may be a possible explanation for the reduced prevalence of wrist injuries at the end of the period. This finding is in accordance with that of Laporte et al. [8] from France whereas both Kim et al. [7] and Shealy et al. [9] found an increase of wrist injuries over time in the USA. The two latter studies do not report if the snowboarding ability changed in the recorded period.
The prevalence of knee injuries was twice as high in females as in males, whereas the reverse was observed for shoulder injuries. These findings were observed throughout the 16-year registration period (Figs. 7 and 8), and have also been reported by others [17–20]. This significant gender difference is observed both in alpine skiing, snowboarding, telemark skiing, and skiboarding, and in each of the four skiing/boarding ability groups: expert, advanced, intermediate, and beginner [12]. It may be due to anatomical sex differences and related to differences in strength and elasticity of ligament and muscles, but so far we have no convincing explanation for these observations.
The prevalence of lower leg fracture in alpine skiers was significantly higher for children than for older skiers (Fig. 6), as reported previously [21, 22]. The risk for lower leg fracture in alpine skiers decreased significantly in the 1970 and 1980, prob-ably due to better boots and release bindings, and better binding setting and adjust-ment in the ski shops, levelling out to a lower plateau from the 1990 [6]. This has not
Injury Trends in Recreational Skiers and Boarders in the 16-Year Period 1996–2012
14
been observed to the same degree in children where the prevalence of lower leg fracture decreased from 20% in the 1996/1998 seasons reaching a plateau of 12–13% from the 2006/2008 seasons. Alpine skiers <13 years with lower leg fracture have a significant lower skiing ability than skiers <13 years with other injuries, and the ski-ing ability of the latter increased significantly during the registration period (Table 5). This may partly explain the reduction of lower leg fracture for children in the period, together with better boots and bindings with correct adjustment and setting, and less use of second-hand equipment [23]. Also Greenwald and Laporte [22] have reported beginners to be overrepresented among skiers with lower leg fracture.
Use of a protective helmet increased from 11 to 81% in the period, but the preva-lence of head injury only dropped from 19 to 16% (Fig. 9). Helmet offers protection against head injuries [24–26], but the reduction of the head injury prevalence of three percentage points or 16% after an increase of helmet use of 60 percentage points or more than seven times is less than expected and in agreement with the findings of Sulheim et al. [27]. But the injuries suffered by skiers/boarders without helmet were probably more serious as more of them required transport direct to hospital or physician than those suffered by skiers/boarders with helmet (Table 6). Skiers/boarders with helmet suffering head injuries had a higher ability than all injured skiers/boarders with helmet [12]. This may indicate that they ski faster on the slope and may have a sensation seeking behavior [25, 28]. The prevalence of neck injuries has been similar for skiers/boarders with and without helmet through-out the study. Thus, the use of helmet does not increase the risk for neck injuries, as also reported by Cusimano and Kwok [26].
Most of the injuries occurred on groomed slopes, where most of the skiing/boarding population was located. Terrain parks started to appear in the ski resorts around 2000, and since then an increasing share of the injuries occur in terrain parks (Fig. 5). More fractures and back injuries occurred in terrain parks than in other slopes and more injuries from the parks required ambulance transport (Table 1), suggesting the injuries in terrain parks to be more serious. It is difficult to record the injury rate in terrain parks. Laporte et al. [8] reported an increased rate compared to the overall injury rate, whereas Shealy et al. [9] found no evidence for an increased injury rate in terrain parks.
The strength of this study is the high number of injuries recorded in the largest Norwegian ski resorts by the same method during 16 successive ski seasons. The limitation is the lack of a control material of uninjured skiers/boarders from the same period. In the 2001/2002 season, we were able to collect a representative con-trol material enabling us to perform a case-control study with calculation of injury rates and injury risk for different groups of skiers/boarders [5, 16]. Another limita-tion is that the diagnoses have been made by ski patrols, and some conditions like fractures may have been over diagnosed. The prevalence of the different injuries has, however been quite consistent during the 16-year period. We therefore think that any weakness of diagnostic accuracy by the ski patrols may partly be compen-sated by the high number of injured skiers/boarders in the material. The ski patrol may also pick up some minor injuries not needing medical attention.
A. Ekeland et al.
15
5 Conclusion
The injury rate on Norwegian slopes dropped 14% during the period 2000–2012, possibly due to an increase of the skiing/boarding ability. The prevalence of wrist injuries in snowboarders was also reduced, whereas the boarding ability increased. The prevalence of back injuries in snowboarders increased by 100% from 1996 to 2012, and this may be related to one-third of the injuries occurred in terrain parks at the end of the period. The prevalence of knee injuries was twice as high in females compared to males, whereas the reverse was observed for shoulder injuries through-out the period. The prevalence of lower leg fracture in children dropped by 35% at the end of the period, whereas the skiing ability of children with other injuries increased. The use of helmet increased more than seven times among injured skiers/boarders to 81%, and the prevalence of head injuries dropped with 16% at the end of the 16-year period.
References
1. Ekeland A, Larsen SR, Tuxen AG, Nygaard P (1989) Organization of skiing safety in Norway. In: Johnson RJ, Mote CD, Binet MH (eds) Skiing trauma and safety, vol 7. ASTM STP 1022, Philadelphia, pp 342–353
2. Hagel BE, Meeuwisse WH, Mohtadi NG, Fick GH (1999) Skiing and snowboarding injuries in children and aldolescents of southern Alberta. Clin J Sport Med 9(1):9–17
3. Langren M, Salvaraj S (2004) Increased injury risk among first-day skiers, snowboarders and skiboarders. Am J Sports Med 32:96–103
4. Ogawa H, Sumi H, Sumi Y, Shimizu K (2010) Skill level-specific differences in snowboarding related injuries. Am J Sports Med 38(3):532–537
5. Sulheim S, Holme I, Rødven A, Ekeland A, Bahr R (2011) Risk factors for injuries in alpine skiing, telemark skiing and snowboarding—case-control study. Br J Sports Med 45(16): 1303–1309
6. Johnson RJ, Ettlinger CF, Shealy JE (2009) Update on injury trends in alpine skiing. In: Johnson RJ, Shealy JE, Langren M (eds) Skiing trauma and safety, vol 17. ASTM STP 1510, Philadelphia, pp 11–22
7. Kim S, Endres NK, Johnson RJ, Ettlinger CF, Shealy JE (2012) Snowboarding injuries. Trends over time and comparisons with alpine skiing injuries. Am J Sports Med 40(4):770–776
8. Laporte JD, Bajolle L, Lamy D, Delay JB (2012) Winter sport injuries in France over two decades. In: Johnson RJ, Shealy JE, Greenwald RM, Scher IS (eds) Skiing trauma and safety, vol 19. ASTM STP 1553, Philadelphia, pp 201–215
9. Shealy JE, Ettlinger CF, Scher I, Johnson RJ (2015) 2010/2011 NSAA 10-year interval injury study. In: Johnson RJ, Shealy JE, Greenwald RM (eds) Skiing trauma and safety, vol 20. ASTM STP 1582, Philadelphia, pp 93–111
10. Ekeland A, Rødven A (2000) Injuries in alpine skiing, telemarking and snowboarding. In: Johnson RJ, Zucco P, Shealy JE (eds) Skiing trauma and safety, vol 13. ASTM STP 1397, Philadelphia, pp 87–94
11. Ekeland A, Rødven A (2006) Injuries in Norwegian ski resorts 2002–2004. In: Johnson RJ, Shealy JE, Yamagishi T (eds) Skiing trauma and safety, vol 16. ASTM STP 1474, Philadelphia, pp 1–7
12. Ekeland A, Rødven A (2012) Injuries in alpine skiing, telemarking, snowboarding and ski-boarding related to gender and ability. In: Johnson RJ, Shealy JE, Greenwald RM, Scher IS (eds) Skiing trauma and safety, vol 19. ASTM STP 1553, Philadelphia, pp 216–227
Injury Trends in Recreational Skiers and Boarders in the 16-Year Period 1996–2012
16
13. Ekeland A, Holtmoen Å, Lystad H (1993) Lower extremity equipment-related injuries in alpine recreational skiers. Am J Sports Med 21(2):201–205
14. Sulheim S, Bahr R, Ekeland A (2007) Self-estimation of ability among skiers and snowboard-ers in alpine skiing resorts. Knee Surg Sports Traumatol Arthrosc 15:665–670
15. Shealy JE (1982) Two-year statistical analysis of skiing injuries at 13 selected aereas in the USA. In: Hauser W, Karlsson J, Magi M (eds) Skiing trauma and skiing safety IV. Publication series of TUEV-edition, Munich, pp 207–216
16. Ekeland A, Sulheim S, Rødven A (2005) Injury rates and injury types in alpine skiing, telemarking and snowboarding. In: Johnson RJ, Shealy JE, Ahlbäumer MG (eds) Skiing trauma and safety, vol 15. ASTM STP 1464, Philadelphia, pp 31–39
17. Zacharopopoulos AN, Smyrnis A, Vlastos I, Zafairiou C (2015) Skiing injuries in Greece: a six year case-control study. In: Johnson RJ, Shealy JE, Greenwald RM (eds) Skiing trauma and safety, vol 20. ASTM STP 1582, Philadelphia, pp 122–137
18. Greenwald RM, France EP, Rosenberg TD, Toelcke T (1996) Significant gender differences in alpine skiing injuries: a five year study. In: Mote CD, Johnson RJ, Hauser W, Schaff PS (eds) Skiing trauma and safety, vol 10. ASTM STP 1266, Philadelphia, pp 36–44
19. Shealy JE, Ettlinger CF (1996) Gender related injury pattern in skiing. In: Mote CD, Johnson RJ, Hauser W, Schaff PS (eds) Skiing trauma and safety, vol 10. ASTM STP 1266, Philadelphia, pp 45–57
20. Cadman R, Macnab AJ (1996) Age and gender: two epidemiological factors in skiing and snowboarding injury. In: Mote CD, Johnson RJ, Hauser W, Schaff PS (eds) Skiing trauma and safety, vol 10. ASTM STP 1266, Philadelphia, pp 58–65
21. Deibert MC, Aronsson DD, Johnson RJ, Ettlinger CF, Shealy JE (1998) Skiing injuries in children, aldolescents and adults. J Bone Joint Surg Am 80(1):25–32
22. Greenwald RM, Laporte JD (2009) Effect of age and experience on lower leg fractures in alpine sports. In: Johnson RJ, Shealy JE, Langren M (eds) Skiing trauma and safety, vol 17. ASTM STP 1510, Philadelphia, pp 3–10
23. Ekeland A, Nordsletten L (1994) Equipment-related injuries in skiing. Recommandations. Sports Med 17:283–287
24. Hagel BE, Pless IB, Goulet V, Platt RW, Robitaille Y (2005) Effectiveness of helmets in skiers and snowboarders: case-control and case crossover study. BMJ 330:281
25. Sulheim S, Holme I, Ekeland A, Bahr R (2006) Helmet use and risk of head injuries in alpine skiers and snowboarders. JAMA 295(8):919–924
26. Cusimano MD, Kwok J (2010) The effectiveness of helmet wear in skiers and snowboarders: a systematic review. Br J Sports Med 44(11):781–786
27. Sulheim S, Ekeland A, Holme I, Bahr R (2017) Helmet use and risk of head injuries in alpine skiers and snowboarders: changes after an interval of one decade. Br J Sports Med. 51:44–50]
28. Shealy JE, Johnson RJ, Ettlinger CF (2006) On piste fatalities in recreational snow sports in the U.S. In: Johnson RJ, Shealy JE, Yamagishi T (eds) Skiing trauma and safety, vol 16. ASTM STP 1474, Philadelphia, pp 27–34
Open Access This chapter is distributed under the terms of the Creative Commons Attribution-Noncommercial 2.5 License (http://creativecommons.org/licenses/by-nc/2.5/) which permits any noncommercial use, distribution, and reproduction in any medium, provided the original author(s) and source are credited.
The images or other third party material in this chapter are included in the work’s Creative Commons license, unless indicated otherwise in the credit line; if such material is not included in the work’s Creative Commons license and the respective action is not permitted by statutory regu-lation, users will need to obtain permission from the license holder to duplicate, adapt or reproduce the material.
A. Ekeland et al.
17© The Author(s) 2017 I.S. Scher et al. (eds.), Snow Sports Trauma and Safety, DOI 10.1007/978-3-319-52755-0_2
New Zealand Snow Sports Injury Trends Over Five Winter Seasons 2010–2014
Brenda A. Costa-Scorse, Will G. Hopkins, John Cronin, and Eadric Bressel
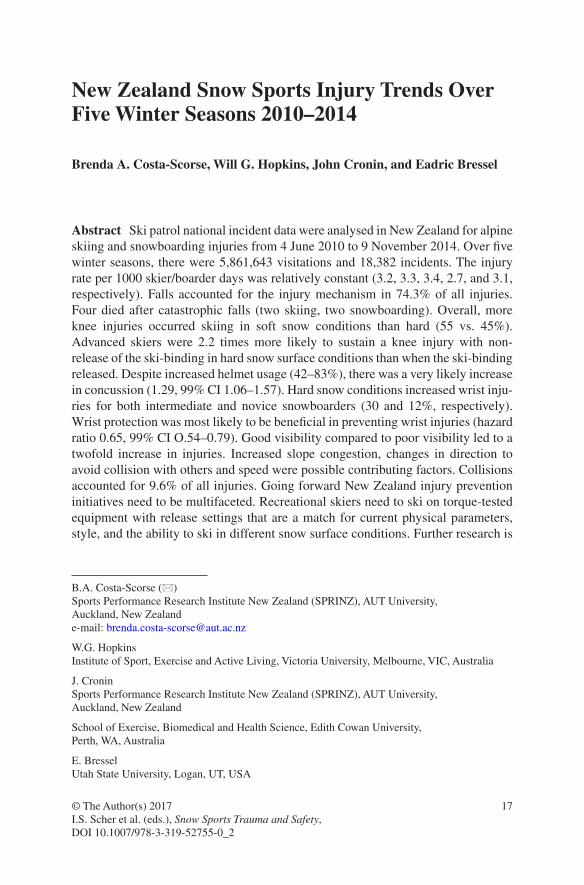
Abstract Ski patrol national incident data were analysed in New Zealand for alpine skiing and snowboarding injuries from 4 June 2010 to 9 November 2014. Over five winter seasons, there were 5,861,643 visitations and 18,382 incidents. The injury rate per 1000 skier/boarder days was relatively constant (3.2, 3.3, 3.4, 2.7, and 3.1, respectively). Falls accounted for the injury mechanism in 74.3% of all injuries. Four died after catastrophic falls (two skiing, two snowboarding). Overall, more knee injuries occurred skiing in soft snow conditions than hard (55 vs. 45%). Advanced skiers were 2.2 times more likely to sustain a knee injury with non- release of the ski-binding in hard snow surface conditions than when the ski-binding released. Despite increased helmet usage (42–83%), there was a very likely increase in concussion (1.29, 99% CI 1.06–1.57). Hard snow conditions increased wrist inju-ries for both intermediate and novice snowboarders (30 and 12%, respectively). Wrist protection was most likely to be beneficial in preventing wrist injuries (hazard ratio 0.65, 99% CI O.54–0.79). Good visibility compared to poor visibility led to a twofold increase in injuries. Increased slope congestion, changes in direction to avoid collision with others and speed were possible contributing factors. Collisions accounted for 9.6% of all injuries. Going forward New Zealand injury prevention initiatives need to be multifaceted. Recreational skiers need to ski on torque-tested equipment with release settings that are a match for current physical parameters, style, and the ability to ski in different snow surface conditions. Further research is
B.A. Costa-Scorse (*) Sports Performance Research Institute New Zealand (SPRINZ), AUT University, Auckland, New Zealande-mail: [email protected]
W.G. Hopkins Institute of Sport, Exercise and Active Living, Victoria University, Melbourne, VIC, Australia
J. Cronin Sports Performance Research Institute New Zealand (SPRINZ), AUT University, Auckland, New Zealand
School of Exercise, Biomedical and Health Science, Edith Cowan University, Perth, WA, Australia
E. Bressel Utah State University, Logan, UT, USA
18
needed to determine whether wearing a helmet increases reckless behaviour in some age groups. An international standard for snow sports wrist protectors with proven dimensions is also needed before ski areas can make any further investment in wrist protectors.
Keywords Skiing • Snowboarding • Injury • Mechanisms • Trends
1 Introduction
Injury surveillance is a requisite for understanding the injury problem in alpine ski-ing and snowboarding [1]. Historically, ski areas have monitored incidents in-house and Ski Areas Association New Zealand (SAANZ) has determined collaborative injury prevention endeavour with the support of technical reports. In 2005, all ski areas moved from recording injury incidents on a SAANZ paper-based incident reporting form to a computerised incident reporting system managed on behalf of SAANZ by the New Zealand Mountain Safety Council. Electronic incident data collection made it possible to undertake this first longitudinal skiing and snow-boarding injury study. The findings from this study will provide SAANZ with more comprehensive evidence to determine, where injury prevention energy and resources should be focussed.
2 Objectives
Describe the injury rates and trends in snow sports in New Zealand over five winters to inform the development of a national injury prevention strategy.
3 Methods
The Auckland University of Technology ethics committee approved the study—ref-erence 14/146. Ski patrollers, nurses, doctors, and radiographers completed incident reporting forms for all injuries at all commercial ski areas throughout New Zealand. Anonymised data were entered into the electronic database each week of each win-ter season over 5 years. The NZ Mountain Safety Council maintained the National Incident Database (NID). SAANZ provided ticket sale records and season pass use for each ski area. Demographic data from SAANZ national consumer satisfaction surveys (2007–2009) were supplied in excel. Bare-head and helmet wear counts were undertaken at chairlifts at two major ski areas in 2010 and 2015. Retrospective analyses were performed with the Statistical Analysis System (SAS). Uncertainties
B.A. Costa-Scorse et al.
19
in the true values of the outcomes were assessed using magnitude-based inferences. For precision, 99% confidence intervals were computed in SAS. Six approaches were taken in the analyses. Trends in annual incidence rates per 1000 skier/boarder days were determined by summing the injuries at each ski area for each year, then modelling the count in each year with Poisson regression using ticket sales and estimated season pass use. The proportions of skiers, snowboarders, females, and males were determined in excel using SAANZ customer surveys (25,910).
The effect of snow conditions and visibility on predicting injury types was anal-ysed by limiting the data to the six major ski areas that had 82% of the skier/boarder days. As there were always injuries on any day that the ski area was open this strat-egy avoided the bias that would arise from a given snow or sky condition reducing the injury rate such that no injuries occurred on some days. Hard snow or icy condi-tions existed when a ski patroller in ski boots could not make an impression in the snowpack. The soft or spring conditions description was used on days when the surface easily permitted leaving a ski-boot impression in the snow. Cloud cover provided effect of visibility data on injury incidence. Clear skies or scattered cloud cover determined good visibility. Poor visibility was determined by overcast condi-tions with full cloud cover leading to flat light or white out conditions with snow falling, mist, or rain.
Logistical regression was used to analyse the effect of snow condition, visibility, skiing or snowboarding activity, and the ability on the proportions of a given type of injury (e.g. head) and type of incident (e.g. falls, jumps, collisions). Deaths were counted. Injured skiers’ self-reported when the ski-binding released during the inci-dent or did not release. Skier accounts of the ski-binding pre-releasing in normal skiing manoeuvres were also included in the three level analysis of the effect of binding release. Probabilistic terms were used to describe the true value of changes in the mechanism (type of incident) over the 5-year period. Where the true value could be substantial in both a positive and negative sense, the result was unclear; otherwise, results were clear and the inference was described as likely trivial, pos-sibly trivial, trivial, likely or a very likely increase or decrease [2].
The effect of helmet use on head injuries (cases) was determined by using other injuries as controls; a method previously applied in an investigation on the relation of head, face, and neck injury in skiers wearing helmets [3, 4]. A hazard ratio was obtained using a Poisson regression model of those that were head injured (using helmets)/(those not using helmets) divided by those that were non-head injured (using helmets)/(those not using helmets). The effect of wrist protection was exam-ined in the same manner.
4 Results
Over five winters 5,861,643 people were active in snow sports at New Zealand ski areas and 18,382 incidents were registered. New Zealand injury trends per 1000 skier/boarder days were 3.2, 3.3, 3.4, 2.7, and 3.1, respectively (2010–2014). There
New Zealand Snow Sports Injury Trends Over Five Winter Seasons 2010–2014
20
was most likely a trivial decline in injuries over this period (−3%, 99% confidence interval − 9 to 3%). The proportions of people active in each sport were determined from 25,911 SAANZ surveys: 61% skiers, 32.4% snowboarders, and 6.6% both ski and snowboard. No data was collected on the number of people tubing at ski areas.
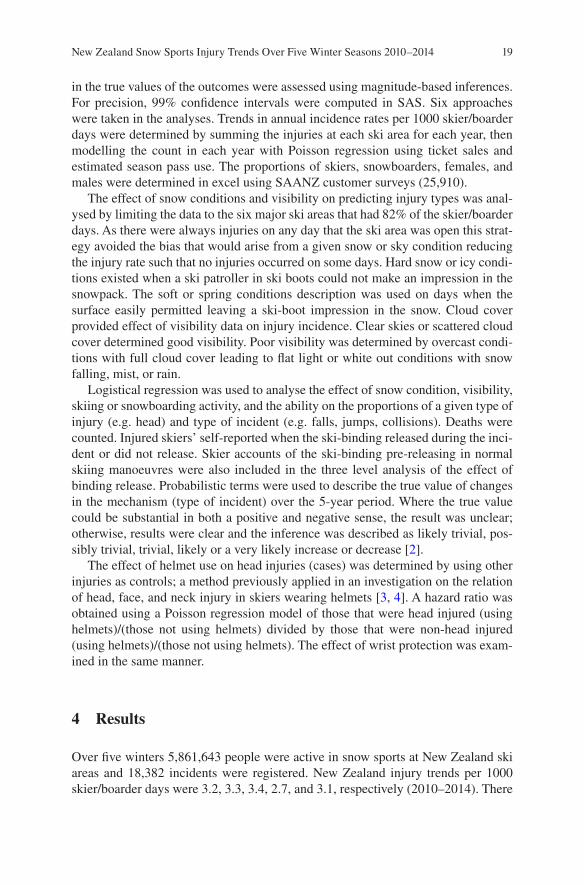
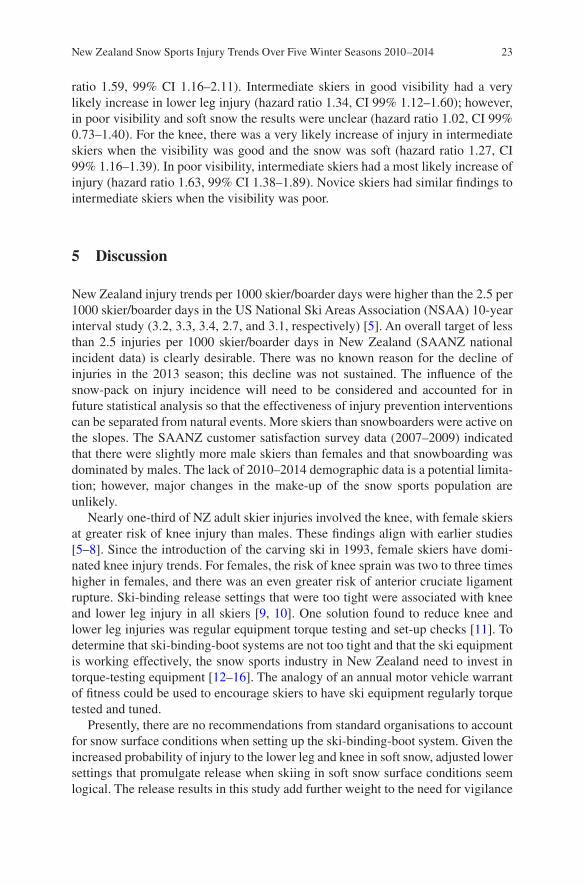
Knee injuries were the most common injury overall (see Fig. 1). Over two-thirds of knee injuries occurred in skiers when compared with snowboarders and others (tubing/hiking) (76, 21, and 3%, respectively). There was no significant difference in the frequency of back injury between skier and snowboarders; 36% occurred in the cervical/thoracic region; and 64% in the lumbar/sacral region. Wrist injuries were more common in snowboarders (80%). Snowboarders accounted for 52% of the head injuries, skiing 43%, and 5% were attributed to other activities. Shoulder injuries occurred more often in snowboarders (61%). Clavicle injuries were also more prevalent in snowboarders (64%). Conversely, 74% of injuries to the lower leg occurred during skiing.
SAANZ customer survey data indicated that the percentage of male skiers was 53%, female skiers 47% compared to 61% male and 39% female snowboarders. Female skiers injured the knee more frequently than male skiers (65% vs. 35%). Non-release of the ski-binding resulted in knee injury in skiers more often than release (see Table 1). More knee injuries occurred in soft snow conditions than hard (55% vs. 45%). The rates of knee injuries either in non-release or release were highest in intermediate skiers (45%), followed by novices (30%) then advanced skiers (25%).
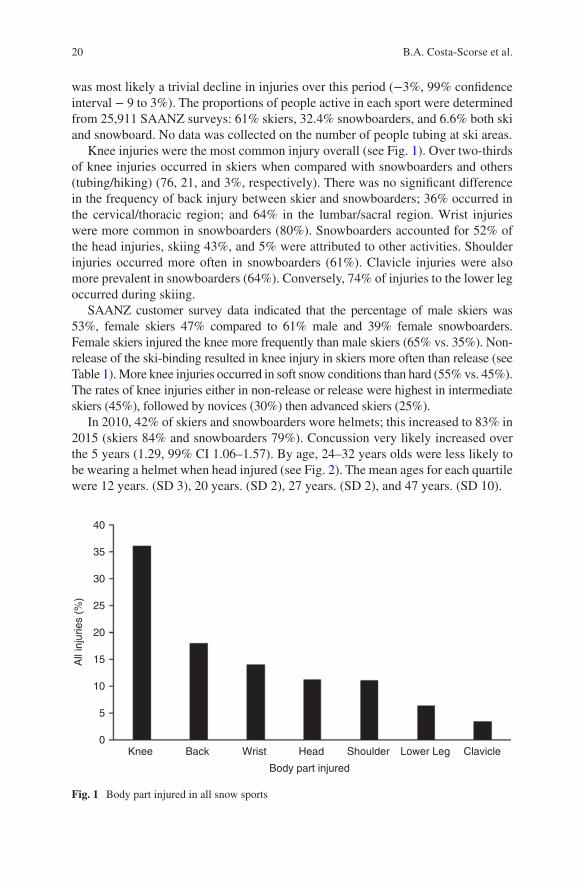
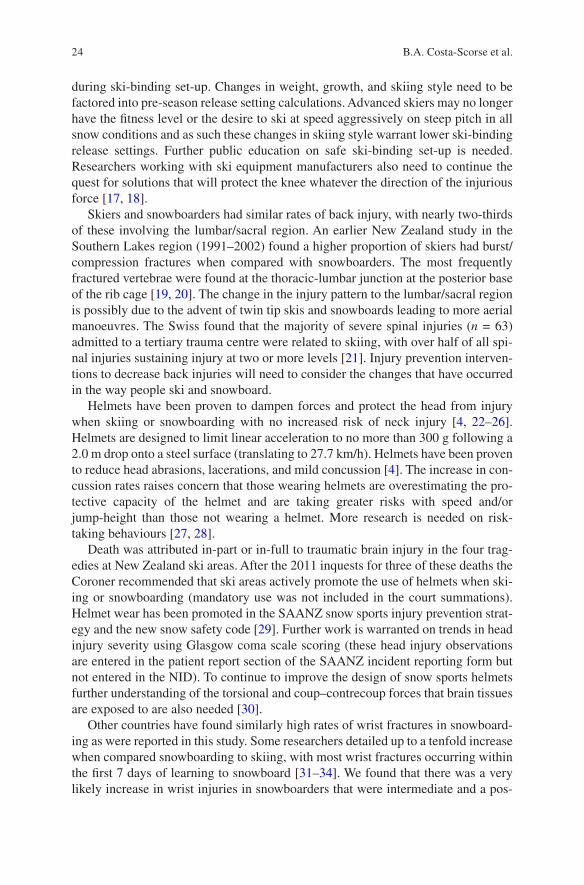
In 2010, 42% of skiers and snowboarders wore helmets; this increased to 83% in 2015 (skiers 84% and snowboarders 79%). Concussion very likely increased over the 5 years (1.29, 99% CI 1.06–1.57). By age, 24–32 years olds were less likely to be wearing a helmet when head injured (see Fig. 2). The mean ages for each quartile were 12 years. (SD 3), 20 years. (SD 2), 27 years. (SD 2), and 47 years. (SD 10).
0Knee Back Wrist Head Shoulder
Body part injured
Lower Leg Clavicle
5
10
15
20
25
30
35
40
All
inju
ries
(%)
Fig. 1 Body part injured in all snow sports
B.A. Costa-Scorse et al.
21
Head injury was higher in advanced and intermediate skiers wearing helmets than novices; 23, 25, and 10%, respectively. For helmet-wearing snowboarders, head injury increased in advanced, intermediate, and novice snowboarders by 41, 29, and 30%, respectively (when compared with those not wearing a helmet). Overall, there was a 26% increased risk of head injury in skiers wearing helmets (hazard ratio 1.26, 99% CI 1.05–1.52) and a 36% increase in head injury in snow-boarders wearing helmets (hazard ratio 1.36, 1.05–1.52).
There was a very likely increase in wrist injuries in intermediate snowboarders in hard snow when compared with soft snow conditions (hazard ratio 1.3, 99% CI 1.17–1.45). Novice snowboarders had a possible increase in the likelihood of wrist injury in hard snow conditions (hazard ratio 1.12, 99% CI 1.02–1.21). Regardless of whether snowboarders were in a terrain park or in open mountain terrain, wrist pro-tection was most likely beneficial in preventing wrist injuries (hazard ratio 0.65, 99% CI O.54–0.79).
Table 1 Equipment effects on knee injuries by snow surface condition and skier ability
Non-release ReleaseDifference (non-release/release)Effect; 99% CI Inference
Advanced SkierSoft snow 30.7% (n = 430) 21.2% (n = 420) 1.5; 1.2–1.7 ↑***Hard snow 27.7% (n = 415) 12.9% (n = 364) 2.2; 1.7–2.7 ↑****Intermediate SkierSoft snow 44.9% (n = 847) 29% (n = 734) 1.6; 1.4–1.7 ↑****Hard snow 37.2% (n = 675) 23.1% (n = 606) 1.6; 1.4–1.8 ↑****Novice SkierSoft snow 46.8% (n = 662) 38.2% (n = 448) 1.2; 1.1–1.36 ↑**Hard snow 36.4% (n = 495) 33.3% (n = 315) 1.1; 0.9–1.3 ↑*
Key Asterisks indicate effects clear at the 99% level and likelihood that the true effect is substan-tial, as follows: *possible, **likely, ***very likely, ****most likely
Fig. 2 Head injured wearing a helmet by age group and year
New Zealand Snow Sports Injury Trends Over Five Winter Seasons 2010–2014
22
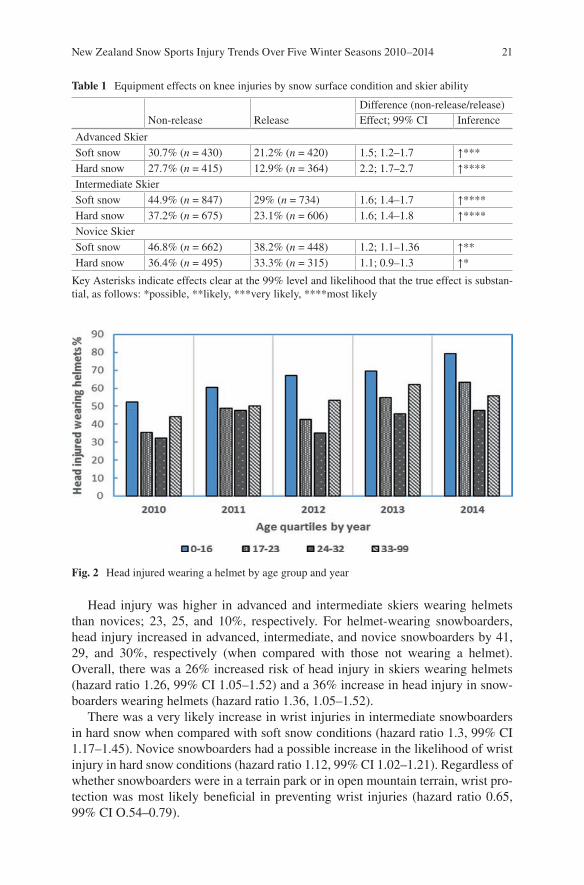
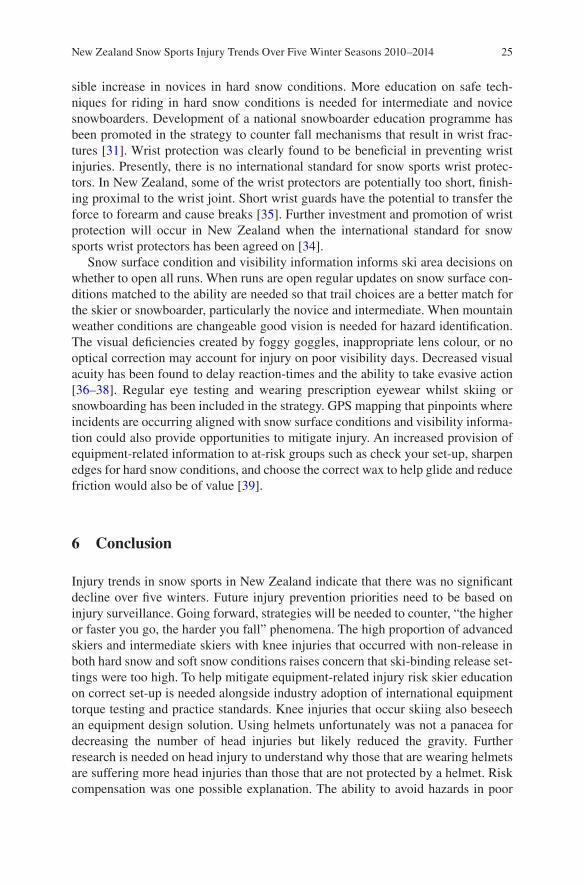
The combined skiing and snowboarding results for types of injury are detailed in Fig. 3. Fractures declined by 0.3 per 1000 skier/boarder days. There was no decline in the incidence of concussion, dislocation, soft tissue injuries, or sprains.
Falls accounted for 74.3% of incident types with no difference between skiers and snowboarders; collisions 9.6%—snowboarders were more commonly injured in collisions than skiers 34 vs. 58% (8% tubing or other activity). In 2010, two ski-ers and one snowboarder died, two of three were not wearing helmets. In 2013, another snowboarder died attempting to retrieve a snowboard. All four deaths involved catastrophic sliding falls in hard snow resulting in severe injuries that included the head.
The proportion of injuries attributed to jumps were 7.3%; man-made terrain fea-tures 5.3%; lift accidents 2%; and sliding whilst tubing or other incident types accounted for the remaining 1.5%. When considering mechanisms of injury using counts of injury types in each year there was a likely decrease in jump-related inju-ries (0.83, 99% CI 0.69–0.99), likely trivial decrease in falls (0.94, 99% CI 0.88–1.00) and the inference for collisions was unclear (1.00, 99% CI 0.83–1.22).
In terms of sky cover, there was 2.5 times more likelihood of injury in good vis-ibility conditions (hazard ratio 2.5, 99% CI 1.97–3.19). In good visibility, advanced skiers most likely increased injuries to the lower leg when the snow was soft vs. hard (hazard ratio 2.06, CI 99% 1.55–2.7) and a likely increased probability of knee injury in soft snow vs. hard (hazard ratio 1.28, 99% CI 1.11–1.48). In poor visibility, the probability that advanced skiers injured the lower leg in soft snow vs. hard snow was a likely increase (hazard ratio 1.63, CI 99% 0.94–2.71). Soft snow conditions led to a very likely increase that advanced skiers sustained knee injuries (hazard
2010 2011 2012 2013 2014
Concussion Dislocation Fracture Soft Tissue Sprain
Year
0
0.2
0.4
0.6
0.8
1
1.2
1.4In
jurie
s pe
r 10
00 s
kier
day
s
Fig. 3 Types of injury in skiing and snowboarding
B.A. Costa-Scorse et al.
23
ratio 1.59, 99% CI 1.16–2.11). Intermediate skiers in good visibility had a very likely increase in lower leg injury (hazard ratio 1.34, CI 99% 1.12–1.60); however, in poor visibility and soft snow the results were unclear (hazard ratio 1.02, CI 99% 0.73–1.40). For the knee, there was a very likely increase of injury in intermediate skiers when the visibility was good and the snow was soft (hazard ratio 1.27, CI 99% 1.16–1.39). In poor visibility, intermediate skiers had a most likely increase of injury (hazard ratio 1.63, 99% CI 1.38–1.89). Novice skiers had similar findings to intermediate skiers when the visibility was poor.
5 Discussion
New Zealand injury trends per 1000 skier/boarder days were higher than the 2.5 per 1000 skier/boarder days in the US National Ski Areas Association (NSAA) 10-year interval study (3.2, 3.3, 3.4, 2.7, and 3.1, respectively) [5]. An overall target of less than 2.5 injuries per 1000 skier/boarder days in New Zealand (SAANZ national incident data) is clearly desirable. There was no known reason for the decline of injuries in the 2013 season; this decline was not sustained. The influence of the snow-pack on injury incidence will need to be considered and accounted for in future statistical analysis so that the effectiveness of injury prevention interventions can be separated from natural events. More skiers than snowboarders were active on the slopes. The SAANZ customer satisfaction survey data (2007–2009) indicated that there were slightly more male skiers than females and that snowboarding was dominated by males. The lack of 2010–2014 demographic data is a potential limita-tion; however, major changes in the make-up of the snow sports population are unlikely.
Nearly one-third of NZ adult skier injuries involved the knee, with female skiers at greater risk of knee injury than males. These findings align with earlier studies [5–8]. Since the introduction of the carving ski in 1993, female skiers have domi-nated knee injury trends. For females, the risk of knee sprain was two to three times higher in females, and there was an even greater risk of anterior cruciate ligament rupture. Ski-binding release settings that were too tight were associated with knee and lower leg injury in all skiers [9, 10]. One solution found to reduce knee and lower leg injuries was regular equipment torque testing and set-up checks [11]. To determine that ski-binding-boot systems are not too tight and that the ski equipment is working effectively, the snow sports industry in New Zealand need to invest in torque- testing equipment [12–16]. The analogy of an annual motor vehicle warrant of fitness could be used to encourage skiers to have ski equipment regularly torque tested and tuned.
Presently, there are no recommendations from standard organisations to account for snow surface conditions when setting up the ski-binding-boot system. Given the increased probability of injury to the lower leg and knee in soft snow, adjusted lower settings that promulgate release when skiing in soft snow surface conditions seem logical. The release results in this study add further weight to the need for vigilance
New Zealand Snow Sports Injury Trends Over Five Winter Seasons 2010–2014
24
during ski-binding set-up. Changes in weight, growth, and skiing style need to be factored into pre-season release setting calculations. Advanced skiers may no longer have the fitness level or the desire to ski at speed aggressively on steep pitch in all snow conditions and as such these changes in skiing style warrant lower ski-binding release settings. Further public education on safe ski-binding set-up is needed. Researchers working with ski equipment manufacturers also need to continue the quest for solutions that will protect the knee whatever the direction of the injurious force [17, 18].
Skiers and snowboarders had similar rates of back injury, with nearly two-thirds of these involving the lumbar/sacral region. An earlier New Zealand study in the Southern Lakes region (1991–2002) found a higher proportion of skiers had burst/compression fractures when compared with snowboarders. The most frequently fractured vertebrae were found at the thoracic-lumbar junction at the posterior base of the rib cage [19, 20]. The change in the injury pattern to the lumbar/sacral region is possibly due to the advent of twin tip skis and snowboards leading to more aerial manoeuvres. The Swiss found that the majority of severe spinal injuries (n = 63) admitted to a tertiary trauma centre were related to skiing, with over half of all spi-nal injuries sustaining injury at two or more levels [21]. Injury prevention interven-tions to decrease back injuries will need to consider the changes that have occurred in the way people ski and snowboard.
Helmets have been proven to dampen forces and protect the head from injury when skiing or snowboarding with no increased risk of neck injury [4, 22–26]. Helmets are designed to limit linear acceleration to no more than 300 g following a 2.0 m drop onto a steel surface (translating to 27.7 km/h). Helmets have been proven to reduce head abrasions, lacerations, and mild concussion [4]. The increase in con-cussion rates raises concern that those wearing helmets are overestimating the pro-tective capacity of the helmet and are taking greater risks with speed and/or jump-height than those not wearing a helmet. More research is needed on risk- taking behaviours [27, 28].
Death was attributed in-part or in-full to traumatic brain injury in the four trag-edies at New Zealand ski areas. After the 2011 inquests for three of these deaths the Coroner recommended that ski areas actively promote the use of helmets when ski-ing or snowboarding (mandatory use was not included in the court summations). Helmet wear has been promoted in the SAANZ snow sports injury prevention strat-egy and the new snow safety code [29]. Further work is warranted on trends in head injury severity using Glasgow coma scale scoring (these head injury observations are entered in the patient report section of the SAANZ incident reporting form but not entered in the NID). To continue to improve the design of snow sports helmets further understanding of the torsional and coup–contrecoup forces that brain tissues are exposed to are also needed [30].
Other countries have found similarly high rates of wrist fractures in snowboard-ing as were reported in this study. Some researchers detailed up to a tenfold increase when compared snowboarding to skiing, with most wrist fractures occurring within the first 7 days of learning to snowboard [31–34]. We found that there was a very likely increase in wrist injuries in snowboarders that were intermediate and a pos-
B.A. Costa-Scorse et al.
25
sible increase in novices in hard snow conditions. More education on safe tech-niques for riding in hard snow conditions is needed for intermediate and novice snowboarders. Development of a national snowboarder education programme has been promoted in the strategy to counter fall mechanisms that result in wrist frac-tures [31]. Wrist protection was clearly found to be beneficial in preventing wrist injuries. Presently, there is no international standard for snow sports wrist protec-tors. In New Zealand, some of the wrist protectors are potentially too short, finish-ing proximal to the wrist joint. Short wrist guards have the potential to transfer the force to forearm and cause breaks [35]. Further investment and promotion of wrist protection will occur in New Zealand when the international standard for snow sports wrist protectors has been agreed on [34].
Snow surface condition and visibility information informs ski area decisions on whether to open all runs. When runs are open regular updates on snow surface con-ditions matched to the ability are needed so that trail choices are a better match for the skier or snowboarder, particularly the novice and intermediate. When mountain weather conditions are changeable good vision is needed for hazard identification. The visual deficiencies created by foggy goggles, inappropriate lens colour, or no optical correction may account for injury on poor visibility days. Decreased visual acuity has been found to delay reaction-times and the ability to take evasive action [36–38]. Regular eye testing and wearing prescription eyewear whilst skiing or snowboarding has been included in the strategy. GPS mapping that pinpoints where incidents are occurring aligned with snow surface conditions and visibility informa-tion could also provide opportunities to mitigate injury. An increased provision of equipment-related information to at-risk groups such as check your set-up, sharpen edges for hard snow conditions, and choose the correct wax to help glide and reduce friction would also be of value [39].
6 Conclusion
Injury trends in snow sports in New Zealand indicate that there was no significant decline over five winters. Future injury prevention priorities need to be based on injury surveillance. Going forward, strategies will be needed to counter, “the higher or faster you go, the harder you fall” phenomena. The high proportion of advanced skiers and intermediate skiers with knee injuries that occurred with non-release in both hard snow and soft snow conditions raises concern that ski-binding release set-tings were too high. To help mitigate equipment-related injury risk skier education on correct set-up is needed alongside industry adoption of international equipment torque testing and practice standards. Knee injuries that occur skiing also beseech an equipment design solution. Using helmets unfortunately was not a panacea for decreasing the number of head injuries but likely reduced the gravity. Further research is needed on head injury to understand why those that are wearing helmets are suffering more head injuries than those that are not protected by a helmet. Risk compensation was one possible explanation. The ability to avoid hazards in poor
New Zealand Snow Sports Injury Trends Over Five Winter Seasons 2010–2014
26
visibility could potentially be enhanced by improving technique, regular eye test-ing, and for those that need it, wearing prescription eyewear on the snow. Wrist protectors were clearly of benefit in reducing wrist fractures in snowboarders. The release of the international snow sports wrist protector standard is eagerly awaited so that wrist protectors with the proven correct dimensions can be promoted. The four deaths that occurred were a sobering reminder that injury prevention efforts cannot diminish. No deaths would be a more than reasonable goal; however, due to human fallibility and the unpredictable challenges faced in mountain terrain this may never reach zero. The development of snowboard brakes could reduce risk of injury during retrieval of a runaway snowboard. Furthermore, when ski area staff open terrain for the public, full account needs to be taken of hard snow surface con-ditions that increase the risk of sliding falls.
7 Limitations
The SAANZ national customer satisfaction survey programme was discontinued in 2010. SAANZ reports for 2010–2014 estimated that these demographics were unchanged; however, there was no data provided to support this assumption. Changes in the make-up of the active snow sports population may have occurred over the years of this study. These surveys may also have had interviewer bias, with one group being interviewed more than another group. There was also no data on the number of people that declined to be interviewed. To effectively target at-risk groups, demographic data (skier, snowboarder, female, or male) needs to be rou-tinely collected at ski areas on each day of operation and included in future analysis of National Incident Data.
Head injury and bare-head count data were only provided by two major ski areas. Counts are needed at all ski areas to more accurately determine the effect of increased helmet use.
Acknowledgements Heads of safety services, ski patrollers, and mountain clinic staff are grate-fully acknowledged for their roles in collecting data. The executive of Ski Areas Association New Zealand and the New Zealand Mountain Safety Council are also acknowledged for providing cen-tral co-ordination and encouragement over the years of this study.
References
1. van Mechelen W, Hlobil H, Kemper HCG (1992) Incidence, severity, aetiology and prevention of sports injuries. A review of concepts. Sports Med 14(2):82–99
2. Hopkins WG, Marshall SW, Batterham AM, Hanin J (2009) Progressive statistics for studies in sports medicine and exercise science. Med Sci Sports Exerc 41(1):3–12
3. Marshall SW (2008) Injury case-control studies using “other injuries” as controls. Epidemiology 19(2):277–279
B.A. Costa-Scorse et al.
27
4. Mueller BA, Cummings B, Rivara FP, Brooks MA, Terasaki RD (2008) Injuries of the head, face, and neck in relation to ski helmet use. Epidemiology 19(2):270–276
5. Shealy J, Ettlinger CE, Scher I, Johnson R (2014) 2010/2011 NSAA 10-year interval injury study. J ASTM Int 20:93–111
6. Laporte JD, Binet MH, Constans D (2000) Evolution of ACL ruptures in French ski resorts 1992–1999. J ASTM Int 13(STP 1397):95–107
7. Greenwald R, Senner V, Swanson S (2001) Biomechanics of carving skis. Schweizerische Z Sportmed Sporttraumatol 49(1):40–44
8. Ruedl G, Linortner I, Schranz A, Fink C, Schindelwig K, Nachbauer W et al (2009) Distribution of injury mechanisms and related factors in ACL-injured female carving skiers. Knee Surg Sports Traumatol Arthrosc 17(11):1393–1398
9. Laporte JD, Binet MH, Bally A (2003) Why the ski binding international standards have been modified in 2001. J ASTM Int 14(STP 1440):64–94
10. Laporte JD, Binet MH, Fenet N, Constans D, Joubert P (2008) Ski bindings and lower leg injuries: a case control study in Flaine 2006. J ASTM Int 17(STP 1510):77–88
11. Costa-Scorse BA, Hopkins WG, Bahr R (eds) (2015) Evaluation of ski-binding-boot system safety using torque testing. ASTM Special Technical Publication, West Conshohocken
12. Costa-Scorse BA, Hopkins WG, Bahr R, Lamont M (eds) (2015) Translation of international snow-sports equipment standards into injury-prevention practice. ASTM Special Technical Publication, West Conshohocken
13. ISO-11088:2006(E). Assembly, adjustment and inspection of an alpine ski-binding-boot (S-B- B) system. International Organization for Standardization, Geneva
14. ISO-13993:2001(E). Rental ski shop practice—sampling and inspection of complete and incomplete alpine ski-binding-boot systems in rental applications. International Organization for Standardization, Geneva
15. F-1063–03. Standard practice for functional inspections and adjustments of alpine ski- binding- boot systems. ASTM International, West Conshohocken
16. F-1064–03. Standard practice for sampling and inspection of complete and incomplete alpine ski-binding-boot systems in rental applications. ASTM International, West Conshohocken
17. Senner V, Michel FI, Lehner S, Brügger O (2013) Technical possibilities for optimising the ski-binding-boot functional unit to reduce knee injuries in recreational alpine skiing. Sports Eng 16(4):211–228
18. Senner V, Michel FI, Lehner S (2013) Ski equipment-related measures to reduce knee injuries. Swiss Council for Accident Prevention, Berne
19. Donald S, Chalmers D, Theis J-C (2005) Are snowboarders more likely to damage their spines than skiers? Lessons learned from a study of spinal injuries from the Otago skifields in New Zealand. N Z Med J 118:U1530
20. Bianchi G, Michel FI, Brügger O (2012) The use of wrist guards by snowboarders in Switzerland. J ASTM Int (STP 1553):38–53
21. Bianchi G, Brügger O, Niemann S, Cavegn M (2011) Helmet use and self-reported risk taking in skiing and snowboarding. J ASTM Int 8(1):1–8
22. Scher I, Richards D, Carhart M (2006) Head injury in snowboarding: evaluating the protective role of helmets. J ASTM Int 3(4):1–9
23. Sulheim S, Holme I, Ekeland A, Bahr R (2006) Helmet use and risk of head injuries in alpine skiers and snowboarders. J Am Med Assoc 295(8):919–924
24. Scher I, Richards D, Carhart M, Thomas R, Hurlen N, Lam T (2009) Pediatric head and neck injuries in snow sports: evaluating the influence of helmets. ASTM Special Tech Publ 5(4):91–107
25. Hagel BE, Russell K, Goulet C, Nettel-Aquirre A, Pless IB (2010) Helmet use and risk of neck injury in skiers and snowboarders. Am J Epidemiol 171(10):1134–1143
26. Shealy JE, Johnson RJ, Ettlinger CE (2006) On piste fatalities in recreational snow sports in the US. ASTM Special Tech Publ 3(5):27–34
27. Scott MD, Buller DB, Andersen PA, Walkosz BJ, Voeks JH, Dignan MB, Cutter GR (2007) Testing the risk compensation hypothesis for safety helmets in alpine skiing and snowboard-ing. Inj Prev 13:173–177
New Zealand Snow Sports Injury Trends Over Five Winter Seasons 2010–2014
28
28. Ruedl G, Abart M, Ledochowski L, Burtscher M, Kopp M (2012) Self-reported risk taking and risk compensation in skiers and snowboarders are associated with sensation seeking. Accid Anal Prev 48:292–296
29. Costa-Scorse B, Hoyle A, Davidson M, Dooney A, Clinton-Baker P, Lamont M, et al. (2015) New Zealand snow sports injury prevention strategy (2015–2020)—a snow sports industry initiative. Wellington, New Zealand: Ski Areas Assoc New Zealand
30. Dickson TJ, Trathen S, Waddington G (2011) Investigating characteristics of head impacts in paediatric snowsport participants: using telemetry, GPS positioning and acceleration logging. Procedia Eng 13:476–480
31. Cooper N, Greenwald R (2006) Observational study on fall trends in snowboarding. J ASTM Int 3(5):19–25
32. Kim S, Endres NK, Johnson RJ, Ettlinger CF, Shealy JE (2012) Snowboarding injuries: trends over time and comparisons with alpine skiing injuries. Am J Sports Med 40:770–776
33. Russell K, Meeuwisse WH, Nettel-Aguirre A, Emery CA, Wishart J, Romanow NTR et al (2014) Feature-specific terrain park-injury rates and risk factors in snowboarders: a case- control study. Br J Sports Med 48(1):23–28
34. Michel FI, Schmitt KU, Greenwald RM, Russell K, Simpson FI, Schulz D et al (2013) White paper: functionality and efficacy of wrist protectors in snowboarding-towards a harmonized international standard. Sports Eng 16(4):197–210
35. Lehner S, Geyer T, Michel FI, Schmitt KU, Senner V (eds) (2014) Wrist injuries in snowboard-ing: simulation of a worst case scenario of snowboard falls. Procedia Eng 72:255–260
36. Jendrusch G, Senner V, Schaff P, Heck H (1999) Vision—an essential factor for safety in ski-ing: visual acuity, stereoscopic depth percetion, effect of colored lenses. J ASTM Int 12(STP 1345):22–34
37. Senner V, Jendrusch G, Schaff P, Heck H (1999) Vision—an essential factor for safety in skiiing: perception, reaction, and motion control aspects. J ASTM Int 12(STP 1345):11–22
38. Harley E, Scher I, Stepan L, Young DE, Shealy J (2010) Reaction times of skiers and snow-boarders. J ASTM Int 18(STP 1525):90–98
39. Coupe RC, Spells SS (2010) Towards a methadology for comparing the effectiveness of differ-ent alpine ski waxes. Sports Eng 12:55
Open Access This chapter is distributed under the terms of the Creative Commons Attribution-Noncommercial 2.5 License (http://creativecommons.org/licenses/by-nc/2.5/) which permits any noncommercial use, distribution, and reproduction in any medium, provided the original author(s) and source are credited.
The images or other third party material in this chapter are included in the work’s Creative Commons license, unless indicated otherwise in the credit line; if such material is not included in the work’s Creative Commons license and the respective action is not permitted by statutory regu-lation, users will need to obtain permission from the license holder to duplicate, adapt or reproduce the material.
B.A. Costa-Scorse et al.
29© The Author(s) 2017 I.S. Scher et al. (eds.), Snow Sports Trauma and Safety, DOI 10.1007/978-3-319-52755-0_3
Skiing and Snowboarding in Switzerland: Trends in Injury and Fatality Rates Over Time
Giannina Bianchi, Othmar Brügger, and Steffen Niemann
Abstract Introduction: Skiing and snowboarding are two of the most popular sports in Switzerland, but their popularity means that the absolute number of injuries remains high. To plan and evaluate effective injury prevention, detailed insights into the injuries that occur are needed. Objective: The aim of this study was to character-ize the current status (average winter season 2008–2012) and trends in injury rate (between 2005 and 2012) and fatality rate (between 2000 and 2014) among skiers and snowboarders in Switzerland. Materials/Methods: Injury data from different sources were collected and analyzed. Extrapolation and estimates were made based on a special household survey and insurance data. All fatal injuries were recorded in a separate database. Moreover, an annual survey on Swiss slopes was conducted that delivered different information about skiers and snowboarders in these areas. Skier days were collected by the Swiss Cableways. Results: The rate of sustaining an injury while skiing or snowboarding on Swiss slopes was 2.8 per 1000 skier days on aver-age from 2008 to 2010. The fatality rate was 0.7 deaths per one million skier days in the same period of time. The injury rate remained relatively stable between 2005 and 2012, and the fatality rate has not changed since 2000. Discussion: Compared with other countries, the rates of injury or even fatality while skiing or snowboarding falls in the mid-range for Switzerland; however, further prevention efforts targeting behav-ior and conditions are needed to minimize and even reduce injuries.
Keywords Skiing • Snowboarding • Injury rate • Epidemiology
1 Introduction
Skiing and snowboarding are two of the most popular sports in Switzerland. Each year, some 2.5 million Swiss residents take to the slopes at least occasionally on skis and another 370,000 on snowboards [1]. Moreover, ski tourism in Switzerland attracts many visitors from other countries. Around a quarter of skiers and
G. Bianchi (*) • O. Brügger • S. Niemann bfu—Swiss Council for Accident Prevention, Hodlerstrasse 5a, CH-3011 Berne, Switzerlande-mail: [email protected]
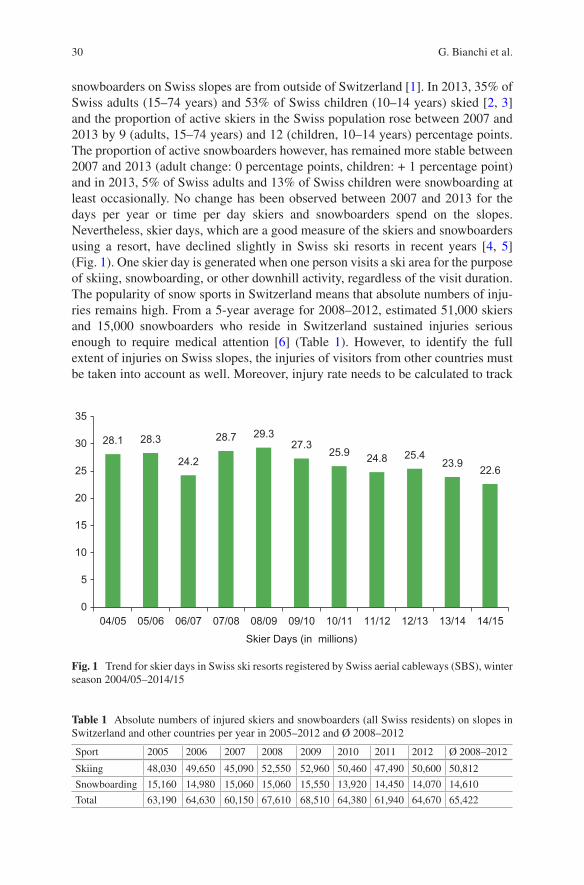
30
snowboarders on Swiss slopes are from outside of Switzerland [1]. In 2013, 35% of Swiss adults (15–74 years) and 53% of Swiss children (10–14 years) skied [2, 3] and the proportion of active skiers in the Swiss population rose between 2007 and 2013 by 9 (adults, 15–74 years) and 12 (children, 10–14 years) percentage points. The proportion of active snowboarders however, has remained more stable between 2007 and 2013 (adult change: 0 percentage points, children: + 1 percentage point) and in 2013, 5% of Swiss adults and 13% of Swiss children were snowboarding at least occasionally. No change has been observed between 2007 and 2013 for the days per year or time per day skiers and snowboarders spend on the slopes. Nevertheless, skier days, which are a good measure of the skiers and snowboarders using a resort, have declined slightly in Swiss ski resorts in recent years [4, 5] (Fig. 1). One skier day is generated when one person visits a ski area for the purpose of skiing, snowboarding, or other downhill activity, regardless of the visit duration. The popularity of snow sports in Switzerland means that absolute numbers of inju-ries remains high. From a 5-year average for 2008–2012, estimated 51,000 skiers and 15,000 snowboarders who reside in Switzerland sustained injuries serious enough to require medical attention [6] (Table 1). However, to identify the full extent of injuries on Swiss slopes, the injuries of visitors from other countries must be taken into account as well. Moreover, injury rate needs to be calculated to track
28.1 28.3
24.2
28.7 29.327.3
25.9 24.8 25.423.9
22.6
0
5
10
15
20
25
30
35
04/05 05/06 06/07 07/08 08/09 09/10 10/11 11/12 12/13 13/14 14/15
Skier Days (in millions)
Fig. 1 Trend for skier days in Swiss ski resorts registered by Swiss aerial cableways (SBS), winter season 2004/05–2014/15
Table 1 Absolute numbers of injured skiers and snowboarders (all Swiss residents) on slopes in Switzerland and other countries per year in 2005–2012 and Ø 2008–2012
Sport 2005 2006 2007 2008 2009 2010 2011 2012 Ø 2008–2012
Skiing 48,030 49,650 45,090 52,550 52,960 50,460 47,490 50,600 50,812
Snowboarding 15,160 14,980 15,060 15,060 15,550 13,920 14,450 14,070 14,610
Total 63,190 64,630 60,150 67,610 68,510 64,380 61,940 64,670 65,422
G. Bianchi et al.
31
trends and compare it with the injury rate associated with other sports and other countries. Detailed insights into the injuries that occur are the basis for planning and evaluating effective injury prevention.
2 Objective
The aim of this study was to portray the current status (average winter season 2008–2012) and trends in injury rate (between 2005 and 2012) and fatality rate (between 2000 and 2014) among snow skiers and snowboarders in Switzerland.
3 Materials and Methods
Snow sport injuries have been recorded in Switzerland in a variety of injury data-bases, in some cases for as long as 30 years. However, no data covering all popula-tion groups or the whole of Switzerland are available for the sports sector, and estimates must be used. The estimated absolute number of injuries sustained by Swiss residents while skiing and snowboarding on slopes in and outside of Switzerland has served as a basis for the present calculations [6] (Table 1). Primarily, the data for the estimation were acquired in a special survey of 15,000 Swiss house-holds using computer-assisted telephone interviews [7]. This calculation is not part of the current study and can be accessed in the corresponding report [7].
To calculate the full extent of injuries in Swiss ski resorts, several assumptions based on different data bases were required. Data from the Central Office for Statistics under the Federal Law for Accident Insurance enable determination of the proportion of injuries that Swiss residents sustain on slopes outside of Switzerland [6]. This information contains data on injuries sustained by around four million employed people (approximately 50% of the Swiss population). However, data are missing for some population groups such as children, students, senior citizens, those who are not employed, or visitors from other countries. Therefore, the database described in the following was also consulted. To evaluate personal protective equip-ment used in winter sports (helmet, wrist protector, back protector), a sample survey is conducted every year on different runs in 21 snow sport resorts, and demographic information like age, gender, type of sport, and country of residence is collected as well [8]. Since winter 2002/03, more than 5000 skiers and snowboarders have been randomly selected and surveyed annually. This survey allows estimation of the pro-portion of skiers and snowboarders as well as Swiss residents and visitors from other countries on Swiss slopes. Moreover, a full survey of all fatal sports accidents has been recorded in a separate database since 2000 [9, 10]. These data include all fatali-ties that have occurred during sporting activities (excluding road traffic accidents) if the victims died as a result of the injury either at the site or within 30 days of the accident. Due to the variety of variables tracked, these data give insight into skiing and snowboarding fatalities and allow for their detailed analysis.
Skiing and Snowboarding in Switzerland: Trends in Injury and Fatality Rates Over Time
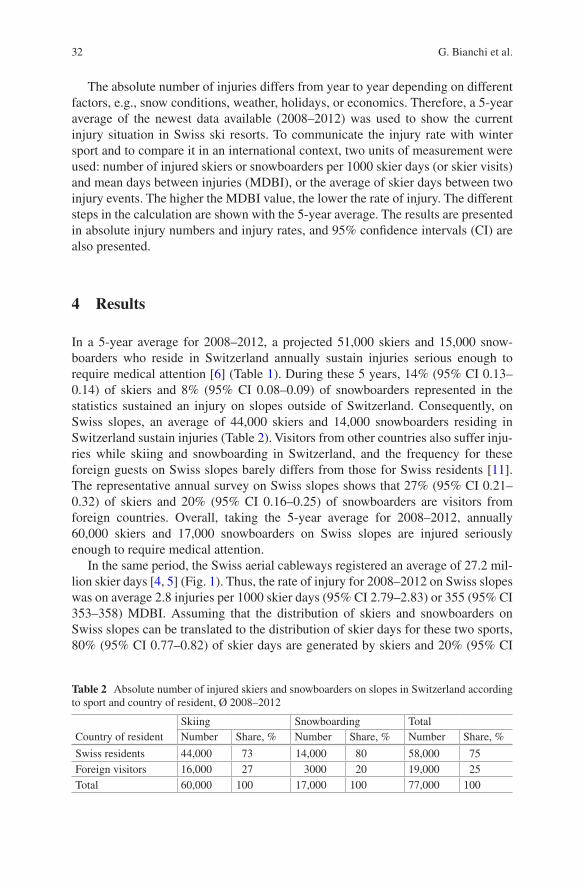
32
The absolute number of injuries differs from year to year depending on different factors, e.g., snow conditions, weather, holidays, or economics. Therefore, a 5-year average of the newest data available (2008–2012) was used to show the current injury situation in Swiss ski resorts. To communicate the injury rate with winter sport and to compare it in an international context, two units of measurement were used: number of injured skiers or snowboarders per 1000 skier days (or skier visits) and mean days between injuries (MDBI), or the average of skier days between two injury events. The higher the MDBI value, the lower the rate of injury. The different steps in the calculation are shown with the 5-year average. The results are presented in absolute injury numbers and injury rates, and 95% confidence intervals (CI) are also presented.
4 Results
In a 5-year average for 2008–2012, a projected 51,000 skiers and 15,000 snow-boarders who reside in Switzerland annually sustain injuries serious enough to require medical attention [6] (Table 1). During these 5 years, 14% (95% CI 0.13–0.14) of skiers and 8% (95% CI 0.08–0.09) of snowboarders represented in the statistics sustained an injury on slopes outside of Switzerland. Consequently, on Swiss slopes, an average of 44,000 skiers and 14,000 snowboarders residing in Switzerland sustain injuries (Table 2). Visitors from other countries also suffer inju-ries while skiing and snowboarding in Switzerland, and the frequency for these foreign guests on Swiss slopes barely differs from those for Swiss residents [11]. The representative annual survey on Swiss slopes shows that 27% (95% CI 0.21–0.32) of skiers and 20% (95% CI 0.16–0.25) of snowboarders are visitors from foreign countries. Overall, taking the 5-year average for 2008–2012, annually 60,000 skiers and 17,000 snowboarders on Swiss slopes are injured seriously enough to require medical attention.
In the same period, the Swiss aerial cableways registered an average of 27.2 mil-lion skier days [4, 5] (Fig. 1). Thus, the rate of injury for 2008–2012 on Swiss slopes was on average 2.8 injuries per 1000 skier days (95% CI 2.79–2.83) or 355 (95% CI 353–358) MDBI. Assuming that the distribution of skiers and snowboarders on Swiss slopes can be translated to the distribution of skier days for these two sports, 80% (95% CI 0.77–0.82) of skier days are generated by skiers and 20% (95% CI
Table 2 Absolute number of injured skiers and snowboarders on slopes in Switzerland according to sport and country of resident, Ø 2008–2012
Country of residentSkiing Snowboarding TotalNumber Share, % Number Share, % Number Share, %
Swiss residents 44,000 73 14,000 80 58,000 75Foreign visitors 16,000 27 3000 20 19,000 25Total 60,000 100 17,000 100 77,000 100
G. Bianchi et al.
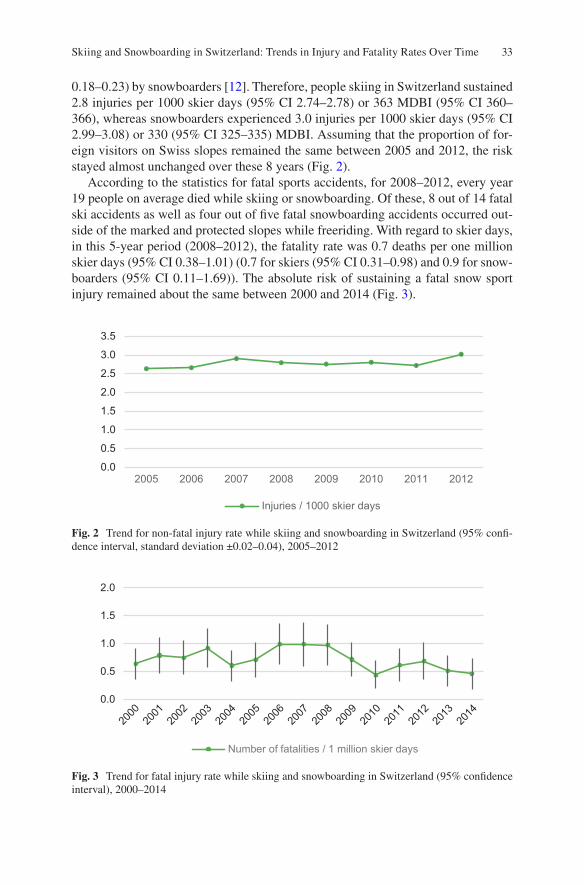
33
0.18–0.23) by snowboarders [12]. Therefore, people skiing in Switzerland sustained 2.8 injuries per 1000 skier days (95% CI 2.74–2.78) or 363 MDBI (95% CI 360–366), whereas snowboarders experienced 3.0 injuries per 1000 skier days (95% CI 2.99–3.08) or 330 (95% CI 325–335) MDBI. Assuming that the proportion of for-eign visitors on Swiss slopes remained the same between 2005 and 2012, the risk stayed almost unchanged over these 8 years (Fig. 2).
According to the statistics for fatal sports accidents, for 2008–2012, every year 19 people on average died while skiing or snowboarding. Of these, 8 out of 14 fatal ski accidents as well as four out of five fatal snowboarding accidents occurred out-side of the marked and protected slopes while freeriding. With regard to skier days, in this 5-year period (2008–2012), the fatality rate was 0.7 deaths per one million skier days (95% CI 0.38–1.01) (0.7 for skiers (95% CI 0.31–0.98) and 0.9 for snow-boarders (95% CI 0.11–1.69)). The absolute risk of sustaining a fatal snow sport injury remained about the same between 2000 and 2014 (Fig. 3).
0.0
0.5
1.0
1.5
2.0
2.5
3.0
3.5
2005 2006 2007 2008 2009 2010 2011 2012
Injuries / 1000 skier days
Fig. 2 Trend for non-fatal injury rate while skiing and snowboarding in Switzerland (95% confi-dence interval, standard deviation ±0.02–0.04), 2005–2012
0.0
0.5
1.0
1.5
2.0
2000
2001
2002
2003
2004
2005
2006
2007
2008
2009
2010
2011
2012
2013
2014
Number of fatalities / 1 million skier days
Fig. 3 Trend for fatal injury rate while skiing and snowboarding in Switzerland (95% confidence interval), 2000–2014
Skiing and Snowboarding in Switzerland: Trends in Injury and Fatality Rates Over Time
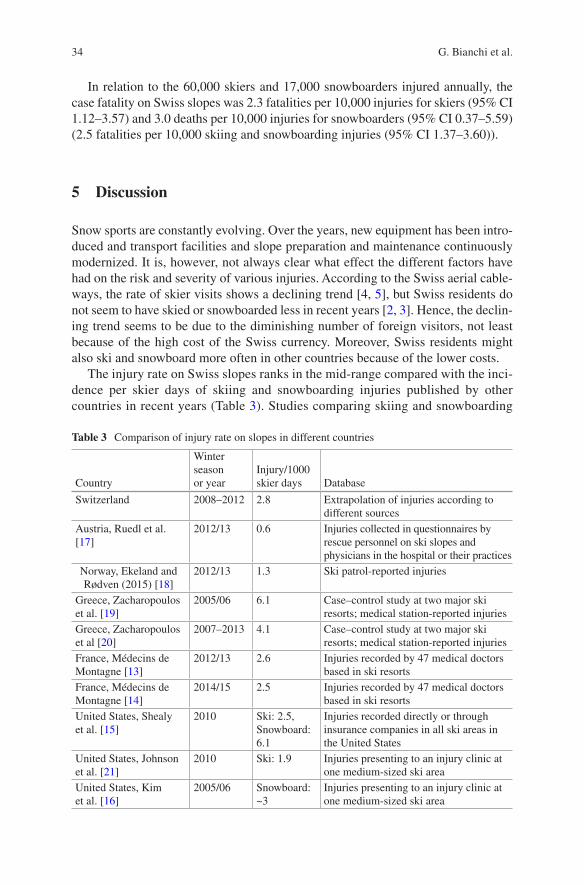
34
In relation to the 60,000 skiers and 17,000 snowboarders injured annually, the case fatality on Swiss slopes was 2.3 fatalities per 10,000 injuries for skiers (95% CI 1.12–3.57) and 3.0 deaths per 10,000 injuries for snowboarders (95% CI 0.37–5.59) (2.5 fatalities per 10,000 skiing and snowboarding injuries (95% CI 1.37–3.60)).
5 Discussion
Snow sports are constantly evolving. Over the years, new equipment has been intro-duced and transport facilities and slope preparation and maintenance continuously modernized. It is, however, not always clear what effect the different factors have had on the risk and severity of various injuries. According to the Swiss aerial cable-ways, the rate of skier visits shows a declining trend [4, 5], but Swiss residents do not seem to have skied or snowboarded less in recent years [2, 3]. Hence, the declin-ing trend seems to be due to the diminishing number of foreign visitors, not least because of the high cost of the Swiss currency. Moreover, Swiss residents might also ski and snowboard more often in other countries because of the lower costs.
The injury rate on Swiss slopes ranks in the mid-range compared with the inci-dence per skier days of skiing and snowboarding injuries published by other countries in recent years (Table 3). Studies comparing skiing and snowboarding
Table 3 Comparison of injury rate on slopes in different countries
Country
Winter season or year
Injury/1000 skier days Database
Switzerland 2008–2012 2.8 Extrapolation of injuries according to different sources
Austria, Ruedl et al. [17]
2012/13 0.6 Injuries collected in questionnaires by rescue personnel on ski slopes and physicians in the hospital or their practices
Norway, Ekeland and Rødven (2015) [18]
2012/13 1.3 Ski patrol-reported injuries
Greece, Zacharopoulos et al. [19]
2005/06 6.1 Case–control study at two major ski resorts; medical station-reported injuries
Greece, Zacharopoulos et al [20]
2007–2013 4.1 Case–control study at two major ski resorts; medical station-reported injuries
France, Médecins de Montagne [13]
2012/13 2.6 Injuries recorded by 47 medical doctors based in ski resorts
France, Médecins de Montagne [14]
2014/15 2.5 Injuries recorded by 47 medical doctors based in ski resorts
United States, Shealy et al. [15]
2010 Ski: 2.5, Snowboard: 6.1
Injuries recorded directly or through insurance companies in all ski areas in the United States
United States, Johnson et al. [21]
2010 Ski: 1.9 Injuries presenting to an injury clinic at one medium-sized ski area
United States, Kim et al. [16]
2005/06 Snowboard: ~3
Injuries presenting to an injury clinic at one medium-sized ski area
G. Bianchi et al.
35
injuries all find a higher injury risk for snowboarders compared to skiers [13–16]. The lowest rate has been reported in two studies from Austria (0.6 injuries/1000 skier days) [17] and Norway (1.3 injuries/1000 skier days) [18], both made in winter 2012/13. The highest published injury rate was observed in Greece in win-ter 2005/06 (6.1 injuries per 1000 skier days) [19]. However, the injury rate dur-ing the period 2007–2013 was still 4.1 injuries per 1000 skier days [20]. In France, the injury rate has been reported to be almost the same as in Switzerland, with snow sport participants sustaining 2.6 injuries per 1000 skier days in winter 2012/13 (ski: 2.5, snowboard: 2.9) [13]. Newer data from France, however, show an even lower rate of 2.5 injuries per 1000 skier days (winter 2014/15) [14]. In the United States in winter 2010, the injury rate for skiers was also lower than in Switzerland (2.5 injuries/1000 visits), but the rate for snowboarders sustaining an injury on slopes in the United States was 6.1 injuries per 1000 visits, much higher than in Switzerland [15]. In comparison, another US study using injury reports from one medium-sized northern ski area found an overall injury rate of only 1.9 injuries per 1000 skier visits (excluding snowboarders) for 2010 [21]. In addition, snowboard injuries at the same ski area analyzed in another study showed a much lower incidence than that calculated for the United States overall [16]. In that study, in one 5-year period (2001/02–2005/06), the risk for sustaining a snow-board injury was lower than 300 MDBI, which corresponds to around three inju-ries per 1000 skier days.
Data collection and analysis methods vary among countries. Some calculations are based on ski patrol reports [18], others on information gained from physicians in hospitals or doctors based in ski resorts [13, 14, 16, 19–21], and other on combi-nations of different methods of data collection [15, 17]. Therefore, it is difficult to compare the injury incidence among the various countries. One review article addressing snowboarding injuries has illustrated the wide range of injury rate due to different databases and years; the authors found injury rates ranging from 0.8 to 8.0 per 1000 snowboarder days [22].
In Switzerland, no clear change can be identified in the development of overall rate (Figs. 2 and 3). Injuries have remained relatively stable between 2005 and 2012. A similar observation can be made for Norway between 1996 and 2012, where the injury rate varied between 1.2 and 1.5 injuries per 1000 skier days [18, 23]. In France, the rate for sustaining an injury has remained the same over a long period of time (1992–2014), and the skiing injury rate has increased and decreased only little over more than 20 years [14, 24]. However, a slightly growing rate of injury was observed for snowboarders between 1992 and 2005 (from 2.6 to 2.7 injuries per 1000 skier days), followed by a subsequent reversal trend with the lowest rate of 2.4 injuries/1000 skier days in 2010. Studies from the United States demonstrate an increase in injury rate for snowboarders since the turn of the millennium, whereas the risk of sustaining an injury while skiing decreased over the years [16]. Another US study calculated a decrease of 55% in injury rate while skiing, down to 1.9 inju-ries per 1000 skier visits since the 1970s [25]. In Austria, a decline in overall snow sports injury rate was observed for skiers and snowboarders: the risk of sustaining an injury dropped from 1.4 in 1997/98 to 1.3 injuries per 1000 skier days in 2002/03 [26]. Moreover, another Austrian study showed a further decline to 0.6 injuries/1000
Skiing and Snowboarding in Switzerland: Trends in Injury and Fatality Rates Over Time
36
skier days up to 2012/13 [17]. It seems that in many regions, the overall risk of sustaining a snow sport injury has remained the same or even dropped through the years. It can be assumed that snow sports have been made safer, especially from the 1970s to the 1990s, when the injury risk was halved [27]. Relating to the data of various other countries, it can be speculated that the risk of skiing injury decreased while the risk of a snowboarding injury slightly increased.
According to calculations from the Observatory Sport and Physical Activity Switzerland, the Swiss population experienced some 35 medically treated injuries per 100,000 h of skiing activity and 77 injuries per 100,000 h of snowboarding activity [28]. To compare, the highest estimated rate in that study was 193 injuries per 100,000 h of playing soccer, and the lowest was 3 per 100,000 h of practicing fitness, aerobic, or gymnastics. Hence, across all types of sport, the injury rate in snow sports ranks in the mid-range. Although the exposure-related injury rate is quite low in comparison to other types of sport, the popularity of snow sports in Switzerland means that the absolute number of injuries remains high.
In Switzerland, the rate of sustaining a fatal snow sport injury has changed little since the turn of millennium (Fig. 2). In those 15 years, only a few studies have been published showing the fatality rate while skiing or snowboarding on slopes. In the United States, different studies by the same research group have relied on several databases [29–31]. In 2006, these authors published their newest study, which took into account different sources and therefore gives the best over-all view [31]. On average, of the 14 winter seasons included in their study (1991/92–2004/05), the overall death rate was 0.7 death per million skier visits and thus similar to the rate on Swiss slopes. In contrast to the data generated in Switzerland, the incidence rate of fatalities in skiing (0.8 deaths per million skier visits) remains greater than for snowboarding (0.5 deaths per million skier visits). In accordance with the Swiss data, no evidence suggests that the fatality rates for snowboarding or skiing have changed significantly over the years. However, no data from this database are available for the United States since 2004/05. According to US data collected by the National Ski Areas Association (NSAA), the fatality rate in the winter 2014/15 was 0.7 per million skier visits [32]. In a 5-year average, 0.7 deaths occurred per one million skier visits, which is compa-rable with the data from Switzerland. Moreover, no increase or decrease in the NSAA data emerged in the study period.
In Austria, the reported average is 0.4 skier and snowboarder fatalities per mil-lion skier days, resulting from trauma (i.e., fall, collision, impact, avalanche on the slopes) [33]. In contrast to the studies from Switzerland and the United States, the Austrian study excluded fatalities happening off-piste. In Switzerland, almost two thirds of skiing and snowboarding fatalities have occurred outside marked and secured slopes. Moreover, the Austrian study showed that another 0.4 deaths per million skier days resulted from non-trauma-related (primarily cardiac arrest) inci-dents. Non-traumatic events are not included in the Swiss database of fatal sports accidents. Even if the rates are not directly comparable because different databases were used, however, the rates of fatal ski and snowboard accidents among the dif-ferent countries are similar.
G. Bianchi et al.
37
6 Study Limitations
Snow sport injuries have been recorded in Switzerland in a variety of injury databases. However, no data covering all population groups or the whole of Switzerland are avail-able for the sports sector, so estimates must be used. Moreover, some data (e.g., pro-portion of visitors from other countries) are not available for every year individually forcing the assumption that the proportion remains the same over different winter sea-sons. This study was not designed to address data quality, per se, however, quality assurance measures to uncover inconsistencies and other anomalies in the data were consistently applied. Although the data quality was checked in many areas, bias cannot be ruled out. Future research is planned to evaluate the data validity more precisely.
7 Conclusion
The rate of sustaining an injury while skiing or snowboarding on Swiss slopes was 2.8 per 1000 skier days on average from 2008 to 2010. The fatality rate in the same period was 0.7 deaths per one million skier days. Injury rates have remained rela-tively stable between 2005 and 2012, and fatality rate has not shifted since the turn of the millennium. Compared with other countries, in Switzerland, the rates of injury and fatality ranks in the mid-range. Even if the exposure-related injury rate is quite low in comparison to other types of sports, the popularity of snow sports in Switzerland means that the absolute number of injuries remains high. Further pre-vention efforts targeting behavior (e.g., the wearing of personal protective equip-ment) and conditions (e.g., the safer construction of snow parks) are needed to minimize or even reduce these numbers [34].
References
1. Bianchi G, Brügger O (2016) [Injuries in skiing and snowboarding in Switzerland: accident situation, risk estimation and development], summary in English. bfu—Swiss Council for Accident Prevention. http://www.bfu.ch/de/bestellen/alles?k=2.286. Accessed 12 Dec 2016
2. Lamprecht M, Fischer A, Stamm H (2014) [Sport in Switzerland 2014: sport behaviour in the Swiss Population]. Swiss Federal Office for Sport (FOSPO). http://www.sportobs.ch/filead-min/sportobs-dateien/Downloads/Sport_Schweiz_2014_d.pdf. Accessed 12 Jan 2016
3. Lamprecht M, Fischer A, Stamm H (2014) [Sport in Switzerland 2014: report on children and adolescents]. Swiss Federal Office for Sport (FOSPO). http://www.sportobs.ch/fileadmin/spor-tobs-dateien/Downloads/2014_Kinder_Jugendbericht_d_screen.pdf. Accessed 12 Jan 2016
4. Vanat L (2015) 2014 International report on snow & mountain tourism: overview of the key industry figures for ski resorts. www.vanat.ch/RM-world-report-2014.pdf. Accessed 12 Jan 2016
5. Vanat L (2015) Saisonbilanz winter 2014/15—Entwicklungen. Erkenntnisse und Prognosen. Swiss Cableways (SBS). http://vanat.ch/RM-CH-palmares-JS2015-R-D-Laurent%20Vanat.pdf. Accessed 12 Jan 2016
Skiing and Snowboarding in Switzerland: Trends in Injury and Fatality Rates Over Time
38
6. bfu—Swiss Council for Accident Prevention (2015) STATUS 2015 statistics on non- occupational accidents and the level of safety in Switzerland. bfu. http://www.bfu.ch/de/bestellen/alles?k=2.265. Accessed 12 Jan 2016
7. Niemann S, Lieb C, Sommer H (2015) [Non-occupational accidents in Switzerland: updated extrapolation and cost calculation]; condensed version in English. bfu—Swiss Council for Accident Prevention. http://www.bfu.ch/de/bestellen/alles?k=2.246. Accessed 12 Jan 2016
8. bfu—Swiss Council for Accident Prevention (2015) bfu survey 2015: use of protective equip-ment in skiing and snowboarding. bfu. www.bfu.ch/de/bestellen/alles?k=2.999. Accessed 12 Jan 2016
9. Bianchi G (2015) bfu-survey 2015: fatal sports accidents in Switzerland 2000–2014. bfu—Swiss Council for Accident Prevention. www.bfu.ch/de/bestellen/alles?k=2.999. Accessed 16 Jan 2016
10. Bianchi G, Brügger O (2013) [bfu statistics on fatal sports accidents in Switzerland, 2000–2012]. bfu—Swiss Council for Accident Prevention. http://www.bfu.ch/de/bestellen/alles?k=2.117. Accessed 12 Jan 2016
11. Fuchs B, Gmünder C, Brügger O et al. (2005) [Individual protective gear in snow sport: survey of wearer behaviour and reasons for wearing], summary in English. bfu—Swiss Council for Accident Prevention. http://www.bfu.ch/de/bestellen/alles?k=2.999. Accessed 12 Jan 2016
12. bfu—Swiss Council for Accident Prevention (2015) bfu-survey 2015: use of protective equip-ment in skiing and snowboarding, special analysis (unpublished). bfu, Berne
13. Médecins de Montagne (2013) L’accidentologie des sports d’hiver: Hiver 2012–2013, Dossier de Presse. Accidentologie des sports d’hiver. http://www.mdem.org. Accessed 22 Sept 2014
14. Médecins de Montagne (2015) L’accidentologie des sports d’hiver: Hiver 2014–2015, Dossier de Presse. Accidentologie des sports d’hiver. http://www.mdem.org. Accessed 11 Jan 2016
15. Shealy JE, Ettlinger CF, Scher I et al (2015) 2010/2011 NSAA 10-year interval injury study. J ASTM Int 20:93–111. doi:10.1520/STP158220140002
16. Kim S, Endres NK, Johnson RJ et al (2012) Snowboarding injuries: trends over time and com-parisons with alpine skiing injuries. Am J Sport Med 40(4):770–776. doi:10.1177/ 0363546511433279
17. Ruedl G, Philippe M, Sommersacher R et al (2014) Current incidence of accidents on Austrian ski slopes. Sportverl Sportschad 28(4):183–187. doi:10.1055/s-0034-1385244
18. Ekeland A, Rødven A (2015) A injury trends in Norwegian ski resorts during the 16 years period 1996–2012. In: Petrone N, Marcolin G (eds) Book of abstract: 21st international con-gress on Ski trauma and skiing safety, International Society for Skiing Safety, San Vito di Cadore, 8–13 March 2015, p 65
19. Zacharopoulos A, Tzanakakis N, Douka M (2008) Skiing and snowboarding injuries in Greece: a two-year case-control study. J ASTM Int 5(6):23–30. doi:10.1520/STP47462S
20. Zacharopoulos A, Smyrnis A, Vlastos I et al (2015) Skiing injuries in Greece: a six years case- control study (2007–2013). J ASTM Int 20:122–140. doi:10.1520/STP158220140006
21. Johnson RJ, Ettlinger CF, Shealy JE (2011) Skier injury trends, 1972 to 2010. In: Scher I, Greenwald R (eds) Book of abstract: 19th International Congress on Ski Trauma and Skiing Safety, Keystone, 1–7 May 2011
22. Russell K, Hagel B, Goulet C (2010) Snowboarding. In: Caine DJ, Harmer PA, Schiff MA (eds) Epidemiology of injuries in olympic sports. Blackwell, Oxford, pp 447–472. doi:10.1002/9781444316872.ch29
23. Ekeland A, Rødven A (2009) Injury trends in Norwegian ski resorts in the 10 year period 1996–2006. J ASTM Int 17:31–38. doi:10.1520/JAO101620
24. Laporte JD, Bajolle L, Lamy D et al (2012) Winter sports injuries in France over two decades. J ASTM Int 19:201–213. doi:10.1520/STP20120055
25. Johnson RJ (2009) Update on injury trends in Alpine Skiing. J ASTM Int 5(10):11–22. doi:10.1520/JAI102046
26. Burtscher M, Gatterer H, Flatz M et al (2008) Effects of modern ski equipment on the overall injury rate and the pattern of injury location in Alpine skiing. Clin J Sport Med 18(4):355–357. doi:10.1097/MJT.0b013e31815fd0fe
G. Bianchi et al.
39
27. Koehle MS, Lloyd-Smith R, Taunton JE (2002) Alpine ski injuries and their prevention. Sports Med 32(12):785–793. doi:10.2165/00007256-200232120-00003
28. Observatory Sport and Physical Activity Switzerland (2015) Indikator 4.1: Niveau und Entwicklung der Sportunfälle und- verletzungen. http://www.sportobs.ch/fileadmin/sportobs- dateien/Indikatoren_PDF/IND_4_1.pdf. Accessed 12 Jan 2016
29. Shealy JE, Thomson T (1996) Death in downhill skiing from 1976 trough 1992: a retrospective view. In: Mote CD, Johnson RJ, Hauser W, Schaff PS (eds) Skiing trauma and safety: tenth volume, ASTM STP 1266. American Society for Testing and Materials, West Conshohocken, pp 66–72. doi:10.1520/STP37915S
30. Shealy JE, Ettlinger CF, Johnson RJ (2000) Rates and modalities of death in the U.S.: snow-boarding and skiing differences 1991/92 through 1998/99. In: Johnson RJ, Zucco P, Shealy JE (eds) Skiing trauma and safety: thirteenth volume, ASTM STP 1397. American Society for Testing and Materials, West Conshohocken, pp 132–138. doi:10.1520/STP12871S
31. Shealy JE, Johnson RJ, Ettlinger CF (2006) On Piste fatalities in recreational snow sports in the U.S. J ASTM Int 3(5):27–34. doi:10.1520/JAI13893
32. National Ski Areas Association NSAA (2015) Skier/Snowboarder fatality incidents during 2014–15 season. National Ski Areas Acciciation NSAA. http://www.nsaa.org/media/254886/Fatality_Fact_Sheet_10_15_2015.pdf. Accessed 12 Jan 2016
33. Ruedl G, Bilek H, Ebner H et al (2011) Fatalities on Austrian ski slopes during a 5-year period. Wild Environ Med 22(4):326–328. doi:10.1016/j.wem.2011.06.008
34. Bianchi G, Brügger O (2015) National strategy for preventing injuries from skiing and snow-boarding in Switzerland. Schweiz Z Sportmed Sporttrauma 63(2):6–12
Open Access This chapter is distributed under the terms of the Creative Commons Attribution-Noncommercial 2.5 License (http://creativecommons.org/licenses/by-nc/2.5/) which permits any noncommercial use, distribution, and reproduction in any medium, provided the original author(s) and source are credited.
The images or other third party material in this chapter are included in the work’s Creative Commons license, unless indicated otherwise in the credit line; if such material is not included in the work’s Creative Commons license and the respective action is not permitted by statutory regu-lation, users will need to obtain permission from the license holder to duplicate, adapt or reproduce the material.
Skiing and Snowboarding in Switzerland: Trends in Injury and Fatality Rates Over Time

41© The Author(s) 2017 I.S. Scher et al. (eds.), Snow Sports Trauma and Safety, DOI 10.1007/978-3-319-52755-0_4
The Utility of Two National Injury Databases to Evaluate Snow-Sports Injuries in New Zealand
Brenda Costa-Scorse, Will G. Hopkins, John Cronin, and Eadric Bressel
Abstract To accurately inform injury-prevention initiatives an in-depth evaluation of the utility of injury-incidence databases is essential. As part of development of a 5-year national injury-prevention strategy for snow sports in New Zealand, injury rates were compared in two databases: the Accident Compensation Commission (ACC) claims database of all snow-sports injuries treated by physiotherapists or doctors and the national incident database (NID) of injuries treated at all commer-cial ski areas. The ACC database focuses on treatment costs, whereas the NID data-base provides details of skier/boarder ability, terrain, surface condition, visibility, and equipment factors, all important information for developing injury-prevention interventions. The total injury rate in the ACC database was 8.8 injuries per 1000 skier/boarder days in the 2010 and 2011 winter seasons. The NID revealed that only one-third of these injuries were assessed and treated at mountain clinics. Sprains accounted for the greatest difference in injury rates between the ACC and the NID (5.3 and 1.3, respectively). Rates of all other main types of injury where higher in the ACC. This “bypass” effect likely represents a delay in seeking treatment that may be explained by increased swelling or pain after leaving the ski area. The bypass effect presumably applies to injury rates in all studies based solely on mountain- clinic incident data and needs to be taken into account when assessing injury trends and aetiology in alpine skiing and snowboarding.
Keywords Skiing • Snowboarding • Injury • Causation • Mechanisms • Prevention
B. Costa-Scorse (*) • J. Cronin Sports Performance Research Institute New Zealand (SPRINZ), AUT University, Auckland, New Zealande-mail: [email protected]
W.G. Hopkins • E. BresselInstitute of Sport, Exercise and Active Living, Victoria University, Melbourne, Australia
42
1 Introduction
The development of the New Zealand snow sports injury-prevention strategy [1] provided the impetus to increase understanding of skiing and snowboarding injuries and apply discoveries made. Traditionally, the magnitude of the injury problem in alpine skiing and snowboarding was solely determined for Ski Areas Association New Zealand (SAANZ) using the national incident database (NID) database. NID analysis provided only one part of the picture, injured people that were assessed and treated at all commercial ski areas. To determine the true magnitude of the injury problem, the proportion and type of injuries that bypass mountain clinics then seek treatment off-the-hill needed to be determined. The Accident Compensation Commission (ACC) database provided all personal injury claims for snow sports; comparison of both the NID and ACC would provide a complete picture.
2 Aims
The primary aim of this study was to quantify the magnitude and nature of the injury problem in alpine skiing and snowboarding in New Zealand. The secondary aims were to determine the utility of two snow-sports injury databases and inform the development of a national injury-prevention strategy.
3 Methods
The NID incident reporting form was revised by the primary researcher and a SAANZ working group in the summer of 2010 prior to commencing NID data collection. Data collected at all ski areas was modified and expanded to include: resident or non-resident; free text space for description of the incident; fall, jump/landed, or slide; type of lift (chair-lift, Tbar, platter, ropetow, carpet lift, fixed grip tow); equipment ownership (self-owned, borrowed, rented on-hill, rented off-hill); equipment mainte-nance (binding calibration this season, >1 season, or never) and ski-binding release settings; skier height and weight; ski-binding release, no release, or premature release; and, terrain-park detail (box, jump, or rail). Activity, collision factors, visibil-ity, snow conditions, protective equipment, and the injury code data points were retained unchanged. Ethics approval was gained from the Auckland University of Technology ethics committee (#14146) and the ACC ethics committee (#258). Descriptive epidemiological analyses and comparisons were made of ACC personal injury claimant data from the legislated government no-fault insurance scheme and the NID for incidents treated at all commercial ski areas 1 June to 31 October in 2010 and 2011. SAANZ provided population numbers for each season using ticket sales and season pass records. The ACC diagnosis, read code, and read code description data were used to group ACC data into the condition categories used in the NID. Analysis of the comprehensive cost details in the ACC data was not undertaken.
B. Costa-Scorse et al.
43
Medical condition categories in the NID were not included. Both data sets were eval-uated for completeness by undertaking checks of blank fields and missing codes.
Proportions of injuries and injury risk were analysed using Poisson or logistic regression. Analysis was performed with the Statistical Analysis System (SAS). Injury rates per 1000 skier days were determined using SAANZ population data. A factor of 0.82 was applied to ACC injury counts to remove injuries that occurred outside commercial ski areas and thereby, allow comparison with NID counts. The p value for the difference of the rates was derived by assuming the normal approximation for the sampling distribution of the two proportions and by assuming (conservatively) the independence of the two proportions. The ratio of the propor-tions was assumed to have a log-normal sampling distribution, and the confidence limits for the ratio were derived from the p value using a spreadsheet [2]. The magnitude- based inference to assess the uncertainty in the outcomes was also calculated in this spreadsheet. Proportion ratios of 0.90 and the inverse 1.11 were assumed to be the smallest clinically important ratios.
4 Results
The ACC database provided body part injured and diagnoses on 24,793 incident claims. The data required considerable checking, filtering, and manipulation to resolve inconsistencies in recording the nature and location of injuries. Missing data were found for <2% of ACC cases; these blanks did not impact determination of a diagnosis. ACC incorrectly attributed <0.01% of snow-sports injuries to water- skiing, jet-skiing, or wakeboarding. Free text written by the injured skier or snow-boarder (claimant) describing the mechanism of injury were not thematically analysed as apart from “fall” there was no consistency in terms.
The NID provided comprehensive descriptive data on 7851 incidents. Ski- binding release, non-release, and ski equipment servicing data were collected only in skiing knee and lower-leg injuries. Missing data were found for <1% of NID cases; these blanks did not effect determination of a diagnosis. There were no dif-ferences in NID incident reporting practices at small ski areas staffed solely by ski patrollers when compared to large ski areas staffed by doctors, nurses, radiogra-phers, and ski patrollers. Coding of injury severity was not consistent in the NID. For example, fractures that occurred in the same part of the body were either coded status three moderate or status four minor. Status codes were also problematic in three cases where minor injuries were incorrectly recorded at one ski area as deceased. A ski area manager corroborated the coding error. Mortality data from the Coronial Services of New Zealand confirmed the dates, times, and causes of three ski area fatalities (two skiers, one snowboarder). Two of three of these fatalities were recorded as status one critical, and the third fatality was not recorded.
The overall injury rate for the combined winter seasons 2010 and 2011 was 8.8 per 1000 skier/boarder days (ACC) and 3.2 per 1000 skier/boarder days (NID). Sprains accounted for the biggest difference in injury rate between the ACC and the
The Utility of Two National Injury Databases to Evaluate Snow-Sports Injuries…
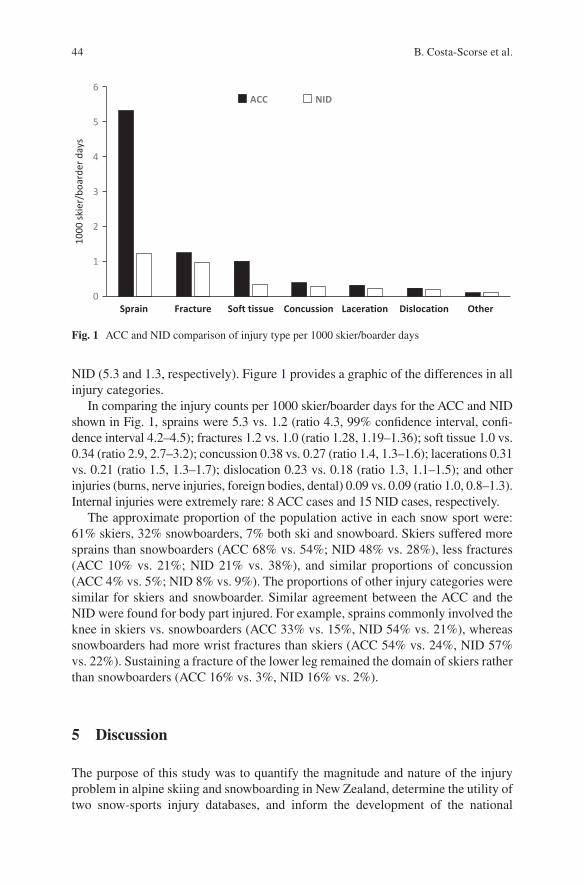
44
NID (5.3 and 1.3, respectively). Figure 1 provides a graphic of the differences in all injury categories.
In comparing the injury counts per 1000 skier/boarder days for the ACC and NID shown in Fig. 1, sprains were 5.3 vs. 1.2 (ratio 4.3, 99% confidence interval, confi-dence interval 4.2–4.5); fractures 1.2 vs. 1.0 (ratio 1.28, 1.19–1.36); soft tissue 1.0 vs. 0.34 (ratio 2.9, 2.7–3.2); concussion 0.38 vs. 0.27 (ratio 1.4, 1.3–1.6); lacerations 0.31 vs. 0.21 (ratio 1.5, 1.3–1.7); dislocation 0.23 vs. 0.18 (ratio 1.3, 1.1–1.5); and other injuries (burns, nerve injuries, foreign bodies, dental) 0.09 vs. 0.09 (ratio 1.0, 0.8–1.3). Internal injuries were extremely rare: 8 ACC cases and 15 NID cases, respectively.
The approximate proportion of the population active in each snow sport were: 61% skiers, 32% snowboarders, 7% both ski and snowboard. Skiers suffered more sprains than snowboarders (ACC 68% vs. 54%; NID 48% vs. 28%), less fractures (ACC 10% vs. 21%; NID 21% vs. 38%), and similar proportions of concussion (ACC 4% vs. 5%; NID 8% vs. 9%). The proportions of other injury categories were similar for skiers and snowboarder. Similar agreement between the ACC and the NID were found for body part injured. For example, sprains commonly involved the knee in skiers vs. snowboarders (ACC 33% vs. 15%, NID 54% vs. 21%), whereas snowboarders had more wrist fractures than skiers (ACC 54% vs. 24%, NID 57% vs. 22%). Sustaining a fracture of the lower leg remained the domain of skiers rather than snowboarders (ACC 16% vs. 3%, NID 16% vs. 2%).
5 Discussion
The purpose of this study was to quantify the magnitude and nature of the injury problem in alpine skiing and snowboarding in New Zealand, determine the utility of two snow-sports injury databases, and inform the development of the national
0
1
2
3
4
5
6
Sprain Fracture Soft tissue Concussion Laceration Dislocation Other
ACC NID
1000
ski
er/b
oard
er d
ays
Fig. 1 ACC and NID comparison of injury type per 1000 skier/boarder days
B. Costa-Scorse et al.
45
injury-prevention strategy [1]. An understanding of the coding, classifications, and terminology used in each database is the first requirement for undertaking a study that compares data [3]. ACC used a single diagnosis code for an individual claim-ant; multiple injuries were not captured in the code. The compact hierarchy of medi-cal codes were developed by Dr. James Read in 1983 to cater for computer systems that had limited memory. Discordance relating to diagnosis may occur when assign-ing the Read code, and the code may also be applied incorrectly [4–7]. In New Zealand, there has been no systematic education for health professionals on how to use Read codes, this lack of education has added to concerns that diagnostic coding errors may occur [6]. However, missing diagnoses in the ACC database of <2% would not be an issue for assessment of trends in injury incidence.
The NID used simplified diagnostic codes for up to three injuries for one indi-vidual, with a four part number and letter system for status, body part injured, side and condition. These nomenclatures added an element of sophistication and pro-vided description of individual skiers or snowboarders who had multiple injuries. The small percentage of NID coding errors was seemingly typographical. Use of status 1 (critical problem with an immediate threat to life) as opposed to status 0 (dead) may have been due to patients being under resuscitation at the time of hando-ver to the helicopter emergency medical service. Missing diagnoses in the NID database of <1%, as for the ACC, would not be an issue for assessment of trends in injury incidence.
Statistical methods have been designed to support comparison of injury inci-dence in studies of snow sports [8–11]. When comparing studies consideration needs to be given to the fact that some jurisdictions only include injuries that have been assessed and diagnosed by medical practitioners and other areas may only analyse ski patrol data. Depending on what data is entered into the incident data-base the number of injuries and patterns of injury may increase or decrease. Medical practitioner incident data may have less minor injuries than ski patrol data. For example, a skier suffering a minor laceration from a ski-edge may only require first aid, not require suturing, and therefore, will not see a doctor. In New Zealand, regardless of the staff skill mix lacerations were recorded as soft tissue injuries in the NID. This reporting culture may lead to an increased proportion of soft tissue injuries when compared with other studies. Importantly, there was no difference in accuracy of data entry when comparing small New Zealand ski areas staffed solely by ski patrollers and large ski areas staffed by a mixed medical team. These finding correlate with Canadian analysis of ski patrol information quality [12].
Norway has a central registry representing 53% of skier/boarder days; 1.3 inju-ries per 1000 skier/boarder days occurred in the 2008/2009 and 2009/2010 seasons [13]. In a study of 10 French ski areas in 2007 and 2010, Laporte et al. [14] found that incident rates fell from 2.8 to 2.4 per 1000 skier/boarder days. Shealy et al. [15] found that the weighted US skiing incident rates in national ski areas association data declined from 3.1 in 1980 to 2.5 per 1000 visits in 2010. The NID incident rates for skiers and snowboarders treated at ski areas in New Zealand were higher than France, Norway, and the USA.
The Utility of Two National Injury Databases to Evaluate Snow-Sports Injuries…
46
The substantially higher injury rate in the ACC compared with the NID repre-sents a “bypass effect”. This effect is most likely due to evolving symptoms leading to first presentations occurring off-the-hill and the no-fault accident compensation system that covers personal claims. For example, symptoms of concussion may not develop immediately following an incident on the snow. Injured international skiers and snowboarders are unlikely to return home for first treatment as ACC covers treatment costs, and New Zealand is an international flight away from other coun-tries. Ski areas located in large continents are likely to see bypass as injured skiers and snowboarders return to their state or country of origin, making it difficult to capture this group of injured.
The ACC system has been heralded as a world-leading solution when comparing medical systems that have burgeoning costs, but it has also been criticised for its potential for false claims by individuals who did not sustain an acute injury in the activity that was registered in the claim [16, 17]. It seems unlikely that there would be a substantial misattribution of injuries to snow sports. However, the ACC system may promote claims for minor injuries where the individual in a user pays environ-ment possibly would not seek treatment. Injured individuals can make a personal injury claim with a medical practitioner, physiotherapist, or other ACC accredited health provider. The choice of treatment modality may in-part explain higher injury rates in the ACC data. For example with universal insurance cover, a skier or snow-boarder with back strain can present directly to a physiotherapist or chiropractor for assessment and treatment at no cost or a low cost surcharge and ACC will cover the remaining treatment costs. In other health systems, the back sprain incidence may be lower as skiers and snowboarders opt for self-management rather than register-ing as injured.
High proportions of knee sprains in skiing were found in recent epidemiological studies [13, 14, 18–20]. The large numbers of knee sprains bypassing mountain clinics in New Zealand highlight that the problem is greater than previously consid-ered. Delays in seeking assessment and treatment for sprains can be explained by swelling evolving over time, increasing limitation of movement, and difficulty with managing pain. Grades of medial collateral ligament injury provide a possible explanation for bypassing mountain clinics [21]. Grade I knee injuries may be pain-ful in the days after skiing but have no laxity and would probably not limit a skier getting off-the-hill without assistance. Grade II knee injuries involve separation of the collagen fibres of the medial collateral ligament, have partial laxity, and may involve the joint capsule, anterior and/or posterior cruciate ligament. Depending on the degree of disability and laxity, grade II medial collateral knee ligament injury may not present at mountain clinics or seek assistance from ski patrollers for extri-cation by toboggan. However, it is likely that grade II injured individuals would have difficulty getting on and off a chair-lift. Grade III medial collateral knee liga-ment injuries are a severe injury that would limit capacity to continue skiing. The complete rupture that occurs in a grade III injury, lax joint, and increased chance of haemathrosis would mean that this group of injured skiers would likely present to ski patrol on-the-hill. Skiers with grade I or grade II injuries possibly take a wait and see approach to see what level of disability exists in the days following skiing. There was no difference in the definition of a sprain in the NID and ACC coding that
B. Costa-Scorse et al.
47
could lead to an alternative explanation for the high proportion of knee sprains in the ACC data.
Both databases indicated that fractures of the lower leg were more common in skiers than snowboarders. The sharp decline in lower-limb fractures seen after the invention of the dual-direction ski-binding in the 1970s and 1980s has not been sus-tained [22–24]. Poor ski-binding maintenance, incorrect release settings, ill- fitting ski boots, changes to skiing style, and skiers unprepared for the trajectory of the carv-ing ski are possible explanations for the continued issue of fractures of the lower leg.
The ACC and the NID reported higher proportions of wrist fractures in snow-boarders when compared to skiers; this is consistent with findings in other studies [25, 26]. The mechanics of falling on an out-stretched hand and frequency of falling when snowboarding (particularly for novices) explains the difference in injury pro-portions [27]. Interventions to reduce the incidence of wrist fractures in snowboard-ers could include instruction on staying upright, instruction on how to fall, and increased use of wrist protectors [28].
The proportions represented by concussion in skiers and snowboarders were sim-ilar. Further research is needed to describe the nature of head injuries in skiers and snowboarders in New Zealand. In the interim, analysis of head injuries elsewhere has provided sufficient evidence for promoting the wearing of helmets [29–31].
6 Conclusion
Researchers informing the development of injury-prevention interventions should not rely solely on one injury database. Bypass injury rates are needed to determine the true magnitude of the injury problem in skiing and snowboarding. Insurance databases are a relatively blunt tool for determining behavioural, equipment, or environmental risk factors. Mountain-based epidemiological studies provide the detail required to inform injury-prevention initiatives. Increased understanding is needed on the demographic of skiers and snowboarders who delay seeking treat-ment, as early intervention may reduce severity and enhance recovery.
Acknowledgements The authors are grateful to SAANZ and ACC for supplying data. SAANZ are also acknowledged for their unequivocal encouragement during the development of the New Zealand Snow Sports Injury Prevention Strategy (2015–2020).
References
1. Costa-Scorse B, Hoyle A, Davidson M, Dooney A, Clinton-Baker P, Lamont M, Cronin J, Bressel E, Hopkins WG 2015 New Zealand snow sports injury prevention strategy (2015–2020)—a snow sports industry initiative. Ski Areas Association New Zealand
2. Hopkins WG, Marshall SW, Batterham AM, Hanin J (2009) Progressive statistics for studies in sports medicine and exercise science. Med Sci Sports Exerc 41(1):3–12
The Utility of Two National Injury Databases to Evaluate Snow-Sports Injuries…
48
3. de Lusignan S (2005) Codes, classifications, terminologies and nomenclatures: definition, development and application in practice. Inform Prim Care 13(1):65–69
4. Tilyard MW, Gurr E, Munro N, Walker SA, Dovey SM (1998) Creating a general practice national minimum data set: present possibility or future plan? N Z Med J 111(1072):317–320
5. Peat G, Greig J, Wood L, Wilkie R, Thomas E, Croft P (2005) Diagnostic discordance: we cannot agree when to call knee pain ‘osteoarthritis’. Fam Pract 22(1):96–102
6. Hall J, Tomlin A, Martin I, Tilyard M (2002) A general practice minimum data set for New Zealand. N Z Med J 115(1163):U200
7. De Lusignan S, Stephens PN, Adal N, Majeed A (2002) Does feedback improve the quality of computerized medical records in primary care? J Am Med Inform Assoc 9(4):395–401
8. Johnson RJ, Ettlinger CF, Shealy JE (2003) A method for comparing alpine skiing injuries among studies. J ASTM Int 14(STP 1440):121–128
9. Lamont MK (1991) Ski injury statistics, what changes? J ASTM Int STP 1104:158–163 10. Knowles SB, Marshall SW, Guskiewicz KM (2006) Issues in estimating risks and rates in
sports injury research. J Athl Train 41(2):207–215 11. Marshall SW (2008) Injury case-control studies using “other injuries” as controls.
Epidemiology 19(2):277–279 12. Hagel BE, Pless IB, Goulet C, Platt RW, Robitaille Y (2004) Quality of information on risk
factors reported by ski patrols. Inj Prev 10(5):275–279 13. Ekeland A, Rødven A (2012) Alpine skiing, telemarking, snowboarding, and skiboarding inju-
ries related to gender and ability. J ASTM Int 2012:216–227 14. Laporte JD, Bajolle L, Lamy D, Delay JB (2012) Winter sports injuries in France over two
decades. J ASTM Int 19(STP1553):201–215 15. Shealy J, Ettlinger CE, Scher I, Johnson R (2014) 2010/2011 NSAA 10-year interval injury
study. J ASTM Int 20(STP1582):93111 16. Spearing NM, Connelly L (2011) Is compensation “bad for health”? A systematic meta-review.
Injury 42(1):15–24 17. Lichtenstein B (1999) From principle to parsimony: a critical analysis of New Zealand’s no-
fault accident compensation scheme. Soc Justice Res 12(2):99–116 18. Laporte JD, Binet MH, Constans D (2000) Evolution of ACL ruptures in French ski resorts
1992-1999. J ASTM Int 13(STP 1397):95–107 19. Johnson RJ, Etlinger CE, Shealy JE (2008) Update on injury trends in alpine skiing. J ASTM
Int 17(STP 1510):11–22 20. Sulheim S, Holme I, Rødven A, Ekeland A, Bahr R (2011) Risk factors for injuries in alpine skiing,
telemark skiing and snowboarding—case-control study. Br J Sports Med 45(16):1303–1309 21. Cox JS (1979) Injury nomenclature. Am J Sports Med 7(3):211–213 22. Shealy JE, Ettlinger CF, Johnson RJ (2003) What do we know about ski injury research that
relates binding function to knee and lower leg injuries? J ASTM Int 14(STP 1440):36–52 23. Greenwald R, Senner V, Swanson S (2001) Biomechanics of carving skis. Schweiz Z Sportmed
Sporttraumatol 49(1):40–44 24. Ettlinger CF, Johnson RJ, Shealy JE (2003) Where do we go from here? J ASTM Int 14
(STP 1440):53–63 25. Dickson TJ, Terwiel FA (2011) Snowboarding injuries in Australia: investigating risk factors
in wrist fractures to enhance injury prevention strategies. Wilderness Environ Med 22(3): 228–235
26. Bianchi G, Michel FI, Brügger O (2012) The use of wrist guards by snowboarders in Switzerland. J ASTM Int STP 1553:38–53
27. Cooper N, Greenwald R (2006) Observational study on fall trends in snowboarding. J ASTM Int 3(5):19–25
28. Michel FI, Schmitt KU, Greenwald RM, Russell K, Simpson FI, Schulz D, Langran M (2013) White paper: functionality and efficacy of wrist protectors in snowboarding-towards a harmo-nized international standard. Sports Eng 16(4):197–210
29. Scher I, Richards D, Carhart M (2006) Head injury in snowboarding: evaluating the protective role of helmets. J ASTM Int 3(4):JAI14203
B. Costa-Scorse et al.
49
30. Ruedl G, Sommersacher R, Woldrich T, Kopp M, Nachbauer W, Burtscher M (2010) Risk fac-tors of head injuries on Austrian slopes. German J Sports Med 61(4):97–102
31. Russell K, Christie J, Hagel BE (2010) The effect of helmets on the risk of head and neck injuries among skiers and snowboarders: a meta-analysis. Can Med Assoc J 182(4):333–340
Open Access This chapter is distributed under the terms of the Creative Commons Attribution-Noncommercial 2.5 License (http://creativecommons.org/licenses/by-nc/2.5/) which permits any noncommercial use, distribution, and reproduction in any medium, provided the original author(s) and source are credited.
The images or other third party material in this chapter are included in the work’s Creative Commons license, unless indicated otherwise in the credit line; if such material is not included in the work’s Creative Commons license and the respective action is not permitted by statutory regu-lation, users will need to obtain permission from the license holder to duplicate, adapt or reproduce the material.
The Utility of Two National Injury Databases to Evaluate Snow-Sports Injuries…
51© The Author(s) 2017 I.S. Scher et al. (eds.), Snow Sports Trauma and Safety, DOI 10.1007/978-3-319-52755-0_5
A Sport Concussion Assessment Tool (SCAT2) for Use in Snowsports: Can the Balance Component of the Tool Be Improved?
G. Waddington, S. Trathen, T.J. Dickson, R. Adams, and A. Rumore
G. Waddington (*) • S. Trathen • T.J. Dickson • R. Adams • A. Rumore Research Institute for Sport and Exercise, University of Canberra, Bruce, ACT 2617, Australiae-mail: [email protected]
Abstract Background: Currently, there are no recommended assessment protocols for monitoring possible effects of head injury in snowsports athletes who are in competition and training. Objective: This project evaluated the Sport Concussion Assessment Tool 2 (SCAT2) for concussion assessment in a snowsport athlete group. In addition, the project determined the effectiveness of enhancing the SCAT2 protocol by using accelerometer smartphone technology in the balance assessment component of the test battery, with a view to an enhanced protocol for assessment of changes in human motor performance post-concussion injury. Methods: The research team recruited 22 athletes from the New South Wales Institute of Sport and the Olympic Winter Institute Australia snowsport athlete squads who were under-taking baseline sport science testing during the Australian 2012 and 2013 winter seasons. Results: Overall correlation between the SCAT 2 over two separate occa-sions was moderate/strong (Pearson’s r = 0.58, p = 0.006). Examination of the sub-categories within the SCAT2 indicated that the overall correlation was being mediated by the strong correlation of the subset “Symptom Score.” The subset “Balance Score” did not correlate across test occasions (r = 0.42, p = 0.054). There were no other significant correlations across the two occasions of testing. Those who had reported a major head impact history, signified by damage to their helmet during the impact, were significantly older (21.5, SD 4.6 years) than the group not reporting a major head impact (17.5, SD 2.6 years). Two of the instrumented bal-ance test measures, one in the double-leg stance and one in the single-leg stance protocol, showed a significant difference between the “major helmet impact” and “no helmet impact” groups warranting further investigation in a larger sample.
Keywords Skiing • Snowboarding • Concussion • Concussion assessment
52
1 Introduction
Snowsports are popular winter sports in Australia and have a strong appeal to young and beginner participants. As in any sport, there is a risk of injury, including head injury. Internationally, it has been suggested that traumatic brain injury (TBI) is the leading cause of death in snowsports [1, 2]. Results from an Australian study of patients presenting to the Canberra Hospital with a snowsport- related head injury found that the incidence of head injuries was 1.8 per 1,000,000 skier days (n = 25) with snowboarders having three times the incidence of head injuries of skiers [3]. As with the broader population, snowsport athletes are also at risk of concussion and head injury though at a higher incidence and severity [4, 5]. Thus, there is a need for an effective mechanism to assess any cumulative effects of repeated head impacts or injuries on cognitive and motor performance.
Helmets are proposed to protect against snowsport head injuries [6–10]. An Australian study in Victoria indicated that usage has increased, with children more likely to wear helmets than adults (67% cf. 16% in 2008), however usage was declining [11]. While it has been demonstrated that helmets may reduce the severity of minor injuries in snowsports [11], there continues to be debate about their effec-tiveness in all circumstances, hence discussion continues about their usefulness. This is consistent with the “Consensus Statement On Concussion In Sport” (CSCS), which states that there is “no good clinical evidence that currently available protec-tive equipment will prevent concussion” [12, 13] though in snowsports helmets may reduce other head and facial injuries. Further, increased helmet usage has not resulted in the expected benefit of less reported head injuries [4]. Yet they are required by FIS for all events [14] but manufactured at similar test standards as recreational helmets where it has been suggested that helmets may not be effective in an impact with a solid object at speeds greater than 23 km/h [2].
The CSCS defines concussion as “a complex pathophysiological process affect-ing the brain, induced by traumatic biomechanical forces” [12, 13]. Research has been conducted on footballers and ice hockey players related to repeated “mild- impact” and the risk of post-concussion syndrome [15], and there have been efforts to achieve some consensus about how to prevent and manage sport-related concus-sions [12, 13]. Yet, to date there is no research that reports and monitors the inci-dence of concussion injury in either athlete or recreational snowsport participants.
The CSCS suggests that “a detailed concussion history is of value” including baseline data gathering prior to a sporting season. A structured concussion history should include specific questions as to previous symptoms of a concussion: not just the perceived number of past concussions. It is also worth noting that dependence upon the recall of concussive injuries by team members or coaches has been dem-onstrated to be “unreliable” [16]. To this end, the Sport Concussion Assessment Tool 2 (SCAT2) was developed as the recommended tool for assessment of concus-sion in sport. The SCAT2 is a tool for assessing symptoms and signs reported by the concussed athlete. The SCAT2 score does not independently determine the diagnosis of concussion, nor the athlete’s return-to-play status. The SCAT2 protocol is
G. Waddington et al.
53
designed for use to determine a pre-injury baseline and to assess readiness for return-to-play in sports such as the football codes and motor sports. The SCAT2 scoring system incorporates scores for the fields, (1) Symptoms and (2) Cognitive and Physical Evaluation, that includes cognitive assessment, physical signs, balance and coordination, the Glasgow coma scale, and the Maddocks Score.
This project focused on the reliability of the SCAT2 as a baseline test across seasons and on the standing balance assessment component of the SCAT2 test, as the protocol uses a relatively coarse balance assessment approach. The static com-ponent of the test uses a hands-on-hips, single-leg stance for 20 s test, with the test scored as the number of times the participant makes movements with the hands away from hips, touches down with one leg, etc. to recover balance, taken as a mea-sure of change in postural sway. With the advances in smart phone technology [17], including the addition of accelerometer systems, the capacity to discover much finer grades of change in sway posture may enhance the sensitivity of the test to detect changes in sway that are indicative of low-level cumulative change in neurologic function. This additional and refined information may then lead to the design of more sensitive SCAT tools.
2 Objectives
As there are currently no recommended assessment protocols for monitoring pos-sible effects of head injury in snowsport athletes who are involved in both competi-tion and training, this project had three objectives:
1. To evaluate the SCAT2 for concussion assessment in a snowsport athlete group 2. To determine the effectiveness of enhancing the SCAT2 protocol using acceler-
ometer smartphone technology in the static “balance assessment” component of the SCAT test
3. To inform the design of an enhanced protocol for assessment of changes in motor performance post-concussion injury: towards an improved SCAT
3 Materials/Methods
Athletes involved in snowsport programs with the New South Wales Institute of Sport and the Olympic Winter Institute of Australia who were competing regionally through to World Cup events were invited to participate in this project. Those who had a significant health issue or those who may have been pregnant did not partici-pate in this study. 22 athletes, 12 male, and 10 female, across a range of snowsport activities (moguls, snowboard cross, and skier cross), volunteered to participate in this project. All were familiarized with the protocol prior to commencing.
A Sport Concussion Assessment Tool (SCAT2) for Use in Snowsports…
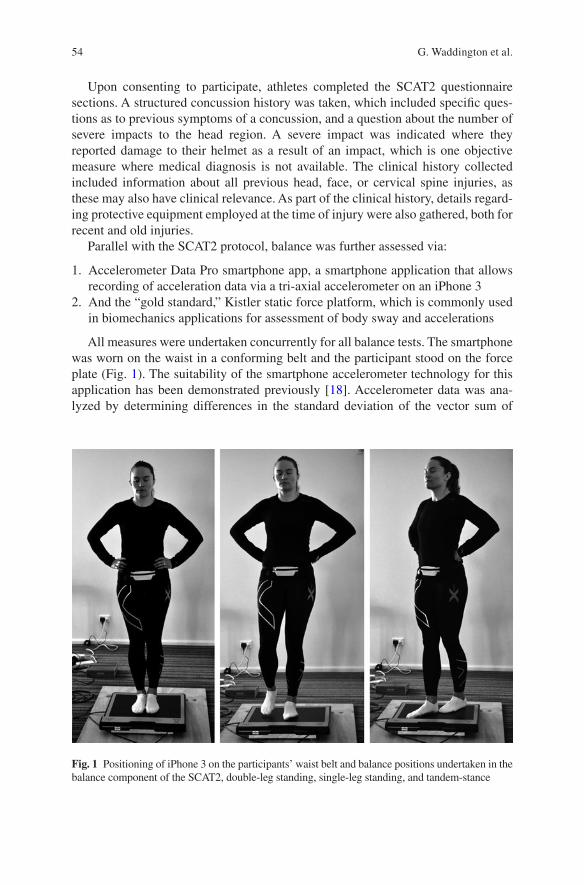
54
Upon consenting to participate, athletes completed the SCAT2 questionnaire sections. A structured concussion history was taken, which included specific ques-tions as to previous symptoms of a concussion, and a question about the number of severe impacts to the head region. A severe impact was indicated where they reported damage to their helmet as a result of an impact, which is one objective measure where medical diagnosis is not available. The clinical history collected included information about all previous head, face, or cervical spine injuries, as these may also have clinical relevance. As part of the clinical history, details regard-ing protective equipment employed at the time of injury were also gathered, both for recent and old injuries.
Parallel with the SCAT2 protocol, balance was further assessed via:
1. Accelerometer Data Pro smartphone app, a smartphone application that allows recording of acceleration data via a tri-axial accelerometer on an iPhone 3
2. And the “gold standard,” Kistler static force platform, which is commonly used in biomechanics applications for assessment of body sway and accelerations
All measures were undertaken concurrently for all balance tests. The smartphone was worn on the waist in a conforming belt and the participant stood on the force plate (Fig. 1). The suitability of the smartphone accelerometer technology for this application has been demonstrated previously [18]. Accelerometer data was ana-lyzed by determining differences in the standard deviation of the vector sum of
Fig. 1 Positioning of iPhone 3 on the participants’ waist belt and balance positions undertaken in the balance component of the SCAT2, double-leg standing, single-leg standing, and tandem-stance
G. Waddington et al.
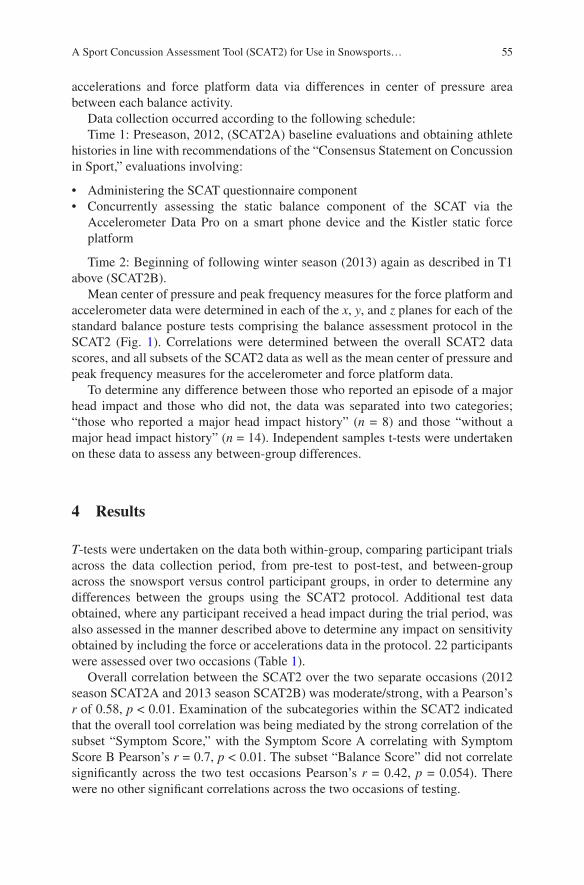
55
accelerations and force platform data via differences in center of pressure area between each balance activity.
Data collection occurred according to the following schedule:Time 1: Preseason, 2012, (SCAT2A) baseline evaluations and obtaining athlete
histories in line with recommendations of the “Consensus Statement on Concussion in Sport,” evaluations involving:
• Administering the SCAT questionnaire component• Concurrently assessing the static balance component of the SCAT via the
Accelerometer Data Pro on a smart phone device and the Kistler static force platform
Time 2: Beginning of following winter season (2013) again as described in T1 above (SCAT2B).
Mean center of pressure and peak frequency measures for the force platform and accelerometer data were determined in each of the x, y, and z planes for each of the standard balance posture tests comprising the balance assessment protocol in the SCAT2 (Fig. 1). Correlations were determined between the overall SCAT2 data scores, and all subsets of the SCAT2 data as well as the mean center of pressure and peak frequency measures for the accelerometer and force platform data.
To determine any difference between those who reported an episode of a major head impact and those who did not, the data was separated into two categories; “those who reported a major head impact history” (n = 8) and those “without a major head impact history” (n = 14). Independent samples t-tests were undertaken on these data to assess any between-group differences.
4 Results
T-tests were undertaken on the data both within-group, comparing participant trials across the data collection period, from pre-test to post-test, and between-group across the snowsport versus control participant groups, in order to determine any differences between the groups using the SCAT2 protocol. Additional test data obtained, where any participant received a head impact during the trial period, was also assessed in the manner described above to determine any impact on sensitivity obtained by including the force or accelerations data in the protocol. 22 participants were assessed over two occasions (Table 1).
Overall correlation between the SCAT2 over the two separate occasions (2012 season SCAT2A and 2013 season SCAT2B) was moderate/strong, with a Pearson’s r of 0.58, p < 0.01. Examination of the subcategories within the SCAT2 indicated that the overall tool correlation was being mediated by the strong correlation of the subset “Symptom Score,” with the Symptom Score A correlating with Symptom Score B Pearson’s r = 0.7, p < 0.01. The subset “Balance Score” did not correlate significantly across the two test occasions Pearson’s r = 0.42, p = 0.054). There were no other significant correlations across the two occasions of testing.
A Sport Concussion Assessment Tool (SCAT2) for Use in Snowsports…
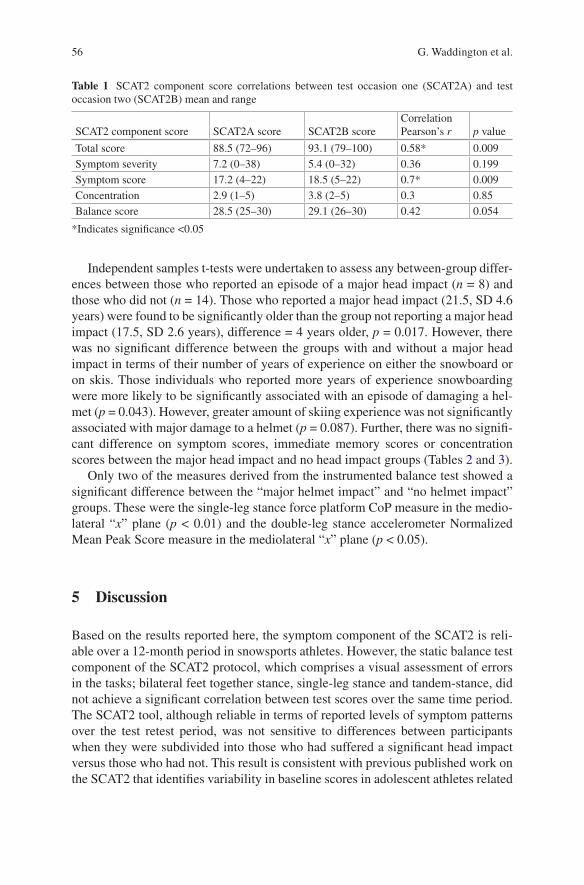
56
Independent samples t-tests were undertaken to assess any between-group differ-ences between those who reported an episode of a major head impact (n = 8) and those who did not (n = 14). Those who reported a major head impact (21.5, SD 4.6 years) were found to be significantly older than the group not reporting a major head impact (17.5, SD 2.6 years), difference = 4 years older, p = 0.017. However, there was no significant difference between the groups with and without a major head impact in terms of their number of years of experience on either the snowboard or on skis. Those individuals who reported more years of experience snowboarding were more likely to be significantly associated with an episode of damaging a hel-met (p = 0.043). However, greater amount of skiing experience was not significantly associated with major damage to a helmet (p = 0.087). Further, there was no signifi-cant difference on symptom scores, immediate memory scores or concentration scores between the major head impact and no head impact groups (Tables 2 and 3).
Only two of the measures derived from the instrumented balance test showed a significant difference between the “major helmet impact” and “no helmet impact” groups. These were the single-leg stance force platform CoP measure in the medio-lateral “x” plane (p < 0.01) and the double-leg stance accelerometer Normalized Mean Peak Score measure in the mediolateral “x” plane (p < 0.05).
5 Discussion
Based on the results reported here, the symptom component of the SCAT2 is reli-able over a 12-month period in snowsports athletes. However, the static balance test component of the SCAT2 protocol, which comprises a visual assessment of errors in the tasks; bilateral feet together stance, single-leg stance and tandem-stance, did not achieve a significant correlation between test scores over the same time period. The SCAT2 tool, although reliable in terms of reported levels of symptom patterns over the test retest period, was not sensitive to differences between participants when they were subdivided into those who had suffered a significant head impact versus those who had not. This result is consistent with previous published work on the SCAT2 that identifies variability in baseline scores in adolescent athletes related
Table 1 SCAT2 component score correlations between test occasion one (SCAT2A) and test occasion two (SCAT2B) mean and range
SCAT2 component score SCAT2A score SCAT2B scoreCorrelation Pearson’s r p value
Total score 88.5 (72–96) 93.1 (79–100) 0.58* 0.009Symptom severity 7.2 (0–38) 5.4 (0–32) 0.36 0.199Symptom score 17.2 (4–22) 18.5 (5–22) 0.7* 0.009Concentration 2.9 (1–5) 3.8 (2–5) 0.3 0.85Balance score 28.5 (25–30) 29.1 (26–30) 0.42 0.054
*Indicates significance <0.05
G. Waddington et al.
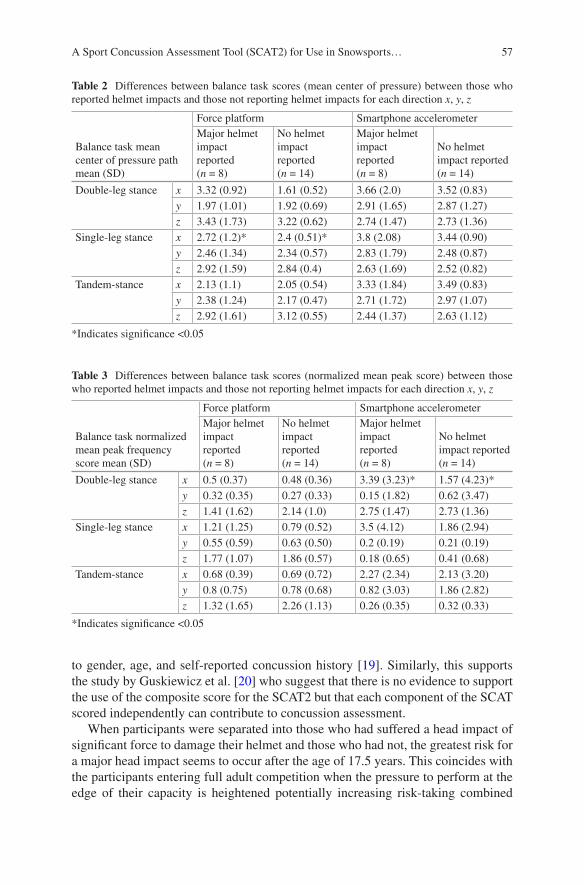
57
to gender, age, and self-reported concussion history [19]. Similarly, this supports the study by Guskiewicz et al. [20] who suggest that there is no evidence to support the use of the composite score for the SCAT2 but that each component of the SCAT scored independently can contribute to concussion assessment.
When participants were separated into those who had suffered a head impact of significant force to damage their helmet and those who had not, the greatest risk for a major head impact seems to occur after the age of 17.5 years. This coincides with the participants entering full adult competition when the pressure to perform at the edge of their capacity is heightened potentially increasing risk-taking combined
Table 2 Differences between balance task scores (mean center of pressure) between those who reported helmet impacts and those not reporting helmet impacts for each direction x, y, z
Balance task mean center of pressure path mean (SD)
Force platform Smartphone accelerometerMajor helmet impact reported (n = 8)
No helmet impact reported (n = 14)
Major helmet impact reported (n = 8)
No helmet impact reported (n = 14)
Double-leg stance x 3.32 (0.92) 1.61 (0.52) 3.66 (2.0) 3.52 (0.83)y 1.97 (1.01) 1.92 (0.69) 2.91 (1.65) 2.87 (1.27)z 3.43 (1.73) 3.22 (0.62) 2.74 (1.47) 2.73 (1.36)
Single-leg stance x 2.72 (1.2)* 2.4 (0.51)* 3.8 (2.08) 3.44 (0.90)y 2.46 (1.34) 2.34 (0.57) 2.83 (1.79) 2.48 (0.87)z 2.92 (1.59) 2.84 (0.4) 2.63 (1.69) 2.52 (0.82)
Tandem-stance x 2.13 (1.1) 2.05 (0.54) 3.33 (1.84) 3.49 (0.83)y 2.38 (1.24) 2.17 (0.47) 2.71 (1.72) 2.97 (1.07)z 2.92 (1.61) 3.12 (0.55) 2.44 (1.37) 2.63 (1.12)
*Indicates significance <0.05
Table 3 Differences between balance task scores (normalized mean peak score) between those who reported helmet impacts and those not reporting helmet impacts for each direction x, y, z
Balance task normalized mean peak frequency score mean (SD)
Force platform Smartphone accelerometerMajor helmet impact reported (n = 8)
No helmet impact reported (n = 14)
Major helmet impact reported (n = 8)
No helmet impact reported (n = 14)
Double-leg stance x 0.5 (0.37) 0.48 (0.36) 3.39 (3.23)* 1.57 (4.23)*y 0.32 (0.35) 0.27 (0.33) 0.15 (1.82) 0.62 (3.47)z 1.41 (1.62) 2.14 (1.0) 2.75 (1.47) 2.73 (1.36)
Single-leg stance x 1.21 (1.25) 0.79 (0.52) 3.5 (4.12) 1.86 (2.94)y 0.55 (0.59) 0.63 (0.50) 0.2 (0.19) 0.21 (0.19)z 1.77 (1.07) 1.86 (0.57) 0.18 (0.65) 0.41 (0.68)
Tandem-stance x 0.68 (0.39) 0.69 (0.72) 2.27 (2.34) 2.13 (3.20)y 0.8 (0.75) 0.78 (0.68) 0.82 (3.03) 1.86 (2.82)z 1.32 (1.65) 2.26 (1.13) 0.26 (0.35) 0.32 (0.33)
*Indicates significance <0.05
A Sport Concussion Assessment Tool (SCAT2) for Use in Snowsports…
58
with an age-related slowing in reaction times from mid-twenties onward [21] which may increase the risk of head injury. Although there was a significantly greater inci-dence of snowboarders than skiers reporting breaking a helmet, neither snowboard-ers nor skiers who also broke a helmet had an associated higher incidence of major head impacts. Based on the data in this study, a helmet breakage event is not neces-sarily equivalent to a severe head impact. This result may cautiously be interpreted as suggesting that the helmet is effectively attenuating a forceful head impact, through the destruction of the helmet.
Two of the instrumented balance assessments, the single-leg stance force plat-form center of pressure measure in the mediolateral “x” plane and the double-leg stance accelerometer normalized mean peak frequency score measure in the medio-lateral “x” plane were significantly different between those receiving a broken hel-met during a fall and those who did not experience breaking a helmet and should be considered for further evaluation in a larger sample of participants. This result sug-gests that accelerometer systems in current smart phone devices may be sensitive to changes in aspects of balance following head impacts and warrants further research. A number of previous research reports indicate changes in postural sway measures occurring following recent concussions, for example, within 48 h post-injury [22] and up to 30 days post-injury [23]. The finding of a difference in a measure of pos-tural sway extending out to months across a season is however consistent with recent reports of changes in performance characteristics and increased lower limb injury rates extending across seasons in concussed athletes [24, 25]. This suggests that the concussion injury may produce residual changes in the balance control systems of the athlete that may result in a higher risk of injury following their return to sport.
Based upon the insights gleaned from this and prior research, further research is warranted to understand both the contributing factors to head injuries and the effect of head impacts on snowsport participants, to inform appropriate and effective snowsport safety strategies. This includes:
• Exploring contributing factors to head injuries such as balance, proprioception, hydration, and risk-taking (e.g., [26–29]).
• Additional research to determine the effectiveness of concussion assessment tools, such as the SCAT 2 and SCAT3, in the immediate post-injury period to allow effective monitoring of return to sport protocols.
• Instrumented balance assessment needs to be further evaluated as a tool in acute concussion evaluation in snowsports athletes.
While this research has been able to add to the overall understanding of a poten-tial tool, the SCAT2, for the evaluating the effect of snowsport head impacts, there are a number of limitations to the research design. The size of the cohort available of high performance athletes in this mix of sports in Australia is determined by practical considerations that limit the number of athletes available for testing at any one time. The small numbers available mean that the resulting power to detect dif-ferences between groups will be less than that achievable with larger sample sizes. However, this can be addressed by collecting data across a series of seasons to
G. Waddington et al.
59
increase sample size over time. The self-report mechanism for determining “major head impacts” is not as effective as a formal medically diagnosed concussion epi-sode. However at the level at which these athletes are competing they are acutely aware of episodes that remove them from training or competition for a period of time. This categorization in this study was able to produce significant differences between groups where the categorization regarding a “broken helmet” was not.
The key insights from this research are that:
• The symptom component of the SCAT2 is reliable over a 12-month period in snowsport athletes.
• The balance test component of the SCAT2 protocol, which comprises a visual assessment of errors in the tasks, bilateral feet together stance, single-leg stance, and tandem-stance, did not achieve a significant correlation over the same time period.
• The SCAT2 tool was not sensitive to differences between participants who had suffered a significant head impact versus those who had not.
• Two of the instrumented balance assessment measures were significantly differ-ent when the group was separated into those who had sustained a helmet damag-ing fall and those who had not and should be considered for further evaluation in a larger sample of participants.
• Devices such as the accelerometers in smartphones need to be further evaluated to determine their usefulness in detection of motor function changes post-head impact.
• The greatest risk for a significant head impact occurs after the age of 17.5 years.• Helmet breakage is not an effective analogue of equivalence for a severe head
impact.
Acknowledgements This project could not have been undertaken without the support of John Marsden, Chief Sport Scientist for the Olympic Winter Institute Australia, and NSW Institute of Sport who facilitated the coordination of access to the OWIA and NSWIS athletes. Grateful acknowledgement is given to the NSW Sporting Injuries Committee who provided the overall funding support for the project.
References
1. Levy AS, Hawkes AP, Hemminger LM, Knight S (2002) An analysis of head injuries among skiers and snowboarders. J Trauma 53(4):695–704
2. Shealy JE, Johnson RJ, Ettlinger CF (2008) The science behind helmets. Ski Canada 37(2):50–53
3. Siu TLT, Chandran KN, Newcombe RL, Fuller JW, Pik JHT (2004) Snow sports related head and spinal injuries: an eight-year survey from the neurotrauma centre for the Snowy Mountains, Australia. J Clin Neurosci 11(3):236–242
4. Dickson TJ, Trathen S, Terwiel FA, Waddington G, Adams R (2017) Head injury trends and helmet use in skiers and snowboarders in Western Canada, 2008–09 to 2012–13: an ecological study. Scand J Med Sci Sports 27(2):236–244. doi:10.1111/sms.12642
A Sport Concussion Assessment Tool (SCAT2) for Use in Snowsports…
60
5. Steenstrup SE, Bere T, Bahr R (2014) Head injuries among FIS World Cup alpine and freestyle skiers and snowboarders: a 7-year cohort study. Br J Sports Med 48(1):1–6
6. Cusimano MD, Kwok J (2010) The effectiveness of helmet wear in skiers and snowboarders: a systematic review. Br J Sports Med 44:781–786. doi:10.1136/bjsm.2009.070573
7. Hagel BE, Pless IB, Goulet C, Platt RW, Robitaille Y (2005a) The effect of helmet use on injury severity and crash circumstances in skiers and snowboarders. Accid Anal Prev 37(1):103–108
8. Hagel BE, Pless IB, Goulet C, Platt RW, Robitaille Y (2005b) Effectiveness of helmets in ski-ers and snowboarders: case-control and case crossover study. Br Med J 330(7486):281. doi:10.1136/bmj.38314.480035.7C
9. McCrory P (2002) Editorial: the role of helmets in skiing and snowboarding. Br J Sports Med 36(5):314. doi:10.1136/bjsm.36.5.314
10. Mueller BA, Cummings P, Rivara F, Brooks MA, Terasaki RD (2008) Injuries of the head, face, and neck in relation to Ski helmet use. Epidemiology 19(2):270–276
11. Cundy TP, Systermans BJ, Cundy WJ, Cundy PJ, Briggs NE, Robinson JB (2010) Helmets for snow sports: prevalence, trends, predictors and attitudes to use. J Trauma 69(6):1486–1490
12. McCrory P, Meeuwisse W, Johnston K, Dvorak J, Aubry M, Molloy M, Cantu R (2009) Consensus statement on concussion in sport—the 3rd International Conference on concussion in sport, held in Zurich, November 2008. J Clin Neurosci 16(3):755–763
13. McCrory P, Meeuwisse WH, Aubry M, Cantu B, Dvořák J, Echemendia RJ, Engebretsen L, Johnston K, Kutcher JS, Raftery M, Sills A, Benson BW, Davis GA, Ellenbogen RG, Guskiewicz K, Herring SA, Iverson GL, Jordan BD, Kissick J, McCrea M, McIntosh AS, Maddocks D, Makdissi M, Purcell L, Putukian M, Schneider K, Tator CH, Turner M (2013) Consensus statement on concussion in sport: the 4th International Conference on Concussion in Sport held in Zurich, November 2012. Br J Sports Med 47(5):250–258. doi:10.1136/bjsports-2013-092313
14. Fédération Internationale de Ski (FIS) (2011) Specficiations for competition equipment and commercial markings: edition 2011/12. Equipment, FIS
15. Bigler ED (2008) Neuropsychology and clinical neuroscience of persistent post-concussive syndrome. J Int Neuropsychol Soc 14(1):1–22. doi:10.1017/S135561770808017X
16. Sulheim S, Holme I, Ekeland A, Bahr R (2006) Helmet use and risk of head injuries in alpine skiers and snowboarders. J Am Med Assoc 295(8):919–924
17. Curaudeau GA, Sharma N, Rovin RA (2011) Development of an iPhone application for side-line concussion testing. Neurosurg Focus 31(5):E4. doi:10.3171/2011.8.FOCUS11186
18. Amick RZ, Patterson JA, Jorgensen MJ (2013) Sensitivity of tri-axial accelerometers within mobile consumer electronic devices: a pilot study. Int J Appl 3(2):97–100
19. Valovich McLeod TC, Bay RC, Lam KC, Chhabra A (2012) Representative baseline values on the Sport Concussion Assessment Tool 2 (SCAT2) in adolescent athletes vary by gender, grade, and concussion history. Am J Sports Med 40(4):927–933
20. Guskiewicz KM, Register-Mihalik J, McCrory P, McCrea M, Johnston K, Makdissi M, Dvořák J, Davis G, Meeuwisse W (2013) Evidence-based approach to revising the SCAT2: introduc-ing the SCAT3. Br J Sports Med 47(5):289–293. doi:10.1136/bjsports-2013-092225
21. Woods DL, Wyma JM, Yund EW, Herron TJ, Reed B (2015) Age-related slowing of response selection and production in a visual choice reaction time task. Front Hum Neurosci 9:193
22. Cavanaugh JT, Guskiewicz KM, Giuliani C, Marshall S, Mercer V, Stergiou N (2005) Detecting altered postural control after cerebral concussion in athletes with normal postural stability. Br J Sports Med 39(11):805–811
23. Slobounov S, Cao C, Sebastianelli W, Slobounov E, Newell K (2008) Residual deficits from concussion as revealed by virtual time-to-contact measures of postural stability. Clin Neurophysiol 119(2):281–289
24. Brooks MA, Peterson K, Biese K, Sanfilippo J, Heiderscheit BC, Bell DR (2016) Concussion increases odds of sustaining a lower extremity musculoskeletal injury after return to play among collegiate athletes. Am J Sports Med 44(3):742–747
G. Waddington et al.
61
25. Wasserman EB, Abar B, Shah MN, Wasserman D, Bazarian JJ (2015) Concussions are associ-ated with decreased batting performance among major league baseball players. Am J Sports Med 43(5):1127–1133
26. Dickson TJ (2008) Behaviors and attitudes towards snowsport safety in Australia. J ASTM Int 5(4):Jai101433. doi:10.1520/JAI101433
27. Han J, Waddington G, Anson J, Adams R (2015) Level of competitive success achieved by elite athletes and multi-joint proprioceptive ability. J Sci Med Sport 18(1):77–81
28. Ruedl G, Burtscher M, Wolf M, Ledochowski L, Bauer R, Benedetto KP, Kopp M (2015) Are self-reported risk-taking behavior and helmet use associated with injury causes among skiers and snowboarders? Scand J Med Sci Sports 25(1):125–130. doi:10.1111/sms.12139
29. Waddington GS, Dickson TJ, Trathen S, Adams RD (2010) Hydration packs modify profes-sional skiers’ hydration levels in all day skiing: a randomised controlled trial. J ASTM Int 7(10):JAI102818. doi:10.1520/JAI102818
Open Access This chapter is distributed under the terms of the Creative Commons Attribution-Noncommercial 2.5 License (http://creativecommons.org/licenses/by-nc/2.5/) which permits any noncommercial use, distribution, and reproduction in any medium, provided the original author(s) and source are credited.
The images or other third party material in this chapter are included in the work’s Creative Commons license, unless indicated otherwise in the credit line; if such material is not included in the work’s Creative Commons license and the respective action is not permitted by statutory regu-lation, users will need to obtain permission from the license holder to duplicate, adapt or reproduce the material.
A Sport Concussion Assessment Tool (SCAT2) for Use in Snowsports…
Part IISki Bindings
65© The Author(s) 2017 I.S. Scher et al. (eds.), Snow Sports Trauma and Safety, DOI 10.1007/978-3-319-52755-0_6
Interactions of Tech Bindings with AT Boot Toe Inserts: Part I, Binding Toe-Piece Mechanics
Jeffrey R. Campbell, Irving S. Scher, David Carpenter, Bruce J. Jahnke, and Randal P. Ching
Abstract Alpine touring (AT) is a subdiscipline of alpine skiing where skiers ascend and descend snow slopes under their own power. Specialized equipment has been developed for AT skiing, including Tech/Pin bindings that rely on metal inserts molded into AT boots to rigidly couple the boot to the binding. The current lack of standardization has resulted in significant variation in tech insert geometry between boot manufacturers. It is hypothesized that the constraint forces from the tech bind-ing on AT boots are highly sensitive to variations in tech insert geometry.
The dimensions of tech inserts in toe region of AT boots were measured from five manufacturers’ boots. The constraint force applied by the toe pieces throughout their travel was measured quasi-statically using custom-built fixture on ten models of tech bindings from five manufacturers. In addition, the retention and release char-acteristics for an applied twisting torque were measured for the AT boots in the Tech/Pin binding toe pieces using an ASTM F504 test apparatus. Linear statistical models were developed to predict the measured retention-release behavior using the clamping force and tech insert geometry as predictor variables. The relative impor-tance of each predictor variable from the linear model was then calculated.
The compressive forces applied to the AT boots were significantly different between bindings for the same boot, but not significantly different for the AT boots
J.R. Campbell (*) • R.P. Ching Applied Biomechanics Laboratory, Department of Mechanical Engineering, University of Washington, 205 NE Northlake Way, Suite 100, Seattle, WA 98105, USAe-mail: [email protected]
I.S. Scher Applied Biomechanics Laboratory, Department of Mechanical Engineering, University of Washington, 205 NE Northlake Way, Suite 100, Seattle, WA 98105, USA
Guidance Engineering and Applied Research, 205 NE Northlake Way, Suite 100, Seattle, WA 98105, USA
D. Carpenter DRC Services LLC, 5327 SW Manning Street, Seattle, WA 98116, USA
B.J. Jahnke K2 Sports, 4201 6th Ave S, Seattle, WA 98108, USA
66
in any particular binding (p < 0.001). Across all AT boots tested, the twisting release torque was not significantly different between bindings for a given boot (p = 0.81); however, significant differences in release torque were found between boots in any particular binding (two-way ANOVA, Tukeys Post Hoc, p < 0.001). Boot dimensions at the toe had the largest influence on release torque (~85%) while the compressive force had the smallest influence (~15%).
Tech/Pin binding toe pieces are sensitive to small changes in tech insert geome-try. This study only examined toe-piece kinematics and forces of tech bindings. Based on the data presented, a companion study will test Tech/Pin boot-binding systems with both the toe and heelpieces.
Keywords Skiing • Alpine touring • Ski bindings • Tech inserts
1 Introduction
Conventional alpine boots and bindings rigidly couple the skiers’ boot to the ski to allow skiers to perform maneuvers while skiing downhill and to release the ski from the boot before loads to the lower leg become injurious. Alpine touring (AT) is a subdiscipline of skiing in which the skier uses the skis to ascend, tra-verse, and descend snow-covered terrain in the backcountry on unmaintained trails and sometimes rough terrain. Conventional alpine skiing equipment lacks functionality to allow skiers to ascend slopes under their own power during alpine touring. As a result, ski boot and binding manufacturers have developed specialized alpine touring equipment.
As a system, AT boots and bindings have two functional modes:
• Downhill (Ski) mode: the toe and heel of the boot are both rigidly fixed to the ski by the binding to allow the skier to perform maneuvers as they ski down snow slopes.
• Uphill (Walk) mode: the binding allows the heel of the boot to be decoupled from the ski, and the toe of the boot is free to pivot to allow the skier to walk up hill on skis, providing both flotation in deep snow and efficiency.
1.1 Alpine Touring Bindings
There are currently two alpine touring binding designs on the market, AT Frame Bindings and Tech/Pin bindings. AT Frame bindings are extrapolations of estab-lished alpine binding technology that incorporate an alpine binding toe piece and heelpiece mounted on a hinged chassis. A locking mechanism can secure the chassis
J.R. Campbell et al.
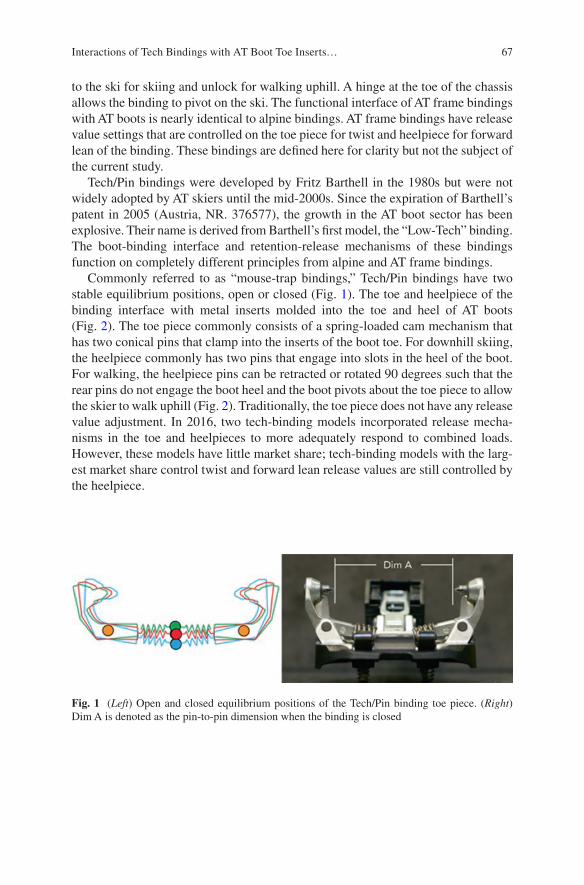
67
to the ski for skiing and unlock for walking uphill. A hinge at the toe of the chassis allows the binding to pivot on the ski. The functional interface of AT frame bindings with AT boots is nearly identical to alpine bindings. AT frame bindings have release value settings that are controlled on the toe piece for twist and heelpiece for forward lean of the binding. These bindings are defined here for clarity but not the subject of the current study.
Tech/Pin bindings were developed by Fritz Barthell in the 1980s but were not widely adopted by AT skiers until the mid-2000s. Since the expiration of Barthell’s patent in 2005 (Austria, NR. 376577), the growth in the AT boot sector has been explosive. Their name is derived from Barthell’s first model, the “Low-Tech” binding. The boot-binding interface and retention-release mechanisms of these bindings function on completely different principles from alpine and AT frame bindings.
Commonly referred to as “mouse-trap bindings,” Tech/Pin bindings have two stable equilibrium positions, open or closed (Fig. 1). The toe and heelpiece of the binding interface with metal inserts molded into the toe and heel of AT boots (Fig. 2). The toe piece commonly consists of a spring-loaded cam mechanism that has two conical pins that clamp into the inserts of the boot toe. For downhill skiing, the heelpiece commonly has two pins that engage into slots in the heel of the boot. For walking, the heelpiece pins can be retracted or rotated 90 degrees such that the rear pins do not engage the boot heel and the boot pivots about the toe piece to allow the skier to walk uphill (Fig. 2). Traditionally, the toe piece does not have any release value adjustment. In 2016, two tech-binding models incorporated release mecha-nisms in the toe and heelpieces to more adequately respond to combined loads. However, these models have little market share; tech-binding models with the larg-est market share control twist and forward lean release values are still controlled by the heelpiece.
Fig. 1 (Left) Open and closed equilibrium positions of the Tech/Pin binding toe piece. (Right) Dim A is denoted as the pin-to-pin dimension when the binding is closed
Interactions of Tech Bindings with AT Boot Toe Inserts…
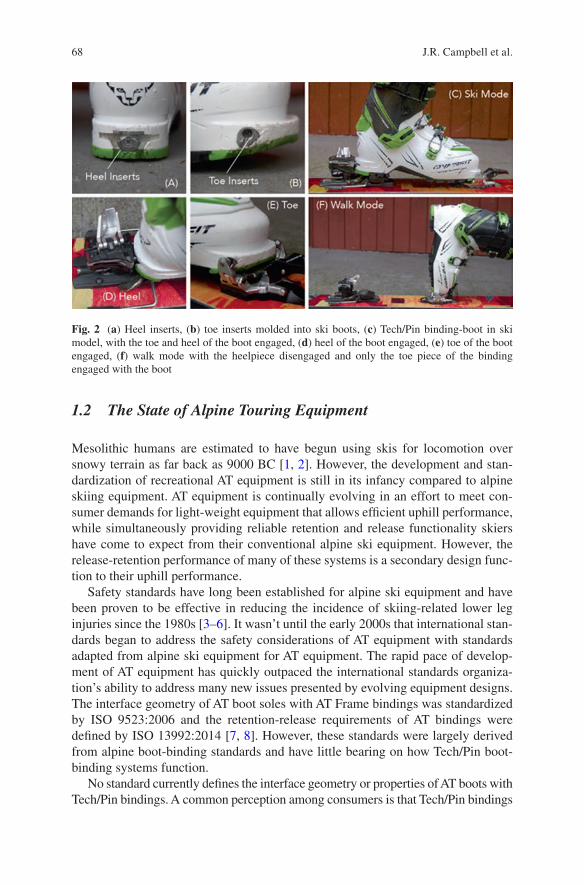
68
1.2 The State of Alpine Touring Equipment
Mesolithic humans are estimated to have begun using skis for locomotion over snowy terrain as far back as 9000 BC [1, 2]. However, the development and stan-dardization of recreational AT equipment is still in its infancy compared to alpine skiing equipment. AT equipment is continually evolving in an effort to meet con-sumer demands for light-weight equipment that allows efficient uphill performance, while simultaneously providing reliable retention and release functionality skiers have come to expect from their conventional alpine ski equipment. However, the release-retention performance of many of these systems is a secondary design func-tion to their uphill performance.
Safety standards have long been established for alpine ski equipment and have been proven to be effective in reducing the incidence of skiing-related lower leg injuries since the 1980s [3–6]. It wasn’t until the early 2000s that international stan-dards began to address the safety considerations of AT equipment with standards adapted from alpine ski equipment for AT equipment. The rapid pace of develop-ment of AT equipment has quickly outpaced the international standards organiza-tion’s ability to address many new issues presented by evolving equipment designs. The interface geometry of AT boot soles with AT Frame bindings was standardized by ISO 9523:2006 and the retention-release requirements of AT bindings were defined by ISO 13992:2014 [7, 8]. However, these standards were largely derived from alpine boot-binding standards and have little bearing on how Tech/Pin boot- binding systems function.
No standard currently defines the interface geometry or properties of AT boots with Tech/Pin bindings. A common perception among consumers is that Tech/Pin bindings
Fig. 2 (a) Heel inserts, (b) toe inserts molded into ski boots, (c) Tech/Pin binding-boot in ski model, with the toe and heel of the boot engaged, (d) heel of the boot engaged, (e) toe of the boot engaged, (f) walk mode with the heelpiece disengaged and only the toe piece of the binding engaged with the boot
J.R. Campbell et al.
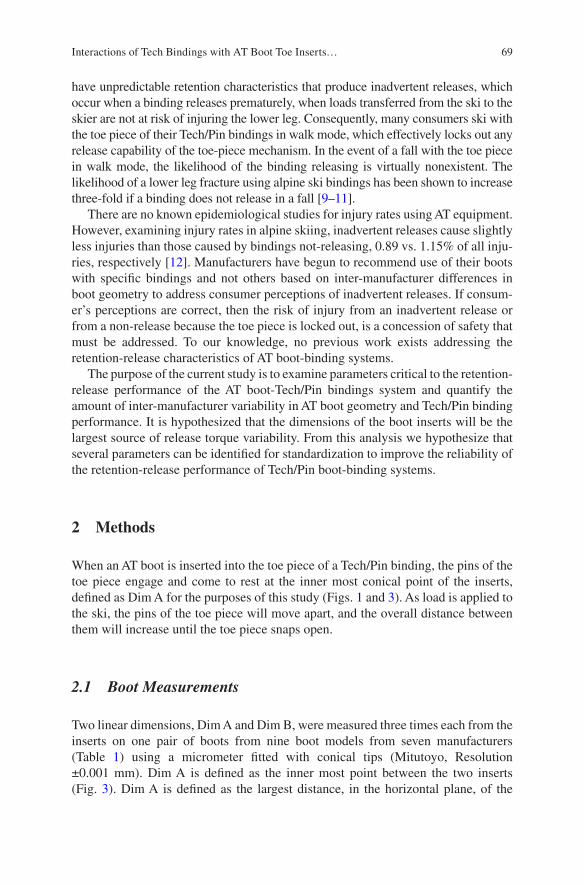
69
have unpredictable retention characteristics that produce inadvertent releases, which occur when a binding releases prematurely, when loads transferred from the ski to the skier are not at risk of injuring the lower leg. Consequently, many consumers ski with the toe piece of their Tech/Pin bindings in walk mode, which effectively locks out any release capability of the toe-piece mechanism. In the event of a fall with the toe piece in walk mode, the likelihood of the binding releasing is virtually nonexistent. The likelihood of a lower leg fracture using alpine ski bindings has been shown to increase three-fold if a binding does not release in a fall [9–11].
There are no known epidemiological studies for injury rates using AT equipment. However, examining injury rates in alpine skiing, inadvertent releases cause slightly less injuries than those caused by bindings not-releasing, 0.89 vs. 1.15% of all inju-ries, respectively [12]. Manufacturers have begun to recommend use of their boots with specific bindings and not others based on inter-manufacturer differences in boot geometry to address consumer perceptions of inadvertent releases. If consum-er’s perceptions are correct, then the risk of injury from an inadvertent release or from a non-release because the toe piece is locked out, is a concession of safety that must be addressed. To our knowledge, no previous work exists addressing the retention- release characteristics of AT boot-binding systems.
The purpose of the current study is to examine parameters critical to the retention- release performance of the AT boot-Tech/Pin bindings system and quantify the amount of inter-manufacturer variability in AT boot geometry and Tech/Pin binding performance. It is hypothesized that the dimensions of the boot inserts will be the largest source of release torque variability. From this analysis we hypothesize that several parameters can be identified for standardization to improve the reliability of the retention-release performance of Tech/Pin boot-binding systems.
2 Methods
When an AT boot is inserted into the toe piece of a Tech/Pin binding, the pins of the toe piece engage and come to rest at the inner most conical point of the inserts, defined as Dim A for the purposes of this study (Figs. 1 and 3). As load is applied to the ski, the pins of the toe piece will move apart, and the overall distance between them will increase until the toe piece snaps open.
2.1 Boot Measurements
Two linear dimensions, Dim A and Dim B, were measured three times each from the inserts on one pair of boots from nine boot models from seven manufacturers (Table 1) using a micrometer fitted with conical tips (Mitutoyo, Resolution ±0.001 mm). Dim A is defined as the inner most point between the two inserts (Fig. 3). Dim A is defined as the largest distance, in the horizontal plane, of the
Interactions of Tech Bindings with AT Boot Toe Inserts…
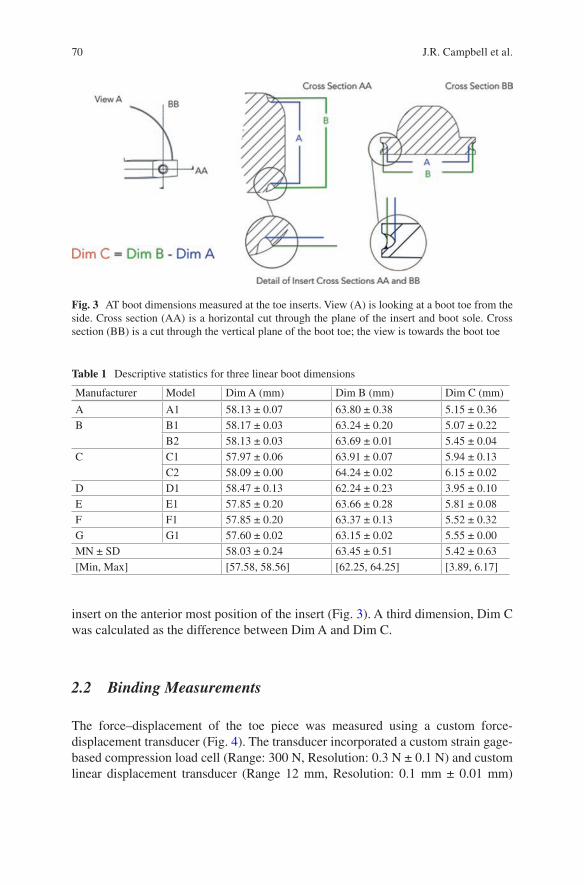
70
insert on the anterior most position of the insert (Fig. 3). A third dimension, Dim C was calculated as the difference between Dim A and Dim C.
2.2 Binding Measurements
The force–displacement of the toe piece was measured using a custom force- displacement transducer (Fig. 4). The transducer incorporated a custom strain gage- based compression load cell (Range: 300 N, Resolution: 0.3 N ± 0.1 N) and custom linear displacement transducer (Range 12 mm, Resolution: 0.1 mm ± 0.01 mm)
Fig. 3 AT boot dimensions measured at the toe inserts. View (A) is looking at a boot toe from the side. Cross section (AA) is a horizontal cut through the plane of the insert and boot sole. Cross section (BB) is a cut through the vertical plane of the boot toe; the view is towards the boot toe
Table 1 Descriptive statistics for three linear boot dimensions
Manufacturer Model Dim A (mm) Dim B (mm) Dim C (mm)
A A1 58.13 ± 0.07 63.80 ± 0.38 5.15 ± 0.36B B1 58.17 ± 0.03 63.24 ± 0.20 5.07 ± 0.22
B2 58.13 ± 0.03 63.69 ± 0.01 5.45 ± 0.04C C1 57.97 ± 0.06 63.91 ± 0.07 5.94 ± 0.13
C2 58.09 ± 0.00 64.24 ± 0.02 6.15 ± 0.02D D1 58.47 ± 0.13 62.24 ± 0.23 3.95 ± 0.10E E1 57.85 ± 0.20 63.66 ± 0.28 5.81 ± 0.08F F1 57.85 ± 0.20 63.37 ± 0.13 5.52 ± 0.32G G1 57.60 ± 0.02 63.15 ± 0.02 5.55 ± 0.00MN ± SD 58.03 ± 0.24 63.45 ± 0.51 5.42 ± 0.63[Min, Max] [57.58, 58.56] [62.25, 64.25] [3.89, 6.17]
J.R. Campbell et al.
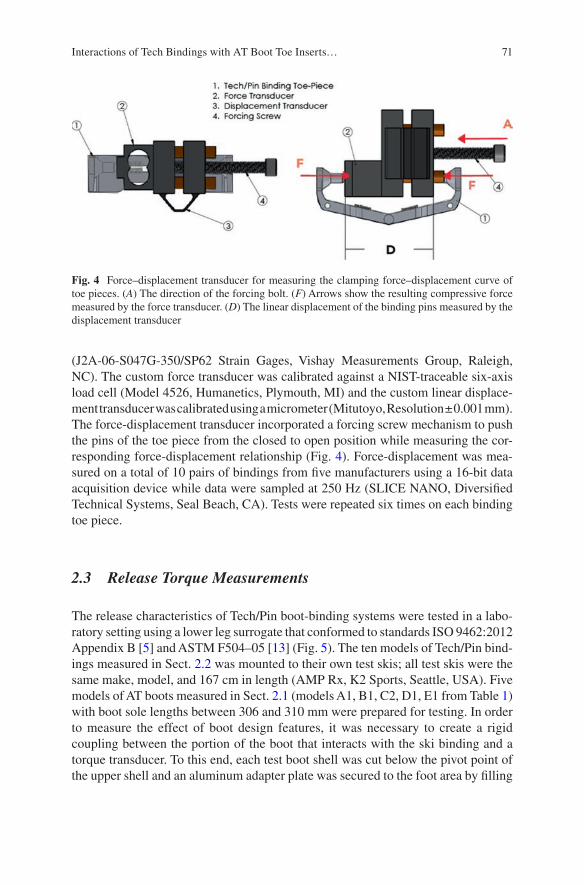
71
(J2A-06-S047G-350/SP62 Strain Gages, Vishay Measurements Group, Raleigh, NC). The custom force transducer was calibrated against a NIST-traceable six-axis load cell (Model 4526, Humanetics, Plymouth, MI) and the custom linear displace-ment transducer was calibrated using a micrometer (Mitutoyo, Resolution ± 0.001 mm). The force-displacement transducer incorporated a forcing screw mechanism to push the pins of the toe piece from the closed to open position while measuring the cor-responding force-displacement relationship (Fig. 4). Force- displacement was mea-sured on a total of 10 pairs of bindings from five manufacturers using a 16-bit data acquisition device while data were sampled at 250 Hz (SLICE NANO, Diversified Technical Systems, Seal Beach, CA). Tests were repeated six times on each binding toe piece.
2.3 Release Torque Measurements
The release characteristics of Tech/Pin boot-binding systems were tested in a labo-ratory setting using a lower leg surrogate that conformed to standards ISO 9462:2012 Appendix B [5] and ASTM F504–05 [13] (Fig. 5). The ten models of Tech/Pin bind-ings measured in Sect. 2.2 was mounted to their own test skis; all test skis were the same make, model, and 167 cm in length (AMP Rx, K2 Sports, Seattle, USA). Five models of AT boots measured in Sect. 2.1 (models A1, B1, C2, D1, E1 from Table 1) with boot sole lengths between 306 and 310 mm were prepared for testing. In order to measure the effect of boot design features, it was necessary to create a rigid coupling between the portion of the boot that interacts with the ski binding and a torque transducer. To this end, each test boot shell was cut below the pivot point of the upper shell and an aluminum adapter plate was secured to the foot area by filling
Fig. 4 Force–displacement transducer for measuring the clamping force–displacement curve of toe pieces. (A) The direction of the forcing bolt. (F) Arrows show the resulting compressive force measured by the force transducer. (D) The linear displacement of the binding pins measured by the displacement transducer
Interactions of Tech Bindings with AT Boot Toe Inserts…
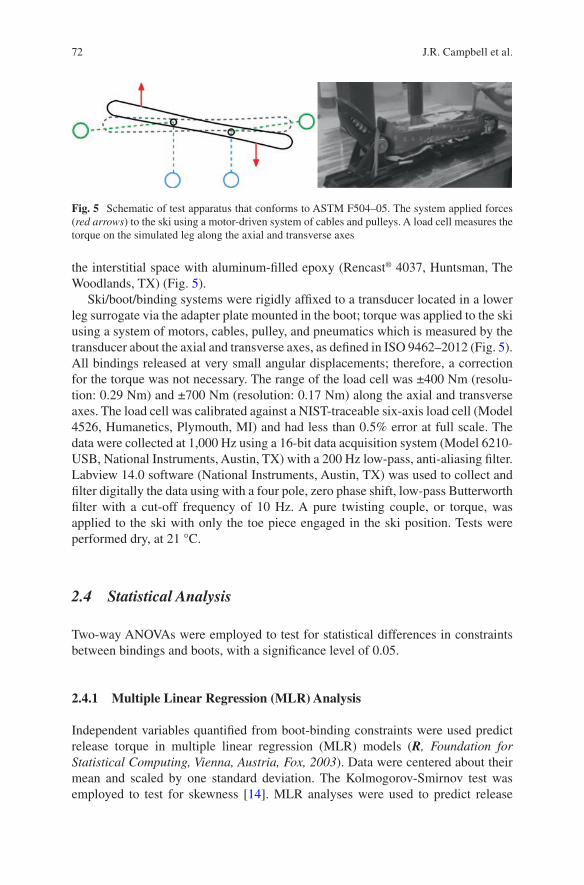
72
the interstitial space with aluminum-filled epoxy (Rencast® 4037, Huntsman, The Woodlands, TX) (Fig. 5).
Ski/boot/binding systems were rigidly affixed to a transducer located in a lower leg surrogate via the adapter plate mounted in the boot; torque was applied to the ski using a system of motors, cables, pulley, and pneumatics which is measured by the transducer about the axial and transverse axes, as defined in ISO 9462–2012 (Fig. 5). All bindings released at very small angular displacements; therefore, a correction for the torque was not necessary. The range of the load cell was ±400 Nm (resolu-tion: 0.29 Nm) and ±700 Nm (resolution: 0.17 Nm) along the axial and transverse axes. The load cell was calibrated against a NIST-traceable six-axis load cell (Model 4526, Humanetics, Plymouth, MI) and had less than 0.5% error at full scale. The data were collected at 1,000 Hz using a 16-bit data acquisition system (Model 6210- USB, National Instruments, Austin, TX) with a 200 Hz low-pass, anti-aliasing filter. Labview 14.0 software (National Instruments, Austin, TX) was used to collect and filter digitally the data using with a four pole, zero phase shift, low-pass Butterworth filter with a cut-off frequency of 10 Hz. A pure twisting couple, or torque, was applied to the ski with only the toe piece engaged in the ski position. Tests were performed dry, at 21 °C.
2.4 Statistical Analysis
Two-way ANOVAs were employed to test for statistical differences in constraints between bindings and boots, with a significance level of 0.05.
2.4.1 Multiple Linear Regression (MLR) Analysis
Independent variables quantified from boot-binding constraints were used predict release torque in multiple linear regression (MLR) models (R, Foundation for Statistical Computing, Vienna, Austria, Fox, 2003). Data were centered about their mean and scaled by one standard deviation. The Kolmogorov-Smirnov test was employed to test for skewness [14]. MLR analyses were used to predict release
Fig. 5 Schematic of test apparatus that conforms to ASTM F504–05. The system applied forces (red arrows) to the ski using a motor-driven system of cables and pulleys. A load cell measures the torque on the simulated leg along the axial and transverse axes
J.R. Campbell et al.
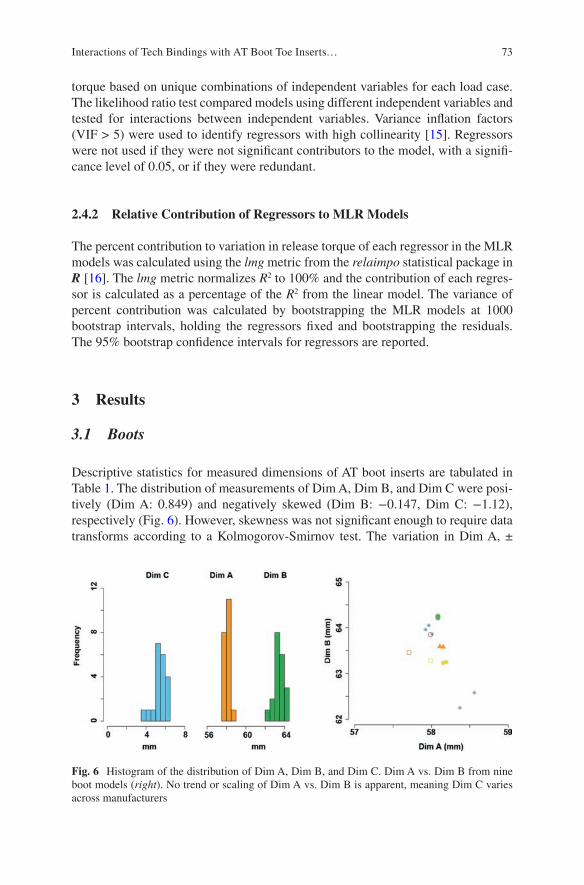
73
torque based on unique combinations of independent variables for each load case. The likelihood ratio test compared models using different independent variables and tested for interactions between independent variables. Variance inflation factors (VIF > 5) were used to identify regressors with high collinearity [15]. Regressors were not used if they were not significant contributors to the model, with a signifi-cance level of 0.05, or if they were redundant.
2.4.2 Relative Contribution of Regressors to MLR Models
The percent contribution to variation in release torque of each regressor in the MLR models was calculated using the lmg metric from the relaimpo statistical package in R [16]. The lmg metric normalizes R2 to 100% and the contribution of each regres-sor is calculated as a percentage of the R2 from the linear model. The variance of percent contribution was calculated by bootstrapping the MLR models at 1000 bootstrap intervals, holding the regressors fixed and bootstrapping the residuals. The 95% bootstrap confidence intervals for regressors are reported.
3 Results
3.1 Boots
Descriptive statistics for measured dimensions of AT boot inserts are tabulated in Table 1. The distribution of measurements of Dim A, Dim B, and Dim C were posi-tively (Dim A: 0.849) and negatively skewed (Dim B: −0.147, Dim C: −1.12), respectively (Fig. 6). However, skewness was not significant enough to require data transforms according to a Kolmogorov-Smirnov test. The variation in Dim A, ±
Fig. 6 Histogram of the distribution of Dim A, Dim B, and Dim C. Dim A vs. Dim B from nine boot models (right). No trend or scaling of Dim A vs. Dim B is apparent, meaning Dim C varies across manufacturers
Interactions of Tech Bindings with AT Boot Toe Inserts…
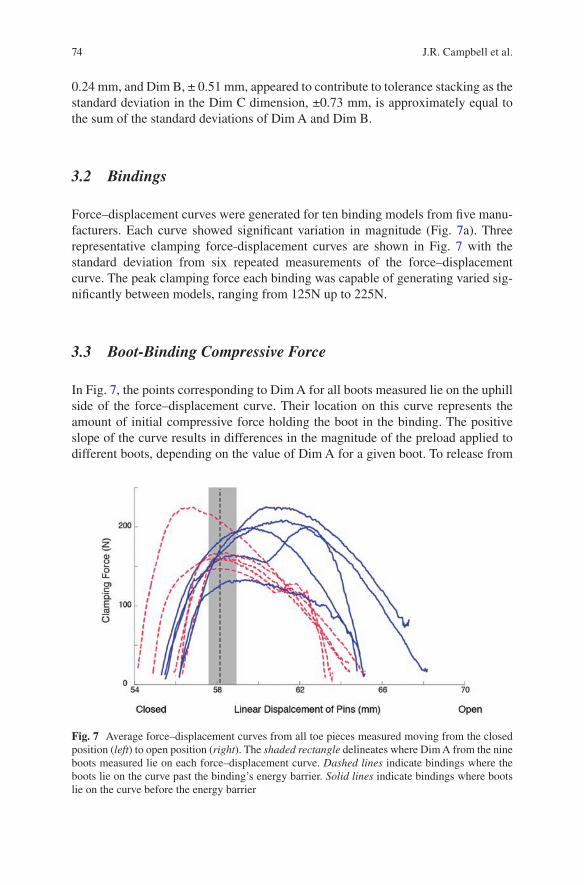
74
0.24 mm, and Dim B, ± 0.51 mm, appeared to contribute to tolerance stacking as the standard deviation in the Dim C dimension, ±0.73 mm, is approximately equal to the sum of the standard deviations of Dim A and Dim B.
3.2 Bindings
Force–displacement curves were generated for ten binding models from five manu-facturers. Each curve showed significant variation in magnitude (Fig. 7a). Three representative clamping force-displacement curves are shown in Fig. 7 with the standard deviation from six repeated measurements of the force–displacement curve. The peak clamping force each binding was capable of generating varied sig-nificantly between models, ranging from 125N up to 225N.
3.3 Boot-Binding Compressive Force
In Fig. 7, the points corresponding to Dim A for all boots measured lie on the uphill side of the force–displacement curve. Their location on this curve represents the amount of initial compressive force holding the boot in the binding. The positive slope of the curve results in differences in the magnitude of the preload applied to different boots, depending on the value of Dim A for a given boot. To release from
Fig. 7 Average force–displacement curves from all toe pieces measured moving from the closed position (left) to open position (right). The shaded rectangle delineates where Dim A from the nine boots measured lie on each force–displacement curve. Dashed lines indicate bindings where the boots lie on the curve past the binding’s energy barrier. Solid lines indicate bindings where boots lie on the curve before the energy barrier
J.R. Campbell et al.
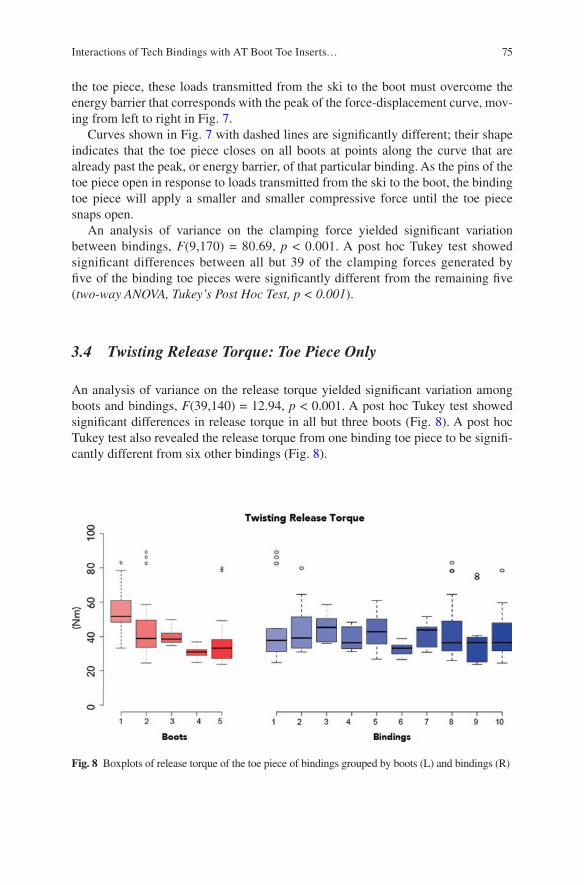
75
the toe piece, these loads transmitted from the ski to the boot must overcome the energy barrier that corresponds with the peak of the force-displacement curve, mov-ing from left to right in Fig. 7.
Curves shown in Fig. 7 with dashed lines are significantly different; their shape indicates that the toe piece closes on all boots at points along the curve that are already past the peak, or energy barrier, of that particular binding. As the pins of the toe piece open in response to loads transmitted from the ski to the boot, the binding toe piece will apply a smaller and smaller compressive force until the toe piece snaps open.
An analysis of variance on the clamping force yielded significant variation between bindings, F(9,170) = 80.69, p < 0.001. A post hoc Tukey test showed significant differences between all but 39 of the clamping forces generated by five of the binding toe pieces were significantly different from the remaining five (two-way ANOVA, Tukey’s Post Hoc Test, p < 0.001).
3.4 Twisting Release Torque: Toe Piece Only
An analysis of variance on the release torque yielded significant variation among boots and bindings, F(39,140) = 12.94, p < 0.001. A post hoc Tukey test showed significant differences in release torque in all but three boots (Fig. 8). A post hoc Tukey test also revealed the release torque from one binding toe piece to be signifi-cantly different from six other bindings (Fig. 8).
Fig. 8 Boxplots of release torque of the toe piece of bindings grouped by boots (L) and bindings (R)
Interactions of Tech Bindings with AT Boot Toe Inserts…
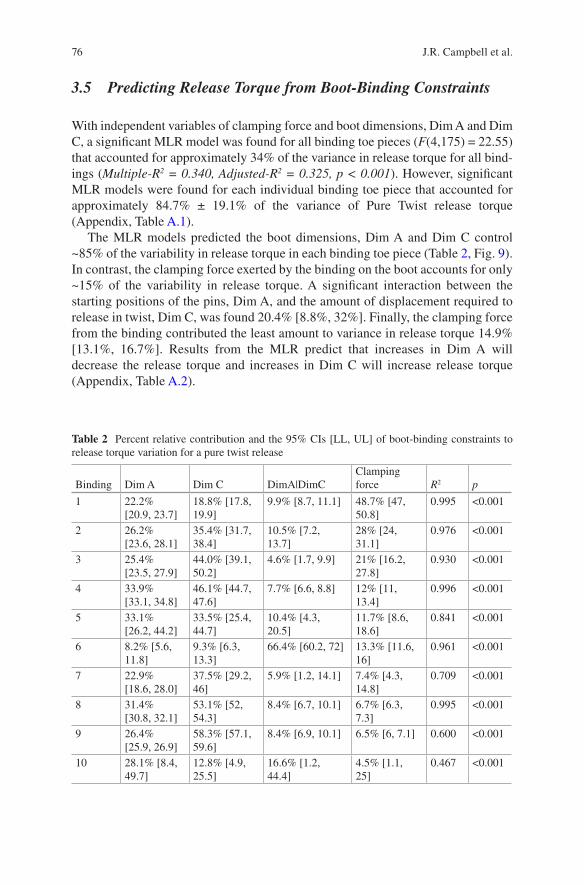
76
3.5 Predicting Release Torque from Boot-Binding Constraints
With independent variables of clamping force and boot dimensions, Dim A and Dim C, a significant MLR model was found for all binding toe pieces (F(4,175) = 22.55) that accounted for approximately 34% of the variance in release torque for all bind-ings (Multiple-R2 = 0.340, Adjusted-R2 = 0.325, p < 0.001). However, significant MLR models were found for each individual binding toe piece that accounted for approximately 84.7% ± 19.1% of the variance of Pure Twist release torque (Appendix, Table A.1).
The MLR models predicted the boot dimensions, Dim A and Dim C control ~85% of the variability in release torque in each binding toe piece (Table 2, Fig. 9). In contrast, the clamping force exerted by the binding on the boot accounts for only ~15% of the variability in release torque. A significant interaction between the starting positions of the pins, Dim A, and the amount of displacement required to release in twist, Dim C, was found 20.4% [8.8%, 32%]. Finally, the clamping force from the binding contributed the least amount to variance in release torque 14.9% [13.1%, 16.7%]. Results from the MLR predict that increases in Dim A will decrease the release torque and increases in Dim C will increase release torque (Appendix, Table A.2).
Table 2 Percent relative contribution and the 95% CIs [LL, UL] of boot-binding constraints to release torque variation for a pure twist release
Binding Dim A Dim C DimA|DimCClamping force R2 p
1 22.2% [20.9, 23.7]
18.8% [17.8, 19.9]
9.9% [8.7, 11.1] 48.7% [47, 50.8]
0.995 <0.001
2 26.2% [23.6, 28.1]
35.4% [31.7, 38.4]
10.5% [7.2, 13.7]
28% [24, 31.1]
0.976 <0.001
3 25.4% [23.5, 27.9]
44.0% [39.1, 50.2]
4.6% [1.7, 9.9] 21% [16.2, 27.8]
0.930 <0.001
4 33.9% [33.1, 34.8]
46.1% [44.7, 47.6]
7.7% [6.6, 8.8] 12% [11, 13.4]
0.996 <0.001
5 33.1% [26.2, 44.2]
33.5% [25.4, 44.7]
10.4% [4.3, 20.5]
11.7% [8.6, 18.6]
0.841 <0.001
6 8.2% [5.6, 11.8]
9.3% [6.3, 13.3]
66.4% [60.2, 72] 13.3% [11.6, 16]
0.961 <0.001
7 22.9% [18.6, 28.0]
37.5% [29.2, 46]
5.9% [1.2, 14.1] 7.4% [4.3, 14.8]
0.709 <0.001
8 31.4% [30.8, 32.1]
53.1% [52, 54.3]
8.4% [6.7, 10.1] 6.7% [6.3, 7.3]
0.995 <0.001
9 26.4% [25.9, 26.9]
58.3% [57.1, 59.6]
8.4% [6.9, 10.1] 6.5% [6, 7.1] 0.600 <0.001
10 28.1% [8.4, 49.7]
12.8% [4.9, 25.5]
16.6% [1.2, 44.4]
4.5% [1.1, 25]
0.467 <0.001
J.R. Campbell et al.
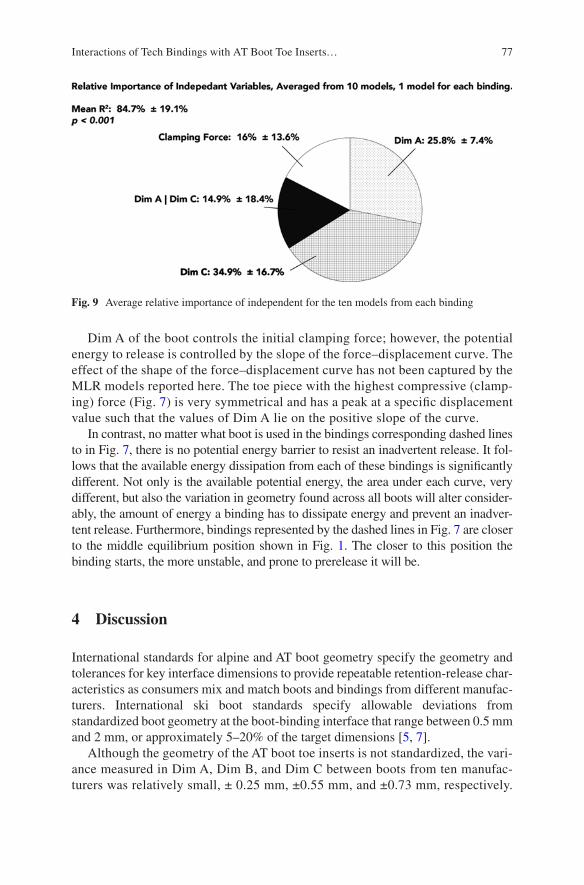
77
Dim A of the boot controls the initial clamping force; however, the potential energy to release is controlled by the slope of the force–displacement curve. The effect of the shape of the force–displacement curve has not been captured by the MLR models reported here. The toe piece with the highest compressive (clamp-ing) force (Fig. 7) is very symmetrical and has a peak at a specific displacement value such that the values of Dim A lie on the positive slope of the curve.
In contrast, no matter what boot is used in the bindings corresponding dashed lines to in Fig. 7, there is no potential energy barrier to resist an inadvertent release. It fol-lows that the available energy dissipation from each of these bindings is significantly different. Not only is the available potential energy, the area under each curve, very different, but also the variation in geometry found across all boots will alter consider-ably, the amount of energy a binding has to dissipate energy and prevent an inadver-tent release. Furthermore, bindings represented by the dashed lines in Fig. 7 are closer to the middle equilibrium position shown in Fig. 1. The closer to this position the binding starts, the more unstable, and prone to prerelease it will be.
4 Discussion
International standards for alpine and AT boot geometry specify the geometry and tolerances for key interface dimensions to provide repeatable retention-release char-acteristics as consumers mix and match boots and bindings from different manufac-turers. International ski boot standards specify allowable deviations from standardized boot geometry at the boot-binding interface that range between 0.5 mm and 2 mm, or approximately 5–20% of the target dimensions [5, 7].
Although the geometry of the AT boot toe inserts is not standardized, the vari-ance measured in Dim A, Dim B, and Dim C between boots from ten manufac-turers was relatively small, ± 0.25 mm, ±0.55 mm, and ±0.73 mm, respectively.
Fig. 9 Average relative importance of independent for the ten models from each binding
Interactions of Tech Bindings with AT Boot Toe Inserts…
78
However, these small variations significantly altered the release torque of boots from the toe piece in twist. For example, in Fig. 9, mean release torque of Binding 2 from a sample of ten boots was 36.5 Nm, but the maximum torque recorded from a boot was 78.44 Nm, a 215% increase in release torque resulting from the use of different boots in the same binding. The MLR models predicted that 85% of this variability is a product of the small variations in boot geometry. These results highlight Dim A and Dim B as dimensions that highly influence the behavior of Tech/Pin boot- binding systems and that if standardized across manu-facturers, a significant portion of the variation in release torque could be reduced. However, if a standard were to be developed for the insert geometry, the dimen-sions would likely require significantly tighter tolerances than what manufactur-ers are accustomed to.
The amount of variation in release torque found between boots and bindings may give credence to the perception among consumers that the release torque of Tech/Pin boot-binding systems is variable and unpredictable. This may tempt skiers to lock out the release mechanism of the toe piece while skiing, particularly when the consequences of a fall could lead to serious injury or death. If the variability in release torque found in this study is an indicator of retention-release function of Tech/Pin bindings under skiing conditions, consumers may be at a higher risk of injury than they are accustomed to when using typical alpine skiing equipment, whether they lock out the release mechanism or not, due to an inadvertent release, or a non-release of a boot-binding system [12].
The current study has investigated the effect of geometric variations of boot insert geometry on release torque. Other factors not explored in the current study, but may also significantly affect release torque, include the surface roughness of the boot inserts, the hardness of the metal used in the binding pins and boot toe inserts, wear of these metal components over time, and debris that enters the system from being used in a mountainous environment.
This study was limited to an examination of the interactions of the boot-binding interface with the toe inserts of the boot and toe piece of the binding. The goal of this study was to understand the fundamental mechanics of the interaction of AT boot insert geometry and Tech/Pin binding toe pieces. The energy barriers of the toe piece have been reported from quasi-static tests. The slope of these quasi-static energy bar-riers provides valuable insight into the stability of a toe piece under dynamic loading; readers should note that under dynamic loading conditions, with the heelpiece engaged, the effects of boot geometry reported here might change. Our study exam-ines the contribution of the toe piece to variation in release torque. Other than a pure twisting release, the current study did not examine any other load cases. Future studies will also examine how the contributions of the heelpiece and boot dimensions affect variations in release torque under other loading scenarios simulating forward and backward twisting falls.
J.R. Campbell et al.
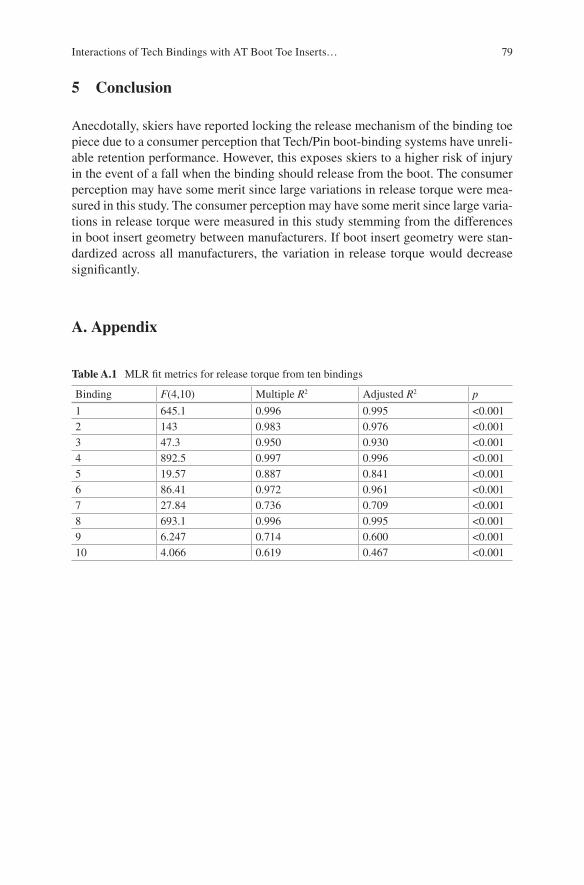
79
5 Conclusion
Anecdotally, skiers have reported locking the release mechanism of the binding toe piece due to a consumer perception that Tech/Pin boot-binding systems have unreli-able retention performance. However, this exposes skiers to a higher risk of injury in the event of a fall when the binding should release from the boot. The consumer perception may have some merit since large variations in release torque were mea-sured in this study. The consumer perception may have some merit since large varia-tions in release torque were measured in this study stemming from the differences in boot insert geometry between manufacturers. If boot insert geometry were stan-dardized across all manufacturers, the variation in release torque would decrease significantly.
A. Appendix
Table A.1 MLR fit metrics for release torque from ten bindings
Binding F(4,10) Multiple R2 Adjusted R2 p
1 645.1 0.996 0.995 <0.0012 143 0.983 0.976 <0.0013 47.3 0.950 0.930 <0.0014 892.5 0.997 0.996 <0.0015 19.57 0.887 0.841 <0.0016 86.41 0.972 0.961 <0.0017 27.84 0.736 0.709 <0.0018 693.1 0.996 0.995 <0.0019 6.247 0.714 0.600 <0.00110 4.066 0.619 0.467 <0.001
Interactions of Tech Bindings with AT Boot Toe Inserts…
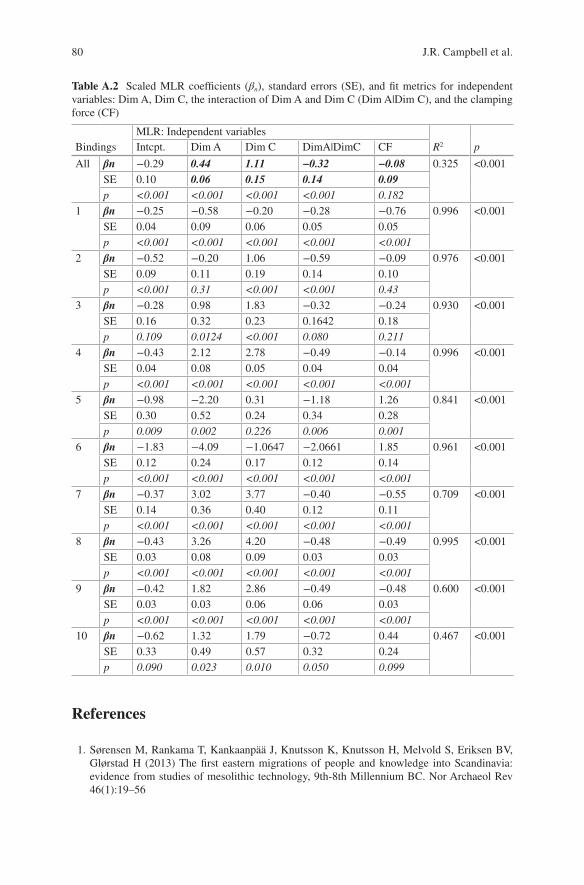
80
References
1. Sørensen M, Rankama T, Kankaanpää J, Knutsson K, Knutsson H, Melvold S, Eriksen BV, Glørstad H (2013) The first eastern migrations of people and knowledge into Scandinavia: evidence from studies of mesolithic technology, 9th-8th Millennium BC. Nor Archaeol Rev 46(1):19–56
Table A.2 Scaled MLR coefficients (βn), standard errors (SE), and fit metrics for independent variables: Dim A, Dim C, the interaction of Dim A and Dim C (Dim A|Dim C), and the clamping force (CF)
BindingsMLR: Independent variables
R2 pIntcpt. Dim A Dim C DimA|DimC CF
All βn −0.29 0.44 1.11 −0.32 −0.08 0.325 <0.001SE 0.10 0.06 0.15 0.14 0.09p <0.001 <0.001 <0.001 <0.001 0.182
1 βn −0.25 −0.58 −0.20 −0.28 −0.76 0.996 <0.001SE 0.04 0.09 0.06 0.05 0.05p <0.001 <0.001 <0.001 <0.001 <0.001
2 βn −0.52 −0.20 1.06 −0.59 −0.09 0.976 <0.001SE 0.09 0.11 0.19 0.14 0.10p <0.001 0.31 <0.001 <0.001 0.43
3 βn −0.28 0.98 1.83 −0.32 −0.24 0.930 <0.001SE 0.16 0.32 0.23 0.1642 0.18p 0.109 0.0124 <0.001 0.080 0.211
4 βn −0.43 2.12 2.78 −0.49 −0.14 0.996 <0.001SE 0.04 0.08 0.05 0.04 0.04p <0.001 <0.001 <0.001 <0.001 <0.001
5 βn −0.98 −2.20 0.31 −1.18 1.26 0.841 <0.001SE 0.30 0.52 0.24 0.34 0.28p 0.009 0.002 0.226 0.006 0.001
6 βn −1.83 −4.09 −1.0647 −2.0661 1.85 0.961 <0.001SE 0.12 0.24 0.17 0.12 0.14p <0.001 <0.001 <0.001 <0.001 <0.001
7 βn −0.37 3.02 3.77 −0.40 −0.55 0.709 <0.001SE 0.14 0.36 0.40 0.12 0.11p <0.001 <0.001 <0.001 <0.001 <0.001
8 βn −0.43 3.26 4.20 −0.48 −0.49 0.995 <0.001SE 0.03 0.08 0.09 0.03 0.03p <0.001 <0.001 <0.001 <0.001 <0.001
9 βn −0.42 1.82 2.86 −0.49 −0.48 0.600 <0.001SE 0.03 0.03 0.06 0.06 0.03p <0.001 <0.001 <0.001 <0.001 <0.001
10 βn −0.62 1.32 1.79 −0.72 0.44 0.467 <0.001SE 0.33 0.49 0.57 0.32 0.24p 0.090 0.023 0.010 0.050 0.099
J.R. Campbell et al.
81
2. Formenti F, Ardigò LP, Minetti AE (2005) Human locomotion on snow: determinants of econ-omy and speed of skiing across the ages. Proc R Soc B Biol Sci 272(1572):1561–1569
3. Warme R, WJ F, King JA, Lambert P, Cunningham KL, Vredenburgh AG, Cohen HH (1993) Proceedings of the human factors and ergonomics society 39th annual meeting—1995, pp. 1015–1019. J Saf Res 27(4):272–273
4. ISO 9462:2006(E) Alpine ski-bindings—requirements and test methods 5. SO 5355:2006(E) Alpine ski-boots—requirements and test methods 6. Johnson RJ, Ettlinger CF, Shealy JE (2007) Update on injury trends in alpine skiing. Ski
Trauma Saf 5(10):11–22 7. ISO 9523:2008 Touring ski-boots for adults–interface with touring ski-bindings—require-
ments and test methods 8. ISO 13992:2006(E) Alpine touring ski-bindings—requirements and test methods 9. Finch CF, Kelsall HL (1998) The effectiveness of ski bindings and their professional adjust-
ment for preventing alpine skiing injuries. Efficacite des fixations de ski et leur reglage par des professionnels pour la prevention des blessures en ski alpin. Sports Med 25(6):407–416
10. Bouter A, Knipschild LM, Volovics PG (1989) Binding function in relation to injury risk in downhill skiing.pdf. Am J Sports Med 17(2):226–233
11. Ekeland H, Holtmoen A, Lystad A (1993) Lower extremity equipment-related injuries in rec-reational skiers. Am J Sports Med 21(2):201–205
12. Shealy JE, Ettlinger CF, Johnson RJ (2005) Using signal detection theory as a model to evalu-ate release/retention criteria in alpine skiing. J ASTM Int 2(7):1–12
13. T. Methods (2005) ASTM F504-05: Standard test method for measuring the quasi-static release moments of alpine ski. ASTM F504, 1–12
14. Tohm Olofsson P, Andersson M (2012) Probability statistics and stochastic processes, vol 33. Wiley, Hoboken, NJ
15. O’Brien RM (2007) A caution regarding rules of thumb for variance inflation factors. Qual Quant 41(5):673–690
16. Grömping U (2006) Relative importance for linear regression in R: the package relaimpo. J Stat Softw 17(1):1–27
Open Access This chapter is distributed under the terms of the Creative Commons Attribution-Noncommercial 2.5 License (http://creativecommons.org/licenses/by-nc/2.5/) which permits any noncommercial use, distribution, and reproduction in any medium, provided the original author(s) and source are credited.
The images or other third party material in this chapter are included in the work’s Creative Commons license, unless indicated otherwise in the credit line; if such material is not included in the work’s Creative Commons license and the respective action is not permitted by statutory regu-lation, users will need to obtain permission from the license holder to duplicate, adapt or reproduce the material.
Interactions of Tech Bindings with AT Boot Toe Inserts…
83© The Author(s) 2017 I.S. Scher et al. (eds.), Snow Sports Trauma and Safety, DOI 10.1007/978-3-319-52755-0_7
Interactions of Tech Bindings with AT Boot Toe Inserts: Part II Binding in Skiing Mode
Jeffrey R. Campbell, Irving S. Scher, David Carpenter, Bruce J. Jahnke, and Randal P. Ching
Abstract Alpine touring (AT) is a subdiscipline of alpine skiing where skiers ascend and descend snow slopes under their own power. Specialized equipment has been developed for AT skiing, including Tech/Pin bindings that rely on metal inserts molded into AT boots to rigidly couple the boot to the binding. The current lack of standardization has resulted in significant variation in tech insert geometry between boot manufacturers. A companion study examined the effects of inter-manufacturer variation of boots and bindings on the release characteristics of the toe piece of Tech/Pin bindings. This study continues this work and examines how inter- manufacturer variability affects the Tech/Pin boot-binding system as a whole, when both the toe and heelpiece are engaged.
The retention and release characteristics for an applied twisting torque were measured for the AT boots in the Tech/Pin binding toe pieces using an ASTM F504 test apparatus. Linear statistical models were developed to predict the measured retention-release behavior using the clamping force and tech insert geometry as predictor variables. The relative importance of each predictor variable from the lin-ear model was then calculated.
Tech/Pin boot-binding systems have variations in release torque that exceed the minimum-maximum allowable release envelope prescribed by international standards. These variations stem from using boots from different manufacturers in a given binding. The indicator settings in these bindings do not change the release torque at the same proportional rate as other AT and alpine ski equipment. Skiers
J.R. Campbell (*) • R.P. Ching Applied Biomechanics Laboratory, Department of Mechanical Engineering, University of Washington, 205 NE Northlake Way, Suite 100, Seattle, WA 98105, USAe-mail: [email protected]
I.S. Scher Applied Biomechanics Laboratory, Department of Mechanical Engineering, University of Washington, 205 NE Northlake Way, Suite 100, Seattle, WA 98105, USA
Guidance Engineering and Applied Research, 205 NE Northlake Way, Suite 100, Seattle, WA 98105, USA
D. Carpenter DRC Services LLC, 5327 SW Manning Street, Seattle, WA 98116, USA
B.J. Jahnke K2 Sports, 4201 6th Ave S, Seattle, WA 98108, USA
84
should not assume that Tech/Pin bindings will provide the same retention-release characteristics as alpine ski equipment, nor that the numerical indicator settings on Tech/Pin bindings are equivalent to alpine bindings. Homogenizing boot geometry would reduce the amount of variation in release torque from these boot-binding systems, but would not eliminate the problem completely, and could exacerbate the problems for users on one far end of the binding setting scale or the other.
Keywords Skiing • Alpine touring • Ski bindings • Tech inserts • Skiing mode
1 Introduction
Alpine touring (AT) is a subdiscipline of skiing in which the skier uses skis to ascend, traverse, and descend snow-covered terrain in the backcountry on unmaintained trails for which ski boot and binding manufacturers have developed specialized alpine touring equipment. For ascending uphill, skiers’ boots are attached to the ski by two pins on the binding toe piece that apply a compressive force to metal conical inserts in the boot toe. The toe piece can be locked during the ascent to eliminate the binding toe piece releasing from the boot. The binding heelpiece is engaged to secure the boot heel for descending slopes while performing alpine turns. In most Tech binding models, the retention-release performance for twisting and forward lean falls is controlled on the heelpiece. A spring-loaded cam mechanisms control the release torque. The preload on the spring is adjusted to indicator values (IV) that correspond to release torque values specified by international standards and are determined based on a skiers height, weight, boot size, and skier classification [1].
Anecdotal evidences suggests that many skiers leave the toe piece locked during the descent, against manufacturers recommendations, to eliminate the risk of an inadvertent release of the binding when a fall could result in injury or death. International standards have not yet been developed for the interface geometry of a subset of AT equipment, called Tech/Pin boot-binding systems. It is hypothesized that variations in boot-binding interface geometry diminishes their compatibility causing their release characteristics to be unpredictable. In turn skiers react to this unpredictability by locking the toe piece out, essentially blocking the release mech-anism of the binding, and increasing the risk of injury in the event of a fall.
In a companion study, the relationship between variations in the interface geom-etry between the boot and binding toe piece, the resulting variations in release torque by quantifying the amount of variation in interface geometry, and constraint forces of the binding were explored. A twisting release torque was applied to the ski-boot-binding system with only the toe piece of the binding engaged with the boot. The amount of variation in boot geometry and binding constraint forces between manufacturers significantly affected the release torque of these systems. The geometry of these inserts are not defined in international equipment standards [2]. This study found that ~85% of the variation in release torque between AT boots
J.R. Campbell et al.
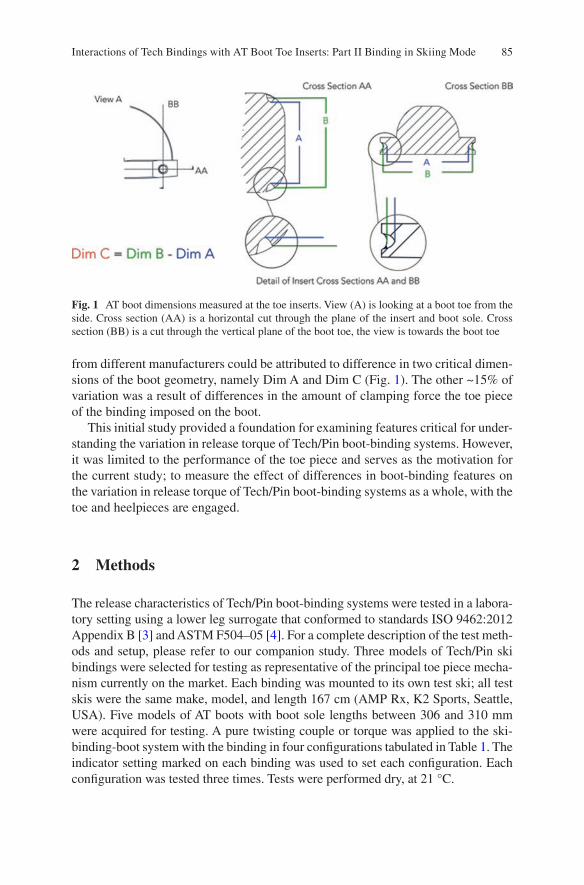
85
from different manufacturers could be attributed to difference in two critical dimen-sions of the boot geometry, namely Dim A and Dim C (Fig. 1). The other ~15% of variation was a result of differences in the amount of clamping force the toe piece of the binding imposed on the boot.
This initial study provided a foundation for examining features critical for under-standing the variation in release torque of Tech/Pin boot-binding systems. However, it was limited to the performance of the toe piece and serves as the motivation for the current study; to measure the effect of differences in boot-binding features on the variation in release torque of Tech/Pin boot-binding systems as a whole, with the toe and heelpieces are engaged.
2 Methods
The release characteristics of Tech/Pin boot-binding systems were tested in a labora-tory setting using a lower leg surrogate that conformed to standards ISO 9462:2012 Appendix B [3] and ASTM F504–05 [4]. For a complete description of the test meth-ods and setup, please refer to our companion study. Three models of Tech/Pin ski bindings were selected for testing as representative of the principal toe piece mecha-nism currently on the market. Each binding was mounted to its own test ski; all test skis were the same make, model, and length 167 cm (AMP Rx, K2 Sports, Seattle, USA). Five models of AT boots with boot sole lengths between 306 and 310 mm were acquired for testing. A pure twisting couple or torque was applied to the ski-binding-boot system with the binding in four configurations tabulated in Table 1. The indicator setting marked on each binding was used to set each configuration. Each configuration was tested three times. Tests were performed dry, at 21 °C.
Fig. 1 AT boot dimensions measured at the toe inserts. View (A) is looking at a boot toe from the side. Cross section (AA) is a horizontal cut through the plane of the insert and boot sole. Cross section (BB) is a cut through the vertical plane of the boot toe, the view is towards the boot toe
Interactions of Tech Bindings with AT Boot Toe Inserts: Part II Binding in Skiing Mode
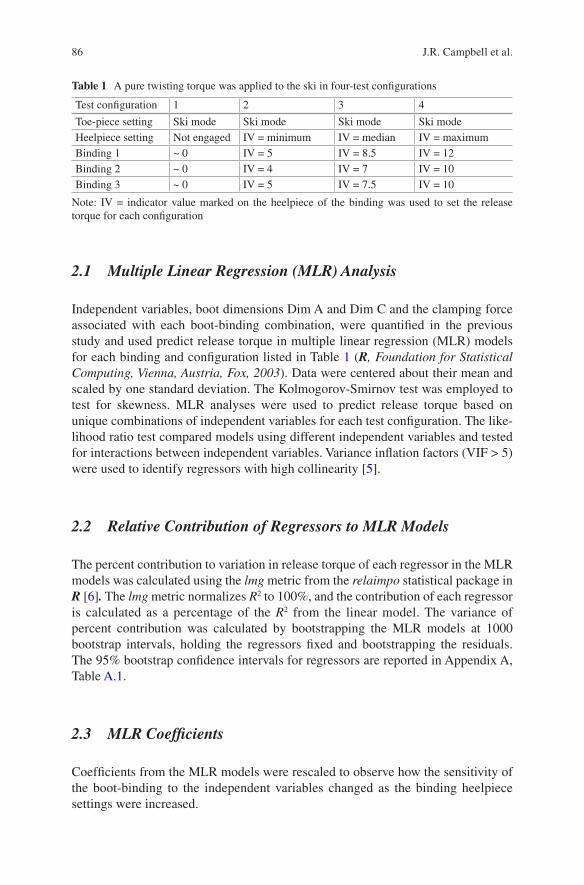
86
2.1 Multiple Linear Regression (MLR) Analysis
Independent variables, boot dimensions Dim A and Dim C and the clamping force associated with each boot-binding combination, were quantified in the previous study and used predict release torque in multiple linear regression (MLR) models for each binding and configuration listed in Table 1 (R, Foundation for Statistical Computing, Vienna, Austria, Fox, 2003). Data were centered about their mean and scaled by one standard deviation. The Kolmogorov-Smirnov test was employed to test for skewness. MLR analyses were used to predict release torque based on unique combinations of independent variables for each test configuration. The like-lihood ratio test compared models using different independent variables and tested for interactions between independent variables. Variance inflation factors (VIF > 5) were used to identify regressors with high collinearity [5].
2.2 Relative Contribution of Regressors to MLR Models
The percent contribution to variation in release torque of each regressor in the MLR models was calculated using the lmg metric from the relaimpo statistical package in R [6]. The lmg metric normalizes R2 to 100%, and the contribution of each regressor is calculated as a percentage of the R2 from the linear model. The variance of percent contribution was calculated by bootstrapping the MLR models at 1000 bootstrap intervals, holding the regressors fixed and bootstrapping the residuals. The 95% bootstrap confidence intervals for regressors are reported in Appendix A, Table A.1.
2.3 MLR Coefficients
Coefficients from the MLR models were rescaled to observe how the sensitivity of the boot-binding to the independent variables changed as the binding heelpiece settings were increased.
Table 1 A pure twisting torque was applied to the ski in four-test configurations
Test configuration 1 2 3 4
Toe-piece setting Ski mode Ski mode Ski mode Ski modeHeelpiece setting Not engaged IV = minimum IV = median IV = maximumBinding 1 ~ 0 IV = 5 IV = 8.5 IV = 12Binding 2 ~ 0 IV = 4 IV = 7 IV = 10Binding 3 ~ 0 IV = 5 IV = 7.5 IV = 10
Note: IV = indicator value marked on the heelpiece of the binding was used to set the release torque for each configuration
J.R. Campbell et al.
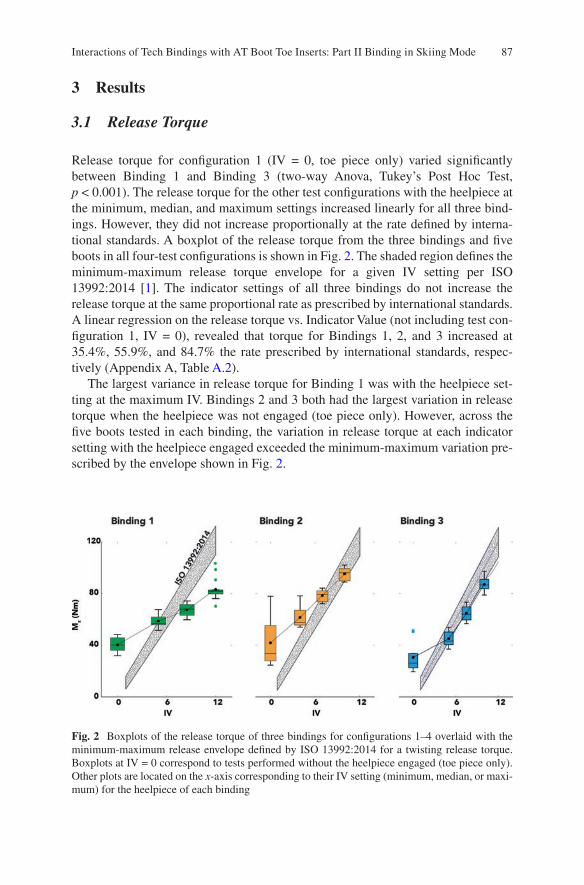
87
3 Results
3.1 Release Torque
Release torque for configuration 1 (IV = 0, toe piece only) varied significantly between Binding 1 and Binding 3 (two-way Anova, Tukey’s Post Hoc Test, p < 0.001). The release torque for the other test configurations with the heelpiece at the minimum, median, and maximum settings increased linearly for all three bind-ings. However, they did not increase proportionally at the rate defined by interna-tional standards. A boxplot of the release torque from the three bindings and five boots in all four-test configurations is shown in Fig. 2. The shaded region defines the minimum-maximum release torque envelope for a given IV setting per ISO 13992:2014 [1]. The indicator settings of all three bindings do not increase the release torque at the same proportional rate as prescribed by international standards. A linear regression on the release torque vs. Indicator Value (not including test con-figuration 1, IV = 0), revealed that torque for Bindings 1, 2, and 3 increased at 35.4%, 55.9%, and 84.7% the rate prescribed by international standards, respec-tively (Appendix A, Table A.2).
The largest variance in release torque for Binding 1 was with the heelpiece set-ting at the maximum IV. Bindings 2 and 3 both had the largest variation in release torque when the heelpiece was not engaged (toe piece only). However, across the five boots tested in each binding, the variation in release torque at each indicator setting with the heelpiece engaged exceeded the minimum-maximum variation pre-scribed by the envelope shown in Fig. 2.
Fig. 2 Boxplots of the release torque of three bindings for configurations 1–4 overlaid with the minimum-maximum release envelope defined by ISO 13992:2014 for a twisting release torque. Boxplots at IV = 0 correspond to tests performed without the heelpiece engaged (toe piece only). Other plots are located on the x-axis corresponding to their IV setting (minimum, median, or maxi-mum) for the heelpiece of each binding
Interactions of Tech Bindings with AT Boot Toe Inserts: Part II Binding in Skiing Mode
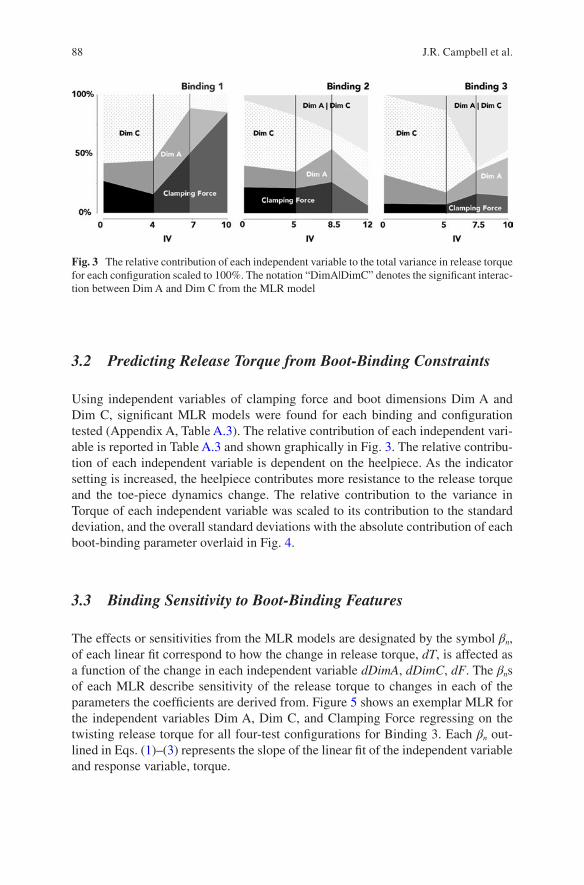
88
3.2 Predicting Release Torque from Boot-Binding Constraints
Using independent variables of clamping force and boot dimensions Dim A and Dim C, significant MLR models were found for each binding and configuration tested (Appendix A, Table A.3). The relative contribution of each independent vari-able is reported in Table A.3 and shown graphically in Fig. 3. The relative contribu-tion of each independent variable is dependent on the heelpiece. As the indicator setting is increased, the heelpiece contributes more resistance to the release torque and the toe-piece dynamics change. The relative contribution to the variance in Torque of each independent variable was scaled to its contribution to the standard deviation, and the overall standard deviations with the absolute contribution of each boot-binding parameter overlaid in Fig. 4.
3.3 Binding Sensitivity to Boot-Binding Features
The effects or sensitivities from the MLR models are designated by the symbol βn, of each linear fit correspond to how the change in release torque, dT, is affected as a function of the change in each independent variable dDimA, dDimC, dF. The βns of each MLR describe sensitivity of the release torque to changes in each of the parameters the coefficients are derived from. Figure 5 shows an exemplar MLR for the independent variables Dim A, Dim C, and Clamping Force regressing on the twisting release torque for all four-test configurations for Binding 3. Each βn out-lined in Eqs. (1)–(3) represents the slope of the linear fit of the independent variable and response variable, torque.
Fig. 3 The relative contribution of each independent variable to the total variance in release torque for each configuration scaled to 100%. The notation “DimA|DimC” denotes the significant interac-tion between Dim A and Dim C from the MLR model
J.R. Campbell et al.
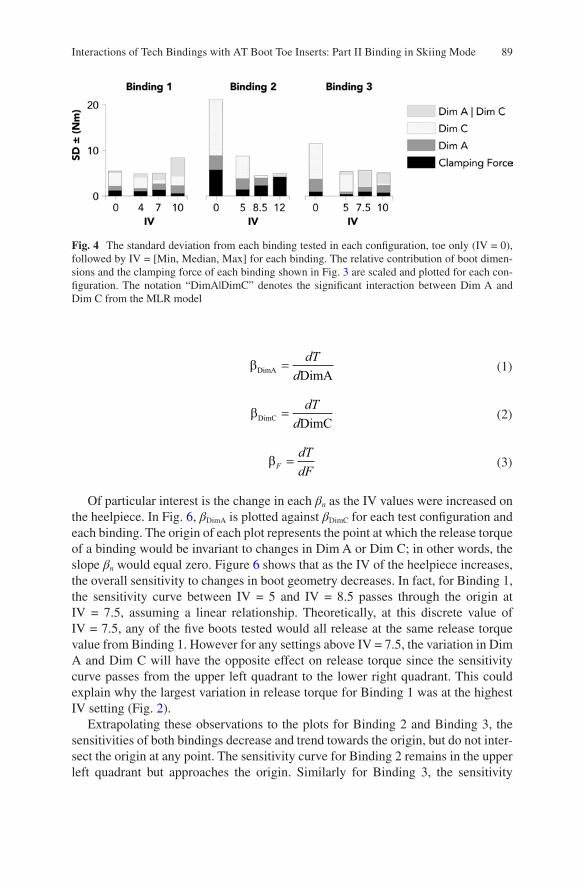
89
bDimA DimA
=dT
d (1)
bDimC DimC
=dT
d (2)
bF
dTdF
=
(3)
Of particular interest is the change in each βn as the IV values were increased on the heelpiece. In Fig. 6, βDimA is plotted against βDimC for each test configuration and each binding. The origin of each plot represents the point at which the release torque of a binding would be invariant to changes in Dim A or Dim C; in other words, the slope βn would equal zero. Figure 6 shows that as the IV of the heelpiece increases, the overall sensitivity to changes in boot geometry decreases. In fact, for Binding 1, the sensitivity curve between IV = 5 and IV = 8.5 passes through the origin at IV = 7.5, assuming a linear relationship. Theoretically, at this discrete value of IV = 7.5, any of the five boots tested would all release at the same release torque value from Binding 1. However for any settings above IV = 7.5, the variation in Dim A and Dim C will have the opposite effect on release torque since the sensitivity curve passes from the upper left quadrant to the lower right quadrant. This could explain why the largest variation in release torque for Binding 1 was at the highest IV setting (Fig. 2).
Extrapolating these observations to the plots for Binding 2 and Binding 3, the sensitivities of both bindings decrease and trend towards the origin, but do not inter-sect the origin at any point. The sensitivity curve for Binding 2 remains in the upper left quadrant but approaches the origin. Similarly for Binding 3, the sensitivity
Fig. 4 The standard deviation from each binding tested in each configuration, toe only (IV = 0), followed by IV = [Min, Median, Max] for each binding. The relative contribution of boot dimen-sions and the clamping force of each binding shown in Fig. 3 are scaled and plotted for each con-figuration. The notation “DimA|DimC” denotes the significant interaction between Dim A and Dim C from the MLR model
Interactions of Tech Bindings with AT Boot Toe Inserts: Part II Binding in Skiing Mode
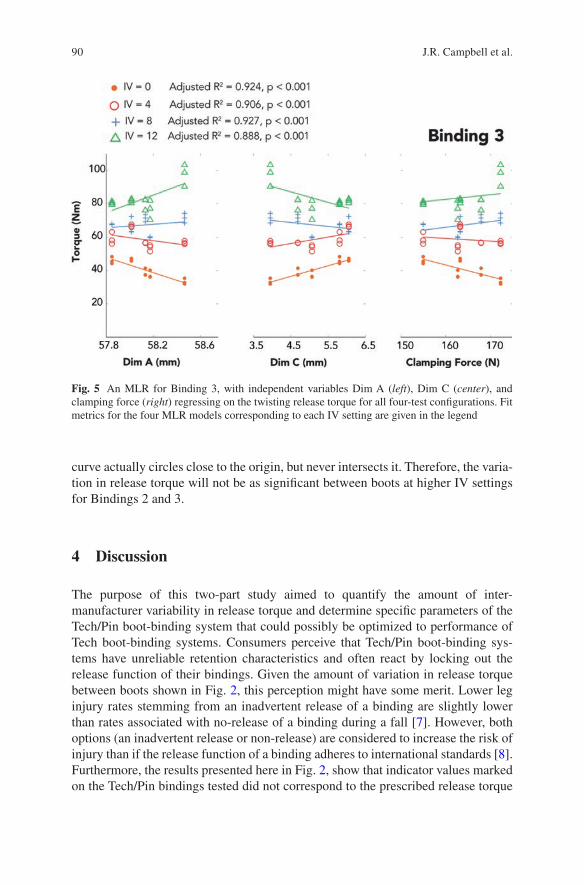
90
curve actually circles close to the origin, but never intersects it. Therefore, the varia-tion in release torque will not be as significant between boots at higher IV settings for Bindings 2 and 3.
4 Discussion
The purpose of this two-part study aimed to quantify the amount of inter- manufacturer variability in release torque and determine specific parameters of the Tech/Pin boot-binding system that could possibly be optimized to performance of Tech boot-binding systems. Consumers perceive that Tech/Pin boot-binding sys-tems have unreliable retention characteristics and often react by locking out the release function of their bindings. Given the amount of variation in release torque between boots shown in Fig. 2, this perception might have some merit. Lower leg injury rates stemming from an inadvertent release of a binding are slightly lower than rates associated with no-release of a binding during a fall [7]. However, both options (an inadvertent release or non-release) are considered to increase the risk of injury than if the release function of a binding adheres to international standards [8]. Furthermore, the results presented here in Fig. 2, show that indicator values marked on the Tech/Pin bindings tested did not correspond to the prescribed release torque
Fig. 5 An MLR for Binding 3, with independent variables Dim A (left), Dim C (center), and clamping force (right) regressing on the twisting release torque for all four-test configurations. Fit metrics for the four MLR models corresponding to each IV setting are given in the legend
J.R. Campbell et al.
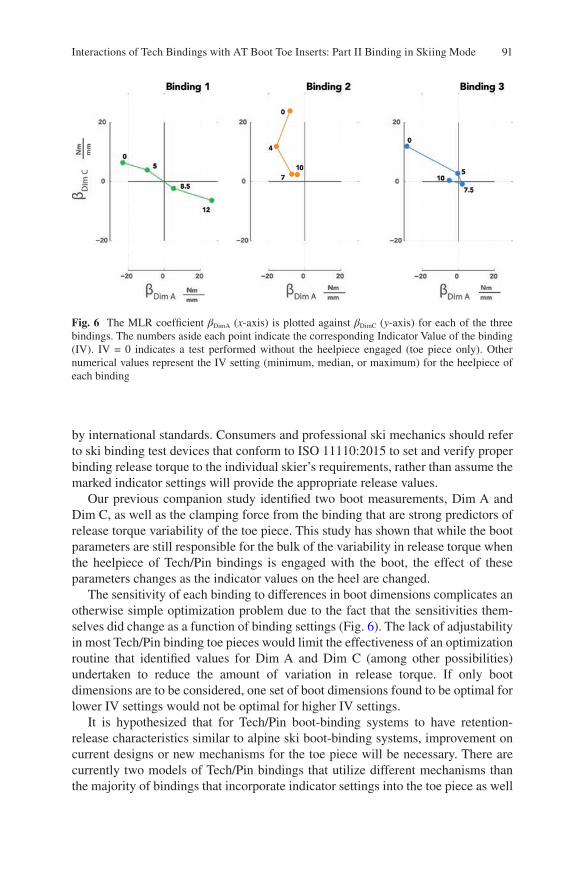
91
by international standards. Consumers and professional ski mechanics should refer to ski binding test devices that conform to ISO 11110:2015 to set and verify proper binding release torque to the individual skier’s requirements, rather than assume the marked indicator settings will provide the appropriate release values.
Our previous companion study identified two boot measurements, Dim A and Dim C, as well as the clamping force from the binding that are strong predictors of release torque variability of the toe piece. This study has shown that while the boot parameters are still responsible for the bulk of the variability in release torque when the heelpiece of Tech/Pin bindings is engaged with the boot, the effect of these parameters changes as the indicator values on the heel are changed.
The sensitivity of each binding to differences in boot dimensions complicates an otherwise simple optimization problem due to the fact that the sensitivities them-selves did change as a function of binding settings (Fig. 6). The lack of adjustability in most Tech/Pin binding toe pieces would limit the effectiveness of an optimization routine that identified values for Dim A and Dim C (among other possibilities) undertaken to reduce the amount of variation in release torque. If only boot dimensions are to be considered, one set of boot dimensions found to be optimal for lower IV settings would not be optimal for higher IV settings.
It is hypothesized that for Tech/Pin boot-binding systems to have retention- release characteristics similar to alpine ski boot-binding systems, improvement on current designs or new mechanisms for the toe piece will be necessary. There are currently two models of Tech/Pin bindings that utilize different mechanisms than the majority of bindings that incorporate indicator settings into the toe piece as well
Fig. 6 The MLR coefficient βDimA (x-axis) is plotted against βDimC (y-axis) for each of the three bindings. The numbers aside each point indicate the corresponding Indicator Value of the binding (IV). IV = 0 indicates a test performed without the heelpiece engaged (toe piece only). Other numerical values represent the IV setting (minimum, median, or maximum) for the heelpiece of each binding
Interactions of Tech Bindings with AT Boot Toe Inserts: Part II Binding in Skiing Mode
92
as the heelpiece. These designs are new do not have significant market share, and one of them utilizes different heel inserts than other bindings. Therefore, they were not considered by the authors to be representative of a sample of bindings on the market, and the authors do not speculate on their performance. However, it is likely that some ability to adjust the clamping force preload of the toe piece, the release load of the toe piece, and the dynamics of the toe piece based on the corresponding heelpiece dynamics will be necessary to reduce the variation in release torque in Tech/Pin boot-binding systems.
This study has not examined the effect of material hardness or loading conditions other than a pure twisting release. It is possible that other boot dimensions and bind-ing features studied here are critical in other release modes or loading conditions. Furthermore, it will likely be impossible to optimize these systems until reaction forces transmitted from the ski to the boot through Tech/Pin bindings is directly measured such that the functional retention-release requirements of Tech/Pin boot- binding systems is clearly defined. Future laboratory testing on this subject could include dynamic impact tests to elucidate how the variables explored in our current study behave under dynamic loads of varying frequency and magnitude.
The mating interface geometry between alpine boots and bindings were homog-enized by international standards in the 1980s; in turn, this normalized the reten-tion/release characteristics. As a result, any alpine ski boot conforming to ISO 5355:2006 [9] from any manufacturer can be used with any alpine binding con-forming to ISO 9462:2006 [3] from any manufacturer, without sacrificing retention/release performance. The results presented here show that retention/release charac-teristics of the Tech/Pin bindings tested, one of which was certified to ISO 13992:2014 by the Technischer Überwachungsverein, or TÜV, vary widely depend-ing on which specific boot is being used and that Tech/Pin boot-binding systems do not provide the same retention/release characteristics as their Alpine boot-binding counterparts.
5 Conclusion
In summary, Tech/Pin boot-binding systems have variations in release torque that exceed the minimum-maximum allowable release envelope prescribed by interna-tional standards. These variations stem from using boots from different manufac-turers in a given binding. The indicator settings in these bindings do not change the release torque at the same proportional rate as other AT and alpine ski equipment. Skiers should not assume that Tech/Pin bindings will provide the same retention-release characteristics as alpine ski equipment, nor that the numerical indicator settings on alpine bindings are equivalent to Tech/Pin bindings. Homogenizing boot geometry would reduce the amount of variation in release torque from these boot-binding systems, but would not eliminate the problem completely, and could exacerbate the problems for users on one far end of the binding setting scale or the other.
J.R. Campbell et al.
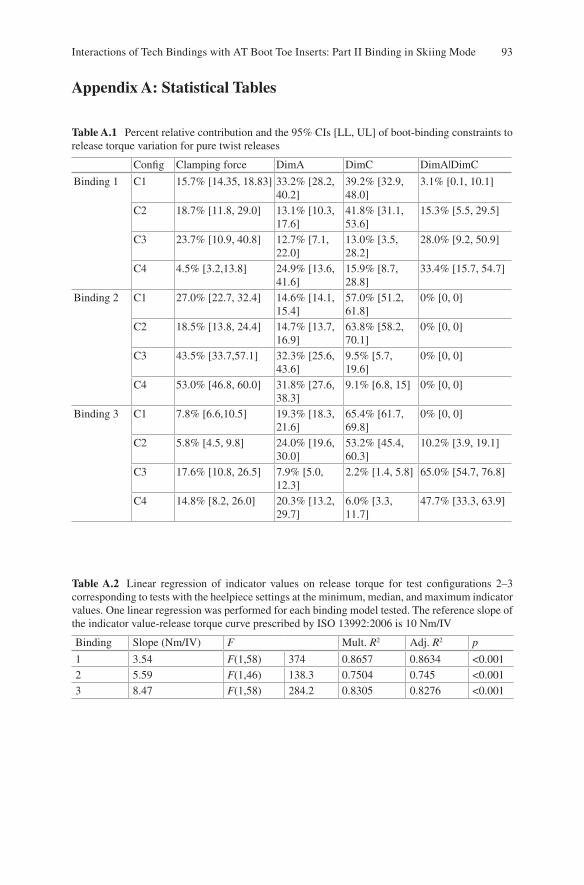
93
Table A.1 Percent relative contribution and the 95% CIs [LL, UL] of boot-binding constraints to release torque variation for pure twist releases
Config Clamping force DimA DimC DimA|DimC
Binding 1 C1 15.7% [14.35, 18.83] 33.2% [28.2, 40.2]
39.2% [32.9, 48.0]
3.1% [0.1, 10.1]
C2 18.7% [11.8, 29.0] 13.1% [10.3, 17.6]
41.8% [31.1, 53.6]
15.3% [5.5, 29.5]
C3 23.7% [10.9, 40.8] 12.7% [7.1, 22.0]
13.0% [3.5, 28.2]
28.0% [9.2, 50.9]
C4 4.5% [3.2,13.8] 24.9% [13.6, 41.6]
15.9% [8.7, 28.8]
33.4% [15.7, 54.7]
Binding 2 C1 27.0% [22.7, 32.4] 14.6% [14.1, 15.4]
57.0% [51.2, 61.8]
0% [0, 0]
C2 18.5% [13.8, 24.4] 14.7% [13.7, 16.9]
63.8% [58.2, 70.1]
0% [0, 0]
C3 43.5% [33.7,57.1] 32.3% [25.6, 43.6]
9.5% [5.7, 19.6]
0% [0, 0]
C4 53.0% [46.8, 60.0] 31.8% [27.6, 38.3]
9.1% [6.8, 15] 0% [0, 0]
Binding 3 C1 7.8% [6.6,10.5] 19.3% [18.3, 21.6]
65.4% [61.7, 69.8]
0% [0, 0]
C2 5.8% [4.5, 9.8] 24.0% [19.6, 30.0]
53.2% [45.4, 60.3]
10.2% [3.9, 19.1]
C3 17.6% [10.8, 26.5] 7.9% [5.0, 12.3]
2.2% [1.4, 5.8] 65.0% [54.7, 76.8]
C4 14.8% [8.2, 26.0] 20.3% [13.2, 29.7]
6.0% [3.3, 11.7]
47.7% [33.3, 63.9]
Table A.2 Linear regression of indicator values on release torque for test configurations 2–3 corresponding to tests with the heelpiece settings at the minimum, median, and maximum indicator values. One linear regression was performed for each binding model tested. The reference slope of the indicator value-release torque curve prescribed by ISO 13992:2006 is 10 Nm/IV
Binding Slope (Nm/IV) F Mult. R2 Adj. R2 p
1 3.54 F(1,58) 374 0.8657 0.8634 <0.0012 5.59 F(1,46) 138.3 0.7504 0.745 <0.0013 8.47 F(1,58) 284.2 0.8305 0.8276 <0.001
Appendix A: Statistical Tables
Interactions of Tech Bindings with AT Boot Toe Inserts: Part II Binding in Skiing Mode
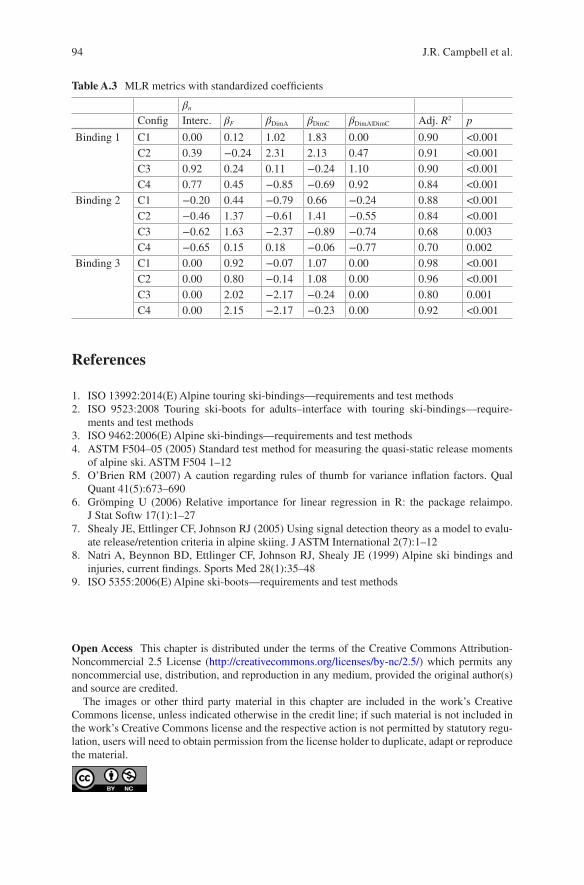
94
References
1. ISO 13992:2014(E) Alpine touring ski-bindings—requirements and test methods 2. ISO 9523:2008 Touring ski-boots for adults–interface with touring ski-bindings—require-
ments and test methods 3. ISO 9462:2006(E) Alpine ski-bindings—requirements and test methods 4. ASTM F504–05 (2005) Standard test method for measuring the quasi-static release moments
of alpine ski. ASTM F504 1–12 5. O’Brien RM (2007) A caution regarding rules of thumb for variance inflation factors. Qual
Quant 41(5):673–690 6. Grömping U (2006) Relative importance for linear regression in R: the package relaimpo.
J Stat Softw 17(1):1–27 7. Shealy JE, Ettlinger CF, Johnson RJ (2005) Using signal detection theory as a model to evalu-
ate release/retention criteria in alpine skiing. J ASTM International 2(7):1–12 8. Natri A, Beynnon BD, Ettlinger CF, Johnson RJ, Shealy JE (1999) Alpine ski bindings and
injuries, current findings. Sports Med 28(1):35–48 9. ISO 5355:2006(E) Alpine ski-boots—requirements and test methods
Open Access This chapter is distributed under the terms of the Creative Commons Attribution-Noncommercial 2.5 License (http://creativecommons.org/licenses/by-nc/2.5/) which permits any noncommercial use, distribution, and reproduction in any medium, provided the original author(s) and source are credited.
The images or other third party material in this chapter are included in the work’s Creative Commons license, unless indicated otherwise in the credit line; if such material is not included in the work’s Creative Commons license and the respective action is not permitted by statutory regu-lation, users will need to obtain permission from the license holder to duplicate, adapt or reproduce the material.
Table A.3 MLR metrics with standardized coefficients
βn
Config Interc. βF βDimA βDimC βDimA|DimC Adj. R2 p
Binding 1 C1 0.00 0.12 1.02 1.83 0.00 0.90 <0.001C2 0.39 −0.24 2.31 2.13 0.47 0.91 <0.001C3 0.92 0.24 0.11 −0.24 1.10 0.90 <0.001C4 0.77 0.45 −0.85 −0.69 0.92 0.84 <0.001
Binding 2 C1 −0.20 0.44 −0.79 0.66 −0.24 0.88 <0.001C2 −0.46 1.37 −0.61 1.41 −0.55 0.84 <0.001C3 −0.62 1.63 −2.37 −0.89 −0.74 0.68 0.003C4 −0.65 0.15 0.18 −0.06 −0.77 0.70 0.002
Binding 3 C1 0.00 0.92 −0.07 1.07 0.00 0.98 <0.001C2 0.00 0.80 −0.14 1.08 0.00 0.96 <0.001C3 0.00 2.02 −2.17 −0.24 0.00 0.80 0.001C4 0.00 2.15 −2.17 −0.23 0.00 0.92 <0.001
J.R. Campbell et al.
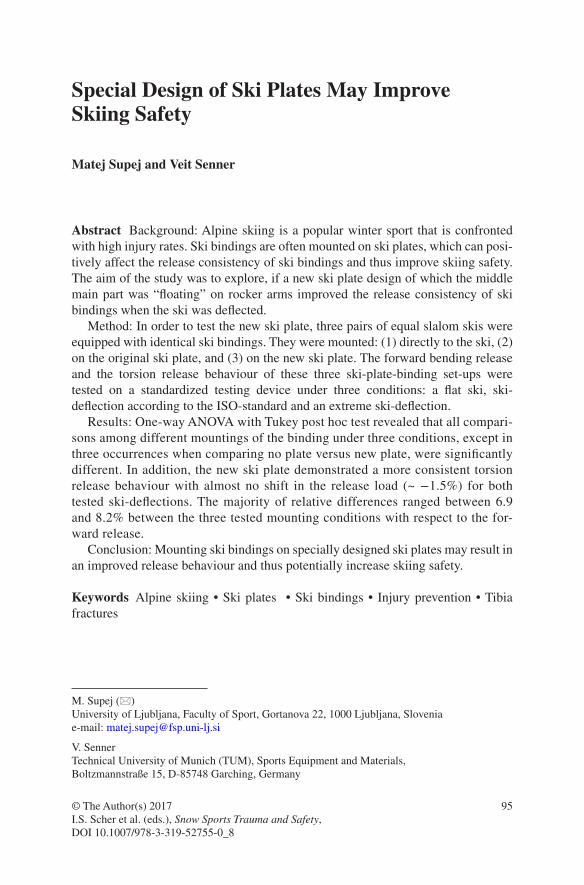
95© The Author(s) 2017 I.S. Scher et al. (eds.), Snow Sports Trauma and Safety, DOI 10.1007/978-3-319-52755-0_8
Special Design of Ski Plates May Improve Skiing Safety
Matej Supej and Veit Senner
Abstract Background: Alpine skiing is a popular winter sport that is confronted with high injury rates. Ski bindings are often mounted on ski plates, which can posi-tively affect the release consistency of ski bindings and thus improve skiing safety. The aim of the study was to explore, if a new ski plate design of which the middle main part was “floating” on rocker arms improved the release consistency of ski bindings when the ski was deflected.
Method: In order to test the new ski plate, three pairs of equal slalom skis were equipped with identical ski bindings. They were mounted: (1) directly to the ski, (2) on the original ski plate, and (3) on the new ski plate. The forward bending release and the torsion release behaviour of these three ski-plate-binding set-ups were tested on a standardized testing device under three conditions: a flat ski, ski- deflection according to the ISO-standard and an extreme ski-deflection.
Results: One-way ANOVA with Tukey post hoc test revealed that all compari-sons among different mountings of the binding under three conditions, except in three occurrences when comparing no plate versus new plate, were significantly different. In addition, the new ski plate demonstrated a more consistent torsion release behaviour with almost no shift in the release load (~ −1.5%) for both tested ski-deflections. The majority of relative differences ranged between 6.9 and 8.2% between the three tested mounting conditions with respect to the for-ward release.
Conclusion: Mounting ski bindings on specially designed ski plates may result in an improved release behaviour and thus potentially increase skiing safety.
Keywords Alpine skiing • Ski plates • Ski bindings • Injury prevention • Tibia fractures
M. Supej (*) University of Ljubljana, Faculty of Sport, Gortanova 22, 1000 Ljubljana, Sloveniae-mail: [email protected]
V. Senner Technical University of Munich (TUM), Sports Equipment and Materials, Boltzmannstraße 15, D-85748 Garching, Germany
96
1 Introduction
Alpine skiing is a popular outdoor winter sport in many countries with approxi-mately 400 million skier visits worldwide [1]. In competitive alpine skiing, skiers, on the one hand, strive to optimize their skiing by optimizing several different mechanical predictors such as time, speed, turn radius and energy dissipation [2–4]. Several of these parameters are, on the other hand, recognized as major risk factors for injuries in competitive skiing [5–8]. It is therefore no surprise that injury rates for competitors are very high [9].
The injury rates are very high also in recreational alpine skiing with a range from 2.4 to 7.0 injuries per 1000 activity days [10]. Alpine skiing was stated to be “the riskiest sport undertaken by adults on a routine basis” [11]. Both, in competitive as well as in recreational skiing the highest rate of injuries is connected to the knee joint [12–14]. The injury rate in the knee joint remains at a high level since the mid- nineties [15], only the MCL (medial collateral ligament)-knee injuries seem to have slightly decreased over the 18 investigated seasons [16]. The reduced ski length generally explains this levelling-off since the introduction of carving skis [15, 17].
With the background of this unchanged high knee injury rate a recent study investigated the potential role of the ski-binding-boot functional unit to decrease the injury risk of lower extremities [18]. It concluded that the biggest potential to decrease the injury rate was to develop more sophisticated safety release bindings, i.e. introducing a mechatronic design. Among others, it was pointed out that the reduction in the influence of constraining forces on the release behaviour of the bindings could be achieved by the intervention in the appropriate design of sliding elements and bearings.
In order to explain the relationship between the inadvertent release and no release when necessary, a Signal Detection Theory (SDT) has been introduced [19]. SDT describes normal load (NL) and injury load (IL). The NL represents the area when no release is needed and the IL when the release is needed. In addition, there is also a probability when (1) a failure to release and (2) the inadvertent release appears. In general, these two probabilities are desired to be as small as possible in order to yield safer bindings for a target population group. Therefore, any attempt that can help providing a decrease in the inadvertent release without affecting the appropri-ate release is considered beneficial for skiing safety.
Ski plates have been primarily propagated to influence a bending line and the damping behaviour of the ski as well as the boot-out at large ski inclinations [18]. Recently, a platform for mounting the binding on a ski (Allflex plate, Allflex ski and snowboard plates, Slovenia) with a unique patented construction [20] has been introduced to the market. It has been designed in such a way that the middle rigid part holding the ski bindings is connected to the ski with two rigidly anchored verti-cal rocker arms at the front and at the back as well as two horizontal rocker arms in the middle of the plate (Fig. 1). Vertical rocker arms at the front and at the back function as compensatory parts, cancelling the shortening of the ski’s upper surface when the ski is deflected. The two double horizontal rocker arms in the middle part
M. Supej and V. Senner
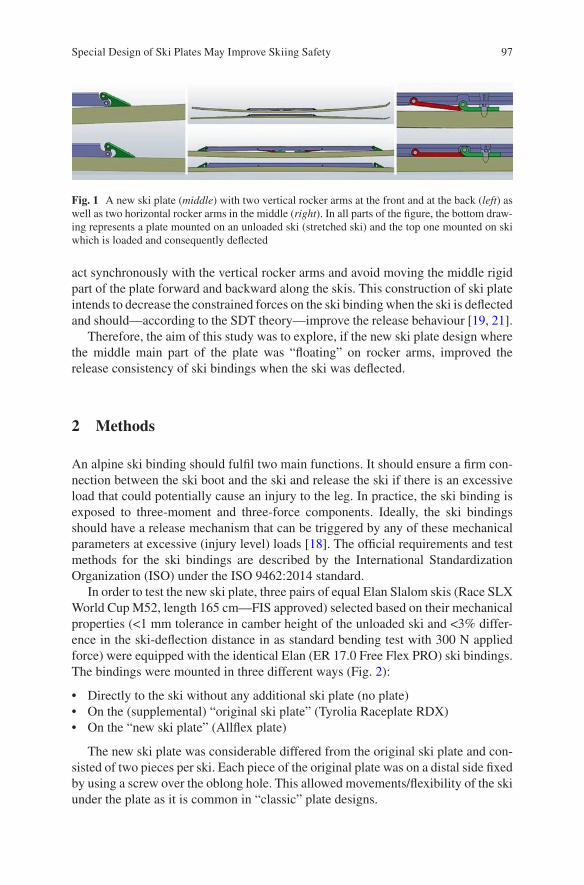
97
act synchronously with the vertical rocker arms and avoid moving the middle rigid part of the plate forward and backward along the skis. This construction of ski plate intends to decrease the constrained forces on the ski binding when the ski is deflected and should—according to the SDT theory—improve the release behaviour [19, 21].
Therefore, the aim of this study was to explore, if the new ski plate design where the middle main part of the plate was “floating” on rocker arms, improved the release consistency of ski bindings when the ski was deflected.
2 Methods
An alpine ski binding should fulfil two main functions. It should ensure a firm con-nection between the ski boot and the ski and release the ski if there is an excessive load that could potentially cause an injury to the leg. In practice, the ski binding is exposed to three-moment and three-force components. Ideally, the ski bindings should have a release mechanism that can be triggered by any of these mechanical parameters at excessive (injury level) loads [18]. The official requirements and test methods for the ski bindings are described by the International Standardization Organization (ISO) under the ISO 9462:2014 standard.
In order to test the new ski plate, three pairs of equal Elan Slalom skis (Race SLX World Cup M52, length 165 cm—FIS approved) selected based on their mechanical properties (<1 mm tolerance in camber height of the unloaded ski and <3% differ-ence in the ski-deflection distance in as standard bending test with 300 N applied force) were equipped with the identical Elan (ER 17.0 Free Flex PRO) ski bindings. The bindings were mounted in three different ways (Fig. 2):
• Directly to the ski without any additional ski plate (no plate)• On the (supplemental) “original ski plate” (Tyrolia Raceplate RDX)• On the “new ski plate” (Allflex plate)
The new ski plate was considerable differed from the original ski plate and con-sisted of two pieces per ski. Each piece of the original plate was on a distal side fixed by using a screw over the oblong hole. This allowed movements/flexibility of the ski under the plate as it is common in “classic” plate designs.
Fig. 1 A new ski plate (middle) with two vertical rocker arms at the front and at the back (left) as well as two horizontal rocker arms in the middle (right). In all parts of the figure, the bottom draw-ing represents a plate mounted on an unloaded ski (stretched ski) and the top one mounted on ski which is loaded and consequently deflected
Special Design of Ski Plates May Improve Skiing Safety
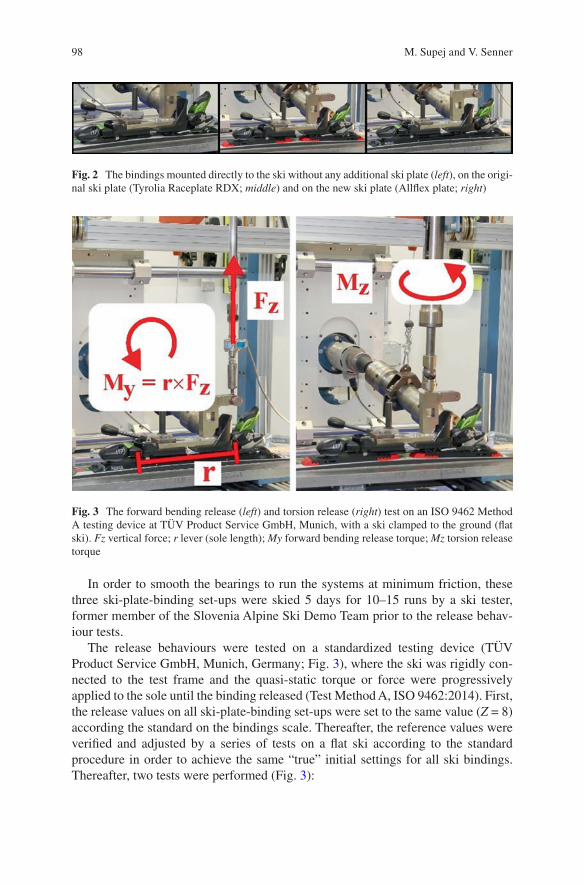
98
In order to smooth the bearings to run the systems at minimum friction, these three ski-plate-binding set-ups were skied 5 days for 10–15 runs by a ski tester, former member of the Slovenia Alpine Ski Demo Team prior to the release behav-iour tests.
The release behaviours were tested on a standardized testing device (TÜV Product Service GmbH, Munich, Germany; Fig. 3), where the ski was rigidly con-nected to the test frame and the quasi-static torque or force were progressively applied to the sole until the binding released (Test Method A, ISO 9462:2014). First, the release values on all ski-plate-binding set-ups were set to the same value (Z = 8) according the standard on the bindings scale. Thereafter, the reference values were verified and adjusted by a series of tests on a flat ski according to the standard procedure in order to achieve the same “true” initial settings for all ski bindings. Thereafter, two tests were performed (Fig. 3):
Fig. 2 The bindings mounted directly to the ski without any additional ski plate (left), on the origi-nal ski plate (Tyrolia Raceplate RDX; middle) and on the new ski plate (Allflex plate; right)
Fig. 3 The forward bending release (left) and torsion release (right) test on an ISO 9462 Method A testing device at TÜV Product Service GmbH, Munich, with a ski clamped to the ground (flat ski). Fz vertical force; r lever (sole length); My forward bending release torque; Mz torsion release torque
M. Supej and V. Senner
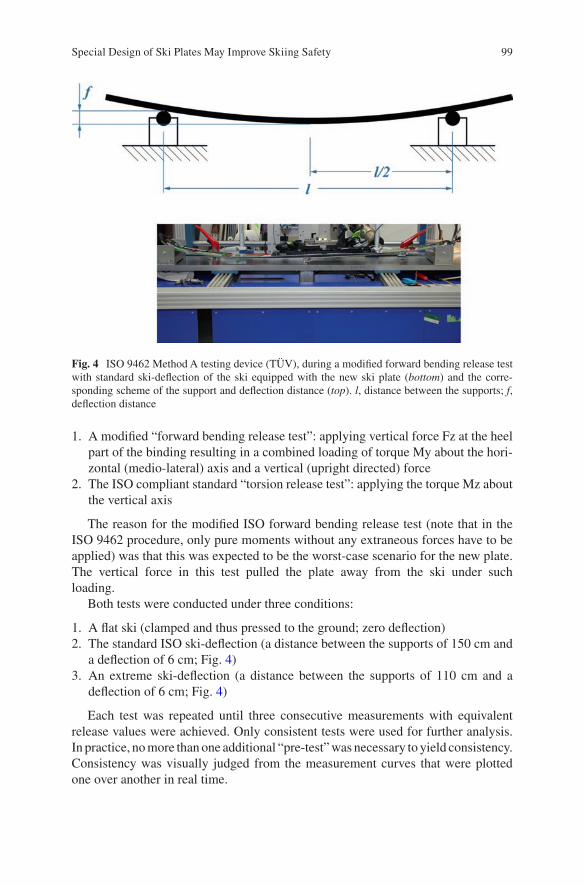
99
1. A modified “forward bending release test”: applying vertical force Fz at the heel part of the binding resulting in a combined loading of torque My about the hori-zontal (medio-lateral) axis and a vertical (upright directed) force
2. The ISO compliant standard “torsion release test”: applying the torque Mz about the vertical axis
The reason for the modified ISO forward bending release test (note that in the ISO 9462 procedure, only pure moments without any extraneous forces have to be applied) was that this was expected to be the worst-case scenario for the new plate. The vertical force in this test pulled the plate away from the ski under such loading.
Both tests were conducted under three conditions:
1. A flat ski (clamped and thus pressed to the ground; zero deflection) 2. The standard ISO ski-deflection (a distance between the supports of 150 cm and
a deflection of 6 cm; Fig. 4) 3. An extreme ski-deflection (a distance between the supports of 110 cm and a
deflection of 6 cm; Fig. 4)
Each test was repeated until three consecutive measurements with equivalent release values were achieved. Only consistent tests were used for further analysis. In practice, no more than one additional “pre-test” was necessary to yield consistency. Consistency was visually judged from the measurement curves that were plotted one over another in real time.
Fig. 4 ISO 9462 Method A testing device (TÜV), during a modified forward bending release test with standard ski-deflection of the ski equipped with the new ski plate (bottom) and the corre-sponding scheme of the support and deflection distance (top). l, distance between the supports; f, deflection distance
Special Design of Ski Plates May Improve Skiing Safety
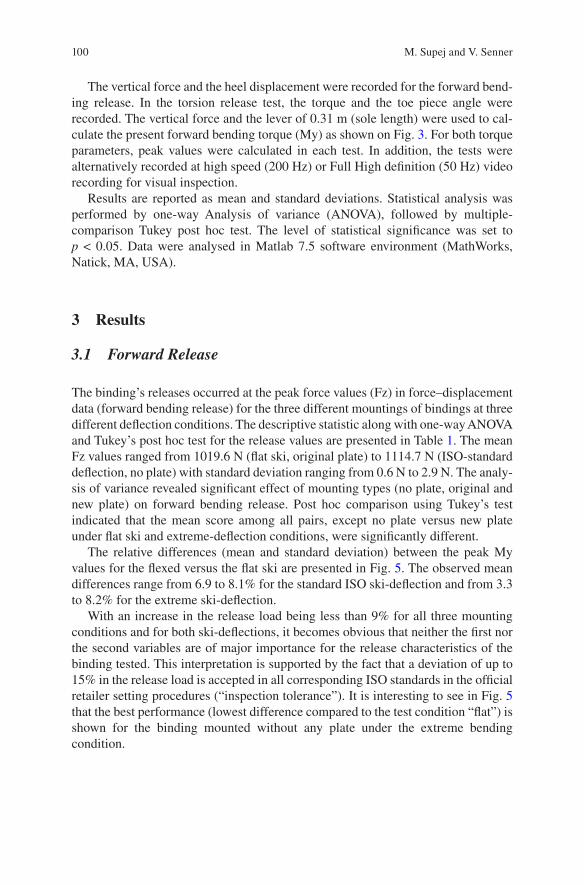
100
The vertical force and the heel displacement were recorded for the forward bend-ing release. In the torsion release test, the torque and the toe piece angle were recorded. The vertical force and the lever of 0.31 m (sole length) were used to cal-culate the present forward bending torque (My) as shown on Fig. 3. For both torque parameters, peak values were calculated in each test. In addition, the tests were alternatively recorded at high speed (200 Hz) or Full High definition (50 Hz) video recording for visual inspection.
Results are reported as mean and standard deviations. Statistical analysis was performed by one-way Analysis of variance (ANOVA), followed by multiple- comparison Tukey post hoc test. The level of statistical significance was set to p < 0.05. Data were analysed in Matlab 7.5 software environment (MathWorks, Natick, MA, USA).
3 Results
3.1 Forward Release
The binding’s releases occurred at the peak force values (Fz) in force–displacement data (forward bending release) for the three different mountings of bindings at three different deflection conditions. The descriptive statistic along with one-way ANOVA and Tukey’s post hoc test for the release values are presented in Table 1. The mean Fz values ranged from 1019.6 N (flat ski, original plate) to 1114.7 N (ISO-standard deflection, no plate) with standard deviation ranging from 0.6 N to 2.9 N. The analy-sis of variance revealed significant effect of mounting types (no plate, original and new plate) on forward bending release. Post hoc comparison using Tukey’s test indicated that the mean score among all pairs, except no plate versus new plate under flat ski and extreme-deflection conditions, were significantly different.
The relative differences (mean and standard deviation) between the peak My values for the flexed versus the flat ski are presented in Fig. 5. The observed mean differences range from 6.9 to 8.1% for the standard ISO ski-deflection and from 3.3 to 8.2% for the extreme ski-deflection.
With an increase in the release load being less than 9% for all three mounting conditions and for both ski-deflections, it becomes obvious that neither the first nor the second variables are of major importance for the release characteristics of the binding tested. This interpretation is supported by the fact that a deviation of up to 15% in the release load is accepted in all corresponding ISO standards in the official retailer setting procedures (“inspection tolerance”). It is interesting to see in Fig. 5 that the best performance (lowest difference compared to the test condition “flat”) is shown for the binding mounted without any plate under the extreme bending condition.
M. Supej and V. Senner
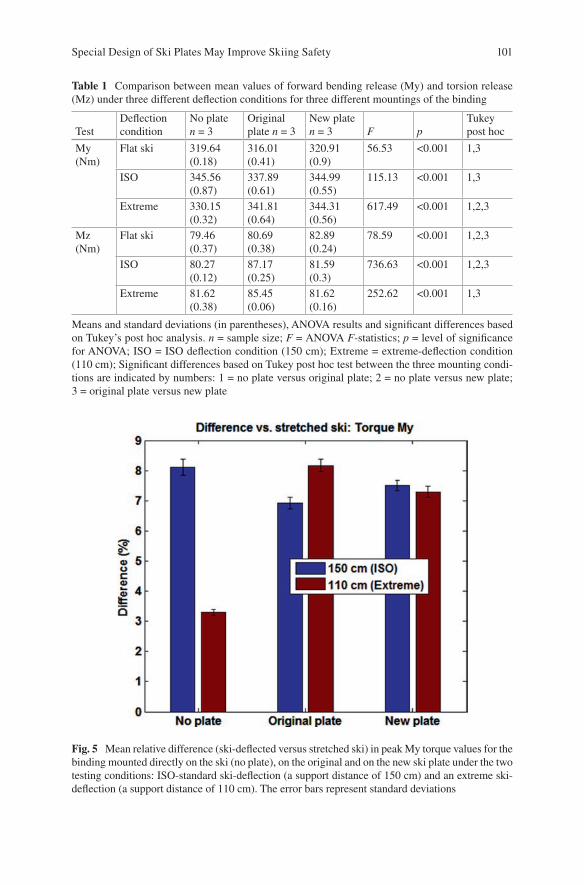
101
Table 1 Comparison between mean values of forward bending release (My) and torsion release (Mz) under three different deflection conditions for three different mountings of the binding
TestDeflection condition
No plate n = 3
Original plate n = 3
New plate n = 3 F p
Tukey post hoc
My (Nm)
Flat ski 319.64 (0.18)
316.01 (0.41)
320.91 (0.9)
56.53 <0.001 1,3
ISO 345.56 (0.87)
337.89 (0.61)
344.99 (0.55)
115.13 <0.001 1,3
Extreme 330.15 (0.32)
341.81 (0.64)
344.31 (0.56)
617.49 <0.001 1,2,3
Mz (Nm)
Flat ski 79.46 (0.37)
80.69 (0.38)
82.89 (0.24)
78.59 <0.001 1,2,3
ISO 80.27 (0.12)
87.17 (0.25)
81.59 (0.3)
736.63 <0.001 1,2,3
Extreme 81.62 (0.38)
85.45 (0.06)
81.62 (0.16)
252.62 <0.001 1,3
Means and standard deviations (in parentheses), ANOVA results and significant differences based on Tukey’s post hoc analysis. n = sample size; F = ANOVA F-statistics; p = level of significance for ANOVA; ISO = ISO deflection condition (150 cm); Extreme = extreme-deflection condition (110 cm); Significant differences based on Tukey post hoc test between the three mounting condi-tions are indicated by numbers: 1 = no plate versus original plate; 2 = no plate versus new plate; 3 = original plate versus new plate
Fig. 5 Mean relative difference (ski-deflected versus stretched ski) in peak My torque values for the binding mounted directly on the ski (no plate), on the original and on the new ski plate under the two testing conditions: ISO-standard ski-deflection (a support distance of 150 cm) and an extreme ski-deflection (a support distance of 110 cm). The error bars represent standard deviations
Special Design of Ski Plates May Improve Skiing Safety
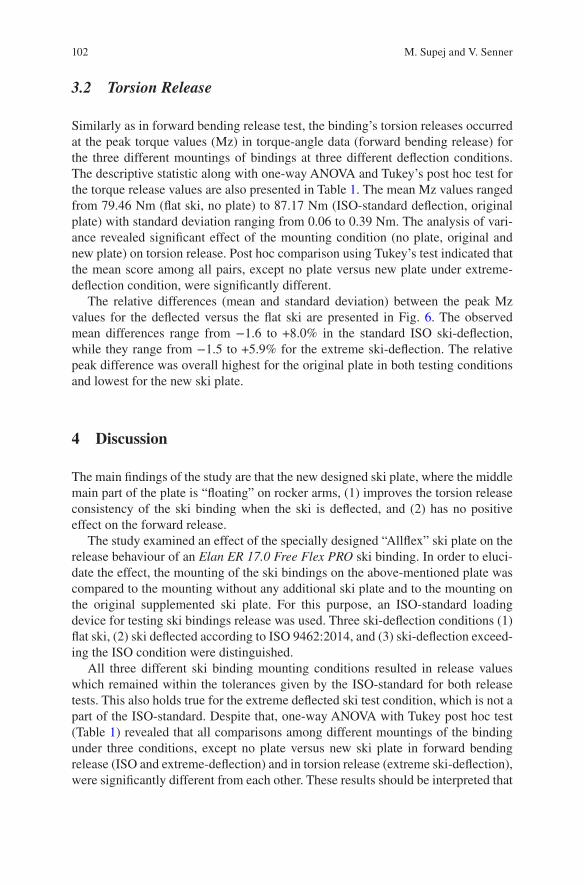
102
3.2 Torsion Release
Similarly as in forward bending release test, the binding’s torsion releases occurred at the peak torque values (Mz) in torque-angle data (forward bending release) for the three different mountings of bindings at three different deflection conditions. The descriptive statistic along with one-way ANOVA and Tukey’s post hoc test for the torque release values are also presented in Table 1. The mean Mz values ranged from 79.46 Nm (flat ski, no plate) to 87.17 Nm (ISO-standard deflection, original plate) with standard deviation ranging from 0.06 to 0.39 Nm. The analysis of vari-ance revealed significant effect of the mounting condition (no plate, original and new plate) on torsion release. Post hoc comparison using Tukey’s test indicated that the mean score among all pairs, except no plate versus new plate under extreme- deflection condition, were significantly different.
The relative differences (mean and standard deviation) between the peak Mz values for the deflected versus the flat ski are presented in Fig. 6. The observed mean differences range from −1.6 to +8.0% in the standard ISO ski-deflection, while they range from −1.5 to +5.9% for the extreme ski-deflection. The relative peak difference was overall highest for the original plate in both testing conditions and lowest for the new ski plate.
4 Discussion
The main findings of the study are that the new designed ski plate, where the middle main part of the plate is “floating” on rocker arms, (1) improves the torsion release consistency of the ski binding when the ski is deflected, and (2) has no positive effect on the forward release.
The study examined an effect of the specially designed “Allflex” ski plate on the release behaviour of an Elan ER 17.0 Free Flex PRO ski binding. In order to eluci-date the effect, the mounting of the ski bindings on the above-mentioned plate was compared to the mounting without any additional ski plate and to the mounting on the original supplemented ski plate. For this purpose, an ISO-standard loading device for testing ski bindings release was used. Three ski-deflection conditions (1) flat ski, (2) ski deflected according to ISO 9462:2014, and (3) ski-deflection exceed-ing the ISO condition were distinguished.
All three different ski binding mounting conditions resulted in release values which remained within the tolerances given by the ISO-standard for both release tests. This also holds true for the extreme deflected ski test condition, which is not a part of the ISO-standard. Despite that, one-way ANOVA with Tukey post hoc test (Table 1) revealed that all comparisons among different mountings of the binding under three conditions, except no plate versus new ski plate in forward bending release (ISO and extreme-deflection) and in torsion release (extreme ski-deflection), were significantly different from each other. These results should be interpreted that
M. Supej and V. Senner
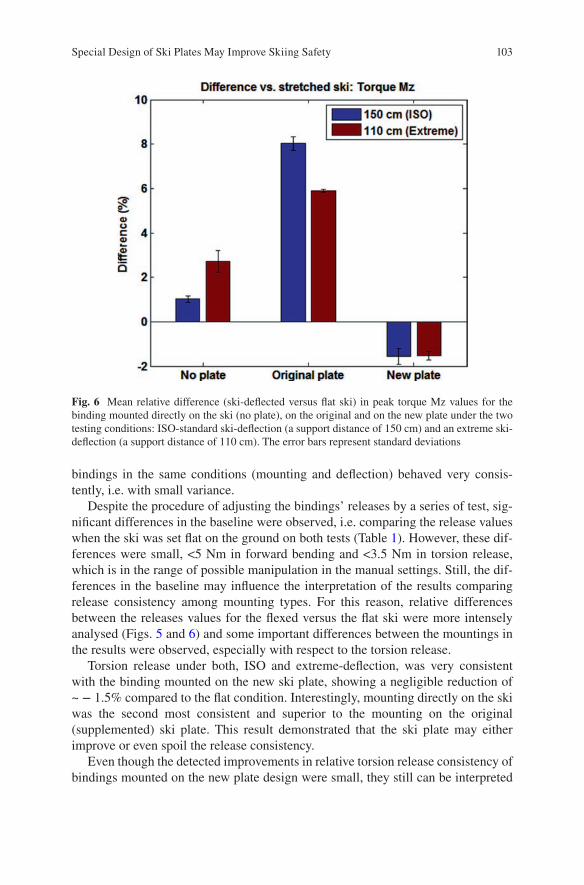
103
bindings in the same conditions (mounting and deflection) behaved very consis-tently, i.e. with small variance.
Despite the procedure of adjusting the bindings’ releases by a series of test, sig-nificant differences in the baseline were observed, i.e. comparing the release values when the ski was set flat on the ground on both tests (Table 1). However, these dif-ferences were small, <5 Nm in forward bending and <3.5 Nm in torsion release, which is in the range of possible manipulation in the manual settings. Still, the dif-ferences in the baseline may influence the interpretation of the results comparing release consistency among mounting types. For this reason, relative differences between the releases values for the flexed versus the flat ski were more intensely analysed (Figs. 5 and 6) and some important differences between the mountings in the results were observed, especially with respect to the torsion release.
Torsion release under both, ISO and extreme-deflection, was very consistent with the binding mounted on the new ski plate, showing a negligible reduction of ~ − 1.5% compared to the flat condition. Interestingly, mounting directly on the ski was the second most consistent and superior to the mounting on the original (supplemented) ski plate. This result demonstrated that the ski plate may either improve or even spoil the release consistency.
Even though the detected improvements in relative torsion release consistency of bindings mounted on the new plate design were small, they still can be interpreted
Fig. 6 Mean relative difference (ski-deflected versus flat ski) in peak torque Mz values for the binding mounted directly on the ski (no plate), on the original and on the new plate under the two testing conditions: ISO-standard ski-deflection (a support distance of 150 cm) and an extreme ski- deflection (a support distance of 110 cm). The error bars represent standard deviations
Special Design of Ski Plates May Improve Skiing Safety
104
as a contribution to binding safety. As severe combined loading conditions were not tested in the current study, i.e. ski being deflected and at the same time twisted about its longitudinal axis (due to edging moment or “roll loading”), the safety gain by the new plate design might even be higher.
Based on the message of the Signal Detection Theory [19, 21], an increase in release consistency can be interpreted as a decrease in the probability of both inad-vertent and also of the false release under the condition that the binding settings are appropriate [18]. This finding regarding the torsion release is of great importance because it is known that in both, recreational as well as competitive skiing, the larg-est number of injuries is related to the lower extremities, particularly to the knee joint [12–14]. For the knee joint it was found that both, internal and external rota-tions of the ski, are associated with knee injury mechanisms [22–24].
Even though all three mountings of the bindings under the ISO-standard deflec-tion condition in forward bending release test demonstrated almost identical relative differences, their absolute values in most cases differed significantly. In contrast to torsion release, the specially designed ski plate did not improve the forward bending release consistency to a meaningful magnitude compared to other two types of mountings. A video analysis of the release behaviour revealed that the (upward directed) Fz vertical force (during forward bending release) caused to bend and stretch the middle floating part of the new ski plate away from the ski. This observa-tion was in line with the fact that the set-up used in the current study with pulling at the heel does not adequately simulate typical real situation in skiing, as it neglects the body weight component. This however is also true for the test procedure accord-ing to ISO 9462:2014 (section 6.3.3). It is not well known even among experts that this release test with ski under deflection contains a rather critical simplification, which might significantly change the behaviour of the system. In real skiing, the force that deflects the ski is applied through the boot to the binding and then to the ski, whereas in the current ISO test, the deflection of the ski is forced “… by a strap or clamp, which does not interfere with the binding” (ISO 9462:2014, section 6.3.3.2 Testing). To the authors’ knowledge, there is still no standard test procedure available offering satisfactory external validity.
Interestingly, the mounting of the binding with its own inbuilt “Free Flex sys-tem” directly on the ski outperformed the other two in an extreme-deflection condi-tion. This indicates that adding ski plates does not necessarily improve the overall release behaviour. Even more, the overall results (relative differences) for the bind-ings mounted on the original plate were less consistent compared to the mounting directly on the ski.
The main limitation of the study was that only one type of skis, namely, Elan slalom skis, were used for all three mountings of the ski bindings in the testing pro-tocol. It can be expected that at least the forward bending release could be depen-dent on the skis’ longitudinal stiffness. This means that a less longitudinally stiff ski may flex more when the Fz vertical force is applied (forward bending release) com-pared to a stiffer ski and thus alter the results. However, the difference can be esti-mated as small, if not negligible according to the fixation of the ski in the testing
M. Supej and V. Senner
105
procedure (see Fig. 4). Hence, possible effect of the small differences in the selected skis for the current study can be concluded to be even smaller. In addition, one type of ski bindings was used for tests, and it is possible that other binding models and/or brands may behave differently. However, these bindings are a standard set together with the skis used in the current study.
Another limitation of the study was the problems of drawing conclusions based on laboratory tests when compared to real skiing situations where numerous factors may play a role and very different injury mechanisms are possible [6, 18, 25–27]. Nevertheless, a state-of-the-art measuring and testing device at an experienced and certified test house was employed for the experiment to ensure reliable and valid measurements.
The test protocol in this study did not investigate the effect of combined loads, which may be present in case of a twisted forward fall. For that reason ISO 9462: 2014 foresees a release test under combined loading (section 6.3.4). According to this standard, the influence of a forward lean of the body should not exceed 35%, the influence of a backward lean no more than 25%, the influence of a “roll loading” no more than 20% and the influence of an axial force no more than 15% of the refer-ence value (a single axis loading condition). Interestingly, these ISO tests for com-bined loads are not united with those tests for the ski under deflection. In practice however, this situation may occur, for instance when a skier runs into a bump falling forward with a rotational component and the ski being strongly flexed at the same time. It is very likely that the new ski plate might demonstrate its additional safety margin under such extreme (but not rare) conditions.
In conclusion, mounting of ski bindings on specially designed ski plates may result in an improved release behaviour and thus potentially increase skiing safety. However, it should be noted that optimizing the consistency of one type of the release behaviour does not necessarily improve the overall ski bindings release behaviour. Even more, mounting of ski bindings on the ski plates can even decrease the release consistency (and skiing safety) as it was the case with the original (supplemented) ski plate. We suggest caution to skiers when combining different brands and types of skis, ski plates and ski bindings in order to avoid compromising skiing safety.
Acknowledgments We would like to express our gratitude to Aco Sitar, the “father” of the Allflex ski plate, Thomas Maier at TÜV Product Service GmbH in Munich, Matej Božičnik and Luka Grilc at Elan d.d.
References
1. Vanat L (2016) International report on snow & mountain tourism—overview of the key indus-try figures for ski resorts; 8th edition. Available from http://www.vanat.ch/RM-world-report- 2016-vanat.pdf. Accessed 12 Jul 2016
2. Supej M, Kipp R, Holmberg HC (2011) Mechanical parameters as predictors of performance in alpine World Cup slalom racing. Scand J Med Sci Sports 21(6):e72–e81
Special Design of Ski Plates May Improve Skiing Safety
106
3. Federolf PA (2012) Quantifying instantaneous performance in alpine ski racing. J Sports Sci 30(10):1063–1068
4. Supej M (2008) Differential specific mechanical energy as a quality parameter in racing alpine skiing. J Appl Biomech 24(2):121–129
5. Gilgien M et al (2014) Mechanics of turning and jumping and skier speed are associated with injury risk in men's World Cup alpine skiing: a comparison between the competition disci-plines. Br J Sports Med 48(9):742–747
6. Sporri J et al (2012) Perceived key injury risk factors in World Cup alpine ski racing—an explorative qualitative study with expert stakeholders. Br J Sports Med 46(15):1059–1064
7. Sporri J et al (2016) Sidecut radius and the mechanics of turning-equipment designed to reduce risk of severe traumatic knee injuries in alpine giant slalom ski racing. Br J Sports Med 50(1):14–19
8. Sporri J et al (2012) Course setting and selected biomechanical variables related to injury risk in alpine ski racing: an explorative case study. Br J Sports Med 46(15):1072–1077
9. Haaland B et al (2016) Injury rate and injury patterns in FIS World Cup Alpine skiing (2006–2015): have the new ski regulations made an impact? Br J Sports Med 50(1):32–36
10. Hebert-Losier K, Holmberg HC (2013) What are the exercise-based injury prevention recom-mendations for recreational alpine skiing and snowboarding? A systematic review. Sports Med 43(5):355–366
11. Hunter RE (1999) Skiing injuries. Am J Sports Med 27(3):381–389 12. Flørenes TW et al (2009) Injuries among male and female World Cup alpine skiers. Br J Sport
Med 43(13):973–978 13. Brucker PU et al (2014) Recreational and competitive alpine skiing: typical injury patterns and
possibilities for prevention. Unfallchirurg 117(1):24–32 14. Burtscher M et al (2008) Effects of modern ski equipment on the overall injury rate and the
pattern of injury location in Alpine skiing. Clin J Sport Med 18(4):355–357 15. Johnson RJ, Ettlinger CF, Shealy JE (2009) Update on injury trends in alpine skiing. In:
Johnson RJ, Shealy JE, Langran M (eds) Skiing trauma and safety, vol 17. ASTM International, West Conshohocken, PA, pp 11–22
16. Kim S et al (2012) Snowboarding injuries: trends over time and comparisons with alpine ski-ing injuries. Am J Sports Med 40(4):770–776
17. Ruedl G et al (2011) ACL injury mechanisms and related factors in male and female carving skiers: a retrospective study. Int J Sports Med 32(10):801–806
18. Senner V et al (2013) Technical possibilities for optimising the ski-binding-boot functional unit to reduce knee injuries in recreational alpine skiing. Sports Eng 16(4):211–228
19. Shealy J, Ettlinger C, Johnson R (2005) Using signal detection theory as a model to evaluate release/retention criteria in alpine skiing. J ASTM Int 2(7):1–12
20. Sitar F (2008) Platform for mounting a ski binding on a ski. European Patent Office, EP2285457, PCT/SI2008/000068, E.P. Office
21. Shealy JE, Ettlinger CF (1999) A model for evaluation release/retention criteria in alpine ski- binding- boot systems. In: Johnson RJ (ed) Skiing trauma and safety, vol 12. ASTM International, West Conshohocken, PA, pp 120–131
22. Paletta GA Jr et al (1992) Patterns of meniscal injury associated with acute anterior cruciate ligament injury in skiers. Am J Sports Med 20(5):542–547
23. Jarvinen M et al (1994) Mechanisms of anterior cruciate ligament ruptures in skiing. Knee Surg Sports Traumatol Arthrosc 2(4):224–228
24. Krosshaug T et al (2007) Biomechanical analysis of anterior cruciate ligament injury mecha-nisms: three-dimensional motion reconstruction from video sequences. Scand J Med Sci Sports 17(5):508–519
25. Rust DA, Gilmore CJ, Treme G (2013) Injury patterns at a large Western United States ski resort with and without snowboarders: the Taos experience. Am J Sports Med 41(3):652–656
M. Supej and V. Senner
107
26. Stenroos A et al (2015) Tibial fractures in alpine skiing and snowboarding in Finland: a retro-spective study on fracture types and injury mechanisms in 363 patients. Scand J Surg 105(3):191–196. doi:10.1177/1457496915607410
27. Urabe Y et al (2002) Anterior cruciate ligament injury in recreational alpine skiers: analysis of mechanisms and strategy for prevention. J Orthop Sci 7(1):1–5
Open Access This chapter is distributed under the terms of the Creative Commons Attribution-Noncommercial 2.5 License (http://creativecommons.org/licenses/by-nc/2.5/) which permits any noncommercial use, distribution, and reproduction in any medium, provided the original author(s) and source are credited.
The images or other third party material in this chapter are included in the work’s Creative Commons license, unless indicated otherwise in the credit line; if such material is not included in the work’s Creative Commons license and the respective action is not permitted by statutory regu-lation, users will need to obtain permission from the license holder to duplicate, adapt or reproduce the material.
Special Design of Ski Plates May Improve Skiing Safety
109© The Author(s) 2017 I.S. Scher et al. (eds.), Snow Sports Trauma and Safety, DOI 10.1007/978-3-319-52755-0_9
Self-Release of Ski Bindings: A Sex Comparison
Markus Posch, Gerhard Ruedl, Robert Eberle, and Martin Burtscher
Abstract Background: Among recreational skiers, ACL injury risk is about three times greater in females compared to males and female skiers suffering from ACL injury reported about 20% points more frequently a failure of binding to release compared to male skiers with an ACL injury. Performing a daily self-release test of ski bindings, however, can prevent skiing-related injuries of the lower extremity.
Aim: To evaluate to what extent uninjured male and female skiers are able to self-release their ski bindings which were recently adjusted to the ISO 11088 standard.
Methods: A total of 15 male and 15 female healthy and physically active young adults with a mean age of 23.0 ± 1.7 years and without any previous injury of the lower extremities participated in this study. Subjects had to perform an isometric leg test and the self-release test of ski bindings with both legs on a Kistler force plate. For each attempt to release the binding, torques calculated via the force plate were normalized to torques calculated by a binding adjustment system (Relative Release Torques—RRT) and represented by percentage values.
Results: Sexes significantly differ regarding body mass and BMI, but not regard-ing relative maximum isometric leg strength. Eleven out of the 15 male subjects (73%) and three out of the 15 female (20%) subjects released their ski bindings at least once with both legs. Regarding a total of 90 self-release trials among each sex (3 trials × 2 legs × 15 subjects), failure of binding release was significantly higher among female compared to male trials (84 vs. 54%, p < 0.01). The mean relative release torques (RRT) of the 76 female trials of failure of binding release were sig-nificantly lower compared to the 49 male trials of failure of binding release (40.9 ± 20.2 vs. 50.6 ± 20.1%, p = 0.009).
Conclusion: Three times more females than males were unable to self-release their ski bindings although their bindings were correctly adjusted according to the ISO 11088 standard for binding setting values. In addition, females reached about 20% lower RRT values within failure of binding release trials although males and females did not differ with regard to relative isometric leg strength.
M. Posch • G. Ruedl (*) • R. Eberle • M. Burtscher Department of Sport Science, University of Innsbruck, Fürstenweg 185, 6020 Innsbruck, Austriae-mail: [email protected]
110
Keywords Ski binding release • Self-release test • Alpine skiing • Prevention • Knee injury
1 Introduction
Recreational alpine skiing is one of the most popular winter sports annually enjoyed by several 100 million skiers worldwide [1, 2]. Despite the large number of skiers, the currently calculated injury rate in Austria is less than one injury per 1000 skier days [3]. The knee joint represents the most commonly injured body part accounting for about one-third of all injuries in recreational skiers, however with a distinctive difference between sexes [3–5]. Female recreational skiers have twice the knee injury prevalence of male skiers and the ACL injury risk is three times greater in female skiers [4–6]. This sex difference of knee injuries among recreational alpine skiers may be partly related to hormonal, anatomical, and/or neuromuscular risk factors which distinguish females from males [7, 8]. Another decisive sex difference among knee-injured skiers concerns the amount of failure of binding to release at the moment of accident [9–12]. For instance, a total of 55–67% male skiers reported a failure of the ski bindings to release compared to 74–88% of female skiers suffering from an ACL injury [9–12]. This difference in binding non-releases percentages occurred even though there was no difference in the date of last binding adjustment [11], whether the bindings were adjusted cor-rectly [13], or self-reported types of falling [11, 12]. In a very recent study among a cohort of about 500 male and female recreational skiers suffering from an ACL injury, Ruedl et al. [12] showed that binding release was independently associated with forward falling with rotation. This so-called forward twisting fall [12] corre-sponds well with the self-release test of ski bindings where skiers try to release their bindings by an inward twist of their leg [14]. Previous studies by Ekeland et al. [15] and Jørgensen et al. [16] found that performing daily the self-release test of ski bindings can prevent skiing-related injuries of the lower extremity. Keeping in mind that female skiers with an ACL injury reported about 20% points more failures of binding to release compared to male skiers with an ACL injury, the aim of this study was to evaluate to what extent uninjured male and female skiers are able to self-release their ski bindings that were recently adjusted according to the ISO 11088 standard for binding setting values. As the ISO 11088 standard for binding setting values does not consider sex-specific differences, we hypothesized that there are no differences between male and female skiers performing the self-release test.
M. Posch et al.
111
2 Material and Method
2.1 Subjects
A total of 15 male and 15 female healthy and physically active young adults without previous injury of the lower extremities were asked to participate in this study. Most participants were students from the Department of Sport Science in Innsbruck/Austria with an advanced skiing skill level.
The study was performed in conformity with the ethical standards of the 2008 Declaration of Helsinki. Informed written consent was obtained from all subjects prior to the beginning of this research. In addition, the study was approved by the Institutional Review Board.
2.2 Study Protocol
After subjects performed a standardized warming up, maximal isometric leg strength of both legs were tested. Then subjects had to perform three trials with each leg to release their bindings adjusted according to the ISO 11088 standard.
2.3 Ski Binding Adjustment
Each subject used his/her own skies and ski boots. The day before the tests took place the skies and ski boots were taken to a ski rental shop where the ski bindings were correctly adjusted according to the ISO 11088 standard using a Wintersteiger Speedtronic adjustment system. Release values of the bindings according to the ISO 11088 standard are determined using individual age, height, weight, skiing type, and sole length of ski boots. In addition, skiers have to differentiate between skiing speed (slow to moderate vs. fast), terrain (gentle to moderate vs. steep), and skiing style (cautious vs. aggressive) to classify themselves into one out of three skiing types. The Wintersteiger Speedtronic adjustment system then calculated the required release torques for the toe and heel piece of the ski binding.
2.4 Isometric Leg Strength Test
Prior to the isometric leg strength test all participants had to do a 7 min warming-up programme on a stationary cycle ergometer. Regarding the determination of leg dominance, subjects were asked which leg they would prefer to kick a ball. According to a study by Raschner et al. [17], participants performed three one-leg isometric leg extensions on each leg. The greater trochanter, lateral intercondylar
Self-Release of Ski Bindings: A Sex Comparison
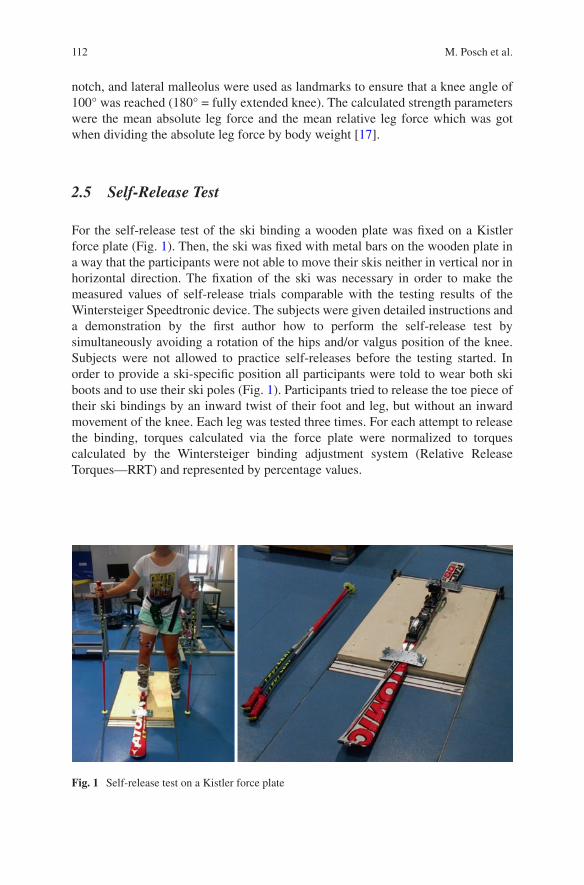
112
notch, and lateral malleolus were used as landmarks to ensure that a knee angle of 100° was reached (180° = fully extended knee). The calculated strength parameters were the mean absolute leg force and the mean relative leg force which was got when dividing the absolute leg force by body weight [17].
2.5 Self-Release Test
For the self-release test of the ski binding a wooden plate was fixed on a Kistler force plate (Fig. 1). Then, the ski was fixed with metal bars on the wooden plate in a way that the participants were not able to move their skis neither in vertical nor in horizontal direction. The fixation of the ski was necessary in order to make the measured values of self-release trials comparable with the testing results of the Wintersteiger Speedtronic device. The subjects were given detailed instructions and a demonstration by the first author how to perform the self-release test by simultaneously avoiding a rotation of the hips and/or valgus position of the knee. Subjects were not allowed to practice self-releases before the testing started. In order to provide a ski-specific position all participants were told to wear both ski boots and to use their ski poles (Fig. 1). Participants tried to release the toe piece of their ski bindings by an inward twist of their foot and leg, but without an inward movement of the knee. Each leg was tested three times. For each attempt to release the binding, torques calculated via the force plate were normalized to torques calculated by the Wintersteiger binding adjustment system (Relative Release Torques—RRT) and represented by percentage values.
Fig. 1 Self-release test on a Kistler force plate
M. Posch et al.
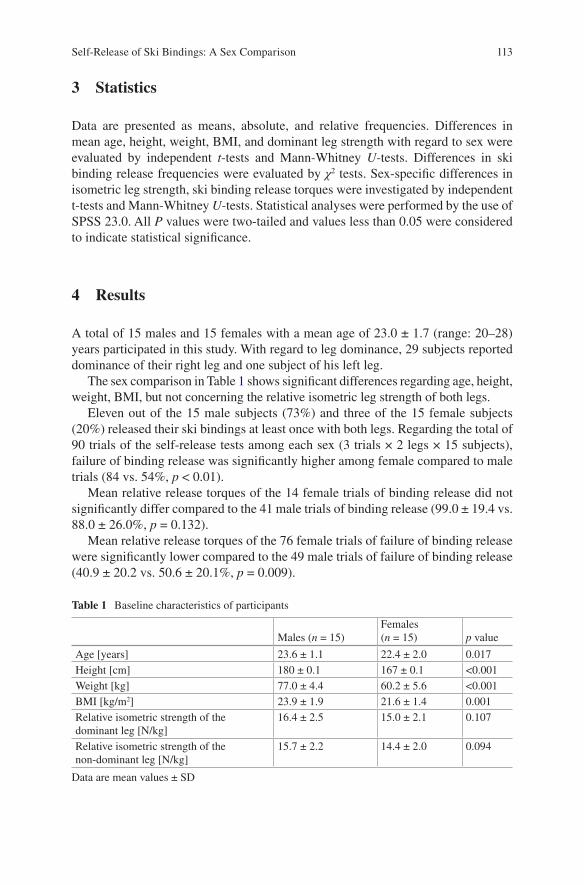
113
3 Statistics
Data are presented as means, absolute, and relative frequencies. Differences in mean age, height, weight, BMI, and dominant leg strength with regard to sex were evaluated by independent t-tests and Mann-Whitney U-tests. Differences in ski binding release frequencies were evaluated by χ2 tests. Sex-specific differences in isometric leg strength, ski binding release torques were investigated by independent t-tests and Mann-Whitney U-tests. Statistical analyses were performed by the use of SPSS 23.0. All P values were two-tailed and values less than 0.05 were considered to indicate statistical significance.
4 Results
A total of 15 males and 15 females with a mean age of 23.0 ± 1.7 (range: 20–28) years participated in this study. With regard to leg dominance, 29 subjects reported dominance of their right leg and one subject of his left leg.
The sex comparison in Table 1 shows significant differences regarding age, height, weight, BMI, but not concerning the relative isometric leg strength of both legs.
Eleven out of the 15 male subjects (73%) and three of the 15 female subjects (20%) released their ski bindings at least once with both legs. Regarding the total of 90 trials of the self-release tests among each sex (3 trials × 2 legs × 15 subjects), failure of binding release was significantly higher among female compared to male trials (84 vs. 54%, p < 0.01).
Mean relative release torques of the 14 female trials of binding release did not significantly differ compared to the 41 male trials of binding release (99.0 ± 19.4 vs. 88.0 ± 26.0%, p = 0.132).
Mean relative release torques of the 76 female trials of failure of binding release were significantly lower compared to the 49 male trials of failure of binding release (40.9 ± 20.2 vs. 50.6 ± 20.1%, p = 0.009).
Table 1 Baseline characteristics of participants
Males (n = 15)Females (n = 15) p value
Age [years] 23.6 ± 1.1 22.4 ± 2.0 0.017Height [cm] 180 ± 0.1 167 ± 0.1 <0.001Weight [kg] 77.0 ± 4.4 60.2 ± 5.6 <0.001BMI [kg/m2] 23.9 ± 1.9 21.6 ± 1.4 0.001Relative isometric strength of the dominant leg [N/kg]
16.4 ± 2.5 15.0 ± 2.1 0.107
Relative isometric strength of the non- dominant leg [N/kg]
15.7 ± 2.2 14.4 ± 2.0 0.094
Data are mean values ± SD
Self-Release of Ski Bindings: A Sex Comparison
114
5 Discussion
The aim of the present study was to evaluate to what extent uninjured male and female skiers are able to self-release their ski bindings that were recently adjusted according to the ISO 11088 standard for binding setting values. The main finding was that significantly more females were not able to self-release their ski bindings compared to males.
In our tests, 84% of female trials and 54% of male trials showed a failure of self- release of their ski bindings. These sex-specific values seem in line with findings observed among ACL-injured recreational skiers where 74–88% of female skiers compared to 55–67% male skiers reported a failure of binding to release [9–12]. This conformity might be somewhat surprising as the self-release test was per-formed in a stationary laboratory setting in contrast to the self-reported amount of failure of binding release during skiing on the slope leading to an ACL injury. However, it may become understandable considering the findings by LaPorte et al. [10] who showed that a total of 44% of lower leg injuries (50% of all tibia fractures, 44% of all MCL injuries, 47% of all complex knee sprains, and 43% of all ACL injuries) occurred at low speed or in a stationary position indicating the potential problem of ski binding release at low speed.
Relative release torques (RRT) of female and male trials of failure of binding release were about 41 and 51%, respectively, indicating a huge difference to the recommended binding setting values. In a field experiment, Scher and Mote [18] analysed forces among a cohort of 12 recreational skiers (two females, ten males) during skiing by using two six-load component dynamometers which were attached under the toe and the heel binding of the left ski. They found that the ASTM (American Society for Testing and Materials) recommended release settings were significantly higher than the forces required to ski normally on varied terrain from hard snow to soft spring snow for ten of the 12 skiers [18]. With regard to the lateral release setting at the toe, ten of the subjects skied within 67% of the current settings and could have lowered this setting by 33% without signalling for inadvertent release [18]. In addition, for inexperienced, lightweight skiers, the release setting at the toe could have been lowered by 38%. Interestingly, the only subject who fell two times and released from the ski was a female beginner skier whose measured mini-mum retention setting at the toe was found to be 61% of the ASTM recommended setting [18]. Scher and Mote [18] concluded from their results that forces generated during skiing depend more on a skiing style variable than on anthropometrical parameters and that, therefore, binding standards that depend on weight, height, and age cannot predict accurately the minimum retention settings for individual skiers. According to the ISO 11088 standard for binding values, skiers have to differentiate between skiing speed (slow to moderate vs. fast), terrain (gentle to moderate vs. steep), and skiing style (cautious vs. aggressive) to classify themselves into one out of three skiing types. Studies, however, found that female skiers are skiing on aver-age at significant lower speeds compared to male skiers [13, 19] and that females, less skilled and cautious skiers perceived their actual speed as fast, moderate, and slow when skiing up to 10 km/h significantly slower compared males, more skilled
M. Posch et al.
115
skiers, and risky skiers [20]. As the ISO 11088 standard for binding setting values does not consider any sex-specific factor so far and to get more insight in needed retention settings of male and female recreational skiers, we would strongly recom-mend replicating the study design by Scher and Mote [18], however, aiming at com-paring potential differences between males and females.
The observed RRT difference of about 20% between male and female trials of failure of binding release might be also considered when discussing the implemen-tation of a sex factor within the ISO 11088 standard. In previous years, a lower binding setting among female skiers has been discussed by LaPorte et al. [21]. In a case-control study, they found that lower binding release values in female skiers set 15% lower than those recommended by the ISO 11088 standard would clearly reduce knee injuries in these persons. No increase in injuries from inadvertent bind-ing release through reduced binding settings has been found [21]. However, these findings mean an association, and not definitely “cause and effect” relationship, because another study at the same time showed a decrease in ACL injury risk with-out reducing binding settings [22] which might be due to the introduction of the short and shaped carving skis at this time [11]. Interestingly, the ISO 11088 stan-dard accepts a deviation of 15% between the measured release moment (“reference moment”) determined according to the setting tables in ISO 8061 and ski binding settings may also be lowered by the same magnitude upon request of the skier [23]. However, this fact is generally unknown in the overall skier population, but could represent a potential preventive measure, especially for female recreational skiers.
A study by Werner and Willis [14] found that muscle strength is highly corre-lated with the ability to release the binding in a self-release test. Assume that a male and a female skier of equal age, height, weight, and ski boot sole length classified themselves as type-3 skier (fast speed, steep terrain, aggressive style). They both would get the same binding setting values without considering sex. With regard to the equal weight of the male and female skier in the mentioned example, it has to be considered that the weight-to-strength ratio is negatively influenced by the higher fat mass in females [24] may be partly explaining the sex difference within the lack of binding release among ACL-injured recreational skiers due to less muscular strength among females. Participants of the present study were young healthy and physically active males and females. Although sexes significantly differ regarding body mass and BMI, no significant differences were detected within relative maxi-mum isometric leg strength when normalized by body weight. Therefore, one would assume that both sexes are able to self-release their bindings to the same amount.
As performing the self-release test seems to prevent skiing injuries [15, 16], male and female skiers should be able to self-release their ski bindings to the same extent, if their bindings are correctly adjusted according to the ISO 11088 standard. However, compared to about 70% of males only one fifth of females in this study were able to self-release their ski bindings with both legs. Therefore, the question arises whether a lowering of the binding settings for females by, e.g. 15% would be relevant in order to decrease the risk of female knee injuries without an increase of inadvertent releases. However, to answer this question, more research in laboratory as well in field settings is needed.
Self-Release of Ski Bindings: A Sex Comparison
116
In conclusion, three times more females than males were unable to self-release their ski bindings although their bindings were correctly adjusted according to the ISO 11088 standard. In addition, females reached about 20% lower RRT values within failure of binding release trials although males and females did not differ with regard to relative isometric leg strength.
Acknowledgement The author gratefully acknowledges support for this study from the University of Innsbruck (Doktoratsstipendium NEU). We also highly appreciate the help by Franz Patscheider for providing the Wintersteiger Speedtronic adjustment system in his ski rental shop.
References
1. Russel K, Christie J, Hagel BE (2010) The effects of helmets on the risk of head and neck injuries among skiers and snowboarders: a meta-analysis. CMAJ 182(4):333–340. doi:10.1503/cmaj.091080
2. Cusimano MD, Kwok J (2010) The effectiveness of helmet wear in skiers and snowboarders: a systematic review. Br J Sports Med 44:781–786. doi:10.1136/bjsm.2009.070573
3. Ruedl G, Philippe M, Sommersacher R et al (2014) Current incidence of accidents on Austrian ski slopes. Sportverletz Sportschaden 28(4):183–187. doi:10.1055/s-0034-1385244
4. Burtscher M, Gatterer H, Flatz N et al (2008) Effects of modern ski equipment on the overall injury rate and the pattern of injury location in alpine skiing. Clin J Sport Med 18(4):355–357
5. Ekeland A, Rodven A (2011) Skiing and boarding injuries on Norwegian slopes during two winter seasons. In: Johnson RJ, Shealy JE, Senner V (eds) Skiing trauma and safety, 18th Volume. Journal of ASTM International 4:139–149. doi: 10.1520/JAI102817
6. Burtscher M, Sommersacher R, Ruedl G, et al (2009) Potential risk factors for knee injuries in alpine skiers. In: Johnson RJ, Shealy JE, Langran M (eds) Skiing trauma and safety, 17th Volume. Journal of ASTM International 6(1):73–76
7. Hewett TE, Meyer GD, Ford KR (2006) Anterior cruciate ligament injuries in female athletes: part 1, mechanisms and risk factors. Am J Sports Med 34:299–311
8. Ruedl G, Schranz A, Fink C et al (2009) Knee injuries in female recreational alpine skiing—an overview of risk factors and prevention. Deutsche Zeitschrift für Sportmedizin 60:345–349
9. Greenwald RM, Toelcke T (1997) Gender differences in alpine skiing injuries: a profile of the knee-injured skier. In: Johnson RJ, Mote CD, Ekeland A (eds) Skiing trauma and safety, 11th Volume. Journal of ASTM International, 111–121
10. LaPorte JD, Binet MH, Fenet N, et al (2009) Ski bindings and lower leg injuries, a case control study in Flaine, 2006. In: Johnson RJ, Shealy JE, Langran M (eds) Skiing trauma and safety, 17th Volume. Journal of ASTM International, 77–88
11. Ruedl G, Webhofer M, Linortner I, Schranz A, Fink C, Patterson C, Nachbauer W, Burtscher M (2011) ACL injury mechanisms and related factors in male and female carving skiers: a retrospective study. Int J Sports Med 32(10):801–806. doi:10.1055/s-0031-1279719
12. Ruedl G, Helle K, Tecklenburg K et al (2016) Factors associated with self-reported failure of binding release among ACL injured male and female recreational skiers: a catalyst to change ISO binding standards? Br J Sports Med 50:37–40. doi:10.1136/bjsports-2015-095482
13. Ruedl G, Sommersacher R, Woldrich T et al (2010) Mean speed of winter sport participants depending on various factors. Sportverletz Sportschaden 24:150–153
14. Werner S, Willis K (2002) Self-release of ski-binding. Int J Sports Med 23:530–535 15. Ekeland A, Holtmoen A, Lystad H (1993) Lower extremity equipment-related injuries in
alpine recreational skiers. Am J Sports Med 21(2):201–205 16. Jørgensen U, Fredensborg T, Haraszuk JP et al (1998) Reduction of injuries in downhill skiing
by use of an instructional ski-video: a prospective randomised intervention study. Knee Surg, Sports Traumatol Arthrosc 6(3):194–200
M. Posch et al.
117
17. Raschner C, Platzer HP, Patterson C et al (2012) The relationship between ACL injuries and physical fitness in young competitive ski racers: a 10-year longitudinal study. Br J Sports Med 46:1065–1071. doi:10.1136/bjsports-2012-091050
18. Scher IS, Mote CD (1999) Comparison of needed and recommended retention settings for snow skiing. In: Johnson R (ed) Skiing trauma and safety, 12th Volume. Journal of ASTM International, 107–119
19. Shealy JE, Ettlinger CF, Johnson RJ (2005) How fast do winter sports participants travel on alpine slopes?. In: Johnson RJ, Shealy JE, Ahlbäumer MG (eds) Skiing trauma and safety, 15th Volume. Journal of ASTM International, 59–66
20. Brunner F, Ruedl G, Kopp M et al (2015) Factors associated with the perception of speed among recreational skiers. PLoS One 10(6):e0132002. doi:10.1371/journal.pone.0132002. eCollection 2015
21. LaPorte JD, Binet MH, Fenet N, Constans D (2006) Ski bindings and lower leg injuries: a two year case-control study in Avoriaz. Abstracts of the sixteenth international symposium on ski trauma and skiing safety, Arai Mountain, Niigata, Japan, 17-23, April 2005. Knee Surg Sports Traumatol Arthrosc 14:100–101
22. Ettlinger CF, Johnson RJ, Shealy JE (2006) Functional and release characteristics of alpine ski equipment. Abstracts of the sixteenth international symposium on ski trauma and skiing safety, Arai Mountain, Niigata, Japan, 17–23 April 2005. Knee Surg Sports Traumatol Arthrosc 14:97–104
23. Senner V, Michel FI, Lehner S et al (2013) Technical possibilities for optimizing the ski- binding- boot functional unit to reduce knee injuries in recreational alpine skiing. Sports Eng 16:211–228
24. Sinning WE (1985) Body composition and athletic performance. In: Clarke DH, Eckert HM (eds) Limits of human performance. The Academy Papers, Champaign, pp 45–56
Open Access This chapter is distributed under the terms of the Creative Commons Attribution-Noncommercial 2.5 License (http://creativecommons.org/licenses/by-nc/2.5/) which permits any noncommercial use, distribution, and reproduction in any medium, provided the original author(s) and source are credited.
The images or other third party material in this chapter are included in the work’s Creative Commons license, unless indicated otherwise in the credit line; if such material is not included in the work’s Creative Commons license and the respective action is not permitted by statutory regu-lation, users will need to obtain permission from the license holder to duplicate, adapt or reproduce the material.
Self-Release of Ski Bindings: A Sex Comparison

Part IIIImpact Injury Mitigation
121© The Author(s) 2017 I.S. Scher et al. (eds.), Snow Sports Trauma and Safety, DOI 10.1007/978-3-319-52755-0_10
Computer Simulation of the Skier-Flex Pole Impact in Slalom
Kurt Schindelwig, Peter Kaps, and Werner Nachbauer
Abstract In skiing the skier-flex pole impact causes a deflection and rotation of the flex pole and a speed loss of the skier. The purpose of the present study was to inves-tigate the effects of skier and pole parameters on time loss, pole deflection, and pole damage speed caused by the skier-pole impact in slalom. Validated finite element models were used for the simulation of the impact. Skier mass, speed and impact height and pole mass, bending stiffness, diameter, and wall thickness were analyzed. Time loss was assessed for seven pole impacts by a simple simulation model of a skier schussing down an inclined plane. From the skier parameters, impact height followed by impact speed showed the highest effect on the skier-pole impulse. The impulse increased with increasing pole mass whereas the effect of bending stiffness was negligible. Time loss could be reduced by lowering the pole mass. However, lowering of pole diameter or wall thickness increased pole deflection enhancing injury risk due to the whiplash effect. Additionally, the reduction of wall thickness decreased pole damage speed with the disadvantage of higher risk of pole fractures. Overall, lowering pole mass for the current impact speeds in World Cup slalom races requires additional investigation. In children and youth races with lower impact speeds than in World Cup races, a pole mass reduction would be possible.
Keywords Flex pole • Slalom • Time loss • FE model • Safety aspects • Impact
1 Introduction
According to the competition rules of the International Ski Federation World Cup skiers hit about 130 flex poles during a slalom race [1]. Specifications for flex poles were developed by the FIS to guarantee that flex poles behave in the same manner
K. Schindelwig (*) • W. Nachbauer Department of Sport Science, University of Innsbruck, Innsbruck, Austriae-mail: [email protected]
P. Kaps Department of Engineering Mathematics, University of Innsbruck, Innsbruck, Austria
122
all over the world, to avoid injury caused by the pole impacts as much as possible, and minimize the risk of pole fracture so that a flex pole is operational over a period of at least 3 years (ca. 8000 passes) [2].
The resistance of the flex pole during impact leads to a speed loss and in conse-quence to a time loss of the skier. Innerhofer and Nachbauer [3] reported that ski-ers of low body mass and height have a competitive disadvantage compared to heavier and taller skiers. This disadvantage was more pronounced the more mass and height differed, e.g., speed loss per pole contact was reduced 23% by increas-ing body mass from 40 to 90 kg and reduced 27% by increasing impact height from 0.6 to 1.2 m.
The impact of the skier causes a deflection of the flex pole that may cause injury to the skier. As a result of the very fast acceleration of the upright pole by the skier impact, the tip of the pole rebounds shortly and may hit the skier in the head- shoulder- back area. This effect—in skiing referred to as the whiplash effect—is stronger for an upright pole with lower bending stiffness and higher mass. There are no injury data available for the whiplash injury mechanism. Bere et al. [4] analyzed 69 injury cases of the alpine skiing World Cup. Gate contact was assumed to contribute directly and/or indirectly to injury in 21 cases. Impacts that contributed indirectly to injury influenced the skier’s balance leading to falls. Two injuries were reported for slalom. However, only severe injuries were analyzed.
Pole fracture data was not published. According to informal reports of coaches and pole manufacturers pole impacts by a skier causes fractures in the middle part of the pole and pole impacts to the ground create fractures in the tip region of the pole. Pole fractures during training/competition shorten the training time or extend the competition time. Moreover, flex poles are relatively expensive. In order to avoid fractures in the tip region, some manufactures attach an additional shell inside the upper end of the pole increasing wall thickness. To prevent injuries due to bro-ken poles, FIS requests a ductile fracture behavior to ensure that the pole only snaps without breaking off completely [2].
In the study of Innerhofer and Nachbauer [3], the pole was modeled as a bend-ing beam. The impact was modeled as pure elastic and pole deflection was taken from video images. Accordingly, plastic deformation was not considered. Schindelwig et al. [5] developed a finite element (FE) model of a flex pole. The model was validated using a pendulum impactor. Measured and simulated data correlated well with less than 2% difference for the impulse and 1.2% difference for the pole deflection.
Lighter and smaller racers have a considerable disadvantage in competitions due to pole resistance. A reduction of the resistance lessens the disadvantage; however, it may increase injury risk and pole fractures. Thus, the purpose of the present study was to investigate the effects of skier and flex pole parameters on time loss, pole deflection, and pole damage speed caused by the skier-pole impact in slalom.
K. Schindelwig et al.
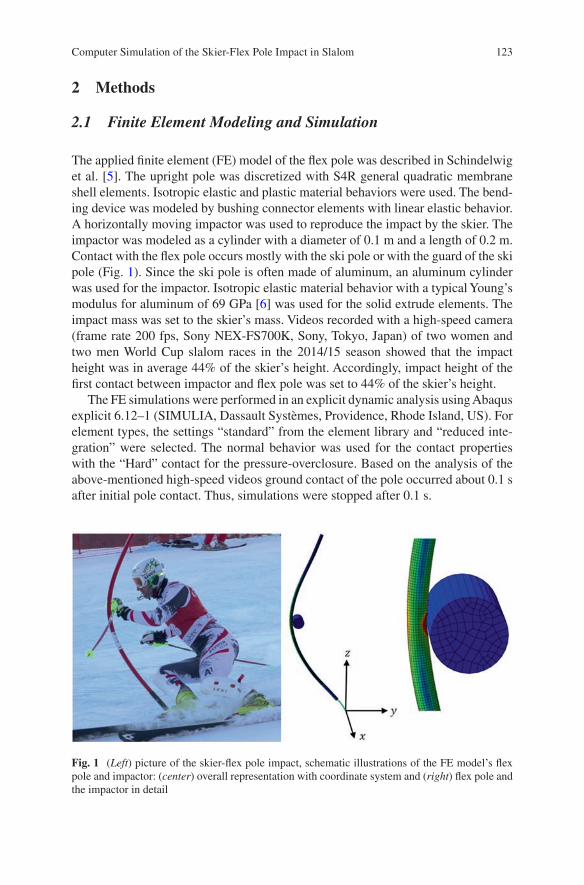
123
2 Methods
2.1 Finite Element Modeling and Simulation
The applied finite element (FE) model of the flex pole was described in Schindelwig et al. [5]. The upright pole was discretized with S4R general quadratic membrane shell elements. Isotropic elastic and plastic material behaviors were used. The bend-ing device was modeled by bushing connector elements with linear elastic behavior. A horizontally moving impactor was used to reproduce the impact by the skier. The impactor was modeled as a cylinder with a diameter of 0.1 m and a length of 0.2 m. Contact with the flex pole occurs mostly with the ski pole or with the guard of the ski pole (Fig. 1). Since the ski pole is often made of aluminum, an aluminum cylinder was used for the impactor. Isotropic elastic material behavior with a typical Young’s modulus for aluminum of 69 GPa [6] was used for the solid extrude elements. The impact mass was set to the skier’s mass. Videos recorded with a high- speed camera (frame rate 200 fps, Sony NEX-FS700K, Sony, Tokyo, Japan) of two women and two men World Cup slalom races in the 2014/15 season showed that the impact height was in average 44% of the skier’s height. Accordingly, impact height of the first contact between impactor and flex pole was set to 44% of the skier’s height.
The FE simulations were performed in an explicit dynamic analysis using Abaqus explicit 6.12–1 (SIMULIA, Dassault Systèmes, Providence, Rhode Island, US). For element types, the settings “standard” from the element library and “reduced inte-gration” were selected. The normal behavior was used for the contact properties with the “Hard” contact for the pressure-overclosure. Based on the analysis of the above-mentioned high-speed videos ground contact of the pole occurred about 0.1 s after initial pole contact. Thus, simulations were stopped after 0.1 s.
Fig. 1 (Left) picture of the skier-flex pole impact, schematic illustrations of the FE model’s flex pole and impactor: (center) overall representation with coordinate system and (right) flex pole and the impactor in detail
Computer Simulation of the Skier-Flex Pole Impact in Slalom
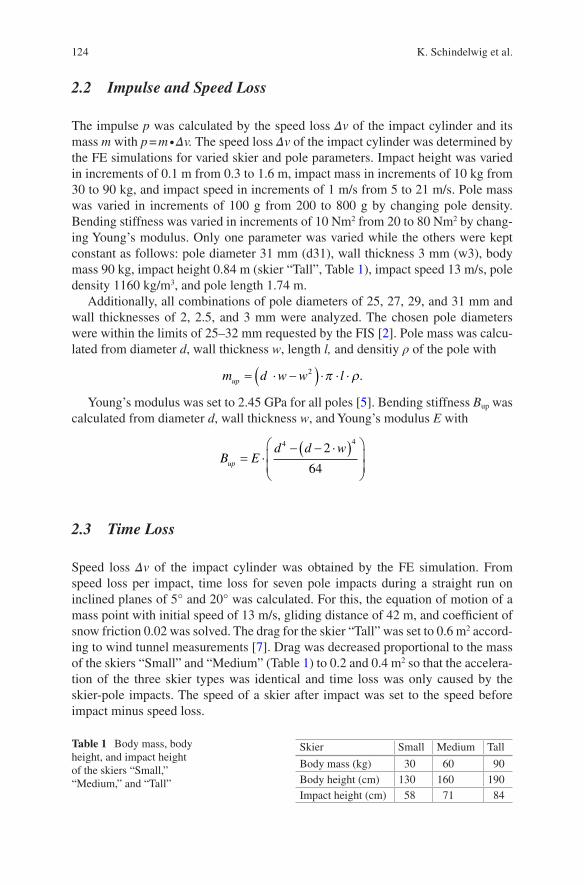
124
2.2 Impulse and Speed Loss
The impulse p was calculated by the speed loss Δv of the impact cylinder and its mass m with p = m ∙ Δv. The speed loss Δv of the impact cylinder was determined by the FE simulations for varied skier and pole parameters. Impact height was varied in increments of 0.1 m from 0.3 to 1.6 m, impact mass in increments of 10 kg from 30 to 90 kg, and impact speed in increments of 1 m/s from 5 to 21 m/s. Pole mass was varied in increments of 100 g from 200 to 800 g by changing pole density. Bending stiffness was varied in increments of 10 Nm2 from 20 to 80 Nm2 by chang-ing Young’s modulus. Only one parameter was varied while the others were kept constant as follows: pole diameter 31 mm (d31), wall thickness 3 mm (w3), body mass 90 kg, impact height 0.84 m (skier “Tall”, Table 1), impact speed 13 m/s, pole density 1160 kg/m3, and pole length 1.74 m.
Additionally, all combinations of pole diameters of 25, 27, 29, and 31 mm and wall thicknesses of 2, 2.5, and 3 mm were analyzed. The chosen pole diameters were within the limits of 25–32 mm requested by the FIS [2]. Pole mass was calcu-lated from diameter d, wall thickness w, length l, and densitiy ρ of the pole with
m d w w lup = × -( ) × × ×2 p r.
Young’s modulus was set to 2.45 GPa for all poles [5]. Bending stiffness Bup was calculated from diameter d, wall thickness w, and Young’s modulus E with
B Ed d w
up = ×- - ×( )æ
èçç
ö
ø÷÷
4 42
64
2.3 Time Loss
Speed loss Δv of the impact cylinder was obtained by the FE simulation. From speed loss per impact, time loss for seven pole impacts during a straight run on inclined planes of 5° and 20° was calculated. For this, the equation of motion of a mass point with initial speed of 13 m/s, gliding distance of 42 m, and coefficient of snow friction 0.02 was solved. The drag for the skier “Tall” was set to 0.6 m2 accord-ing to wind tunnel measurements [7]. Drag was decreased proportional to the mass of the skiers “Small” and “Medium” (Table 1) to 0.2 and 0.4 m2 so that the accelera-tion of the three skier types was identical and time loss was only caused by the skier-pole impacts. The speed of a skier after impact was set to the speed before impact minus speed loss.
Table 1 Body mass, body height, and impact height of the skiers “Small,” “Medium,” and “Tall”
Skier Small Medium Tall
Body mass (kg) 30 60 90Body height (cm) 130 160 190Impact height (cm) 58 71 84
K. Schindelwig et al.
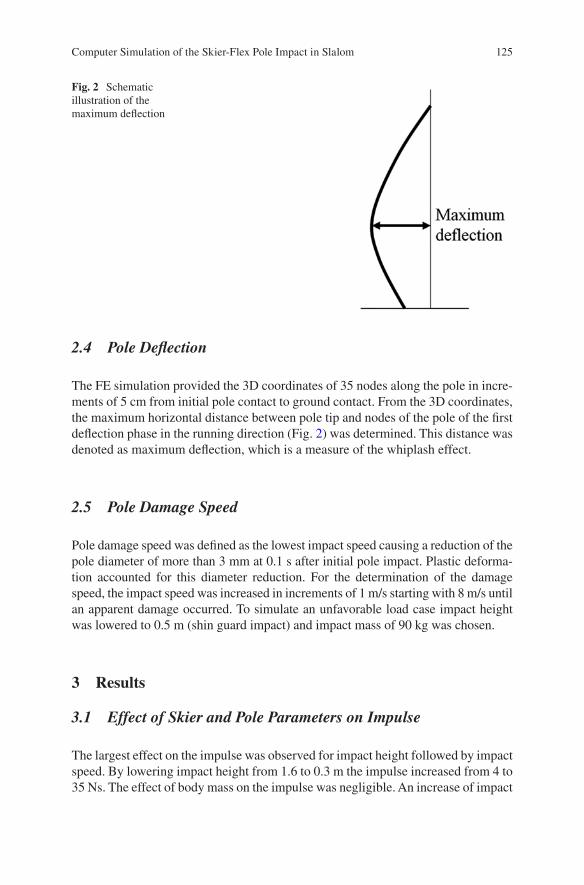
125
2.4 Pole Deflection
The FE simulation provided the 3D coordinates of 35 nodes along the pole in incre-ments of 5 cm from initial pole contact to ground contact. From the 3D coordinates, the maximum horizontal distance between pole tip and nodes of the pole of the first deflection phase in the running direction (Fig. 2) was determined. This distance was denoted as maximum deflection, which is a measure of the whiplash effect.
2.5 Pole Damage Speed
Pole damage speed was defined as the lowest impact speed causing a reduction of the pole diameter of more than 3 mm at 0.1 s after initial pole impact. Plastic deforma-tion accounted for this diameter reduction. For the determination of the damage speed, the impact speed was increased in increments of 1 m/s starting with 8 m/s until an apparent damage occurred. To simulate an unfavorable load case impact height was lowered to 0.5 m (shin guard impact) and impact mass of 90 kg was chosen.
3 Results
3.1 Effect of Skier and Pole Parameters on Impulse
The largest effect on the impulse was observed for impact height followed by impact speed. By lowering impact height from 1.6 to 0.3 m the impulse increased from 4 to 35 Ns. The effect of body mass on the impulse was negligible. An increase of impact
Fig. 2 Schematic illustration of the maximum deflection
Computer Simulation of the Skier-Flex Pole Impact in Slalom
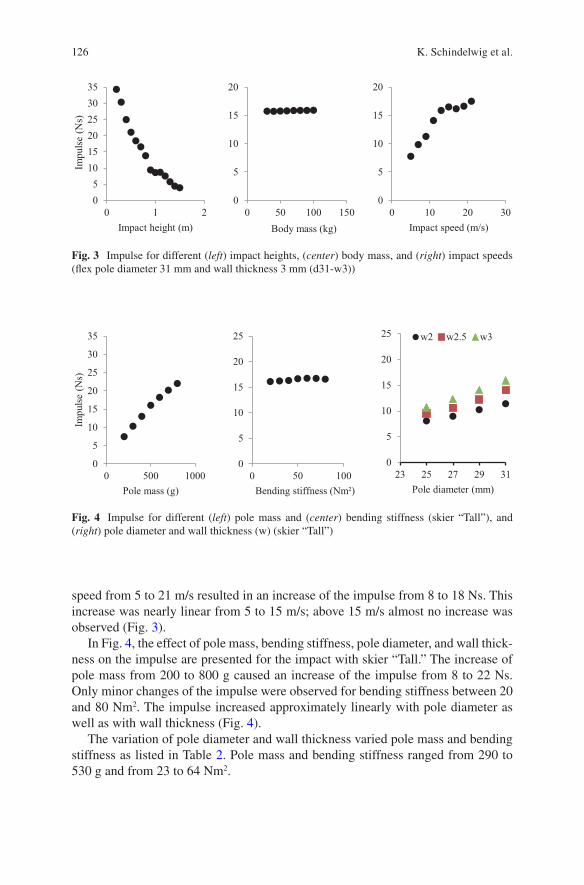
126
speed from 5 to 21 m/s resulted in an increase of the impulse from 8 to 18 Ns. This increase was nearly linear from 5 to 15 m/s; above 15 m/s almost no increase was observed (Fig. 3).
In Fig. 4, the effect of pole mass, bending stiffness, pole diameter, and wall thick-ness on the impulse are presented for the impact with skier “Tall.” The increase of pole mass from 200 to 800 g caused an increase of the impulse from 8 to 22 Ns. Only minor changes of the impulse were observed for bending stiffness between 20 and 80 Nm2. The impulse increased approximately linearly with pole diameter as well as with wall thickness (Fig. 4).
The variation of pole diameter and wall thickness varied pole mass and bending stiffness as listed in Table 2. Pole mass and bending stiffness ranged from 290 to 530 g and from 23 to 64 Nm2.
05
101520253035
0 1 2
Impu
lse (N
s)
Impact height (m)
0
5
10
15
20
0 50 100 150Body mass (kg)
0
5
10
15
20
0 10 20 30Impact speed (m/s)
Fig. 3 Impulse for different (left) impact heights, (center) body mass, and (right) impact speeds (flex pole diameter 31 mm and wall thickness 3 mm (d31-w3))
0
5
10
15
20
25
30
35
0 500 1000
Impu
lse (N
s)
Pole mass (g)
0
5
10
15
20
25
0 50 100Bending stiffness (Nm²)
0
5
10
15
20
25
23 25 27 29 31Pole diameter (mm)
w2 w2.5 w3
Fig. 4 Impulse for different (left) pole mass and (center) bending stiffness (skier “Tall”), and (right) pole diameter and wall thickness (w) (skier “Tall”)
K. Schindelwig et al.
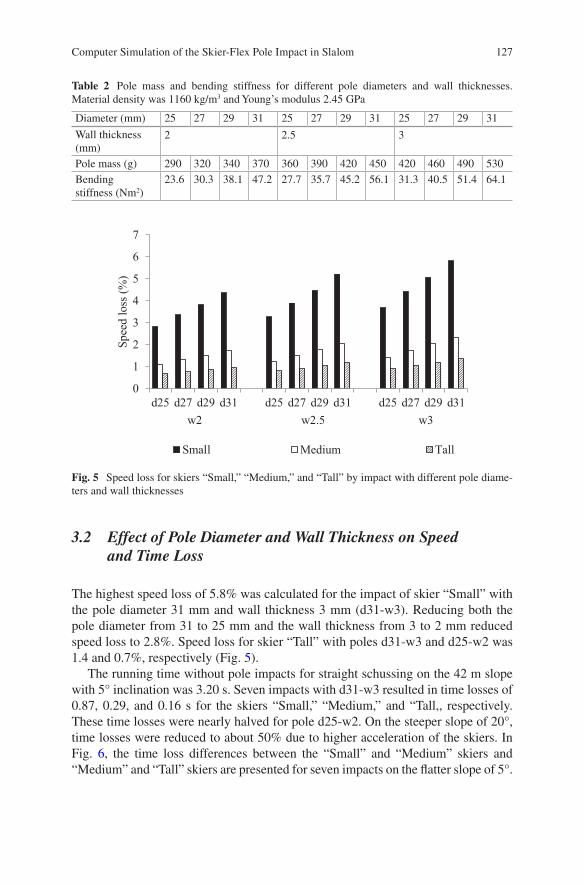
127
3.2 Effect of Pole Diameter and Wall Thickness on Speed and Time Loss
The highest speed loss of 5.8% was calculated for the impact of skier “Small” with the pole diameter 31 mm and wall thickness 3 mm (d31-w3). Reducing both the pole diameter from 31 to 25 mm and the wall thickness from 3 to 2 mm reduced speed loss to 2.8%. Speed loss for skier “Tall” with poles d31-w3 and d25-w2 was 1.4 and 0.7%, respectively (Fig. 5).
The running time without pole impacts for straight schussing on the 42 m slope with 5° inclination was 3.20 s. Seven impacts with d31-w3 resulted in time losses of 0.87, 0.29, and 0.16 s for the skiers “Small,” “Medium,” and “Tall,, respectively. These time losses were nearly halved for pole d25-w2. On the steeper slope of 20°, time losses were reduced to about 50% due to higher acceleration of the skiers. In Fig. 6, the time loss differences between the “Small” and “Medium” skiers and “Medium” and “Tall” skiers are presented for seven impacts on the flatter slope of 5°.
Table 2 Pole mass and bending stiffness for different pole diameters and wall thicknesses. Material density was 1160 kg/m3 and Young’s modulus 2.45 GPa
Diameter (mm) 25 27 29 31 25 27 29 31 25 27 29 31
Wall thickness (mm)
2 2.5 3
Pole mass (g) 290 320 340 370 360 390 420 450 420 460 490 530Bending stiffness (Nm2)
23.6 30.3 38.1 47.2 27.7 35.7 45.2 56.1 31.3 40.5 51.4 64.1
0
1
2
3
4
5
6
7
d25 d27 d29 d31 d25 d27 d29 d31 d25 d27 d29 d31
Spee
d lo
ss (%
)
w2 w2.5 w3
Small Medium Tall
Fig. 5 Speed loss for skiers “Small,” “Medium,” and “Tall” by impact with different pole diame-ters and wall thicknesses
Computer Simulation of the Skier-Flex Pole Impact in Slalom
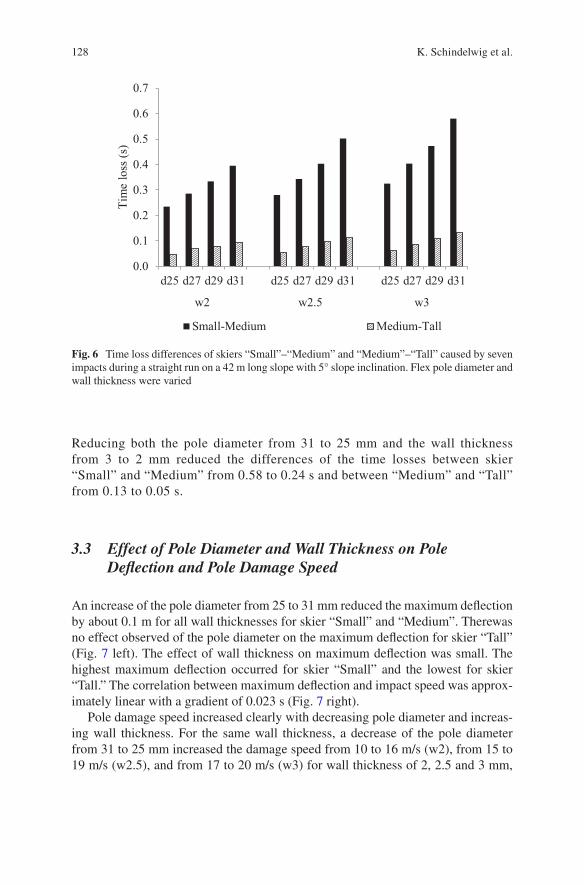
128
Reducing both the pole diameter from 31 to 25 mm and the wall thickness from 3 to 2 mm reduced the differences of the time losses between skier “Small” and “Medium” from 0.58 to 0.24 s and between “Medium” and “Tall” from 0.13 to 0.05 s.
3.3 Effect of Pole Diameter and Wall Thickness on Pole Deflection and Pole Damage Speed
An increase of the pole diameter from 25 to 31 mm reduced the maximum deflection by about 0.1 m for all wall thicknesses for skier “Small” and “Medium”. Therewas no effect observed of the pole diameter on the maximum deflection for skier “Tall” (Fig. 7 left). The effect of wall thickness on maximum deflection was small. The highest maximum deflection occurred for skier “Small” and the lowest for skier “Tall.” The correlation between maximum deflection and impact speed was approx-imately linear with a gradient of 0.023 s (Fig. 7 right).
Pole damage speed increased clearly with decreasing pole diameter and increas-ing wall thickness. For the same wall thickness, a decrease of the pole diameter from 31 to 25 mm increased the damage speed from 10 to 16 m/s (w2), from 15 to 19 m/s (w2.5), and from 17 to 20 m/s (w3) for wall thickness of 2, 2.5 and 3 mm,
0.0
0.1
0.2
0.3
0.4
0.5
0.6
0.7
d25 d27 d29 d31 d25 d27 d29 d31 d25 d27 d29 d31
Tim
e lo
ss (s
)
w2 w2.5 w3
Small-Medium Medium-Tall
Fig. 6 Time loss differences of skiers “Small”–“Medium” and “Medium”–“Tall” caused by seven impacts during a straight run on a 42 m long slope with 5° slope inclination. Flex pole diameter and wall thickness were varied
K. Schindelwig et al.
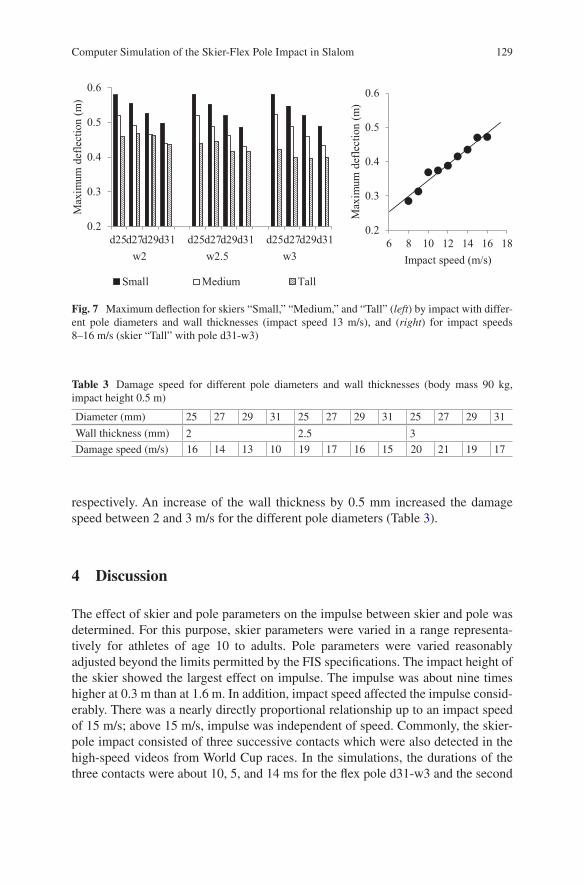
129
respectively. An increase of the wall thickness by 0.5 mm increased the damage speed between 2 and 3 m/s for the different pole diameters (Table 3).
4 Discussion
The effect of skier and pole parameters on the impulse between skier and pole was determined. For this purpose, skier parameters were varied in a range representa-tively for athletes of age 10 to adults. Pole parameters were varied reasonably adjusted beyond the limits permitted by the FIS specifications. The impact height of the skier showed the largest effect on impulse. The impulse was about nine times higher at 0.3 m than at 1.6 m. In addition, impact speed affected the impulse consid-erably. There was a nearly directly proportional relationship up to an impact speed of 15 m/s; above 15 m/s, impulse was independent of speed. Commonly, the skier- pole impact consisted of three successive contacts which were also detected in the high-speed videos from World Cup races. In the simulations, the durations of the three contacts were about 10, 5, and 14 ms for the flex pole d31-w3 and the second
0.2
0.3
0.4
0.5
0.6
d25d27d29d31 d25d27d29d31 d25d27d29d31
Max
imum
def
lect
ion
(m)
w2 w2.5 w3
Small Medium Tall
0.2
0.3
0.4
0.5
0.6
6 8 10 12 14 16 18
Max
imum
def
lect
ion
(m)
Impact speed (m/s)
Fig. 7 Maximum deflection for skiers “Small,” “Medium,” and “Tall” (left) by impact with differ-ent pole diameters and wall thicknesses (impact speed 13 m/s), and (right) for impact speeds 8–16 m/s (skier “Tall” with pole d31-w3)
Table 3 Damage speed for different pole diameters and wall thicknesses (body mass 90 kg, impact height 0.5 m)
Diameter (mm) 25 27 29 31 25 27 29 31 25 27 29 31
Wall thickness (mm) 2 2.5 3Damage speed (m/s) 16 14 13 10 19 17 16 15 20 21 19 17
Computer Simulation of the Skier-Flex Pole Impact in Slalom
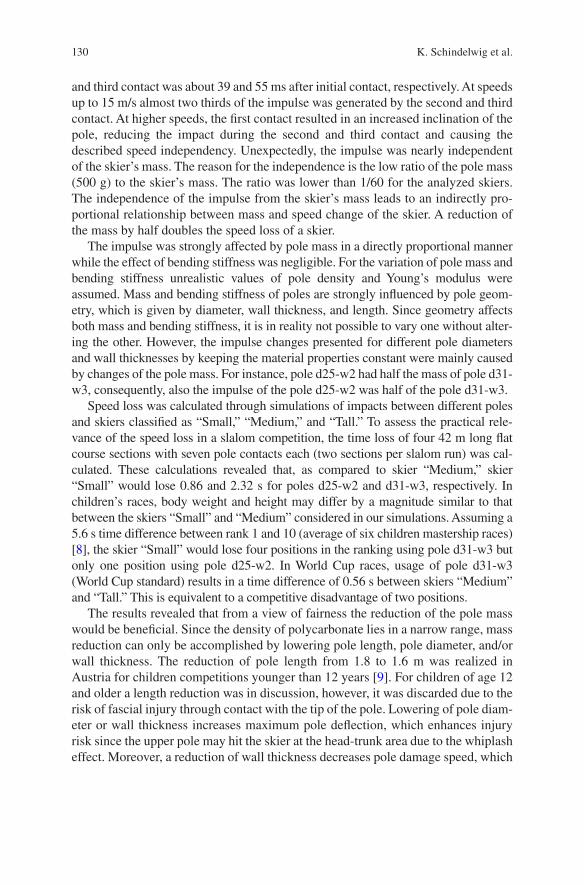
130
and third contact was about 39 and 55 ms after initial contact, respectively. At speeds up to 15 m/s almost two thirds of the impulse was generated by the second and third contact. At higher speeds, the first contact resulted in an increased inclination of the pole, reducing the impact during the second and third contact and causing the described speed independency. Unexpectedly, the impulse was nearly independent of the skier’s mass. The reason for the independence is the low ratio of the pole mass (500 g) to the skier’s mass. The ratio was lower than 1/60 for the analyzed skiers. The independence of the impulse from the skier’s mass leads to an indirectly pro-portional relationship between mass and speed change of the skier. A reduction of the mass by half doubles the speed loss of a skier.
The impulse was strongly affected by pole mass in a directly proportional manner while the effect of bending stiffness was negligible. For the variation of pole mass and bending stiffness unrealistic values of pole density and Young’s modulus were assumed. Mass and bending stiffness of poles are strongly influenced by pole geom-etry, which is given by diameter, wall thickness, and length. Since geometry affects both mass and bending stiffness, it is in reality not possible to vary one without alter-ing the other. However, the impulse changes presented for different pole diameters and wall thicknesses by keeping the material properties constant were mainly caused by changes of the pole mass. For instance, pole d25-w2 had half the mass of pole d31-w3, consequently, also the impulse of the pole d25-w2 was half of the pole d31-w3.
Speed loss was calculated through simulations of impacts between different poles and skiers classified as “Small,” “Medium,” and “Tall.” To assess the practical rele-vance of the speed loss in a slalom competition, the time loss of four 42 m long flat course sections with seven pole contacts each (two sections per slalom run) was cal-culated. These calculations revealed that, as compared to skier “Medium,” skier “Small” would lose 0.86 and 2.32 s for poles d25-w2 and d31-w3, respectively. In children’s races, body weight and height may differ by a magnitude similar to that between the skiers “Small” and “Medium” considered in our simulations. Assuming a 5.6 s time difference between rank 1 and 10 (average of six children mastership races) [8], the skier “Small” would lose four positions in the ranking using pole d31- w3 but only one position using pole d25-w2. In World Cup races, usage of pole d31-w3 (World Cup standard) results in a time difference of 0.56 s between skiers “Medium” and “Tall.” This is equivalent to a competitive disadvantage of two positions.
The results revealed that from a view of fairness the reduction of the pole mass would be beneficial. Since the density of polycarbonate lies in a narrow range, mass reduction can only be accomplished by lowering pole length, pole diameter, and/or wall thickness. The reduction of pole length from 1.8 to 1.6 m was realized in Austria for children competitions younger than 12 years [9]. For children of age 12 and older a length reduction was in discussion, however, it was discarded due to the risk of fascial injury through contact with the tip of the pole. Lowering of pole diam-eter or wall thickness increases maximum pole deflection, which enhances injury risk since the upper pole may hit the skier at the head-trunk area due to the whiplash effect. Moreover, a reduction of wall thickness decreases pole damage speed, which
K. Schindelwig et al.
131
increases the risk of pole fractures. For the current impact speeds in World Cup slalom races, advanced investigations are necessary for lowering the pole mass.
In children and youth races, skiing speed and thus impact speed is clearly lower than in World Cup races resulting in lower skier-pole impulse with lower maximum pole deflection and pole damage speed. Lower speeds permit reducing pole mass by lowering pole diameter and wall thickness. Assuming lower impact speeds of 2 m/s than in World Cup races, pole d27-w2.5 showed the same maximum deflection as the World Cup approved pole d31-w3. Also the difference between impact speed and pole damage speed was the same for both poles. However, time loss would be reduced about 40% in the described seven gate flat course due to the mass reduction.
5 Limitations
In this study, variations of temperature or plasticity of the upright pole were not considered. A yielding movement of the skier at pole contact was not included. The dimension of the impactor was not varied. An impactor with a smaller diameter may reduce damage speed. Pole damage speed was not analyzed for the impact on the snow surface.
Acknowledgments The authors would like to thank the International Ski Federation for its finan-cial support. The computational results presented have been achieved using the HPC infrastructure LEO of the University of Innsbruck.
References
1. The International Ski Federation (FIS) (2014) The international ski competition rules (ICR) Book IV Joint regulations for alpine skiing. http://www.fis-ski.com/mm/Document/docu-mentlibrary/AlpineSkiing/03/29/54/ICR_clean_12082014_Neutral.pdf. Accessed 19 Sep 2016
2. The International Ski Federation (FIS) (2008) FIS specifications for flex poles. http://bmsi.ru/media/75f004dd-d384-4d1f-aa99-0882bff649b3/kip08e.pdf. Accessed 12 Nov 2015
3. Innerhofer G, Nachbauer W (1999) Influence of the skier’s mass and height on clearing slalom gates. Paper presented at the 10th European congress on sports medicine, University of Innsbruck, Innsbruck, 22–24 September 1999
4. Bere T, Flørenes TW, Krosshaug T, Haugen P, Svandal I, Nordsletten L, Bahr R (2013) A sys-tematic video analysis of 69 injury cases in World Cup alpine skiing. Scand J Med Sci Sports 24:667–677
5. Schindelwig K, Ellensohn S, Kaps P, Nachbauer W (2016) Validation of a 3D finite element model for flex pole impacts. JSET (in review)
6. Gall K, Horstemeyer MF, Degner BW, McDowell DL, Fan J (2001) On the driving force for fatigue crack formation from inclusions and voids in a cast A356 aluminum alloy. Int J Fract 108:207
7. Brownlie L, Larose G, D’Auteuil A, Allinger T, Meinert F, Kristofic P, Dugase S, Boyde R, Stephens D (2010) Factors affecting the aerodynamic drag of alpine skiers. Procedia Eng 2:2375–2380
Computer Simulation of the Skier-Flex Pole Impact in Slalom
132
Open Access This chapter is distributed under the terms of the Creative Commons Attribution-Noncommercial 2.5 License (http://creativecommons.org/licenses/by-nc/2.5/) which permits any noncommercial use, distribution, and reproduction in any medium, provided the original author(s) and source are credited.
The images or other third party material in this chapter are included in the work’s Creative Commons license, unless indicated otherwise in the credit line; if such material is not included in the work’s Creative Commons license and the respective action is not permitted by statutory regu-lation, users will need to obtain permission from the license holder to duplicate, adapt or reproduce the material.
8. The International Ski Federation (2016). http://www.fis-ski.com/alpine-skiing/events-and- places/results/. Accessed 13 Apr 2016
9. Austrian Ski Federation (2016). https://www.oesv.at/media/media_vereinsservice/media_wet-tkampfordnungen/OeWO-ALPIN-2015-2016-fuer-Homepage.pdf. Accessed 13 Apr 2016
K. Schindelwig et al.
133© The Author(s) 2017 I.S. Scher et al. (eds.), Snow Sports Trauma and Safety, DOI 10.1007/978-3-319-52755-0_11
Sagittal Plane Helmet Acceleration at Pole Contact of Alpine Ski Racers is Dependent on Slalom Pole Type and Skill Level
Ronald W. Kipp and John G. Seifert
R.W. Kipp (*) United States Ski and Snowboard Association, Park City, UT, USAe-mail: [email protected]
J.G. Seifert Movement Science Laboratory, Montana State University, Bozeman, MT, USA
Abstract A slalom ski racer’s center-of-mass (CoM) has a negative acceleration during a turn. Some of this change in acceleration can be attributed to the physical contact with the pole, and possibly physiological and/or psychological factors of the ski racer. One factor may be the type/size of poles (gates) used to define the race line (route prescribed by competition rules) in slalom. Poles come in a variety of sizes and styles. This study utilized five differing pole types with 12-year-old male and female racers. As a general conclusion, they were faster on the small/shorter poles. They also felt faster, more aggressive, higher level of confidence, and thought their race line was superior on the shorter poles. When looking at the acceleration com-ponent, we divided the skiers into “skilled” and “less skilled.” The two groups dif-fered on direction of acceleration. The discussion lays out mechanical, physiological, psychological, and technique ramifications to interpret this acceleration paradox.
Keywords Ski racers • Slalom • Pole contact • Head injury • Pole design
1 Introduction
1.1 Acceleration
Alpine ski racers ski around poles which are used to describe the race line. Each ski turn creates a situation where there is a negative acceleration of the skier’s center- of- mass (CoM) followed by a period of positive acceleration between turns [1]. To ski fast in slalom, the ski racer skis with their skis close to the pole such that their CoM may actually travel to the inside of the race line. This is a legal passage accord-ing to the rules of the Fédération Internationale de Ski (FIS), the governing body of international ski racing. Racers will contact the long pole hitting, blocking, moving,
134
or clearing it out of the way with their hand and or ski pole, allowing their body to take a shorter path. This pole contact and movement requires about 181 J for each pole clear for a World Cup ski racer which may explain part of their CoM-negative acceleration (R. Reid, personal communication, 2010). This negative acceleration would be amplified for young skiers having less mass.
While ski racers must ski around poles, recreational skiers make turns in volun-tary locations and tempo. For recreational skiers, turning is an opportunity to man-age speed while for the ski racer it is a situation for speed loss to be minimized.
1.2 Poles and Training Aids
Poles are used in alpine ski racing to define the race line for the ski racer. The FIS [2] has specifications for pole dimensions used in international competition, while individual countries determine domestic standards.
Poles have a hinge at the snow level. This hinge was developed to keep the pole from becoming dislodged as ski racers skied increasingly closer to the pole eventu-ally discovering they could just mow down the pole with their hand, ski pole, or shin enabling them to take a shorter and therefore faster path. Standards for the hinge are mandated by the FIS.
The FIS has two categories of poles: Type A; which is for use in any FIS race. They have a shaft diameters from 29 to 32 mm. Type B poles (25–28.9 mm) are for use in any FIS race except World Cup.
Poles vary by their height above the snow surface. All FIS races must employ poles that project a minimum of 1.8 m above the snow surface [3]. In the United States, U16 competitions must also use the 1.8 m poles (FIS A or B). However, slalom poles for U14s must be 152 cm FIS B, while stubby poles are for non-scored events [4].
Young ski racers typically compete with shorter length (137 and 152 cm) and smaller diameter poles (27 vs. 32 mm). In place of poles, props or training aids, such as Whiskers and Heroes, reduce contact while still skiing the intended path. Whiskers are 23 cm brushes and Heroes are 70 cm flexible poles. There are no FIS standards for Whiskers and Heroes (SPM S.P.A., Varese, Italy).
The purpose of this study was to determine if pole type or shaft length had an effect on acceleration. Additionally, would finishing time, and subjective feelings of young ski racers be altered by pole length?
2 Methods
2.1 Subjects
Eighty seven (54 females, 33 males) club level skiers from three different USSA (United States Ski and Snowboard Association) affiliate ski teams participated in the study. Data are presented as average (± standard deviation). Average age was
R.W. Kipp and J.G. Seifert
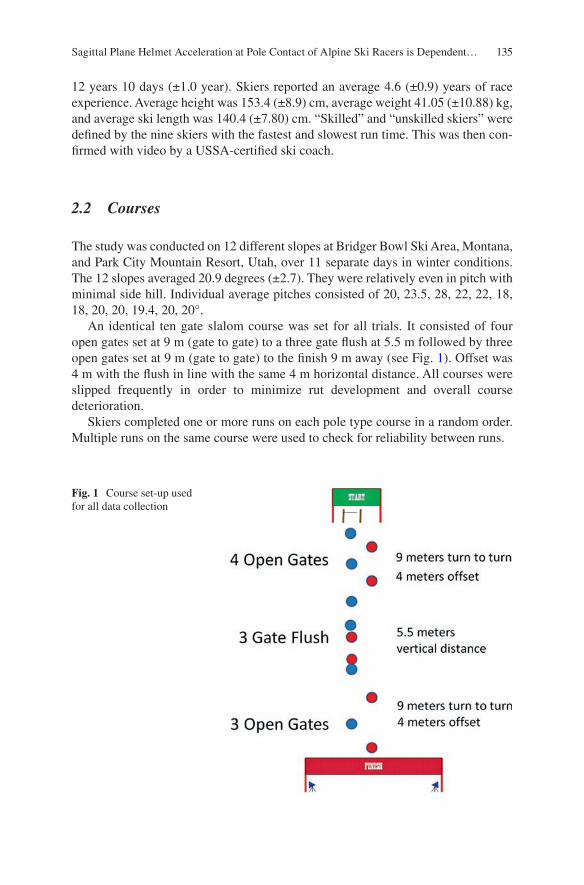
135
12 years 10 days (±1.0 year). Skiers reported an average 4.6 (±0.9) years of race experience. Average height was 153.4 (±8.9) cm, average weight 41.05 (±10.88) kg, and average ski length was 140.4 (±7.80) cm. “Skilled” and “unskilled skiers” were defined by the nine skiers with the fastest and slowest run time. This was then con-firmed with video by a USSA-certified ski coach.
2.2 Courses
The study was conducted on 12 different slopes at Bridger Bowl Ski Area, Montana, and Park City Mountain Resort, Utah, over 11 separate days in winter conditions. The 12 slopes averaged 20.9 degrees (±2.7). They were relatively even in pitch with minimal side hill. Individual average pitches consisted of 20, 23.5, 28, 22, 22, 18, 18, 20, 20, 19.4, 20, 20°.
An identical ten gate slalom course was set for all trials. It consisted of four open gates set at 9 m (gate to gate) to a three gate flush at 5.5 m followed by three open gates set at 9 m (gate to gate) to the finish 9 m away (see Fig. 1). Offset was 4 m with the flush in line with the same 4 m horizontal distance. All courses were slipped frequently in order to minimize rut development and overall course deterioration.
Skiers completed one or more runs on each pole type course in a random order. Multiple runs on the same course were used to check for reliability between runs.
Fig. 1 Course set-up used for all data collection
Sagittal Plane Helmet Acceleration at Pole Contact of Alpine Ski Racers is Dependent…
136
2.2.1 Pole Type Used During Each Testing
• Whiskers: Bright orange and green plastic were alternated in the courses. 23 cm length, with a lightly threaded 20.5 cm base.
• Hero: Red and blue, pliable, rubber-like shaft, 35 mm in diameter and 70 cm long. 86 cm overall length including BrushGrip™ Base.
• 137 cm: 27 mm diameter shaft that is 137 cm off the snow with BrushGrip™ Base.• 152 cm: 27 mm diameter shaft that is 152 cm off the snow with BrushGrip™ Base.• 180 cm: 27 mm diameter shaft that is 180 cm off the snow with BrushGrip™ Base.
All poles, Heroes, and Whiskers were manufactured by SPM and were new at the beginning of the study. Pole hinges showed no sign of deterioration at the end of the study.
2.2.2 Timing
The order in which the courses were skied was randomized for each testing bout.Timing was with a Brower XS Timing System (Salt Lake City, UT, USA).
2.2.3 Acceleration
A gyroscopically controlled three-dimensional accelerometer (Electronic Realization, Bozeman, MT) was attached to the crown of the skier’s helmet. Sagittal plane, the fore/aft direction was defined as “x” the vertical direction as “y” the lat-eral direction as “z”.
2.2.4 Skier Perception
Skier perception immediately at the conclusion of each run was collected. The sub-ject responded to four statements indicating their perception about speed, aggres-siveness, confidence, and line with a 10-point Likert scale.
On that course I felt:
• Slow…fast• Not aggressive…very aggressive• Not confident…very confident• Not a good line…a very good line
The higher the response number, the more positive the skier felt. A single factor ANOVA and post hoc Tukey HSD were used to calculate significance.
R.W. Kipp and J.G. Seifert
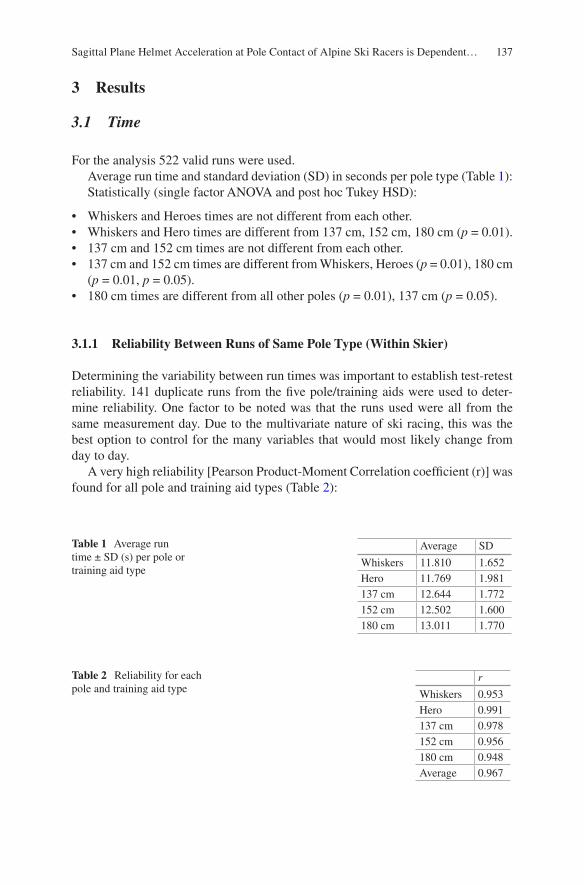
137
3 Results
3.1 Time
For the analysis 522 valid runs were used.Average run time and standard deviation (SD) in seconds per pole type (Table 1):Statistically (single factor ANOVA and post hoc Tukey HSD):
• Whiskers and Heroes times are not different from each other.• Whiskers and Hero times are different from 137 cm, 152 cm, 180 cm (p = 0.01).• 137 cm and 152 cm times are not different from each other.• 137 cm and 152 cm times are different from Whiskers, Heroes (p = 0.01), 180 cm
(p = 0.01, p = 0.05).• 180 cm times are different from all other poles (p = 0.01), 137 cm (p = 0.05).
3.1.1 Reliability Between Runs of Same Pole Type (Within Skier)
Determining the variability between run times was important to establish test-retest reliability. 141 duplicate runs from the five pole/training aids were used to deter-mine reliability. One factor to be noted was that the runs used were all from the same measurement day. Due to the multivariate nature of ski racing, this was the best option to control for the many variables that would most likely change from day to day.
A very high reliability [Pearson Product-Moment Correlation coefficient (r)] was found for all pole and training aid types (Table 2):
Table 1 Average run time ± SD (s) per pole or training aid type
Average SD
Whiskers 11.810 1.652Hero 11.769 1.981137 cm 12.644 1.772152 cm 12.502 1.600180 cm 13.011 1.770
Table 2 Reliability for each pole and training aid type
r
Whiskers 0.953Hero 0.991137 cm 0.978152 cm 0.956180 cm 0.948Average 0.967
Sagittal Plane Helmet Acceleration at Pole Contact of Alpine Ski Racers is Dependent…
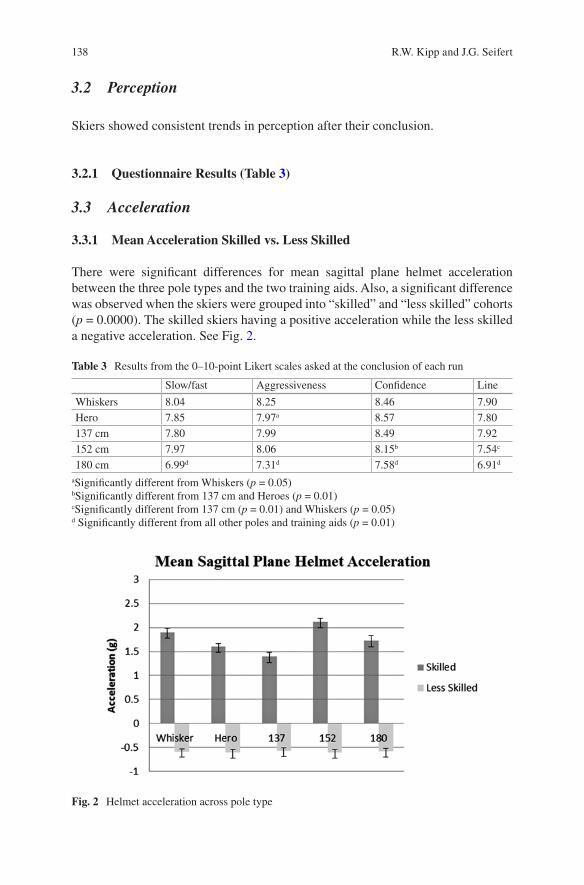
138
3.2 Perception
Skiers showed consistent trends in perception after their conclusion.
3.2.1 Questionnaire Results (Table 3)
3.3 Acceleration
3.3.1 Mean Acceleration Skilled vs. Less Skilled
There were significant differences for mean sagittal plane helmet acceleration between the three pole types and the two training aids. Also, a significant difference was observed when the skiers were grouped into “skilled” and “less skilled” cohorts (p = 0.0000). The skilled skiers having a positive acceleration while the less skilled a negative acceleration. See Fig. 2.
Table 3 Results from the 0–10-point Likert scales asked at the conclusion of each run
Slow/fast Aggressiveness Confidence Line
Whiskers 8.04 8.25 8.46 7.90Hero 7.85 7.97a 8.57 7.80137 cm 7.80 7.99 8.49 7.92152 cm 7.97 8.06 8.15b 7.54c
180 cm 6.99d 7.31d 7.58d 6.91d
aSignificantly different from Whiskers (p = 0.05)bSignificantly different from 137 cm and Heroes (p = 0.01)cSignificantly different from 137 cm (p = 0.01) and Whiskers (p = 0.05)d Significantly different from all other poles and training aids (p = 0.01)
Fig. 2 Helmet acceleration across pole type
R.W. Kipp and J.G. Seifert
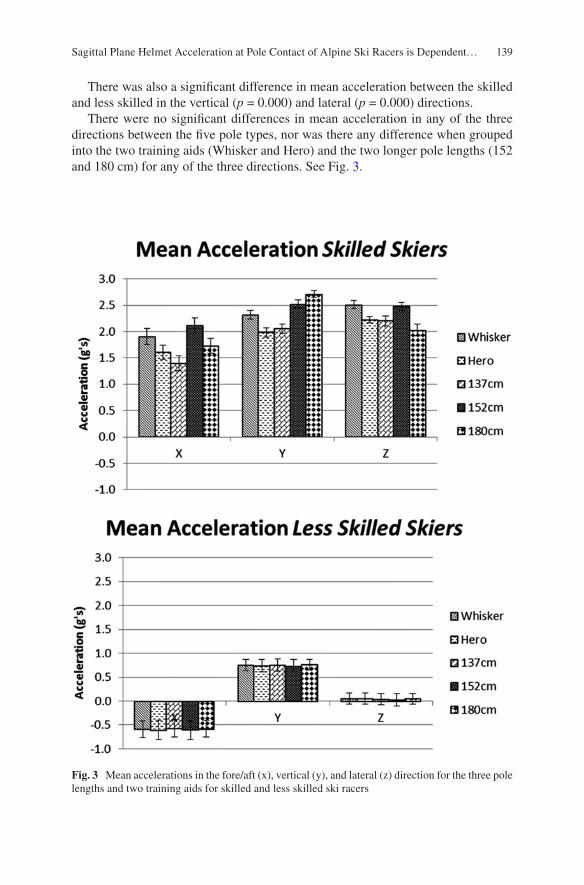
139
There was also a significant difference in mean acceleration between the skilled and less skilled in the vertical (p = 0.000) and lateral (p = 0.000) directions.
There were no significant differences in mean acceleration in any of the three directions between the five pole types, nor was there any difference when grouped into the two training aids (Whisker and Hero) and the two longer pole lengths (152 and 180 cm) for any of the three directions. See Fig. 3.
Fig. 3 Mean accelerations in the fore/aft (x), vertical (y), and lateral (z) direction for the three pole lengths and two training aids for skilled and less skilled ski racers
Sagittal Plane Helmet Acceleration at Pole Contact of Alpine Ski Racers is Dependent…
140
3.4 Peak Acceleration
When averaged over ten consecutive turns there was significant differences for peak acceleration for the skilled group in the z direction (p = 0.03) when the short props were compared to the two long poles, and for the less skilled in the y direction (p = 0.05). When the short props were compared to the two long poles, all other short props vs. tall poles were nonsignificant.
4 Discussion
Three pole types (lengths) and two training aids were selected for this study. The 27 mm shaft diameter was chosen over the 25 mm shaft based upon a previous USSA club questionnaire and US supplier recommendations. The 137 and 152 cm lengths were chosen as they are popular lengths used in the United States for young ski racers, and 180 cm as the FIS standard. Whiskers and Heroes were included as they are popular training choices.
The subjects were very homogenous in age. The control of age was important to eliminate or reduce age as an extraneous variable that could potentially affect the results. The study was conducted over 11 nonconsecutive days on 12 differing slopes. This helped to ensure that the results would be representative to the popula-tion in question.
Acceleration was positive for the skilled skiers and negative for the less skilled skiers across all three pole lengths and the two training aids. The question must be asked, was this difference in acceleration due to the pole length or type, or was it indicative of the skilled behavior?
Did pole type effect time? Whisker and Heroes were the fastest, with the 137 and 152 cm next, followed by 180 cm as the slowest. This time transition from shorter pole to longer pole agrees with intuitive logic and could be based on the mechanical energy dissipation consequence of shaft deformation, shaft acceleration, and hinge resistance, or possibly the influence of pole size on the racer’s psychological state.
The run time of Whiskers and Heroes were not statistically different from one another. Contact with the pole or any line alteration with the Hero did not seem to influence the finish time when compared to the Whiskers. This was confirmed with the skier’s subjective impression giving a similar response (Whisker: 8.04, Hero: 7.85) when asked if they felt “slow” (0) or “very fast” (10). The skiers also report feeling less aggressive on the Hero (7.97) courses than the Whisker (8.25) courses (p = 0.01).
The 137 and 152 cm poles were not significantly different from each other in time. However, they were significantly different from the Whisker, Hero, and 180 cm. While the skier’s time was not statistically different, they did report feeling less confident and less satisfied with their line when skiing the 152 cm pole.
The 180 cm poles elicited the slowest time, which was also the feeling generated from the skiers. The skiers also felt less aggressive and less confident along with less satisfaction with their line.
R.W. Kipp and J.G. Seifert
141
A very high reliability was found for all five pole types (cumulatively r = 0.967). Reliability is an essential component of validity which was essential for this study. Being assured that a run time per pole type was indeed indicative of that pole type was crucial to the interpretation of the results.
4.1 Possible Explanations
There are natural acceleration consequences of a skier center-of-mass during a ski turn. Reid and coworkers have used kinematic data with elite ski racers showing that during a slalom turn, the skier’s CoM goes through a period of negative acceleration that is followed by a period of positive acceleration between turns [1]. The period of negative acceleration starts when the turn is initiated which is before flex pole contact. Recently, Schindelwig and coworkers used finite element analysis to demonstrate the increase in race time due to a longer flex pole in children’s slalom racing [5].
4.1.1 Physical Contact with the Pole
It has been calculated that elite ski racers contacting an FIS A pole will use 45 J for work to deform the pole, 108 J to accelerate the pole, and 28 J to overcome hinge resistance for 181 J of work. This comes out to be about 4% of his kinetic energy (R. Reid, personal communication, 2010). Upon video analysis, the less skilled ski-ers did not necessarily contact the pole.
4.1.2 Anticipatory Postural Control
Racers contact the pole by hitting, blocking, moving, or clearing it out of the way with their hand or ski pole allowing their body to take a shorter path. The action to perform this “clearing” maneuver involves raising the arm which is accomplished with the pectoralis major and anterior fibers of the deltoid. While this is the mecha-nism, a phenomena observed and described by Belen’kii et al. [6] that standing subjects when asked to raise their arm, utilized both their prime movers (arm) and their postural muscles (trunk and legs). The postural muscles innervate 50 ms prior to the prime mover activation. This was in anticipation the upcoming destabilizing effects of the arm movement.
The more skilled ski racers could be anticipating the impact of pole contact with their postural muscles. These could be with the lower body or the neck muscles. In such a case, they are accelerating their upper body in proactive manner intuitively knowing that the pole will have a negative accelerating effect on them. This anticipatory postural adjustment has been shown to be a learned response by Cordo and Nashner [7]. The less skilled ski racers may not have had ample experience to have sufficiently learned this anticipatory postural mechanism and partially explain the resultant negative accel-eration seen in this study.
Sagittal Plane Helmet Acceleration at Pole Contact of Alpine Ski Racers is Dependent…
142
4.1.3 Vestibulo-Ocular Reflex
The vestibulo-ocular reflex (VOR) maintains the visual image during linear and angu-lar head movement. While skiing skill may be thought of as the ability to manipulate the skis in an efficient strategy, there may be an adaptive mechanisms in the central nervous system that is important in maintaining the VOR [8, 9]. This adaptation may be a result of increasing skiing skill or possibly a manifestation of maturity.
VOR motor learning functions to improve motor performance. This occurs via the gain of the VOR or the ratio of eye to head speed and its phase which is the temporal relationship between eye and head movement. Eye movements are oppo-site in direction and approximately equal in speed to the head movement [10]. It could be postulated that the positive acceleration from the skilled skiers at pole contact was an anticipatory learned response knowing that the pole would provide some negative acceleration at contact.
4.1.4 Psychological Factors
One explanation for the positive and negative acceleration at pole contact from the skilled and less skilled can be explained by the novelty of situation. The skilled skier has encountered this situation many times and knows what to expect. The less skilled skier is not as sure what to expect. The less skilled skiers’ negative helmet accelera-tion may be a result of moving away from the pole in a ducking or avoidance response.
4.1.5 Ski Pressure Management
Elite ski racers strive to pressure their skis while they are in the fall-line or in the part of the turn that is pointed down the hill. Less skilled ski racers and recreational skiers that are striving for speed control as opposed to speed conservation will have pressure later in the turn. This type of turn will not accelerate in the turn but con-stantly show a negative acceleration throughout the turn.
4.1.6 Movement Decision Under Risk
Alpine skiing can be perceived as a risky endeavor. The skier skill level can lead to behavior that is based on risk avoidance or risk-seeking objectives [11, 12]. A risk avoidance situation can be postulated from the less skilled ski racers that will have greater variability in most aspects of their skiing technique suggesting increased instability [13]. Some of the negative acceleration seen in this study could be expli-cated by the risk perception that occurs during the middle of the turn when the skis are pointed at their most down the hill attitude and coinciding with a possible pole contact. Both could be assumed to be a “risky” moment in time.
R.W. Kipp and J.G. Seifert
143
4.2 What Does It Mean for Safety?
There are many ways to become injured skiing. The most obvious is losing some level of control of the skis. When injury does happen, there is a 50% chance it is to the lower extremity, which today usually means an ACL injury [14, 15]. Most of the ACL injuries among recreational skiers are reported to occur during falling [16, 17]. The three mechanisms of ACL injury all involve falling either in a backward or a forward direction. [18]. Specifically, the “phantom-foot,” “boot-induced anterior drawer,” “slip-catch,” “landing back-weighted,” and the “dynamic snowplow” mechanisms all have the skier falling backwards while the “valgus-external rota-tion” the skier falls forward. This is different from the mechanisms for other sports, such as American football, basketball, and soccer. In these activities, the foot is in firm contact with the ground and usually results in deceleration, change-of-direc-tion, or some sort of direct blow. In skiing, the skis are constantly sliding forward while not in contact with the ground. This forward motion constantly challenges the skier to maintain control of their fore/aft relationship.
Fore/aft balance has always been a nemesis to the skier. The importance to rec-reational skiers is that the Professional Ski Instructor’s of American lists “control-ling the relationship of the center-of-mass to the base of support to direct pressure along the length of the skis” as one of their five Fundamentals of Skiing [19]. And among elite ski racers, fore/aft movement has been found to be correlated with speed in a race course [20, 21].
While it would be inappropriate to suggest that having superior fore/aft balance would lead to greater control, and therefore greater safety, it would conversely be irresponsible to overlook the relevancy and connection between sagittal plane con-trol and the possible association with safety.
Acknowledgements World Cup Supply, VT, USA for supplying new SPM poles, Whiskers, and Heroes. Skiers and coaches from the Park City Ski Team, Summit Ski Team, and Bridger Ski Foundation for their help and participation.
References
1. Reid R, Gilgien M, Moger T et al (2009) Turn characteristics and energy dissipation in slalom. In: Müller E et al (eds) Science and Skiing IV. Meyer & Meyer Sport, Oxford, pp 419–429
2. FIS international ski competition rules book IV joint regulations for alpine skiing (2016) International Ski Federation FIS. Oberhofen, Switzerland
3. The International Ski Competition Rules (ICR) (2012) International Ski Federation FIS. Oberhofen, Switzerland
4. 2016 USSA Alpine Competition Guide (2015) U. S. Ski and Snowboard Association. Park City, UT
5. Schindelwig K, Kaps P, Nachbauer W (2015) Short and thin walled flex poles for children slalom race. In: Petrone N, Marcolin G (eds) 21st International Congress on Ski Trauma and Skiing Safety Book of Abstract, p 97
Sagittal Plane Helmet Acceleration at Pole Contact of Alpine Ski Racers is Dependent…
144
6. Belen’kii VY, Gurfinkel VS, Paltsev YI (1967) Elements of control of voluntary movements. Biofizika 12:135–141
7. Cordo P, Nashner L (1982) Properties of postural adjustments associated with rapid arm move-ments. J Neurophysiol 47:287–302
8. Page GD, Telford L, Seidman SH et al (1998) Human vestibuloocular reflex and its interac-tions with vision and fixation distance during linear and angular head movement. J Neurophysiol 80:2391–2404
9. Peterka RJ, Black FO, Schoenhoff MB (1990) Age-related changes in human vestibulo-ocular reflexes: sinusoidal rotation and caloric tests. J Vestib Res 1(1):49–59
10. Broussard DM, Kassardjian CD (2004) Learning in a simple motor system. Learn Mem 11:127–136
11. O’Brien MK, Ahmed AA (2016) Rationality in human movement. Exerc Sport Sci Rev 44(1):20–28
12. Pienciak-Siewert A, Barletta AJ, Ahmed AA (2013) Transfer of postural adaptation depends on context of prior exposure. J Neurophysiol 111:1466–1478
13. Manista GC, Ahmed AA (2012) Stability limits modulate whole-body learning. J Neurophysiol 107:1952–1961
14. Ekeland A, Rødven A (2009) Injury trends in Norwegian ski resorts in the 10 year period 1996–2006. In: Johnson RJ (ed) Skiing trauma and safety: 17th volume, ASTM STP 1510. American Society for Testing and Materials, West Conshohocken, PA, pp 31–38
15. Johnson RJ, Ettlinger CF, Shealy JE (2009) Updates on injury trends in alpine skiing. In: Johnson RJ, Shealy JE, Langran M (eds) Skiing trauma and safety: 17th volume. American Society for Testing and Materials, West Conshohocken, PA, pp 11–22
16. Fischer JF, Leyvraz PF, Bally A (1994) A dynamic analysis of knee ligament injuries in alpine skiing. Acta Orthop Belg 60:194–203
17. Ruedl G, Linortner I, Schranz A et al (2009) Distribution of injury mechanisms and related factors in ACL-injured female carving skiers. Knee Surg Sports Traumatol Arthrosc 17:1393–1398
18. Bare T (2011) Mechanisms of anterior cruciate ligament injury in world cup alpine skiing: a systematic video analysis of 20 cases. Am J Sports Med 39:1421–1429
19. PSIA Alpine Certification Standards (2014) ASEA and ASEA-EF. Lakewood CO 20. Kipp RW, Reid RC, Gilgien M et al (2008) Slalom performance in élite alpine ski racing can
be predicted by fore/aft movement dynamics. Med Sci Sports Exerc 40(5):S1246 21. Kipp RW, Reid RC, Gilgien M et al (2009) Fore/aft movement is adapted to gate separation by
elite alpine racers in slalom. In: 14th Annual Congress of the European College of Sports Science Book of Abstracts. Oslo, Norway, p 171
Open Access This chapter is distributed under the terms of the Creative Commons Attribution-Noncommercial 2.5 License (http://creativecommons.org/licenses/by-nc/2.5/) which permits any noncommercial use, distribution, and reproduction in any medium, provided the original author(s) and source are credited.
The images or other third party material in this chapter are included in the work’s Creative Commons license, unless indicated otherwise in the credit line; if such material is not included in the work’s Creative Commons license and the respective action is not permitted by statutory regu-lation, users will need to obtain permission from the license holder to duplicate, adapt or reproduce the material.
R.W. Kipp and J.G. Seifert
145© The Author(s) 2017 I.S. Scher et al. (eds.), Snow Sports Trauma and Safety, DOI 10.1007/978-3-319-52755-0_12
Auxetic Foam for Snow-Sport Safety Devices
Tom Allen, Olly Duncan, Leon Foster, Terry Senior, Davide Zampieri, Victor Edeh, and Andrew Alderson
Abstract Skiing and snowboarding are popular snow-sports with inherent risk of injury. There is potential to reduce the prevalence of injuries by improving and implementing snow-sport safety devices with the application of advanced materials. This chapter investigates the application of auxetic foam to snow-sport safety devices. Composite pads—consisting of foam covered with a semi-rigid shell—were investi-gated as a simple model of body armour and a large 70 × 355 × 355 mm auxetic foam sample was fabricated as an example crash barrier. The thermo- mechanical conversion process was applied to convert open-cell polyurethane foam to auxetic foam. The composite pad with auxetic foam absorbed around three times more energy than the conventional equivalent under quasi-static compression with a concentrated load, indicating potential for body armour applications. An adapted thermo-mechanical process—utilising through-thickness rods to control in-plane compression—was applied to fabricate the large sample with relatively consistent properties throughout, indicating further potential for fabrication of a full size auxetic crash barrier. Further work will create full size prototypes of snow-sport safety devices with comparative testing against current products.
Keywords Skiing • Padding • Impact protection • Snowboarding • Material
1 Introduction
Alpine skiing and snowboarding are popular Winter Olympic Sports. Worldwide participation numbers are hard to predict, but there are an estimated 115 to 200 mil-lion skiers [1, 2] and 10 to 15 million snowboarders [3–5]. Despite the popularity of snow-sports, there are inherent risks of injury, and even death. Snowboarders are at
T. Allen (*) Manchester Metropolitan University, Manchester, UKe-mail: [email protected]
O. Duncan • L. Foster • T. Senior • D. Zampieri • V. Edeh • A. AldersonSheffield Hallam University, Sheffield, UKe-mail: [email protected]
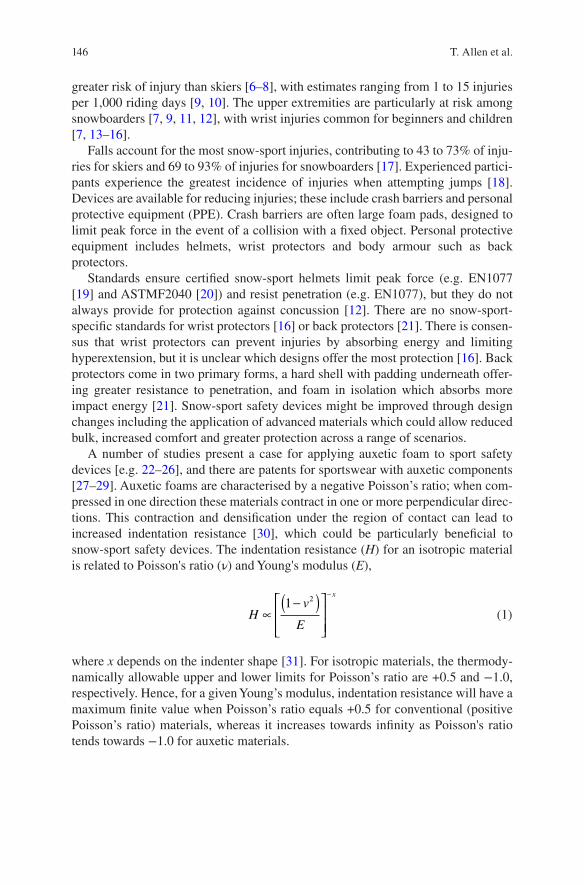
146
greater risk of injury than skiers [6–8], with estimates ranging from 1 to 15 injuries per 1,000 riding days [9, 10]. The upper extremities are particularly at risk among snowboarders [7, 9, 11, 12], with wrist injuries common for beginners and children [7, 13–16].
Falls account for the most snow-sport injuries, contributing to 43 to 73% of inju-ries for skiers and 69 to 93% of injuries for snowboarders [17]. Experienced partici-pants experience the greatest incidence of injuries when attempting jumps [18]. Devices are available for reducing injuries; these include crash barriers and personal protective equipment (PPE). Crash barriers are often large foam pads, designed to limit peak force in the event of a collision with a fixed object. Personal protective equipment includes helmets, wrist protectors and body armour such as back protectors.
Standards ensure certified snow-sport helmets limit peak force (e.g. EN1077 [19] and ASTMF2040 [20]) and resist penetration (e.g. EN1077), but they do not always provide for protection against concussion [12]. There are no snow-sport- specific standards for wrist protectors [16] or back protectors [21]. There is consen-sus that wrist protectors can prevent injuries by absorbing energy and limiting hyperextension, but it is unclear which designs offer the most protection [16]. Back protectors come in two primary forms, a hard shell with padding underneath offer-ing greater resistance to penetration, and foam in isolation which absorbs more impact energy [21]. Snow-sport safety devices might be improved through design changes including the application of advanced materials which could allow reduced bulk, increased comfort and greater protection across a range of scenarios.
A number of studies present a case for applying auxetic foam to sport safety devices [e.g. 22–26], and there are patents for sportswear with auxetic components [27–29]. Auxetic foams are characterised by a negative Poisson’s ratio; when com-pressed in one direction these materials contract in one or more perpendicular direc-tions. This contraction and densification under the region of contact can lead to increased indentation resistance [30], which could be particularly beneficial to snow-sport safety devices. The indentation resistance (H) for an isotropic material is related to Poisson's ratio (ν) and Young's modulus (E),
Hv
E
x
∝−( )
−1 2
(1)
where x depends on the indenter shape [31]. For isotropic materials, the thermody-namically allowable upper and lower limits for Poisson’s ratio are +0.5 and −1.0, respectively. Hence, for a given Young’s modulus, indentation resistance will have a maximum finite value when Poisson’s ratio equals +0.5 for conventional (positive Poisson’s ratio) materials, whereas it increases towards infinity as Poisson's ratio tends towards −1.0 for auxetic materials.
T. Allen et al.
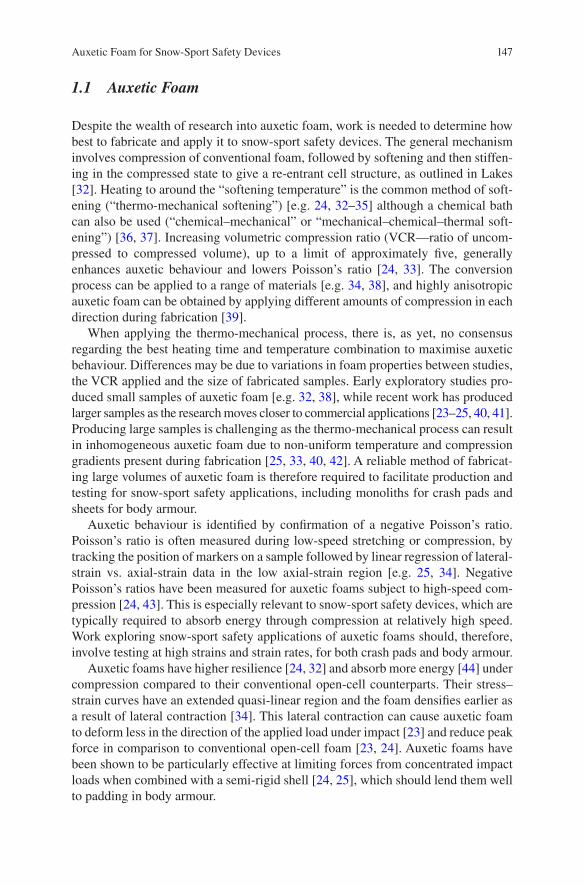
147
1.1 Auxetic Foam
Despite the wealth of research into auxetic foam, work is needed to determine how best to fabricate and apply it to snow-sport safety devices. The general mechanism involves compression of conventional foam, followed by softening and then stiffen-ing in the compressed state to give a re-entrant cell structure, as outlined in Lakes [32]. Heating to around the “softening temperature” is the common method of soft-ening (“thermo-mechanical softening”) [e.g. 24, 32–35] although a chemical bath can also be used (“chemical–mechanical” or “mechanical–chemical–thermal soft-ening”) [36, 37]. Increasing volumetric compression ratio (VCR—ratio of uncom-pressed to compressed volume), up to a limit of approximately five, generally enhances auxetic behaviour and lowers Poisson’s ratio [24, 33]. The conversion process can be applied to a range of materials [e.g. 34, 38], and highly anisotropic auxetic foam can be obtained by applying different amounts of compression in each direction during fabrication [39].
When applying the thermo-mechanical process, there is, as yet, no consensus regarding the best heating time and temperature combination to maximise auxetic behaviour. Differences may be due to variations in foam properties between studies, the VCR applied and the size of fabricated samples. Early exploratory studies pro-duced small samples of auxetic foam [e.g. 32, 38], while recent work has produced larger samples as the research moves closer to commercial applications [23–25, 40, 41]. Producing large samples is challenging as the thermo-mechanical process can result in inhomogeneous auxetic foam due to non-uniform temperature and compression gradients present during fabrication [25, 33, 40, 42]. A reliable method of fabricat-ing large volumes of auxetic foam is therefore required to facilitate production and testing for snow-sport safety applications, including monoliths for crash pads and sheets for body armour.
Auxetic behaviour is identified by confirmation of a negative Poisson’s ratio. Poisson’s ratio is often measured during low-speed stretching or compression, by tracking the position of markers on a sample followed by linear regression of lateral- strain vs. axial-strain data in the low axial-strain region [e.g. 25, 34]. Negative Poisson’s ratios have been measured for auxetic foams subject to high-speed com-pression [24, 43]. This is especially relevant to snow-sport safety devices, which are typically required to absorb energy through compression at relatively high speed. Work exploring snow-sport safety applications of auxetic foams should, therefore, involve testing at high strains and strain rates, for both crash pads and body armour.
Auxetic foams have higher resilience [24, 32] and absorb more energy [44] under compression compared to their conventional open-cell counterparts. Their stress–strain curves have an extended quasi-linear region and the foam densifies earlier as a result of lateral contraction [34]. This lateral contraction can cause auxetic foam to deform less in the direction of the applied load under impact [23] and reduce peak force in comparison to conventional open-cell foam [23, 24]. Auxetic foams have been shown to be particularly effective at limiting forces from concentrated impact loads when combined with a semi-rigid shell [24, 25], which should lend them well to padding in body armour.
Auxetic Foam for Snow-Sport Safety Devices
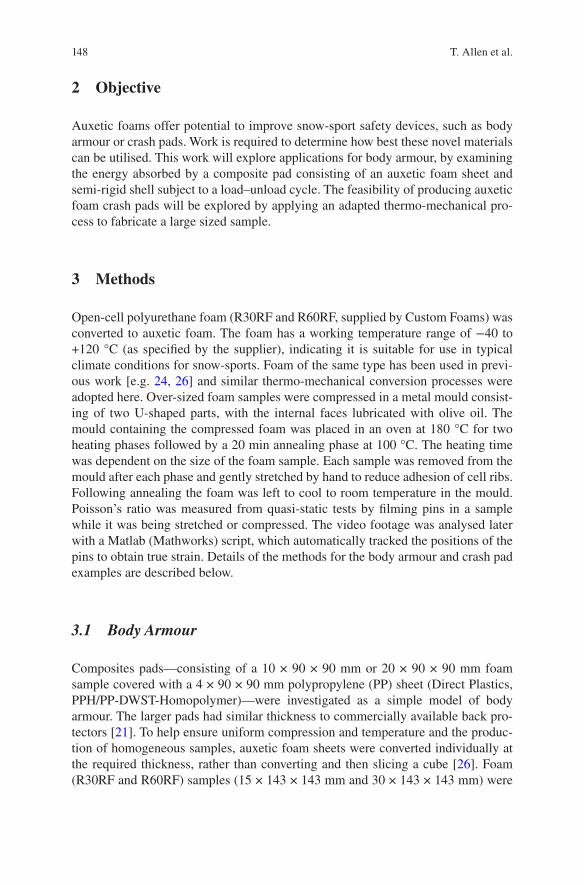
148
2 Objective
Auxetic foams offer potential to improve snow-sport safety devices, such as body armour or crash pads. Work is required to determine how best these novel materials can be utilised. This work will explore applications for body armour, by examining the energy absorbed by a composite pad consisting of an auxetic foam sheet and semi-rigid shell subject to a load–unload cycle. The feasibility of producing auxetic foam crash pads will be explored by applying an adapted thermo-mechanical pro-cess to fabricate a large sized sample.
3 Methods
Open-cell polyurethane foam (R30RF and R60RF, supplied by Custom Foams) was converted to auxetic foam. The foam has a working temperature range of −40 to +120 °C (as specified by the supplier), indicating it is suitable for use in typical climate conditions for snow-sports. Foam of the same type has been used in previ-ous work [e.g. 24, 26] and similar thermo-mechanical conversion processes were adopted here. Over-sized foam samples were compressed in a metal mould consist-ing of two U-shaped parts, with the internal faces lubricated with olive oil. The mould containing the compressed foam was placed in an oven at 180 °C for two heating phases followed by a 20 min annealing phase at 100 °C. The heating time was dependent on the size of the foam sample. Each sample was removed from the mould after each phase and gently stretched by hand to reduce adhesion of cell ribs. Following annealing the foam was left to cool to room temperature in the mould. Poisson’s ratio was measured from quasi-static tests by filming pins in a sample while it was being stretched or compressed. The video footage was analysed later with a Matlab (Mathworks) script, which automatically tracked the positions of the pins to obtain true strain. Details of the methods for the body armour and crash pad examples are described below.
3.1 Body Armour
Composites pads—consisting of a 10 × 90 × 90 mm or 20 × 90 × 90 mm foam sample covered with a 4 × 90 × 90 mm polypropylene (PP) sheet (Direct Plastics, PPH/PP-DWST-Homopolymer)—were investigated as a simple model of body armour. The larger pads had similar thickness to commercially available back pro-tectors [21]. To help ensure uniform compression and temperature and the produc-tion of homogeneous samples, auxetic foam sheets were converted individually at the required thickness, rather than converting and then slicing a cube [26]. Foam (R30RF and R60RF) samples (15 × 143 × 143 mm and 30 × 143 × 143 mm) were
T. Allen et al.
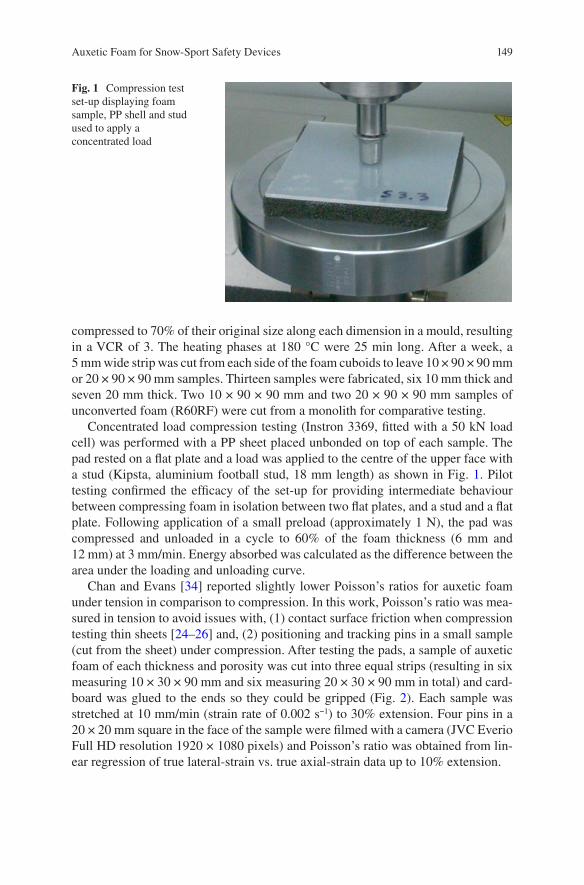
149
compressed to 70% of their original size along each dimension in a mould, resulting in a VCR of 3. The heating phases at 180 °C were 25 min long. After a week, a 5 mm wide strip was cut from each side of the foam cuboids to leave 10 × 90 × 90 mm or 20 × 90 × 90 mm samples. Thirteen samples were fabricated, six 10 mm thick and seven 20 mm thick. Two 10 × 90 × 90 mm and two 20 × 90 × 90 mm samples of unconverted foam (R60RF) were cut from a monolith for comparative testing.
Concentrated load compression testing (Instron 3369, fitted with a 50 kN load cell) was performed with a PP sheet placed unbonded on top of each sample. The pad rested on a flat plate and a load was applied to the centre of the upper face with a stud (Kipsta, aluminium football stud, 18 mm length) as shown in Fig. 1. Pilot testing confirmed the efficacy of the set-up for providing intermediate behaviour between compressing foam in isolation between two flat plates, and a stud and a flat plate. Following application of a small preload (approximately 1 N), the pad was compressed and unloaded in a cycle to 60% of the foam thickness (6 mm and 12 mm) at 3 mm/min. Energy absorbed was calculated as the difference between the area under the loading and unloading curve.
Chan and Evans [34] reported slightly lower Poisson’s ratios for auxetic foam under tension in comparison to compression. In this work, Poisson’s ratio was mea-sured in tension to avoid issues with, (1) contact surface friction when compression testing thin sheets [24–26] and, (2) positioning and tracking pins in a small sample (cut from the sheet) under compression. After testing the pads, a sample of auxetic foam of each thickness and porosity was cut into three equal strips (resulting in six measuring 10 × 30 × 90 mm and six measuring 20 × 30 × 90 mm in total) and card-board was glued to the ends so they could be gripped (Fig. 2). Each sample was stretched at 10 mm/min (strain rate of 0.002 s−1) to 30% extension. Four pins in a 20 × 20 mm square in the face of the sample were filmed with a camera (JVC Everio Full HD resolution 1920 × 1080 pixels) and Poisson’s ratio was obtained from lin-ear regression of true lateral-strain vs. true axial-strain data up to 10% extension.
Fig. 1 Compression test set-up displaying foam sample, PP shell and stud used to apply a concentrated load
Auxetic Foam for Snow-Sport Safety Devices
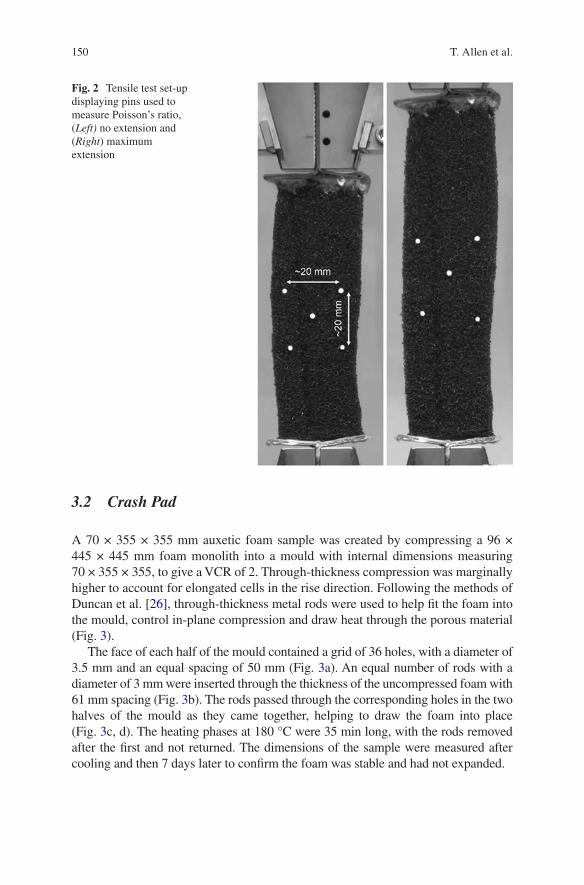
150
3.2 Crash Pad
A 70 × 355 × 355 mm auxetic foam sample was created by compressing a 96 × 445 × 445 mm foam monolith into a mould with internal dimensions measuring 70 × 355 × 355, to give a VCR of 2. Through-thickness compression was marginally higher to account for elongated cells in the rise direction. Following the methods of Duncan et al. [26], through-thickness metal rods were used to help fit the foam into the mould, control in-plane compression and draw heat through the porous material (Fig. 3).
The face of each half of the mould contained a grid of 36 holes, with a diameter of 3.5 mm and an equal spacing of 50 mm (Fig. 3a). An equal number of rods with a diameter of 3 mm were inserted through the thickness of the uncompressed foam with 61 mm spacing (Fig. 3b). The rods passed through the corresponding holes in the two halves of the mould as they came together, helping to draw the foam into place (Fig. 3c, d). The heating phases at 180 °C were 35 min long, with the rods removed after the first and not returned. The dimensions of the sample were measured after cooling and then 7 days later to confirm the foam was stable and had not expanded.
Fig. 2 Tensile test set-up displaying pins used to measure Poisson’s ratio, (Left) no extension and (Right) maximum extension
T. Allen et al.
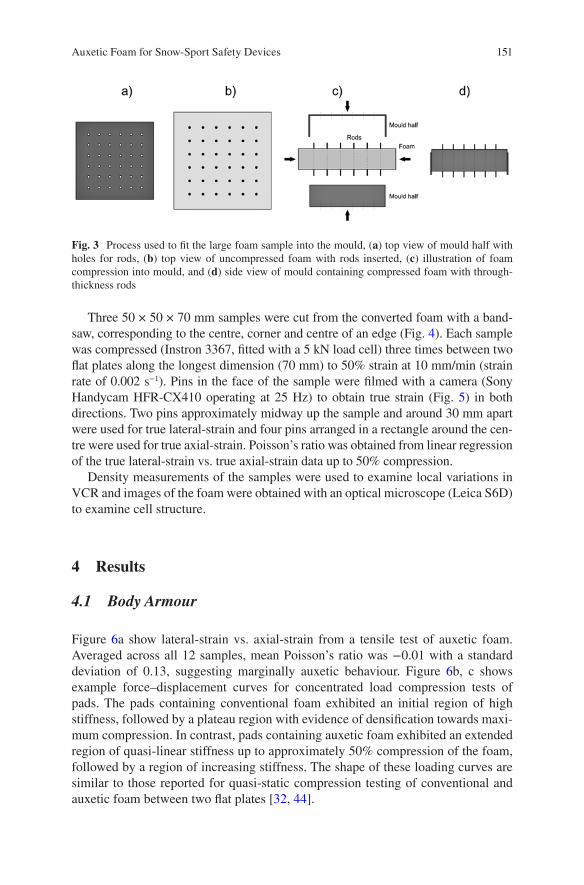
151
Three 50 × 50 × 70 mm samples were cut from the converted foam with a band-saw, corresponding to the centre, corner and centre of an edge (Fig. 4). Each sample was compressed (Instron 3367, fitted with a 5 kN load cell) three times between two flat plates along the longest dimension (70 mm) to 50% strain at 10 mm/min (strain rate of 0.002 s−1). Pins in the face of the sample were filmed with a camera (Sony Handycam HFR-CX410 operating at 25 Hz) to obtain true strain (Fig. 5) in both directions. Two pins approximately midway up the sample and around 30 mm apart were used for true lateral-strain and four pins arranged in a rectangle around the cen-tre were used for true axial-strain. Poisson’s ratio was obtained from linear regression of the true lateral-strain vs. true axial-strain data up to 50% compression.
Density measurements of the samples were used to examine local variations in VCR and images of the foam were obtained with an optical microscope (Leica S6D) to examine cell structure.
4 Results
4.1 Body Armour
Figure 6a show lateral-strain vs. axial-strain from a tensile test of auxetic foam. Averaged across all 12 samples, mean Poisson’s ratio was −0.01 with a standard deviation of 0.13, suggesting marginally auxetic behaviour. Figure 6b, c shows example force–displacement curves for concentrated load compression tests of pads. The pads containing conventional foam exhibited an initial region of high stiffness, followed by a plateau region with evidence of densification towards maxi-mum compression. In contrast, pads containing auxetic foam exhibited an extended region of quasi-linear stiffness up to approximately 50% compression of the foam, followed by a region of increasing stiffness. The shape of these loading curves are similar to those reported for quasi-static compression testing of conventional and auxetic foam between two flat plates [32, 44].
Fig. 3 Process used to fit the large foam sample into the mould, (a) top view of mould half with holes for rods, (b) top view of uncompressed foam with rods inserted, (c) illustration of foam compression into mould, and (d) side view of mould containing compressed foam with through- thickness rods
Auxetic Foam for Snow-Sport Safety Devices
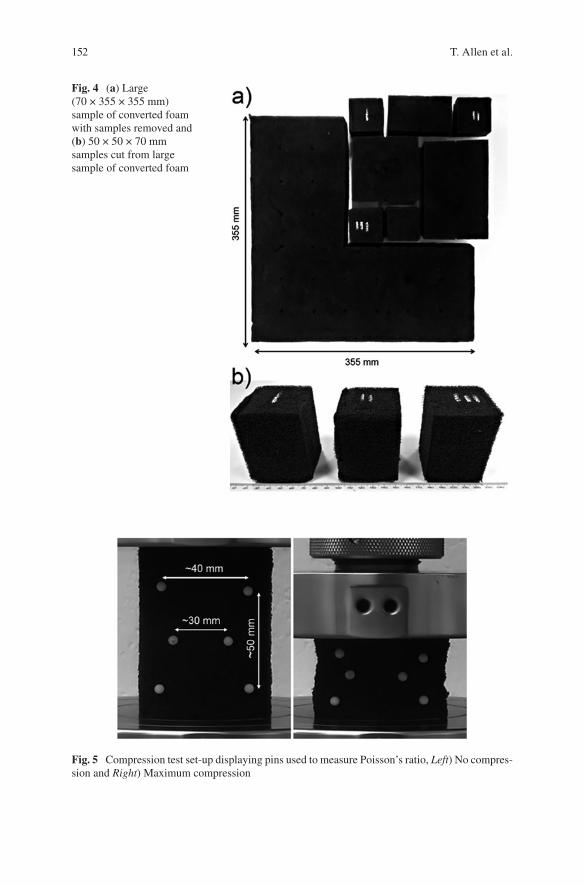
152
Fig. 4 (a) Large (70 × 355 × 355 mm) sample of converted foam with samples removed and (b) 50 × 50 × 70 mm samples cut from large sample of converted foam
Fig. 5 Compression test set-up displaying pins used to measure Poisson’s ratio, Left) No compres-sion and Right) Maximum compression
T. Allen et al.
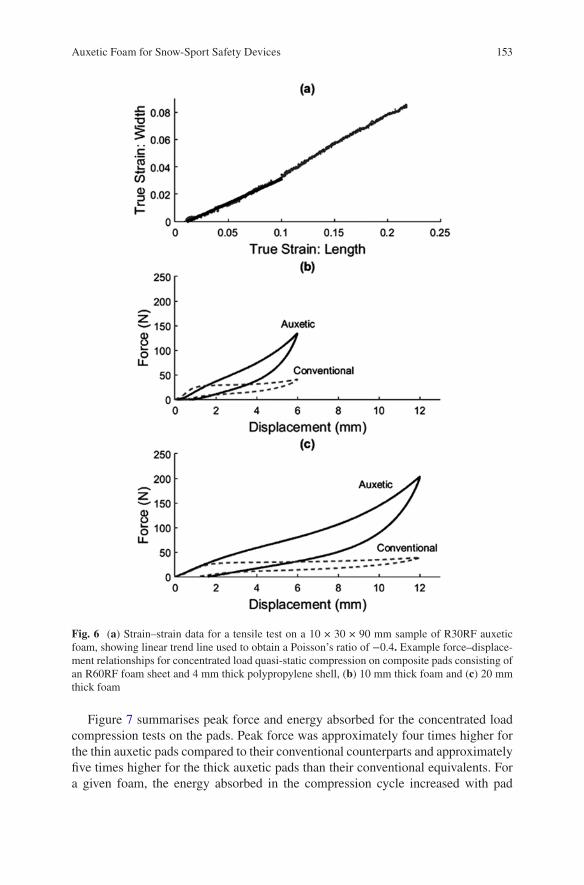
153
Figure 7 summarises peak force and energy absorbed for the concentrated load compression tests on the pads. Peak force was approximately four times higher for the thin auxetic pads compared to their conventional counterparts and approximately five times higher for the thick auxetic pads than their conventional equivalents. For a given foam, the energy absorbed in the compression cycle increased with pad
Fig. 6 (a) Strain–strain data for a tensile test on a 10 × 30 × 90 mm sample of R30RF auxetic foam, showing linear trend line used to obtain a Poisson’s ratio of −0.4. Example force–displace-ment relationships for concentrated load quasi-static compression on composite pads consisting of an R60RF foam sheet and 4 mm thick polypropylene shell, (b) 10 mm thick foam and (c) 20 mm thick foam
Auxetic Foam for Snow-Sport Safety Devices
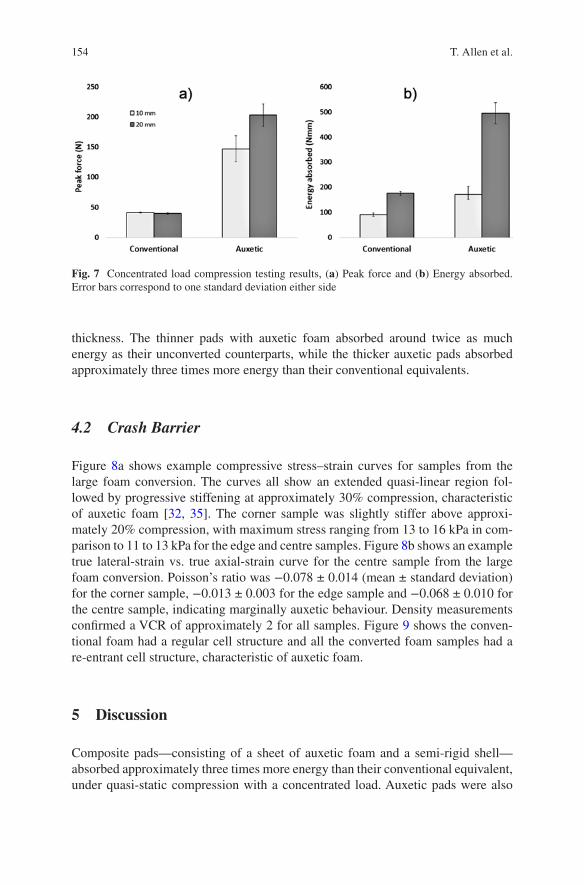
154
thickness. The thinner pads with auxetic foam absorbed around twice as much energy as their unconverted counterparts, while the thicker auxetic pads absorbed approximately three times more energy than their conventional equivalents.
4.2 Crash Barrier
Figure 8a shows example compressive stress–strain curves for samples from the large foam conversion. The curves all show an extended quasi-linear region fol-lowed by progressive stiffening at approximately 30% compression, characteristic of auxetic foam [32, 35]. The corner sample was slightly stiffer above approxi-mately 20% compression, with maximum stress ranging from 13 to 16 kPa in com-parison to 11 to 13 kPa for the edge and centre samples. Figure 8b shows an example true lateral-strain vs. true axial-strain curve for the centre sample from the large foam conversion. Poisson’s ratio was −0.078 ± 0.014 (mean ± standard deviation) for the corner sample, −0.013 ± 0.003 for the edge sample and −0.068 ± 0.010 for the centre sample, indicating marginally auxetic behaviour. Density measurements confirmed a VCR of approximately 2 for all samples. Figure 9 shows the conven-tional foam had a regular cell structure and all the converted foam samples had a re-entrant cell structure, characteristic of auxetic foam.
5 Discussion
Composite pads—consisting of a sheet of auxetic foam and a semi-rigid shell—absorbed approximately three times more energy than their conventional equivalent, under quasi-static compression with a concentrated load. Auxetic pads were also
Fig. 7 Concentrated load compression testing results, (a) Peak force and (b) Energy absorbed. Error bars correspond to one standard deviation either side
T. Allen et al.
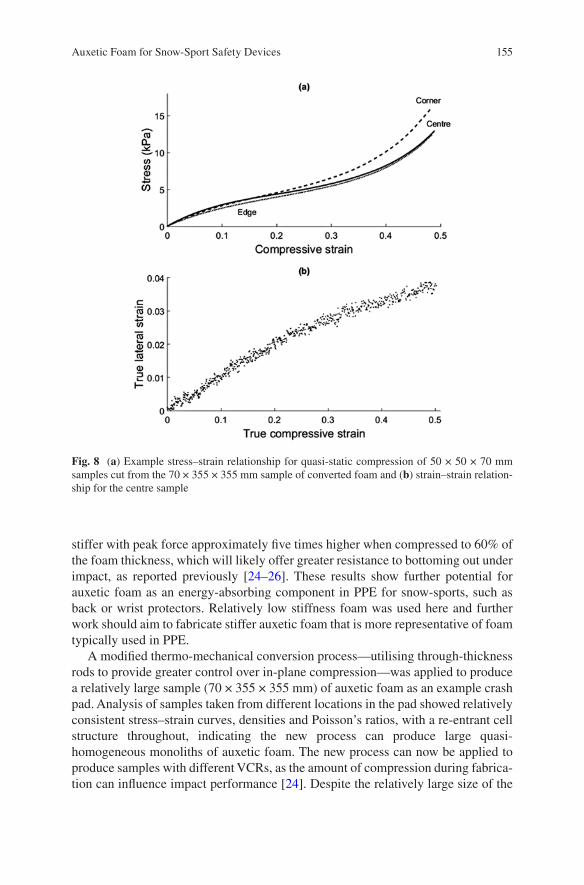
155
stiffer with peak force approximately five times higher when compressed to 60% of the foam thickness, which will likely offer greater resistance to bottoming out under impact, as reported previously [24–26]. These results show further potential for auxetic foam as an energy-absorbing component in PPE for snow-sports, such as back or wrist protectors. Relatively low stiffness foam was used here and further work should aim to fabricate stiffer auxetic foam that is more representative of foam typically used in PPE.
A modified thermo-mechanical conversion process—utilising through-thickness rods to provide greater control over in-plane compression—was applied to produce a relatively large sample (70 × 355 × 355 mm) of auxetic foam as an example crash pad. Analysis of samples taken from different locations in the pad showed relatively consistent stress–strain curves, densities and Poisson’s ratios, with a re-entrant cell structure throughout, indicating the new process can produce large quasi- homogeneous monoliths of auxetic foam. The new process can now be applied to produce samples with different VCRs, as the amount of compression during fabrica-tion can influence impact performance [24]. Despite the relatively large size of the
Fig. 8 (a) Example stress–strain relationship for quasi-static compression of 50 × 50 × 70 mm samples cut from the 70 × 355 × 355 mm sample of converted foam and (b) strain–strain relation-ship for the centre sample
Auxetic Foam for Snow-Sport Safety Devices
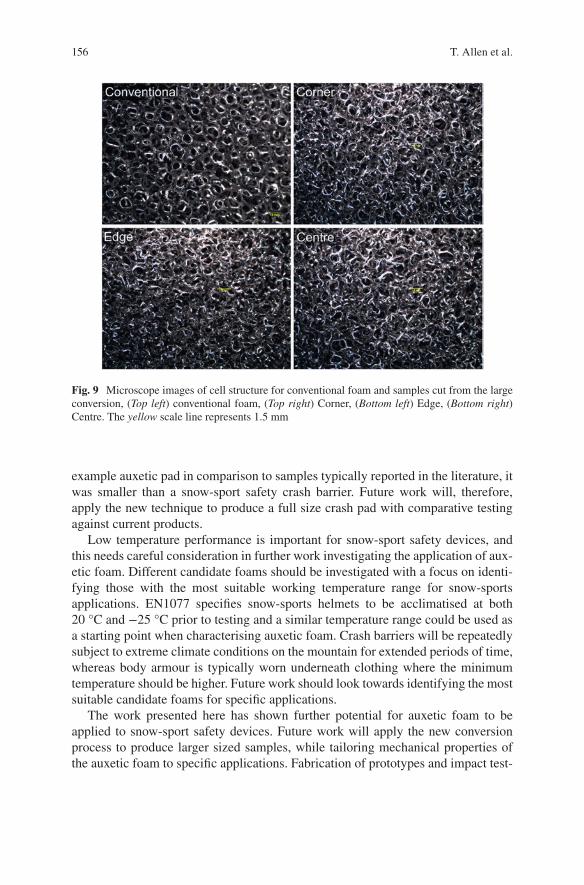
156
example auxetic pad in comparison to samples typically reported in the literature, it was smaller than a snow-sport safety crash barrier. Future work will, therefore, apply the new technique to produce a full size crash pad with comparative testing against current products.
Low temperature performance is important for snow-sport safety devices, and this needs careful consideration in further work investigating the application of aux-etic foam. Different candidate foams should be investigated with a focus on identi-fying those with the most suitable working temperature range for snow-sports applications. EN1077 specifies snow-sports helmets to be acclimatised at both 20 °C and −25 °C prior to testing and a similar temperature range could be used as a starting point when characterising auxetic foam. Crash barriers will be repeatedly subject to extreme climate conditions on the mountain for extended periods of time, whereas body armour is typically worn underneath clothing where the minimum temperature should be higher. Future work should look towards identifying the most suitable candidate foams for specific applications.
The work presented here has shown further potential for auxetic foam to be applied to snow-sport safety devices. Future work will apply the new conversion process to produce larger sized samples, while tailoring mechanical properties of the auxetic foam to specific applications. Fabrication of prototypes and impact test-
Fig. 9 Microscope images of cell structure for conventional foam and samples cut from the large conversion, (Top left) conventional foam, (Top right) Corner, (Bottom left) Edge, (Bottom right) Centre. The yellow scale line represents 1.5 mm
T. Allen et al.
157
ing for scenarios representative of snow-sport collisions is required. Impact testing of auxetic foam should be performed at temperatures typical of those where snow- sport is practised and the effect of repeated loading should be investigated.
References
1. Hunter RE (1999) Skiing injuries. Am J Sports Med 27(3):381–389 2. Vanat L (2014) International report on snow & mountain tourism. http://www.vanat.ch/
RM-world-report-2015.pdf. Accessed 22 Dec 2015 3. Dann K (2011) Snowboarding. In: Engelhardt M, Dorr A (eds) Sports orthopaedics. Elsevier,
Official Manual of GOTS, pp 637–645 4. Hasler RM, Berov S, Benneker L et al (2010) Are there risk factors for snowboard injuries? a
case-control multicentre study of 559 snowboarders. Br J Sports Med 44(11):816–821 5. Kusche H, Gutsfeld P, Bühren V (2010) Snowboarden. Sport Orthop Sport Traumatol
26(3):178–181 6. Hagel BE, Goulet C, Platt RW et al (2004) Injuries among skiers and snowboarders in Quebec.
Epidemiology 15(3):279–286 7. Russell K, Hagel B, Francescutti LH (2007) The effect of wrist guards on wrist and arm inju-
ries among snowboarders: a systematic review. Clin J Sport Med 17(2):145–150 8. Sasaki K, Takagi M, Ida H et al (1999) Severity of upper limb injuries in snowboarding. Arch
Orthop Trauma Surg 119(5–6):292–295 9. Russell K, Hagel B, Goulet C (2010) Snowboarding. In: Caine DJ, Harmer PA, Schiff MA
(eds) Epidemiology of injuries in olympic sports, vol XVI. Blackwell Publishing, Oxford, pp 447–472
10. Machold W, Kwasny O, Gäler P et al (2000) Risk of injury through snowboarding. J Trauma Acute Care Surg 48(6):1109–1114
11. Kim S, Lee SK (2011) Snowboard wrist guards-use, efficacy, and design: a systematic review. Bull NYU Hosp Jt Dis 69(2):149–157
12. Brügger O, Bianchi G, Schulz D et al (2010) Snow-sport helmets: injury prevention, rate of wearers and recommendations. Berne: bfu-Swiss Council for Accident Prevention. EuroSafe Task Force Safety in Sports
13. Matsumoto K, Sumi H, Sumi Y et al (2004) Wrist fractures from snowboarding: a prospective study for 3 seasons from 1998 to 2001. Clin J Sport Med 14:64–71
14. Torjussen J, Bahr R (2005) Injuries among competitive snowboarders at the national elite level. Am J Sports Med 33(3):370–377
15. Dickson TJ (2009) Risk factors in snowboarder’s wrist fractures. In: Senner V, Fastenbauer V, Bohm H (eds) Proceedings of the 18th Congress of the International Society for Skiing Safety (ISSS). Technical University of Munich, Department of Sport Equipment and Materials, Garmisch-Partenkirchen, p 13
16. Michel FI, Schmitt KU, Greenwald RM et al (2013) White paper: functionality and efficacy of wrist protectors in snowboarding—towards a harmonized international standard. Sports Eng 16(4):197–210
17. Hagel B (2005) Skiing and snowboarding injuries. In: Caine DJ, Maffulli N (eds) Epidemiology of pediatric sports injuries, individual sports. Med sport sci, vol 48. Karger, Basel, pp 74–119
18. Hume PA, Lorimer AV, Griffiths PC et al (2015) Recreational snow-sports injury risk factors and countermeasures: a meta-analysis review and Haddon matrix evaluation. Sports Med 45(8):1–16
19. European Committee for Standardization (2007) Helmets for alpine skiers and snowboarders; EN 1077: 2007. EN 1077: 2007. European Committee for Standardization, Brussels
Auxetic Foam for Snow-Sport Safety Devices
158
20. American Society for Testing and Materials (ASTM) (2002) ASTM F 2040-02: standard specification for helmets used for recreational snow sports. West Conshohocken
21. Schmitt KU, Liechti B, Michel FI et al (2010) Are current back protectors suitable to prevent spinal injury in recreational snowboarders? Br J Sports Med 44(11):822–826
22. Sanami M et al (2014) Auxetic materials for sports applications. In: James D, Choppin S, Allen T, Wheat J, Fleming P (eds) The Engineering of Sport 10, 10th Conference of the International Sports Engineering Association, Sheffield, July 2015, vol 72. Procedia Engineering, pp 453–458
23. Allen T et al (2015) Auxetic foams for sport safety applications. In: Subic A, Fuss FK, Alam F, Pang TY, Takla M (eds) The Impact of Technology on Sport VI. 7th Asia-Pacific Congress on Sports Technology, Barcelona, September 2015, vol 112. Procedia Engineering, pp 104–109
24. Allen T, Shepherd J, Hewage TAM et al (2015) Low-kinetic energy impact response of auxetic and conventional open-cell polyurethane foams. Phys Status Solidi B 252(7):1631–1639
25. Duncan O, Foster L, Senior T et al (2016) Quasi-static characterisation and impact testing of auxetic foam for sports safety applications. Smart Mater Struct 25(5):1–9
26. Duncan O, Foster L, Senior T, et al (2016) A comparison of novel and conventional fabrication methods for auxetic foams for sports safety applications. In: The Engineering of Sport 11. 11th Conference of the International Sports Engineering Association, Delft, July 2016, vol 147. Procedia Engineering, pp 384–389
27. Cross TM, Hoffer KW, Jones DP et al (2015) Auxetic structures and footwear with soles having auxetic structures. US patent 20,150,245,685, 3 Sep 2015
28. Bentham M, Alderson A, Alderson KL (2008) Garments having auxetic foam layers. US patent 7,455,567, 25 Nov 2008
29. Toronjo A (2013) Articles of apparel including auxetic materials. US Patent Application 13/838,827, filed 15 March 2013
30. Chan N, Evans KE (1998) Indentation resilience of conventional and auxetic foams. J Cell Plast 34(3):231–260
31. Evans KE, Alderson A (2000) Auxetic materials: functional materials and structures from lateral thinking! Adv Mater 12(9):617–628
32. Lakes R (1987) Foam structures with a negative Poisson’s ratio. Science 235(4792):1038–1040 33. Critchley R, Corni I, Wharton JA et al (2013) A review of the manufacture, mechanical properties
and potential applications of auxetic foams. Phys Status Solidi B 250(10):1963–1982 34. Chan N, Evans KE (1999) The mechanical properties of conventional and auxetic foams. Part I:
compression and tension. J Cell Plast 35(2):130–165 35. Scarpa F, Pastorino P, Garelli A et al (2005) Auxetic compliant flexible PU foams: static and
dynamic properties. Phys Status Solidi B 242(3):681–694 36. Grima JN, Attard D, Gatt R et al (2009) A novel process for the manufacture of auxetic foams
and for their re-conversion to conventional form. Adv Eng Mater 11(7):533–535 37. Lisiecki J, Błażejewicz T, Kłysz S et al (2013) Tests of polyurethane foams with negative
Poisson's ratio. Phys Status Solidi B 250(10):1988–1995 38. Friis EA, Lakes RS, Park JB (1988) Negative Poisson’s ratio polymeric and metallic foams.
J Mater Sci 23(12):4406–4414 39. Alderson A et al (2005) The effects of processing on the topology and mechanical properties
of negative Poisson’s ratio foams. In: Proceedings of ASME International Mechanical Engineering Congress and Exposition (Aerospace Division), Orlando, Florida, November 2005, vol 70AD, p 503
40. Lowe A, Lakes RS (2000) Negative Poisson's ratio foam as seat cushion material. Cell Polym 19(3):157–168
41. Lisiecki J, Kłysz S, Błażejewicz T et al (2014) Tomographic examination of auxetic polyurethane foam structures. Phys Status Solidi B 251(2):314–320
42. Chan N, Evans KE (1997) Fabrication methods for auxetic foams. J Mater Sci 32(22): 5945–5953
T. Allen et al.
159
43. Pastorino P, Scarpa FL, Patsias S et al (2007) Strain rate dependence of stiffness and Poisson’s ratio of auxetic open cell PU foams. Phys Status Solidi B 244(3):955–965
44. Bezazi A, Scarpa F (2007) Mechanical behaviour of conventional and negative Poisson’s ratio thermoplastic polyurethane foams under compressive cyclic loading. Int J Fatigue 29(5): 922–930
Open Access This chapter is distributed under the terms of the Creative Commons Attribution-Noncommercial 2.5 License (http://creativecommons.org/licenses/by-nc/2.5/) which permits any noncommercial use, distribution, and reproduction in any medium, provided the original author(s) and source are credited.
The images or other third party material in this chapter are included in the work’s Creative Commons license, unless indicated otherwise in the credit line; if such material is not included in the work’s Creative Commons license and the respective action is not permitted by statutory regu-lation, users will need to obtain permission from the license holder to duplicate, adapt or reproduce the material.
Auxetic Foam for Snow-Sport Safety Devices

Part IVSkier Behavior
163© The Author(s) 2017 I.S. Scher et al. (eds.), Snow Sports Trauma and Safety, DOI 10.1007/978-3-319-52755-0_13
Recorded Speed on Alpine Slopes: How to Interpret Skier’s Perception of Their Speed?
Nicolas Bailly, Sofiane Abouchiche, Catherine Masson, Thierry Donnadieu, and Pierre-Jean Arnoux
Abstract The speed before the accident is a necessary data to understand the injury mechanisms and to evaluate means of protection. In order to interpret the reported speed of a skier in an accident survey, this study aims to identify the governing factors of skiing speed and to propose ranges of speed combining the identified fac-tors and the skiers’ perception of their speed. Travelling speed of 1399 skiers and snowboarders was measured with a radar speed gun. Gender, sport, helmet use, skill level, difficulty, and preparation of the slope were recorded. 170 recorded skiers were interviewed about their age, their skill level, their perceived speed (“slow to medium,” “high,” or “too high”), and their estimated speed (km/h). Linear regression models were used to evaluate the effect of each factor on skiing speed. The mean recorded speed was 43.4 (±15.2) km/h. It was 37.5 (±9.8) km/h when the perceived speed was “low to medium” and 49.0 (±14.6) km/h when the perceived speed was “high.” The factors best explaining skiing speed were the skill level (η2 = 0.26) and the slope dif-ficulty (η2 = 0.19). Gender, age, sport, and slope preparation were found to have a small but significant effect (η2 < 0.1; p < 0.05). Those factors also influenced the speed perception: for the same perceived speed, “less skilled” skiers and skiers on easy slope tended to go on average 6 km/h and 8 km/h slower than the “more skilled” and those on medium slope, respectively. Finally, skiers estimated their measured speed fairly (r: 0.53). They tended to overestimate the speed when they went slower than 35 km/h but underestimated it at higher speed. Ranges of speed were obtained regarding perceived speed, skill level, and difficulty of the slope. This should be considered when interpreting skiers’ evaluation of their speed in accidents reports.
Keywords Ski • Snowboard • Speed • Speed perception
N. Bailly (*) Aix-Marseille Univ, IFSTTAR, LBA UMR_T24, 13916 Marseille, France
Salomon S.A.S., 74996 Annecy, Francee-mail: [email protected]
S. Abouchiche • C. Masson • P.-J. Arnoux Aix-Marseille Univ, IFSTTAR, LBA UMR_T24, 13916 Marseille, France
T. Donnadieu Salomon S.A.S., 74996 Annecy, France
164
1 Introduction
Each year approximately 150,000 ski and snowboard-related injuries are treated in a French medical centers [1]. One of the main factors affecting the kinematic of the accident and the injury severity is the speed of the participant prior to the accident [2, 3]. Indeed, the energy involved in the accident and the kinematic of the fall are related to the speed of the participant before the accident. In order to investigate these injury mechanisms, it is necessary to develop a robust understanding of skiing speed just before the crash. That understanding is also useful to evaluate means of protection such as ski helmets and protection mats whose effectiveness depends on the impact speed and the energy involved in the accident. In epidemiological study, the only available data on skiing speed before the accident, is the victims’ percep-tion of their own speed [1, 3]. To access skiing speed before the crash, a translation between the perceived speed and the measured speed is therefore necessary.
In order to propose such a translation, understanding the factors influencing ski-ing speed and its perception is crucial. Shealy et al. [4] and later Rueld et al. [5] showed that sport, gender, skill level, age, and risk-taking behavior might affect both skiing speed and the ability of the skiers to estimate their speed. Recently, Brunner et al. [6] also revealed that the skier’s perception of their speed might also depend on those factors. However, those studies were conducted on the same kind of slopes (medium difficulty); therefore, the difficulty and preparation of ski slope were never considered as factors influencing skiing speed.
2 Objective
This study investigates the measured speed on alpines slope and its perception. The first objective is to identify the factors having the greatest effect on skiing speed. The second objective is to obtain the range of speed regarding those identi-fied factors and skier’s perception of their speed.
3 Materials/Methods
3.1 First Investigation: Evaluation of the Factors Not Related to the Perception of the User
The objective of this first investigation is to identify the factors best explaining the skiing speed. Using a discreet radar speed gun with an accuracy of ±2 km/h (Pocket radar, Pocket Radar, Inc., Santa Rosa, California), speed measurements were per-formed in three different French ski resorts [Grand Bornand (n = 158), La Clusaz (n = 747), and Courchevelle (n = 494)], during five full days of the 2013/2014
N. Bailly et al.
165
French winter holidays. A trained observer standing in the skier’s way measured the skiing speed during their approach. The radar we used only measured subjects mov-ing in line with the radar beam which was not always the case of the skier because of the turn performed. This might lead to an underestimation of the actual speed. In order to limit that underestimation, the speed of the skier was measured during an observation period of three or four turns, and only the maximum speed was recorded. The observer also recorded helmet use and estimated the gender, and the skill level of the skier. The evaluation of the skill level was performed by the same trained observer according to criteria defined by Sulheim et al. [7]. The speed of 1399 skiers and snowboarders was recorded on wide slopes of different difficulties rated accord-ing to the European classification of ski slopes: green (very easy), blue (easy), red (medium), and black (hard) and of different preparations (well-groomed or bumpy). The “bumpy” slopes were slopes left ungroomed during several days, where some small moguls had appeared. The bumpy slopes selected in this study were blue (84 recorded users) and black (62 recorded users). Those slopes were busy because it was the middle of the peak season and the weather was sunny. As much as possible, the speed measurement was performed on consecutive skiers and snowboarders.
3.2 Second Investigation: Combining the Identified Factors with Perception of the User
Based on the identification of the most important factors influencing skiing speed, a second investigation was conducted. The aim was to combine those identified fac-tors with the users’ perception of their speed. 200 randomly selected measured ski-ers and snowboarders were stopped and interviewed by a research assistant at the bottom of the ski slope. The assistant recorded the gender, age, helmet use, sport, as well as the skiers’ self-estimation of their skill level (beginner, intermediate, or advanced). Users were then showed the observation area where they had been mea-sured and were asked to estimate their perceived speed (low to medium, high, or too high) and their measured speed (km/h). The measured speed was transmitted to the research assistant by walkie-talkie and was also recorded. This method is very simi-lar to the one described on medium slopes by Shealy et al. [4] and Rueld et al. [5]. In our second investigation, the slopes selected were large red (medium) and blue (easy) because the first investigation had showed that red and blue slopes differ in typologies of skill level and speed of the participants and because those are the slopes where most accident occur [8].
Due to the small number of interviewed snowboarders (n = 24), only skiers were included in the statistical analysis. In the same way, the speed categories “high” and “too high” were grouped as well as the skill level “beginner” and “intermediate” because only 10 skiers estimated their speed as “too high” and only three declared being a beginner.
Recorded Speed on Alpine Slopes: How to Interpret Skier’s Perception of Their Speed?
166
3.3 Data Analysis
In order to evaluate the effect of each factor (i.e., whether the mean speed is signifi-cantly different between groups and by how much), we used the factorial ANOVA of a Generalized Linear Model (GLM). This choice was made because the GLM enables us to test the effect of each factor regardless of the other factors tested. Two- tailed p-values <0.05 were considered for statistical significance. All variables with a significant effect (significant difference of mean speed between the catego-ries) were used in the final model. The variances explained by the models were assessed with the coefficient of determination (R2). Effect size was evaluated using partial η2 measuring the variance explained by each factor with 0.01, 0.1, and 0.25 for small, medium, and large effects. We analyzed the measured speed according to the perceived speed and the other factors best explaining skiing speed. Additionally, we investigated the measured speed regarding the self-estimated speed (in km/h).
4 Results
4.1 First Investigation: Evaluation of the Factors Not Related to User’s Perception
1246 skiers and 153 snowboarders were measured in 3 different ski resorts, and on 10 ski slopes of different difficulties (from very easy to very hard) and different preparation (groomed or bumby). The mean skiing speed recorded was 43.4 (±15.2) km/h. The mean recorded speeds regarding slope difficulty, slope preparation, skill level, sport, gender, and helmet use are presented in Table 1. The results of the linear regression model are presented in Table 1. Table 2 summarizes the effects of each factor on the measured speed. Skill level (η2 = 0.26; P < 0.001) and slope difficulty (η2 = 0.19; P < 0.001) were the factors best explaining the variance of the skiing speed. Gender (η2 = 0.06; P < 0.001), sport (η2 = 0.03; P < 0.001), and slope prepa-ration (η2 = 0.01; P < 0.001) had a small but significant effect on skiing speed (Table 2). However, the effect of the use of helmet was not significant and was not included in the final model.
The linear regression model, presented on Table 1, explained 47% of speed vari-ance. According to this model, intermediate skiers tended to go 11.7 km/h faster than beginner and 11.5 km/h slower than advanced skier. Speed of males was higher than the speed of females, by a mean of 3.1 km/h. Skiers were 2.8 km/h faster than snowboarders. Finally, the slope difficulty and preparation had a great influence on skiing speed. Skiers went faster on red and green slopes than on blue slopes by a mean of 7.2 km/h and 5 km/h, respectively. However, they travelled 9.0 km/h slower on black slope than on blue slope. Users went on average 1.7 km/h faster on a well- groomed ski slope than on a bumpy slope.
N. Bailly et al.
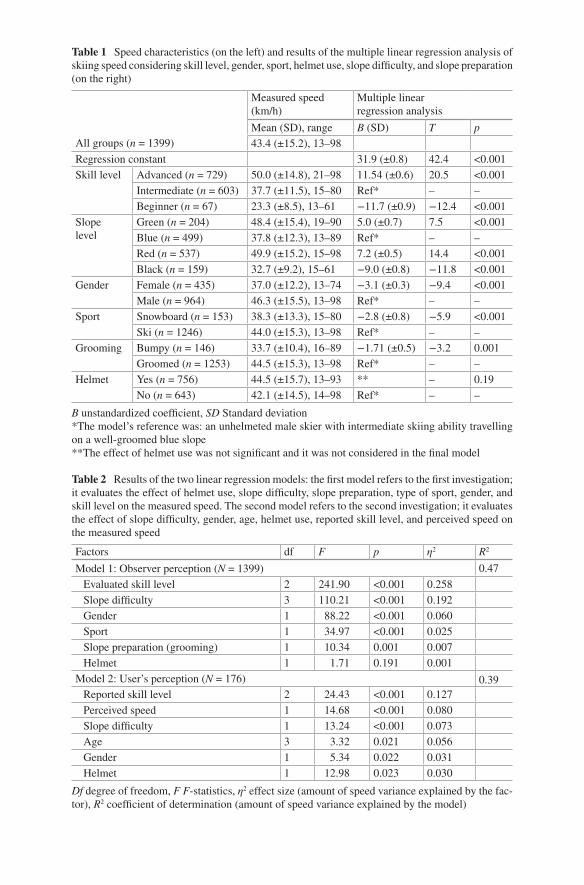
Table 1 Speed characteristics (on the left) and results of the multiple linear regression analysis of skiing speed considering skill level, gender, sport, helmet use, slope difficulty, and slope preparation (on the right)
Measured speed (km/h)
Multiple linear regression analysis
Mean (SD), range B (SD) T pAll groups (n = 1399) 43.4 (±15.2), 13–98Regression constant 31.9 (±0.8) 42.4 <0.001Skill level Advanced (n = 729) 50.0 (±14.8), 21–98 11.54 (±0.6) 20.5 <0.001
Intermediate (n = 603) 37.7 (±11.5), 15–80 Ref* – –Beginner (n = 67) 23.3 (±8.5), 13–61 −11.7 (±0.9) −12.4 <0.001
Slope level
Green (n = 204) 48.4 (±15.4), 19–90 5.0 (±0.7) 7.5 <0.001Blue (n = 499) 37.8 (±12.3), 13–89 Ref* – –Red (n = 537) 49.9 (±15.2), 15–98 7.2 (±0.5) 14.4 <0.001Black (n = 159) 32.7 (±9.2), 15–61 −9.0 (±0.8) −11.8 <0.001
Gender Female (n = 435) 37.0 (±12.2), 13–74 −3.1 (±0.3) −9.4 <0.001Male (n = 964) 46.3 (±15.5), 13–98 Ref* – –
Sport Snowboard (n = 153) 38.3 (±13.3), 15–80 −2.8 (±0.8) −5.9 <0.001Ski (n = 1246) 44.0 (±15.3), 13–98 Ref* – –
Grooming Bumpy (n = 146) 33.7 (±10.4), 16–89 −1.71 (±0.5) −3.2 0.001Groomed (n = 1253) 44.5 (±15.3), 13–98 Ref* – –
Helmet Yes (n = 756) 44.5 (±15.7), 13–93 ** – 0.19No (n = 643) 42.1 (±14.5), 14–98 Ref* – –
B unstandardized coefficient, SD Standard deviation*The model’s reference was: an unhelmeted male skier with intermediate skiing ability travelling on a well-groomed blue slope**The effect of helmet use was not significant and it was not considered in the final model
Table 2 Results of the two linear regression models: the first model refers to the first investigation; it evaluates the effect of helmet use, slope difficulty, slope preparation, type of sport, gender, and skill level on the measured speed. The second model refers to the second investigation; it evaluates the effect of slope difficulty, gender, age, helmet use, reported skill level, and perceived speed on the measured speed
Factors df F p η2 R2
Model 1: Observer perception (N = 1399)Evaluated skill level 2 241.90 <0.001 0.258
0.47
Slope difficulty 3 110.21 <0.001 0.192Gender 1 88.22 <0.001 0.060Sport 1 34.97 <0.001 0.025Slope preparation (grooming) 1 10.34 0.001 0.007Helmet 1 1.71 0.191 0.001
Model 2: User’s perception (N = 176)Reported skill level 2 24.43 <0.001 0.127
0.39
Perceived speed 1 14.68 <0.001 0.080Slope difficulty 1 13.24 <0.001 0.073Age 3 3.32 0.021 0.056Gender 1 5.34 0.022 0.031Helmet 1 12.98 0.023 0.030
Df degree of freedom, F F-statistics, η2 effect size (amount of speed variance explained by the fac-tor), R2 coefficient of determination (amount of speed variance explained by the model)
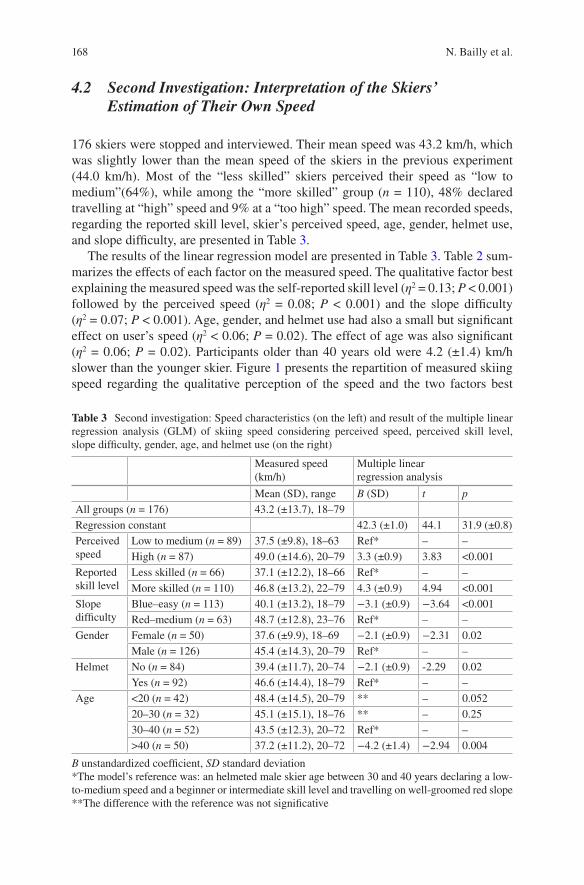
168
4.2 Second Investigation: Interpretation of the Skiers’ Estimation of Their Own Speed
176 skiers were stopped and interviewed. Their mean speed was 43.2 km/h, which was slightly lower than the mean speed of the skiers in the previous experiment (44.0 km/h). Most of the “less skilled” skiers perceived their speed as “low to medium”(64%), while among the “more skilled” group (n = 110), 48% declared travelling at “high” speed and 9% at a “too high” speed. The mean recorded speeds, regarding the reported skill level, skier’s perceived speed, age, gender, helmet use, and slope difficulty, are presented in Table 3.
The results of the linear regression model are presented in Table 3. Table 2 sum-marizes the effects of each factor on the measured speed. The qualitative factor best explaining the measured speed was the self-reported skill level (η2 = 0.13; P < 0.001) followed by the perceived speed (η2 = 0.08; P < 0.001) and the slope difficulty (η2 = 0.07; P < 0.001). Age, gender, and helmet use had also a small but significant effect on user’s speed (η2 < 0.06; P = 0.02). The effect of age was also significant (η2 = 0.06; P = 0.02). Participants older than 40 years old were 4.2 (±1.4) km/h slower than the younger skier. Figure 1 presents the repartition of measured skiing speed regarding the qualitative perception of the speed and the two factors best
Table 3 Second investigation: Speed characteristics (on the left) and result of the multiple linear regression analysis (GLM) of skiing speed considering perceived speed, perceived skill level, slope difficulty, gender, age, and helmet use (on the right)
Measured speed (km/h)
Multiple linear regression analysis
Mean (SD), range B (SD) t p
All groups (n = 176) 43.2 (±13.7), 18–79Regression constant 42.3 (±1.0) 44.1 31.9 (±0.8)Perceived speed
Low to medium (n = 89) 37.5 (±9.8), 18–63 Ref* – –High (n = 87) 49.0 (±14.6), 20–79 3.3 (±0.9) 3.83 <0.001
Reported skill level
Less skilled (n = 66) 37.1 (±12.2), 18–66 Ref* – –
More skilled (n = 110) 46.8 (±13.2), 22–79 4.3 (±0.9) 4.94 <0.001Slope difficulty
Blue–easy (n = 113) 40.1 (±13.2), 18–79 −3.1 (±0.9) −3.64 <0.001Red–medium (n = 63) 48.7 (±12.8), 23–76 Ref* – –
Gender Female (n = 50) 37.6 (±9.9), 18–69 −2.1 (±0.9) −2.31 0.02Male (n = 126) 45.4 (±14.3), 20–79 Ref* – –
Helmet No (n = 84) 39.4 (±11.7), 20–74 −2.1 (±0.9) -2.29 0.02Yes (n = 92) 46.6 (±14.4), 18–79 Ref* – –
Age <20 (n = 42) 48.4 (±14.5), 20–79 ** – 0.05220–30 (n = 32) 45.1 (±15.1), 18–76 ** – 0.2530–40 (n = 52) 43.5 (±12.3), 20–72 Ref* – –>40 (n = 50) 37.2 (±11.2), 20–72 −4.2 (±1.4) −2.94 0.004
B unstandardized coefficient, SD standard deviation*The model’s reference was: an helmeted male skier age between 30 and 40 years declaring a low- to- medium speed and a beginner or intermediate skill level and travelling on well-groomed red slope**The difference with the reference was not significative
N. Bailly et al.
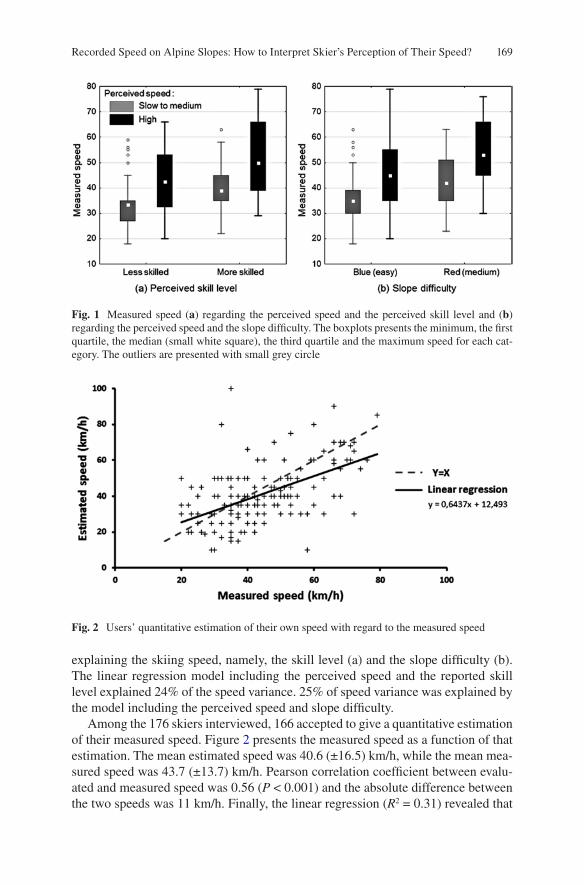
169
explaining the skiing speed, namely, the skill level (a) and the slope difficulty (b). The linear regression model including the perceived speed and the reported skill level explained 24% of the speed variance. 25% of speed variance was explained by the model including the perceived speed and slope difficulty.
Among the 176 skiers interviewed, 166 accepted to give a quantitative estimation of their measured speed. Figure 2 presents the measured speed as a function of that estimation. The mean estimated speed was 40.6 (±16.5) km/h, while the mean mea-sured speed was 43.7 (±13.7) km/h. Pearson correlation coefficient between evalu-ated and measured speed was 0.56 (P < 0.001) and the absolute difference between the two speeds was 11 km/h. Finally, the linear regression (R2 = 0.31) revealed that
Fig. 1 Measured speed (a) regarding the perceived speed and the perceived skill level and (b) regarding the perceived speed and the slope difficulty. The boxplots presents the minimum, the first quartile, the median (small white square), the third quartile and the maximum speed for each cat-egory. The outliers are presented with small grey circle
Fig. 2 Users’ quantitative estimation of their own speed with regard to the measured speed
Recorded Speed on Alpine Slopes: How to Interpret Skier’s Perception of Their Speed?
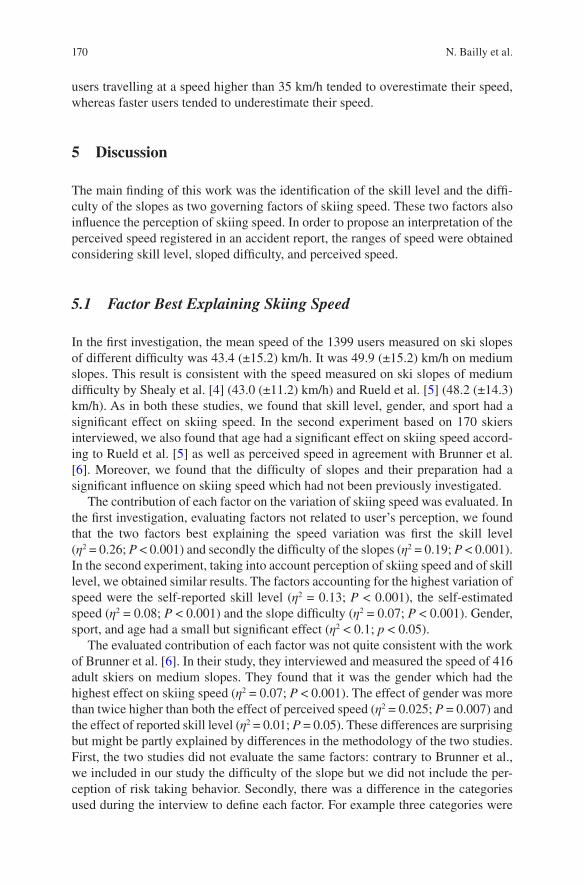
170
users travelling at a speed higher than 35 km/h tended to overestimate their speed, whereas faster users tended to underestimate their speed.
5 Discussion
The main finding of this work was the identification of the skill level and the diffi-culty of the slopes as two governing factors of skiing speed. These two factors also influence the perception of skiing speed. In order to propose an interpretation of the perceived speed registered in an accident report, the ranges of speed were obtained considering skill level, sloped difficulty, and perceived speed.
5.1 Factor Best Explaining Skiing Speed
In the first investigation, the mean speed of the 1399 users measured on ski slopes of different difficulty was 43.4 (±15.2) km/h. It was 49.9 (±15.2) km/h on medium slopes. This result is consistent with the speed measured on ski slopes of medium difficulty by Shealy et al. [4] (43.0 (±11.2) km/h) and Rueld et al. [5] (48.2 (±14.3) km/h). As in both these studies, we found that skill level, gender, and sport had a significant effect on skiing speed. In the second experiment based on 170 skiers interviewed, we also found that age had a significant effect on skiing speed accord-ing to Rueld et al. [5] as well as perceived speed in agreement with Brunner et al. [6]. Moreover, we found that the difficulty of slopes and their preparation had a significant influence on skiing speed which had not been previously investigated.
The contribution of each factor on the variation of skiing speed was evaluated. In the first investigation, evaluating factors not related to user’s perception, we found that the two factors best explaining the speed variation was first the skill level (η2 = 0.26; P < 0.001) and secondly the difficulty of the slopes (η2 = 0.19; P < 0.001). In the second experiment, taking into account perception of skiing speed and of skill level, we obtained similar results. The factors accounting for the highest variation of speed were the self-reported skill level (η2 = 0.13; P < 0.001), the self-estimated speed (η2 = 0.08; P < 0.001) and the slope difficulty (η2 = 0.07; P < 0.001). Gender, sport, and age had a small but significant effect (η2 < 0.1; p < 0.05).
The evaluated contribution of each factor was not quite consistent with the work of Brunner et al. [6]. In their study, they interviewed and measured the speed of 416 adult skiers on medium slopes. They found that it was the gender which had the highest effect on skiing speed (η2 = 0.07; P < 0.001). The effect of gender was more than twice higher than both the effect of perceived speed (η2 = 0.025; P = 0.007) and the effect of reported skill level (η2 = 0.01; P = 0.05). These differences are surprising but might be partly explained by differences in the methodology of the two studies. First, the two studies did not evaluate the same factors: contrary to Brunner et al., we included in our study the difficulty of the slope but we did not include the per-ception of risk taking behavior. Secondly, there was a difference in the categories used during the interview to define each factor. For example three categories were
N. Bailly et al.
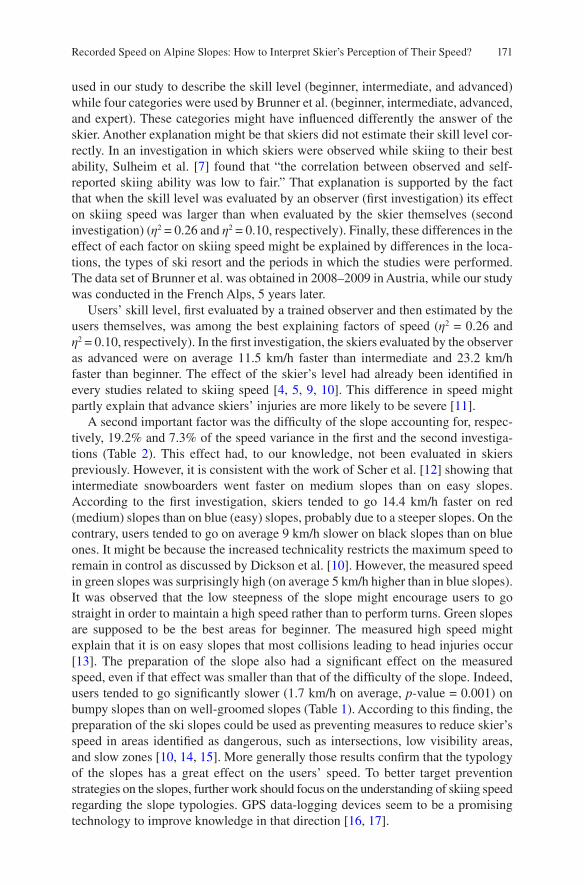
171
used in our study to describe the skill level (beginner, intermediate, and advanced) while four categories were used by Brunner et al. (beginner, intermediate, advanced, and expert). These categories might have influenced differently the answer of the skier. Another explanation might be that skiers did not estimate their skill level cor-rectly. In an investigation in which skiers were observed while skiing to their best ability, Sulheim et al. [7] found that “the correlation between observed and self- reported skiing ability was low to fair.” That explanation is supported by the fact that when the skill level was evaluated by an observer (first investigation) its effect on skiing speed was larger than when evaluated by the skier themselves (second investigation) (η2 = 0.26 and η2 = 0.10, respectively). Finally, these differences in the effect of each factor on skiing speed might be explained by differences in the loca-tions, the types of ski resort and the periods in which the studies were performed. The data set of Brunner et al. was obtained in 2008–2009 in Austria, while our study was conducted in the French Alps, 5 years later.
Users’ skill level, first evaluated by a trained observer and then estimated by the users themselves, was among the best explaining factors of speed (η2 = 0.26 and η2 = 0.10, respectively). In the first investigation, the skiers evaluated by the observer as advanced were on average 11.5 km/h faster than intermediate and 23.2 km/h faster than beginner. The effect of the skier’s level had already been identified in every studies related to skiing speed [4, 5, 9, 10]. This difference in speed might partly explain that advance skiers’ injuries are more likely to be severe [11].
A second important factor was the difficulty of the slope accounting for, respec-tively, 19.2% and 7.3% of the speed variance in the first and the second investiga-tions (Table 2). This effect had, to our knowledge, not been evaluated in skiers previously. However, it is consistent with the work of Scher et al. [12] showing that intermediate snowboarders went faster on medium slopes than on easy slopes. According to the first investigation, skiers tended to go 14.4 km/h faster on red (medium) slopes than on blue (easy) slopes, probably due to a steeper slopes. On the contrary, users tended to go on average 9 km/h slower on black slopes than on blue ones. It might be because the increased technicality restricts the maximum speed to remain in control as discussed by Dickson et al. [10]. However, the measured speed in green slopes was surprisingly high (on average 5 km/h higher than in blue slopes). It was observed that the low steepness of the slope might encourage users to go straight in order to maintain a high speed rather than to perform turns. Green slopes are supposed to be the best areas for beginner. The measured high speed might explain that it is on easy slopes that most collisions leading to head injuries occur [13]. The preparation of the slope also had a significant effect on the measured speed, even if that effect was smaller than that of the difficulty of the slope. Indeed, users tended to go significantly slower (1.7 km/h on average, p-value = 0.001) on bumpy slopes than on well-groomed slopes (Table 1). According to this finding, the preparation of the ski slopes could be used as preventing measures to reduce skier’s speed in areas identified as dangerous, such as intersections, low visibility areas, and slow zones [10, 14, 15]. More generally those results confirm that the typology of the slopes has a great effect on the users’ speed. To better target prevention strategies on the slopes, further work should focus on the understanding of skiing speed regarding the slope typologies. GPS data-logging devices seem to be a promising technology to improve knowledge in that direction [16, 17].
Recorded Speed on Alpine Slopes: How to Interpret Skier’s Perception of Their Speed?
172
The effect of the helmet on skiing speed is a controversial issue. According to Rueld et al. (2013a), that effect was nonsignificant whereas for Shealy et al. [4], helmet users were significantly faster than non-helmet users. In our first experiment, we did not find a significant effect between helmet use and the measured speed (Table 1, multiple linear regressions). However, in our second experiment, we found that there was a significant effect of helmet use on skiing speed, but it was the factor which had the smallest effect on skiing speed (η2 = 0.03; P = 0.023). Therefore, according to our results helmet use might have an effect on the skiing speed but that effect is very small.
5.2 Interpretation of the Skier’s Estimation of Their Own Speed
The results of the second investigation demonstrate that the perception of skiing speed depends on various factors such as skill level, slope difficulty, age, gender, and helmet use. For example, when perceiving their speed as “high,” “less skilled” skiers were on average 9 km/h slower than the “more skilled” (42.5 (±14.1) km/h and 51.5 (±14.1) km/h, respectively). In order to better interpret the skiers’ estima-tion of their own speed, we combined their perception of skiing speed with the best explaining factors, namely, the skill level and the difficulty of the slope (Fig. 1). To combine those information, enable a better prediction of the measured speed. Indeed, the regression model including the perception of speed and the reported skill level explained 24% of the speed variance. This is 7% higher than the regression model including the speed perception only (17%). However, we recorded a high variability of the measured speed among the defined categories of skiers as men-tioned by Brunner et al. [6]: there was almost 50 km/h between the slowest and the fastest “less skilled” skiers who estimated their speed as “high.” It shows that skiers’ perception of their own skill level and their speed is not very precise nor very reli-able and has to be taken carefully. We argue that it might be relevant to choose range of speed over mean speed in order to describe the speed of a category of skiers.
The quantitative estimation of the measured speed was also studied (Fig. 2). The Pearson correlation coefficient between estimated and measured speed was 0.53 which is consistent with the study of Shealy et al. [4] and Rueld et al. [5] (0.56). And the mean absolute difference between measured and estimated speed was 11.3 km/h. Interestingly, we found that skiers tended to overestimate their speed when travelling at a speed of under 35 km/h and underestimate their speed when travelling faster. Previously, Rueld et al. (2013a) had found a similar result but for a speed of 40 km/h. Based on those results, speed quantitative estimation should be included in an acci-dent survey. However, the interpretation of such data is difficult, indeed, as reported in Rueld et al. [5], because a few users were incompetent in the evaluation of their speed: one skier claimed a speed of 30 km/h when, actually, he travelled at 72 km/h, or at the contrary one claimed a 80 km/h speed when he travelled at 32 km/h. Moreover, users were very reluctant to estimate quantitatively their speed and we doubt that many would accept to give such an interpretation in an accident survey.
N. Bailly et al.
173
5.3 Limitations
The second experiment was performed in order to interpret the reported speed of a skier in an accident survey. Even if there was a large variability in speed among each category of users, the study provides approximate speed ranges of these categories. For example, the advance skiers who perceived their speed as “low to medium” were at a speed of between 18 and 59 km/h, and a majority of them was at a speed of between 27 and 35 km/h. However, it is possible that in the medical center, due to the traumatic event, the users do not perceive their speed and their skill level the same way they would at the bottom of a ski slope.
The radar used in this study was designed to measure the speed of objects of vari-ous size from tennis ball to car at a speed from 11 to 600 km/h and could operate at a temperature as low as −7 °C. It was hence appropriate to measure skiers. Also the speed measurements were done in 1/50 s and were hence not affected by the slow movement made by the observer to track the skier. However, the radar measured the speed only in the direction in which it was pointing. To measure the speed accu-rately, the observer had to be in the skier’s way which was not the case during the skier’s turn. To tackle that issue, we chose to measure the skier during several turns and to record the highest measured speed during that observation period. However, the speed might still be slightly underestimated by the radar.
The gender and the skill level were evaluated by the observer during the observa-tion period. The skier was included in the study when the observer was positive about their gender. Yet it is worth noticing that in the literature, there is reported bias associated with higher skill skiers more easily perceived as male [18].
6 Conclusion
In conclusion, we found that among the evaluated factors, the skiers’ perception, the skill level, and the slope difficulty were the most influencing factors of skiing speed. These results should be considered in order to improve the prevention strategies on the slopes. We also provided ranges of speed associated with the skier’s perception of their speed and considering skill level and the slope difficulty. This result pro-vides insights to interpret the skiers’ assessment of their own speed in an accident report. This is, therefore, a first step toward a precise accident reconstruction, lead-ing to a better understanding of the accident mechanisms and a better evaluation of the means of protection.
References
1. Laporte J-D, Bajolle L, Lamy D, Delay J-B (2012) Winter sports injuries in France over two decades. In: Skiing trauma and safety, vol 19. ASTM International, pp 201–215
2. Bailly, N., Llari, M., Donnadieu, T., Masson, C. and Arnoux, P. J. (2016), Head impact in a snowboarding accident. Scand J Med Sci Sports.
Recorded Speed on Alpine Slopes: How to Interpret Skier’s Perception of Their Speed?
174
3. Takakuwa T, Endo S (1997) Factors determining the severity of ski injuries. J Orthop Sci 2(6):367–371
4. Shealy JE, Ettlinger CF, Johnson RJ (2005) How fast do winter sports participants travel on alpine slopes? J ASTM Int 2(7):JAI12092
5. Ruedl G, Brunner F, Woldrich T, Faulhaber M, Kopp M, Nachbauer W, Burtscher M (2013) Factors associated with the ability to estimate actual speeds in recreational alpine skiers. Wilderness Environ Med 24(2):118–123
6. Brunner F, Ruedl G, Kopp M, Burtscher M (2015) Factors associated with the perception of speed among recreational skiers. PLoS One 10(6):e0132002
7. Sulheim S, Ekeland A, Bahr R (2007) Self-estimation of ability among skiers and snowboarders in alpine skiing resorts. Knee Surg Sports Traumatol Arthrosc Off J ESSKA 15(5):665–670
8. Fukuda O, Takaba M, Saito T, Endo S (2001) Head injuries in snowboarders compared with head injuries in skiers a prospective analysis of 1076 patients from 1994 to 1999 in Niigata, Japan. Am J Sports Med 29(4):437–440
9. Williams R, Delaney T, Nelson E, Gratton J, Laurent J, Heath B (2007) Speeds associated with skiing and snowboarding. Wilderness Environ Med 18(2):102–105
10. Dickson T, Terwiel F, Waddington G, Trathen S (2012) Easiest routes and slow zones: How fast do I go?: speeds and distances of recreational and expert snowsport participants. In: Skiing trauma and safety, vol 19. ASTM International, pp 184–197
11. Goulet C, Hagel BE, Hamel D, Légaré G (2010) Self-reported skill level and injury severity in skiers and snowboarders. J Sci Med Sport Sports Med Aust 13(1):39–41
12. Scher I, Richards D, Carhart M (2006) Head injury in snowboarding: Evaluating the protective role of helmets. J ASTM Int 3(4)
13. Bailly N, Afquir S, Laporte J-D, Melot A, Savary D, Seigneuret E, Delay J-B, Donnadieu T, Masson C, Arnoux P-J (2017) Analysis of Injury Mechanisms in Head Injuries in Skiers and Snowboarders. Med Sci Sports Exerc. 49:1–10
14. Ruedl G, Kopp M, Sommersacher R, Woldrich T, Burtscher M (2013) Factors associated with injuries occurred on slope intersections and in snow parks compared to on-slope injuries. Accid Anal Prev 50:1221–1225
15. Bergstrøm KA, Ekeland A (2004) Effect of trail design and grooming on the incidence of injuries at alpine ski areas. Br J Sports Med 38(3):264–268
16. Dickson TJ, Terwiel FA, Waddington G, Trathen S (2011) Evaluation of the use of a GPS data- logging device in a snowsport environment. Procedia Eng 13:470–475
17. Dickson TJ, Trathen S, Waddington GS (2014) Speeds of pediatric snowsport participants: insights for injury prevention strategies. In: Skiing trauma and safety, vol 19. ASTM International, pp 141–149
18. Dickson TJ, Laneyrie F, Pritchard A (2006) Australian snowsports: gendered and contested spaces? Tour 54(1):17–32
Open Access This chapter is distributed under the terms of the Creative Commons Attribution-Noncommercial 2.5 License (http://creativecommons.org/licenses/by-nc/2.5/) which permits any noncommercial use, distribution, and reproduction in any medium, provided the original author(s) and source are credited.
The images or other third party material in this chapter are included in the work’s Creative Commons license, unless indicated otherwise in the credit line; if such material is not included in the work’s Creative Commons license and the respective action is not permitted by statutory regu-lation, users will need to obtain permission from the license holder to duplicate, adapt or reproduce the material.
N. Bailly et al.
175© The Author(s) 2017 I.S. Scher et al. (eds.), Snow Sports Trauma and Safety, DOI 10.1007/978-3-319-52755-0_14
Snowsport Instructors: Their Actual Maximum Speeds, Their Estimation of Maximum Speed and Speed in Slow Zones, and Their Knowledge of Helmet Effectiveness
Tracey J. Dickson and F. Anne Terwiel
Abstract Snowsport safety strategies include resort and equipment design, trail management, emergency response, and public education. Snowsport instructors are well placed to inform their students about snowsport safety both in the behavior they model and the information they provide. To contribute to the evidence-base of snowsport safety and helmet awareness, this research explores the actual and esti-mated maximal speeds of ski and snowboard instructors across a normal work-day as well as their knowledge of helmet effectiveness. During winter 2012/13, a conve-nience sample of 109 instructors was recruited across six resorts in Western Canada and were issued with iPhone 3 s loaded with the Ski Tracks app. An anonymous questionnaire investigated their prior snowsport experiences, their knowledge of snowsport safety, and their understanding of helmet effectiveness. Results indicated that snowsport instructors: (1) underestimated their maximal speeds by 12 km/h on average; (2) overestimated the overall snowsport injury rate as well as the propor-tion of head injuries; and (3) overestimated the effectiveness of helmets. Based upon these results, if snowsport instructors are to contribute to the knowledge and under-standing of the snowsport safety of their students then their own knowledge needs to be developed with regard to helmet effectiveness.
Keywords Skiing • Snowboarding • Speed • Slow zones • Helmet effectiveness
T.J. Dickson (*) Research Institute for Sport and Exercise, University of Canberra, Canberra, ACT, Australiae-mail: [email protected]
F.A. Terwiel Faculty of Adventure, Culinary Arts and Tourism, Thompson Rivers University, Kamloops, BC, Canadae-mail: [email protected]
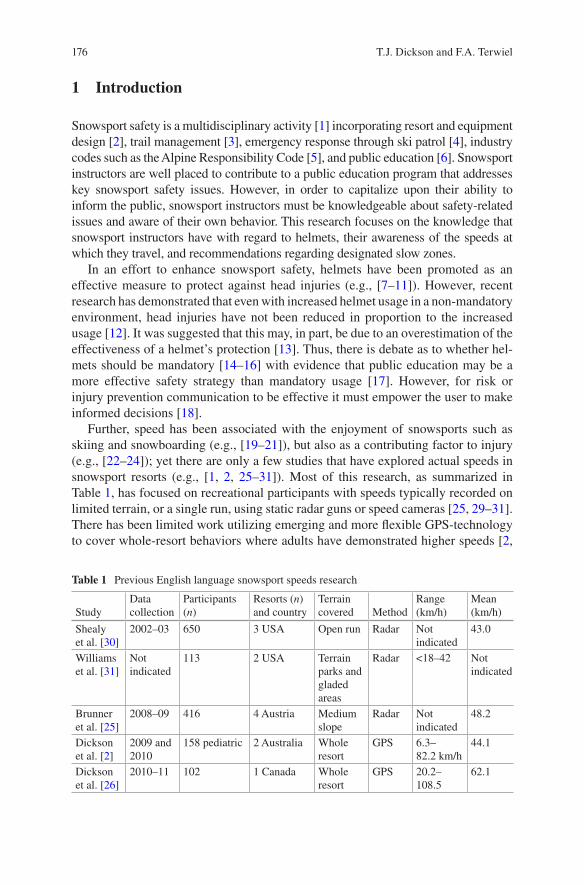
176
1 Introduction
Snowsport safety is a multidisciplinary activity [1] incorporating resort and equipment design [2], trail management [3], emergency response through ski patrol [4], industry codes such as the Alpine Responsibility Code [5], and public education [6]. Snowsport instructors are well placed to contribute to a public education program that addresses key snowsport safety issues. However, in order to capitalize upon their ability to inform the public, snowsport instructors must be knowledgeable about safety-related issues and aware of their own behavior. This research focuses on the knowledge that snowsport instructors have with regard to helmets, their awareness of the speeds at which they travel, and recommendations regarding designated slow zones.
In an effort to enhance snowsport safety, helmets have been promoted as an effective measure to protect against head injuries (e.g., [7–11]). However, recent research has demonstrated that even with increased helmet usage in a non- mandatory environment, head injuries have not been reduced in proportion to the increased usage [12]. It was suggested that this may, in part, be due to an overestimation of the effectiveness of a helmet’s protection [13]. Thus, there is debate as to whether hel-mets should be mandatory [14–16] with evidence that public education may be a more effective safety strategy than mandatory usage [17]. However, for risk or injury prevention communication to be effective it must empower the user to make informed decisions [18].
Further, speed has been associated with the enjoyment of snowsports such as skiing and snowboarding (e.g., [19–21]), but also as a contributing factor to injury (e.g., [22–24]); yet there are only a few studies that have explored actual speeds in snowsport resorts (e.g., [1, 2, 25–31]). Most of this research, as summarized in Table 1, has focused on recreational participants with speeds typically recorded on limited terrain, or a single run, using static radar guns or speed cameras [25, 29–31]. There has been limited work utilizing emerging and more flexible GPS-technology to cover whole-resort behaviors where adults have demonstrated higher speeds [2,
Table 1 Previous English language snowsport speeds research
StudyData collection
Participants (n)
Resorts (n) and country
Terrain covered Method
Range (km/h)
Mean (km/h)
Shealy et al. [30]
2002–03 650 3 USA Open run Radar Not indicated
43.0
Williams et al. [31]
Not indicated
113 2 USA Terrain parks and gladed areas
Radar <18–42 Not indicated
Brunner et al. [25]
2008–09 416 4 Austria Medium slope
Radar Not indicated
48.2
Dickson et al. [2]
2009 and 2010
158 pediatric 2 Australia Whole resort
GPS 6.3–82.2 km/h
44.1
Dickson et al. [26]
2010–11 102 1 Canada Whole resort
GPS 20.2– 108.5
62.1
T.J. Dickson and F.A. Terwiel
177
26], nor has there been a specific focus on instructors who may act as safety role models and educators.
A common finding from all of this speeds research (Table 1) that is relevant for snowsport safety is that most participants, young and old, beginner through expert, regularly exceed the flat impact test standards for snowsport helmets which are in the range of 20–23 km/h [2, 32–35]. It has been demonstrated that people regularly exceed their own recommended speeds for slow zones [26]. Slow zones are typi-cally identified by prominent signs on slopes and markings on trail maps, and include learning areas, areas reserved for children, trail junctions, and busier runs. Those signs, according to the Alpine Responsibility Code, should be obeyed [5], but there is lack of understanding as to what “slow” means [26]. From a risk manage-ment or snowsport safety perspective together these may be problematic when argu-ing for slow zone regulation and mandatory helmet usage and may explain research that refers to mitigation of injury rather than prevention [36–39].
To contribute to the evidence-base of snowsport safety, speed regulation, and helmet awareness, with respect to professional snowsport instructors, this research explores:
1. The actual and estimated maximum on-snow speeds of professional snowsport instructors in six mid-sized Western Canada resorts during a normal work-day
2. Recommendations for speeds in designated slow zones 3. Their knowledge and understanding of snowsport helmet effectiveness 4. The differences that exist between the characteristics of helmet wearers and non-
helmet wearers and their on-snow behaviors
The broader context of this research is Western Canadian snowsport where the governing bodies of ski and snowboard instructors are the Canadian Ski Instructors Alliance (CSIA), and the Canadian Association of Snowboard Instructors (CASI). They are responsible for instructor training, certification, and ongoing education, with education committees responsible for developing content and materials that enable and support instructor training, certification, and teaching ([40], Sec 1.3).
The mission statement of the CSIA is that the CSIA “sets the standard for the profession of ski teaching” ([40], 1.2). Their manual provides a detailed Code of Ethics to be followed, and under the heading Responsible Teaching, demands that the activities of members will be done safely and with the best interests of all par-ticipants in mind ([40], 1.4). The manual reinforces the concept of Duty of Care, taught to all instructors in every certification course, encouraging them to act as a prudent parent would act, and to conduct themselves as knowledgeable, responsi-ble, and vigilant guides, acting with strict adherence to the Alpine Responsibility Code ([40], 1.10).
Regarding helmet use, “The CSIA supports its members, staff and partners and their choices on helmet use while skiing … The CSIA encourages informed helmet use” ([40], 1.10). Currently, all CSIA Course Conductors wear helmets while conducting certification courses; however, course participants are not mandated to wear helmets. At the time of this research, helmet wearing was not mandatory for snowsport instructors in western Canada
Snowsport Instructors: Their Actual Maximum Speeds, Their Estimation of Maximum…
178
With respect to speed, the CSIA does not have a stated public position. In instructor certification courses, participants are taught to use “appropriate” speed and terrain, suitable to the skill of the guest and the goals of the lesson [41]. The CSIA promotes the Alpine Responsibility Code [5] where the first item relates to speed: “Always stay in control. You must be able to stop, or avoid other people or objects.”
2 Method
In order to explore the on-snow work-day behavior of snowsport instructors and their knowledge and understanding of key snowsport safety issues, a convenience sample of snowsport instructors was recruited across six resorts in Western Canada during the 2012/13 season. Data was collected at each resort over two consecutive days. Instructors were approached at their morning meetings and briefed on the research; up to ten instructors volunteered each day to participate. Speed, distance, and duration over the day were recorded using the “Ski Tracks” app (http://www.corecoders.com/applications/ski-tracks/) on ten iPhone 3 s. Ski Tracks is a GPS- based application that does not require WiFi or Phone connections. This smartphone application was chosen to apply a more affordable and publically accessible GPS- based technology than in previous research [1, 42]. At the time of this research, Ski Tracks was the world’s most downloaded ski application. Ski Tracks is battery effi-cient (up to 14 h of track recording), runs in the background, is simple to operate, does not require a SIM card and is ski/snowboard specific. Readouts include maxi-mum speed, average speed, ski distance (ascent and descent), accumulated vertical distance, number of runs, slope angle, and time duration.
Participants completed an anonymous questionnaire exploring: demographic information including age range, previous snowsport experience across four snowsport disciplines: snowboarding, alpine skiing, telemarking, and cross-coun-try skiing (no experience, 1 day, 2–6 days, 7–13 days, 14–27 days, 4–8 weeks, >8 weeks); history of serious snowsport injury (i.e., concussion, fracture, disloca-tion) in each snowsport discipline (no injury, 1, 2, 3, 4, 5, 6, or more); how fast they believe that skiers should ski in slow zones (open question); perception of their own maximum speed (open question) and distance travelled that day (open question); and they were asked to estimate the maximum speed at which a snow-sport helmet is effective (open question). To explore knowledge of snowsport risks, participants were asked, ‘If there are 1000 people on the slopes today, how many people do you think will be injured? (<1, 1–5, 6–10, 11–15, 16–20, more than 20); and ‘Of all snowsport injuries, what percentage do you think are head injuries? (open question). Current GPS use was also explored to track awareness and changes in uptake.
With the initial part of the questionnaire completed, and data-recording devices fitted, instructors undertook their normal day’s instructional activity. The full variety of lesson types were represented, with guests ranging from beginner through
T.J. Dickson and F.A. Terwiel
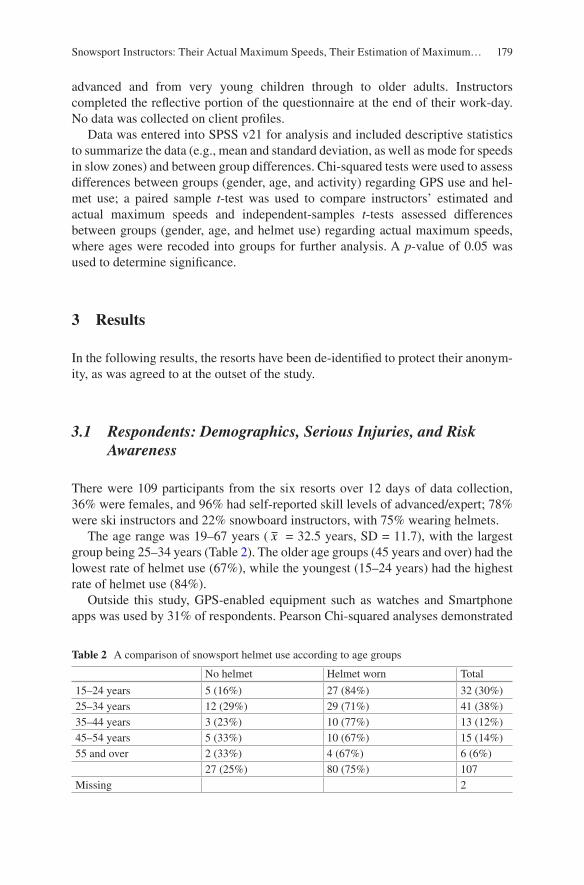
179
advanced and from very young children through to older adults. Instructors completed the reflective portion of the questionnaire at the end of their work-day. No data was collected on client profiles.
Data was entered into SPSS v21 for analysis and included descriptive statistics to summarize the data (e.g., mean and standard deviation, as well as mode for speeds in slow zones) and between group differences. Chi-squared tests were used to assess differences between groups (gender, age, and activity) regarding GPS use and hel-met use; a paired sample t-test was used to compare instructors’ estimated and actual maximum speeds and independent-samples t-tests assessed differences between groups (gender, age, and helmet use) regarding actual maximum speeds, where ages were recoded into groups for further analysis. A p-value of 0.05 was used to determine significance.
3 Results
In the following results, the resorts have been de-identified to protect their anonym-ity, as was agreed to at the outset of the study.
3.1 Respondents: Demographics, Serious Injuries, and Risk Awareness
There were 109 participants from the six resorts over 12 days of data collection, 36% were females, and 96% had self-reported skill levels of advanced/expert; 78% were ski instructors and 22% snowboard instructors, with 75% wearing helmets.
The age range was 19–67 years ( x = 32.5 years, SD = 11.7), with the largest group being 25–34 years (Table 2). The older age groups (45 years and over) had the lowest rate of helmet use (67%), while the youngest (15–24 years) had the highest rate of helmet use (84%).
Outside this study, GPS-enabled equipment such as watches and Smartphone apps was used by 31% of respondents. Pearson Chi-squared analyses demonstrated
Table 2 A comparison of snowsport helmet use according to age groups
No helmet Helmet worn Total
15–24 years 5 (16%) 27 (84%) 32 (30%)25–34 years 12 (29%) 29 (71%) 41 (38%)35–44 years 3 (23%) 10 (77%) 13 (12%)45–54 years 5 (33%) 10 (67%) 15 (14%)55 and over 2 (33%) 4 (67%) 6 (6%)
27 (25%) 80 (75%) 107Missing 2
Snowsport Instructors: Their Actual Maximum Speeds, Their Estimation of Maximum…
180
that there was no significant difference between GPS use by females and males (p = 0.81), younger and older instructors (p = 0.96), nor between skiers and snowboarders (p = 0.32).
To consider risk-awareness participants were asked if they had experienced a serious snowsport injury, defined as being a concussion, fracture, or dislocation. Most alpine ski instructors had experienced a serious injury while skiing (67%), which was the same for snowboard instructors who had experienced a serious injury while snowboarding. When estimating snowsport injury rates and propor-tion of head injuries, just 32.7% of instructors correctly estimated the injury rate at between 1–5 injuries per 1000 skier-days, 19.6% believed the injury rate was 16 or more per 1000 skier-days. Others indicated: 0 (0.9%), 6–10 (27.1%), 11–15 (19.6%). Estimates of the proportion of head injuries ranged from 0 to 80% ( x = 22.0%, SD = 17.6), 79.4% estimated that 10% or more of injuries are to the head, the remainder indicated: nil (2.8%), 1 (0.9%), 2 (5.6%), 4 (0.9%), 5 (10.3%), and 8 (0.9%).
3.2 Duration, Distance Travelled, and Maximum Speeds
Total skiing/boarding time logged was 665 h (2:49–8:50 h, x = 6:06 h, SD = 1:24 h), covering 4389.2 km ( x =6.6 km travelled per hour). The number of runs taken ranged from 1 to 25, with an average of nine runs per work-day (SD = 4.8). Maximum-recorded speeds ranged from 25.9–110.6 km/h ( x = 64.7 km/h, SD = 17.4). Estimates of their maximum speeds ranged from 10 to 140 km/h ( x = 53.0 km/h, SD = 25.3). A paired sample t-test of the estimated and actual maximum speeds was significant (t(99) = 5.92, p < 0.001) with instructors underes-timating their maximum speeds by an average of 12 km/h.
Male instructors travelled faster and further than females, with a 13.6 km/h dif-ference in mean maximum speeds (69.6 versus 56.0 km/h), and a 6.4 km difference in mean distance travelled (23.2 versus 16.8 km). Younger instructors (<25 years) travelled less distance and had lower mean maximum speeds than older instructors (i.e., 25 years plus). An independent sample t-test analysis was conducted to com-pare the actual maximum speeds for females and males, as well as younger (<25 years) and older (25 years plus) instructors. There was a significant difference in the actual maximum speeds for females ( x = 56.0 km/h, SD = 15.87) and male instructors ( x =69.6 km/h, SD = 16.54; t(105) = 4.15, p = <0.01) and also for younger ( x = 59.1 km/h, SD = 18.80) and older instructors ( x = 66.7 km/h, SD = 16.43; t(105) = 2.09, p = 0.04). For mean distance travelled, there was a sig-nificant difference between female ( x = 28.6 km, SD = 12.2) and male ( x = 46.8 km, SD = 50.4; t(105) = 2.222, p = 0.03) instructors, and between younger ( x = 27.7 km, SD = 10.5) and older ( x = 45.2 km, SD = 48.4; t(105) = 2.0.28, p = 0.045) instructors. An independent-samples t-test analysis did not reveal a significant difference between helmet wearers ( x = 64.8 km/h, SD = 18.3) and non-helmet wearers ( x = 64.4 km/h, SD = 14.8; t(107) = 2.115,
T.J. Dickson and F.A. Terwiel
181
p = 0.91) nor for GPS users ( x =63.1 km/h, SD = 16.4) and non-users ( x =65.1 km/h, SD = 18.3; t(100) = 0.53, p = 0.60).
3.3 Slow Zone Recommendations
The range in instructor-recommended maximum speed for slow zones was between 2 and 62 km/h ( x =20.8 km/h, SD = 11.9, mode = 20 km/h), with an almost 5 km/h difference in the recommendations between male ( x =22.6 km/h, SD = 12.8) and female ( x =17.8 km/h, SD = 9.8; t(101) = 1.98, p = 0.051) instructors though not statistically significant. Though there was nearly 3 km/h difference in the recommendations of older ( x =21.6 km/h, SD = 12.5) and younger instructors ( x =18.8 km/h, SD = 10.6; t(101) = 1.10, p = 0.28), this was not statistically significant either. An independent-samples t-test was con-ducted to compare the recommended maximum speeds in slow zones between helmet wearers and non-helmet wearers. There was no significant difference in estimates for helmet wearers ( x =19.9 km/h, SD = 10.7), and non-helmet wear-ers ( x = 23.3 km/h, SD = 15.2; t(103) = 1.05, p = 0.30), nor for GPS users ( x =18.1 km/h, SD = 9.3) a non-users ( x = 21.5 km/h, SD = 12.9 t(96) = 1.32, p = 0.19).
3.4 Helmet Effectiveness
Helmets were worn by 75% of respondents that day, with the estimates for the maxi-mum speed to which helmets are effective ranging from 0 to 150 km/h ( x = 54.1 km/h, SD = 29.5). An independent-samples t-test was conducted to com-pare the estimated maximum speeds to which helmets are effective between helmet wearers and non-helmet wearers. There was no significant difference in estimates for helmet wearers ( x = 54.3 km/h, SD = 27.5), and non-helmet wearers ( x = 53.7 km/h, SD = 36.5; t(90) = 0.82, p = 0.94). Those with higher maximum recorded speeds believed that their helmets were effective to higher speeds.
3.5 Characteristics of Helmet Wearers Vs. Non-Helmet Wearers
The only between group difference noted between helmet wearers and non-helmet wearers was for alpine skiing vs. snowboarding (1, n = 109) = 0.04 (Table 3). Chi- squared tests indicated there was no significant difference for gender (1, n = 107) = 0.08, nor age groups (1, n = 107) = 0.14.
Snowsport Instructors: Their Actual Maximum Speeds, Their Estimation of Maximum…
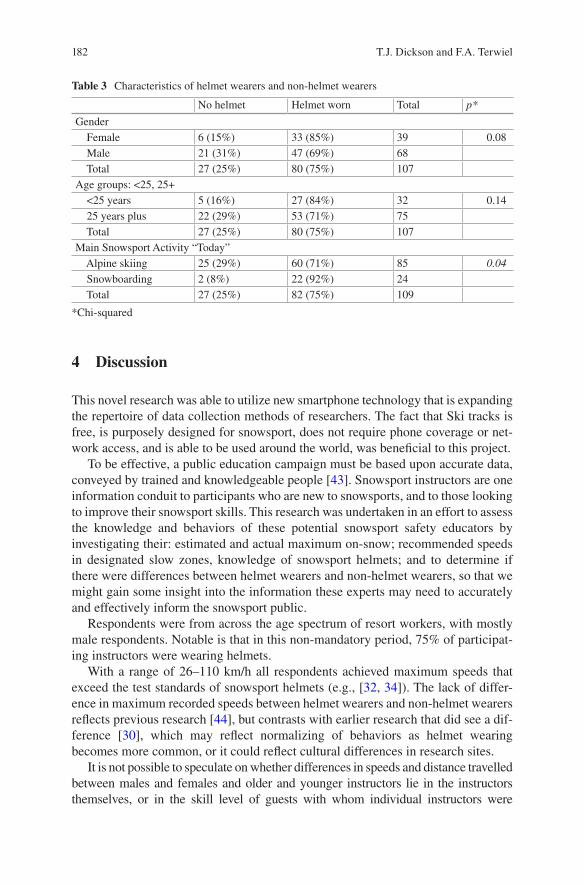
182
4 Discussion
This novel research was able to utilize new smartphone technology that is expanding the repertoire of data collection methods of researchers. The fact that Ski tracks is free, is purposely designed for snowsport, does not require phone coverage or net-work access, and is able to be used around the world, was beneficial to this project.
To be effective, a public education campaign must be based upon accurate data, conveyed by trained and knowledgeable people [43]. Snowsport instructors are one information conduit to participants who are new to snowsports, and to those looking to improve their snowsport skills. This research was undertaken in an effort to assess the knowledge and behaviors of these potential snowsport safety educators by investigating their: estimated and actual maximum on-snow; recommended speeds in designated slow zones, knowledge of snowsport helmets; and to determine if there were differences between helmet wearers and non-helmet wearers, so that we might gain some insight into the information these experts may need to accurately and effectively inform the snowsport public.
Respondents were from across the age spectrum of resort workers, with mostly male respondents. Notable is that in this non-mandatory period, 75% of participat-ing instructors were wearing helmets.
With a range of 26–110 km/h all respondents achieved maximum speeds that exceed the test standards of snowsport helmets (e.g., [32, 34]). The lack of differ-ence in maximum recorded speeds between helmet wearers and non-helmet wearers reflects previous research [44], but contrasts with earlier research that did see a dif-ference [30], which may reflect normalizing of behaviors as helmet wearing becomes more common, or it could reflect cultural differences in research sites.
It is not possible to speculate on whether differences in speeds and distance travelled between males and females and older and younger instructors lie in the instructors themselves, or in the skill level of guests with whom individual instructors were
Table 3 Characteristics of helmet wearers and non-helmet wearers
No helmet Helmet worn Total p*
Gender Female 6 (15%) 33 (85%) 39 0.08 Male 21 (31%) 47 (69%) 68 Total 27 (25%) 80 (75%) 107Age groups: <25, 25+ <25 years 5 (16%) 27 (84%) 32 0.14 25 years plus 22 (29%) 53 (71%) 75 Total 27 (25%) 80 (75%) 107Main Snowsport Activity “Today” Alpine skiing 25 (29%) 60 (71%) 85 0.04
Snowboarding 2 (8%) 22 (92%) 24 Total 27 (25%) 82 (75%) 109
*Chi-squared
T.J. Dickson and F.A. Terwiel
183
working. Regarding estimation of speeds, female instructors underestimated their actual maximum speed by 16.9 km/h, while males only underestimated maximum speeds by 8 km/h. However, of the 31% of instructors who reported GPS-enabled equipment already in use, an independent-samples t-test indicated that there was no significant difference in their means for maximum speeds, estimated maximum speeds, or recommended speeds in slow zones. That said, Mobile Applications (apps) that measure speed, distance, vertical accumulated, etc. may be changing the on-hill behav-ior of snowsport instructors and the general public. Now that these apps are ubiquitous, research is needed to ascertain whether this is the case, and if so, is this a safety man-agement problem. (http://www.banfflakelouise.com/Media- Relations/News-Releases/RockiesReplay-Allows-Skiers-and-Snowboarders-to-Shred-with-Cred-at-Banff- -National-Park-Ski-Resorts).
Previous research on slow zone recommendations in a study of a single resort [26] revealed a range of 5–60 km/h with a slightly higher mean of 23.8 km/h and a higher mode of 30 km/h. Experts in this previous research had a range of 10–50 km.h and much higher mean of 33.4 m/h. This survey of instructors across six resorts reveals a much more conservative recommendation for slow zones than the broader public at just one resort.
With regard to estimates of the speeds to which helmets are effective, there was a remarkable 150 km/h range, an indication that, at the time of this research, information about the speed to which helmets are tested to meet the helmet’s limited performance requirements had failed to reach this group of instructors. The mean of 54 km/h across the six resorts is the same as previous research with instructors at a single resort [13]. When considering speed and helmet effective-ness it is worth noting that the kinetic energy at 65 km/h is nearly eight times higher than at 23 km/h [30] which will impact the ability of a helmet to reduce head accelerations as per the standards. The wide range regarding speeds to which helmets are expected to be effective indicates a knowledge gap between snowsport instructors and the helmet industry. Commensurate with a risk com-munication approach it is necessary for instructors to be educated about the design and use of helmets relative to the speeds achieved in normal snowsport behaviors, in order to be able to provide accurate information to their students as part of a broader snowsport safety strategy. The current mandate to wear hel-mets while working points to further research to ensure that helmets are being used effectively such as looking at how instructors purchase their helmets (used versus new), how the helmets fit, how they are worn, and in particular, how they are cared for [45].
The higher than average rate of serious injury reported may reflect the higher exposure levels of instructors compared to the average participant who only partici-pates in snowsports 10 days a year [46]. Some instructors are working back-to-back winters (teaching in the northern hemisphere December through April and in the southern hemisphere June through September), effectively doubling their yearly exposure. Having been exposed to or perceiving more serious injuries than the norm may have contributed to their overestimation of the risk of injury in the broader public, but does not appear to have impacted their behaviors such as maximum recorded speeds. Nearly one-third correctly estimated snowsport injuries to be in
Snowsport Instructors: Their Actual Maximum Speeds, Their Estimation of Maximum…
184
the range of 1–5 injuries per 1000 skier visits, at the time of the research it was closer to 2 per 1000 skier visits in Western Canada [12]; most overestimated the head injury rate which was close to 9% of reported injuries at the time [12]. This may be a result of the increased interest in head injuries, particularly concussions, across a range of sports.
While snowsport instructors are well positioned to support a public education campaign, this research has demonstrated that neither the CSIA nor CASI provide information through their manuals to their members upon which they can make an informed decision about helmet use or the effectiveness of helmets. This raises a further question as to who could, or should, help provide relevant information about helmet effectiveness. Further, the research has shown that for the sample here, their knowledge of snowsport risks, helmet effectiveness, expectations about behaviors in slow zones, and their ability to estimate their speeds is problematic if they are to be central to a public education campaign that will clarify snowsport safety for the broader public.
5 Limitations
Instructors were fitted with the GPS-logging device at the beginning of their work- day and turned the devices in at the end of the day. We are unable to deter-mine whether instructors were working with guests every minute that the devices were recording, or whether they may have gone skiing or boarding on their own between or after lessons. The research was conducted during the height of the Western Canadian snowsport season, during which time most instructors are fully utilized, however there is no way to confirm that all data collected represented time with students. All instructors were in uniform for the duration of the record-ing time, so whether with students or not, as they were still in uniform they were in the public eye.
While this research was undertaken to try to understand the knowledge levels of ski and snowboard instructors in general, the relatively small sample size and the convenience sample limits the generalizability to a larger population.
Speed analysis, in the form of maximum speed rather that mean speed, was the unit of analysis in this research. This is because the Ski Tracks application mea-sures speed from the time it begins recording until it is shut off. That means Ski Tracks measures speed while standing still, walking, riding the chair lift, etc. With Ski Tracks the only reliable measure of speed while sliding downhill is maximum speed, as maximum speed cannot occur in situations other than skiing or snow-boarding while on-hill during the work-day.
Finally, while the focus on speeds was downplayed it was possible that instruc-tors were aware that speed data was being collected, and as such, may have modi-fied their behavior, as per the Hawthorne Effect [47].
T.J. Dickson and F.A. Terwiel
185
6 Conclusion
Consistent with previous research on recreational participants, during this novel research that utilized a smartphone application, snowsport instructors: (1) underes-timated the speeds they travelled by an average of 12 km/h, (2) recommended lower slow zone speeds than recreational participants, (3) overestimated the speeds at which helmets may be effective, as indicated by industry standards, and (4) overes-timated the injury risk in snowsports.
Finally, it has been proposed that education programs are the best way to inform both instructors and the general public about safe behavior within resorts, involving both the use of personal protective equipment and personal and group behavior. Research is necessary to determine if this is, in fact, the case in a snowsport environment.
References
1. Dickson TJ, Trathen S, Waddington G, Terwiel FA, Baltis D (2016b) A human factors approach to snowsport safety: novel research on pediatric participants’ behaviors and head injury risk. Appl Ergon 53(Part A):79–86. doi:10.1016/j.apergo.2015.08.006
2. Dickson TJ, Trathen S, Waddington GS (2015) Speeds of pediatric snowsport participants: insights for injury prevention strategies. In: Johnson RJ, Shealy JE, Greenwald RM (eds) Skiing trauma and safety: 20th volume, STP1582 ASTM international, West Conshohocken, PA, pp 141–149
3. Bergstrom KA, Ekeland A (2004) Effect of trail design and grooming on the incidence of injuries at alpine ski areas. Br J Sports Med 38(3):264–268
4. Kuepper T, Steffgen J, Gore C, Perren B, Zahnd P, Gore R (2002) Qualified rescue by ski patrols–safety for the skier. Int J Sports Med 23(7):524–529
5. Canada West Ski Areas Association (2016) Policy–Alpine Responsibility Code. http://www.cwsaa.org/policy/alpine-responsibility-code.html. Accessed 19 Jan 2016
6. Levy AS, Hawkes AP, Rossie GV (2007) Helmets for skiers and snowboarders: an injury pre-vention program. Health Promot Pract 8(3):257–265
7. Cusimano MD, Kwok J (2010) The effectiveness of helmet wear in skiers and snowboarders: a systematic review. Br J Sports Med 44:781–786. doi:10.1136/bjsm.2009.070573
8. Hagel BE, Pless IB, Goulet C, Platt RW, Robitaille Y (2005) Effectiveness of helmets in skiers and snowboarders: case-control and case crossover study. Br Med J 330(7486):281. doi:10.1136/bmj.38314.480035.7C
9. Haider AH, Saleem T, Bilaniuk JW, Barraco RD, Committee obotEAftSoTICP (2012) An evidence-based review: efficacy of safety helmets in the reduction of head injuries in recre-ational skiers and snowboarders. J Trauma Acute Care Surg 73(5):1340–1347. 1310.1097/TA.1340b1013e318270bbca
10. Jung C, Zweckberger K, Schick U, Unterberg A (2011) Helmet use in winter sport activities—attitude and opinion of neurosurgeons and non-traumatic-brain-injury-educated persons. Acta Neurochir 153(1):101–106. doi:10.1007/s00701-010-0704-8
11. Russell K, Christie J, Hagel BE (2010) The effect of helmets on the risk of head and neck injuries among skiers and snowboarders: a meta-analysis. Can Med Assoc J 182(4):333–340
12. Dickson TJ, Trathen S, Terwiel FA, Waddington G, Adams R (2016a) Head injury trends and helmet use in skiers and snowboarders in Western Canada, 2008–09 to 2012–13: an ecological study. Scand J Med Sci Sport. Doi:10.1111/sms.12642
Snowsport Instructors: Their Actual Maximum Speeds, Their Estimation of Maximum…
186
13. Terwiel FA, Dickson TJ (2015) Helmets: what do snowsport instructors and guests know and expect? In: Johnson RJ, Shealy JE, Greenwald RM (eds) Skiing trauma and safety: 20th vol-ume, STP 1582. ASTM International, West Conshohocken, PA, pp 3–21. doi:10.1520/STP158220140008
14. Bussewitz C (2010) California considers mandatory ski helmet laws. USA Today 15. CBC News (2012) Ski helmets lack mandatory Canadian safety rules: Canadian Standards
Association alpine helmet guidelines. Under review 16. Ruedl G, Kopp M, Burtscher M (2010a) Editorial: mandatory ski helmets? Can Med Assoc
J 182(9):942 17. Ruedl G, Kopp M, Burtscher M (2012b) Editorial: is ski helmet legislation more effective than
education? Br J Sports Med 46(16):1091–1092. doi:10.1136/bjsports-2012-091374 18. Covello V, Sandman PM (2001) Risk communication: evolution and revolution. In: Wolbarst
A (ed) Solutions to an environment in peril. John Hopkins University Press, Baltimore, pp 164–178
19. Brandauer T, Senner V, Woitschell J (2010) Speed and ability as modulating factors of the flow experience while skiing on prepared slopes. In: Müller E, Lindinger S, Stöggl T, Pfusterschmeid J (eds) Science and skiing V. Meyer & Meyer Sport, Maidenhead, pp 85–93
20. Dickson TJ, Terwiel FA (2013) Supervising snowsport activities: a reflection upon legislation, policies, guidelines and practice. Aust J Outdoor Educ 16(2):24–41
21. Ruedl G, Abart M, Ledochowski L, Burtscher M, Kopp M (2012a) Self reported risk taking and risk compensation in skiers and snowboarders are associated with sensation seeking. Accid Anal Prev 48(0):292–296. doi:10.1016/j.aap.2012.01.031
22. Chaze B, McDonald P (2009) Head injuries in winter sports: Downhill skiing, snowboarding, sledding, snowmobiling, ice skating and ice hockey. Phys Med Rehabil Clin N Am 20(1):287–293
23. Franz T, Hasler RM, Benneker L, Zimmermann H, Siebenrock KA, Exadaktylos AK (2008) Severe spinal injuries in alpine skiing and snowboarding: a 6-year review of a tertiary trauma centre for the Bernese Alps ski resorts, Switzerland. Br J Sports Med 42(1):55–58. doi:10.1136/bjsm.2007.038166
24. Spörri J, Kröll J, Amesberger G, Blake OM, Müller E (2012) Perceived key injury risk factors in World Cup alpine ski racing—an explorative qualitative study with expert stakeholders. Br J Sports Med. bjsports-2012-091048
25. Brunner F, Ruedl G, Kopp M, Burtscher M (2015) Factors associated with the perception of speed among recreational skiers. PLoS One 10(6):e0132002
26. Dickson TJ, Terwiel FA, Waddington GS, Trathen S (2012) Easiest routes and slow zones: how fast do I go?: speeds and distances of recreational and expert snowsport participants. In: Johnson RJ, Shealy JE, Greenwald RM, Scher I (eds) STP 1553 skiing trauma and safety: 19th volume. ASTM International, West Conshohocken, PA, pp 184–197. doi:10.1520/STP104413
27. Dickson TJ, Waddington G, Trathen S, Baltis D, Adams R (2013) Technology applications to enhance understanding of real-time snowsport head accelerations. Procedia Eng 60(0):220–225. doi:10.1016/j.proeng.2013.07.079
28. Ruedl G, Brunner F, Woldrich T, Faulhaber M, Kopp M, Nachbauer W, Burtscher M (2013) Factors associated with the ability to estimate actual speeds in recreational alpine skiers. Wilderness Environ Med 24(2):118–123. doi:10.1016/j.wem.2012.11.021
29. Scher I, Richards D, Carhart M, Thomas R, Hurlen N, Lam T (2008) Pediatric head and neck injuries in snow sports: evaluating the influence of helmets. J ASTM Int 5(4):91–100
30. Shealy JE, Ettlinger CF, Johnson RJ (2005) How fast do winter sports participants travel on alpine slopes? J ASTM Int 2(7):12092–12098
31. Williams R, Delaney T, Nelson E, Gratton J, Laurent J, Heath B (2007) Speeds associated with skiing and snowboarding. Wilderness Environ Med 18(2):102–105
32. ASTM International (2000) F2040 Standard specification for helmets used for recreational snow sports. ASTM International, West Conshohocken, PA
33. Canadian Standards Association (2009) CSA Z263.1–08 Recreational alpine skiing and snow-boarding helmets. Ontario
T.J. Dickson and F.A. Terwiel
187
34. European Committee for Standardization (1996) EN 1077:1996 Helmets for alpine skiers. European Committee for Standardization, Brussels.
35. Snell Memorial Foundation (1998) 1998 Standard for Protective Headgear RS-98 For Recreational Skiing and Snowboarding. http://www.smf.org/standards/ski/rs98std.html. Accessed 18th May 2009
36. Editor (2014) Families approve of increased slow zone safety. The Whistler News 37. Fidel S (2010) Reckless skier hurts 6-year-old girl. Deseret News 38. Scher I, Richards D, Carhart M (2006) Head injury in snowboarding: Evaluating the protective
role of helmets. J ASTM Int 3(4):14203–14209 39. Shealy JE, Johnson RJ, Ettlinger CF, Scher I (2015) Role of helmets in mitigation of head
injuries: epidemiologic study of head injuries to skiers. In: Johnson RJ, Shealy JE, Greenwald RM (eds) Skiing trauma and safety: 20th volume, STP1582 ASTM international, West Conshohocken, PA, pp 22–36
40. Canadian Ski Instructor’s Alliance (2011) Canadian Ski teaching. Canadian Ski Instructor’s Alliance, Montreal, QB
41. Canadian Ski Instructor’s Alliance (2013) Canadian Ski teaching 42. Dickson TJ, Terwiel FA, Waddington G, Trathen S (2011) Evaluation of the use of a GPS data-
logging device in a snowsport environment. Procedia Eng 13:470–475. doi:10.1016/j.proeng.2011.05.116
43. Poulos R, Donaldson A, Finch C (2010) Towards evidence-informed sports safety policy for New South Wales, Australia: assessing the readiness of the sector. Inj Prev 16(2):127–131
44. Ruedl G, Pocecco E, Sommersacher R, Gatterer H, Kopp M, Nachbauer W, Burtscher M (2010b) Factors associated with self-reported risk-taking behaviour on ski slopes. Br J Sports Med 44(3):204–206. doi:10.1136/bjsm.2009.066779
45. Shealy JE, Stepan L (2013) Head Injury and Helmets in Skiing & Boarding. Paper presented at the Can West Ski Areas Association Spring Meeting, 6th–9th May, Kelowna, BC, Canada
46. Canadian Ski Council (2011) 2010–2011 Canadian Skier and Snowboarder Facts and Stats 47. Landsberger HA (1958) Hawthorne revisited: Management and the worker: its critics, and
developments in human relations in industry. Cornell Studies Series, vol 9. Cornell University, New York
Open Access This chapter is distributed under the terms of the Creative Commons Attribution-Noncommercial 2.5 License (http://creativecommons.org/licenses/by-nc/2.5/) which permits any noncommercial use, distribution, and reproduction in any medium, provided the original author(s) and source are credited.
The images or other third party material in this chapter are included in the work’s Creative Commons license, unless indicated otherwise in the credit line; if such material is not included in the work’s Creative Commons license and the respective action is not permitted by statutory regu-lation, users will need to obtain permission from the license holder to duplicate, adapt or reproduce the material.
Snowsport Instructors: Their Actual Maximum Speeds, Their Estimation of Maximum…
189© The Author(s) 2017 I.S. Scher et al. (eds.), Snow Sports Trauma and Safety, DOI 10.1007/978-3-319-52755-0_15
Factors Associated with Alcohol Intake in Mountain Top Huts Among Slope Tourers
Anika Frühauf, Gerhard Ruedl, Christian Kickenweiz, Sepp Thöni, and Martin Kopp
Abstract Introduction: Ski touring along ski slopes (slope touring) has increased in recent years on Austrian ski slopes. Alcohol consumption is proposed to be a risk factor in winter sports-related accidents. The aim of this study was to evaluate fac-tors associated with alcohol intake among uninjured slope tourers.
Methods: A total of 328 slope tourers (45% females) with a mean age of 43.8 ± 11.8 years were questioned in February and March 2014 in two huts at the top of two Austrian ski areas. Questionnaires were conducted during daytime (9.00 a.m.–4.00 p.m.) and nighttime hours (5.00 p.m.–9.45 p.m.) with a following breath alcohol test. Slope tourers filled in on demographics, skill level, risk-taking behavior, ski helmet use, and alcohol consumption. In addition, slope tourers who had consumed alcohol were asked to estimate their individual breath alcohol level.
Results: In total, 187 (57%) of the slope tourers reported that they had consumed alcohol at the hut. Male sex, a higher BMI, more ski touring experience, and less ski helmet use were significantly associated with alcohol intake among slope tourers. Mean-tested breath alcohol level was 0.24 ± 0.17‰; this significantly differed from the mean estimated breath alcohol level of 0.18 ± 0.12‰. Male slope tourers had a significantly higher breath alcohol level than female slope tourers (0.26 ± 0.17 vs. 0.22 ± 0.15‰, p = 0.014).
Conclusion: Approximately 60% of interviewed slope tourers, predominantly males, consumed alcohol in the huts. In addition, male slope tourers had a signifi-cantly higher breath alcohol level compared to female slope tourers and mean-tested breath alcohol level was underestimated by approximately 25% on average.
Keywords Ski touring • Slope touring • Alcohol consumption • Risk factors
A. Frühauf, M.Sc. (*) • G. Ruedl • C. Kickenweiz • S. Thöni • M. Kopp Department of Sport Science, University of Innsbruck, Fürstenweg 185, 6020 Innsbruck, Austriae-mail: [email protected]
190
1 Introduction
In the Austrian mountainous regions alone, there is an estimated number of eight million ski visitors per year [1]. Slope touring (= the ascending of a ski slope with ski touring equipment and following downhill skiing on the slope) has increased throughout the years with an estimated number of 80,000 slope tourers on Austrian ski slopes per year [2]. The region around the city of Innsbruck hosts approximately 30,000 slope tourers per year [3]. Reasons given for the growing number of slope tourers include the easy ascent, physical activity-related health promotion, no risk of avalanches on slopes, and social aspects [3]. This progress, however, often causes troubles with the lift companies because of safety risks through ascending slope tourers during daytime hours and descending slope tourers during nighttime hours [2]. Overall, little is known about injuries and risk factors in slope touring. In a preliminary study, Ruedl et al. investigated potential factors associated with injuries in slope touring [2]. More than 450 slope tourers (60.1% males) with a mean age of 39.3 ± 14.4 years reported that they perform about 20.6 ± 16.0 slope tours per sea-son mainly with a partner (48%) and during the day (51%) [2]. A total of 57 persons (12.6%) reported that they have suffered at least one injury during slope touring that required medical care; this corresponds to a rate of six injuries per 1000 slope tours. Main causes of injury were falls (78%) and collisions with another person (15%), and the main injured body part was the knee (36%) [2]. Slope tourers with an injury history were more likely to report wearing back protectors and to have experienced more falls during downhill skiing [2]. They were also more likely to report listening to music more often during downhill skiing and to consume alcohol more frequently in the hut compared to slope tourers without an injury history [2]. In a survey among slope tourers, participants reported to fear an injury mostly through a collision with intoxicated, descending skiers while ascending the mountain uphill or an accident with the cable winch of a snow groomer while skiing downhill on the slope during night [4]. As alcohol consumption is often associated with winter sports-related injuries [5], the aim of this study was to evaluate factors associated with alcohol intake among uninjured slope tourers.
2 Methods
Slope tourers were assessed at two different skiing huts (>750 m of ascent) in Tyrol, Austria. Assessments took place during daytime (9.00 a.m.–4.00 p.m.) and night-time hours (5.30 p.m.–9.45 p.m.) in February and March 2014. The mean duration of completing the questionnaires was about 15–25 min. Inclusion criterion was the ascent of the person with skis. Eight persons cancelled the participation at an early stage and were therefore excluded. Before leaving the hut, participants were asked to perform an alcohol breath test with the LION FUEL CELL SENSOR 500 to measure their breath alcohol concentration; to avoid false-positive results, a time interval of at least 15 min after the last drink was assured before breathalyzing.
A. Frühauf et al.
191
Besides sociodemographic data (age, sex, BMI, education degree), participants were asked about their subjective skill level (beginner/intermediate, advanced, expert) according to Sulheim et al. [6] and risk-taking behavior (more cautious vs. more risky) according to Sulheim et al. [7] and Ruedl et al. [8], years of experience in ski touring, weekly frequency of ski touring (regularly = minimum one tour per week vs. irregularly), amount of persons in the group (alone vs. two persons vs. three and more persons), and ski helmet use. Additionally, participants had to answer questions about how frequently they consumed alcohol during the last five ski tours (never vs. once vs. several times vs. always), their perceived alcohol intake (Do you feel intoxicated?—not at all vs. little vs. moderate vs. strongly), and their estimated alcohol level (in ‰).
3 Statistical Analysis
Data are presented as means and standard deviations and as absolute and relative frequencies. Chi-square tests were used to compare the groups of slope tourers with and without alcohol intake regarding sex, education degree, time of the day (day vs. night), skill level, risk-taking behavior, helmet use, group size, and ski touring fre-quency. Mann-Whitney-U Tests were used to compare both groups (alcohol vs. no alcohol intake) regarding age, BMI, and years of experience. In addition, Mann- Whitney- U Tests were used to compare mean breath alcohol level between male and female slope tourers. One-way ANOVAs were used to calculate differences between mean alcohol level and perceived alcohol intake, and between mean breath alcohol level and alcohol consumption during the last five ski tours. Spearman correlation analyses were used to show relationships between estimated and measured breath alcohol level. All p-values were two-tailed and values of p < 0.05 were considered to indicate statistical significance.
4 Results
A total of 328 slope tourers (45% females) with a mean age of 43.8 ± 11.8 years and a mean BMI of 23.0 ± 2.9 participated in this study. The majority of the slope tour-ers were advanced skiers (55%) and performed their sport in a favored group size of two people (75%).
In total, 187 (57%) of slope tourers stated that they consumed alcohol in the hut. Mean-tested breath alcohol level was 0.24 ± 0.17‰ (range: 0–1.32‰) which sig-nificantly differed from the mean estimated breath alcohol level of 0.18 ± 0.12‰ (range: 0–0.5‰) (p < 0.001). Male slope tourers had a significantly higher breath alcohol level than female slope tourers (0.26 ± 0.17 vs. 0.22 ± 0.15‰, p = 0.014).
None of the slope tourers with alcohol intake felt strongly intoxicated. In total, 11 (6%) participants felt moderately intoxicated with a tested mean alcohol level of
Factors Associated with Alcohol Intake in Mountain Top Huts Among Slope Tourers
192
0.45 ± 0.35‰, 50 (27%) participants felt little intoxicated with a tested mean alco-hol level of 0.29 ± 0.17‰, and 126 (67%) participants did not feel intoxicated at all with a tested mean alcohol level of 0.21 ± 0.12‰. The subjective feeling of intoxi-cation showed a significant difference between the three groups in terms of the tested breath alcohol level (p < 0.001). There was a strong, significant correlation between estimated and measured breath alcohol level (r = 0.854; p < 0.001).
Regarding the alcohol consumption during the last five ski tours, one-way ANOVA showed that those participants who drank always (N = 44; mean alcohol level of 0.32 ± 0.22‰) or several times (N = 83; mean alcohol level of 0.24 ± 0.14‰) had significantly higher mean alcohol levels than those who drank just once (N = 46; mean alcohol level of 0.18 ± 0.11‰) or never (N = 12; mean alcohol level of 0.20 ± 0.12‰) (p < 0.001).
Table 1 shows two groups of slope tourers divided into an Alcohol Intake Group (AIG) and a No-Alcohol Intake Group (NAIG). AIG significantly differed from NAIG regarding sex, BMI, ski touring experience, and ski helmet use (see Table 1).
5 Discussion
The aim of this study was to evaluate factors associated with alcohol intake among slope tourers who visited mountain top huts in Austria in the winter of 2014. In total, 57% of the slope tourers stated that they consumed alcohol in the hut. Based on data collected from self-report questionnaires, male sex, higher BMI, more ski touring experience, and less ski helmet use were significantly associated with alco-hol intake among slope tourers. In addition, male slope tourers had a significantly higher breath alcohol level than female slope tourers and mean-tested breath alcohol level was significantly higher (about 25%) compared to the mean estimated breath alcohol level.
The cohort of slope tourers in the current study with a mean age of about 44 years consisted primarily of males (55%). In comparison, in the study on slope tourers by Ruedl et al. 60% were males and mean age was about 39 years [2]. Furthermore, the high number of slope tourers with a self-estimated advanced or expert skiing skill level and the favored group size of two persons remain comparable throughout vari-ous studies [2, 4, 9].
The high number of slope tourers with alcohol consumption in this study must be viewed with caution as it needs to be taken into account that assessments were con-ducted in the huts. Since not all slope tourers visit the huts, a much lower proportion of alcohol consumption may be observed if tests were conducted of slope tourers in the parking area.
In the current study, 66% of slope tourers who consumed alcohol were males and the mean breath alcohol level was significantly higher among male compared to female slope tourers. Those sex differences regarding alcohol consumption are widely known [10, 11] and occur even in adolescence [12]. Schmid stated that in young adults aged 19–20 years, 62% of males and 32% of females consume alcohol
A. Frühauf et al.
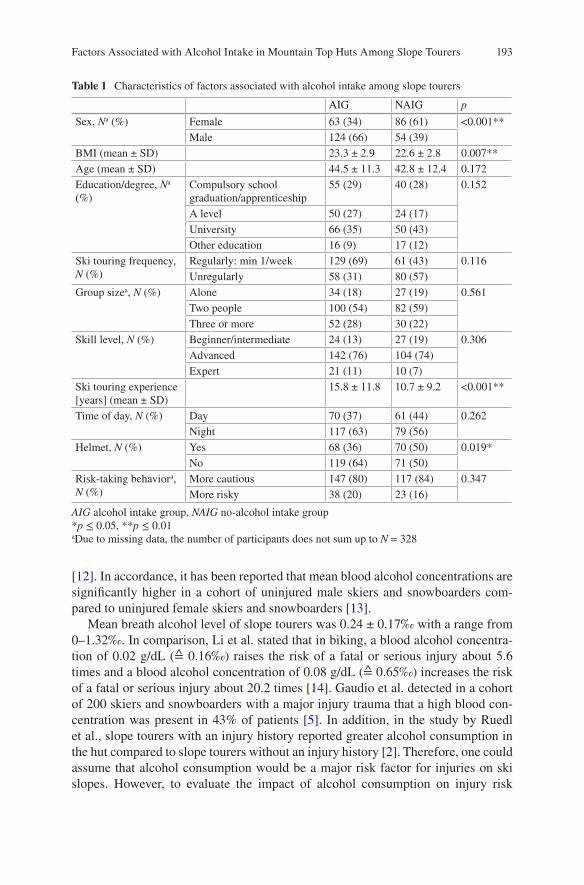
193
[12]. In accordance, it has been reported that mean blood alcohol concentrations are significantly higher in a cohort of uninjured male skiers and snowboarders com-pared to uninjured female skiers and snowboarders [13].
Mean breath alcohol level of slope tourers was 0.24 ± 0.17‰ with a range from 0–1.32‰. In comparison, Li et al. stated that in biking, a blood alcohol concentra-tion of 0.02 g/dL (≙ 0.16‰) raises the risk of a fatal or serious injury about 5.6 times and a blood alcohol concentration of 0.08 g/dL (≙ 0.65‰) increases the risk of a fatal or serious injury about 20.2 times [14]. Gaudio et al. detected in a cohort of 200 skiers and snowboarders with a major injury trauma that a high blood con-centration was present in 43% of patients [5]. In addition, in the study by Ruedl et al., slope tourers with an injury history reported greater alcohol consumption in the hut compared to slope tourers without an injury history [2]. Therefore, one could assume that alcohol consumption would be a major risk factor for injuries on ski slopes. However, to evaluate the impact of alcohol consumption on injury risk
Table 1 Characteristics of factors associated with alcohol intake among slope tourers
AIG NAIG p
Sex, Na (%) Female 63 (34) 86 (61) <0.001**Male 124 (66) 54 (39)
BMI (mean ± SD) 23.3 ± 2.9 22.6 ± 2.8 0.007**Age (mean ± SD) 44.5 ± 11.3 42.8 ± 12.4 0.172Education/degree, Na (%)
Compulsory school graduation/apprenticeship
55 (29) 40 (28) 0.152
A level 50 (27) 24 (17)University 66 (35) 50 (43)Other education 16 (9) 17 (12)
Ski touring frequency, N (%)
Regularly: min 1/week 129 (69) 61 (43) 0.116Unregularly 58 (31) 80 (57)
Group sizea, N (%) Alone 34 (18) 27 (19) 0.561Two people 100 (54) 82 (59)Three or more 52 (28) 30 (22)
Skill level, N (%) Beginner/intermediate 24 (13) 27 (19) 0.306Advanced 142 (76) 104 (74)Expert 21 (11) 10 (7)
Ski touring experience [years] (mean ± SD)
15.8 ± 11.8 10.7 ± 9.2 <0.001**
Time of day, N (%) Day 70 (37) 61 (44) 0.262Night 117 (63) 79 (56)
Helmet, N (%) Yes 68 (36) 70 (50) 0.019*No 119 (64) 71 (50)
Risk-taking behaviora, N (%)
More cautious 147 (80) 117 (84) 0.347More risky 38 (20) 23 (16)
AIG alcohol intake group, NAIG no-alcohol intake group*p ≤ 0.05, **p ≤ 0.01aDue to missing data, the number of participants does not sum up to N = 328
Factors Associated with Alcohol Intake in Mountain Top Huts Among Slope Tourers
194
among winter sport participants, a case-control study design comparing the breath or blood alcohol levels of injured to uninjured persons would be necessary. Earlier studies using such a study design, however, found no significant differences with respect to mean blood alcohol concentration between injured and uninjured winter sport participants [13, 15, 16]. In contrast, Burtscher et al. stated that alcohol con-sumption on the skiing day was a risk factor for falls in skiers and snowboarders [17]. This might be due to the fact that alcohol consumption impairs the central nervous system function, resulting in decrements in cognitive function and motor skills [18]. Although a fall does not imply an injury, self-inflicted falls are the major cause for injuries during skiing and snowboarding [17].
The present study found that slope tourers significantly underestimated their breath alcohol level considering that the mean-tested breath alcohol level was about 25% higher compared to the mean estimated breath alcohol level. Underestimation of alcohol intoxication might be a risk factor for a fall causing an injury on the ski slope.
Regarding participants’ perceptions of alcohol consumption, none of the slope tourers with alcohol intake reported feeling strongly intoxicated, and a decreasing perception of the individual alcohol level was significantly associated with a decreasing mean-tested breath alcohol level. This result implies that many of the slope tourers may be unaware of the fact that there is sufficient alcohol in their sys-tem to potentially cause impairments. Even low doses of alcohol significantly pro-duced more incorrect reactions during a peripheral vision test [19] and might have further impacts on athletic and cognitive performance [18, 20].
In this study, a higher frequency of alcohol consumption during the last five ski tours was significantly associated with a higher mean breath alcohol level indicating a possible association between drinking frequency during ski tours and level of alcohol intoxication. In addition, slope tourers with alcohol consumption reported significantly higher BMIs compared to those without alcohol intake. This might be due to the fact that studies reported positive findings between alcohol intake and weight gain [21, 22].
Slope tourers with and without alcohol consumption did not differ in this study with regard to age, group size, educational degree, self-reported skill level, and risk- taking behavior. Group size or peer group are likely to influence alcohol consump-tion as studies have shown that team athletes consume more alcohol than individual athletes [10, 23, 24]; however, this result was not reflected in the present study.
Slope tourers with alcohol intake showed a significantly higher mean ski touring experience (16 vs. 11 years) compared to those who did not drink alcohol in the hut. Although studies indicate that sport participation is associated with alcohol use [25], to our knowledge, no literature is available concerning the years of sport par-ticipation and alcohol intake.
Slope tourers with alcohol intake were significantly less likely to report wearing a ski helmet compared to tourers with no alcohol intake (36 vs. 50% helmet use). This might be the result of the duration in sport participation because AIG slope tour-ers have engaged in their sport over a longer period of time (16 years vs. 11 years). Since helmet use rates have increased significantly over the last decade, the NAIG
A. Frühauf et al.
195
might have started slope touring with helmet right from the beginning. As Ruedl et al. presented, the head was involved in 14% of injuries among slope tourers [2]. A helmet would be a meaningful safety equipment to reduce head injury risk [7].
In conclusion, about 60% of the interviewed slope tourers consumed alcohol in the hut. Male sex, a higher BMI, a longer ski touring experience, and less ski helmet use were significantly associated with alcohol intake among slope tourers. In addi-tion, male slope tourers had a significantly higher breath alcohol level than female slope tourers and mean-tested breath alcohol level was significantly higher com-pared to the mean estimated breath alcohol level by about 25%.
Obtained results require preventive interventions to reduce alcohol consumption among slope tourers. The interventions should be especially addressed to the group of male slope tourers with over 10 years of experience in ski touring and an age of about 40 years.
References
1. Burtscher M, Bodner T, Burtscher J et al (2013) Life-style characteristics and cardiovascular risk factors in regular downhill skiers: an observational study. BMC Publ Health 13:788. doi:10.1186/1471-2458-13-788
2. Ruedl G, Pocecco E, Kopp M et al (2015) Verletzungshäufigkeit und unfallursachen beim pistentourengehen—eine pilotstudie. Sportverletz Sportschaden 29(01):46–50. doi:10.1055/s-0034-1399181
3. Essl J, Koch W (2011) Pistentouren im Großraum Innsbruck: 3–10 4. Pröbstl U (2012) Skitourengeher auf pisten—neue zielgruppe oder trainingsvariante?
Mountainmanager (4):54–55 5. Gaudio RM, Barbieri S, Feltracco P et al (2010) Impact of alcohol consumption on winter
sports-related injuries. Med Sci Law 50(3):122–125 6. Sulheim S, Ekeland A, Bahr R (2007) Self-estimation of ability among skiers and snowboard-
ers in alpine skiing resorts. Knee Surg Sports Traumatol Arthrosc 15(5):665–670. doi:10.1007/s00167-006-0122-x
7. Sulheim S, Holme I, Ekeland A et al (2006) Helmet use and risk of head injuries in alpine ski-ers and snowboarders. JAMA 295(8):919–924. doi:10.1001/jama.295.8.919
8. Ruedl G, Pocecco E, Sommersacher R et al (2010) Factors associated with self-reported risk- taking behaviour on ski slopes. Br J Sports Med 44(3):204–206. doi:10.1136/bjsm.2009.066779
9. Kopp M, Wolf M, Ruedl G et al (2016) Differences in sensation seeking between alpine skiers, snowboarders and ski tourers. J Sports Sci Med 15(1):11–16
10. Watten RG (1995) Sports, physical exercise and use of alcohol. Scand J Med Sci Sports 5(6):364–368
11. Greenfield TK, Room R (1997) Situational norms for drinking and drunkenness: trends in the US adult population, 1979–1990. Addiction 92(1):33–47
12. Schmid H (2002) Sport, alkohol, tabak und illegale drogen in der entwicklung von jugendli-chen zu jungen erwachsenen. Zeitschrift für Gesundheitspsychologie 10(1):36–48. doi:10.1026//0943-8149.10.1.36
13. Salminen S, Pohjola J, Saarelainen P et al (1996) Alcohol as a risk factor for downhill skiing trauma. J Trauma 40(2):284–287
14. Li G, Shahpar C, Soderstrom CA et al (2000) Alcohol use in relation to driving records among injured bicyclists. Accid Anal Prev 32(4):583–587
Factors Associated with Alcohol Intake in Mountain Top Huts Among Slope Tourers
196
15. Bouter LM (ed) (1988) Alcohol consumption and injury risk in downhill skiing: Injury risk in downhill skiing. Results from an etiological case-control study conducted among Dutch skiers. In: Sportwetenschappelijke onderzoekingen, vol 14. De Vrieseborch, Haarlem, pp 89–107
16. Made C, Elmqvist L (1996) Downhill Skiing injuries in Lapland, Sweden: a survey including alcohol monitoring and one-year follow-up. In: Mote CD, Johnson RJ, Hauser W et al (eds) Skiing Trauma and Safety, vol 10. ASTM International, West Conshohocken, PA, pp 98-98-6
17. Burtscher M, Pühringer R, Werner I et al (2010) Gender-specific effects of smoking and alco-hol consumption on the risk of falling in downhill skiers. J ASTM Int 7(7):102815. doi:10.1520/JAI102815
18. Shirreffs SM, Maughan RJ (2006) The effect of alcohol on athletic performance. Curr Sports Med Rep 5(4):192–196
19. Langer P, Holzner B, Magnet W et al (2005) Hands-free mobile phone conversation impairs the peripheral visual system to an extent comparable to an alcohol level of 4–5 g 100 ml. Hum Psychopharmacol 20(1):65–66. doi:10.1002/hup.654
20. Barnes MJ (2014) Alcohol: impact on sports performance and recovery in male athletes. Sports Med 44(7):909–919. doi:10.1007/s40279-014-0192-8
21. Sayon-Orea C, Martinez-Gonzalez MA, Bes-Rastrollo M (2011) Alcohol consumption and body weight: a systematic review. Nutr Rev 69(8):419–431. doi:10.1111/j.1753-4887.2011.00403.x
22. Schrieks IC, Stafleu A, Griffioen-Roose S et al (2015) Moderate alcohol consumption stimu-lates food intake and food reward of savoury foods. Appetite 89:77–83. doi:10.1016/j.appet.2015.01.021
23. Lorente FO, Souville M, Griffet J et al (2004) Participation in sports and alcohol consumption among French adolescents. Addict Behav 29(5):941–946. doi:10.1016/j.addbeh.2004.02.039
24. Kulesza M, Grossbard JR, Kilmer J et al (2014) Take one for the team? Influence of team and individual sport participation on high school athlete substance use patterns. J Child Adolesc Subst Abuse 23(4):217–223. doi:10.1080/1067828X.2013.786928
25. Kwan M, Bobko S, Faulkner G et al (2014) Sport participation and alcohol and illicit drug use in adolescents and young adults: a systematic review of longitudinal studies. Addict Behav 39(3):497–506. doi:10.1016/j.addbeh.2013.11.006
Open Access This chapter is distributed under the terms of the Creative Commons Attribution-Noncommercial 2.5 License (http://creativecommons.org/licenses/by-nc/2.5/) which permits any noncommercial use, distribution, and reproduction in any medium, provided the original author(s) and source are credited.
The images or other third party material in this chapter are included in the work’s Creative Commons license, unless indicated otherwise in the credit line; if such material is not included in the work’s Creative Commons license and the respective action is not permitted by statutory regu-lation, users will need to obtain permission from the license holder to duplicate, adapt or reproduce the material.
A. Frühauf et al.
197© The Author(s) 2017 I.S. Scher et al. (eds.), Snow Sports Trauma and Safety, DOI 10.1007/978-3-319-52755-0_16
To What Extent Do Attitudes Regarding Ski Helmets Change After a Period of Utilization?
Gerhard Ruedl, Elena Pocecco, Martin Niedermeier, Larissa Ledochowski, and Martin Kopp
Abstract Background: Common reasons reported for helmet non-use are impaired hearing and impaired vision and an increasing level of risk taking. Therefore, health communication programmes should be instituted to get non-helmeted skiers and snowboarders to try out helmets to eliminate their potential prejudices. Aim: to evaluate whether and to what extent attitudes regarding ski helmets change after a period of utilization. Methods: Subjects who wanted to borrow a ski helmet in a ski rental shop had to rate 14 attitudes about ski helmets using a 5-point Likert scale two times (1) before they borrow a helmet and (2) after the return of the helmet. Results: A total of 231 (43.7% females) subjects with a mean age of 35.2 ± 14.3 years participated. A ski helmet was used never before, one time, and more times by 21.2, 16.7, and 62.1%, respectively. There was a significant increase after borrowing in the agreement that all winter sport participants should wear a ski helmet (p = .003), and that a ski helmet damages the hairstyle (p = .021) while there was a decreasing agreement that a ski helmet looks good/is stylish (p = .030). According to a factor analysis, attitudes about ski helmets clustered around two major dimensions—“safety awareness/comfort” and “subjective disadvantages” explaining 42–43% of the overall variance. A significant increase in the dimension “safety awareness/com-fort” from pre- 31.8 ± 5.9 to post-borrowing 32.6 ± 5.9 (p < .001) was found while the dimension “subjective disadvantages” did not significantly change (pre: 18.6 ± 4.3 vs. post: 19.1 ± 4.3, p = .091). Regarding subgroup analysis with these two dimensions, previous helmet use (never before vs. one time vs. more times) did not show significant differences in the change in attitudes. Conclusion: The ski helmet- related dimension “safety awareness/comfort” significantly increased after a period of utilization, irrespective of previous helmet use.
Keywords Ski helmet • Attitude change • Safety behaviour • Alpine skiing • Snowboarding • Head injury
G. Ruedl (*) • E. Pocecco • M. Niedermeier • L. Ledochowski • M. Kopp Department of Sport Science, University of Innsbruck, Fürstenweg 185, 6020 Innsbruck, Austriae-mail: [email protected]
198
1 Introduction
In recreational alpine skiing and snowboarding, the prevalence of all injuries to the head account for up to 20% of all injuries occurred on ski slopes [1–3]. In past years, ski helmet usage rate on ski slopes increased up to 80% among recreational skiers and snowboarders [2–4]. Although there is convincing evidence of head pro-tective effects by wearing ski helmets [1, 3, 5], about 20% of skiers and snowboard-ers do not wear a ski helmet yet on ski slopes [3, 4].
Common reasons reported for helmet non-use are impaired hearing, impaired vision, and an increasing level of risk taking [6–8]. In a previous study by Ruedl et al. [9], more than 900 persons scored 14 statements on a five-level Likert scale about their attitudes regarding ski helmets. While results of this study showed little disagreement on the important features of helmets that they could save lives, that they do not promote risk compensation and that adults wearing a ski helmet are positive role models, helmeted and non-helmeted skiers, and snowboarders differed in far less fundamental issues (e.g. hearing, hairstyle, costs), which might be more amenable to attitude change [9]. Therefore, health communication programmes should be instituted to get non-helmeted skiers and snowboarders to try out helmets to eliminate their potential prejudices. According to Andersen et al. [10], helmet campaigns should be based on Roger’s “Trialability from Diffusion of Innovation Theory” [11] because the ability to utilize an innovation for a trial period is posi-tively correlated with its rate of adoption [10]. From a health psychological approach there is a lack of knowledge how practicing the behaviour might influence attitudes toward the behaviour or subjective norms as most of the models neglect conse-quences of behaviour (i.e. theory of planned behaviour, TBP, Ajzen [12]). In inter-preting the results from our earlier study [9] we used the Transtheoretical Model (TTM) and concluded that specific information in the second stage, “contempla-tion”, might foster at least the preparation of behaviour change [13]. In a further step, it seems necessary to focus on the stage of “action” relying on this model. Therefore, the aim of the study was to evaluate whether and to what extent attitudes regarding ski helmets change after a period of utilization.
2 Methods
2.1 Study Design
Pre-/post-survey
2.2 Subjects
German-speaking skiers and snowboarders who wanted to borrow a ski helmet in one out of three ski rental shops during three consecutive winter seasons from 2012/13 to 2014/15 were randomly invited to participate. Subjects had to rate
G. Ruedl et al.
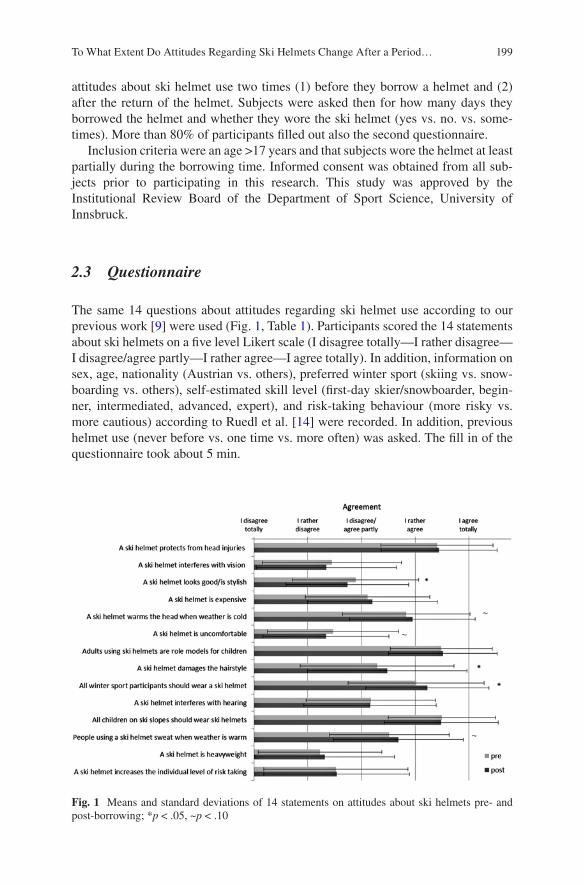
199
attitudes about ski helmet use two times (1) before they borrow a helmet and (2) after the return of the helmet. Subjects were asked then for how many days they borrowed the helmet and whether they wore the ski helmet (yes vs. no. vs. some-times). More than 80% of participants filled out also the second questionnaire.
Inclusion criteria were an age >17 years and that subjects wore the helmet at least partially during the borrowing time. Informed consent was obtained from all sub-jects prior to participating in this research. This study was approved by the Institutional Review Board of the Department of Sport Science, University of Innsbruck.
2.3 Questionnaire
The same 14 questions about attitudes regarding ski helmet use according to our previous work [9] were used (Fig. 1, Table 1). Participants scored the 14 statements about ski helmets on a five level Likert scale (I disagree totally—I rather disagree—I disagree/agree partly—I rather agree—I agree totally). In addition, information on sex, age, nationality (Austrian vs. others), preferred winter sport (skiing vs. snow-boarding vs. others), self-estimated skill level (first-day skier/snowboarder, begin-ner, intermediated, advanced, expert), and risk-taking behaviour (more risky vs. more cautious) according to Ruedl et al. [14] were recorded. In addition, previous helmet use (never before vs. one time vs. more often) was asked. The fill in of the questionnaire took about 5 min.
Fig. 1 Means and standard deviations of 14 statements on attitudes about ski helmets pre- and post-borrowing; *p < .05, ~p < .10
To What Extent Do Attitudes Regarding Ski Helmets Change After a Period…
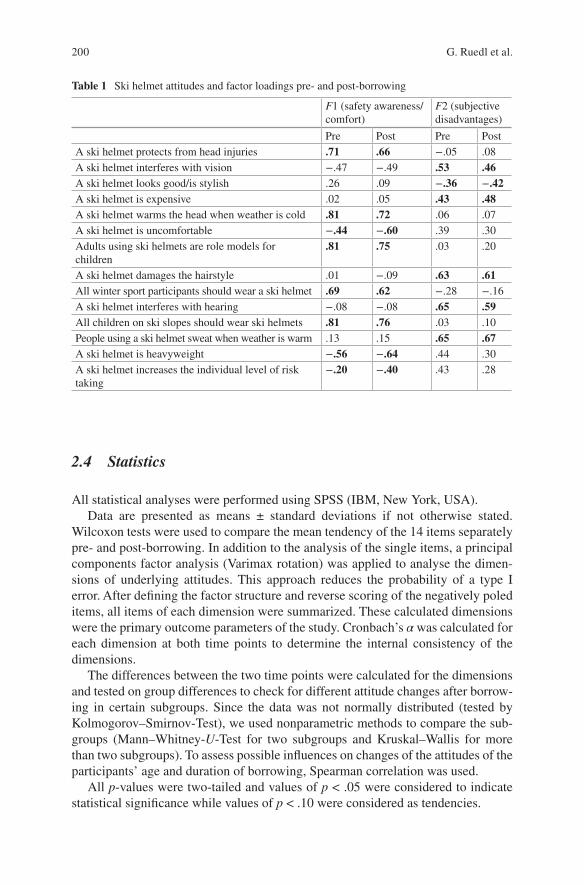
200
2.4 Statistics
All statistical analyses were performed using SPSS (IBM, New York, USA).Data are presented as means ± standard deviations if not otherwise stated.
Wilcoxon tests were used to compare the mean tendency of the 14 items separately pre- and post-borrowing. In addition to the analysis of the single items, a principal components factor analysis (Varimax rotation) was applied to analyse the dimen-sions of underlying attitudes. This approach reduces the probability of a type I error. After defining the factor structure and reverse scoring of the negatively poled items, all items of each dimension were summarized. These calculated dimensions were the primary outcome parameters of the study. Cronbach’s α was calculated for each dimension at both time points to determine the internal consistency of the dimensions.
The differences between the two time points were calculated for the dimensions and tested on group differences to check for different attitude changes after borrow-ing in certain subgroups. Since the data was not normally distributed (tested by Kolmogorov–Smirnov-Test), we used nonparametric methods to compare the sub-groups (Mann–Whitney-U-Test for two subgroups and Kruskal–Wallis for more than two subgroups). To assess possible influences on changes of the attitudes of the participants’ age and duration of borrowing, Spearman correlation was used.
All p-values were two-tailed and values of p < .05 were considered to indicate statistical significance while values of p < .10 were considered as tendencies.
Table 1 Ski helmet attitudes and factor loadings pre- and post-borrowing
F1 (safety awareness/comfort)
F2 (subjective disadvantages)
Pre Post Pre PostA ski helmet protects from head injuries .71 .66 −.05 .08A ski helmet interferes with vision −.47 −.49 .53 .46A ski helmet looks good/is stylish .26 .09 −.36 −.42A ski helmet is expensive .02 .05 .43 .48A ski helmet warms the head when weather is cold .81 .72 .06 .07A ski helmet is uncomfortable −.44 −.60 .39 .30Adults using ski helmets are role models for children
.81 .75 .03 .20
A ski helmet damages the hairstyle .01 −.09 .63 .61All winter sport participants should wear a ski helmet .69 .62 −.28 −.16A ski helmet interferes with hearing −.08 −.08 .65 .59All children on ski slopes should wear ski helmets .81 .76 .03 .10People using a ski helmet sweat when weather is warm .13 .15 .65 .67A ski helmet is heavyweight −.56 −.64 .44 .30A ski helmet increases the individual level of risk taking
−.20 −.40 .43 .28
G. Ruedl et al.
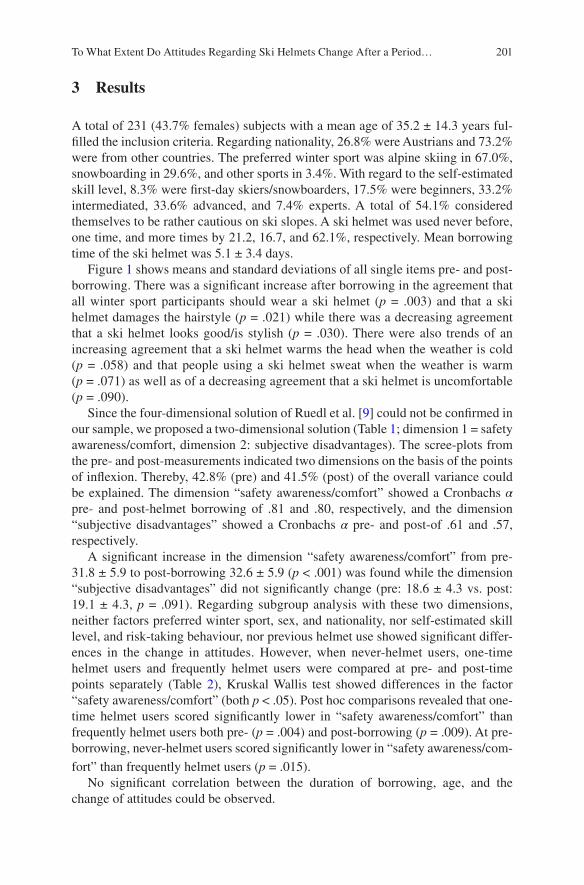
201
3 Results
A total of 231 (43.7% females) subjects with a mean age of 35.2 ± 14.3 years ful-filled the inclusion criteria. Regarding nationality, 26.8% were Austrians and 73.2% were from other countries. The preferred winter sport was alpine skiing in 67.0%, snowboarding in 29.6%, and other sports in 3.4%. With regard to the self-estimated skill level, 8.3% were first-day skiers/snowboarders, 17.5% were beginners, 33.2% intermediated, 33.6% advanced, and 7.4% experts. A total of 54.1% considered themselves to be rather cautious on ski slopes. A ski helmet was used never before, one time, and more times by 21.2, 16.7, and 62.1%, respectively. Mean borrowing time of the ski helmet was 5.1 ± 3.4 days.
Figure 1 shows means and standard deviations of all single items pre- and post- borrowing. There was a significant increase after borrowing in the agreement that all winter sport participants should wear a ski helmet (p = .003) and that a ski helmet damages the hairstyle (p = .021) while there was a decreasing agreement that a ski helmet looks good/is stylish (p = .030). There were also trends of an increasing agreement that a ski helmet warms the head when the weather is cold (p = .058) and that people using a ski helmet sweat when the weather is warm (p = .071) as well as of a decreasing agreement that a ski helmet is uncomfortable (p = .090).
Since the four-dimensional solution of Ruedl et al. [9] could not be confirmed in our sample, we proposed a two-dimensional solution (Table 1; dimension 1 = safety awareness/comfort, dimension 2: subjective disadvantages). The scree-plots from the pre- and post-measurements indicated two dimensions on the basis of the points of inflexion. Thereby, 42.8% (pre) and 41.5% (post) of the overall variance could be explained. The dimension “safety awareness/comfort” showed a Cronbachs α pre- and post-helmet borrowing of .81 and .80, respectively, and the dimension “subjective disadvantages” showed a Cronbachs α pre- and post-of .61 and .57, respectively.
A significant increase in the dimension “safety awareness/comfort” from pre- 31.8 ± 5.9 to post-borrowing 32.6 ± 5.9 (p < .001) was found while the dimension “subjective disadvantages” did not significantly change (pre: 18.6 ± 4.3 vs. post: 19.1 ± 4.3, p = .091). Regarding subgroup analysis with these two dimensions, neither factors preferred winter sport, sex, and nationality, nor self-estimated skill level, and risk-taking behaviour, nor previous helmet use showed significant differ-ences in the change in attitudes. However, when never-helmet users, one-time helmet users and frequently helmet users were compared at pre- and post-time points separately (Table 2), Kruskal Wallis test showed differences in the factor “safety awareness/comfort” (both p < .05). Post hoc comparisons revealed that one-time helmet users scored significantly lower in “safety awareness/comfort” than frequently helmet users both pre- (p = .004) and post-borrowing (p = .009). At pre- borrowing, never-helmet users scored significantly lower in “safety awareness/com-
fort” than frequently helmet users (p = .015).No significant correlation between the duration of borrowing, age, and the
change of attitudes could be observed.
To What Extent Do Attitudes Regarding Ski Helmets Change After a Period…
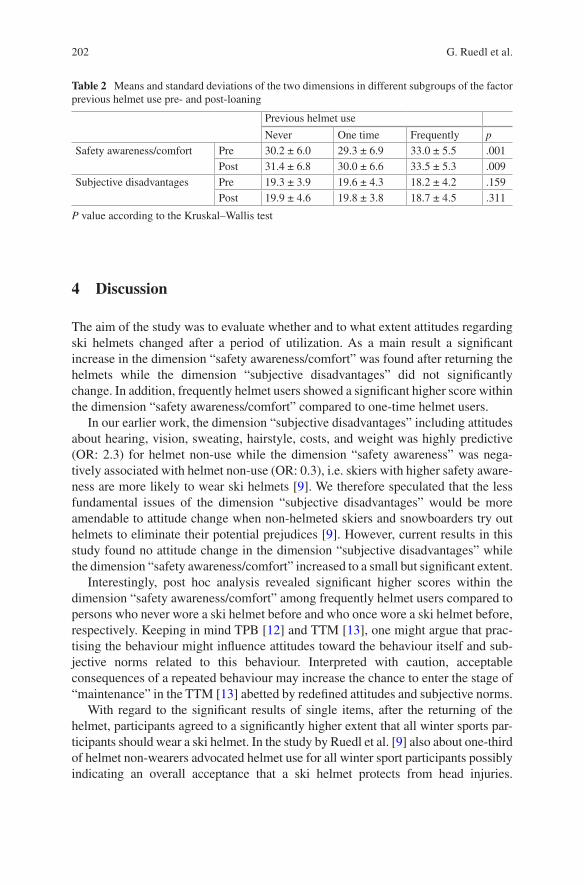
202
4 Discussion
The aim of the study was to evaluate whether and to what extent attitudes regarding ski helmets changed after a period of utilization. As a main result a significant increase in the dimension “safety awareness/comfort” was found after returning the helmets while the dimension “subjective disadvantages” did not significantly change. In addition, frequently helmet users showed a significant higher score within the dimension “safety awareness/comfort” compared to one-time helmet users.
In our earlier work, the dimension “subjective disadvantages” including attitudes about hearing, vision, sweating, hairstyle, costs, and weight was highly predictive (OR: 2.3) for helmet non-use while the dimension “safety awareness” was nega-tively associated with helmet non-use (OR: 0.3), i.e. skiers with higher safety aware-ness are more likely to wear ski helmets [9]. We therefore speculated that the less fundamental issues of the dimension “subjective disadvantages” would be more amendable to attitude change when non-helmeted skiers and snowboarders try out helmets to eliminate their potential prejudices [9]. However, current results in this study found no attitude change in the dimension “subjective disadvantages” while the dimension “safety awareness/comfort” increased to a small but significant extent.
Interestingly, post hoc analysis revealed significant higher scores within the dimension “safety awareness/comfort” among frequently helmet users compared to persons who never wore a ski helmet before and who once wore a ski helmet before, respectively. Keeping in mind TPB [12] and TTM [13], one might argue that prac-tising the behaviour might influence attitudes toward the behaviour itself and sub-jective norms related to this behaviour. Interpreted with caution, acceptable consequences of a repeated behaviour may increase the chance to enter the stage of “maintenance” in the TTM [13] abetted by redefined attitudes and subjective norms.
With regard to the significant results of single items, after the returning of the helmet, participants agreed to a significantly higher extent that all winter sports par-ticipants should wear a ski helmet. In the study by Ruedl et al. [9] also about one-third of helmet non-wearers advocated helmet use for all winter sport participants possibly indicating an overall acceptance that a ski helmet protects from head injuries.
Table 2 Means and standard deviations of the two dimensions in different subgroups of the factor previous helmet use pre- and post-loaning
Previous helmet use
Never One time Frequently p
Safety awareness/comfort Pre 30.2 ± 6.0 29.3 ± 6.9 33.0 ± 5.5 .001Post 31.4 ± 6.8 30.0 ± 6.6 33.5 ± 5.3 .009
Subjective disadvantages Pre 19.3 ± 3.9 19.6 ± 4.3 18.2 ± 4.2 .159Post 19.9 ± 4.6 19.8 ± 3.8 18.7 ± 4.5 .311
P value according to the Kruskal–Wallis test
G. Ruedl et al.
203
Russell et al. [1] found in their meta-analysis that ski helmet use could reduce head injury risk by 35% in the general ski population and by 59% in children. In addition, a study by Rughani et al. [5] showed that ski helmet use was associated with reduced rates of skull fractures among hospitalized children. More recently, Shealy et al. [3] observed that ski helmet use offers very effective mitigation for head injuries such as skull fractures and scalp lacerations. In addition, Shealy et al. [3] found that an increased use of helmets was also associated with a significant reduction in poten-tially serious head injuries, as well as all head injuries.
After the returning of the helmet, participants agreed to a significantly less extent that a ski helmet looks stylish. The style factor of a ski helmet might be an important individual factor when people decide to buy a helmet. Therefore, manufacturers of ski helmets continuously try to improve the style, weight, air ventilation, and com-fort of their products.
In addition, after returning the borrowed helmet participants also agreed to a significantly higher extent that a ski helmet damages the hairstyle. In comparison, in the study by Ruedl et al. [9] about a quarter of helmet wearers and non-wearers found that a helmet damages one’s hairstyle. However, keeping in mind that most head injuries occur when the skier or snowboarder hits his head on the snow during a self-inflicted fall [15], head protection should be more important than hairstyle protection. In addition, when using a ski cap instead of a ski helmet, hairstyle also would be damaged.
In this study, no significant changes could be found according to the most com-mon reported reasons for helmet non-use, i.e. impaired hearing, impaired vision, and an increasing level of risk taking [6–8]. As shown in Fig. 1, the mean level of agreement to these three questions was relatively low compared to other questions. With regard to these three issues and beside the subjective attitudes of the individu-als, there are some evidence-based results from recent studies. Tudor et al. [16] and Ruedl et al. [17] found that compared to a ski cap a ski helmet showed an increased hearing threshold. However, according to Ruedl et al. [17] the degree of the hearing impairment when using a ski helmet is less than what is termed as a hearing impair-ment. In addition, as most injuries on ski slopes occurred after a self-inflicted fall without involvement of another skier or snowboarder [2, 15, 18], compared to an impaired hearing an impairment of vision might be a more essential factor for safety in alpine skiing.
Regarding a limited field of vision when wearing a ski helmet, a study found that not the ski helmet per se but an additional use of ski goggles increased mean reaction time when using a continuous-tracking-test combined with peripheral signals [19].
According to the so-called risk-compensation hypothesis, there is an ongoing debate whether the use of a ski helmet provides a false sense of security, resulting in a riskier behaviour on ski slopes [20–22]. We found in a study [14] that self- reported risk-taking skiers and snowboarders skied on average 8 km/h faster than cautious persons; however, helmet use was nearly equal in both groups. Also, Scott et al. [22] found no evidence of risk compensation in their study. In addition, in past years ski helmet use increased up to 80% of the overall population on ski slopes [3, 4]
To What Extent Do Attitudes Regarding Ski Helmets Change After a Period…
204
expecting also partly an increase in the overall rate of ski injuries due to self- inflicted falls or collisions with other winter sport participants if ski helmet use would increase one’s risk-taking behaviour. However, ski injury rate continuously decreased during the last decades [18, 23] while at the same time ski helmet rate continuously increased [2, 3].
In general, the results of this study show that practicing a new safety or health behaviour has the potential not only to influence perceived behavioural control as indicated in the theory of planned behaviour but also attitudes toward the behaviour. According to the TTM of behaviour change [13], not only information but also practising the behaviour should be implemented in helmet campaigns focusing to increase helmet use on ski slopes. This aspect might be interesting to foster more research on the short- and long-term consequences after enhancing new health and safety behaviours.
When interpreting the results of our study, it has to be taken into account that the reported effects of wearing a ski helmet were relatively small which might partly due to a mean borrowing time of only 5 days. It is therefore unknown, how repeat-able the observed effects are in future studies. Furthermore, a prospective study design would bring out more reliable results. Factor analysis of the 14 statements on ski helmet attitudes in this study showed a two dimensions solution contrasting the four dimensions solution in our earlier study [9] which might be due to differences in the number of participants, sex distribution, mean age, preferred winter sport, etc. between the two studies. However, the current solution explained about 43% of the overall variance which is in accordance with 48% in the study by Ruedl et al. [9]. Cronbachs α pre- and post-helmet borrowing of .81 and .80 for the dimension “safety awareness/comfort” and Cronbachs α pre- and post-helmet borrowing of .61 and .57 for the dimension “subjective disadvantages” are higher compared to the equivalent values of these two dimensions of .59 and .52, respectively, in the study by Ruedl et al. [9]. However, an attitude questionnaire previously validated would facilitate the embedding in psychological literature.
Furthermore, results of this study are limited by the fact that only German- speaking people were asked and that during the data collection period the helmet- wearing rate in Austria increased from about 60% to about 80%. However, this study was the first of its kind to observe effects of a period of utilization on ski helmet-related attitudes.
In conclusion, repeatedly trying out a ski helmet is positively associated with an increase in the dimension “safety awareness/comfort” of winter sport participants. Therefore, it is recommended to promote ski-helmet use during the general ski rental process by reducing barriers like additional costs or separate ways for customers.
Acknowledgement The authors gratefully acknowledge the support for this study from the Tiroler Wissenschaftsfonds (TWF).
G. Ruedl et al.
205
References
1. Russell K, Christie J, Hagel BE (2010) The effects of helmets on the risk of head and neck injuries among skiers and snowboarders: a meta-analysis. CMAJ 182(4):333–340
2. Ekeland A, Rodven A (2012) Alpine skiing, telemarking, snowboarding, and skiboarding inju-ries related to gender and ability. In: Johnson RJ, Shealy JE, Greenwald RM, Scher I (eds) Skiing trauma and safety, vol 19. ASTM International, West Conshohocken, pp 216–227
3. Shealy JE, Ettlinger CF, Johnson RJ, Scher I (2015) Role of helmets in mitigation of head injuries: epidemiologic study of head injuries to skiers. In: Johnson RJ, Shealy JE, Greenwald RM (eds) Skiing trauma and safety, vol 20. ASTM International, West Conshohocken, pp 22–36
4. Philippe M, Ruedl G, Woldrich T, Nachbauer W, Burtscher M (2014) How frequent and why are skiers and snowboarders fallin? Sportverletz Sportschaden 28(4):188–192
5. Rughani AI, Lin C, Ares WJ, Cushing DA, Horgan MA, Tranmer BI, Jewell RP, Florman JE (2011) Helmet use and reduction in skull fractures in skiers and snowboarders admitted to the hospital. J Neurosurg Pediatr 7:268–271
6. Cundy TP, Systermans BJ, Cundy WJ, Cundy PJ, Briggs NE, Robinson JB (2010) Helmets for snow sports: prevalence, trends, predictors and attitudes to use. J Trauma 69:1486–1490
7. Ruedl G, Kopp M, Burtscher M (2011) The protective effects of helmets in skiers and snow-boarders. BMJ 342:d857
8. Terwiel A, Dickson T (2015) Helmets: what do snowsport instructors and guests know and expect? In: Johnson RJ, Shealy JE, Greenwald RM (eds) Skiing trauma and safety, vol 20. ASTM International, West Conshohocken, pp 3–21
9. Ruedl G, Kopp M, Rumpold G, Holzner B, Ledochowski L, Burtscher M (2012) Attitudes regarding ski helmet use among helmet wearers and non-wearers. Inj Prev 18(3):182–186
10. Andersen PA, Buller DB, Scott MD, Walkosz BJ, Voeks JH, Cutter GR, Dignan MB (2004) Prevalence and diffusion of helmet use at ski areas in Western North America in 2001-02. Inj Prev 10(6):358–362
11. Rogers EM (2003) Diffusion of innovations, 5th edn. The Free Press, New York 12. Ajzen I (2002) Perceived behavioral control, self-efficacy, locus of control, and the theory of
planned behavior. J Appl Soc Psychol 32:665–683 13. Prochaska JO, DiClemente CC (1983) Stages and processes of self-change of smoking: toward
an integrative model of change. J Consult Clin Psychol 51:390e5 14. Ruedl G, Pocecco E, Sommersacher R, Gatterer H, Kopp M, Nachbauer W, Burtscher M
(2010) Factors associated with self-reported risk taking behaviour on ski slopes. Br J Sports Med 44(3):204–206
15. Greve MW, Young DJ, Goss AL, Degutis LC (2009) Skiing and snowboarding head injuries in 2 areas of the United States. Wilderness Environ Med 20(3):234–238
16. Tudor A, Ruzic L, Bencic I, Sestan B, Bonifacic M (2010) Ski helmets could attenuate the sounds of danger. Clin J Sport Med 20(3):173–178
17. Ruedl G, Seebacher J, Koci V, Stephan K, Weichbold V, Zorowka P, Burtscher M, Kopp M (2014) Effect of wearing a ski helmet or a ski cap on perception and localization of sounds. Int J Sports Med 35(8):645–650
18. Ruedl G, Philippe M, Sommersacher R, Dünnwald T, Kopp M, Burtscher M (2014) Current incidence of accidents on Austrian ski slopes. Sportverletz Sportschaden 28(4):183–187
19. Ruedl G, Herzog S, Schöpf S, Anewanter P, Geiger A, Burtscher M, Kopp M (2011) Do ski helmets affect reaction time to peripheral stimuli? Wilderness Environ Med 22:148–150
20. Hagel B, Meeuwisse W (2004) Risk compensation: a “side effect” of sport injury prevention? Clin J Sports Med 14:193–196
21. Ruedl G, Kopp M, Burtscher M (2012) Does risk compensation undo the protective effect of ski helmet use? Epidemiology 23(6):936–937
To What Extent Do Attitudes Regarding Ski Helmets Change After a Period…
206
22. Scott MD, Buller DB, Andersen PA, Walkosz BJ, Voeks JH, Dignan MB, Cutter GR (2007) Testing the risk compensation hypothesis for safety helmets in alpine skiing and snowboard-ing. Inj Prev 13(3):173–177
23. Shealy JE, Ettlinger CF, Scher I, Johnson RJ (2015) 2010/2011 NSAA 10-year interval injury study. In: Johnson RJ, Shealy JE, Greenwald RM (eds) Skiing trauma and safety, vol 20. ASTM International, West Conshohocken, pp 93–111
Open Access This chapter is distributed under the terms of the Creative Commons Attribution-Noncommercial 2.5 License (http://creativecommons.org/licenses/by-nc/2.5/) which permits any noncommercial use, distribution, and reproduction in any medium, provided the original author(s) and source are credited.
The images or other third party material in this chapter are included in the work’s Creative Commons license, unless indicated otherwise in the credit line; if such material is not included in the work’s Creative Commons license and the respective action is not permitted by statutory regu-lation, users will need to obtain permission from the license holder to duplicate, adapt or reproduce the material.
G. Ruedl et al.
Related Documents