Investor Presentation April 2012 © 2012 MindTree Limited CONFIDENTIAL: For limited circulation only

Welcome message from author
This document is posted to help you gain knowledge. Please leave a comment to let me know what you think about it! Share it to your friends and learn new things together.
Transcript
Investor PresentationApril 2012
© 2012 MindTree Limited Slide 1CONFIDENTIAL: For limited circulation only Slide 1© 2012 MindTree LimitedCONFIDENTIAL: For limited circulation only

Safe Harbor
Certain statements in this release concerning our future growth prospects are forward-lookingt t t hi h i l b f i k d t i ti th t ld t l lt tstatements, which involve a number of risks, and uncertainties that could cause actual results to
differ materially from those in such forward-looking statements. The risks and uncertaintiesrelating to these statements include, but are not limited to, risks and uncertainties regardingfluctuations in earnings, our ability to manage growth, intense competition in IT services includingthose factors which may affect our cost advantage wage increases our ability to attract andthose factors which may affect our cost advantage, wage increases, our ability to attract andretain highly skilled professionals, time and cost overruns on fixed- price, fixed-time framecontracts, client concentration, restrictions on immigration, our ability to manage ourinternational operations, reduced demand for technology in our key focus areas, disruptions intelecommunication networks, our ability to successfully complete and integrate potentialtelecommunication networks, our ability to successfully complete and integrate potentialacquisitions, liability for damages on our service contracts, withdrawal of governmental fiscalincentives, political instability, legal restrictions on raising capital or acquiring companies outsideIndia, and unauthorized use of our intellectual property and general economic conditions affectingour industry. MindTree may, from time to time, make additional written and oral forward lookingy y, f , f gstatements, including our reports to shareholders. The Company does not undertake to update anyforward-looking statement that may be made from time to time by or on behalf of the company.
© 2012 MindTree Limited Slide 2CONFIDENTIAL: For limited circulation only Slide 2
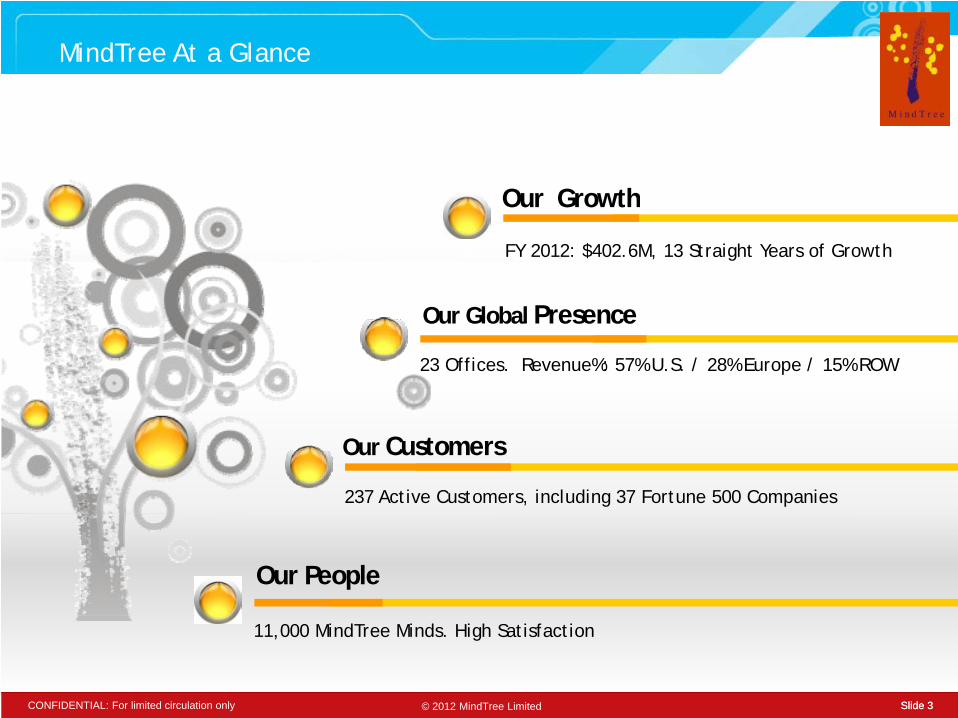
MindTree At a Glance
Our Growth
FY 2012: $402.6M, 13 Straight Years of Growth
Our Growth
O Gl b l P
23 Offices. Revenue%: 57% U.S. / 28% Europe / 15% ROW
Our Global Presence
237 Active Customers, including 37 Fortune 500 Companies
Our Customers
Our People
© 2012 MindTree Limited Slide 3CONFIDENTIAL: For limited circulation only Slide 3
11,000 MindTree Minds. High Satisfaction

Our Service Offerings
© 2012 MindTree Limited Slide 4CONFIDENTIAL: For limited circulation only
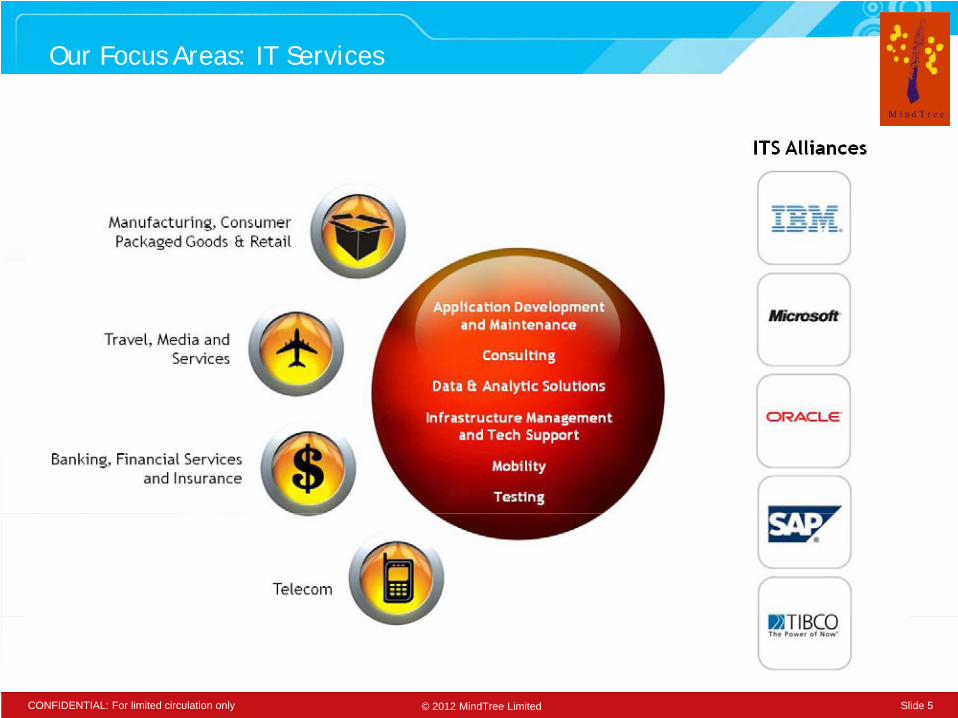
Our Focus Areas: IT Services
© 2012 MindTree Limited Slide 5CONFIDENTIAL: For limited circulation only
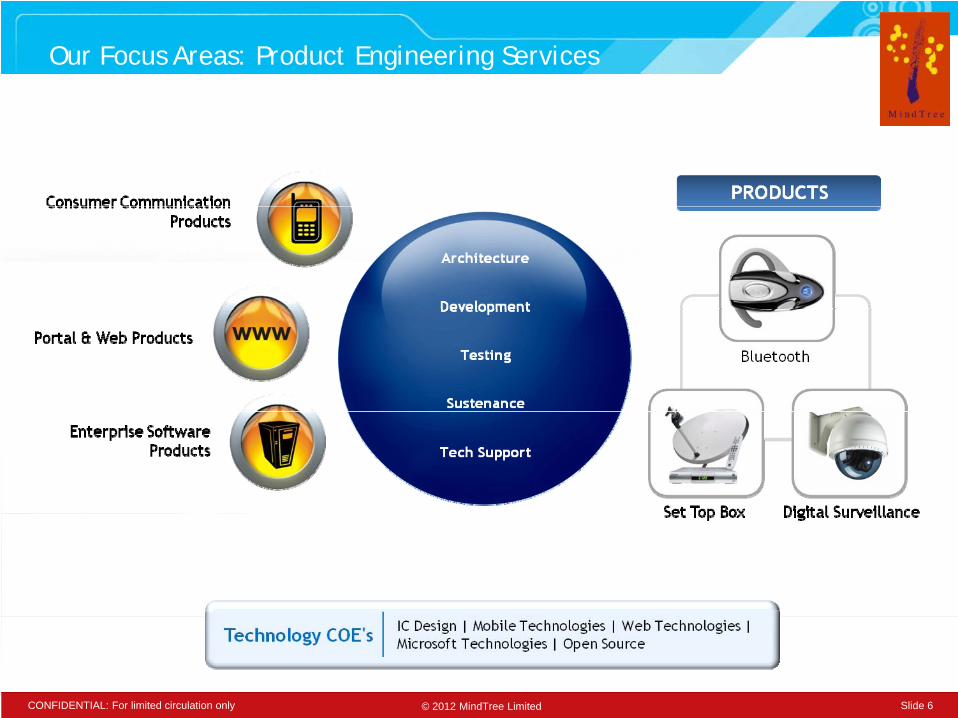
Our Focus Areas: Product Engineering Services
© 2012 MindTree Limited Slide 6CONFIDENTIAL: For limited circulation only

Data and Analytic Solutions
© 2012 MindTree Limited Slide 7CONFIDENTIAL: For limited circulation only
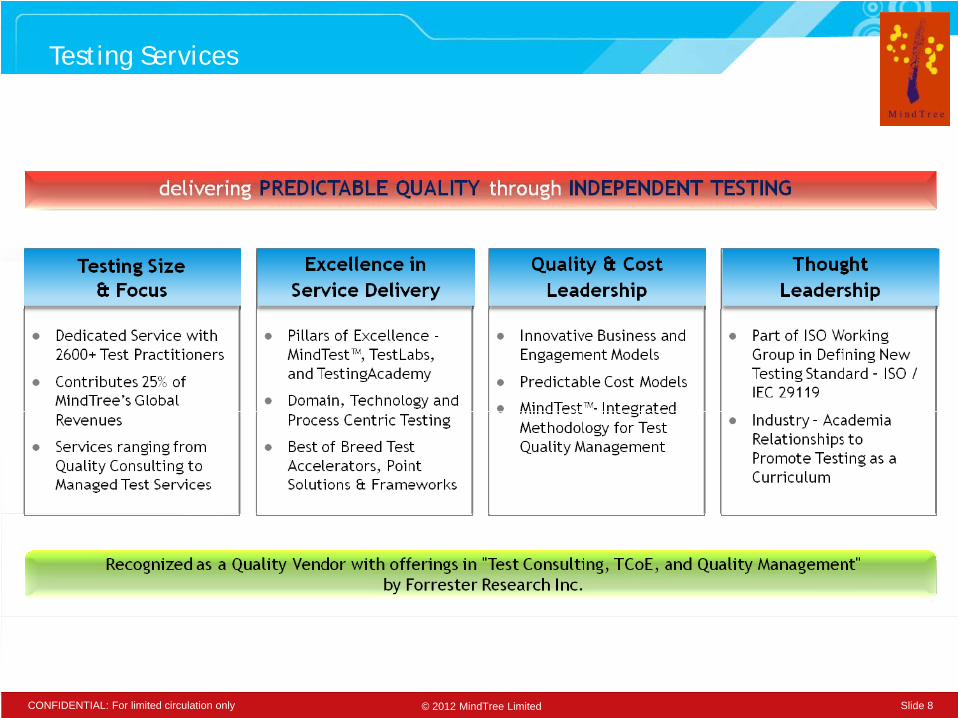
Testing Services
© 2012 MindTree Limited Slide 8CONFIDENTIAL: For limited circulation only
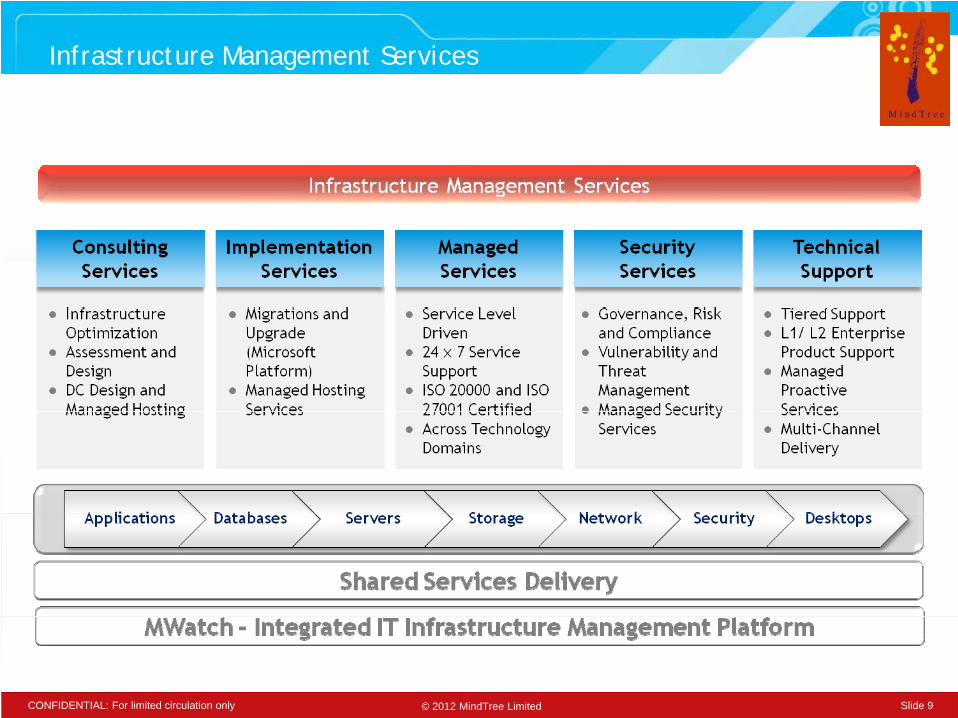
Infrastructure Management Services
© 2012 MindTree Limited Slide 9CONFIDENTIAL: For limited circulation only

Our Customers
© 2012 MindTree Limited Slide 10CONFIDENTIAL: For limited circulation only
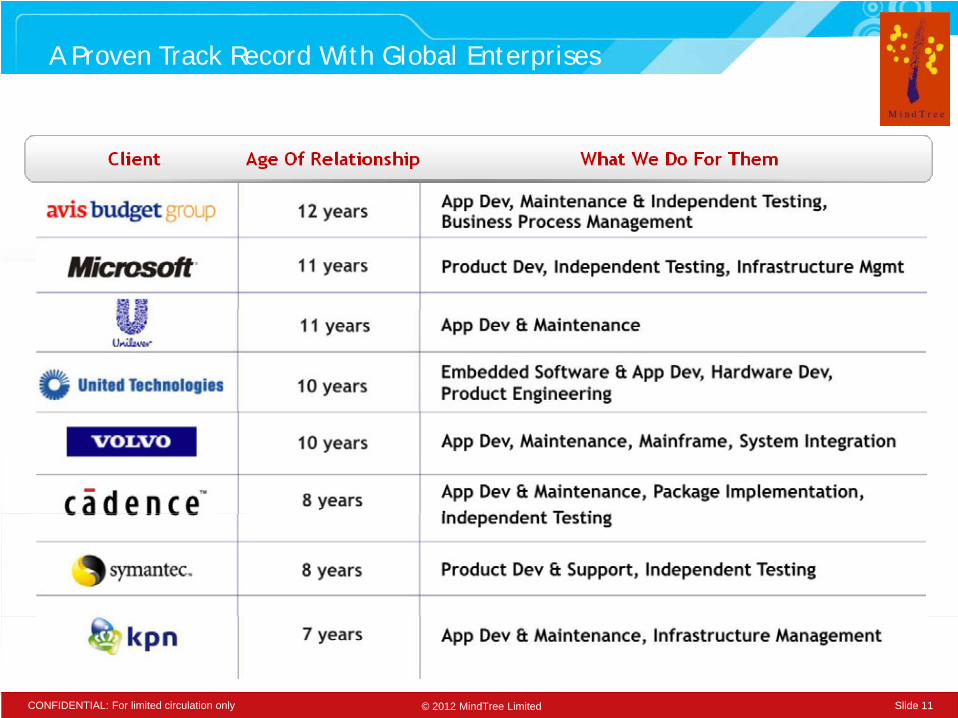
A Proven Track Record With Global Enterprises
© 2012 MindTree Limited Slide 11CONFIDENTIAL: For limited circulation only
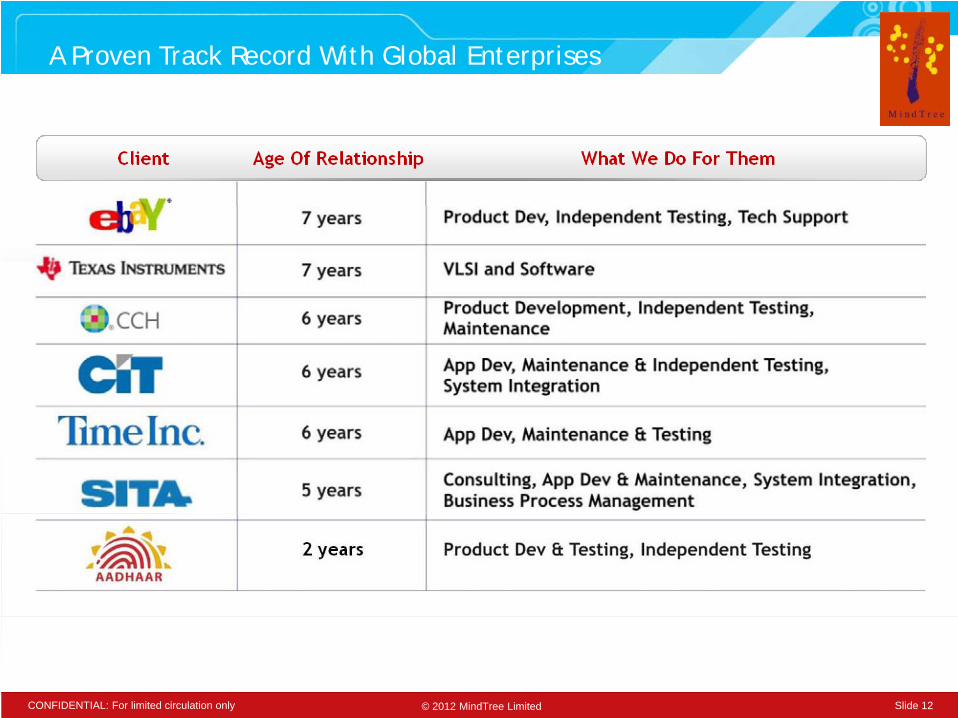
A Proven Track Record With Global Enterprises
© 2012 MindTree Limited Slide 12CONFIDENTIAL: For limited circulation only
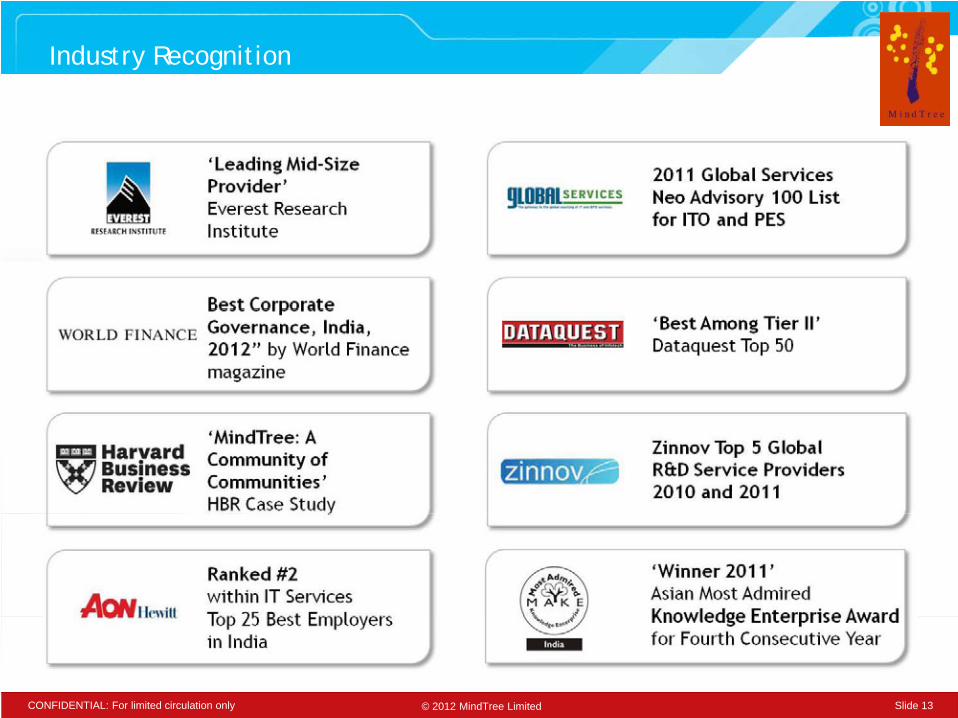
Industry Recognition
© 2012 MindTree Limited Slide 13CONFIDENTIAL: For limited circulation only
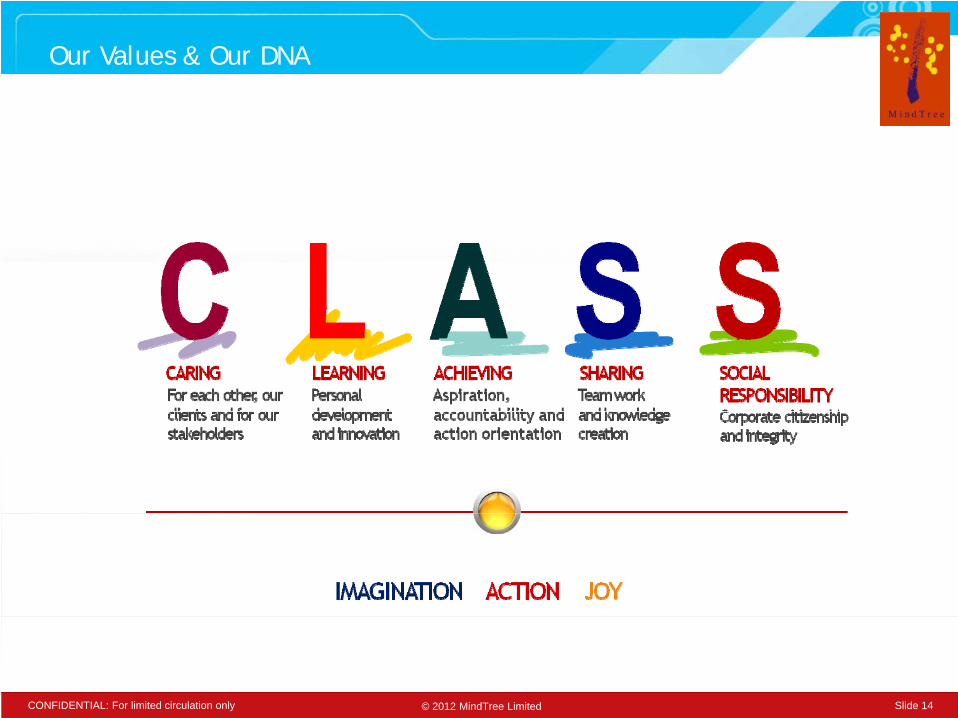
Our Values & Our DNA
© 2012 MindTree Limited Slide 14CONFIDENTIAL: For limited circulation only
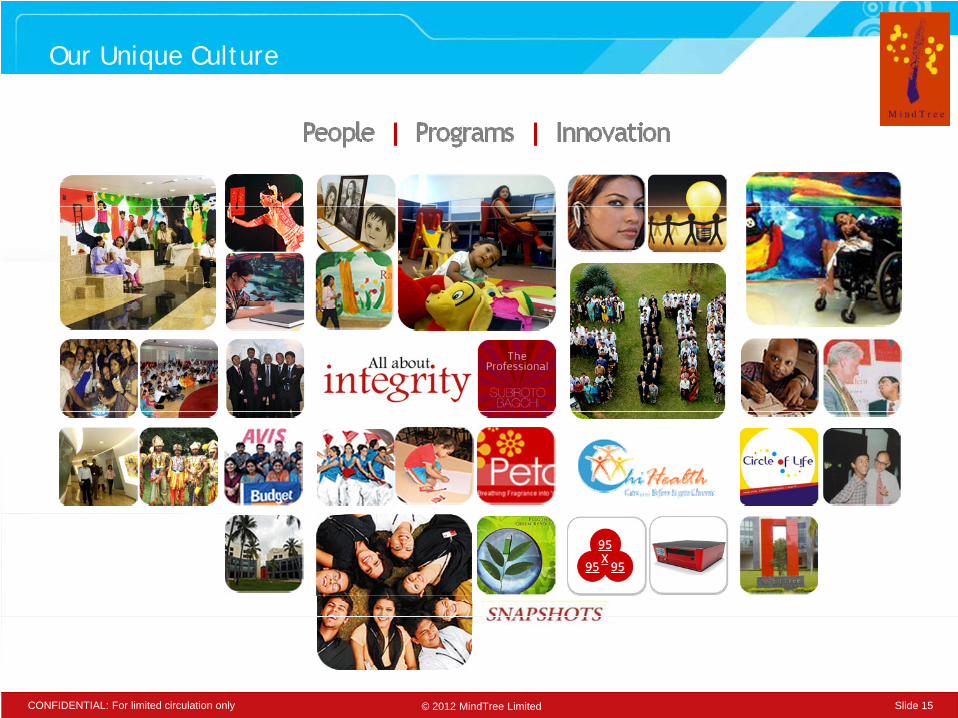
Our Unique Culture
© 2012 MindTree Limited Slide 15CONFIDENTIAL: For limited circulation only
IT Industry
© 2012 MindTree Limited Slide 16CONFIDENTIAL: For limited circulation only Slide 16© 2012 MindTree LimitedCONFIDENTIAL: For limited circulation only Slide 16
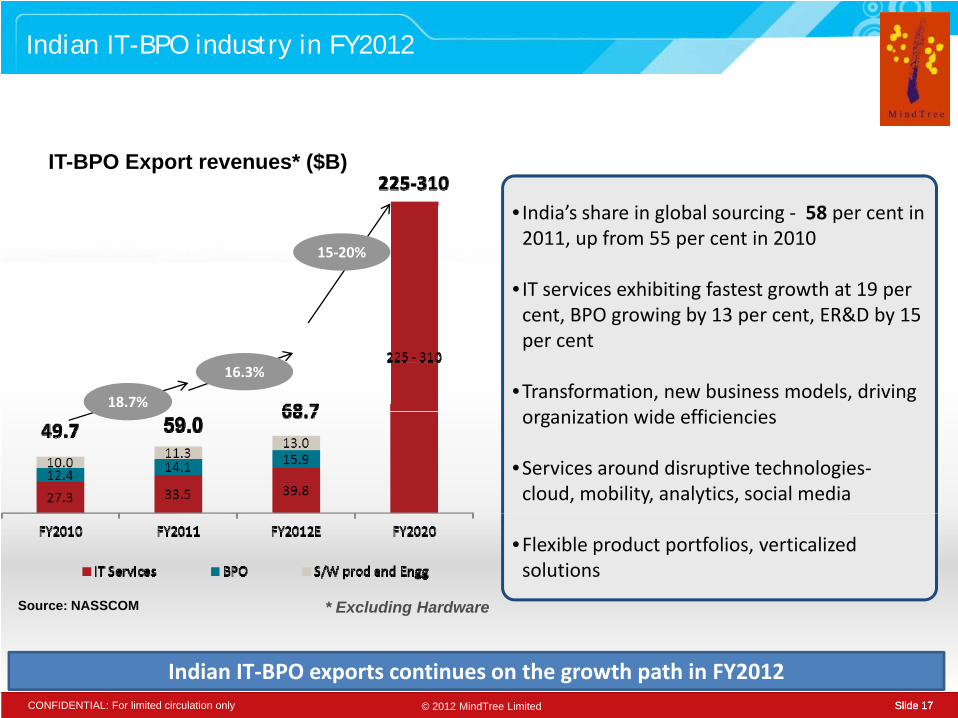
Indian IT-BPO industry in FY2012
IT-BPO Export revenues* ($B)
I di ’ h i l b l i 58 i
15‐20%
• India’s share in global sourcing ‐ 58 per cent in 2011, up from 55 per cent in 2010
• IT services exhibiting fastest growth at 19 per t BPO i b 13 t ER&D b 15
18.7%
16.3%
cent, BPO growing by 13 per cent, ER&D by 15 per cent
•Transformation, new business models, driving i ti id ffi i iorganization wide efficiencies
•Services around disruptive technologies‐cloud, mobility, analytics, social media
Source: NASSCOM * Excluding Hardware
•Flexible product portfolios, verticalized solutions
© 2012 MindTree Limited Slide 17CONFIDENTIAL: For limited circulation only Slide 17
Indian IT‐BPO exports continues on the growth path in FY2012

Global IT services offshoring market size
Global IT services offshoring market size ($B)
100% = $70-72BCEE – Central and Eastern EuropeOth L ti A i SE A i Af i
Global IT services offshoring market share (%), 2011E
Others – Latin America, SE Asia, Africa
8% CAGRCAGR
© 2012 MindTree Limited Slide 18CONFIDENTIAL: For limited circulation only Slide 18
India continues to lead the IT offshoring marketSource: NASSCOM
MindTree Implications
● Customer Implications● Customers want on see domain expertise and domain centric solutions● C i ti IT hi & t b d d l g tti g ● Co-innovation, IT ownership & outcome based models are getting
mainstream ● Disruptive & emerging technologies will change the current offering
portfolio of vendorsportfolio of vendors● Customer adoption of SaaS solutions will generate new opportunities
for service providers (customization of point solutions)
● Talent ImplicationsTalent Implications● We will need high impact client facing team that can deliver business
results ● Managing quality talent (attract, assimilate, advantage) will be a key g g q y ( , , g ) y
to scale profitably● Be the most attractive employer for GenY● Onshore delivery center (termed “domestic delivery center”) needed
© 2012 MindTree Limited Slide 19CONFIDENTIAL: For limited circulation only Slide 19
for talent, agility and PR
Outcome of Strategy Themes
© 2012 MindTree Limited Slide 20CONFIDENTIAL: For limited circulation only Slide 20© 2012 MindTree LimitedCONFIDENTIAL: For limited circulation only Slide 20
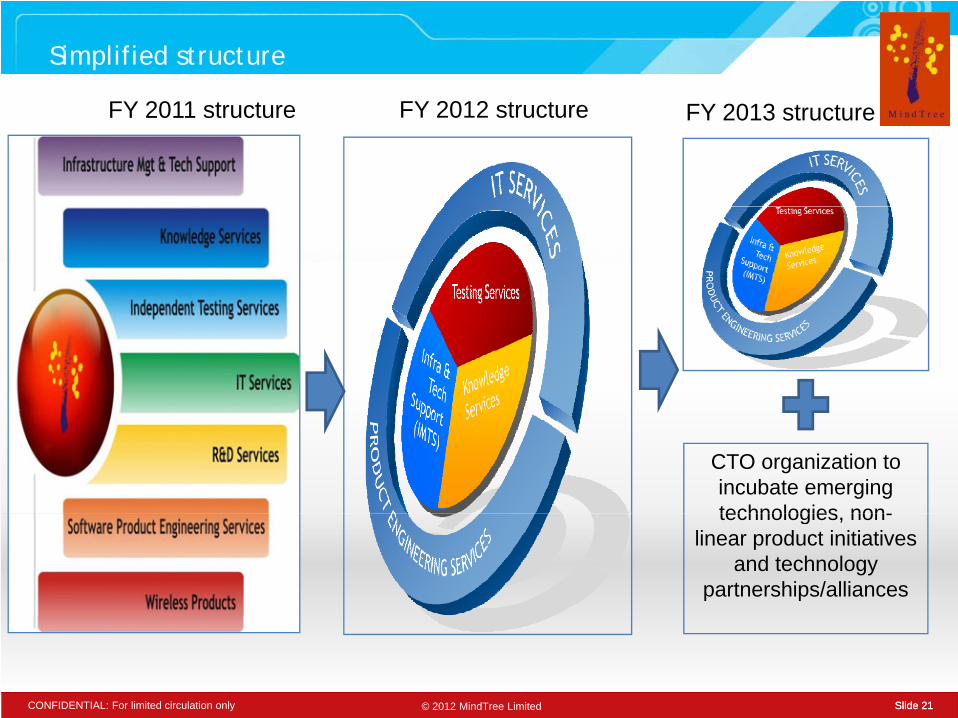
Simplified structure
FY 2011 t t FY 2012 t t FY 2013 t tFY 2011 structure FY 2012 structure FY 2013 structure
CTO organization to incubate emerging technologies non-technologies, non-
linear product initiatives and technology
partnerships/alliances
© 2012 MindTree Limited Slide 21CONFIDENTIAL: For limited circulation only Slide 21
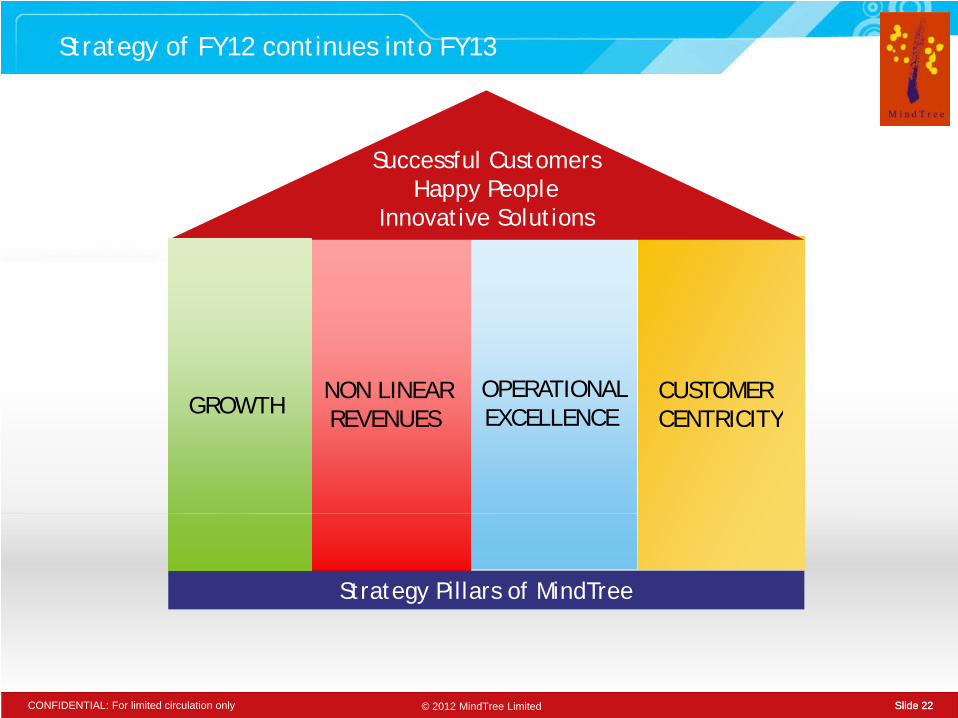
Strategy of FY12 continues into FY13
Successful CustomersHappy People
Innovative Solutions
NON LINEAR REVENUES NON LINEAR REVENUES
OPERATIONALEXCELLENCE OPERATIONALEXCELLENCE
CUSTOMER CENTRICITYCUSTOMER CENTRICITYGROWTH GROWTH REVENUES REVENUES EXCELLENCE EXCELLENCE CENTRICITYCENTRICITYGROWTH GROWTH
Strategy Pillars of MindTree
© 2012 MindTree Limited Slide 22CONFIDENTIAL: For limited circulation only Slide 22
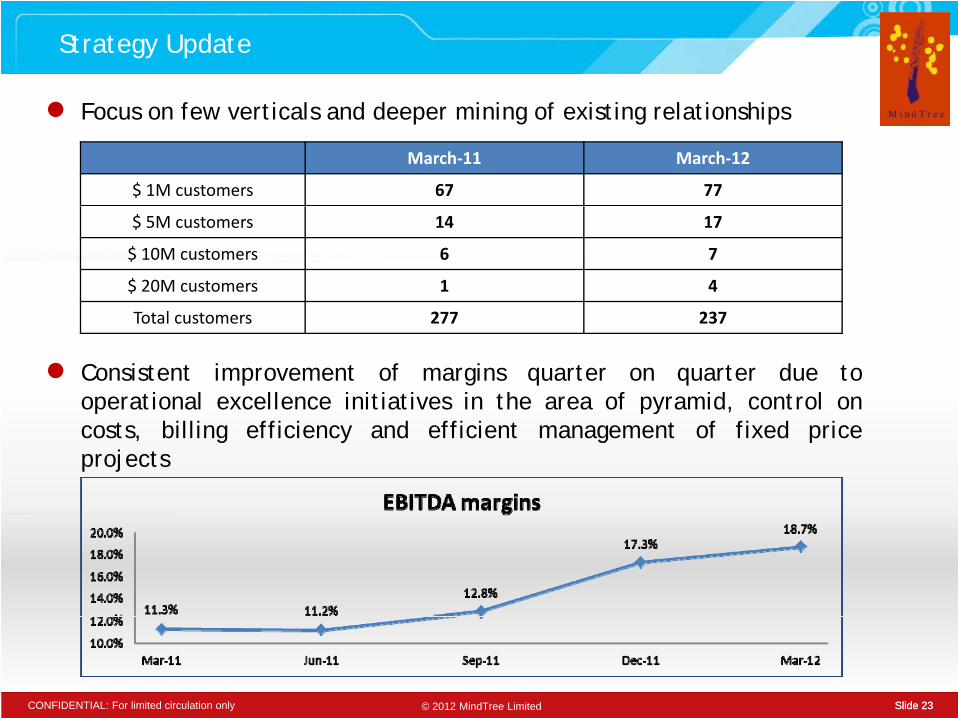
Strategy Update
● F f ti l d d i i f i ti l ti hi
March‐11 March‐12
$ 1M customers 67 77
● Focus on few verticals and deeper mining of existing relationships
$ 5M customers 14 17
$ 10M customers 6 7
$ 20M customers 1 4
Total customers 277 237
● Consistent improvement of margins quarter on quarter due tooperational excellence initiatives in the area of pyramid, control onp py ,costs, billing efficiency and efficient management of fixed priceprojects
© 2012 MindTree Limited Slide 23CONFIDENTIAL: For limited circulation only Slide 23
Q4 and FY12 – Key Financials
© 2012 MindTree Limited Slide 24CONFIDENTIAL: For limited circulation only Slide 24© 2012 MindTree LimitedCONFIDENTIAL: For limited circulation only Slide 24

Snapshot of the year
Overall a very satisfying year● Important milestones: $100m quarter, 10,000 MindTree Minds,
large multi year deals completion of AADHAARlarge multi-year deals, completion of AADHAAR● Largest ever intake of campus grads (1800 people), revamped
training process – working well. Challenge - to get them billedquicklyquickly
● We won 2 international Corporate Governance awards● Strengthened our front-end team to help us win large deals
i f dgoing forward● Smoothly managed shareholding changes● Stock price on 1 April 2011: Rs 401.2 & on 31 March 2012: Rs
489.3
© 2012 MindTree Limited Slide 25CONFIDENTIAL: For limited circulation only Slide 25
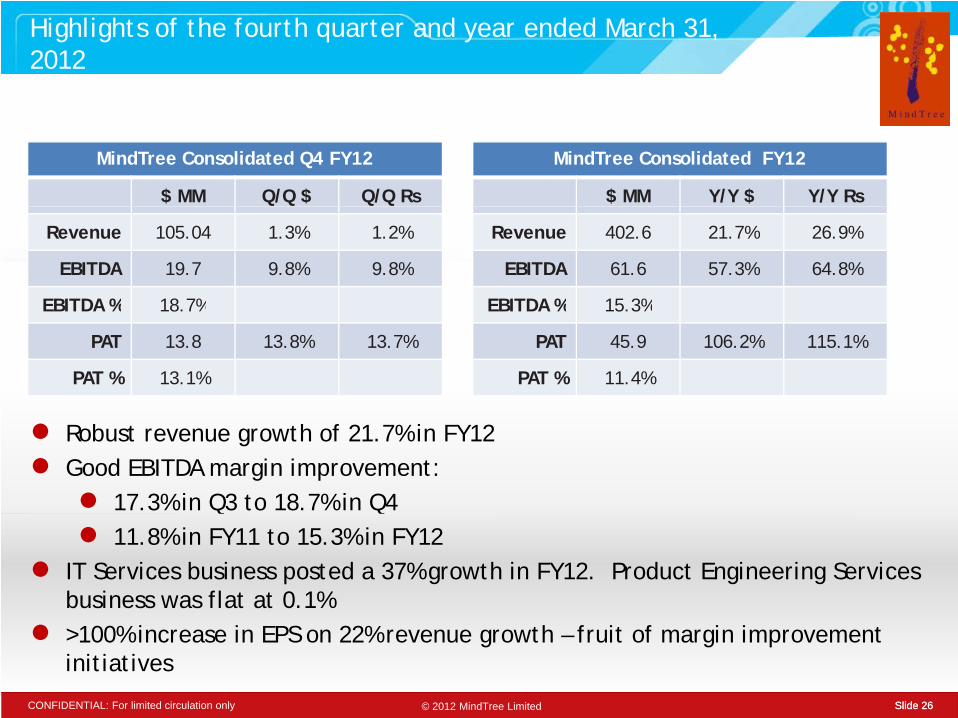
Highlights of the fourth quarter and year ended March 31, 2012
MindTree Consolidated Q4 FY12
$ MM Q/Q $ Q/Q Rs
MindTree Consolidated FY12
$ MM Y/Y $ Y/Y Rs
Revenue 105.04 1.3% 1.2%
EBITDA 19.7 9.8% 9.8%
EBITDA % 18.7%
Revenue 402.6 21.7% 26.9%
EBITDA 61.6 57.3% 64.8%
EBITDA % 15.3%EBITDA % 18.7%
PAT 13.8 13.8% 13.7%
PAT % 13.1%
EBITDA % 15.3%
PAT 45.9 106.2% 115.1%
PAT % 11.4%
● Robust revenue growth of 21.7% in FY12● Good EBITDA margin improvement:
● 17.3% in Q3 to 18.7% in Q4● 11.8% in FY11 to 15.3% in FY12
● IT Services business posted a 37% growth in FY12. Product Engineering Services business was flat at 0.1%
© 2012 MindTree Limited Slide 26CONFIDENTIAL: For limited circulation only Slide 26
● >100% increase in EPS on 22% revenue growth – fruit of margin improvement initiatives
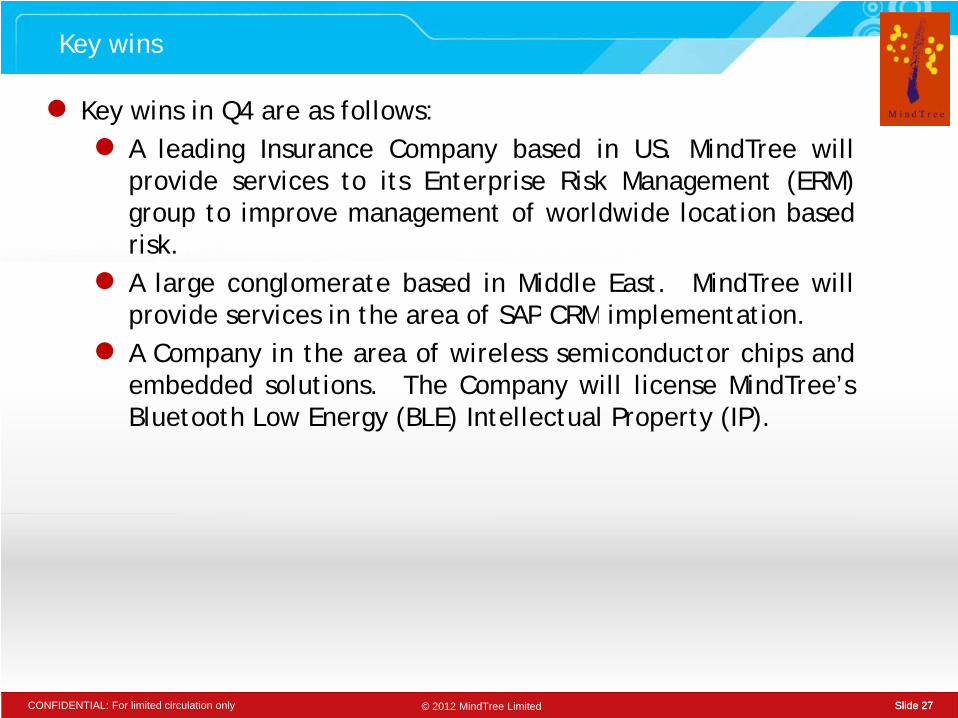
Key wins
● K i i Q4 f ll● Key wins in Q4 are as follows:● A leading Insurance Company based in US. MindTree will
provide services to its Enterprise Risk Management (ERM)t i t f ld id l ti b dgroup to improve management of worldwide location based
risk.● A large conglomerate based in Middle East. MindTree will
id i i th f SAP CRM i l t tiprovide services in the area of SAP CRM implementation.● A Company in the area of wireless semiconductor chips and
embedded solutions. The Company will license MindTree’sBl t th L E g (BLE) I t ll t l P t (IP)Bluetooth Low Energy (BLE) Intellectual Property (IP).
© 2012 MindTree Limited Slide 27CONFIDENTIAL: For limited circulation only Slide 27
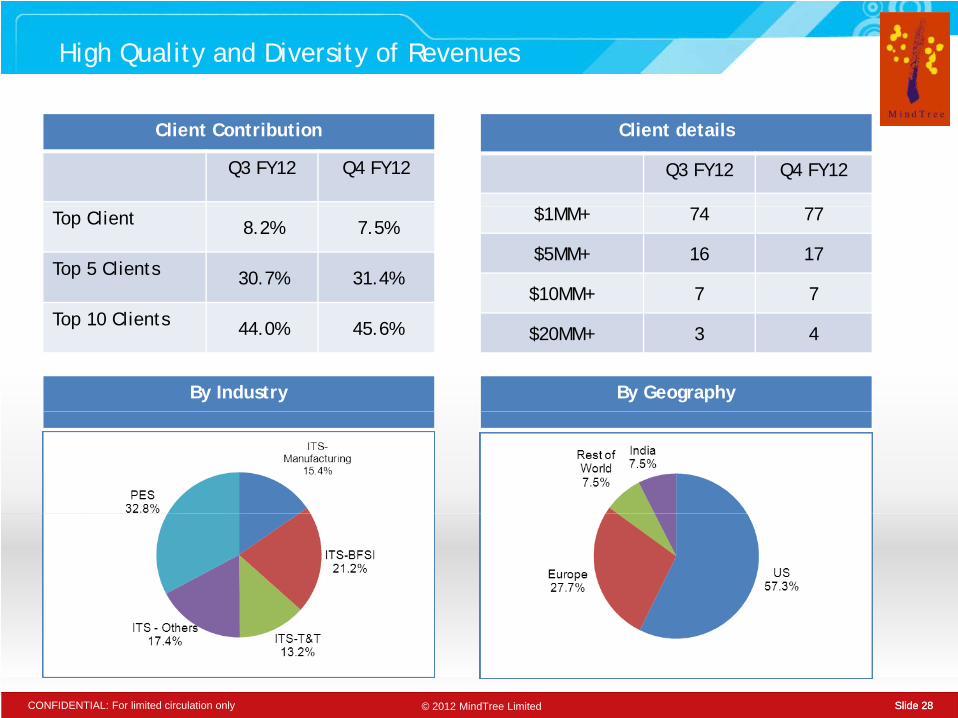
High Quality and Diversity of Revenues
Client details
Q3 FY12 Q4 FY12
$
Client Contribution
Q3 FY12 Q4 FY12
$1MM+ 74 77
$5MM+ 16 17
$10MM+ 7 7
Top Client 8.2% 7.5%
Top 5 Clients 30.7% 31.4%
$20MM+ 3 4Top 10 Clients 44.0% 45.6%
By Industry By Geography
© 2012 MindTree Limited Slide 28CONFIDENTIAL: For limited circulation only Slide 28

Other Operating Metrics
Revenue by Project Type
Q3 FY12 Q4 FY12
Revenue by Business
Q3 FY12 Q4 FY12
Fixed Cost, Fixed Monthly 38.2% 37.9%ITS 66.9% 67.2%
Time and Materials 61.8% 62.1%Product Engineering
Services (PES)33.1% 32.8%
Headcount and Utilization Revenue MixHeadcount and Utilization
Q3 FY12 Q4 FY12
Revenue Mix
Q3 FY12 Q4 FY12
Headcount 10,934 11,000
Utilization* 68 3% 67 8%
Onsite 34.0% 34.5%
Offshore 66 0% 65 5%
© 2012 MindTree Limited Slide 29CONFIDENTIAL: For limited circulation only Slide 29
Utilization 68.3% 67.8% Offshore 66.0% 65.5%
* - Including Trainees
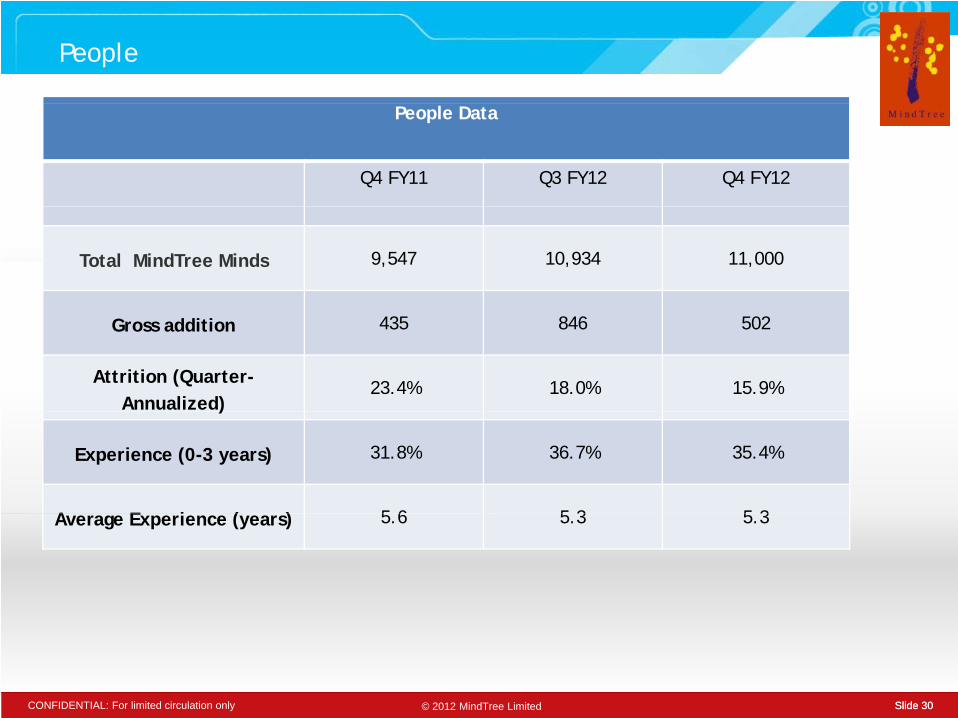
People
People Data
Q4 FY11 Q3 FY12 Q4 FY12
Total MindTree Minds 9,547 10,934 11,000
Gross addition 435 846 502
Attrition (Quarter-Annualized)
23.4% 18.0% 15.9%)
Experience (0-3 years) 31.8% 36.7% 35.4%
A E i ( ) 5 6 5 3 5 3Average Experience (years) 5.6 5.3 5.3
© 2012 MindTree Limited Slide 30CONFIDENTIAL: For limited circulation only Slide 30
Sushanth Pai
© 2012 MindTree Limited Slide 31CONFIDENTIAL: For limited circulation only Slide 31
www.mindtree.com
© 2012 MindTree LimitedCONFIDENTIAL: For limited circulation only
Related Documents