Alandalus Property Q1 2021 Investor Presentation 1 H1 2021

Welcome message from author
This document is posted to help you gain knowledge. Please leave a comment to let me know what you think about it! Share it to your friends and learn new things together.
Transcript

Alandalus
Property
Q1 2021
Investor Presentation
1
H1 2021
Alandalus
Property
Q1 2021 Disclaimer
The information contained in this presentation is subject to change without further notice, its accuracy is not guaranteed, and it may not contain all material information concerning the company. Neither we nor our advisors make any representation regarding, and assume no responsibility or liability for, the accuracy or completeness of, or any errors or omissions in, to any information contained herein.In addition, the information contains projections and forward-looking statements that reflect the company’s current views with respect to future events and financial performance. These views are based on current assumptions which are subject to various risks and may change over time. No assurance can be given that future events will occur, that projections will be achieved, or that the company’s assumptions are correct. Actual results may differ materially from those projected.This presentation is strictly not to be distributed without the explicit consent of Alandalus Companymanagement under any circumstances.
2
Alandalus
Property
Q1 2021
Overview
Operational Performance
Financial Performance
4
9
12
Contents
3
Alandalus
Property
Q1 2021
4
Overview
Alandalus
Property
Q1 2021
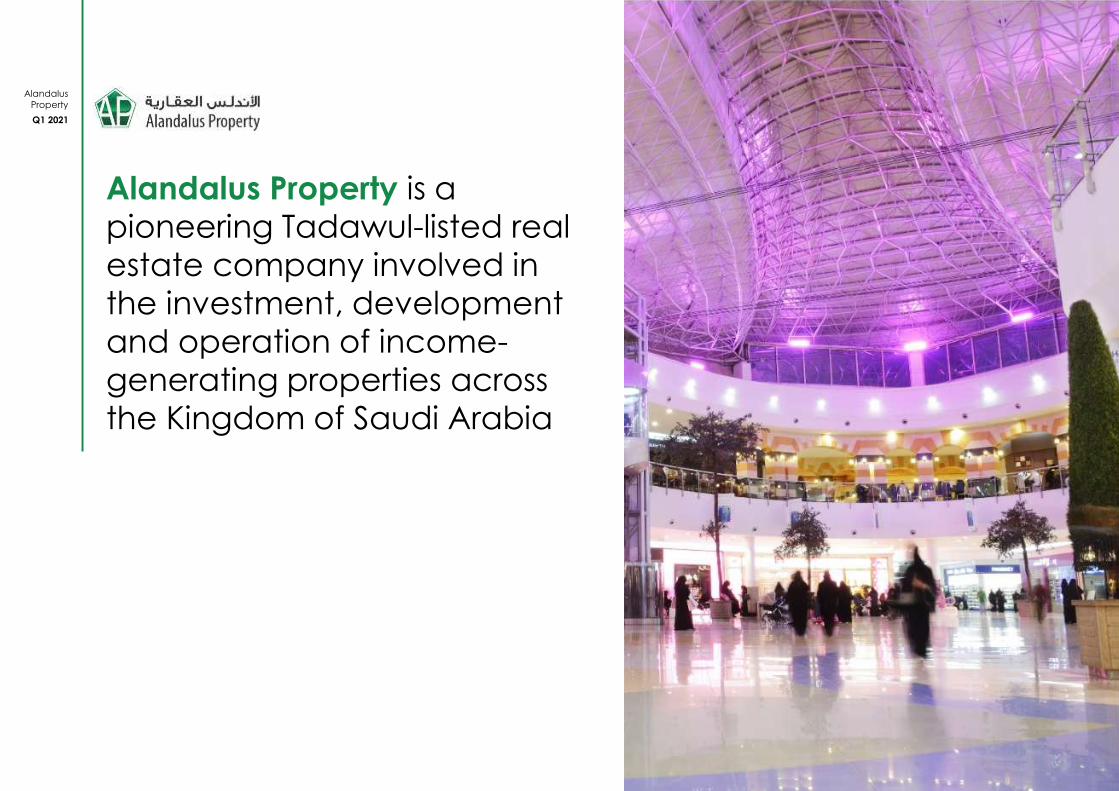
Alandalus Property is a
pioneering Tadawul-listed real
estate company involved in
the investment, development
and operation of income-
generating properties across
the Kingdom of Saudi Arabia
Change picture

To develop and operate unique and
compelling destinations differentiated by
engaging guests, customers and
communities through experiences that foster
loyalty, frequency of visits and lifetime value
which ultimately drive and sustain
unparalleled growth
To become the most admired and
awarded developer of preferred
destination spaces by leading the
transformation from transactional to
engagement-focused destinations in the Kingdom of Saudi Arabia
Mission
Vision
6
Alandalus
Property
Q1 2021
7
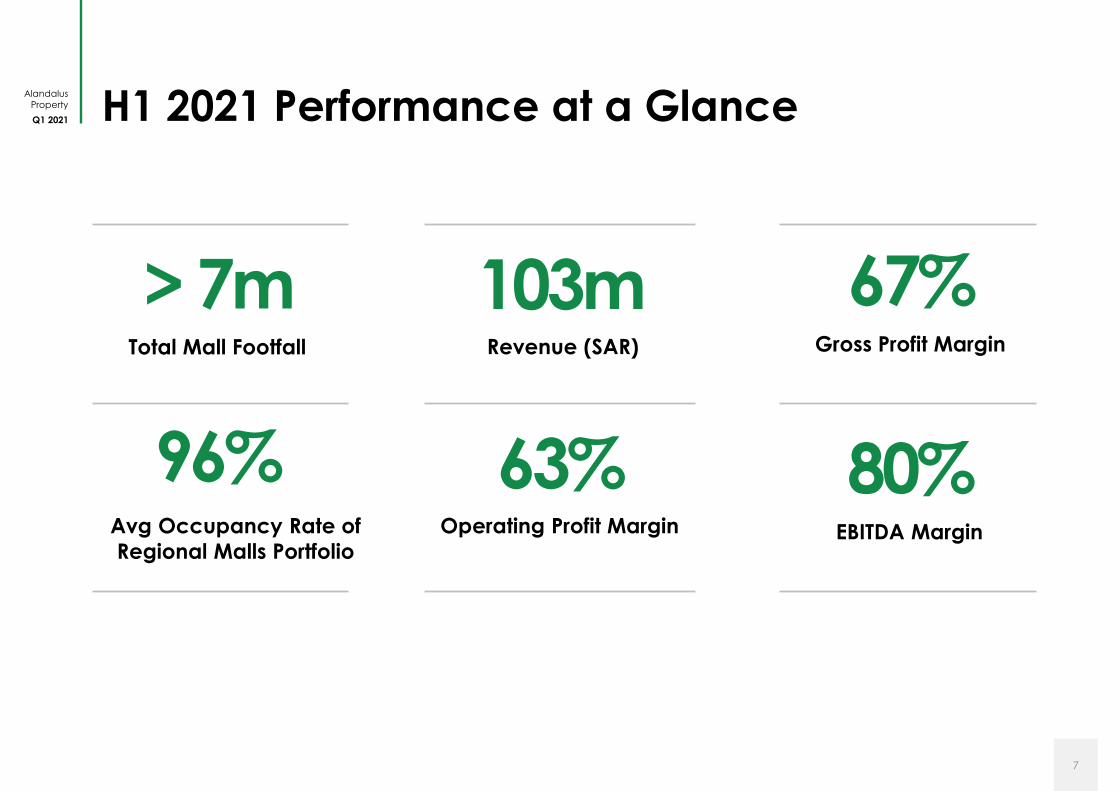
H1 2021 Performance at a Glance
Total Mall Footfall
> 7mRevenue (SAR)
103m
Operating Profit Margin
63%
Gross Profit Margin
67%
EBITDA Margin
80%Avg Occupancy Rate of
Regional Malls Portfolio
96%
Alandalus
Property
Q1 2021
8
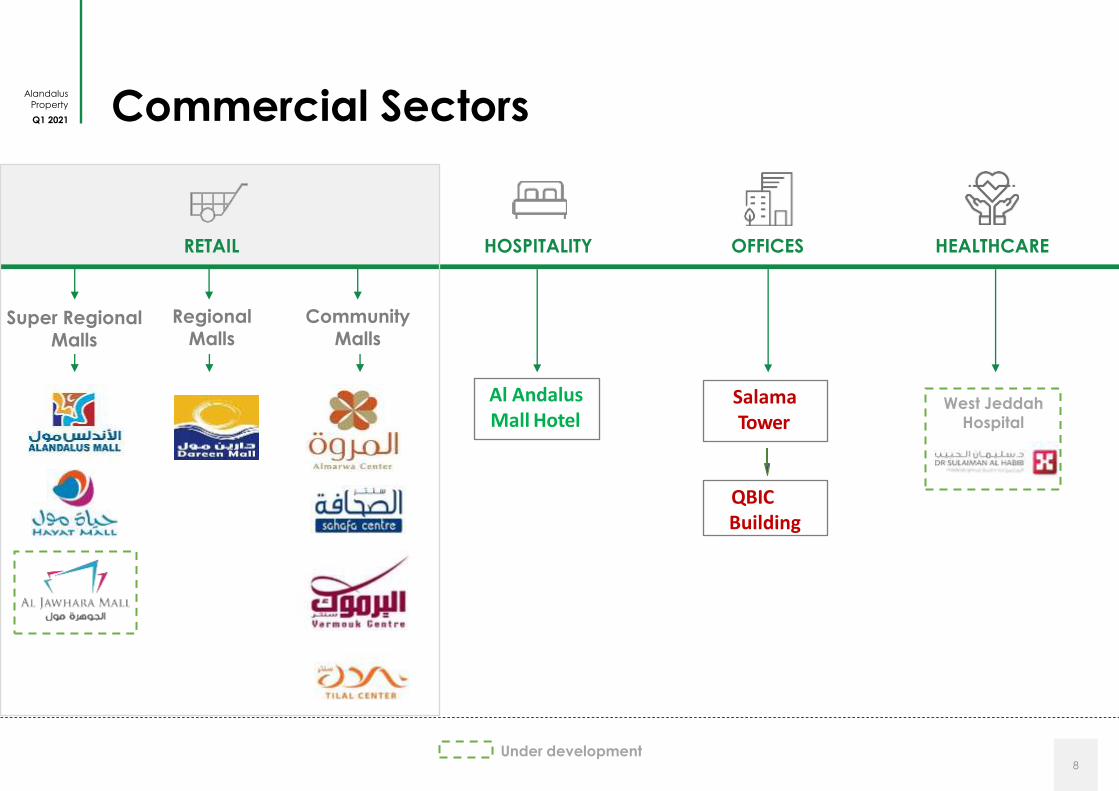
Commercial Sectors
RETAIL HOSPITALITY OFFICES HEALTHCARE
Regional Malls
Community Malls
West Jeddah
Hospital
Under development
Super Regional Malls
Al Andalus Mall Hotel
Salama Tower
QBICBuilding

Alandalus
Property
Q1 2021 Operational
Performance
9
Alandalus
Property
Q1 2021
10
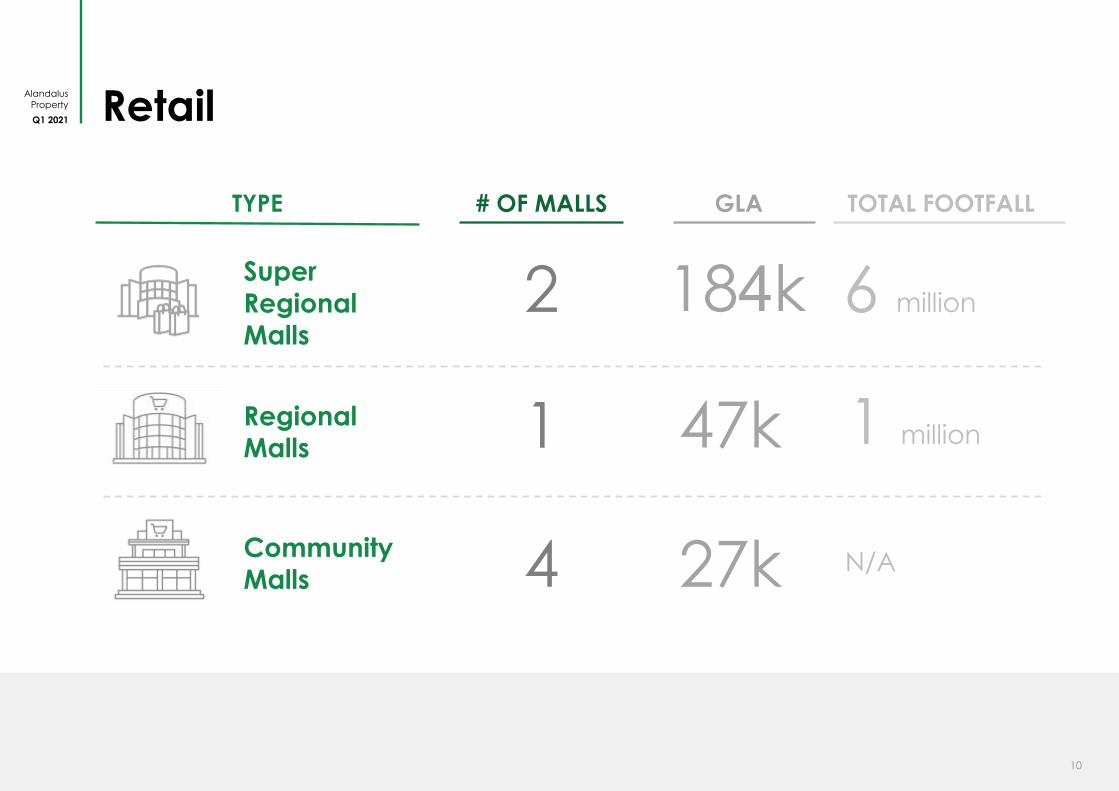
Retail
TYPE # OF MALLS GLA TOTAL FOOTFALL
Super Regional
Malls
Regional
Malls
Community
Malls
2
1
4 27k
6 million
N/A
47k
184k
1 million
Alandalus
Property
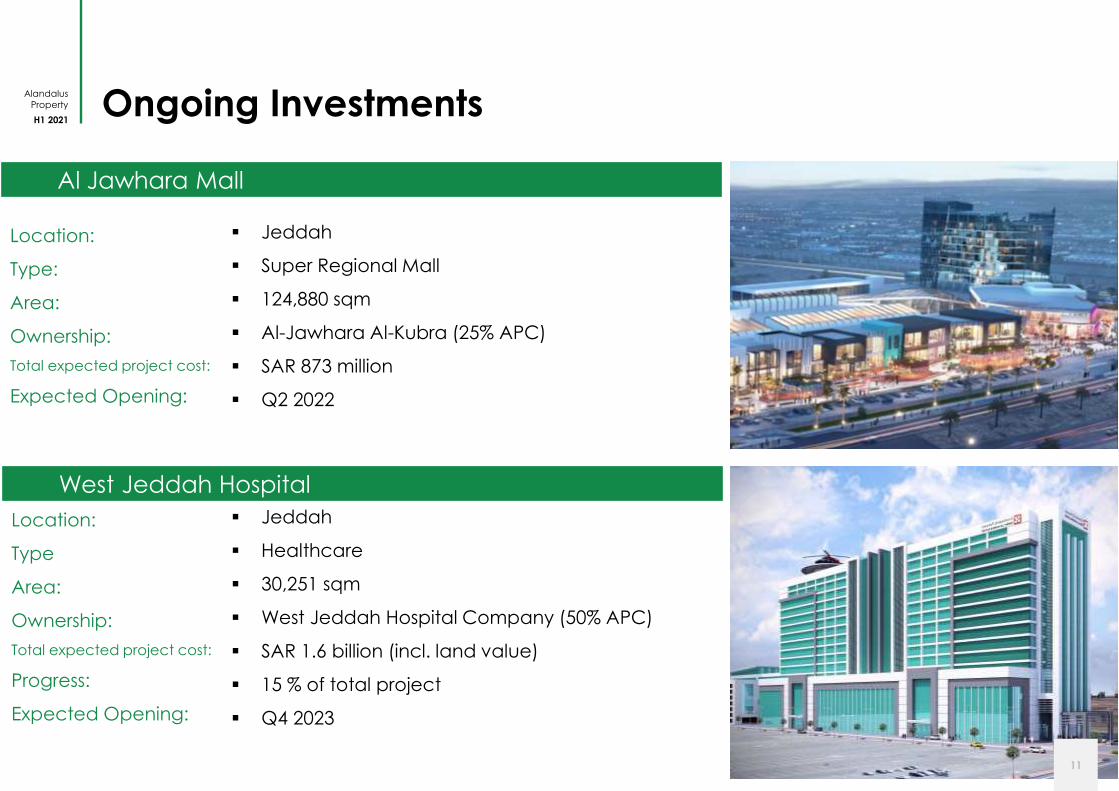
H1 2021Ongoing Investments
▪ Jeddah
▪ Super Regional Mall
▪ 124,880 sqm
▪ Al-Jawhara Al-Kubra (25% APC)
▪ SAR 873 million
▪ Q2 2022
Location:
Type:
Area:
Ownership:
Total expected project cost:
Expected Opening:
Al Jawhara Mall
▪ Jeddah
▪ Healthcare
▪ 30,251 sqm
▪ West Jeddah Hospital Company (50% APC)
▪ SAR 1.6 billion (incl. land value)
▪ 15 % of total project
▪ Q4 2023
Location:
Type
Area:
Ownership:
Total expected project cost:
Progress:
Expected Opening:
West Jeddah Hospital
11
Alandalus
Property
Q1 2021 Financial
Performance
12
Alandalus
Property
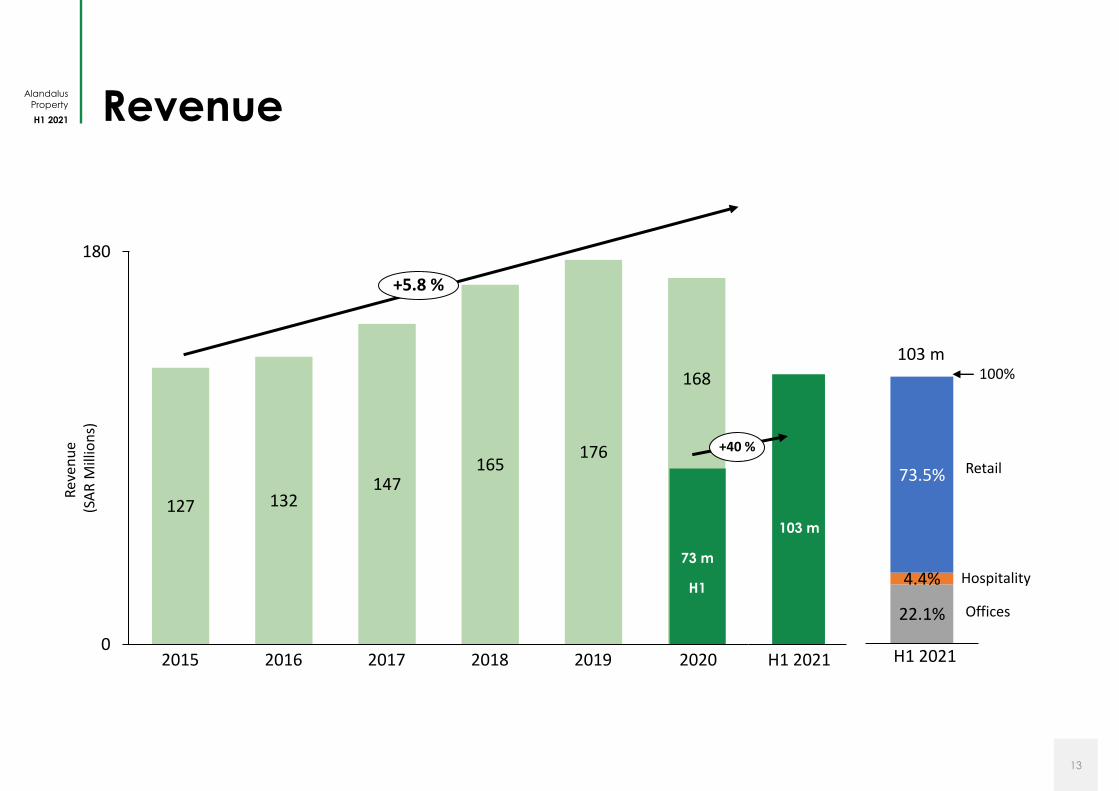
H1 2021 Revenue
13
127 132147
165176
168
180
0202020162015 2017 2018 2019
+5.8 %
Rev
enu
e(S
AR
Mill
ion
s)
22.1%
4.4%
73.5%
100%
Retail
H1 2021
103 m
Offices
Hospitality
+40 %
H1 2021
73 m
H1
103 m
Alandalus
Property
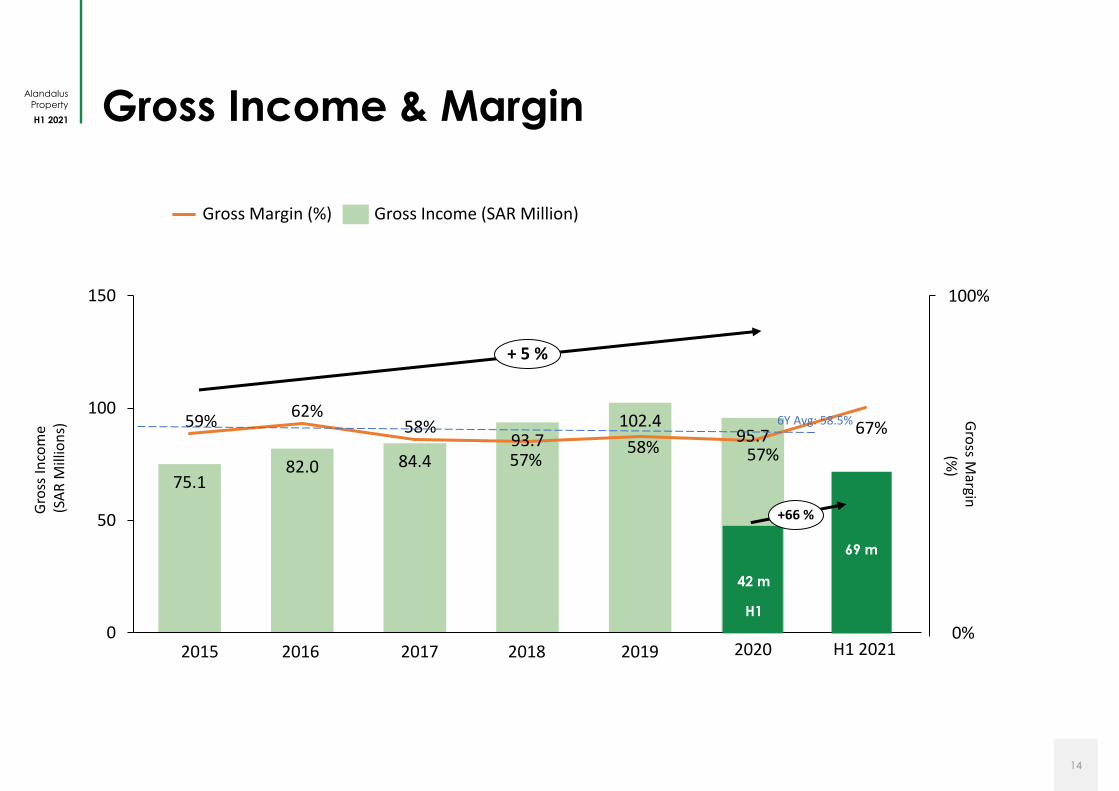
H1 2021 Gross Income & Margin
14
75.182.0 84.4
93.7102.4
95.7
0
50
100
150 100%
0%
59%
2019 20202015
62%
2016
58%
2017
57%
2018
58%
+ 5 %
Gross Income (SAR Million)Gross Margin (%)
Gro
ss In
com
e(S
AR
Mill
ion
s)
Gro
ss Margin
(%
)
6Y Avg: 58.5%
57%
+66 %
H1 2021
42 m
H1
69 m
67%
Alandalus
Property
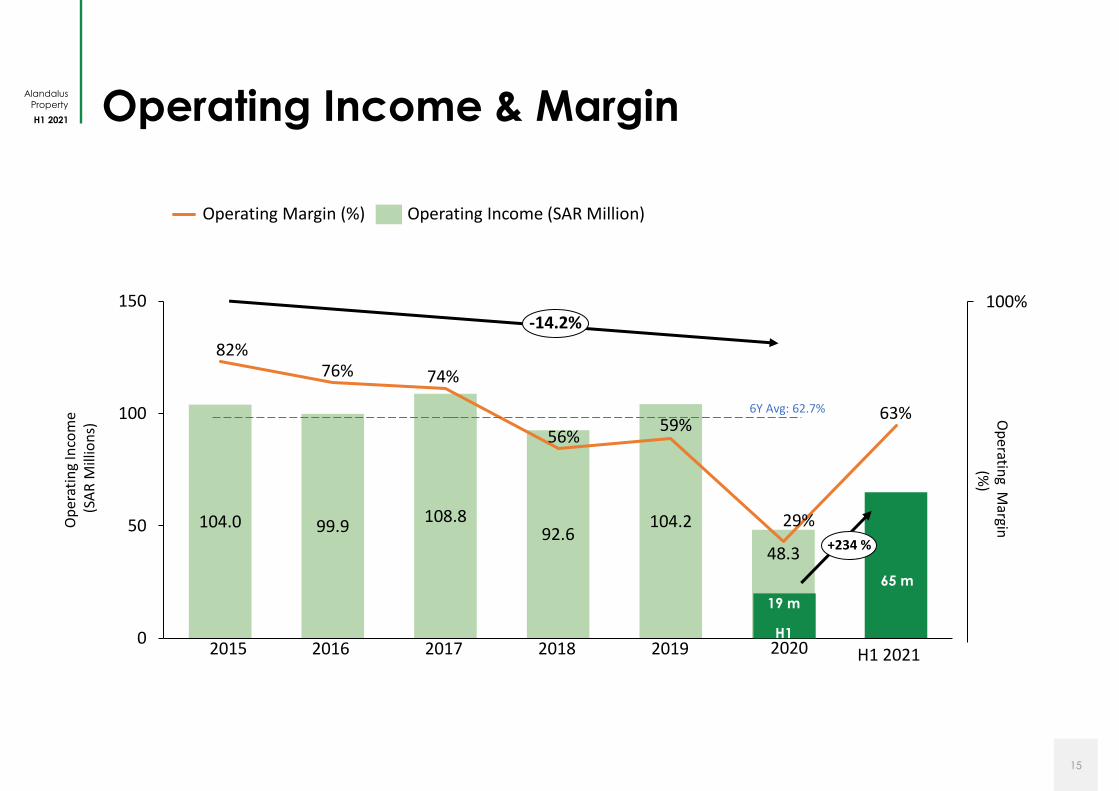
H1 2021 Operating Income & Margin
15
6Y Avg: 62.7%
104.0 99.9108.8
92.6104.2
48.3
0%
50%
100%
0
50
100
150
2016
29%
2017 2020
74%
82%
2015
76%
56%
2018 2019
-14.2%
Operating Margin (%) Operating Income (SAR Million)
Op
erat
ing
Inco
me
(SA
R M
illio
ns)
Op
erating M
argin
(%)
59%
100%
+234 %
H1 2021
19 m
H1
65 m
63%
Alandalus
Property
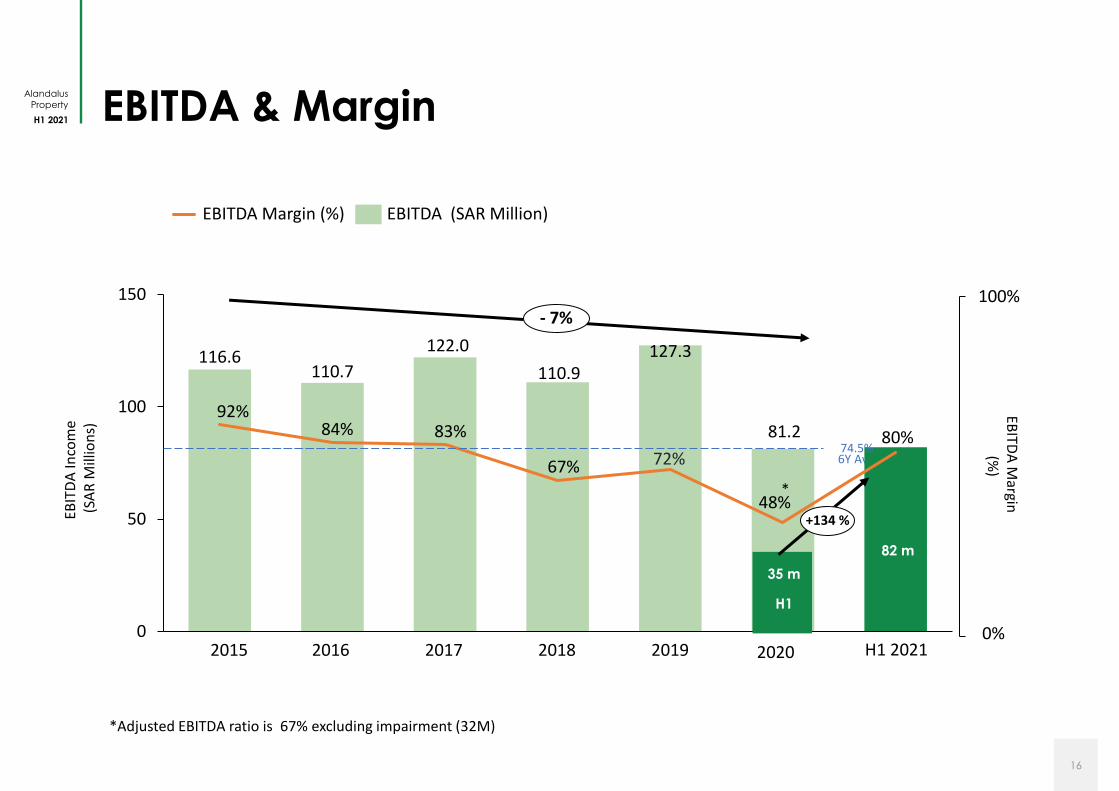
H1 2021 EBITDA & Margin
16
6Y Avg
116.6110.7
122.0
110.9127.3
81.2
0%
50%
100%
150%
0
50
100
150
92%
2017
83%
2016 2018 20202015
84%
67% 72%
2019
74.5%
- 7%
EBITDA Margin (%) EBITDA (SAR Million)
EBIT
DA
Inco
me
(SA
R M
illio
ns)
EBITD
A M
argin
(%)
48%
*Adjusted EBITDA ratio is 67% excluding impairment (32M)
100%
0%
+134 %
H1 2021
82 m
35 m
H1
80%
*
Alandalus
Property
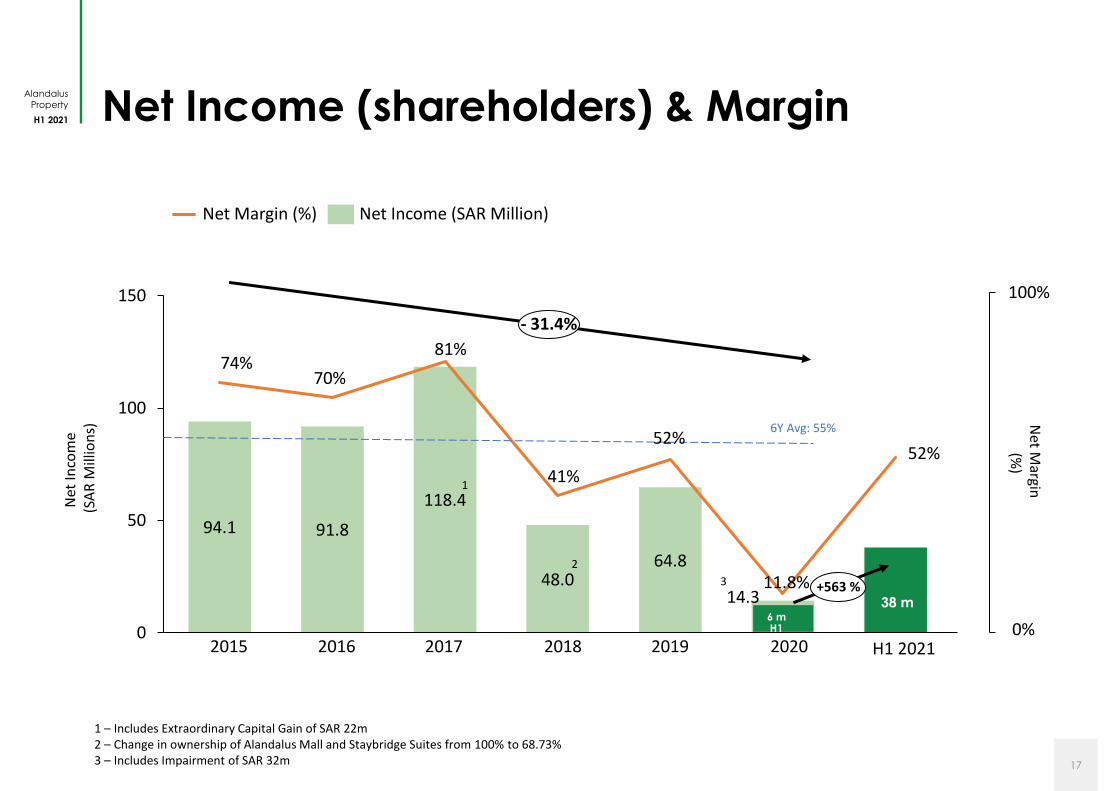
H1 2021 Net Income (shareholders) & Margin
17
6Y Avg: 55%
94.1 91.8
118.4
48.064.8
14.3
0%
50%
100%
0
50
100
150
2015
11.8%
2016 2020
74%70%
81%
1
2017
41%
2
2018
52%
2019
- 31.4%
Net Margin (%) Net Income (SAR Million)
Net
Inco
me
(SA
R M
illio
ns)
Net M
argin
(%)
1 – Includes Extraordinary Capital Gain of SAR 22m2 – Change in ownership of Alandalus Mall and Staybridge Suites from 100% to 68.73%3 – Includes Impairment of SAR 32m
100%
0%
+563 %
H1 2021
38 m
52%
6 m H1
3
Alandalus
Property
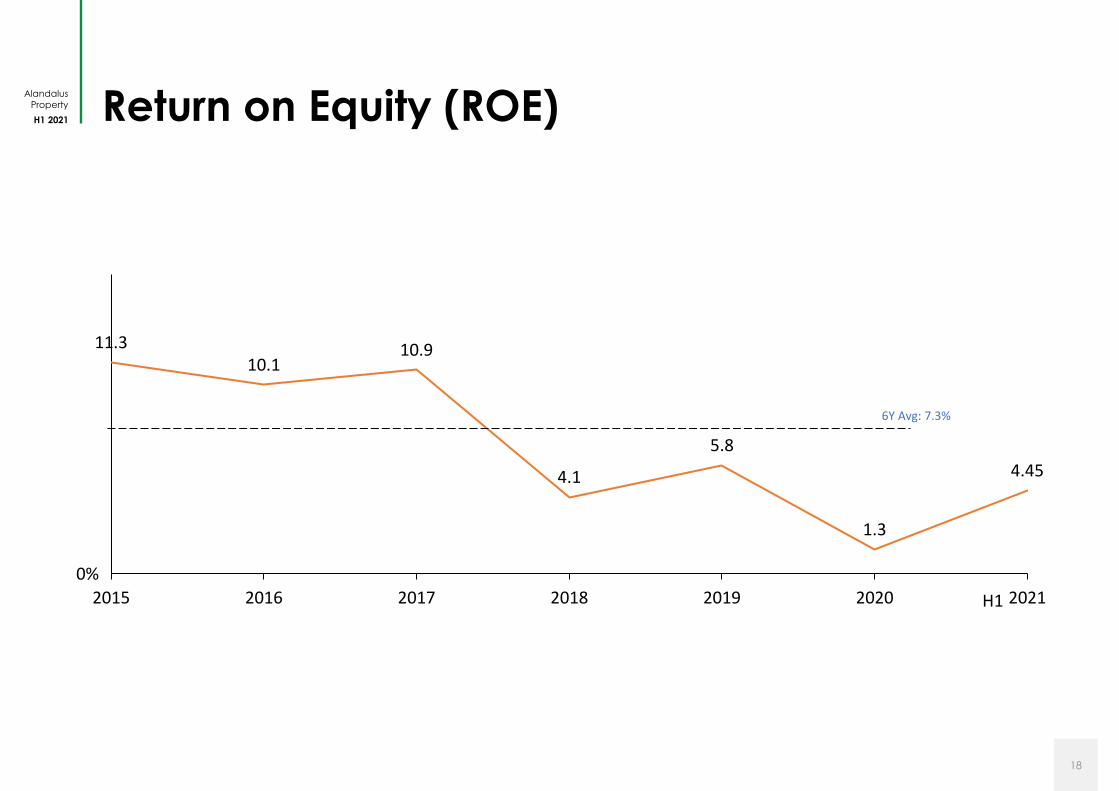
H1 2021 Return on Equity (ROE)
18
11.310.1
10.9
4.1
5.8
1.3
4.45
2015 2016 2017 2018 2019 2020 2021
0%
6Y Avg: 7.3%
H1
Alandalus
Property
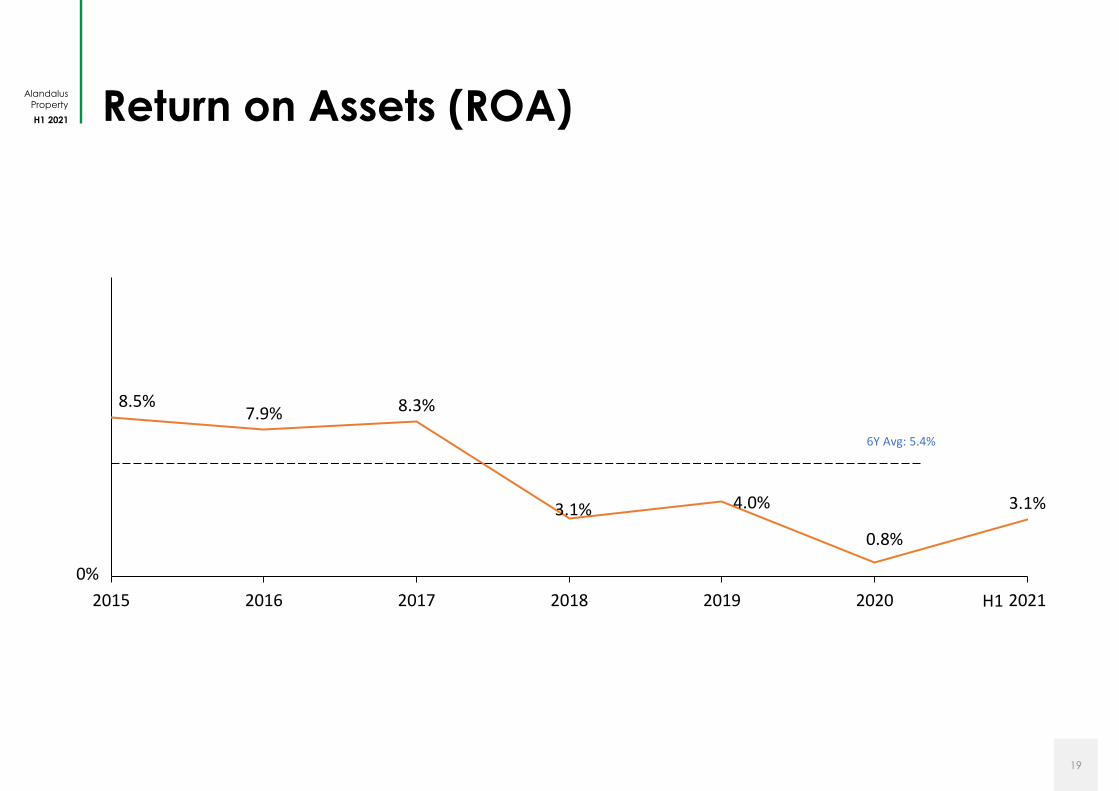
H1 2021 Return on Assets (ROA)
19
8.5%7.9% 8.3%
3.1% 4.0% 3.1%
2015 2016 2017 2018 2019 2020 2021
0%
6Y Avg: 5.4%
0.8%
H1
Alandalus
Property
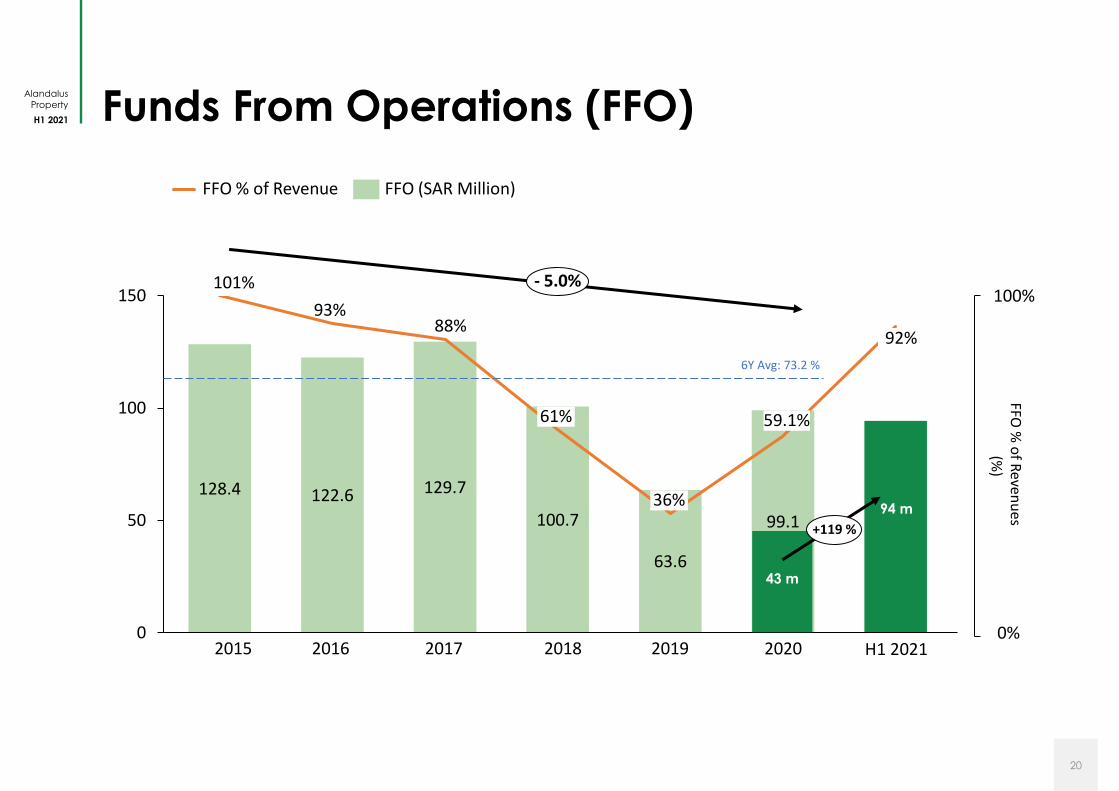
H1 2021 Funds From Operations (FFO)
20
6Y Avg: 73.2 %
128.4 122.6 129.7
100.7
63.6
99.1
0%
50%
100%
0
50
100
150
88%
2020
101%
2015 2016
93%
2017
61%
2018
36%
2019
- 5.0%
FFO % of Revenue FFO (SAR Million)
59.1%
100%
0%
FFO %
of R
evenu
es(%
)
+119 %
H1 2021
92%
94 m
43 m
Alandalus
Property
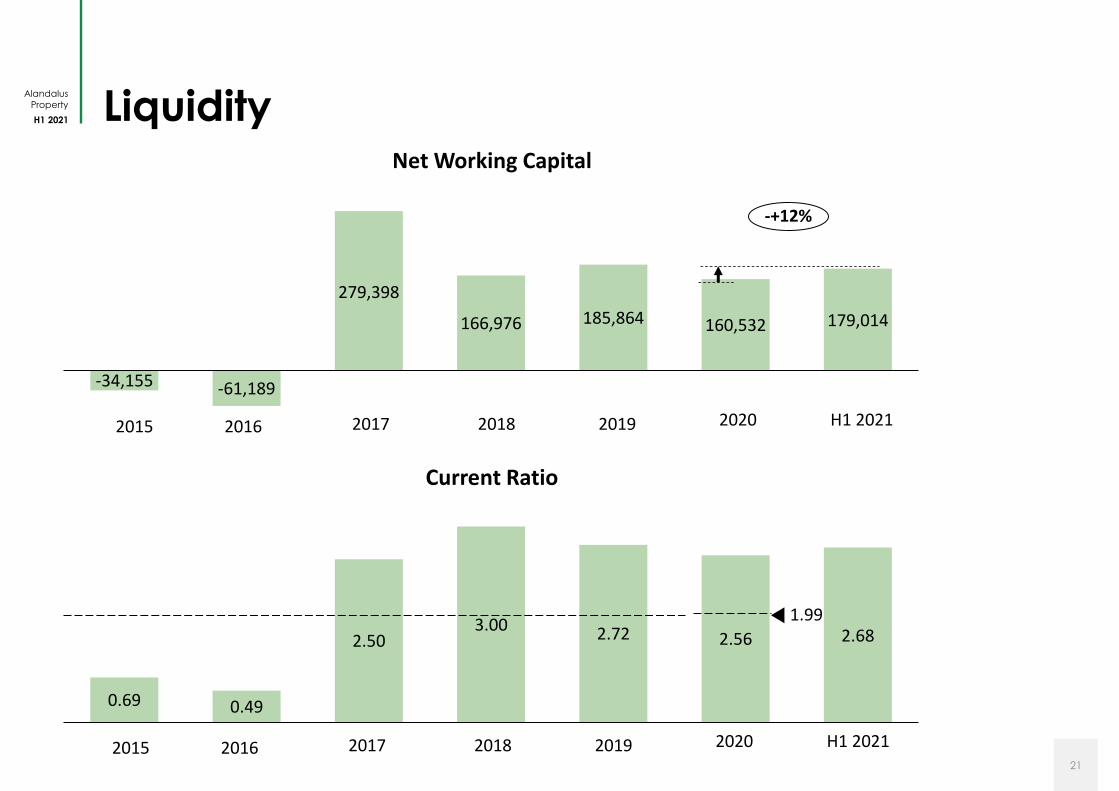
H1 2021 Liquidity
21
Net Working Capital
-34,155 -61,189
279,398
166,976 185,864 160,532 179,014
2019 20202015 2016 2017 2018
-+12%
Current Ratio
0.69 0.49
2.503.00 2.72 2.56 2.68
1.99
H1 2021
2019 20202015 2016 2017 2018 H1 2021
Alandalus
Property
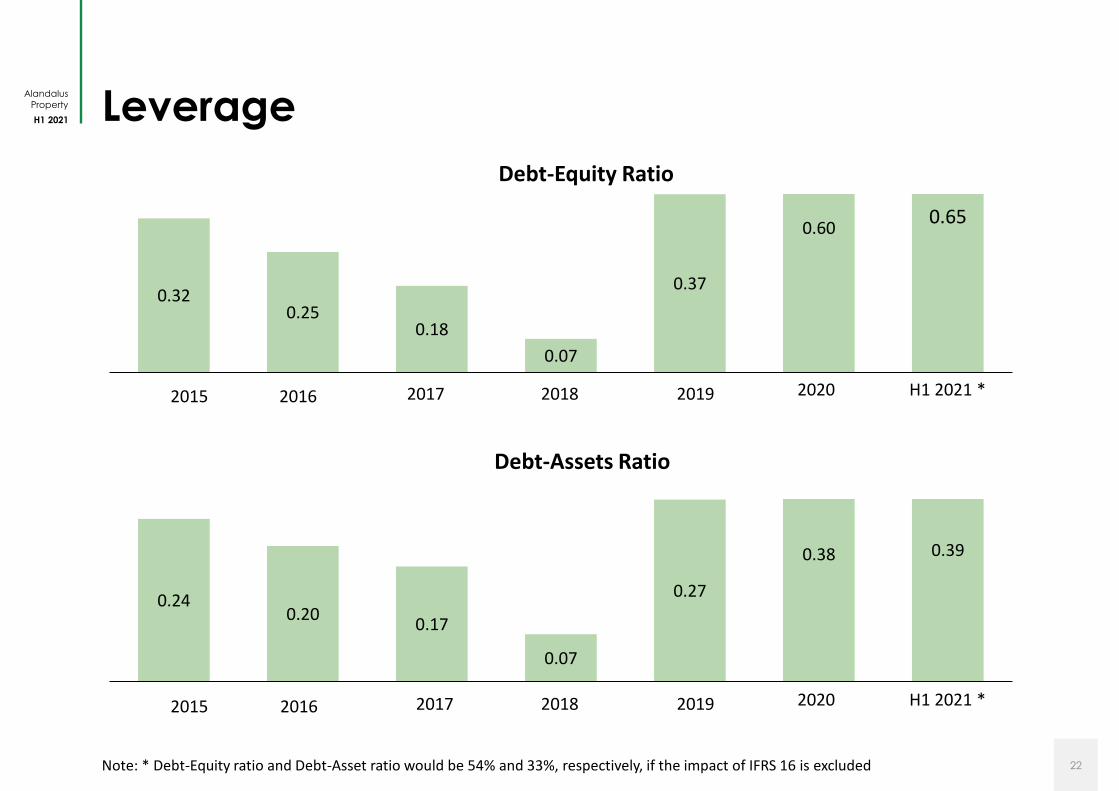
H1 2021 Leverage
22
0.240.20
0.17
0.07
0.27
0.38 0.39
Debt-Assets Ratio
0.320.25
0.18
0.07
0.37
0.600.65
Debt-Equity Ratio
Note: * Debt-Equity ratio and Debt-Asset ratio would be 54% and 33%, respectively, if the impact of IFRS 16 is excluded
2019 20202015 2016 2017 2018 H1 2021 *
2019 20202015 2016 2017 2018 H1 2021 *
Alandalus
Property
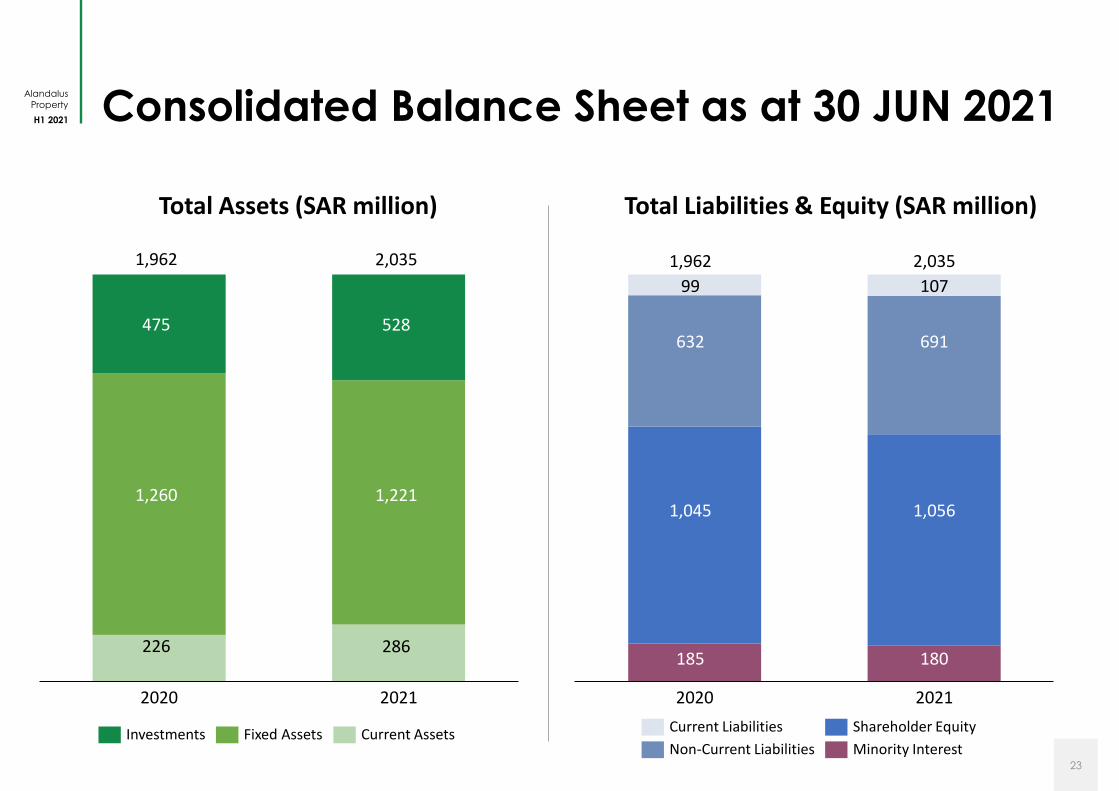
H1 2021 Consolidated Balance Sheet as at 30 JUN 2021
23
Total Assets (SAR million) Total Liabilities & Equity (SAR million)
2020
107
2021
2,035
1,056
691
180
Current Liabilities Shareholder Equity
Non-Current Liabilities Minority Interest
2021
226
1,260
2020
475
1,962
Investments Fixed Assets Current Assets
286
1,221
528
2,035
99
1,962
1,045
632
185

Related Documents