1 V. 24.11. 2016 Family Day | 2 décembre 2016 Investor Day December 1, 2016

Welcome message from author
This document is posted to help you gain knowledge. Please leave a comment to let me know what you think about it! Share it to your friends and learn new things together.
Transcript
1V. 24.11. 2016 Family Day | 2 décembre 2016
Investor DayDecember 1, 2016
2Wendel Investor Day | December 1, 2016
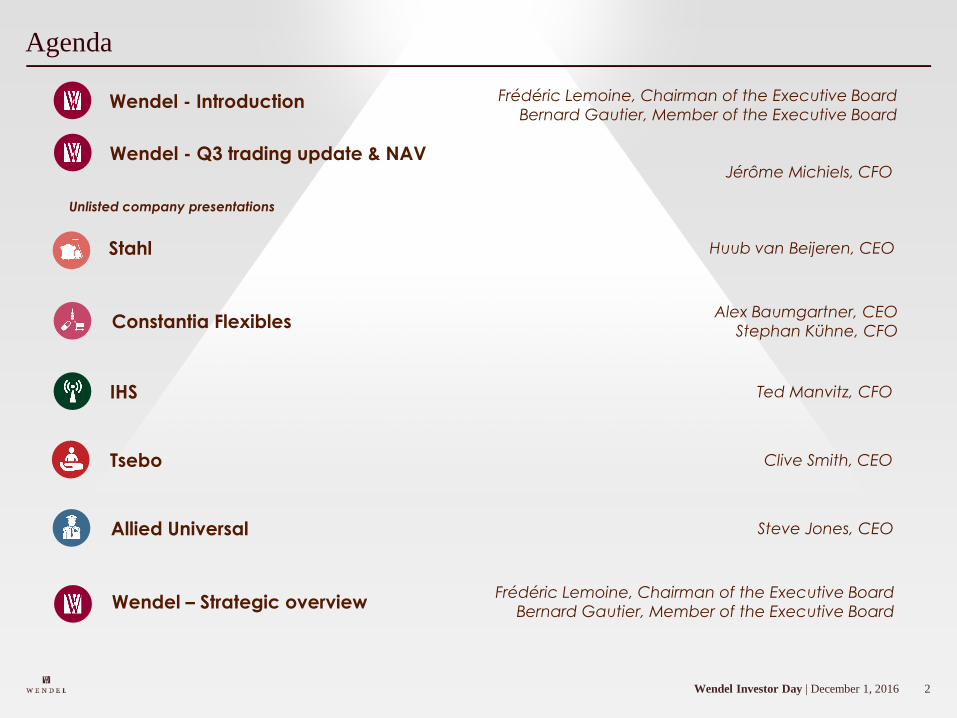
Agenda
Wendel - Q3 trading update & NAV
Stahl Huub van Beijeren, CEO
Constantia FlexiblesAlex Baumgartner, CEO
Stephan Kühne, CFO
IHS Ted Manvitz, CFO
Tsebo Clive Smith, CEO
Allied Universal Steve Jones, CEO
Wendel – Strategic overviewFrédéric Lemoine, Chairman of the Executive Board
Bernard Gautier, Member of the Executive Board
Wendel - Introduction
Jérôme Michiels, CFO
Frédéric Lemoine, Chairman of the Executive Board
Bernard Gautier, Member of the Executive Board
Unlisted company presentations
3Wendel Investor Day | December 1, 2016
Put your questions to our speakers through out the morning
OR OR
Visit app.wisembly.com
Enter keyword: wendel2016
Scan QR code
Access Wisembly directly
Send SMS to +44 1582 380 335
Type wendel2016 followed by
a space mark and your question
Q&A sessions will follow each keynote
In the room, you can ask questions orally or use our interactive tool.
From the web, you can ask questions from our interactive tool.
4Wendel Investor Day | December 1, 2016
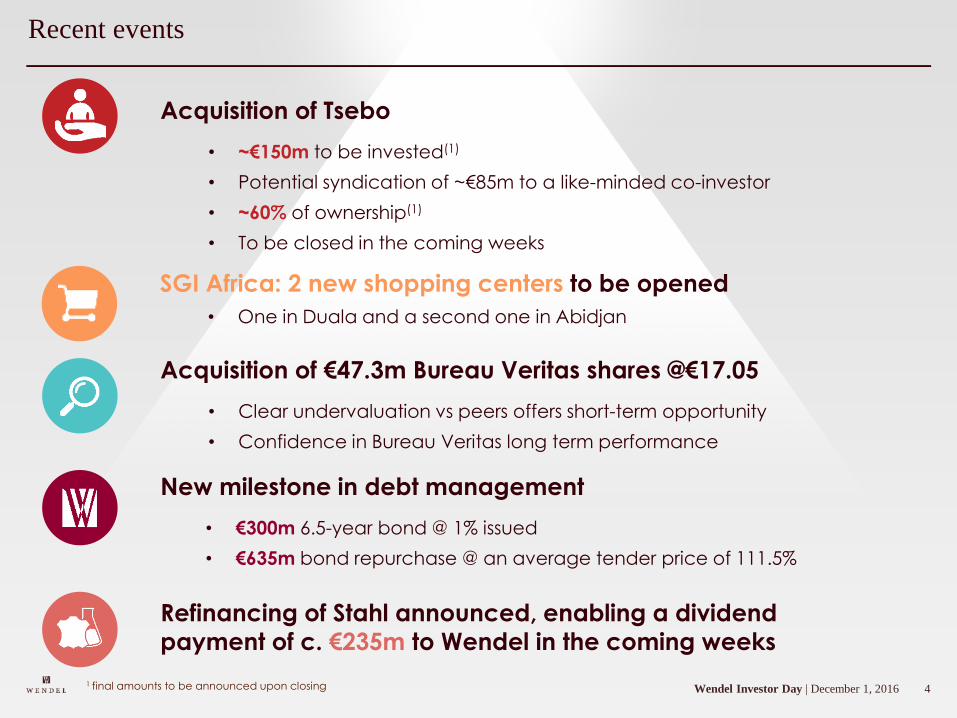
Recent events
Acquisition of Tsebo
• ~€150m to be invested(1)
• Potential syndication of ~€85m to a like-minded co-investor
• ~60% of ownership(1)
• To be closed in the coming weeks
New milestone in debt management
• €300m 6.5-year bond @ 1% issued
• €635m bond repurchase @ an average tender price of 111.5%
1 final amounts to be announced upon closing
Acquisition of €47.3m Bureau Veritas shares @€17.05
• Clear undervaluation vs peers offers short-term opportunity
• Confidence in Bureau Veritas long term performance
Refinancing of Stahl announced, enabling a dividend
payment of c. €235m to Wendel in the coming weeks
SGI Africa: 2 new shopping centers to be opened
• One in Duala and a second one in Abidjan

5V. 24.11. 2016 Family Day | 2 décembre 2016
Trading updateWendel
6Wendel Investor Day | December 1, 2016
IHS
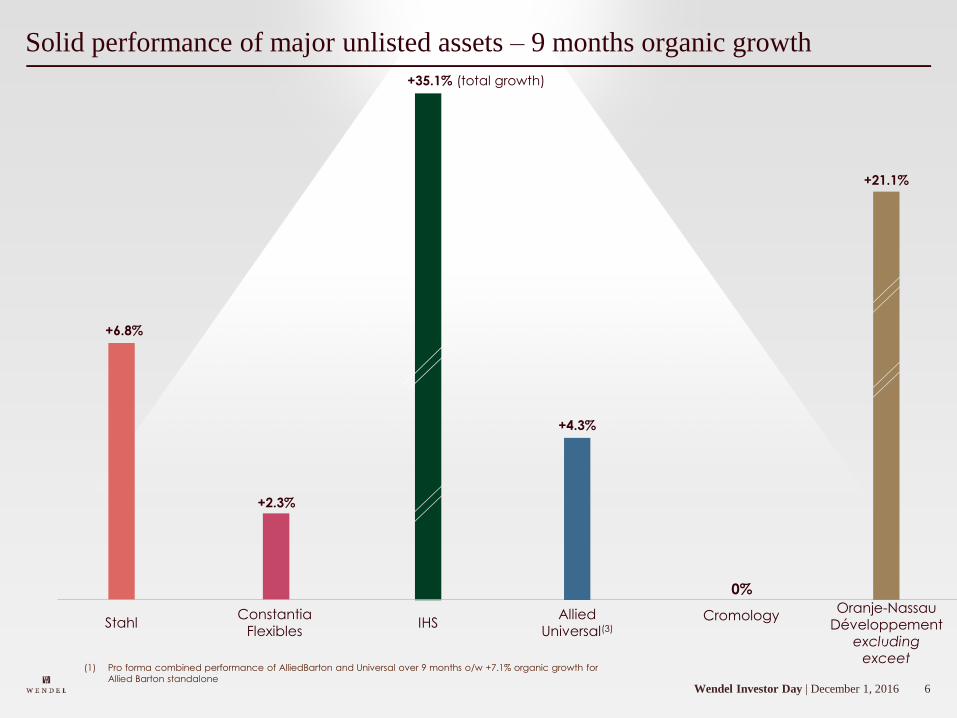
+35.1% (total growth)
Constantia Flexibles
+2.3%
Solid performance of major unlisted assets – 9 months organic growth
(1) Pro forma combined performance of AlliedBarton and Universal over 9 months o/w +7.1% organic growth for
Allied Barton standalone
StahlAllied
Universal(3)
0%
Cromology
+6.8%
+4.3%
Oranje-NassauDéveloppement
excludingexceet
+21.1%
7Wendel Investor Day | December 1, 2016
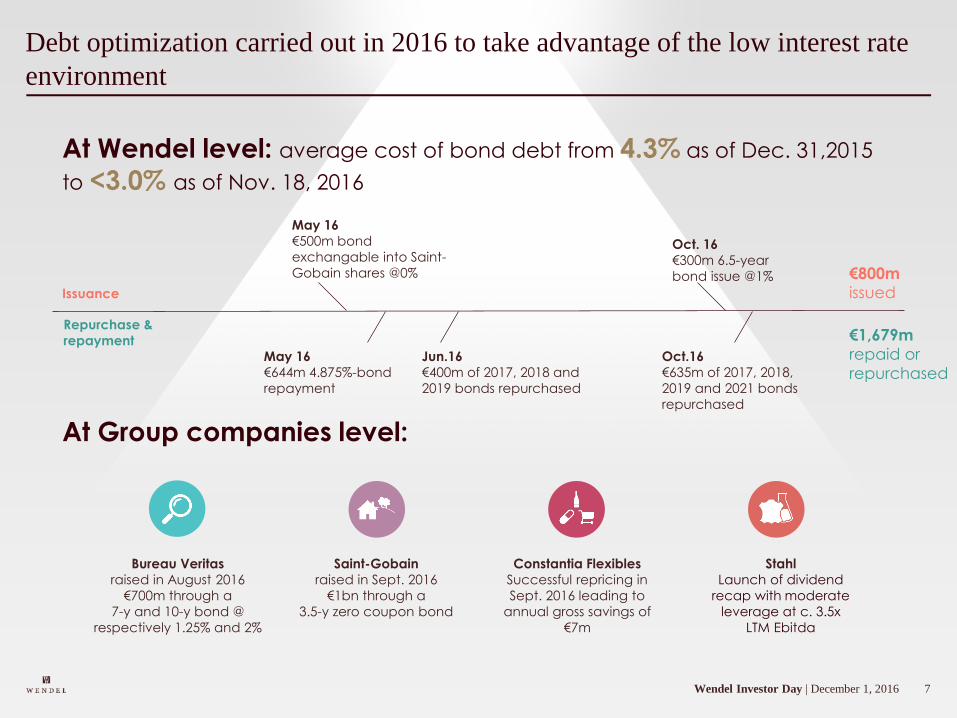
Debt optimization carried out in 2016 to take advantage of the low interest rate
environment
At Wendel level: average cost of bond debt from 4.3% as of Dec. 31,2015
to <3.0% as of Nov. 18, 2016
May 16
€500m bond
exchangable into Saint-
Gobain shares @0%
Jun.16
€400m of 2017, 2018 and
2019 bonds repurchased
Oct. 16
€300m 6.5-year
bond issue @1%
Oct.16
€635m of 2017, 2018,
2019 and 2021 bonds
repurchased
May 16
€644m 4.875%-bond
repayment
At Group companies level:
Bureau Veritas
raised in August 2016
€700m through a
7-y and 10-y bond @
respectively 1.25% and 2%
Saint-Gobain
raised in Sept. 2016
€1bn through a
3.5-y zero coupon bond
Constantia Flexibles
Successful repricing in
Sept. 2016 leading to
annual gross savings of
€7m
Stahl
Launch of dividend
recap with moderate
leverage at c. 3.5x
LTM Ebitda
Issuance
Repurchase &
repayment
€800m
issued
€1,679m
repaid or
repurchased
8Wendel Investor Day | December 1, 2016
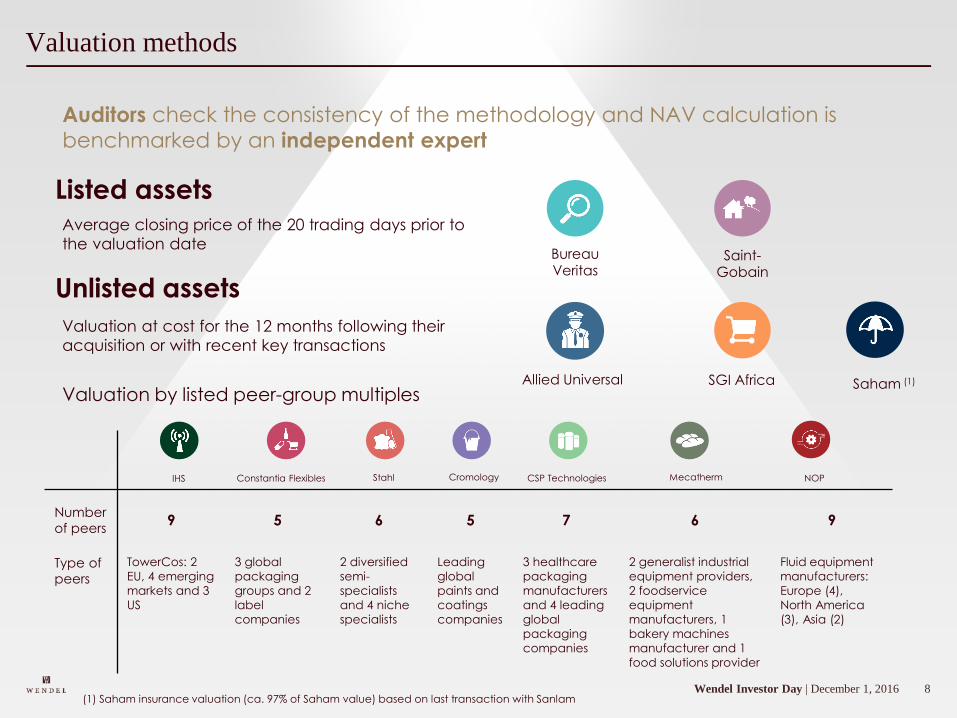
Number
of peers9 5 6 5 7 6 9
Type of
peers
TowerCos: 2
EU, 4 emerging
markets and 3
US
3 global
packaging
groups and 2
label
companies
2 diversified
semi-
specialists
and 4 niche
specialists
Leading
global
paints and
coatings
companies
3 healthcare
packaging
manufacturers
and 4 leading
global
packaging
companies
2 generalist industrial
equipment providers,
2 foodservice
equipment
manufacturers, 1
bakery machines
manufacturer and 1
food solutions provider
Fluid equipment
manufacturers:
Europe (4),
North America
(3), Asia (2)
Valuation methods
Listed assetsAverage closing price of the 20 trading days prior to
the valuation date
Unlisted assets
Valuation at cost for the 12 months following their
acquisition or with recent key transactions
Valuation by listed peer-group multiples
Bureau Veritas
SGI Africa
IHS Constantia Flexibles Stahl Cromology CSP Technologies Mecatherm
Saham (1)
NOP
Allied Universal
Saint-Gobain
(1) Saham insurance valuation (ca. 97% of Saham value) based on last transaction with Sanlam
Auditors check the consistency of the methodology and NAV calculation is
benchmarked by an independent expert
9Wendel Investor Day | December 1, 2016
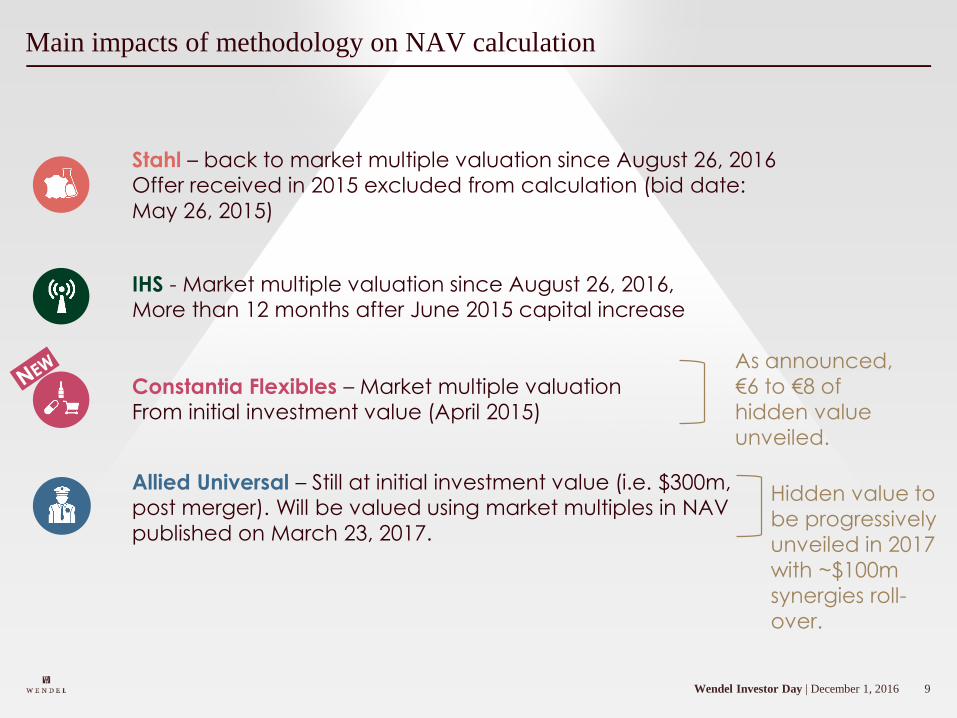
Constantia Flexibles – Market multiple valuationFrom initial investment value (April 2015)
Main impacts of methodology on NAV calculation
Stahl – back to market multiple valuation since August 26, 2016Offer received in 2015 excluded from calculation (bid date:
May 26, 2015)
IHS - Market multiple valuation since August 26, 2016,More than 12 months after June 2015 capital increase
Allied Universal – Still at initial investment value (i.e. $300m, post merger). Will be valued using market multiples in NAV
published on March 23, 2017.
As announced,
€6 to €8 of
hidden value
unveiled.
Hidden value to
be progressively
unveiled in 2017
with ~$100m
synergies roll-
over.
10Wendel Investor Day | December 1, 2016
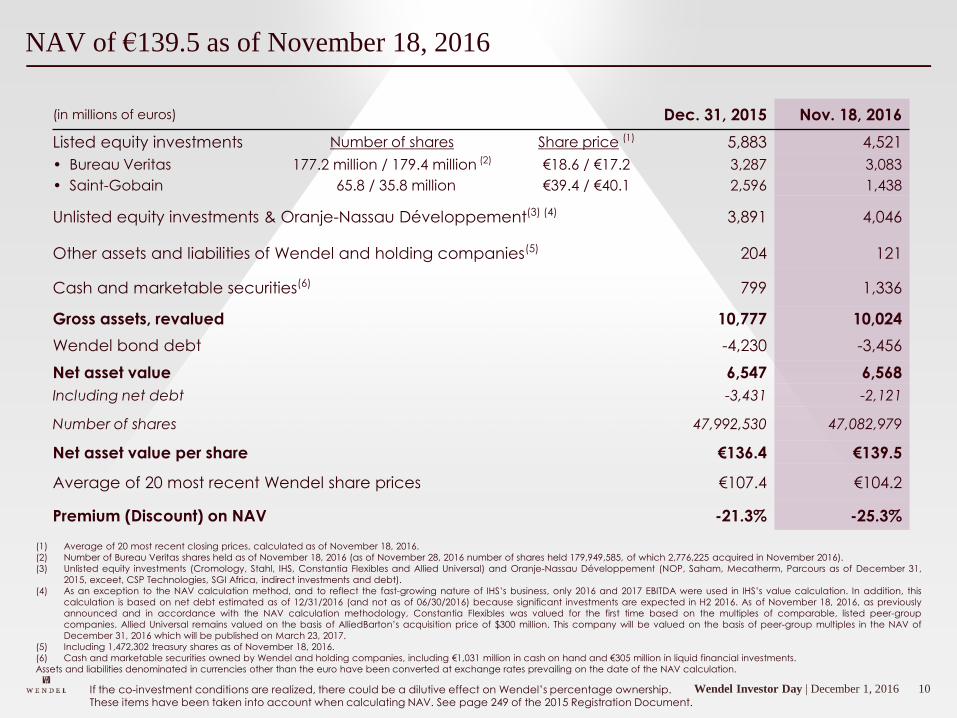
NAV of €139.5 as of November 18, 2016
(in millions of euros) Dec. 31, 2015 Nov. 18, 2016
Listed equity investments Number of shares Share price (1) 5,883 4,521
• Bureau Veritas 177.2 million / 179.4 million (2) €18.6 / €17.2 3,287 3,083
• Saint-Gobain 65.8 / 35.8 million €39.4 / €40.1 2,596 1,438
Unlisted equity investments & Oranje-Nassau Développement(3) (4) 3,891 4,046
Other assets and liabilities of Wendel and holding companies(5) 204 121
Cash and marketable securities(6) 799 1,336
Gross assets, revalued 10,777 10,024
Wendel bond debt -4,230 -3,456
Net asset value 6,547 6,568
Including net debt -3,431 -2,121
Number of shares 47,992,530 47,082,979
Net asset value per share €136.4 €139.5
Average of 20 most recent Wendel share prices €107.4 €104.2
Premium (Discount) on NAV -21.3% -25.3%
(1) Average of 20 most recent closing prices, calculated as of November 18, 2016.
(2) Number of Bureau Veritas shares held as of November 18, 2016 (as of November 28, 2016 number of shares held 179,949,585, of which 2,776,225 acquired in November 2016).
(3) Unlisted equity investments (Cromology, Stahl, IHS, Constantia Flexibles and Allied Universal) and Oranje-Nassau Développement (NOP, Saham, Mecatherm, Parcours as of December 31,
2015, exceet, CSP Technologies, SGI Africa, indirect investments and debt).
(4) As an exception to the NAV calculation method, and to reflect the fast-growing nature of IHS’s business, only 2016 and 2017 EBITDA were used in IHS’s value calculation. In addition, this
calculation is based on net debt estimated as of 12/31/2016 (and not as of 06/30/2016) because significant investments are expected in H2 2016. As of November 18, 2016, as previously
announced and in accordance with the NAV calculation methodology, Constantia Flexibles was valued for the first time based on the multiples of comparable, listed peer-group
companies. Allied Universal remains valued on the basis of AlliedBarton’s acquisition price of $300 million. This company will be valued on the basis of peer-group multiples in the NAV of
December 31, 2016 which will be published on March 23, 2017.
(5) Including 1,472,302 treasury shares as of November 18, 2016.
(6) Cash and marketable securities owned by Wendel and holding companies, including €1,031 million in cash on hand and €305 million in liquid financial investments.
Assets and liabilities denominated in currencies other than the euro have been converted at exchange rates prevailing on the date of the NAV calculation.
If the co-investment conditions are realized, there could be a dilutive effect on Wendel’s percentage ownership. These items have been taken into account when calculating NAV. See page 249 of the 2015 Registration Document.
1Stahl – Wendel Investor Day 2016 | December 1, 2016
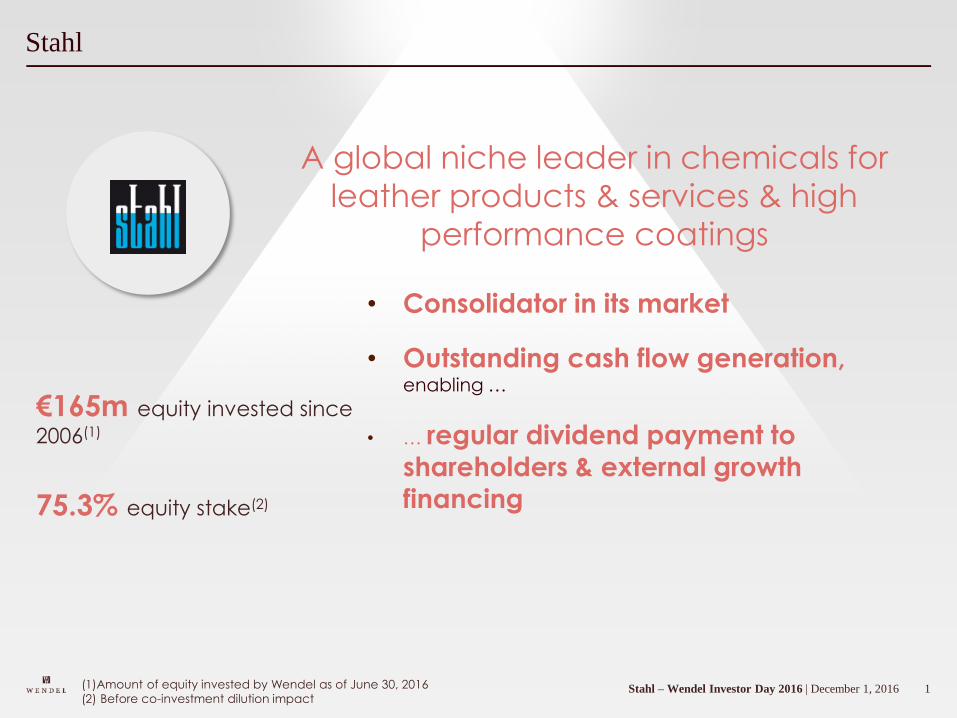
Stahl
• Consolidator in its market
• Outstanding cash flow generation, enabling …
• … regular dividend payment to shareholders & external growth
financing
A global niche leader in chemicals for
leather products & services & high
performance coatings
€165m equity invested since
2006(1)
75.3% equity stake(2)
(1)Amount of equity invested by Wendel as of June 30, 2016
(2) Before co-investment dilution impact
2Stahl – Wendel Investor Day 2016 | December 1, 2016
Huub van Beijeren–CEO of Stahl
Huub van Beijeren has been Stahl’s Chief Executive Officer since 2007.
He has led the company through the financial crisis and succeeded in making Stahl the market leader in process chemicals for leather and other substrates.
Huub has broad experience in a variety of international manufacturing industries, in public companies and in the private equity world.
Prior to Stahl, he was Director of the Paper and Packaging Industry of DS Smith plc. and at British VITA plc., a polymer manufacturer. Huub holds a Bachelor degree in Law from the University of Utrecht and a MSc in Company Law from the University of Leiden, The Netherlands.
In 2016, Huub van Beijeren received Honorary Doctorate of University of Northampton, UK.
3V. 24.11. 2016 Family Day | 2 décembre 2016
Stahl Huub van Beijeren
4Stahl – Wendel Investor Day 2016 | December 1, 2016
Group Overview
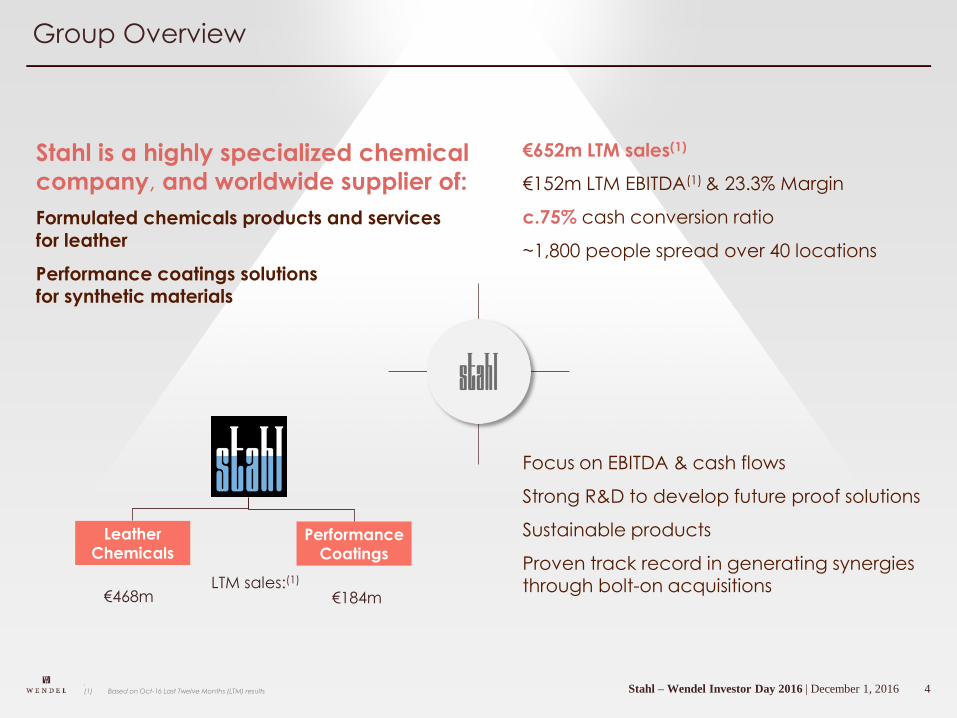
Stahl is a highly specialized chemical
company, and worldwide supplier of:
Formulated chemicals products and services
for leather
Performance coatings solutions for synthetic materials
€652m LTM sales(1)
€152m LTM EBITDA(1) & 23.3% Margin
c.75% cash conversion ratio
~1,800 people spread over 40 locations
Focus on EBITDA & cash flows
Strong R&D to develop future proof solutions
Sustainable products
Proven track record in generating synergies through bolt-on acquisitions
Leather
ChemicalsPerformance
Coatings
.(1) Based on Oct-16 Last Twelve Months (LTM) results
LTM sales:(1)
€184m€468m
5Stahl – Wendel Investor Day 2016 | December 1, 2016
Management Team
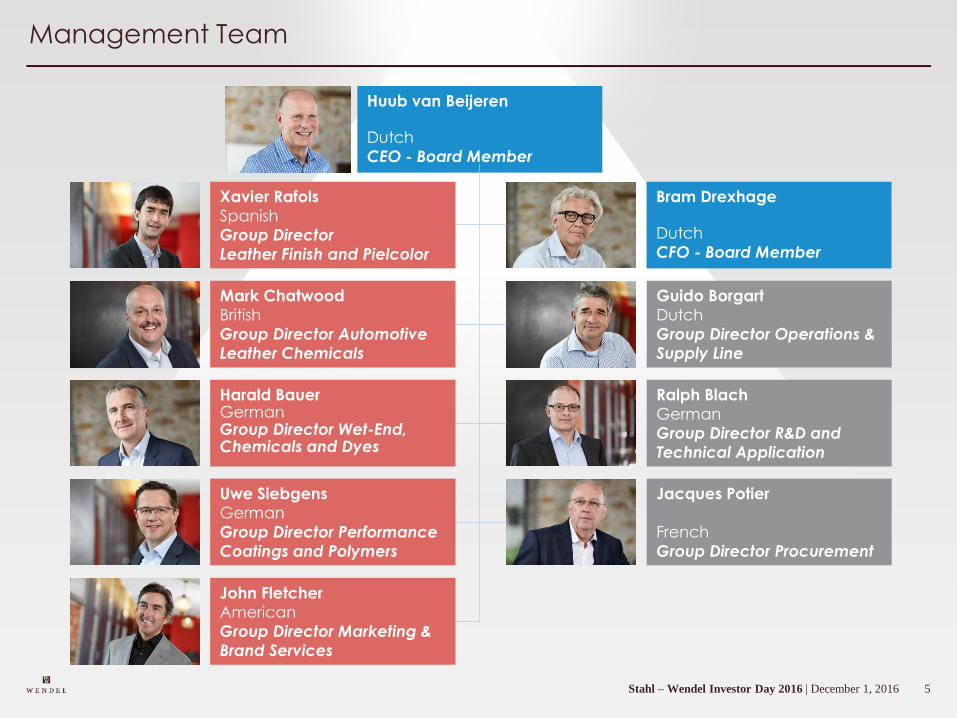
Bram Drexhage
Dutch
CFO - Board Member
Guido Borgart
Dutch
Group Director Operations &
Supply Line
Ralph Blach
German
Group Director R&D and
Technical Application
Uwe Siebgens
German
Group Director Performance
Coatings and Polymers
Harald BauerGermanGroup Director Wet-End, Chemicals and Dyes
Mark Chatwood
British
Group Director Automotive
Leather Chemicals
Xavier Rafols
Spanish
Group Director
Leather Finish and Pielcolor
Jacques Potier
French
Group Director Procurement
Huub van Beijeren
Dutch
CEO - Board Member
John Fletcher
American
Group Director Marketing &
Brand Services
6Stahl – Wendel Investor Day 2016 | December 1, 2016
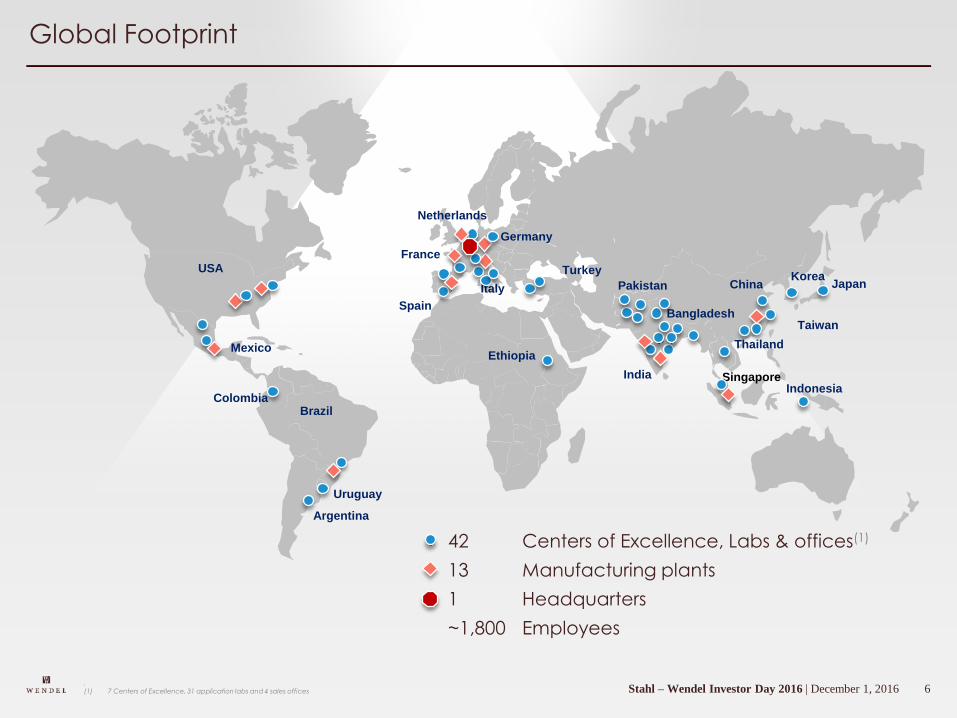
42 Centers of Excellence, Labs & offices(1)
13 Manufacturing plants
1 Headquarters
~1,800 Employees
USA
Mexico
Brazil
Italy
Netherlands
Spain
India
China
Singapore
Argentina
Bangladesh
Colombia
Turkey
Ethiopia
Pakistan
Thailand
Taiwan
JapanKorea
France
Indonesia
Germany
Uruguay
Global Footprint
.(1) 7 Centers of Excellence, 31 application labs and 4 sales offices
7Stahl – Wendel Investor Day 2016 | December 1, 2016
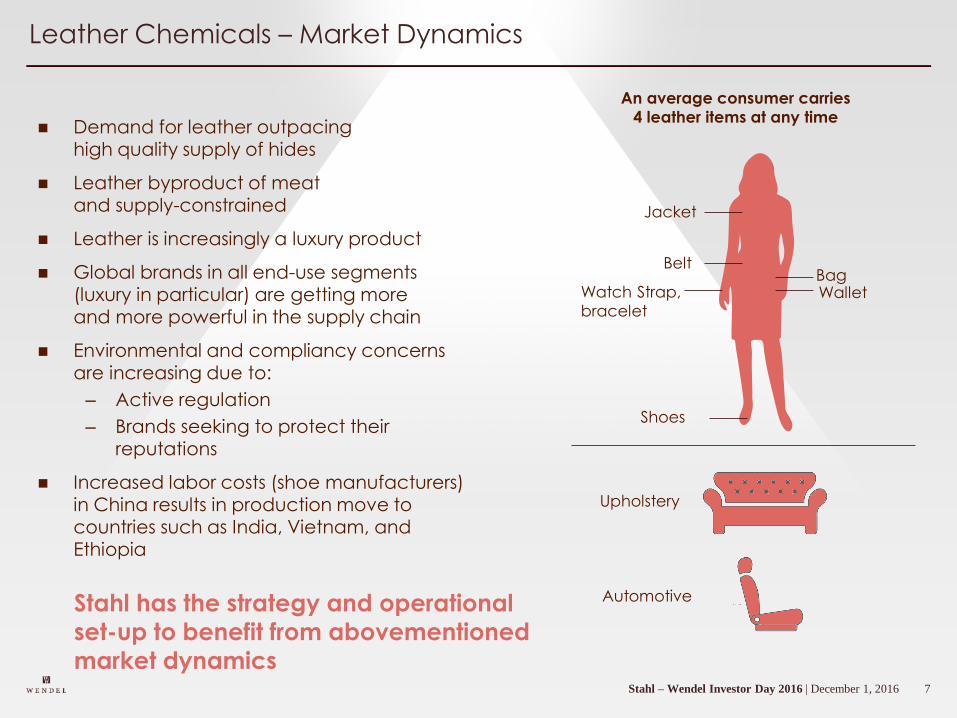
Demand for leather outpacing high quality supply of hides
Leather byproduct of meat and supply-constrained
Leather is increasingly a luxury product
Global brands in all end-use segments (luxury in particular) are getting more and more powerful in the supply chain
Environmental and compliancy concerns are increasing due to:
– Active regulation
– Brands seeking to protect their reputations
Increased labor costs (shoe manufacturers) in China results in production move to countries such as India, Vietnam, and Ethiopia
An average consumer carries 4 leather items at any time
Jacket
Belt
Watch Strap,bracelet
Shoes
BagWallet
Upholstery
Automotive
Leather Chemicals – Market Dynamics
Stahl has the strategy and operational
set-up to benefit from abovementioned
market dynamics
8Stahl – Wendel Investor Day 2016 | December 1, 2016
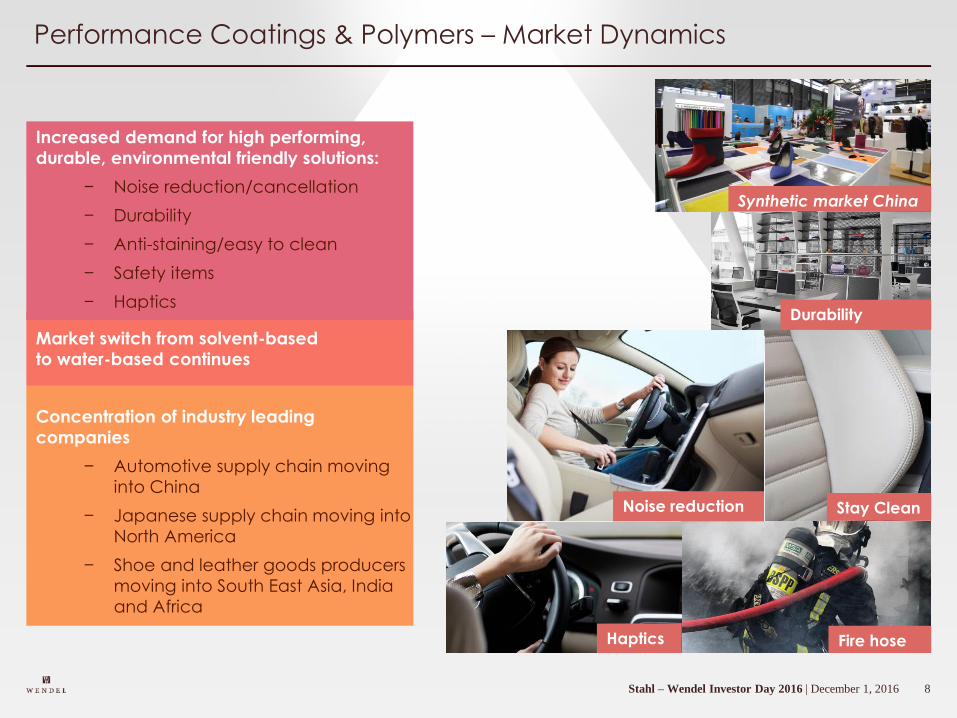
Increased demand for high performing,
durable, environmental friendly solutions:
− Noise reduction/cancellation
− Durability
− Anti-staining/easy to clean
− Safety items
− Haptics
Market switch from solvent-based
to water-based continues
Concentration of industry leading
companies
− Automotive supply chain moving
into China
− Japanese supply chain moving into
North America
− Shoe and leather goods producers
moving into South East Asia, India
and Africa
Performance Coatings & Polymers – Market Dynamics
Fire hose
Stay CleanNoise reduction
Haptics
Durability
Synthetic market China
9Stahl – Wendel Investor Day 2016 | December 1, 2016
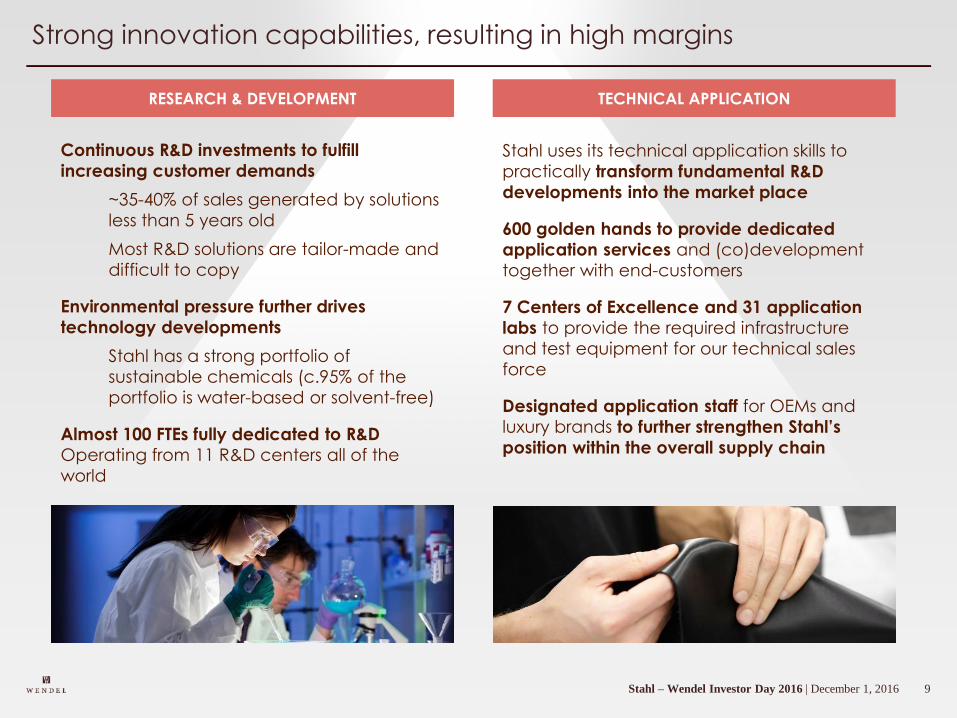
Strong innovation capabilities, resulting in high margins
Continuous R&D investments to fulfill
increasing customer demands
~35-40% of sales generated by solutions
less than 5 years old
Most R&D solutions are tailor-made and
difficult to copy
Environmental pressure further drives
technology developments
Stahl has a strong portfolio of
sustainable chemicals (c.95% of the
portfolio is water-based or solvent-free)
Almost 100 FTEs fully dedicated to R&D
Operating from 11 R&D centers all of the
world
RESEARCH & DEVELOPMENT TECHNICAL APPLICATION
Stahl uses its technical application skills to
practically transform fundamental R&D
developments into the market place
600 golden hands to provide dedicated
application services and (co)development
together with end-customers
7 Centers of Excellence and 31 application
labs to provide the required infrastructure
and test equipment for our technical sales
force
Designated application staff for OEMs and
luxury brands to further strengthen Stahl’s
position within the overall supply chain

10Stahl – Wendel Investor Day 2016 | December 1, 2016
Stahl’s transition between
2010 and 2016
11Stahl – Wendel Investor Day 2016 | December 1, 2016
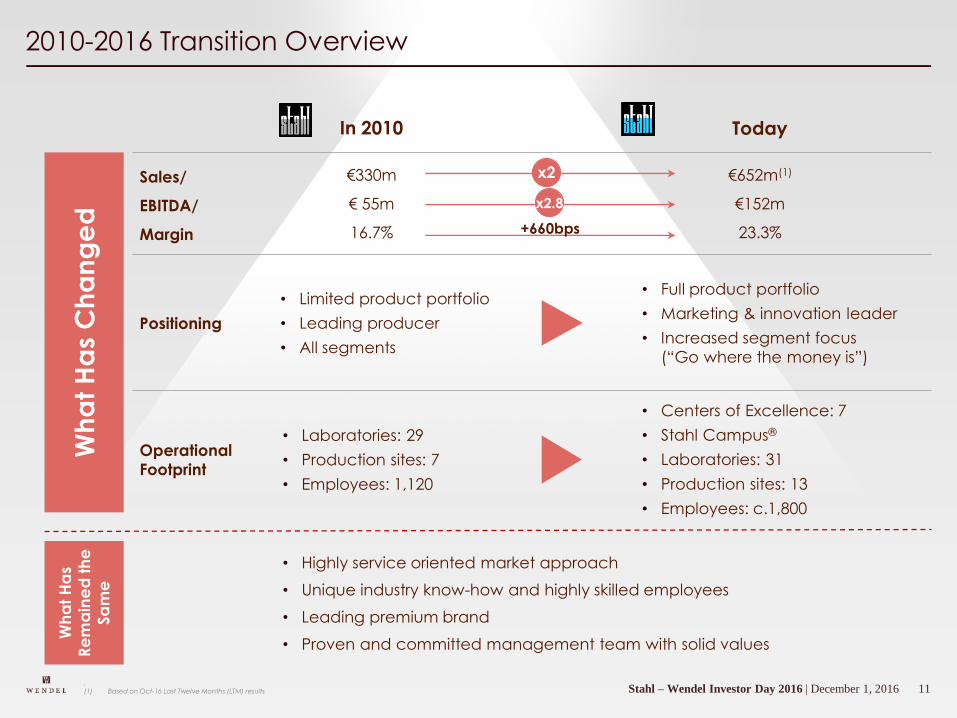
2010-2016 Transition Overview
Wh
at
Ha
s C
ha
ng
ed
Wh
at
Ha
s
Re
ma
ine
d t
he
Sa
me
• Highly service oriented market approach
• Unique industry know-how and highly skilled employees
• Leading premium brand
• Proven and committed management team with solid values
In 2010 Today
Sales/
EBITDA/
Margin
€330m
€ 55m
16.7%
€652m(1)
€152m
23.3%
.(1) Based on Oct-16 Last Twelve Months (LTM) results
Positioning
• Limited product portfolio
• Leading producer
• All segments
• Full product portfolio
• Marketing & innovation leader
• Increased segment focus
(“Go where the money is”)
Operational
Footprint
• Laboratories: 29
• Production sites: 7
• Employees: 1,120
• Centers of Excellence: 7
• Stahl Campus®
• Laboratories: 31
• Production sites: 13
• Employees: c.1,800
x2
x2.8
+660bps
12Stahl – Wendel Investor Day 2016 | December 1, 2016
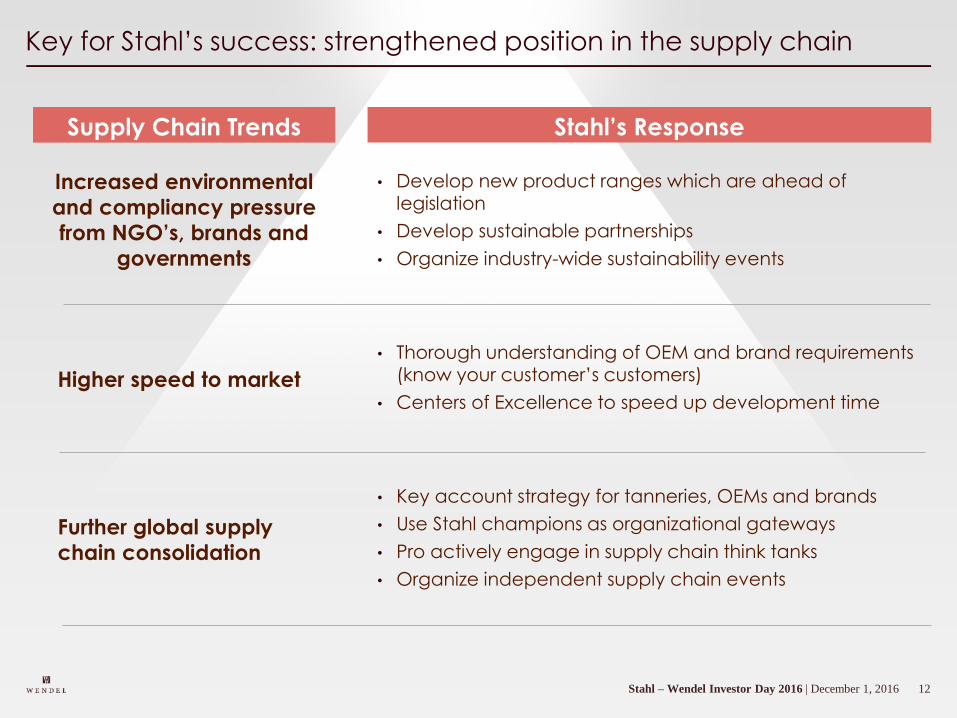
Key for Stahl’s success: strengthened position in the supply chain
Increased environmental
and compliancy pressure
from NGO’s, brands and
governments
Supply Chain Trends Stahl’s Response
• Develop new product ranges which are ahead of legislation
• Develop sustainable partnerships
• Organize industry-wide sustainability events
Higher speed to market
• Thorough understanding of OEM and brand requirements (know your customer’s customers)
• Centers of Excellence to speed up development time
Further global supply
chain consolidation
• Key account strategy for tanneries, OEMs and brands
• Use Stahl champions as organizational gateways
• Pro actively engage in supply chain think tanks
• Organize independent supply chain events
13Stahl – Wendel Investor Day 2016 | December 1, 2016
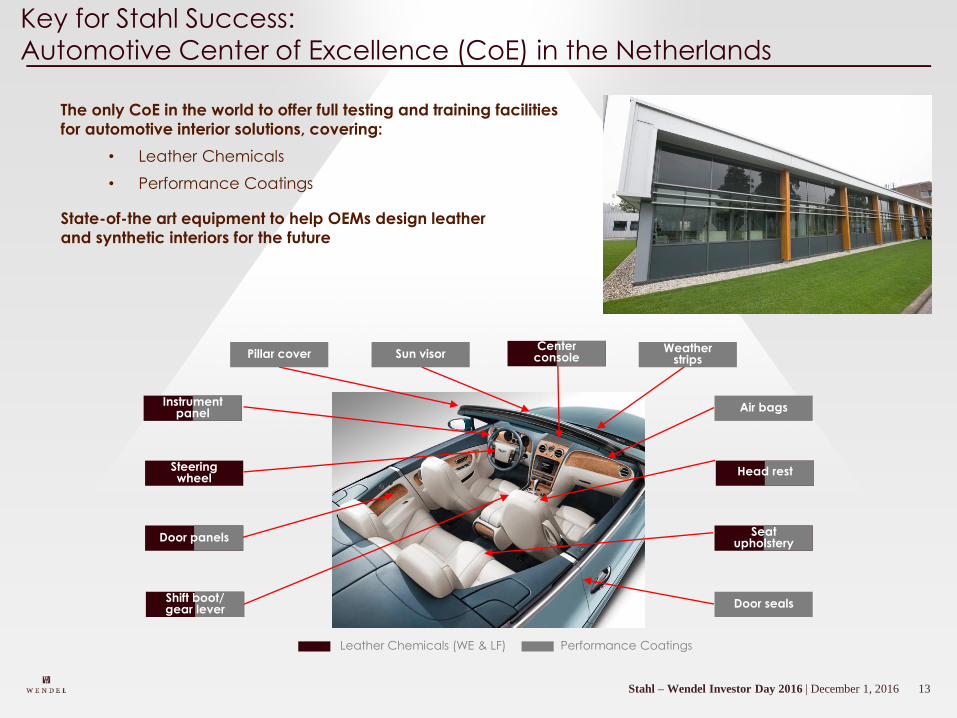
Key for Stahl Success:
Automotive Center of Excellence (CoE) in the Netherlands
The only CoE in the world to offer full testing and training facilities
for automotive interior solutions, covering:
• Leather Chemicals
• Performance Coatings
State-of-the art equipment to help OEMs design leather
and synthetic interiors for the future
Seat upholstery
Door panels
Steering wheel
Air bags
Door seals
Performance CoatingsLeather Chemicals (WE & LF)
Instrument panel
Shift boot/gear lever
Head rest
Weather strips
Sun visorPillar coverCenter
console
14Stahl – Wendel Investor Day 2016 | December 1, 2016
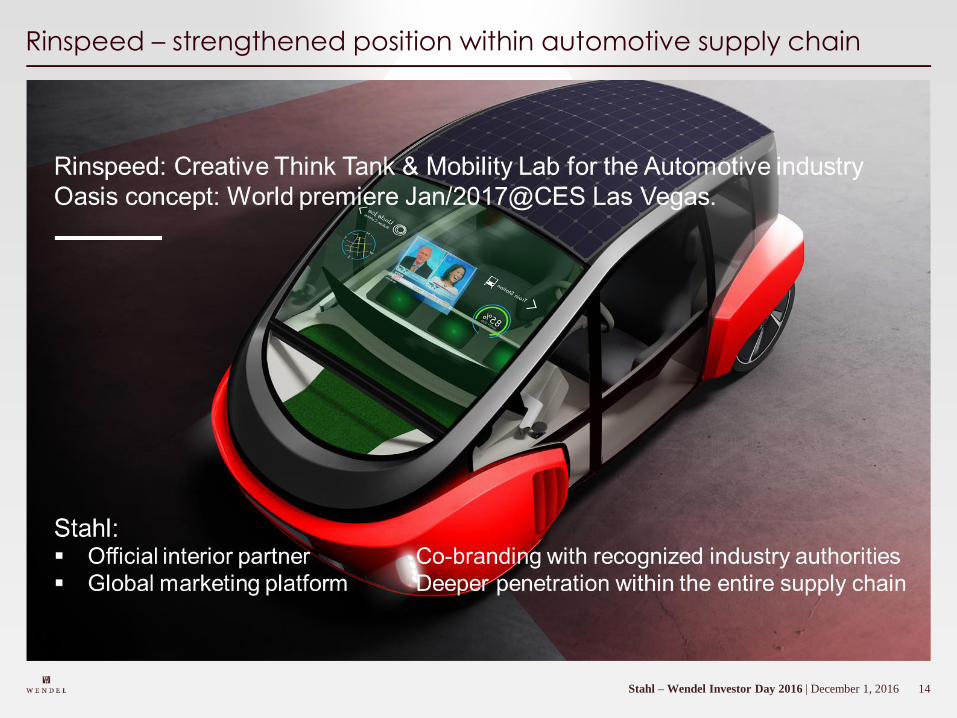
Rinspeed – strengthened position within automotive supply chain
15Stahl – Wendel Investor Day 2016 | December 1, 2016
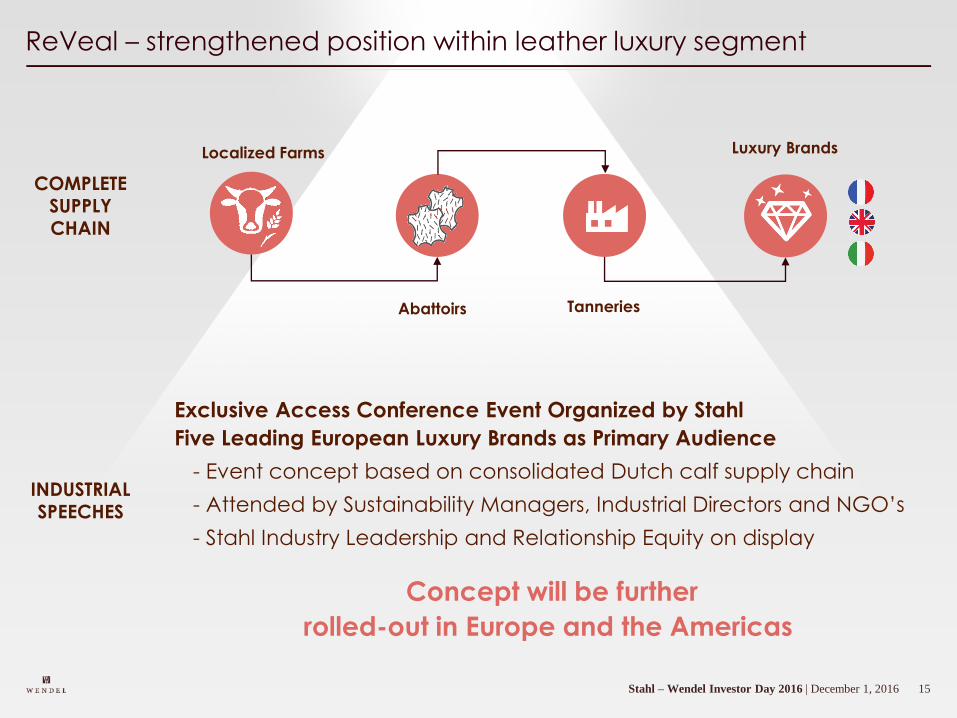
ReVeal – strengthened position within leather luxury segment
Tanneries
Localized Farms
Abattoirs
Exclusive Access Conference Event Organized by Stahl
Five Leading European Luxury Brands as Primary Audience
- Event concept based on consolidated Dutch calf supply chain
- Attended by Sustainability Managers, Industrial Directors and NGO’s
- Stahl Industry Leadership and Relationship Equity on display
Concept will be further
rolled-out in Europe and the Americas
Luxury Brands
COMPLETESUPPLYCHAIN
INDUSTRIALSPEECHES
16Stahl – Wendel Investor Day 2016 | December 1, 2016
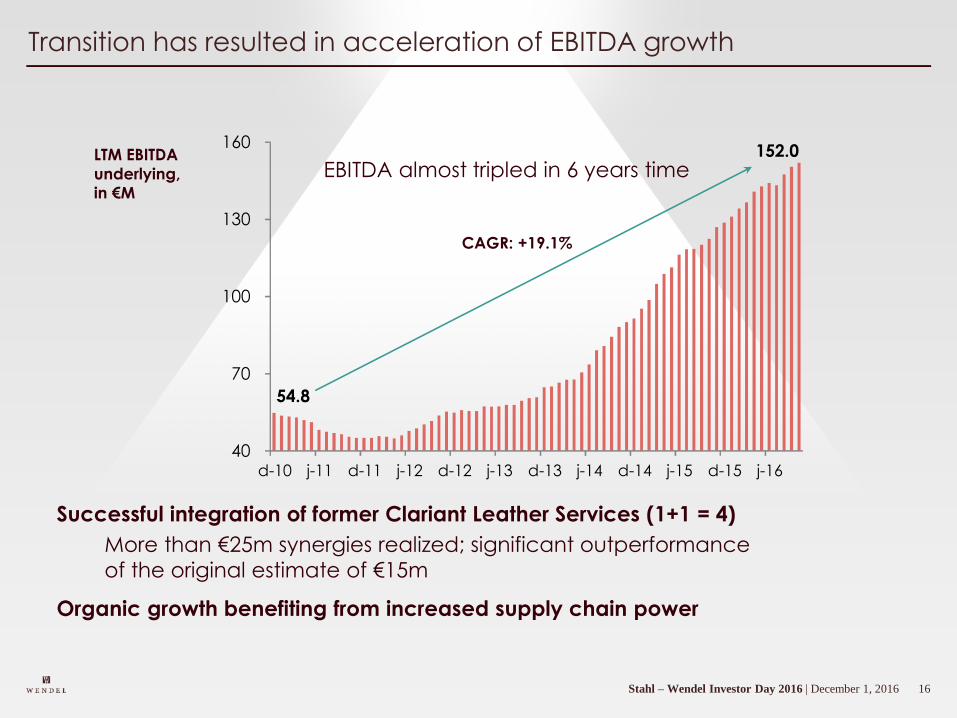
Transition has resulted in acceleration of EBITDA growth
Successful integration of former Clariant Leather Services (1+1 = 4)
More than €25m synergies realized; significant outperformance
of the original estimate of €15m
Organic growth benefiting from increased supply chain power
54.8
152.0
40
70
100
130
160
d-10 j-11 d-11 j-12 d-12 j-13 d-13 j-14 d-14 j-15 d-15 j-16
CAGR: +19.1%
LTM EBITDA
underlying, in €M
EBITDA almost tripled in 6 years time
17Stahl – Wendel Investor Day 2016 | December 1, 2016
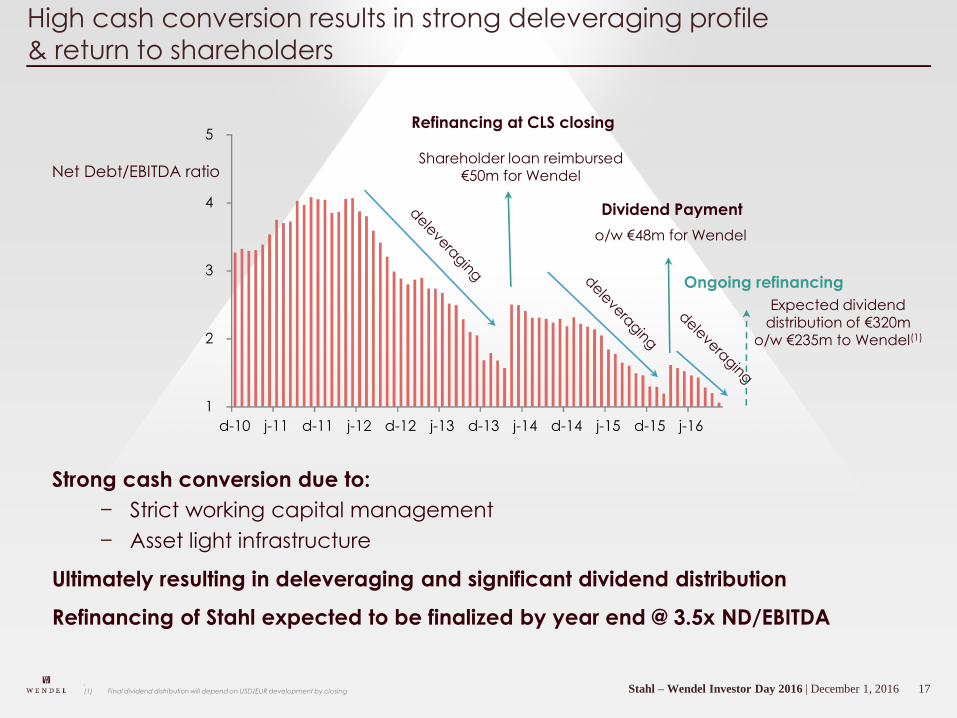
High cash conversion results in strong deleveraging profile
& return to shareholders
Strong cash conversion due to:
− Strict working capital management
− Asset light infrastructure
Ultimately resulting in deleveraging and significant dividend distribution
Refinancing of Stahl expected to be finalized by year end @ 3.5x ND/EBITDA
1
2
3
4
5
d-10 j-11 d-11 j-12 d-12 j-13 d-13 j-14 d-14 j-15 d-15 j-16
Refinancing at CLS closing
Shareholder loan reimbursed€50m for Wendel
Dividend Payment
o/w €48m for Wendel
Ongoing refinancing
Expected dividend distribution of €320m
o/w €235m to Wendel(1)
Net Debt/EBITDA ratio
.(1) Final dividend distribution will depend on USD/EUR development by closing
18Stahl – Wendel Investor Day 2016 | December 1, 2016
2010-2016 transition results
First dividends paid to our shareholders in March 2016, and more to come
Very strong operating performance & deleveraging
Materialization of value adding bolt-on acquisitions
Transformation into a €650m+ revenue companywith a more diversified business model
19Stahl – Wendel Investor Day 2016 | December 1, 2016
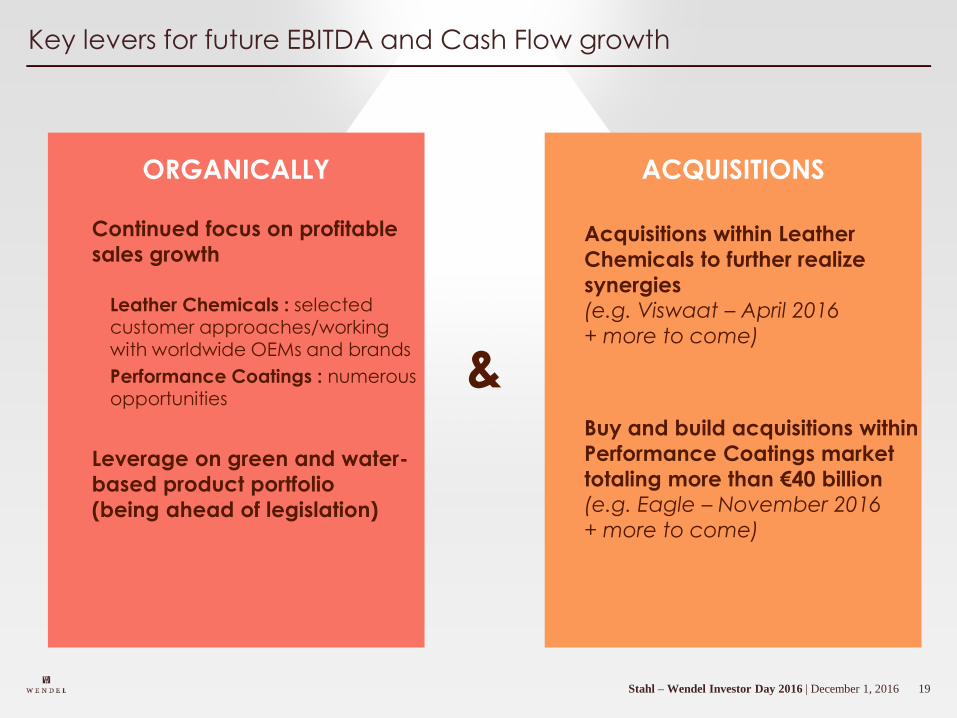
Key levers for future EBITDA and Cash Flow growth
ORGANICALLY
Continued focus on profitable
sales growth
Leather Chemicals : selected customer approaches/working with worldwide OEMs and brands
Performance Coatings : numerous opportunities
Leverage on green and water-
based product portfolio
(being ahead of legislation)
ACQUISITIONS
Acquisitions within Leather
Chemicals to further realize
synergies(e.g. Viswaat – April 2016
+ more to come)
Buy and build acquisitions within
Performance Coatings market
totaling more than €40 billion(e.g. Eagle – November 2016
+ more to come)
&
20Stahl – Wendel Investor Day 2016 | December 1, 2016
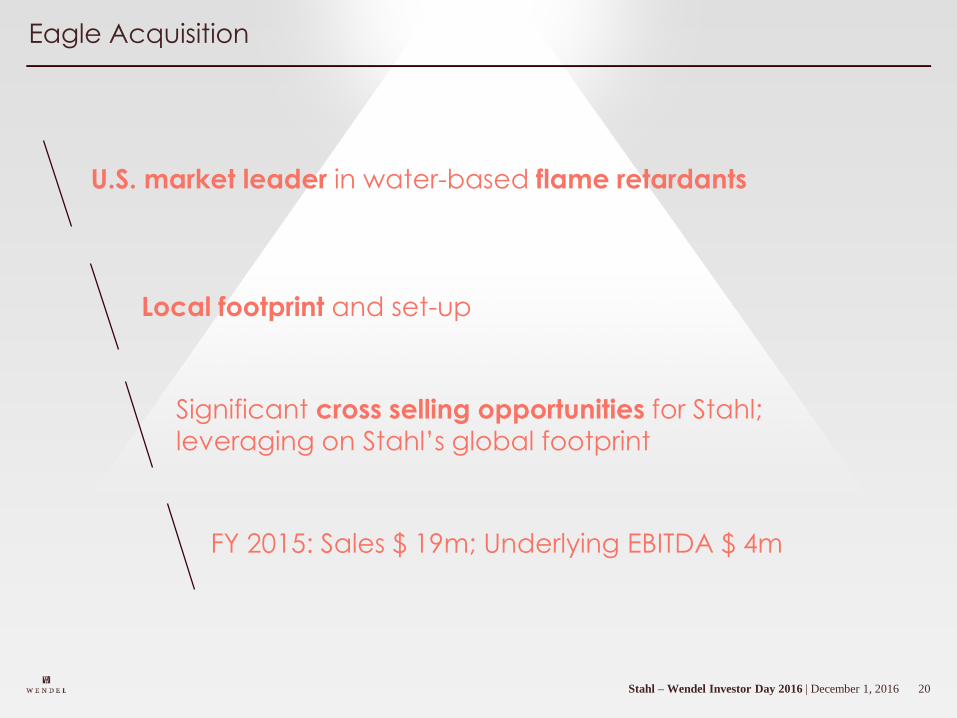
Eagle Acquisition
Significant cross selling opportunities for Stahl;leveraging on Stahl’s global footprint
Local footprint and set-up
FY 2015: Sales $ 19m; Underlying EBITDA $ 4m
U.S. market leader in water-based flame retardants
21Stahl – Wendel Investor Day 2016 | December 1, 2016
Digitalization is also a strong
lever for growth
22Stahl – Wendel Investor Day 2016 | December 1, 2016
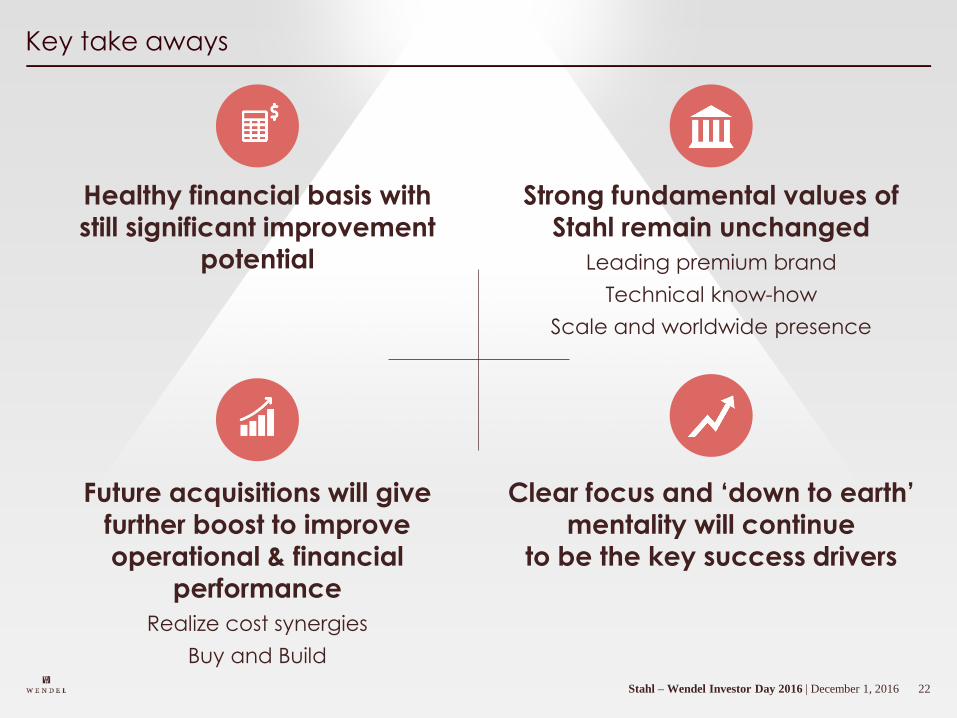
Healthy financial basis with
still significant improvement
potential
Clear focus and ‘down to earth’
mentality will continue
to be the key success drivers
Strong fundamental values of
Stahl remain unchanged
Leading premium brand
Technical know-how
Scale and worldwide presence
Future acquisitions will give
further boost to improve
operational & financial
performance
Realize cost synergies
Buy and Build
Key take aways

24Stahl – Wendel Investor Day 2016 | December 1, 2016
Appendix
25Stahl – Wendel Investor Day 2016 | December 1, 2016
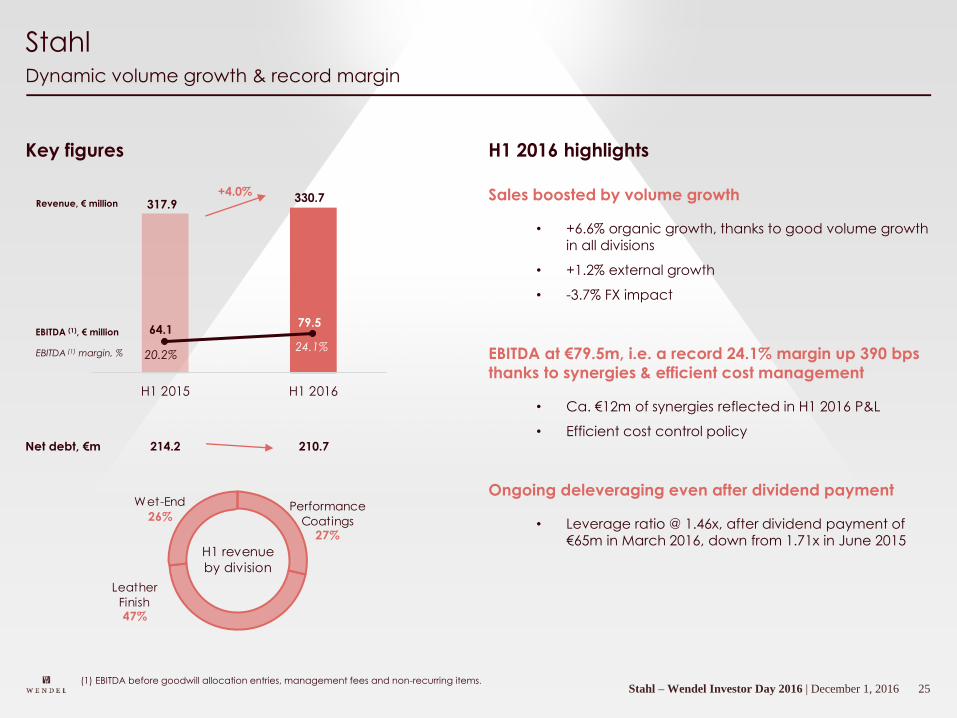
H1 2015 H1 2016
Dynamic volume growth & record margin
Stahl
(1) EBITDA before goodwill allocation entries, management fees and non-recurring items.
Key figures
330.7Revenue, € million
EBITDA (1), € million
Sales boosted by volume growth
• +6.6% organic growth, thanks to good volume growth
in all divisions
• +1.2% external growth
• -3.7% FX impact
EBITDA at €79.5m, i.e. a record 24.1% margin up 390 bps
thanks to synergies & efficient cost management
• Ca. €12m of synergies reflected in H1 2016 P&L
• Efficient cost control policy
Ongoing deleveraging even after dividend payment
• Leverage ratio @ 1.46x, after dividend payment of €65m in March 2016, down from 1.71x in June 2015
317.9
64.179.5
20.2%24.1%
Net debt, €m 214.2 210.7
+4.0%
H1 2016 highlights
EBITDA (1) margin, %
Performance
Coatings27%
Leather
Finish47%
Wet-End
26%
H1 revenue
by division
26Stahl – Wendel Investor Day 2016 | December 1, 2016
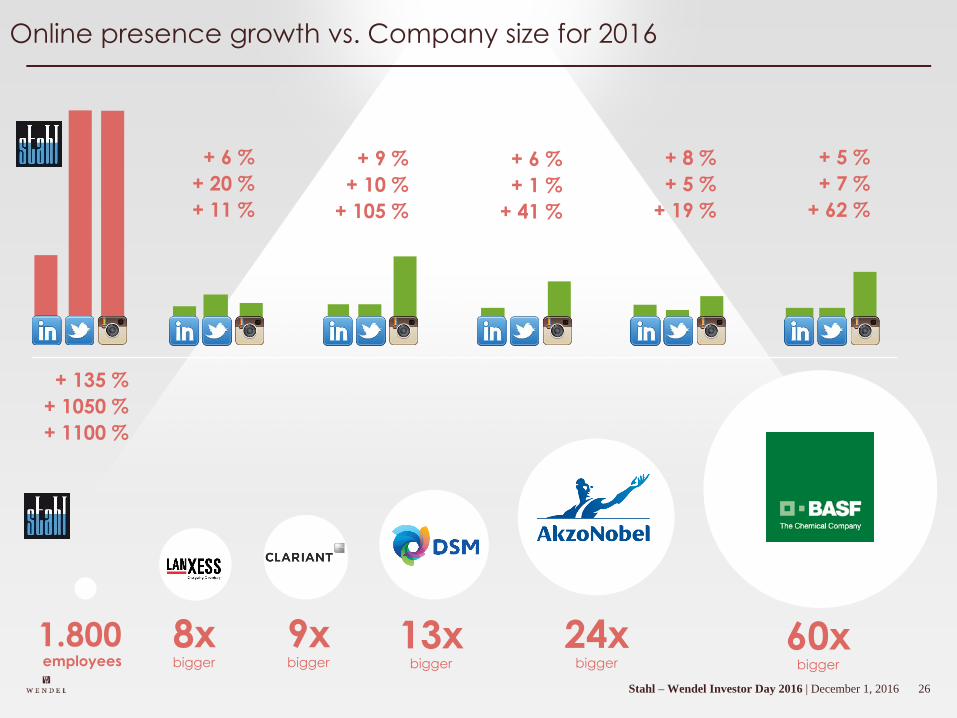
Online presence growth vs. Company size for 2016
8xbigger
9xbigger
13xbigger
24xbigger
60xbigger
1.800employees
+ 135 %
+ 1050 %
+ 1100 %
+ 6 %
+ 20 %
+ 11 %
+ 9 %
+ 10 %
+ 105 %
+ 6 %
+ 1 %
+ 41 %
+ 8 %
+ 5 %
+ 19 %
+ 5 %
+ 7 %
+ 62 %

23Stahl – Wendel Investor Day 2016 | December 1, 2016
Investor DayDecember 1, 2016
1Constantia - Wendel Investor Day | December 1, 2016
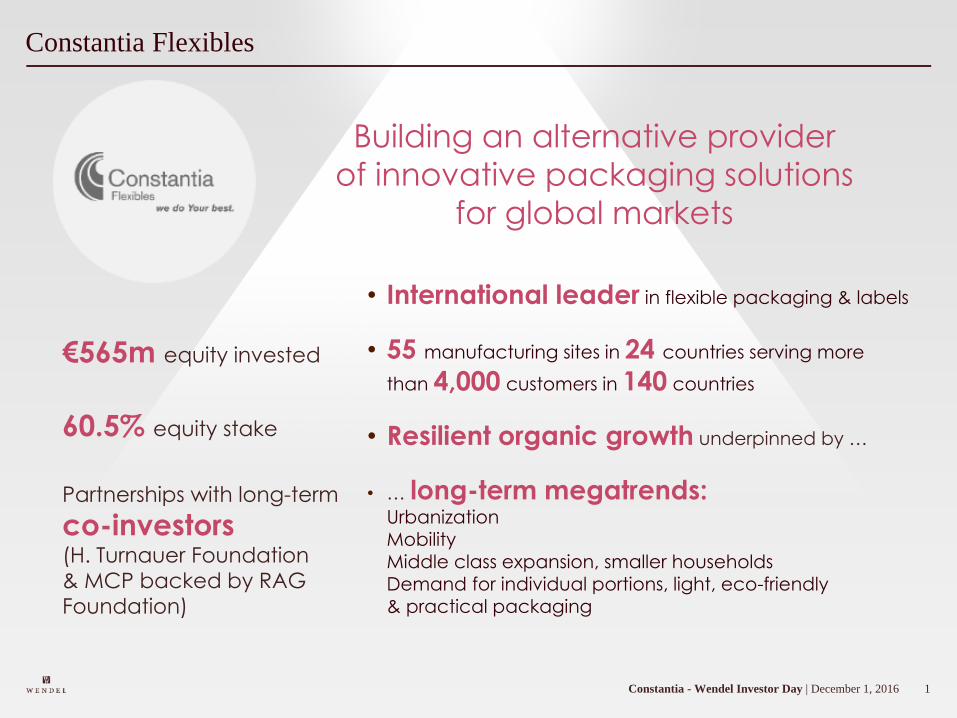
Constantia Flexibles
• International leader in flexible packaging & labels
• 55 manufacturing sites in 24 countries serving more
than 4,000 customers in 140 countries
• Resilient organic growth underpinned by …
• … long-term megatrends:Urbanization
Mobility
Middle class expansion, smaller households
Demand for individual portions, light, eco-friendly
& practical packaging
Building an alternative provider
of innovative packaging solutions
for global markets
€565m equity invested
60.5% equity stake
Partnerships with long-term
co-investors (H. Turnauer Foundation
& MCP backed by RAG
Foundation)
2Constantia - Wendel Investor Day | December 1, 2016
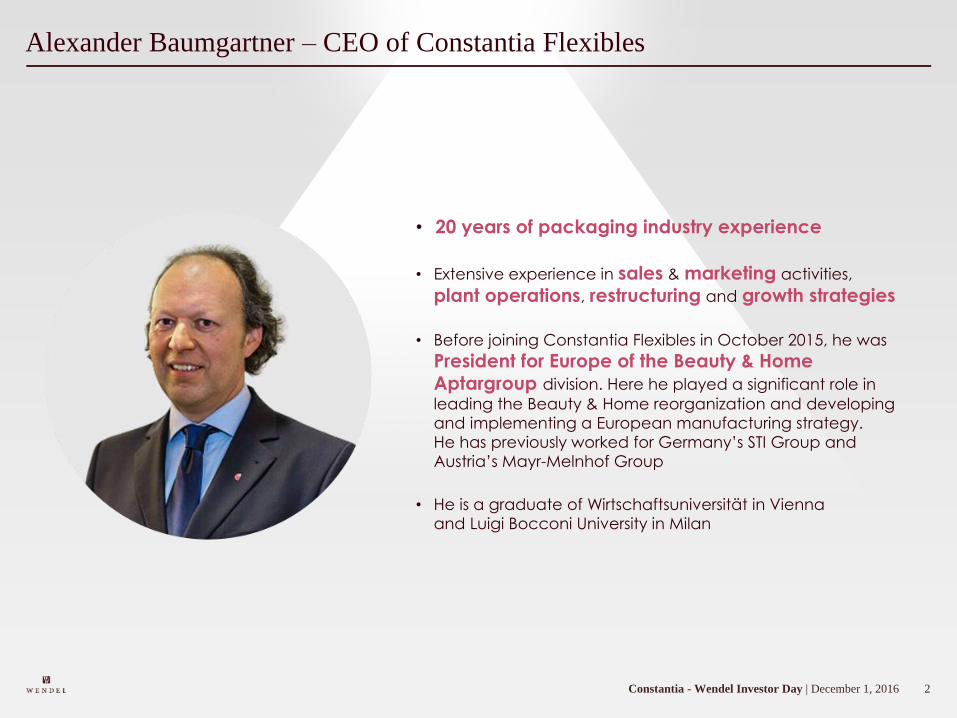
Alexander Baumgartner – CEO of Constantia Flexibles
• 20 years of packaging industry experience
• Extensive experience in sales & marketing activities,
plant operations, restructuring and growth strategies
• Before joining Constantia Flexibles in October 2015, he was
President for Europe of the Beauty & Home
Aptargroup division. Here he played a significant role in
leading the Beauty & Home reorganization and developing
and implementing a European manufacturing strategy.
He has previously worked for Germany’s STI Group and
Austria’s Mayr-Melnhof Group
• He is a graduate of Wirtschaftsuniversität in Vienna
and Luigi Bocconi University in Milan
3V. 24.11. 2016 Family Day | 2 décembre 2016
Constantia FlexiblesAlexander Baumgartner, CEO & Stephan Kuehne, CFO
4Wendel Investor Day | December 1, 2016
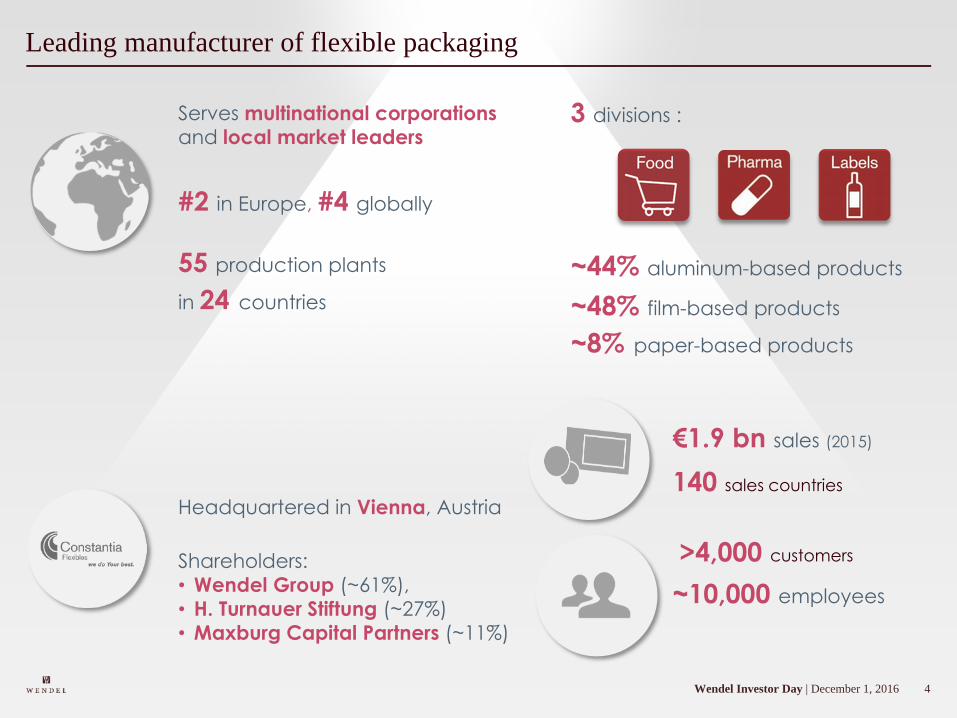
Leading manufacturer of flexible packaging
Serves multinational corporations
and local market leaders
55 production plants
in 24 countries
Headquartered in Vienna, Austria
Shareholders:
• Wendel Group (~61%),
• H. Turnauer Stiftung (~27%)
• Maxburg Capital Partners (~11%)
3 divisions :
#2 in Europe, #4 globally
~10,000 employees
~44% aluminum-based products
~48% film-based products
~8% paper-based products
€1.9 bn sales (2015)
140 sales countries
>4,000 customers
5Wendel Investor Day | December 1, 2016
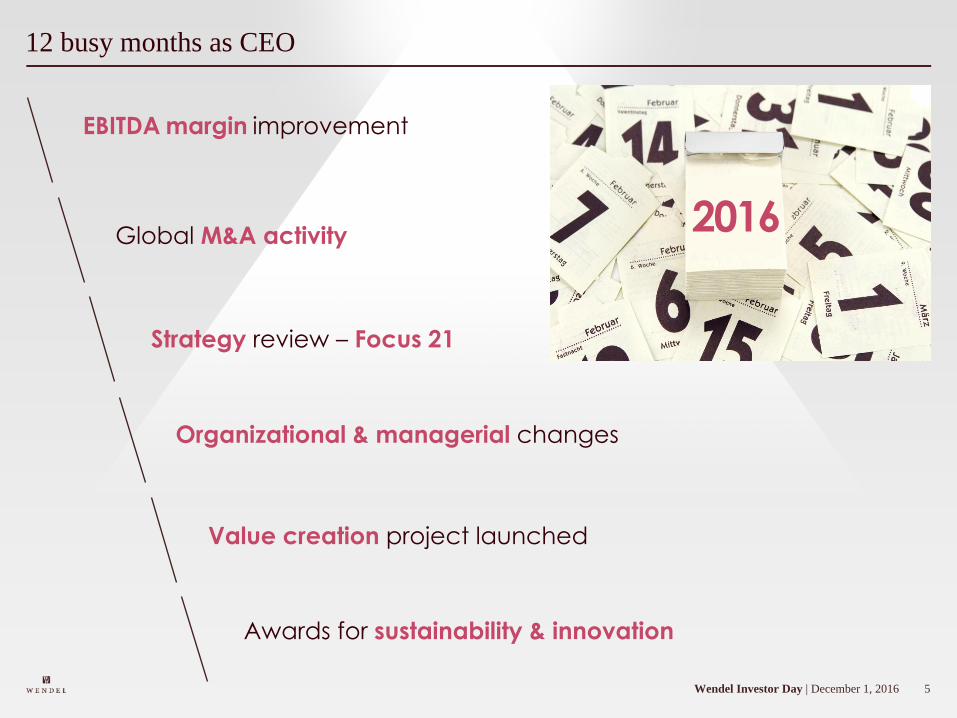
12 busy months as CEO
EBITDA margin improvement
Strategy review – Focus 21
Global M&A activity
Organizational & managerial changes
Awards for sustainability & innovation
Value creation project launched
2016
6Wendel Investor Day | December 1, 2016
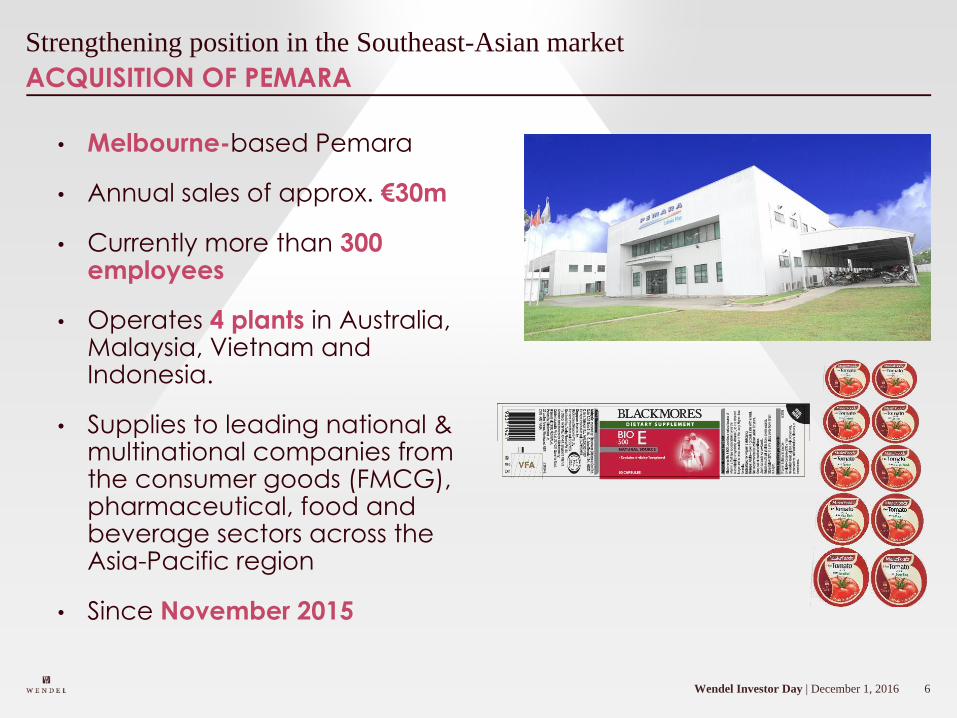
ACQUISITION OF PEMARA
Strengthening position in the Southeast-Asian market
• Melbourne-based Pemara
• Annual sales of approx. €30m
• Currently more than 300 employees
• Operates 4 plants in Australia, Malaysia, Vietnam and Indonesia.
• Supplies to leading national & multinational companies from the consumer goods (FMCG), pharmaceutical, food and beverage sectors across the Asia-Pacific region
• Since November 2015
7Wendel Investor Day | December 1, 2016
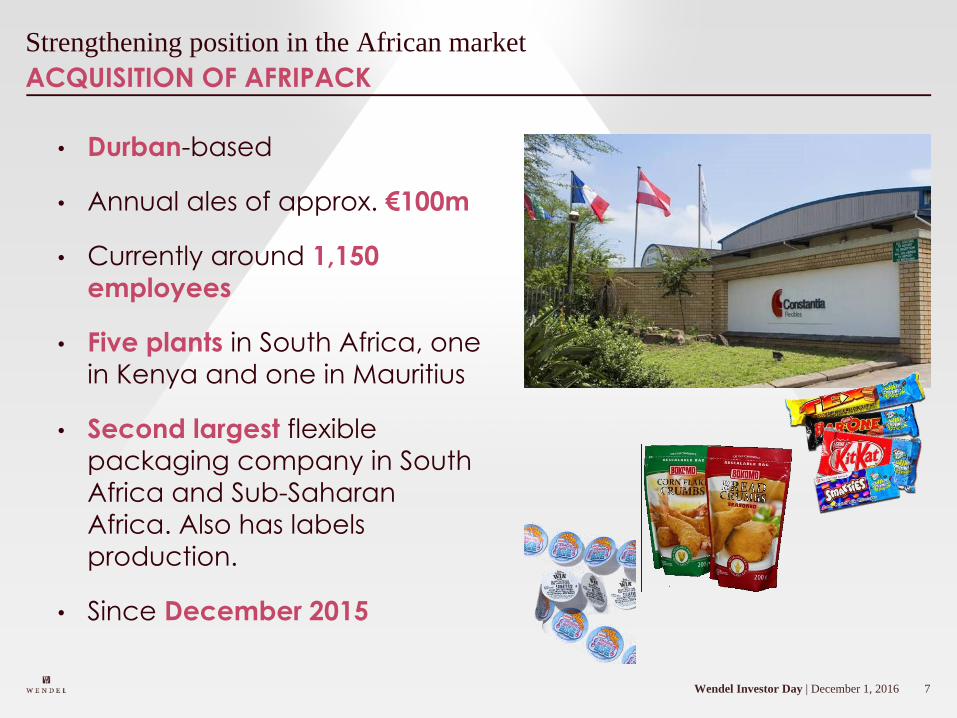
ACQUISITION OF AFRIPACK
Strengthening position in the African market
• Durban-based
• Annual ales of approx. €100m
• Currently around 1,150
employees
• Five plants in South Africa, one
in Kenya and one in Mauritius
• Second largest flexible
packaging company in South
Africa and Sub-Saharan
Africa. Also has labels
production.
• Since December 2015
8Wendel Investor Day | December 1, 2016
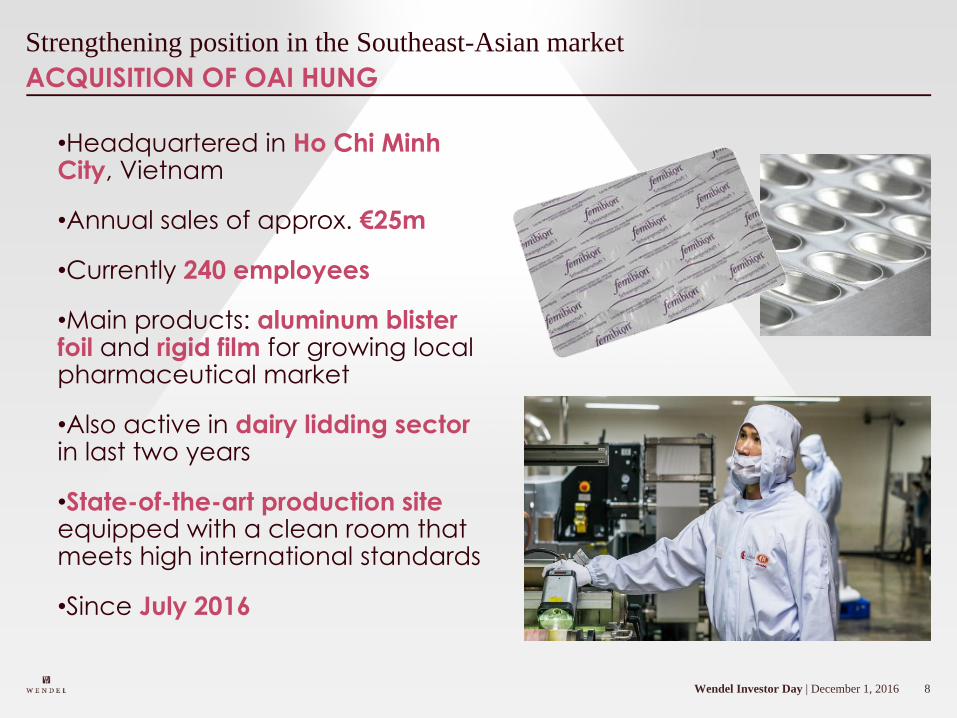
ACQUISITION OF OAI HUNG
Strengthening position in the Southeast-Asian market
•Headquartered in Ho Chi Minh City, Vietnam
•Annual sales of approx. €25m
•Currently 240 employees
•Main products: aluminum blister foil and rigid film for growing local pharmaceutical market
•Also active in dairy lidding sector in last two years
•State-of-the-art production site equipped with a clean room that meets high international standards
•Since July 2016
9Wendel Investor Day | December 1, 2016
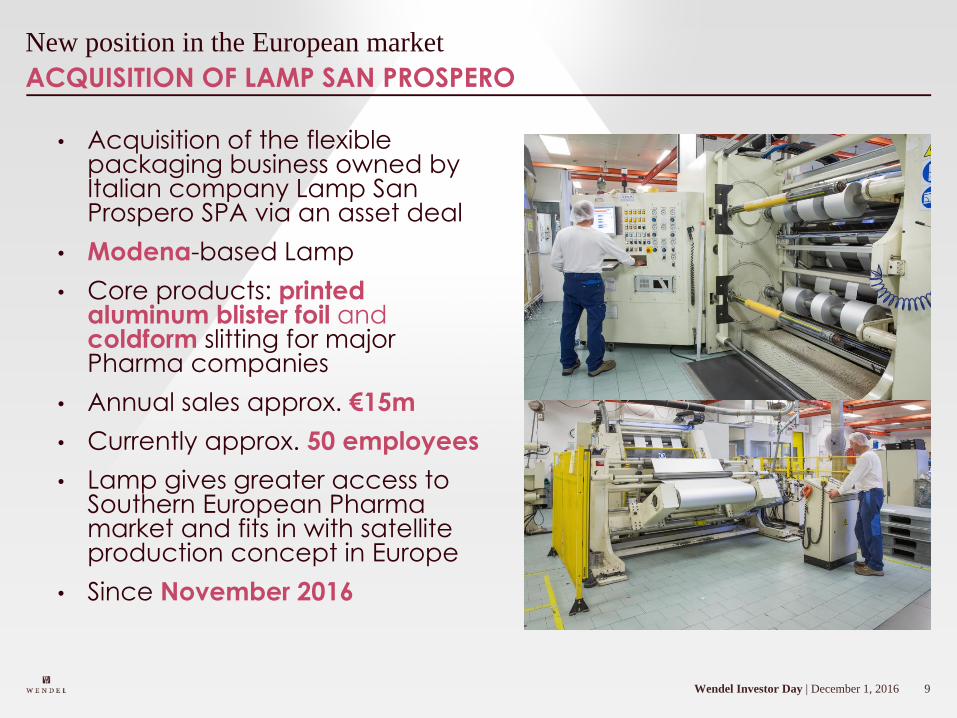
ACQUISITION OF LAMP SAN PROSPERO
New position in the European market
• Acquisition of the flexible packaging business owned by Italian company Lamp San Prospero SPA via an asset deal
• Modena-based Lamp
• Core products: printed aluminum blister foil and coldform slitting for major Pharma companies
• Annual sales approx. €15m
• Currently approx. 50 employees
• Lamp gives greater access to Southern European Pharma market and fits in with satellite production concept in Europe
• Since November 2016
10Wendel Investor Day | December 1, 2016
ALUPRINT PLEGADIZOS SOLD
Folding carton business in Mexico sold
• Constantia Flexibles acquired Aluprint
Plegadizos as part of takeover of
Globalpack in 2013
• Company located in San Luis Potosi,
Mexico
• Approximately 600 employees
• Manufactures folding cartons and
high graphics micro-corrugated boxes
for the fast moving consumer goods
industry in Mexico, the U.S., Canada,
Central America and the Caribbean
• Sold in November 2016
11Wendel Investor Day | December 1, 2016
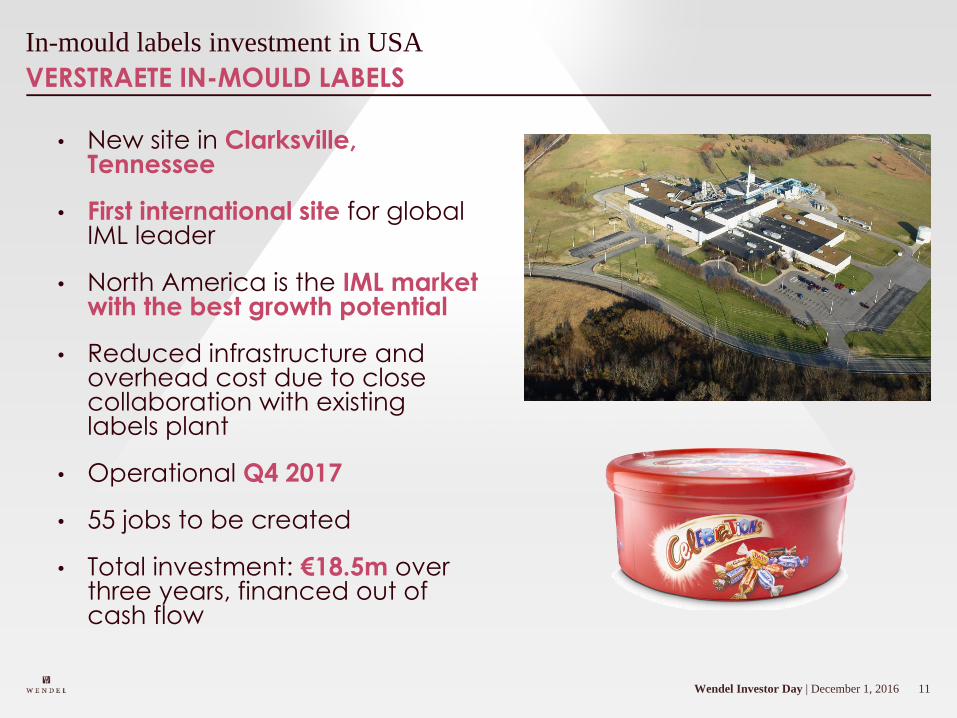
VERSTRAETE IN-MOULD LABELS
In-mould labels investment in USA
• New site in Clarksville, Tennessee
• First international site for global IML leader
• North America is the IML market with the best growth potential
• Reduced infrastructure and overhead cost due to close collaboration with existing labels plant
• Operational Q4 2017
• 55 jobs to be created
• Total investment: €18.5m over three years, financed out of cash flow
12Wendel Investor Day | December 1, 2016
CFO since August 2016
Stephan Kuehne appointed as new CFO
Previous positions
• Managing Director & CFO of
Intersnack Group GmbH & Co. KG,
Düsseldorf (since 2011)
• European market leader for
savory snack foods
• Annual turnover of €2.3bn
• 28 manufacturing sites
• 8,500 employees
• Deutsche Messe AG in Hannover,
Germany – Member of the Executive
Board and CFO
• Kloeckner Pentaplast of America, Inc.
in Gordonsville/VA, USA – CFO
13Wendel Investor Day | December 1, 2016
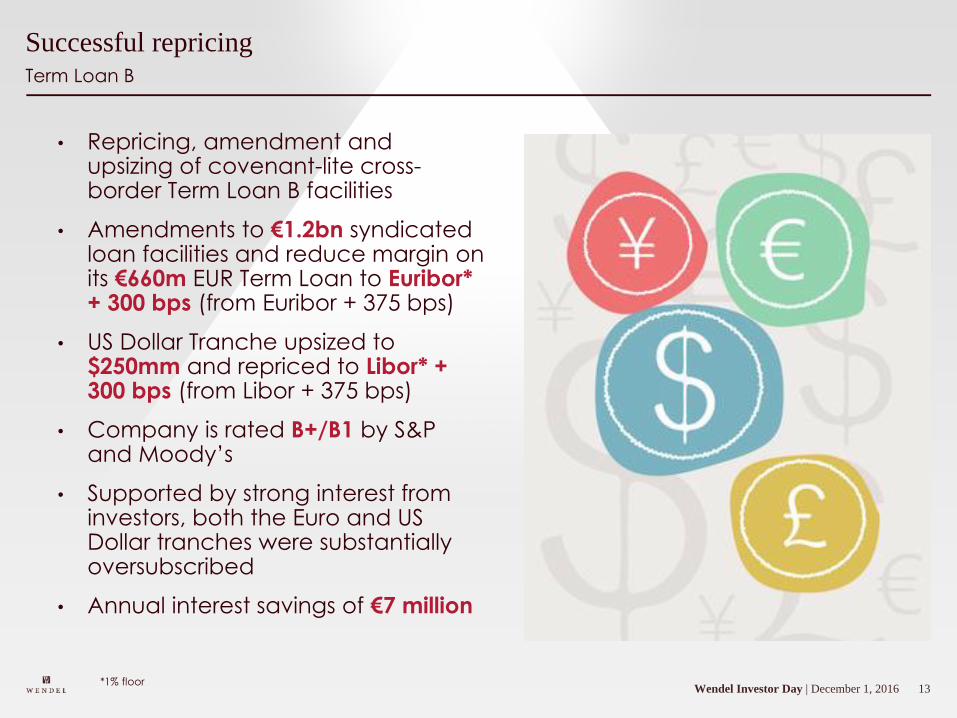
Term Loan B
Successful repricing
• Repricing, amendment and upsizing of covenant-lite cross-border Term Loan B facilities
• Amendments to €1.2bn syndicated loan facilities and reduce margin on its €660m EUR Term Loan to Euribor* + 300 bps (from Euribor + 375 bps)
• US Dollar Tranche upsized to $250mm and repriced to Libor* + 300 bps (from Libor + 375 bps)
• Company is rated B+/B1 by S&P and Moody’s
• Supported by strong interest from investors, both the Euro and US Dollar tranches were substantially oversubscribed
• Annual interest savings of €7 million
*1% floor
14Wendel Investor Day | December 1, 2016
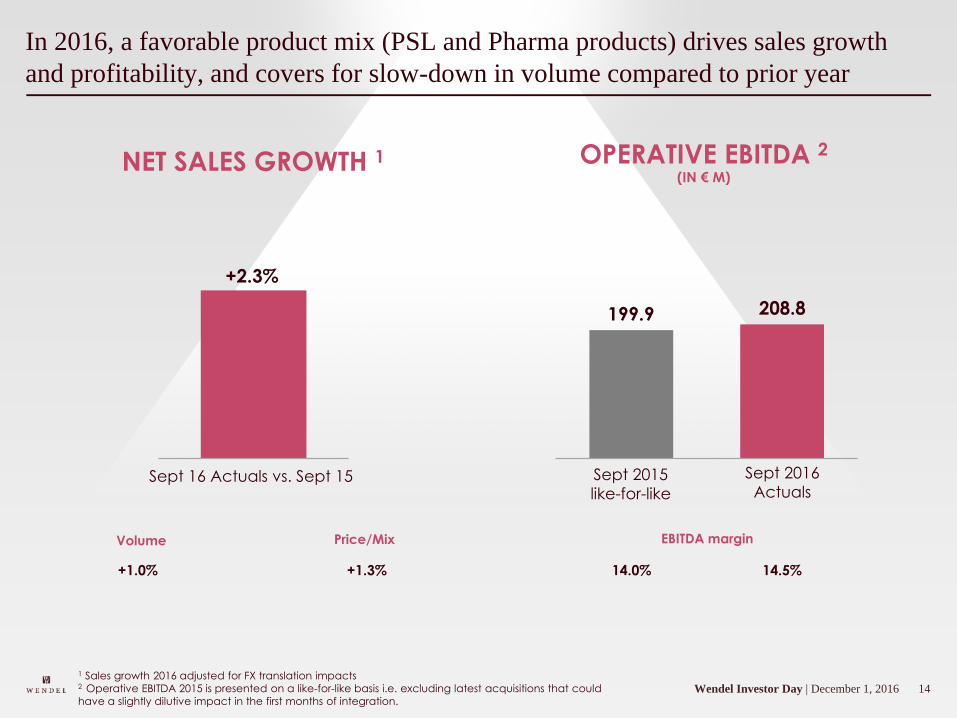
In 2016, a favorable product mix (PSL and Pharma products) drives sales growth
and profitability, and covers for slow-down in volume compared to prior year
1 Sales growth 2016 adjusted for FX translation impacts2 Operative EBITDA 2015 is presented on a like-for-like basis i.e. excluding latest acquisitions that could
have a slightly dilutive impact in the first months of integration.
NET SALES GROWTH 1 OPERATIVE EBITDA 2(IN € M)
Sept 16 Actuals vs. Sept 15
+2.3%
Volume Price/Mix
+1.0% +1.3% 14.5%
EBITDA margin
199.9 208.8
Sept 2016
ActualsSept 2015
like-for-like
14.0%
15Wendel Investor Day | December 1, 2016
0,8%
0,6%
operationa
l efficiency
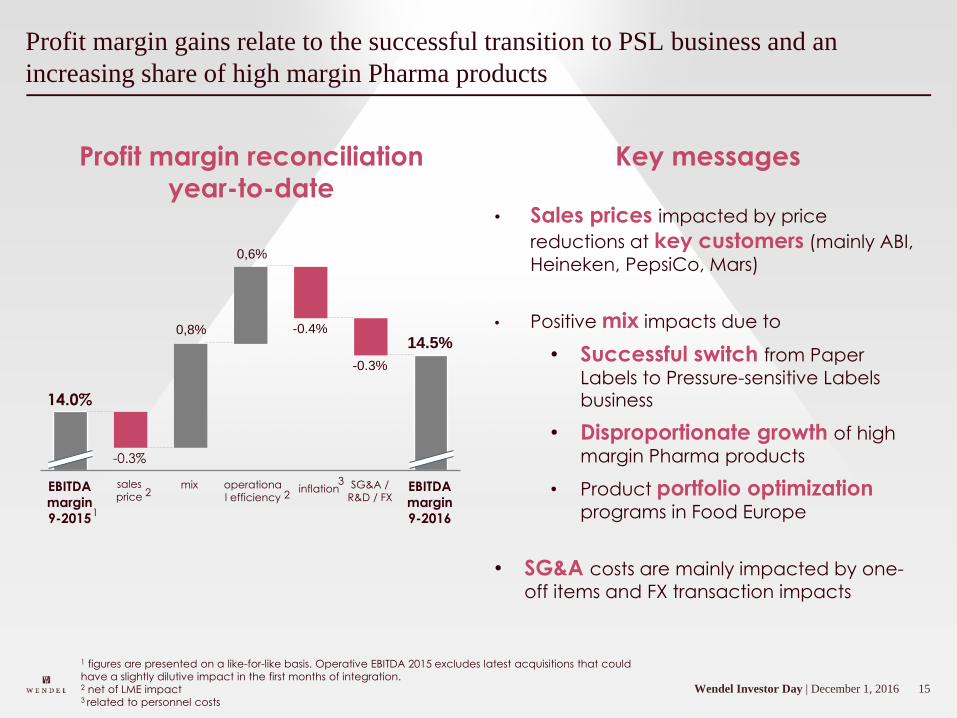
Profit margin gains relate to the successful transition to PSL business and an
increasing share of high margin Pharma products
Profit margin reconciliation
year-to-date
Key messages
• Sales prices impacted by price
reductions at key customers (mainly ABI,
Heineken, PepsiCo, Mars)
• Positive mix impacts due to
• Successful switch from Paper
Labels to Pressure-sensitive Labels
business
• Disproportionate growth of high
margin Pharma products
• Product portfolio optimization programs in Food Europe
• SG&A costs are mainly impacted by one-
off items and FX transaction impacts
2 2
3inflation
-0.3%
EBITDA
margin
9-2016
SG&A /
R&D / FX
14.5%-0.4%
sales
price
-0.3%
mixEBITDA
margin
9-2015
14.0%
1
1 figures are presented on a like-for-like basis. Operative EBITDA 2015 excludes latest acquisitions that could
have a slightly dilutive impact in the first months of integration.2 net of LME impact3 related to personnel costs
16Wendel Investor Day | December 1, 2016
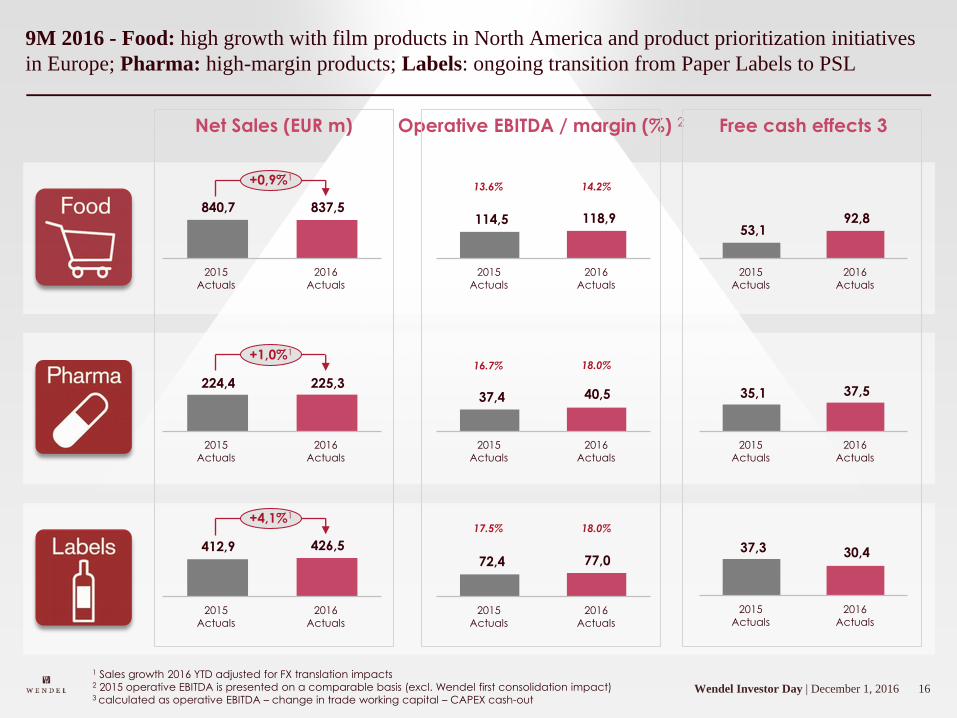
9M 2016 - Food: high growth with film products in North America and product prioritization initiatives
in Europe; Pharma: high-margin products; Labels: ongoing transition from Paper Labels to PSL
1 Sales growth 2016 YTD adjusted for FX translation impacts2 2015 operative EBITDA is presented on a comparable basis (excl. Wendel first consolidation impact)3 calculated as operative EBITDA – change in trade working capital – CAPEX cash-out
Net Sales (EUR m)
840,7 837,5
2015
Actuals
+0,9%1
2016
Actuals
224,4 225,3
+1,0%1
2016
Actuals
2015
Actuals
412,9 426,5
2015
Actuals
2016
Actuals
+4,1%1
114,5 118,9
2016
Actuals
2015
Actuals
13.6% 14.2%
Operative EBITDA / margin (%) 2
37,4 40,5
2016
Actuals
2015
Actuals
72,4 77,0
2016
Actuals
2015
Actuals
17.5% 18.0%
16.7% 18.0%
53,192,8
2016
Actuals
2015
Actuals
Free cash effects 3
35,1 37,5
2016
Actuals
2015
Actuals
37,3 30,4
2015
Actuals
2016
Actuals
17Wendel Investor Day | December 1, 2016
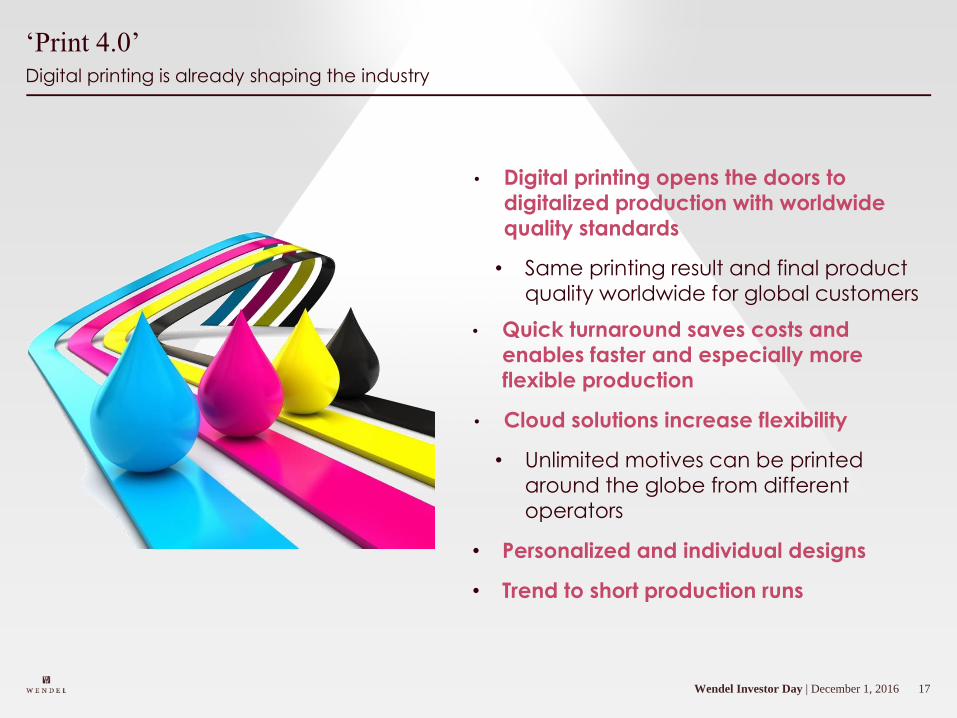
Digital printing is already shaping the industry
‘Print 4.0’
• Digital printing opens the doors to digitalized production with worldwide
quality standards
• Same printing result and final product
quality worldwide for global customers
• Quick turnaround saves costs and enables faster and especially more flexible production
• Cloud solutions increase flexibility
• Unlimited motives can be printed around the globe from different
operators
• Personalized and individual designs
• Trend to short production runs
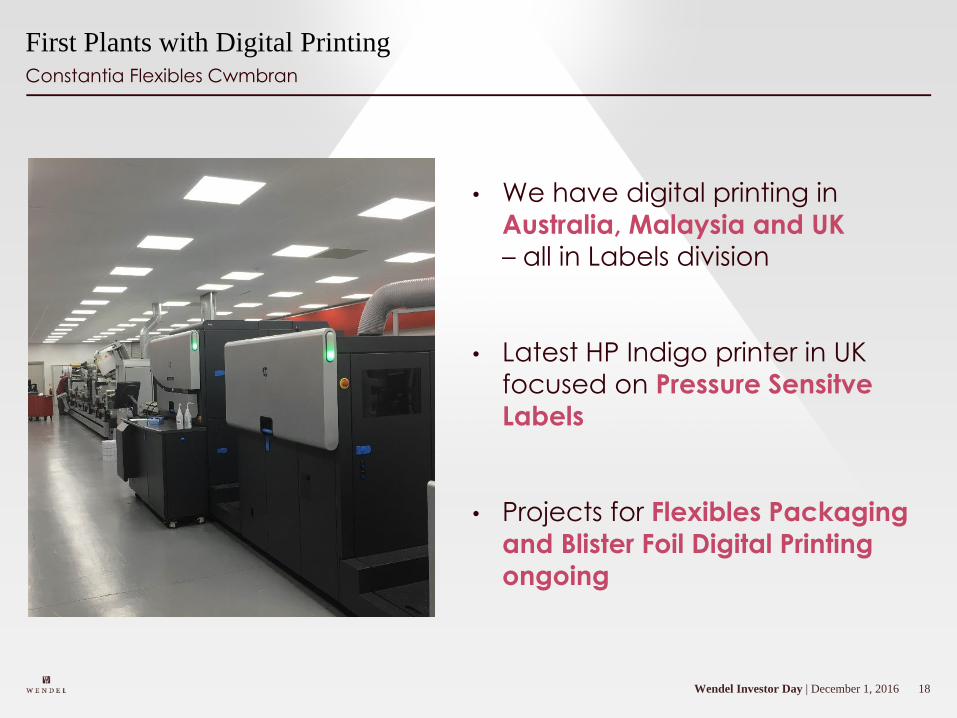
18Wendel Investor Day | December 1, 2016
Constantia Flexibles Cwmbran
First Plants with Digital Printing
• We have digital printing in
Australia, Malaysia and UK
– all in Labels division
• Latest HP Indigo printer in UK
focused on Pressure Sensitve
Labels
• Projects for Flexibles Packaging
and Blister Foil Digital Printing
ongoing
19Wendel Investor Day | December 1, 2016
A new strategy leads our way forward
Profitable and sustainable
growth by focusing
on attractive
end-markets worldwide
We focus on selective end-markets
in attractive regions with our customers
20Wendel Investor Day | December 1, 2016
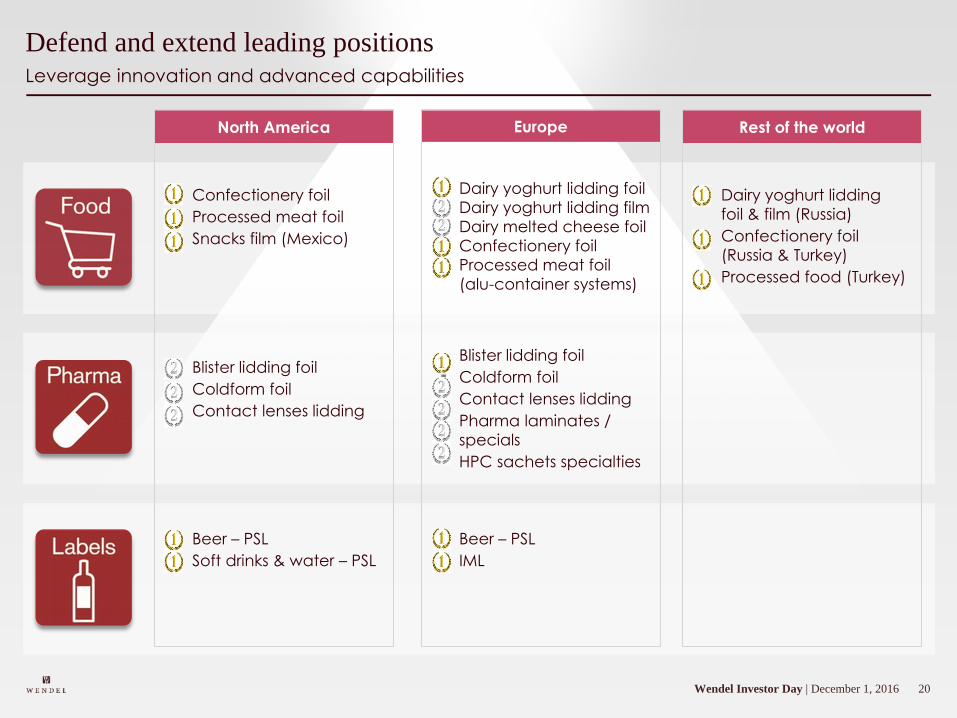
Leverage innovation and advanced capabilities
Defend and extend leading positions
Beer – PSL
Soft drinks & water – PSL
Confectionery foil
Processed meat foil
Snacks film (Mexico)
Blister lidding foil
Coldform foil
Contact lenses lidding
Beer – PSL
IML
Dairy yoghurt lidding foil
Dairy yoghurt lidding film
Dairy melted cheese foil
Confectionery foil
Processed meat foil
(alu-container systems)
Blister lidding foil
Coldform foil
Contact lenses lidding
Pharma laminates /
specials
HPC sachets specialties
North America Rest of the worldEurope
Dairy yoghurt lidding
foil & film (Russia)
Confectionery foil
(Russia & Turkey)
Processed food (Turkey)
21Wendel Investor Day | December 1, 2016
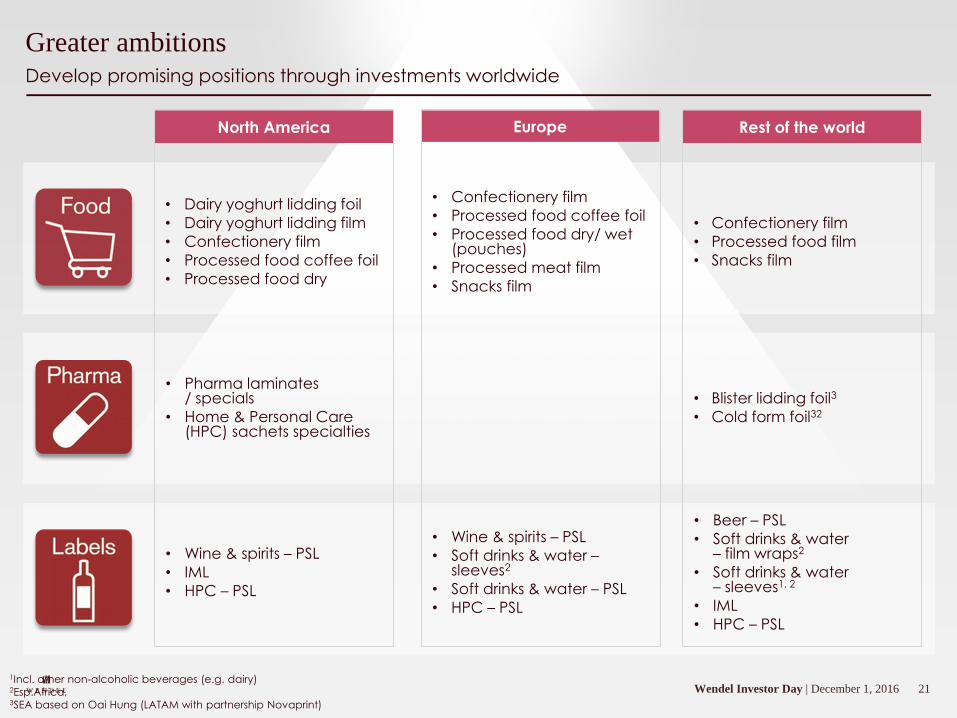
Develop promising positions through investments worldwide
Greater ambitions
1Incl. other non-alcoholic beverages (e.g. dairy)2Esp.Africa, 3SEA based on Oai Hung (LATAM with partnership Novaprint)
North America Rest of the worldEurope
• Wine & spirits – PSL
• IML
• HPC – PSL
• Dairy yoghurt lidding foil
• Dairy yoghurt lidding film
• Confectionery film
• Processed food coffee foil
• Processed food dry
• Pharma laminates / specials
• Home & Personal Care (HPC) sachets specialties
• Wine & spirits – PSL
• Soft drinks & water –sleeves2
• Soft drinks & water – PSL
• HPC – PSL
• Confectionery film
• Processed food coffee foil
• Processed food dry/ wet (pouches)
• Processed meat film
• Snacks film
• Beer – PSL
• Soft drinks & water – film wraps2
• Soft drinks & water – sleeves1, 2
• IML
• HPC – PSL
• Confectionery film
• Processed food film
• Snacks film
• Blister lidding foil3
• Cold form foil32
22Wendel Investor Day | December 1, 2016
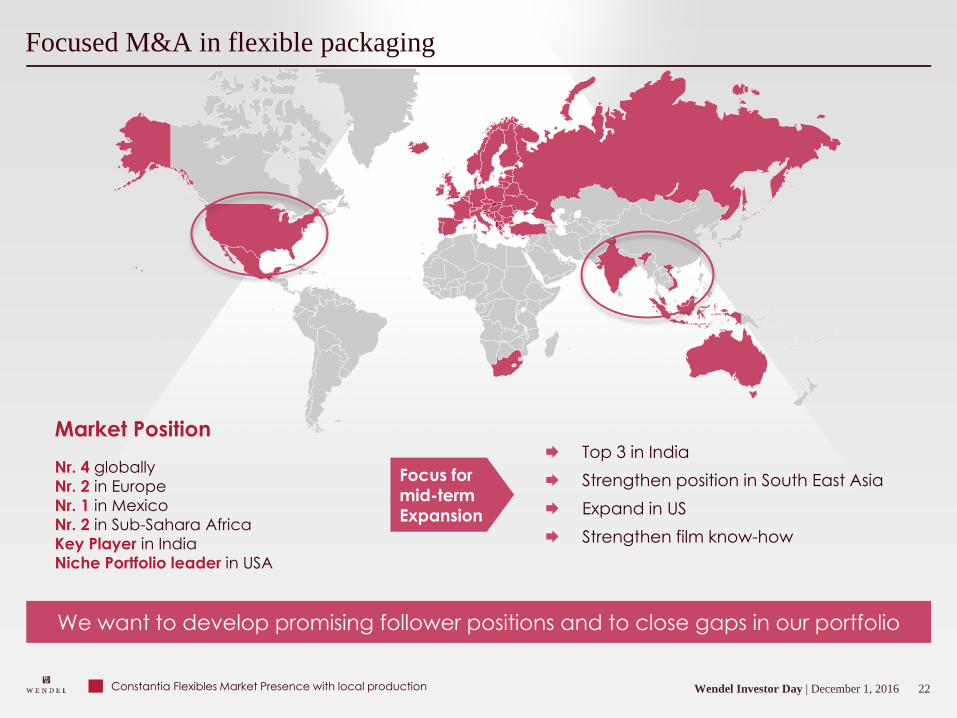
Focused M&A in flexible packaging
Top 3 in India
Strengthen position in South East Asia
Expand in US
Strengthen film know-how
Focus for
mid-term
Expansion
Constantia Flexibles Market Presence with local production
We want to develop promising follower positions and to close gaps in our portfolio
Market Position
Nr. 4 globally
Nr. 2 in Europe
Nr. 1 in Mexico
Nr. 2 in Sub-Sahara Africa
Key Player in India
Niche Portfolio leader in USA
23Wendel Investor Day | December 1, 2016
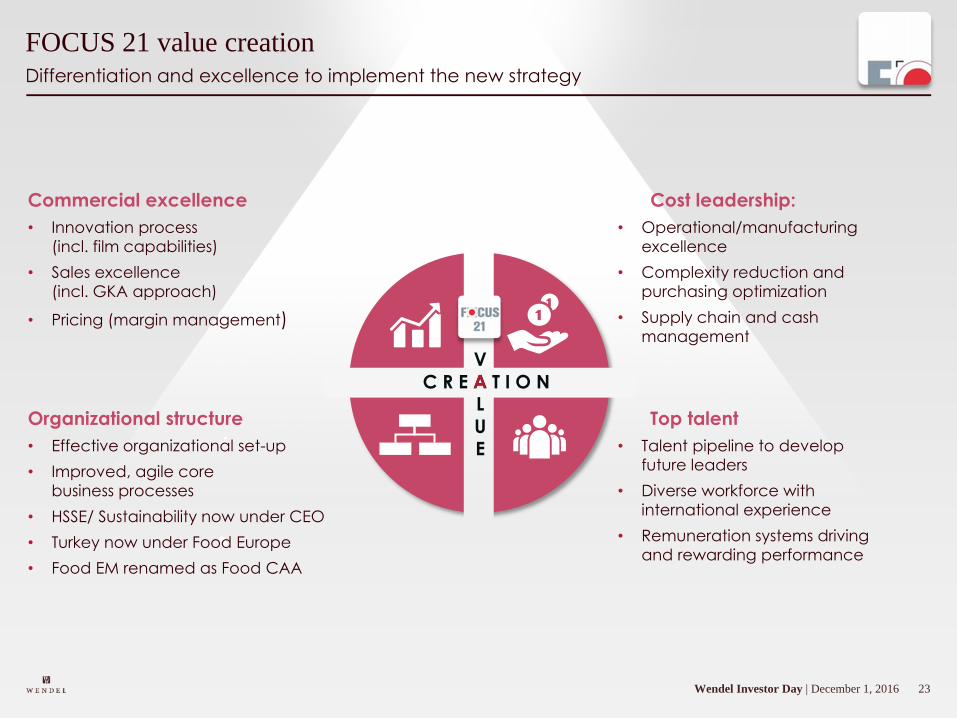
Differentiation and excellence to implement the new strategy
FOCUS 21 value creation
Top talent
• Talent pipeline to develop
future leaders
• Diverse workforce with
international experience
• Remuneration systems driving
and rewarding performance
V
A
L
U
E
C R E A T I O N
Organizational structure
• Effective organizational set-up
• Improved, agile core
business processes
• HSSE/ Sustainability now under CEO
• Turkey now under Food Europe
• Food EM renamed as Food CAA
Commercial excellence
• Innovation process
(incl. film capabilities)
• Sales excellence
(incl. GKA approach)
• Pricing (margin management)
Cost leadership:
• Operational/manufacturing
excellence
• Complexity reduction and
purchasing optimization
• Supply chain and cash
management
24Wendel Investor Day | December 1, 2016
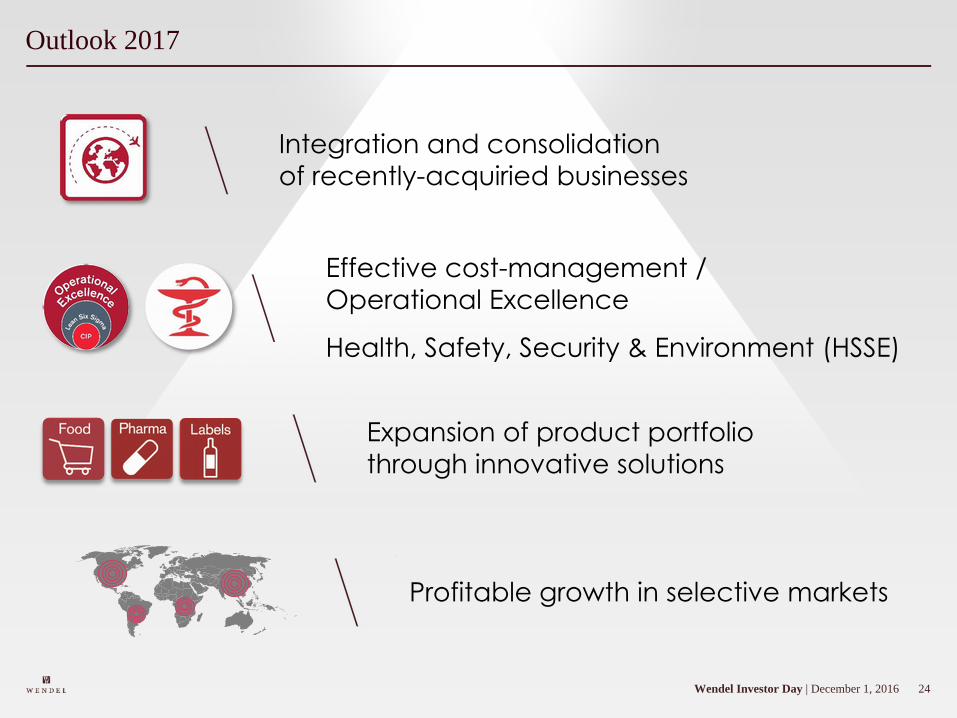
Outlook 2017
Integration and consolidation
of recently-acquiried businesses
Effective cost-management /
Operational Excellence
Health, Safety, Security & Environment (HSSE)
Expansion of product portfolio
through innovative solutions
Profitable growth in selective markets
25Wendel Investor Day | December 1, 2016
PEOPLE
PASSION
PACKAGING
Thank You!

26IHS - Wendel Investor Day | December 1, 2016
Investor DayDecember 1, 2016
1IHS - Wendel Investor Day | December 1, 2016
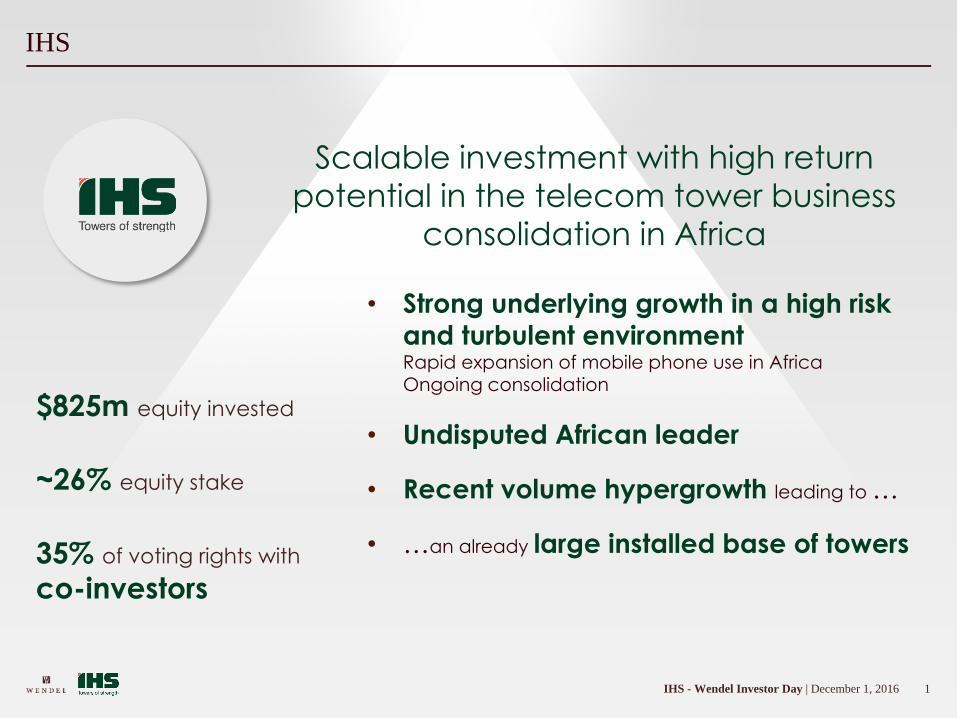
IHS
• Strong underlying growth in a high risk
and turbulent environmentRapid expansion of mobile phone use in Africa
Ongoing consolidation
• Undisputed African leader
• Recent volume hypergrowth leading to …
• …an already large installed base of towers
Scalable investment with high return
potential in the telecom tower business
consolidation in Africa
$825m equity invested
~26% equity stake
35% of voting rights with
co-investors
2IHS - Wendel Investor Day | December 1, 2016
Ted Manvitz–CFO of IHS
Ted joined IHS in 2009 and, as Group CFO, he is
responsible for the company’s financial management,
debt and equity funding initiatives, M&A activities and
the investor relations programme. Prior to being named
CFO, Ted served as the group’s Chief Operating Officer
and Chief Investment Officer as the company
expanded into four new countries, raised over $5.5
billion in debt and equity funding and completed 13
acquisitions.
Before joining IHS, Ted lived in Nigeria and was
managing Investment AB Kinnevik’s new investments in
Africa. Ted previously worked with JP Morgan
in London and San Francisco and started his career as
a corporate lawyer with Bryan Cave in Missouri, USA.
Ted has an MBA from the Kelly School of Business,
Indiana University; a law degree from the University of
Iowa College of Law (with distinction); and a
Bachelor’s Degree in Business Administration from Avila
University (major in Accounting cum laude).
3IHS - Wendel Investor Day | December 1, 2016
IHSTed Manvitz– Group CFO
4IHS - Wendel Investor Day | December 1, 2016
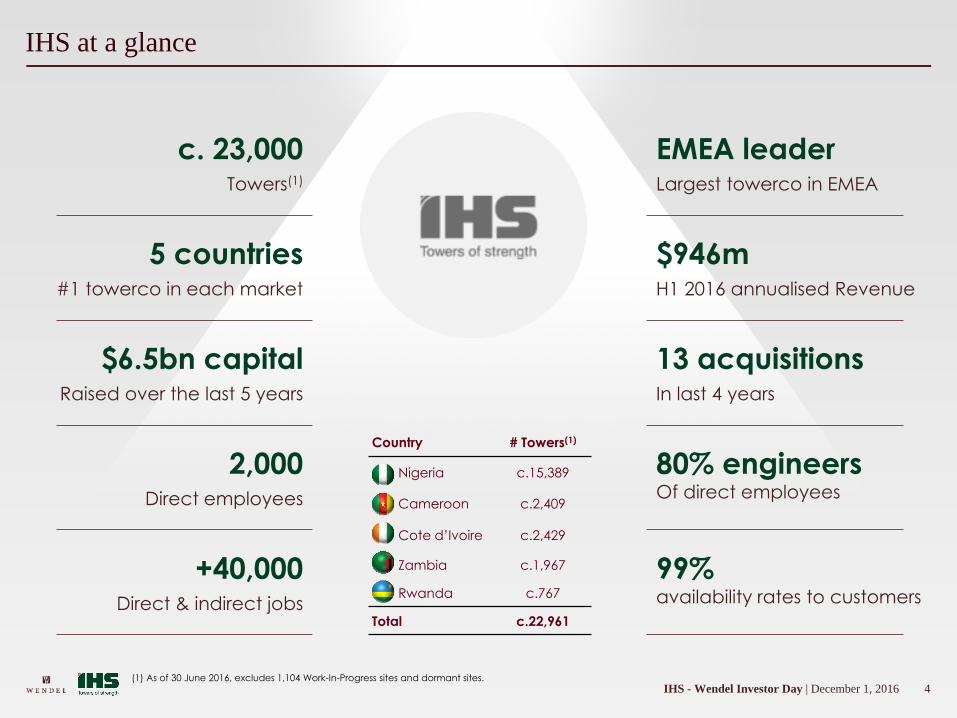
IHS at a glance
c. 23,000Towers(1)
13 acquisitionsIn last 4 years
$6.5bn capitalRaised over the last 5 years
$946m H1 2016 annualised Revenue
5 countries#1 towerco in each market
2,000Direct employees
80% engineersOf direct employees
EMEA leaderLargest towerco in EMEA
Country # Towers(1)
Nigeria c.15,389
Cameroon c.2,409
Cote d’Ivoire c.2,429
Zambia c.1,967
Rwanda c.767
Total c.22,961
+40,000 Direct & indirect jobs
99%availability rates to customers
(1) As of 30 June 2016, excludes 1,104 Work-In-Progress sites and dormant sites.
5IHS - Wendel Investor Day | December 1, 2016
IHS & The African Market
6IHS - Wendel Investor Day | December 1, 2016
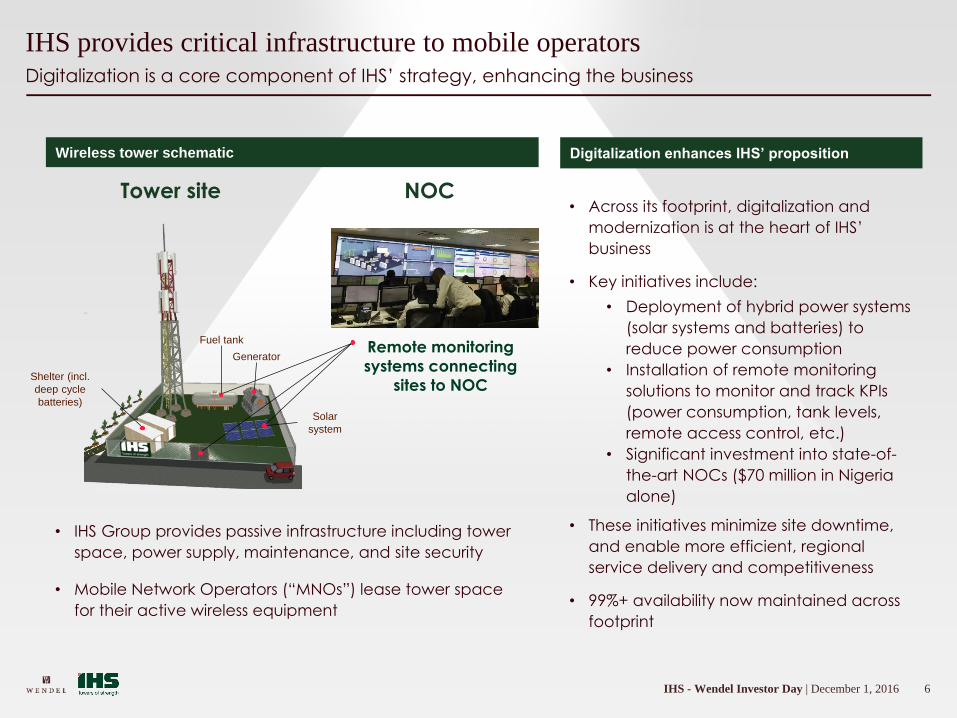
Digitalization is a core component of IHS’ strategy, enhancing the business
IHS provides critical infrastructure to mobile operators
Wireless tower schematic
• IHS Group provides passive infrastructure including tower
space, power supply, maintenance, and site security
• Mobile Network Operators (“MNOs”) lease tower space
for their active wireless equipment
Digitalization enhances IHS’ proposition
• Across its footprint, digitalization and
modernization is at the heart of IHS’
business
• Key initiatives include:
• Deployment of hybrid power systems
(solar systems and batteries) to
reduce power consumption
• Installation of remote monitoring
solutions to monitor and track KPIs
(power consumption, tank levels,
remote access control, etc.)
• Significant investment into state-of-
the-art NOCs ($70 million in Nigeria
alone)
• These initiatives minimize site downtime,
and enable more efficient, regional
service delivery and competitiveness
• 99%+ availability now maintained across
footprint
Remote monitoring
systems connecting
sites to NOC
NOCTower site
Shelter (incl.
deep cycle
batteries)
Fuel tank
Solar
system
Generator
7IHS - Wendel Investor Day | December 1, 2016
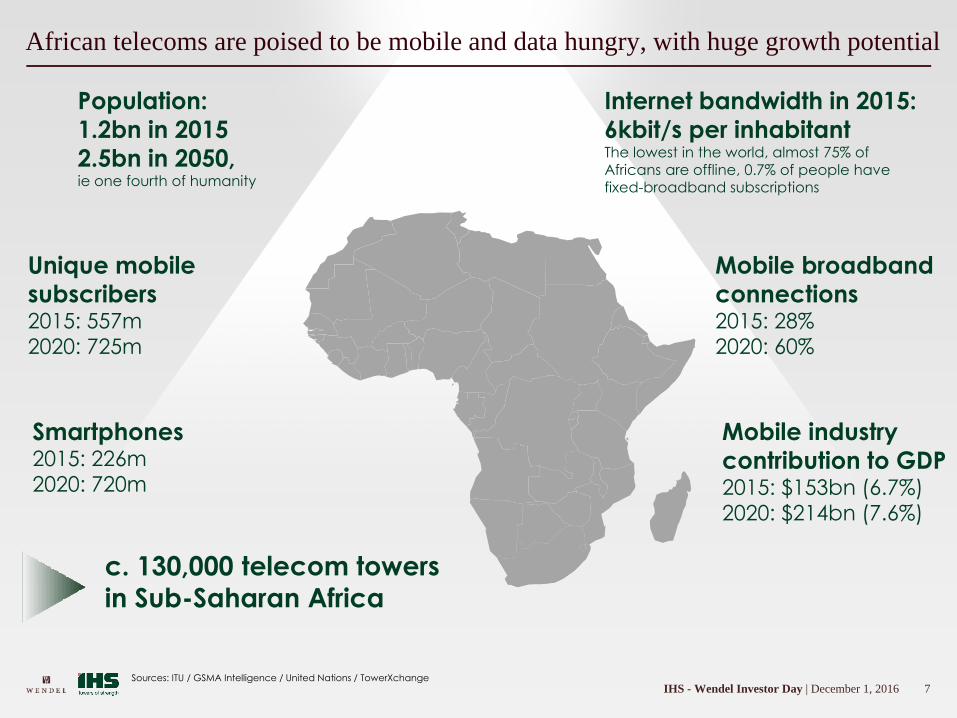
African telecoms are poised to be mobile and data hungry, with huge growth potential
Population:
1.2bn in 2015
2.5bn in 2050, ie one fourth of humanity
Internet bandwidth in 2015:
6kbit/s per inhabitantThe lowest in the world, almost 75% of
Africans are offline, 0.7% of people have fixed-broadband subscriptions
c. 130,000 telecom towers
in Sub-Saharan Africa
Unique mobile
subscribers2015: 557m
2020: 725m
Mobile industry
contribution to GDP2015: $153bn (6.7%)
2020: $214bn (7.6%)
Mobile broadband
connections2015: 28%
2020: 60%
Smartphones2015: 226m
2020: 720m
Sources: ITU / GSMA Intelligence / United Nations / TowerXchange
8IHS - Wendel Investor Day | December 1, 2016
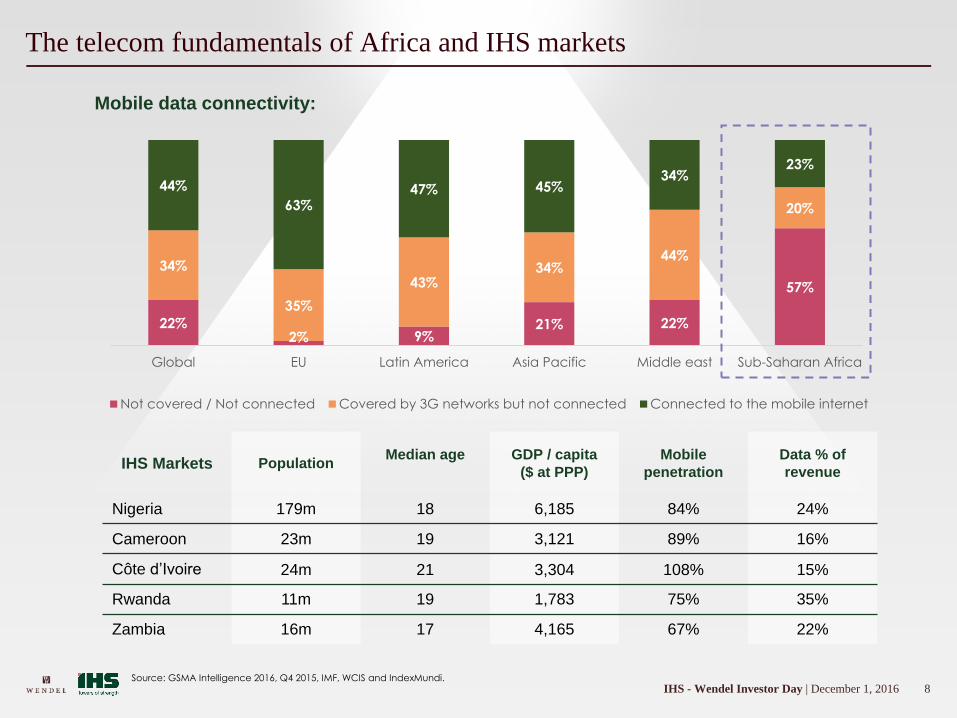
The telecom fundamentals of Africa and IHS markets
IHS Markets PopulationMedian age GDP / capita
($ at PPP)
Mobile
penetration
Data % of
revenue
Nigeria 179m 18 6,185 84% 24%
Cameroon 23m 19 3,121 89% 16%
Côte d’Ivoire 24m 21 3,304 108% 15%
Rwanda 11m 19 1,783 75% 35%
Zambia 16m 17 4,165 67% 22%
22%2% 9%
21% 22%
57%
34%
35%
43%34%
44%
20%
44%
63%47% 45%
34%23%
Global EU Latin America Asia Pacific Middle east Sub-Saharan Africa
Not covered / Not connected Covered by 3G networks but not connected Connected to the mobile internet
Source: GSMA Intelligence 2016, Q4 2015, IMF, WCIS and IndexMundi.
Mobile data connectivity:
9IHS - Wendel Investor Day | December 1, 2016
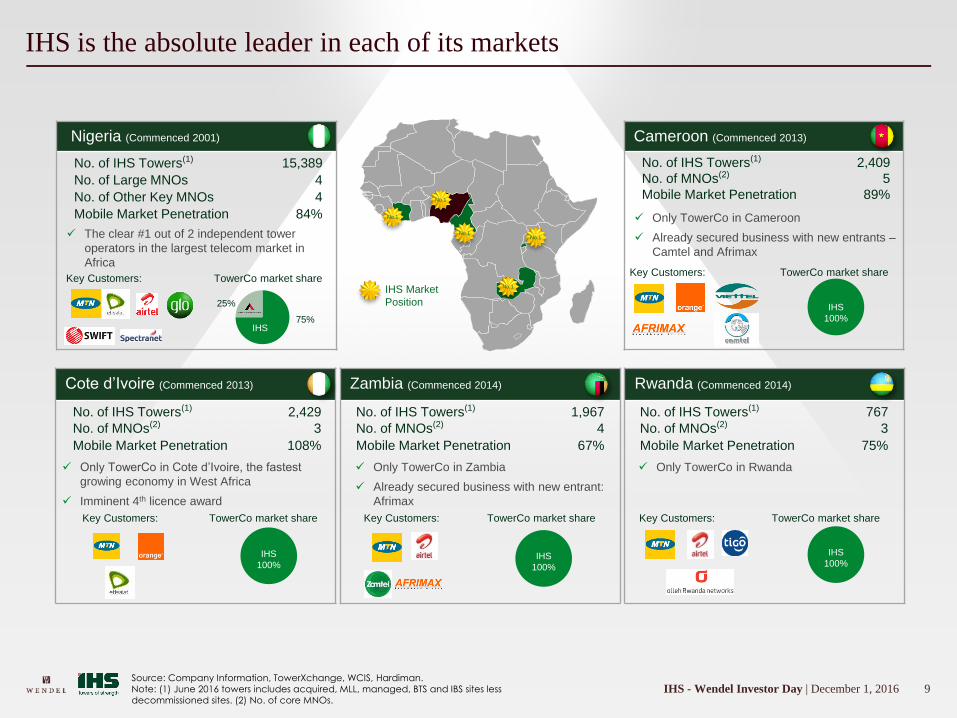
IHS is the absolute leader in each of its markets
Source: Company Information, TowerXchange, WCIS, Hardiman.Note: (1) June 2016 towers includes acquired, MLL, managed, BTS and IBS sites less decommissioned sites. (2) No. of core MNOs.
Cameroon (Commenced 2013)
IHS
100%
Nigeria (Commenced 2001)
Zambia (Commenced 2014)
No.1
No.1
No.1
No.1
No.1
IHS Market
Position
Cote d’Ivoire (Commenced 2013) Rwanda (Commenced 2014)
Only TowerCo in Cameroon
Already secured business with new entrants –
Camtel and Afrimax
The clear #1 out of 2 independent tower
operators in the largest telecom market in
Africa
No. of IHS Towers(1) 15,389
No. of Large MNOs 4
No. of Other Key MNOs 4
Mobile Market Penetration 84%
No. of IHS Towers(1) 2,429
No. of MNOs(2) 3
Mobile Market Penetration 108%
No. of IHS Towers(1) 1,967
No. of MNOs(2) 4
Mobile Market Penetration 67%
No. of IHS Towers(1) 767
No. of MNOs(2) 3
Mobile Market Penetration 75%
No. of IHS Towers(1) 2,409
No. of MNOs(2) 5
Mobile Market Penetration 89%
Only TowerCo in Rwanda Only TowerCo in Zambia
Already secured business with new entrant:
Afrimax
Only TowerCo in Cote d’Ivoire, the fastest
growing economy in West Africa
Imminent 4th licence award
Key Customers:Key Customers:
Key Customers: Key Customers: Key Customers:
TowerCo market share
IHS
TowerCo market share
75%
25%
TowerCo market share
IHS
100%
TowerCo market share
IHS
100%
TowerCo market share
IHS
100%
10IHS - Wendel Investor Day | December 1, 2016
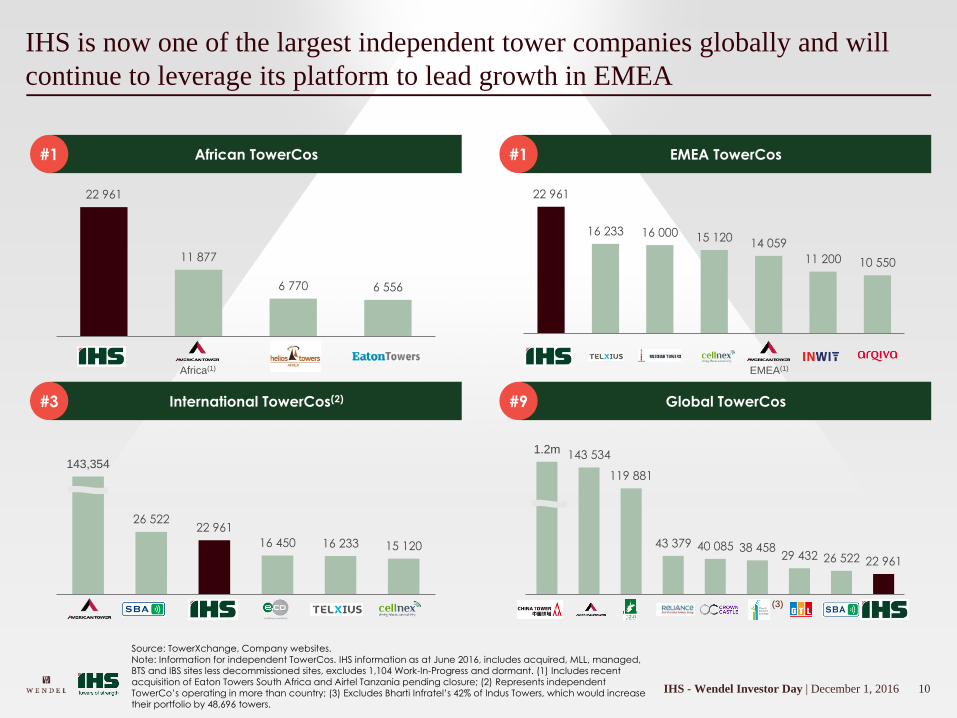
IHS is now one of the largest independent tower companies globally and will
continue to leverage its platform to lead growth in EMEA
Source: TowerXchange, Company websites.Note: Information for independent TowerCos. IHS information as at June 2016, includes acquired, MLL, managed, BTS and IBS sites less decommissioned sites, excludes 1,104 Work-In-Progress and dormant. (1) Includes recent acquisition of Eaton Towers South Africa and Airtel Tanzania pending closure; (2) Represents independent TowerCo’s operating in more than country; (3) Excludes Bharti Infratel’s 42% of Indus Towers, which would increase their portfolio by 48,696 towers.
African TowerCos#1 EMEA TowerCos#1
International TowerCos(2)#3 Global TowerCos#9
22 961
11 877
6 770 6 556
Africa(1)
143,354
26 52222 961
16 450 16 233 15 120
1.2m 143 534
119 881
43 379 40 085 38 45829 432 26 522 22 961
(3)
22 961
16 233 16 000 15 12014 059
11 200 10 550
EMEA(1)
11IHS - Wendel Investor Day | December 1, 2016
Financials & Corporate Activity
12IHS - Wendel Investor Day | December 1, 2016
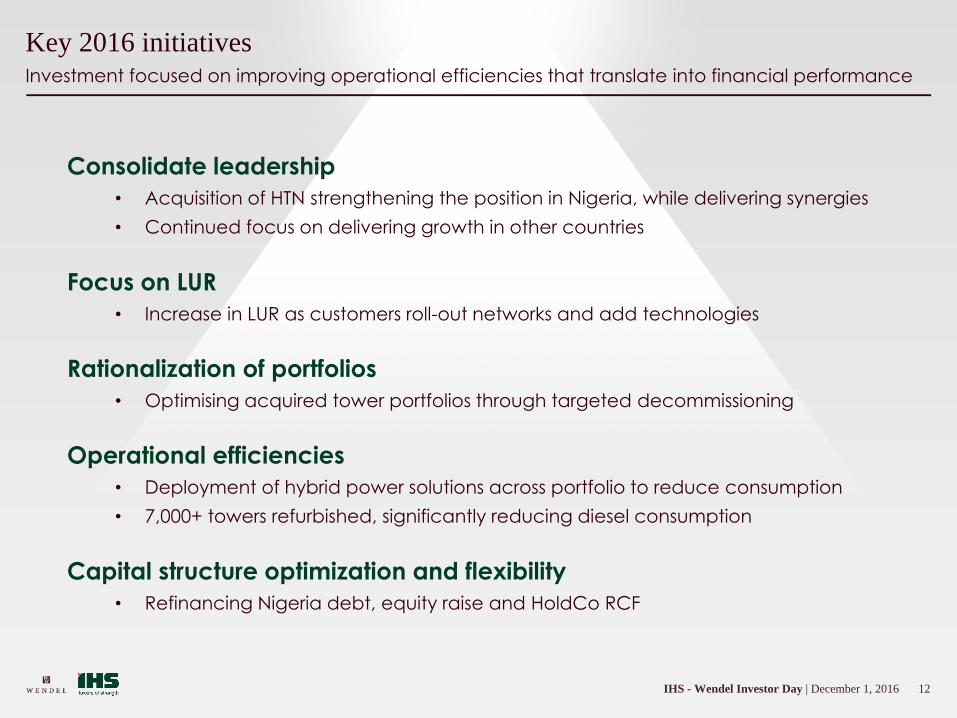
Investment focused on improving operational efficiencies that translate into financial performance
Key 2016 initiatives
Consolidate leadership
• Acquisition of HTN strengthening the position in Nigeria, while delivering synergies
• Continued focus on delivering growth in other countries
Focus on LUR
• Increase in LUR as customers roll-out networks and add technologies
Operational efficiencies
• Deployment of hybrid power solutions across portfolio to reduce consumption
• 7,000+ towers refurbished, significantly reducing diesel consumption
Capital structure optimization and flexibility
• Refinancing Nigeria debt, equity raise and HoldCo RCF
Rationalization of portfolios
• Optimising acquired tower portfolios through targeted decommissioning
13IHS - Wendel Investor Day | December 1, 2016
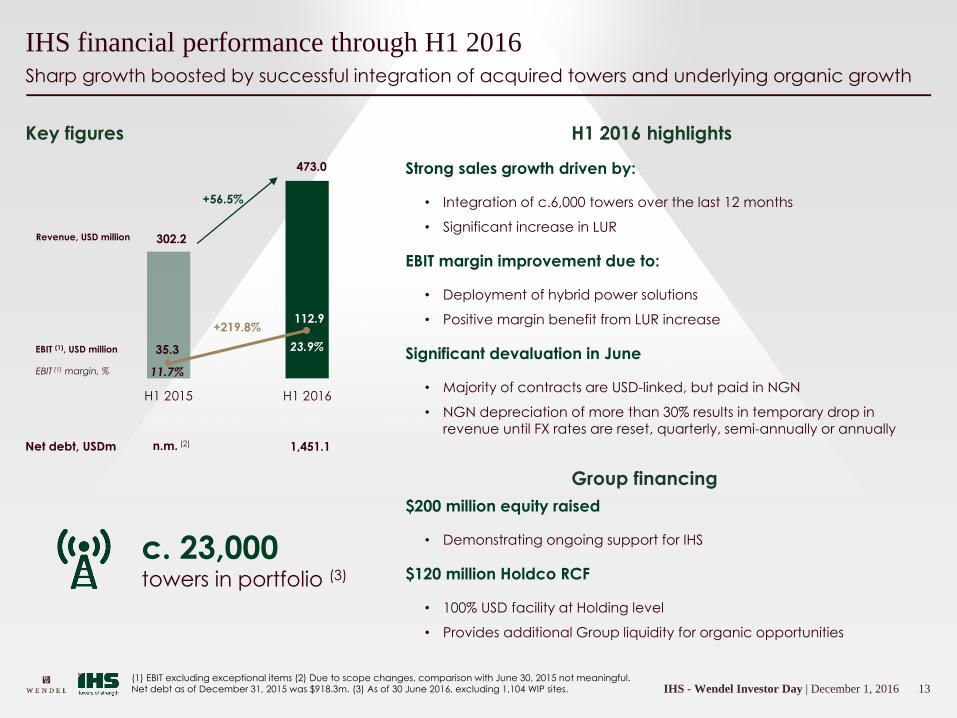
H1 2015 H1 2016
Sharp growth boosted by successful integration of acquired towers and underlying organic growth
IHS financial performance through H1 2016
Key figures
473.0
Revenue, USD million
EBIT (1), USD million
Strong sales growth driven by:
• Integration of c.6,000 towers over the last 12 months
• Significant increase in LUR
EBIT margin improvement due to:
• Deployment of hybrid power solutions
• Positive margin benefit from LUR increase
Significant devaluation in June
• Majority of contracts are USD-linked, but paid in NGN
• NGN depreciation of more than 30% results in temporary drop in
revenue until FX rates are reset, quarterly, semi-annually or annually
302.2
35.3
112.9
11.7%
Net debt, USDm 1,451.1
+56.5%
H1 2016 highlights
EBIT (1) margin, %
c. 23,000towers in portfolio (3)
23.9%
n.m. (2)
+219.8%
(1) EBIT excluding exceptional items (2) Due to scope changes, comparison with June 30, 2015 not meaningful. Net debt as of December 31, 2015 was $918.3m. (3) As of 30 June 2016, excluding 1,104 WIP sites.
Group financing
$200 million equity raised
• Demonstrating ongoing support for IHS
$120 million Holdco RCF
• 100% USD facility at Holding level
• Provides additional Group liquidity for organic opportunities
14IHS - Wendel Investor Day | December 1, 2016
Outlook & Strategy
15IHS - Wendel Investor Day | December 1, 2016
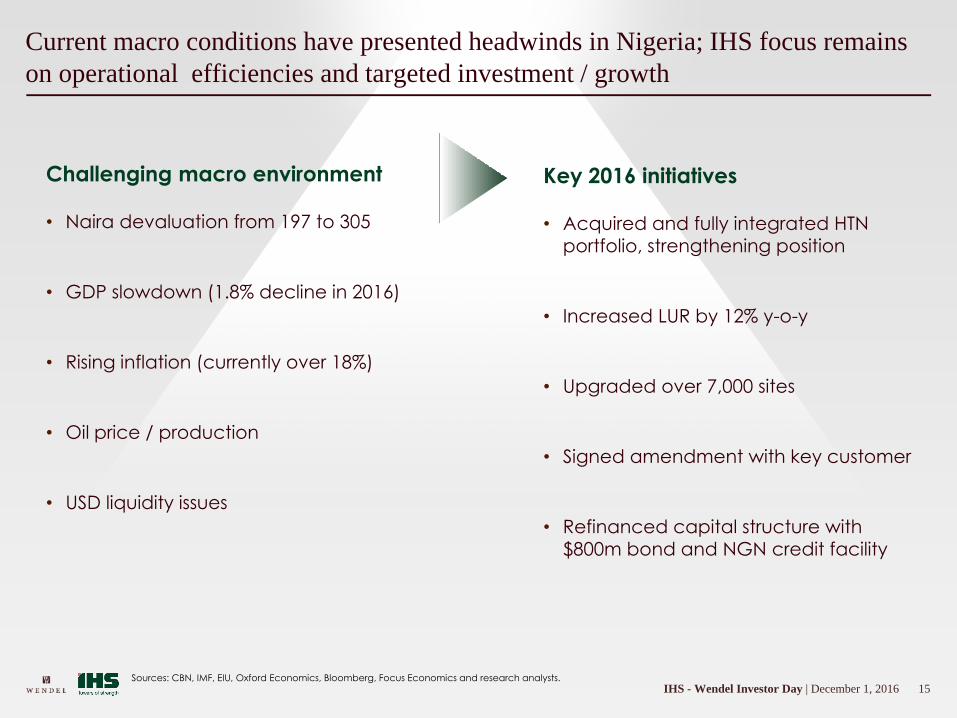
Current macro conditions have presented headwinds in Nigeria; IHS focus remains
on operational efficiencies and targeted investment / growth
Sources: CBN, IMF, EIU, Oxford Economics, Bloomberg, Focus Economics and research analysts.
Challenging macro environment
• Naira devaluation from 197 to 305
• GDP slowdown (1.8% decline in 2016)
• Rising inflation (currently over 18%)
• Oil price / production
• USD liquidity issues
Key 2016 initiatives
• Acquired and fully integrated HTN
portfolio, strengthening position
• Increased LUR by 12% y-o-y
• Upgraded over 7,000 sites
• Signed amendment with key customer
• Refinanced capital structure with
$800m bond and NGN credit facility
16IHS - Wendel Investor Day | December 1, 2016
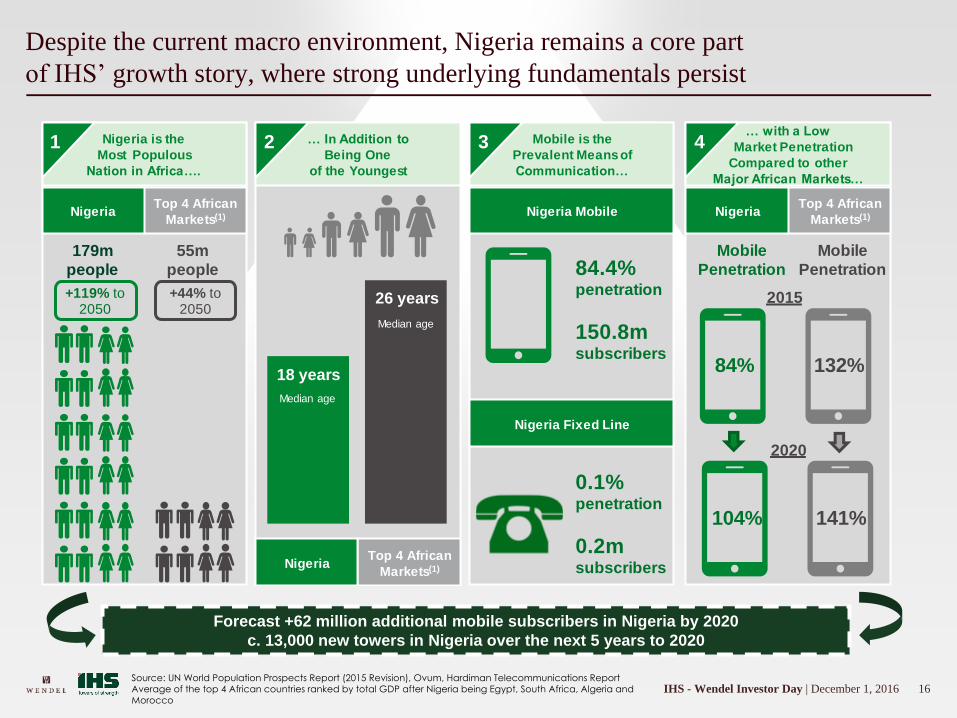
Despite the current macro environment, Nigeria remains a core part
of IHS’ growth story, where strong underlying fundamentals persist
Nigeria is the
Most Populous
Nation in Africa….
… In Addition to
Being One
of the Youngest
… with a Low
Market Penetration
Compared to other
Major African Markets…
Mobile is the
Prevalent Means of
Communication…
+119% to 2050
84.4% penetration
150.8m subscribers
1 2 3 4
Top 4 African
Markets(1)Nigeria
179m
people
+44% to 2050
55m
people
Top 4 African
Markets(1)Nigeria
18 years
26 years
Nigeria Mobile
Nigeria Fixed Line
0.1% penetration
0.2m subscribers
Top 4 African
Markets(1)Nigeria
84%
Mobile
Penetration
132%
Mobile
Penetration
2015
104% 141%
2020
Median age
Median age
Forecast +62 million additional mobile subscribers in Nigeria by 2020Forecast +62 million additional mobile subscribers in Nigeria by 2020
c. 13,000 new towers in Nigeria over the next 5 years to 2020
Source: UN World Population Prospects Report (2015 Revision), Ovum, Hardiman Telecommunications ReportAverage of the top 4 African countries ranked by total GDP after Nigeria being Egypt, South Africa, Algeria and Morocco
17IHS - Wendel Investor Day | December 1, 2016
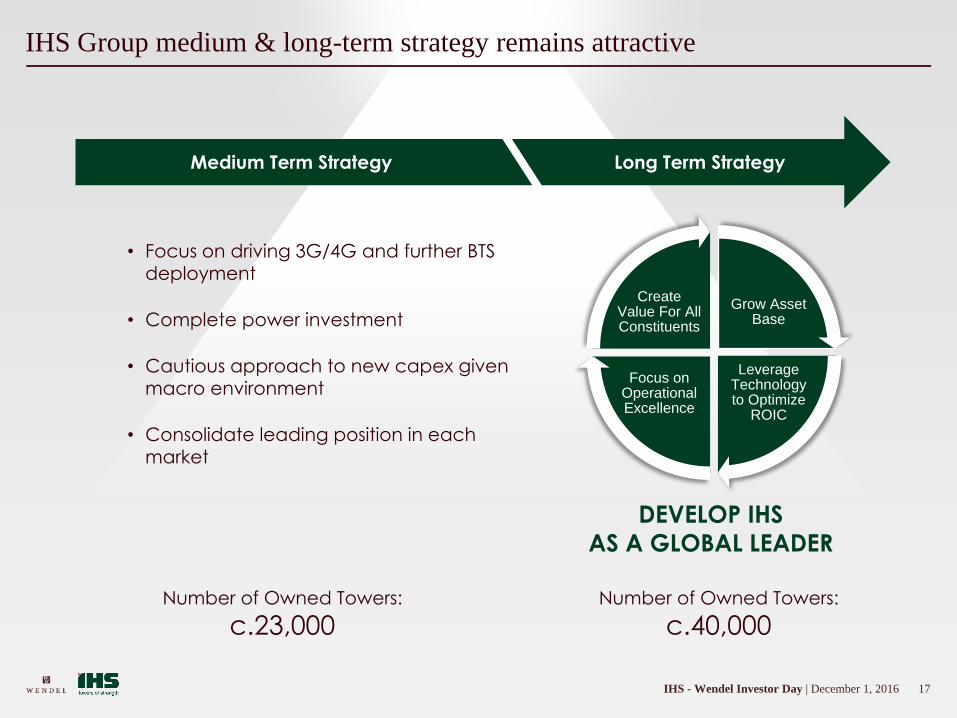
IHS Group medium & long-term strategy remains attractive
• Focus on driving 3G/4G and further BTS
deployment
• Complete power investment
• Cautious approach to new capex given
macro environment
• Consolidate leading position in each
market
Medium Term Strategy Long Term Strategy
Grow Asset Base
Leverage Technology to Optimize
ROIC
Focus on Operational Excellence
Create Value For All Constituents
DEVELOP IHS
AS A GLOBAL LEADER
Number of Owned Towers:
c.23,000Number of Owned Towers:
c.40,000
18IHS - Wendel Investor Day | December 1, 2016
Thank You

19IHS - Wendel Investor Day | December 1, 2016
Investor DayDecember 1, 2016
20IHS - Wendel Investor Day | December 1, 2016
Break
1Tsebo - Wendel Investor Day | December 1, 2016
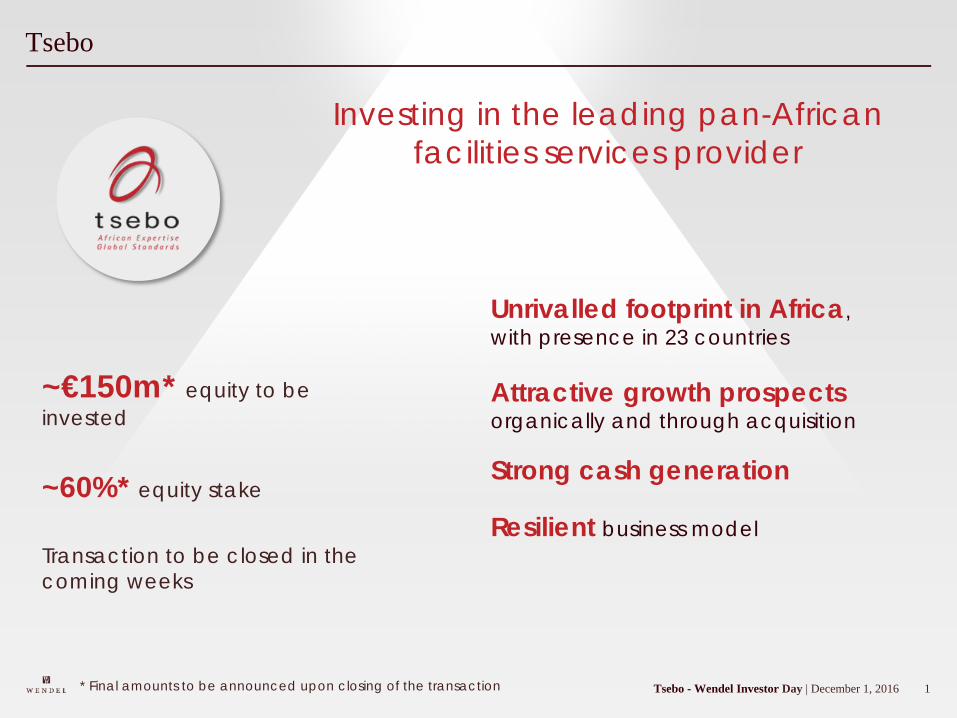
Tsebo
Investing in the leading pan-African facilities services provider
~€150m* equity to be invested
~60%* equity stake
Transaction to be closed in the coming weeks
Unrivalled footprint in Africa,with presence in 23 countries
Attractive growth prospects organically and through acquisition
Resilient business model
Strong cash generation
* Final amounts to be announced upon closing of the transaction
2Tsebo - Wendel Investor Day | December 1, 2016
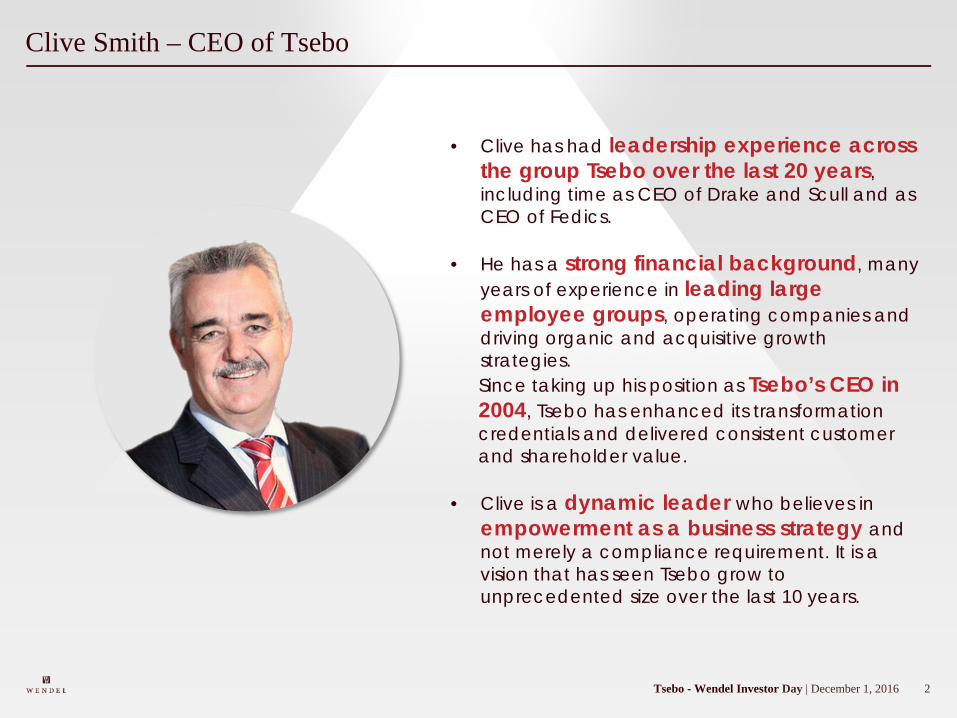
Clive Smith – CEO of Tsebo
• Clive has had leadership experience across the group Tsebo over the last 20 years, including time as CEO of Drake and Scull and as CEO of Fedics.
• He has a strong financial background, many years of experience in leading large employee groups, operating companies and driving organic and acquisitive growth strategies.Since taking up his position as Tsebo’s CEO in 2004, Tsebo has enhanced its transformation credentials and delivered consistent customer and shareholder value.
• Clive is a dynamic leader who believes in empowerment as a business strategy and not merely a compliance requirement. It is a vision that has seen Tsebo grow to unprecedented size over the last 10 years.
3V. 24.11. 2016 Family Day | 2 décembre 2016
TseboClive Smith, CEO
4Tsebo - Wendel Investor Day | December 1, 2016
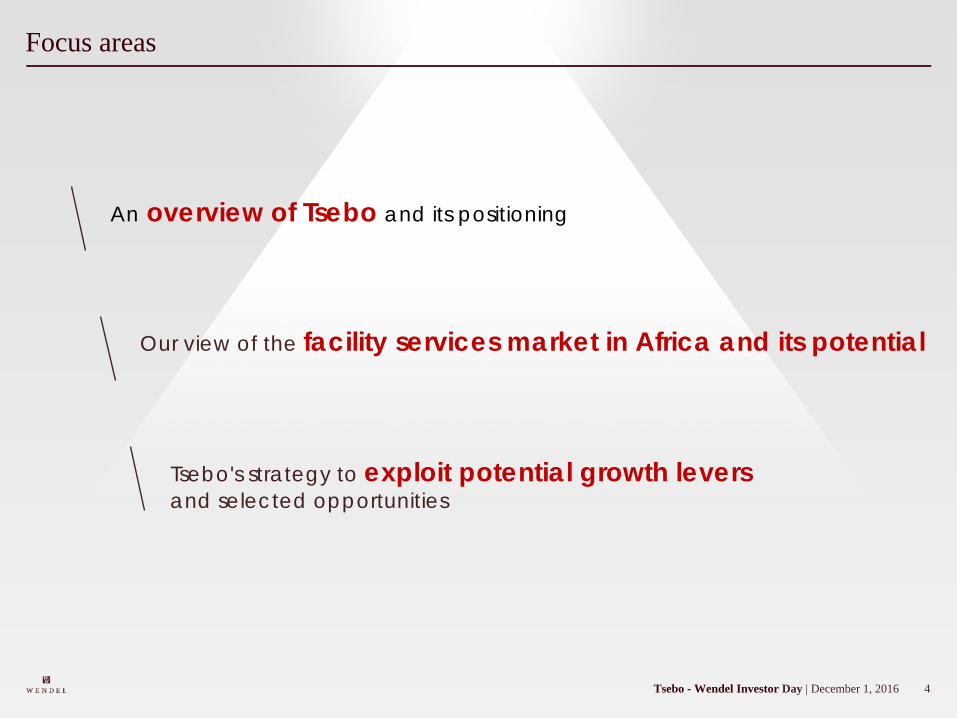
Focus areas
An overview of Tsebo and its positioning
Tsebo's strategy to exploit potential growth levers and selected opportunities
Our view of the facility services market in Africa and its potential
5Tsebo - Wendel Investor Day | December 1, 2016
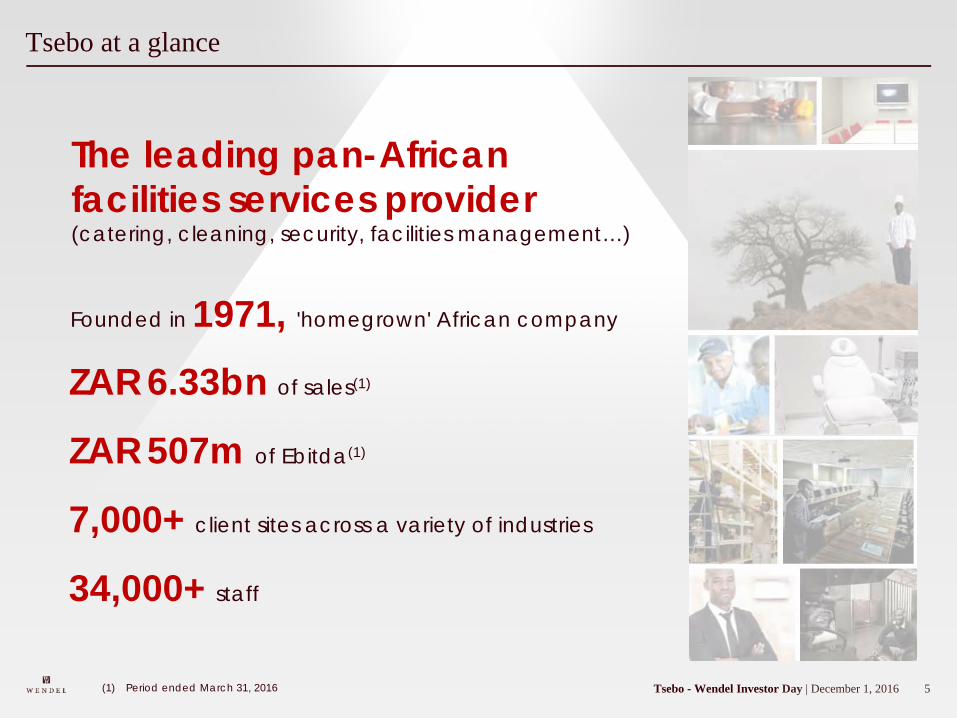
Tsebo at a glance
ZAR 6.33bn of sales(1)
ZAR 507m of Ebitda(1)
34,000+ staff
7,000+ client sites across a variety of industries
The leading pan-African facilities services provider(catering, cleaning, security, facilities management…)
Founded in 1971, 'homegrown' African company
(1) Period ended March 31, 2016
6Tsebo - Wendel Investor Day | December 1, 2016
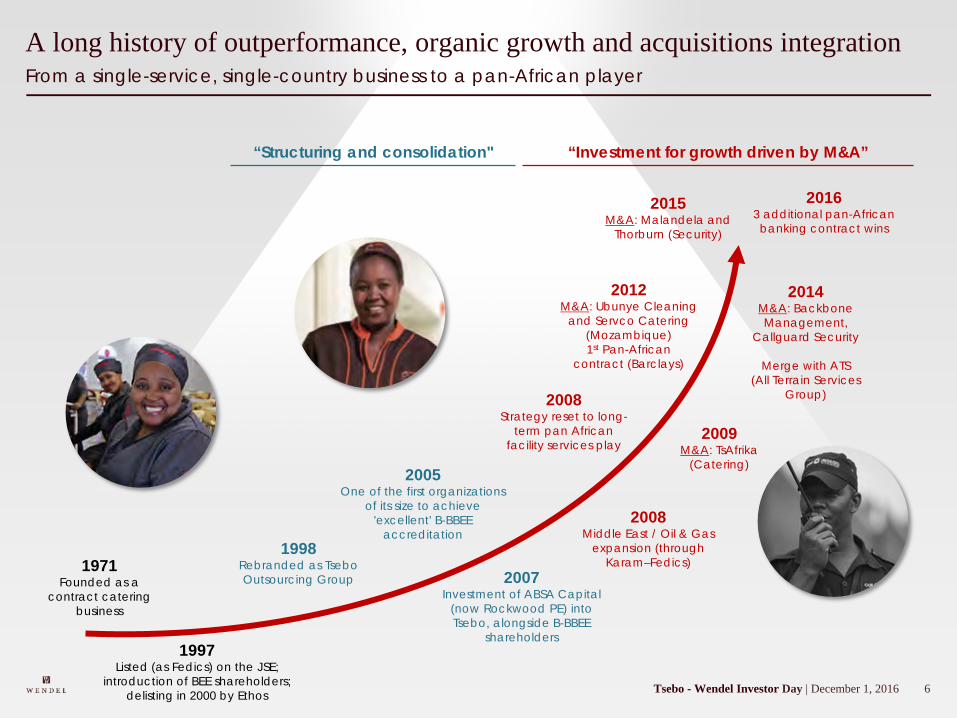
From a single-service, single-country business to a pan-African player A long history of outperformance, organic growth and acquisitions integration
1971 Founded as a
contract catering business
1997Listed (as Fedics) on the JSE;
introduction of BEE shareholders; delisting in 2000 by Ethos
1998Rebranded as TseboOutsourcing Group
2005 One of the first organizations
of its size to achieve 'excellent' B-BBEE
accreditation
2007Investment of ABSA Capital
(now Rockwood PE) into Tsebo, alongside B-BBEE
shareholders
2009M&A: TsAfrika
(Catering)
2012M&A: Ubunye Cleaning
and Servco Catering (Mozambique)1st Pan-African
contract (Barclays)
2015M&A: Malandela and
Thorburn (Security)
2014M&A: Backbone Management,
Callguard Security
Merge with ATS(All Terrain Services
Group)
“Investment for growth driven by M&A”“Structuring and consolidation"
2008Strategy reset to long-
term pan African facility services play
2016 3 additional pan-African banking contract wins
2008Middle East / Oil & Gas
expansion (through Karam–Fedics)
7Tsebo - Wendel Investor Day | December 1, 2016
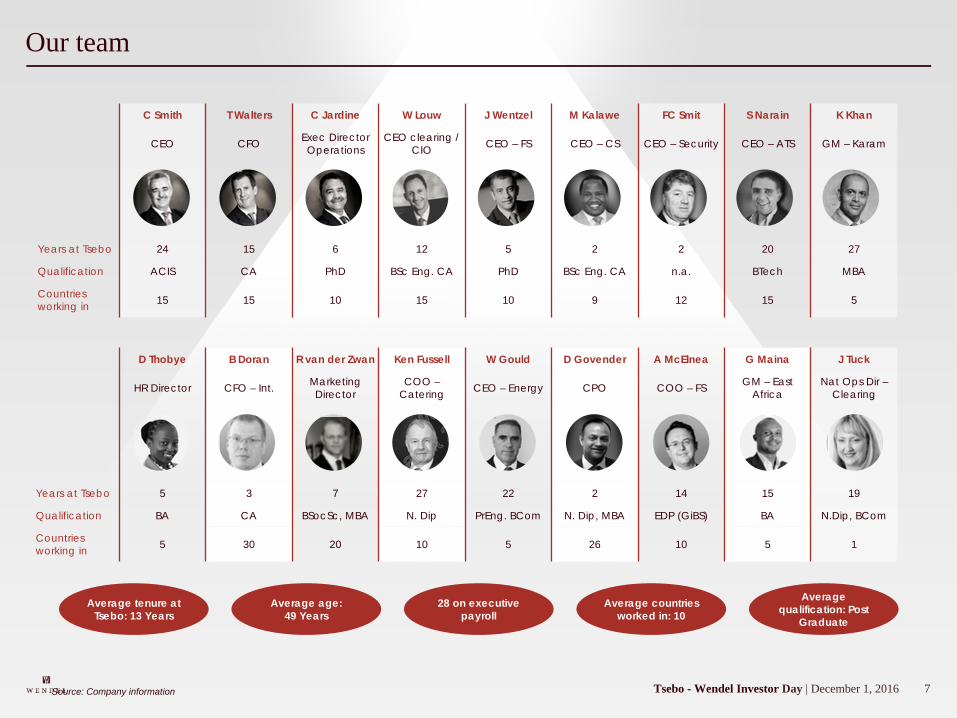
Our team
C Smith T Walters C Jardine W Louw J Wentzel M Kalawe FC Smit S Narain K Khan
CEO CFO Exec Director Operations
CEO clearing / CIO CEO – FS CEO – CS CEO – Security CEO – ATS GM – Karam
Years at Tsebo 24 15 6 12 5 2 2 20 27
Qualification ACIS CA PhD BSc Eng. CA PhD BSc Eng. CA n.a. BTech MBA
Countriesworking in 15 15 10 15 10 9 12 15 5
D Thobye B Doran R van der Zwan Ken Fussell W Gould D Govender A McElnea G Maina J Tuck
HR Director CFO – Int. MarketingDirector
COO –Catering CEO – Energy CPO COO – FS GM – East
AfricaNat Ops Dir –
Clearing
Years at Tsebo 5 3 7 27 22 2 14 15 19
Qualification BA CA BSocSc, MBA N. Dip PrEng. BCom N. Dip, MBA EDP (GiBS) BA N.Dip, BCom
Countriesworking in 5 30 20 10 5 26 10 5 1
Average tenure at Tsebo: 13 Years
Average age: 49 Years
28 on executive payroll
Average countries worked in: 10
Average qualification: Post
Graduate
Source: Company information
8Tsebo - Wendel Investor Day | December 1, 2016
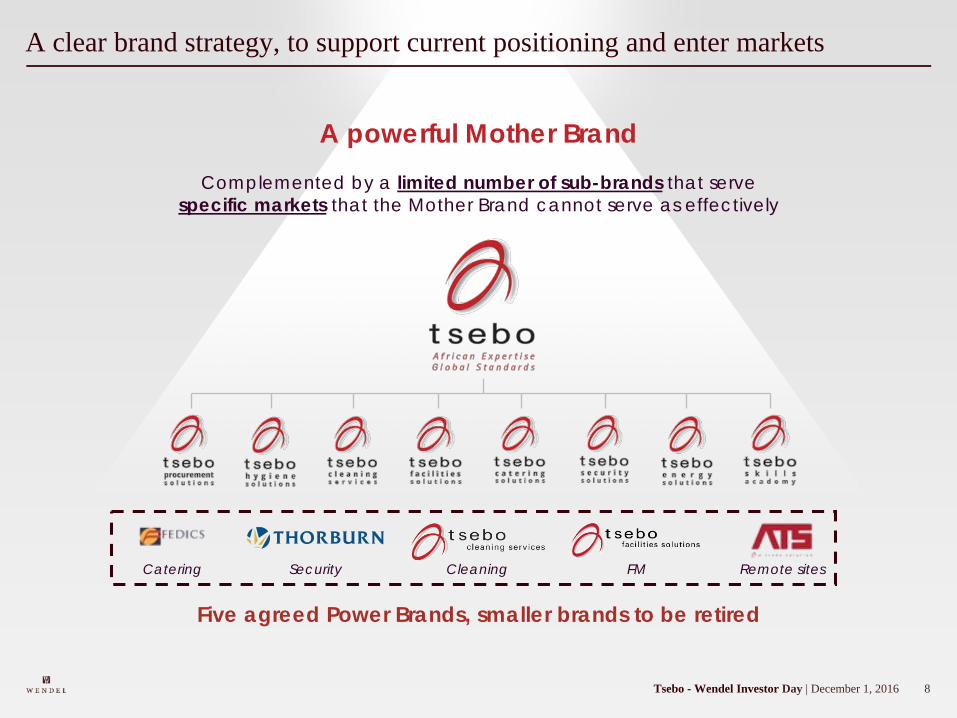
A clear brand strategy, to support current positioning and enter markets
A powerful Mother BrandComplemented by a limited number of sub-brands that serve
specific markets that the Mother Brand cannot serve as effectively
Five agreed Power Brands, smaller brands to be retired
Catering Security Cleaning FM Remote sites
9Tsebo - Wendel Investor Day | December 1, 2016
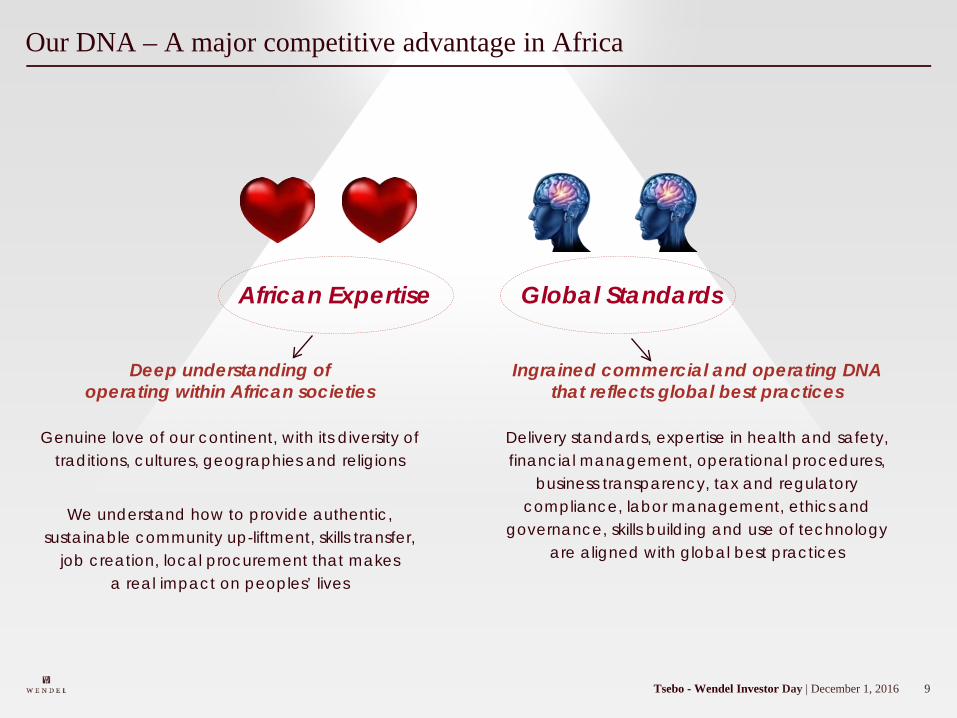
Our DNA – A major competitive advantage in Africa
Ingrained commercial and operating DNA that reflects global best practices
African Expertise Global Standards
Deep understanding of operating within African societies
Genuine love of our continent, with its diversity of traditions, cultures, geographies and religions
We understand how to provide authentic, sustainable community up-liftment, skills transfer,
job creation, local procurement that makes a real impact on peoples’ lives
Delivery standards, expertise in health and safety, financial management, operational procedures,
business transparency, tax and regulatory compliance, labor management, ethics and
governance, skills building and use of technology are aligned with global best practices
10Tsebo - Wendel Investor Day | December 1, 2016
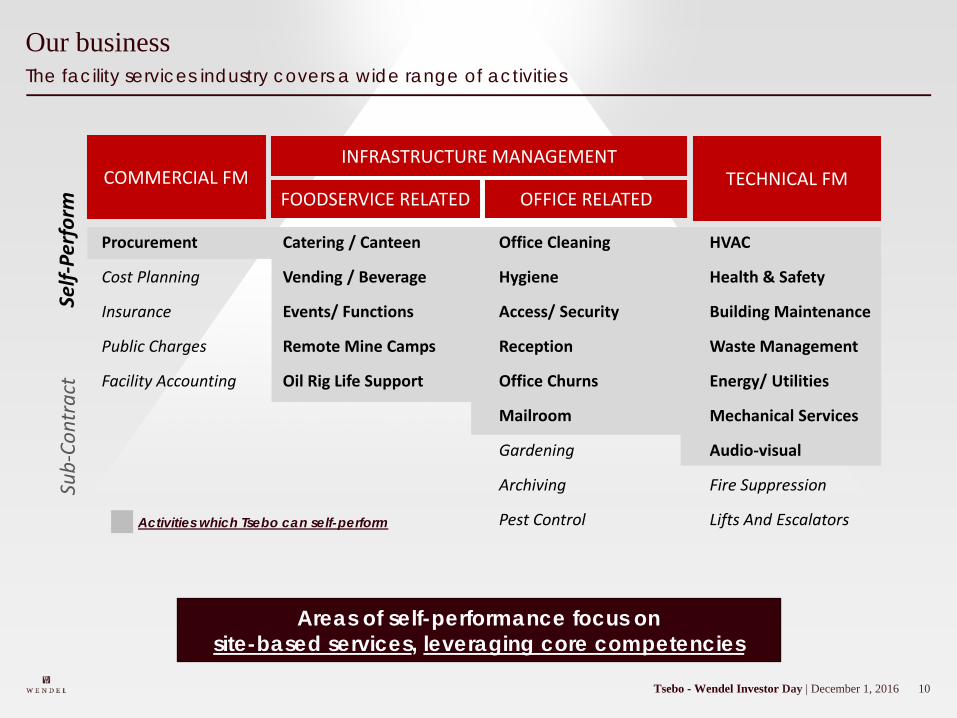
The facility services industry covers a wide range of activitiesOur business
Activities which Tsebo can self-perform
COMMERCIAL FMFOODSERVICE RELATED OFFICE RELATED
TECHNICAL FM INFRASTRUCTURE MANAGEMENT
Procurement
Cost Planning
Insurance
Public Charges
Facility Accounting
Catering / Canteen
Vending / Beverage
Events/ Functions
Remote Mine Camps
Oil Rig Life Support
Office Cleaning
Hygiene
Access/ Security
Reception
Office Churns
Mailroom
Gardening
Archiving
Pest Control
HVAC
Health & Safety
Building Maintenance
Waste Management
Energy/ Utilities
Mechanical Services
Audio-visual
Fire Suppression
Lifts And Escalators
Self-
Perf
orm
Su
b-Co
ntra
ct
Areas of self-performance focus on site-based services, leveraging core competencies
11Tsebo - Wendel Investor Day | December 1, 2016
Our value proposition and our clients
Operational Risk, Complexity and Cost
ProductivityTransparencyCompliance
Ease of Doing Business
"The company behind the best companies in Africa"
Our Value Proposition
…by increasing
…and decreasing
We improve…
Some of our clients
12Tsebo - Wendel Investor Day | December 1, 2016
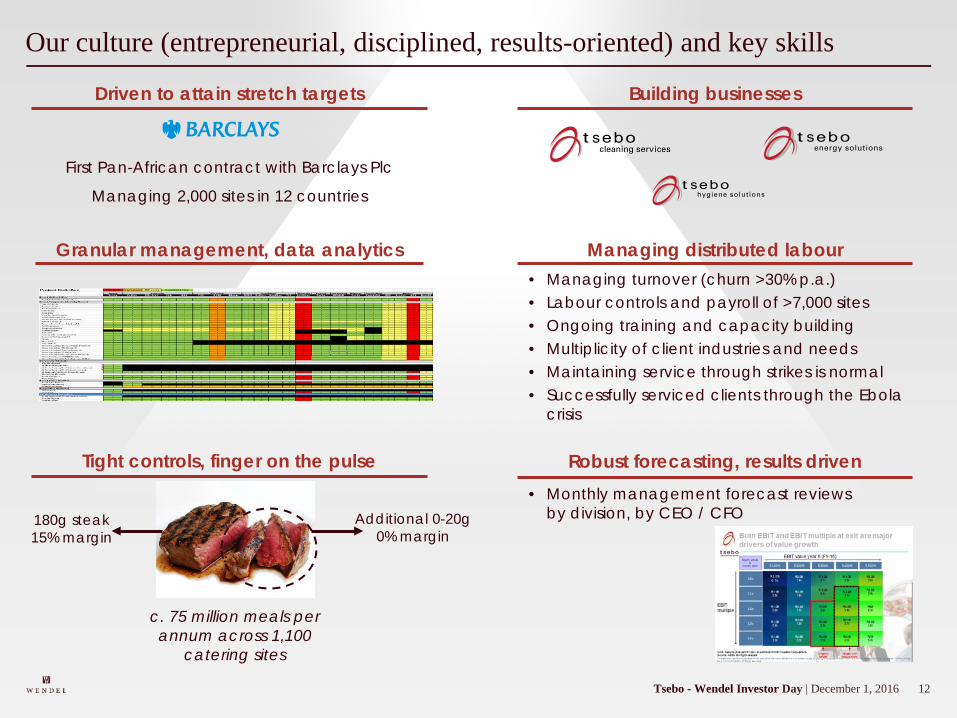
• Monthly management forecast reviews by division, by CEO / CFO
Our culture (entrepreneurial, disciplined, results-oriented) and key skills
First Pan-African contract with Barclays Plc
Managing 2,000 sites in 12 countries
Driven to attain stretch targets Building businesses
Granular management, data analytics
Tight controls, finger on the pulse
180g steak15% margin
Additional 0-20g 0% margin
Robust forecasting, results driven
Managing distributed labour• Managing turnover (churn >30% p.a.)• Labour controls and payroll of >7,000 sites• Ongoing training and capacity building• Multiplicity of client industries and needs• Maintaining service through strikes is normal• Successfully serviced clients through the Ebola
crisis
c. 75 million meals per annum across 1,100
catering sites
13Tsebo - Wendel Investor Day | December 1, 2016
Corporate Governance and risk management are an integral part of our DNA
Comprehensive risk matrix developed and managed
Corporate governance and risk management approacho Zero tolerance policyo Annual risk review
ABACo UK Bribery Acto US Foreign Corrupt Practices Acto RSA Prevention and Combating of Corrupto Practices Act – Venus modelled on UK Acto Status of ABAC strategy
Ethicso Employee accountability and tip-off hotlineo Code of ethics and good business practice
Audit Regulatory environment
14Tsebo - Wendel Investor Day | December 1, 2016
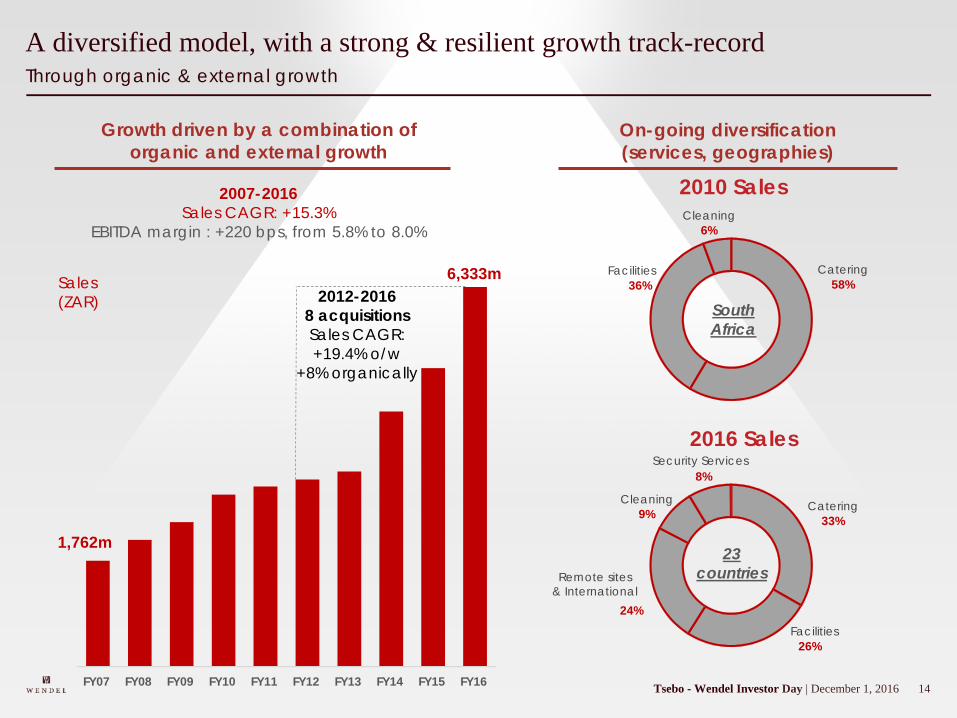
Through organic & external growthA diversified model, with a strong & resilient growth track-record
2012-20168 acquisitions Sales CAGR: +19.4% o/w
+8% organically
Growth driven by a combination of organic and external growth
2016 Sales
2010 Sales
1,762m
Sales (ZAR)
6,333m
FY07 FY08 FY09 FY10 FY11 FY12 FY13 FY14 FY15 FY16
2007-2016Sales CAGR: +15.3%
EBITDA margin : +220 bps, from 5.8% to 8.0%
SouthAfrica
23countries
Catering33%
Facilities26%
Remote sites & International
24%
Cleaning9%
Security Services8%
Catering58%
Facilities36%
Cleaning6%
On-going diversification(services, geographies)
15Tsebo - Wendel Investor Day | December 1, 2016
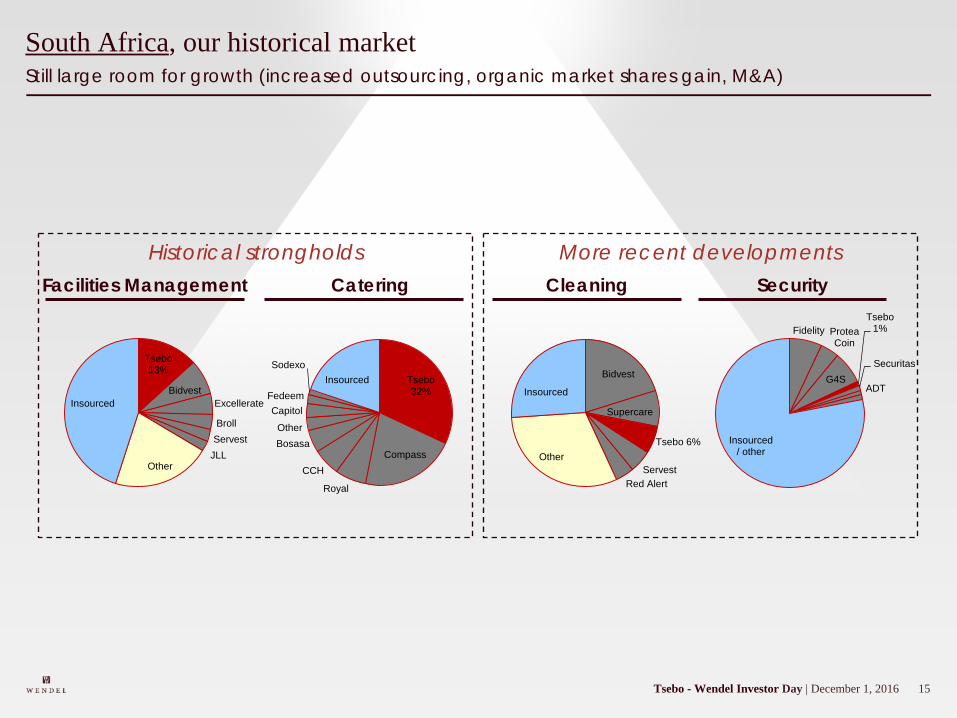
Still large room for growth (increased outsourcing, organic market shares gain, M&A)South Africa, our historical market
Catering CleaningFacilities Management Security
Tsebo13%
Bidvest
Excellerate
Broll
Servest
JLLOther
Insourced
Fidelity Protea Coin
G4S
Tsebo1%
Securitas
ADT
Insourced/ other
Bidvest
Supercare
Tsebo 6%
Servest
Red Alert
Other
Insourced
Tsebo32%
Compass
Royal
CCH
Bosasa
Other
Capitol
Fedeem
Sodexo
Insourced
Historical strongholds More recent developments
16Tsebo - Wendel Investor Day | December 1, 2016
Rest of Africa: our investment thesis
(1) Period ended March 31, 2016
Strong macro fundamentals, urbanization and increased consumer spending attracting our global customers into Africa and developing local markets
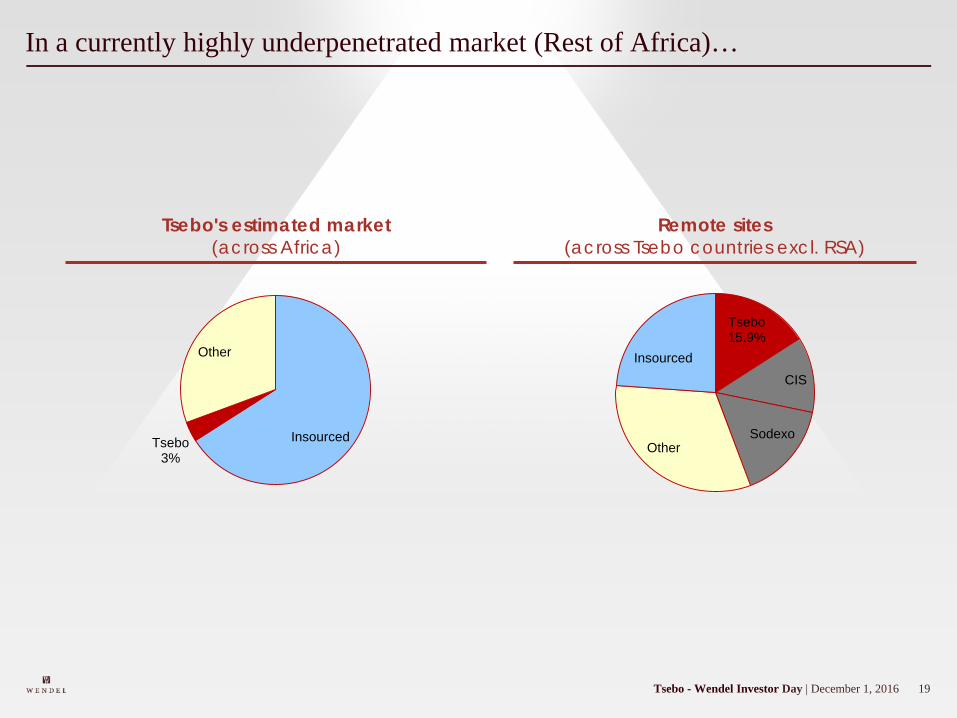
In a currently highly underpenetrated market (>2/3 insourced), Tsebo is already a leader and ideally positioned to capture the opportunity
These global customers are seeking global solutions; all are seeking less complexity, enhanced compliance and productivity
17Tsebo - Wendel Investor Day | December 1, 2016
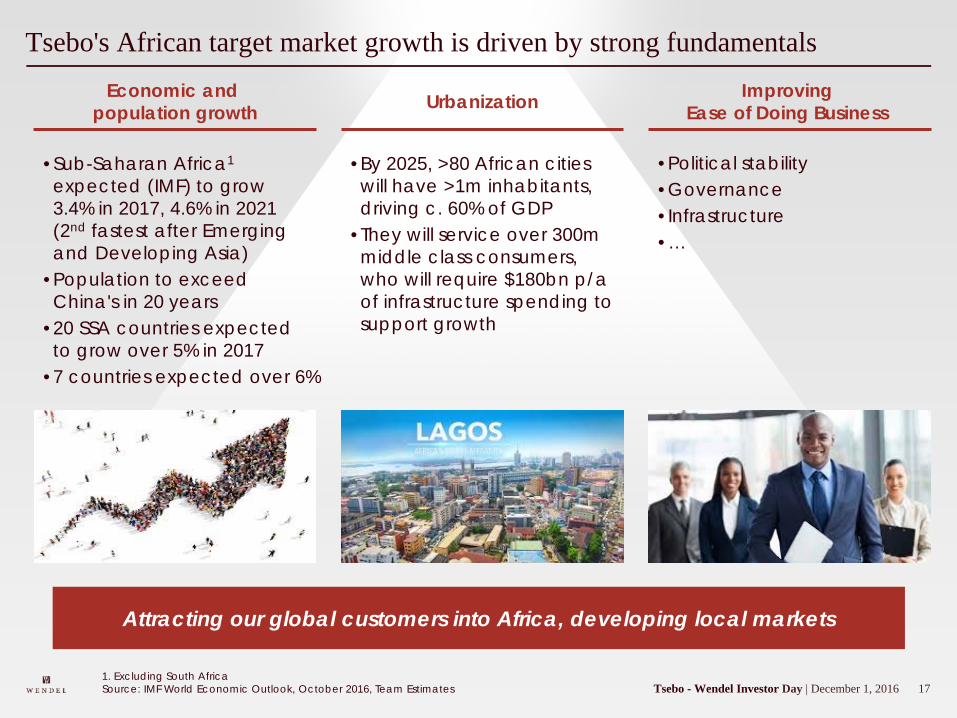
Tsebo's African target market growth is driven by strong fundamentals
1. Excluding South AfricaSource: IMF World Economic Outlook, October 2016, Team Estimates
Economic and population growth Urbanization
• Sub-Saharan Africa1
expected (IMF) to grow 3.4% in 2017, 4.6% in 2021 (2nd fastest after Emerging and Developing Asia)
• Population to exceed China's in 20 years
• 20 SSA countries expected to grow over 5% in 2017
• 7 countries expected over 6%
• By 2025, >80 African cities will have >1m inhabitants, driving c. 60% of GDP
• They will service over 300m middle class consumers, who will require $180bn p/a of infrastructure spending to support growth
• Political stability• Governance• Infrastructure• …
Attracting our global customers into Africa, developing local markets
Improving Ease of Doing Business
18Tsebo - Wendel Investor Day | December 1, 2016
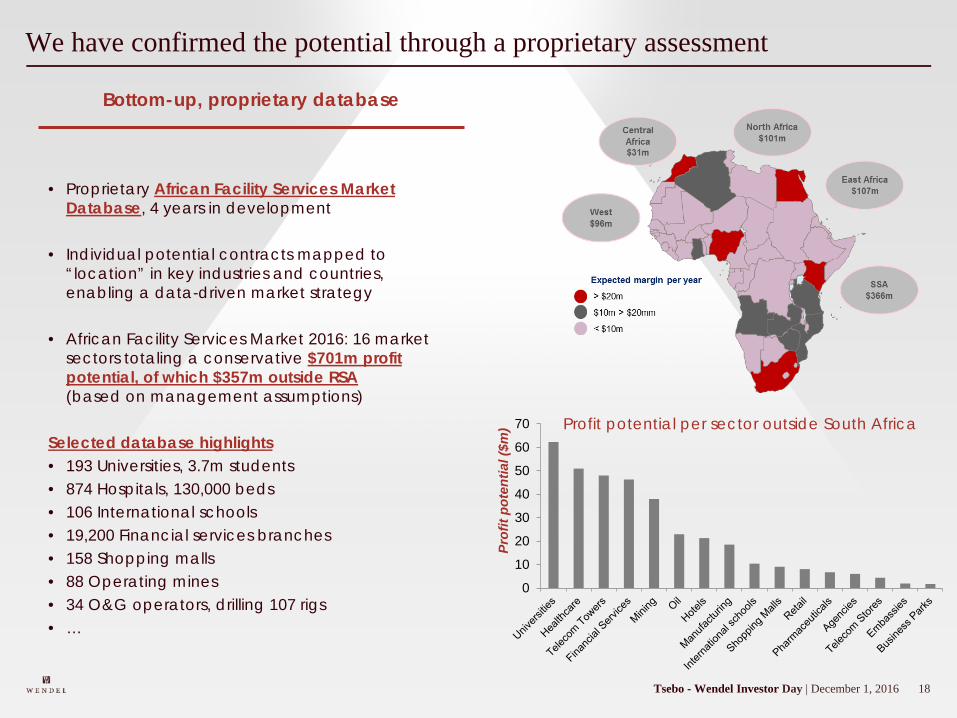
We have confirmed the potential through a proprietary assessment
Bottom-up, proprietary database
• Proprietary African Facility Services Market Database, 4 years in development
• Individual potential contracts mapped to “location” in key industries and countries, enabling a data-driven market strategy
• African Facility Services Market 2016: 16 market sectors totaling a conservative $701m profit potential, of which $357m outside RSA (based on management assumptions)
Selected database highlights • 193 Universities, 3.7m students • 874 Hospitals, 130,000 beds • 106 International schools• 19,200 Financial services branches • 158 Shopping malls • 88 Operating mines • 34 O&G operators, drilling 107 rigs • …
Profit potential per sector outside South Africa
0
10
20
30
40
50
60
70
Prof
it po
tent
ial (
$m)
19Tsebo - Wendel Investor Day | December 1, 2016
In a currently highly underpenetrated market (Rest of Africa)…
Tsebo's estimated market(across Africa)
Remote sites(across Tsebo countries excl. RSA)
InsourcedTsebo3%
Other
Tsebo15.9%
CIS
SodexoOther
Insourced
20Tsebo - Wendel Investor Day | December 1, 2016
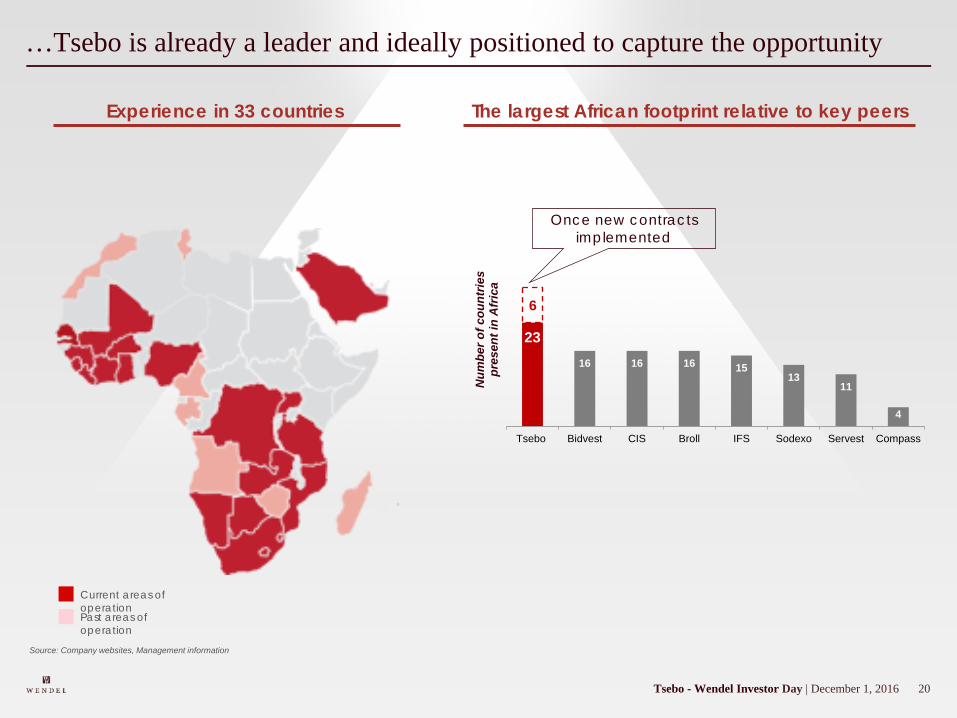
…Tsebo is already a leader and ideally positioned to capture the opportunity
Current areas of operationPast areas of operation
Source: Company websites, Management information
23
16 16 16 1513
11
4
Tsebo Bidvest CIS Broll IFS Sodexo Servest Compass
Num
ber o
f cou
ntrie
s pr
esen
t in
Afr
ica
6
Once new contracts implemented
Experience in 33 countries The largest African footprint relative to key peers
21Tsebo - Wendel Investor Day | December 1, 2016
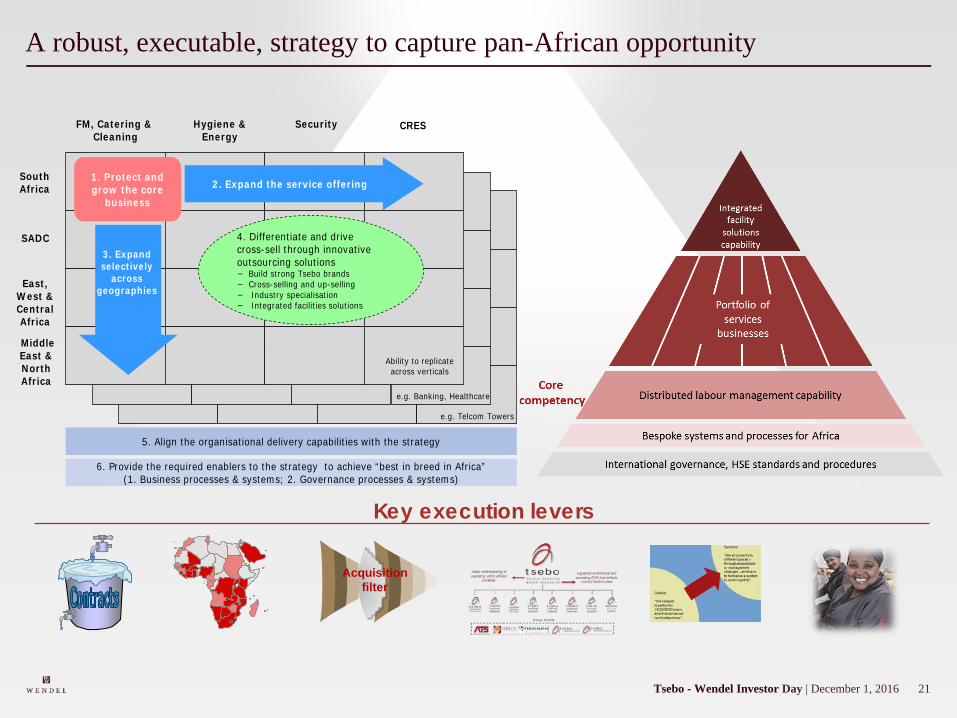
A robust, executable, strategy to capture pan-African opportunity
Key execution levers
Acquisition
filter
FM, Catering & Cleaning
South Africa
1. Protect and grow the core
business2. Expand the service offering
3. Expand selectively
across geographies
5. Align the organisational delivery capabilities with the strategy
6. Provide the required enablers to the strategy to achieve “best in breed in Africa”(1. Business processes & systems; 2. Governance processes & systems)
4. Differentiate and drive cross-sell through innovative outsourcing solutions− Build strong Tsebo brands − Cross-selling and up-selling − Industry specialisation− Integrated facilities solutions
Ability to replicate across verticals
e.g. Banking, Healthcare
e.g. Telcom Towers
Hygiene & Energy
Security CRES
SADC
East, West & Central Africa
Middle East & North Africa
22Tsebo - Wendel Investor Day | December 1, 2016
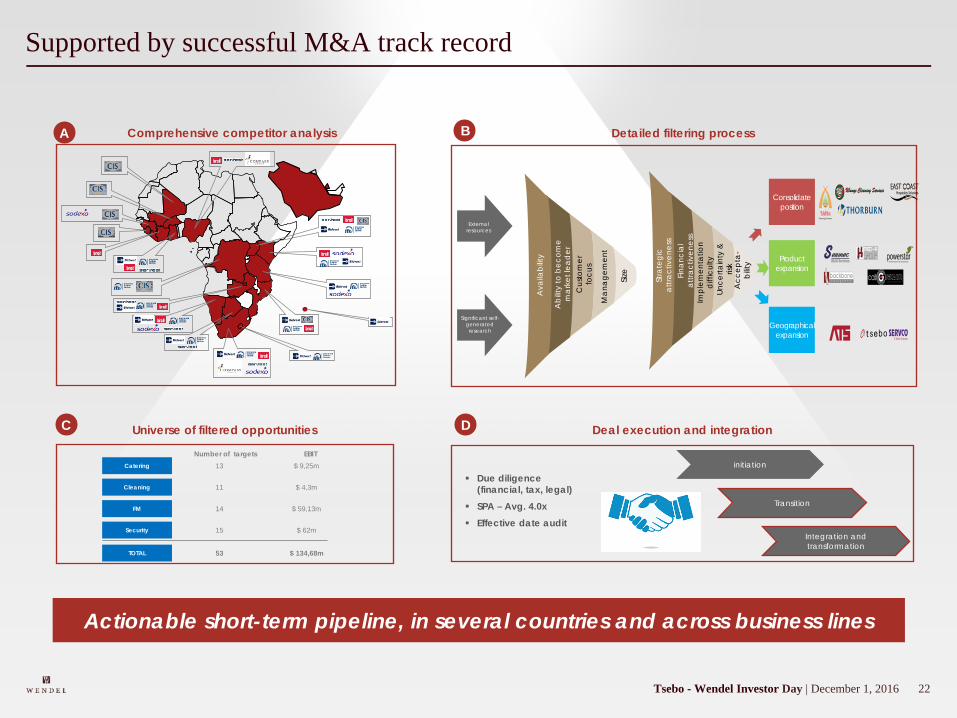
Supported by successful M&A track record
Universe of filtered opportunities
Comprehensive competitor analysis Detailed filtering process
Integration and transformation
Transition
Due diligence (financial, tax, legal)
SPA – Avg. 4.0x Effective date audit
Deal execution and integration
A B
C D
initiationCatering 13 $ 9,25m
Cleaning 11 $ 4,3m
FM 14 $ 59,13m
Security 15 $ 62m
Number of targets EBIT
TOTAL 53 $ 134,68m
External resources
Significant self-generated research
Stra
tegi
c at
tract
iven
ess
Finan
cial
at
tract
iven
ess
Impl
emen
tatio
n d
iffic
ulty
Unce
rtain
ty &
ris
kA
ccep
ta-
bilit
y
Cus
tom
er
focu
s
Abi
lity
to b
ecom
e m
arke
t lea
der
Size
Ava
ilabi
lity
Man
agem
ent
Consolidate position
Product expansion
Geographical expansion
Actionable short-term pipeline, in several countries and across business lines
23Tsebo - Wendel Investor Day | December 1, 2016
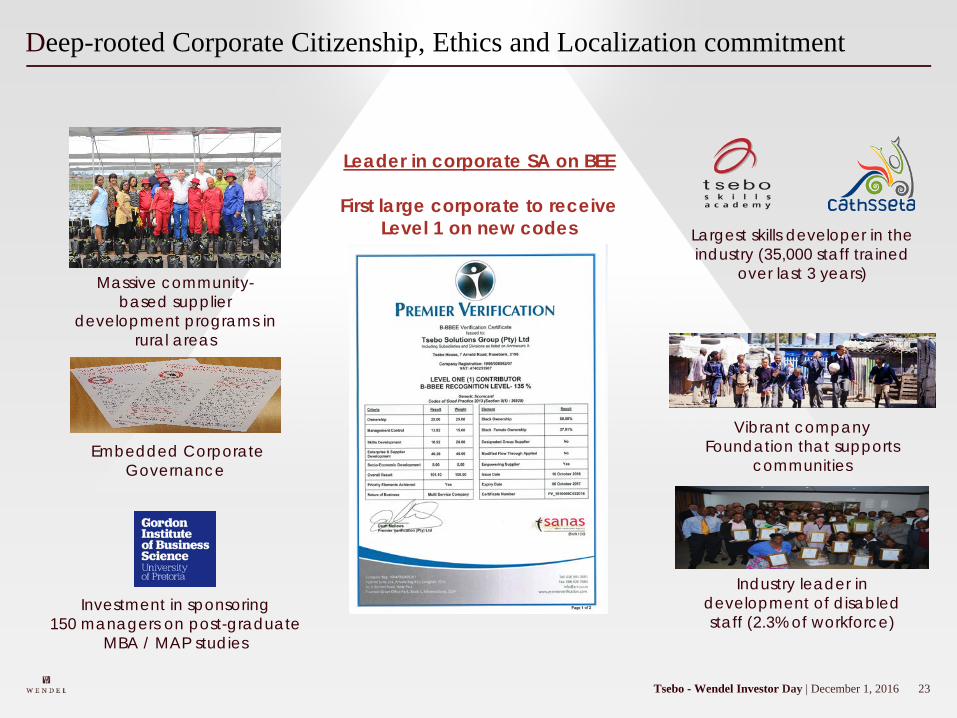
Deep-rooted Corporate Citizenship, Ethics and Localization commitment
Investment in sponsoring 150 managers on post-graduate
MBA / MAP studies
Massive community-based supplier
development programs in rural areas
Industry leader in development of disabled staff (2.3% of workforce)
Vibrant company Foundation that supports
communities
Leader in corporate SA on BEE
First large corporate to receive Level 1 on new codes Largest skills developer in the
industry (35,000 staff trained over last 3 years)
Embedded Corporate Governance
24Tsebo - Wendel Investor Day | December 1, 2016
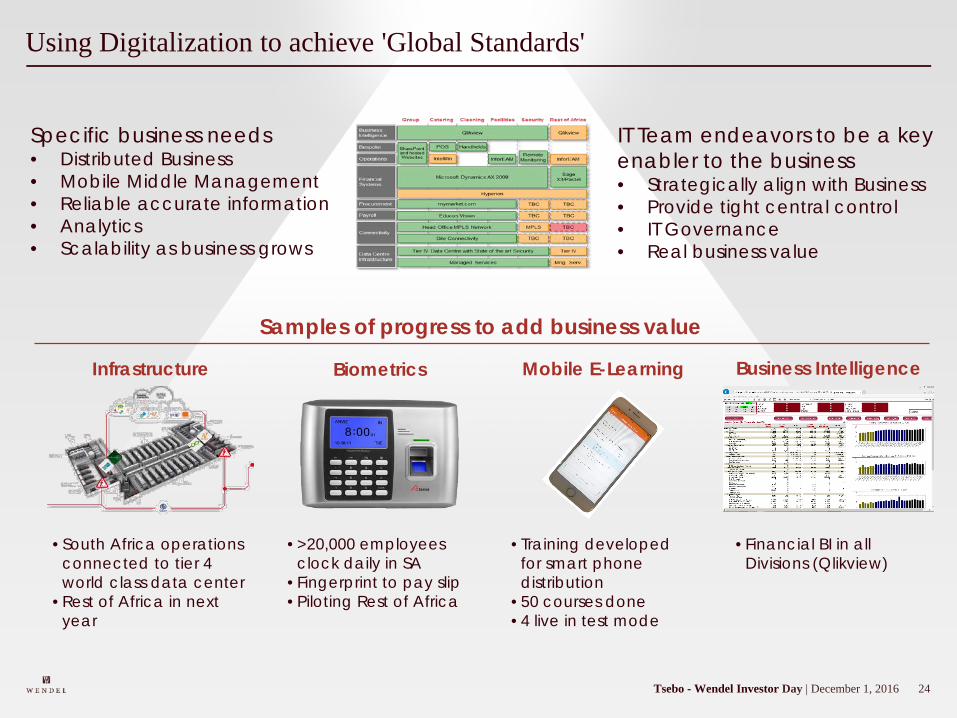
Using Digitalization to achieve 'Global Standards'
Specific business needs• Distributed Business• Mobile Middle Management• Reliable accurate information• Analytics • Scalability as business grows
IT Team endeavors to be a key enabler to the business• Strategically align with Business• Provide tight central control• IT Governance• Real business value
Samples of progress to add business value
Biometrics
• South Africa operations connected to tier 4 world class data center
• Rest of Africa in next year
Mobile E-Learning Business IntelligenceInfrastructure
• >20,000 employees clock daily in SA
• Fingerprint to pay slip• Piloting Rest of Africa
• Training developed for smart phone distribution
• 50 courses done• 4 live in test mode
Picture
• Financial BI in all Divisions (Qlikview)
25Tsebo - Wendel Investor Day | December 1, 2016
Key takeaways
African facility services market, a large, fragmented and growing market, thus we have huge potential to sell, consolidate and replicate
Tsebo is ideally positioned to capture an important share of this growth through organic and acquisitive growth
Tsebo has crafted pan-African leadership position, and built a robust platform with the largest footprint in the industry
Investment in brands, culture, systems and the consolidation engine are supported by strong cash generation and a stable, passionate team
The team is excited to continue the journey with international shareholders of reference
The key to success is the careful prioritization of limited resourcesto unlock the potential

26IHS - Wendel Investor Day | December 1, 2016
Investor DayDecember 1, 2016
0Allied Universal - Wendel Investor Day | December 1, 2016
Allied Universal
• Well-known American player of security services with a nationwide footprint
• Outstanding platform for consolidation
• Resilient growth and high cash flows
• High quality services & strongcredibility in the market
Capitalize on a very strong megatrend in America:
organic growth & consolidationof the security services market
$300m equity invested
c. 33% equity stake
co-control with Warburg-Pincus
1Allied Universal - Wendel Investor Day | December 1, 2016
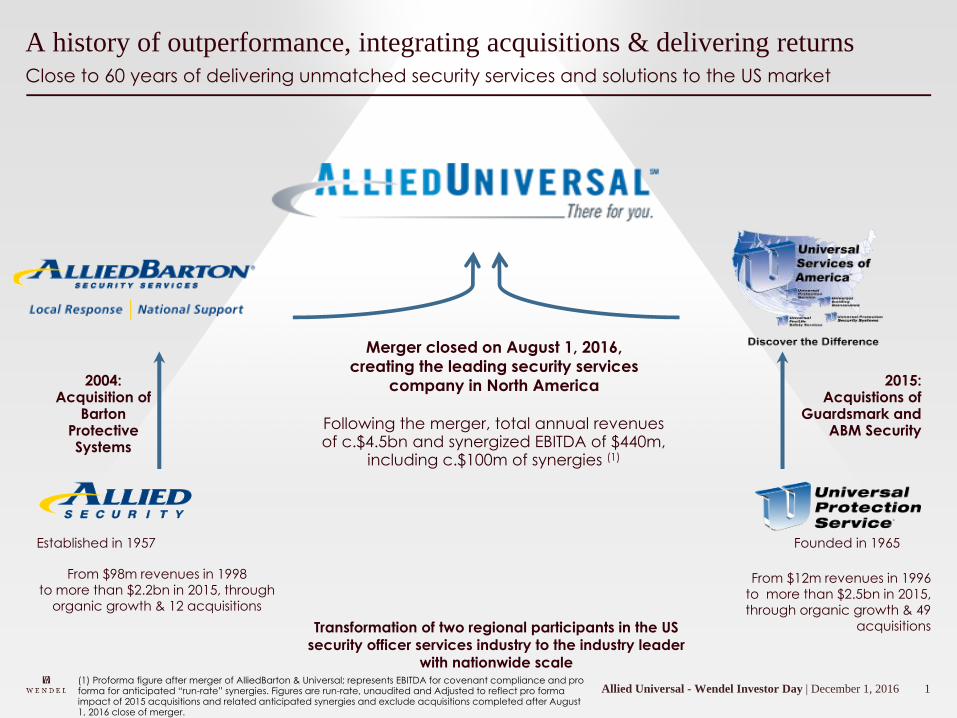
Close to 60 years of delivering unmatched security services and solutions to the US market
A history of outperformance, integrating acquisitions & delivering returns
Transformation of two regional participants in the US
security officer services industry to the industry leader
with nationwide scale
Founded in 1965
From $12m revenues in 1996
to more than $2.5bn in 2015,
through organic growth & 49
acquisitions
Established in 1957
From $98m revenues in 1998
to more than $2.2bn in 2015, through
organic growth & 12 acquisitions
Merger closed on August 1, 2016,
creating the leading security services
company in North America2004:Acquisition of
Barton Protective Systems
2015:Acquistions of
Guardsmark and ABM SecurityFollowing the merger, total annual revenues
of c.$4.5bn and synergized EBITDA of $440m, including c.$100m of synergies (1)
(1) Proforma figure after merger of AlliedBarton & Universal; represents EBITDA for covenant compliance and pro forma for anticipated “run-rate” synergies. Figures are run-rate, unaudited and Adjusted to reflect pro forma impact of 2015 acquisitions and related anticipated synergies and exclude acquisitions completed after August 1, 2016 close of merger.
2Allied Universal - Wendel Investor Day | December 1, 2016
Steve Jones–CEO of Allied Universal
Steve Jones joined Universal Services of America in 1996
Past experience at large, national services companies including executive level positions at two Fortune 500 companies
E&Y Entrepreneur of the Year and Vistage International Leadership Award winner
BA in Political Science, California Polytechnic University; MBA, University of Redlands
3Allied Universal - Wendel Investor Day | December 1, 2016
Allied Universal Steve Jones - CEO
4Allied Universal - Wendel Investor Day | December 1, 2016
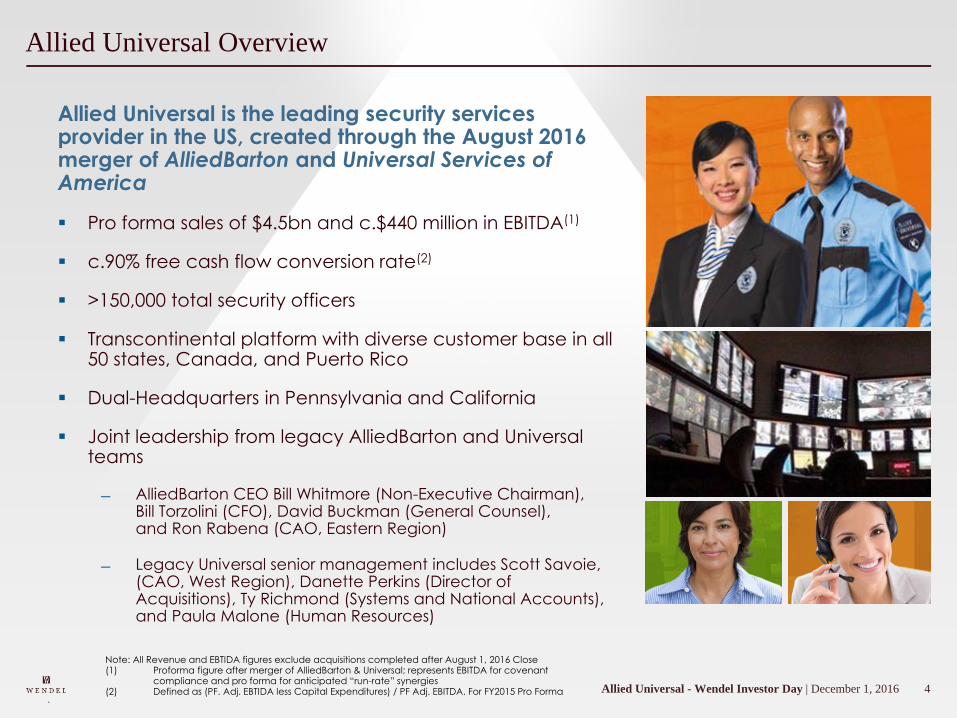
Allied Universal Overview
Allied Universal is the leading security services provider in the US, created through the August 2016 merger of AlliedBarton and Universal Services of America
Pro forma sales of $4.5bn and c.$440 million in EBITDA(1)
c.90% free cash flow conversion rate(2)
>150,000 total security officers
Transcontinental platform with diverse customer base in all 50 states, Canada, and Puerto Rico
Dual-Headquarters in Pennsylvania and California
Joint leadership from legacy AlliedBarton and Universal teams
AlliedBarton CEO Bill Whitmore (Non-Executive Chairman), Bill Torzolini (CFO), David Buckman (General Counsel), and Ron Rabena (CAO, Eastern Region)
Legacy Universal senior management includes Scott Savoie, (CAO, West Region), Danette Perkins (Director of Acquisitions), Ty Richmond (Systems and National Accounts), and Paula Malone (Human Resources)
.
Note: All Revenue and EBTIDA figures exclude acquisitions completed after August 1, 2016 Close(1) Proforma figure after merger of AlliedBarton & Universal; represents EBITDA for covenant
compliance and pro forma for anticipated “run-rate” synergies (2) Defined as (PF. Adj. EBTIDA less Capital Expenditures) / PF Adj. EBITDA. For FY2015 Pro Forma
5Allied Universal - Wendel Investor Day | December 1, 2016
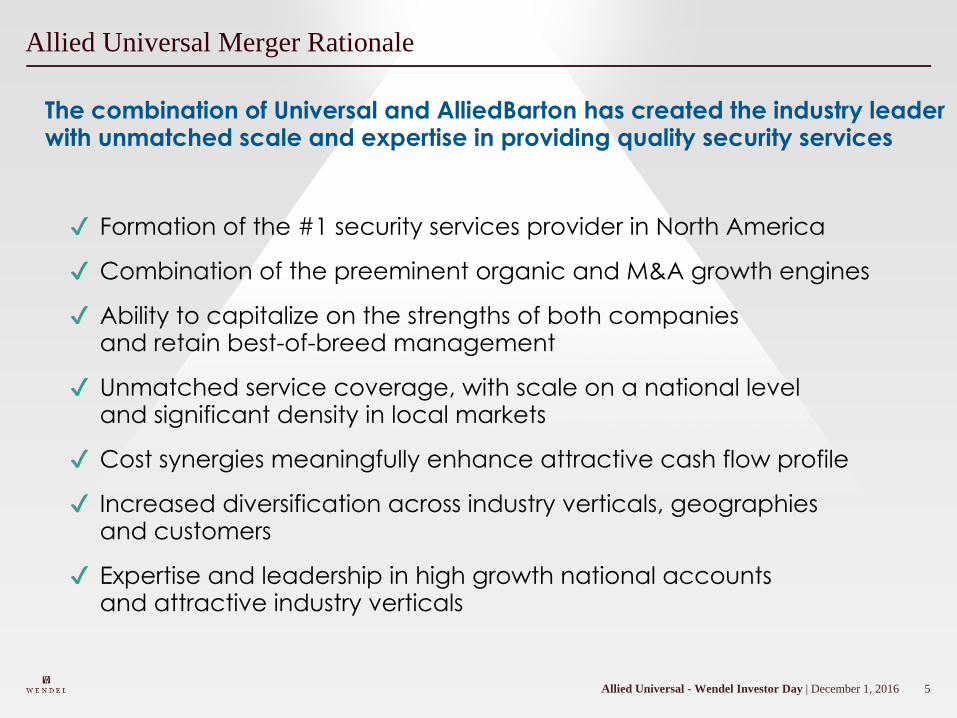
Allied Universal Merger Rationale
The combination of Universal and AlliedBarton has created the industry leader with unmatched scale and expertise in providing quality security services
✔ Formation of the #1 security services provider in North America
✔ Combination of the preeminent organic and M&A growth engines
✔ Ability to capitalize on the strengths of both companies and retain best-of-breed management
✔ Unmatched service coverage, with scale on a national level and significant density in local markets
✔ Cost synergies meaningfully enhance attractive cash flow profile
✔ Increased diversification across industry verticals, geographies and customers
✔ Expertise and leadership in high growth national accounts and attractive industry verticals
6Allied Universal - Wendel Investor Day | December 1, 2016
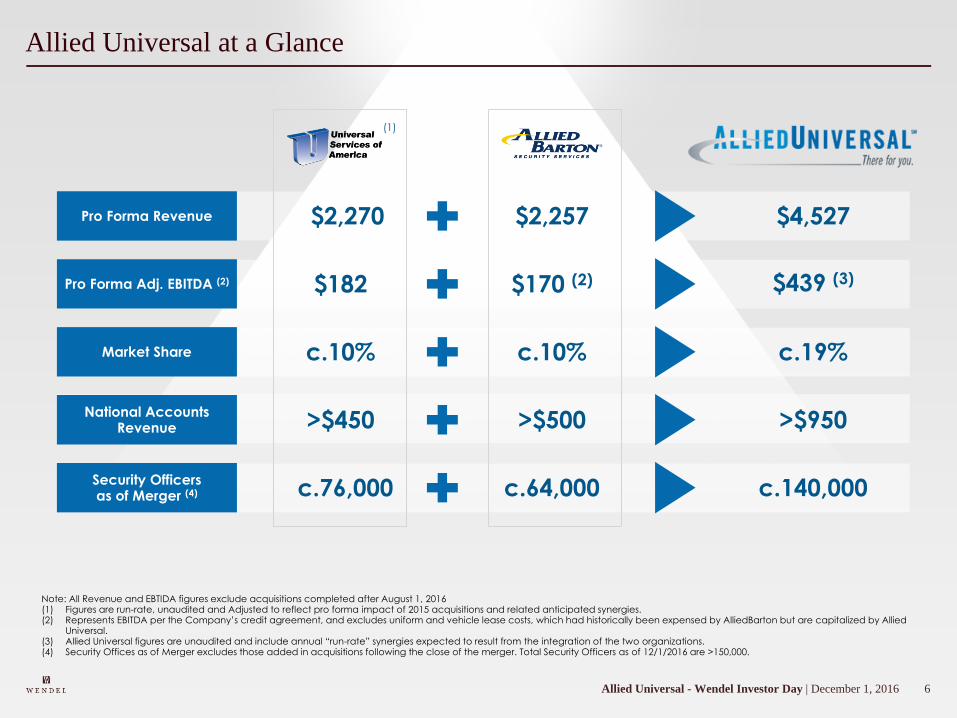
Allied Universal at a Glance
Pro Forma Revenue $2,270 $2,257 $4,527
Pro Forma Adj. EBITDA (2) $182 $170 (2) $439 (3)
Market Share c.10% c.10% c.19%
National Accounts Revenue >$450 >$500 >$950
Security Officers as of Merger (4) c.76,000 c.64,000 c.140,000
Note: All Revenue and EBTIDA figures exclude acquisitions completed after August 1, 2016(1) Figures are run-rate, unaudited and Adjusted to reflect pro forma impact of 2015 acquisitions and related anticipated synergies.(2) Represents EBITDA per the Company’s credit agreement, and excludes uniform and vehicle lease costs, which had historically been expensed by AlliedBarton but are capitalized by Allied
Universal.(3) Allied Universal figures are unaudited and include annual “run-rate” synergies expected to result from the integration of the two organizations.(4) Security Offices as of Merger excludes those added in acquisitions following the close of the merger. Total Security Officers as of 12/1/2016 are >150,000.
(1)
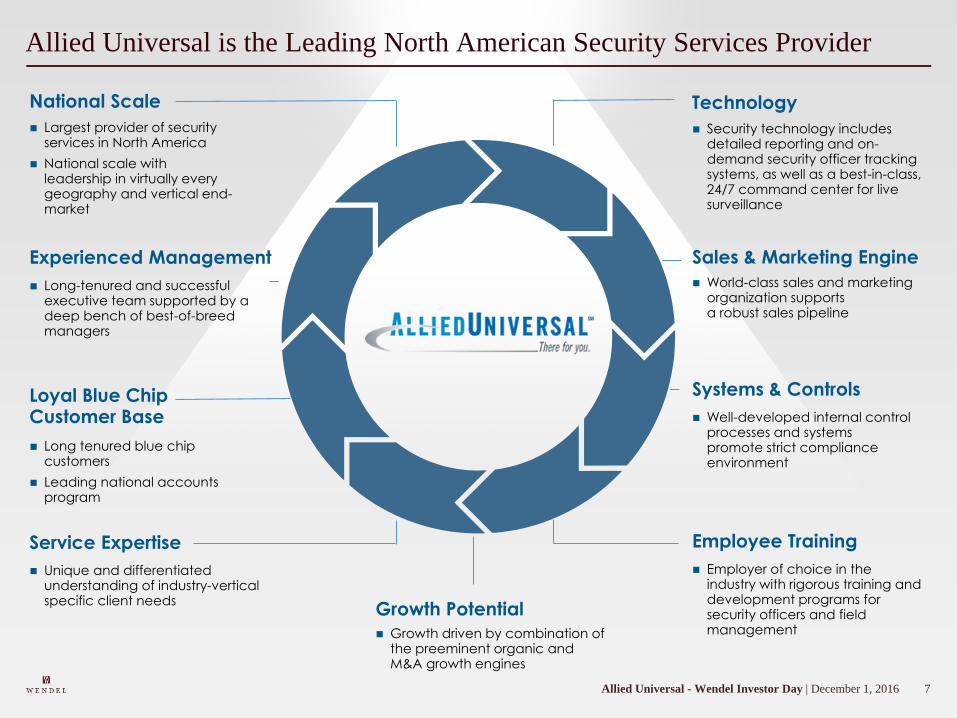
7Allied Universal - Wendel Investor Day | December 1, 2016
Allied Universal is the Leading North American Security Services Provider
National Scale
Experienced Management
Loyal Blue Chip Customer Base
Service Expertise
Largest provider of security services in North America
National scale withleadership in virtually every geography and vertical end-market
Long-tenured and successful executive team supported by a deep bench of best-of-breed managers
Long tenured blue chip customers
Leading national accounts program
Unique and differentiated understanding of industry-vertical specific client needs
Security technology includes detailed reporting and on-demand security officer tracking systems, as well as a best-in-class, 24/7 command center for live surveillance
World-class sales and marketing organization supports a robust sales pipeline
Well-developed internal control processes and systems promote strict compliance environment
Employer of choice in the industry with rigorous training and development programs for security officers and field management
Technology
Sales & Marketing Engine
Employee Training
Systems & Controls
Growth driven by combination of the preeminent organic and M&A growth engines
Growth Potential
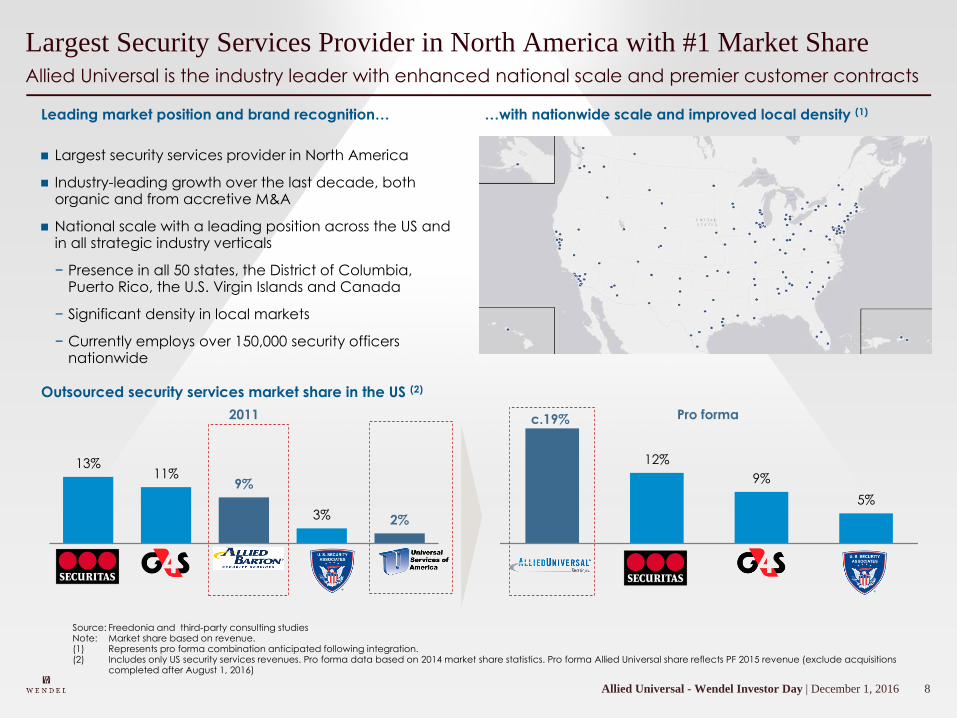
8Allied Universal - Wendel Investor Day | December 1, 2016
Allied Universal is the industry leader with enhanced national scale and premier customer contracts
Largest Security Services Provider in North America with #1 Market Share
Outsourced security services market share in the US (2)
13%11%
9%
3% 2%
12%
9%
5%
Largest security services provider in North America
Industry-leading growth over the last decade, both organic and from accretive M&A
National scale with a leading position across the US and in all strategic industry verticals
− Presence in all 50 states, the District of Columbia, Puerto Rico, the U.S. Virgin Islands and Canada
− Significant density in local markets
− Currently employs over 150,000 security officers nationwide
2011 Pro forma
…with nationwide scale and improved local density (1)Leading market position and brand recognition…
Source: Freedonia and third-party consulting studiesNote: Market share based on revenue.(1) Represents pro forma combination anticipated following integration.(2) Includes only US security services revenues. Pro forma data based on 2014 market share statistics. Pro forma Allied Universal share reflects PF 2015 revenue (exclude acquisitions
completed after August 1, 2016)
c.19%
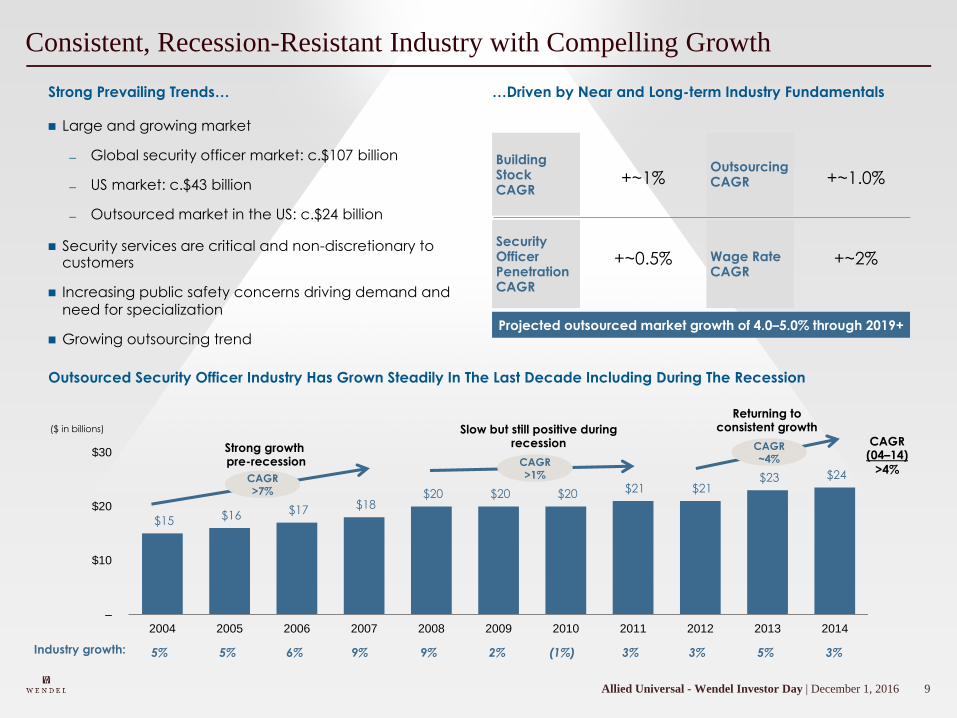
9Allied Universal - Wendel Investor Day | December 1, 2016
Consistent, Recession-Resistant Industry with Compelling Growth
Strong Prevailing Trends…
Outsourced Security Officer Industry Has Grown Steadily In The Last Decade Including During The Recession
Large and growing market
Global security officer market: c.$107 billion
US market: c.$43 billion
Outsourced market in the US: c.$24 billion
Security services are critical and non-discretionary to customers
Increasing public safety concerns driving demand and
need for specialization
Growing outsourcing trend
($ in billions)
$15 $16 $17 $18 $20 $20 $20 $21 $21
$23 $24
–
$10
$20
$30
2004 2005 2006 2007 2008 2009 2010 2011 2012 2013 2014
>4%
CAGR(04–14)
CAGR
>7%
Strong growth pre-recession
Slow but still positive during recession
Returning to consistent growth
CAGR
>1%
CAGR
~4%
5% 5% 6% 9% 9% 2% (1%) 3% 3% 5% 3%
…Driven by Near and Long-term Industry Fundamentals
Building StockCAGR
Security Officer PenetrationCAGR
OutsourcingCAGR
Wage RateCAGR
Projected outsourced market growth of 4.0–5.0% through 2019+
+~1% +~1.0%
+~0.5% +~2%
Industry growth:
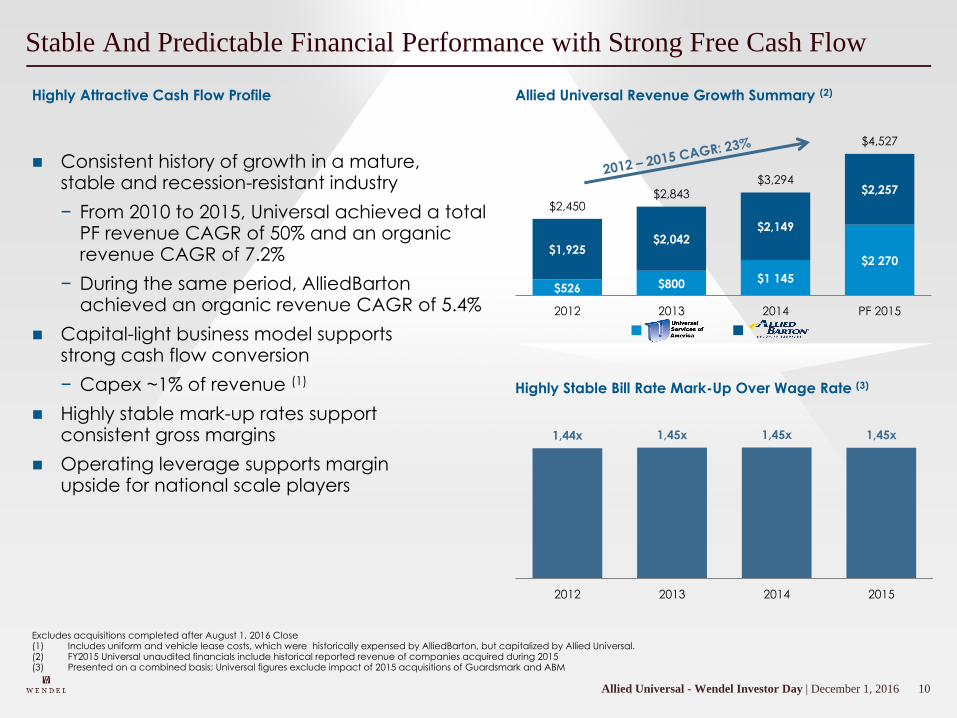
10Allied Universal - Wendel Investor Day | December 1, 2016
Stable And Predictable Financial Performance with Strong Free Cash Flow
$526 $800 $1 145
$2 270 $1,925
$2,042 $2,149
$2,257
$2,450 $2,843
$3,294
$4,527
2012 2013 2014 PF 2015
Highly Stable Bill Rate Mark-Up Over Wage Rate (3)
Allied Universal Revenue Growth Summary (2)
Consistent history of growth in a mature, stable and recession-resistant industry
− From 2010 to 2015, Universal achieved a total PF revenue CAGR of 50% and an organic revenue CAGR of 7.2%
− During the same period, AlliedBarton achieved an organic revenue CAGR of 5.4%
Capital-light business model supports strong cash flow conversion
− Capex ~1% of revenue (1)
Highly stable mark-up rates support consistent gross margins
Operating leverage supports margin upside for national scale players
Highly Attractive Cash Flow Profile
1,44x 1,45x 1,45x 1,45x
2012 2013 2014 2015
Excludes acquisitions completed after August 1, 2016 Close(1) Includes uniform and vehicle lease costs, which were historically expensed by AlliedBarton, but capitalized by Allied Universal.(2) FY2015 Universal unaudited financials include historical reported revenue of companies acquired during 2015(3) Presented on a combined basis; Universal figures exclude impact of 2015 acquisitions of Guardsmark and ABM
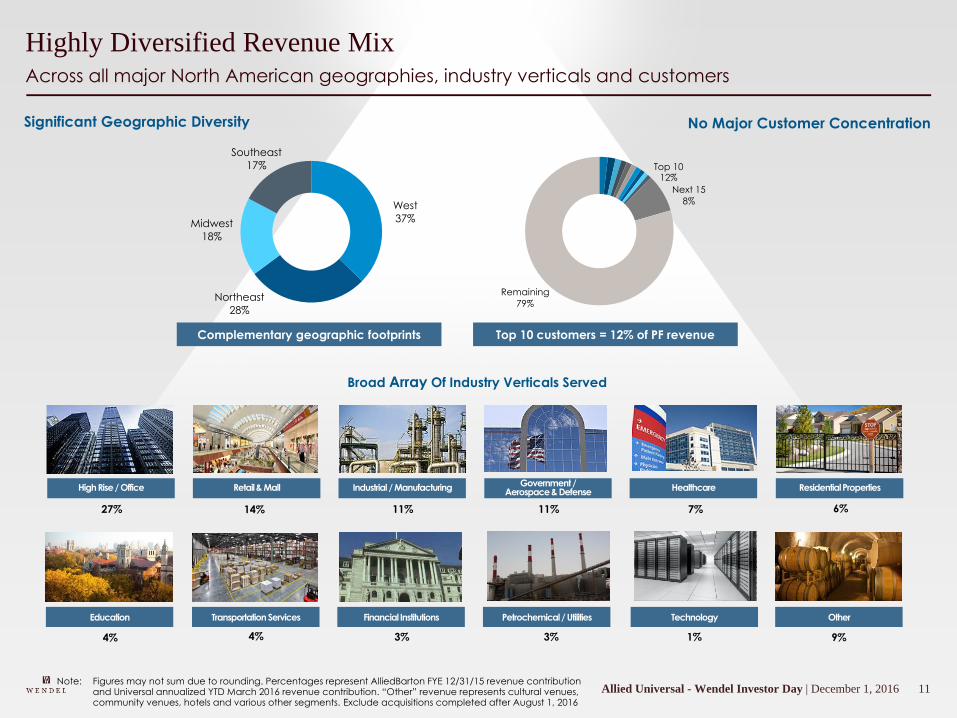
11Allied Universal - Wendel Investor Day | December 1, 2016
Across all major North American geographies, industry verticals and customers
Highly Diversified Revenue Mix
No Major Customer Concentration Significant Geographic Diversity
Broad Array Of Industry Verticals Served
Next 15
8%
Remaining
79%
West
37%
Northeast
28%
Midwest
18%
Southeast
17%
Education
4%
Industrial / Manufacturing
11%
High Rise / Office
27%
Petrochemical / Utilities
3%
Transportation Services
4%
Residential Properties
6%14%
Retail & Mall
Financial Institutions
3%
Healthcare
7%
Other
9%
Government / Aerospace & Defense
11%
Technology
1%
Top 1012%
Complementary geographic footprints Top 10 customers = 12% of PF revenue
Note: Figures may not sum due to rounding. Percentages represent AlliedBarton FYE 12/31/15 revenue contribution and Universal annualized YTD March 2016 revenue contribution. “Other” revenue represents cultural venues, community venues, hotels and various other segments. Exclude acquisitions completed after August 1, 2016
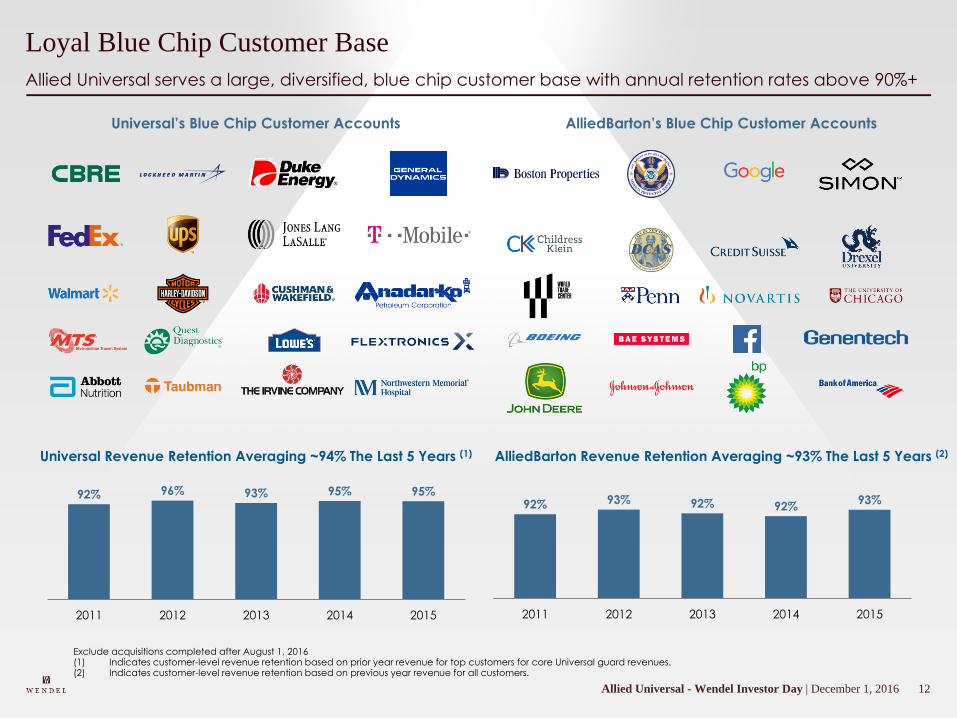
12Allied Universal - Wendel Investor Day | December 1, 2016
Allied Universal serves a large, diversified, blue chip customer base with annual retention rates above 90%+
Loyal Blue Chip Customer Base
AlliedBarton’s Blue Chip Customer AccountsUniversal’s Blue Chip Customer Accounts
AlliedBarton Revenue Retention Averaging ~93% The Last 5 Years (2)Universal Revenue Retention Averaging ~94% The Last 5 Years (1)
92% 96% 93% 95% 95%
2011 2012 2013 2014 2015
92% 93% 92% 92%93%
2011 2012 2013 2014 2015
Exclude acquisitions completed after August 1, 2016(1) Indicates customer-level revenue retention based on prior year revenue for top customers for core Universal guard revenues. (2) Indicates customer-level revenue retention based on previous year revenue for all customers.
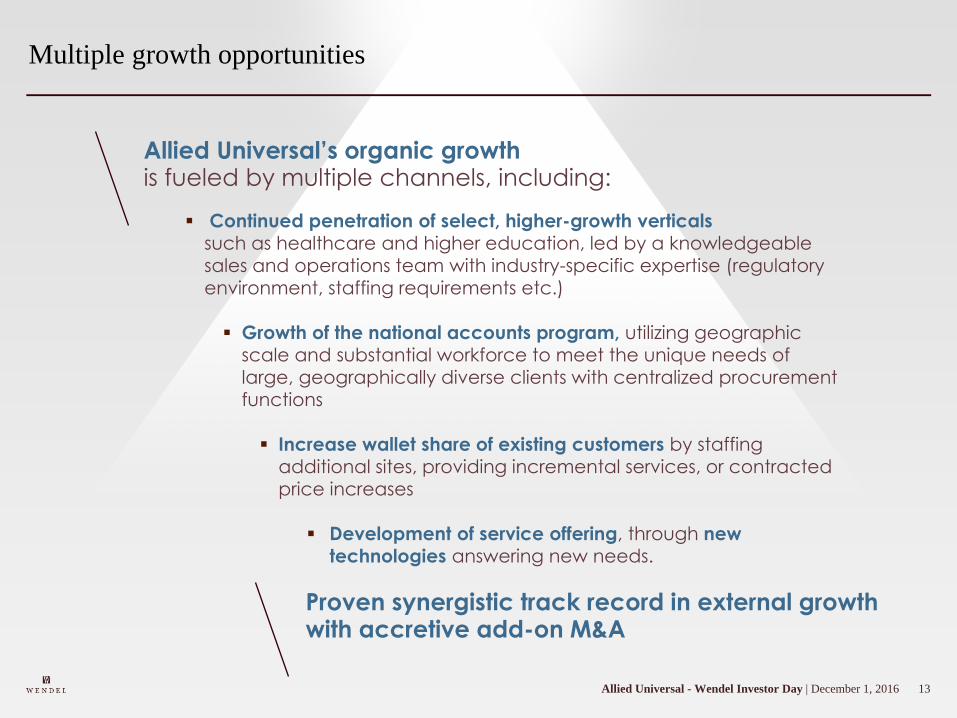
13Allied Universal - Wendel Investor Day | December 1, 2016
Multiple growth opportunities
Continued penetration of select, higher-growth verticals
such as healthcare and higher education, led by a knowledgeable
sales and operations team with industry-specific expertise (regulatory
environment, staffing requirements etc.)
Growth of the national accounts program, utilizing geographic
scale and substantial workforce to meet the unique needs of
large, geographically diverse clients with centralized procurement
functions
Increase wallet share of existing customers by staffing
additional sites, providing incremental services, or contracted
price increases
Development of service offering, through new
technologies answering new needs.
Allied Universal’s organic growth is fueled by multiple channels, including:
Proven synergistic track record in external growth with accretive add-on M&A
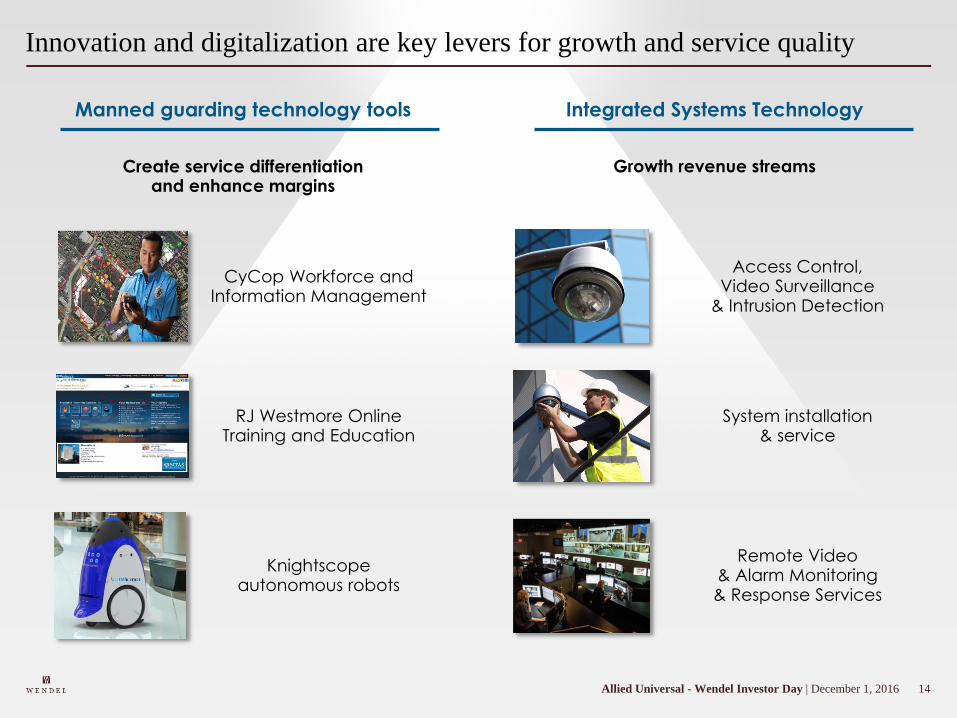
14Allied Universal - Wendel Investor Day | December 1, 2016
Innovation and digitalization are key levers for growth and service quality
Create service differentiation and enhance margins
Growth revenue streams
Manned guarding technology tools Integrated Systems Technology
CyCop Workforce and Information Management
RJ Westmore Online Training and Education
Knightscope autonomous robots
Access Control, Video Surveillance
& Intrusion Detection
Remote Video & Alarm Monitoring & Response Services
System installation & service
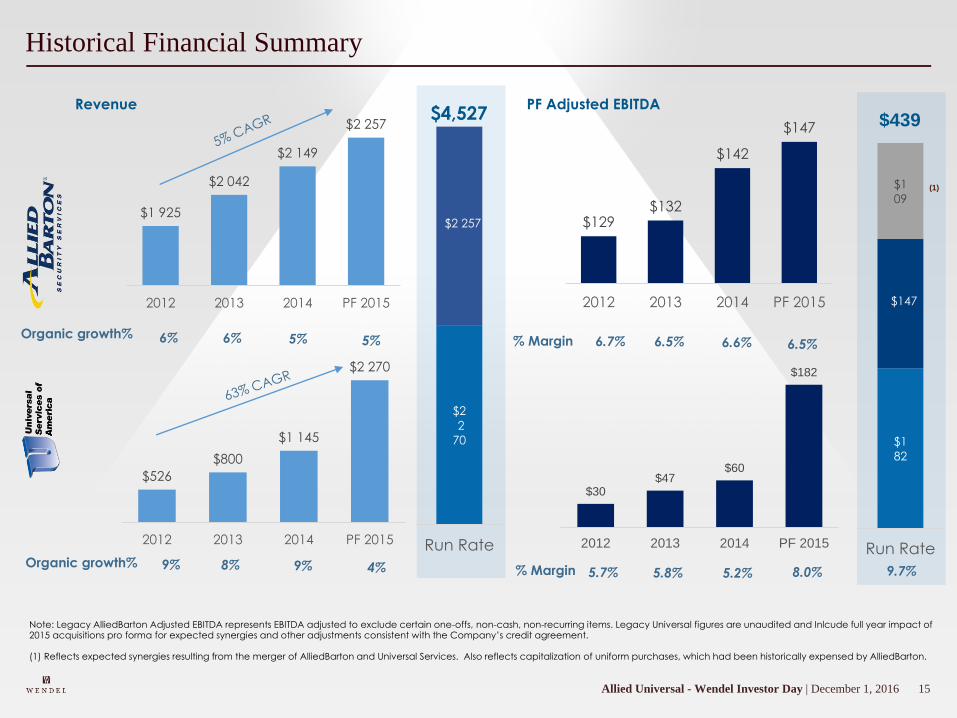
15Allied Universal - Wendel Investor Day | December 1, 2016
$2
2
70
$2 257
Run Rate
$4,527
Historical Financial Summary
Note: Legacy AlliedBarton Adjusted EBITDA represents EBITDA adjusted to exclude certain one-offs, non-cash, non-recurring items. Legacy Universal figures are unaudited and Inlcude full year impact of 2015 acquisitions pro forma for expected synergies and other adjustments consistent with the Company’s credit agreement.
(1) Reflects expected synergies resulting from the merger of AlliedBarton and Universal Services. Also reflects capitalization of uniform purchases, which had been historically expensed by AlliedBarton.
$1 925
$2 042
$2 149
$2 257
2012 2013 2014 PF 2015
$526
$800
$1 145
$2 270
2012 2013 2014 PF 2015
$129 $132
$142
$147
2012 2013 2014 PF 2015
$30 $47
$60
$182
2012 2013 2014 PF 2015
5.7% 5.8% 5.2% 8.0%
Revenue PF Adjusted EBITDA
Organic growth% 6% 6% 5% 5%
9% 8% 9% 4%Organic growth%
% Margin 6.7% 6.5% 6.6% 6.5%
% Margin
$1
82
$147
$1
09
Run Rate
(1)
$439
9.7%
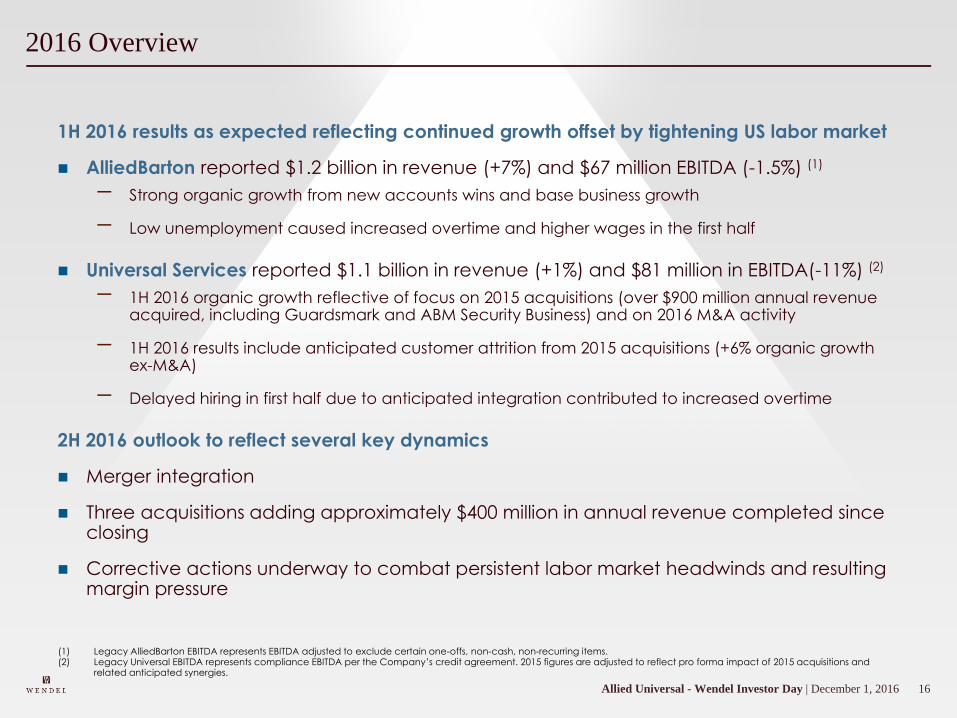
16Allied Universal - Wendel Investor Day | December 1, 2016
2016 Overview
1H 2016 results as expected reflecting continued growth offset by tightening US labor market
AlliedBarton reported $1.2 billion in revenue (+7%) and $67 million EBITDA (-1.5%) (1)
Strong organic growth from new accounts wins and base business growth
Low unemployment caused increased overtime and higher wages in the first half
Universal Services reported $1.1 billion in revenue (+1%) and $81 million in EBITDA(-11%) (2)
1H 2016 organic growth reflective of focus on 2015 acquisitions (over $900 million annual revenue acquired, including Guardsmark and ABM Security Business) and on 2016 M&A activity
1H 2016 results include anticipated customer attrition from 2015 acquisitions (+6% organic growth ex-M&A)
Delayed hiring in first half due to anticipated integration contributed to increased overtime
2H 2016 outlook to reflect several key dynamics
Merger integration
Three acquisitions adding approximately $400 million in annual revenue completed since closing
Corrective actions underway to combat persistent labor market headwinds and resulting margin pressure
(1) Legacy AlliedBarton EBITDA represents EBITDA adjusted to exclude certain one-offs, non-cash, non-recurring items. (2) Legacy Universal EBITDA represents compliance EBITDA per the Company’s credit agreement. 2015 figures are adjusted to reflect pro forma impact of 2015 acquisitions and
related anticipated synergies.
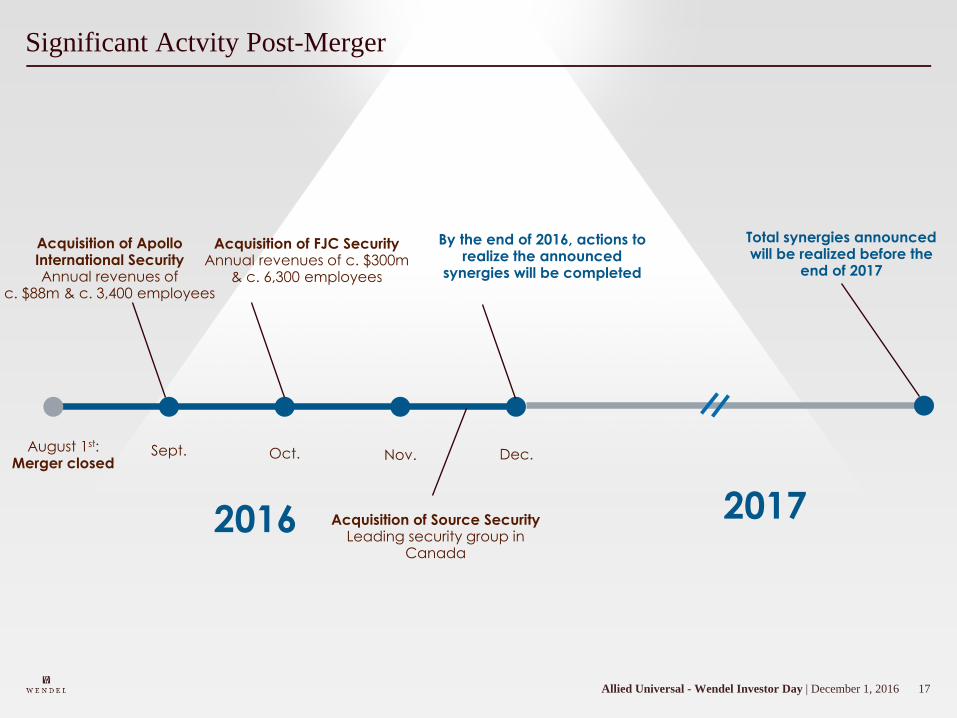
17Allied Universal - Wendel Investor Day | December 1, 2016
Significant Actvity Post-Merger
2016
August 1st:Merger closed
Acquisition of Apollo International SecurityAnnual revenues of
c. $88m & c. 3,400 employees
Acquisition of FJC SecurityAnnual revenues of c. $300m
& c. 6,300 employees
Sept. Oct. Nov. Dec.
By the end of 2016, actions to realize the announced
synergies will be completed
Total synergies announcedwill be realized before the
end of 2017
Acquisition of Source SecurityLeading security group in
Canada
2017
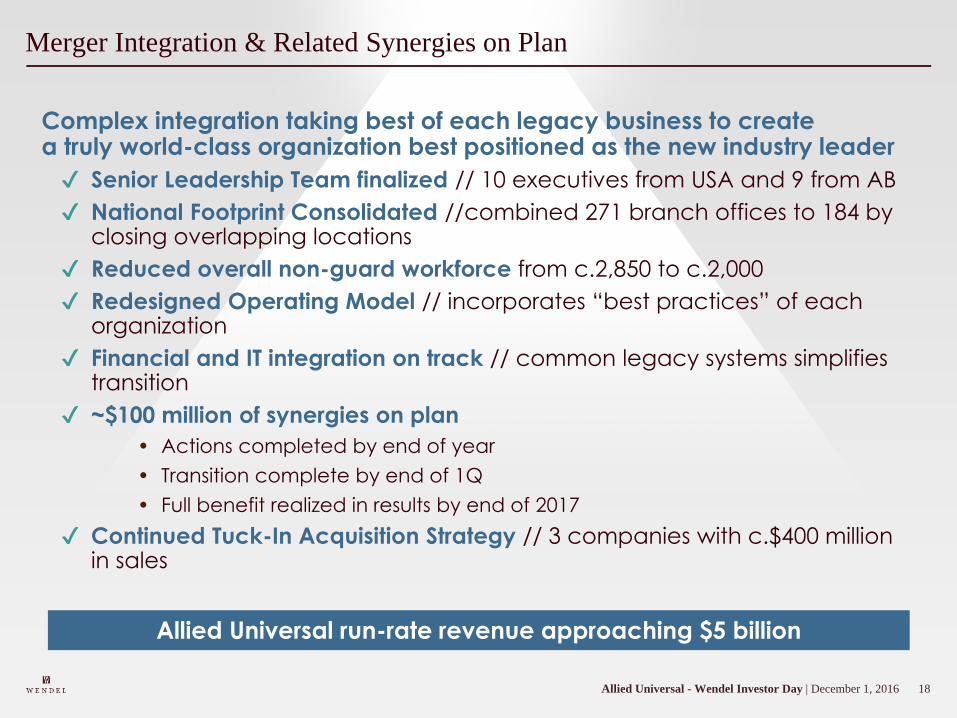
18Allied Universal - Wendel Investor Day | December 1, 2016
Merger Integration & Related Synergies on Plan
Complex integration taking best of each legacy business to create a truly world-class organization best positioned as the new industry leader
✔ Senior Leadership Team finalized // 10 executives from USA and 9 from AB
✔ National Footprint Consolidated //combined 271 branch offices to 184 by closing overlapping locations
✔ Reduced overall non-guard workforce from c.2,850 to c.2,000
✔ Redesigned Operating Model // incorporates “best practices” of each organization
✔ Financial and IT integration on track // common legacy systems simplifies transition
✔ ~$100 million of synergies on plan
• Actions completed by end of year
• Transition complete by end of 1Q
• Full benefit realized in results by end of 2017
✔ Continued Tuck-In Acquisition Strategy // 3 companies with c.$400 million in sales
Allied Universal run-rate revenue approaching $5 billion
19Allied Universal - Wendel Investor Day | December 1, 2016
Key takeaways
Market Leader in large,growing industry
Diversified & resilientbusiness model with strong free cash flow generation
Proven track record of growth organically and through
accretive acquisition
Strong Civic Commitment & Involvement in Communities
20Allied Universal - Wendel Investor Day | December 1, 2016

21Allied Universal - Wendel Investor Day | December 1, 2016
Investor DayDecember 1, 2016
1V. 24.11. 2016 Family Day | 2 décembre 2016
Strategic orientation
2Wendel Investor Day | December 1, 2016
Wendel specific identity
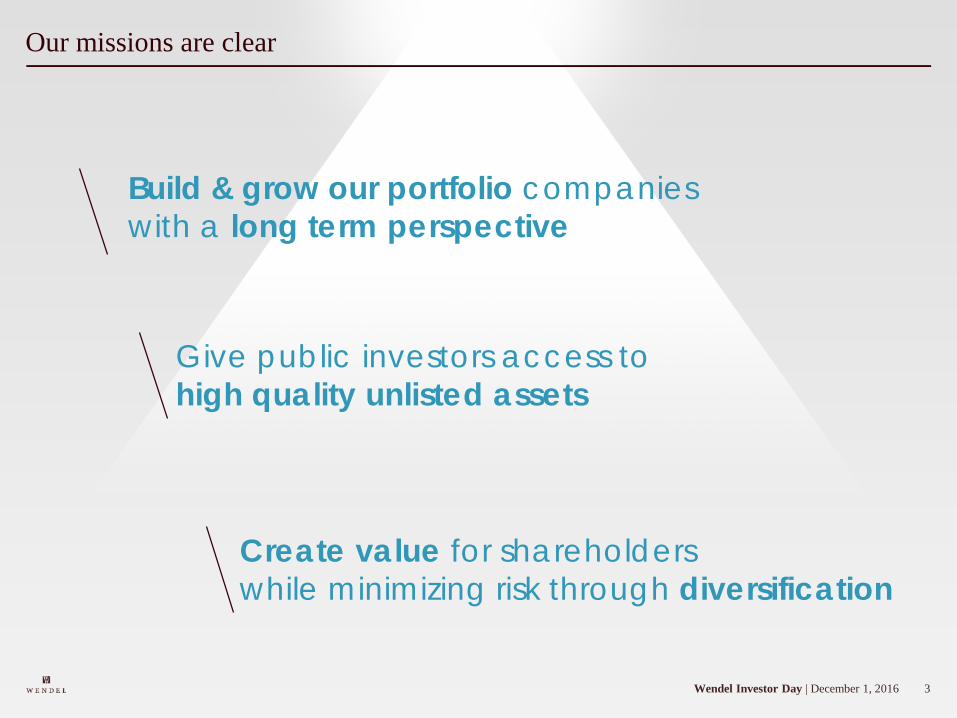
3Wendel Investor Day | December 1, 2016
Create value for shareholders while minimizing risk through diversification
Our missions are clear
Give public investors access to high quality unlisted assets
Build & grow our portfolio companies with a long term perspective
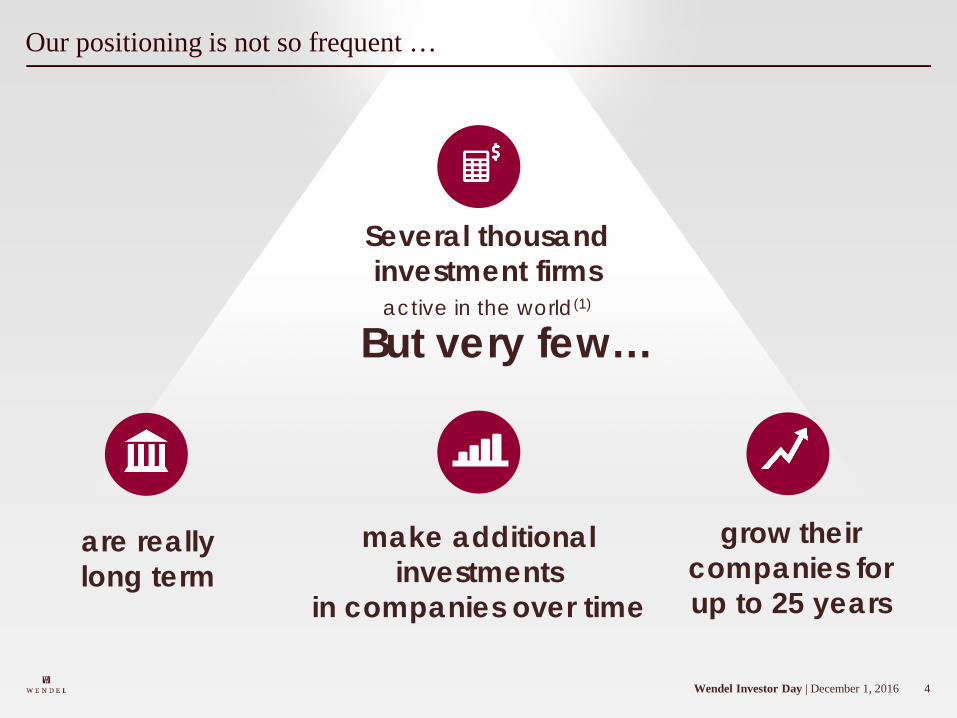
4Wendel Investor Day | December 1, 2016
Several thousandinvestment firmsactive in the world(1)
But very few…
grow their companies for up to 25 years
are reallylong term
Our positioning is not so frequent …
make additional investments
in companies over time
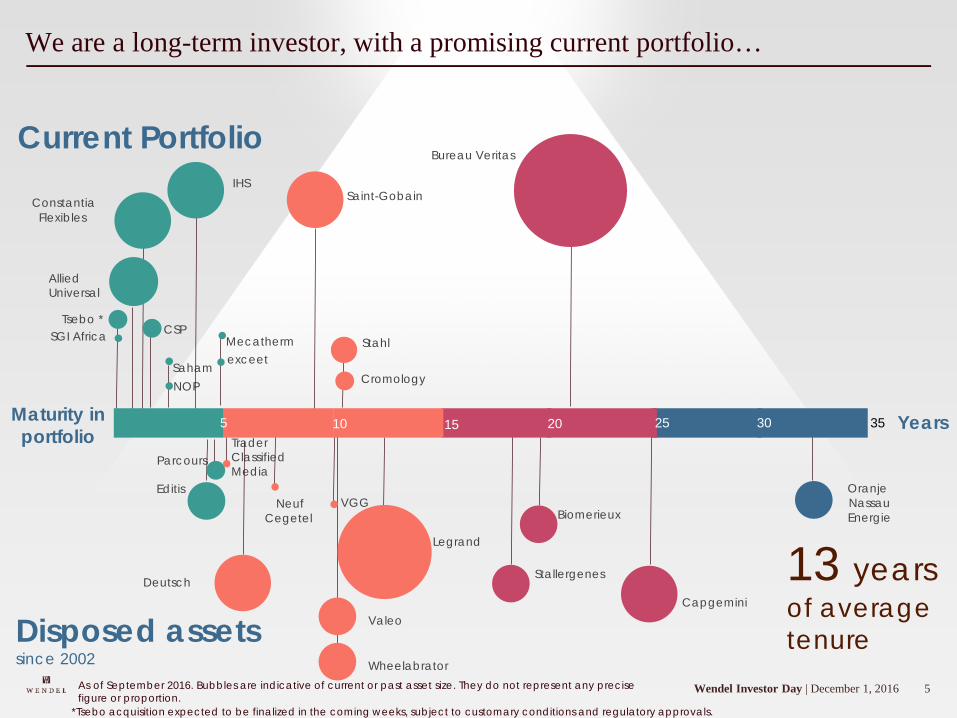
5Wendel Investor Day | December 1, 2016
We are a long-term investor, with a promising current portfolio…
Editis
Trader ClassifiedMedia
Deutsch
VGG
Valeo
Legrand
Stallergenes
Biomerieux
Capgemini
OranjeNassau Energie
Parcours
Neuf Cegetel
35
As of September 2016. Bubbles are indicative of current or past asset size. They do not represent any precisefigure or proportion.
Current Portfolio
Disposed assetssince 2002
Maturity in portfolio
AlliedUniversal
Constantia Flexibles
CSP
SahamNOP
IHS
Mecathermexceet
Saint-Gobain
Stahl
Cromology
Bureau Veritas
Wheelabrator
SGI AfricaTsebo *
*Tsebo acquisition expected to be finalized in the coming weeks, subject to customary conditions and regulatory approvals.
13 yearsof averagetenure
Years5 10 15 20 25 30
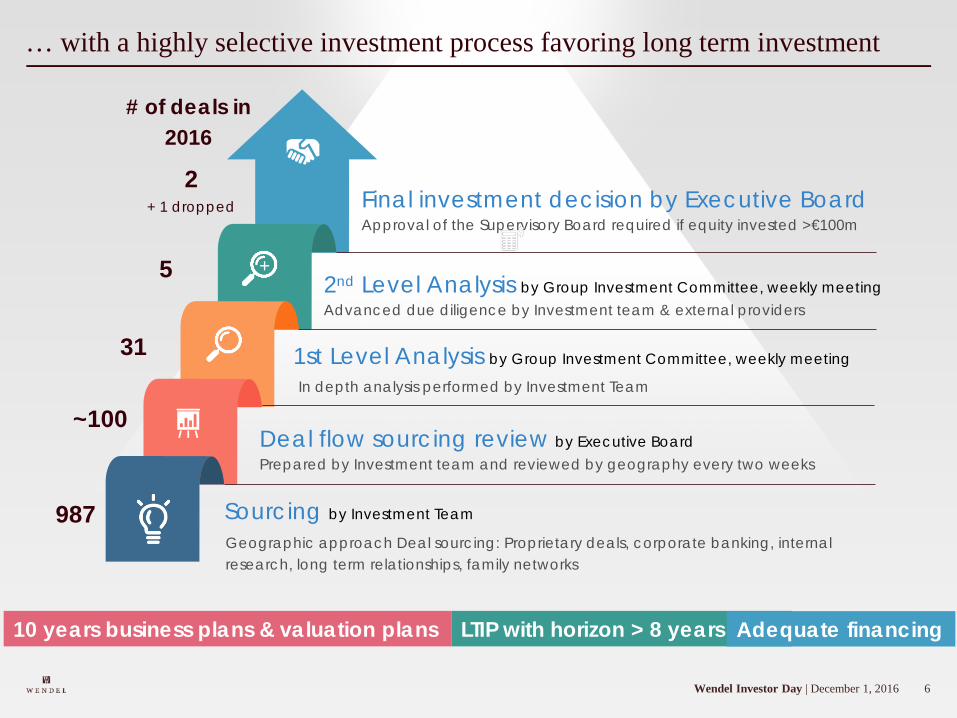
6Wendel Investor Day | December 1, 2016
… with a highly selective investment process favoring long term investment
Prepared by Investment team and reviewed by geography every two weeksDeal flow sourcing review by Executive Board
In depth analysis performed by Investment Team
1st Level Analysis by Group Investment Committee, weekly meeting
Advanced due diligence by Investment team & external providers2nd Level Analysis by Group Investment Committee, weekly meeting
Approval of the Supervisory Board required if equity invested >€100mFinal investment decision by Executive Board
Geographic approach Deal sourcing: Proprietary deals, corporate banking, internalresearch, long term relationships, family networks
Sourcing by Investment Team
+
# of deals in 2016
2 + 1 dropped
5
31
~100
987
LTIP with horizon > 8 years Adequate financing10 years business plans & valuation plans
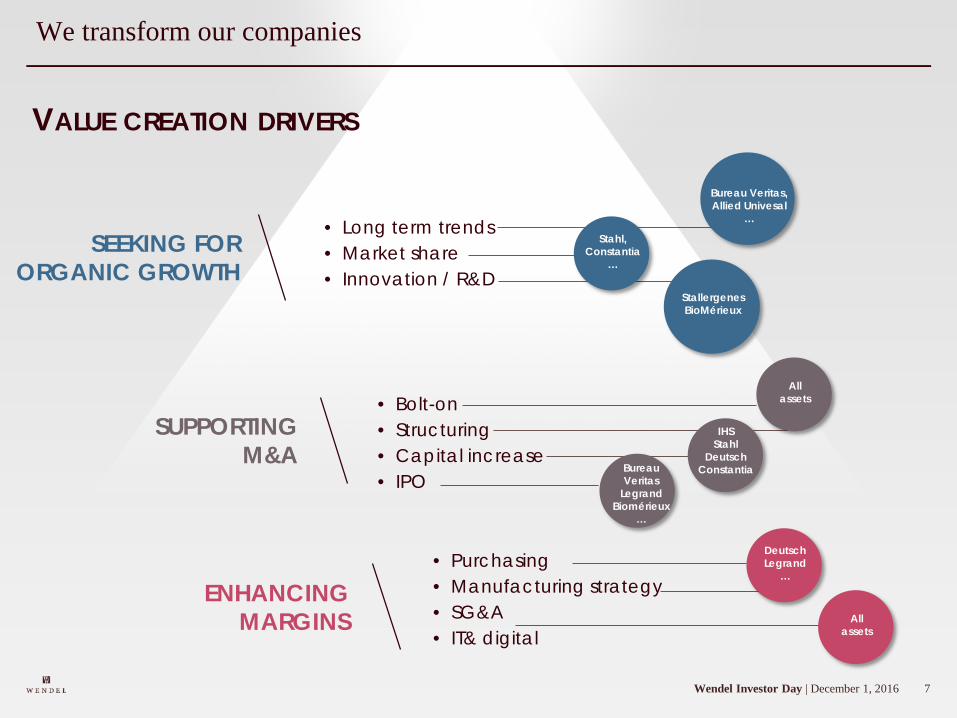
7Wendel Investor Day | December 1, 2016
We transform our companies
ENHANCINGMARGINS
SEEKING FORORGANIC GROWTH
SUPPORTING M&A
• Long term trends• Market share• Innovation / R&D
• Bolt-on• Structuring• Capital increase• IPO
• Purchasing• Manufacturing strategy• SG&A• IT& digital
All assets
Bureau Veritas, Allied Univesal
…
Stahl, Constantia
…
DeutschLegrand
…
StallergenesBioMérieux
IHSStahl
DeutschConstantia
All assets
Bureau Veritas
LegrandBiomérieux
…
VALUE CREATION DRIVERS
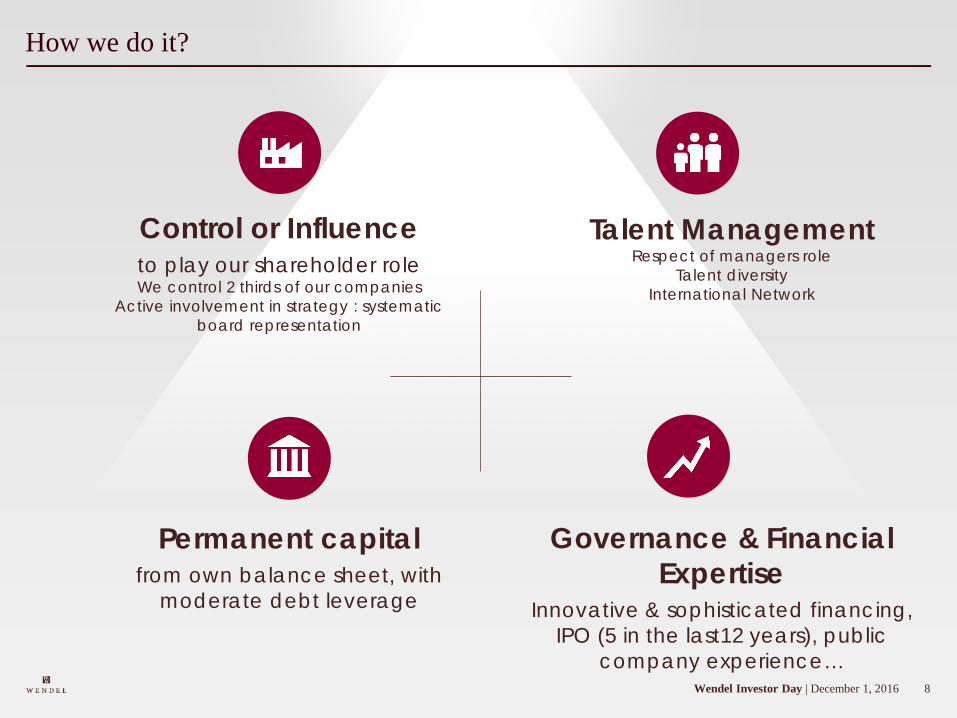
8Wendel Investor Day | December 1, 2016
Control or Influenceto play our shareholder roleWe control 2 thirds of our companies
Active involvement in strategy : systematicboard representation
Talent ManagementRespect of managers role
Talent diversityInternational Network
Permanent capitalfrom own balance sheet, with
moderate debt leverage
Governance & Financial Expertise
Innovative & sophisticated financing, IPO (5 in the last12 years), public
company experience…
How we do it?
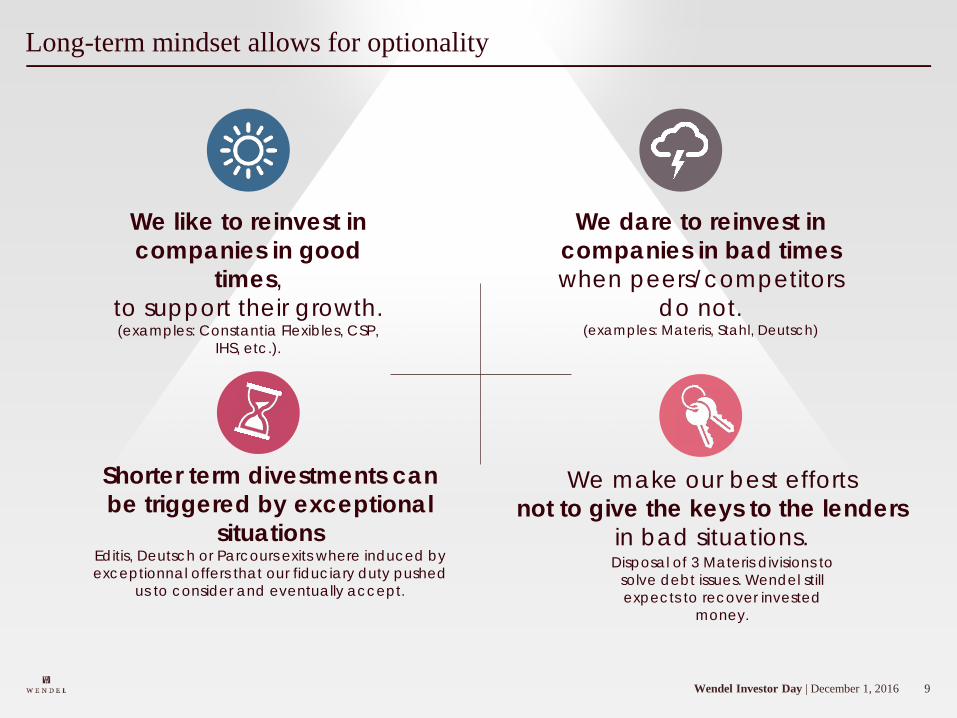
9Wendel Investor Day | December 1, 2016
Long-term mindset allows for optionality
We like to reinvest in companies in good
times, to support their growth. (examples: Constantia Flexibles, CSP,
IHS, etc.).
Shorter term divestments canbe triggered by exceptional
situationsEditis, Deutsch or Parcours exits where induced by exceptionnal offers that our fiduciary duty pushed
us to consider and eventually accept.
We dare to reinvest in companies in bad times when peers/competitors
do not.(examples: Materis, Stahl, Deutsch)
We make our best efforts not to give the keys to the lenders
in bad situations.Disposal of 3 Materis divisions to
solve debt issues. Wendel stillexpects to recover invested
money.
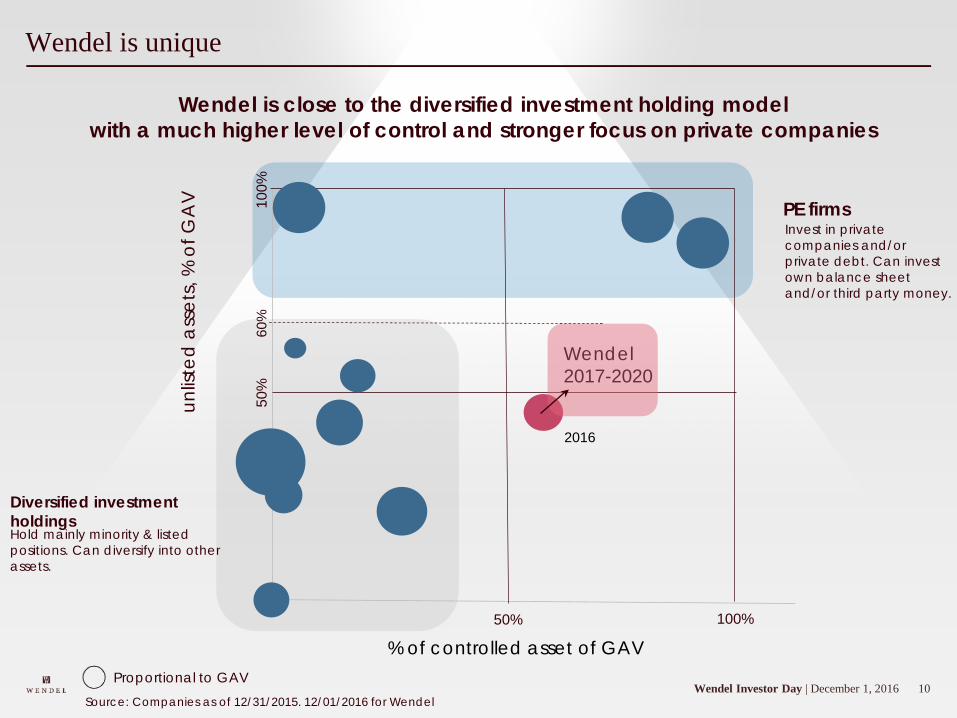
10Wendel Investor Day | December 1, 2016
Wendel is unique
50% 100%
unlis
ted
ass
ets,
% o
f GA
V
% of controlled asset of GAV
50%
100%
Wendel2017-2020
Proportional to GAV
PE firmsInvest in privatecompanies and/or private debt. Can investown balance sheetand/or third party money.
Diversified investmentholdingsHold mainly minority & listedpositions. Can diversify into otherassets.
60%
2016
Wendel is close to the diversified investment holding model with a much higher level of control and stronger focus on private companies
Source: Companies as of 12/31/2015. 12/01/2016 for Wendel
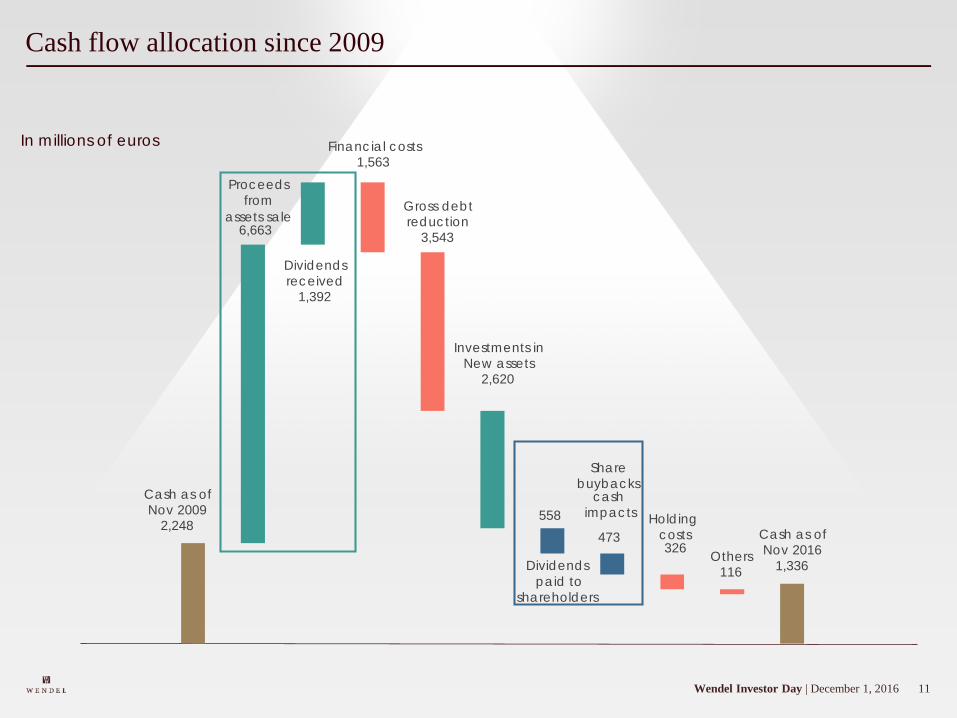
11Wendel Investor Day | December 1, 2016
Cash flow allocation since 2009
In millions of euros
Cash as of Nov 2009
2,248
Proceedsfrom
assets sale6,663
Dividends received
1,392
Financial costs1,563
Gross debt reduction
3,543
Investments in New assets
2,620
Dividendspaid to
shareholders
558
Share buybacks
cash impacts
473Holding
costs326 Others
116
Cash as of Nov 2016
1,336
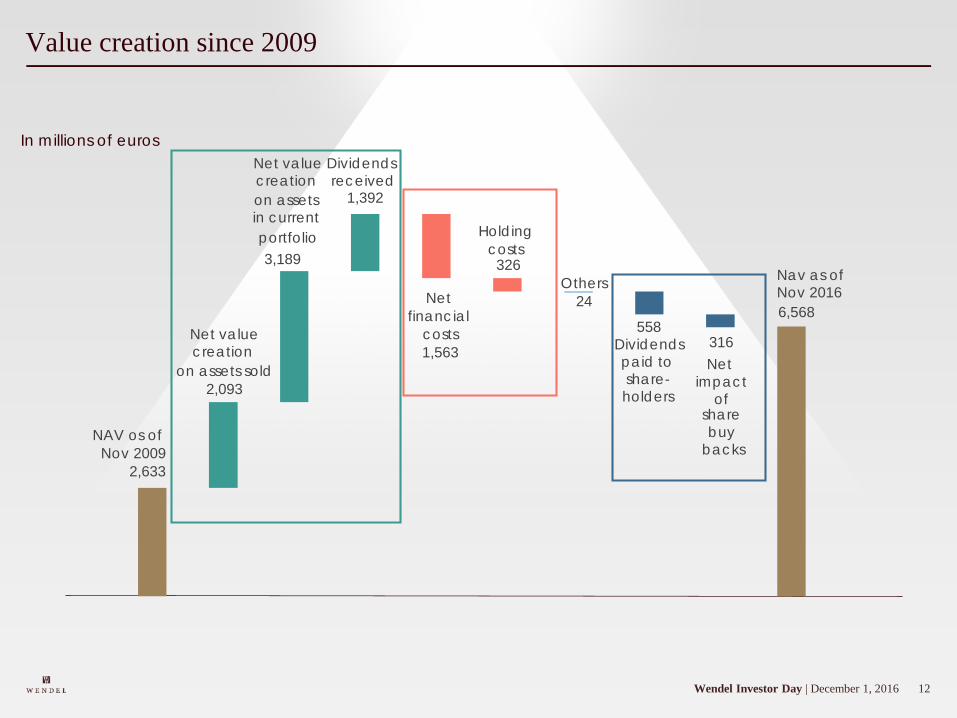
12Wendel Investor Day | December 1, 2016
Value creation since 2009
In millions of euros
NAV os of Nov 2009
2,633
Net valuecreation
on assets sold2,093
Net valuecreation on assets in current portfolio3,189
Dividends received
1,392
Net financial
costs1,563
Holding costs
326Others
24
Dividendspaid to share-holders
558
Net impact
of sharebuy
backs
316
Nav as of Nov 20166,568
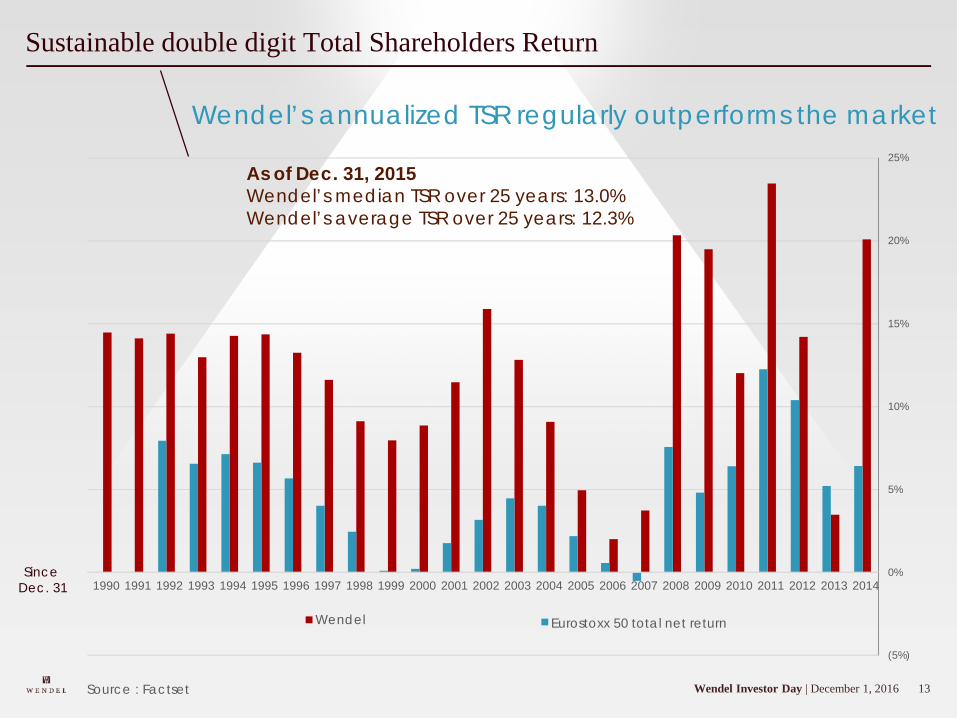
13Wendel Investor Day | December 1, 2016
Wendel’s annualized TSR regularly outperforms the market
Sustainable double digit Total Shareholders Return
As of Dec. 31, 2015Wendel’s median TSR over 25 years: 13.0%Wendel’s average TSR over 25 years: 12.3%
Since Dec. 31
Source : Factset
(5%)
0%
5%
10%
15%
20%
25%
2014201320122011201020092008200720062005200420032002200120001999199819971996199519941993199219911990
Wendel Eurostoxx 50 total net return
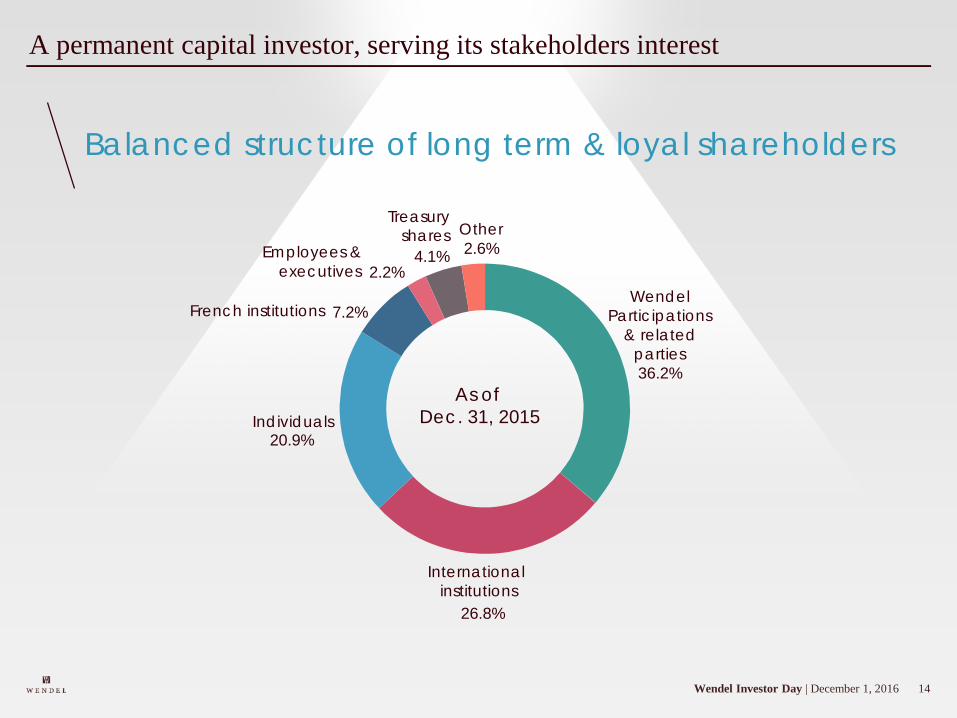
14Wendel Investor Day | December 1, 2016
Balanced structure of long term & loyal shareholders
A permanent capital investor, serving its stakeholders interest
Wendel Participations
& related parties36.2%
International institutions
26.8%
Individuals 20.9%
French institutions 7.2%
Employees & executives 2.2%
Treasury shares
4.1%
Other2.6%
As of Dec. 31, 2015
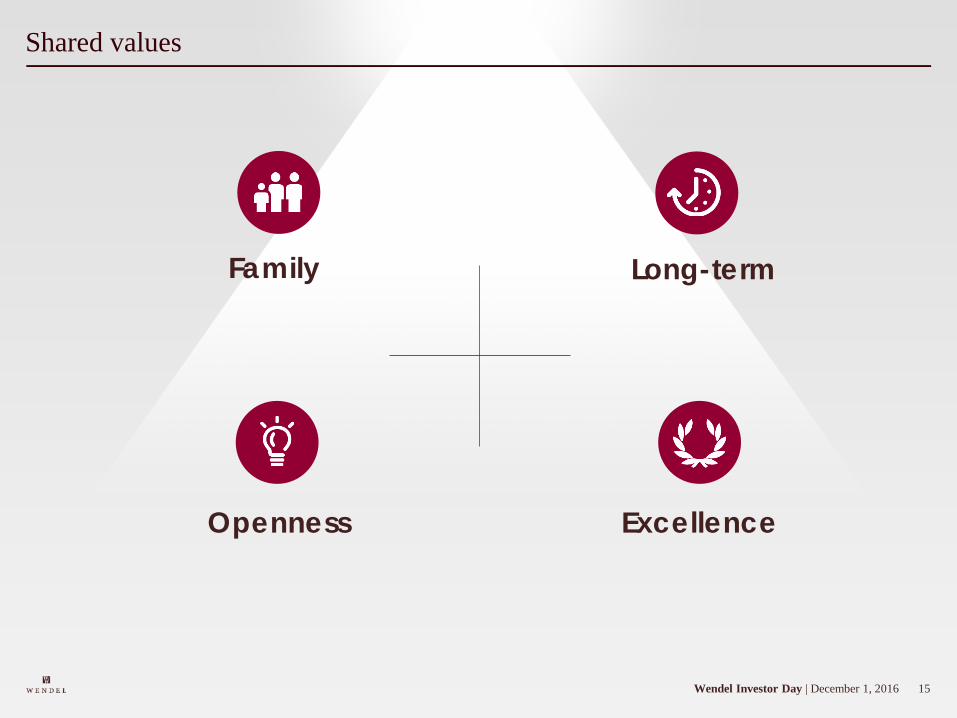
15Wendel Investor Day | December 1, 2016
Shared values
Family Long-term
ExcellenceOpenness
16Wendel Investor Day | December 1, 2016
16

17Wendel Investor Day | December 1, 2016
Objectives to pursue growth
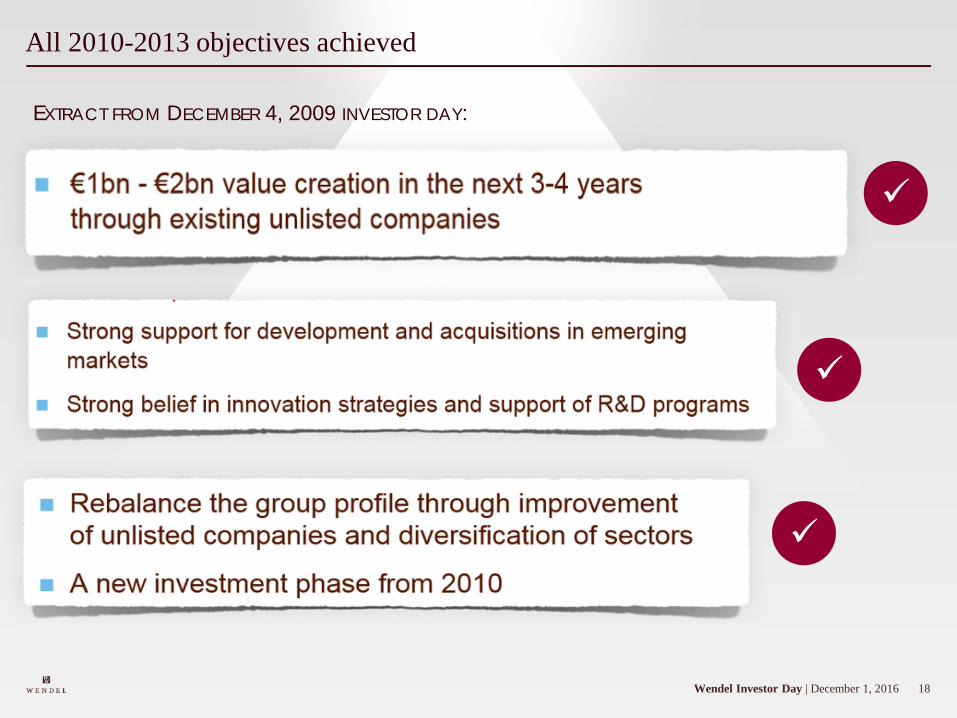
18Wendel Investor Day | December 1, 2016
All 2010-2013 objectives achieved
EXTRACT FROM DECEMBER 4, 2009 INVESTOR DAY:
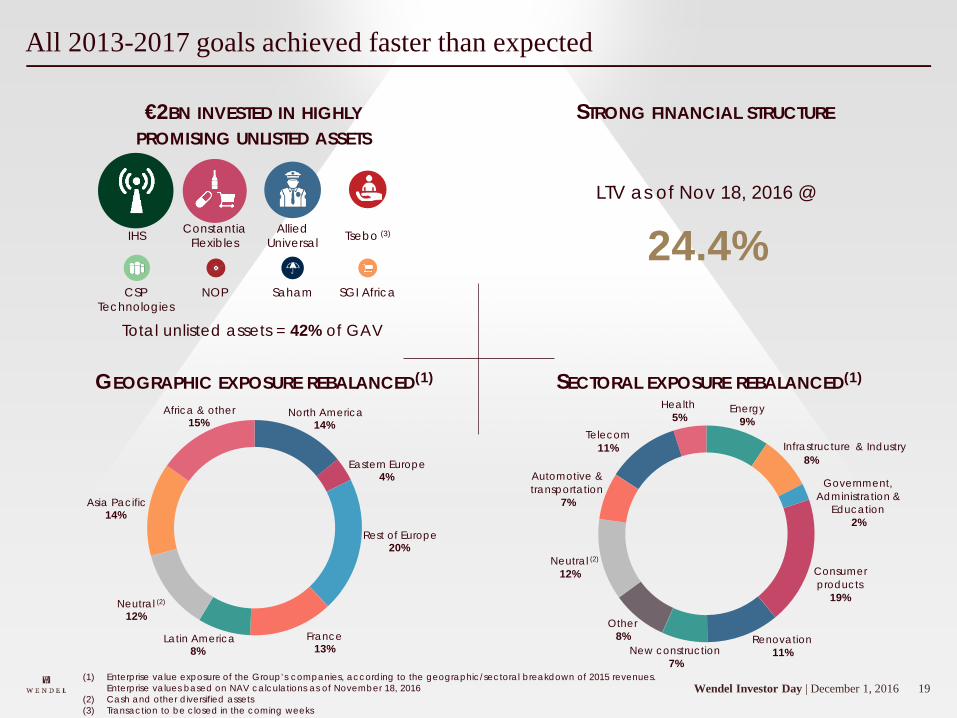
19Wendel Investor Day | December 1, 2016
All 2013-2017 goals achieved faster than expected
SECTORAL EXPOSURE REBALANCED(1)
€2BN INVESTED IN HIGHLYPROMISING UNLISTED ASSETS
LTV as of Nov 18, 2016 @
24.4%IHS
(1) Enterprise value exposure of the Group’s companies, according to the geographic/sectoral breakdown of 2015 revenues. Enterprise values based on NAV calculations as of November 18, 2016
(2) Cash and other diversified assets(3) Transaction to be closed in the coming weeks
STRONG FINANCIAL STRUCTURE
ConstantiaFlexibles
AlliedUniversal
CSPTechnologies
NOP Saham SGI Africa
GEOGRAPHIC EXPOSURE REBALANCED(1)
Tsebo (3)
Total unlisted assets = 42% of GAV
Energy 9%
Infrastructure & Industry8%
Government, Administration &
Education2%
Consumer products
19%
Renovation11%New construction
7%
Other8%
Neutral (2)
12%
Automotive & transportation
7%
Telecom11%
Health5%North America
14%
Eastern Europe4%
Rest of Europe20%
France13%
Latin America8%
Neutral (2)
12%
Asia Pacific14%
Africa & other15%
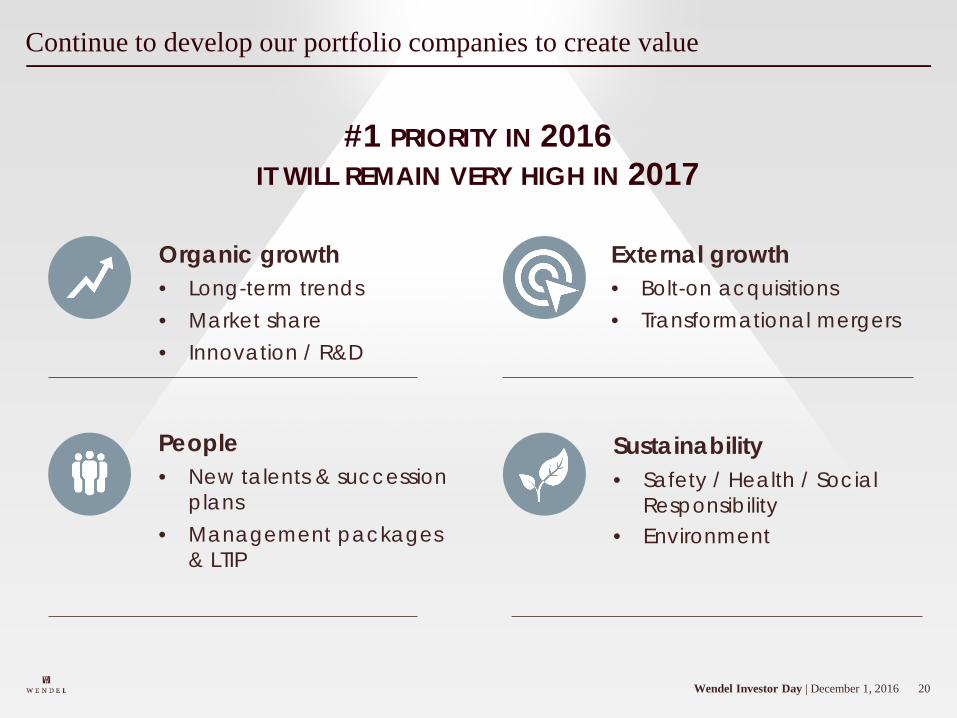
20Wendel Investor Day | December 1, 2016
Continue to develop our portfolio companies to create value
Organic growth• Long-term trends• Market share• Innovation / R&D
External growth• Bolt-on acquisitions• Transformational mergers
Sustainability• Safety / Health / Social
Responsibility• Environment
People• New talents & succession
plans• Management packages
& LTIP
#1 PRIORITY IN 2016 IT WILL REMAIN VERY HIGH IN 2017
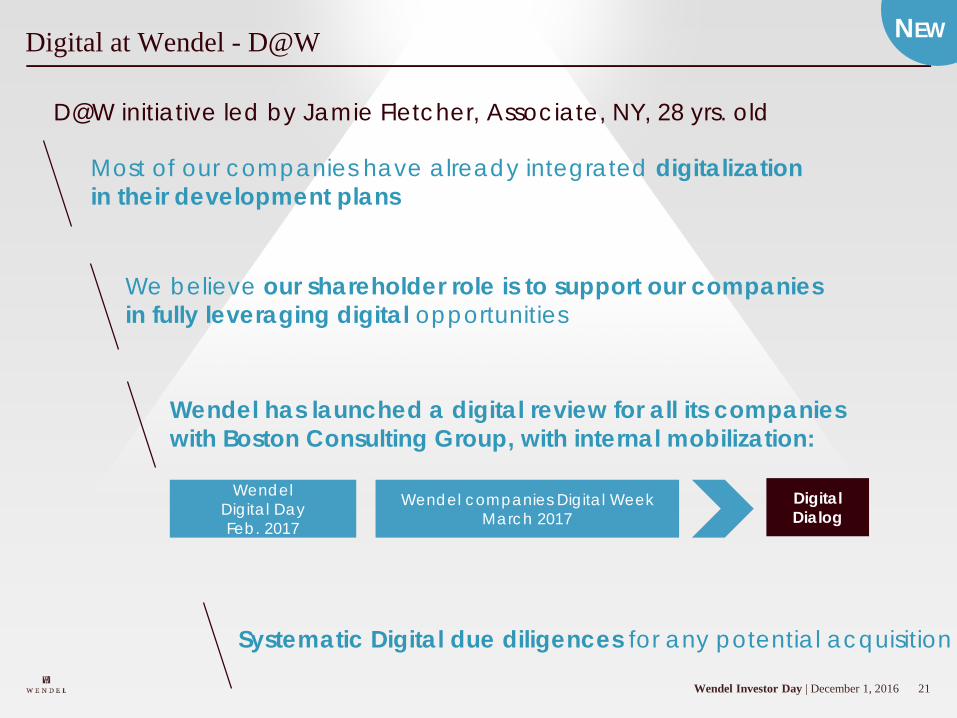
21Wendel Investor Day | December 1, 2016
Digital at Wendel - D@W
We believe our shareholder role is to support our companiesin fully leveraging digital opportunities
Most of our companies have already integrated digitalizationin their development plans
Systematic Digital due diligences for any potential acquisition
D@W initiative led by Jamie Fletcher, Associate, NY, 28 yrs. old
NEW
Wendel has launched a digital review for all its companieswith Boston Consulting Group, with internal mobilization:
Wendel Digital DayFeb. 2017
Wendel companies Digital WeekMarch 2017
DigitalDialog
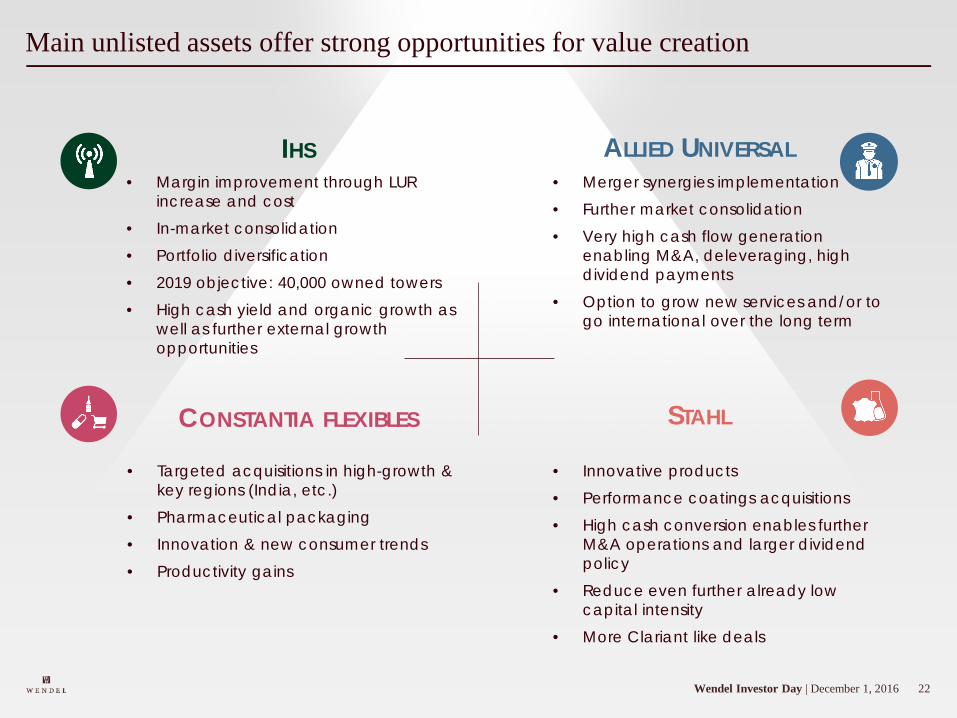
22Wendel Investor Day | December 1, 2016
Main unlisted assets offer strong opportunities for value creation
CONSTANTIA FLEXIBLES
• Targeted acquisitions in high-growth & key regions (India, etc.)
• Pharmaceutical packaging• Innovation & new consumer trends• Productivity gains
STAHL
• Innovative products• Performance coatings acquisitions• High cash conversion enables further
M&A operations and larger dividend policy
• Reduce even further already low capital intensity
• More Clariant like deals
IHS• Margin improvement through LUR
increase and cost• In-market consolidation• Portfolio diversification• 2019 objective: 40,000 owned towers• High cash yield and organic growth as
well as further external growth opportunities
ALLIED UNIVERSAL• Merger synergies implementation• Further market consolidation• Very high cash flow generation
enabling M&A, deleveraging, high dividend payments
• Option to grow new services and/or to go international over the long term
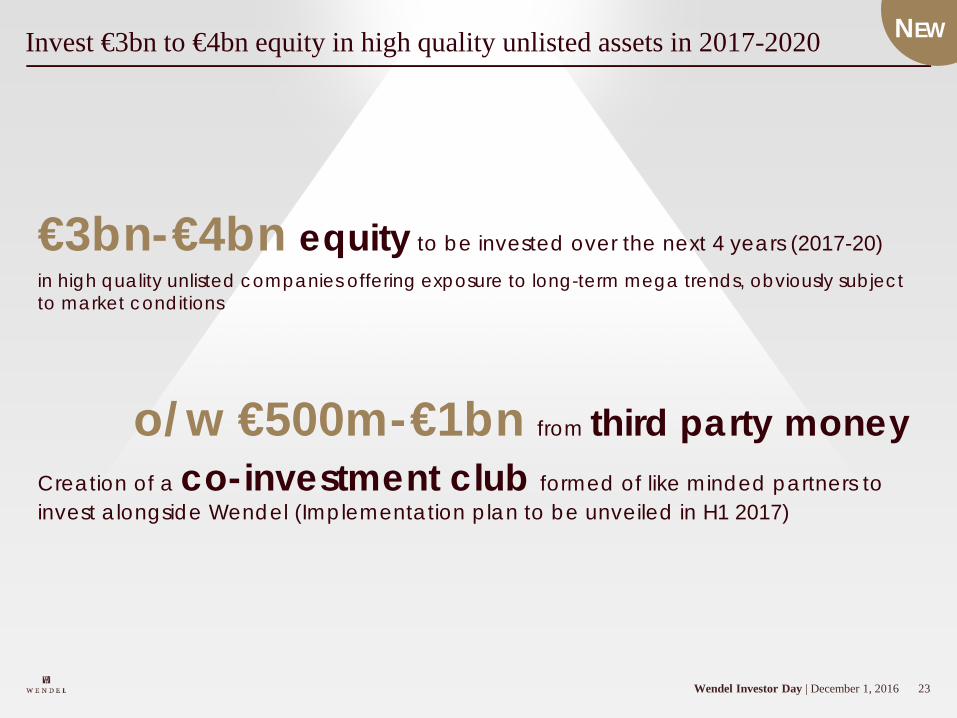
23Wendel Investor Day | December 1, 2016
Invest €3bn to €4bn equity in high quality unlisted assets in 2017-2020
€3bn-€4bn equity to be invested over the next 4 years (2017-20)
in high quality unlisted companies offering exposure to long-term mega trends, obviously subjectto market conditions
o/w €500m-€1bn from third party moneyCreation of a co-investment club formed of like minded partners to invest alongside Wendel (Implementation plan to be unveiled in H1 2017)
NEW
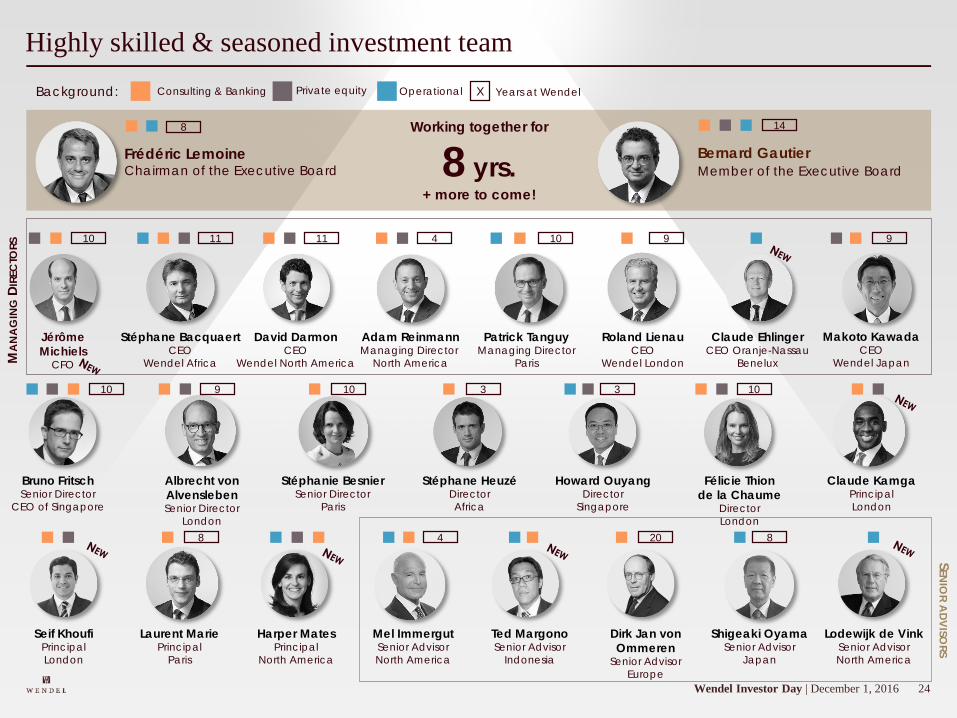
24Wendel Investor Day | December 1, 2016
Private equity OperationalConsulting & Banking Years at Wendel
Highly skilled & seasoned investment team
Shigeaki OyamaSenior Advisor
Japan
Albrecht von AlvenslebenSenior Director
London
Félicie Thionde la Chaume
DirectorLondon
Stéphanie BesnierSenior Director
Paris
Frédéric LemoineChairman of the Executive Board
Bernard GautierMember of the Executive Board
Stéphane BacquaertCEO
Wendel Africa
David DarmonCEO
Wendel North America
Patrick TanguyManaging Director
Paris
Roland LienauCEO
Wendel London
Claude EhlingerCEO Oranje-Nassau
Benelux
Makoto KawadaCEO
Wendel Japan
Laurent MariePrincipal
Paris
Stéphane HeuzéDirectorAfrica
Mel ImmergutSenior AdvisorNorth America
Harper MatesPrincipal
North America
Claude KamgaPrincipalLondon
Seif KhoufiPrincipalLondon
Lodewijk de VinkSenior AdvisorNorth America
Howard OuyangDirector
Singapore
XBackground:
8 14
11 11 9 910
Adam ReinmannManaging Director
North America
4
4 8
9 10
Bruno FritschSenior Director
CEO of Singapore
10 3 103
8
Jérôme Michiels
CFO
10
Ted MargonoSenior Advisor
Indonesia
Dirk Jan von Ommeren
Senior AdvisorEurope
20
MA
NA
GIN
GDI
REC
TORS
SENIO
RA
DVISORS
Working together for
8 yrs.+ more to come!
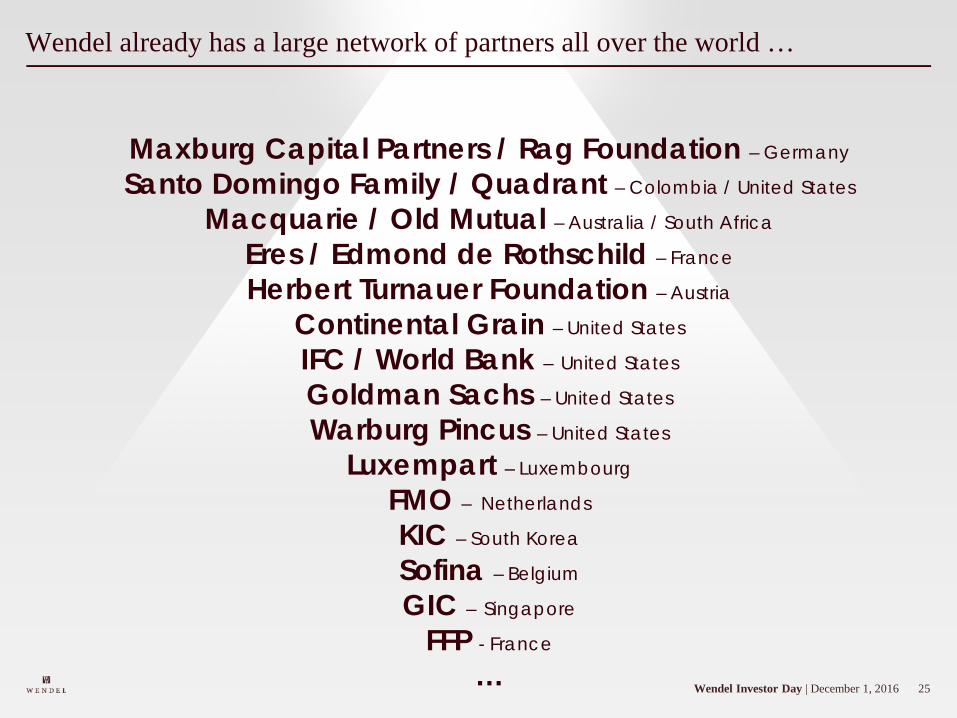
25Wendel Investor Day | December 1, 2016
Wendel already has a large network of partners all over the world …
Maxburg Capital Partners / Rag Foundation – Germany
Santo Domingo Family / Quadrant – Colombia / United States
Macquarie / Old Mutual – Australia / South Africa
Eres / Edmond de Rothschild – France
Herbert Turnauer Foundation – Austria
Continental Grain – United States
IFC / World Bank – United States
Goldman Sachs – United States
Warburg Pincus – United States
Luxempart – Luxembourg
FMO – Netherlands
KIC – South Korea
Sofina – Belgium
GIC – Singapore
FFP - France
…
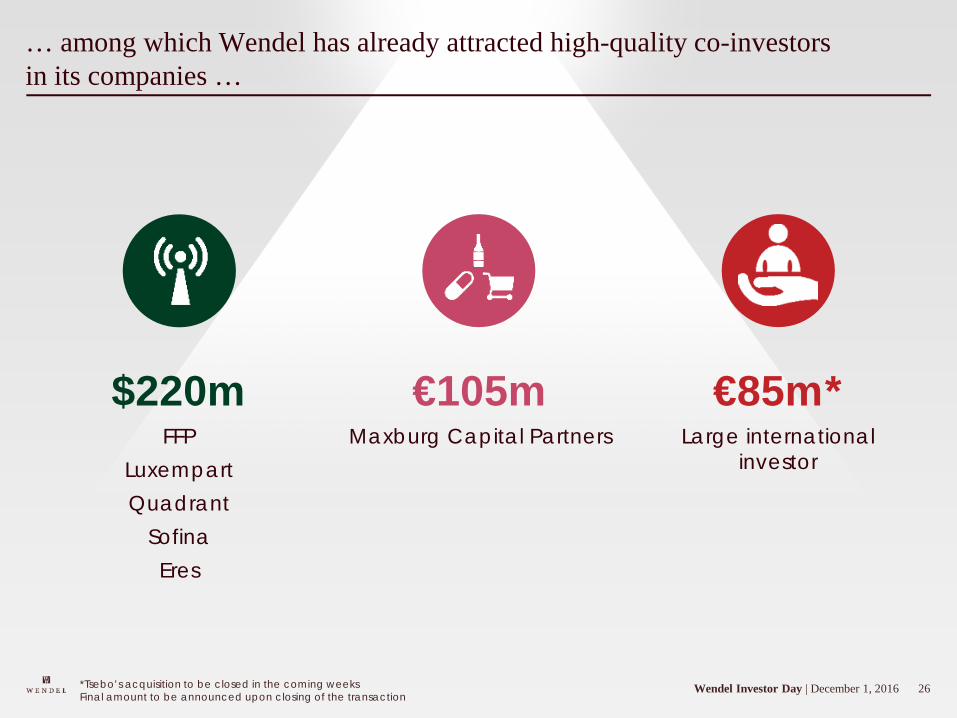
26Wendel Investor Day | December 1, 2016
… among which Wendel has already attracted high-quality co-investorsin its companies …
$220mFFP
LuxempartQuadrant
SofinaEres
€105mMaxburg Capital Partners
€85m*Large international
investor
*Tsebo’s acquisition to be closed in the coming weeksFinal amount to be announced upon closing of the transaction
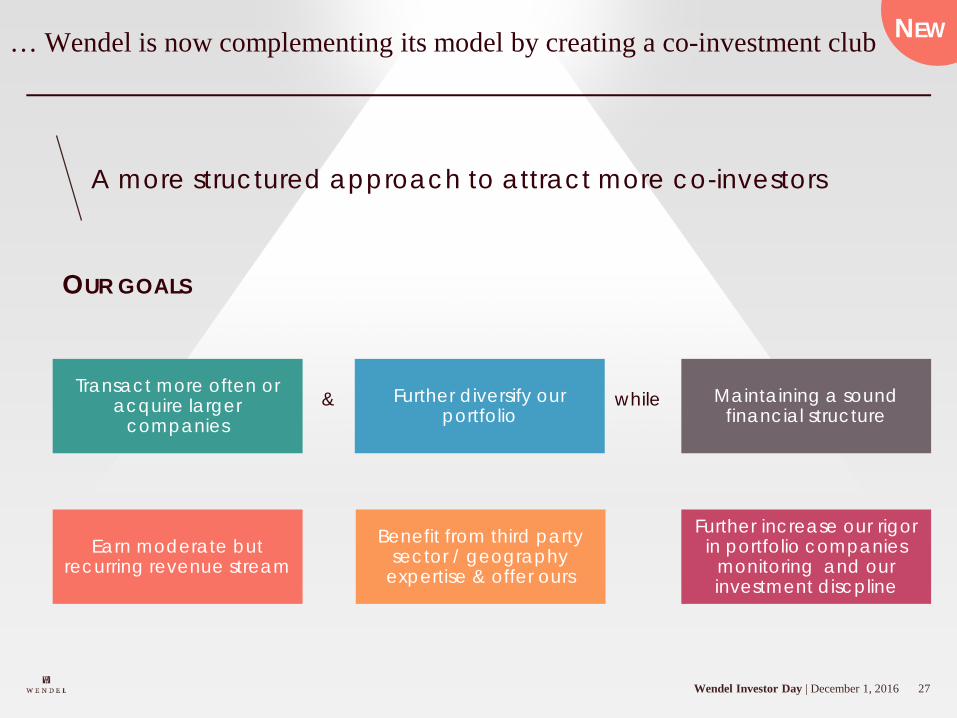
27Wendel Investor Day | December 1, 2016
… Wendel is now complementing its model by creating a co-investment club
A more structured approach to attract more co-investors
OUR GOALS
Transact more often or acquire larger
companiesFurther diversify our
portfolio& while Maintaining a sound
financial structure
Earn moderate but recurring revenue stream
Benefit from third party sector / geography
expertise & offer ours
Further increase our rigorin portfolio companies
monitoring and ourinvestment discpline
NEW
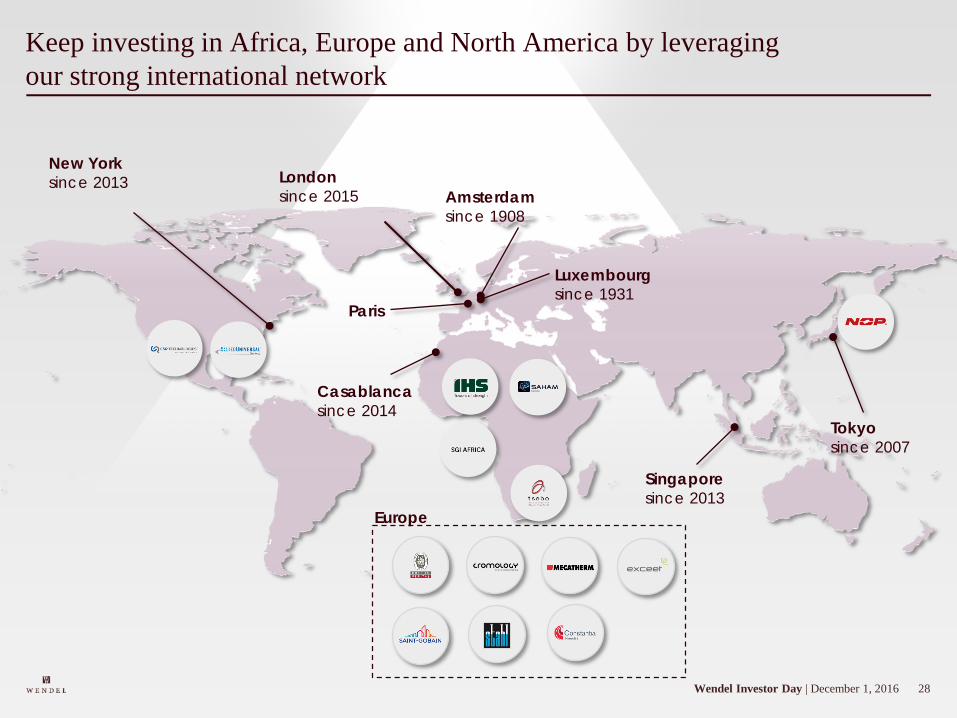
28Wendel Investor Day | December 1, 2016
Keep investing in Africa, Europe and North America by leveragingour strong international network
New Yorksince 2013
Casablancasince 2014
Singaporesince 2013
Tokyosince 2007
Luxembourgsince 1931
Amsterdamsince 1908
Paris
Londonsince 2015
Europe
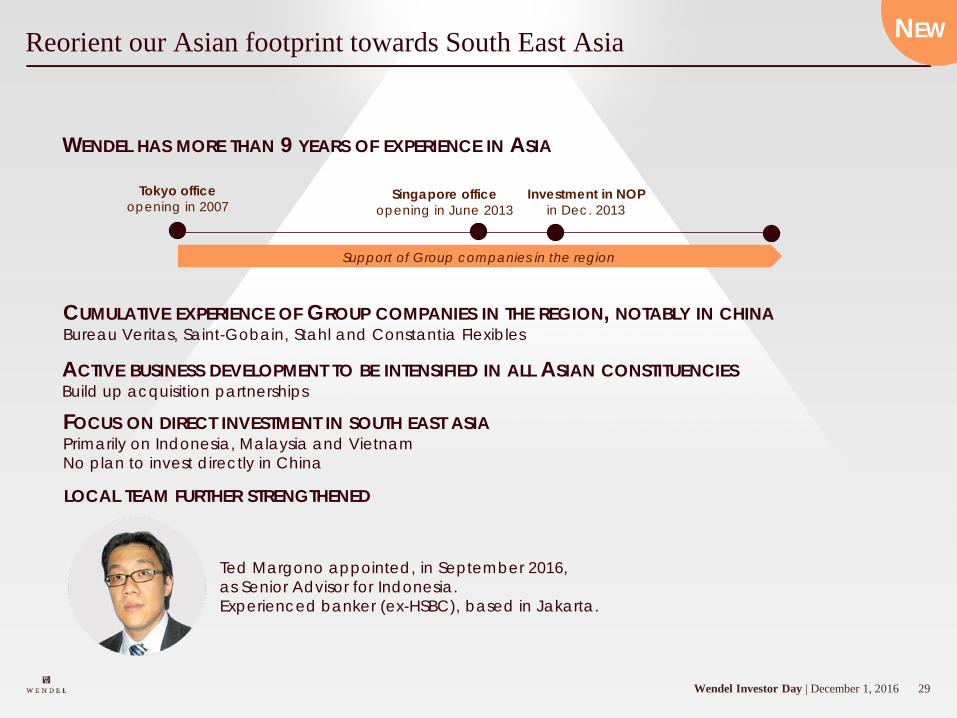
29Wendel Investor Day | December 1, 2016
Reorient our Asian footprint towards South East Asia
LOCAL TEAM FURTHER STRENGTHENED
WENDEL HAS MORE THAN 9 YEARS OF EXPERIENCE IN ASIA
CUMULATIVE EXPERIENCE OF GROUP COMPANIES IN THE REGION, NOTABLY IN CHINABureau Veritas, Saint-Gobain, Stahl and Constantia Flexibles
Tokyo office opening in 2007
Singapore office opening in June 2013
Support of Group companies in the region
Investment in NOPin Dec. 2013
FOCUS ON DIRECT INVESTMENT IN SOUTH EAST ASIAPrimarily on Indonesia, Malaysia and VietnamNo plan to invest directly in China
Ted Margono appointed, in September 2016, as Senior Advisor for Indonesia.Experienced banker (ex-HSBC), based in Jakarta.
ACTIVE BUSINESS DEVELOPMENT TO BE INTENSIFIED IN ALL ASIAN CONSTITUENCIESBuild up acquisition partnerships
NEW
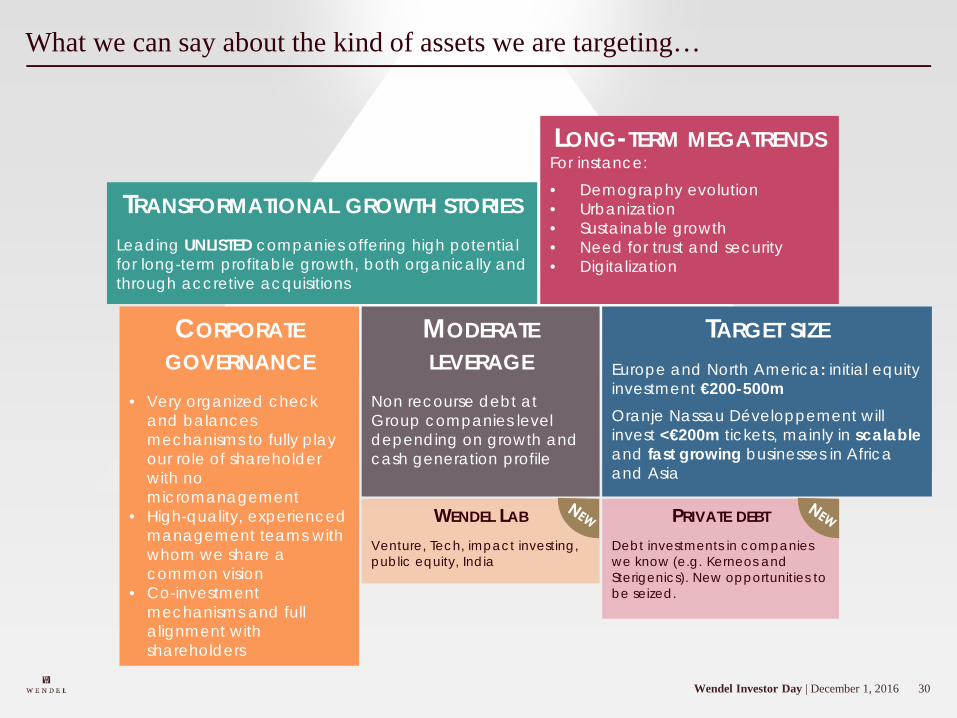
30Wendel Investor Day | December 1, 2016
What we can say about the kind of assets we are targeting…
TRANSFORMATIONAL GROWTH STORIESLeading UNLISTED companies offering high potential for long-term profitable growth, both organically and through accretive acquisitions
LONG-TERM MEGATRENDSFor instance:• Demography evolution• Urbanization• Sustainable growth• Need for trust and security• Digitalization
MODERATELEVERAGE
Non recourse debt at Group companies level depending on growth and cash generation profile
TARGET SIZEEurope and North America: initial equity investment €200-500mOranje Nassau Développement willinvest <€200m tickets, mainly in scalableand fast growing businesses in Africaand Asia
PRIVATE DEBT
Debt investments in companies we know (e.g. Kerneos and Sterigenics). New opportunities to be seized.
WENDEL LAB
Venture, Tech, impact investing, public equity, India
CORPORATEGOVERNANCE
• Very organized check and balances mechanisms to fully playour role of shareholderwith no micromanagement
• High-quality, experienced management teams with whom we share a common vision
• Co-investmentmechanisms and full alignment withshareholders
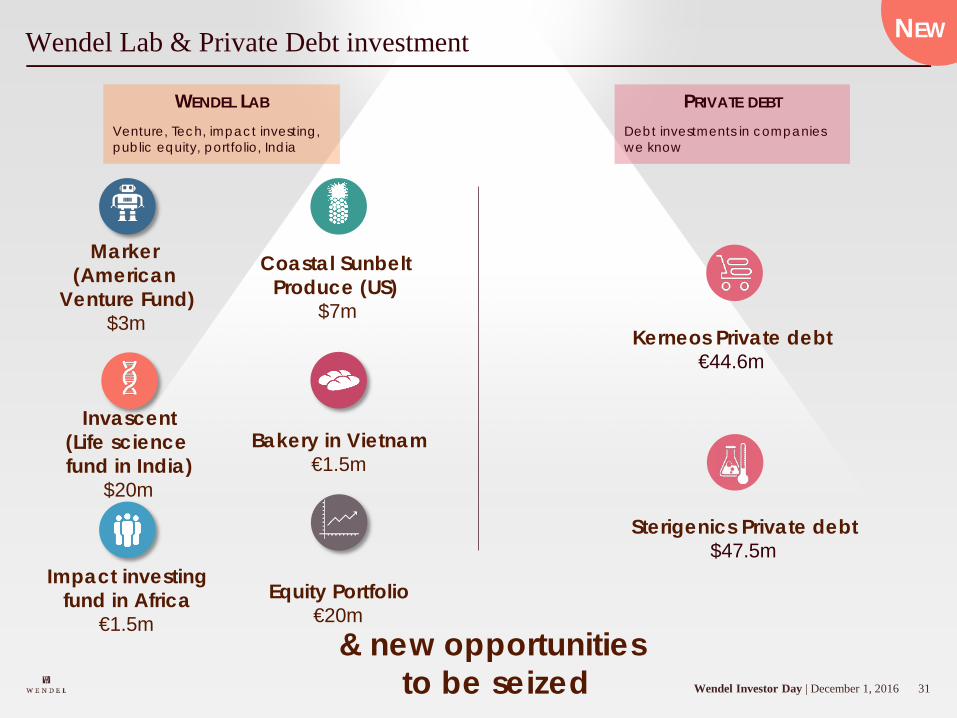
31Wendel Investor Day | December 1, 2016
Wendel Lab & Private Debt investment NEW
Coastal SunbeltProduce (US)
$7m
Marker (American
Venture Fund)$3m
Invascent(Life science fund in India)
$20m
Equity Portfolio€20m
Bakery in Vietnam€1.5m
Impact investingfund in Africa
€1.5m
WENDEL LAB
Venture, Tech, impact investing, public equity, portfolio, India
PRIVATE DEBT
Debt investments in companies we know
& new opportunities to be seized
Sterigenics Private debt$47.5m
Kerneos Private debt€44.6m
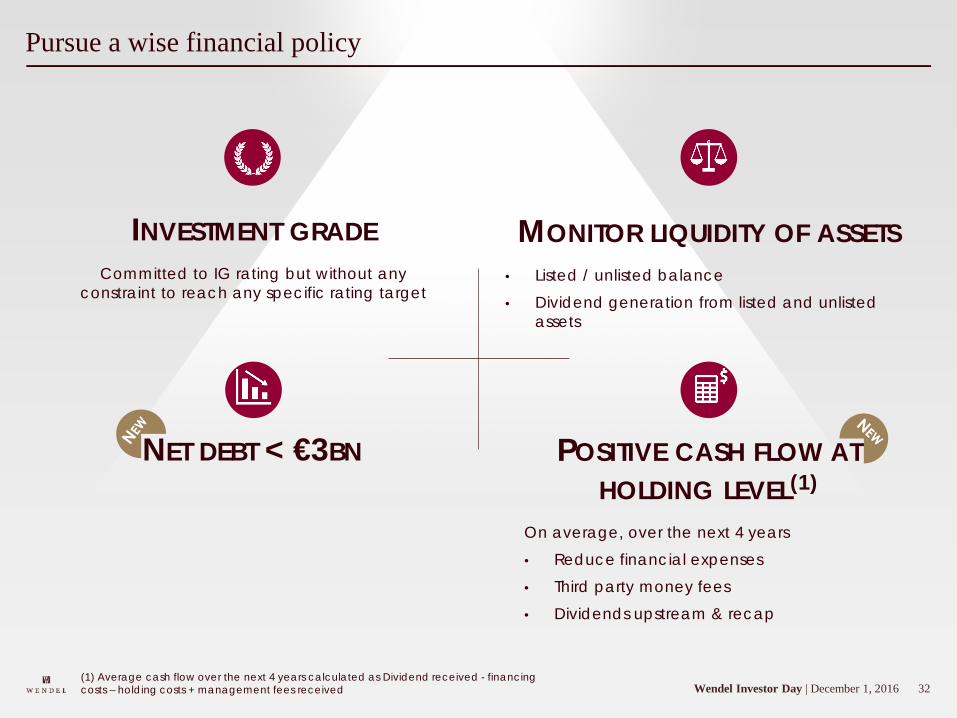
32Wendel Investor Day | December 1, 2016
Pursue a wise financial policy
POSITIVE CASH FLOW ATHOLDING LEVEL(1)
On average, over the next 4 years• Reduce financial expenses• Third party money fees• Dividends upstream & recap
INVESTMENT GRADECommitted to IG rating but without any
constraint to reach any specific rating target
MONITOR LIQUIDITY OF ASSETS• Listed / unlisted balance• Dividend generation from listed and unlisted
assets
NET DEBT < €3BN
(1) Average cash flow over the next 4 years calculated as Dividend received - financing costs – holding costs + management fees received
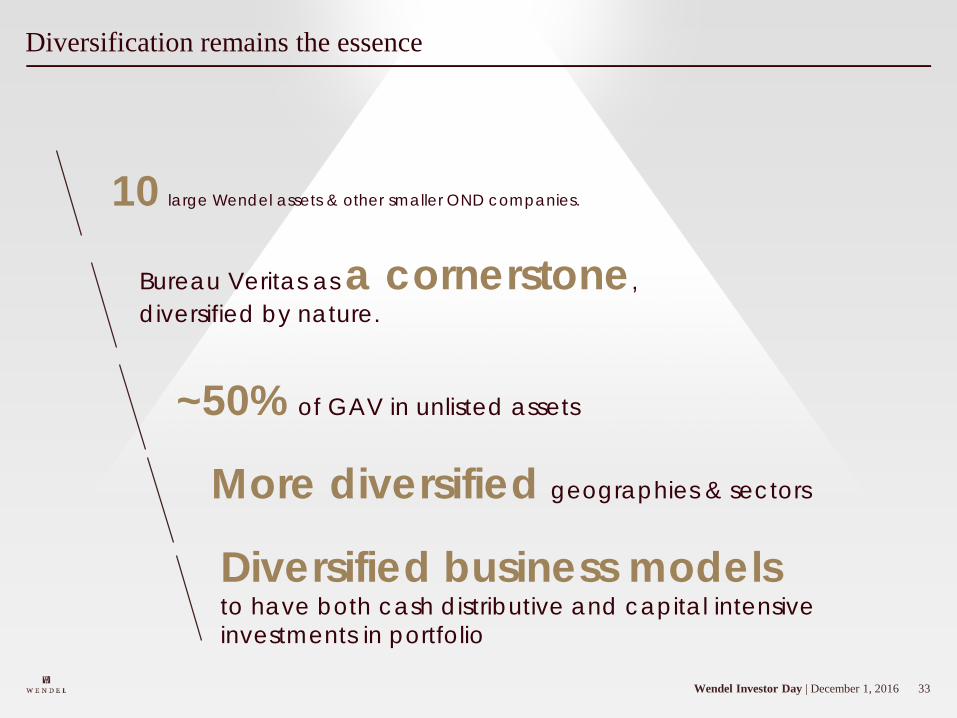
33Wendel Investor Day | December 1, 2016
Diversification remains the essence
10 large Wendel assets & other smaller OND companies.
More diversified geographies & sectors
~50% of GAV in unlisted assets
Diversified business modelsto have both cash distributive and capital intensive investments in portfolio
Bureau Veritas as a cornerstone, diversified by nature.
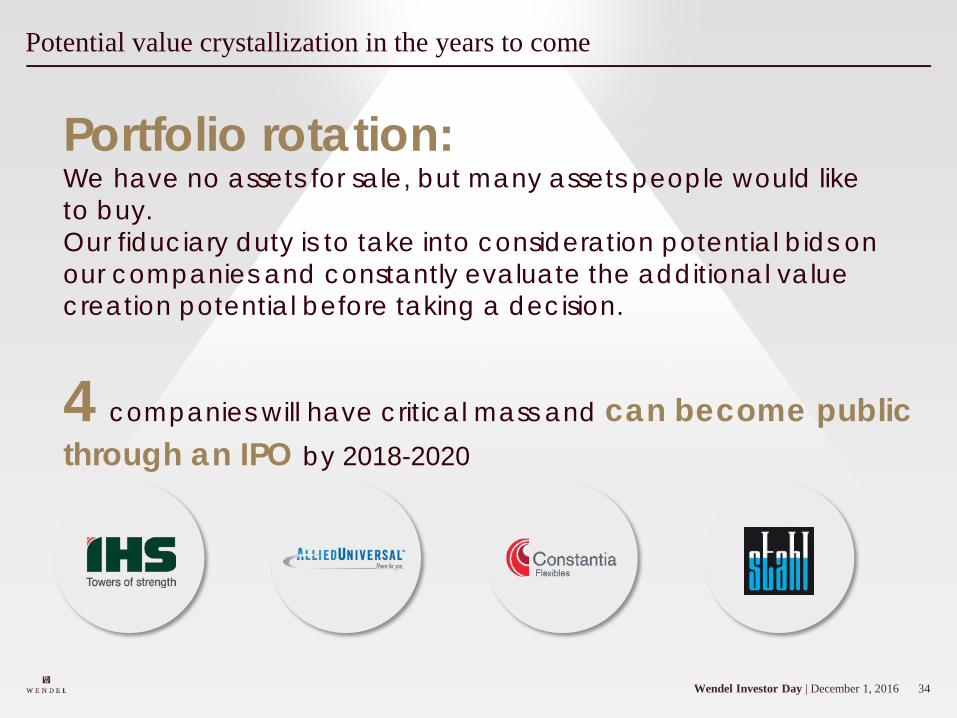
34Wendel Investor Day | December 1, 2016
Potential value crystallization in the years to come
4 companies will have critical mass and can become public through an IPO by 2018-2020
Portfolio rotation:We have no assets for sale, but many assets people would liketo buy. Our fiduciary duty is to take into consideration potential bids on our companies and constantly evaluate the additional value creation potential before taking a decision.
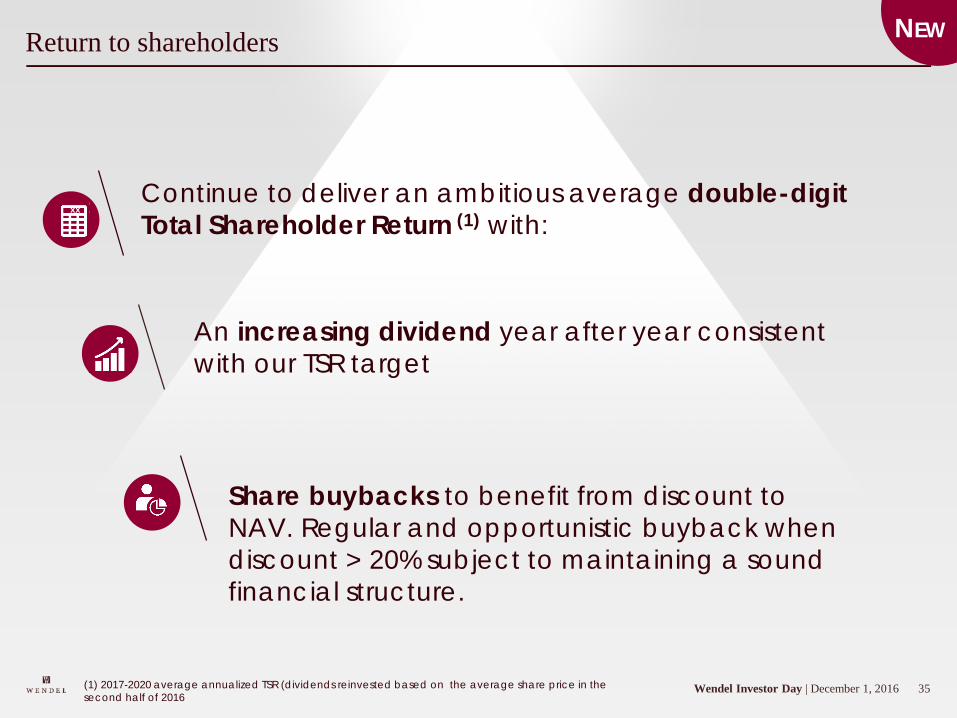
35Wendel Investor Day | December 1, 2016
Return to shareholders
Continue to deliver an ambitious average double-digit Total Shareholder Return (1) with:
An increasing dividend year after year consistent with our TSR target
Share buybacks to benefit from discount to NAV. Regular and opportunistic buyback whendiscount > 20% subject to maintaining a soundfinancial structure.
(1) 2017-2020 average annualized TSR (dividends reinvested based on the average share price in the second half of 2016
NEW
xx
36Wendel Investor Day | December 1, 2016
Conclusion
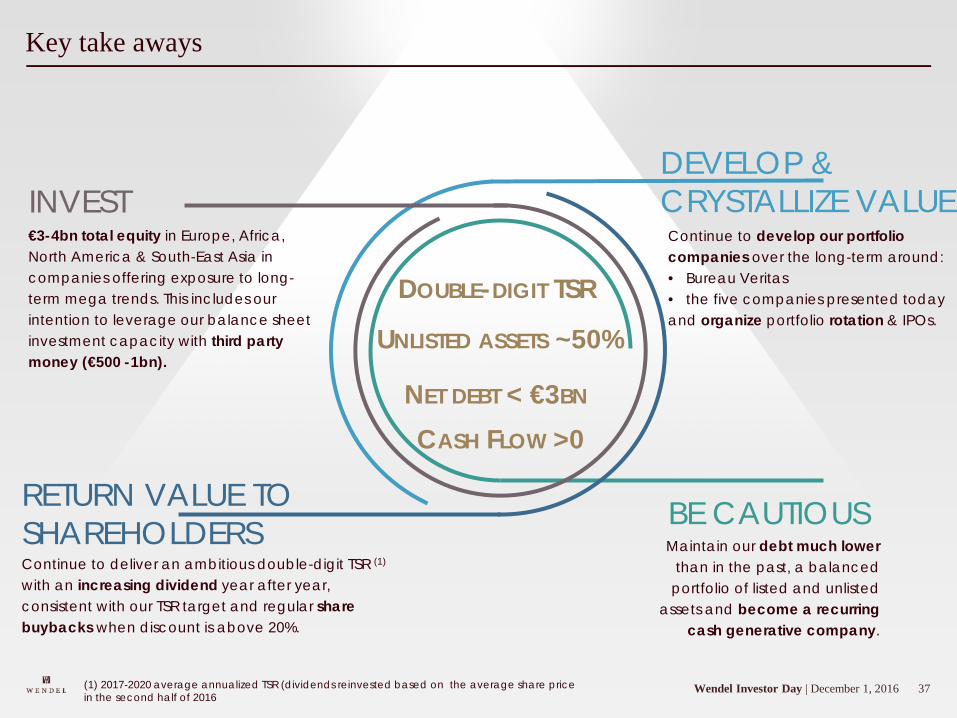
37Wendel Investor Day | December 1, 2016
Key take aways
DEVELOP & CRYSTALLIZE VALUEContinue to develop our portfolio companies over the long-term around:• Bureau Veritas• the five companies presented todayand organize portfolio rotation & IPOs.
RETURN VALUE TO SHAREHOLDERSContinue to deliver an ambitious double-digit TSR (1)
with an increasing dividend year after year, consistent with our TSR target and regular sharebuybacks when discount is above 20%.
BE CAUTIOUSMaintain our debt much lower
than in the past, a balancedportfolio of listed and unlisted
assets and become a recurringcash generative company.
DOUBLE-DIGIT TSR
NET DEBT < €3BN
UNLISTED ASSETS ~50%
CASH FLOW >0
INVEST€3-4bn total equity in Europe, Africa, North America & South-East Asia in companies offering exposure to long-term mega trends. This includes ourintention to leverage our balance sheetinvestment capacity with third party money (€500 -1bn).
(1) 2017-2020 average annualized TSR (dividends reinvested based on the average share pricein the second half of 2016
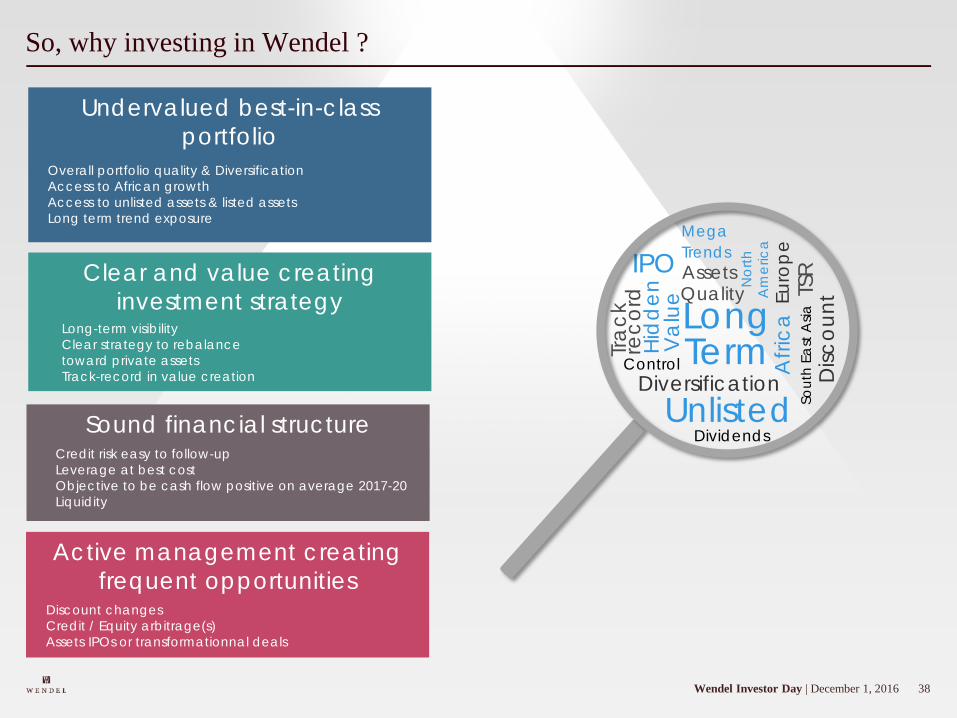
38Wendel Investor Day | December 1, 2016
So, why investing in Wendel ?
Clear and value creating investment strategy
Long-term visibilityClear strategy to rebalance toward private assetsTrack-record in value creation
Sound financial structureCredit risk easy to follow-upLeverage at best costObjective to be cash flow positive on average 2017-20Liquidity
Undervalued best-in-class portfolio
Active management creating frequent opportunities
Afri
caEu
rop
e
UnlistedDiversification
Long TermControl
Assets
Disc
ount
Nor
thA
mer
ica
TSR
reco
rd
IPO
Tra
ck Quality
Hid
den
Va
lue
MegaTrends
Overall portfolio quality & DiversificationAccess to African growthAccess to unlisted assets & listed assetsLong term trend exposure
Discount changes Credit / Equity arbitrage(s)Assets IPOs or transformationnal deals
Sout
h Ea
st A
sia
Dividends
40Wendel Investor Day | December 1, 2016
Appendix
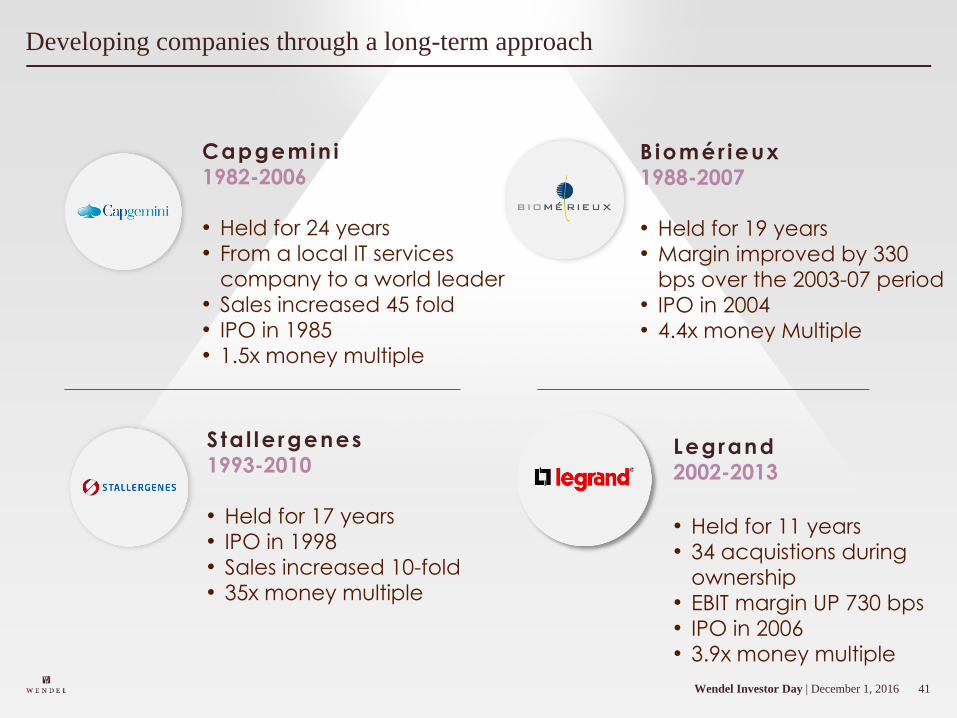
41Wendel Investor Day | December 1, 2016
Biomér ieux
1988-2007
• Held for 19 years
• Margin improved by 330
bps over the 2003-07 period
• IPO in 2004
• 4.4x money Multiple
Sta l le rgenes
1993-2010
• Held for 17 years
• IPO in 1998
• Sales increased 10-fold
• 35x money multiple
Capgemin i
1982-2006
• Held for 24 years
• From a local IT services
company to a world leader
• Sales increased 45 fold
• IPO in 1985
• 1.5x money multiple
Developing companies through a long-term approach
Legrand
2002-2013
• Held for 11 years
• 34 acquistions during
ownership
• EBIT margin UP 730 bps
• IPO in 2006
• 3.9x money multiple
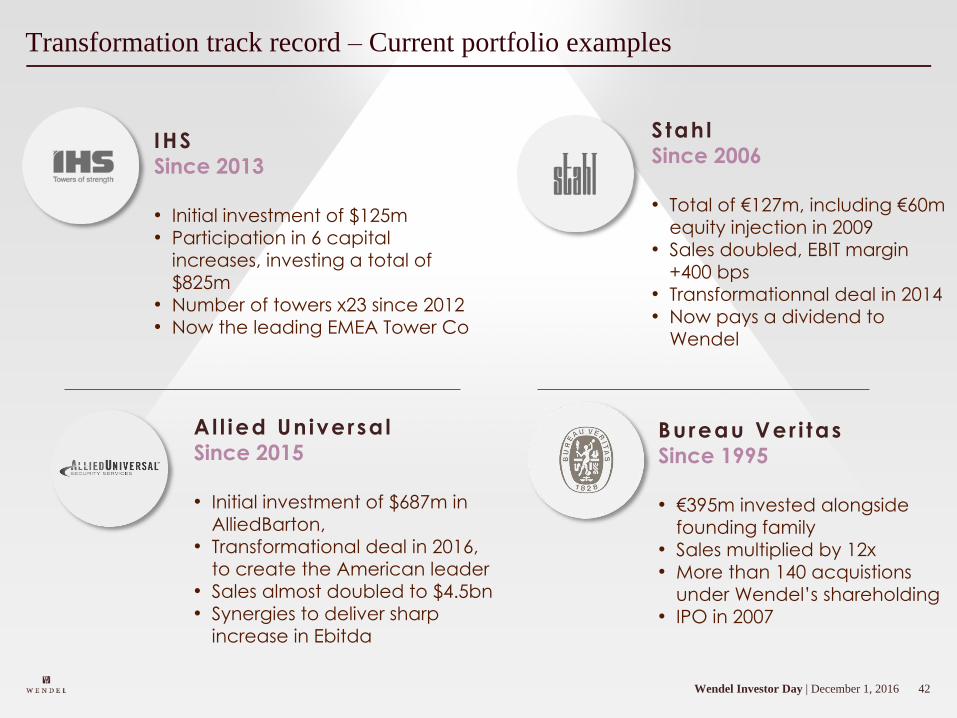
42Wendel Investor Day | December 1, 2016
Transformation track record – Current portfolio examples
IHS
Since 2013
• Initial investment of $125m
• Participation in 6 capital
increases, investing a total of
$825m
• Number of towers x23 since 2012
• Now the leading EMEA Tower Co
Stah l
Since 2006
• Total of €127m, including €60m
equity injection in 2009
• Sales doubled, EBIT margin
+400 bps
• Transformationnal deal in 2014
• Now pays a dividend to
Wendel
Al l ied Un iversa l
Since 2015
• Initial investment of $687m in
AlliedBarton,
• Transformational deal in 2016,
to create the American leader
• Sales almost doubled to $4.5bn
• Synergies to deliver sharp
increase in Ebitda
Bureau Ver i tas
Since 1995
• €395m invested alongside
founding family
• Sales multiplied by 12x
• More than 140 acquistions
under Wendel’s shareholding
• IPO in 2007
43Wendel Investor Day | December 1, 2016
44Wendel Investor Day | December 1, 2016
Disclaimer
• This document has been prepared by Wendel S.E. (“Wendel”) solely for use at the Investor Day presentation, to be held on December 1, 2016. This document must be
treated confidentially by attendees at such presentation and may not be reproduced or redistributed to any other person.
• No representation or warranty, express or implied, is made as to, and no reliance should be placed on, the fairness, accuracy, completeness or correctness of the
information or opinions contained herein and Wendel expressly disclaims any liability relating thereto. Wendel is under no obligation to keep current the information
contained in this presentation and any opinions expressed in this representation are subject to change without notice.
• This document may include forward‐looking statements. These forward‐looking statements relate to Wendel’s and its affiliates’ future prospects, developments and
business strategies and are based on analyses of estimates of amounts not yet determinable. By their nature, forward‐looking statements involve risks and uncertainties.
Wendel cautions you that forward‐looking statements are not guarantees of future performance and that its actual financial condition, actual results of operations and
cash flows and the development of the industries in which Wendel or its affiliates operate may differ materially from those made in or suggested by the forward‐looking
statements contained in this presentation. Wendel does not undertake any obligation to review or confirm analysts’ expectations or estimates or to release publicly any
revisions to any forward‐looking statements to reflect events that occur or circumstances that arise after the date of this document, unless required by law or any
applicable regulation.
• No liability is accepted for the consequences of any reliance upon any statement of any kind (including statements of fact or opinion) contained herein.
• This presentation includes only summary information and must be read in conjunction with Wendel’s Financial Reports, which may be obtained on the website of
Wendel (www.wendelgroup.com) and the Reference Document submitted on April 8, 2016 to the AMF under the number D. 16‐0308. You are invited carefully to take
into consideration the risk factors described in these documents.
• No information provided on this document constitutes, or should be used or considered as, an offer to sell or a solicitation of any offer to buy the securities or services of
Wendel or any other issuer in any jurisdiction whatsoever. Wendel securities have not been and will not be registered under the US Securities Act of 1933, as amended
(the “Securities Act”), and may not be offered or sold in the United States except pursuant to an exemption from, or in a transaction not subject to, the registration
requirements of the Securities Act.
• By attending this presentation and/or accepting this document you agree to be bound by the foregoing limitations.

45IHS - Wendel Investor Day | December 1, 2016
Investor DayDecember 1, 2016
Related Documents