Pets at Home Investor & Analyst Capital Markets Presentation September 2017

Welcome message from author
This document is posted to help you gain knowledge. Please leave a comment to let me know what you think about it! Share it to your friends and learn new things together.
Transcript

nemo2014\Presentations\Analyst Presentation Jan14\201401 Nemo Analyst Presentation Master-22nd Jan FINAL.pptx
Pets at Home Investor & Analyst Capital Markets Presentation
September 2017
nemo2014\Presentations\Analyst Presentation Jan14\201401 Nemo Analyst Presentation Master-22nd Jan FINAL.pptx
Introduction
Ian Kellett Group CEO

nemo2014\Presentations\Analyst Presentation Jan14\201401 Nemo Analyst Presentation Master-22nd Jan FINAL.pptx
Today: a focus on the Group’s strategic and competitive position and our medium term outlook in the sector
2
Growing our overall share in the pet products and services market
1
Bringing convenience to our customers through omnichannel
investment
2
Growing the market and our share in Advanced Nutrition food
3
Giving more service and advice to customers, online and in-store
4
Rolling out new practices and growing ahead of market in our
veterinary business
5
Pursuing bolt-on growth opportunities, particularly in the
veterinary market
6
Group strategic focus and achievements

nemo2014\Presentations\Analyst Presentation Jan14\201401 Nemo Analyst Presentation Master-22nd Jan FINAL.pptx
Afternoon timetable
14.00 – 15.00
Ian Kellett Introduction
Pet market insights and our competitive position
Andrei Balta Vet Group business
Q&A
15.00 – 15.25 Break and networking with Pets at Home colleagues
15.30 – 16.25
Peter Pritchard Retail business
Mike Iddon and Ian Kellett Integrated product and services economics Conclusions
Q&A
16.30 Finish 0
3
Presenter
Presentation Notes
Flag that we will take a break after the Seamless shopping section
nemo2014\Presentations\Analyst Presentation Jan14\201401 Nemo Analyst Presentation Master-22nd Jan FINAL.pptx
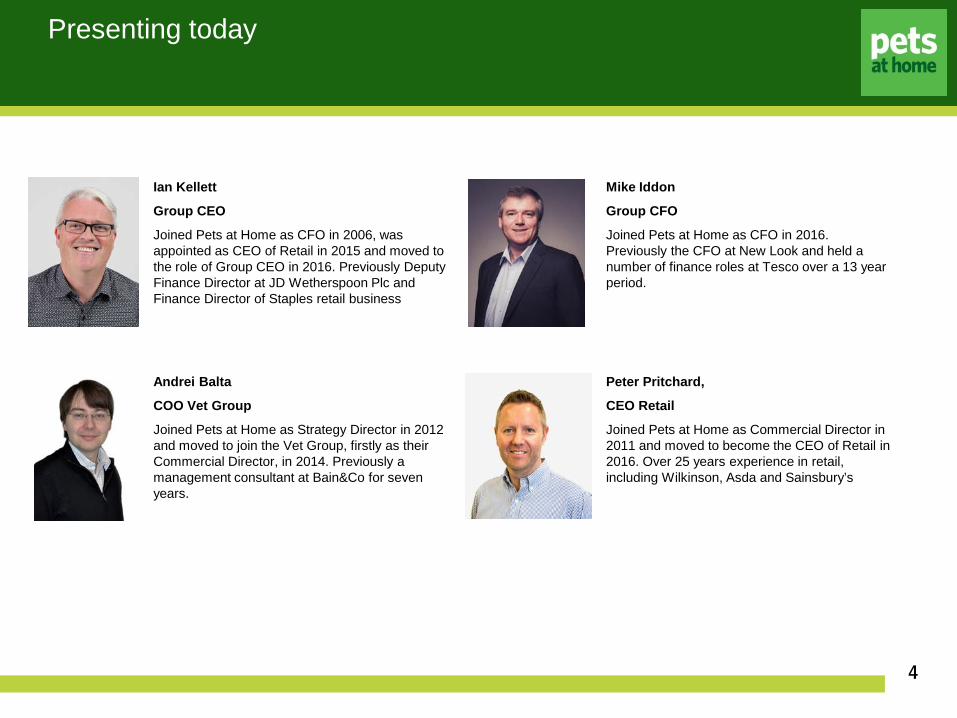
Ian Kellett
Group CEO
Joined Pets at Home as CFO in 2006, was appointed as CEO of Retail in 2015 and moved to the role of Group CEO in 2016. Previously Deputy Finance Director at JD Wetherspoon Plc and Finance Director of Staples retail business
Mike Iddon
Group CFO
Joined Pets at Home as CFO in 2016. Previously the CFO at New Look and held a number of finance roles at Tesco over a 13 year period.
Andrei Balta
COO Vet Group
Joined Pets at Home as Strategy Director in 2012 and moved to join the Vet Group, firstly as their Commercial Director, in 2014. Previously a management consultant at Bain&Co for seven years.
Peter Pritchard,
CEO Retail
Joined Pets at Home as Commercial Director in 2011 and moved to become the CEO of Retail in 2016. Over 25 years experience in retail, including Wilkinson, Asda and Sainsbury’s
Presenting today
4
nemo2014\Presentations\Analyst Presentation Jan14\201401 Nemo Analyst Presentation Master-22nd Jan FINAL.pptx
Pet market insights
Ian Kellett Group CEO

nemo2014\Presentations\Analyst Presentation Jan14\201401 Nemo Analyst Presentation Master-22nd Jan FINAL.pptx
There are multiple factors driving growth in the UK pet market
Vet Group Retail
6
Humanisation of pets
Stable pet numbers
Focus on health &
wellbeing
Expanding vet
procedures
Increasing insurance coverage
Advanced Nutrition
Expected annual growth in UK pet
products and services market 5%
(2016-21)1
1 Source: OC&C
Omnichannel sales

nemo2014\Presentations\Analyst Presentation Jan14\201401 Nemo Analyst Presentation Master-22nd Jan FINAL.pptx
UK pet market growth has been boosted by services and has been more resilient than the general retail market
Vet Group Retail
7
100
102
104
106
108
110
112
114
116
118
120
2012 2013 2014 2015 2016
Mar
ket g
row
th (r
ebas
ed)
UK General Retail Pet Products Pet Market including Services
Source: UK General Retail data: ONS Value Seasonally Adjusted: All Retailers excluding fuel. Pet products and market data: OC&C 2017.
UK general retail market vs. pet retail market growth
nemo2014\Presentations\Analyst Presentation Jan14\201401 Nemo Analyst Presentation Master-22nd Jan FINAL.pptx
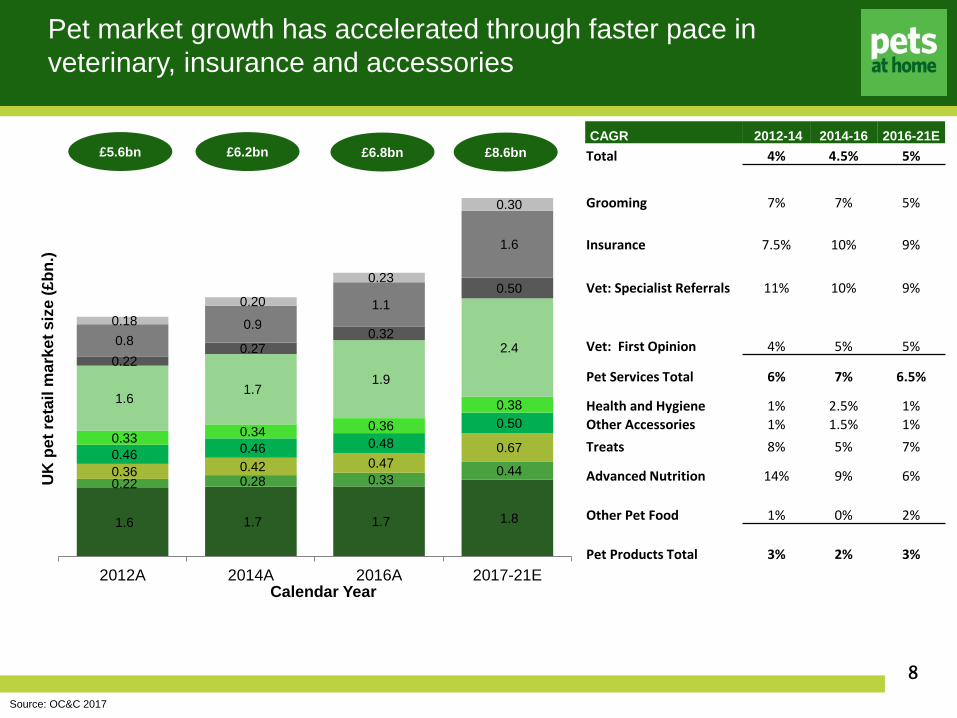
Pet market growth has accelerated through faster pace in veterinary, insurance and accessories
Vet Group
8
1.6 1.7 1.7 1.8
0.22 0.28 0.33 0.44 0.36 0.42 0.47 0.67 0.46 0.46 0.48 0.50
0.33 0.34 0.36 0.38 1.6
1.7 1.9
2.4 0.22
0.27 0.32
0.50
0.8 0.9
1.1
1.6
0.18 0.20
0.23
0.30
2012A 2014A 2016A 2017-21E
UK
pet
reta
il m
arke
t siz
e (£
bn.)
Calendar Year
£5.6bn £6.2bn £8.6bn £6.8bn
Source: OC&C 2017
CAGR 2012-14 2014-16 2016-21E Total 4% 4.5% 5%
Grooming 7% 7% 5%
Insurance 7.5% 10% 9%
Vet: Specialist Referrals 11% 10% 9%
Vet: First Opinion 4% 5% 5%
Pet Services Total 6% 7% 6.5%
Health and Hygiene 1% 2.5% 1% Other Accessories 1% 1.5% 1% Treats 8% 5% 7%
Advanced Nutrition 14% 9% 6%
Other Pet Food 1% 0% 2%
Pet Products Total 3% 2% 3%

nemo2014\Presentations\Analyst Presentation Jan14\201401 Nemo Analyst Presentation Master-22nd Jan FINAL.pptx
We remain the UK’s largest pet business
Retail
9
0
100
200
300
400
500
600
700
800
900
FY17
Num
ber o
f Sto
res
Financial Year
Pets at Home Pets Corner Pet HutJolleyes Just For Pets KennelGate
0
200
400
600
800
1000
1200
1400
FY17
Num
ber o
f Pra
ctic
es
Financial Year
Pets at Home CVS IVC Medivet Vet Partners
Source: Annual report and financial statements and company websites.
Vet first opinion practice numbers by competitor Pet store numbers by competitor
Total UK small animal vet
practices c5000

nemo2014\Presentations\Analyst Presentation Jan14\201401 Nemo Analyst Presentation Master-22nd Jan FINAL.pptx
Our total pet product market share has grown from 19% to 20% through 2014-2016
Vet Group Retail
10 Source: OC&C 2017
53%
21%
5% 13%
36%
36% 73% 64%
6%
14% 13%
17%
19%
15%
19%
7%
8%
13%
16%
12%
8% 9% 3%
21%
0%
10%
20%
30%
40%
50%
60%
70%
80%
90%
100%
Advanced Nutrition Bridging Grocery Treats Accessories
Mar
ket S
hare
Pets at Home Grocers Discounters Vets Pet Specialists Online (Specialists and Non-Specialists) Other
Pets at Home Share Change 2014-2016
+2%
Pet product market share by player, 2016
+3% 0% +1% +2%

nemo2014\Presentations\Analyst Presentation Jan14\201401 Nemo Analyst Presentation Master-22nd Jan FINAL.pptx
Stores are an important part of future market growth. Bricks and mortar sales along with C&C expected to grow at 2.7% per annum
Vet Group Retail
11
0
500
1000
1500
2000
2500
3000
3500
4000
4500
2016A 2021E
Expe
cted
UK
Pet
Pro
duct
Mar
ket
Valu
e (£
bn.)
Bricks and Mortar Online Click and Collect Online Deliver to Home
Source: OC&C 2017. Data refers to calendar years.
c15% c11% Online participation
0f pet market
Pet Products Market CAGR
2016-21
Total 3.0%
Online Deliver to Home 5.3%
Online Click and Collect 30.0%
Bricks and Mortar 2.1%
2.7%

nemo2014\Presentations\Analyst Presentation Jan14\201401 Nemo Analyst Presentation Master-22nd Jan FINAL.pptx
The vet market continues to consolidate and we are one of three major players with leading market share
Vet Group Retail
12
0%
10%
20%
30%
40%
50%
60%
70%
80%
90%
100%
2012 2014 2016
Mar
ket S
hare
PAH JV CVS Medivet IVC Other
Source: OC&C 2017 and Pets at Home estimates
0%
10%
20%
30%
40%
50%
60%
70%
80%
90%
100%
Actual Estimated Mature
Mar
ket S
hare
PAH JV CVS Medivet IVC Other
Note: Data refers to calendar years, by estimated revenue per practice.
If all our existing practices were mature, estimated PAH share would be 18%
PAH Vet Group has a 12% market share with a young practice estate
nemo2014\Presentations\Analyst Presentation Jan14\201401 Nemo Analyst Presentation Master-22nd Jan FINAL.pptx
Unique competitive position
Ian Kellett Group CEO

nemo2014\Presentations\Analyst Presentation Jan14\201401 Nemo Analyst Presentation Master-22nd Jan FINAL.pptx
Unique integrated product and service offering
Vet Group Retail
14

nemo2014\Presentations\Analyst Presentation Jan14\201401 Nemo Analyst Presentation Master-22nd Jan FINAL.pptx
And a differentiated competitive position in the pet market
15
Grocers/discounters
Online specialists
Online generalists
Vet groups
Product range
Vet or groom services
Online platform
Omnichannel capabilities
Expertise & advice
Value & price
Convenience
Customer pet data
nemo2014\Presentations\Analyst Presentation Jan14\201401 Nemo Analyst Presentation Master-22nd Jan FINAL.pptx
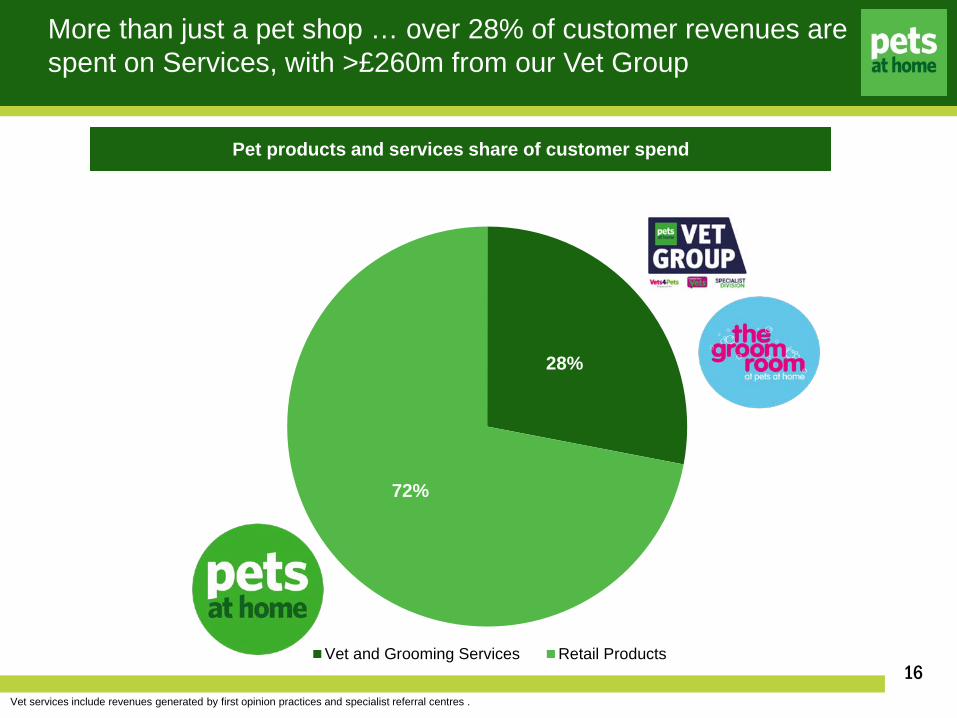
More than just a pet shop … over 28% of customer revenues are spent on Services, with >£260m from our Vet Group
Vet Group Retail
16
28%
72%
Vet and Grooming Services Retail Products
Pet products and services share of customer spend
Vet services include revenues generated by first opinion practices and specialist referral centres .
nemo2014\Presentations\Analyst Presentation Jan14\201401 Nemo Analyst Presentation Master-22nd Jan FINAL.pptx
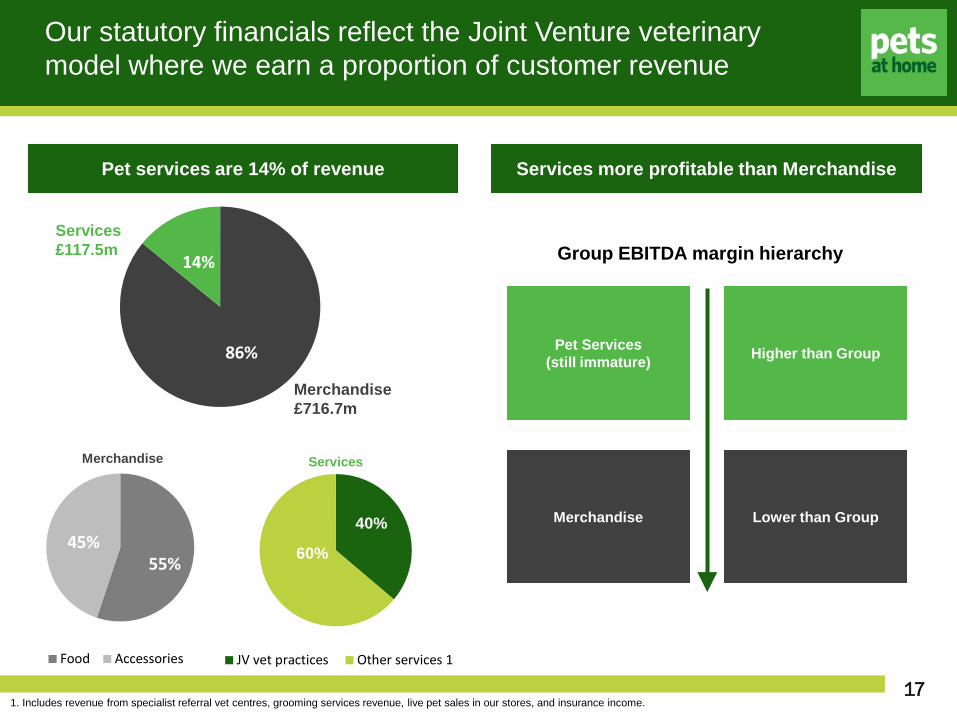
JV vet practices Other services 1
55% 45%
Food Accessories
86%
14%
Pet Services (still immature)
Merchandise
Higher than Group
Lower than Group
Group EBITDA margin hierarchy
Merchandise £716.7m
Services £117.5m
Our statutory financials reflect the Joint Venture veterinary model where we earn a proportion of customer revenue
17 1. Includes revenue from specialist referral vet centres, grooming services revenue, live pet sales in our stores, and insurance income.
Services more profitable than Merchandise Pet services are 14% of revenue
40%
60%
Merchandise Services

nemo2014\Presentations\Analyst Presentation Jan14\201401 Nemo Analyst Presentation Master-22nd Jan FINAL.pptx
Having an integrated product and services offering drives overall customer spend and frequency
Vet Group
18
Store Only Store and Web Store & Web &Groomer
Store & Vet & Web Store & Vet & Web &Groomer
Spen
d pe
r ann
um (£
)
Customer type
Store Vet Online Groom
£490 £339 £76 £- £-
£396 £245 £295 £195 £125
VIP loyalty card data: average yearly spend of product and services customers
34 22 19 11 6 Customer
Transactions per annum
Services spend
Store spend

nemo2014\Presentations\Analyst Presentation Jan14\201401 Nemo Analyst Presentation Master-22nd Jan FINAL.pptx
Rollout of vet practices and grooming salons, along with marketing, is encouraging more VIPs to purchase product & services
0
50,000
100,000
150,000
200,000
250,000
300,000
350,000
400,000
450,000
500,000
FY15 FY16 FY17
+36%
+14%
19
Number of VIP loyalty card members who purchase both products and a service

nemo2014\Presentations\Analyst Presentation Jan14\201401 Nemo Analyst Presentation Master-22nd Jan FINAL.pptx
Our strategy is designed to maximise our competitive position and market opportunity
Price, innovation, services & advice
Vet practice maturity
Optimised Store & Services Rollout
Key Growth Drivers
Driv
ers
of C
ore
Gro
wth
Like For Like
Space
Margin
VIP club members
Omnichannel
Vet Group
Private label mix
20
nemo2014\Presentations\Analyst Presentation Jan14\201401 Nemo Analyst Presentation Master-22nd Jan FINAL.pptx
Vet Group
Andrei Balta Vet Group COO

nemo2014\Presentations\Analyst Presentation Jan14\201401 Nemo Analyst Presentation Master-22nd Jan FINAL.pptx
Our core business is first opinion small animal veterinary practices, with recent extension into specialist referral care
22
Vet Group Retail
438 practices at end FY17 289 in-store 149 standalone
Covers all aspects of general small animal veterinary work: preventative care, emergency care, sick pet work Health plans 24/7 out of hours care Extended hours Own brand nutraceuticals
Internal medicine Oncology Orthopaedic surgery Soft tissue surgery Neurology and neurosurgery Diagnostic imaging
First opinion practices Referral centres
nemo2014\Presentations\Analyst Presentation Jan14\201401 Nemo Analyst Presentation Master-22nd Jan FINAL.pptx
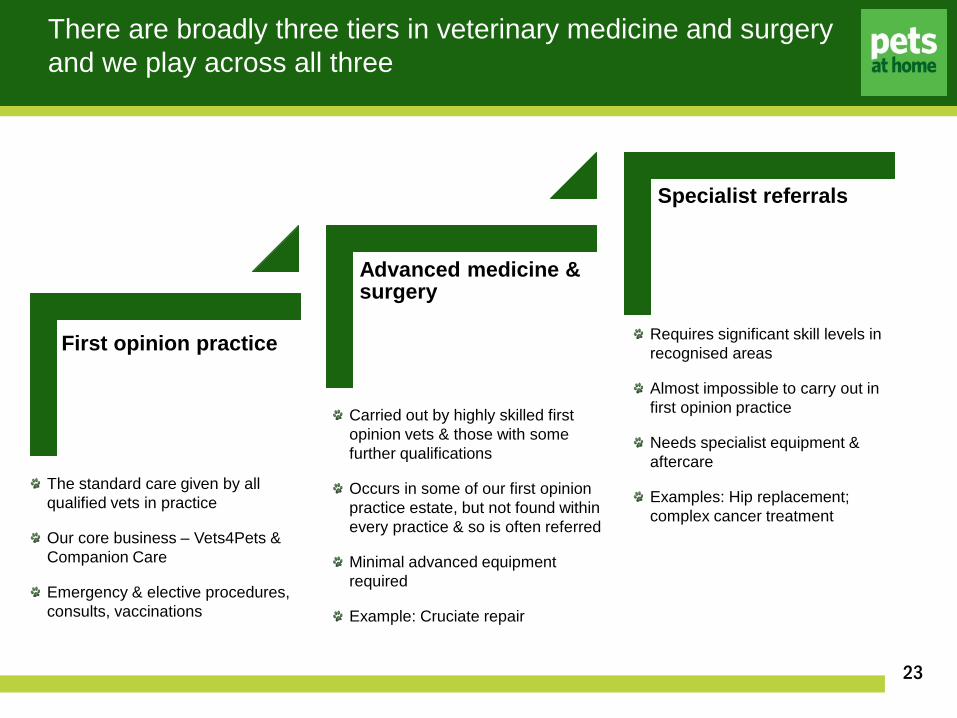
23
First opinion practice
Advanced medicine & surgery
Specialist referrals
The standard care given by all qualified vets in practice
Our core business – Vets4Pets & Companion Care
Emergency & elective procedures, consults, vaccinations
Carried out by highly skilled first opinion vets & those with some further qualifications
Occurs in some of our first opinion practice estate, but not found within every practice & so is often referred
Minimal advanced equipment required
Example: Cruciate repair
Requires significant skill levels in recognised areas
Almost impossible to carry out in first opinion practice
Needs specialist equipment & aftercare
Examples: Hip replacement; complex cancer treatment
There are broadly three tiers in veterinary medicine and surgery and we play across all three
nemo2014\Presentations\Analyst Presentation Jan14\201401 Nemo Analyst Presentation Master-22nd Jan FINAL.pptx
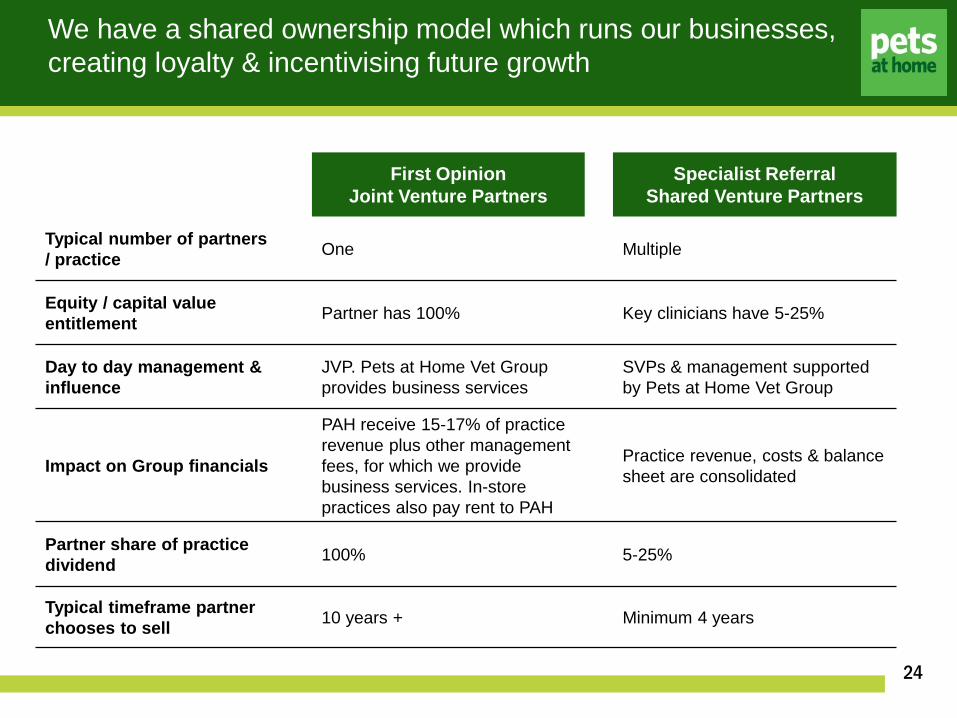
We have a shared ownership model which runs our businesses, creating loyalty & incentivising future growth
24
First Opinion Joint Venture Partners
Specialist Referral Shared Venture Partners
Typical number of partners / practice One Multiple
Equity / capital value entitlement Partner has 100% Key clinicians have 5-25%
Day to day management & influence
JVP. Pets at Home Vet Group provides business services
SVPs & management supported by Pets at Home Vet Group
Impact on Group financials
PAH receive 15-17% of practice revenue plus other management fees, for which we provide business services. In-store practices also pay rent to PAH
Practice revenue, costs & balance sheet are consolidated
Partner share of practice dividend 100% 5-25%
Typical timeframe partner chooses to sell 10 years + Minimum 4 years
nemo2014\Presentations\Analyst Presentation Jan14\201401 Nemo Analyst Presentation Master-22nd Jan FINAL.pptx
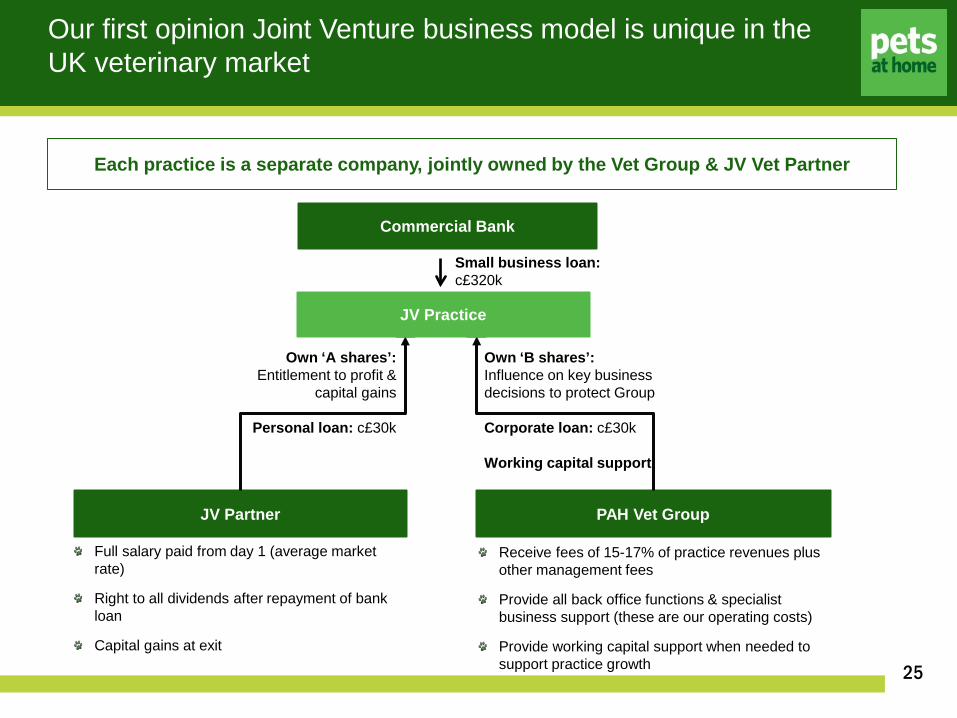
Our first opinion Joint Venture business model is unique in the UK veterinary market
25
JV Partner PAH Vet Group
Own ‘A shares’: Entitlement to profit &
capital gains
Personal loan: c£30k
Own ‘B shares’: Influence on key business decisions to protect Group Corporate loan: c£30k Working capital support
Full salary paid from day 1 (average market rate)
Right to all dividends after repayment of bank loan
Capital gains at exit
Receive fees of 15-17% of practice revenues plus other management fees
Provide all back office functions & specialist business support (these are our operating costs)
Provide working capital support when needed to support practice growth
JV Practice
Commercial Bank
Small business loan: c£320k
Each practice is a separate company, jointly owned by the Vet Group & JV Vet Partner

nemo2014\Presentations\Analyst Presentation Jan14\201401 Nemo Analyst Presentation Master-22nd Jan FINAL.pptx
Our Joint Venture partnership model provides a number of important advantages
26
Vet Group Our competitive advantage Vs corporate
competitors Vs independents
JV Partner highly motivated to drive business: sense of ownership and potential for high returns
Employed colleagues lack incentive to drive business to full potential
Independent ownership creates motivation but responsibility daunting to many vets
Business support from Vet Group provides expert support in non-clinical areas, leveraging our scale and expertise
Business support provided centrally
Vets responsible for clinical and non-clinical issues, often lacking core business capabilities. Minimal benefits of scale
National Brand provides opportunity to reach customers at scale
Closest competitors have no national branding
Can build local reputation, but not national
Association with Pets at Home provides access to highly engaged VIP members and PAH colleague advocates
No association with national retailer to leverage
Local relationships cannot replicate VIP or PAH opportunity
Growth plans focused on highly repeatable new opening model
Minimal number of new openings. Growth dependent on acquisitions
New opening challenging due to funding constraints and risk of new entity
nemo2014\Presentations\Analyst Presentation Jan14\201401 Nemo Analyst Presentation Master-22nd Jan FINAL.pptx
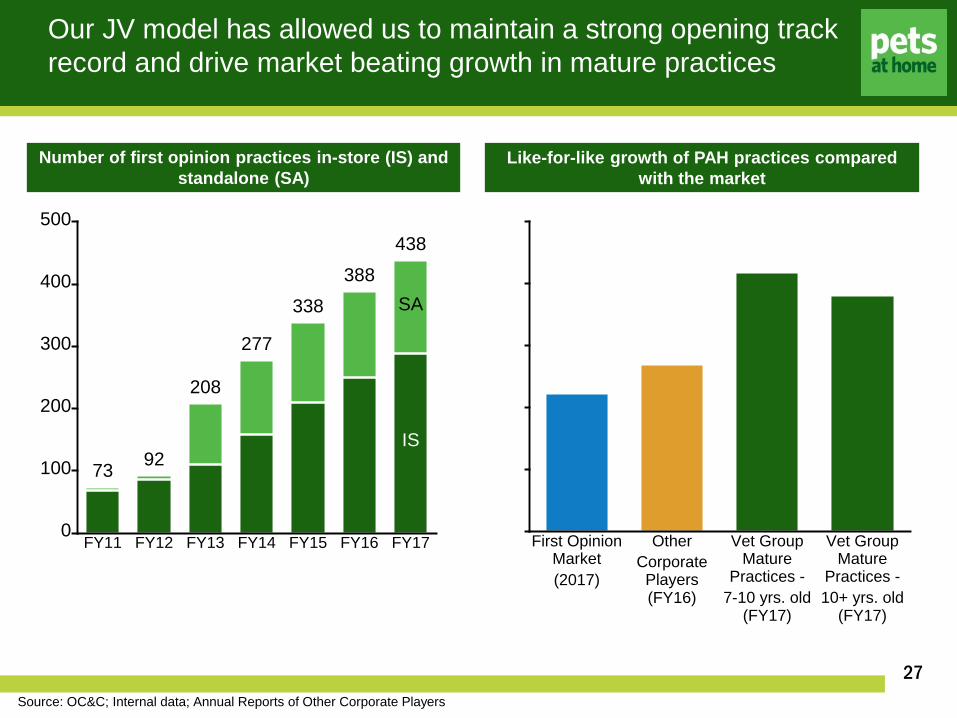
Our JV model has allowed us to maintain a strong opening track record and drive market beating growth in mature practices
27
0
100
200
300
400
500
Pets at Home Vet Group Practices
FY11
73
FY12
92
FY13
208
FY14
277
FY15
338
FY16
388
FY17
IS
SA
438
Like-for-like growth
First Opinion
Market
(2017)
Other
Corporate
Players
(FY16)
Vet Group
Mature
Practices -
7-10 yrs. old
(FY17)
Vet Group
Mature
Practices -
10+ yrs. old
(FY17)
Source: OC&C; Internal data; Annual Reports of Other Corporate Players
Number of first opinion practices in-store (IS) and standalone (SA)
Like-for-like growth of PAH practices compared with the market

nemo2014\Presentations\Analyst Presentation Jan14\201401 Nemo Analyst Presentation Master-22nd Jan FINAL.pptx
Our First Opinion strategy is built around four pillars and underpinned by preparing for future scale
28
Vet Group
Build our brand
Be the best place to work
Put our clients first
Deliver world class support
Prepare for future scale

nemo2014\Presentations\Analyst Presentation Jan14\201401 Nemo Analyst Presentation Master-22nd Jan FINAL.pptx
0
20
40
60
80
Feb-16 Jul-16 Oct-16 Feb-17
Advocacy
Building our brand: We have the most recognised brand in the UK vet market and it is well perceived
29
Vet Group
0
20
40
60%
Vets4P
ets
Medive
t
Compa
nion
CareIV
C
Best F
riend
sCVS
Godda
rd
Prompted awareness of UK veterinary
groups among regular vet users
Source: PAH Annual Survey 2017; Millward Brown metrics Advocacy measured as % of people who would recommend this brand to a friend or colleague
Advocacy – measured as the percentage of people who would recommend the brand
Prompted awareness of UK veterinary groups amongst regular vet users

nemo2014\Presentations\Analyst Presentation Jan14\201401 Nemo Analyst Presentation Master-22nd Jan FINAL.pptx
Build our brand: Our strong brand allows us to achieve national, regional and local visibility
30
Vet Group
Our TV campaigns had an annual reach of 46m in the last 12 months
We’ve built unique relationships with national charities to help
attract rehoming clients
We’re creating regional partnerships and educating pet
owners alongside building awareness of our brand
We can build strong local messages, reinforcing the local nature alongside our national
brand

nemo2014\Presentations\Analyst Presentation Jan14\201401 Nemo Analyst Presentation Master-22nd Jan FINAL.pptx
Be the best place to work: We’re focused on being the employer of choice for clinical and non-clinical colleagues
31
Vet Group
Graduate programme refreshed & extended
International Intern programme
Everywoman Programme
Nursing Academy
Nurse & VCA Apprenticeships
Nurse Conference & Continuing Professional Development (CPD)
Reception Academy
Healthcare Plan modules
JVP Development Journey
Our focus on colleague engagement and wellbeing differentiates us from our competitors
Vets Nurses Non-clinical

nemo2014\Presentations\Analyst Presentation Jan14\201401 Nemo Analyst Presentation Master-22nd Jan FINAL.pptx
Put our clients first: We perform well on the key indicators most important to clients and significant progress has been achieved
32
Vet Group
Source: PAH Vets Group Customer Insights 2017
All Respondents: Key Purchase Criteria Im
port
ance
Great cu
stomer
serv
ice
Conv
enien
t loc
ation
Been
trea
ting my p
ets f
or ye
ars
Prem
ises h
ave n
ice lo
ok an
d fee
l
I can
alway
s see
the s
ame v
et
Reco
mmen
ded by
frien
d/oll
eagu
e
Lowes
t pric
e
Reco
mmen
ded by
staff
in pe
t sho
p
Vet a
nd nur
ses a
re w
ell
traine
d &
profes
siona
l
All s
ervic
es m
y pet nee
ds
Conv
enien
t ope
ning ho
urs
Open for e
mer
genc
ies
at nigh
ts an
d at w
eeke
nds
Spec
ialist
vets
at th
e pra
ctice
Good va
lue fo
r mon
ey
Reco
mmen
ded on
line
Reco
mmen
ded by
my b
reed
er
V4P 2017V4P 2014
Local
independents
Key purchase criteria and ratings of our practices compared with independents

nemo2014\Presentations\Analyst Presentation Jan14\201401 Nemo Analyst Presentation Master-22nd Jan FINAL.pptx
Deliver world class Partner support: Strong support system in place around Partners that we are constantly investing in
33
Vet Group

nemo2014\Presentations\Analyst Presentation Jan14\201401 Nemo Analyst Presentation Master-22nd Jan FINAL.pptx
Deliver world class Partner support: Helping JVPs develop their mature businesses is an important part of our support
34
Vet Group Expand mature practice Acquire multiple sites Sell their ownership
Developing “super surgeries” and 24/7 – space and time expansion of existing mature practices
Example Mature practice opened in 1998
FY 15/16: Customer revenue £2.0M
Dec. 2015: added 3 consults and 1 theatre
Dec. 2016: launched 24/7
Customer revenue LfL growth FY18 YTD; 28%
Practice EBITDA LFL growth 48%
JVPs can acquire a stake in multiple practices
Example
JVP opened first in-store practice July 2010
Opened 2nd site with 2nd JVP in 2011
JVP now holds stake in 5 practices, already drawing dividends from 2010 opening
Mentors younger vets to become Co-Partners
Opportunity to work together across cluster i.e. 24/7, CT scanner facilities
JVPs exit their practice by selling A shares to another vet (approved by PAH). All profits belong to the JVP
Example Practice opened July 2010. Partner decided to exit September 2016 to allow change in lifestyle
Sold for £0.6m
Practice LfL growth post sale 13% vs 9% pre sale Uptick in growth expected post sale: “JVP effect”
nemo2014\Presentations\Analyst Presentation Jan14\201401 Nemo Analyst Presentation Master-22nd Jan FINAL.pptx
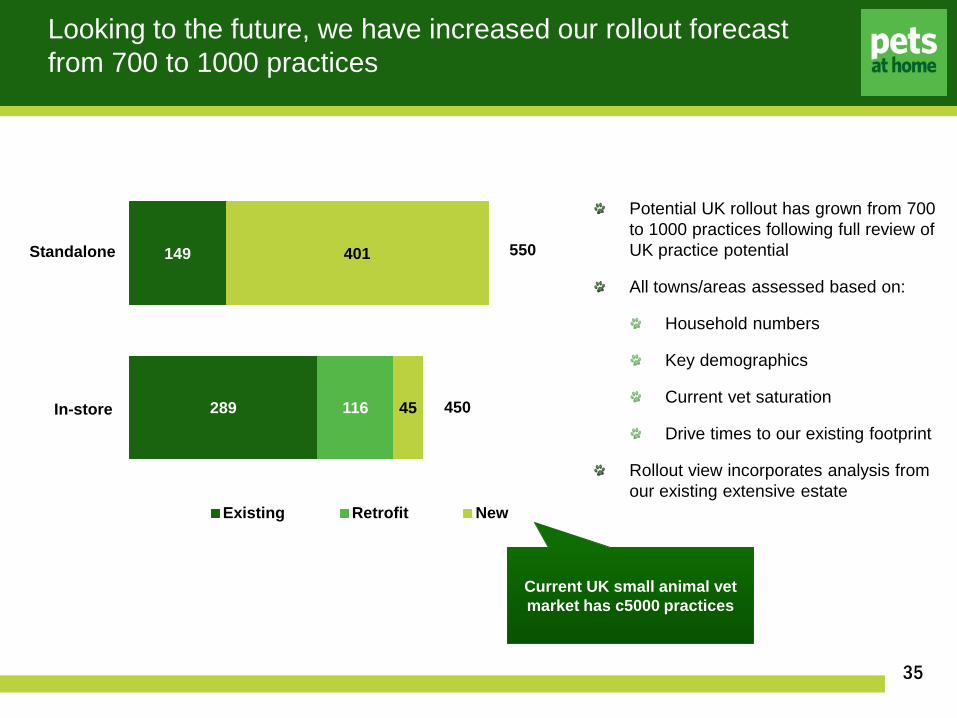
Looking to the future, we have increased our rollout forecast from 700 to 1000 practices
35
Vet Group
Potential UK rollout has grown from 700 to 1000 practices following full review of UK practice potential
All towns/areas assessed based on:
Household numbers
Key demographics
Current vet saturation
Drive times to our existing footprint
Rollout view incorporates analysis from our existing extensive estate
Current UK small animal vet market has c5000 practices
289
149
116 45
401
Existing Retrofit New
550
450 In-store
Standalone

nemo2014\Presentations\Analyst Presentation Jan14\201401 Nemo Analyst Presentation Master-22nd Jan FINAL.pptx
Entering the specialist market brings financial & reputational benefits to the Group
36
A natural adjacency in the veterinary market where we have core competency
Incremental market spend & share of wallet opportunity with existing clients
Enhances our reputation with clients, potential Joint Venture vet partners & employed vets / nurses
Offers world class CPD to our first opinion vets & nurses
Internal Medicine
Oncology
Ophthalmology
Cardiology
Neurology
Orthopeadics
Spinal Surgery
Diagnostic Imaging

nemo2014\Presentations\Analyst Presentation Jan14\201401 Nemo Analyst Presentation Master-22nd Jan FINAL.pptx
Our specialist division is performing well and growing ahead of the market rate
Market
PAH Vet Group
Specialist
Division
Specialist Like for Like growth
122.9
Source: Market data based on FY17 to FY18 full year, OC&C; PAH VG based on YTD
Like-for-like growth in our referral centres is 12 percentage points ahead of the overall market
37
nemo2014\Presentations\Analyst Presentation Jan14\201401 Nemo Analyst Presentation Master-22nd Jan FINAL.pptx
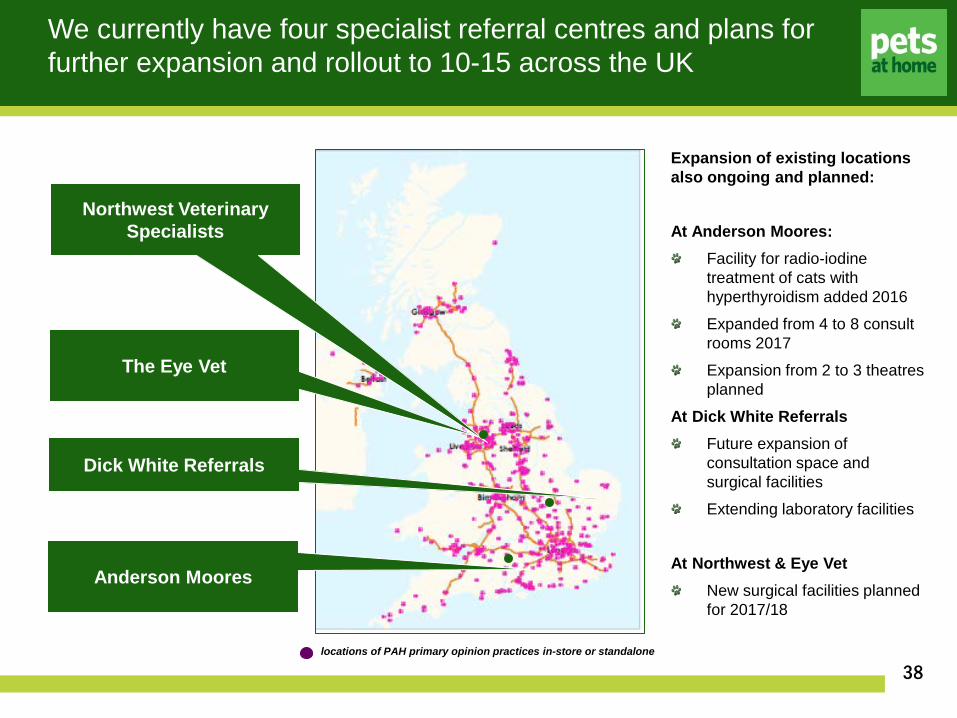
We currently have four specialist referral centres and plans for further expansion and rollout to 10-15 across the UK
38 locations of PAH primary opinion practices in-store or standalone
Northwest Veterinary Specialists
Dick White Referrals
Anderson Moores
The Eye Vet
Expansion of existing locations also ongoing and planned:
At Anderson Moores: Facility for radio-iodine treatment of cats with hyperthyroidism added 2016
Expanded from 4 to 8 consult rooms 2017
Expansion from 2 to 3 theatres planned
At Dick White Referrals Future expansion of consultation space and surgical facilities
Extending laboratory facilities
At Northwest & Eye Vet New surgical facilities planned for 2017/18
nemo2014\Presentations\Analyst Presentation Jan14\201401 Nemo Analyst Presentation Master-22nd Jan FINAL.pptx
<1 Year 1-2 Years 3- 4 Years 5-6 Years 7-10Years
10+ Years
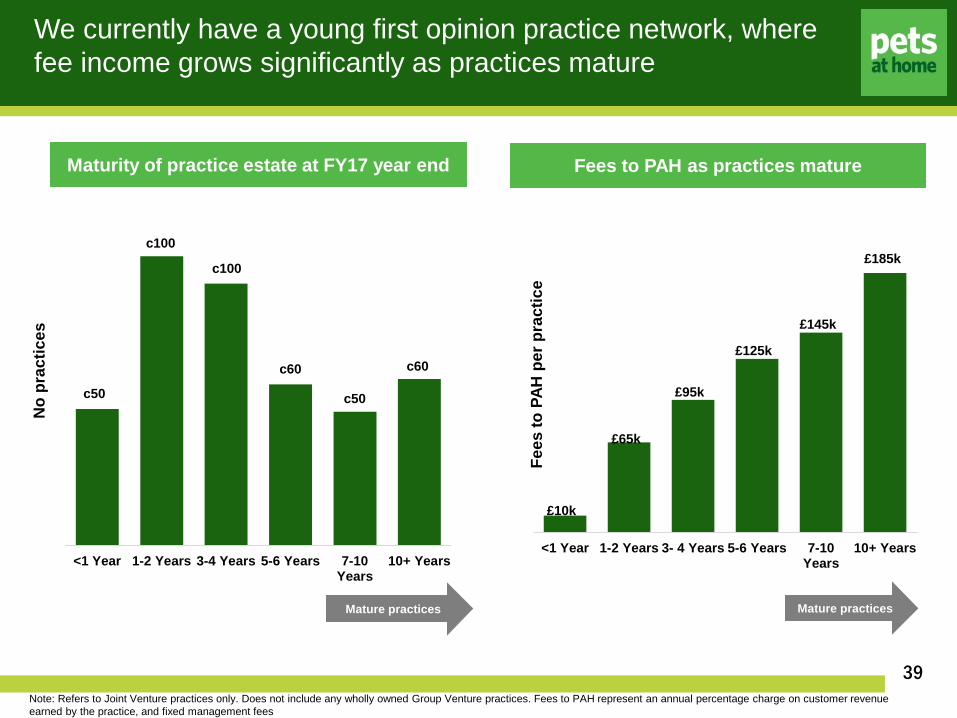
We currently have a young first opinion practice network, where fee income grows significantly as practices mature
39
Maturity of practice estate at FY17 year end
No
prac
tices
Fees to PAH as practices mature
Mature practices
Fees
to P
AH p
er p
ract
ice
<1 Year 1-2 Years 3-4 Years 5-6 Years 7-10
Years10+ Years
Mature practices
c100
c60
c50
c60
c100
c50
Note: Refers to Joint Venture practices only. Does not include any wholly owned Group Venture practices. Fees to PAH represent an annual percentage charge on customer revenue earned by the practice, and fixed management fees
£10k
£95k
£125k
£145k
£185k
£65k

nemo2014\Presentations\Analyst Presentation Jan14\201401 Nemo Analyst Presentation Master-22nd Jan FINAL.pptx
FY17a FY20e FY23e
The number of mature practices is expected to almost double by FY20 and more than triple by FY23
40
Number of mature practices aged 7 years and older
Almost double the number of mature practices vs FY17
c110
>200
>350
Note: Mature practices refers to Joint Venture practices aged 7+ years. The generation of mature practices to FY23 does not require any further new practice openings

nemo2014\Presentations\Analyst Presentation Jan14\201401 Nemo Analyst Presentation Master-22nd Jan FINAL.pptx
£0m
£25m
£50m
£75m
£100m
FY17a FY20e FY23e
Fees from new openings & immature practices Fees from Mature Practices
As we roll out towards reaching 1000 practices, our fee income is expected to double
41
Tota
l fee
inco
me
to P
AH
c50% expected increase from current fees
Expected doubling of current fees
Note: Future rollout estimated at 40 practices per annum. Fee income forecasts are based upon the FY17 average fee income for practice cohorts as they age, shown on slide 20 and inflated at c1% per annum. Fees from mature practices includes those aged 7+ years

nemo2014\Presentations\Analyst Presentation Jan14\201401 Nemo Analyst Presentation Master-22nd Jan FINAL.pptx
£0
£40,000
£80,000
£120,000
£160,000
£200,000
<1 Year 1-2 Years 3- 4 Years 5-6 Years 7-10 Years 10+ Years
Fees to PAH Incremental PAH costs per new practice opening
The mainly fixed Support Office costs mean that margin leverage is delivered as our first opinion practices mature
42
Incremental costs are additional Support Office colleagues when the practice opens. Colleague costs will then grow at c5% per
annum
Tota
l fee
inco
me
and
cost
s to
PAH

nemo2014\Presentations\Analyst Presentation Jan14\201401 Nemo Analyst Presentation Master-22nd Jan FINAL.pptx
Overall Vet Group economics: there is an opportunity to significantly increase EBITDA both through maturation and rollout
43
FY17a Current Vet Group (438practices, 4 referral centres)
MATURE Current Vet Group(438 practices, 4 referral
centres)
MATURE Full UK rollout VetGroup (700 practices, 4 referral
centres)
MATURE Full UK rollout VetGroup (1000 practices, 4
referral centres)
FY17a Current Vet Group
438 practices, 4 referral centres
Mature Current Vet Group2
438 practices, 4 referral centres
Mature 700 rollout Vet Group,3
700 practices, 4 referral centres
Mature 1000 rollout Vet Group3
1000 practices, 4 referral centres
1. Mature fee income forecasts for first opinion practices are based upon those for FY17 cohorts aged 10+years – with c1% inflation per annum. EBITDA does not include any central cost allocation for the Executive Management team or Pets at Home Group Head Office support. Referral centre revenue and EBITDA is assumed to remain flat from FY17 actuals
2. EBITDA to PAH assumes no additional colleagues required at Vet Group Support Office to support the existing practice base. Colleague costs are inflated at c5% per annum 3. EBITDA to PAH assumes additional colleagues are required at Vet Group Support Office to support new practice openings. New and existing colleague costs are inflated at c5% per
annum
EBITDA1 to Pets at Home from the Vet Group
c2x Today
Today
>3x Today
c5x Today

nemo2014\Presentations\Analyst Presentation Jan14\201401 Nemo Analyst Presentation Master-22nd Jan FINAL.pptx
Future plans … our Vet Group strategy is focused on accelerating growth opportunities
44
Build our brand
Be the best place to work
Put our clients first
Deliver world class support
Build scale and grow share across the veterinary market
nemo2014\Presentations\Analyst Presentation Jan14\201401 Nemo Analyst Presentation Master-22nd Jan FINAL.pptx
Retail business
Peter Pritchard Retail CEO

nemo2014\Presentations\Analyst Presentation Jan14\201401 Nemo Analyst Presentation Master-22nd Jan FINAL.pptx
We hold a position of significant share and strength within the pet products market
46
Share of total pet product market
Supermarkets
Online specialists and generalists
Store specialists
Vet practices
Share of pet product market excluding grocery food & treats
20%
46%
8%
7%
6%
13%
40%
7%
16%
12%
13%
11%
Pets at Home
Pets at Home
Supermarkets
Vet practices
Online specialists and generalists
Store specialists
Discounters
Discounters
Note: 2016 estimated market shares Source: OC&C 2016 and PAH pet owner survey 2017

nemo2014\Presentations\Analyst Presentation Jan14\201401 Nemo Analyst Presentation Master-22nd Jan FINAL.pptx
Our points of difference lie in our ability to deliver on all aspects of the market as the only omnichannel products and services provider
47
Omnichannel
Owner and pet data
Colleague advice and expertise
Private label
Subscription platform
Services Strategic
differentiators
nemo2014\Presentations\Analyst Presentation Jan14\201401 Nemo Analyst Presentation Master-22nd Jan FINAL.pptx
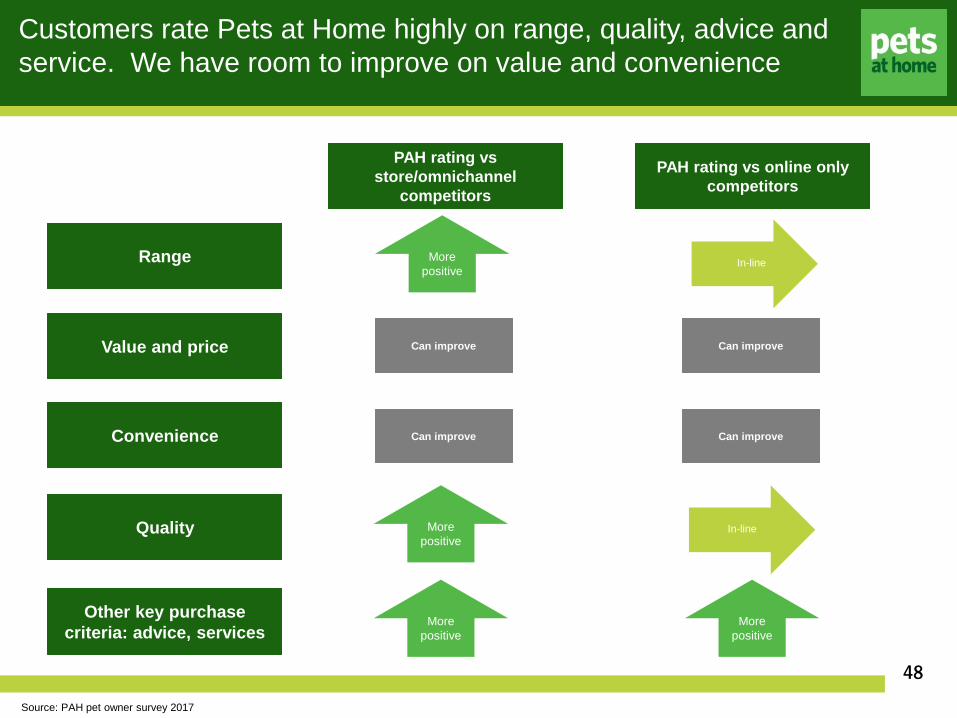
Customers rate Pets at Home highly on range, quality, advice and service. We have room to improve on value and convenience
48
Range
Value and price
Convenience
Quality
PAH rating vs store/omnichannel
competitors
PAH rating vs online only competitors
More positive
More positive
In-line
In-line
Can improve Can improve
Can improve Can improve
Other key purchase criteria: advice, services
More positive
More positive
In-line
Source: PAH pet owner survey 2017

nemo2014\Presentations\Analyst Presentation Jan14\201401 Nemo Analyst Presentation Master-22nd Jan FINAL.pptx
Our immediate strategic focus in retail is based around three key themes: value, competitive advantage and operational leverage
49
Value Competitive Advantage
Operational Leverage
Leveraging the value and quality of our private label
premium foods
Leveraging our points of difference
Driving cost efficiencies
Repositioning prices in branded economy and
Advanced Nutrition foods
Repositioning prices in everyday pet essentials
nemo2014\Presentations\Analyst Presentation Jan14\201401 Nemo Analyst Presentation Master-22nd Jan FINAL.pptx
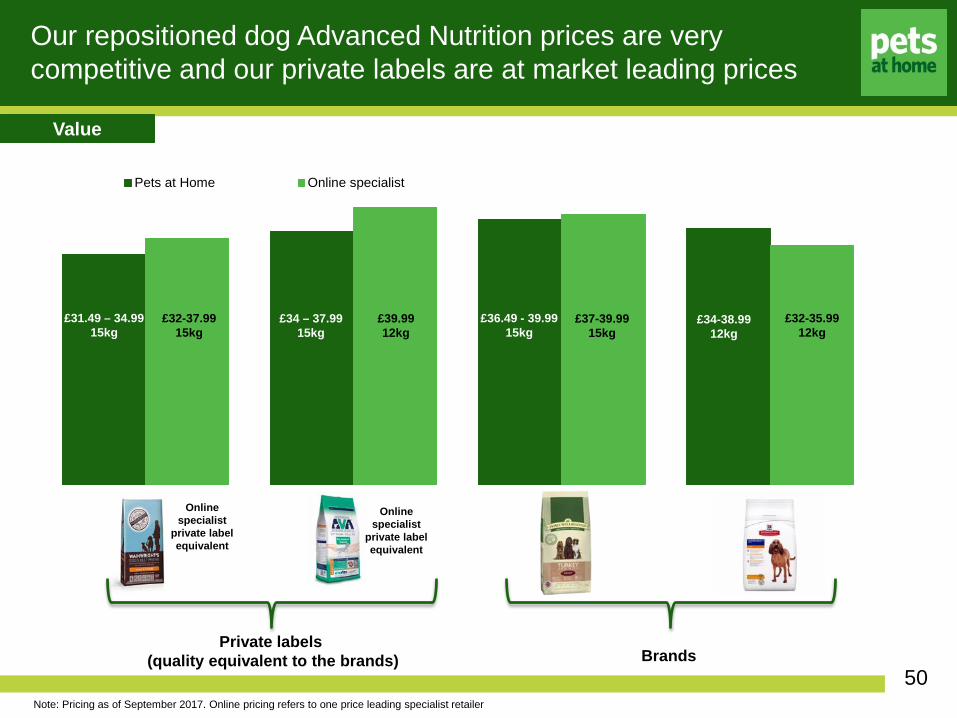
Pets at Home Online specialist
Our repositioned dog Advanced Nutrition prices are very competitive and our private labels are at market leading prices
Online specialist
private label equivalent
Online specialist
private label equivalent
£31.49 – 34.99 15kg
£32-37.99 15kg
Private labels (quality equivalent to the brands) Brands
£39.99 12kg
£37-39.99 15kg
£36.49 - 39.99 15kg
£34-38.99 12kg
£32-35.99 12kg
Note: Pricing as of September 2017. Online pricing refers to one price leading specialist retailer
£34 – 37.99 15kg
Value
50

nemo2014\Presentations\Analyst Presentation Jan14\201401 Nemo Analyst Presentation Master-22nd Jan FINAL.pptx
Note: Charts show relative pricing index vs Pets at Home. Source: Brandview lowest available price compared for LFL products
-20%
0%
20%
40%
60%
80%
100%
120%
140%
Pre Launch�Post launch
Cat Dog
Pet essentials pricing is now on par with the discounters post repositioning
Value
51

nemo2014\Presentations\Analyst Presentation Jan14\201401 Nemo Analyst Presentation Master-22nd Jan FINAL.pptx
100
120
140
160
180
200
220
Jan 17 Feb 17 Mar 17 Apr 17 May 17 Jun 17 Jul 17 Aug 17
We have seen a good response in demand elasticity since repositioning selected dog Advanced Nutrition prices
52
Private label AN volume uplifts are exceeding the deflationary effect
Average price cut c20-30%
And whilst early days we are seeing the same in a branded AN line that we have repositioned
Note: Volumes compare the average uplift since price repositioning with a defined time period before repositioning
Average volume up
>40%
Value
Inde
xed
volu
mes
of d
og A
N p
rivat
e la
bel s
ince
pric
es re
posi
tione
d
Average price cut
c30%
Average volume up
>70%
100
120
140
160
180
200
220
240
260
Apr 17 May 17 Jun 17 Jul 17 Aug 17

nemo2014\Presentations\Analyst Presentation Jan14\201401 Nemo Analyst Presentation Master-22nd Jan FINAL.pptx
Primarily achieved through reactivating old customers and driving brand switching
53
VIPs who have purchased our private label dog Advanced Nutrition products that have had prices repositioned
Of all VIPs who have purchased,
13% were reactivated customers
Value
New to dry food
Switch from another AN
brand
Switched from grocery dog food
Other

nemo2014\Presentations\Analyst Presentation Jan14\201401 Nemo Analyst Presentation Master-22nd Jan FINAL.pptx
Our Autumn marketing campaign will be the first major opportunity to advertise our pricing message to potential new customers
54
Dog food Advanced Nutrition Day to day pet essentials
Grocery food lines
Value
nemo2014\Presentations\Analyst Presentation Jan14\201401 Nemo Analyst Presentation Master-22nd Jan FINAL.pptx
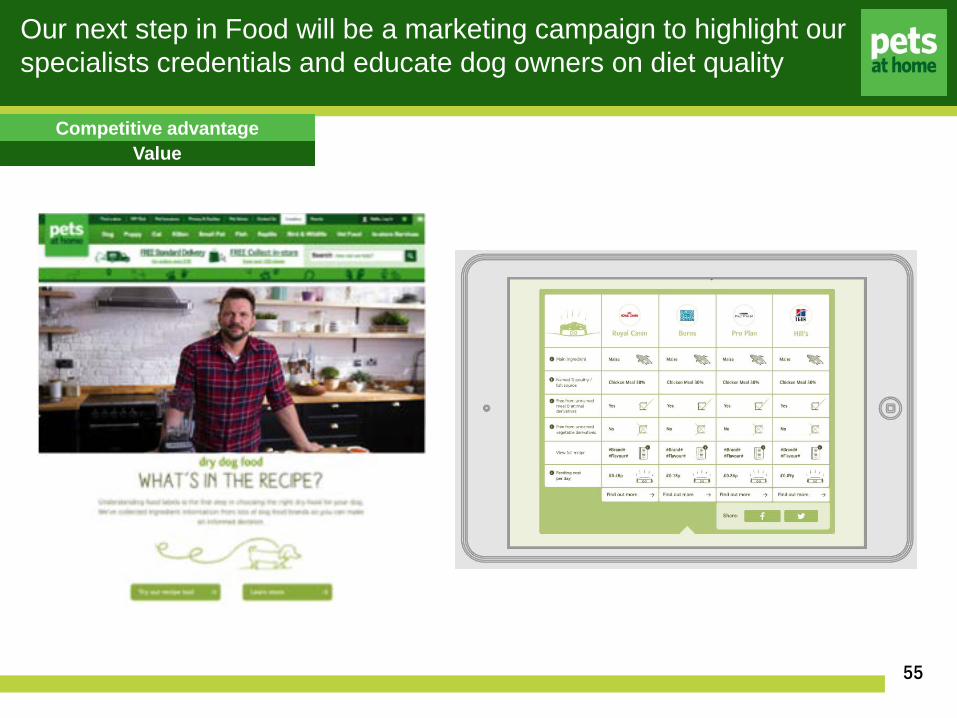
Our next step in Food will be a marketing campaign to highlight our specialists credentials and educate dog owners on diet quality
55
Value Competitive advantage

nemo2014\Presentations\Analyst Presentation Jan14\201401 Nemo Analyst Presentation Master-22nd Jan FINAL.pptx
Order in-store is a differentiator that demonstrates the importance of stores and service from colleagues
• Colleagues have direct access to our full online range through their PetPads
• Customer order can be completed in under two minutes
• With the option to collect the product back in-store or be delivered to home
We estimate c70% of Order in-store revenues are incremental
Driven by sales of product lines from the extended online range
Competitive advantage
56
nemo2014\Presentations\Analyst Presentation Jan14\201401 Nemo Analyst Presentation Master-22nd Jan FINAL.pptx
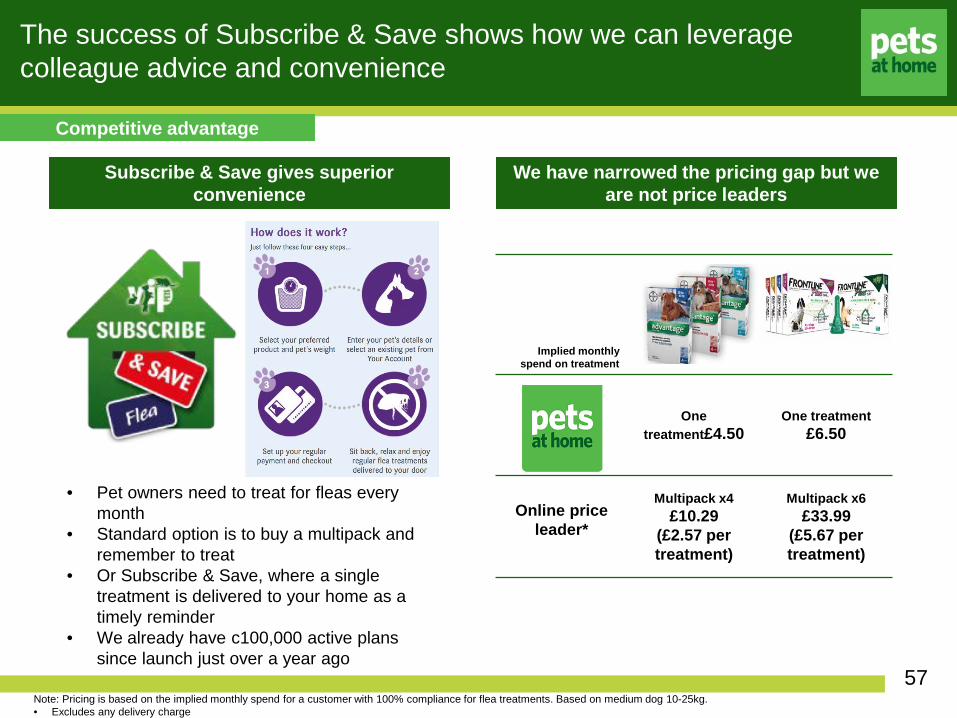
Implied monthly spend on treatment
One treatment£4.50
One treatment £6.50
Online price leader*
Multipack x4 £10.29
(£2.57 per treatment)
Multipack x6 £33.99
(£5.67 per treatment)
Note: Pricing is based on the implied monthly spend for a customer with 100% compliance for flea treatments. Based on medium dog 10-25kg. • Excludes any delivery charge
Subscribe & Save gives superior convenience
The success of Subscribe & Save shows how we can leverage colleague advice and convenience
We have narrowed the pricing gap but we are not price leaders
• Pet owners need to treat for fleas every month
• Standard option is to buy a multipack and remember to treat
• Or Subscribe & Save, where a single treatment is delivered to your home as a timely reminder
• We already have c100,000 active plans since launch just over a year ago
Competitive advantage
57

nemo2014\Presentations\Analyst Presentation Jan14\201401 Nemo Analyst Presentation Master-22nd Jan FINAL.pptx
Our website developments are focused on a faster and simpler checkout process to improve conversion
58
Competitive advantage
nemo2014\Presentations\Analyst Presentation Jan14\201401 Nemo Analyst Presentation Master-22nd Jan FINAL.pptx
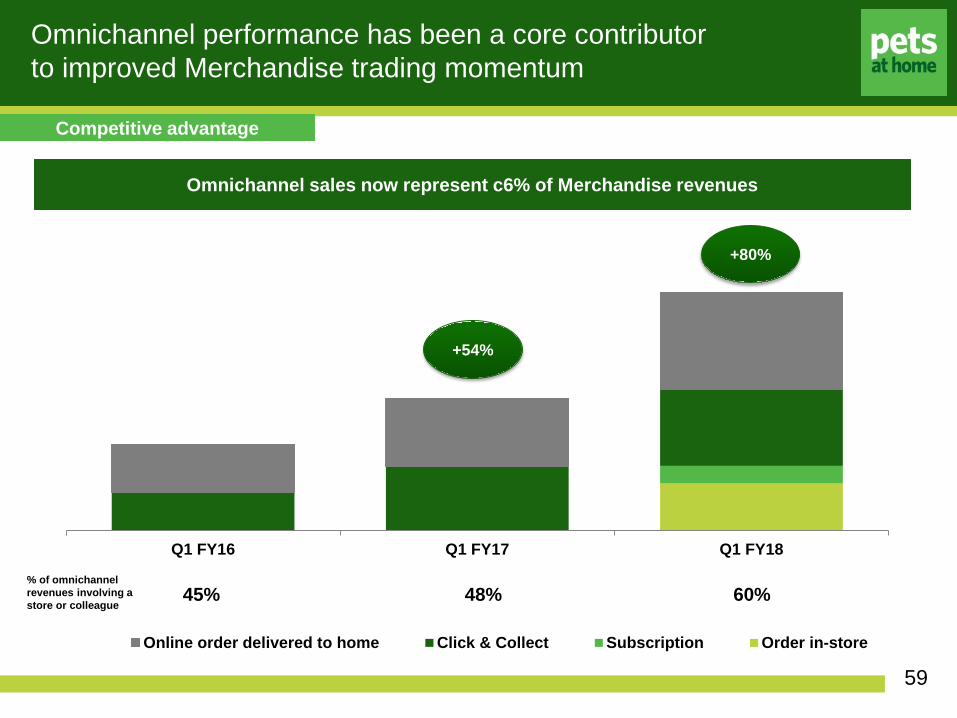
Omnichannel performance has been a core contributor to improved Merchandise trading momentum
Omnichannel sales now represent c6% of Merchandise revenues
Q1 FY16 Q1 FY17 Q1 FY18
Online order delivered to home Click & Collect Subscription Order in-store
+54%
+80%
45% 48% 60% % of omnichannel revenues involving a store or colleague
Competitive advantage
59

nemo2014\Presentations\Analyst Presentation Jan14\201401 Nemo Analyst Presentation Master-22nd Jan FINAL.pptx
We need to capture more of the lifetime value of dog and cat owners
60
We have a significant share of the puppy and kitten market, which erodes over their lifetime
Puppy share Adult dog share Kitten share Adult cat share
Pets
at H
ome
shar
e of
pro
duct
s m
arke
t
Competitive advantage
nemo2014\Presentations\Analyst Presentation Jan14\201401 Nemo Analyst Presentation Master-22nd Jan FINAL.pptx
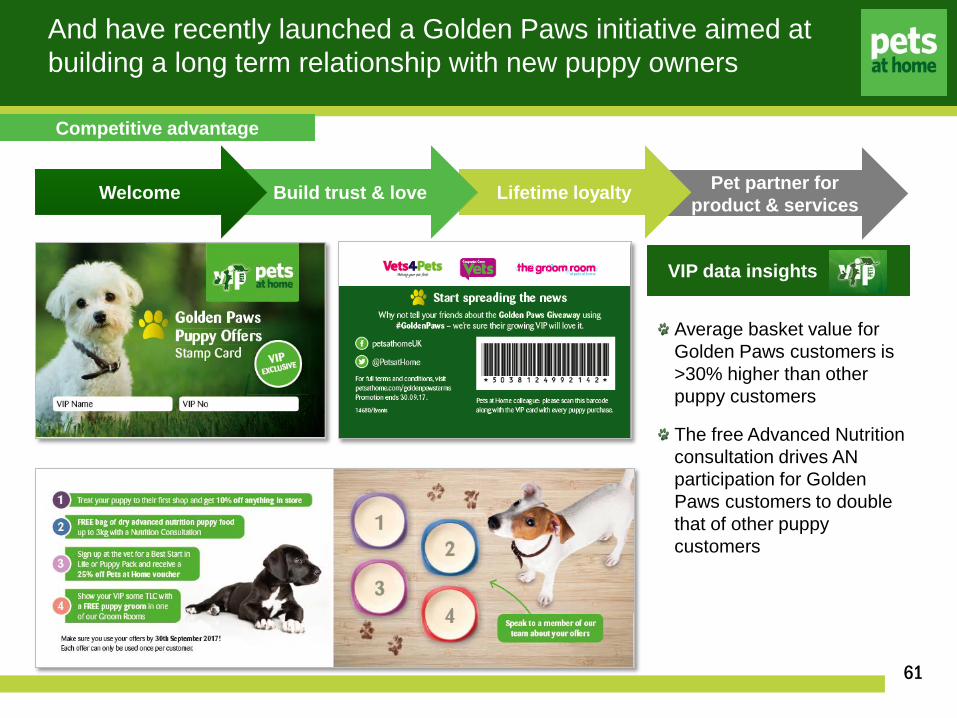
Pet partner for product & services Lifetime loyalty Build trust & love
And have recently launched a Golden Paws initiative aimed at building a long term relationship with new puppy owners
61
Welcome
Average basket value for Golden Paws customers is >30% higher than other puppy customers
The free Advanced Nutrition consultation drives AN participation for Golden Paws customers to double that of other puppy customers
VIP data insights
Competitive advantage

nemo2014\Presentations\Analyst Presentation Jan14\201401 Nemo Analyst Presentation Master-22nd Jan FINAL.pptx
Range change and innovation in accessories has also contributed to our improved trading performance
62
Competitive advantage

nemo2014\Presentations\Analyst Presentation Jan14\201401 Nemo Analyst Presentation Master-22nd Jan FINAL.pptx
At the same time as innovating – we are driving a number of simplicity initiatives through the retail business to manage costs
63
Targeting c£5m of cost savings in FY18
Reduction in store hours Energy cost management Simpler distribution
Fewer promotional & ticket changes
Simpler & improved pet care routines
Move manual processes to digital
Customer facing time not impacted
LED lights
Smart energy management systems
Reduce SKU count & promo stocking cycles
Fewer small item goods-out deliveries
Reduce goods-in deliveries
Operational leverage
nemo2014\Presentations\Analyst Presentation Jan14\201401 Nemo Analyst Presentation Master-22nd Jan FINAL.pptx
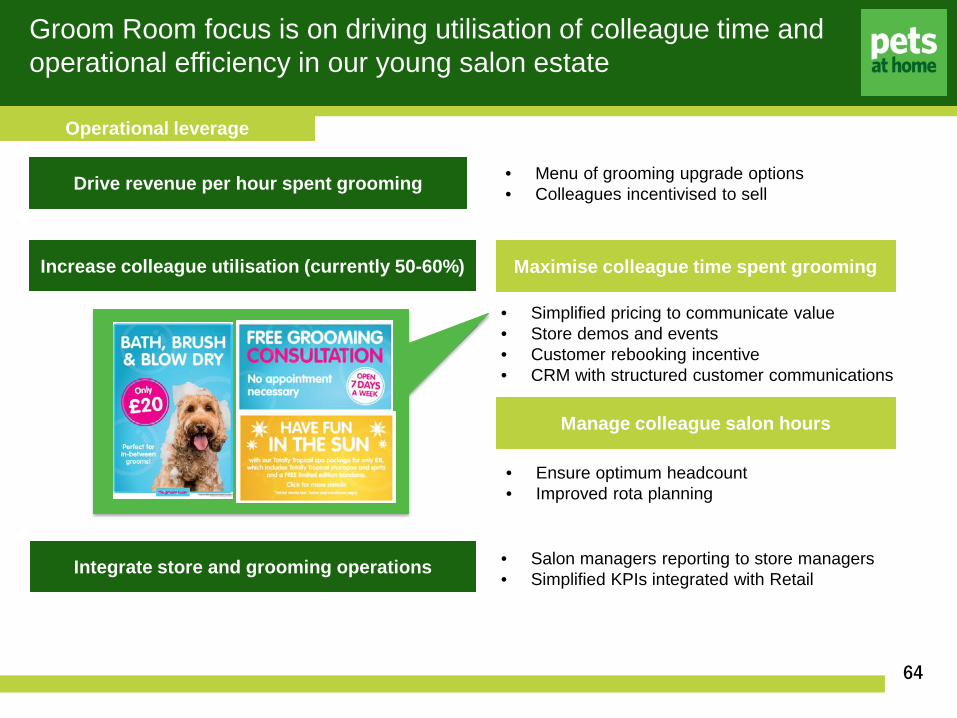
Groom Room focus is on driving utilisation of colleague time and operational efficiency in our young salon estate
64
Drive revenue per hour spent grooming
Increase colleague utilisation (currently 50-60%)
• Menu of grooming upgrade options • Colleagues incentivised to sell
Maximise colleague time spent grooming
Manage colleague salon hours
• Simplified pricing to communicate value • Store demos and events • Customer rebooking incentive • CRM with structured customer communications
Integrate store and grooming operations • Salon managers reporting to store managers • Simplified KPIs integrated with Retail
• Ensure optimum headcount • Improved rota planning
Operational leverage

nemo2014\Presentations\Analyst Presentation Jan14\201401 Nemo Analyst Presentation Master-22nd Jan FINAL.pptx
Proven model will deliver 20-30 new Groom Rooms per year We are also trialling a number of new formats
65
Groom Room in new store
Retrofit in existing store alongside a vet practice
Retrofit in existing store without a vet practice
Groom Room in a standalone vet practice
Grooming salon in Barkers / High Street
Grooming salon standalone pod in other locations
• Proven models with payback <3 years • Will track new store vet refit numbers,
totalling 20-30 per year
More recent formats, where model delivering required return is yet to be proven
Operational leverage

nemo2014\Presentations\Analyst Presentation Jan14\201401 Nemo Analyst Presentation Master-22nd Jan FINAL.pptx
Future strategic focus … neutralising competitive barriers and leveraging our differentiators
66
Further strengthen price position Take Subscribe & Save to more product categories
Provide more services in-store Give colleagues more knowledge and hours to share with customers
Provide more services online Give customers more convenient shopping locations and platforms

nemo2014\Presentations\Analyst Presentation Jan14\201401 Nemo Analyst Presentation Master-22nd Jan FINAL.pptx
Integrated store economics and capital investment Mike Iddon Group CFO

nemo2014\Presentations\Analyst Presentation Jan14\201401 Nemo Analyst Presentation Master-22nd Jan FINAL.pptx
Why we are better together
Vet Group Retail
68
A mature store with integrated services delivers an EBITDA uplift of 24% per square foot compared to a
mature store without services
Annual EBITDA £0.3m Annual EBITDA £0.5m
Note: Includes central cost allocation.

nemo2014\Presentations\Analyst Presentation Jan14\201401 Nemo Analyst Presentation Master-22nd Jan FINAL.pptx
We have invested to integrate services into over 54% of our stores. Few are mature, with significant profit maturity to come.
Retail
69
FY17A FY18E FY19E FY20E FY21E FY22E FY23E
200
15
Note: An integrated store unit is defined as a store which incorporates a first opinion veterinary practice and a groom room
Number of mature integrated store units

nemo2014\Presentations\Analyst Presentation Jan14\201401 Nemo Analyst Presentation Master-22nd Jan FINAL.pptx
Our capital expenditure supports growth opportunities
Vet Group Retail
70
4.8 4.4 7.1 14.1 5.3 4.9
10.0
7.2 9.0 13.6
12.9
16.8
10.9 10.3
11.5
6.4
0
5
10
15
20
25
30
35
40
45
50
FY14 FY15 FY16 FY17 FY18 FY19 FY20 FY21
Cap
ital S
pend
(£m
)
Other including distribution, energy saving and specialist referral vets Business systems and omnichannel Refurbishment and retrofit New stores
£30m
£33m
£42m
£45m £38-40m
Expected run rate
e e e e
£40-42m
nemo2014\Presentations\Analyst Presentation Jan14\201401 Nemo Analyst Presentation Master-22nd Jan FINAL.pptx
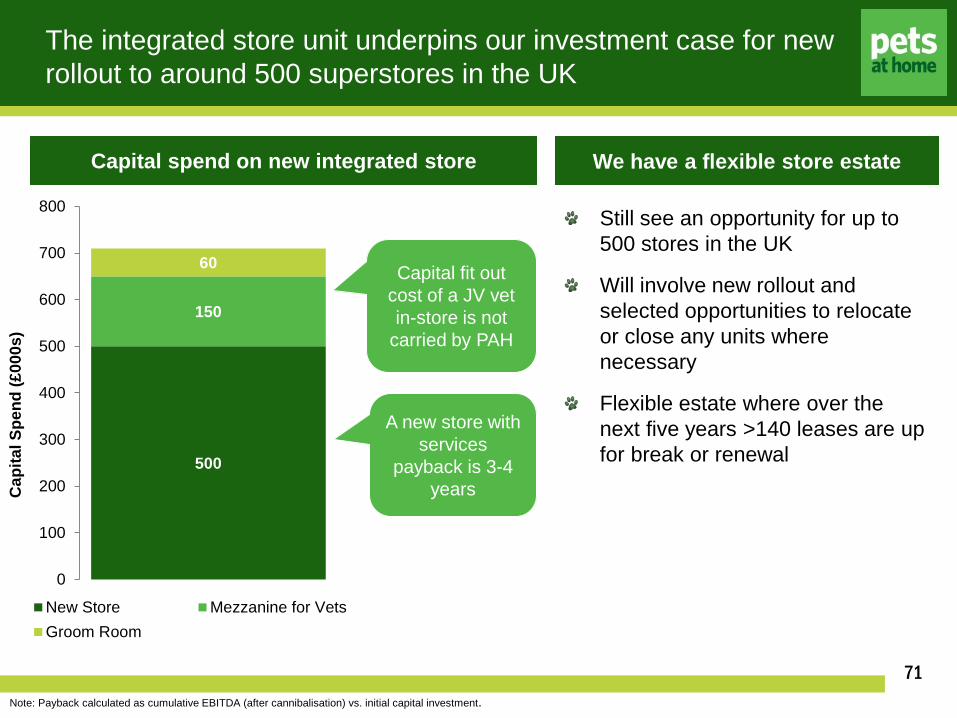
The integrated store unit underpins our investment case for new rollout to around 500 superstores in the UK
Retail
71
Capital fit out cost of a JV vet in-store is not
carried by PAH
A new store with services
payback is 3-4 years
500
150
60
0
100
200
300
400
500
600
700
800
Cap
ital S
pend
(£00
0s)
New Store Mezzanine for VetsGroom Room
Note: Payback calculated as cumulative EBITDA (after cannibalisation) vs. initial capital investment.
Capital spend on new integrated store We have a flexible store estate
Still see an opportunity for up to 500 stores in the UK
Will involve new rollout and selected opportunities to relocate or close any units where necessary
Flexible estate where over the next five years >140 leases are up for break or renewal

nemo2014\Presentations\Analyst Presentation Jan14\201401 Nemo Analyst Presentation Master-22nd Jan FINAL.pptx
New integrated store and services rollout meets strict criteria A case study: Prestwich
72
Store Prestwich
Opened February 2016
Catchment 30,000 (Prestwich); 190,000 (Bury); 2,800,000 (Greater Manchester)
Store Size 8,000 square feet (gross) of which 2,000 of services on mezzanine & 5,000 square feet of retail
Cannibalisation Average 6% impact on 2 surrounding stores
Estimated payback period 4 years (but trading ahead)
Services Vets, Groomer, and more
Omnichannel sales participation 4%
nemo2014\Presentations\Analyst Presentation Jan14\201401 Nemo Analyst Presentation Master-22nd Jan FINAL.pptx
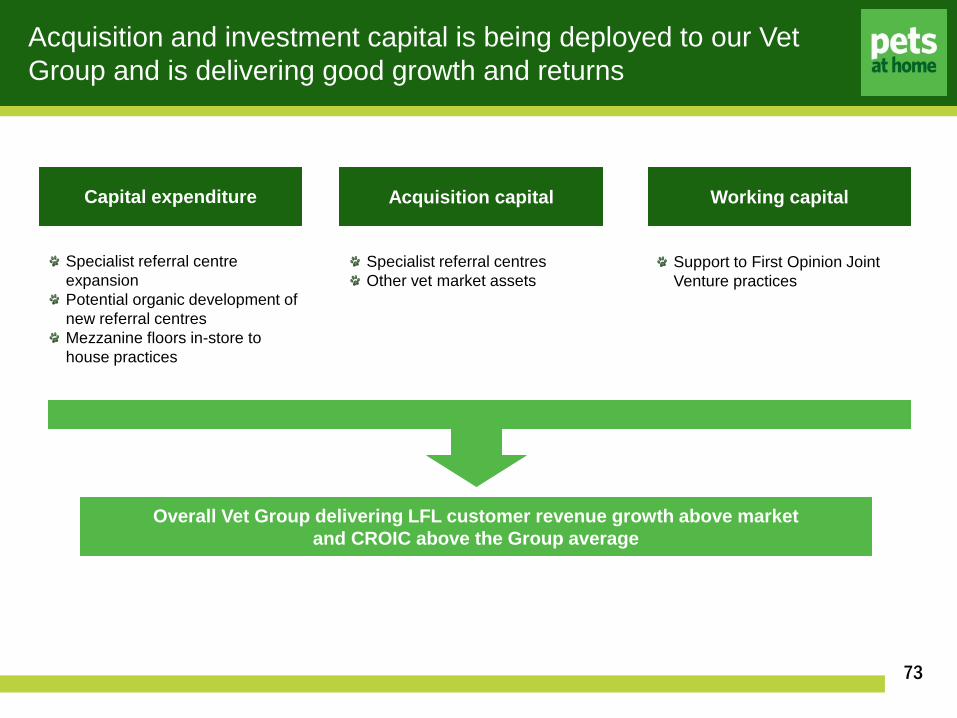
Acquisition and investment capital is being deployed to our Vet Group and is delivering good growth and returns
73
Capital expenditure Acquisition capital Working capital
Overall Vet Group delivering LFL customer revenue growth above market and CROIC above the Group average
Specialist referral centre expansion Potential organic development of new referral centres Mezzanine floors in-store to house practices
Specialist referral centres Other vet market assets
Support to First Opinion Joint Venture practices
nemo2014\Presentations\Analyst Presentation Jan14\201401 Nemo Analyst Presentation Master-22nd Jan FINAL.pptx
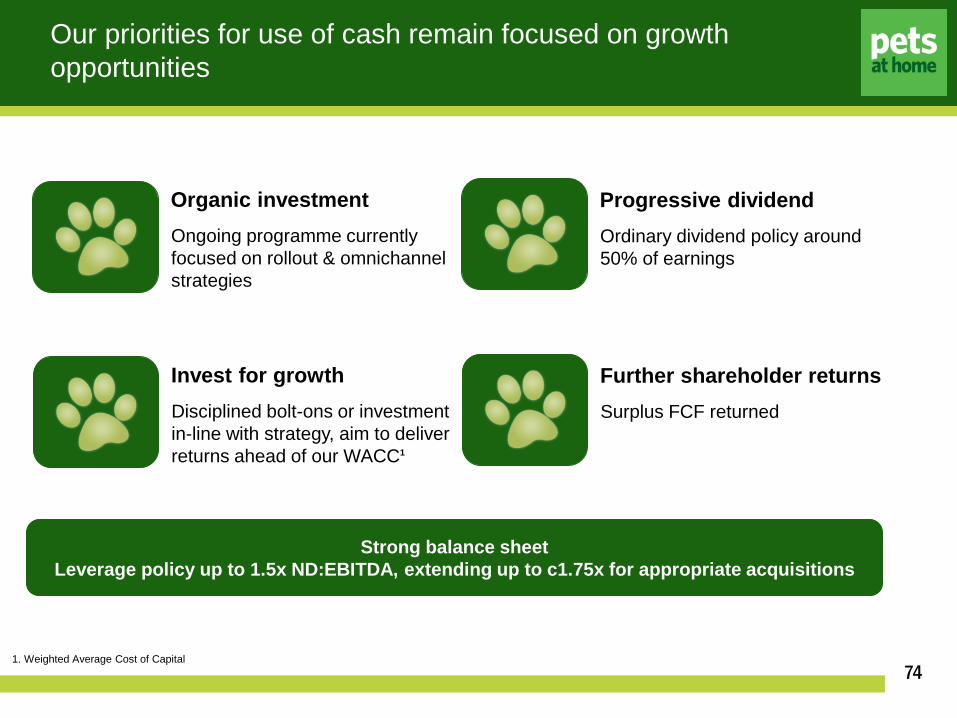
Our priorities for use of cash remain focused on growth opportunities
Strong balance sheet Leverage policy up to 1.5x ND:EBITDA, extending up to c1.75x for appropriate acquisitions
Organic investment Ongoing programme currently focused on rollout & omnichannel strategies
Progressive dividend Ordinary dividend policy around 50% of earnings
Invest for growth Disciplined bolt-ons or investment in-line with strategy, aim to deliver returns ahead of our WACC1
Further shareholder returns Surplus FCF returned
74 1. Weighted Average Cost of Capital
nemo2014\Presentations\Analyst Presentation Jan14\201401 Nemo Analyst Presentation Master-22nd Jan FINAL.pptx
Summary and outlook
Ian Kellett Group CEO
nemo2014\Presentations\Analyst Presentation Jan14\201401 Nemo Analyst Presentation Master-22nd Jan FINAL.pptx
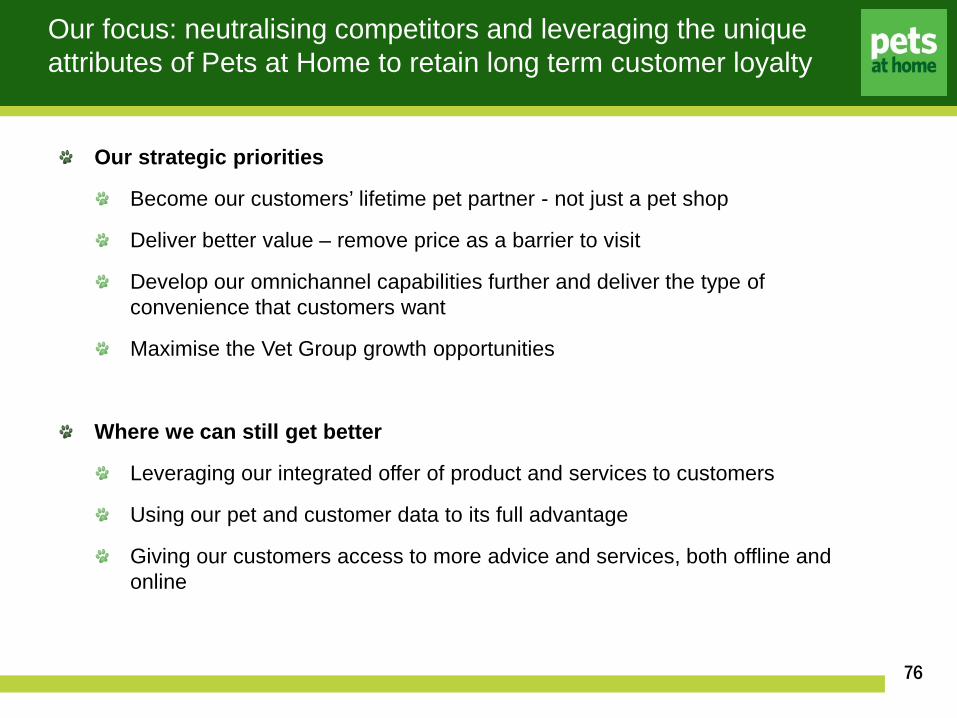
Our focus: neutralising competitors and leveraging the unique attributes of Pets at Home to retain long term customer loyalty
76
Our strategic priorities
Become our customers’ lifetime pet partner - not just a pet shop
Deliver better value – remove price as a barrier to visit
Develop our omnichannel capabilities further and deliver the type of convenience that customers want
Maximise the Vet Group growth opportunities
Where we can still get better
Leveraging our integrated offer of product and services to customers
Using our pet and customer data to its full advantage
Giving our customers access to more advice and services, both offline and online

nemo2014\Presentations\Analyst Presentation Jan14\201401 Nemo Analyst Presentation Master-22nd Jan FINAL.pptx
FY20 onwards Services maturity benefits evident
FY19 Transition to positive Group profit growth
Financial outlook: a three year transition to lay the foundations for future growth and realise Services maturity benefits
77
FY18 Reposition the Merchandise
business
All financial guidance reconfirmed
Price investment on track
Operational cost savings delivery H2 weighted
Increased working capital support for vet practice growth vs FY17 – overall Group working capital guidance for FY18 remains c£5m outflow
Lower rollout of grooming salons expected at 20-30 practices
On track to deliver FY in line with market expectations
Through the majority of price repositioning
Annualisation of FY18 investment
Potential for further investment in selected areas
Targeting Merchandise LFL above market levels and taking share
Vet Group delivering ongoing high profit growth
Continued operational cost savings action
Continued above market growth in Merchandise
Group operating margin expansion evident and supported by Vet Group maturation
Group profit growth at high single digit levels

nemo2014\Presentations\Analyst Presentation Jan14\201401 Nemo Analyst Presentation Master-22nd Jan FINAL.pptx
Questions?
78
Attractive long term growth market
1
Strong position as market leader in key growth segments
2
Only integrated omnichannel & services provider
3
Structural and embedded growth in vet business
4
Cash generative with clear capital allocation framework
5
Longstanding and committed management team
6
Pets at Home Investment Case
Related Documents
![Interim Results FY18 28th - Pets at Home Group plc · [xxx] nemo2014\Presentations\Analyst Presentation Jan14\201401 Nemo Analyst Presentation Master-22nd Jan FINAL.pptx 161 [xxx]](https://static.cupdf.com/doc/110x72/5ecedd60c06374728112dfa4/interim-results-fy18-28th-pets-at-home-group-plc-xxx-nemo2014presentationsanalyst.jpg)


![Pets At Home Vets Group - Pets at Home Group plc...[xxx] nemo2014\Presentations\Analyst Presentation Jan14\201401 Nemo Analyst Presentation Master-22nd Jan FINAL.pptx 161 [xxx] [xxx]](https://static.cupdf.com/doc/110x72/5f0ca92f7e708231d43682a7/pets-at-home-vets-group-pets-at-home-group-plc-xxx-nemo2014presentationsanalyst.jpg)
