Crustaceana 91 (12) 1453-1464 INVESTIGATIONS ON UNEXPLORED BRACHYURANS (DECAPODA), CHARYBDIS HOPLITES (WOOD-MASON, 1877) AND CHARYBDIS SMITHII MACLEAY, 1838, FROM TRAWL DISCARDS OF THE SOUTHEAST ARABIAN SEA ECOSYSTEM BY A. P. DINESHBABU 1,3 ), SUJITHA THOMAS 1 ) and G. MAHESWARUDU 2 ) 1 ) ICAR – Central Marine Fisheries Research Institute, Research Centre Mangalore, P.B. No. 244, Mangalore – 575001, India 2 ) ICAR – Central Marine Fisheries Research Institute, P.B. No. 1603, Kochi – 682018, India ABSTRACT The effectiveness of GIS-based resource mapping to strengthen the database for Ecosystem- Based Fisheries Management (EBFM), was tested in an attempt at resolving the existing gap in the data on non-commercial resources. In this paper we describe the result of that try by giving an example of one of the most important influential species in the benthic ecosystem of the Southeast Arabian Sea (SEAS). An estimated 2803 t of Charybdis hoplites, a relatively little known species from the coast, are yearly caught and discarded by trawlers operating from the Mangalore fisheries harbour. A GIS-aided study on distribution and abundance estimated, that the average biomass of the species is 322.7 t, at any time in the area covered. This study brings out the fact that a number of non- commercial biota are serving as non-detectable factors in sustaining productivity. The identification of their role and the quantification of their biomass thus constitute important data for an effective implementation of EBFM. Key words. — GIS, trophic importance, EBFM, trawling, crabs, biomass, Arabian Sea RÉSUMÉ L’efficacité du système d’information géographique (GIS) dans la cartographie des ressources afin de renforcer les données pour la gestion écosystémique des pêches (EBFM), a été testée pour essayer de résoudre la lacune existant dans les données sur les ressources non commerciales. Dans ce papier nous décrivons le résultat de cet essai en donnant en exemple l’une des espèces la plus influente sur l’écosystème benthique du sud ouest de la Mer d’Arabie (SEAS). Une estimation de 2803 t de Charybdis hoplites, une espèce relativement peu connue de la côte, ont été pêchées et débarquées annuellement par les chalutiers des pêcheries opérant à partir du partir du port de Mangalore. Une étude par GIS sur la distribution et l’abondance a estimé que la biomasse moyenne de cette espèce était de 322,7 t dans l’aire étudiée. Cette étude souligne le fait qu’un nombre de biota non commerciaux représentent des facteurs non détectables dans le maintien de la productivité. 3 ) Corresponding author; e-mail: [email protected] © Koninklijke Brill NV, Leiden, 2018 DOI 10.1163/15685403-00003853

Welcome message from author
This document is posted to help you gain knowledge. Please leave a comment to let me know what you think about it! Share it to your friends and learn new things together.
Transcript
Crustaceana 91 (12) 1453-1464
INVESTIGATIONS ON UNEXPLORED BRACHYURANS (DECAPODA),CHARYBDIS HOPLITES (WOOD-MASON, 1877) AND CHARYBDIS SMITHII
MACLEAY, 1838, FROM TRAWL DISCARDS OF THE SOUTHEASTARABIAN SEA ECOSYSTEM
BY
A. P. DINESHBABU1,3), SUJITHA THOMAS1) and G. MAHESWARUDU2)1) ICAR – Central Marine Fisheries Research Institute, Research Centre Mangalore, P.B. No. 244,
Mangalore – 575001, India2) ICAR – Central Marine Fisheries Research Institute, P.B. No. 1603, Kochi – 682018, India
ABSTRACT
The effectiveness of GIS-based resource mapping to strengthen the database for Ecosystem-Based Fisheries Management (EBFM), was tested in an attempt at resolving the existing gap inthe data on non-commercial resources. In this paper we describe the result of that try by giving anexample of one of the most important influential species in the benthic ecosystem of the SoutheastArabian Sea (SEAS). An estimated 2803 t of Charybdis hoplites, a relatively little known speciesfrom the coast, are yearly caught and discarded by trawlers operating from the Mangalore fisheriesharbour. A GIS-aided study on distribution and abundance estimated, that the average biomass of thespecies is 322.7 t, at any time in the area covered. This study brings out the fact that a number of non-commercial biota are serving as non-detectable factors in sustaining productivity. The identificationof their role and the quantification of their biomass thus constitute important data for an effectiveimplementation of EBFM.
Key words. — GIS, trophic importance, EBFM, trawling, crabs, biomass, Arabian Sea
RÉSUMÉ
L’efficacité du système d’information géographique (GIS) dans la cartographie des ressourcesafin de renforcer les données pour la gestion écosystémique des pêches (EBFM), a été testée pouressayer de résoudre la lacune existant dans les données sur les ressources non commerciales. Dansce papier nous décrivons le résultat de cet essai en donnant en exemple l’une des espèces la plusinfluente sur l’écosystème benthique du sud ouest de la Mer d’Arabie (SEAS). Une estimationde 2803 t de Charybdis hoplites, une espèce relativement peu connue de la côte, ont été pêchéeset débarquées annuellement par les chalutiers des pêcheries opérant à partir du partir du port deMangalore. Une étude par GIS sur la distribution et l’abondance a estimé que la biomasse moyennede cette espèce était de 322,7 t dans l’aire étudiée. Cette étude souligne le fait qu’un nombre debiota non commerciaux représentent des facteurs non détectables dans le maintien de la productivité.
3) Corresponding author; e-mail: [email protected]
© Koninklijke Brill NV, Leiden, 2018 DOI 10.1163/15685403-00003853
1454 A. P. DINESHBABU, SUJITHA THOMAS & G. MAHESWARUDU
L’identification de leur rôle et la quantification de leur biomasse constituent donc des donnéesimportantes pour une mise en œuvre efficace de EBFM
Mots clés. — GIS, importance trophique, EBFM, chalutage, crabes, biomasse, Mer d’Arabie
INTRODUCTION
The area known as the Southeast Arabian Sea (SEAS) is considered oneof the richest marine ecosystems along the Indian coast (Vivekanandan et al.,2002), and accordingly displays a scenario of a complex multi-species fishery thatobviously encompasses multi-gear exploitation. Trawls have become the dominantcontributor to the fishery in the last two decades, with an extension of regularfishing depth from 50 to 200 m, and an increase in fishing days from 3 to 13days. Both the commercial trawl catch and the low-value catch have increasedsubstantially, and 205 species or species-groups of fishes were identified fromthe trawling grounds off the southwestern coast of India (Dineshbabu et al.,2012). Ecosystem-Based Fisheries Management (EBFM), which is consideredas a well-adopted methodology for the management of multispecies fishery intropical waters (Vivekanandan et al., 2003) requires quantitative information oncommercial and non-commercial fishes and other marine organisms. The biomassof groups at different trophic levels in the ecosystem provides an indication forthe flow kinetics governing that system (Pauly et al., 2000), and the incorporationof information on spatial distribution and abundance of discards is suggested as areliable option for effective trawl fisheries management (Walters et al., 2000).
Demersal crabs have been identified as one of the major food items for demersalfishes along the Southeastern Arabian Sea (Abdurahiman et al., 2010) and in thiscontext, an attempt was made to study the distribution and quantification of someof the less well-known brachyuran crabs. Earlier studies on bycatch and discardsfrom the trawlers in these fishing grounds showed, that huge quantities of non-edible crabs belonging to the genus Charybdis are regularly discarded (Dineshbabuet al., 2012). Thus, GIS-based resource mapping was performed in an attempt toillustrate the distribution of these brachyuran crabs in the trawling grounds. So, thepresent study is intended to contribute to an understanding of the importance ofnon-commercial brachyuran species in the trawl fishing grounds of the SEAS areain terms of distribution and abundance. As a consequence, these data can serveto emphasize the need for conservation of those non-commercial species throughtrawl discard management, specifically intended for sustaining commercial marinefisheries. The methodology described in this study can be applied to more than200 species (or species-groups) identified from the trawl catch/bycatch off thecoast, and, thus, for strengthening the Ecosystem-Based Fisheries Managementpurported to guarantee sustainable fisheries activities in the region.
CHARYBDIS HOPLITES AND C. SMITHII AS UNEXPLORED BRACHYURA 1455
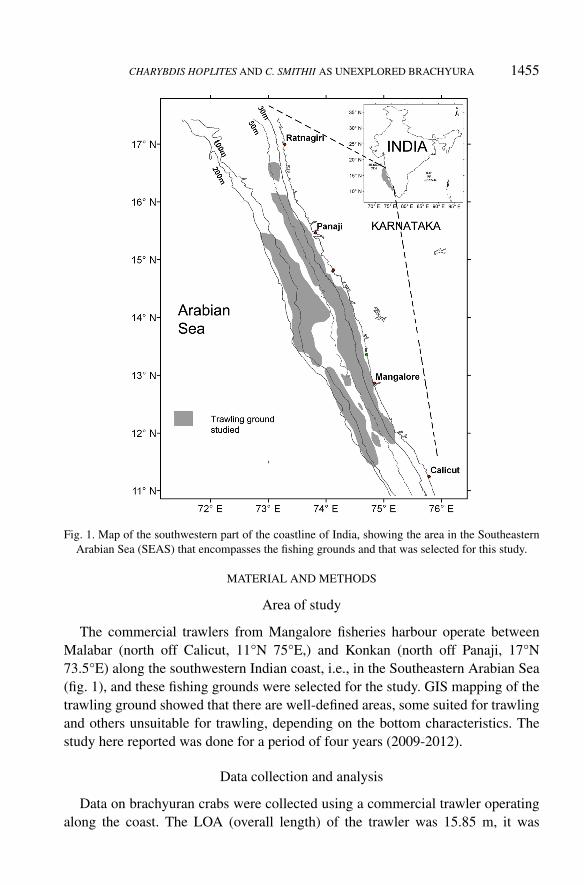
Fig. 1. Map of the southwestern part of the coastline of India, showing the area in the SoutheasternArabian Sea (SEAS) that encompasses the fishing grounds and that was selected for this study.
MATERIAL AND METHODS
Area of study
The commercial trawlers from Mangalore fisheries harbour operate betweenMalabar (north off Calicut, 11°N 75°E,) and Konkan (north off Panaji, 17°N73.5°E) along the southwestern Indian coast, i.e., in the Southeastern Arabian Sea(fig. 1), and these fishing grounds were selected for the study. GIS mapping of thetrawling ground showed that there are well-defined areas, some suited for trawlingand others unsuitable for trawling, depending on the bottom characteristics. Thestudy here reported was done for a period of four years (2009-2012).
Data collection and analysis
Data on brachyuran crabs were collected using a commercial trawler operatingalong the coast. The LOA (overall length) of the trawler was 15.85 m, it was
1456 A. P. DINESHBABU, SUJITHA THOMAS & G. MAHESWARUDU
equipped with a 350 hp engine, and the vessel was engaged in trawling for 8to 13 days on each trip. Specially designed logbooks were prepared, and thecrew members of the sampling boats were trained in data collection. Onboardinformation collected and recorded were the date of operation, depth of shooting,time of the shooting, shooting longitude, shooting latitude, hauling depth, haulingtime, latitude and longitude; also the total catch (kg), total discard (kg) and thenumber of hauls/day were carefully registered (Dineshbabu et al., 2016).
The geocoded subsample from the catch (i.e., a sample with GPS informationon the area of capture) was collected from the operating trawlers and brought tothe laboratory for further analysis. Hauls from 915 fishing days of regular fishingoperations were analysed for the study. The species composition of the catch,including discards-at-sea, in each haul, were recorded. For the mapping of thespatiotemporal distribution and for a smooth handling of the data, two softwareprograms, “ArcGIS” and ‘Visual Basic 6” were used. The analysis of GIS maps toderive information on fishing and species distribution was carried out followingthe methodologies described by Baird et al. (2015). For the average biomassestimation, the “swept” area methods suggested by Sparre & Venema (1998) andKlima (1976) were used. The use of GIS coordinates of the fishing operation forthe area calculation was employed as per the methodology described by Wood &Baird (2010). For an estimation of the landing of commercial crabs and also tounderstand the hours of operation of trawlers on the fishing grounds, catch-and-effort data collected from Mangalore fisheries harbour (Srinath et al., 2005) during2009-2012 were also analysed. For testing the seasonality of the species, a “Oneway analysis of variance” (ANOVA) was done with SPSS (ver. 16) software, andanalyses for graphical representation were performed in RStudio (Version 1.0.136)using the inbuilt package “gg plot” (version 2.2.1) (RStudio Team, 2015).
RESULTS
Distribution and abundance of brachyuran crabs
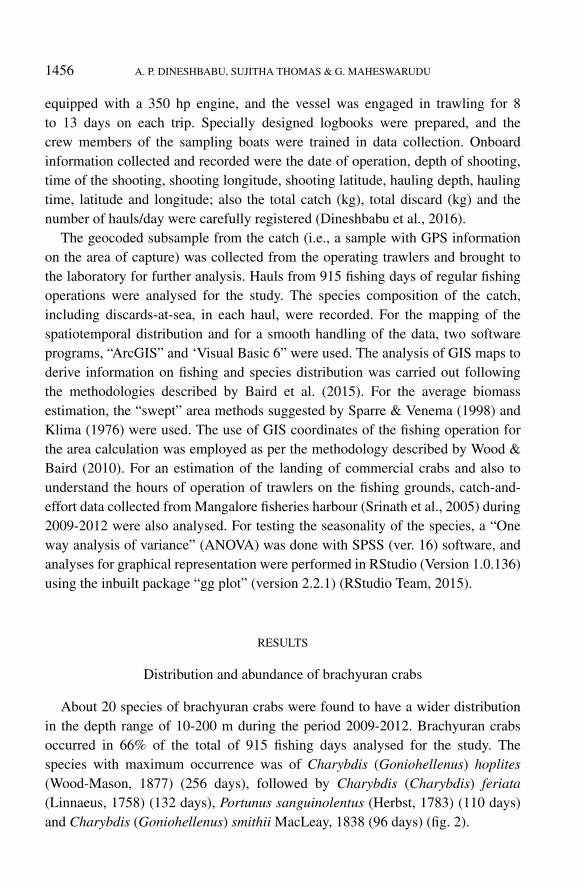
About 20 species of brachyuran crabs were found to have a wider distributionin the depth range of 10-200 m during the period 2009-2012. Brachyuran crabsoccurred in 66% of the total of 915 fishing days analysed for the study. Thespecies with maximum occurrence was of Charybdis (Goniohellenus) hoplites(Wood-Mason, 1877) (256 days), followed by Charybdis (Charybdis) feriata(Linnaeus, 1758) (132 days), Portunus sanguinolentus (Herbst, 1783) (110 days)and Charybdis (Goniohellenus) smithii MacLeay, 1838 (96 days) (fig. 2).
CHARYBDIS HOPLITES AND C. SMITHII AS UNEXPLORED BRACHYURA 1457
Fig. 2. Frequency of days of occurrence of the various crab species in the trawl catch dur-ing 2009-2012. The species found were: Portunus pelagicus (Linnaeus, 1758), P. sanguinolentus(Herbst, 1783), Thalamita crenata Rüppell, 1830, Portunus gracilimanus (Stimpson, 1858), Podoph-thalmus vigil (Fabricius, 1798), Myra fugax (Fabricius, 1798), Leucosia pubescens Miers, 1877 [cur-rently also known as Seulocia pubescens (Miers, 1877)], L. anatum (Herbst, 1783), Etisus laevi-manus Randall, 1840, Doclea ovis (Fabricius, 1787), D. hybridoidea Bleeker, 1856 [currently alsoknown as Doclea muricata (Herbst, 1788)], Cryptopodia angulata H. Milne Edwards & Lucas, 1841,Charybdis smithii MacLeay, 1838, C. riversandersoni Alcock, 1899, C. lucifera (Fabricius, 1798),C. hoplites (Wood-Mason, 1877), C. feriata (Linnaeus, 1758), Calappa lophos (Herbst, 1782), C.
granulata (Linnaeus, 1758), and C. gallus (Herbst, 1803).
Seasonal distribution and abundance of commercial crabs in the fishery
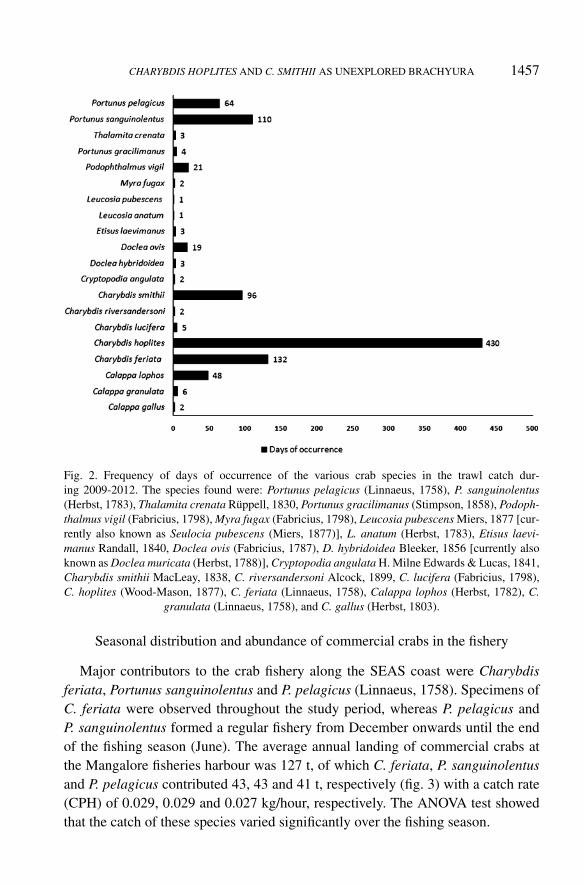
Major contributors to the crab fishery along the SEAS coast were Charybdisferiata, Portunus sanguinolentus and P. pelagicus (Linnaeus, 1758). Specimens ofC. feriata were observed throughout the study period, whereas P. pelagicus andP. sanguinolentus formed a regular fishery from December onwards until the endof the fishing season (June). The average annual landing of commercial crabs atthe Mangalore fisheries harbour was 127 t, of which C. feriata, P. sanguinolentusand P. pelagicus contributed 43, 43 and 41 t, respectively (fig. 3) with a catch rate(CPH) of 0.029, 0.029 and 0.027 kg/hour, respectively. The ANOVA test showedthat the catch of these species varied significantly over the fishing season.
1458 A. P. DINESHBABU, SUJITHA THOMAS & G. MAHESWARUDU
Fig. 3. Commercial crab landings at Mangalore fisheries harbour in 2009-2012: Charybdis feriata(Linnaeus, 1758), Portunus pelagicus (Linnaeus, 1758) and P. sanguinolentus (Herbst, 1783).
Non-commercial crabs from discarded bycatch
Major contributors to the non-commercial crab catch were C. hoplites and C.smithii, in which C. hoplites had the wider spatial distribution, followed by C.smithii. The temporal distribution analyses showed that C. smithii occurred onlyduring August, December and May, whereas C. hoplites was observed throughoutall months. Also, the Analysis of Variance showed no significant difference in theavailability of C. hoplites between months.
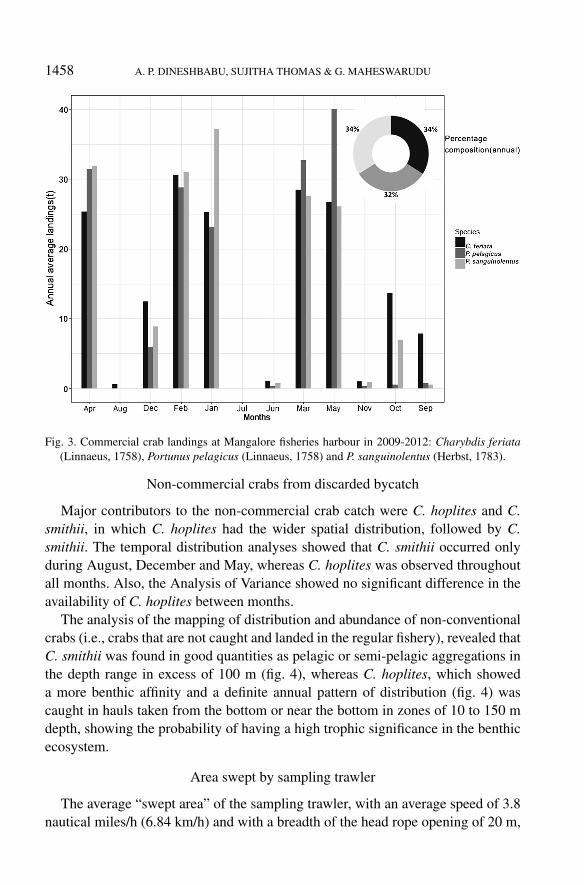
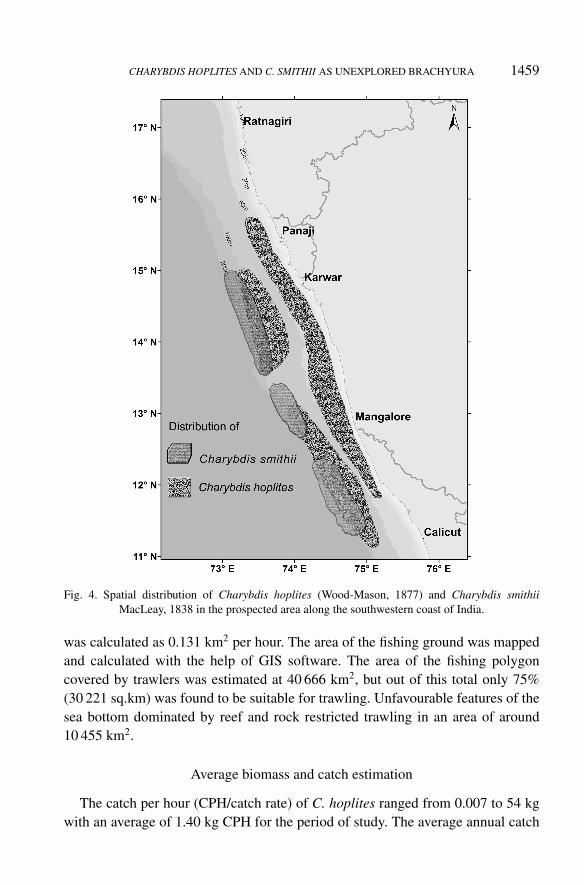
The analysis of the mapping of distribution and abundance of non-conventionalcrabs (i.e., crabs that are not caught and landed in the regular fishery), revealed thatC. smithii was found in good quantities as pelagic or semi-pelagic aggregations inthe depth range in excess of 100 m (fig. 4), whereas C. hoplites, which showeda more benthic affinity and a definite annual pattern of distribution (fig. 4) wascaught in hauls taken from the bottom or near the bottom in zones of 10 to 150 mdepth, showing the probability of having a high trophic significance in the benthicecosystem.
Area swept by sampling trawler
The average “swept area” of the sampling trawler, with an average speed of 3.8nautical miles/h (6.84 km/h) and with a breadth of the head rope opening of 20 m,
CHARYBDIS HOPLITES AND C. SMITHII AS UNEXPLORED BRACHYURA 1459
Fig. 4. Spatial distribution of Charybdis hoplites (Wood-Mason, 1877) and Charybdis smithiiMacLeay, 1838 in the prospected area along the southwestern coast of India.
was calculated as 0.131 km2 per hour. The area of the fishing ground was mappedand calculated with the help of GIS software. The area of the fishing polygoncovered by trawlers was estimated at 40 666 km2, but out of this total only 75%(30 221 sq.km) was found to be suitable for trawling. Unfavourable features of thesea bottom dominated by reef and rock restricted trawling in an area of around10 455 km2.
Average biomass and catch estimation
The catch per hour (CPH/catch rate) of C. hoplites ranged from 0.007 to 54 kgwith an average of 1.40 kg CPH for the period of study. The average annual catch
1460 A. P. DINESHBABU, SUJITHA THOMAS & G. MAHESWARUDU
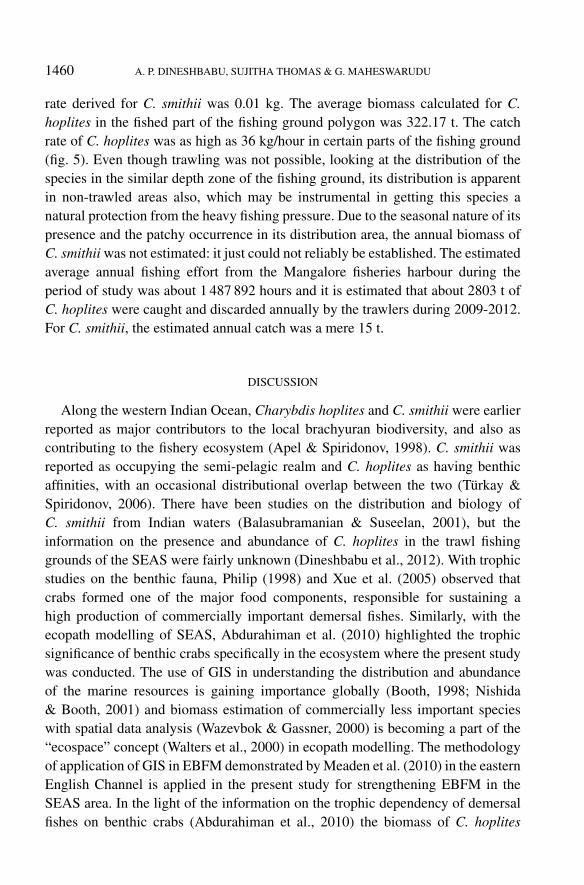
rate derived for C. smithii was 0.01 kg. The average biomass calculated for C.hoplites in the fished part of the fishing ground polygon was 322.17 t. The catchrate of C. hoplites was as high as 36 kg/hour in certain parts of the fishing ground(fig. 5). Even though trawling was not possible, looking at the distribution of thespecies in the similar depth zone of the fishing ground, its distribution is apparentin non-trawled areas also, which may be instrumental in getting this species anatural protection from the heavy fishing pressure. Due to the seasonal nature of itspresence and the patchy occurrence in its distribution area, the annual biomass ofC. smithii was not estimated: it just could not reliably be established. The estimatedaverage annual fishing effort from the Mangalore fisheries harbour during theperiod of study was about 1 487 892 hours and it is estimated that about 2803 t ofC. hoplites were caught and discarded annually by the trawlers during 2009-2012.For C. smithii, the estimated annual catch was a mere 15 t.
DISCUSSION
Along the western Indian Ocean, Charybdis hoplites and C. smithii were earlierreported as major contributors to the local brachyuran biodiversity, and also ascontributing to the fishery ecosystem (Apel & Spiridonov, 1998). C. smithii wasreported as occupying the semi-pelagic realm and C. hoplites as having benthicaffinities, with an occasional distributional overlap between the two (Türkay &Spiridonov, 2006). There have been studies on the distribution and biology ofC. smithii from Indian waters (Balasubramanian & Suseelan, 2001), but theinformation on the presence and abundance of C. hoplites in the trawl fishinggrounds of the SEAS were fairly unknown (Dineshbabu et al., 2012). With trophicstudies on the benthic fauna, Philip (1998) and Xue et al. (2005) observed thatcrabs formed one of the major food components, responsible for sustaining ahigh production of commercially important demersal fishes. Similarly, with theecopath modelling of SEAS, Abdurahiman et al. (2010) highlighted the trophicsignificance of benthic crabs specifically in the ecosystem where the present studywas conducted. The use of GIS in understanding the distribution and abundanceof the marine resources is gaining importance globally (Booth, 1998; Nishida& Booth, 2001) and biomass estimation of commercially less important specieswith spatial data analysis (Wazevbok & Gassner, 2000) is becoming a part of the“ecospace” concept (Walters et al., 2000) in ecopath modelling. The methodologyof application of GIS in EBFM demonstrated by Meaden et al. (2010) in the easternEnglish Channel is applied in the present study for strengthening EBFM in theSEAS area. In the light of the information on the trophic dependency of demersalfishes on benthic crabs (Abdurahiman et al., 2010) the biomass of C. hoplites
CHARYBDIS HOPLITES AND C. SMITHII AS UNEXPLORED BRACHYURA 1461
Fig. 5. GIS aided biomass estimation of Charybdis hoplites (Wood-Mason, 1877).
(332 t), can be considered a prominent contributor to the high production ofdemersal fishes from SEAS and, as observed by Baran (2002), heavy exploitationof such ecologically sensitive species as bycatch, as in the present case, which isestimated at 700 t annually, may have a detrimental impact on the sustaining highproductivity from SEAS. The methodology described in the present paper will bea handy tool for the quantification of many other discarded species, which aregenerally unrecorded, to ensure efficient management of the marine fishery fromSEAS.
There are only a few published accounts on the distribution of non-commercialspecies in trawling grounds, since most of these catches are discarded at sea.Generally, non-commercial species were found to act as “keystone species” and

1462 A. P. DINESHBABU, SUJITHA THOMAS & G. MAHESWARUDU
their absence or reduction in abundance may change the entire trophic fabricof the ecosystem (Link, 2007), but due to the absence of such species in theactual landings, their importance is often neglected. The present study revealsthe significant role of non-commercial brachyuran species in the trawl fishinggrounds, in terms of distribution and abundance, and emphasize the fact that, whiledeveloping plans for management of the commercial fishery, the exploitation of (asyet) non-commercial species also needs to be taken into consideration, first of allfor ensuring continued sustainability.
ACKNOWLEDGEMENTS
The authors are thankful to Dr. A Gopalakrishnan, Director, Central MarineFisheries Research Institute (CMFRI), Kochi, and Dr. Prathibha Rohit, Scientist-in-Charge, CMFRI, Mangalore, for the facilities provided for this work, as well asfor their constant encouragement. The authors are thankful to Ms. Shailaja Salianfor her help in data compilation and GIS mapping. The first author wishes to thankDr. Tom Nishida, International Fishery GIS Society, Japan, for the encouragementand for mailing a large number of relevant pieces of literature from Fishery GIS.The co-operation and help provided by the fishing community of Mangalore areacknowledged with gratitude.
REFERENCES
ABDURAHIMAN, K. P., T. H. NAYAK, P. U. ZACHARIA & K. S. MOHAMED, 2010. Trophicorganization and predator-prey interactions among commercially exploited demersal finfishesin the coastal waters of the Southeastern Arabian Sea. Estuar. Coast. Shelf Sci., 87: 601-610.
APEL, M. & V. A. SPIRIDONOV, 1998. Taxonomy and zoogeography of the portunid crabs(Crustacea: Decapoda: Brachyura: Portunidae) of the Arabian Gulf and adjacent waters. Faunaof Arabia, 17: 159-331.
BAIRD, S. J., J. E. HEWITT & B. A. WOOD, 2015. Benthic habitat classes and trawl fishingdisturbance in New Zealand waters shallower than 250 m. New Zealand Aquatic Environmentand Biodiversity Report, 144: 1-184.
BALASUBRAMANIAN, C. P. & C. SUSEELAN, 2001. Distribution and population structure of deep-water crab Charybdis smithii (Decapoda: Portunidae) in the Arabian Sea and the Bay of Bengal.Bull. Mar. Sci., 68(3): 435-449.
BARAN, E., 2002. The importance of non-commercial fish. In: P. SAFRAN (ed.), Fisheries and aqua-culture: towards sustainable aquatic living resources management: 1-7. (UNESCO Encyclopae-dia of Life Support Systems; EOLSS Publishers, Oxford, U.K.).
BOOTH, A. J., 1998. Spatial analysis of fish distribution and abundance patterns: a GIS approach. In:F. FUNK, T. J. QUINN, II, J. HEIFETZ, J. N. IANELLI, J. E. POWERS, J. F. SCHWEIGERT, P. J.SULLIVAN & C. I. ZHANG (eds.), Fisheries stock assessment models: 719-740. (University ofAlaska Sea Grant, Fairbanks).
CHRISTENSEN, V. & D. PAULY (eds.), 1993. Trophic models of aquatic ecosystems. ICLARMConference Proceedings, 26: 1-390.
CHARYBDIS HOPLITES AND C. SMITHII AS UNEXPLORED BRACHYURA 1463
DINESHBABU, A. P., S. THOMAS & A. C. DINESH, 2016. Handbook on application of GIS as adecision support tool in marine fisheries: 1-104. (ICAR – Central Marine Fisheries ResearchInstitute, Kochi).
DINESHBABU, A. P., S. THOMAS & E. V. RADHAKRISHNAN, 2012. Spatiotemporal analysisand impact assessment of trawl bycatch of Karnataka to suggest operation based fisherymanagement options. Indian J. Fish., 59(2): 27-38.
GUNDERSON, D. R., 1993. Surveys of fisheries resources: 1-248. (Wiley, New York).KLIMA, E. F., 1976. A review of the fishery resources in the western central Atlantic. WECAF Stud.,
3: 1-77.LINK, J. S., 2007. Underappreciated species in ecology: “ugly fish” in the northwest Atlantic Ocean.
Ecological Applications, 17(7): 2037-2060.MEADEN, G. J., 1999. Applications of GIS to fisheries management. In: D. WRIGHT &
D. BARTLETT (eds.), Marine and coastal geographical information systems: 205-226. (Tay-lor & Francis, London).
NISHIDA, T. & A. J. BOOTH, 2001. Recent approaches using GIS in the spatial analysis offish populations. In: G. H. KRUSE, N. BEZ, A. BOOTH, M. W. DORN, S. HILLS, R. N.LIPCIUS, D. PELLETIER, C. ROY, S. J. SMITH & D. WITHERELL (eds.), Spatial processesand management of marine populations: 19-36. (University of Alaska Sea Grant, Fairbanks).
PAULY, D., V. CHRISTENSEN & C. WALTERS, 2000. Ecopath, ecosysm and ecospace as tools forevaluating ecosystem impact fisheries. ICES J. Mar. Sci., 57: 697-706.
PHILIP, K. P., 1998. Food and feeding habits of Priacanthus hamrur (Forsskål) from the upper eastcoast of India. Bull. Fish. Surv. India, 26: 12-25.
RSTUDIO TEAM, 2015. RStudio: integrated development for R. (RStudio, Inc., Boston, MA).[Available at: http://www.rstudio.com/.]
SPARRE, P. & S. C. VENEMA, 1998. Introduction to tropical fish stock assessment. Part 1. Manual.FAO Fish. Tech. Pap., 306.1 (Rev. 2): 1-407. (FAO, Rome).
SRINATH, M., S. KURIAKOSE & K. G. MINI, 2005. Methodology for the estimation of marine fishlandings in India. CMFRI Spec. Publ., 86: 1-57.
TÜRKAY, M. & V. A. SPIRIDONOV, 2006. Deep water swimming crabs of the subgenus Charybdis(Goniohellenus) of the western Indian Ocean (Crustacea: Decapoda: Portunidae). Fauna ofArabia, 22: 199-223.
VIVEKANANDAN, E., 2002. Application of an ecosystem model on the fish stocks in the southwestcoast of India. RAP Publication (FAO), 2002/27: 47-60.
VIVEKANANDAN, E., M. SRINATH, V. N. PILLAI, S. IMMANUEL & K. N. KURUP, 2003. Marinefisheries along the southwest coast of India. In: G. SILVESTRE, L. GARCES, I. STOBUTZKI, C.LUNA, M. AHMAD, R. A. VALMONTE-SANTOS, L. LACHICA-ALIÑO, P. MUNRO, V. CHRIS-TENSEN & D. PAULY (eds.), Assessment, management and future directions for coastal fish-eries in Asian countries. WorldFish Center Conference Proceedings, 67: 757-792. (Penang).
WALTERS, C., D. PAULY & V. CHRISTENSEN, 2000. Ecospace: prediction of mesoscale spatialpatterns in trophic relationships of exploited ecosystems, with emphasis on the impacts ofmarine protected areas. Ecosystems, 2: 539-554.
WAZEVBOK, J. & H. GASSNER, 2000. Assessment of fish biomass distribution in Australian lakesand visualisation in 3D GIS. In: T. NISHIDA (ed.), Proceedings of first international symposiumon GIS in fisheries science, 2-4 March 1999, Seattle, Washington: 329-335. (GIS FisheryResearch Group, Saitama, Japan).
WOOD, B. & S. J. BAIRD, 2010. Mapping bottom-trawl fishing activity in the New Zealand EEZ.In: T. NISHIDA & A. E. CATON (eds.), GIS/spatial analyses in fishery and aquatic sciences, 4:443-450. (International Fishery GIS Society, Saitama, Japan).
XUE, Y., X. JIN, B. ZHANG & Z. LIANG, 2005. Seasonal, diel and ontogenetic variation in feedingpatterns of small yellow croaker in the central Yellow Sea. J. Fish. Biol., 67: 33-50.
1464 A. P. DINESHBABU, SUJITHA THOMAS & G. MAHESWARUDU
NOTE FROM THE EDITORS
The name Charybdis feriata, as spelled considering the generic name to be of feminine gender(as is in accordance with the guidelines in the ICZN (1964) and also appears from many otherspecific names in combination with this generic name that show the difference between masculineand feminine gender; as evidenced by the list of species on the website of WoRMS (2018): see http://www.marinespecies.org/aphia.php?p=taxdetails&id=106923), other lists treat the name Charybdisas of masculine gender, as, e.g., the website of Sealife Base (2018), at: https://www.sealifebase.ca/summary/Charybdis-feriatus.html, where consequently the name is spelled as Charybdis feriatus.Crustaceana follows WoRMS (2018) and Ng et al. (2008), and thus spells the name as C. feriata.
ICZN, 1964. International code of zoological nomenclature – adopted by the XV internationalcongress of zoology (2nd ed.): i-xx, 1-177. (International Trust for Zoological Nomenclature,London).
NG, P. K. L., D. GUINOT & P. J. F. DAVIE, 2008. Systema Brachyurorum: Part I. An annotatedchecklist of extant brachyuran crabs of the world. Raffles Bull. Zool., (Suppl.) 17: 1-286.
WORMS, 2018. World Register of Marine Species. [Available at: http://www.marinespecies.org/index.php.]
First received 7 May 2018.Final version accepted 20 September 2018.
Related Documents