INVESTIGATIONS INTO THE EARLY LIFE HISTORY OF NATURALLY PRODUCED SPRING CHINOOK SALMON AND SUMMER STEELHEAD IN THE GRANDE RONDE RIVER SUBBASIN ANNUAL REPORT 2007 Project Period: 1 February 2007 to 31 January 2008 Prepared by: Jeffrey A. Yanke Erick S. Van Dyke Brian M. Alfonse Jacob P. Kimbro Jesse W. Steele Ian P. Wilson Brian C. Jonasson Richard W. Carmichael Oregon Department of Fish and Wildlife La Grande, OR Funded by: U. S. Department of Energy Bonneville Power Administration Division of Fish and Wildlife Portland, OR 97208-3621 Project Number 1992-026-04 Contract Number 36760 June 2008

Welcome message from author
This document is posted to help you gain knowledge. Please leave a comment to let me know what you think about it! Share it to your friends and learn new things together.
Transcript

INVESTIGATIONS INTO THE EARLY LIFE HISTORY OF NATURALLY PRODUCED SPRING CHINOOK SALMON
AND SUMMER STEELHEAD IN THE GRANDE RONDE RIVER SUBBASIN
ANNUAL REPORT 2007
Project Period: 1 February 2007 to 31 January 2008
Prepared by:
Jeffrey A. Yanke Erick S. Van Dyke Brian M. Alfonse Jacob P. Kimbro Jesse W. Steele Ian P. Wilson
Brian C. Jonasson Richard W. Carmichael
Oregon Department of Fish and Wildlife
La Grande, OR
Funded by:
U. S. Department of Energy Bonneville Power Administration
Division of Fish and Wildlife Portland, OR 97208-3621
Project Number 1992-026-04
Contract Number 36760
June 2008
slb7868
Text Box
Document ID #P107071

ABSTRACT
This study was designed to document and describe the status and life history strategies of spring Chinook salmon and summer steelhead in the Grande Ronde River Subbasin. We determined migration timing, abundance, and life-stage survival rates for juvenile spring Chinook salmon Oncorhynchus tshawytscha and summer steelhead O. mykiss in four streams in the subbasin during migratory year 2007 from 1 July 2006 through 30 June 2007. As observed in previous years of this study, spring Chinook salmon and steelhead exhibited fall and spring movements out of their natal rearing areas, but did not begin their smolt migration through the Snake and lower Columbia River hydrosystem until spring. In this report we provide estimates of abundance and timing of migrants leaving each study stream, their survival and timing to Lower Granite Dam, and estimates of abundance of spring Chinook salmon parr and summer steelhead parr in Catherine Creek and spring Chinook salmon parr in Lostine River during summer. We also document aquatic habitat conditions using water temperature and stream flow in four study streams in the subbasin.
i

CONTENTS
Page ABSTRACT......................................................................................................................... i EXECUTIVE SUMMARY .................................................................................................1
Objectives ................................................................................................................1 Accomplishments.....................................................................................................1 Findings....................................................................................................................2
Spring Chinook Salmon...............................................................................2 Summer Steelhead .......................................................................................3 Stream Condition .........................................................................................3
Management Implications and Recommendations ..................................................4 INTRODUCTION ...............................................................................................................5 SPRING CHINOOK SALMON INVESTIGATIONS........................................................8
Methods....................................................................................................................8
In-Basin Migration Timing and Abundance ................................................8 Migration Timing and Survival to Lower Granite Dam ............................11
Results and Discussion ..........................................................................................15
In-Basin Migration Timing and Abundance ..............................................15 Migration Timing and Survival to Lower Granite Dam ............................16
SUMMER STEELHEAD INVESTIGATIONS................................................................19
Methods..................................................................................................................19 In-Basin Migration Timing and Abundance ..............................................19 Migration Timing and Survival to Lower Granite Dam ............................20
Results and Discussion ..........................................................................................22
In-Basin Migration Timing and Abundance ..............................................22 Migration Timing and Survival to Lower Granite Dam ............................23
ii
CONTENTS (continued)
Page STREAM CONDITION INVESTIGATIONS..................................................................26
Methods..................................................................................................................26 Stream Temperature and Flow...................................................................26
Results and Discussion ..........................................................................................26
Stream Temperature and Flow...................................................................26 FUTURE DIRECTIONS ...................................................................................................29 REFERENCES ..................................................................................................................30 APPENDIX A. A Compilation of Spring Chinook Salmon Data ....................................59 APPENDIX B. A Compilation of Steelhead Data............................................................77
iii

TABLES Number Page 1. Dates of tagging and number of spring Chinook salmon parr PIT-tagged on
various northeast Oregon streams during the summers of 2006 and 2007 ..........33 2. Catch of juvenile spring Chinook salmon at four trap locations in the
Grande Ronde River Subbasin during MY 2007.................................................33 3. Fork lengths of juvenile spring Chinook salmon collected from the study
streams during MY 2007 .....................................................................................34 4. Weights of juvenile spring Chinook salmon collected from the study
streams during MY 2007 .....................................................................................35 5. Survival probability to Lower Granite Dam for spring Chinook salmon parr
tagged in summer 2006 and detected at Columbia and Snake River dams in 2007......................................................................................................................36
6. Juvenile spring Chinook salmon survival probability by location and tag
group from time of tagging to Lower Granite Dam.............................................36 7. Catch of juvenile steelhead at four trap locations in the Grande Ronde
River Subbasin during MY 2007 .........................................................................37 8. Age structure of early and late steelhead migrants collected at trap sites
during MY 2006...................................................................................................38 9. Travel time to Lower Granite Dam of wild steelhead PIT-tagged at screw
traps in spring of 2007 and arriving at Lower Granite Dam in 2007...................38 10. Survival probability to Lower Granite Dam of steelhead PIT-tagged on
Catherine Creek during summer 2006 and at screw traps on Catherine Creek and the upper Grande Ronde, Lostine, and Minam rivers during the fall of 2006 and spring of 2007............................................................................39
11. Age structure of PIT tagged early migrating steelhead with known age
information, and the subset subsequently detected at downstream dams the following spring ...................................................................................................39
iv

FIGURES Number Page 1. Locations of fish traps in the Grande Ronde River Subbasin during the
study period..........................................................................................................40 2. Estimated migration timing and abundance of juvenile spring Chinook
salmon migrants captured by rotary screw traps during MY 2007......................41 3. Length frequency distribution of early and late migrating juvenile spring
Chinook salmon captured at the upper Grande Ronde River, Catherine Creek, Lostine River, and Minam River traps during MY 2007 .........................42
4. Weekly mean fork lengths with standard error for spring Chinook salmon
captured in rotary screw traps in the Grande Ronde River Subbasin during MY 2007. .............................................................................................................43
5. Dates of arrival in 2007 at Lower Granite Dam of spring Chinook salmon
PIT-tagged as parr on Catherine Creek and the Imnaha, Lostine, and Minam rivers during the summer of 2006 summarized by week and expressed as a percentage of the total detected for each group ...........................44
6. Dates of arrival in 2007 at Lower Granite Dam for the fall, winter, and
spring tag groups of juvenile spring Chinook salmon PIT-tagged on the upper Grande Ronde River, expressed as a percentage of the total detected for each group ......................................................................................................45
7. Dates of arrival in 2007 at Lower Granite Dam for the fall, winter, and
spring tag groups of juvenile spring Chinook salmon PIT-tagged on Catherine Creek, expressed as a percentage of the total detected for each group ....................................................................................................................46
8. Dates of arrival in 2007 at Lower Granite Dam for the fall, winter, and
spring tag groups of juvenile spring Chinook salmon PIT-tagged on the Lostine River, expressed as a percentage of the total detected for each group ....................................................................................................................47
9. Dates of arrival in 2007 at Lower Granite Dam for the fall and spring tag
groups of juvenile spring Chinook salmon PIT-tagged on the Minam River, expressed as a percentage of the total detected for each group ...........................48
10. Estimated abundance and migration timing of steelhead migrants captured
by rotary screw traps, during MY 2007 ...............................................................49
v

FIGURES (continued) Number Page 11. Dates of arrival in 2007 at Lower Granite Dam for the fall and spring tag
groups of steelhead PIT-tagged on the upper Grande Ronde River, expressed as a percentage of the total detected for each group ...........................50
12. Dates of arrival in 2007 at Lower Granite Dam for the summer, fall, and
spring tag groups of steelhead PIT-tagged on Catherine Creek, expressed as a percentage of the total detected for each group ............................................51
13. Dates of arrival in 2007 at Lower Granite Dam for the fall and spring tag
groups of steelhead PIT-tagged on the Lostine River, expressed as a percentage of the total detected for each group ...................................................52
14. Dates of arrival in 2007 at Lower Granite Dam for the fall and spring tag
groups of steelhead PIT-tagged on the Minam River, expressed as a percentage of the total detected for each group ...................................................53
15. Length frequency distributions for all steelhead PIT-tagged at screw traps
in the fall of 2006 and those subsequently observed at Snake River or Columbia River dams in 2007 .............................................................................54
16. Length frequency distributions for all steelhead PIT-tagged at screw traps
in the fall of 2005, and those subsequently observed at Snake River or Columbia River dams in 2006 and 2007..............................................................55
17. Length frequency distributions for all steelhead PIT-tagged at screw traps
in the spring of 2007 and those subsequently observed at Snake River or Columbia River dams in 2007 .............................................................................56
18. Moving mean of maximum water temperature during the in-basin life
stages of egg-to-emigrant for juvenile spring Chinook salmon that migrated from four study streams in the Grande Ronde River basin during migratory year 2007..............................................................................................................57
19. Average daily discharge during the in-basin life stages of egg-to-emigrant
for juvenile spring Chinook salmon that migrated from four study streams in the Grande Ronde River basin during migratory year 2007............................58
vi

APPENDIX TABLES Number Page A-1. Population estimates, median migration dates, and percentage of juvenile
spring Chinook salmon population moving as late migrants past traps sites, 1994–2007............................................................................................................60
A-2. Dates of arrival at Lower Granite Dam of spring Chinook salmon smolts
PIT-tagged in upper rearing areas during the summer and winter, and at screw traps as early and late migrants during migratory years 1993–2007 .........62
A-3. The number of PIT tagged spring Chinook salmon released by tag group
and stream, and survival probability to Lower Granite Dam during migratory years 1993–2007 .................................................................................68
A-4. Travel time to Lower Granite Dam of juvenile spring Chinook salmon PIT-
tagged at screw traps in spring and arriving at Lower Granite Dam the same year .............................................................................................................73
A-5. Overwinter survival rates of spring Chinook salmon parr overwintering
upstream of screw traps on Catherine Creek and the Lostine and Grande Ronde rivers .........................................................................................................75
A-6. Comparisons of overwinter survival of spring Chinook salmon parr in
rearing areas upstream and downstream on the upper Grande Ronde River, Catherine Creek and the Lostine River ................................................................76
B-1. Population estimates, median migration dates, and percentage of steelhead
population moving as late migrants past trap sites, 1997–2007 migratory years. ....................................................................................................................78
B-2. Dates of arrival at Lower Granite Dam of steelhead PIT-tagged upstream
of the screw trap in Catherine Creek and tributaries during summer, and at screw traps in the fall and spring during the same migratory year, 2000–2007......................................................................................................................80
B-3. Survival probabilities to Lower Granite Dam for steelhead PIT- tagged in
the upper rearing areas of Catherine Creek in summer and at screw traps during fall and spring ...........................................................................................82
B-4. Fork lengths of steelhead at the time they were PIT-tagged at screw traps
on Catherine Creek and the upper Grande Ronde, Lostine, and Minam rivers during the early migration period 1999–2006, summarized by dam detection history...................................................................................................86
vii

APPENDIX TABLES (continued) Number Page B-5. Fork lengths of steelhead at the time they were PIT-tagged at screw traps
on Catherine Creek and the upper Grande Ronde, Lostine, and Minam rivers during the late migration period 2000–2007, summarized by dam detection history...................................................................................................89
B-6. Fork lengths of steelhead at the time they were PIT-tagged in rearing
areas upstream of the screw trap on Catherine Creek and its tributaries during summer 2000–2006, summarized by migration history ...........................92
viii

EXECUTIVE SUMMARY
Objectives 1. Document the in-basin migration patterns and estimate egg-to-migrant survival for
spring Chinook salmon juveniles in Catherine Creek and the upper Grande Ronde, Minam, and Lostine rivers.
2. Determine overwinter mortality and the relative success of fall (early) migrant and
spring (late) migrant life history strategies for spring Chinook salmon from tributary populations in Catherine Creek and the upper Grande Ronde, and Lostine rivers, and the relative success of fall (early) migrant and spring (late) migrant life history strategies for spring Chinook salmon from the Minam River.
3. Estimate and compare smolt survival probabilities at main stem Columbia and Snake
River dams for migrants from four local, natural populations of spring Chinook salmon in the Grande Ronde River and Imnaha River subbasins.
4. Document the annual migration patterns for spring Chinook salmon juveniles from
four local, natural populations in the Grande Ronde River and Imnaha River subbasins: Catherine Creek, Lostine, Minam, and Imnaha rivers.
5. Document patterns of movement for juvenile steelhead from tributary populations in
Catherine Creek, the upper Grande Ronde, Lostine and the Minam rivers including data on migration timing, duration, and smolt abundance.
6. Estimate and compare survival probabilities to main stem Columbia and Snake River
dams for summer steelhead from four tributary populations: Catherine Creek and the upper Grande Ronde, Lostine, and Minam rivers.
7. Evaluate methods to estimate the proportion of steelhead captured during fall trapping
that are migrating out of rearing areas and will undertake a smolt migration the following spring.
Accomplishments We accomplished all of our objectives in 2007.
1
Findings Spring Chinook Salmon
We determined migration timing and abundance of juvenile spring Chinook salmon Oncorhynchus tshawytscha using rotary screw traps on four streams in the Grande Ronde River Subbasin from 12 September 2006 through 11 June 2007. Based on migration timing and abundance, we distinguished two distinct life history strategies of juvenile spring Chinook salmon. 'Early' migrants left upper rearing areas from 12 September 2006 to 11 January 2007 with a peak in the fall. 'Late' migrants left upper rearing areas from 14 February 2007 to 11 June 2007 with a peak in the spring. At the upper Grande Ronde River trap, we estimated 17,109 juvenile spring Chinook salmon migrated out of upper rearing areas with approximately 31% leaving as early migrants. At the Catherine Creek trap, we estimated 13,831 juvenile spring Chinook salmon migrated out of upper rearing areas with 79% leaving as early migrants. At the Lostine River trap, we estimated 46,183 juvenile spring Chinook salmon migrated out of upper rearing areas with 74% leaving as early migrants. At the Minam River trap, we estimated 37,719 juvenile spring Chinook salmon migrated out of the river with 67% leaving as early migrants.
Juvenile spring Chinook salmon that were PIT-tagged in natal rearing areas of
Catherine Creek and the Imnaha, Lostine, and Minam rivers during the summer of 2006 were detected at Lower Granite Dam between 4 April and 24 May 2007. Arrival timing to Lower Granite Dam was not significantly different among the four study streams (P = 0.381). Median arrival dates at Lower Granite Dam ranged from 23 April to 4 May. Survival probabilities were significantly lower for Chinook salmon PIT-tagged as parr in Catherine Creek (0.042) than for parr in the Lostine, Minam, and Imnaha rivers (0.159, 0.175, and 0.178, respectively) which were not significantly different from each other.
Chinook salmon tagged at the traps were detected at Lower Granite Dam between
5 April and 13 June 2007. Although there was overlap in arrival dates, median arrival dates for early migrants were before that of late migrants for all four streams. Early migrant survival probabilities to Lower Granite Dam ranged from 0.203 to 0.250, and late migrants ranged from 0.310 to 0.602. Among the four populations, the upper Grande Ronde River and Catherine Creek populations generally had lower rates of survival than the Lostine and Minam River populations.
During migratory year (MY) 2007, upper Grande Ronde and Catherine Creek
juvenile spring Chinook salmon that overwintered downstream of trap sites (early migrants) survived at higher rates than juveniles that overwintered upstream of the traps (late migrants). For the Lostine River population, survival rates between fish that overwintered downstream or upstream of the trap were equivalent.
2

Summer Steelhead
We determined migration timing and abundance of juvenile steelhead/rainbow trout Oncorhynchus mykiss using rotary screw traps on four streams in the Grande Ronde River Subbasin during MY 2007. Based on migration timing and abundance, we distinguished early and late migration patterns, similar to those of spring Chinook salmon. For MY 2007, we estimated 12,632 steelhead migrants left upper rearing areas of the upper Grande Ronde River with 13% of these fish leaving as early migrants. We estimated 13,715 steelhead migrants left upper rearing areas in Catherine Creek with 73% of these fish leaving as early migrants. We estimated 13,162 steelhead migrated out of the Lostine River, with approximately 74% of these fish leaving as early migrants. We estimated 11,831 steelhead migrated from the Minam River with 28% of these fish leaving as early migrants.
The steelhead collected at trap sites during MY 2007 were comprised of four age
groups. Early migrants ranged from 0 to 3 years of age, whereas late migrants ranged from 1 to 3 years of age. Smolts detected at Snake River and lower Columbia River dams ranged from 1 to 3 years of age with age-2 fish making up the highest percentage of seaward migrants.
Juvenile steelhead PIT-tagged at screw traps on Catherine Creek, and the upper Grande Ronde, Lostine, and Minam rivers were detected at Lower Granite Dam from 2 April to 12 June 2007. Median arrival dates for early migrants ranged from 5 May to 14 May. Median arrival dates for late migrants ranged from 7 May to 13 May.
The survival probability for steelhead tagged in the Catherine Creek drainage
during the summer of 2006 was 0.072 for fish tagged in the main stem. We were not able to estimate survival probability in Little Catherine Creek because no fish were detected at Lower Granite Dam. Survival probabilities to Lower Granite Dam for early migrating steelhead ranged from 0.084 to 0.160. Survival probabilities to Lower Granite Dam for late migrants ranged from 0.179 to 0.684. Fish from Catherine Creek had consistently lower rates of survival than fish from the upper Grande Ronde, Lostine and Minam rivers. Stream Condition
Daily mean water temperature typically fell within DEQ standards in all four
study streams while the 2005 BY of spring Chinook salmon were in the Grande Ronde River Subbasin (1 August 2005–30 June 2007). The 2005 BY encountered daily mean water temperature in excess of the DEQ standard of 17.8°C for 43 of 596 days in the upper Grande Ronde River, 26 of 661 days Catherine Creek, 0 of 698 days in the Lostine River, and 59 of 698 days Minam River. Daily mean water temperatures in excess of 17.8°C occurred intermittently while eggs may have been being deposited in redds (August 2005), intermittently during parr rearing stages (June–August 2006), and during several days of early dispersal (August–September 2006) in the upper Grande Ronde River, Catherine Creek and the Minam River. Daily mean water temperature did not
3
exceed 17.8°C on any day in the Lostine River. Temperatures preferred by juvenile Chinook salmon (10–15.6°C) occurred for 20% of the hours logged in the upper Grande Ronde River, 18% of the hours logged in Catherine Creek, 23% of the hours logged in the Lostine River and 16% of the hours logged in the Minam River. These optimal temperatures tended to occur May–June and August–October in all four study streams. Maximum water temperature considered lethal to Chinook salmon was encountered 10 of 596 days in the upper Grande Ronde River, two of 661 days in Catherine Creek, and 11 of 698 days in the Minam River. The moving mean of maximum daily water temperature showed that temperatures below the limit for healthy growth (4.4°C) occurred more often than temperature above the limit for healthy growth (18.9°C) in all four study streams. With the exception of the upper Grande Ronde River during January of 2006, stream discharge was relatively low and stable August through March. Spring run-off typically occurred April–May through July–August with peak flows occurring mid-May in all four study streams.
Management Implications and Recommendations
Rearing of juvenile spring Chinook salmon and summer steelhead in the Grande Ronde River Subbasin is not confined to the areas in which the adults spawn. Some of the juvenile spring Chinook salmon and steelhead from each of the study streams move out of natal rearing areas to overwinter in downstream areas of the subbasin before migrating toward the ocean as smolts the following spring or later. These movements of spring Chinook salmon and steelhead show that lower river habitats in the subbasin are used for more than migratory corridors, and point to a need for adequate habitat protection in all areas of the subbasin. Migration timing continues to vary between years and populations; therefore the need exists to manage the hydrosystem to maximize survival throughout the entire migratory period of Snake River spring/summer Chinook salmon and steelhead smolts.
4

INTRODUCTION
The Grande Ronde River originates in the Blue Mountains of northeast Oregon and flows 334 km to its confluence with the Snake River near Rogersburg, Washington. The Grande Ronde River Subbasin is divided into three watershed areas: the Upper Grande Ronde River Watershed, the Lower Grande River Watershed, and the Wallowa River Watershed. The Upper Grande Ronde River Watershed includes the Grande Ronde River and tributaries from the headwaters to the confluence with the Wallowa River. The Lower Grande Ronde River Watershed includes the Grande Ronde River and tributaries, excluding the Wallowa River, from the Wallowa River to the confluence with the Snake River. The Wallowa River Watershed includes the Wallowa River and tributaries, including the Lostine and Minam rivers, from the headwaters to its confluence with the Grande Ronde River.
Historically, the Grande Ronde River Subbasin produced an abundance of
salmonids including spring, summer and fall Chinook salmon, sockeye salmon, coho salmon, and summer steelhead (ODFW 1990). During the past century, numerous factors have led to a reduction in salmonid stocks such that the only viable populations remaining are spring Chinook salmon and summer steelhead. Snake River spring/summer Chinook salmon, including Grande Ronde River spring Chinook salmon, were listed as threatened under the Endangered Species Act (ESA) in 1992. Snake River steelhead, including Grande Ronde River summer steelhead, were listed as threatened under the ESA in 1997. Six spring Chinook salmon populations have been identified in the subbasin (TRT 2003): Wenaha River; Wallowa–Lostine River (includes Wallowa River, Lostine River, Bear Creek and Hurricane Creek); Minam River; Catherine Creek (includes Catherine and Indian creeks); Upper Grande Ronde River (includes the upper Grande Ronde River and Sheep Creek); and Lookingglass Creek, of which the endemic spring Chinook salmon population is considered extinct. Four summer steelhead populations have been identified in the subbasin (TRT 2003): Lower Grande Ronde River (includes the main stem Grande Ronde River and all tributaries, except Joseph Creek, upstream to the confluence of the Wallowa River); Joseph Creek; Wallowa River (includes Minam and Lostine rivers); and Upper Grande Ronde River (includes the main stem upper Grande Ronde River, Lookingglass Creek, Catherine Creek, Indian Creek, and tributaries).
Anadromous fish production in the subbasin is limited by two overarching factors (Nowak 2004). Adult escapement of salmon and steelhead is limited by out-of-subbasin issues, such as juvenile and adult passage problems at Columbia and Snake River dams and out-of-subbasin overharvest, and is insufficient to fully seed the available habitat (Nowak 2004). The carrying capacity of the habitat and fish survival have been reduced within the subbasin by land management activities which have contributed to riparian and instream habitat degradation. Impacts to fish and aquatic habitats have included water withdrawal for irrigated agriculture, human residential development, livestock overgrazing, mining, channelization, low stream flows, poor water quality, mountain pine beetle damage, logging activity, and road construction (Nowak 2004). Many of these impacts have been reduced in recent years as management practices become more
5

sensitive to fish and aquatic habitats, but the effects of past management remain (Nowak 2004).
Development of sound recovery strategies for these salmon stocks requires knowledge of stock-specific life history strategies and critical habitats for spawning, rearing, and downstream migration (Snake River Recovery Team 1993; NWPPC 1992; ODFW 1990). This project is acquiring knowledge of juvenile migration patterns, smolt production, rates of survival, and juvenile winter rearing habitat within the subbasin. This project collects data to obtain life stage specific survival estimates (egg-to-parr, parr-to-smolt, and smolt-to-adult), and includes an evaluation of the importance and frequency at which alternative life history tactics are utilized by spring Chinook salmon populations in northeast Oregon.
The spring Chinook salmon and summer steelhead smolt migration from the Grande Ronde River Subbasin occurs in spring. Data from Lookingglass Creek (Burck 1993), Catherine Creek, Grande Ronde River, and Lostine River (Keefe et al. 1994, 1995; Jonasson et al. 1997, Van Dyke et al. 2001) indicate a substantial number of juveniles move out of upper rearing areas during fall and overwinter downstream within the Grande Ronde River Subbasin. The proportion of the total migrant population these early migrants represent, and their survival to Snake and Columbia River dams varies among years and streams.
Juvenile Chinook salmon that leave upper rearing areas in Catherine Creek and the upper Grande Ronde River in fall overwinter in the Grande Ronde Valley. Much of the habitat in these mid-reaches of the Grande Ronde River is degraded. Stream conditions in the Grande Ronde River below the city of La Grande consist of both meandering and channeled sections of stream, which run through agricultural land. Riparian vegetation in this area is sparse and provides little shade or instream cover. The river is heavily silted due to extensive erosion associated with agricultural and forest management practices and mining activities. It is reasonable to suggest that salmon overwintering in degraded habitat may be subject to increased mortality due to the limited ability of the habitat to buffer against environmental extremes. The fall migration from upper rearing areas in Catherine Creek constitutes a substantial portion of the juvenile production (Jonasson et al. 2006). Therefore winter rearing habitat quantity and quality in the Grande Ronde River valley may be important factors limiting spring Chinook salmon smolt production in the Grande Ronde River.
Juvenile steelhead that leave the upper rearing areas in fall and spring may
continue rearing within the subbasin for an extended period of time (6 months to several years) before continuing on the smolt migration during the spring. Therefore rearing habitat is not limited to the areas where steelhead are spawned.
Numerous enhancement activities have been undertaken in an effort to recover
spring Chinook salmon populations in the Grande Ronde River Subbasin. Supplementation programs have been initiated by the Oregon Department of Fish and Wildlife, the Confederated Tribes of the Umatilla Indian Reservation, and the Nez Perce
6

Tribe using endemic broodstock from the upper Grande Ronde River, Catherine Creek, and Lostine River. Information collected by this project will serve as the foundation for assessing the effectiveness of programs currently underway.
7

SPRING CHINOOK SALMON INVESTIGATIONS
Methods For the purpose of this report, we assume all juvenile spring Chinook salmon
captured in traps were downstream “migrants”. A migratory year (MY) in the Grande Ronde River Subbasin begins on 1 July, which is the earliest calendar date juvenile spring Chinook salmon are expected to begin their migration to the ocean. The migratory year ends on 30 June the following calendar year. The term “brood year” (BY) refers to the calendar year in which eggs were fertilized. All spring Chinook salmon referred to in this report were naturally produced unless noted otherwise.
In-Basin Migration Timing and Abundance
We determined the in-basin migration timing and abundance of juvenile spring Chinook salmon in the upper Grande Ronde River, Catherine Creek, and the Lostine and Minam rivers by operating rotary screw traps during MY 2007. Spring Chinook salmon in each study stream exhibit two migratory life history patterns. Early migrants leave upper rearing areas in fall to overwinter in downstream habitat before continuing their seaward migration out of the subbasin the following spring. Late migrants exhibit another life history strategy whereby they overwinter in the upper rearing areas prior to initiating their seaward migration in spring. Designations of early and late migration periods were based on trends in capture rates at trap sites. A common period of diminished capture rates occur at all four trap sites in winter and was used to separate fish into early and late migration periods. We determined migration timing and abundance for both of these periods.
In the Grande Ronde River Subbasin, we operated four rotary screw traps (Figure
1). In the Upper Grande Ronde River Watershed, one rotary screw trap was located below spawning and upper rearing areas in the upper Grande Ronde River near the town of Starkey at rkm 299, and a second trap was located in Catherine Creek below spawning and upper rearing areas near the town of Union at rkm 32. In the Wallowa River Watershed, one rotary screw trap was located below the majority of spawning and upper rearing areas on the Lostine River near the town of Lostine at rkm 3, and another trap was located on the Minam River below spawning and rearing areas at rkm 0. Although the intent was to operate the traps continuously through the year, there were times when a trap could not be operated due to high or low river flows or freezing conditions. There were also instances when traps were not operating due to debris blockage and mechanical breakdowns. No attempt was made to adjust population estimates for periods when traps were not operating. For this reason, estimates represent a minimum number of migrants.
8
Sampling and Marking: The rotary screw traps were equipped with live-boxes that safely held hundreds of juvenile spring Chinook salmon trapped over 24–72 h periods. The traps were generally checked daily, but were checked as infrequently as every third day when few fish were captured per day and environmental conditions were not severe. All juvenile spring Chinook salmon captured in traps were removed for enumeration and scanned for PIT tags. Before scanning or marking, fish were anesthetized in an aerated bath containing 40–50 mg/L of tricaine methanesulfonate (MS-222). PIT tags were injected manually with a modified hypodermic syringe as described by Prentice et al. (1986, 1990) and Matthews et al. (1990, 1992) for fish with fork length (FL) greater than 54 mm. Syringes were disinfected for 10 min in 70% isopropyl alcohol and allowed to dry between each use. A portable tagging station that consisted of a computer, PIT tag reader, measuring board, and electronic balance was used to record the tag code, fork length (±1 mm), and weight (±0.1 g) of tagged fish. Fork lengths (mm) and weights (g) were measured from at least 100 juvenile spring Chinook salmon each week when possible. All fish were handled and marked at stream temperatures of 16°C or less and released within 24 hours of being tagged. River height was recorded daily from permanent staff gauges and water temperatures were recorded daily at each trap location using thermographs or hand held thermometers.
Migrant abundance was estimated by conducting weekly trap efficiency tests throughout the migratory year at each trap site. Chinook salmon fry and sexually mature parr were not included in migrant abundance estimates. Trap efficiency was determined by releasing a known number of marked fish above each trap and enumerating recaptures. Immature parr that exceeded 54 mm in FL were either caudal fin-clipped or PIT-tagged, whereas fish less than 55 mm in FL were marked with a caudal fin clip only. On days when a trap stopped operating, the number of recaptured fish and the number of marked fish released the previous day were subtracted from the weekly totals. Trap efficiency was estimated by jjj MRE =ˆ , (1)
where is the estimated trap efficiency for week j, RjE j is the number of marked fish recaptured during week j, and Mj is the number of marked fish released upstream during week j.
The weekly abundance of migrants that passed each trap site was estimated by jjj EUN ˆˆ = , (2)
where jN is the estimated number of fish migrating past the trap for week j , Uj is the
total number of unmarked fish captured that week, and is the estimated trap efficiency for week j. Total migrant abundance was estimated as the sum of weekly abundance estimates.
jE
Variance of each weekly $N was estimated by the one-sample bootstrap method
(Efron and Tibshirani 1986; Thedinga et al. 1994) with 1,000 iterations. Preliminary analysis indicated that when less than 10 fish were recaptured in a week, bootstrap variance estimates were greatly expanded. For this reason, consecutive weeks were
9

combined when there were fewer than 10 recaptures until total recaptures were greater or equal to 10 fish. This combined trap efficiency estimate was used in the bootstrap procedure to estimate variance of weekly population estimates. Each bootstrap iteration calculated weekly from equations (1 and 2) drawing and from the binomial distribution, where asterisks denote bootstrap values. Variance of was calculated from the 1,000 iterations. Weekly variance estimates were summed to obtain an estimated variance for the total migrant abundance. Confidence intervals for total migrant abundance were calculated by
*ˆ jN *Rj *jU
*ˆ jN
95% CI V= 196. , (3) where V is the estimated total variance determined from the bootstrap.
The upper Grande Ronde River, Catherine Creek, and Lostine River traps were located below hatchery spring Chinook salmon release sites. The magnitude of hatchery spring Chinook salmon releases into these streams during the spring required modifications to the methods used for estimating migrant abundance of wild spring Chinook salmon at the trap sites. During low hatchery spring Chinook salmon catch periods the trap was fished continuously throughout a 24 h period as described above. During high catch periods, the trap was fished systematically (each night) for a 2 or 4 h interval using systematic two-stage sampling. Systematic sampling allowed us to reduce fish handling and overcrowding in the live-box, and avoid labor-intensive 24 h trap monitoring. Preliminary 24 h sampling indicated a strong diel pattern in spring Chinook salmon catch rates. The specific intervals were chosen because a relatively large proportion of the total daily catch was captured during these 2 and 4 h time blocks.
Systematic sampling required estimating the proportion of the total daily catch
captured during each sampling interval. This proportion was estimated by fishing the trap over several 24 h periods prior to systematic sampling. The number of fish trapped during the 2 or 4 h sampling interval and the number in the remaining interval within each 24 h period were counted. The proportion of the total daily catch captured during the sampling interval (i) was estimated by CSP ii =ˆ , (4) where is the estimated proportion of the total daily catch for sampling interval i, is the total number of fish caught during sampling interval i, and C is the total number of fish caught throughout the 24 h sampling periods.
iP iS
Estimates of trap efficiency could not be obtained during systematic sampling, so
trap efficiency was calculated using mark–recapture numbers from one week before and after the systematic sampling period. Abundance of wild juvenile spring Chinook salmon at each trap during the systematic sampling period was estimated by ( ) EPUN iis ˆˆˆ = , (5) where is the estimated number of fish migrating past the trap during systematic sampling, is the total number of fish captured during interval i, is the proportion of daily catch from equation (9), and
sNiU iP
E is the estimated trap efficiency. Abundance for the
10
total migration at the Catherine Creek, upper Grande Ronde, and Lostine river traps was determined by summing the continuous and systematic sampling estimates.
Variance for at each trap during systematic sampling was estimated by the one-sample bootstrap method (Efron and Tibshirani 1986; Thedinga et al. 1994) with 1,000 iterations. Each bootstrap iteration calculated from equations (1, 4, and 5) drawing R and S
sN
sNi from the binomial distribution and Ui from the Poisson distribution.
Variance of total migrant abundance was determined by summing the variance from the continuous and systematic sampling estimates. Migration Timing and Survival to Lower Granite Dam
Detections of PIT tagged fish at Lower Granite Dam (the first Snake River dam encountered) were used to estimate migration timing, while survival probabilities to Lower Granite Dam were estimated using detections of PIT tagged fish at Snake and Columbia River dams. Both estimates were calculated for summer, fall, winter, and spring tag groups.
The summer tag groups consisted of age-0 parr tagged during July and August
2006 in their upstream rearing habitat. This group included fish that moved out of upper rearing areas either as early or late migrants, and consequently overwintered either in the lower or the upper rearing areas, respectively before continuing their downstream migration. Therefore, the summer tag group represented timing and survival for the population as a whole.
Summer tag group fish were captured using snorkel–seining methods, whereby 2
or 3 snorkelers herded parr downstream into a seine held perpendicular to the stream flow. Traditional beach seining was also used in a few areas. Captured fish were held in aerated, 19-L buckets and transferred periodically to live cages anchored in shaded areas of the stream near marking stations. The goal was to PIT-tag 500 parr per stream on Catherine Creek and the Lostine River, and 1,000 parr per stream on the Minam and Imnaha rivers for the summer tag groups.
The fall tag groups represented early migrants that left the upstream rearing areas
in the fall and overwintered downstream of screw traps. For consistency with previous years’ data, fish tagged as they moved downstream past the upper trap sites between 1 September 2006 and 28 January 2007 were designated the fall tag group. Early migrants were captured, tagged, and released at the screw traps on the upper Grande Ronde River, Catherine Creek, Lostine River, and Minam River. The goal was to PIT-tag 500 fish at each trap throughout the early migration.
Both the winter and spring tag groups represented late migrants that overwintered
as parr upstream of the screw traps and migrated downstream in the spring. The winter group was tagged earlier in the upper rearing areas (December 2006) than the spring group, which were tagged at the screw trap as migrants (29 January–30 June 2007). Therefore, the winter tag group experienced overwinter mortality after tagging while the
11
spring tag group did not. Winter tag group fish were caught, tagged, and released a minimum of 8 km above the trap sites to minimize the chance they would pass the trap sites while making localized movements during winter. Fish were caught using dip nets while snorkeling at night. The goal was to PIT-tag 500 fish in the upper Grande Ronde River, Catherine Creek, and the Lostine River for winter tag groups.
Spring migrants were captured, tagged, and released at the screw traps on the
upper Grande Ronde River, Catherine Creek, Lostine River, and Minam River. The goal was to PIT-tag 500 fish at each trap throughout the spring migration.
During MY 2007, all fish were scanned for PIT tags upon capture in all screw
traps. Additionally, PIT tag interrogation systems were used in juvenile bypass systems at seven of eight Snake River and Columbia River dams to monitor fish passage. All recaptured and interrogated fish were identified by their original tag group, insuring the independence of tag groups for analysis. At the completion of MY 2007, detection information was obtained from juvenile PIT tag interrogation sites at Lower Granite, Little Goose, Lower Monumental, Ice Harbor, McNary, John Day, and Bonneville dams.
Calculations: Migration Timing: The timing of migration past Lower Granite
Dam was estimated for each tag group by expanding total daily numbers of PIT tag detections relative to the proportion of river outflow and spill. This procedure was necessary because some fish may have passed undetected over the spillway and the amount of spill varies throughout the migration season. The proportion of fish that passed over the spillway was assumed to be directly related to the proportion of flow spilled. This assumption conforms fairly well to data obtained using non-species-specific hydroacoustic methods (Kuehl 1986). It was also assumed that there was no temporal variation either in the proportion of fish diverted from turbine intakes into the bypass system or in the proportion of fish that passed through the surface bypass collector. These assumptions were made in light of evidence to the contrary (Giorgi et al. 1988, Swan et al. 1986, Johnson et al. 1997) because the data required to account for such variation were unavailable. The extent to which the results may be biased would depend on the overall rates of fish passage via the bypass system and surface bypass collector, and on the degree to which daily rates of fish passage by these routes may have varied throughout the migration seasons. The number of fish in a particular tag group migrating past Lower Granite Dam by day ( ) was estimated by multiplying the number of fish from the tag group that were detected each day by a daily expansion factor calculated using Lower Granite Dam forebay water flow data obtained from the U.S. Army Corps of Engineers at the DART website (
N dˆ
www.cbr.washington.edu/dart/river.html):
O
LODNd
ddd
d
+×=ˆ , (6)
where Dd is the number of PIT tagged fish from a tag group detected at Lower Granite Dam on day d, Od is the outflow (kcfs) measured at Lower Granite Dam forebay on day d, and Ld is the spill at Lower Granite dam spill (kcfs) on day d. Each daily estimate was rounded in the nearest integer. Daily estimates were added for each week to obtain weekly migration timing estimates for each tag group, which were reported graphically. First and last arrival dates were reported for each tag group. The median arrival date of
12

each tag group was determined from the daily estimates. Late migrants are tagged while fish are actively migrating seaward, whereas PIT tagged early migrants stop migrating and overwinter prior to resuming seaward migration in the spring. Simulated chi-square tests using the number of PIT tag releases and the estimated number of migrants for each week have shown that these two variables are independent when both trap efficiency estimates and annual peaks in movement vary (random). Therefore, median arrival dates may be biased on the distribution of PIT tag releases. In hopes of reducing this bias we used winter tag group to represent the late migrants when comparing migration timing differences with early migrants. The travel times for the spring tag groups to reach Lower Granite Dam from the screw traps were summarized for each location.
Survival Probabilities: The probability of survival to Lower Granite Dam for fish
in each tag group was calculated using the Cormack–Jolly–Seber method in the SURPH 2.2b program (Lady et al. 2001). This method takes into account the probability of detection when calculating the probability of survival.
Overwinter Survival: Survival probabilities for the winter tag group and the
spring tag group were used to indirectly estimate the overwinter survival ( ) for late migrants in the upstream rearing habitat on the upper Grande Ronde River, Catherine Creek, and the Lostine River:
S overwintersˆ ,
SS
Ssprings
wintersoverwinters ˆ
ˆˆ
,
,, = (7)
where is the survival probability to Lower Granite Dam for the winter tag group from stream s, and
S wintersˆ ,
S pringssˆ , is the survival probability to Lower Granite Dam for the spring tag group from stream s.
Population Characteristics and Comparisons: The summer tag groups include
the various life history patterns displayed by a population and provides information about the population’s overall survival and timing past the dams. In summer of 2005 and 2006, PIT tagged parr from populations in Catherine Creek and the Lostine, Minam, and Imnaha rivers were used to monitor and compare their migration timing as smolts to Lower Granite Dam and their survival probabilities from tagging to the dams on the Snake River. Tagging operations were conducted in late summer (Table 1) so that most fish would be large enough to tag (FL > 55 mm). Sampling occurred primarily in areas where spawning adults were concentrated the previous year.
Migration Timing: Differences in migration timing between populations were
determined using a Kruskal–Wallis one-way ANOVA on ranks on dates of arrival, expressed as day of the year, of expanded total daily PIT tag detections (see expansion explanation in Migration Timing and Survival to Lower Granite Dam: Calculations: Migration Timing). When significant differences were found, the Dunn’s pairwise multiple comparison procedure was used (α = 0.05) to compare arrival dates among populations.
13

Survival Probabilities: Survival probabilities were compared between populations using the modeling and hypothesis testing capabilities of Surph 2.2b (Lady et al. 2001). Several possible models describing differences of survival probabilities among populations were developed, and the model that best-fit the data was selected using Akaike’s Information Criterion. This model of best fit was tested against the full (Ha) or null (Ho) model using likelihood ratio tests to determine if there were statistically significant differences in survival probabilities between populations.
Comparison of Life History Strategies within Populations: Tests were
performed to determine if the early or late migrant life histories were associated with differences in migration timing to Lower Granite Dam, and survival to main stem Snake and Columbia River dams.
Migration Timing: Timing of migration past Lower Granite Dam was compared
between the fall (early migrants) and winter (late migrants) tag groups from upper Grande Ronde River, Catherine Creek, and the Lostine River to investigate differences in migration timing. Comparisons were made using the Mann–Whitney rank sum test on arrival dates. Spillway flow (and the passage of undetected PIT tagged fish at the dam) was taken into account when expanding daily detections (see expansion explanation in Migration Timing and Survival to Lower Granite Dam: Calculations: Migration Timing). A winter tag group was not available for the Minam River, so no comparison of median arrival dates were made for this population.
Survival Probabilities: Fish that moved out of upstream rearing areas
overwintered in different habitats than fish that remained upstream, and each group was subject to different environmental conditions. Selecting different overwintering habitats may have implications on overwinter survival. For each stream, relative success of early and late migrants was evaluated by using the Maximum Likelihood Ratio Test to test the null hypothesis that survival probabilities of the fall tag group (early migrants) and the winter tag group (late migrants) were the same. Any difference in survival probabilities between these two groups was assumed to be due to differential survival in upstream (used by winter tag group) and downstream (used by fall tag group) overwintering habitat. Since the fall group was tagged before the winter group, a lower survival estimate for the fall tag group could be due to elapsed time rather than a difference in over wintering conditions.
14

Results and Discussion
In-Basin Migration Timing and Abundance
Upper Grande Ronde River: The upper Grande Ronde River trap fished for 152 d between 19 September 2006 and 13 June 2007 (Table 2). There was a distinct early and late migration exhibited by juvenile spring Chinook salmon at this trap site (Figure 2). Systematic subsampling comprised 17 of the 94 d the trap was fished during late migration period, and a total of 261 juvenile Chinook salmon were caught during this period. The median emigration date for early migrants passing the trap was 20 October 2006, and the median emigration date for late migrants passing the trap was 13 March 2007 (Appendix Table A-1). These dates fall within the range of median dates previously recorded for this study but tended to be earlier than most years.
We estimated a minimum of 17,109 (95% CI, ± 1,708) juvenile spring Chinook salmon migrated out of the upper Grande Ronde River rearing areas during MY 2007 (Appendix Table A-1). Based on the total minimum estimate, 31% (7,846 ± 306) of the juvenile spring Chinook salmon were early migrants and 69% (11,753 ± 1,680) were late migrants. A dominant late migration in the upper Grande Ronde River is consistent with most migratory years studied (Appendix Table A-1).
Catherine Creek: The Catherine Creek trap fished for 164 d between 18
September 2006 and 11 June 2007 (Table 2). There was a distinct early migration exhibited by juvenile spring Chinook salmon at this trap site, but there was not a distinct peak in the late migration in MY 2007 (Figure 2), which was similar to the patterns observed since MY 2000. Systematic subsampling comprised 6 of the 104 d the trap was fished during late migration period, and a total of 46 juvenile Chinook salmon were caught during this period. The median emigration date for early migrants passing the trap was 14 October 2006, and the median emigration date for late migrants was 29 March 2007. The early median emigration dates was within the range of median dates reported from previous years of this study, however the late median emigration date was the latest recorded to date in this study (Appendix Table A-1).
We estimated a minimum of 13,831 ± 1,032 juvenile spring Chinook salmon migrated out of the upper Catherine Creek rearing areas during MY 2007. This migrant estimate was within the range of population estimates previously reported for this study (Appendix Table A-1). Based on the total minimum estimate, 79% (10,936 ± 788) migrated early and 21% (2,895 ± 667) migrated late. In contrast with migrants from the upper Grande Ronde River, the principal migration from Catherine Creek has consistently been observed during the early migrant period.
Lostine River: The Lostine River trap fished for 230 d between 12 September
2006 and 15 June 2007 (Table 2). Distinct early and late migrations were evident at this trap site (Figure 2). Systematic subsampling comprised 15 of the 118 d the trap was fished during the late migration period, and a total of 1,056 juvenile Chinook salmon were caught during this period. The median emigration date for early migrants was 14
15

October 2006, and the median date for late migrants was 7 April 2006. Both dates were within the range reported in previous years of this study (Appendix Table A-1).
We estimated a minimum of 46,183 ± 4,827 juvenile spring Chinook salmon
migrated out of the Lostine River during MY 2007. Based on the minimum estimate, 74% (34,250 ± 4,720) of the juvenile spring Chinook salmon migrated early and 26% (11,933 ± 1,013) migrated late. The percentage of late migrants is within the range reported from previous years of this study (Appendix Table A-1). The Lostine River population appears to be similar to the Catherine Creek population in that the largest emigration has been observed during the early migrant period (Appendix Table A-1).
Minam River: The Minam River trap fished for 181 d between 11 September 2006 and 15 June 2007 (Table 2). Distinct early and late migrations were evident (Figure 2). The median emigration date of early migrants was 5 November 2006, and the median date for late migrants was 22 March 2007.
We estimated a minimum of 37,719 ± 5,767 juvenile spring Chinook salmon
migrated out of the Minam River during MY 2007. Based on the minimum estimate, 69% (25,875 ± 5,517) of the juvenile spring Chinook salmon migrated early and 31% (11,844 ± 1,680) migrated late. The percentage of late migrants is within the range reported from previous years of this study (Appendix Table A-1).
Size of Migrants: A comparison of mean lengths and weights of juvenile spring
Chinook salmon captured in the traps as early and late migrants and in upper rearing areas in winter and those PIT-tagged and released are given in Tables 3 and 4. Length frequency distributions of juvenile spring Chinook salmon caught in all traps by migration period are shown in Figure 3. Weekly mean lengths of migrants generally increased over time at each of the traps (Figure 4).
Migration Timing and Survival to Lower Granite Dam
Population Comparisons: During July–August 2006, Chinook salmon parr were PIT-tagged and released in upper rearing areas on Catherine Creek, the Lostine, Minam and Imnaha rivers (Table 1). Parr were captured in summer rearing areas upstream of screw traps. Information on the migration timing and survival of parr PIT-tagged in summer 2007 will be reported in 2008.
Migration Timing: Spring Chinook salmon parr PIT-tagged on Catherine Creek
and the Imnaha, Lostine, and Minam rivers during summer 2006 were detected at Lower Granite Dam from 4 April to 24 May 2007 (Appendix Table A-2). The period of detection at Lower Granite Dam among the four populations ranged from 30 d (Catherine Creek) to 49 d (Imnaha River) in length. Median dates of arrival ranged from 23 April to 4 May (Figure 5). Median dates of arrival at Lower Granite Dam were not significantly different among the four populations during MY 2007 (Kruskal–Wallis, P = 0.381). The median arrival date for the Catherine Creek population was the earliest observed during this study, but the other three populations were within the previously-observed range of
16

median arrival dates (Appendix Table A-2).
Survival Probabilities: Survival probabilities to Lower Granite Dam for parr tagged in the summer of 2006 were 0.042 for Catherine Creek, 0.159 for the Lostine River, 0.175 for the Minam River, and 0.178 for the Imnaha River population. Hypothesis testing indicated that the model Catherine ≠ Lostine = Minam = Imnaha had the best fit (P < 0.001). The survival probability for the Catherine Creek population was significantly lower than the other three populations, which did not differ significantly from each other (Table 5). Survival probabilities for the MY 2007 Catherine Creek population were the lowest observed for this study. Survival probabilities for the Lostine, Minam and Imnaha populations were within the range previously reported, and were relatively higher than survival probabilities reported in recent years (Appendix Table A-3).
Comparison of Early Life History Strategies: Juvenile spring Chinook salmon
that were not previously marked were PIT-tagged at screw traps on the upper Grande Ronde River, Catherine Creek, Lostine River, and Minam River. Parr were also tagged upstream of the screw traps on the upper Grande Ronde River, Catherine Creek, and Lostine River during the winter. Total numbers of fish tagged in each group for each study stream is provided in Table 6.
Migration Timing: Median arrival dates at Lower Granite Dam for the fall, winter
and spring tag groups on the upper Grande Ronde River were 11 May, 15 May, and 14 May 2007, respectively (Figure 6). Median arrival dates at Lower Granite Dam for the fall, winter, and spring tag groups tagged on Catherine Creek were 2 May, 13 May, and 13 May 2007, respectively (Figure 7). Median arrival dates at Lower Granite Dam for the fall, winter, and spring tag groups from the Lostine River were 17 April, 12 May, and 11 May 2007, respectively (Figure 8). Median arrival dates at Lower Granite Dam for the fall and spring tag groups on the Minam River were 16 April and 12 May 2007, respectively (Figure 9). Median arrival dates for fall tag groups from the Lostine and Minam rivers were earlier than previously observed, but all other median arrival dates were within the range previously observed at all trap sites (Appendix Table A-2).
As in past years, early migrants (fall tag group) reached Lower Granite Dam
earlier than late migrants (winter tag group) from Catherine Creek, the upper Grande Ronde and Lostine rivers (each Mann–Whitney rank-sum test, P < 0.001). There was no winter tag group to compare with early migrants for the Minam River.
Upper Grande Ronde River late migrants took 10 to 73 d with a median of 55 d (n
= 79) to travel from the screw trap to Lower Granite Dam. Travel times for Catherine Creek late migrants ranged from 14 to 83 d with a median of 46 d (n = 42). Travel times for Lostine River late migrants ranged from 6 to 84 d with a median of 35 d (n = 109). Travel times for Minam River late migrants ranged from 9 to 62 d with a median of 33 d (n = 40). Median travel time during MY 2007 was faster in Catherine Creek and the Minam River than previously observed. Travel time in the upper Grande Ronde and the Lostine River fell within the range previously observed (Appendix Table A-4).
17

Survival Probabilities: Survival probabilities to Lower Granite Dam for the fall,
winter, and spring tag groups from the upper Grande Ronde River were 0.242, 0.138, and 0.373, respectively. Survival probabilities to Lower Granite Dam for the fall, winter and spring tag groups from Catherine Creek were 0.203, 0.088, and 0.310, respectively. Survival probabilities for the fall, winter and spring tag groups from the Lostine River were 0.223, 0.135, and 0.589, respectively. Survival probabilities for the fall and spring tag group from the Minam River were 0.250 and 0.602, respectively. Survival probabilities are generally higher for the spring tag groups because fish are not subject to the same overwinter mortality that the other tag groups experience (Table 6).
Overwinter survival of BY 2005 (MY 2007) fish in the upper rearing areas on the
upper Grande Ronde River was 37%, and is within the range previously reported for this study (Appendix Table A-5). During MY 2007, fish that overwintered downstream of the upper Grande Ronde River trap survived at a significantly higher rate compared to fish that overwintered upstream of the trap (Maximum Likelihood Ratio test, P = 0.012). We have previously observed higher survival rates for fish overwintering downstream of the trap during MY 1995 and MY 1998-2000 (Appendix Table A-6). Upstream overwintering conferred better survival in MY 2004-2005, and survival rates were equivalent between overwintering habitats in MY 1994 and 2006 (Appendix Table A-6).
Overwinter survival of BY 2005 fish in the upper rearing areas on Catherine
Creek was 28%, and was within the range previously observed during this study (Appendix Table A-5). During MY 2007, fish that overwintered downstream of the Catherine Creek trap survived at a significantly higher rate compared to fish that overwintered upstream of the trap (Maximum Likelihood Ratio test, P < 0.001). We have observed higher survival rates for fish overwintering downstream of the Catherine Creek trap in MY 1997 and MY 1999-2000 (Appendix Table A-6). However, overwinter survival has been mostly equivalent between upstream and downstream habitats (7 of 13 migratory years) while upstream habitats did confer better survival in MY 1999 and MY 2004 (Appendix Table A-6).
Overwinter survival of BY 2005 fish in the upper rearing areas on the Lostine
River was 23%, and was the lowest percentage observed during this study (Appendix Table A-5). During MY 2007, the difference in survival between fish that overwintered upstream and downstream of the Lostine River trap was not significant (Maximum Likelihood Ratio test, P = 0.115). For the Lostine River, we have observed equivalent survival for upstream and downstream overwintering habitats for seven of ten years analyzed. The remaining three comparisons indicated higher survival rates for downstream-rearing fish (Appendix Table A-6).
18

SUMMER STEELHEAD INVESTIGATIONS
Methods In the Grande Ronde River Subbasin, most steelhead populations are sympatric
with rainbow trout populations and only steelhead smolts and mature adults can be visually differentiated from resident rainbow trout. For this reason all Oncorhynchus mykiss are referred to as steelhead in this report, even though some of these fish may be resident rainbow trout.
We studied the steelhead in Catherine Creek upstream of our screw trap in
summer from 2000 to 2006 to learn more about the abundance, migration characteristics, growth rates, and size and age structure of the population. The abundance, growth rates, size and age structure of steelhead in Catherine Creek upstream of our screw trap in summer 2006 was reported in Van Dyke et al. (2008) and the migration timing and survival of these fish is reported in this report. We also used screw traps to study the movement of juvenile steelhead downstream from tributary habitats in Catherine Creek and the Lostine, Minam, and upper Grande Ronde rivers. We assumed all juvenile steelhead captured at trap sites were making directed downstream movements and not localized movements. Violation of this assumption would result in positively biased population estimates. In-Basin Migration Timing and Abundance
The migration timing and abundance for steelhead in the upper Grande Ronde River, Catherine Creek, Lostine River, and Minam River were determined by operating rotary screw traps year round. As with spring Chinook salmon, summer steelhead exhibit two migrational life history patterns in the Grande Ronde River Subbasin (Van Dyke et al. 2001), so the same methodology described for operating screw traps and analyzing data for spring Chinook salmon was used for steelhead (see SPRING CHINOOK SALMON INVESTIGATIONS; Methods; In-Basin Migration Timing and Abundance).
Fork lengths (mm) and weights (g) were measured from randomly-selected
steelhead caught each week at rotary screw traps throughout the migratory year. The same methodology described for spring Chinook salmon was used to sample and mark steelhead (see SPRING CHINOOK SALMON INVESTIGATIONS; Methods; In-Basin Migration Timing and Abundance; Sampling and Marking). In previous years of this study, steelhead less than 115 mm in FL were not tagged in spring because fish in this size range were not detected at Snake or Columbia River dams during the same spring they were tagged. Although these criteria targeted only seaward migrating steelhead for the spring tag group, it failed to characterize the migration behavior of all the fish that migrated out of natal rearing areas in spring. Beginning in MY 2004, we tagged all size steelhead to fully document the level of alternate life history strategies used by each of the four populations. In addition, scale samples were taken during both migration periods. During the fall migration period, scales were taken from a subsample
19
of steelhead (10 fish/10 mm FL group). During the spring migration period, scales were collected from a random sample of steelhead migrants regardless of size. Descriptive statistics and an age–length key were used to describe the age structure of early and late migrants collected at each trap site.
Migration Timing and Survival to Lower Granite Dam
Migration Timing: Detections of PIT tagged steelhead at Lower Granite Dam were used to estimate migration timing past this Snake River dam in the same manner as described for spring Chinook salmon (see SPRING CHINOOK SALMON INVESTIGATIONS; Methods; Migration Timing and Survival to Lower Granite Dam). The summer tag group represents steelhead tagged upstream of the upper trap site at the beginning of a migratory year (July) and was only conducted in Catherine Creek drainage in 2006. The fall tag group represents fish that moved downstream of the upper trap sites between 1 September and 28 January (early migrants). The spring tag group represents fish that moved downstream of the upper trap sites between 29 January and 30 June (late migrants). During the summer of 2006, the goal was to PIT-tag 500 steelhead in the main stem of Catherine Creek, and 500 fish in Little Catherine Creek. At each trap site the goal was to PIT-tag 600 steelhead for the fall tag group, and 500 fish for the spring tag group to assess migration timing of early and late migrants from each location.
Survival Probabilities: We monitored PIT tagged steelhead migration behavior
the same as described for spring Chinook salmon (see SPRING CHINOOK SALMON INVESTIGATIONS; Methods; Migration Timing and Survival to Lower Granite Dam) using the three tag groups described above. However, since steelhead tagged during each migratory year of the study have been detected at the dams across more than one migratory year (Reischauer et al. 2003), survival probabilities were analyzed for each tag group by combining detection histories for every migratory year that fish were observed. Survival probabilities were calculated using the SURPH2.2b program (Lady et al. 2001).
Length and Age Characterization of Smolt Detections: We compared
steelhead lengths at tagging, grouped by dam detection history, to investigate the relationship between size, migration patterns, and survival to the dams. The fork lengths of all steelhead tagged in the fall of 2006 were compared to the fork lengths of those subsequently detected at the dams in the spring of 2007 using a Mann–Whitney rank-sum test. The fork lengths of all steelhead tagged in the fall of 2005 were compared to the lengths of those detected in 2006 and 2007 using a Kruskal–Wallis one-way ANOVA on ranks. In addition, the fork lengths of steelhead tagged in the spring of 2007 were compared to the fork lengths of those subsequently detected at the dams in the spring of 2007 using a Mann–Whitney rank-sum test. The age structure of steelhead tagged at the traps and the age structure of the subset detected at the dams in the spring of 2007 were characterized. Only steelhead in which scale samples provided a known age at time of tagging were used for this analyses.
20

Migration Pattern of the Summer Tag Group: We summarized median length of steelhead tagged upstream of the Catherine Creek trap during the summer by year of tagging to investigate whether size at tagging was related to migration behavior. Individual lengths of fish were grouped by subsequent recapture events and dam detection history.
21
Results and Discussion In-Basin Migration Timing and Abundance
Upper Grande Ronde River: The upper Grande Ronde River trap fished for 152 d between 19 September 2006 and 13 June 2007 (Table 7). Systematic subsampling comprised 17 of the 94 d the trap was fished during late migration period. A distinct early migration was not as evident at this trap site as most juvenile steelhead moved as late migrants during spring months, which is consistent with previous years of this study (Figure 10). The median emigration date for early migrants passing the trap was 20 October 2006 and the median emigration date for late migrants was 10 April 2007. Both median migration dates were within the range previously reported for this study (Appendix Table B-1).
We estimated a minimum of 12,632 (95% CI, ± 1,766) juvenile steelhead
migrated out of upper rearing areas of the upper Grande Ronde River during MY 2007, which is within estimates from previous migratory years (Appendix Table B-1). Based on the total minimum estimate, 13% (1,625 ± 186) were early migrants and 87% (11,007 ± 1,757) were late migrants. The pattern of a dominant late migration of juvenile steelhead in the upper Grande Ronde River is consistent for all migratory years studied to date (Appendix Table B-1).
Catherine Creek: The Catherine Creek trap fished for 164 d between 18
September 2006 and 11 June 2007 (Table 7). Systematic subsampling comprised 6 of the 104 d the trap was fished during late migration period. There were distinct early and late migrations exhibited by juvenile steelhead at this trap site (Figure 10). Median emigration date for early migrants was 16 October 2006, and the median date for late migrants was 4 May 2007. Both median migration dates were within the range previously reported for this study (Appendix Table B-1).
We estimated a minimum of 13,715 ± 1,704 juvenile steelhead migrated out of
the upper rearing areas of Catherine Creek during MY 2007. Based on the total minimum estimate, 73% (9,948 ± 1,588) migrated early and 27% (3,767 ± 619) migrated late. The proportion of juvenile steelhead leaving upper rearing areas as late migrants is consistent with the proportions from previous years of this study (Appendix Table B-1). The Catherine Creek population appears to be different from the upper Grande Ronde River population in that a larger proportion of the overall migrant population tends to leave upper rearing areas as early migrants.
Lostine River: The Lostine River trap fished for 230 d between 12 September
2006 and 15 June 2007 (Table 7). Systematic subsampling comprised 15 of the 118 d the trap was fished during late migration period. Distinct early and late migrations were evident at this trap site (Figure 10). The median emigration date of early migrants was 5 October 2006, and the median emigration date for late migrants was 28 April 2007. Both median dates are within the range reported in previous years of this study (Appendix Table B-1).
22
We estimated a minimum of 13,162 ± 1,867 steelhead migrated out of the Lostine
River during MY 2007. Based on the total minimum estimate, 74% (9,767 ± 1,761) of the juvenile steelhead migrated early and 26% (3,395 ± 619) migrated late.
Minam River: The Minam River trap fished for 181 d between 11 September
2006 and 15 June 2007 (Table 7). Distinct early and late migrations were evident at this trap site (Figure 10). The median emigration date for early migrants was 1 October 2006, and the median emigration date for late migrants was 30 April 2007. Both median migration dates were within the range previously reported for this study (Appendix Table B-1).
We estimated a minimum of 11,831 ± 3,330 juvenile steelhead migrated out of the Minam River during MY 2007. Based on the total minimum estimate, 28% (3,330 ± 1,488) migrated early and 72% (8,501 ± 2,979) migrated late.
Age of Migrants at Traps: The steelhead collected at trap sites during MY 2007 were comprised of four age-groups. Early migrants ranged from 0 to 3 years of age while late migrants ranged in age from 1 to 3 years of age (Table 8). The age structure varied between migrant periods within and among trap sites. We believe that scale samples did not completely represent the entire migration period at any trap site so comparisons between percentages by age among populations were not analyzed. Migration Timing and Survival to Lower Granite Dam
The total number of steelhead tagged in each tag group for each study stream is provided in Appendix Table B-2. Detections of the summer tag group from Catherine Creek and tributaries represented both early and late migrant groups that originated from this drainage. Migration Timing: The median arrival dates at Lower Granite Dam for the fall and spring tag groups on the upper Grande Ronde River were 9 May and 13 May, respectively (Figure 11). The median arrival dates for the summer, fall and spring tag groups on Catherine Creek were 12 May, 5 May, and 9 May, respectively (Figure 12). The median arrival dates for the fall and spring tag groups on Lostine River were 13 May and 10 May, respectively (Figure 13). The median arrival dates for the fall and spring tag groups on Minam River were 14 May and 7 May, respectively (Figure 14).
Travel times from the screw trap to Lower Granite Dam for the spring tag group from the four study streams are presented in Table 9. Travel time to Lower Granite Dam for the spring tag group from the upper Grande Ronde River ranged from 9 to 83 d with a median of 24 d. Travel times to Lower Granite Dam for the spring tag group from Catherine Creek ranged from 8 to 59 d with a median of 28 d. Travel times to Lower Granite Dam for the spring tag group from Lostine River ranged from 7 to 48 d with a median of 9 d. Travel times to Lower Granite Dam for the spring tag group from Minam River ranged from 5 to 63 d with a median of 12 d.
23
Survival Probabilities: The survival probabilities of wild steelhead PIT-tagged during the summer of 2006 and detected at the dam during MY 2007 was 0.072 for Catherine Creek and we could not calculate a survival probability for Little Catherine Creek because no fish were detected at Lower Granite Dam (Table 10). Survival probabilities of steelhead tagged in fall 2006 could not be calculated for the Minam River and ranged from 0.084 to 0.160 among the remaining three trap sites (Table 10). Survival probabilities of steelhead tagged in the spring 2007 (FL ≥ 115 mm) could not be calculated for the Lostine River and ranged from 0.179 to 0.684 among the remaining three trap sites (Table 10). Estimated survival for the spring tag group in Catherine Creek and the upper Grande Ronde River were the lowest since we began making the calculation in 2000 (Appendix Table B-3). Some steelhead from all three tag groups do not migrate past the dams until the following migratory year. Therefore, detections of tagged fish from these groups during subsequent migratory years may change the survival probabilities reported for each tag group in future reports. At least one PIT tagged fish captured and released in the Middle, North and South forks of Catherine Creek, Little Catherine Creek, and Milk Creek have been detected at the dams, indicating the anadromous life history is present in all these tributaries (Appendix Table B-3).
Length and Age Characterization of Smolt Detections: Of all the early migrating steelhead tagged at all four traps in the fall of 2006, the larger individuals from each trap tended to be the ones detected at the dams in 2007 (Mann–Whitney, P < 0.05, Figure 15). This pattern was also observed the previous migratory year for early migrants tagged in fall 2005 at all traps except the upper Grande Ronde River trap (Kruskal–Wallis, P < 0.05, Figure 16). There were no detections in 2007 of steelhead tagged during fall 2005 at the upper Grande Ronde River trap therefore we could not test this pattern. The spring tag group of 2007 also showed a pattern of the larger individuals being detected at the dams that spring (Mann–Whitney, P < 0.05, Figure 17). Summaries of fork lengths at the time of tagging for all steelhead tagged for the various tag groups and for those detected at the dams are provided in Appendix Tables B-4, B-5, and B-6. While differences between medians of an entire tag group and those detected at dams could be the result of greater size-dependent mortality rate for smaller fish, there is evidence that smaller individuals passing the traps delay their migration past the dams until the subsequent migratory year (Appendix Tables B-4, B-5, and B-6).
Of the 164 early migrating age-0 fish tagged in the four study streams, none were
observed at the dams the following spring while 26 of the 347 age-1 and 10 of the 63 age-2 early migrants were observed the following spring at the dams. As in past years, age-2 smolts (age-1 early migrants) made up the highest weighted percentage of all observations in MY 2007 (Table 11). Late migrant smolts consisted of age 1 to 3 years in 2007, but data collected in previous years have indicated that steelhead smolts from the Grande Ronde River Subbasin range in age from 1 to 4 years. Peven et al. (1994) found that steelhead smolts from the mid-Columbia River ranged in age from 1 to 7 years with most occurring as age-2 and age-3 fish. Even though the proportion of steelhead smolts within age-groups has been shown to vary considerably between migratory years (Ward and Slaney 1988), results from all years of this study indicate that the majority of the steelhead originating from the subbasin smolt as age-2 fish.
24

Migration Pattern of the Summer Tag Group: Like the migrant tag groups,
the larger steelhead of a summer tag group were more likely than smaller fish of the same tag group to be detected at the dams within the subsequent spring. Trap recaptures and dam detections of the steelhead tagged upstream of the Catherine Creek trap during the past six summers also showed that larger fish (median FL ≥ 115 mm) were more likely to migrate out of the upstream rearing areas by spring while smaller fish (median FL ≤ 101 mm) were more likely to migrate out more than one year after tagging (Appendix Table B-6).
25

STREAM CONDITION INVESTIGATIONS
Methods Stream Temperature and Flow
An initial assessment of stream condition was conducted in all four study streams.
General stream condition sampling was based on protocols described by The Oregon Plan for Salmon and Watersheds (OPSW 1999) and stream flow data provided by the United States Geologic Survey (USGS) and the Oregon Water Resources Department (OWRD) La Grande District Water Master. Stream temperature and stream flow was characterized in all four study streams for the entire in-basin life history of juvenile spring Chinook salmon from BY 2005 which extended from 1 August 2005 (spawning) to 1 July 2007 (the end of MY 2007). Daily mean values were generated using data logged between 00:00 and 23:59. Stream temperature was recorded to the nearest 0.1°C every hour using a temperature data logger located at each trapping site. Descriptive statistics were used to characterize water temperature in each study stream with standards of three optimal or lethal temperature ranges for juvenile Chinook salmon (OPSW 1999). The cumulative effects from prolonged exposure to high water temperature were characterized using a seven-day moving mean of the daily maximum, and were calculated by averaging each day’s maximum temperature and the maximum temperatures for the preceding three days and following three days (n = 7).
Stream discharge was obtained from data logged at upper Grande Ronde River
(station 13317850; rkm 321.9), Catherine Creek (station 13320000; rkm 38.6), Lostine River (station 13330300; rkm 1.6) and Minam River (station 13331500; rkm 0.4) gauging stations that measured discharge (cubic foot per second, cfs) every 15 minutes. Average daily discharge was converted to the nearest 0.001 cubic meters per second (m3/s).
Results and Discussion
Stream Temperature and Flow
Upper Grande Ronde River: Water temperatures during the second year of the in-basin life history of BY 2005 upper Grande Ronde River Chinook salmon ranged from a low of 0.0°C to a high of 28.2°C. We were unable to characterize a 103 day period during the winter of 2005 (28 September 2005 - 8 January 2006). Daily mean water temperature exceeded the DEQ standard of 17.8°C on 43 of 596 days in the upper Grande Ronde River. Water temperature was within the range preferred by juvenile Chinook salmon (10–15.6°C; OPSW 1999) during 5,298 of 14,276 hours logged in the upper Grande Ronde River. The DEQ lethal limit of 25°C was exceeded for 34 hours during ten of the 596 days. The seven-day moving mean of the maximum temperature showed that water temperatures below the range expected to support healthy growth (4.4–18.9°C; OPSW 1999) were encountered for longer durations than high water temperatures (Figure 18). Moving mean temperatures exceeded 18.9°C on 109 days while the 2005 cohorts
26
eggs were deposited into spawning gravel, upper rearing, dispersal, and emigration seaward. Moving mean temperatures were less than 4.4°C on 201 days (12 January–8 March 2005) during incubation, winter rearing, and dispersal for the first couple days of spring migration.
Due to the unavailability of discharge data collected by OWRD at the time of
submission of this report, stream flow characteristics were analyzed only for the first 14 months of the in-basin life history of BY 2005 upper Grande Ronde River Chinook salmon. Average daily discharge (station located at the upper end of summer rearing distribution) during this time ranged from a low of 0.176 to a high of 8.893 m3/s (Figure 19). Discharge was less than 1.00 m3/s on 143 of 144 days from August through late December 2005. Discharge was 1.00 m3/s or greater on 63 of 65 days from late April through June 2006, with annual peak flow of 8.893 m3/s occurring 21 May 2006. In addition to the usual spring increase, stream discharge exceeded 1.00 m3/s for 23 days during the winter (23 December 2005–14 February 2006) peaking at 7.363 m3/s on 4 January 2006.
Catherine Creek: Water temperatures during the majority of the in-basin life
history of BY 2005 Catherine Creek Chinook salmon ranged from a low of 0.0°C to a high of 25.1°C. We were not able to characterize a 38 day (19 December 2006–28 January 2007) period in which this cohort was over-wintering in Catherine Creek. Daily mean water temperature exceeded the DEQ standard of 17.8°C on 26 of 661 days in Catherine Creek. Water temperature was within the range preferred by juvenile Chinook salmon (10–15.6°C; OPSW 1999) during 2,859 of 15,835 hours logged in Catherine Creek. The DEQ lethal limit of 25°C was exceeded for four hours during two of the 661 days. The seven-day moving mean of the maximum temperature showed that water temperatures below the range expected to support healthy growth (4.4–18.9°C; OPSW 1999) were encountered for longer durations than high water temperatures (Figure 18). Moving mean temperatures exceeded 18.9°C on 87 days during the in basin life history of this cohort. Of these, a total of 28 days (8-31 August 2005) were during spawning and incubation of eggs, and 59 days (2 July–7 September 2006) in which the majority of young of the year parr were rearing and dispersing. Moving mean temperatures were less than 4.4°C on 178 days (12 November 2006–3 March 2007) during incubation, rearing, and parr dispersal.
Due to the unavailability of discharge data collected by OWRD at the time of
submission of this report, stream flow characteristics were analyzed only for the first 14 months of the in-basin life history of BY 2005 Catherine Creek Chinook salmon. Average daily discharge (station located in the lower end of summer rearing distribution) during this time ranged from a low of 0.566 to a high of 29.736 m3/s (Figure 19). Discharge was less than 2.00 m3/s on 230 of 236 days from August 2005 through late March 2006. Discharge was 2.00 m3/s or greater on 108 days from late April through mid-July, with annual peak flow of 29.736 m3/s on 20 May 2006.
Lostine River: Water temperatures during the in-basin life history of BY 2005
Lostine River Chinook salmon ranged from a low of 0.0°C to a high of 20.8°C. Daily
27

mean water temperature did not exceed the DEQ standard of 17.8°C during any of the 698 days logged in the Lostine River. Water temperature was within the range preferred by juvenile Chinook salmon (10–15.6°C; OPSW 1999) during 3,803 of 16,704 hours logged in the Lostine River. The DEQ lethal limit of 25°C was not exceeded on any of the 698 days. The seven-day moving mean of the maximum temperature showed that water temperatures below the range expected to support healthy growth (4.4–18.9°C; OPSW 1999) were encountered for longer durations than high water temperatures (Figure 18). Moving mean temperatures exceeded 18.9°C on six days (4-9 August 2005) when the eggs of this cohort were being deposited in the spawning gravel, and nine days (21-29 July 2006) during the period when the majority of young of the year parr were rearing in habitats within the spawning grounds. Moving mean temperatures were less than 4.4°C on 99 days (18 November 2005–24 February 2006) during incubation of the 2005 cohort and 90 days (25 November 2006–1 March 2007) during dispersal and winter rearing.
Average daily discharge (station located at the lower end of summer rearing
distribution) during the entire in-basin life history of the 2005 cohort ranged from a low of 0.263 to a high of 45.595 m3/s (Figure 19). Discharge was greater than 7.5 m3/s on 69 of 75 days from late April through mid-July 2006, with annual peak flow occurring on 20 May 2006 and 5 June 2007. Discharge was less than 7.5 m3/s on 266 of 272 days from mid-July through April 2007. In addition to the usual spring increase, stream discharge exceeded 7.5 m3/s for a five day period in mid November with a peak of 32.002 m3/s on 7 November 2006. Spring flows between 1 March and 30 June were on average lower in 2007 than in 2006 (9.05 m3/s and 11.44 m3/s respectively).
Minam River: Water temperatures during the in-basin life history of BY 2005
Minam River Chinook salmon ranged from a low of 0.0°C to a high of 26.2°C. Daily mean water temperature exceeded the DEQ standard of 17.8°C on 59 of 698 days in the Minam River. Water temperature was within the range preferred by juvenile Chinook salmon (10–15.6°C; OPSW 1999) during 2,799 of 16,723 hours logged in the Minam River. The DEQ lethal limit of 25°C was exceeded on 11 out of the 698 days (15 hours, 1–8 August 2005, and 16 hours, 22 July–8 August 2005). The seven-day moving mean of the maximum temperature showed that water temperatures below the range expected to support healthy growth (4.4–18.9°C; OPSW 1999) were encountered for longer durations than high water temperatures (Figure 18). Moving mean temperatures exceeded 18.9°C on 35 days (4 August–7 September 2005) when the eggs of this cohort were being deposited in the spawning gravel, and 63 days (11 July–11 September 2006) when the majority of young of the year parr were rearing in habitats within the spawning grounds. Moving mean temperatures were less than 4.4°C on 110 days (8 November 2005–11 March 2006) while the 2005 cohort was incubating, and 106 days (30 October 2006–1 March 2007) during parr dispersal, and winter rearing.
Average daily discharge (station located at the lower end of summer rearing
distribution) during the entire in-basin life history of the 2005 cohort ranged from a low of 1.558 to a high of 112.714 m3/s (Figure 19). Discharge was greater than 9.0 m3/s on 113 of 114 days from late March through mid-July 2006, with annual peak flow occurring on 20 May 2006 and 5 June 2007. Discharge was less than 9.0 m3/s on 203 of
28

218 days from mid-July 2006 through late February 2007. In addition to the usual spring increase, stream discharge exceeded 9.0 m3/s for a seven day period in mid-November with a peak of 33.418 m3/s on 11 November 2006. Spring flows between 1 March and 30 June were on average lower in 2007 than in 2006 (19.20 m3/s and 29.98 m3/s respectively).
FUTURE DIRECTIONS
We will continue this early life history study of spring Chinook salmon and
summer steelhead in Catherine Creek and the upper Grande Ronde, Lostine, and Minam rivers. This project will continue to provide key metrics to monitor and evaluate the success of restoration efforts for spring Chinook salmon and steelhead in the Grande Ronde Subbasin.
29

REFERENCES Burck, W. A. 1993. Life history of spring Chinook salmon in Lookingglass Creek,
Oregon. Oregon Department of Fish and Wildlife, Information Reports 94-1, Portland.
Efron, B., and R. Tibshirani. 1986. Bootstrap methods for standard errors, confidence
intervals, and other measures of statistical accuracy. Statistical Science 1: 54–77. Giorgi, A. E., G. A. Swan, W. S. Zaugg, T. C. Corley and T. Y. Barila. 1988. The
susceptibility of Chinook salmon smolts to bypass systems at hydroelectric dams. North American Journal of Fisheries Management 8:25–29.
Johnson, G. E., R. L. Johnson, E. Kucera, and C. Sullivan. 1997. Fixed-location
hydroacoustic evaluation of the prototype surface bypass and collector at Lower Granite Dam in 1996. Final Report. U.S. Army Corps of Engineers, Walla Walla, WA.
Jonasson, B. C., J. V. Tranquilli, M. Keefe, and R. W. Carmichael. 1997. Investigations
into the early life history of naturally produced spring Chinook salmon in the Grande Ronde River basin. Annual Progress Report 1997. Bonneville Power Administration, Portland, OR.
Jonasson, B. C., A. G. Reischauer, F. R. Monzyk, E. S. Van Dyke, and R. W.
Carmichael. 2006. Investigations into the early life history of naturally produced spring Chinook salmon in the Grande Ronde River basin. Annual Progress Report 2002. Bonneville Power Administration, Portland, OR.
Keefe, M., R. W. Carmichael, B. C. Jonasson, R. T. Messmer, and T. A. Whitesel. 1994.
Investigations into the life history of spring Chinook salmon in the Grande Ronde River basin. Annual Progress Report 1994. Bonneville Power Administration, Portland, OR.
Keefe, M., D. J. Anderson, R. W. Carmichael, and B. C. Jonasson. 1995. Early life
history study of Grande Ronde River basin Chinook salmon. Annual Progress Report 1995. Bonneville Power Administration, Portland, OR.
Kuehl, S. 1986. Hydroacoustic evaluation of fish collection efficiency at Lower Granite
Dam in spring 1985. Final Report to U.S. Army Corps of Engineers, Walla Walla, WA.
Lady, J., P. Westhagen, and J. R. Skalski. 2001. SURPH.2 User Manual, SURPH 2.2b,
SURvival under Proportional Hazards. School of Aquatic and Fisheries Sciences, University of Washington, Seattle, WA. Available: http://www.cbr.washington.edu/paramEst/SURPH (January 2008).
30

Matthews, G. M., J. R. Harmon, S. Achord, O. W. Johnson, and L. A. Kubin. 1990.
Evaluation of transportation of juvenile salmonids and related research on the Columbia and Snake rivers, 1989. Report of the U.S. Army Corps of Engineers, Contract DACW68-84-H0034. National Marine Fisheries Service, Seattle.
Matthews, G. M., and eight coauthors. 1992. Evaluation of transportation of juvenile
salmonids and related research on the Columbia and Snake rivers, 1990. Report of the U.S. Army Corps of Engineers, Contract DACW68-84-H0034. National Marine Fisheries Service, Seattle.
Nowak, M. C., lead writer. 2004. Grande Ronde Subbasin Plan. Northwest Power and
Conservation Council, Portland. Available: http://www.nwcouncil.org/fw/ subbasinplanning/granderonde/plan/ (January 2008).
NWPPC (Northwest Power Planning Council). 1992. Strategy for salmon, Volume VII. ODFW (Oregon Department of Fish and Wildlife). 1990. Grande Ronde River Subbasin
Salmon and Steelhead Production Plan. Oregon Department of Fish and Wildlife, Portland, OR.
OPSW (The Oregon Plan for Salmon and Watersheds). 1999. Water Quality Monitoring
Technical Guide Book: version 2.0. Available: http://www.oregon.gov/OWEB/ docs/pubs/wq_mon_guide.pdf (January 2008).
Prentice, E. F., T. A. Flagg, C. S. McCutcheon, D. F. Brastow, and D. C. Cross. 1990.
Equipment, methods, and an automated data-entry station for PIT tagging. American Fisheries Society Symposium 7: 335–340.
Prentice, E. F., D. L. Park, T. A. Flagg, and S. McCutcheon. 1986. A study to determine
the biological feasibility of a new fish tagging system, 1985–1986. Annual Progress Report. Bonneville Power Administration, Portland OR.
Peven, C. M., R. R. Whitney, and K. R. Williams. 1994. Age and length of steelhead
smolts from the mid-Columbia river basin, Washington. North American Journal of Fisheries Management 14:77–86
Reischauer, A. G., F. R. Monzyk, E. S. Van Dyke, B. C. Jonasson, and R. W.
Carmichael. 2003. Investigations into the early life history of naturally produced spring Chinook salmon in the Grande Ronde River basin. Annual Progress Report 2001. Bonneville Power Administration, Portland, OR.
Snake River Recovery Team. 1993. Draft Snake River salmon recovery plan
recommendations. National Marine Fisheries Service, Portland, OR.
31
Swan, G. A., R. F. Krcma, and F. J. Ossiander. 1986. Continuing studies to improve and evaluate juvenile collection at Lower Granite Dam, 1985. Report to U.S. Army Corps of Engineers, Portland, OR.
Thedinga, J. F., M. L. Murphy, S. W. Johnson, J. M. Lorenz, and K. V. Koski. 1994.
Determination of salmonid smolt yield with rotary-screw traps in the Situk River, Alaska, to predict effects of glacial flooding. North American Journal of Fisheries Management 14: 837–851.
TRT (Interior Columbia Basin Technical Recovery Team). 2003. Independent
Populations of Chinook, Steelhead, and Sockeye for Listed Evolutionarily Significant Units within the Interior Columbia River Domain.
Van Dyke, E. S., M. Keefe, B. C. Jonasson, and R. W. Carmichael. 2001. Aspects of life
history and production of juvenile Oncorhynchus mykiss in the Grande Ronde River Basin, northeast Oregon. Summary Report. Bonneville Power Administration, Portland, OR.
Van Dyke, E. S., J. A. Yanke, J. W. Steele, B. C. Jonasson, and R. W. Carmichael. 2008.
Investigations into the early life history of naturally produced spring Chinook salmon in the Grande Ronde River basin. Annual Progress Report 2006. Bonneville Power Administration, Portland, OR.
Ward, B. R., and P. A. Slaney. 1988. Life history and smolt-to-adult survival of Keogh
River steelhead trout (Salmo gairdneri) and the relationship to smolt size. Canadian Journal of Fish and Aquatic Science 45: 1110–1122.
32
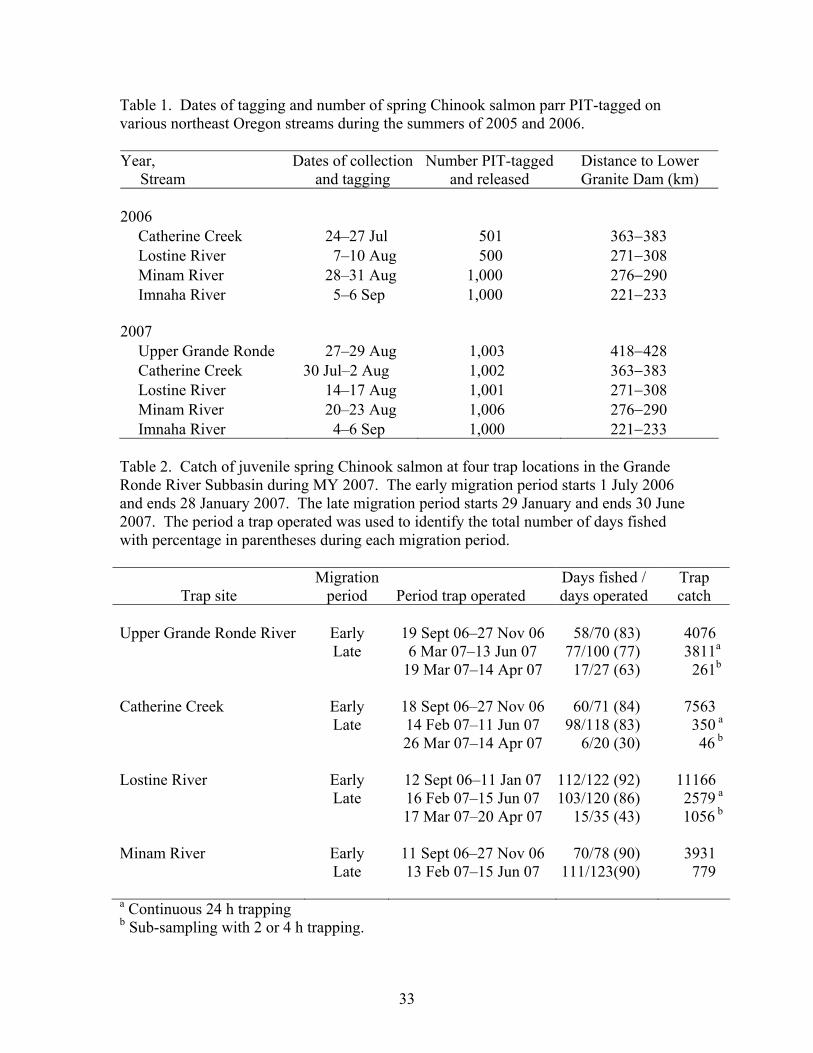
33
Table 1. Dates of tagging and number of spring Chinook salmon parr PIT-tagged on various northeast Oregon streams during the summers of 2005 and 2006. Year, Stream
Dates of collection and tagging
Number PIT-tagged and released
Distance to Lower Granite Dam (km)
2006
Catherine Creek 24–27 Jul 501 363−383 Lostine River 7–10 Aug 500 271−308 Minam River 28–31 Aug 1,000 276−290 Imnaha River 5–6 Sep 1,000 221−233
2007
Upper Grande Ronde 27–29 Aug 1,003 418−428 Catherine Creek 30 Jul–2 Aug 1,002 363−383 Lostine River 14–17 Aug 1,001 271−308 Minam River 20–23 Aug 1,006 276−290 Imnaha River 4–6 Sep 1,000 221−233
Table 2. Catch of juvenile spring Chinook salmon at four trap locations in the Grande Ronde River Subbasin during MY 2007. The early migration period starts 1 July 2006 and ends 28 January 2007. The late migration period starts 29 January and ends 30 June 2007. The period a trap operated was used to identify the total number of days fished with percentage in parentheses during each migration period.
Trap site Migration
period Period trap operated Days fished / days operated
Trap catch
Upper Grande Ronde River Early 19 Sept 06–27 Nov 06 58/70 (83) 4076 Late 6 Mar 07–13 Jun 07 77/100 (77) 3811a
19 Mar 07–14 Apr 07 17/27 (63) 261b
Catherine Creek Early 18 Sept 06–27 Nov 06 60/71 (84) 7563 Late 14 Feb 07–11 Jun 07 98/118 (83) 350 a
26 Mar 07–14 Apr 07 6/20 (30) 46 b
Lostine River Early 12 Sept 06–11 Jan 07 112/122 (92) 11166 Late 16 Feb 07–15 Jun 07 103/120 (86) 2579 a
17 Mar 07–20 Apr 07 15/35 (43) 1056 b
Minam River Early 11 Sept 06–27 Nov 06 70/78 (90) 3931 Late 13 Feb 07–15 Jun 07 111/123(90) 779 a Continuous 24 h trapping
b Sub-sampling with 2 or 4 h trapping.

Tabl
e 3.
For
k le
ngth
s of j
uven
ile sp
ring
Chi
nook
salm
on c
olle
cted
from
the
stud
y st
ream
s dur
ing
MY
200
7. E
arly
and
late
mig
rant
s w
ere
capt
ured
with
a ro
tary
scre
w tr
ap o
n ea
ch st
udy
stre
am.
Win
ter g
roup
fish
wer
e ca
ptur
ed w
ith d
ipne
ts u
pstre
am o
f the
rota
ry
scre
w tr
aps.
Min
. = m
inim
um, M
ax. =
max
imum
.
Leng
ths (
mm
) of f
ish
colle
cted
Leng
ths (
mm
) of f
ish
tagg
ed a
nd re
leas
ed
Stre
am, g
roup
n
Mea
n SE
M
in.
Max
.
n M
ean
SE
Min
. M
ax.
Upp
er G
rand
e R
onde
Riv
er
Ea
rly m
igra
nts
698
73.3
0.
24
56
97
53
4 72
.1
0.26
56
94
W
inte
r gro
up
482
75.6
0.
37
56
103
48
2 75
.6
0.37
56
10
3 La
te m
igra
nts
661
86.5
0.
39
38
140
50
1 85
.5
0.41
64
13
0
C
athe
rine
Cre
ek
Ea
rly m
igra
nts
551
83.9
0.
36
61
129
50
0 83
.7
0.37
61
10
7 W
inte
r gro
up
500
80.7
0.
32
55
100
50
0 80
.7
0.32
55
10
0 La
te m
igra
nts
433
83.7
0.
94
33
141
36
1 91
.2
0.46
70
14
1
Lo
stin
e R
iver
Early
mig
rant
s 1,
340
83.4
0.
29
54
180
50
0 84
.2
0.48
56
12
6 W
inte
r gro
up
500
75.7
0.
34
56
97
50
0 75
.7
0.34
56
97
La
te m
igra
nts
515
92.4
0.
45
70
132
50
5 92
.1
0.43
70
13
0
M
inam
Riv
er
Ea
rly m
igra
nts
776
77.4
0.
36
50
114
50
0 78
.3
0.41
55
10
2 La
te m
igra
nts
247
91.6
0.
78
68
223
21
7 92
.1
0.87
68
22
3
34

Tabl
e 4.
Wei
ghts
of j
uven
ile sp
ring
Chi
nook
salm
on c
olle
cted
from
the
stud
y st
ream
s dur
ing
MY
200
7. E
arly
and
late
mig
rant
s wer
e ca
ptur
ed w
ith a
rota
ry sc
rew
trap
on
each
stud
y st
ream
. W
inte
r gro
up fi
sh w
ere
capt
ured
with
dip
net
s ups
tream
of t
he ro
tary
scre
w
traps
. M
in. =
min
imum
, Max
. = m
axim
um.
35
W
eigh
ts (g
) of f
ish
colle
cted
Wei
ghts
(g) o
f fis
h ta
gged
and
rele
ased
St
ream
, gro
up
n M
ean
SE
Min
. M
ax.
n
Mea
n SE
M
in.
Max
.
U
pper
Gra
nde
Ron
de R
iver
Early
mig
rant
s 67
4 4.
14
0.04
1.
9 9.
5
518
4.00
0.
04
1.9
9.5
Win
ter g
roup
48
1 4.
78
0.07
1.
9 11
.4
48
1 4.
78
0.07
1.
9 11
.4
Late
mig
rant
s 60
3 6.
82
0.20
2.
3 31
.6
44
4 6.
30
0.12
2.
4 24
.4
Cat
herin
e C
reek
Early
mig
rant
s 53
8 6.
45
0.08
2.
4 14
.4
49
3 6.
48
0.08
2.
4 14
.4
Win
ter g
roup
49
8 5.
67
0.06
1.
9 10
.7
49
8 5.
67
0.06
1.
9 10
.7
Late
mig
rant
s 34
1 8.
20
0.15
3.
7 28
.4
34
0 8.
12
0.15
3.
7 28
.4
Lost
ine
R
iver
iver
Ea
rly m
igra
nts
1,33
4 7.
10
0.09
1.
3 73
.3
49
6 7.
50
0.13
2.
0 23
.0
Win
ter g
roup
49
9 5.
13
0.07
2.
0 10
.9
49
9 5.
13
0.07
2.
0 10
.9
Late
mig
rant
s 51
2 8.
78
0.13
3.
5 24
.5
50
2 8.
65
0.13
3.
5 23
.7
Min
am R
Early
mig
rant
s 76
9 5.
59
0.08
1.
5 15
.5
49
9 5.
75
0.09
2.
2 12
.1
Late
mig
rant
s 24
7 8.
91
0.46
3.
1 11
1.8
21
7 9.
16
0.52
3.
1 11
1.8
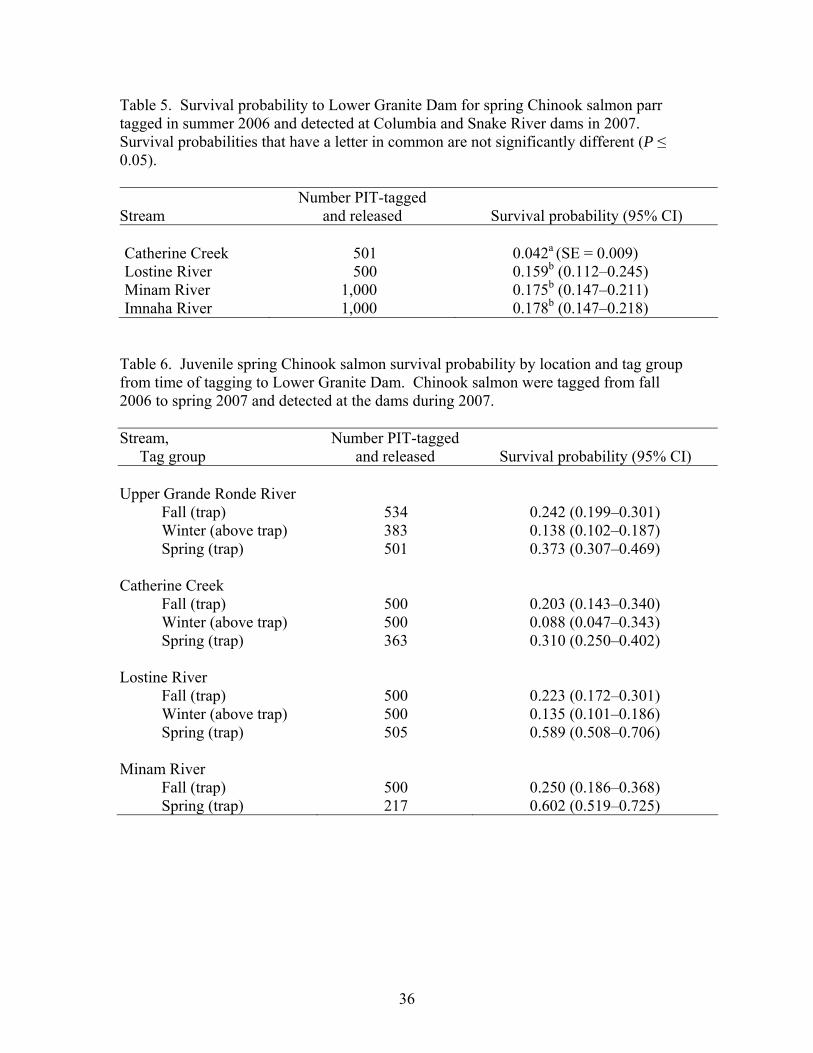
Table 5. Survival probability to Lower Granite Dam for spring Chinook salmon parr tagged in summer 2006 and detected at Columbia and Snake River dams in 2007. Survival probabilities that have a letter in common are not significantly different (P ≤ 0.05).
Stream Number PIT-tagged
and released Survival probability (95% CI)
Catherine Creek 501 0.042a (SE = 0.009) Lostine River 500 0.159b (0.112–0.245) Minam River 1,000 0.175b (0.147–0.211) Imnaha River 1,000 0.178b (0.147–0.218)
Table 6. Juvenile spring Chinook salmon survival probability by location and tag group from time of tagging to Lower Granite Dam. Chinook salmon were tagged from fall 2006 to spring 2007 and detected at the dams during 2007. Stream, Tag group
Number PIT-tagged and released Survival probability (95% CI)
Upper Grande Ronde River
Fall (trap) 534 0.242 (0.199–0.301) Winter (above trap) 383 0.138 (0.102–0.187) Spring (trap) 501 0.373 (0.307–0.469)
Catherine Creek
Fall (trap) 500 0.203 (0.143–0.340) Winter (above trap) 500 0.088 (0.047–0.343) Spring (trap) 363 0.310 (0.250–0.402)
Lostine River
Fall (trap) 500 0.223 (0.172–0.301) Winter (above trap) 500 0.135 (0.101–0.186) Spring (trap) 505 0.589 (0.508–0.706)
Minam River
Fall (trap) 500 0.250 (0.186–0.368) Spring (trap) 217 0.602 (0.519–0.725)
36

Table 7. Catch of juvenile steelhead at four trap locations in the Grande Ronde River Subbasin during MY 2007. The early migration period starts 1 July 2006 and ends 28 January 2007. The late migration period starts 29 January and ends 30 June 2007. The period a trap operated was used to identify the total number of days fished with percentage in parentheses during each migration period.
Trap site Migration
period Period trap operated Days fished / days operated
Trap catch
Upper Grande Ronde River Early 19 Sept 06–27 Nov 06 58/70 (83) 820 Late 6 Mar 07–13 Jun 07 77/100 (77) 2,526a
19 Mar 07–14 Apr 07 17/27 (63) 116b
Catherine Creek Early 18 Sept 06–27 Nov 07 60/71 (84) 1,575 Late 14 Feb 07–11 Jun 07 98/118 (83) 356a
26 Mar 07–14 Apr 07 6/20 (30) 24b
Lostine River Early 12 Sept 06–11 Jan 07 112/122 (92) 2120 Late 16 Feb 07–15 Jun 07 103/120 (86) 375a 17 Mar 07–20 Apr 07 15/35 (43) 47b Minam River Early 11 Sept 06–27 Nov 07 70/78 (90) 170 Late 13 Feb 07–15 Jun 07 111/123(90) 434 a Continuous 24 h trapping
b Sub-sampling with 2 or 4 h trapping.
37
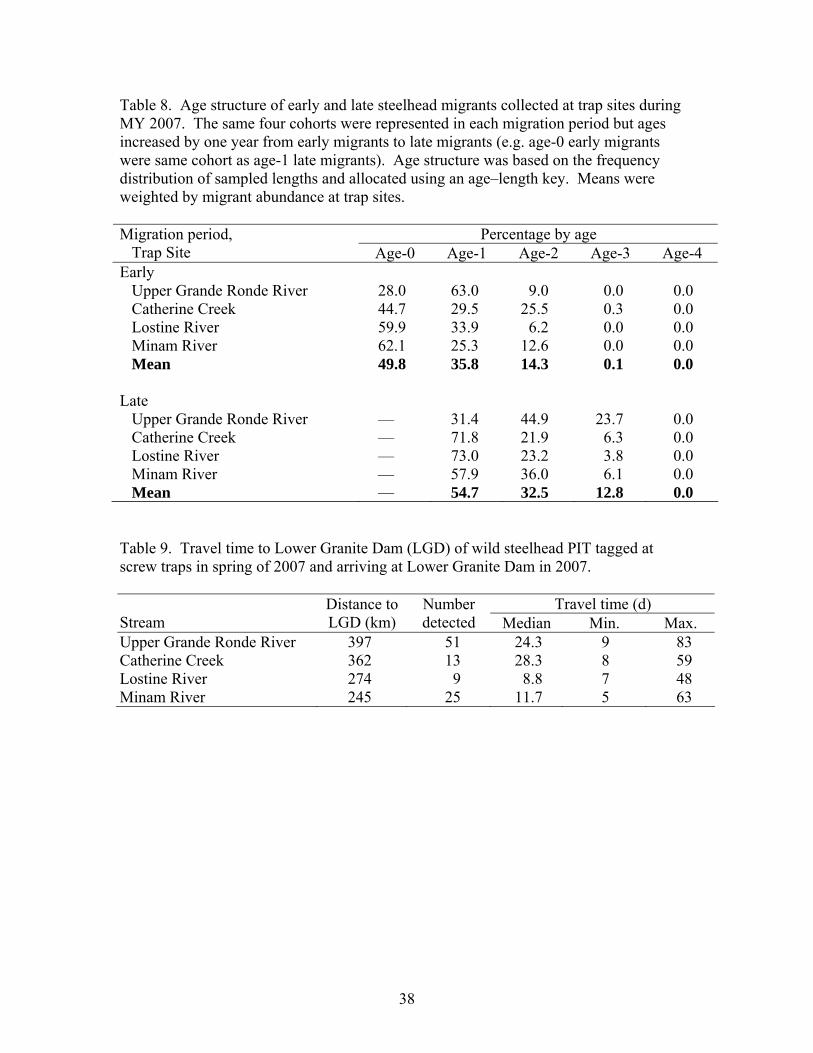
Table 8. Age structure of early and late steelhead migrants collected at trap sites during MY 2007. The same four cohorts were represented in each migration period but ages increased by one year from early migrants to late migrants (e.g. age-0 early migrants were same cohort as age-1 late migrants). Age structure was based on the frequency distribution of sampled lengths and allocated using an age–length key. Means were weighted by migrant abundance at trap sites.
Percentage by age Migration period, Trap Site Age-0 Age-1 Age-2 Age-3 Age-4 Early
Upper Grande Ronde River 28.0 63.0 9.0 0.0 0.0 Catherine Creek 44.7 29.5 25.5 0.3 0.0 Lostine River 59.9 33.9 6.2 0.0 0.0 Minam River 62.1 25.3 12.6 0.0 0.0 Mean 49.8 35.8 14.3 0.1 0.0
Late Upper Grande Ronde River — 31.4 44.9 23.7 0.0 Catherine Creek — 71.8 21.9 6.3 0.0 Lostine River — 73.0 23.2 3.8 0.0 Minam River — 57.9 36.0 6.1 0.0 Mean — 54.7 32.5 12.8 0.0
Table 9. Travel time to Lower Granite Dam (LGD) of wild steelhead PIT tagged at screw traps in spring of 2007 and arriving at Lower Granite Dam in 2007.
Travel time (d) Stream
Distance to LGD (km)
Number detected Median Min. Max.
Upper Grande Ronde River 397 51 24.3 9 83 Catherine Creek 362 13 28.3 8 59 Lostine River 274 9 8.8 7 48 Minam River 245 25 11.7 5 63
38
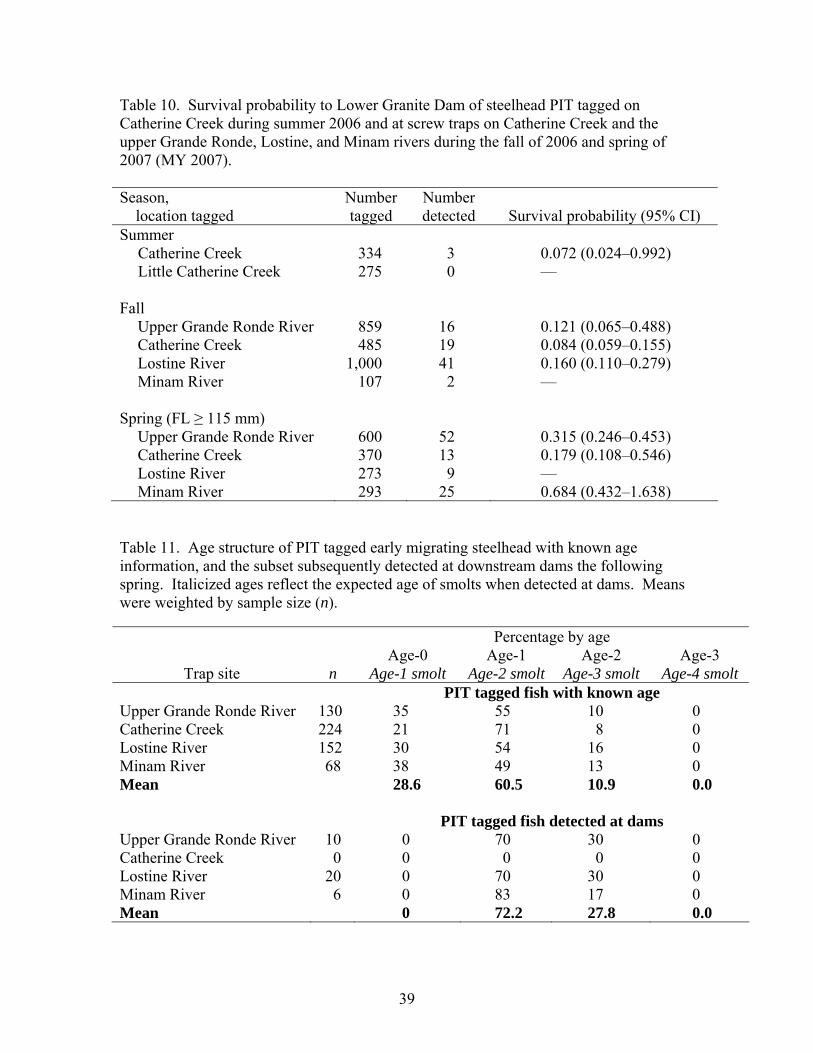
Table 10. Survival probability to Lower Granite Dam of steelhead PIT tagged on Catherine Creek during summer 2006 and at screw traps on Catherine Creek and the upper Grande Ronde, Lostine, and Minam rivers during the fall of 2006 and spring of 2007 (MY 2007). Season, location tagged
Number tagged
Number detected Survival probability (95% CI)
Summer Catherine Creek 334 3 0.072 (0.024–0.992) Little Catherine Creek 275 0 —
Fall Upper Grande Ronde River 859 16 0.121 (0.065–0.488) Catherine Creek 485 19 0.084 (0.059–0.155) Lostine River 1,000 41 0.160 (0.110–0.279) Minam River 107 2 —
Spring (FL ≥ 115 mm)
Upper Grande Ronde River 600 52 0.315 (0.246–0.453) Catherine Creek 370 13 0.179 (0.108–0.546) Lostine River 273 9 — Minam River 293 25 0.684 (0.432–1.638)
Table 11. Age structure of PIT tagged early migrating steelhead with known age information, and the subset subsequently detected at downstream dams the following spring. Italicized ages reflect the expected age of smolts when detected at dams. Means were weighted by sample size (n).
Percentage by age
Trap site n Age-0
Age-1 smolt Age-1
Age-2 smoltAge-2
Age-3 smolt Age-3
Age-4 smolt PIT tagged fish with known age Upper Grande Ronde River 130 35 55 10 0 Catherine Creek 224 21 71 8 0 Lostine River 152 30 54 16 0 Minam River 68 38 49 13 0 Mean 28.6 60.5 10.9 0.0 PIT tagged fish detected at dams Upper Grande Ronde River 10 0 70 30 0 Catherine Creek 0 0 0 0 0 Lostine River 20 0 70 30 0 Minam River 6 0 83 17 0 Mean 0 72.2 27.8 0.0
39
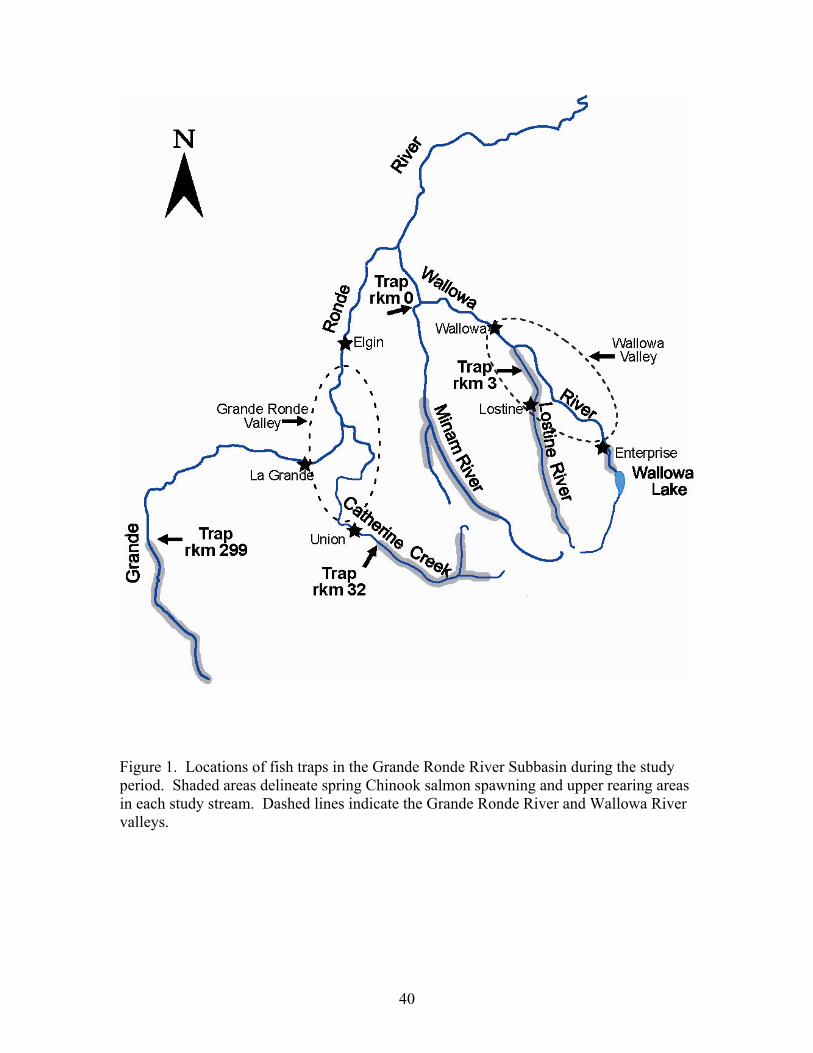
Figure 1. Locations of fish traps in the Grande Ronde River Subbasin during the study period. Shaded areas delineate spring Chinook salmon spawning and upper rearing areas in each study stream. Dashed lines indicate the Grande Ronde River and Wallowa River valleys.
40

Upper Grande Ronde River
0
2,000
4,000
6,000
Catherine Creek
0
2,000
4,000
6,000
Lostine River
0
2,000
4,000
6,000
8,000
Minam River
0
2,000
4,000
6,000
8,000
10,000
27 29 31 33 35 37 39 41 43 45 47 49 51 1 3 5 7 9 11 13 15 17 19 21 23 25
Estim
ated
abu
ndan
ce
Week of the year Figure 2. Estimated migration timing and abundance of juvenile spring Chinook salmon migrants captured by rotary screw traps during MY 2007. Traps were located at rkm 299 of the Grande Ronde River, rkm 32 of Catherine Creek, rkm 3 of the Lostine River, and rkm 0 of the Minam River.
41
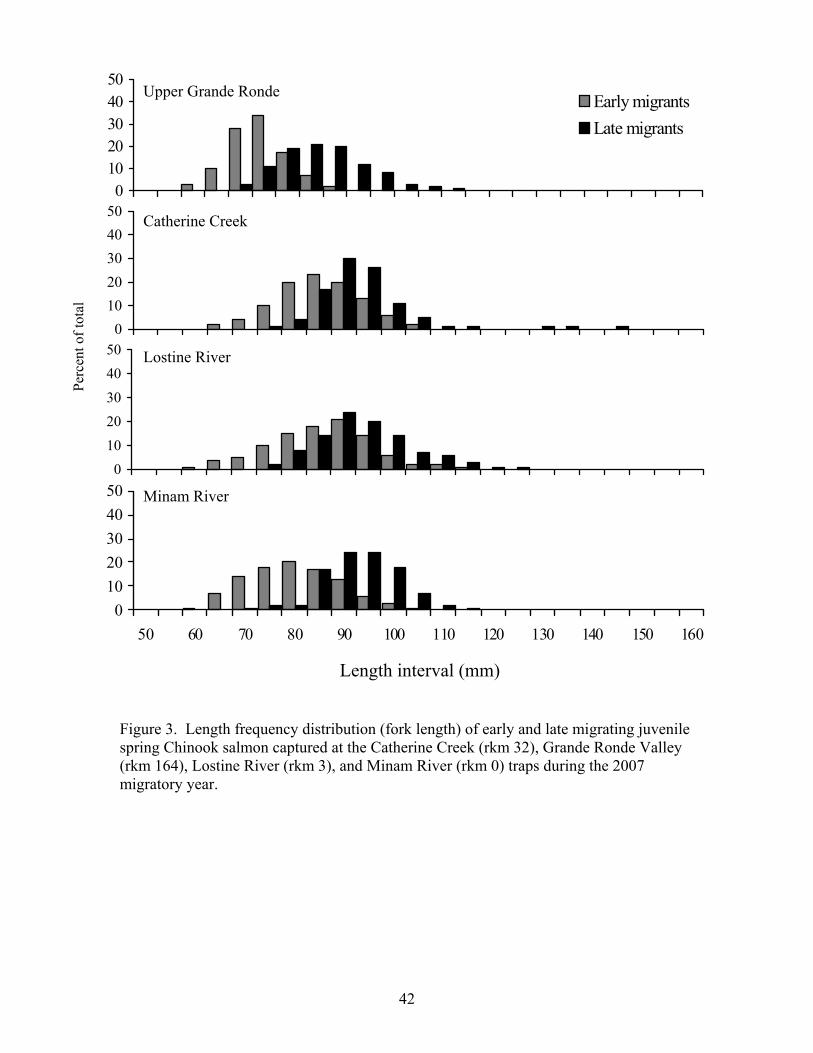
0
1020304050
Early migrantsLate migrants
Upper Grande Ronde
01020304050 Catherine Creek
Perc
ent o
f tot
al
0
10
2030
4050 Lostine River
01020304050
50 60 70 80 90 100 110 120 130 140 150 160
Length interval (mm)
Minam River
Figure 3. Length frequency distribution (fork length) of early and late migrating juvenile spring Chinook salmon captured at the Catherine Creek (rkm 32), Grande Ronde Valley (rkm 164), Lostine River (rkm 3), and Minam River (rkm 0) traps during the 2007 migratory year.
42
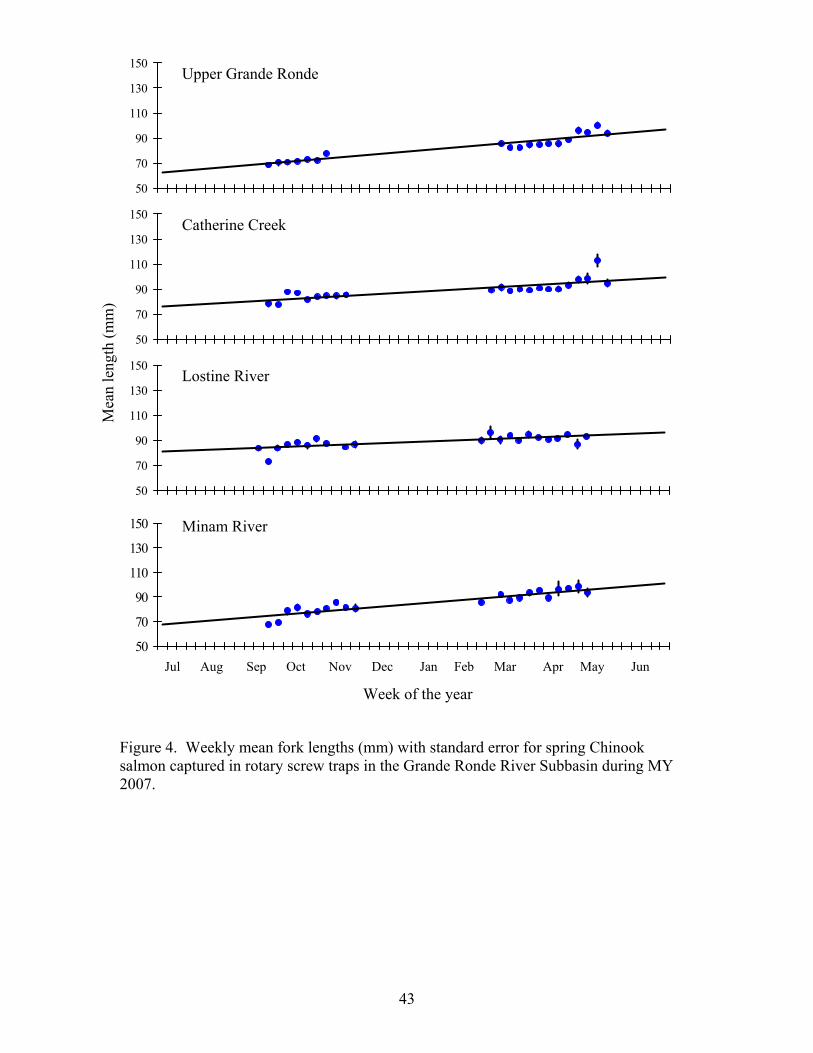
50
70
90
110
130
150
27 29 31 33 35 37 39 41 43 45 47 49 51 1 3 5 7 9 11 13 15 17 19 21 23 25
50
70
90
110
130
27 29 31 33 35 37 39 41 43 45 47 49 51 1 3 5 7 9 11 13 15 17 19 21 23 25
150Upper Grande Ronde
50
70
90
110
130
150
27 29 31 33 35 37 39 41 43 45 47 49 51 1 3 5 7 9 11 13 15 17 19 21 23 25
Catherine Creek
50
70
90
110
130
150
27 29 31 33 35 37 39 41 43 45 47 49 51 1 3 5 7 9 11 13 15 17 19 21 23 25
Lostine River
Minam River
Jul Aug Sep Oct Nov Dec Jan Feb Mar Apr May Jun
Mea
n le
ngth
(mm
)
Week of the year
Figure 4. Weekly mean fork lengths (mm) with standard error for spring Chinook salmon captured in rotary screw traps in the Grande Ronde River Subbasin during MY 2007.
43

Date
25-M
ar
1-A
pr
8-A
pr
15-A
pr
22-A
pr
29-A
pr
6-M
ay
13-M
ay
20-M
ay
27-M
ay
3-Ju
n
10-J
un
17-J
un
24-J
un
1-Ju
l
8-Ju
l
15-J
ul
22-J
ul
29-J
ul
5-A
ug
12-A
ug
19-A
ug
0
10
20
30
40
50
0
10
20
30
40
50
0
10
20
30
40
50
Perc
ent d
etec
ted
at L
ower
Gra
nite
Dam
0
15
30
45
60
75Catherine Creek
Lostine River
Minam River
Imnaha River
n = 6Median = 23 April
n = 27Median = 4 May
n = 65Median = 2 May
n = 59Median = 27 April
Figure 5. Dates of arrival in 2007 at Lower Granite Dam of spring Chinook salmon PIT-tagged as parr on Catherine Creek and the Imnaha, Lostine, and Minam rivers during the summer of 2006 summarized by week and expressed as a percentage of the total detected for each group. ♦ = median arrival date. Detections were expanded for spillway flow.
44

Date
25-M
ar
1-A
pr
8-A
pr
15-A
pr
22-A
pr
29-A
pr
6-M
ay
13-M
ay
20-M
ay
27-M
ay
3-Ju
n
10-J
un
17-J
un
24-J
un
1-Ju
l
8-Ju
l
15-J
ul
22-J
ul
29-J
ul
5-A
ug
12-A
ug
19-A
ug
0
10
20
30
40
50
0
10
20
30
40
50
Perc
ent d
etec
ted
at L
ower
Gra
nite
Dam
0
10
20
30
40
50Fall Group
Winter Group
Spring Group
n = 54Median = 11 May
n = 32Median = 15 May
n = 79Median = 14 May
Figure 6. Dates of arrival in 2007 at Lower Granite Dam for the fall, winter, and spring tag groups of juvenile spring Chinook salmon PIT-tagged on the upper Grande Ronde River, expressed as a percentage of the total detected for each group. ♦ = median arrival date. Detections were expanded for spillway flow.
45
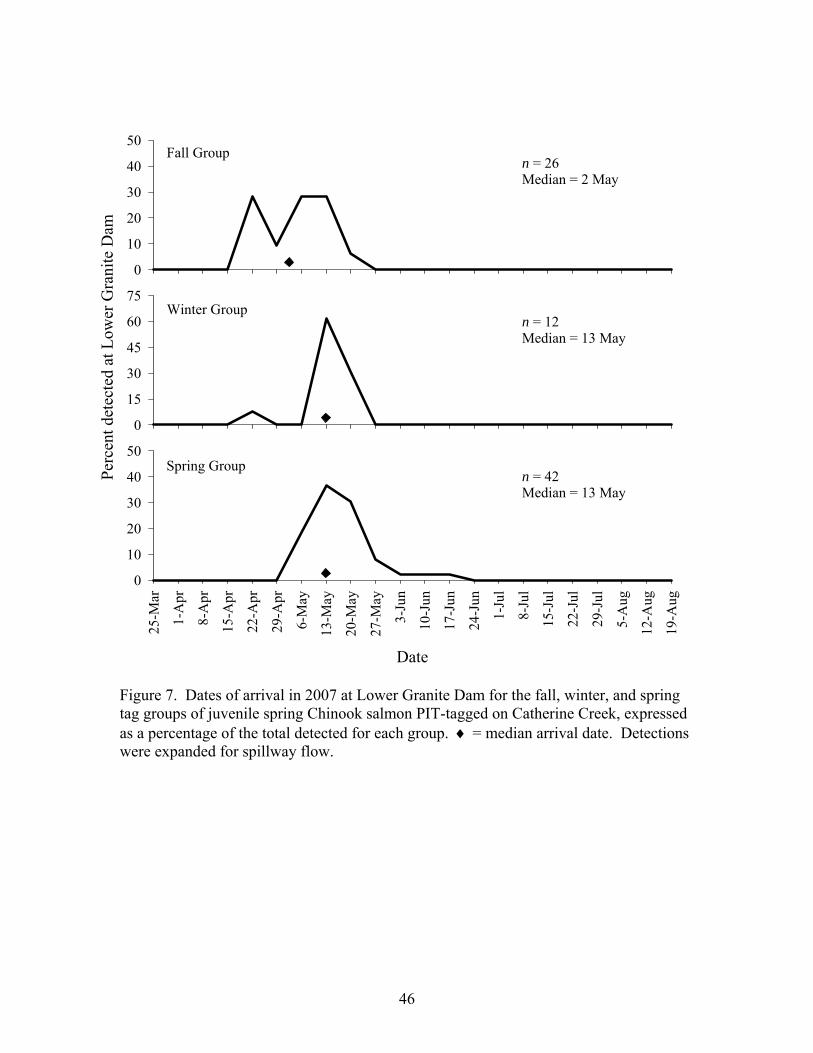
Date
25-M
ar
1-A
pr
8-A
pr
15-A
pr
22-A
pr
29-A
pr
6-M
ay
13-M
ay
20-M
ay
27-M
ay
3-Ju
n
10-J
un
17-J
un
24-J
un
1-Ju
l
8-Ju
l
15-J
ul
22-J
ul
29-J
ul
5-A
ug
12-A
ug
19-A
ug
0
10
20
30
40
50
0
15
30
45
60
75
Perc
ent d
etec
ted
at L
ower
Gra
nite
Dam
0
10
20
30
40
50Fall Group
Winter Group
Spring Group
n = 26Median = 2 May
n = 12Median = 13 May
n = 42Median = 13 May
Figure 7. Dates of arrival in 2007 at Lower Granite Dam for the fall, winter, and spring tag groups of juvenile spring Chinook salmon PIT-tagged on Catherine Creek, expressed as a percentage of the total detected for each group. ♦ = median arrival date. Detections were expanded for spillway flow.
46
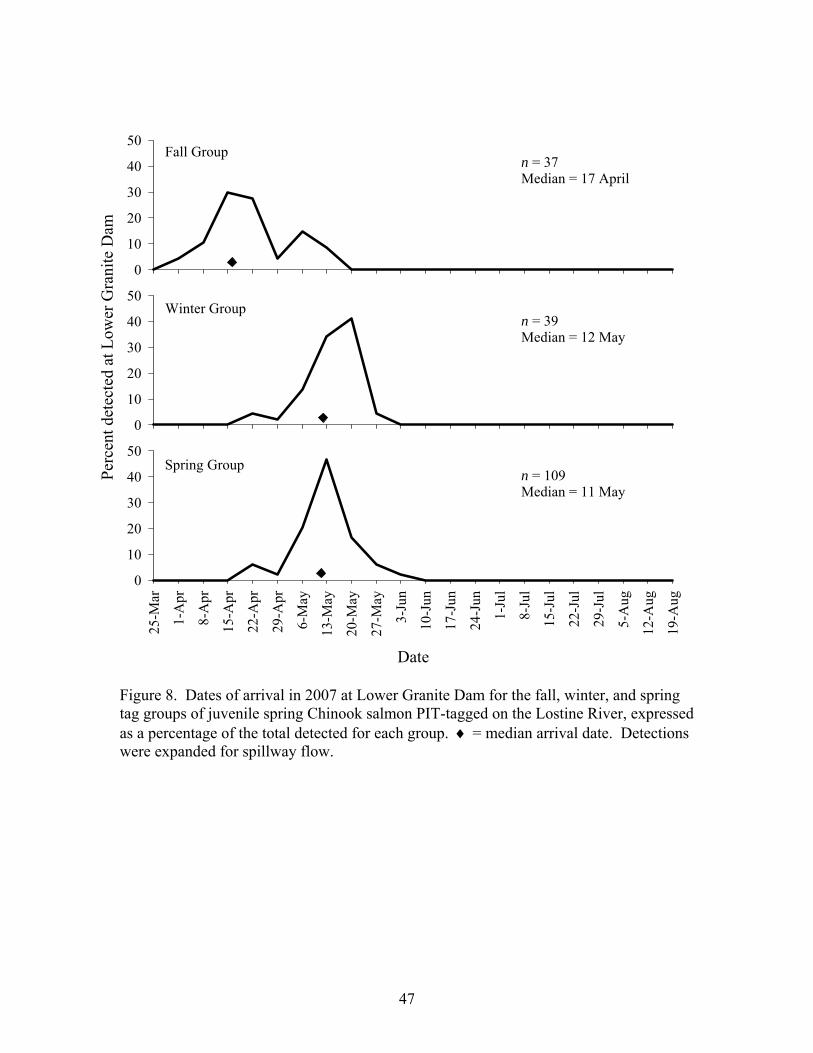
Date
25-M
ar
1-A
pr
8-A
pr
15-A
pr
22-A
pr
29-A
pr
6-M
ay
13-M
ay
20-M
ay
27-M
ay
3-Ju
n
10-J
un
17-J
un
24-J
un
1-Ju
l
8-Ju
l
15-J
ul
22-J
ul
29-J
ul
5-A
ug
12-A
ug
19-A
ug
0
10
20
30
40
50
0
10
20
30
40
50
Perc
ent d
etec
ted
at L
ower
Gra
nite
Dam
0
10
20
30
40
50Fall Group
Winter Group
Spring Group
n = 37Median = 17 April
n = 39Median = 12 May
n = 109Median = 11 May
Figure 8. Dates of arrival in 2007 at Lower Granite Dam for the fall, winter, and spring tag groups of juvenile spring Chinook salmon PIT-tagged on the Lostine River, expressed as a percentage of the total detected for each group. ♦ = median arrival date. Detections were expanded for spillway flow.
47

Date
25-M
ar
1-A
pr
8-A
pr
15-A
pr
22-A
pr
29-A
pr
6-M
ay
13-M
ay
20-M
ay
27-M
ay
3-Ju
n
10-J
un
17-J
un
24-J
un
1-Ju
l
8-Ju
l
15-J
ul
22-J
ul
29-J
ul
5-A
ug
12-A
ug
19-A
ug
0
10
20
30
40
50
Perc
ent d
etec
ted
at L
ower
Gra
nite
Dam
0
10
20
30
40
50Fall Group
Spring Group
n = 28Median = 16 April
n = 40Median = 12 May
Figure 9. Dates of arrival in 2007 at Lower Granite Dam for the fall, winter, and spring tag groups of juvenile spring Chinook salmon PIT-tagged on the Minam River, expressed as a percentage of the total detected for each group. ♦ = median arrival date. Detections were expanded for spillway flow.
48

Upper Grande Ronde River
0
1,000
2,000
3,000
4,000
Week of the year
Estim
ated
abu
ndan
ce
Catherine Creek
0
1,000
2,000
3,000
4,000
Lostine River
0
1,000
2,000
3,000
4,000
Minam River
0
1,000
2,000
3,000
4,000
27 29 31 33 35 37 39 41 43 45 47 49 51 1 3 5 7 9 11 13 15 17 19 21 23 25
Figure 10. Estimated abundance and migration timing of steelhead migrants captured by rotary screw traps, during MY 2007. Traps were located at rkm 299 of the Grande Ronde River, rkm 32 of Catherine Creek, rkm 3 of the Lostine River, and rkm 0 of the Minam River.
49

0
15
30
45
60
75
25-M
ar1-
Apr
8-A
pr
15-A
pr22
-Apr
29-A
pr6-
May
13-M
ay20
-May
27-M
ay3-
Jun
10-J
un17
-Jun
24-J
un1-
Jul
8-Ju
l15
-Jul
22-J
ul29
-Jul
5-A
ug12
-Aug
19-A
ug
0
15
30
45
60
75
25-M
ar1-
Apr
8-A
pr
15-A
pr22
-Apr
29-A
pr6-
May
13-M
ay20
-May
27-M
ay3-
Jun
10-J
un17
-Jun
24-J
un1-
Jul
8-Ju
l15
-Jul
22-J
ul29
-Jul
5-A
ug12
-Aug
19-A
ug
Perc
ent d
etec
ted
at L
ower
Gra
nite
Date
Fall Group
Spring Group
n = 16 Median = 9 May
n = 59 Median = 13 May
Figure 11. Dates of arrival in 2007 at Lower Granite Dam for the fall and spring tag groups of steelhead PIT-tagged on the upper Grande Ronde River, expressed as a percentage of the total detected for each group. ♦ = median arrival date. Detections were expanded for spillway flow.
50

0
15
30
45
60
75
25-M
ar1-
Apr
8-A
pr
15-A
pr22
-Apr
29-A
pr6-
May
13-M
ay20
-May
27-M
ay3-
Jun
10-J
un17
-Jun
24-J
un1-
Jul
8-Ju
l15
-Jul
22-J
ul29
-Jul
5-A
ug12
-Aug
19-A
ug
0
15
30
45
60
75
25-M
ar1-
Apr
8-A
pr
15-A
pr22
-Apr
29-A
pr6-
May
13-M
ay20
-May
27-M
ay3-
Jun
10-J
un17
-Jun
24-J
un1-
Jul
8-Ju
l15
-Jul
22-J
ul29
-Jul
5-A
ug12
-Aug
19-A
ug
0
15
30
45
60
75
25-M
ar1-
Apr
8-A
pr
15-A
pr22
-Apr
29-A
pr6-
May
13-M
ay20
-May
27-M
ay3-
Jun
10-J
un17
-Jun
24-J
un1-
Jul
8-Ju
l15
-Jul
22-J
ul29
-Jul
5-A
ug12
-Aug
19-A
ug
Perc
ent d
etec
ted
at L
ower
Gra
nite
Dam
Date
Summer Group
Fall Group
Spring Group
n = 3 Median = 12 May
n = 21 Median = 5 May
n = 15 Median = 9 May
Figure 12. Dates of arrival in 2007 at Lower Granite Dam for the summer, fall, and spring tag groups of steelhead PIT-tagged on Catherine Creek, expressed as a percentage of the total detected for each group. ♦ = median arrival date. Detections were expanded for spillway flow.
51
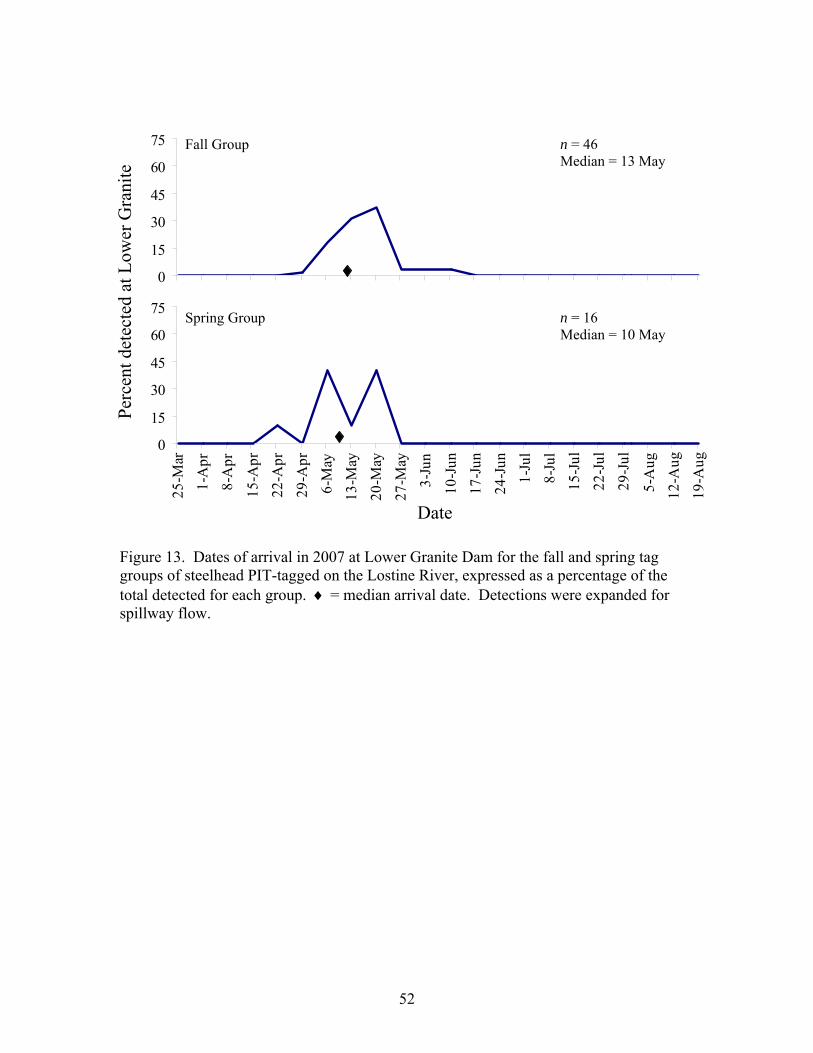
0
15
30
45
60
75
25-M
ar1-
Apr
8-A
pr
15-A
pr22
-Apr
29-A
pr6-
May
13-M
ay20
-May
27-M
ay3-
Jun
10-J
un17
-Jun
24-J
un1-
Jul
8-Ju
l15
-Jul
22-J
ul29
-Jul
5-A
ug12
-Aug
19-A
ug
0
15
30
45
60
75
25-M
ar1-
Apr
8-A
pr
15-A
pr22
-Apr
29-A
pr6-
May
13-M
ay20
-May
27-M
ay3-
Jun
10-J
un17
-Jun
24-J
un1-
Jul
8-Ju
l15
-Jul
22-J
ul29
-Jul
5-A
ug12
-Aug
19-A
ug
Perc
ent d
etec
ted
at L
ower
Gra
nite
Date
Fall Group
Spring Group
n = 46 Median = 13 May
n = 16 Median = 10 May
Figure 13. Dates of arrival in 2007 at Lower Granite Dam for the fall and spring tag groups of steelhead PIT-tagged on the Lostine River, expressed as a percentage of the total detected for each group. ♦ = median arrival date. Detections were expanded for spillway flow.
52
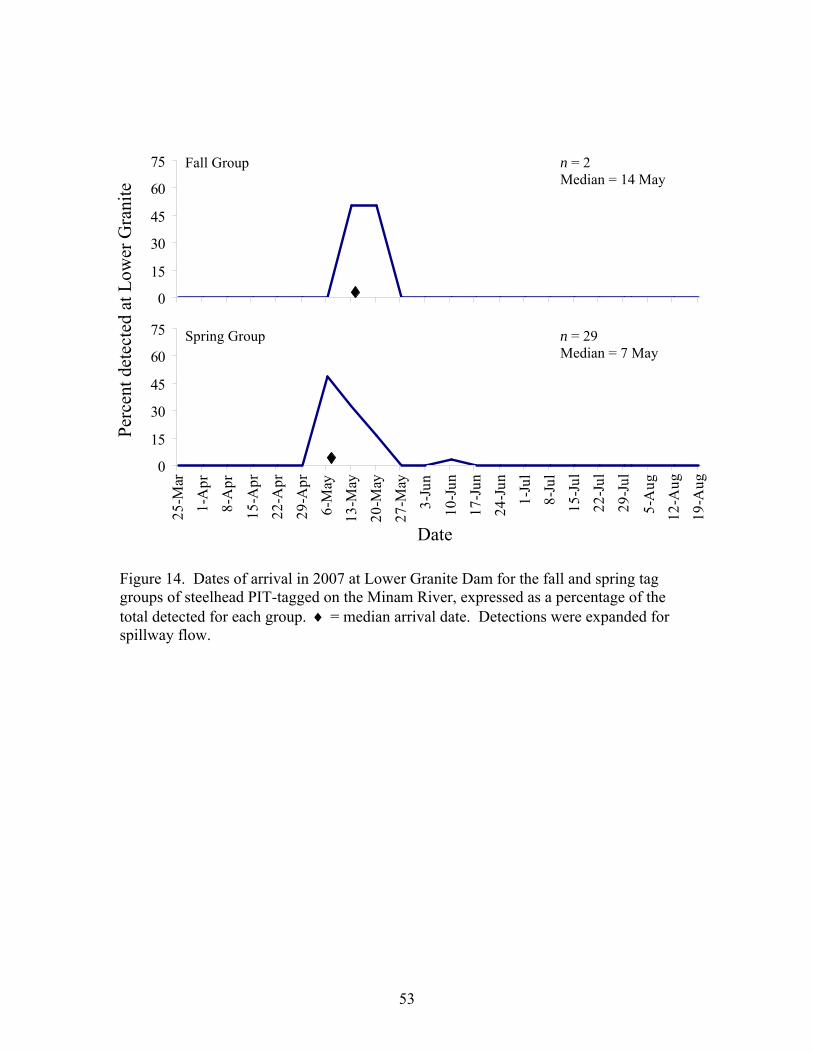
0
15
30
45
60
7525
-Mar
1-A
pr8-
Apr
15-A
pr22
-Apr
29-A
pr6-
May
13-M
ay20
-May
27-M
ay3-
Jun
10-J
un17
-Jun
24-J
un1-
Jul
8-Ju
l15
-Jul
22-J
ul29
-Jul
5-A
ug12
-Aug
19-A
ug
0
15
30
45
60
75
25-M
ar1-
Apr
8-A
pr
15-A
pr22
-Apr
29-A
pr6-
May
13-M
ay20
-May
27-M
ay3-
Jun
10-J
un17
-Jun
24-J
un1-
Jul
8-Ju
l15
-Jul
22-J
ul29
-Jul
5-A
ug12
-Aug
19-A
ug
Perc
ent d
etec
ted
at L
ower
Gra
nite
Date
Fall Group
Spring Group
n = 2 Median = 14 May
n = 29 Median = 7 May
Figure 14. Dates of arrival in 2007 at Lower Granite Dam for the fall and spring tag groups of steelhead PIT-tagged on the Minam River, expressed as a percentage of the total detected for each group. ♦ = median arrival date. Detections were expanded for spillway flow.
53
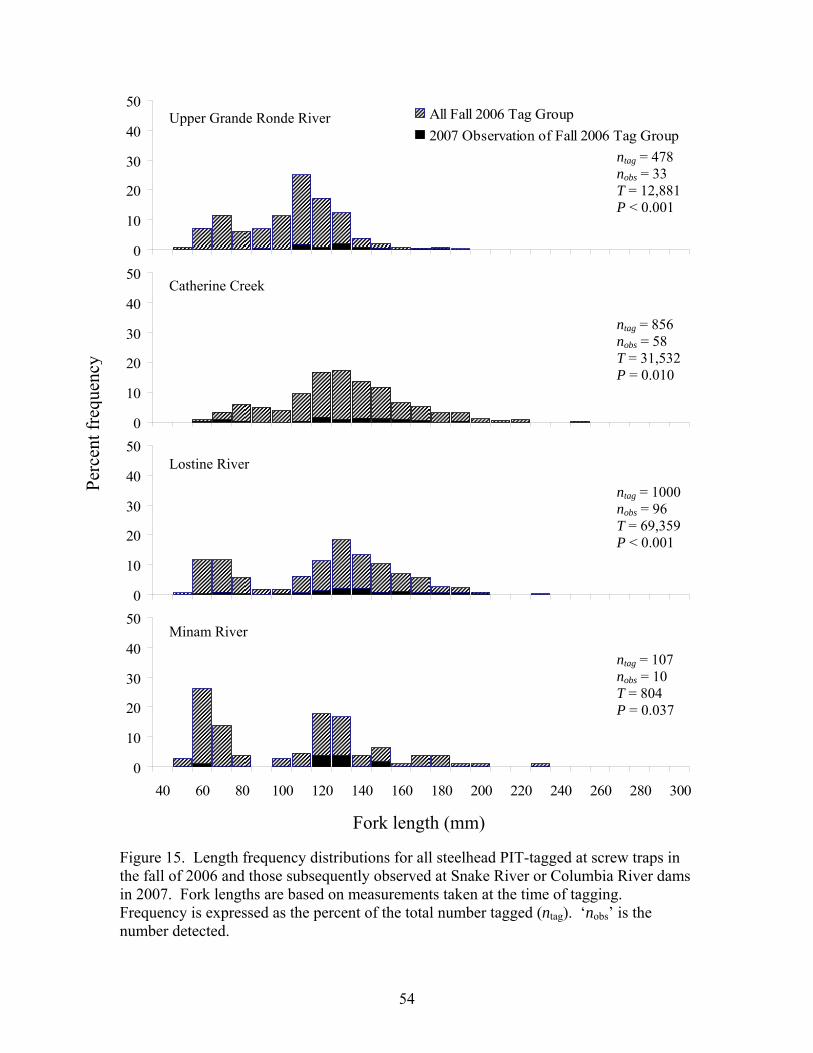
0
50
40
30
20
10
Figure 15. Length frequency distributions for all steelhead PIT-tagged at screw traps in the fall of 2006 and those subsequently observed at Snake River or Columbia River dams in 2007. Fork lengths are based on measurements taken at the time of tagging. Frequency is expressed as the percent of the total number tagged (ntag). ‘nobs’ is the number detected.
40 60 80 100 120 140 160 180 200 220 240 260 280 300
All Fall 2006 Tag Group2007 Observation of Fall 2006 Tag Group
0
50
40
30
20
10
40 60 80 100 120 140 160 180 200 220 240 260 280 300
040 60 80 100 120 140 160 180 200 220 240 260 280 300
10
20
30
40
50
040 60 80 100 120 140 160 180 200 220 240 260 280 300
ntag = 478 nobs = 33 T = 12,881 P < 0.001
ntag = 856 nobs = 58 T = 31,532 P = 0.010
ntag = 1000 nobs = 96 T = 69,359 P < 0.001
ntag = 107 nobs = 10 T = 804 P = 0.037
Fork length (mm)
Peue
ncy
cent
freq
r
50
40
Upper Grande Ronde River
Catherine Creek
Lostine River
Minam River
30
20
10
54

012345
40 60 80 100 120 140 160 180 200 220 240 260 280 300010203040502006 Observation of Fall 2005 Tag Group
2007 Observation of Fall 2005 Tag GroupAll 2005 Fall Tag Group
012345
40 60 80 100 120 140 160 180 200 220 240 260 280 30001020304050
012345
40 60 80 100 120 140 160 180 200 220 240 260 280 30001020304050
012345
40 60 80 100 120 140 160 180 200 220 240 260 280 30001020304050
Fork Length (mm)
Perc
ent f
requ
ency
Upper Grande Ronde River
Catherine Creek
Minam River
ntag = 53 n2006 = 5 n2007 = 0
Perc
ent o
f tot
al ta
gged
Lostine River
ntag = 934 H = 62.4 n2006 = 61 P < 0.001 n2007 = 12
ntag = 827 H = 74.1 n2005 = 59 P < 0.001 n2006 = 15
ntag = 80 H = 8.0 n2005 = 7 P = 0.018 n2006 = 1
Figure 16. Length frequency distributions for all steelhead PIT-tagged at screw traps in the fall of 2005, and those subsequently observed at Snake River or Columbia River dams in 2006 and 2007. Fork lengths are based on measurements taken at the time of tagging. Frequency is expressed as the percent of the total number tagged. ‘H’ is the test statistic for the Kruskal–Wallis one-way ANOVA on ranks of the lengths. * Median length of the group was significantly different (α = 0.05, Dunn’s all pair-wise multiple comparison procedure).
55

0
10
20
30
40 60 80 100 120 140 160 180 200 220 240 260 280 300
40
50All Tagged Spring 2007Spring 2007 Observations
0
10
20
30
40
50
40 60 80 100 120 140 160 180 200 220 240 260 280 300
0
10
20
30
40
50
40 60 80 100 120 140 160 180 200 220 240 260 280 300
0
10
20
30
40
50
40 60 80 100 120 140 160 180 200 220 240 260 280 300
Fork length (mm)
Perc
ent f
requ
ency
Catherine Creek
Lostine River
Minam River
ntag = 600 nobs = 119 T = 58,103
Upper Grande Ronde River
P < 0.001
ntag = 370 nobs = 26 T = 8,072 P < 0.001
ntag = 281 nobs = 35 T = 9,116 P < 0.001
ntag = 293 nobs = 68 T = 17,246 P < 0.001
Figure 17. Length frequency distributions for all steelhead PIT-tagged at screw traps in the spring of 2007 and those subsequently observed at Snake River or Columbia River dams in 2007. Fork lengths are based on measurements taken at the time of tagging. Frequency is expressed as the percent of the total number tagged (ntag), and ‘nobs’ is the number detected.
56

0.05.0
10.015.020.025.030.0
1-A
ug-0
51-
Sep-
051-
Oct
-05
1-N
ov-0
51-
Dec
-05
1-Ja
n-06
1-Fe
b-06
1-M
ar-0
61-
Apr
-06
1-M
ay-0
61-
Jun-
061-
Jul-0
61-
Aug
-06
1-Se
p-06
1-O
ct-0
61-
Nov
-06
1-D
ec-0
61-
Jan-
071-
Feb-
071-
Mar
-07
1-A
pr-0
71-
May
-07
1-Ju
n-07
D a te
0.05.0
10.015.020.025.030.0
1-A
ug-0
51-
Sep-
051-
Oct
-05
1-N
ov-0
51-
Dec
-05
1-Ja
n-06
1-Fe
b-06
1-M
ar-0
61-
Apr
-06
1-M
ay-0
61-
Jun-
061-
Jul-0
61-
Aug
-06
1-Se
p-06
1-O
ct-0
61-
Nov
-06
1-D
ec-0
61-
Jan-
071-
Feb-
071-
Mar
-07
1-A
pr-0
71-
May
-07
1-Ju
n-07
Date
0.05.0
10.015.020.025.030.0
1-A
ug-0
51-
Sep-
051-
Oct
-05
1-N
ov-0
51-
Dec
-05
1-Ja
n-06
1-Fe
b-06
1-M
ar-0
61-
Apr
-06
1-M
ay-0
61-
Jun-
061-
Jul-0
61-
Aug
-06
1-Se
p-06
1-O
ct-0
61-
Nov
-06
1-D
ec-0
61-
Jan-
071-
Feb-
071-
Mar
-07
1-A
pr-0
71-
May
-07
1-Ju
n-07
Date
0.05.0
10.015.020.025.030.0
1-A
ug-0
51-
Sep-
051-
Oct
-05
1-N
ov-0
51-
Dec
-05
1-Ja
n-06
1-Fe
b-06
1-M
ar-0
61-
Apr
-06
1-M
ay-0
61-
Jun-
061-
Jul-0
61-
Aug
-06
1-Se
p-06
1-O
ct-0
61-
Nov
-06
1-D
ec-0
61-
Jan-
071-
Feb-
071-
Mar
-07
1-A
pr-0
71-
May
-07
1-Ju
n-07
Date
Mov
ing
Mea
n of
Max
imum
wat
er te
mpe
ratu
re (C
)
Date
Upper Grande Ronde River
Catherine Creek
Lostine River
Minam River
Figure 18. Moving mean of maximum water temperature during the in-basin life stages of egg-to-emigrant for juvenile spring Chinook salmon that migrated from four study streams in the Grande Ronde River basin during migratory year 2007. Missing portions of a trend line represent periods where data were not available.
57

0.01.53.04.56.07.59.0
10.512.0
1-A
ug-0
51-
Sep-
051-
Oct
-05
1-N
ov-0
51-
Dec
-05
1-Ja
n-06
1-Fe
b-06
1-M
ar-0
61-
Apr
-06
1-M
ay-0
61-
Jun-
061-
Jul-0
61-
Aug
-06
1-Se
p-06
1-O
ct-0
61-
Nov
-06
1-D
ec-0
61-
Jan-
071-
Feb-
071-
Mar
-07
1-A
pr-0
71-
May
-07
1-Ju
n-07
1-Ju
l-07
Date
0.04.08.0
12.016.020.024.028.032.0
1-A
ug-0
51-
Sep-
051-
Oct
-05
1-N
ov-0
51-
Dec
-05
1-Ja
n-06
1-Fe
b-06
1-M
ar-0
61-
Apr
-06
1-M
ay-0
61-
Jun-
061-
Jul-0
61-
Aug
-06
1-Se
p-06
1-O
ct-0
61-
Nov
-06
1-D
ec-0
61-
Jan-
071-
Feb-
071-
Mar
-07
1-A
pr-0
71-
May
-07
1-Ju
n-07
1-Ju
l-07
Date
0.06.0
12.018.024.030.036.042.048.0
1-A
ug-0
51-
Sep-
051-
Oct
-05
1-N
ov-0
51-
Dec
-05
1-Ja
n-06
1-Fe
b-06
1-M
ar-0
61-
Apr
-06
1-M
ay-0
61-
Jun-
061-
Jul-0
61-
Aug
-06
1-Se
p-06
1-O
ct-0
61-
Nov
-06
1-D
ec-0
61-
Jan-
071-
Feb-
071-
Mar
-07
1-A
pr-0
71-
May
-07
1-Ju
n-07
1-Ju
l-07
Date
0.015.030.045.060.075.090.0
105.0120.0
1-A
ug-0
51-
Sep-
051-
Oct
-05
1-N
ov-0
51-
Dec
-05
1-Ja
n-06
1-Fe
b-06
1-M
ar-0
61-
Apr
-06
1-M
ay-0
61-
Jun-
061-
Jul-0
61-
Aug
-06
1-Se
p-06
1-O
ct-0
61-
Nov
-06
1-D
ec-0
61-
Jan-
071-
Feb-
071-
Mar
-07
1-A
pr-0
71-
May
-07
1-Ju
n-07
1-Ju
l-07
Date
Catherine Creek
Upper Grande Ronde River
Lostine River
Minam River
Stre
am D
isch
arge
(m³/s
ec)
Date
Data not available at time of submission
Data not available at time of submission
Figure 19. Average daily discharge during the in-basin life stages of egg-to-emigrant for juvenile spring Chinook salmon that migrated from the Lostine and Minam rivers during migratory year 2007. Discharge data was not available for the upper Grande Ronde River and Catherine Creek.
58

APPENDIX A
A Compilation of Spring Chinook Salmon Data
59
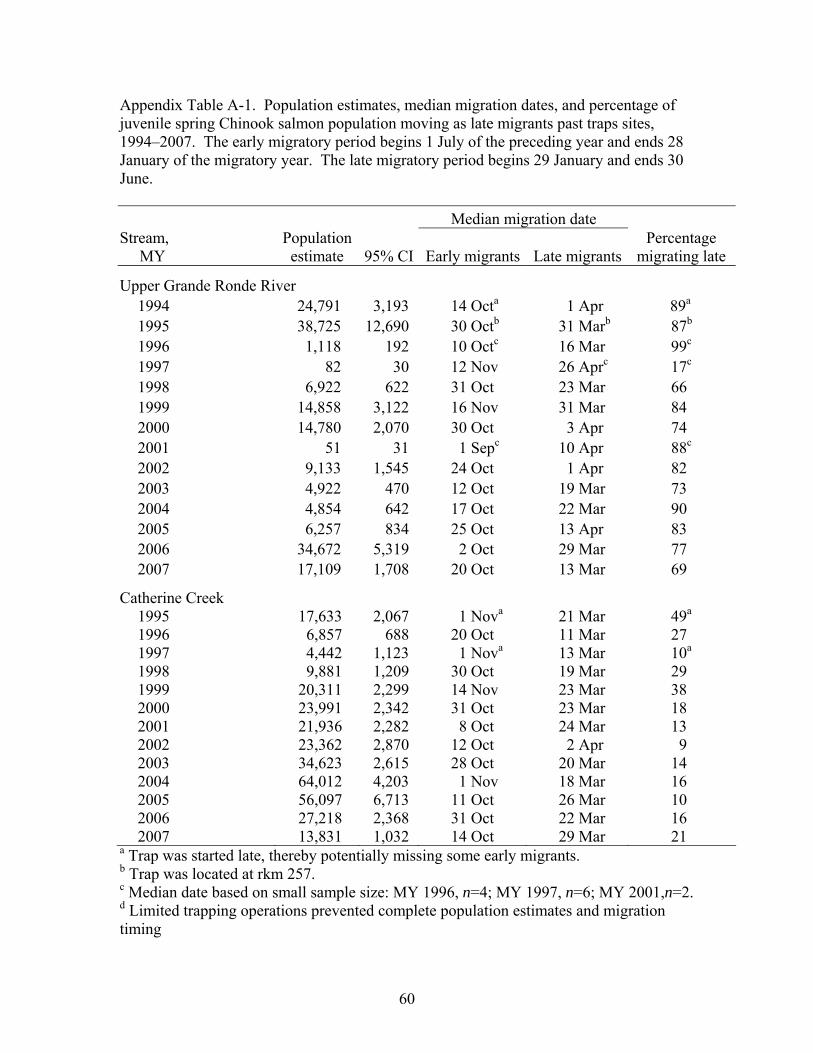
Appendix Table A-1. Population estimates, median migration dates, and percentage of juvenile spring Chinook salmon population moving as late migrants past traps sites, 1994–2007. The early migratory period begins 1 July of the preceding year and ends 28 January of the migratory year. The late migratory period begins 29 January and ends 30 June. Median migration date Stream, MY
Population estimate 95% CI Early migrants Late migrants
Percentage migrating late
Upper Grande Ronde River 1994 24,791 3,193 14 Octa 1 Apr 89a 1995 38,725 12,690 30 Octb 31 Marb 87b 1996 1,118 192 10 Octc 16 Mar 99c 1997 82 30 12 Nov 26 Aprc 17c 1998 6,922 622 31 Oct 23 Mar 66 1999 14,858 3,122 16 Nov 31 Mar 84 2000 14,780 2,070 30 Oct 3 Apr 74 2001 51 31 1 Sepc 10 Apr 88c 2002 9,133 1,545 24 Oct 1 Apr 82 2003 4,922 470 12 Oct 19 Mar 73 2004 4,854 642 17 Oct 22 Mar 90 2005 6,257 834 25 Oct 13 Apr 83 2006 34,672 5,319 2 Oct 29 Mar 77 2007 17,109 1,708 20 Oct 13 Mar 69
Catherine Creek 1995 17,633 2,067 1 Nova 21 Mar 49a 1996 6,857 688 20 Oct 11 Mar 27 1997 4,442 1,123 1 Nova 13 Mar 10a 1998 9,881 1,209 30 Oct 19 Mar 29 1999 20,311 2,299 14 Nov 23 Mar 38 2000 23,991 2,342 31 Oct 23 Mar 18 2001 21,936 2,282 8 Oct 24 Mar 13 2002 23,362 2,870 12 Oct 2 Apr 9 2003 34,623 2,615 28 Oct 20 Mar 14 2004 64,012 4,203 1 Nov 18 Mar 16 2005 56,097 6,713 11 Oct 26 Mar 10 2006 27,218 2,368 31 Oct 22 Mar 16 2007 13,831 1,032 14 Oct 29 Mar 21
a Trap was started late, thereby potentially missing some early migrants. b Trap was located at rkm 257. c Median date based on small sample size: MY 1996, n=4; MY 1997, n=6; MY 2001,n=2. d Limited trapping operations prevented complete population estimates and migration timing
60

Appendix Table A-1. Continued.
Median migration date Stream, MY
Population estimate 95% CI Early migrants Late migrants
Percentage migrating late
Lostine River 1997 4,496 606 26 Nova 30 Mar 52a 1998 17,539 2,610 26 Oct 26 Mar 35 1999 34,267 2,632 12 Nov 18 Apr 41 2000 12,250 887 2 Nov 9 Apr 32 2001 13,610 1,362 29 Sep 20 Apr 23 2002 18,140 2,428 24 Oct 1 Apr 15 2003 28,939 1,865 22 Oct 1 Apr 34 2004 —d — — — — 2005 54,602 6,734 22 Sep 31 Mar 25 2006 54,268 8,812 4 Nov 11 Apr 222007 46,183 4,827 14 Oct 7 Apr 26
a Trap was started late, thereby potentially missing some early migrants.
Minam River 2001 28,209 4,643 8 Octa 27 Mar 64a 2002 79,000 10,836 24 Octa 8 Apr 21a 2003 63,147 10,659 30 Octa 5 Apr 69a 2004 65,185 9,049 13 Nov 29 Mar 34 2005 111,390 26,553 21 Oct 28 Mar 57 2006 50,959 8,262 14 Oct 1 Apr 42 2007 37,719 5,767 5 Nov 22 Mar 31
b Trap was located at rkm 257. c Median date based on small sample size: MY 1996, n=4; MY 1997, n=6; MY 2001, n=2. d Limited trapping operations prevented complete population estimates and migration timing
61

Appendix Table A-2. Dates of arrival at Lower Granite Dam (LGD) of spring Chinook salmon smolts PIT-tagged in upper rearing areas during the summer and winter, and at screw traps as early and late migrants during migratory years 1993–2007. Italics indicate that the median may be biased due to when fish were tagged. Numbers of fish detected at Lower Granite Dam were expanded for spillway flow to calculate the median arrival date.
Arrival dates Stream, MY
Tag group
Migration period
Number tagged
Number detected at
LGD Median First Last
Upper Grande Ronde River (rkm 299) 1993 Summer All 918 117 17 May 23 Apr 20 Jun 1994 Summer All 1,001 57 29 May 23 Apr 29 Aug Fall Early 405 65 30 Apr 21 Apr 23 Jun Winter Late 505 27 29 May 28 Apr 16 Jul Spring Late 573 93 15 May 20 Apr 06 Aug1995a Summer All 1,000 89 29 May 12 Apr 1 Jul Fall Early 424 57 5 May 11 Apr 2 Jun Winter Late 433 30 28 May 17 Apr 4 Jul Spring Late 368 109 2 Jun 15 Apr 12 Jul 1996 Fall Early 4 0 — — — Spring Late 327 47 16 May 19 Apr 6 Jun 1997 Fall Early 27 2 23 Apr 22 Apr 24 Apr Spring Late 1 1 14 May — — 1998 Fall Early 592 81 27 Apr 4 Apr 25 May Winter Late 124 5 5 Jun 11 May 26 Jun Spring Late 513 116 5 May 8 Apr 5 Jun 1999 Fall Early 500 42 29 Apr 31 Mar 1 Jun Winter Late 420 13 27 May 12 May 20 Jun Spring Late 535 83 4 May 18 Apr 20 Jun 2000 Fall Early 493 45 8 May 12 Apr 6 Jun Winter Late 500 22 26 May 9 May 16 Jul Spring Late 495 91 11 May 15 Apr 20 Jul 2001 Spring Late 6 4 17 May 4 May 20 May2002 Fall Early 344 20 20 May 17 Apr 2 Jun Spring Late 538 71 31 May 14 Apr 28 Jun 2003 Fall Early 584 46 1 May 3 Apr 26 May Spring Late 571 95 17 May 31 Mar 2 Jun 2004 Fall Early 180 24 5 May 15 Apr 3 Jun Winter Late 301 68 21 May 26 Apr 17 Jun Spring Late 525 173 21 May 17 Apr 3 Jun 2005 Fall Early 368 39 7 May 20 Apr 1 Jun Winter Late 449 46 30 May 3 May 19 Jun Spring Late 615 131 19 May 19 Apr 13 Jun
a Trap was located at rkm 257.
62

Appendix Table A-2. Continued.
Arrival dates Stream, MY
Tag group
Migration period
Number tagged
Number detected at
LGD Median First Last
Upper Grande Ronde River (cont.) 2006 Fall Early 521 29 18 May 16 Apr 6 Jun
Winter Late 464 12 3 Jun 20 May 14 Jun Spring Late 505 49 20 May 30 Mar 20 Jun
2007 Fall Early 534 54 11 May 14 Apr 3 Jun Winter Late 383 32 15 May 27 Apr 6 Jun Spring Late 501 79 14 May 13 Apr 11 Jun Catherine Creek
1993 Summer All 1,094 125 18 May 29 Apr 26 Jun 1994 Summer All 1,000 91 11 May 13 Apr 26 Jul 1995 Summer All 999 88 25 May 26 Apr 2 Jul Fall Early 502 65 7 May 22 Apr 19 Jun Winter Late 483 57 13 May 27 Apr 4 Jul Spring Late 348 88 5 Jun 1 May 8 Jul 1996 Summer All 499 60 1 May 17 Apr 29 May Fall Early 566 76 29 Apr 14 Apr 4 Jun Winter Late 295 14 18 May 19 Apr 14 Jun Spring Late 277 70 17 May 17 Apr 13 Jun 1997 Summer All 583 51 14 May 24 Apr 10 Jun Fall Early 403 40 12 May 17 Apr 1 Jun Winter Late 102 5 17 May 27 Apr 15 Jun Spring Late 78 22 26 May 28 Apr 1 Jun 1998 Summer All 499 43 17 May 24 Apr 4 Jun Fall Early 598 66 1 May 3 Apr 3 Jun Winter Late 438 57 11 May 15 Apr 15 Jun Spring Late 453 109 21 May 26 Apr 26 Jun 1999 Summer All 502 20 26 May 26 Apr 26 Jun Fall Early 656 41 23 May 19 Apr 28 Jun Winter Late 494 35 29 May 23 Apr 9 Jul Spring Late 502 54 21 May 20 Apr 20 Jun 2000 Summer All 497 30 7 May 12 Apr 7 Jun Fall Early 677 56 3 May 12 Apr 29 May Winter Late 500 22 9 May 25 Apr 1 May Spring Late 431 52 12 May 21 Apr 2 Jul 2001 Summer All 498 33 17 May 28 Apr 3 Jul Fall Early 494 57 10 May 27 Apr 18 Jun Winter Late 538 27 1 Jun 4 May 6 Jul Spring Late 329 100 30 May 29 Apr 13 Jul
63

Appendix Table A-2. Continued.
Arrival dates Stream, MY
Tag group
Migration period
Number tagged
Number detected at
LGD Median First Last
Catherine Creek (cont.) 2002 Summer All 502 17 6 May 15 Apr 22 May Fall Early 515 20 6 May 16 Apr 20 Jun Winter Late 449 15 14 May 24 Apr 26 Jun Spring Late 217 27 26 May 17 Apr 1 Jul 2003 Summer All 501 17 16 May 14 Apr 9 Jun Fall Early 1,196 59 18 May 14 Apr 31 May Winter Late 531 25 22 May 18 Apr 6 Jun Spring Late 576 95 25 May 13 Apr 23 Jun 2004 Summer All 467 30 15 May 22 Apr 25 Jun Fall Early 524 45 21 May 15 Apr 15 Jun Winter Late 502 66 21 May 23 Apr 8 Jul Spring Late 525 172 29 May 22 Apr 14 Jul 2005 Summer All 495 21 8 May 20 Apr 2 Jun Fall Early 544 43 7 May 14 Apr 2 Jun Winter Late 529 28 21 May 18 Apr 20 Jun Spring Late 410 82 31 May 26 Apr 20 Jun 2006 Summer All 523 7 16 May 28 Apr 19 May Fall Early 500 15 4 May 23 Apr 10 Jun Winter Late 500 19 15 May 26 Apr 9 Jun Spring Late 360 34 4 Jun 2 May 22 Jun 2007 Summer All 501 6 23 Apr 19 Apr 19 May Fall Early 500 26 2 May 16 Apr 15 May Winter Late 500 12 13 May 21 Apr 20 May Spring Late 363 42 13 May 1 May 13 Jun
Grande Ronde River (rkm 164) 2002 Spring NA 167 21 23 May 17 May 18 Jun 2003 Spring NA 250 90 16 May 22 Apr 18 Jun 2004 Spring NA 488 286 5 May 21 Apr 5 Jun 2005 Spring NA 236 118 3 May 6 Apr 29 May2006 Spring NA 400 107 16-May 8-Apr 30-May
Lostine River 1993 Summer All 997 136 4 May 17 Apr 1 Jun 1994 Summer All 725 77 2 May 19 Apr 7 Jun 1995 Summer All 1,002 115 2 May 8 Apr 19 Jun 1996 Summer All 977 129 15 May 17 Apr 19 Jun 1997 Summer All 527 43 25 Apr 9 Apr 21 May Fall Early 519 53 22 Apr 2 Apr 13 May Winter Late 390 60 2 May 15 Apr 27 May Spring Late 476 109 25 Apr 10 Apr 22 May
64

Appendix Table A-2. Continued.
Arrival dates Stream, MY
Tag group
Migration period
Number tagged
Number detected at
LGD Median First Last
Lostine River (cont.) 1998 Summer All 506 19 15 May 29 Mar 29 May Fall Early 500 109 21 Apr 31 Mar 13 May Winter Late 504 96 29 Apr 4 Apr 24 May Spring Late 466 185 28 Apr 4 Apr 1 Jul 1999 Summer All 509 36 8 May 13 Apr 3 Jun Fall Early 501 40 26 Apr 31 Mar 18 May Winter Late 491 39 10 May 6 Apr 7 Jun Spring Late 600 88 12 May 9 Apr 8 Jul 2000 Summer All 489 87 9 May 10 Apr 12 Jun Fall Early 514 59 18 Apr 3 Apr 13 May Winter Late 511 51 9 May 20 Apr 2 Jul Spring Late 355 65 22 May 14 Apr 16 Jul 2001 Summer All 501 23 20 Apr 28 Mar 29 May Fall Early 500 139 27 Apr 12 Apr 18 May Winter Late 500 113 14 May 16 Apr 19 Jun Spring Late 445 246 12 May 21 Apr 4 Jul 2002 Summer All 509 21 8 May 11 Apr 3 Jun Fall Early 501 37 17 Apr 30 Mar 5 May Winter Late 564 22 7 May 11 Apr 23 Jun Spring Late 406 61 7 May 15 Apr 11 Jun 2003 Summer All 997 136 4 May 17 Apr 1 Jun Fall Early 900 77 18 Apr 25 Mar 27 May Winter Late 491 42 15 May 13 Apr 8 Jun Spring Late 527 107 4 May 3 Apr 4 Jul 2004 Summer All 525 26 7 May 14 Apr 15 Jun Winter Late 500 70 11 May 23 Apr 27 May2005 Summer All 500 49 28 Apr 5 Apr 18 Jun Fall Early 500 103 20 Apr 5 Apr 9 May Winter Late 500 72 9 May 12 Apr 13 Jun Spring Late 464 174 8 May 13 Apr 19 Jun 2006 Summer All 1,105 29 28 Apr 5 Apr 9 Jun Fall Early 495 29 22 Apr 2 Apr 10 May Winter Late 501 27 12 May 20 Apr 31 May Spring Late 517 112 11 May 6 Apr 3 Jun 2007 Summer All 500 27 4 May 5 Apr 21 May Fall Early 500 37 17 Apr 27 Mar 12 May Winter Late 500 39 12 May 17 Apr 25 May Spring Late 505 109 11 May 18 Apr 1 Jun
65
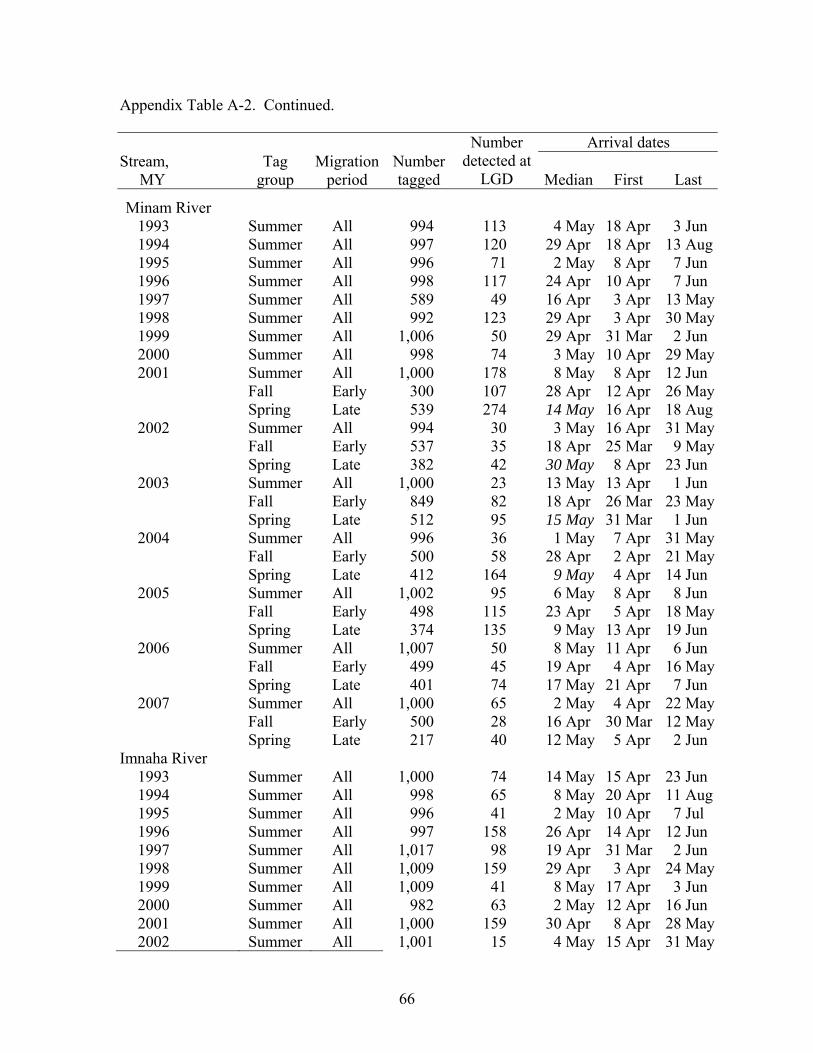
Appendix Table A-2. Continued.
Arrival dates Stream, MY
Tag group
Migration period
Number tagged
Number detected at
LGD Median First Last
Minam River 1993 Summer All 994 113 4 May 18 Apr 3 Jun 1994 Summer All 997 120 29 Apr 18 Apr 13 Aug1995 Summer All 996 71 2 May 8 Apr 7 Jun 1996 Summer All 998 117 24 Apr 10 Apr 7 Jun 1997 Summer All 589 49 16 Apr 3 Apr 13 May1998 Summer All 992 123 29 Apr 3 Apr 30 May1999 Summer All 1,006 50 29 Apr 31 Mar 2 Jun 2000 Summer All 998 74 3 May 10 Apr 29 May2001 Summer All 1,000 178 8 May 8 Apr 12 Jun Fall Early 300 107 28 Apr 12 Apr 26 May Spring Late 539 274 14 May 16 Apr 18 Aug2002 Summer All 994 30 3 May 16 Apr 31 May Fall Early 537 35 18 Apr 25 Mar 9 May Spring Late 382 42 30 May 8 Apr 23 Jun 2003 Summer All 1,000 23 13 May 13 Apr 1 Jun Fall Early 849 82 18 Apr 26 Mar 23 May Spring Late 512 95 15 May 31 Mar 1 Jun 2004 Summer All 996 36 1 May 7 Apr 31 May Fall Early 500 58 28 Apr 2 Apr 21 May Spring Late 412 164 9 May 4 Apr 14 Jun 2005 Summer All 1,002 95 6 May 8 Apr 8 Jun Fall Early 498 115 23 Apr 5 Apr 18 May Spring Late 374 135 9 May 13 Apr 19 Jun 2006 Summer All 1,007 50 8 May 11 Apr 6 Jun Fall Early 499 45 19 Apr 4 Apr 16 May Spring Late 401 74 17 May 21 Apr 7 Jun 2007 Summer All 1,000 65 2 May 4 Apr 22 May Fall Early 500 28 16 Apr 30 Mar 12 May Spring Late 217 40 12 May 5 Apr 2 Jun
Imnaha River 1993 Summer All 1,000 74 14 May 15 Apr 23 Jun 1994 Summer All 998 65 8 May 20 Apr 11 Aug1995 Summer All 996 41 2 May 10 Apr 7 Jul 1996 Summer All 997 158 26 Apr 14 Apr 12 Jun 1997 Summer All 1,017 98 19 Apr 31 Mar 2 Jun 1998 Summer All 1,009 159 29 Apr 3 Apr 24 May1999 Summer All 1,009 41 8 May 17 Apr 3 Jun 2000 Summer All 982 63 2 May 12 Apr 16 Jun 2001 Summer All 1,000 159 30 Apr 8 Apr 28 May2002 Summer All 1,001 15 4 May 15 Apr 31 May
66

Appendix Table A-2. Continued.
Arrival dates Stream, MY
Tag group
Migration period
Number tagged
Number detected at
LGD Median First Last
Imnaha River (cont.) 2003 Summer All 1,003 43 8 May 17 Apr 31 May2004 Summer All 998 81 4 May 18 Apr 8 Jun 2005 Summer All 1,001 90 2 May 5 Apr 11 Jun 2006 Summer All 1,011 40 30 Apr 3 Apr 4 Jun 2007 Summer All 1,000 59 27 Apr 5 Apr 24 May
Wenaha and South Fork Wenaha rivers 1993 Summer All 749 84 28 Apr 14 Apr 15 May1994 Summer All 998 93 24 Apr 18 Apr 6 Jun 1995 Summer All 999 76 26 Apr 9 Apr 15 May1996 Summer All 997 105 21 Apr 13 Apr 16 May1997 Summer All 62 10 16 Apr 9 Apr 23 Apr
67
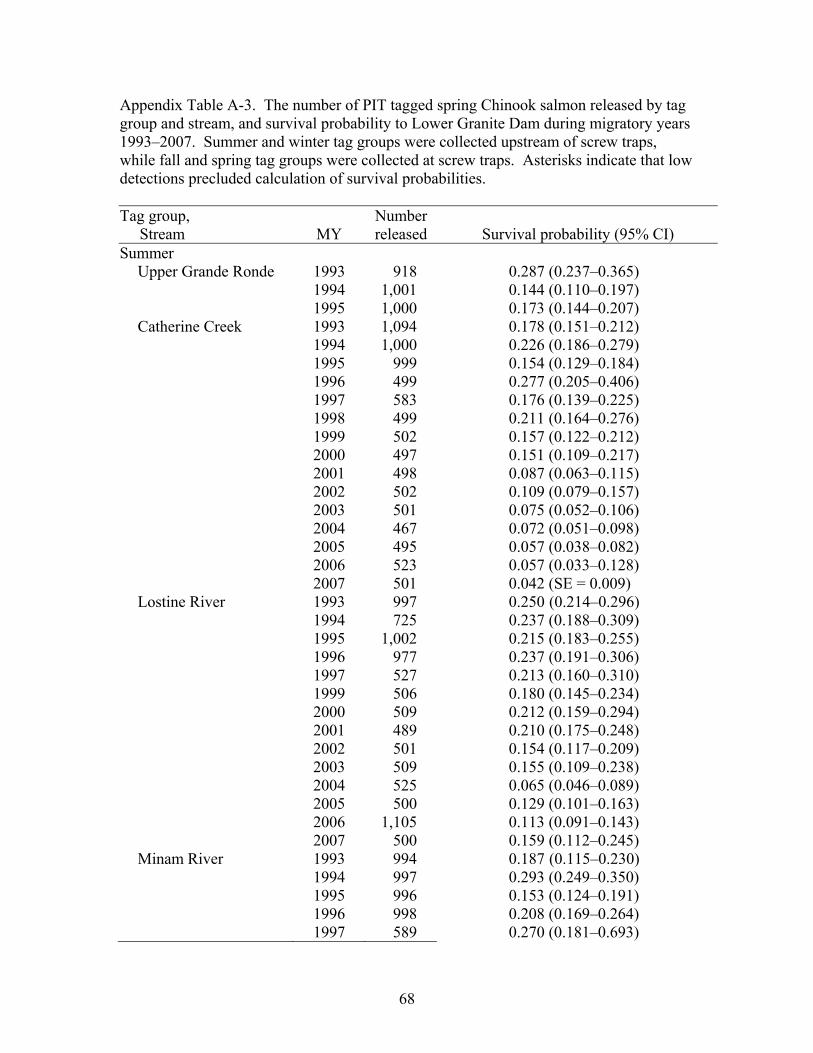
Appendix Table A-3. The number of PIT tagged spring Chinook salmon released by tag group and stream, and survival probability to Lower Granite Dam during migratory years 1993–2007. Summer and winter tag groups were collected upstream of screw traps, while fall and spring tag groups were collected at screw traps. Asterisks indicate that low detections precluded calculation of survival probabilities. Tag group, Stream MY
Number released Survival probability (95% CI)
Summer Upper Grande Ronde 1993 918 0.287 (0.237–0.365)
1994 1,001 0.144 (0.110–0.197) 1995 1,000 0.173 (0.144–0.207)
Catherine Creek 1993 1,094 0.178 (0.151–0.212) 1994 1,000 0.226 (0.186–0.279) 1995 999 0.154 (0.129–0.184) 1996 499 0.277 (0.205–0.406) 1997 583 0.176 (0.139–0.225) 1998 499 0.211 (0.164–0.276) 1999 502 0.157 (0.122–0.212) 2000 497 0.151 (0.109–0.217) 2001 498 0.087 (0.063–0.115)
2002 502 0.109 (0.079–0.157) 2003 501 0.075 (0.052–0.106) 2004 467 0.072 (0.051–0.098) 2005 495 0.057 (0.038–0.082) 2006 523 0.057 (0.033–0.128) 2007 501 0.042 (SE = 0.009) Lostine River 1993 997 0.250 (0.214–0.296)
1994 725 0.237 (0.188–0.309) 1995 1,002 0.215 (0.183–0.255) 1996 977 0.237 (0.191–0.306) 1997 527 0.213 (0.160–0.310) 1999 506 0.180 (0.145–0.234) 2000 509 0.212 (0.159–0.294) 2001 489 0.210 (0.175–0.248) 2002 501 0.154 (0.117–0.209) 2003 509 0.155 (0.109–0.238) 2004 525 0.065 (0.046–0.089) 2005 500 0.129 (0.101–0.163) 2006 1,105 0.113 (0.091–0.143)
2007 500 0.159 (0.112–0.245) Minam River 1993 994 0.187 (0.115–0.230)
1994 997 0.293 (0.249–0.350) 1995 996 0.153 (0.124–0.191) 1996 998 0.208 (0.169–0.264) 1997 589 0.270 (0.181–0.693)
68
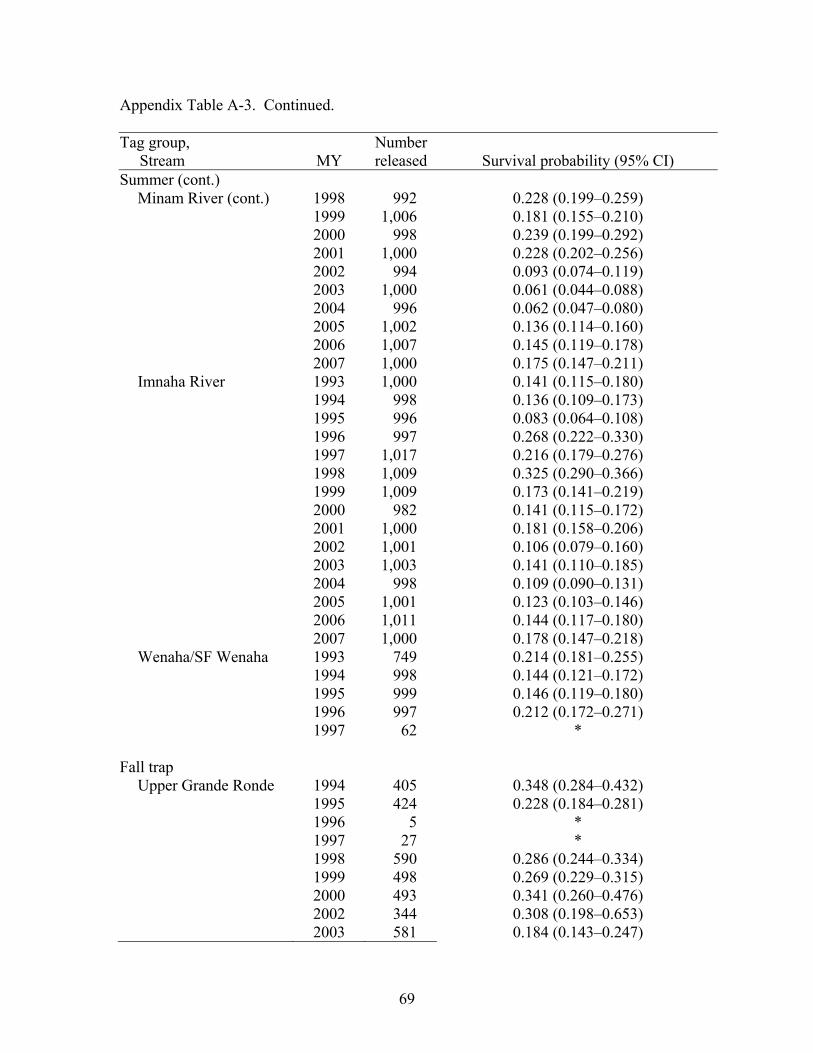
Appendix Table A-3. Continued. Tag group, Stream MY
Number released Survival probability (95% CI)
Summer (cont.) Minam River (cont.) 1998 992 0.228 (0.199–0.259)
1999 1,006 0.181 (0.155–0.210) 2000 998 0.239 (0.199–0.292) 2001 1,000 0.228 (0.202–0.256) 2002 994 0.093 (0.074–0.119) 2003 1,000 0.061 (0.044–0.088) 2004 996 0.062 (0.047–0.080) 2005 1,002 0.136 (0.114–0.160) 2006 1,007 0.145 (0.119–0.178) 2007 1,000 0.175 (0.147–0.211)
Imnaha River 1993 1,000 0.141 (0.115–0.180) 1994 998 0.136 (0.109–0.173) 1995 996 0.083 (0.064–0.108) 1996 997 0.268 (0.222–0.330) 1997 1,017 0.216 (0.179–0.276) 1998 1,009 0.325 (0.290–0.366) 1999 1,009 0.173 (0.141–0.219) 2000 982 0.141 (0.115–0.172) 2001 1,000 0.181 (0.158–0.206) 2002 1,001 0.106 (0.079–0.160) 2003 1,003 0.141 (0.110–0.185) 2004 998 0.109 (0.090–0.131) 2005 1,001 0.123 (0.103–0.146) 2006 1,011 0.144 (0.117–0.180) 2007 1,000 0.178 (0.147–0.218)
Wenaha/SF Wenaha 1993 749 0.214 (0.181–0.255) 1994 998 0.144 (0.121–0.172) 1995 999 0.146 (0.119–0.180) 1996 997 0.212 (0.172–0.271) 1997 62 * Fall trap
Upper Grande Ronde 1994 405 0.348 (0.284–0.432) 1995 424 0.228 (0.184–0.281) 1996 5 * 1997 27 * 1998 590 0.286 (0.244–0.334) 1999 498 0.269 (0.229–0.315) 2000 493 0.341 (0.260–0.476) 2002 344 0.308 (0.198–0.653) 2003 581 0.184 (0.143–0.247)
69

Appendix Table A-3. Continued. Tag group, Stream MY
Number released Survival probability (95% CI)
Fall trap (cont.) Upper Grande Ronde 2004 180 0.164 (0.114–0.225)
2005 368 0.138 (0.105–0.177) 2006 521 0.171 (0.136–0.232) 2007 534 0.242 (0.199–0.301)
Catherine Creek 1995 502 0.238 (0.193–0.297) 1996 508 0.358 (0.296–0.446) 1997 399 0.365 (0.256–0.588) 1998 582 0.238 (0.194–0.293) 1999 644 0.202 (0.166–0.250) 2000 677 0.212 (0.170–0.269) 2001 508 0.130 (0.103–0.162) 2002 514 0.154 (0.114–0.245) 2003 849 0.120 (0.093–0.160) 2004 524 0.126 (0.099–0.158) 2005 544 0.122 (0.093–0.161) 2006 500 0.074 (SE = 0.012) 2007 500 0.203 (0.143–0.340)
Lostine River 1997 519 0.312 (0.247–0.465) 1998 500 0.448 (0.391–0.514) 1999 501 0.422 (0.349–0.538) 2000 514 0.317 (0.267–0.380) 2001 498 0.335 (0.294–0.378) 2002 500 0.326 (0.258–0.455) 2003 854 0.287 (0.236–0.365) 2004 0 — 2005 500 0.267 (0.227–0.310) 2006 495 0.269 (0.207–0.406) 2007 500 0.223 (0.172–0.301)
Minam River 2001 300 0.427 (0.371–0.485) 2002 537 0.249 (0.201–0.326) 2003 849 0.238 (0.199–0.292) 2004 500 0.183 (0.150–0.219) 2005 498 0.293 (0.253–0.337) 2006 499 0.245 (0.205–0.304) 2007 500 0.250 (0.186–0.368)
Wallowa River 1999 45 * Winter
Upper Grande Ronde 1994 505 0.248 (0.152–0.519) 1995 432 0.151 (0.115–0.199) 1998 124 0.113 (SE = 0.028)
70

Appendix Table A-3. Continued. Tag group, Stream MY
Number released Survival probability (95% CI)
Winter (cont.) Upper Grande Ronde 1999 420 0.118 (0.083–0.183)
2000 500 0.133 (0.099–0.183) 2004 301 0.296 (0.245–0.353) 2005 449 0.207 (0.159–0.306) 2006 464 0.080 (0.052–0.183) 2007 383 0.138 (0.102–0.187)
Catherine Creek 1995 482 0.279 (0.230–0.343) 1996 295 0.312 (0.163–1.008) 1997 102 0.078 (0.033–0.222) 1998 437 0.278 (0.226–0.345) 1999 493 0.285 (0.230–0.367) 2000 500 0.138 (0.102–0.191) 2001 522 0.077 (0.054–0.106) 2002 431 0.203 (0.129–0.476) 2003 524 0.152 (0.109–0.231) 2004 502 0.178 (0.145–0.215) 2005 529 0.112 (0.079–0.178) 2006 500 0.125 (0.080–0.312) 2007 500 0.088 (0.047–0.343)
Lostine River 1997 388 0.445 (0.334–0.650) 1998 504 0.349 (0.301–0.403) 1999 491 0.305 (0.259–0.363) 2000 511 0.397 (0.296–0.576) 2001 499 0.284 (0.245–0.326) 2002 564 0.246 (0.170–0.464) 2003 501 0.226 (0.167–0.337) 2004 500 0.189 (0.156–0.227) 2005 500 0.201 (0.166–0.240) 2006 501 0.177 (0.127–0.304) 2007 500 0.135 (0.101–0.186) Spring trap
Upper Grande Ronde 1994 571 0.462 (0.387–0.563) 1995 368 0.609 (0.545–0.683) 1996 327 0.512 (0.404–0.690) 1998 512 0.548 (0.487–0.622) 1999 528 0.538 (0.486–0.601) 2000 495 0.560 (0.472–0.680) 2001 6 * 2002 536 0.499 (0.416–0.633) 2003 571 0.397 (0.346–0.461) 2004 525 0.420 (0.376–0.464)
71
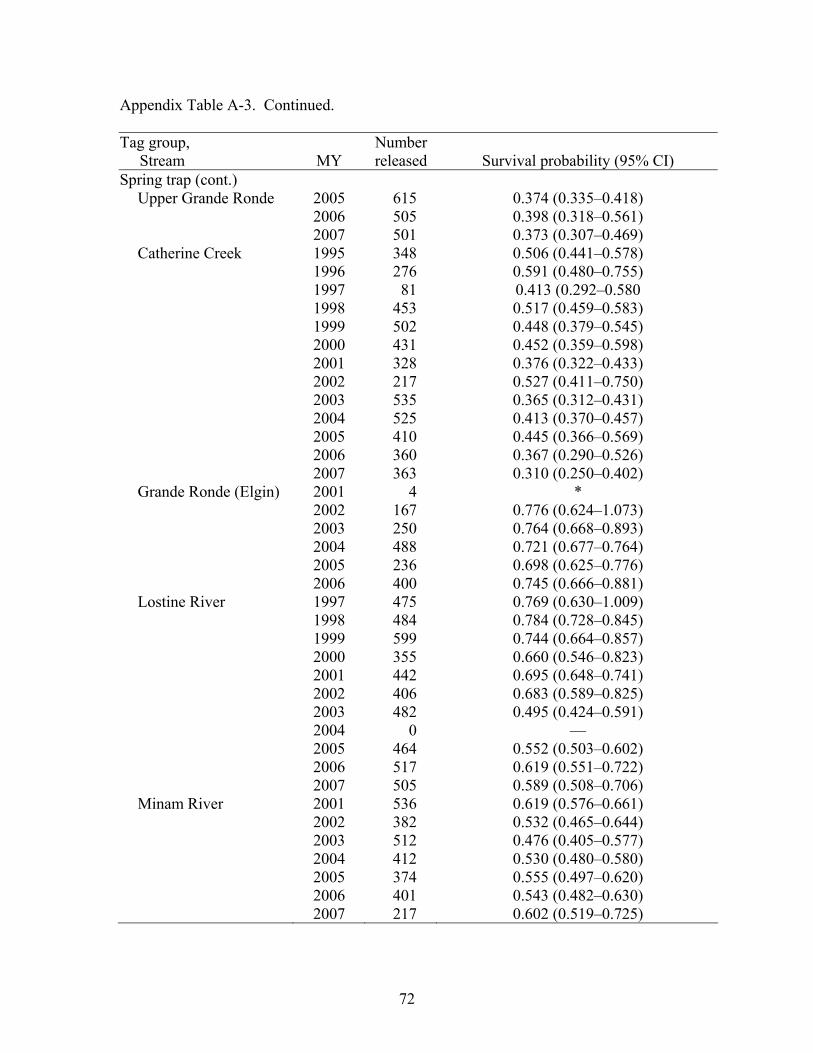
Appendix Table A-3. Continued. Tag group, Stream MY
Number released Survival probability (95% CI)
Spring trap (cont.) Upper Grande Ronde 2005 615 0.374 (0.335–0.418)
2006 505 0.398 (0.318–0.561) 2007 501 0.373 (0.307–0.469)
Catherine Creek 1995 348 0.506 (0.441–0.578) 1996 276 0.591 (0.480–0.755) 1997 81 0.413 (0.292–0.580 1998 453 0.517 (0.459–0.583)
1999 502 0.448 (0.379–0.545) 2000 431 0.452 (0.359–0.598) 2001 328 0.376 (0.322–0.433) 2002 217 0.527 (0.411–0.750) 2003 535 0.365 (0.312–0.431) 2004 525 0.413 (0.370–0.457) 2005 410 0.445 (0.366–0.569) 2006 360 0.367 (0.290–0.526) 2007 363 0.310 (0.250–0.402)
Grande Ronde (Elgin) 2001 4 * 2002 167 0.776 (0.624–1.073) 2003 250 0.764 (0.668–0.893) 2004 488 0.721 (0.677–0.764) 2005 236 0.698 (0.625–0.776) 2006 400 0.745 (0.666–0.881)
Lostine River 1997 475 0.769 (0.630–1.009) 1998 484 0.784 (0.728–0.845) 1999 599 0.744 (0.664–0.857) 2000 355 0.660 (0.546–0.823) 2001 442 0.695 (0.648–0.741) 2002 406 0.683 (0.589–0.825) 2003 482 0.495 (0.424–0.591) 2004 0 — 2005 464 0.552 (0.503–0.602) 2006 517 0.619 (0.551–0.722) 2007 505 0.589 (0.508–0.706)
Minam River 2001 536 0.619 (0.576–0.661) 2002 382 0.532 (0.465–0.644) 2003 512 0.476 (0.405–0.577) 2004 412 0.530 (0.480–0.580) 2005 374 0.555 (0.497–0.620) 2006 401 0.543 (0.482–0.630) 2007 217 0.602 (0.519–0.725)
72

Appendix Table A-4. Travel time to Lower Granite Dam (LGD) of juvenile spring Chinook salmon PIT-tagged at screw traps in spring and arriving at Lower Granite Dam the same year. Min. = minimum; Max. = maximum.
Travel time (d) Stream, MY
Distance to LGD (km)
Number detected Median Min. Max
Upper Grande Ronde River (rkm 299) 397
1994 93 45.1 17 130 1995a 114 19.5 6 81 1996 47 64.7 14 88 1997 1 56.7 — — 1998 116 48.6 25 71 1999 83 39.1 16 92 2000 91 50.5 12 98 2001 4 37.5 29 56 2002 71 46.5 12 79 2003 95 56.0 20 84 2004 173 52.5 10 95 2005 131 36.7 11 74 2006 49 49.9 21 77 2007 79 54.7 10 73
Catherine Creek 362 1995 88 59.1 20 105 1996 70 54.2 9 91 1997 22 60.4 17 91 1998 109 56.5 12 87 1999 54 63.2 21 90 2000 52 50.5 20 95 2001 100 64.5 15 110 2002 27 52.8 13 75 2003 95 54.8 16 101 2004 172 56.8 10 109 2005 82 49.7 9 109 2006 34 50.1 12 86 2007 42 46.1 14 83
Grande Ronde River (rkm 164) 262
2002 21 6.6 3 22 2003 90 8.6 3 35 2004 286 8.5 4 52 2005 118 20.3 4 51 2006 107 5.8 2 50
a Trap was located at rkm 257; distance to LGD was 355 km.
73
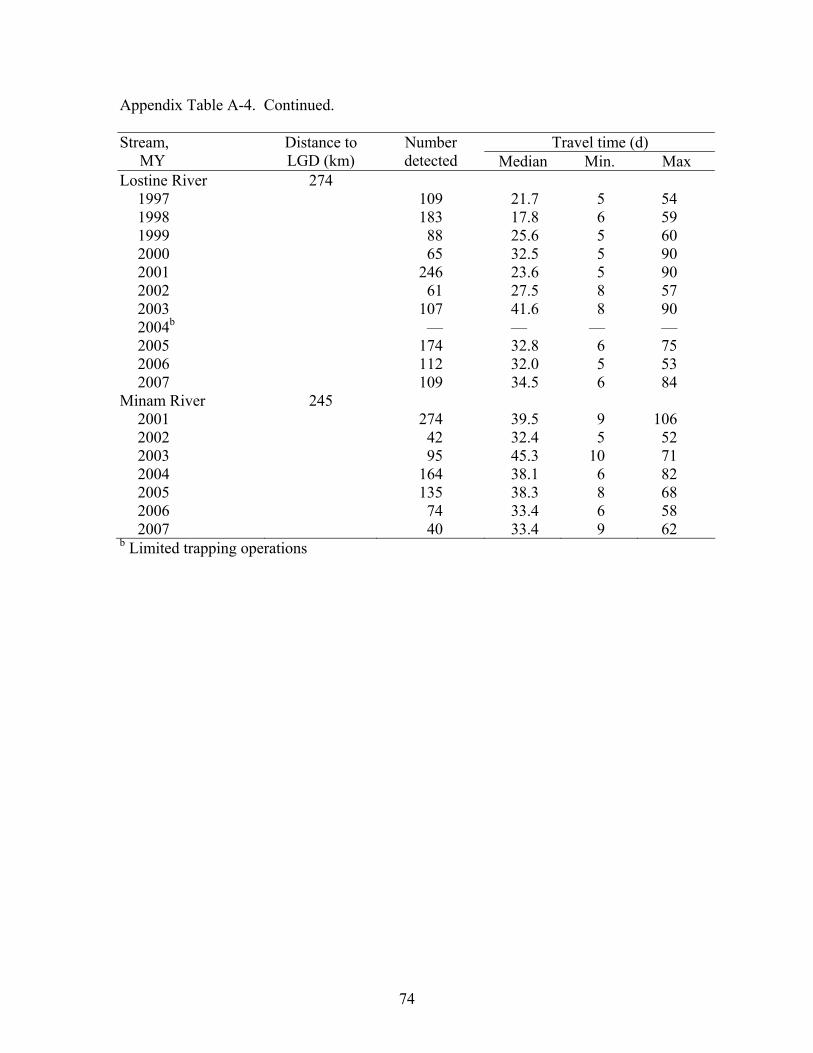
Appendix Table A-4. Continued.
Travel time (d) Stream, MY
Distance to LGD (km)
Number detected Median Min. Max
Lostine River 274 1997 109 21.7 5 54 1998 183 17.8 6 59 1999 88 25.6 5 60 2000 65 32.5 5 90 2001 246 23.6 5 90 2002 61 27.5 8 57 2003 107 41.6 8 90 2004b — — — — 2005 174 32.8 6 75 2006 112 32.0 5 53 2007 109 34.5 6 84
Minam River 245 2001 274 39.5 9 106 2002 42 32.4 5 52 2003 95 45.3 10 71 2004 164 38.1 6 82 2005 135 38.3 8 68 2006 74 33.4 6 58 2007 40 33.4 9 62
b Limited trapping operations
74

75
Appendix Table A-5. Overwinter survival rates of spring Chinook salmon parr overwintering upstream of screw traps on Catherine Creek and the Lostine and Grande Ronde rivers. Screw traps are located on Catherine Creek at rkm 32, Lostine River at rkm 3, and Grande Ronde River at rkm 299, except MY 1995 when the upper Grande Ronde River trap was at rkm 257. Survival rates were calculated by dividing the survival probability of the winter tag group by the survival probability of the spring tag group.
Overwinter survival in upper rearing areas
BY MY Upper Grande Ronde River
Catherine Creek
Lostine River
1992 1994 0.54 — — 1993 1995 0.25 0.55 — 1994 1996 — 0.53 — 1995 1997 — 0.19 0.58 1996 1998 0.21 0.54 0.45 1997 1999 0.22 0.64 0.41 1998 2000 0.24 0.31 0.60 1999 2001 — 0.20 0.41 2000 2002 — 0.39 0.36 2001 2003 — 0.38 0.46 2002 2004 0.70 0.43 0.30 2003 2005 0.55 0.25 0.36 2004 2006 0.20 0.34 0.29 2005 2007 0.37 0.28 0.23

App
endi
x Ta
ble
A-6
. C
ompa
rison
s of o
verw
inte
r sur
viva
l of s
prin
g C
hino
ok sa
lmon
par
r in
rear
ing
area
s ups
tream
(abo
ve sc
rew
trap
) an
d do
wns
tream
(bel
ow sc
rew
trap
) on
the
uppe
r Gra
nde
Ron
de R
iver
, Cat
herin
e C
reek
and
the
Lost
ine
Riv
er.
Early
mig
rant
life
hi
stor
y co
rres
pond
s to
over
win
terin
g do
wns
tream
; lat
e m
igra
nt li
fe h
isto
ry c
orre
spon
ds to
ove
rwin
terin
g up
stre
am.
Scre
w tr
aps
oper
ated
in th
e sa
me
loca
tion
in e
ach
stud
y st
ream
with
the
exce
ptio
n of
the
uppe
r Gra
nde
Ron
de R
iver
trap
whi
ch o
pera
ted
at rk
m
299
in a
ll ye
ars b
ut M
Y 1
995
whe
n it
was
loca
ted
at rk
m 2
57.
Each
P-v
alue
was
bas
ed o
n th
e m
axim
um li
kelih
ood
ratio
test
co
mpa
ring
the
fit o
f the
nul
l mod
el (f
all t
ag g
roup
surv
ival
= w
inte
r tag
gro
up su
rviv
al) t
o th
e fit
of t
he fu
ll m
odel
(fal
l tag
gro
up
surv
ival
≠ w
inte
r tag
gro
up su
rviv
al).
76
Upp
er G
rand
e R
onde
Riv
er
C
athe
rine
Cre
ek
Lo
stin
e R
iver
MY
A
rea/
life
hist
ory
with
hi
gher
ove
rwin
ter s
urvi
val
P-va
lue
Are
a/lif
e hi
stor
y w
ith
high
er o
verw
inte
r sur
viva
l P-
valu
e A
rea/
life
hist
ory
with
hi
gher
ove
rwin
ter s
urvi
val
P-va
lue
1994
Eq
uiva
lent
0.
331
—
—
—
—
1995
D
owns
tream
/fall
mig
rant
s 0.
020
Equi
vale
nt
0.27
8 —
—
19
96
—
—
Equi
vale
nt
0.76
6 —
—
19
97
—
—
Dow
nstre
am/fa
ll m
igra
nts
0.01
6 Eq
uiva
lent
0.
133
1998
D
owns
tream
/fall
mig
rant
s <0
.001
Eq
uiva
lent
0.
289
Dow
nstre
am/fa
ll m
igra
nts
0.01
4 19
99
Dow
nstre
am/fa
ll m
igra
nts
0.00
2 U
pstre
am/s
prin
g m
igra
nts
0.02
5 D
owns
tream
/fall
mig
rant
s 0.
014
2000
D
owns
tream
/fall
mig
rant
s <0
.001
D
owns
tream
/fall
mig
rant
s 0.
031
Equi
vale
nt
0.21
1 20
01
—
—
Dow
nstre
am/fa
ll m
igra
nts
0.00
9 Eq
uiva
lent
0.
090
2002
—
—
Eq
uiva
lent
0.
403
Equi
vale
nt
0.35
0 20
03
—
—
Equi
vale
nt
0.28
3 Eq
uiva
lent
0.
263
2004
U
pstre
am/s
prin
g m
igra
nts
0.00
1 U
pstre
am/s
prin
g m
igra
nts
0.02
6 —
—
20
05
Ups
tream
/spr
ing
mig
rant
s 0.
030
Equi
vale
nt
0.73
3 D
owns
tream
/fall
mig
rant
s 0.
021
2006
Eq
uiva
lent
0.
070
Equi
vale
nt
0.06
1 Eq
uiva
lent
0.
144
2007
D
owns
tream
/fall
mig
rant
s 0.
012
Dow
nstre
am/fa
ll m
igra
nts
<0.0
01
Equi
vale
nt
0.11
5

APPENDIX B
A Compilation of Steelhead Data
77
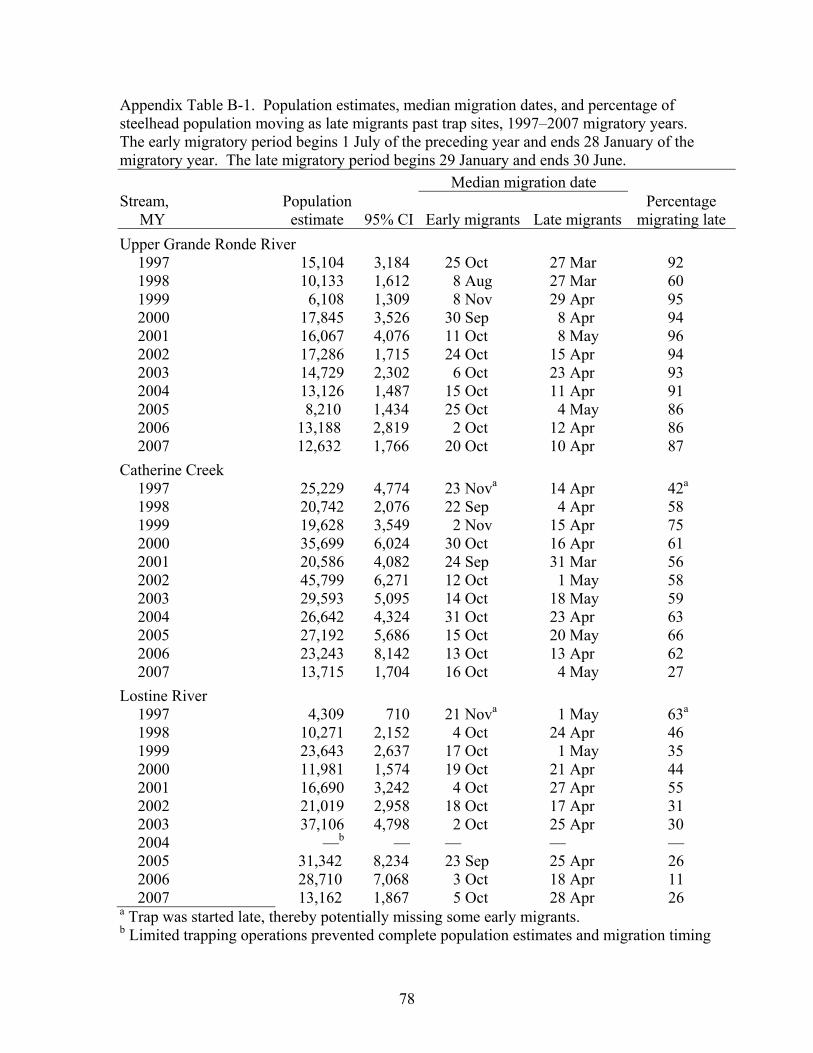
Appendix Table B-1. Population estimates, median migration dates, and percentage of steelhead population moving as late migrants past trap sites, 1997–2007 migratory years. The early migratory period begins 1 July of the preceding year and ends 28 January of the migratory year. The late migratory period begins 29 January and ends 30 June. Median migration date Stream, MY
Population estimate 95% CI Early migrants Late migrants
Percentage migrating late
Upper Grande Ronde River 1997 15,104 3,184 25 Oct 27 Mar 92 1998 10,133 1,612 8 Aug 27 Mar 60 1999 6,108 1,309 8 Nov 29 Apr 95 2000 17,845 3,526 30 Sep 8 Apr 94 2001 16,067 4,076 11 Oct 8 May 96 2002 17,286 1,715 24 Oct 15 Apr 94 2003 14,729 2,302 6 Oct 23 Apr 93 2004 13,126 1,487 15 Oct 11 Apr 91 2005 8,210 1,434 25 Oct 4 May 86 2006 13,188 2,819 2 Oct 12 Apr 86 2007 12,632 1,766 20 Oct 10 Apr 87
Catherine Creek 1997 25,229 4,774 23 Nova 14 Apr 42a 1998 20,742 2,076 22 Sep 4 Apr 58 1999 19,628 3,549 2 Nov 15 Apr 75 2000 35,699 6,024 30 Oct 16 Apr 61 2001 20,586 4,082 24 Sep 31 Mar 56 2002 45,799 6,271 12 Oct 1 May 58 2003 29,593 5,095 14 Oct 18 May 59 2004 26,642 4,324 31 Oct 23 Apr 63 2005 27,192 5,686 15 Oct 20 May 66 2006 23,243 8,142 13 Oct 13 Apr 62 2007 13,715 1,704 16 Oct 4 May 27
Lostine River 1997 4,309 710 21 Nova 1 May 63a 1998 10,271 2,152 4 Oct 24 Apr 46 1999 23,643 2,637 17 Oct 1 May 35 2000 11,981 1,574 19 Oct 21 Apr 44 2001 16,690 3,242 4 Oct 27 Apr 55 2002 21,019 2,958 18 Oct 17 Apr 31 2003 37,106 4,798 2 Oct 25 Apr 30 2004 —b — — — — 2005 31,342 8,234 23 Sep 25 Apr 26 2006 28,710 7,068 3 Oct 18 Apr 11 2007 13,162 1,867 5 Oct 28 Apr 26
a Trap was started late, thereby potentially missing some early migrants. b Limited trapping operations prevented complete population estimates and migration timing
78

Appendix Table B-1. Continued.
Median migration date Stream, MY
Population estimate 95% CI Early migrants Late migrants
Percentage migrating late
Minam River 2001 28,113 10,537 3 Octa 28 Apr 86a 2002 44,872 19,786 24 Octa 25 Apr 82a 2003 43,743 20,680 10 Nova 1 May 99a 2004 24,846 13,564 29 Oct 28 Apr 97 2005 105,853 75,607 16 Sep 18 Apr 94 2006 103,141 62,607 2 Oct 22 Apr 78 2007 11,831 3,330 1 Oct 30 Apr 72
79
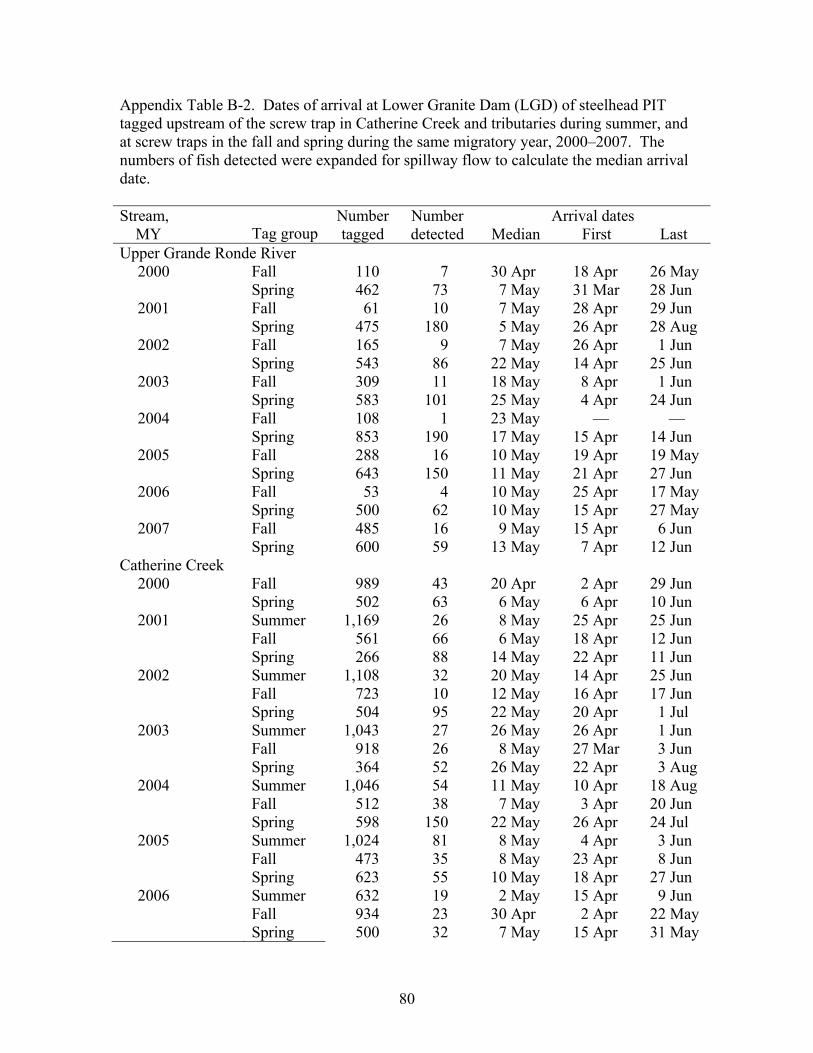
Appendix Table B-2. Dates of arrival at Lower Granite Dam (LGD) of steelhead PIT tagged upstream of the screw trap in Catherine Creek and tributaries during summer, and at screw traps in the fall and spring during the same migratory year, 2000–2007. The numbers of fish detected were expanded for spillway flow to calculate the median arrival date.
Arrival dates Stream, MY Tag group
Number tagged
Number detected Median First Last
Upper Grande Ronde River 2000 Fall 110 7 30 Apr 18 Apr 26 May Spring 462 73 7 May 31 Mar 28 Jun 2001 Fall 61 10 7 May 28 Apr 29 Jun Spring 475 180 5 May 26 Apr 28 Aug 2002 Fall 165 9 7 May 26 Apr 1 Jun Spring 543 86 22 May 14 Apr 25 Jun 2003 Fall 309 11 18 May 8 Apr 1 Jun Spring 583 101 25 May 4 Apr 24 Jun 2004 Fall 108 1 23 May — — Spring 853 190 17 May 15 Apr 14 Jun 2005 Fall 288 16 10 May 19 Apr 19 May Spring 643 150 11 May 21 Apr 27 Jun 2006 Fall 53 4 10 May 25 Apr 17 May Spring 500 62 10 May 15 Apr 27 May 2007 Fall 485 16 9 May 15 Apr 6 Jun Spring 600 59 13 May 7 Apr 12 Jun
Catherine Creek 2000 Fall 989 43 20 Apr 2 Apr 29 Jun Spring 502 63 6 May 6 Apr 10 Jun 2001 Summer 1,169 26 8 May 25 Apr 25 Jun Fall 561 66 6 May 18 Apr 12 Jun Spring 266 88 14 May 22 Apr 11 Jun 2002 Summer 1,108 32 20 May 14 Apr 25 Jun Fall 723 10 12 May 16 Apr 17 Jun Spring 504 95 22 May 20 Apr 1 Jul 2003 Summer 1,043 27 26 May 26 Apr 1 Jun Fall 918 26 8 May 27 Mar 3 Jun Spring 364 52 26 May 22 Apr 3 Aug 2004 Summer 1,046 54 11 May 10 Apr 18 Aug Fall 512 38 7 May 3 Apr 20 Jun Spring 598 150 22 May 26 Apr 24 Jul 2005 Summer 1,024 81 8 May 4 Apr 3 Jun Fall 473 35 8 May 23 Apr 8 Jun Spring 623 55 10 May 18 Apr 27 Jun 2006 Summer 632 19 2 May 15 Apr 9 Jun Fall 934 23 30 Apr 2 Apr 22 May Spring 500 32 7 May 15 Apr 31 May
80
Appendix Table B-2. Continued.
Arrival dates Stream, MY Tag group
Number tagged
Number detected Median First Last
Catherine Creek cont. 2007 Summer 609 3 12 May 2 May 13 May
Fall 859 21 5 May 2 Apr 9 Jun Spring 370 15 9 May 4 May 3 Jun Lostine River
2000 Fall 777 116 10 May 26 Mar 16 Jun Spring 532 166 6 May 13 Apr 13 Jun 2001 Fall 421 13 12 May 16 Apr 13 Jun Spring 345 164 14 May 13 Apr 18 Aug 2002 Fall 837 40 8 May 10 Apr 24 Jun Spring 351 72 23 May 19 Apr 30 Jun 2003 Fall 999 48 26 May 25 Mar 22 Jun Spring 451 116 26 May 3 Apr 15 Jun 2004 Falla — — — — — Springa — — — — — 2005 Fall 760 73 10 May 2 Apr 18 Jun Spring 232 52 9 May 10 Apr 20 May 2006 Fall 827 21 19 May 6 Apr 8 Jun Spring 270 23 1 May 18 Apr 22 May 2007 Fall 1,000 46 13 May 27 Apr 10 Jun Spring 273 16 10 May 18 Apr 16 May
Minam River 2001 Fall 32 6 9 May 2 May 17 May Spring 454 240 7 May 26 Apr 29 Aug 2002 Fall 262 5 11 May 17 Apr 31 May Spring 197 48 20 May 16 Apr 2 Jun 2003 Fall 42 6 13 Apr 2 Apr 27 May Spring 503 129 21 May 2 Apr 6 Jun 2004 Fall 60 2 24 May 23 May 1 Jun Spring 217 52 11 May 28 Apr 25 Jun 2005 Fall 79 7 8 May 1 May 10 May Spring 333 67 10 May 7 Apr 18 Jun 2006 Fall 81 5 28 Apr 18 Apr 6 May Spring 437 64 2 May 8 Apr 3 Jun 2007 Fall 107 2 14 May 12 May 16 May Spring 293 29 7 May 3 May 7 Jun
a Limited trapping operations during MY 2004.
81

Appendix Table B-3. Survival probabilities to Lower Granite Dam for steelhead PIT tagged in the upper rearing areas of Catherine Creek in summer and at screw traps during fall and spring. Number detected Cumulative survival probabilityTag group, Stream
MY tagged
Number tagged MY
MY + 1
MY + 2 Probability (95% CI)
Summer Catherine Creek 2001 410 22 7 0 0.081 (0.055–0.118) 2002 837 65 9 0 0.119 (0.088–0.171) 2003 510 23 7 0 0.061 (0.042–0.086) 2004 527 42 18 0 0.117 (0.090–0.148) 2005 704 58 3 0 0.083 (0.064–0.105) 2006 418 40 1 — 0.142 (0.093–0.261) 2007 334 10 — — 0.072 (0.024–0.992) Little Catherine Creek 2001 415 0 3 0 0.010 (0.002–0.097) 2007 275 1 — — (a) Middle Fork Catherine Creek 2006 214 1 0 — (a) Milk Creek 2003 532 27 3 0 0.068 (0.045–0.106) North Fork Catherine Creek 2001 117 2 1 1 0.034 (SE = 0.017) 2002 270 8 2 1 0.051 (0.026–0.111) 2005 320 14 6 0 0.068 (0.041–0.115) South Fork Catherine Creek 2001 225 5 4 0 0.041 (0.020–0.074) 2004 519 20 10 1 0.057 (SE = 0.010) Catherine Creek and tribs combined 2001 1,167 29 15 1 0.043 (0.032–0.058) 2002 1,107 73 11 1 0.102 (0.078–0.140) 2003 1,042 50 10 0 0.063 (0.048–0.082) 2004 1,046 62 28 1 0.087 (0.071–0.106) 2005 1,024 72 9 0 0.077 (0.062–0.096) 2006 632 41 1 — 0.097 (0.063–0.179)
2007 609 11 — — 0.045 (0.015–0.062) Fall
Upper Grande Ronde River 2000 110 16 0 0 0.227 (0.118–0.650) 2001 61 12 0 0 0.223 (0.122–0.398) 2002 165 21 1 0 0.196 (0.115–0.411) 2003 309 17 1 0 0.078 (0.043–0.245)
a Data was insufficient to calculate a survival probability.
82

Appendix Table B-3. Continued. Number detected Cumulative survival probabilityTag group, Stream
MY tagged
Number tagged MY
MY + 1
MY + 2 Probability (95% CI)
Fall cont. Upper Grande Ronde cont. 2004 108 1 1 0 0.019 (SE = 0.013) 2005 288 20 2 0 0.079 (0.051–0.117) 2006 53 5 5 — 0.094 (SE = 0.040) 2007 485 34 — — 0.121 (0.065–0.488) Catherine Creek 2000 989 73 14 0 0.108 (0.085–0.136) 2001 561 67 0 0 0.120 (0.095–0.149) 2002 723 30 4 0 0.081 (0.049–0.165) 2003 915 56 11 1 0.086 (0.064–0.118) 2004 512 54 6 0 0.139 (0.105–0.189) 2005 473 44 2 0 0.095 (0.070–0.127) 2006 934 61 12 — 0.094 (0.071–0.133) 2007 859 59 — — 0.084 (0.059–0.155) Lostine River 2000 777 157 11 0 0.271 (0.231–0.320) 2001 421 17 18 0 0.098 (0.068–0.141) 2002 837 106 19 0 0.178 (0.145–0.221) 2003 998 100 31 0 0.141 (0.118–0.167) 2005 760 108 27 0 0.189 (0.159–0.223) 2006 827 59 15 — 0.106 (0.080–0.150) 2007 1,000 96 — — 0.160 (0.110–0.279) Minam River 2001 32 7 2 0 0.294 (0.152–0.485) 2002 262 11 10 0 0.172 (0.084–0.558) 2003 42 8 1 0 0.238 (0.105–1.663) 2004 60 3 2 0 (a) 2005 79 10 1 0 0.139 (SE = 0.039) 2006 81 7 1 — 0.099 (SE = 0.033) 2007 107 10 — — (a)
Spring (FL ≥ 115 mm) Upper Grande Ronde River 2000 324 99 1 0 0.394 (0.329–0.487) 2001 465 196 5 0 0.467 (0.417–0.521) 2002 543 192 1 0 0.445 (0.383–0.523) 2003 578 205 3 0 0.455 (0.391–0.540) 2004 853 223 2 0 0.496 (0.447–0.546) 2005 371 186 2 0 0.554 (0.492–0.627)
83

Appendix Table B-3. Continued. Number detected Cumulative survival probabilityTag group, Stream
MY tagged
Number tagged MY
MY + 1
MY + 2 Probability (95% CI)
Spring (FL ≥ 115 mm) cont. Upper Grande Ronde cont. 2006 342 168 2 — 0.522 (0.454–0.629) 2007 464 119 — — 0.315 (0.246–0.453) Catherine Creek 2000 305 103 2 0 0.480 (0.388–0.608) 2001 248 96 2 0 0.404 (0.342–0.468) 2002 504 212 2 0 0.522 (0.453–0.608) 2003 359 108 2 0 0.365 (0.295–0.479) 2004 411 187 1 0 0.476 (0.425–0.528) 2005 181 69 2 0 0.457 (0.359–0.615) 2006 222 96 0 — 0.538 (0.418–0.789) 2007 169 26 — — 0.179 (0.108–0.546) Lostine River 2000 442 234 4 0 0.640 (0.576–0.711) 2001 323 182 16 0 0.643 (0.585–0.700) 2002 351 171 6 0 0.657 (0.565–0.778) 2003 447 269 4 0 0.719 (0.646–0.811) 2005 90 56 1 1 0.661 (0.551–0.788) 2006 89 57 0 — 0.629 (SE= 0.051) 2007 101 35 — — (a) Minam River 2001 442 269 8 0 0.654 (0.605–0.702) 2002 197 108 1 0 0.744 (0.612–0.939) 2003 500 272 0 0 0.664 (0.591–0.756) 2004 120 68 2 0 0.607 (0.508–0.712) 2005 161 91 3 0 0.582 (0.501–0.663) 2006 274 168 1 — 0.664 (0.585–0.798) 2007 178 68 — — 0.684 (0.432–1.638)
Spring (FL < 115 mm) Upper Grande Ronde River 2000 129 0 5 0 0.039 (0.000–0.314) 2001 7 0 0 0 (a) 2002 17 2 1 0 0.176 (SE= 0.092) 2003 5 0 0 0 (a) 2004 378 5 29 1 0.097 (0.069–0.136) 2005 272 0 9 2 0.041 (SE= 0.012) 2006 157 2 9 — 0.087 (0.043–0.210) 2007 136 0 — — (a)
84

Appendix Table B-3. Continued. Number detected Cumulative survival probabilityTag group, Stream
MY tagged
Number tagged MY
MY + 1
MY + 2 Probability (95% CI)
Spring (FL < 115 mm) cont. Catherine Creek 2000 189 0 10 1 0.060 (0.032–0.103) 2001 19 1 2 0 (a) 2002 6 0 0 0 (a) 2003 4 1 0 0 (a) 2004 187 5 17 0 0.124 (0.080–0.187) 2005 442 1 22 0 0.063 (0.039–0.114) 2006 278 3 8 — 0.061 (0.023–0.718) 2007 201 0 — — (a) Lostine River 2000 84 0 9 0 0.109 (0.054–0.188) 2001 21 1 1 0 (a) 2002 0 0 0 0 (a) 2003 1 0 0 0 (a) 2005 142 0 24 1 0.170 (SE= 0.032) 2006 89 1 16 — 0.162 (0.082–0.483) 2007 172 0 — — (a) Minam River 2001 9 0 0 0 (a) 2002 1 0 0 0 (a) 2003 0 0 0 0 (a) 2004 97 0 9 1 0.094 (SE= 0.030) 2005 172 0 10 0 0.053 (SE= 0.017) 2006 274 0 7 — 0.074 (0.022–0.957) 2007 115 0 — — (a)
a Data was insufficient to calculate a survival probability.
85

Appendix Table B-4. Fork lengths of steelhead at the time they were PIT-tagged at screw traps on Catherine Creek and the upper Grande Ronde, Lostine, and Minam rivers during the early migration period 1999–2006, summarized by dam detection history.
Length at tagging (mm) Percentile Stream,
Year tagged Year
detected N Median Min 25th 75th Max Upper Grande Ronde River
1999 (a) 108 133 71 122 148 205 2000 (a) 60 124 86 101 145 180 2001 12 152 115 134 161 180 2001 (a) 165 115 62 80 130 193 2002 21 130 110 120 150 163 2003 1 111 — — — — 2002 (a) 309 111 63 76 131 200 2003 17 133 120 125 140 155 2004 1 77 — — — — 2003 (a) 108 77 61 70.5 110 160 2004 1 113 — — — — 2005 1 70 — — — — 2004 (a) 288 114 62 90 125 179
2005 20 127 101 118 137 159 2006 2 81 72 77 86 90
2005 (a) 53 113 63 73 128 190 2006 5 136 110 127 176 190
2006 (a) 478 112 54 87 123 190 2007 33 131 99 119 140 180 Catherine Creek
1999 (a) 986 101 60 76 142 200 2000 73 148 67 133 162 195 2001 14 77 61 73 86 118 2000 (a) 561 136 76 124 150 204 2001 67 139 102 126 152 195 2001 (a) 723 85 62 75 124 193 2002 30 128 78 91 136 170 2003 4 71 62 67 75 75 2002 (a) 918 111 60 81 141 245 2003 56 143 99 133 154 177 2004 13 74 65 71 83 167 2003 (a) 512 117 59 85 133 240 2004 54 131 81 118 146 185 2005 6 77 65 71 82 118 2004 (a) 473 124 58 81 140 191 2005 44 136 85 123 152 189 2006 2 81 75 78 84 87
a Data represents all the early migrants tagged, regardless of detection history.
86

Appendix Table B-4. Continued.
Length at tagging (mm) Percentile Stream,
Year tagged Year
detected N Median Min 25th 75th Max Catherine Creek (cont.)
2005 (a) 934 91 55 77 134 246 2006 61 140 82 127 154 208 2007 12 78 69 71 79 94 2006 (a) 856 135 60 118 153 331
2007 58 144 81 127 160 227 Lostine River
1999 (a) 773 153 66 140 168 286 2000 157 157 121 144 170 259 2001 11 105 79 85 119 141 2000 (a) 421 80 61 73 91 235 2001 17 161 95 146 178 212 2002 18 86 65 80 89 106 2001 (a) 824 100 60 85 155 262
2002 105 155 87 140 169 205 2003 19 82 68 78 94 161
2002 (a) 999 93 62 73 155 348 2003 98 152 68 136 175 263 2004 33 75 66 70 84 263
2003 (b) — — — — — — 2004 (a) 758 92 57 77 148 246 2005 108 148 73 135 166 205 2006 27 77 62 71 85 101 2005 (a) 827 83 59 72 140 298 2006 59 155 82 138 165 188
2007 15 75 62 71 78 101 2006 (a) 1000 132 55 84 150 278
2007 96 143 103 133 161 236 Minam River
2000 (a) 32 122 58 69 153 218 2001 7 147 114 126 155 183 2002 2 68 63 65 70 72 2001 (a) 262 66 55 61 117 318 2002 11 132 120 124 147 185 2003 10 65 60 63 68 85 2002 (a) 42 104 65 72 146 199 2003 8 161 133 135 169 185
b No early migrants were tagged in the Lostine River because the trap was not operated.
87
Appendix Table B-4. Continued.
Length at tagging (mm) Percentile Stream,
Year tagged Year
detected N Median Min 25th 75th Max Minam River (cont.)
2003 (a) 60 106 60 67 133 206 2004 3 118 115 115 118 118 2005 2 68 65 66 69 70 2004 (a) 79 73 59 65 161 226 2005 10 167 73 147 173 210 2006 1 67 — — — — 2005 (a) 81 71 58 64 153 218 2006 7 161 119 143 178 209 2007 1 61 — — — — 2006 (a) 107 112 59 67 134 230 2007 10 131 122 128 134 153
88

Appendix Table B-5. Fork lengths of steelhead at the time they were PIT-tagged at screw traps on Catherine Creek and the upper Grande Ronde, Lostine, and Minam rivers during the late migration period 2000–2007, summarized by dam detection history.
Length at tagging (mm) Percentile Stream,
Year tagged Year
detected N Median Min 25th 75th Max Upper Grande Ronde River
2000 (a) 453 133 71 108 152 225 2000 99 155 115 139 166 208 2001 6 80 72 77 109 126 2001 (a) 465 147 115 135 163 219 2001 196 156 115 145 171 207 2002 5 143 121 127 150 152 2002 (a) 543 150 115 135 164 216 2002 192 155 115 144 170 209 2003 1 159 — — — — 2003 (a) 578 150 115 136 164 199 2003 204 158 115 142 169 199 2004 4 130 117 119 168 197 2004 (a) 853 123 60 82 147 204 2004 228 148 98 135 167 202 2005 31 81 64 74 98 123 2005 (a) 642 130 65 91 152 208 2005 186 150 117 141 164 197 2006 11 89 69 81 95 140 2007 2 82 70 76 88 94 2006 (a) 500 132 62 94 150 276 2006 170 150 111 135 166 203
2007 10 91 65 76 105 124 2007 (a) 600 142 65 118 157 230
2007 119 157 121 146 168 230 Catherine Creek
2000 (a) 494 132 61 86 150 210 2000 103 152 120 143 167 210 2001 12 79 70 73 104 125 2002 1 87 — — — — 2001 (a) 247 142 115 131 154 190 2001 96 150 115 138 161 190 2002 2 120 115 117 122 124 2002 (a) 503 152 115 139 164 260 2002 212 156 115 144 166 208 2003 2 126 123 124 127 128
a Data represents all the late migrants tagged, regardless of detection history.
89
Appendix Table B-5. Continued.
Length at tagging (mm) Percentile Stream,
Year tagged Year
detected N Median Min 25th 75th Max Catherine Creek (cont.)
2003 (a) 360 145 115 132 156 203 2003 107 150 118 137 161 201 2004 2 122 122 122 122 122 2004 (a) 598 135 62 102 152 202 2004 192 148 94 135 160 202 2005 18 77 63 72 82 130 2005 (a) 623 93 60 82 123 195 2005 70 155 109 139 172 195 2006 24 87 65 77 101 127 2006 (a) 500 98 60 81 146 203 2006 99 151 87 138 163 199
2007 8 83 80 82 87 105 2007 (a) 370 111 61 91 147 222
2007 26 153 118 143 164 181 Lostine River
2000 (a) 526 160 66 145 175 329 2000 234 168 123 157 179 236 2001 13 89 66 80 128 158 2001 (a) 323 163 115 148 180 292
2001 182 172 121 157 185 292 2002 16 141 115 121 156 160
2002 (a) 351 158 115 141 178 326 2002 171 163 115 152 180 244 2003 6 127 122 122 131 138
2003 (a) 447 162 115 150 174 289 2003 267 163 132 152 175 208 2004 4 125 115 117.5 141 152 2004 (a) 416 115 61 86 153 215 2004 122 163 105 148 180 215 2005 24 87 73 81 104 130 2005 (a) 232 99 64 83 156 226 2005 56 178 141 160 188 226 2006 25 84 69 80 97 133 2006 (a) 270 89 61 76 149 243 2006 58 169 106 157 183 243
2007 16 79 65 73 89 94 2007 (a) 281 94 60 81 142 292
2007 35 167 130 154 182 210
90

Appendix Table B-5. Continued.
Length at tagging (mm) Percentile Stream,
Year tagged Year
detected N Median Min 25th 75th Max Minam River
2001 (a) 442 160 115 144 177 227 2001 269 167 124 151 183 227 2002 8 136 118 125 151 169 2002 (a) 197 158 115 147 179 219 2002 108 164 119 151 185 219 2003 1 135 — — — — 2003 (a) 500 164 116 152 178 224 2003 271 165 127 153 178 218 2004 1 194 — — — — 2004 (a) 217 133 59 86 168 239 2004 68 169 117 154 180 239 2005 11 102 71 82 106 122 2005 (a) 332 110 62 76 160 288 2005 91 163 127 149 180 215 2006 13 76 69 74 111 142 2006 (a) 437 141 58 79 165 218 2006 168 164 115 149 180 213 2007 8 76 67 71 87 139 2007 (a) 293 144 63 87 172 220 2007 68 174 118 160 187 201
91
Appendix Table B-6. Fork lengths of steelhead at the time they were PIT-tagged in rearing areas upstream of the screw trap on Catherine Creek and its tributaries during summer 2000–2006, summarized by migration history.
Length at tagging (mm) Percentile Tag group,
Migration history N Median Min 25th 75th Max Summer 2000
All PIT tagged 1,163 113 59 90 137 263 Captured in trap Fall 2000 22 124 83 113 135 152 Captured in trap Spring 2001 5 125 88 106 141 142 Migrated past trap during MY 2001 50 127 83 113 139 170 Migrated past trap during MY 2002 6 93 63 92 101 136 Migrated past trap during MY 2003 0 — — — — — Still upstream after MY 2001 12 92 63 84 106 136 Still upstream after MY 2002 1 92 — — — — Still upstream after MY 2003 0 — — — — — Detected at dams during MY 2001 29 130 85 114 143 170 Detected at dams during MY 2002 15 92 72 78 103 133 Detected at dams during MY 2003 1 83 — — — —
Summer 2001 All PIT tagged 1,108 112 63 97 130 221 Captured in trap Fall 2001 46 117 99 110 126 147 Captured in trap Spring 2002 9 129 97 122 142 168 Migrated past trap MY 2002 118 123 96 112 135 168 Migrated past trap MY 2003 8 94 68 81 108 118 Migrated past trap MY 2004 0 — — — — — Still upstream after MY 2002 14 95 68 86 105 177 Still upstream after MY 2003 1 134 — — — — Still upstream after MY 2004 0 — — — — — Detected at dams during MY 2002 73 128 96 112 137 161 Detected at dams during MY 2003 11 99 82 93 101 118 Detected at dams during MY 2004 1 71 — — — —
Summer 2002 All PIT tagged 1,043 115 73 103 130 230 Captured in trap Fall 2002 46 115 90 108 128 154 Captured in trap Spring 2003 10 115 88 105 128 143 Migrated past trap MY 2003 53 117 88 108 128 153 Migrated past trap MY2004 14 97 75 86 104 111 Migrated past trap MY2005 0 — — — — — Still upstream after spring 2003 3 101 86 94 103 104 Still upstream after spring 2004 0 — — — — — Still upstream after spring 2005 0 — — — — — Detected at dams during 2003 50 121 86 105 134 169 Detected at dams during 2004 10 98 75 86 105 111
92

Appendix Table B-6. Continued.
Length at tagging (mm) Percentile Tag group,
Migration history N Median Min 25th 75th Max Summer 2003
All PIT tagged 1,165 106 58 89 127 229 Captured in trap Fall 2003 16 115 92 104 124 149 Captured in trap Spring 2004 12 123 91 109 131 167 Migrated past trap MY 2004 81 121 78 110 133 171 Migrated past trap MY2005 5 91 78 85 92 96 Migrated past trap MY2006 0 — — — — — Still upstream after spring 2004 4 107 97 101 109 110 Still upstream after spring 2005 0 — — — — — Still upstream after spring 2006 0 — — — — — Detected at dams during 2004 62 123 78 110 137 171 Detected at dams during 2005 28 91 65 81 99 111 Detected at dams during 2006 1 71 — — — —
Summer 2004 All PIT tagged 1,024 127 56 109 146 229 Captured in trap Fall 2004 18 130 111 122 147 172 Captured in trap Spring 2005 3 142 137 140 149 156 Migrated past trap MY 2005 90 139 105 125 155 185 Migrated past trap MY 2006 3 101 78 90 103 104 Migrated past trap MY 2007 0 — — — — — Still upstream after spring 2005 1 179 — — — — Still upstream after spring 2006 1 107 — — — — Still upstream after spring 2007 0 — — — — — Detected at dams during 2005 72 141 105 127 156 185 Detected at dams during 2006 9 103 80 99 108 120 Detected at dams during 2007 0 — — — — —
Summer 2005 All PIT tagged 632 119 55 106 141 279 Captured in trap Fall 2005 10 118 89 114 123 139 Captured in trap Spring 2006 3 115 96 106 118 121 Migrated past trap MY 2006 52 122 89 115 144 186 Migrated past trap MY 2007 1 105 — — — — Still upstream after spring 2006 1 101 — — — — Still upstream after spring 2007 0 — — — — — Detected at dams during 2006 41 126 96 116 149 186 Detected at dams during 2007 1 99 — — — —
93

Appendix Table B-6. Continued.
Length at tagging (mm) Percentile
Tag group,
Migration history N Median Min 25th 75th Max Summer 2006
All PIT tagged 609 109 59 90 129 268 Captured in trap Fall 2006 18 124 95 107 131 167 Captured in trap Spring 2007 3 86 74 80 111 135 Migrated past trap MY 2007 30 124 74 107 134 177 Still upstream after spring 2007 0 — — — — — Detected at dams during 2007 10 130 107 108 136 177
94
Related Documents


