INVESTIGATING INTENSITIES OF VERY HIGH VOLTAGE RISE dv/dt PULSED POWER SOURCE IN ATMOSPHERIC MICROPLASMA Siti Khadijah, Tetsuya Akitsu, Tomohiro Otagawa, Shinsuke Yamazaki, Takeki Sakurai Interdisciplinary Graduate School of Medicine and Engineering, University of Yamanashi, Kofu, Yamanashi, 400-8511, Japan Abstract Micro barrier discharge operating at atmospheric air was excited by a compact pulse generator which has the capability to produce fast rising voltage pulse with maximum rise up voltage as high as 435MV/s. Sequences of images and its intensity values were recorded at 100 nanoseconds intervals as a function of gap distance and applied voltage. Results showed that the discharge intensities are afterglow microplasma. Maximum intensity values were obtained at approximate time for each condition. Uniformity of discharge obtained when gap distance was 600 µm and applied voltage was 6 kV. I. INTRODUCTION Microdischarge devices are characterized by plasma dimensions below 1 mm and operating pressures up to and exceeding 1 atm. There are variety power sources such as AC, DC, RF and pulse power supply to create microdischarges. In this paper we investigated microdischarges properties generated by high voltage rise pulse power. Applications to this configuration include plasma cleaning, plasma assisted chemical reactions, surface coatings and surface functionalization. In a microdischarge, plasma size is reduced based on the Paschen law. According to Paschen law the product pressure p times distance d between electrodes is constant. To keep the breakdown voltage as small as possible the pressure p has to be increased as the distance d of the discharge shrinks in order. Therefore, scaling down of d to micrometer sizes, requires the increasing of p to megapascals orders. [1-5] Among the most attractive features of microplasmas are the micro scale provides additional freedom in the usage; a microplasma can be used in a single unit or a group of microplasmas can be used in an integrated arrays of a few micrometers to a few centimeters. Furthermore, the smaller scale also means the decrease in energy and gas consumption. In general, a plasma has reactive, radiative, conductive and dielectric properties inherently. These properties are combined with the characteristics of microplasmas promising a variety of possibilities for the application of microplasmas leading to the creation of a new scientific and technological world of microplasmas. [1] The development of microplasmas represents a great interest because of their miniaturization enabling a wide range of applications (spectrometric analysis, gas treatment, surface treatment, sterilization, coatings). [6-8] The practical handling of atmospheric pressure plasma offers attractive advantages in comparison to low pressure plasma. Furthermore its design simplicity and low operational cost appeals to the manufacturing industry. Microplasma can be created in various forms, such as direct current, microwave induced, capacitively coupled and inductively coupled plasmas. Depending on the design, microdischarges can work either with continuous mode or pulsed mode. A pulsed working mode enables the injection of large energy amounts in the discharge while the system warming up is limited. On the other hand, a pulsed power supply is technically more complex than a DC source. A pulse generator consists of high voltage generator, energy storage system, switch, pulse formation and transmission. There are two types of energy storage systems namely, capacitive energy storage system and inductive energy storage system. Inductive energy system offers energy density 100 times larger than the capacitive type. A conventional inductive type pulse generator uses Thyristors, GTO Thyristors, MOSFETs or IGBTs for its switching mechanism. However these switches are slow and unsuitable for short pulses of high current and high voltage supply. The invention of Induction Energy Storage (IES) circuit using Static Induction Thyristor (SI-Thy) has made it possible to generate high voltage rise-up pulsed rate pulses. [9-10] In this experiment, microdischarge was generated by IES pulse generator. The generator is a compact 1-4244-0914-4/07/$25.00 ©2007 IEEE. 179

Welcome message from author
This document is posted to help you gain knowledge. Please leave a comment to let me know what you think about it! Share it to your friends and learn new things together.
Transcript
INVESTIGATING INTENSITIES OF VERY HIGH VOLTAGE RISE dv/dt PULSED POWER SOURCE IN ATMOSPHERIC MICROPLASMA
Siti Khadijah, Tetsuya Akitsu, Tomohiro Otagawa, Shinsuke Yamazaki, Takeki Sakurai
Interdisciplinary Graduate School of Medicine and Engineering, University of Yamanashi, Kofu, Yamanashi, 400-8511, Japan
Abstract Micro barrier discharge operating at atmospheric air was excited by a compact pulse generator which has the capability to produce fast rising voltage pulse with maximum rise up voltage as high as 435MV/s. Sequences of images and its intensity values were recorded at 100 nanoseconds intervals as a function of gap distance and applied voltage. Results showed that the discharge intensities are afterglow microplasma. Maximum intensity values were obtained at approximate time for each condition. Uniformity of discharge obtained when gap distance was 600 µm and applied voltage was 6 kV.
I. INTRODUCTION
Microdischarge devices are characterized by plasma dimensions below 1 mm and operating pressures up to and exceeding 1 atm. There are variety power sources such as AC, DC, RF and pulse power supply to create microdischarges. In this paper we investigated microdischarges properties generated by high voltage rise pulse power. Applications to this configuration include plasma cleaning, plasma assisted chemical reactions, surface coatings and surface functionalization. In a microdischarge, plasma size is reduced based on the Paschen law. According to Paschen law the product pressure p times distance d between electrodes is constant. To keep the breakdown voltage as small as possible the pressure p has to be increased as the distance d of the discharge shrinks in order. Therefore, scaling down of d to micrometer sizes, requires the increasing of p to megapascals orders. [1-5] Among the most attractive features of microplasmas are the micro scale provides additional freedom in the usage; a microplasma can be used in a single unit or a group of microplasmas can be used in an integrated arrays of a few micrometers to a few centimeters. Furthermore, the smaller scale also means the decrease in energy and
gas consumption. In general, a plasma has reactive, radiative, conductive and dielectric properties inherently. These properties are combined with the characteristics of microplasmas promising a variety of possibilities for the application of microplasmas leading to the creation of a new scientific and technological world of microplasmas. [1] The development of microplasmas represents a great interest because of their miniaturization enabling a wide range of applications (spectrometric analysis, gas treatment, surface treatment, sterilization, coatings). [6-8] The practical handling of atmospheric pressure plasma offers attractive advantages in comparison to low pressure plasma. Furthermore its design simplicity and low operational cost appeals to the manufacturing industry. Microplasma can be created in various forms, such as direct current, microwave induced, capacitively coupled and inductively coupled plasmas. Depending on the design, microdischarges can work either with continuous mode or pulsed mode. A pulsed working mode enables the injection of large energy amounts in the discharge while the system warming up is limited. On the other hand, a pulsed power supply is technically more complex than a DC source. A pulse generator consists of high voltage generator, energy storage system, switch, pulse formation and transmission. There are two types of energy storage systems namely, capacitive energy storage system and inductive energy storage system. Inductive energy system offers energy density 100 times larger than the capacitive type. A conventional inductive type pulse generator uses Thyristors, GTO Thyristors, MOSFETs or IGBTs for its switching mechanism. However these switches are slow and unsuitable for short pulses of high current and high voltage supply. The invention of Induction Energy Storage (IES) circuit using Static Induction Thyristor (SI-Thy) has made it possible to generate high voltage rise-up pulsed rate pulses. [9-10] In this experiment, microdischarge was generated by IES pulse generator. The generator is a compact
1-4244-0914-4/07/$25.00 ©2007 IEEE. 179
pulse power supply which can generate repetitive, positively polarized voltage trains pulse signal, has fast switching mechanism have and fast high voltage rise pulse power. In this experiment we generated microplasma discharge at 1 atm using DBD configuration and air as its working gas. Pulse power generated pulse signal with pulse width of 400ns, providing 30mJ of energy per pulse at frequency of 2 kHz.
II. EXPERIMENT
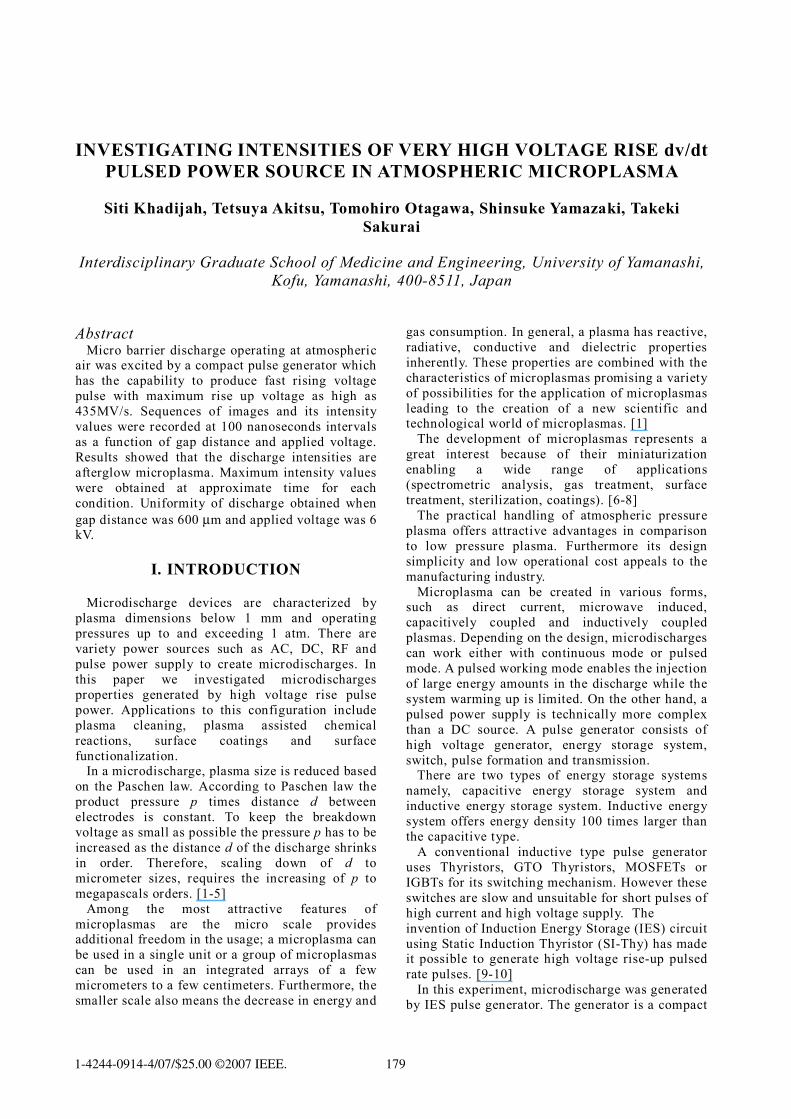
The micro barrier discharge device configuration consists of plane-parallel electrodes. The anode is transparent indium tin oxide (ITO) which is deposited on to a glass plate and cathode is of stainless steel sheet (SUS) of 200 µm thickness. The 1 mm glass plate works as the dielectric barrier. Spacers are for varying the gap distance, between the two electrodes which is approximately 600 µm and 1050 µm. The high voltage power supply (6 or 8 kV) generated are series of pulses with a width of 100 ns and a frequency in the range of 2 kHz. Experiments were conducted by varying gap distance g and supplied voltage v. Fig. 1 (a) shows the side view of the microdischarge apparatus. It consists of inductive energy storage type pulse power supply and micro dielectric barrier discharge. Microplasma images were taken using an intensified CCD camera at 10 µs and 100 ns intervals. The 10 µs interval was for determining the exact frames to be studied and 100 ns interval was for uniformity evaluation. Images were divided to 512 pixels each horizontally and vertically. The physical dimension of a pixel is approximately 85 µm. Images of discharges were produced at an area of 11x12 mm. Intensity values at each pixel in this area were recorded. Experiments were conducted at three conditions; (i) 600 µm gap distance and 6 kV voltage; (ii) 1050 µm gap distance and 6 kV voltage; and (iii) 1050 µm gap distance and 8 kV voltage. Relation between time, intensities and uniformity properties of discharges were studied.
III. RESULTS AND DISCUSSION
To study the images, we must first determine the time microplasma starts to glow. A series of images were taken to predict the location of frames to be studied. The gap distance was 600 µm and 6 kV was supplied to the device.
Figure 1. Microdischarge apparatus
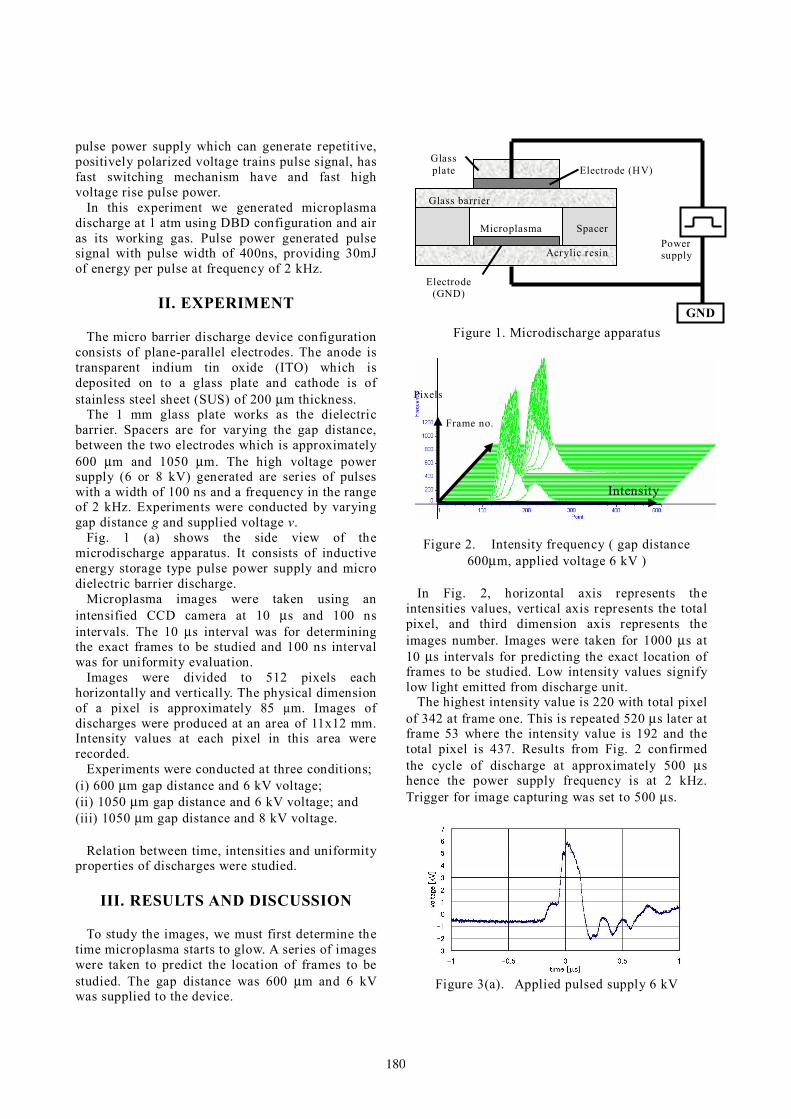
Figure 2. Intensity frequency ( gap distance 600µm, applied voltage 6 kV )
In Fig. 2, horizontal axis represents the intensities values, vertical axis represents the total pixel, and third dimension axis represents the images number. Images were taken for 1000 µs at 10 µs intervals for predicting the exact location of frames to be studied. Low intensity values signify low light emitted from discharge unit. The highest intensity value is 220 with total pixel of 342 at frame one. This is repeated 520 µs later at frame 53 where the intensity value is 192 and the total pixel is 437. Results from Fig. 2 confirmed the cycle of discharge at approximately 500 µs hence the power supply frequency is at 2 kHz. Trigger for image capturing was set to 500 µs.
Figure 3(a). Applied pulsed supply 6 kV
Pixels
Intensity
Frame no.
GND
Power supply Acrylic resin
Electrode (GND)
Spacer
Electrode (HV)
Microplasma
Glass plate
Glass barrier
180
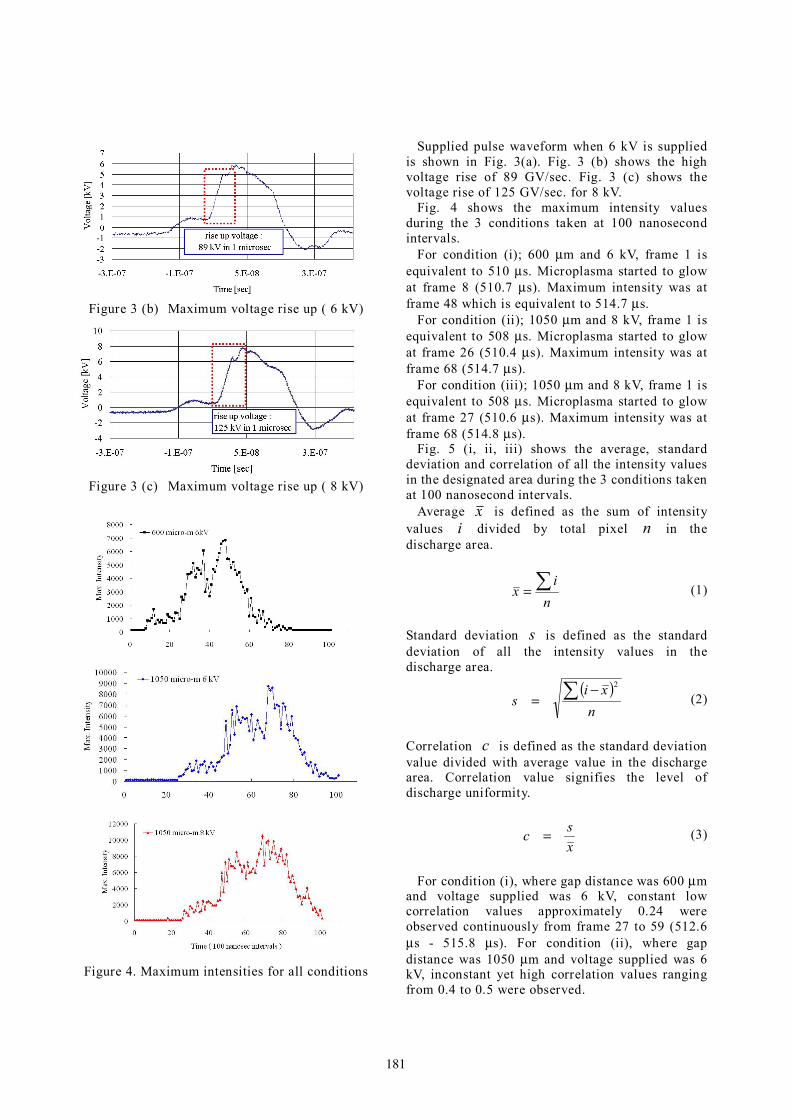
Figure 3 (b) Maximum voltage rise up ( 6 kV)
Figure 3 (c) Maximum voltage rise up ( 8 kV)
Figure 4. Maximum intensities for all conditions
Supplied pulse waveform when 6 kV is supplied is shown in Fig. 3(a). Fig. 3 (b) shows the high voltage rise of 89 GV/sec. Fig. 3 (c) shows the voltage rise of 125 GV/sec. for 8 kV. Fig. 4 shows the maximum intensity values during the 3 conditions taken at 100 nanosecond intervals. For condition (i); 600 µm and 6 kV, frame 1 is equivalent to 510 µs. Microplasma started to glow at frame 8 (510.7 µs). Maximum intensity was at frame 48 which is equivalent to 514.7 µs. For condition (ii); 1050 µm and 8 kV, frame 1 is equivalent to 508 µs. Microplasma started to glow at frame 26 (510.4 µs). Maximum intensity was at frame 68 (514.7 µs). For condition (iii); 1050 µm and 8 kV, frame 1 is equivalent to 508 µs. Microplasma started to glow at frame 27 (510.6 µs). Maximum intensity was at frame 68 (514.8 µs). Fig. 5 (i, ii, iii) shows the average, standard deviation and correlation of all the intensity values in the designated area during the 3 conditions taken at 100 nanosecond intervals. Average x is defined as the sum of intensity values i divided by total pixel n in the discharge area.
ni
x ∑= (1)
Standard deviation s is defined as the standard deviation of all the intensity values in the discharge area.
( )n
xis ∑ −
=2
(2)
Correlation c is defined as the standard deviation value divided with average value in the discharge area. Correlation value signifies the level of discharge uniformity.
xsc = (3)
For condition (i), where gap distance was 600 µm and voltage supplied was 6 kV, constant low correlation values approximately 0.24 were observed continuously from frame 27 to 59 (512.6 µs - 515.8 µs). For condition (ii), where gap distance was 1050 µm and voltage supplied was 6 kV, inconstant yet high correlation values ranging from 0.4 to 0.5 were observed.
181
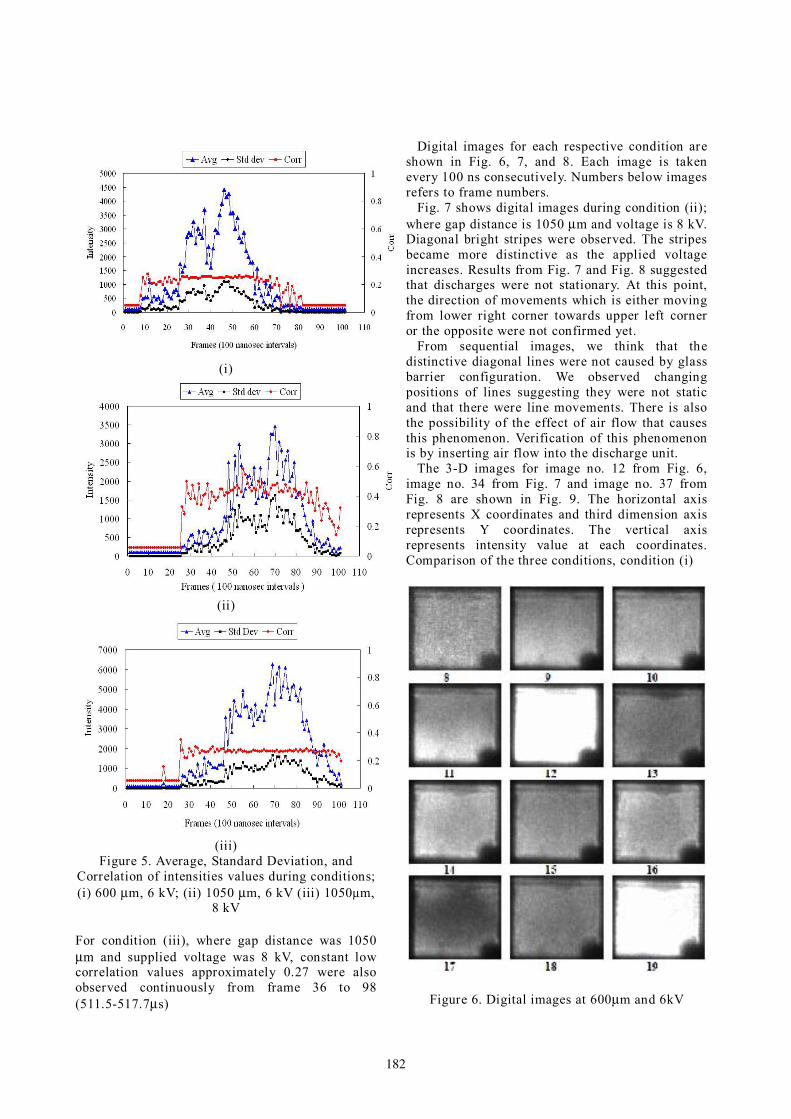
(i)
(ii)
(iii)
Figure 5. Average, Standard Deviation, and Correlation of intensities values during conditions; (i) 600 µm, 6 kV; (ii) 1050 µm, 6 kV (iii) 1050µm,
8 kV
For condition (iii), where gap distance was 1050 µm and supplied voltage was 8 kV, constant low correlation values approximately 0.27 were also observed continuously from frame 36 to 98 (511.5-517.7µs)
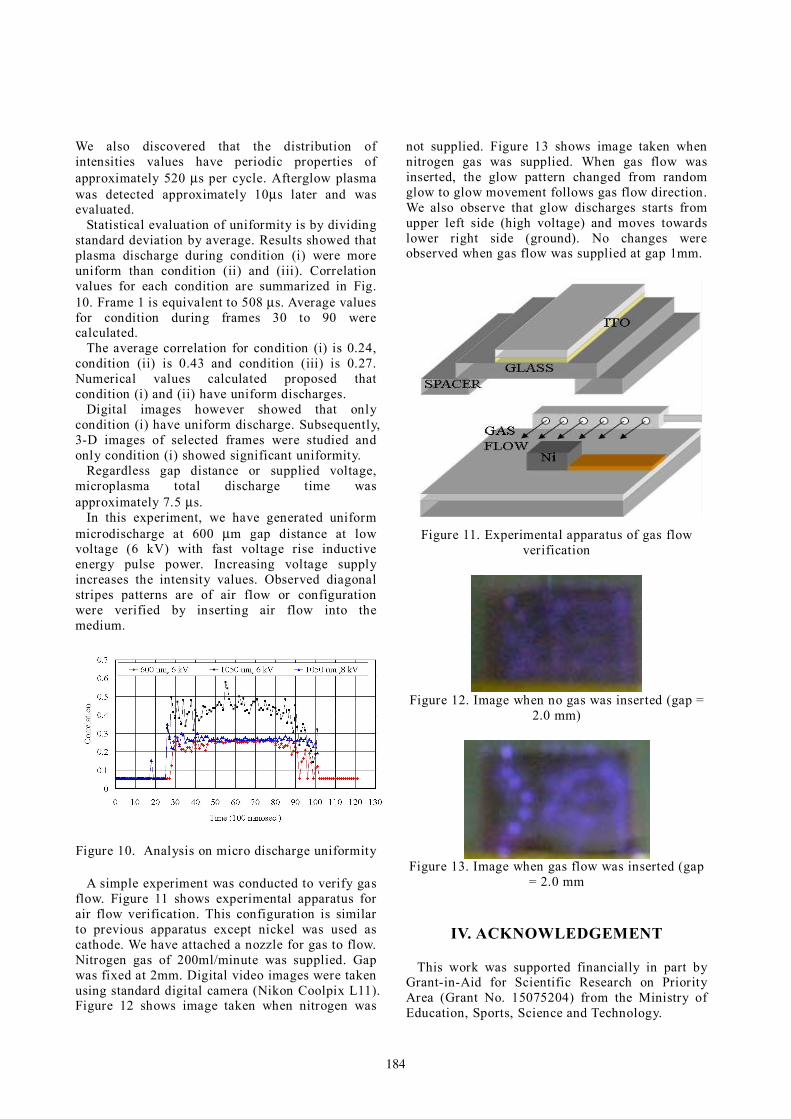
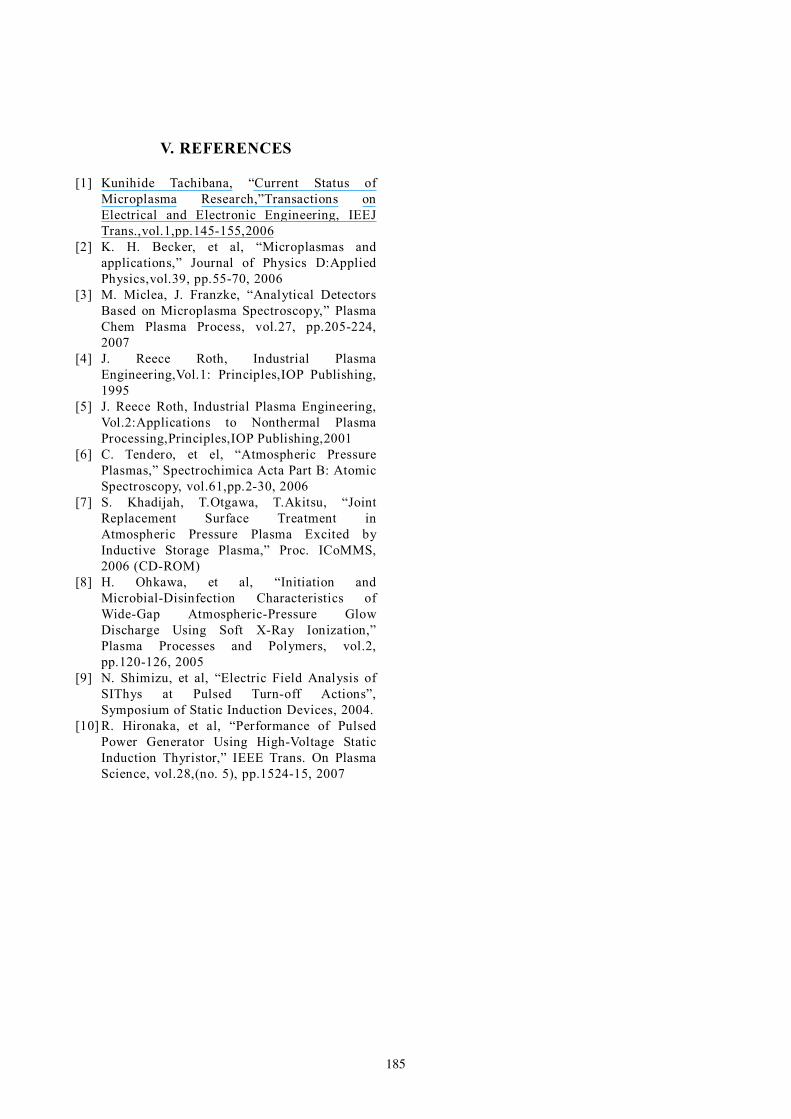
Digital images for each respective condition are shown in Fig. 6, 7, and 8. Each image is taken every 100 ns consecutively. Numbers below images refers to frame numbers. Fig. 7 shows digital images during condition (ii); where gap distance is 1050 µm and voltage is 8 kV. Diagonal bright stripes were observed. The stripes became more distinctive as the applied voltage increases. Results from Fig. 7 and Fig. 8 suggested that discharges were not stationary. At this point, the direction of movements which is either moving from lower right corner towards upper left corner or the opposite were not confirmed yet. From sequential images, we think that the distinctive diagonal lines were not caused by glass barrier configuration. We observed changing positions of lines suggesting they were not static and that there were line movements. There is also the possibility of the effect of air flow that causes this phenomenon. Verification of this phenomenon is by inserting air flow into the discharge unit. The 3-D images for image no. 12 from Fig. 6, image no. 34 from Fig. 7 and image no. 37 from Fig. 8 are shown in Fig. 9. The horizontal axis represents X coordinates and third dimension axis represents Y coordinates. The vertical axis represents intensity value at each coordinates. Comparison of the three conditions, condition (i)
Figure 6. Digital images at 600µm and 6kV
182
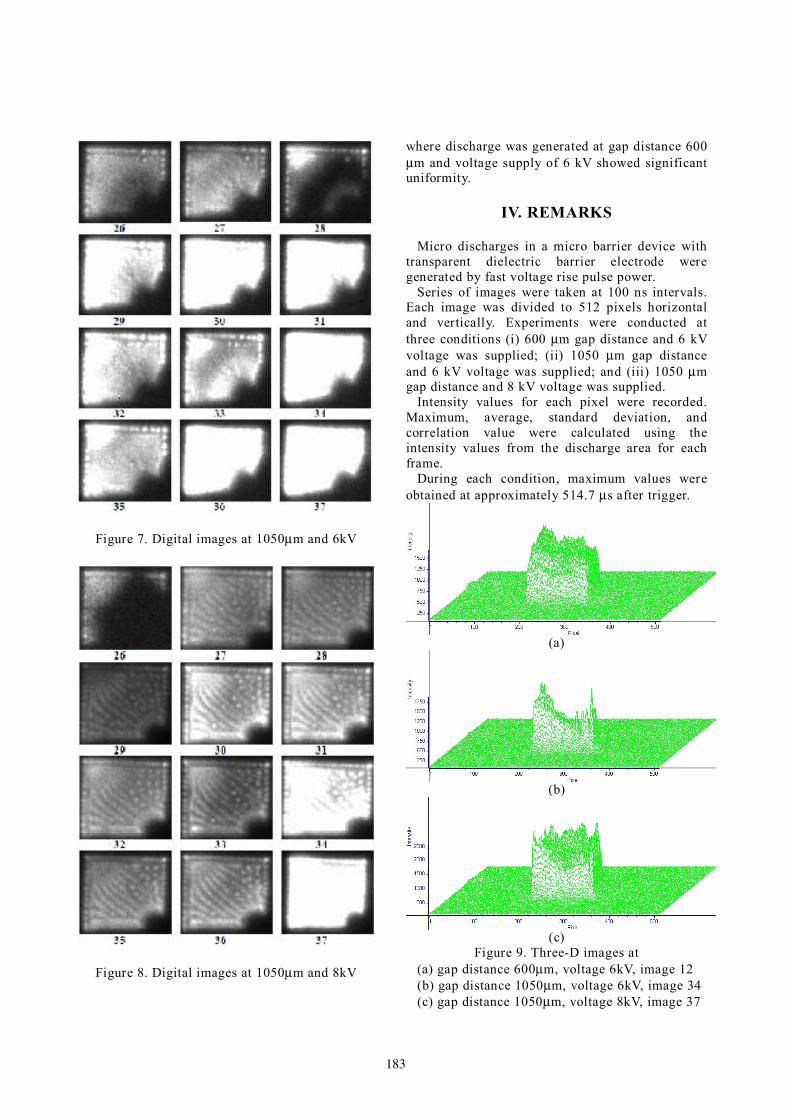
Figure 7. Digital images at 1050µm and 6kV
Figure 8. Digital images at 1050µm and 8kV
where discharge was generated at gap distance 600 µm and voltage supply of 6 kV showed significant uniformity.
IV. REMARKS
Micro discharges in a micro barrier device with transparent dielectric barrier electrode were generated by fast voltage rise pulse power. Series of images were taken at 100 ns intervals. Each image was divided to 512 pixels horizontal and vertically. Experiments were conducted at three conditions (i) 600 µm gap distance and 6 kV voltage was supplied; (ii) 1050 µm gap distance and 6 kV voltage was supplied; and (iii) 1050 µm gap distance and 8 kV voltage was supplied. Intensity values for each pixel were recorded. Maximum, average, standard deviation, and correlation value were calculated using the intensity values from the discharge area for each frame. During each condition, maximum values were obtained at approximately 514.7 µs after trigger.
(a)
(b)
(c)
Figure 9. Three-D images at (a) gap distance 600µm, voltage 6kV, image 12 (b) gap distance 1050µm, voltage 6kV, image 34 (c) gap distance 1050µm, voltage 8kV, image 37
183
We also discovered that the distribution of intensities values have periodic properties of approximately 520 µs per cycle. Afterglow plasma was detected approximately 10µs later and was evaluated. Statistical evaluation of uniformity is by dividing standard deviation by average. Results showed that plasma discharge during condition (i) were more uniform than condition (ii) and (iii). Correlation values for each condition are summarized in Fig. 10. Frame 1 is equivalent to 508 µs. Average values for condition during frames 30 to 90 were calculated. The average correlation for condition (i) is 0.24, condition (ii) is 0.43 and condition (iii) is 0.27. Numerical values calculated proposed that condition (i) and (ii) have uniform discharges. Digital images however showed that only condition (i) have uniform discharge. Subsequently, 3-D images of selected frames were studied and only condition (i) showed significant uniformity. Regardless gap distance or supplied voltage, microplasma total discharge time was approximately 7.5 µs. In this experiment, we have generated uniform microdischarge at 600 µm gap distance at low voltage (6 kV) with fast voltage rise inductive energy pulse power. Increasing voltage supply increases the intensity values. Observed diagonal stripes patterns are of air flow or configuration were verified by inserting air flow into the medium.
Figure 10. Analysis on micro discharge uniformity
A simple experiment was conducted to verify gas flow. Figure 11 shows experimental apparatus for air flow verification. This configuration is similar to previous apparatus except nickel was used as cathode. We have attached a nozzle for gas to flow. Nitrogen gas of 200ml/minute was supplied. Gap was fixed at 2mm. Digital video images were taken using standard digital camera (Nikon Coolpix L11). Figure 12 shows image taken when nitrogen was
not supplied. Figure 13 shows image taken when nitrogen gas was supplied. When gas flow was inserted, the glow pattern changed from random glow to glow movement follows gas flow direction. We also observe that glow discharges starts from upper left side (high voltage) and moves towards lower right side (ground). No changes were observed when gas flow was supplied at gap 1mm.
Figure 11. Experimental apparatus of gas flow verification
Figure 12. Image when no gas was inserted (gap =
2.0 mm)
Figure 13. Image when gas flow was inserted (gap
= 2.0 mm
IV. ACKNOWLEDGEMENT
This work was supported financially in part by Grant-in-Aid for Scientific Research on Priority Area (Grant No. 15075204) from the Ministry of Education, Sports, Science and Technology.
184
V. REFERENCES
[1] Kunihide Tachibana, “Current Status of Microplasma Research,”Transactions on Electrical and Electronic Engineering, IEEJ Trans.,vol.1,pp.145-155,2006
[2] K. H. Becker, et al, “Microplasmas and applications,” Journal of Physics D:Applied Physics,vol.39, pp.55-70, 2006
[3] M. Miclea, J. Franzke, “Analytical Detectors Based on Microplasma Spectroscopy,” Plasma Chem Plasma Process, vol.27, pp.205-224, 2007
[4] J. Reece Roth, Industrial Plasma Engineering,Vol.1: Principles,IOP Publishing, 1995
[5] J. Reece Roth, Industrial Plasma Engineering, Vol.2:Applications to Nonthermal Plasma Processing,Principles,IOP Publishing,2001
[6] C. Tendero, et el, “Atmospheric Pressure Plasmas,” Spectrochimica Acta Part B: Atomic Spectroscopy, vol.61,pp.2-30, 2006
[7] S. Khadijah, T.Otgawa, T.Akitsu, “Joint Replacement Surface Treatment in Atmospheric Pressure Plasma Excited by Inductive Storage Plasma,” Proc. ICoMMS, 2006 (CD-ROM)
[8] H. Ohkawa, et al, “Initiation and Microbial-Disinfection Characteristics of Wide-Gap Atmospheric-Pressure Glow Discharge Using Soft X-Ray Ionization,” Plasma Processes and Polymers, vol.2, pp.120-126, 2005
[9] N. Shimizu, et al, “Electric Field Analysis of SIThys at Pulsed Turn-off Actions”, Symposium of Static Induction Devices, 2004.
[10] R. Hironaka, et al, “Performance of Pulsed Power Generator Using High-Voltage Static Induction Thyristor,” IEEE Trans. On Plasma Science, vol.28,(no. 5), pp.1524-15, 2007
185
Related Documents