20 February 2008 Invention and Discovery In Science-Based Firms By James D. Adams, Rensselaer Polytechnic Institute and NBER J. Roger Clemmons, Institute for Child Health Policy, School of Medicine, University of Florida Second Draft February 2008 JEL Codes: D24, L23, O31 Keywords: Science, Citations, Scientific Papers, Patents, Research and Development, Spillovers, Universities, Firms, Production Functions Corresponding Author: James D. Adams, Department of Economics, Rensselaer Polytechnic Institute, 3504 Russell Sage Laboratory, Troy, NY 12180-3590. Telephone: 1-518-276-2523, fax: 1-518-276-2235, E-mail: [email protected] *The Andrew W. Mellon Foundation has generously supported this research. We thank Nancy Bayers and Henry Small of Thomson-Scientific for assistance with the data, and Ken Simons for helpful suggestions, especially concerning issues of computation.

Welcome message from author
This document is posted to help you gain knowledge. Please leave a comment to let me know what you think about it! Share it to your friends and learn new things together.
Transcript
20 February 2008
Invention and Discovery
In Science-Based Firms
By
James D. Adams, Rensselaer Polytechnic Institute and NBER
J. Roger Clemmons, Institute for Child Health Policy,
School of Medicine, University of Florida
Second Draft
February 2008
JEL Codes: D24, L23, O31
Keywords: Science, Citations, Scientific Papers, Patents, Research and Development,
Spillovers, Universities, Firms, Production Functions
Corresponding Author: James D. Adams, Department of Economics, Rensselaer
Polytechnic Institute, 3504 Russell Sage Laboratory, Troy, NY 12180-3590. Telephone:
1-518-276-2523, fax: 1-518-276-2235,
E-mail: [email protected]
*The Andrew W. Mellon Foundation has generously supported this research. We thank
Nancy Bayers and Henry Small of Thomson-Scientific for assistance with the data, and
Ken Simons for helpful suggestions, especially concerning issues of computation.

Abstract
This paper estimates production functions for patents, treated as a measure of
invention. Inputs are firm R&D and knowledge flows from a firm’s inventions and
scientific discoveries, from inventions and discoveries of other firms, and from scientific
discoveries in universities.
The largest impact on new patents derives from invention-based knowledge flows.
But science-based flows also play a role for highly cited, high impact patents.
Knowledge flows from other firms’ patents are more important than flows from inside
the firm. Industry flows outweigh university flows.
We also compare production functions for patents and scientific papers. Even more
than patents, papers depend on knowledge outside the firm. In contrast with patents,
knowledge flows from universities dominate industry flows.
The results suggest that inventions are determined by a sequence of research. Later
on knowledge flows narrow down to industry, whereas university research is more
important in the early stages. Even so, science plays an appreciable role in patents,
especially high impact patents.
1
I. Introductory Remarks
To what extent does new invention depend on knowledge from past inventions? How
important for invention is knowledge outside the firm compared to inside knowledge?
Do knowledge flows from science play an additional role in invention? How do
production functions for invention compare with those for scientific discoveries? This
paper seeks to provide tentative answers to these questions.
Our approach builds on two literatures. The first is the search approach to
technological change pioneered by Evenson and Kislev (1975, 1976), and applied to
R&D by Nelson (1982) and growth by Kortum (1997). The second is the quality ladders
approach to growth, in which higher quality products supersede lower quality ones.
Grossman and Helpman (1991) and Barro and Sala-i-Martin (2004) contain expositions.
Etro (2004) implicitly builds on this approach in his discussion of patent racing under
different assumptions about industry organization.
Using a sample of large R&D-performing firms in the U.S., which are observed
during 1981-1999, the empirical work quantifies inventions and scientific discoveries as
well as knowledge flows to both. Our evidence builds on patents and citations in the
NBER Patent Citations Database and papers and citations to papers from the NBER
Scientific Papers Database. In addition we draw on Compustat for firm R&D stocks and
on the CASPAR database of the National Science Foundation for university R&D1.
Main findings are as follows. Simple patent counts depend on knowledge flows from
1 See Standard and Poor’s-Data Services Compustat (2007) for firm R&D data; the WebCASPAR
Integrated Science and Engineering Resources Data System (2007) for data on R&D by university and
field; and National Science Foundation (2007) for aggregate R&D by type as well as industry. Chapter 13
of Jaffe and Trajtenberg (2002) discusses the patent database. Adams and Clemmons (2006) discuss the
scientific papers database at length.
2
inventions but much less on science. When we replace patent counts with patents
weighted by citations received, a measure of invention weighted by impact, we find that
knowledge flows from patents continue to dominate, but that knowledge flows from
science now have a much greater impact. When we compare flows from inside and
outside the firm, we find that outside flows have a larger effect on patents produced.
When we compare industry- with university-based we find that the effects of knowledge
flows from industry outweigh those from universities by a wide margin.
For comparison with patents we estimate production functions for scientific papers.
We find that firm’s papers depend even more that its patents on knowledge flows from
outside the firm. In addition, unlike patents, flows from universities have a larger effect
on scientific papers than industry flows.
These comparative findings on patents and papers suggest that innovation is a
sequential process in which the scope of the firm’s research progressively narrows as it
proceeds from early to late stages. In the early going the firm’s scientific effort depends
mostly on outside knowledge, most of that coming from universities. Later on, the firm’s
inventions depend mostly on the firms’ past inventions and on inventions elsewhere in
industry, with science strictly secondary. Nevertheless, we observe that science plays an
important role in patents, especially highly cited patents.
The rest of the paper is arranged as follows. Section II describes the structure of firm
innovation decisions. Section III discusses preparation of the data, beginning with
construction of firm R&D stocks. For the purpose of matching patents to firms, we
proceed to the problem of matching of firm names and their subsidiaries to patent
assignees. Then, the section discusses the calculation of patent counts and citation-

3
weighted patents for the firm. Afterwards we describe flows of knowledge from patents
of the same firm and other firms. Finally we turn to knowledge flows from science. We
construct papers and citation-weighted papers of firms, flows of science-based
knowledge from papers of the same firm, other firms, and universities. Crucially, we
describe a method of mapping flows of science-based knowledge by field of science into
patent categories. The section concludes with a description of the various knowledge
flow indicators. Section IV discusses the patent panel, describes the main variables, and
presents findings for knowledge production functions for patents. Section V describes
the scientific papers panel and presents findings for knowledge production functions for
scientific papers. Section VI discusses and compares findings for patents and papers and
concludes the paper.
II. Structure of the Firm’s Innovation Decisions
A. Overview
We start by asking why a firm invests in science and technology and how this is
conditioned by size and product diversity of a firm. Having addressed these questions we
are better able to understand why large, diverse firms are more likely to invest in science.
The theory is based on the quality ladders model (Grossman and Helpman, 1991;
Barro and Sala-i-Martin, 2004), which assumes that firms compete to be the sole
producer of the next level of quality of a given product. By investing in science and
R&D, the current producer of the product can raise the probability that it will continue to
be the monopolist. This is the question of the persistence of monopoly. According to
the Arrow effect the monopolist has less of an incentive to invest than the entrant,
because it forgoes a present value of profits on the current product in which it holds a

4
monopoly position. However, Etro (2004) shows that if the monopolist has an
informational advantage and knows the reaction of entrants to its R&D investments, and
if there is free entry to be producer of the next higher level of the product, then the Arrow
effect disappears: the incumbent has a greater incentive to invest than entrants. To this
theory we add economies of scope based on science and other firm-wide capabilities.
The theory is consistent with the persistence of leadership of many firms in our sample
and it agrees with empirical results of Blundell, Griffiths, and Van Reenan (1999), who
find that market share increases innovation and enhances the impact of innovation on a
firm’s stock market value.
B. Single Line of Business
Consider the competition to be patent holder and producer of the next generation
of the product. The present value of entrant i and incumbent L respectively are
(1) Fppr
RsVpPV
Lj
n
j
iii
i
1
(2) Fppr
RsVpPV
Lj
n
j
LLL
L
1
The first term in (1) is the discounted expected present value of the entrant’s being first to
invent while the second term is its fixed cost F of entering the race. The numerator of (1)
is the probabilityi
p that the entrant is first to innovate times the present valueV of the
next generation product, minus the cost of the two inputs, the sampling rate i
s (search)
and R&Di
R , whose prices are both normalized to unity. The denominator is the sum of
interest rate r and the probabilityLj
n
jpp
1. This is the discount rate given the
Poisson assumption on the probability of invention. Equation (2) is similar to (1) except
5
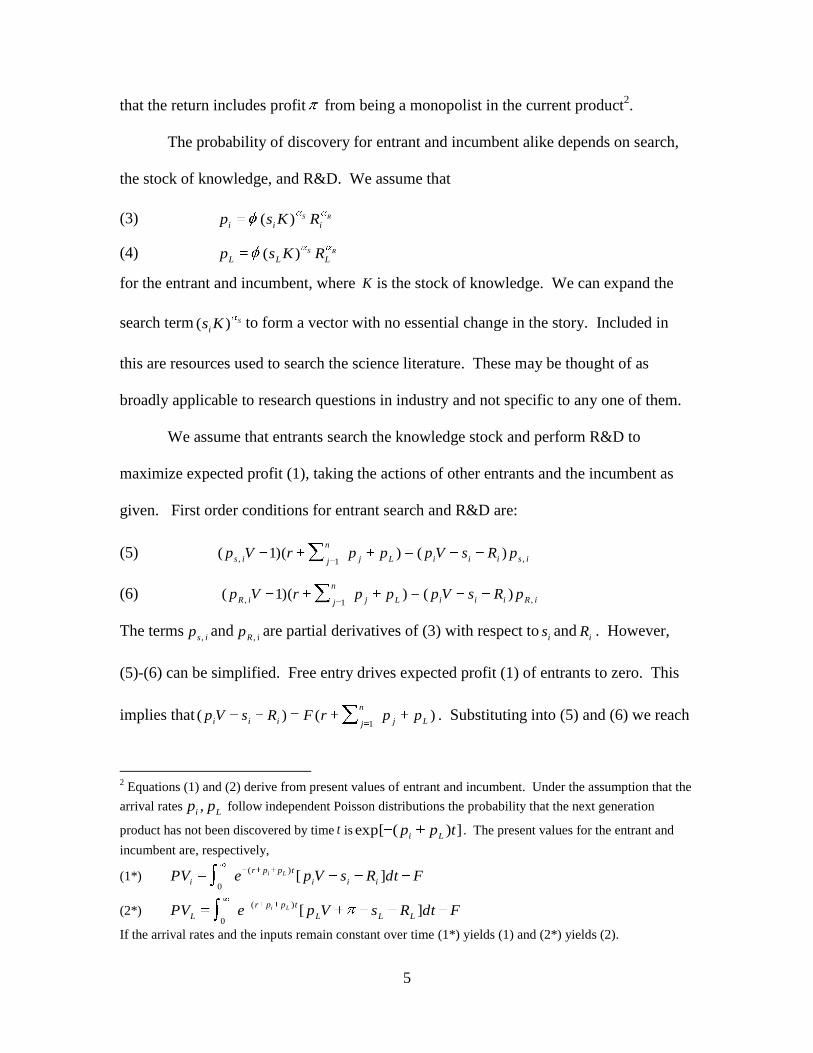
that the return includes profit from being a monopolist in the current product2.
The probability of discovery for entrant and incumbent alike depends on search,
the stock of knowledge, and R&D. We assume that
(3) RS
iiiRKsp )(
(4) RS
LLLRKsp )(
for the entrant and incumbent, where K is the stock of knowledge. We can expand the
search term SKsi
)( to form a vector with no essential change in the story. Included in
this are resources used to search the science literature. These may be thought of as
broadly applicable to research questions in industry and not specific to any one of them.
We assume that entrants search the knowledge stock and perform R&D to
maximize expected profit (1), taking the actions of other entrants and the incumbent as
given. First order conditions for entrant search and R&D are:
(5) isiiiLj
n
jispRsVppprVp
,1 ,)())(1(
(6) iRiiiLj
n
jiRpRsVppprVp
,1 ,)())(1(
The termsis
p ,and
i ,Rp are partial derivatives of (3) with respect to
is and
iR . However,
(5)-(6) can be simplified. Free entry drives expected profit (1) of entrants to zero. This
implies that )()(1 Lj
n
jiiipprFRsVp . Substituting into (5) and (6) we reach
2 Equations (1) and (2) derive from present values of entrant and incumbent. Under the assumption that the
arrival ratesLi
pp , follow independent Poisson distributions the probability that the next generation
product has not been discovered by time t is ])(exp[ tppLi
. The present values for the entrant and
incumbent are, respectively,
(1*) FdtRsVpePViii
tppr
iLi ][
)(
0
(2*) FdtRsVpePVLLL
tppr
LLi ][
)(
0
If the arrival rates and the inputs remain constant over time (1*) yields (1) and (2*) yields (2).
6
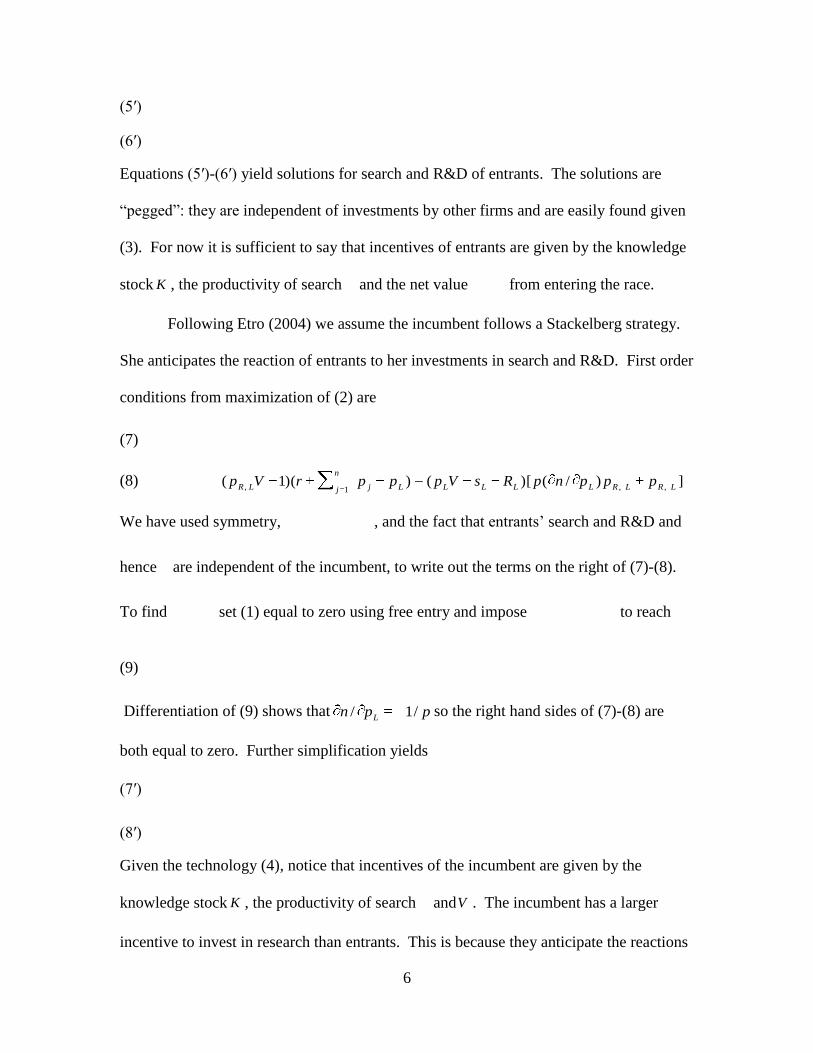
(5′) 1)( ,
FVpis
(6′) 1)( ,
FVpiR
Equations (5′)-(6′) yield solutions for search and R&D of entrants. The solutions are
“pegged”: they are independent of investments by other firms and are easily found given
(3). For now it is sufficient to say that incentives of entrants are given by the knowledge
stock K , the productivity of search and the net value FV from entering the race.
Following Etro (2004) we assume the incumbent follows a Stackelberg strategy.
She anticipates the reaction of entrants to her investments in search and R&D. First order
conditions from maximization of (2) are
(7) ])/()[())(1( , ,1 , LRLRLLLLLj
n
jLspppnpRsVppprVp
(8) ])/()[())(1( , ,1 , LRLRLLLLLj
n
jLRpppnpRsVppprVp
We have used symmetry, nppj
n
j 1, and the fact that entrants’ search and R&D and
hence p are independent of the incumbent, to write out the terms on the right of (7)-(8).
To findL
pn / set (1) equal to zero using free entry and impose nppj
n
j 1to reach
(9) p
p
p
r
Fp
Rs
F
Vn L
Differentiation of (9) shows that ppnL
/1/ so the right hand sides of (7)-(8) are
both equal to zero. Further simplification yields
(7′) 1 ,Vp
Ls
(8′) 1 ,Vp
LR
Given the technology (4), notice that incentives of the incumbent are given by the
knowledge stock K , the productivity of search andV . The incumbent has a larger
incentive to invest in research than entrants. This is because they anticipate the reactions

7
of entrants to their investment. There is a tendency towards persistence of monopoly if
the difference in favor of the incumbent, due to fixed costs F , is large.
C. Multiple Lines of Business
We now show that the above argument understates the advantages of the incumbent.
Suppose that a firm owns multiple lines of business in which it is the leader and suppose
that it competes in every one to be the first to invent the next generation of higher quality
product. We shall assume that search resources of the firm exhibit an economy of scope,
on the grounds that science, which is included in these resources, tends to be general
knowledge, along with some forms of technology, but that science is on the whole
broader than technology. To see how this scenario would play out, consider an
incumbent whose present value over N lines of business, indexed by superscript k , is:
(10) k
k
L
k
j
n
j
k
LL
kkk
LN
kLF
ppr
RNsVpPV
1
1
/
Observe that the unit price of search resources is N/1 since these inputs are used in
all N lines of business. The probability of the incumbent winning patent race k is
(11) RS k
L
k
LRsKp )()(
Search spans all the different product lines of the firm, while R&D is specific to a
product line. While the assumption is extreme it points out the difference between
general knowledge, of which science tends to be an example, and technology, which
tends to be specific to sectors.
To highlight the difference between large incumbents and small entrants, we
suppose that the expected present value of the entrant follows (1) and refers to a single

8
line of business. Thus, the first order conditions (5′) and (6′) continue to apply. Given
symmetry across lines of business the first order conditions for the incumbent become:
(12) ])/()[/())(/1( , , , LsLsLLLLLLs
pppnpRNsVppnprNVp
(13) ])/()[/())(1( , , , LsLsLLLLLLs
pppnpRNsVppnprVp
Differentiation of (9) again shows that ppnL
/1/ so that the bracketed term on the
right equals zero. Upon simplifying, the incumbent’s first order conditions become:
(12′) 1 ,VNp
Ls
(13′) 1 ,Vp
LR
Using (4) equations (12′)-(13′) can easily be solved for equilibrium investments in
research by the incumbent. But it is already clear what we shall find. Not only is the
incumbent’s incentiveV larger than the entrant’s FV , which contributes to persistence
of monopoly, but there is a further advantage to, as well as bias towards, search and
science resources s owing to their use across all N business lines. These are used to
search the stock of knowledge (Cohen, Nelson, and Walsh, 2002), and the incumbent’s
size and diversity favors them over R&D specific to a line of business.
This digression into the large incumbent firm’s environment for innovation serves
three purposes. First, it shows that the assumption of informational advantage, which is
based on the incumbent’s knowledge of the market in which she is a leader, when
coupled with the assumption of free entry, will give the incumbent more incentives than
entrants to invest in research. Second, and perhaps more important, economies of scope
associated with search give the incumbent even more of an incentive to invest in research
than entrants. The search input increases because of the scope economy. But as search
increases there is a secondary effect that increases R&D, owing to Pareto
complementarity between knowledge absorbed and R&D specific to product lines. Thus

9
large and diverse firms invest heavily, especially in search. Third, the model suggests
that science is primarily a large company affair, because large and diverse firms benefit
more than small firms engaged in a single line of business. The production functions for
inventions and science within firms could reflect the incentives described in this section.
We shall try to find empirical counterparts to them in auxiliary data.
III. Preparation of the Data
A. Construction of R&D Stocks
Data preparation begins with the selection of the Top 200 R&D-performing firms
in the U.S., hereafter the Top 200. The firms are drawn from the year 2000 edition of
Compustat and are ranked by R&D expense. For a current description of these data, see
Standard and Poor’s-Data Services Compustat (2007). Identities of the Top 200 and of
the science carried on in them are described in Adams and Clemmons (2006). We
deflate R&D expense using the 1992 implicit price deflator of the Bureau of Economic
Analysis. Then we depreciate deflated R&D at an annual rate of 15 percent and construct
five-year R&D stocks3. The stocks are lagged one year so for example, the 1993 stock
covers 1992 back to 1988. The firm’s R&D stock is,
(14) jti
j
jtiRRDK
,
15
1 ,)85.0(
We adjust (14) to represent basic research by multiplying the R&D stock by the
ratio of basic research to total R&D in the firms’ primary industry to yield the firm’s
estimated stock of basic research. We use basic research stock to explain the firm’s
output of scientific papers4. Then we multiply (14) by the ratio of applied research to
total R&D to yield an estimate of the firm’s applied research stock. We use basic plus
3 The five year lagged R&D stock takes the relatively short R&D series on some firms into account.
However, eight year stocks behave similarly in a smaller panel. 4 The stock of basic plus applied research performs almost as well.

10
applied research to explain the firm’s output of patents. The industry ratios are taken
from National Science Foundation (2007)5. While these estimates fit better than the
unadjusted R&D stock (14) the difference is not essential.
B. Patent Data
1. Name Match to Patent Assignees
By construction Top 200 firms match Compustat, but they do not match patent
assignees in the NBER Patent Citations database (Jaffe and Trajtenberg, 2002), our
source for patents and the knowledge flows related to them. For this reason we undertake
a name match between Top 200 names and assignee names in the NBER data.
The first step in this match is to obtain subsidiaries of the firms from FIS OnLine.
Since FIS later became Mergent see Mergent OnLine (2007) for a description of recent
data. This step yields 13,536 subsidiaries, or about 70 per firm. Its importance is that it
allows for multiple patent assignees including foreign subsidiaries owned by the firms.
The second step is a name match between subsidiaries and assignees. This yields
1,549 assignees or about eight per firm. Since FIS (Mergent) assigns ticker symbols to
subsidiaries, tickers are attached to matching assignees and their patents. At this point we
have matched the Top 200 firms in Compustat, their assignees, and their assignees’
patents. A ticker symbol appears in all patent records.
2. Patents and Citation-Weighted Patents
Next we extract patents of the Top 200 as well as citations made and received by
the patents. The result is 357,739 patents during 1975-1999 or about one-fifth of all U.S.
patents during this period. Top 200 patents receive 0.9 million citations from Top 200
5 The NSF data do not exist in all years and therefore require interpolation as well as extrapolation. This is
especially true in the early 1980s and in non-manufacturing but R&D intensive sectors. These data are the
only data available with which to make these adjustments.

11
firms and two million citations overall. To capture their impact on industry we use
forward citations received from other Top 200 firms over the first five years including the
grant year6. Citation-weighted patents using a seven year interval perform similarly in
the empirical work7.
Given these data we accumulate patent counts and citation-weighted patents by
firm, patent category, and year. The six categories are chemical; computer and
communications; drugs and medical; electrical and electronics; mechanical; and other.
We want to construct patents by firm and category because this helps to distinguish
knowledge flows from firm level R&D. We start the panel in 1988 to allow the R&D
stocks and knowledge flows to build up over time. After missing values are removed,
this process yields 7,263 observations on patent counts arranged by firm, patent category,
and year over 1988-1999. There are 4,615 observations on patents weighted by five-year
citations received, in which the time period is 1988-1995. These two variables serve as
measures of invention that are to be explained.
We date patents by grant year rather than application year. This choice is dictated
by the scientific papers part of our data. Use of grant year implies that patents and papers
are both lagged relative to the year in which the invention or discovery is applied for.
Clearly this makes it harder to synchronize patents with their effects on the U.S.
economy. But part of our purpose is to link knowledge flows from scientific papers with
those from patents. As it happens, papers are dated only by publication year, the
6 Trajtenberg (1990) and Harhoff, Narin, Scherer, and Vopel (1999) validate citations received as a measure
of patent quality. 7 Since patents granted end in 1999 five year citations end in 1995, and seven year citations in 1993. While
the seven year interval is a more accurate measure of the importance of the patents, by catching more later
maturing patents, it truncates the sample two years earlier and thus causes appreciable loss of sample size.

12
analogue to grant year. Nothing is known about the year of submission, especially given
that papers can be submitted an unknown number of times.
If we were to use application year for patents, then we could wind up dating
patents before papers, when the patents appear later. Put another way we lack application
year for papers so we cannot consistently assign “grant” dates to research.
3. Knowledge Flows Inside the Firm
Throughout we assume that knowledge flows are the result of a search for useful
knowledge by industrial scientists and engineers. To make this idea tangible we assume
first, that citation (and collaboration) rates for patents and scientific papers measure
sampling rates under search, and that estimated sampling rates are roughly proportional
to the knowledge that spills over. Second, we assume that R&D stocks of cited
institutions, whose science and technology is being sampled, are highly correlated with
unobservable stocks of knowledge. Klette and Kortum (2004) take this point of view8.
Third, we impose an aggregation condition in that we assume that different knowledge
flows can be added up to form an overall knowledge flow to the citing firm.
R&D stocks have several practical advantages as measures of accumulated
knowledge. They provide an historical record of research that captures anticipated future
impact. R&D stocks also avoid nominal variations in papers-R&D and patents-R&D
ratios. For example, firms could shift towards higher impact science and invention so
that R&D remains profitable, despite declines in these ratios. (Griliches, 1993; Lanjouw
and Schankerman, 2004)
8 Klette and Kortum (2004) demonstrate the point for a stylized model of the firm. Using a depreciation
rate on R&D equal to the rate of creative destruction yields a stock of firm R&D that is equal to firm
knowledge, defined as the number of its innovative products. A different depreciation rate would yield a
stock of R&D that is highly correlated with firm knowledge. The point is that stocks of R&D and stocks of
innovative goods are different ways to measure innovation, the first by inputs, the second by outputs.

13
Given these assumptions we construct a variety of knowledge flows, all based on
patents. We call these “original” measures in that they refer to knowledge flows before
aggregation into “derived” measures. We distinguish the flows by citing firm, patent
category, and year; and by cited firm, category, and year9. These dimensions determine
observed knowledge flows by points of origin and destination.
We begin with measurement of knowledge flows from patents inside the firm.
The measure that we use is the citation rate times cited R&D stock, summed over cited
years and categories, but within the firm. Inside knowledge flows depend on the number
of citations to earlier patents in the firm, on the number of patents that could have been
cited, and on the firm’s R&D stock. Our justification is that citation rates sample the
amount of accumulated knowledge captured by the stock of R&D. Therefore, inside
knowledge flows by citing firm, patent category, and year are
(15) 16
1
6
1
1
,
itit
iktk
ikt
ijtkTINSIDEFIRM
ijtRDKa
n
cK
Firm i patents in patent category j at time t makeikt
ijtc citations to
iktn —these are all the
patents of firm i in category k at time t . Since citing and cited firms i are the same
these are “inside” citations. The citation rate, the middle term on the right of (15), is an
overall weighted-average.
This is because cited R& D stock is at the firm level10
. The term it
a in (15) is the
ratio of basic plus applied research to total R&D in the firm’s industry, which yields an
9 Recall that the six patent categories are chemical, computer and communications, electrical and
electronic, mechanical, and other. 10
If R&D stocks were distributed by patent category, then (15) would instead be
(15′) 1
6
11
,
iktit
ikt
ikt
ijt
k
TINSFIRM
ijtRDKa
n
cK

14
estimate of the stock of basic plus applied research when multiplied by R&D
stock ,1it
RDK as defined in (14). Note that cited patents are lagged by at least one year
and that R&D stock is lagged by one more year. In the empirical work we lag knowledge
flows (15) by still another year relative to patents to instrument the citation rate in (15).
Therefore, R&D precedes citing patents by at least two years. These lags are identical for
all knowledge flows that follow.
4. Knowledge Flows from other Firms
In a similar way outside knowledge flows, or flows of knowledge from other
firms’ patents, depend on citation rates to earlier patents of other firms, times stocks of
basic and applied research. The measure of outside knowledge flows is
(16) 16
1
6
1
11
,
ltlt
lktk
lkt
ijtkTN
ill
OUTSIDEFIRM
ijtRDKa
n
cK
Firm i patents in category j at time t makelkt
ijtc citations to patents of another firm l .
These lkt
n are all the patents issued to firm l in category k at time t that could have
been cited. Since citing and cited firms i and l differ these are “outside” citations and
summation occurs over cited firms as well as cited years and patent categories. Again
the citation rate is a weighted average across categories, because cited R&D is at the firm
level. The termlt
a is the ratio of basic plus applied research to total R&D in the cited
firm’s industry and this provides an estimate of basic plus applied research, multiplied by
the lagged, cited R&D stock .1lt
RDK Lags on R&D are the same as for inside
knowledge (15) and precede citing patents by at least two years.

15
C. Scientific Papers Data
1. Papers and Citation-Weighted Papers
The data that we use on scientific papers derive from Thomson Scientific. They
are described in Adams, Black, Clemmons, and Stephan (2005), Adams, Clemmons, and
Stephan (forthcoming), Adams and Clemmons (2006), Adams and Clemmons
(forthcoming 2008) and Adams and Clemmons (2008).
The data consist of 230 thousand papers of the Top 200 firms and 2.43 million papers
of the top 110 U.S. universities, which are published during 1981-1999. The papers
appear in 7,137 scientific journals. Each journal and the papers it contains, is assigned to
a single science field. The main alternative is the assignment of papers according to
authors’ fields. But this information is not complete11
.
Top 200 firms make one million citations to papers of top 110 universities, and 0.6
million citations to Top 200 papers, including their own. Because firms rarely
collaborate with one another, in this paper collaboration consists simply of joint research
between firms and universities12
.
After removing missing values the data yield 4,340 observations on scientific papers
arranged by firm, field, and year over the period 1988-1999; and 2,495 observations on
11
We tried to assign all papers of Harvard University to a science field using address information. About a
third of the papers could not be assigned leading us to abandon this method. 12
Firm papers are 1/10 as many as university papers so collaborations between firms would be 1/10 as
many as universities and firms collaborations. This assumes that the two collaboration propensities are the
same. But firm-firm collaborations are rarer than this.

16
citation-weighted papers over 1988-199513
. These variables are observations on firms’
scientific discoveries.
2. Knowledge Flows Inside the Firm
We use S to represent knowledge flows from scientific papers to distinguish these
from knowledge flows K from patents. All flows take place in one of six main fields that
dominate industrial science: biology, chemistry, computer science, medicine, physics,
and engineering. As before, the flows occur at the receiving firm, science field, and year
level. Perhaps the most serious problem that we face in estimating knowledge production
functions for patents is that there is no direct link between science fields and patent
categories. We address this issue in Section III.C.5.
As with patent-based flows, inside knowledge flows from papers of the firm are
(17) 16
1
6
1
1
,
itit
iftf
ift
ijtfTINSIDEFIRM
ijtRDKb
N
CS
Firm i papers in science field j at time t makeift
ijtC “inside” science citations to
iftN —
these are all the papers published by firm i in field f at time t . Again the citation rate
on the right is a weighted average because R&D stock is at the firm level. The term it
b is
the ratio of basic research to total R&D in the firm’s primary industry. Multiplied
by1it
RDK this provides an estimate of the firm’s basic research.
3. Knowledge Flows from other Firms
Knowledge flows from scientific papers of other firms follow a similar pattern.
The measure of outside knowledge flows from scientific papers of other firms is
13
Since citations received cover the first five years after publication and since the data end in 1999,
citation-weighted papers end in 1995, leading to a drop in the number of observations.

17
(18) 16
1
6
1
11
,
ltlt
lftf
lft
ijtfTN
ill
OUTSIDEFIRM
ijtRDKb
N
CS
Firm i papers in science field j at time t makelft
ijtC citations to firm l papers
fltN , which
are all the papers issued to firm i in field f at earlier time t . Since citing firm i and
cited firm ,, ill are different these are “outside” citations. The termlt
b is the ratio of
basic research to total R&D in the cited firm’s primary industry, which provides an
estimate of basic research when multiplied by1lt
RDK .
4. Knowledge Flows from Universities
Knowledge flows from universities take place through citation and collaboration
since firms collaborate with universities on 20 percent of their papers14
. Thus we
consider two different knowledge flows from university science. The collaboration flow
carries the richer connotation of sustained mutual learning, often over an extended period
of time. And of course collaboration contributes to citation through references to past
joint research and the learning process just alluded to.
In constructing measures of knowledge flow from university science we use
stocks of federally funded R&D, which the National Science Foundation collects by
university, field of science, and year. To learn more about the data see WebCASPAR
Integrated Science and Engineering Resources Data System (2007). We restrict
university R&D to federally funded research so as to avoid double-counting with the firm
R&D shown in (14)-(18). University R&D stocks are eight year, lagged stocks in
millions of 1992 dollars, depreciated at 15 percent. The R&D stock in university i and
field j at time t is
14
In contrast, firms collaborate in two percent of cases, many of these jointly authored with university
researchers and presumably written while in graduate school.

18
(19) tijt
URURK18
1)85.0(
Unlike industrial R&D, which is available by firm and year, university R&D is available
by university, field, and year. While this seems an advantage, errors in field-specific
university R&D are a countervailing disadvantage.
The measurement of knowledge flows through science citations to universities is
(20) 11
6
11
,
lft
lft
lft
ijtT
f
N
l
CITESUNIV
ijtURK
N
CS
In (20) the knowledge flows are summed over cited universities l using science
citations lft
ijtC to university papers in field f divided by university papers in year t ,
times the cited, lagged university stock1lft
URK . The citation rate is specific to field. It
is not a weighted average rate because university R&D is reported by field.
Knowledge flows by means of collaboration are similar to (20) except that
collaboration takes place within field, occurs contemporaneously, and collaboration
countslft
ijtJ replace citation counts. This simplifies the measure relative to (20). It is
(21) ljt
ljt
ljt
ijtN
l
COLLABSUNIV
ijtURK
N
JS
1
,
In the empirical work we instrument knowledge flows in (20) and (21), as before, by
lagging them by one year relative to the patent counts and citation-weighted patents that
we seek to explain. The lag structure in (20) and (21) is similar to knowledge flows from
firms except that eight-year stocks replace five-year stocks.
Equations (18)-(21) yield knowledge flows from science at the firm, field, and
year level. But this does not help us to explain patents by firm, category, and year. A

19
method for mapping patent categories to science fields is required. This problem is the
subject of the next section.
5. Assignment of Science Fields to Patent Categories
We assign knowledge flows from fields to categories as follows. First, we
transform the knowledge flows from science in a firm, field, and year (some of which are
zero) by adding 0.001 to each and taking logarithms of the result. Separately by science
field we then run Tobit equations of the transformed variables on a vector of year
dummies (t
D ) and a vector of proportions of the firm’s patents falling in different
categories (it
P ), omitting the “other” patent category. The equation is:
(22) ijtitt
X
ijtuPDS )ln(
We estimate (22) separately for each field j (biology, chemistry, computer science,
medicine, physics, and engineering) and each knowledge flow from science (FIRM,
INSIDE; FIRM, OUTSIDE; UNIV, CITE; UNIV, COLLAB). We choose patent
proportions because we want to avoid a result in which knowledge depends on the
volume of patents.
We tabulate significant positive coefficients and rank them by size across different
fields of science and thus equations, to see which sciences increase most for a one unit
increase in each patent proportion.
Table 1 displays the results from this exercise. To illustrate, consider knowledge
flows from inside papers of the firm. The largest effect of the chemical patent share is on
chemistry, the second largest is on biology, the third largest on physics, and so forth.
This is shown in the first column of Table 1 under “Citations, Same Firm Papers”.

20
Typically three science fields increase in response to a given patent share. We take
the top three fields, top two fields, and top field as sciences that are associated with a
patent category. To illustrate, consider knowledge flows through citation to papers of the
same firm, and consider the top two fields. For chemical patents, the knowledge flow
comes from chemistry and biology. For communications and software patents it comes
from computer science and physics. Likewise, the flow for drug and medical patents
derives from medicine and biology. For electrical and electronics patents it is physics
and engineering; for mechanical patents it is physics and chemistry; and for other patents
it is computer science and engineering. Any of the criteria: top three, top two, and top
field work well in the patent equations. As a compromise we choose the top two fields.
This method almost surely creates a downward bias in the measured effect of science
on patents. This is because it does not capture the use of science that is specific to
patents in a particular category: the same physics knowledge flow, for instance, affects
electrical and electronics patents as mechanical patents. And yet, despite this drawback,
science flows are significant in the patent equations.
D. Summary of Knowledge Flow Concepts
Table 2 summarizes the knowledge flow indicators from Sections III.B and III.C.
The first six are the “original” measures described by (15)-(18) and (20)-(21), while the
final six are “derived” measures that are sums of original measures.
Following (15) original measure 1 consists of knowledge flows from citations to
earlier patents of the same firm. Measure 2 consists of knowledge flows from citations to
patents of other firms and follows (16). The remaining four measures are knowledge
flows from scientific papers. Measure 3 is (17) and is based on citations to papers of the

21
same firm. Measure 4 is (18): it is based on citations to papers of other firms. The
remaining “original” measures report knowledge flows from university papers. Measure
5 is derived from citations to university papers. It follows (20). Measure 6 is derived
from collaborations on university papers and follows (21).
Table 2 concludes with six “derived” measures. Flows from all patents (measure 7)
are the sum of knowledge flows from patents inside and outside the firm—measure 1 plus
measure 2. Flows from all papers (measure 8) are the sum of knowledge flows from all
firms and universities by citation and collaboration. They are the sum of measures 3 to 6.
Measure 9 aggregates knowledge flows inside the firm from patents and papers, or
measure 1 plus measure 3. Measure 10 is the sum of knowledge flows from other firms’
patents and papers and from university papers—this is the sum of measures 2, 4, 5, and 6.
The sum of all knowledge flows from industry patents and papers, or measures 1 to 4,
yields measure 11. Flows from university papers comprise measure 12. It is the sum of
measures 5 and 6. Table 2 contains all the different concepts of knowledge flow that we
use in our study of patents. We now turn to estimates of patent production functions.
IV. Patent Production Functions
A. Patent Panel
Capitalizing on the data construction, we create a patent panel that relates current
patents of firms to lagged knowledge flows. Its dimensions consist of firm, patent
category, and year. Table 3 describes the principal variables. At the top are patent
counts and citation-weighted patents. The mean number of patents per cell is 29, while
the mean number of patents weighted by five-year forward citations is 13. Citation-

22
weighted patents are fewer than patent counts, because many patents are not cited by
patents of other Top 200 firms.
Next we report various measures of firm R&D stock. As Section III.A explains,
the basic research stock, basic plus applied stock, and stock of development are all
obtained by multiplying the firm’s total R&D stock by proportions of each of these
components of R&D in the firms’ primary industries. The mean stock of basic research
is 100 million dollars of 1992, the basic plus applied stock is 372 million, and the stock
of development is 1,284 million. The three components sum by construction to total
R&D stock, whose mean is accordingly 1,757 million.
Knowledge flows comprise the rest of Table 3. The definitions underlying these
figures consist of equations (15)-(18) and (20)-(21) in Section III. The mean flow based
on citation to patents of the same firm is 101 million. For citation-based flows to other
firms’ patents it is 113 million.
Now consider knowledge flows from science. The mean flow from papers of the
same firm is 61 million dollars. The flow from other firms’ papers is 32 million dollars
and from university papers it is 45 million. Thus, industry patent-based flows are more
than double the scientific paper-based flows, 213 million versus 92 million. Moreover,
inside knowledge flows from patents and papers amount to 161 million, as compared to
144 million of between-firm or outside flows by means of patents and papers. We
conclude that most knowledge flows to patents are patent-based. Even more of the flows
are industry-based and only 13 percent (45/351) derive from universities.
“Derived” measures complete Table 3. Outside patent and paper flows (190
million) exceed inside flows (161 million) because we group university knowledge flows

23
with flows from other firms. For convenience of interpretation we often use “derived”
knowledge flows in patent production functions. The “all patents” and “all papers”
definitions, the “inside” and “outside” measures, and the “industry” and “university”
decomposition form the specifications used in the empirical work.
B. Estimates
Table 4 presents estimates of the patent equations in which the principal variables are
the logarithm of the stock of the firm’s basic plus applied research, the logarithm of
knowledge flows through all patents, or patent-based flows; and the logarithm of
knowledge flows through all papers. These are scientific paper-based flows.
The dependent variable in equations 4.1-4.3 consists of patent counts. The method is
fixed effects Poisson, which Cameron and Trivedi (2005) view as a robust estimation for
count data15
. Fixed effects represent both firm and patent category.
In 4.1 and 4.2 we find that the elasticity of patents with respect to the firm’s research
stock is around 0.2—roughly equal to the elasticity of patent-based knowledge flows.
Both are highly significant. When we introduce the knowledge flow from all scientific
papers in 4.2, the paper-based elasticity is only 0.02, though it is significant.
Equation 4.3 adds “zero interaction terms” for knowledge flows to 4.2. These are
similar to a spline in which zero values and positive knowledge flows are taken into
account. The rationale goes back to the transformation of the knowledge flows. We
added 0.001 to the values, many of which are zero (see Table 3) in order to include the
entire sample. The estimates in 4.1 and 4.2 are thus an average over zero and positive
values. The zero interactions are products of dummy variables equal to 1 when the
15
Consistent with this, random effect Poisson or Negative Binomial estimates are similar to the estimates
shown. The key reference on this subject is Hausman, Hall, and Griliches (1984), though Cameron and
Trivedi (2005) discuss subsequent developments.

24
knowledge flow is zero and 0 when the flow is positive, and the logarithm of the
knowledge flow (plus 0.001). When the knowledge flow is zero, the zero interaction
term is ln (0.001), but when it is positive the zero interaction term disappears. When the
knowledge flow is zero, we expect the zero interaction term to cancel out the main
knowledge term. Adams and Clemmons (2006) use this specification extensively.
Equation 4.3 employs zero interactions for knowledge flows from patents and
scientific papers. As expected the interaction elasticities are negative and roughly cancel
the main elasticities. In addition, the main knowledge flow elasticities rise sharply when
interaction terms are included: the effect of knowledge is of course greater, when
positive flows occur. The coefficient of the research stock drops when knowledge
coefficients are measured separately over zero and positive domains.
Equations 4.4-4.6 are random effects Tobit estimates for citation-weighted patents,
about a fourth of which are left-truncated16
. The method controls for random effects for
the group—again this is the firm-patent category—and also for group and time. In 4.4
the elasticity for the knowledge flow from patents increases relative to the elasticity for
the firm’s research stock. In 4.5, when we include the knowledge flow from scientific
papers, the research stock becomes insignificant. The relative elasticity of the science
variable rises markedly compared with the results for patent counts. This could follow
from a difference in techniques, in part because we cannot control for fixed effects in the
Tobit equations. But the prominence of science could be a substantive difference, in that
science is more productive for highly cited inventions. In 4.6 the zero interaction term
for patent flows cancels the main effect, and as before, the main effect rises.
16
Fixed effects Tobit estimates are inconsistent in short panels like ours because of the incidental
parameters problem. Differencing and conditioning that would eliminate the fixed effects are not available
because of the nonlinearity of the likelihood. Again see Cameron and Trivedi (2005).

25
Table 5 reports results like 4.2 and 4.5 separately by industry. For patent counts
(columns (1)-(3)) the research stock and flows from all patents enter with persistent
positive and significant signs. A positive effect of science flows is not discernable in
petrochemicals or drugs and biotechnology. This is not true for citation-weighted patents
(columns (4)-(6)). Elasticities of the science flows are greatest in drugs and
biotechnology, as one would think given the science linkages for this industry.
Table 6 breaks up knowledge flows from patents and papers into flows inside and
outside of the firm. As in tables 4 and 5 6.1 and 6.2 are fixed effect Poisson estimates for
patent counts, while 6.3 and 6.4 are random effects Tobit estimates. 6.1 and 6.3 include
only inside-outside knowledge flows for patents, while 6.2 and 6.4 add inside-outside
knowledge flows for scientific papers.
In 6.1 and 6.3 the outside knowledge elasticity is double the inside elasticity. This
pattern continues when science flows are included (see 6.2 and 6.4). The pattern is still
more extreme for inside and outside science, where the only significant effect is from
outside science. We conclude that outside knowledge dominates invention: its elasticity
is larger than the elasticity for inside knowledge.
Table 7 breaks up knowledge, first, into industry knowledge flows from papers and
patents together and then university papers (7.1 and 7.3); and second, into industry
knowledge flows from patents and papers separately, then university papers (7.2 and 7.4).
Equations 7.1 and 7.3 reveal that the elasticity of industry knowledge flows is at least
four times larger than the elasticity of university flows. In 7.2 and 7.4, where we break
up patent and paper flows, most of the industry premium is shown to reside in the patent-

26
based flows. Indeed the elasticity of industry flows from science is only slightly greater
than the elasticity of university science flows.
Table 8 reports Wald tests of coefficient restrictions where equality of the coefficients
is the null hypothesis. This is done for the leading specifications of the equations in
Tables 4, 6, and 7. Equality is rejected in nearly every case. On line one, the elasticity of
the research stock is less than the patent flow elasticity in 4.2 but it is greater in 4.5 for
citation-weighted patents. On line two, the patent flow elasticity significantly exceeds
that of paper flows. The outside elasticities (Table 6, lines three and four) significantly
exceed inside elasticities in every case. Then, in Table 7, the industry patent flow
elasticity is significantly greater than both the industry and university paper flow
elasticities on lines five and six. Finally, on line seven the industry paper flow elasticity
exceeds or is equal to the university paper flow elasticity. The Wald tests in Table 8
formally confirm the significance of the differences in coefficients that we observe.
V. Scientific Paper Production Functions
A. Scientific Papers Panel
For comparison with the patent estimates we construct a panel of scientific papers,
whose dimensions are firm, science field, and year. Table 9 describes the principal
variables and the panel. The six scientific fields dominate industrial science and consist
of biology, chemistry, computer science, medicine, physics, and engineering. The time
period is 1988-1999, except for citation-weighted papers, where it is 1988-1995. The
number of observations is 4,340 for scientific papers, and 2,719 for citation-weighted
papers. In both cases we have “fractionated” the papers and citation-weighted papers to
avoid multiple counting of scientific output and to reflect co-authorship with other

27
institutions, increasingly common in science (Adams, Black, Clemmons, and Stephan,
2005). From an econometric point of view this also means that the paper data are
continuous and not integer-valued, so that count data methods are not needed.
The mean number of papers is 29 and the mean of citation-weighted papers is 74.
These are dependent variables in the empirical work that follows. About one-sixth
(448/2,719) of citation-weighted papers are left-truncated, suggesting the use of Tobit
analysis for citation-weighted data.
The various research stocks are about one-third larger than the patent panel, which
shows the larger size of firms that undertake science, even among the Top 200. For
instance, the stock of basic research in Table 9 is 146 million dollars rather than 100
million and the stock of R&D is 2,592 million rather than 1,757 million as in Table 3.
In this data set the knowledge flows all pertain to scientific papers. All are lagged one
year behind the papers and citation-weighted papers which they seek to explain17
. Since
the citation lags and the R&D stocks that enter the knowledge flow indicators are the
same as the science measures expounded in section III, effective lags amount to several
years. The mean knowledge flow from scientific papers is 111 million, of which 42
million is inside the firm, and 69 million outside of it. Of the 111 million, 66 million is
contributed by industry papers and 45 million by university papers. This is to be
contrasted with Table 3, in which 92 million was contributed by industry knowledge
flows from papers and again 45 million from university paper flows. A larger proportion
of science-based knowledge comes from the academic sector at the pre-invention stage.
Table 10 reports production functions for scientific papers. Equations 10.1 and 10.2
use fixed-effect OLS. Here the dependent variable is the logarithm of fractional papers.
17
Exploration of the role of patents in scientific papers is beyond the scope of this paper.

28
Equations 10.3 and 10.4 use random effects Tobit. Here the dependent variable is the
logarithm of fractional citation-weighted papers (plus 0.001). In 10.1 and 10.3 we
employ the inside-outside knowledge flow decomposition that Table 9 explains. In 10.2
and 10.4 we use the alternative industry-university decomposition.
The significance of the firm’s stock of basic and applied research varies, perhaps
because of the random effects approach used in the table’s second half. The elasticity of
inside knowledge ranges from 0.07 to 0.17, while the outside elasticity ranges from 0.45
to 0.86. Using both methods the inside elasticity is about one-sixth of the outside
elasticity. In the industry-university specifications the industry elasticity is less than half
the university elasticity. Thus the impact of university science exceeds that of industry
science.
Also interesting is the comparison between Table 6 and Table 10, for inside and
outside knowledge. The comparative elasticity of inside knowledge is far larger in Table
6, implying that the relative impact of knowledge outside the firm is smaller at the
inventive stage than at the pre-technology stage. Thus the scope of relevant knowledge
narrows down and begins to center on the firm, as it move towards commercialization
and increasingly depends on a sequence of R&D decisions.
Likewise, in the comparison of industry and university elasticities in Tables 7 and 10,
the industry elasticity is larger at the inventive stage, while the reverse holds at the pre-
technology stage of Table 10. The scope of relevant knowledge narrows down and
begins to center on industry, as the firm works through a sequence of phases that in the
best of outcomes results in new products and processes.

29
Table 11 concludes the empirical work by testing a set of equality restrictions on the
equations in Table 10. On line one, the hypothesis that the elasticities of the basic
research stock and the inside knowledge flow are equal is rejected in 10.1 but accepted in
10.3. On average, the inside paper elasticity is found to be greater. On lines two and
three equality of the elasticities is rejected. Thus, the outside elasticity significantly
exceeds that of the research stock and the inside knowledge flow.
Lines four and five are ambiguous as to whether the elasticity of the research stock
exceeds or falls short of the industry or university knowledge flows. But line five is
unambiguous in finding that the university elasticity exceeds the industry elasticity.
Thus, Table 11 finds that per one percent change outside knowledge flows and university
knowledge flows produce a greater percentage increase in papers and citation-weighted
papers than inside knowledge and industry knowledge.
VI. Discussion, Comparison, and Conclusion
This paper has explored the motives behind the production of inventions and
scientific discoveries in large R&D-performing enterprises and it has provided a simple
framework in which research is carried out, arguing that there are reasons for the
persistence of monopoly, based on the informational advantage of incumbents and
economies of scope in large companies having to do with science and other general forms
of knowledge.
In this paper we estimate production functions for inventions and scientific
discoveries in R&D-performing firms. The analysis treats patents and scientific papers,
sometimes weighted by their citations, as pertinent measures of inventions and
discoveries: ideas located at different removes from commercialization. In turn, ideas are

30
treated as a function of the firm’s R&D stock, of knowledge flows from its own past
inventions and discoveries, and of knowledge flows from inventions and discoveries in
other firms and in universities.
We capture the importance of different kinds of knowledge by the elasticity of ideas
with respect to each knowledge source. Our most significant findings are first, that
knowledge flows from past inventions are the most important determinant of new
inventions. Second, past scientific discoveries are also important, holding patent-based
knowledge flows constant, especially for highly cited, impactful patents.
We also explore implications of knowledge flows inside and outside the firm for the
firm’s inventions. We find that outside knowledge flows from patents issued by other
firms are more important than inside knowledge flows. In addition, industry knowledge
flows outweigh university flows in the invention production function.
Turing to production functions for firms’ scientific papers we find that papers depend
even more than patents on outside knowledge. In sharp contrast with patents, knowledge
flows from universities are more important than knowledge flows from industry,
implying that universities exert their greatest influence at early stages of industrial
research, a fact that is obscured by an exclusive reliance on patent data.
Together the findings suggest that firm’s inventions are determined by a sequence of
research that in late stages narrows the scope of knowledge flows to the firm and industry
relative to early stages of pre-technology science. Even so, science plays an appreciable
direct role in the production of patents, especially high impact patents.

31
References
Adams, James D., “Fundamental Stocks of Knowledge and Productivity Growth,”
Journal of Political Economy 98 (August 1990): 673-702
______________, “Learning, Internal Research, and Spillovers,” Economics of
Innovation and New Technology 15 (January 2006): 5-36
______________, and J. Roger Clemmons, “The NBER-Rensselaer Polytechnic Institute
Scientific Papers Database: Characteristics and Purpose,” Working Paper,
September 2006
__________________________________, and J. Roger Clemmons, “Science and
Industry: Tracing the Flow of Basic Research through Manufacturing and Trade,”
forthcoming 2008, Economics of Innovation and New Technology
__________________________________, “The Origins of Industrial Scientific
Discoveries,” Cambridge, MA, NBER Working Paper #13823, February 2008
______________, J. Roger Clemmons, and Paula E. Stephan, “Standing on Academic
Shoulders: Measuring Scientific Influence in Universities,” forthcoming, Annales
d’Economie et de Statistique
_____________, Grant Black, J. Roger Clemmons, and Paula E. Stephan, “Scientific
Teams and Institutional Collaborations: Evidence from U.S. Universities, 1981-
1999,” Research Policy 34 (April 2005): 259-285
Barro, Robert J., and Xavier Sala-i-Martin, Economic Growth, 2nd
edition, Cambridge,
Massachusetts: MIT Press, 2004

32
Blundell, Richard, Rachel Griffiths, and John Van Reenan, “Market Share, Market Value
and Innovation in A Panel of British Manufacturing Firms,” Review of Economic
Studies 66 (1999): 529-554
Etro, Federico, “Innovation by Leaders,” Economic Journal 114 (April 2004): 281-303
Evenson, Robert E., and Yoav Kislev, Agricultural Research and Productivity, New
Haven, Connecticut: Yale University Press, 1975
______________________________, “A Stochastic Model of Applied Research,”
Journal of Political Economy 84 (April 1976): 265-282
Cameron, A. Colin, and Trivedi, Pravin K., Microeconometrics: Methods and
Applications, 1st edition, New York: Cambridge University Press, 2005
Cohen, Wesley M., and Steven Klepper, “The Anatomy of Industry R&D Intensity
Distributions,” American Economic Review 82 (September 1992): 773-799
Grossman, Gene M., and Elhanan Helpman, Innovation and Growth in the Global
Economy, Cambridge, Massachusetts: MIT Press, 1991
Hall, Bronwyn H., Adam B. Jaffe, and Manuel Trajtenberg, “Market Value and Citations:
A First Look,” Cambridge, Massachusetts: NBER Working Paper No. 7741, June
2000
Hausman, Jerry, Bronwyn H. Hall, and Zvi Griliches, “Econometric Models for Count
Data with an Application to the Patents-R&D Relationship,” Econometrica 52
(1984): 909-938
Harhoff, Dietmar, Francis Narin, F.M. Scherer, and Katrin Vopel, “Citation Frequency
And the Value of Patented Inventions,” Review of Economics and Statistics 81
(August 1999): 511-515

33
Hounshell, David A., and John Kenley Smith, Jr.: Science and Corporate Strategy: Du
Pont R&D, 1902-1980, Cambridge, United Kingdom: Cambridge University
Press, 1988
Jaffe, Adam B., and Manuel Trajtenberg, Patents, Citations, and Innovations,
Cambridge, Massachusetts: MIT Press, 2002
Klette, Tor Jakob, and Zvi Griliches, “Empirical Patterns of Firm Growth and R&D
Investment: A Quality Ladder Model Interpretation,” Economic Journal 110
(April 2000): 363-387
______________, and Samuel S. Kortum, “Innovating Firms and Aggregate Innovation,”
Journal of Political Economy 112 (October 2004): 986-1018
Kortum, Samuel S., “Research, Patenting, and Technological Change,” Econometrica 65
(November 1997): 1389-1419
Mergent OnLine (2007): www.mergentonline.com.
Mueller, Willard F., “The Origins of the Basic Inventions Underlying Du Pont’s Major
Product and Process Innovations, 1920-1950,” in Richard R. Nelson, Editor, The
Rate and Direction of Inventive Activity; Social and Economic Factors,
Princeton, New Jersey: Princeton University Press for NBER, 1962
National Science Foundation (2007), Funds for Performance of Basic Research,
Applied Research, and Development, by Industry and Source of Funds,
Arlington, Virginia: www.nsf.gov/statistics/iris
Nelson, Richard R., “The Link between Science and Invention: The Case of the

34
Transistor,” in Richard R. Nelson, Editor, The Rate and Direction of Inventive
Activity: Social and Economic Factors, Princeton, New Jersey: Princeton
University Press for NBER, 1962
_______________, “The Role of Knowledge in R&D Efficiency,” Quarterly Journal of
Economics 97 (August 1982): 453-370
Scott, John T., “Firm versus Industry Variability in R&D Intensity,” in Zvi Griliches,
Editor, R&D, Patents, and Productivity, Chicago: University of Chicago Press
for NBER, 1984
Standard and Poor’s-Data Services Compustat (2007), www2.standardandpoors.com
Sutton, John, “Gibrat’s Legacy,” Journal of Economic Literature 35 (March 1997):
40-59
Thomson Scientific (2007): http://scientific.thomson.com/isi
WebCASPAR Integrated Science and Engineering Resources Data System (2007):
www.webcaspar.nsf.gov

35
Table 1
Assignment of Scientific Fields to Patent Categories,
By Type of Knowledge Flow
Type of Knowledge Flow,
Science Field
Patent Category
Chemical
Communications
& Software
Drug &
Medical
Electrical
Mechanical
Other
Citations, Same Firm Papers
Biology 2 2
Chemistry 1 3 2 1
Computer Science 1
Medicine 1
Physics 3 2 1 1 2
Engineering 3 2 3
Citations, Other Firm’s Papers
Biology 2 2
Chemistry 1 3 1 1
Computer Science 1 3
Medicine 1
Physics 3 2 1 2
Engineering 3 2 3
Citations, University Papers
Biology 2 3
Chemistry 1 2 2 1
Computer Science 1 2
Medicine 4 1
Physics 3 2 1 3
Engineering 5 3 3 1
Collaborations, University
Papers
Biology 2 2
Chemistry 1 3 1 1
Computer Science 1 3
Medicine 1
Physics 3 2 1 3
Engineering 3 2 2
Notes: Integers represent ranking of science fields. Ranks are based on Tobit equations in
which the logarithm of the science flows by field is explained by year dummies and
patent shares of by different patent categories. See the text for a further explanation.

36
Table 2
Definitions of the Knowledge Flow Indicators,
Patent Equations
Indicator
Number
Knowledge Flow Indicator
Inside/Outside
the Firm
Source of Knowledge
A. Original Measures
1 Citations, Same Firm’s Patents a
Inside Same Firm’s Patents
2 Citations, Other Firms’ Patents b
Outside Other Firms’ Patents
3 Citations, Same Firms’ Papers c
Inside Same Firm’s Scientific Papers
4 Citations, Other Firms’ Papers d Outside Other Firms’ Scientific Papers
5 Citations, University Papers e
Outside University Scientific Papers
6 Collaborations, University Papers f
Outside University Scientific Papers
B. Derived Measures
7 All Patents (1+2) Both Patents
8 All Papers (3+4+5+6) Both Scientific Papers
9 Inside Patents and Papers (1+3) Inside Same Firm’s Patents and Papers
10 Outside Patents and Papers (2+4+5+6) Outside Other Firms’ Patents and Papers
11 Industry Patents and Papers (1+2+3+4) Both All Firms’ Patents and Papers
12 University Papers (5+6) Outside University Scientific Papers
Notes: See the text for definitions of original measures. Derived measures are sums over
selected basic measures as shown in parentheses. a See equation (15).
b See equation
(16). c See equation (17).
d See equation (18).
e See equation (20).
f See equation (21).

37
Table 3
Descriptive Statistics, Patent Panel, Top 200 R&D Firms
Variable
Mean
Std. Dev.
Min
Max
Obs. Equal
to Zero
Patents 29.09 67.62 1 1785 0
Citation-Weighted Patents a 12.51 45.2 0 1635.21 1,106
Stock of R&D b
Basic Research 100.25 197.48 0 2,218.56 85
Applied Research 371.82 572.07 “ 4,868.96 “
Development 1,284.48 2,693.89 “ 24,367.03 “
Total R&D 1,756.55 3,282.16 “ 27,413.96 “
Knowledge Flow Indicators
Original Measures c
1 Citations, Same Firm’s Patents 100.60 398.69 0 14,690.19 2,272
2 Citations, Other Firms’ Patents 112.71 392.66 “ 16,354.59 1,416
3 Citations, Same Firm’s Papers d
60.72 243.27 “ 3,706.77 3,147
4 Citations, Other Firms’ Papers d
31.83 85.94 “ 1,094.90 2,785
5 Citations, University Papers d
42.38 136.64 “ 1,968.85 2,514
6 Collaborations, University Papers d
2.93 8.10 “ 117.22 2,880
Derived Measures e
7 All Patents (1+2)
213.31 744.23 0 31,044.78 1,244
8 All Papers (3+4+5+6)
137.88 422.10 “ 4,892.81 1,980
9 Inside Patents and Papers (1+3) 161.33 548.57 “ 16,216.27 1,481
10 Outside Patents and Papers (2+4+5+6) 189.86 500.53 “ 17,480.11 688
11 Industry Patents and Papers (1+2+3+4) 305.86 909.28 “ 32,917.99 716
12 University Papers (5+6) 45.32 142.95 “ 2,030.92 2,256
Notes: Period is 1982-1999. Data are a three-dimensional panel arranged by firm, patent
category, and grant year. Number of observations is 7,263 except where noted. a Citations are received from other firms. They are measured over the first five years
including the patent’s grant year. Number of observations on citation-weighted patents is
4,615, and years covered are 1988-1995, since the five-year measurement precludes grant
years 1996-1999. b R&D Stock is the lagged R&D stock of the firm computed over the
preceding five years, expressed in millions of 1992 dollars and depreciated at 15 percent
a year. c See Table 2 and the text for definitions of “original” knowledge flows.
d All of
the knowledge flows from science are based on the assignment of the top two sciences to
a patent category. See Section III.C.5 for more details. e “Derived” knowledge flows are
sums over the indicated “original” flows.

38
Table 4
Patent Production Functions with Patent- and Scientific Paper-Based Knowledge Flows
(Asymptotic Normal Statistics in Parentheses)
Variable
Or Statistic
Dependent Variable: Log
(Patents)
Dependent Variable: Log
(Citation-Weighted Patents)
Eq. 4.1
Eq. 4.2 Eq. 4.3 Eq. 4.4 Eq. 4.5 Eq. 4.6
Estimation Method Fixed Effects Poisson Random Effects Tobit
Year Dummies
Yes Yes Yes Yes Yes Yes
Log (Basic & Applied Research
Stock of the Firm) (R
)
0.216**
(0.006)
0.202**
(0.006)
0.133**
(0.005)
0.104*
(0.042)
0.014
(0.043)
-0.076
(0.041)
Log (Knowledge Flows, All
Patents) (P
)
0.187**
(0.003)
0.183**
(0.003)
0.409**
(0.004)
0.329**
(0.020)
0.314**
(0.020)
0.999**
(0.060)
Zero Interaction Term, Knowledge
Flows, All Patents
-0.508**
(-0.007)
-1.003**
(0.084)
Log (Knowledge Flows, All
Scientific Papers)( S
)
0.024**
(0.002)
0.035**
(0.003)
0.134**
(0.019)
0.102*
(0.048)
Zero Interaction Term, Knowledge
Flows, All Scientific Papers
-0.029**
(0.004)
-0.020
(0.064)
Number of Observations 7,187 7,187 7,187 4,615 4,615 4,615
Number of Groups 820 820 820 816 816 816
Average Number of Observations
Per Group
8.8 8.8 8.8 5.7 5.7 5.7
Left-Censored Observations -- -- -- 1,106 1,106 1,106
Sigma u -- -- -- 2.78 2.67 2.09
Sigma e -- -- -- 3.32 3.31 3.35
Log Likelihood -28,642.9 -28,535.7 -25,605.5 -10,804.9 -10.781.2 -10.710.0
Notes: See Table 2 and the text for a discussion of original and derived knowledge flow
indicators. A group is defined as a firm-patent category combination. Sigma u is the
square root of the variance component for firm-patent category. Sigma e is the square
root of the variance component for firm-patent category, and time. **Significant at the
1% level. * Significant at the 5% level.

39
Table 5
Patent Production Functions with Patent- and Scientific Paper-Based Knowledge Flows,
By Major Industry Group
(Asymptotic Normal Statistics in Parentheses)
Industry Group
Dependent Variable:
Log (Patents)
Dependent Variable: Log
(Citation-Weighted Patents)
Log (B
asic
& A
ppli
ed
Res
earc
h S
tock
of
the
Fir
m)
Log (K
now
ledge
Flo
ws,
All
Pat
ents
)
Log (
know
ledge
Flo
ws,
All
Sci
enti
fic
Pap
ers)
Log (B
asic
& A
ppli
ed
Res
earc
h S
tock
of
the
Fir
m)
Log (K
now
ledge
Flo
ws,
All
Pat
ents
)
Log (
know
ledge
Flo
ws,
All
Sci
enti
fic
Pap
ers)
(1) (2) (3) (4) (5) (6)
Petrochemicals 0.703**
(0.040)
0.170**
(0.008)
-0.001
(0.005)
0.514*
(0.207)
0.477**
(0.054)
0.157**
(0.005)
Drugs and Biotechnology 0.120**
(0.023)
0.066**
(0.006)
-0.058**
(0.013)
0.064
(0.130)
0.219**
(0.056)
0.343**
(0.081)
Metals, Machinery & Miscellaneous 0.567**
(0.029)
0.091**
(0.005)
0.020**
(0.003)
-0.298
(0.174)
0.447**
(0.056)
0.087
(0.051)
Computers, Communications Services,
Software & Business Services
0.054**
(0.009)
0.286**
(0.007)
0.062**
(0.004)
0.061
(0.072)
0.202**
(0.037)
0.134**
(0.038)
Electrical Equipment & Instruments 0.155**
(0.008)
0.154**
(0.005)
0.025**
(0.003)
0.043
(0.068)
0.340**
(0.039)
0.161**
(0.036)
Transportation Equipment
0.286**
(0.032)
0.171**
(0.008)
0.029**
(0.005)
0.660**
(0.210)
0.303**
(0.059)
0.133*
(0.056)
Notes: Equations are specified as in eq. 4.2 (columns (1)-(3)) or eq. 4.5 (columns (4)-
(6)) of Table 4. * Significant at the 5 percent level. ** Significant at the 1 percent level.

40
Table 6
Patent Production Functions with Inside and Outside Knowledge Flows
(Asymptotic Normal Statistics in Parentheses)
Variable
Or Statistic
Dependent Variable:
Log (Patents)
Dependent Variable:
Log (Citation-Weighted
Patents)
Eq. 6.1
Eq. 6.2 Eq. 6.3 Eq. 6.4
Estimation Method Fixed Effects Poisson Random Effects Tobit
Year Dummies
Yes Yes Yes Yes
Log (Basic & Applied Research Stock of
the Firm) (R
)
0.187**
(0.005)
0.176**
(0.006)
0.040
(0.041)
-0.036
(0.042)
Log (Inside Knowledge Flows, Patents)
( IN
P)
0.063**
(0.002)
0.061**
(0.002)
0.157**
(0.019)
0.144**
(0.019)
Log (Outside Knowledge Flows, Patents)
( OUT
P)
0.123**
(0.003)
0.121**
(0.003)
0.276**
(0.021)
0.269**
(0.021)
Log (Inside Knowledge Flows, Scientific
Papers) ( IN
S)
0.001
(0.001)
0.011
(0.023)
Log (Outside Knowledge Flows, Scientific
Papers) ( OUT
S)
0.018**
(0.002)
0.113**
(0.023)
Number of Observations 7,187 7,187 4,615 4,615
Number of Groups 820 820 816 816
Average Number of Observations
Per Group
8.8 8.8 5.7 5.7
Left-Censored Observations -- -- 1,106 1,106
Sigma u -- -- 2.47 2.38
Sigma e -- -- 3.34 3.33
Log Likelihood -28,113.72 -28,051.6 -10,763.1 -10.744.0
Notes: See Table 2 and the text for a discussion of original and derived knowledge flow
indicators. Sigma u is the square root of the variance component for firm-patent
category. Sigma e is the square root of the variance component for firm-patent category,
and time. ** Significant at the 1% level. * Significant at the 5% level.

41
Table 7
Patent Production Functions with Industry and University Knowledge Flows
(Asymptotic Normal Statistics in Parentheses)
Variable
Or Statistic
Dependent Variable:
Log (Patents)
Dependent Variable:
Log (Citation-Weighted
Patents)
Eq. 7.1
Eq. 7.2 Eq. 7.3 Eq. 7.4
Estimation Method Fixed Effects Poisson Random Effects Tobit
Year Dummies
Yes Yes Yes Yes
Log (Basic & Applied Research Stock of
the Firm) (R
)
0.167**
(0.005)
0.197**
(0.006)
0.067
(0.044)
0.006
(0.043)
Log (Industry Knowledge Flows, Patents
& Scientific Papers) ( IND
SP)
0.264**
(0.004)
0.302**
(0.024)
Log (Industry Knowledge Flows, Patents)
( IND
P)
0.182**
(0.003)
0.313**
(0.020)
Log (Industry Knowledge Flows,
Scientific Papers) ( IND
S)
0.020**
(0.002)
0.083**
(0.026)
Log (University Knowledge Flows,
Scientific Papers) ( UNIV
S)
0.010**
(0.002)
0.012**
(0.002)
0.074**
(0.023)
0.068*
(0.028)
Number of Observations 7,187 7,187 4,615 4,615
Number of Groups 820 820 816 816
Average Number of Observations
Per Group
8.8 8.8 5.7 5.7
Left-Censored Observations -- -- 1,106 1,106
Sigma u -- -- 3.09 2.65
Sigma e -- -- 3.29 3.32
Log Likelihood -28,382.3 -28,481.1 -10,839.3 -10,780.5
Notes: See Table 2 and the text for definitions of original and derived knowledge flow
indicators. Sigma u is the square root of the variance component for firm-patent category.
Sigma e is the square root of the variance component for firm-patent category, and time.
** Significant at the 1% level. * Significant at the 5% level.

42
Table 8
Tests for Equality of the Coefficients,
Patent Production Functions
Location
Test Description
Coefficient
Restriction
F-Statistics
For
Patents
F-Statistics For
Citation-Weighted
Patents
Table 4: Eq. 4.2, 4.5 R&D and Patent Elasticities equal
PR
7.5++ 34.0++
“ “ , “ Patent and Paper Elasticities equal
SP 2,358.7++
37.8++
Table 6: Eq. 6.2, 6.4 Inside Patent Elasticity and Outside
Patent Elasticity equal
OUT
P
IN
P 282.2
++ 13.6
++
“ “ , “ Inside Paper Elasticity and Outside
Paper Elasticity equal
OUT
S
IN
S 43.6
++ 6.3+
Table 7: Eq. 7.2, 7.4 Industry Patent Elasticity and Industry
Paper Elasticity equal
IND
S
IND
P 2,350.3++ 45.1++
“ “ , “ Industry Patent Elasticity and
University Paper Elasticity equal
UNIV
S
IND
P 2,495.0++ 49.8++
“ “ , “ Industry Paper Elasticity and
University Paper Elasticity equal
UNIV
S
IND
S 6.8++ 0.1
Notes: ++
Equality is rejected at the one percent level. + Equality is rejected at the five percent level.

43
Table 9
Descriptive Statistics, Scientific Papers Panel, Top 200 R&D Firms
Variable
Mean
Std. Dev.
Min
Max
Obs. Equal
to Zero
Scientific Papers 28.66 60.44 0.14 849.17 0
Citation-Weighted Papers a 73.87 245.69 0 3,657.07 448
Stock of R&D b
Basic Research 146.10 240.81 0 2,218.56 20
Applied Research 538.20 685.32 “ 4,868.96 “
Development 1,907.46 3,468.44 “ 24,367.03 “
Total R&D 2,591.77 4,162.65 “ 27,413.96 “
Knowledge Flow Indicators, Papers c
“Derived Measures” d
All Papers (3+4+5+6) 110.70 275.52 0 4,019.03 4
Inside Papers (3) 41.57 140.50 “ 2,785.90 1,191
Outside Papers (4+5+6) 69.14 157.81 “ 1,735.32 6
Industry Papers (3+4) 66.12 185.13 “ 3,293.01 491
University Papers (5+6) 44.58 107.12 “ 1,185.68 79
Notes: Period is 1982-1999. Data are a three-dimensional panel arranged by firm,
scientific field, and publication year. Number of observations is 4,340 except where
noted. a Citations are citations received from firms, and are measured over the first five
years since and including, the paper’s publication year. Number of observations on
citation-weighted patents is 2,719, and years covered are 1988-1995, since the five-year
measurement precludes publication years 1996-1999. b R&D Stock is the lagged R&D
stock of the firm computed over the preceding five years, expressed in 1992 dollars and
depreciated at 15 percent a year. c See the text and Tables 2 and 3 for definitions of
knowledge flows through scientific papers. d See Table 3 for the “Original” knowledge
flow indicators in parentheses that yield the derived measures in this table.

44
Table 10
Scientific Paper Production Functions with Inside/Outside and
Industry/University Knowledge Flows
(Asymptotic Normal Statistics in Parentheses)
Variable
Or Statistic
Dependent Variable:
Log (Scientific Papers)
Dependent Variable:
Log (Citation-Weighted
Scientific Papers)
Eq. 10.1
Eq. 10.2 Eq. 10.3 Eq. 10.4
Estimation Method Fixed Effects OLS Random Effects Tobit
Year Dummies
Yes Yes Yes Yes
Log (Basic Research Stock of the Firm)
(R
)
0.033
(0.018)
0.035
(0.018)
0.246**
(0.064)
0.370**
(0.066)
Log (Inside Knowledge Flows, Scientific
Papers) ( IN
S)
0.073**
(0.006)
0.167**
(0.027)
Log (Outside Knowledge Flows, Scientific
Papers) ( OUT
S)
0.445**
(0.015)
0.863**
(0.067)
Log (Industry Knowledge Flows,
Scientific Papers) ( IND
S)
0.130**
(0.007)
0.205**
(0.031)
Log (University Knowledge Flows,
Scientific Papers) ( UNIV
S)
0.302**
(0.014)
0.464**
(0.049)
Number of Observations 4,340 4,340 2,719 2,719
Root Mean Squared Error 0.788 0.836 -- --
R-Squared 0.751 0.720 -- --
Number of Groups -- -- 503 503
Average Number of Observations
Per Group
-- -- 5.4 5.4
Left-Censored Observations -- -- 448 448
Sigma u -- -- 2.01 2.74
Sigma e -- -- 2.86 2.77
Log Likelihood -- -- -6,392.2 -6,420.0
Notes: Sigma u is the square root of the variance component for firm-patent category.
Sigma e is the square root of the variance component for firm-patent category, and time.
** Significant at the 1% level. * Significant at the 5% level.

45
Table 11
Tests for Equality of the Coefficients,
Scientific Paper Production Functions
Location
Description of Test
Coefficient
Restriction
F-Statistics
For
Papers
F-Statistics For
Citation-Weighted
Papers
Table 10: Eq. 10.1, 10.3 R&D and Inside Paper Elasticities equal
INS
SR 4.4
+ 1.0
“ “ , “ R&D and Outside Paper Elasticities equal
OUT
SR 286.5
++ 33.0++
“ “ , “ Inside and Outside Paper Elasticities equal
OUT
S
IN
S 370.2++ 86.8++
Table 10: Eq. 10.2, 10.4 R&D and Industry Paper Elasticities equal
IND
SR 23.1++ 4.3+
“ “ , “ R&D and University Paper Elasticities equal
UNIV
SR 129.2++
1.1
“ “ , “ Industry and University Paper Elasticities
equal
UNIV
S
IND
S 89.0++
19.2++
Notes: ++
Equality is rejected at the one percent level. + Equality is rejected at the five percent level.
Related Documents