Introductory Workshop on Introductory Workshop on Grid-based Map Analysis Grid-based Map Analysis Techniques and Modeling Techniques and Modeling Presentation by Presentation by Joseph K. Berry Joseph K. Berry W.M. Keck Scholar in Geosciences, University of Denver W.M. Keck Scholar in Geosciences, University of Denver Principal, Berry & Associates // Spatial Information Systems Principal, Berry & Associates // Spatial Information Systems 2000 S. College Ave, Suite 300, Fort Collins, CO 80525 2000 S. College Ave, Suite 300, Fort Collins, CO 80525 Phone: (970) 215-0825 Email: [email protected] Phone: (970) 215-0825 Email: [email protected] Website at Website at www.innovativegis.com/basis www.innovativegis.com/basis New York State Geographic Information Systems New York State Geographic Information Systems 23 23 rd rd Annual Conference — October 1 and 2, 2007 — Albany, New York Annual Conference — October 1 and 2, 2007 — Albany, New York www.innovativegis.com/basis/present/NYGIS07/ www.innovativegis.com/basis/present/NYGIS07/ …to download workshop materials …to download workshop materials

Introductory Workshop on Grid-based Map Analysis Techniques and Modeling Presentation by Joseph K. Berry Joseph K. Berry W.M. Keck Scholar in Geosciences,
Dec 16, 2015
Welcome message from author
This document is posted to help you gain knowledge. Please leave a comment to let me know what you think about it! Share it to your friends and learn new things together.
Transcript
Introductory Workshop onIntroductory Workshop on
Grid-based Map Analysis Grid-based Map Analysis Techniques and ModelingTechniques and Modeling
Presentation byPresentation by
Joseph K. BerryJoseph K. BerryW.M. Keck Scholar in Geosciences, University of DenverW.M. Keck Scholar in Geosciences, University of Denver
Principal, Berry & Associates // Spatial Information SystemsPrincipal, Berry & Associates // Spatial Information Systems2000 S. College Ave, Suite 300, Fort Collins, CO 805252000 S. College Ave, Suite 300, Fort Collins, CO 80525
Phone: (970) 215-0825 Email: [email protected]: (970) 215-0825 Email: [email protected]
Website at Website at www.innovativegis.com/basiswww.innovativegis.com/basis
New York State Geographic Information SystemsNew York State Geographic Information Systems2323rdrd Annual Conference — October 1 and 2, 2007 — Albany, New York Annual Conference — October 1 and 2, 2007 — Albany, New York
www.innovativegis.com/basis/present/NYGIS07/ www.innovativegis.com/basis/present/NYGIS07/ …to download workshop materials…to download workshop materials

Manual map drafting …8,000 yearsManual map drafting …8,000 years
Historical Setting and GIS EvolutionHistorical Setting and GIS Evolution
Computer MappingComputer Mapping automates the cartographic process (70s) automates the cartographic process (70s)
Spatial Database ManagementSpatial Database Managementlinks computer mapping techniques with links computer mapping techniques with
traditional database capabilities (80s) traditional database capabilities (80s)
What do you think is the What do you think is the current (00s) frontiercurrent (00s) frontier?? … …but that’s another storybut that’s another story
GIS Analysis and ModelingGIS Analysis and Modeling representation of relationships withinrepresentation of relationships within
and among mapped data (90s) and among mapped data (90s)
(Berry)(Berry)(See Beyond Mapping III, “Topic 27”, (See Beyond Mapping III, “Topic 27”, www.innovativegis.com/basis ) )

Click on…Click on…
Select ThemeSelect Theme Zoom PanZoom PanInfo Info ToolTool
ThemeThemeTableTable DistanceDistance
::Object IDObject IDX,YX,YX,YX,YX,YX,Y ::
FeatureFeature SpeciesSpecies etc.etc. : :: :Object ID AwObject ID Aw : :: :
Discrete, irregular map features (objects)Discrete, irregular map features (objects)
Spatial Spatial TableTable
AttributeAttributeTableTable
Now for a Now for a Geo-Query…Geo-Query…
QueryQueryBuilderBuilder
……identify tall identify tall aspen standsaspen stands
Big …over 400,000m2 (40ha)?
(Berry)(Berry)
Desktop Mapping Framework Desktop Mapping Framework
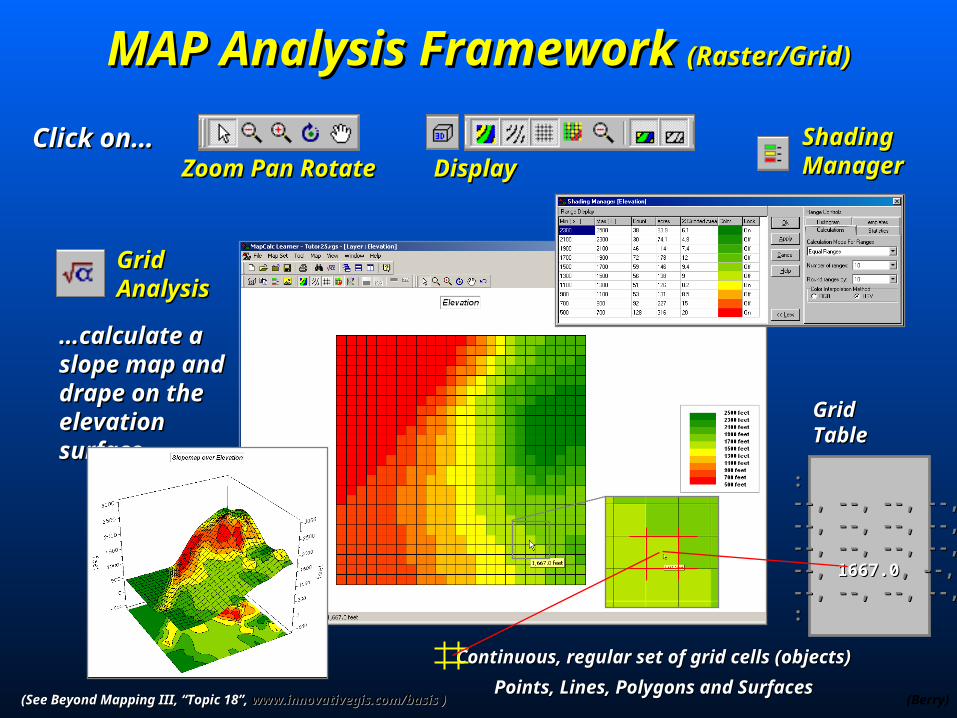
MAP Analysis FrameworkMAP Analysis Framework (Raster/Grid)(Raster/Grid)
Click on…Click on…Zoom Pan RotateZoom Pan Rotate DisplayDisplay
ShadingShadingManagerManager
(Berry)
GridGridAnalysisAnalysis
……calculate a calculate a slope map and slope map and drape on the drape on the elevation surfaceelevation surface
Continuous, regular set of grid cells (objects)Continuous, regular set of grid cells (objects)
Points, Lines, Polygons and SurfacesPoints, Lines, Polygons and Surfaces
::--, --, --, --,--, --, --, --,--, --, --, --,--, --, --, --,--, --, --, --,--, --, --, --,--, --, 1667.01667.0, --,, --,--, --, --, --,--, --, --, --,::
GridGridTableTable
(See Beyond Mapping III, “Topic 18”,(See Beyond Mapping III, “Topic 18”, www.innovativegis.com/basis ) www.innovativegis.com/basis )
Elevation Surface
(Berry)
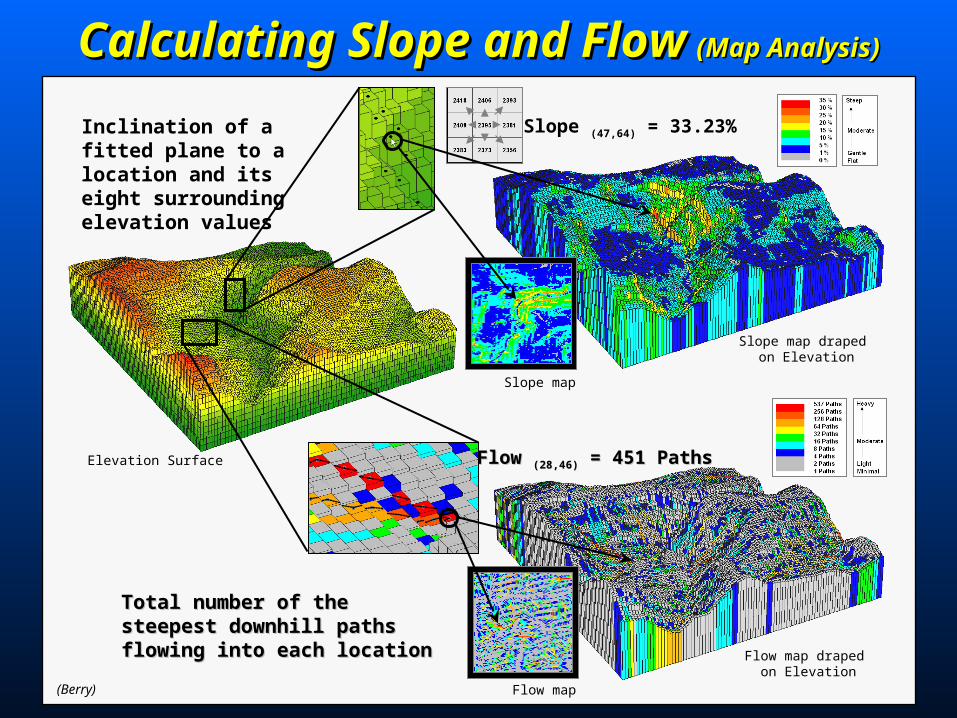
Calculating Slope and FlowCalculating Slope and Flow (Map Analysis)(Map Analysis)
Inclination of a fitted plane to a location and its eight surrounding elevation values
Total number of the steepest Total number of the steepest downhill paths flowing into each downhill paths flowing into each location location
Slope (47,64) = 33.23%
Slope map draped on Elevation
Slope map
Flow Flow (28,46)(28,46) = 451 Paths = 451 Paths
Flow map draped on Elevation
Flow map

Deriving Erosion PotentialDeriving Erosion Potential
Simple Buffer (Berry)
But reality suggests that all buffer-feet are not the same…
Need to reach farther under some conditions and not as far under others— common sense?
Flow/Slope Erosion_potentialSlope_classes
Flow_classes
Erosion PotentialErosion Potential
Flowmap
Slopemap
Erosion_potential
Streams
Erosion Buffers
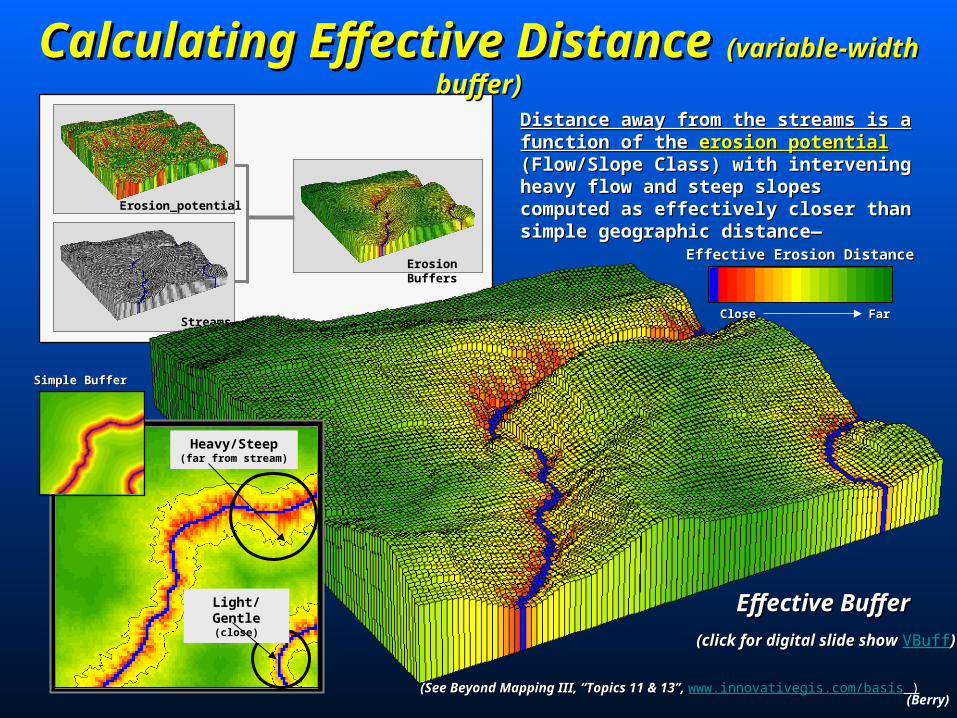
Distance away from the streams is a Distance away from the streams is a function of the function of the erosion potentialerosion potential (Flow/Slope (Flow/Slope Class) with intervening heavy flow and Class) with intervening heavy flow and steep slopes computed as effectively closer steep slopes computed as effectively closer than simple geographic distance— than simple geographic distance—
Calculating Effective DistanceCalculating Effective Distance (variable-width buffer)(variable-width buffer)
Effective BufferEffective Buffer
(click for digital slide show (click for digital slide show VBuff))
Effective Erosion DistanceEffective Erosion Distance
CloseClose FarFar
Heavy/Steep(far from stream)
Light/Gentle(close)
Simple BufferSimple Buffer
(Berry)(See Beyond Mapping III, “Topics 11 & 13”, (See Beyond Mapping III, “Topics 11 & 13”, www.innovativegis.com/basis )
Traditional StatisticsTraditional Statistics
• Mean, StDev (Normal Curve)Mean, StDev (Normal Curve)
• Central TendencyCentral Tendency
• Typical Response (scalar) Typical Response (scalar)
Minimum= 5.4 ppmMinimum= 5.4 ppmMaximum= 103.0 ppmMaximum= 103.0 ppm
Mean= 22.4 ppmMean= 22.4 ppmStDEV= 15.5StDEV= 15.5
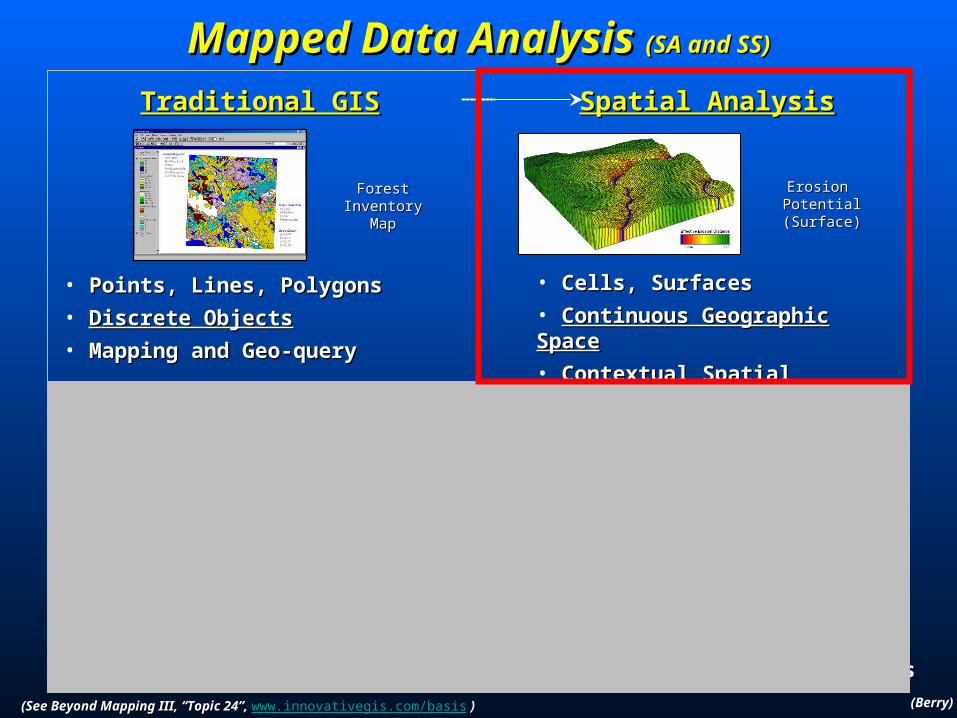
Traditional GISTraditional GIS
• Points, Lines, PolygonsPoints, Lines, Polygons
• Discrete ObjectsDiscrete Objects
• Mapping and Geo-queryMapping and Geo-query
Forest Inventory Forest Inventory MapMap
Mapped Data Analysis Mapped Data Analysis (SA and SS)(SA and SS)
Spatial AnalysisSpatial Analysis
• Cells, Surfaces Cells, Surfaces
• Continuous Geographic SpaceContinuous Geographic Space
• ContextualContextual Spatial Relationships Spatial Relationships
Erosion PotentialErosion Potential(Surface)(Surface)
Spatial StatisticsSpatial Statistics
• Map of Variance Map of Variance (gradient)(gradient)
• Spatial DistributionSpatial Distribution
• NumericalNumerical Spatial Relationships Spatial Relationships
Spatial Spatial DistributionDistribution(Surface)(Surface)
(See Beyond Mapping III, “Topic 24”, (See Beyond Mapping III, “Topic 24”, www.innovativegis.com/basis )) (Berry)

Evaluating Habitat SuitabilityEvaluating Habitat Suitability
(Berry)
AssumptionsAssumptions – Hugags – Hugags like…like…
• gentlegentle slopes slopes• southerlysoutherly aspects aspects• lowlow elevations elevations
Manual Map Overlay(Binary)
Ranking Overlay(Binary Sum)
Rating Overlay(Rating Average)
Generating maps of animal habitat…Generating maps of animal habitat…
(click for digital slide show (click for digital slide show Hugag)

CovertypeWaterMask
0= No, 1= Yes
HabitatRating
0= No, 1 to 9 Good
Constraint MapConstraint Map
SolutionSolutionMapMap
HabitatRating
Bad 1 to 9 Good
(Times 1)(Times 1)
(1)(1)
(1)(1)
Conveying Suitability Model LogicConveying Suitability Model Logic
(Berry)(See Beyond Mapping III, “Topics 22 & 23”, (See Beyond Mapping III, “Topics 22 & 23”, www.innovativegis.com/basis ) )
Interpreted Interpreted MapsMaps
gentle slopesgentle slopes
SlopePreference
Bad 1 to 9 Good
AspectPreference
Bad 1 to 9 Good
ElevationPreference
Bad 1 to 9 Good
southerly aspectssoutherly aspects
lower elevationslower elevations
Derived MapsDerived Maps
Slope
Aspect
Base MapsBase Maps
Elevation
Elevation
Elevation
FactFact JudgmentJudgment
CalibrateCalibrateAlgorithmAlgorithm WeightWeight
Reclassify
Reclassify
Reclassify
Reclassify
Overlay
Overlay
……while while ReclassifyReclassify and and OverlayOverlay operations aren’t operations aren’t very exciting, they very exciting, they are are frequently frequently usedused
Hugag.scr

HabitatRating
Bad 1 to 9 Good
gentle slopesgentle slopes
SlopePreference
Bad 1 to 9 Good
AspectPreference
Bad 1 to 9 Good
ElevationPreference
Bad 1 to 9 Good
southerly aspectssoutherly aspects
lower elevationslower elevations
Slope
Aspect
Extending Model CriteriaExtending Model Criteria
(Berry)
Elevation
Elevation
Elevation
Additional criteria can be Additional criteria can be added…added…
forestsforests
ForestPreference
Bad 1 to 9 Good
ForestProximity
Forests
—Hugags would prefer to Hugags would prefer to bebe in/near forested areas in/near forested areas
waterwater
WaterPreference
Bad 1 to 9 Good
WaterProximity
Water
—Hugags would prefer to Hugags would prefer to bebe near water near water
—Hugags are Hugags are 10 times 10 times more concerned more concerned with slope, with slope, forest and water criteriaforest and water criteria than aspect and elevationthan aspect and elevation
(Times 10)(Times 10)
(10)(10)
(10)(10)
(1)(1)
(1)(1)

Classes of Spatial Analysis Operators Classes of Spatial Analysis Operators (contextual)(contextual)
(Berry)
……all Spatial Analysis involves generating all Spatial Analysis involves generating new map valuesnew map values (numbers) as a (numbers) as a mathematical or statistical function of the values on another map layer(s)mathematical or statistical function of the values on another map layer(s)
Basic
Advanced
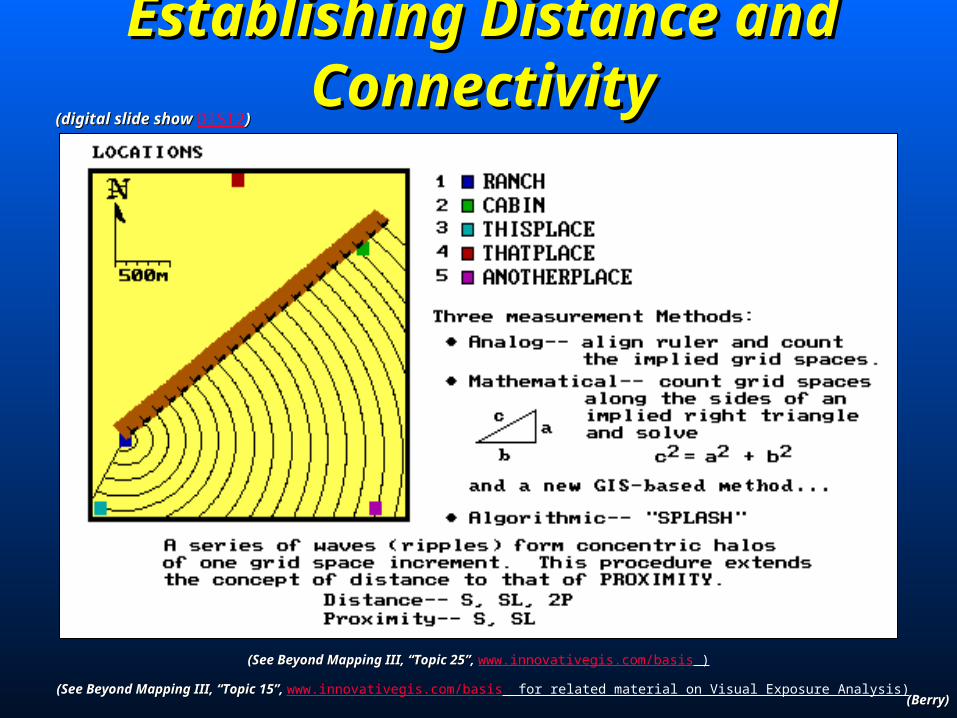
Establishing Distance and Establishing Distance and ConnectivityConnectivity
(digital slide show (digital slide show DIST2))
(Berry)(Berry)
(See Beyond Mapping III, “Topic 25”, (See Beyond Mapping III, “Topic 25”, www.innovativegis.com/basis )
(See Beyond Mapping III, “Topic 15”, (See Beyond Mapping III, “Topic 15”, www.innovativegis.com/basis for related material on Visual Exposure Analysis)

Accumulation Surface Analysis Accumulation Surface Analysis (customer (customer
travel-time)travel-time)
(Berry)(Berry)
See Beyond Mapping III, “Topics 5, 14 and 17”,See Beyond Mapping III, “Topics 5, 14 and 17”, www.innovativegis.com/basis
for more informationfor more information
……subtractingsubtracting two proximity two proximity surfaces identifies relative surfaces identifies relative advantageadvantage
ZeroZero – equidistant– equidistant
SignSign – which has the advantage– which has the advantage
MagnitudeMagnitude – advantage strength– advantage strength
(digital slide show (digital slide show TTime))
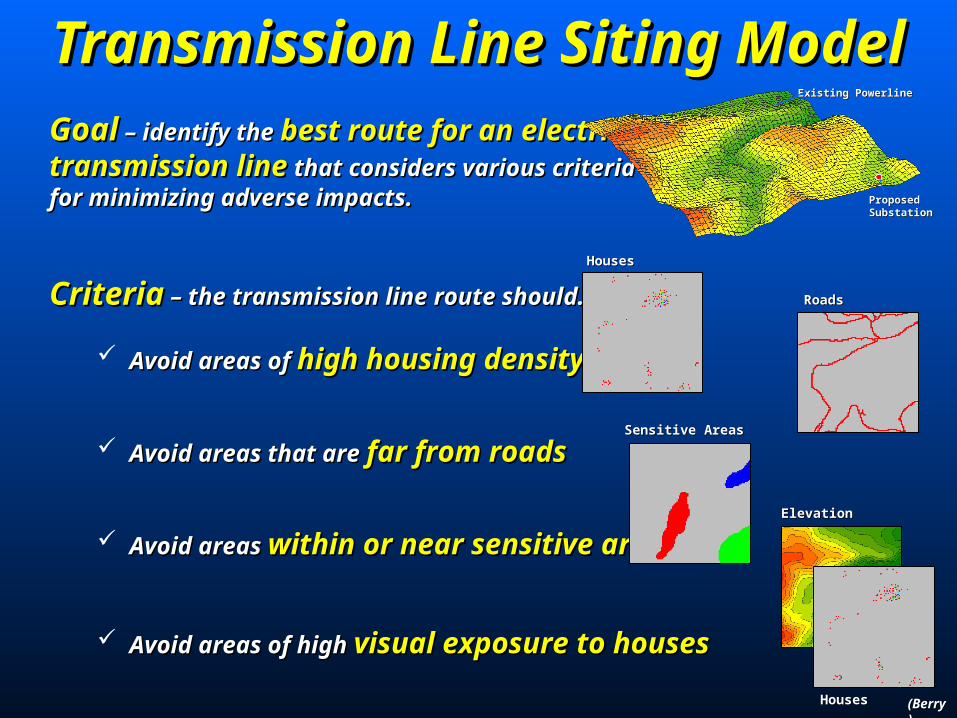
Transmission Line Siting ModelTransmission Line Siting Model
CriteriaCriteria – the transmission line route should… – the transmission line route should…
Avoid areas ofAvoid areas of high housing densityhigh housing density
Avoid areas that areAvoid areas that are far from roadsfar from roads
Avoid areasAvoid areas within or near sensitive areaswithin or near sensitive areas
Avoid areas of highAvoid areas of high visual exposure to housesvisual exposure to houses
HousesHouses
RoadsRoads
Sensitive AreasSensitive Areas
HousesHouses
ElevationElevation
GoalGoal – identify the– identify the best route for an electric best route for an electric transmission linetransmission line that considers various criteria that considers various criteria for minimizing adverse impacts.for minimizing adverse impacts.
Existing PowerlineExisting Powerline
Proposed Proposed SubstationSubstation
(Berry)(Berry)

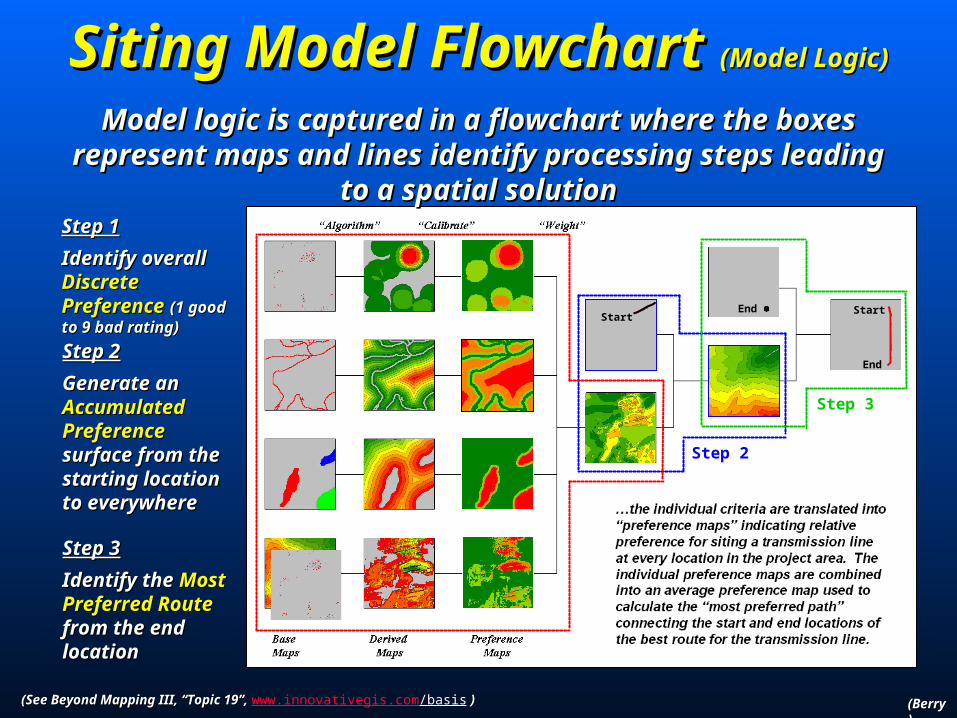
Siting Model Flowchart Siting Model Flowchart (Model Logic)(Model Logic)
Model logic is captured in a flowchart where the boxes represent Model logic is captured in a flowchart where the boxes represent maps and lines identify processing steps leading to a spatial solutionmaps and lines identify processing steps leading to a spatial solution
High Housing High Housing DensityDensity
Far from RoadsFar from Roads
In or Near In or Near Sensitive AreasSensitive Areas
High Visual High Visual Exposure Exposure ……build on this build on this single factorsingle factor
Avoid areas of…Avoid areas of…
(Berry)(Berry)
Siting Model Flowchart Siting Model Flowchart (Model Logic)(Model Logic)
Model logic is captured in a flowchart where the boxes represent Model logic is captured in a flowchart where the boxes represent maps and lines identify processing steps leading to a spatial solutionmaps and lines identify processing steps leading to a spatial solution
Step 2Step 2
Generate anGenerate an Accumulated Accumulated PreferencePreference surface surface from the starting from the starting location to location to everywhereeverywhere
Step 2
Start
Step 3Step 3
Identify theIdentify the Most Most Preferred RoutePreferred Route from the end from the end locationlocation
Step 3
End
End
Start
Step 1Step 1
Identify overall Identify overall Discrete PreferenceDiscrete Preference (1 good to 9 bad rating)(1 good to 9 bad rating)
Step 1
(See Beyond Mapping III, “Topic 19”, (See Beyond Mapping III, “Topic 19”, www.innovativegis.com/basis ) ) (Berry)(Berry)

Step 1Step 1 Discrete Preference Map Discrete Preference Map
(Berry)(Berry)
CalibrationWeighting
HDensity
RProximity
SAreas
VExposure

Step 2Step 2 Accumulated Preference Map Accumulated Preference Map
(Berry)(Berry)
Splash Algorithm – like tossing a stick into a pond with Splash Algorithm – like tossing a stick into a pond with waves emanating out waves emanating out and accumulating costsand accumulating costs as the wave front moves as the wave front moves
Animated slide set AccumSurface2.pptAnimated slide set AccumSurface2.ppt

Step 3Step 3 Most Preferred Route Most Preferred Route
(Berry)(Berry)
…steepest downhill path “re-traces” the accumulated cost wave front that got there first

Generating Optimal Path CorridorsGenerating Optimal Path Corridors
(Berry)(Berry)
Animated slide set Total_accumulation_flood.pptAnimated slide set Total_accumulation_flood.ppt

Power and Pipeline Routing Power and Pipeline Routing (Advanced GIS Models)(Advanced GIS Models)
Global routing solution Global routing solution identifies the identifies the Optimal Optimal RouteRoute (blue line) and (blue line) and
Optimal CorridorOptimal Corridor (cross-hatched) (cross-hatched)
……see Application Paper see Application Paper \GITA_Oil&Gas_04 on the Workshop CD on the Workshop CD
Infusing stakeholder perspectives into Infusing stakeholder perspectives into CalibrationCalibration and and WeightingWeighting
……of of EngineeringEngineering considerations, considerations, Natural Natural EnvironmentEnvironment consequences and consequences and Built Built
EnvironmentEnvironment impacts impacts
……see Application Paper see Application Paper \GW04_routing on the Workshop CD on the Workshop CD
(Berry)(Berry)

Modeling Wildfire RiskModeling Wildfire Risk
(Berry)(…see Application Paper (…see Application Paper \GW05_Wildfire on the Workshop CDon the Workshop CD ))
……an extensive GIS an extensive GIS model was developed to model was developed to
identify areas most likely identify areas most likely to be impacted by wildfireto be impacted by wildfire
so effective pre-so effective pre-treatment, suppression treatment, suppression and recovery plans can and recovery plans can
be developedbe developed
Increased population growth into the Increased population growth into the wildland/urban interface raises the wildland/urban interface raises the threat of disaster…threat of disaster…

Mapped Data Analysis Mapped Data Analysis (SA and SS)(SA and SS)
Traditional StatisticsTraditional Statistics
• Mean, StDev (Normal Curve)Mean, StDev (Normal Curve)
• Central TendencyCentral Tendency
• Typical Response (scalar) Typical Response (scalar)
Minimum= 5.4 ppmMinimum= 5.4 ppmMaximum= 103.0 ppmMaximum= 103.0 ppm
Mean= 22.4 ppmMean= 22.4 ppmStDEV= 15.5StDEV= 15.5
Traditional GISTraditional GIS
• Points, Lines, PolygonsPoints, Lines, Polygons
• Discrete ObjectsDiscrete Objects
• Mapping and Geo-queryMapping and Geo-query
Forest Inventory Forest Inventory MapMap
Spatial AnalysisSpatial Analysis
• Cells, Surfaces Cells, Surfaces
• Continuous Geographic SpaceContinuous Geographic Space
• ContextualContextual Spatial Relationships Spatial Relationships
Erosion PotentialErosion Potential(Surface)(Surface)
Spatial StatisticsSpatial Statistics
• Map of Variance Map of Variance (gradient)(gradient)
• Spatial DistributionSpatial Distribution
• NumericalNumerical Spatial Relationships Spatial Relationships
Spatial Spatial DistributionDistribution(Surface)(Surface)
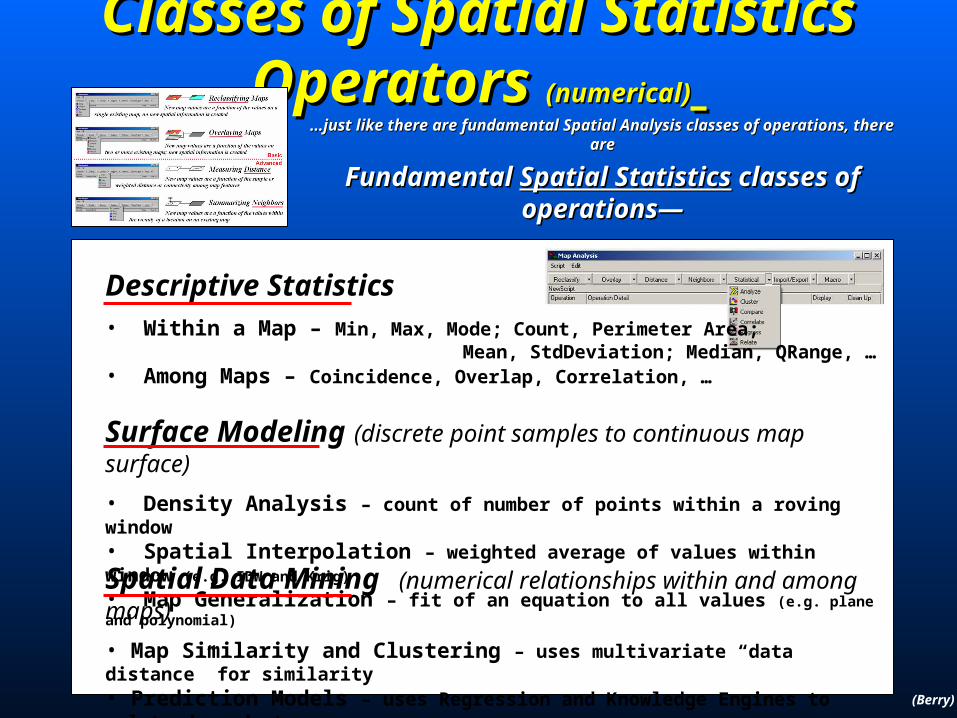
Classes of Spatial Statistics Operators Classes of Spatial Statistics Operators (numerical)(numerical)
(Berry)
……just like there are fundamental Spatial Analysis classes of operations, there arejust like there are fundamental Spatial Analysis classes of operations, there are
Fundamental Fundamental Spatial StatisticsSpatial Statistics classes of operations— classes of operations—
Descriptive Statistics• Within a Map – Min, Max, Mode; Count, Perimeter Area; Mean, StdDeviation; Median, QRange, …• Among Maps – Coincidence, Overlap, Correlation, …
Surface Modeling (discrete point samples to continuous map surface)
• Density Analysis – count of number of points within a roving window• Spatial Interpolation – weighted average of values within window (e.g. IDW and Krig)
• Map Generalization – fit of an equation to all values (e.g. plane and polynomial)
Spatial Data Mining (numerical relationships within and among maps)
• Map Similarity and Clustering – uses multivariate “data distance” for similarity• Prediction Models – uses Regression and Knowledge Engines to relate dependent and independent map variables

Statistical Nature of Mapped DataStatistical Nature of Mapped Data (descriptive)(descriptive)
(Berry)
Digital maps are linked to descriptive data by attribute Digital maps are linked to descriptive data by attribute tables (vector) or directly to tables (vector) or directly to data matricesdata matrices (grid) (grid)
……throwing the throwing the baby baby
(spatial distribution)(spatial distribution) out with the out with the bath waterbath water
(data)(data)
……most desktop mapping applications simply most desktop mapping applications simply “paint” a color corresponding to the average “paint” a color corresponding to the average regardless of numerical or spatial patternsregardless of numerical or spatial patterns of the field collected data within a parcelof the field collected data within a parcel
Map data can be generalized Map data can be generalized into a into a single statisticsingle statistic
(e.g. Mean or Median)(e.g. Mean or Median)
Red is unusually highRed is unusually high (Mean + 1 StDev)(Mean + 1 StDev)
Red is unusually highRed is unusually high (Median + 1 QRange)(Median + 1 QRange)…inconsistent
results because the data is not normally distributed—
Infeasible
(See Beyond Mapping III, “Topic 7”, (See Beyond Mapping III, “Topic 7”, www.innovativegis.com/basis ) )

Point Density AnalysisPoint Density AnalysisPoint Density analysis identifies the number of customers within Point Density analysis identifies the number of customers within
a specified distance of each grid locationa specified distance of each grid location
(Berry)
Roving Window (count)

Identifying Unusually High DensityIdentifying Unusually High DensityPockets of unusually high customer density are identified as Pockets of unusually high customer density are identified as
more than one standard deviation above the meanmore than one standard deviation above the mean
(Berry)
Unusually high customer density(>1 Stdev)

Spatial Interpolation Spatial Interpolation (Smoothing the Variability)(Smoothing the Variability)
The “The “iterative smoothingiterative smoothing” process is similar to slapping a big chunk of ” process is similar to slapping a big chunk of modeler’s clay over the “data spikes,” then taking a knife and cutting away modeler’s clay over the “data spikes,” then taking a knife and cutting away
the excess to leave a the excess to leave a continuous surfacecontinuous surface that encapsulates the peaks and that encapsulates the peaks and valleys implied in the original field samplesvalleys implied in the original field samples
……repeated repeated smoothing smoothing slowly “erodes” slowly “erodes” the data surface the data surface to a flat planeto a flat plane= = AVERAGEAVERAGE
(click for digital slide show (click for digital slide show SStat2)
(Berry)(Berry)(See Beyond Mapping III, “Topic 2” and “Topic 8”, (See Beyond Mapping III, “Topic 2” and “Topic 8”, www.innovativegis.com/basis ) )
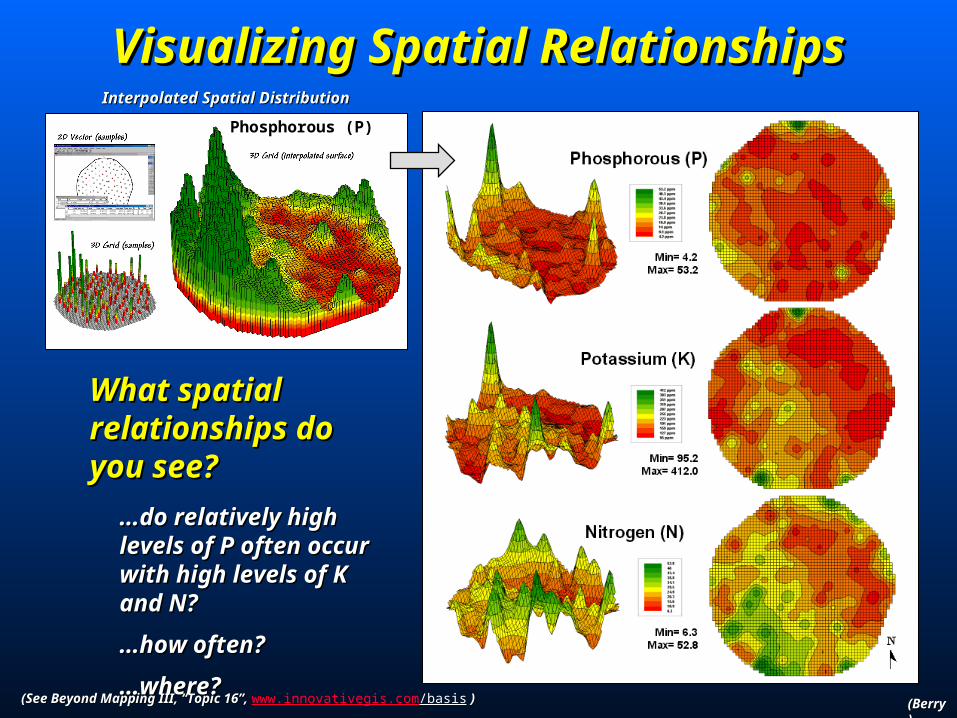
Visualizing Spatial RelationshipsVisualizing Spatial Relationships
(Berry)(Berry)
Interpolated Spatial DistributionInterpolated Spatial Distribution
Phosphorous (P)
What spatial What spatial relationships do you relationships do you see?see?
……do relatively high levels do relatively high levels of P often occur with high of P often occur with high levels of K and N?levels of K and N?
……how often?how often?
……where?where?
(See Beyond Mapping III, “Topic 16”, (See Beyond Mapping III, “Topic 16”, www.innovativegis.com/basis ) )

Geographic Space
Clustering Maps for Data ZonesClustering Maps for Data Zones
(Berry)(Berry)Variable Rate ApplicationVariable Rate Application
……apply apply different management actionsdifferent management actions for different “data zones”for different “data zones”
……groups of “floating balls” in groups of “floating balls” in data spacedata space of of locations in the field identify similar data locations in the field identify similar data patterns– patterns– data zonesdata zones
Data Space
Relatively low responses in P, K and N
Relatively high responses in P, K and N
Clustered DataZones
Map surfaces are clustered to identify data pattern groups
Geographic Space
(See Beyond Mapping III, “Topic 10”, (See Beyond Mapping III, “Topic 10”, www.innovativegis.com/basis ) )
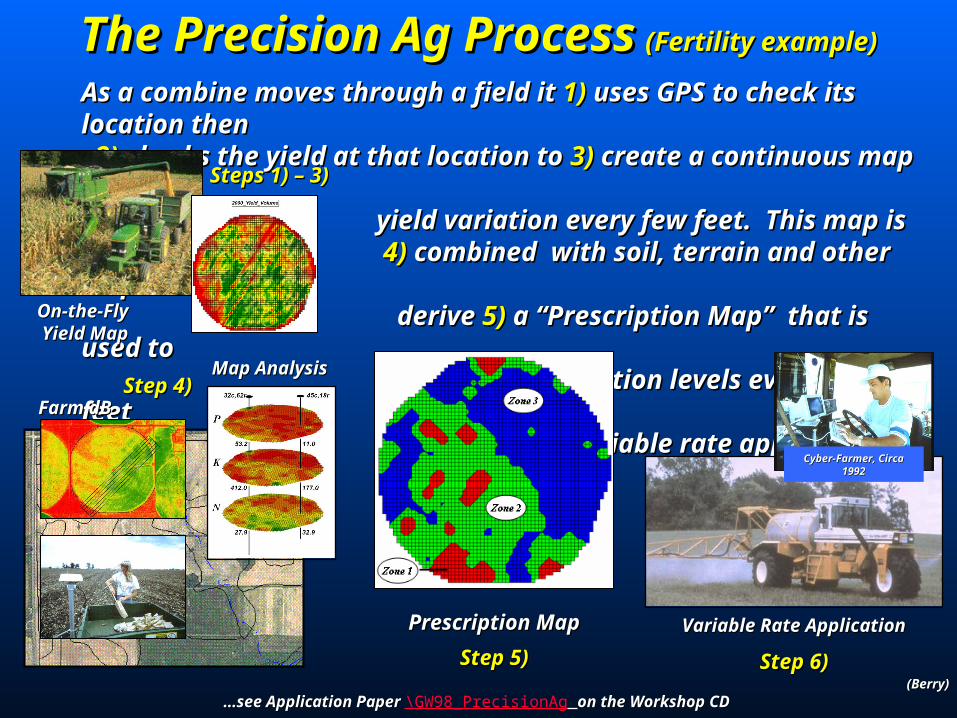
The Precision Ag ProcessThe Precision Ag Process (Fertility example)(Fertility example)
As a combine moves through a field it As a combine moves through a field it 1)1) uses GPS to check its location then uses GPS to check its location then 2)2) checks the yield at that location to checks the yield at that location to 3)3) create a continuous map of the create a continuous map of the yield variation every few feet. This map isyield variation every few feet. This map is 4)4) combined with soil, terrain and other maps to combined with soil, terrain and other maps to derive derive 5)5) a “Prescription Map” that is used to a “Prescription Map” that is used to 6)6) adjust fertilization levels every few feet adjust fertilization levels every few feet in the field (variable rate application).in the field (variable rate application).
(Berry)(Berry)
Farm dBFarm dBStep 4)Step 4)
Map AnalysisMap Analysis
On-the-Fly On-the-Fly Yield MapYield Map
Steps 1) – 3)Steps 1) – 3)
Step 6)Step 6)
Variable Rate ApplicationVariable Rate Application
Cyber-Farmer, Circa 1992Cyber-Farmer, Circa 1992
……see Application Paper see Application Paper \GW98_PrecisionAg on the Workshop CD on the Workshop CD
Prescription MapPrescription Map
Step 5)Step 5)

Spatial Data MiningSpatial Data Mining
Precision Farming is just one example of applying Precision Farming is just one example of applying spatial statistics and data mining techniquesspatial statistics and data mining techniques
(Berry)(Berry)
Mapped data that Mapped data that exhibits high exhibits high spatial spatial dependencydependency create create strong prediction strong prediction functions. As in functions. As in traditional statistical traditional statistical analysis, spatial analysis, spatial relationships can be relationships can be used to predict used to predict outcomesoutcomes
……the difference is the difference is that spatial statisticsthat spatial statisticspredicts predicts wherewhere responses will be responses will be high or lowhigh or low
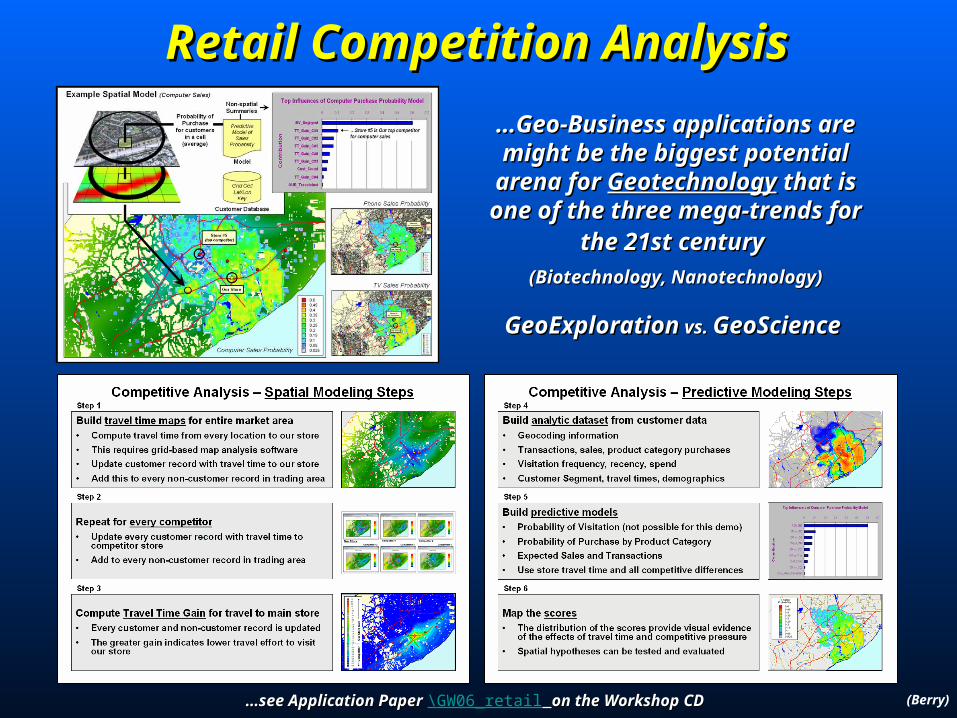
Retail Competition AnalysisRetail Competition Analysis
(Berry)
……Geo-Business applications are Geo-Business applications are might be the biggest potential arena might be the biggest potential arena for for GeotechnologyGeotechnology that is one of the that is one of the
three mega-trends for the 21st centurythree mega-trends for the 21st century (Biotechnology, Nanotechnology)(Biotechnology, Nanotechnology)
GeoExplorationGeoExploration vs. vs. GeoScience GeoScience
……see Application Paper see Application Paper \GW06_retail on the Workshop CD on the Workshop CD

Where Have We Been?Where Have We Been? Mapping Mapping (70s)(70s), Modeling , Modeling (80s)(80s) and Modeling and Modeling (90s)(90s)
Vector Vector (discrete objects)(discrete objects) vs. Raster/Grid vs. Raster/Grid (continuous surfaces)(continuous surfaces)
Spatial AnalysisSpatial Analysis — analytical tools for — analytical tools for investigating investigating CONTEXTUALCONTEXTUAL relationships within and relationships within and among map layersamong map layers
Reclassifying Maps, Overlaying Maps, Measuring Reclassifying Maps, Overlaying Maps, Measuring Distance and Connectivity, Summarizing NeighborsDistance and Connectivity, Summarizing Neighbors
GIS Modeling involves sequencing map analysis GIS Modeling involves sequencing map analysis operations to solve spatial problems (map-ematics)operations to solve spatial problems (map-ematics)
Spatial StatisticsSpatial Statistics — analytical tools for — analytical tools for investigating investigating NUMERICALNUMERICAL relationships within and relationships within and among map layersamong map layers
Descriptive Statistics (aggregate summaries)Descriptive Statistics (aggregate summaries) Surface Modeling (discrete point data to a Surface Modeling (discrete point data to a continuous spatial distribution)continuous spatial distribution) Spatial Data Mining (identifying relationships within Spatial Data Mining (identifying relationships within and among map layers)and among map layers)
Counter-intuitive?Counter-intuitive?
A bit deep?A bit deep?
Grid-based Grid-based Map AnalysisMap Analysis is more different than it is is more different than it is similar to Traditional similar to Traditional Mapping—Mapping—

What’s Next? What’s Next? (References and Homework)(References and Homework)
Joseph K. BerryJoseph K. Berry, [email protected], [email protected]
ONLINE REFERENCEONLINE REFERENCE — — see the online book see the online book Beyond Mapping IIIBeyond Mapping III (Berry, BASIS Press)(Berry, BASIS Press) that is posted at…that is posted at… www.innovativegis.com/basiswww.innovativegis.com/basis
... application papers referenced in this presentation are included on the Workshop CD... application papers referenced in this presentation are included on the Workshop CD
NEW BOOKNEW BOOK — — seesee the description of the the description of the Map AnalysisMap Analysis book book (Berry, 2007; GeoTec Media)(Berry, 2007; GeoTec Media) at…at… www.innovativegis.com/basiswww.innovativegis.com/basis
…develops a structured view of the important concepts, considerations and procedures involved in grid-based map analysis.
…the companion CD contains further readings and software for hands-on experience with the material presented.
WORKSHOP CDWORKSHOP CD — — contains the contains the PowerPoint slide set, notes, PowerPoint slide set, notes, background reading, hands-on tutorial background reading, hands-on tutorial using MapCalc Learner software using MapCalc Learner software (14-day (14-day
evaluation)evaluation)
Related Documents