Introduction to Project Management A basic introduction to common project management processes that may be typically encountered during a projects lifetime. Complied by AlNik Solutions for project managers using PMPlan products.

Introduction to Project Management A basic introduction to common project management processes that may be typically encountered during a projects lifetime.
Dec 22, 2015
Welcome message from author
This document is posted to help you gain knowledge. Please leave a comment to let me know what you think about it! Share it to your friends and learn new things together.
Transcript

Introduction to Project Management
A basic introduction to common project management processes that may be typically
encountered during a projects lifetime.
Complied by AlNik Solutions for project managers using PMPlan products.

“Robert’s Rules of Order for Project Management”
1. Get a project charter2. Create the project scope statement3. Create the WBS with the project team4. Create the activity list from the WBS5. Sequence the activities in the order in which
they must – or should – happen6. Estimate the time of the activities based on
which resources you have to complete the activities
7. Assign the needed resources to the activities8. Get it done.
From “Real Life Project Management: Managing the Project Scope” by Joseph Phillips Jan 28, 2005

Agenda of Presentation
• General Project Management
• Work Breakdown Structure
• Scheduling
• Earned Value Management
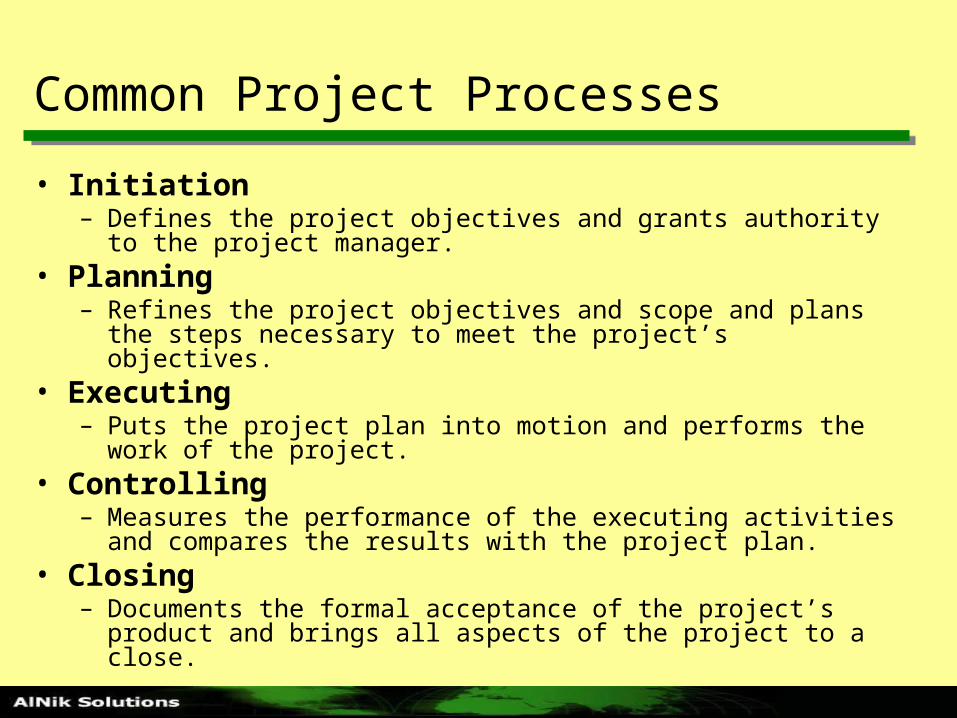
Common Project Processes
• Initiation– Defines the project objectives and grants authority to the project
manager.• Planning
– Refines the project objectives and scope and plans the steps necessary to meet the project’s objectives.
• Executing– Puts the project plan into motion and performs the work of the
project.• Controlling
– Measures the performance of the executing activities and compares the results with the project plan.
• Closing– Documents the formal acceptance of the project’s product and
brings all aspects of the project to a close.

Managing the Triple Constraint
• Project Scope– How much work is to be done? Increasing the scope
causes more work to be done, and vice versa.
• Time– The schedule of the project. Modifying the schedule
alters the start and end dates for tasks in the project and can alter the project’s overall end date.
• Cost– The cost required to accomplish the project’s
objectives. Modifying the cost of the project generally has an impact on the scope, time, or quality of the project.
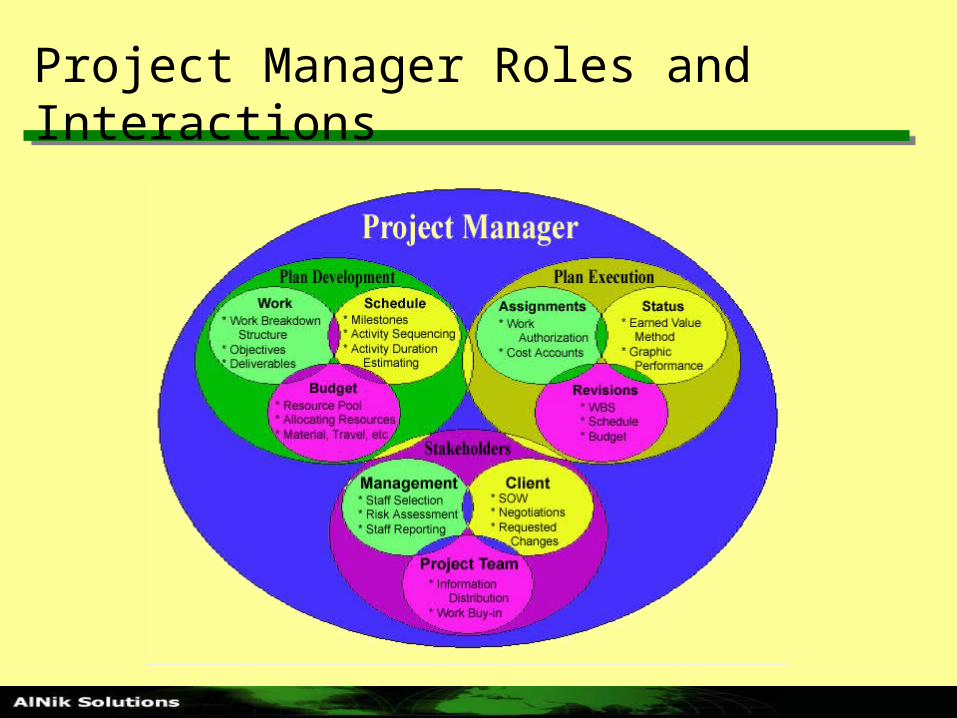
Project Manager Roles and Interactions

Elements of Developing a Project Plan
ClientSOW
WorkBreakdown Structure
ActivityDefinition
ResourcePlanning
ResourcePool
ActivitySequencing
ActivityDuration
Estimating
CostEstimating
ScheduleDevelopment
WorkPackages
Project PlanDevelopment
PMPlan can address these elements when developing the project plan.
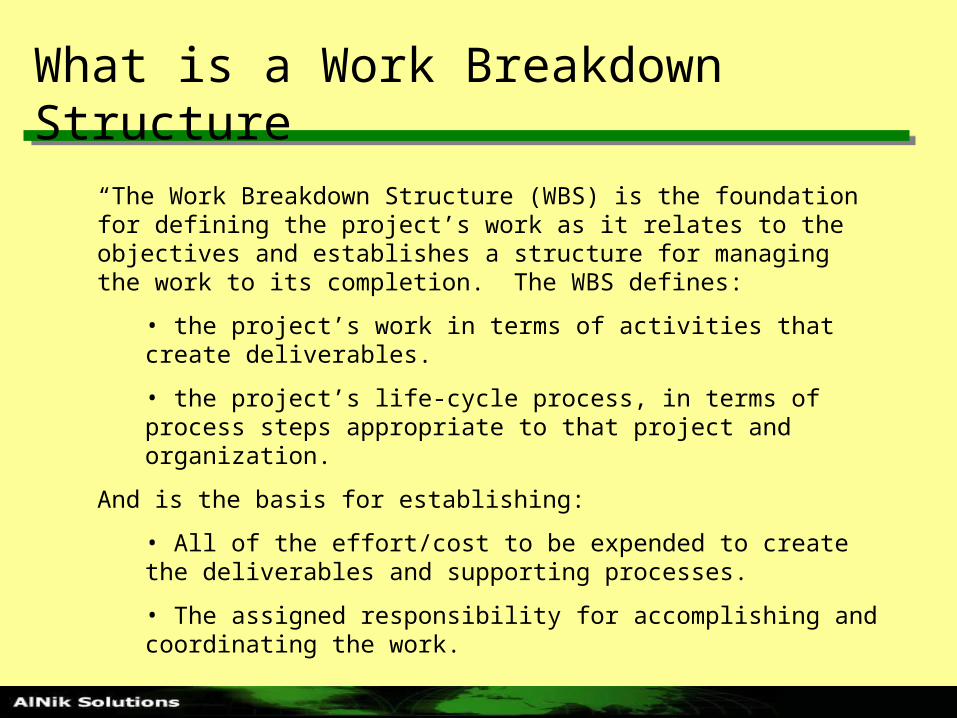
What is a Work Breakdown Structure
“The Work Breakdown Structure (WBS) is the foundation for defining the project’s work as it relates to the objectives and establishes a structure for managing the work to its completion. The WBS defines:
• the project’s work in terms of activities that create deliverables.
• the project’s life-cycle process, in terms of process steps appropriate to that project and organization.
And is the basis for establishing:
• All of the effort/cost to be expended to create the deliverables and supporting processes.
• The assigned responsibility for accomplishing and coordinating the work.
” (from the PMI Practice Standard for Work Breakdown Structures, Oct 2000)”
Good WBS Design Principles
• The 100% Rule– The WBS defines 100% of the work of the project– Anything that isn’t defined in the WBS is outside the scope of the project.– The work content on any item is the sum of what is included under that
work item
• Upper Levels are Planned outcomes (deliverables), not planned actions
• Ends of WBS include the activities needed to create the project deliverables
• Mutually-exclusive elements– Work should only appear in one place in the WBS
• WBS must be consistent with the way the project will be performed and controlled
• Must be easy to update

WBS Role
• Partition the major project deliverables into smaller components to improve the accuracy of cost estimates
• Provide a mechanism for collecting actual costs
• Provide a mechanism for performance measurement and control
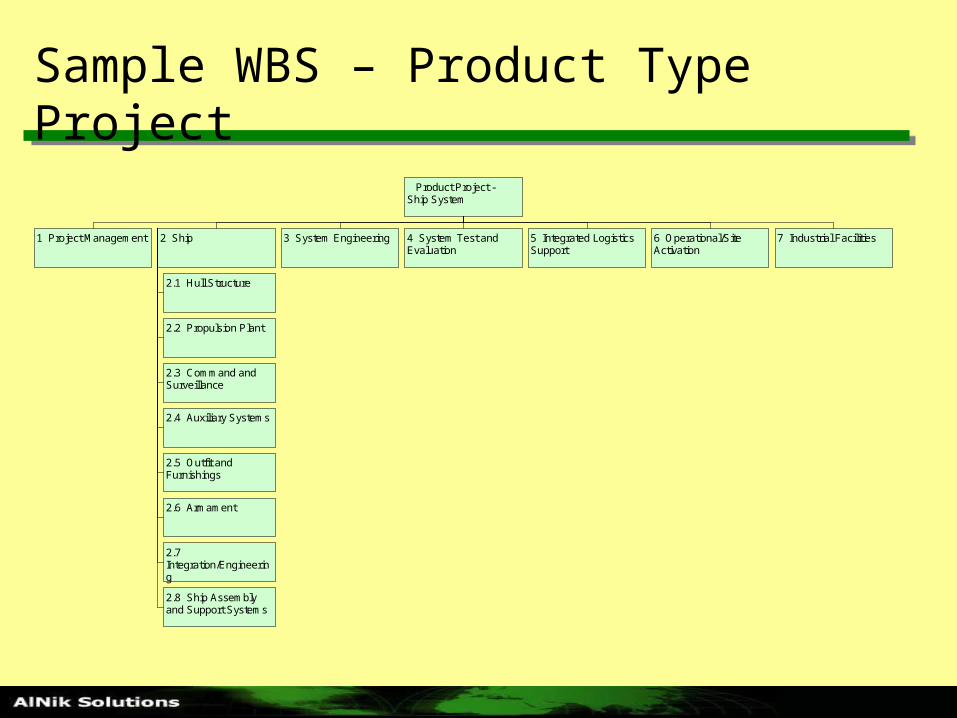
Sample WBS – Product Type Project
1 Project Management 2 Ship
2.1 Hull Structure
2.2 Propulsion Plant
2.3 Command and Surveillance
2.4 Auxiliary Systems
2.5 Outfit and Furnishings
2.6 Armament
2.7 Integration/Engineering
2.8 Ship Assembly and Support Systems
3 System Engineering
Product Project - Ship System
4 System Test and Evaluation
5 Integrated Logistics Support
6 Operational/Site Activation
7 Industrial Facilities

Sample WBS – Service Type Project
1 Project Management 2 Attendees
Service Project - International Conference Project
3 Transportation 4 Facilities 5 Program 6 Displays
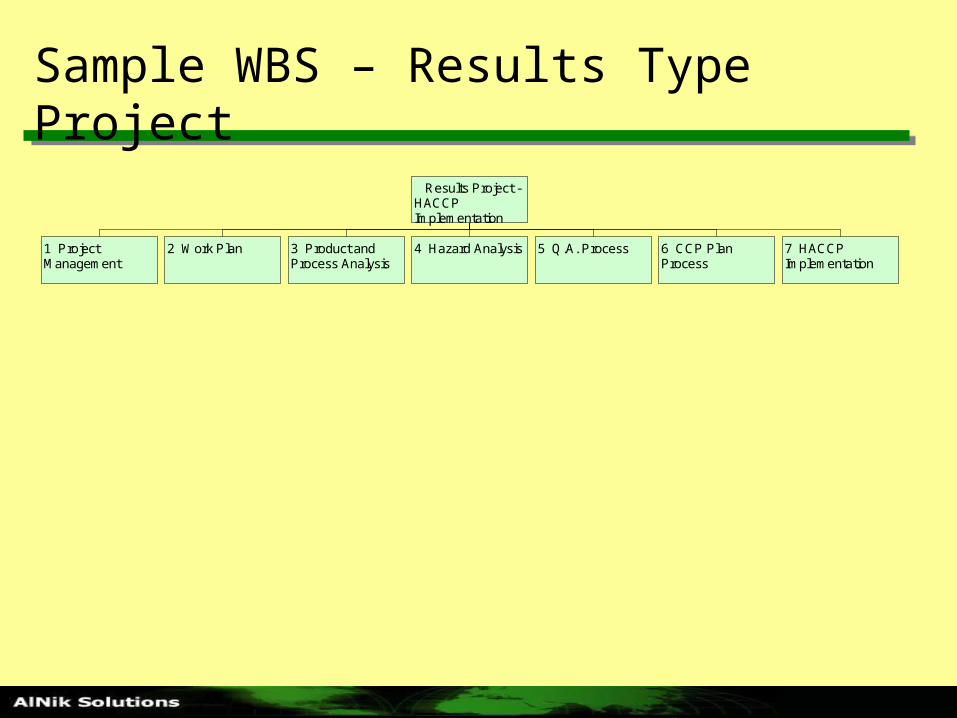
Sample WBS – Results Type Project
1 Project Management
2 Work Plan 3 Product and Process Analysis
Results Project - HACCP Implementation
4 Hazard Analysis 5 Q.A. Process 6 CCP Plan Process
7 HACCP Implementation
Why create a WBS?
• Cost Estimating
• Cost Budgeting
• Resource Planning
• Risk Management Planning
• Activity Definition

Scheduling
• Scheduling forces:– Quantification of discrete effort– Placement of tasks in proper relationship
• Two most common scheduling methodologies– Bar Charts (aka Gantt Charts)– Critical Path Method (CPM) using Precedence
Diagramming Method (PDM)

Bar / Gantt Charts Defined:
• Analyze and specify the basic approach in execution
• Segment into reasonable number of activities• Estimate the time required to perform each
activity• Manually places activities in time order
– Sequential performance– Parallel performance
• Adjust to specified completion time

Bar / Gantt Charts Advantages:
• Plan, schedule and progress are all depicted graphically on a single chart
• Easily read
• Provides simple way to schedule small undertaking
• Provides summary display of more detailed plans and schedules
• Best used for management briefings

Bar / Gantt Charts Disadvantages:
• Planning and scheduling are considered simultaneously
• Simplicity precludes sufficient detail for timely detection of slippages
• Activity dependencies cannot adequately be shown
• Difficult to determine how activity progress delays affect project completion
• Difficult to establish and maintain for large projects.
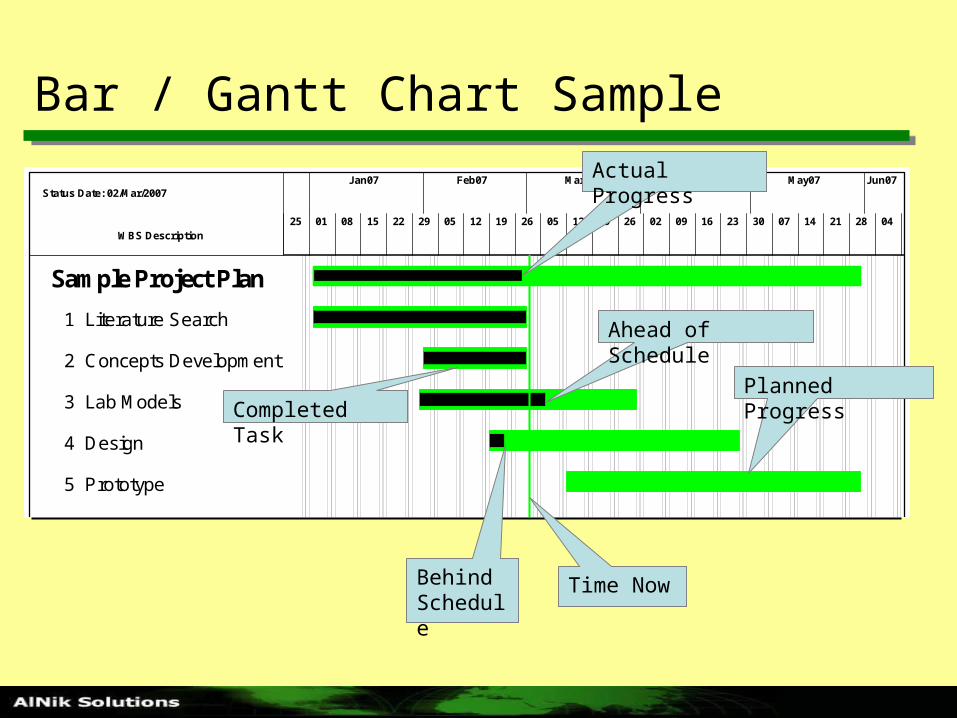
Bar / Gantt Chart Sample
25 01 08 15 22
Jan07
29 05 12 19
Feb07
26 05 12 19
Mar07
26 02 09 16 23
Apr07
30 07 14 21
May07
28 04
Jun07Status Date: 02/Mar/2007
WBS Description
Sample Project Plan
1 Literature Search
2 Concepts Development
3 Lab Models
4 Design
5 Prototype
Planned Progress
Actual Progress
Ahead of Schedule
Behind Schedule
Time Now
Completed Task

Critical Path Method Advantages:
• Identifies activities that control the project length• Determines shortest time for completion• Identifies activities that are critical (i.e. cannot be
delayed)• Shows available float for non-critical activities• Allows evaluation of “what-if” scenarios• Allows monitoring & control of fast-track projects• With software can be resource loaded and leveled
Critical Path Method Disadvantages
• Only as good as the effort put forth to properly model the plan
• Can be difficult to properly update
• Can be easily misused
• May lead to a false sense of security
• Actual conditions may necessitate significant modifications to model to accurately reflect reality
Precedence Diagramming Method (PDM)
• PDM network rules:– Activities are represented by boxes or nodes that are
assigned properties of the activity they represent– Precedences are shown by arrows that have both
direction and time properties– Precedences consist of two parts: A relationship and a
lag value or constraint• Finish – to – Start FS• Finish – to – Finish FF• Start – to – Start SS• Start – to – Finish SF
Lag = x Days ( a negative lag is
called a lead)
PDM – Precedence Diagram
• PDM activities are comprised of:– Activity descriptions– Nodes representing the activity– Arrows representing relationship / dependency– Points indicating direction of relationship /
dependency
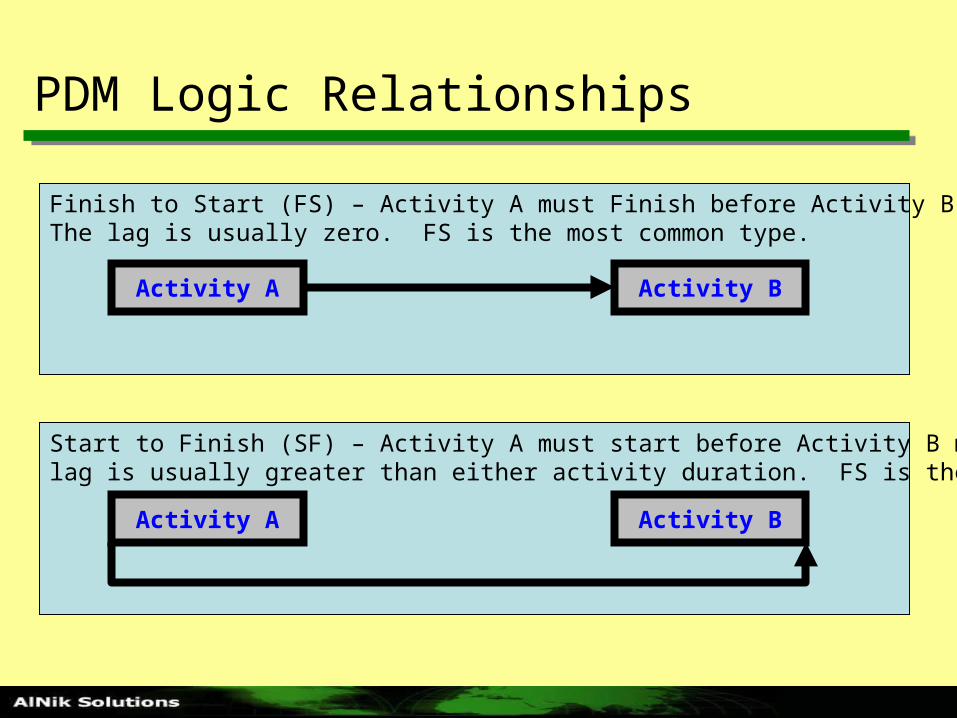
PDM Logic Relationships
Finish to Start (FS) – Activity A must Finish before Activity B may Start.The lag is usually zero. FS is the most common type.
Start to Finish (SF) – Activity A must start before Activity B may Finish. Thelag is usually greater than either activity duration. FS is the least common type.
Activity A Activity B
Activity A Activity B

PDM Logic Relationships
Finish to Finish (FF) – Activity A must Finish before Activity B may Finish.The lag value is usually greater than zero. FF is a less common type.
Start to Start (SS) – Activity A must Start before Activity B may Start.The lag value is usually greater than zero. SS is a less common type.
Activity A Activity B
Activity A Activity B

PDM Time Calculations
• Once the Network is constructed and duration of each activity is estimated, we can determined the following four time values:– Earliest Start (ES) – The earliest possible time an
activity can begin– Earliest Finish (EF) – The earliest possible time an
activity can finish– Latest Start (LS) – The latest possible time an activity
can start without delaying project completion– Latest Finish (LF) – The latest possible time an activity
can start without delaying project completion

PDM Time Calculations
• ES and EF are determined by making a Forward Pass (left-to-right) through the Network. ES of an activity is equal to the latest of early finish times of its predecessors. EF is the total of the activity ES plus its duration.
• LS and LF are determined by making a Backward Pass (right-to-left) through the Network. LF of an activity is equal to the smallest of the LS times of the activities exiting from the activity in question. LS of an activity is equal to its LF minus its duration.

PDM Activity Notation and Assumptions
• Each activity box consists of six cells
• For the following example assume all activities:– Begin on the morning of the scheduled start
date– End the evening of the scheduled finish date– Using a 7-day workdays per week calendar
4 E 611 2 13
ES EF
Activity
Duration
LS LF
0 Lag

Forward Pass Example
6 D 94
8 E 81
4 F 107
12 G 187
2
0
0
(F to G) 10 + 0 + 1 = 11(E to G) 8 + 0 + 1 = 9(D to G) 9 + 2 + 1 = 12
Largest ES
Early Start Calculations
Early Finish Calculation12 + 7 – 1 = 18

Backward Pass Example
18 H 2425 7 31
18 I 2124 4 27
18 J 1834 1 34
14 K 1719 4 22
2
0
0
(H to K) 25 - 2 - 1 = 22(I to K) 24 - 0 - 1 = 23(J to K) 34 - 0 - 1 = 33
Late Finish Calculations
Late Start Calculation22 - 4 + 1 = 19

CPM Example Exercise
A6d
B11d
C20d
H20d
J20d
D13d
E9d
F20d
G6d
I13d

CPM Example Exercise
Forward Pass Results
A6d
B11d
C20d
H20d
J20d
D13d
E9d
F20d
G6d
I13d
1d 6d 7d 17d 18d 37d 63d 82d
1d 20d 21d 33d 34d 42d 43d 62d
34d 39d 40d 52d

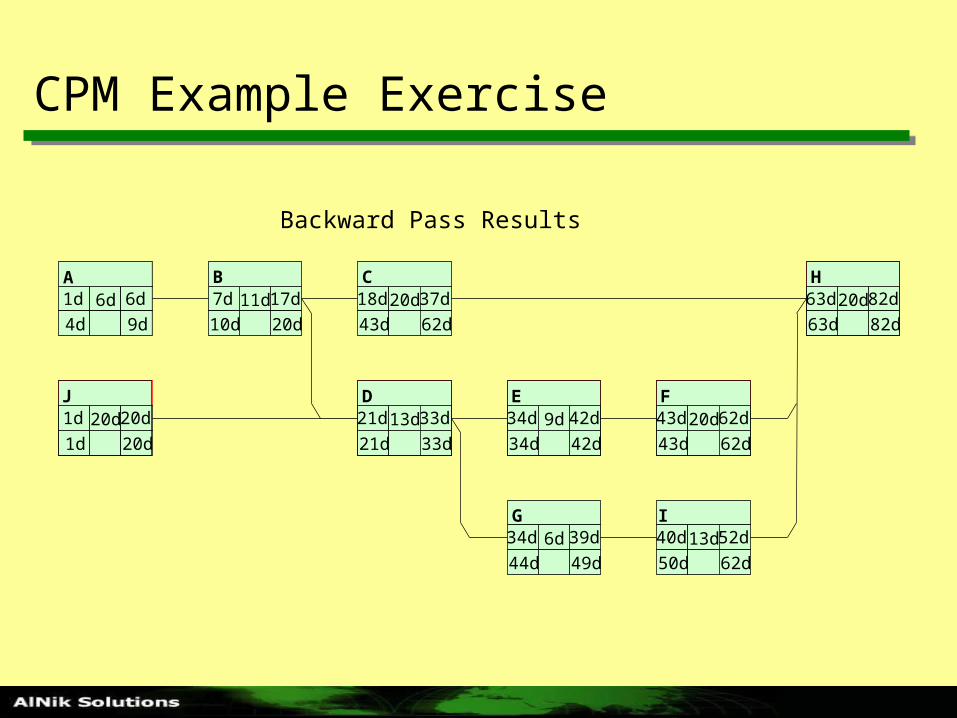
CPM Example Exercise
Backward Pass Results
A6d
B11d
C20d
H20d
J20d
D13d
E9d
F20d
G6d
I13d
1d 6d 7d 17d 18d 37d 63d 82d
1d 20d 21d 33d 34d 42d 43d 62d
34d 39d 40d 52d
4d 9d 10d 20d 43d 62d 63d 82d
1d 20d 21d 33d 34d 42d 43d 62d
44d 49d 50d 62d
CPM Example Exercise
Backward Pass Results
A6d
B11d
C20d
H20d
J20d
D13d
E9d
F20d
G6d
I13d
1d 6d 7d 17d 18d 37d 63d 82d
1d 20d 21d 33d 34d 42d 43d 62d
34d 39d 40d 52d
4d 9d 10d 20d 43d 62d 63d 82d
1d 20d 21d 33d 34d 42d 43d 62d
44d 49d 50d 62d

CPM – Float (or Slack) and Critical Path
• Additional Network calculations provides other important information allowing analysis and control:– Total Float (TF) – The amount of time an activity can
be delayed without delaying the overall project completion, which is equal to Late Finish minus Early Finish.
– Free Float (FF) – The amount of time an activity can be delayed without delaying the start of another activity. Can be determine by subtracting the smallest Total Float going into an activity from each predecessor into that activity.
– Critical Path – The path through the Network that has the longest total duration, thus it defines the shortest period of time in which the project may be completed.

Float Calculation Example
21 V 3035 10 45
29 W 3539 7 45
36 X 4046 5 50
44 Y 5044 1 50
51 Z 6051 10 60
FT = 15
FF = 5
FT = 10
FF = 0
FT = 10
FF = 0
FT = 0
FF = 0
FT = 0
FF = 0

CPM Example Exercise
Continue with Exercise
A6d
B11d
C20d
H20d
J20d
D13d
E9d
F20d
G6d
I13d
1d 6d 7d 17d 18d 37d 63d 82d
1d 20d 21d 33d 34d 42d 43d 62d
34d 39d 40d 52d
4d 9d 10d 20d 43d 62d 63d 82d
1d 20d 21d 33d 34d 42d 43d 62d
44d 49d 50d 62d

CPM Example Exercise
Float Results
A6d
B11d
C20d
H20d
J20d
D13d
E9d
F20d
G6d
I13d
1d 6d 7d 17d 18d 37d 63d 82d
1d 20d 21d 33d 34d 42d 43d 62d
34d 39d 40d 52d
4d 9d 10d 20d 43d 62d 63d 82d
1d 20d 21d 33d 34d 42d 43d 62d
44d 49d 50d 62d
3d 3d 25d 0d
0d 0d 0d 0d
10d 10d

CPM Example Exercise
Critical Path Traced
A1d 6d 6d4d 3d 9d
B7d 11d 17d10d 3d 20d
C18d 20d 37d43d 25d 62d
H63d 20d 82d63d 0d 82d
J1d 20d 20d1d 0d 20d
D21d 13d 33d21d 0d 33d
E34d 9d 42d34d 0d 42d
F43d 20d 62d43d 0d 62d
G34d 6d 39d44d 10d 49d
I40d 13d 52d50d 10d 62d

Scheduling Basics Review
• Two widely used scheduling techniques:– Bar / Gantt Charts
• Project, schedule & progress depicted on a single chart
• Easy to read• Good for management review and oversight
– Critical Path Method (CPM)• Identifies activities that control the project length• Identifies activities that are critical• Shows available float for non-critical activities

Earned Value Tracking
Earned Value (EV) based performance measurement systems “Link
Expenditures to accomplishments”
This review of Earned Value Concept will:
• Describe a simple project and its progress
• Define Earned Value and related terms
• Show how Earned Value defines project performance

Earned Value System
• Can:– Provide early (Difficult to ignore) performance
problem identification– Improve financial Reporting
• Does not:– Recognize Critical Paths
• Will not:– Take management action
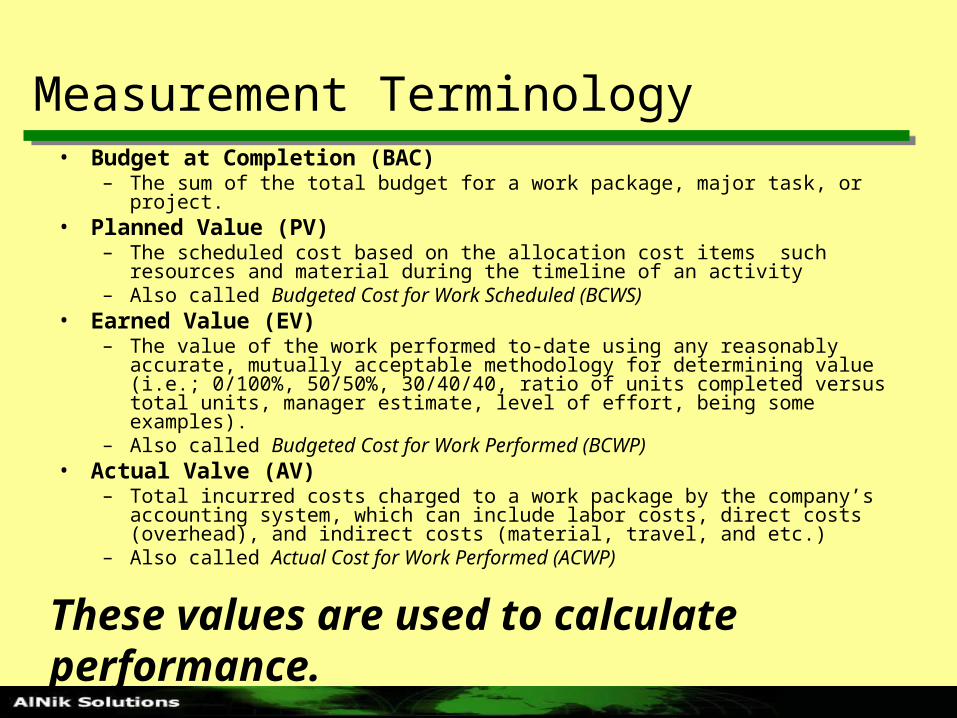
Measurement Terminology• Budget at Completion (BAC)
– The sum of the total budget for a work package, major task, or project.• Planned Value (PV)
– The scheduled cost based on the allocation cost items such resources and material during the timeline of an activity
– Also called Budgeted Cost for Work Scheduled (BCWS)• Earned Value (EV)
– The value of the work performed to-date using any reasonably accurate, mutually acceptable methodology for determining value (i.e.; 0/100%, 50/50%, 30/40/40, ratio of units completed versus total units, manager estimate, level of effort, being some examples).
– Also called Budgeted Cost for Work Performed (BCWP)• Actual Valve (AV)
– Total incurred costs charged to a work package by the company’s accounting system, which can include labor costs, direct costs (overhead), and indirect costs (material, travel, and etc.)
– Also called Actual Cost for Work Performed (ACWP)
These values are used to calculate performance.

Performance Terminology
• Cost Variance (CV)– CV = EV – AV = BCWP – ACWP
• Cost Performance Index (CPI)– The cost efficiency ratio of earned value to actual costs (CPI = EV/AV)– In PMPlan, the CPI is used to calculate Estimate at Completion (EAC)
(EAC = BAC/CPI)• Schedule Variance (SV)
– SV = EV – PV =BCWP – BCWS• Schedule Performance Index (SPI)
– The schedule efficiency ratio of earned value accomplished against planned value (SPI = EV/PV). The SPI describes what portion of the planned schedule was actually accomplished.
• Variance at Completion (VAC)– The predicted magnitude of possible underrun or overrun at completion of
work package, major task, or project (VAC = BAC – EAC)
Review of Earned Value Concept
• Will– Describe a simple project and its progress– Define earned value and related terms– Show how earned value defines project
performance
Note: Sample tables and graphics shown in following slides are from PMPlan

Schedule
• This shows a sample project schedule

Planned Budget
• The sample project is loaded with resources which results in an allocated spend plan.

Time-Phased Spend Plan
• This shows the time-phased spend plan if the project proceeds as planned.

Typical Approach of Tracking of Actual versus Planned
• The chart tells us we have spent less than planned to date, but
• We cannot tell if we are behind schedule, nor if the cost for work completed matches the actual costs.

Using Earned Value Method
• For Earned Value Method to work well you need to breakdown the project into measurable activities (Note: in PMPlan,Cost Budgeting is done at the activity level not work package).
• It is recommended that your work packages (where you accumulate actual costs) be one or two levels above the activities.
• The following five slides show different performance results of our sample project.

Example PMPlan Earned Value Worksheet
• The project manager or task leader enters either a earned percentage or a $ value.
• Actual Cost is also entered. In this worksheet, actual cost can also include open commitments such as unpaid invoices for material and equipment.
• The ‘Threshold’ is a percent of the AV to the BAC, which determines when the application uses the CPI to calculate VAC. If AV is less than ‘Threshold’, the VAC equals CV.
• Based on the data entered, this project is both behind schedule and over budget. Even though the current CV = $4,000, the VAC indicates a potential overrun of $5,517.
• The next slide shows two other views of this data.

Project has Negative SV and CV
• In the lower half of the graph, the EV is below both the PV and AC indicating problems with cost and schedule.
• The upper half of the graph shows both CPI and SPI relative to a value of 1. It is showing that progress is being made to improve the schedule, but cost problem remains.
• The black EV bars in the Gantt schedule at the right shows that ‘Design’ and ‘Prototype’ activities are behind schedule.

Status when have - SV and zero (0) CV
• The EV and AC are equal, thus actual cost are inline with accomplishments.
• Even though the project is behind schedule, the schedule variance trend shows a strong improvement in schedule.

Status when have zero (0) SV, + CV
• This project is on schedule and should be completed under budget.
• With the project all of the earned bars line up with the green status line.

Why 50% Complete may not be half the schedule bar!
• In the above sample, all three activities have earned values of 50% of BAC, but the black earned bars are not the same length even though the planned bars are the same.
• Task A is behind schedule, because 75% of the budget was to be spent by end of December.• Task B is ahead of schedule, because only 25% of the budget was to be spent by end of
December.
In Summary – an Earned Value System
• Can:– Provide early (Difficult to ignore) performance
problem identification– Improve financial Reporting
• Does not:– Recognize Critical Paths
• Will not:– Take management action

Project Management Methods Summary
• We have described three major processes used in project management– Work Breakdown Structure– Scheduling– Earned Value Management
• We are ready now to see how PMPlan can help you with these processes
Related Documents