1 CHAPTER ONE Introduction

Welcome message from author
This document is posted to help you gain knowledge. Please leave a comment to let me know what you think about it! Share it to your friends and learn new things together.
Transcript

1
CHAPTER ONE
Introduction

2
1.Introduction
1. 1 Overview
Nanotechnology is the ability to measure, design, and manipulate at the atomic,
molecular and supramolecular levels on a scale of about 1 to 100 nm in an effort to
understand, create, and use material structures, devices, and systems with fundamentally new
properties and functions attributable to their small structures [1]. All biological and man-
made systems have their first levels of organization at the nanoscale (nanocrystals, nanotubes,
and nanobiomotors), where their fundamental properties and functions are defined. The goal
in nanotechnology may be described as the ability to assemble molecules into useful objects
hierarchically integrated along several length scales and then, after use, disassemble objects
into molecules. Nature already accomplishes this in living systems and in the environment.
Nanobiomedicine is a field that applies nanoscale principles and techniques to
understanding and transforming inert materials and biosystems (nonliving, living or thinking)
for medical purposes such as drug synthesis, brain understanding, body part replacement,
visualization, and tools for medical interventions. Integration of nanotechnology with
biomedicine and biology, and with information technology and cognitive science is expected
to accelerate in the next decade [2]. Convergence of nanoscale science with modern biology
and medicine is a trend that should be reflected in science policy decisions [3].
Nanobiosystem science and engineering is one of the most challenging and fastest
growing components of nanotechnology. It is essential for better understanding of living
systems and for developing new tools for medicine and solutions for health care (such as
synthesis of new drugs and their targeted delivery, regenerative medicine, and neuromorphic
engineering). One important challenge understands the processes inside cells and neural
systems. Nanobiosystems are sources of inspiration and provide models for man-made
nanosystems. Research may lead to better biocompatible materials and nanobiomaterials for
industrial applications. The confluence of biology and nanoscience will contribute to unifying
concepts of science, engineering, technology, medicine, and agriculture [4].

3
1.2 Nanoparticles and their properties
A nanoparticle is by definition a particle where all the three dimensions are in nanometer
scale [5]. These particles exhibit electronic, optical, magnetic and chemical properties that are
very different from both the bulk and the constituent atoms or molecules [6, 7].
Nanoparticles cover a broad area of interest including electronics, medicine, food industry,
environmental applications and cosmetics [8].
1.2.1 Nanoparticle advantages
Nanoparticle, crystal and nanolayer manufacturing processes aim to take advantage of four
kinds of effects:
a) New physical, chemical or biological properties are caused by size scaling. Smaller
particle size determines larger interfacial area, an increased number of molecules on the
particle interfaces, quantum electromagnetic interactions, increased surface tension, and size
confinement effects (from electronic and optic to confined crystallization and flow
structures). The wavelike properties of the electrons inside matter are affected by shape and
volume variations on the nanometer scale. Quantum effects become significant for
organizational structures under 50 nm, and they manifest even at room temperature if their
size is less than 10 nm.
b) New phenomena are due to size reduction to the point where interaction length scales of
physical, chemical and biological phenomena (for instance, the magnetic, laser, photonic, and
heat radiation wavelengths) become comparable to the size of the particle, crystal, or
respective microstructure grain.
c) Generation of new atomic, molecular and macromolecular structures of materials by using
various routes: chemistry (three-dimensional macromolecular structures, chemical self
assembling), nanofabrication (creating nanostructures on surfaces, manipulation of three-
dimensional structures), or biotechnology (evolutionary approach, bio-templating, and three-
dimensional molecular folding).
d) Significant increase of the degree of complexity and speed of processes in particulate
systems. Time scales change because of smaller distances and the increased spectrum of
forces with intrinsically short time scales (electrostatic, magnetic, electrophoresis, radiation
pressure, others) [9].
1.2.2Nanoparticles shapes
Nanoparticles are known to exist in diverse shapes such as spherical, triangular, cubical,
pentagonal, rod-shaped, shells, ellipsoidal and so forth. Nanoparticles by themselves and

4
when used as building blocks to construct complex nanostructures such as nanochains,
nanowires, nanoclusters and nanoaggregates find use in a wide variety of applications in the
fields of electronics, chemistry, biotechnology and medicine, just to mention few: For
example, gold nanoparticles are being used to enhance electrolumin escence and quantum
efficiency in organic light emitting diodes [5].
Figure 1.1: Various shapes of gold nanoparticles [8]
1.3 Gold nanoparticles
Properties of gold nanoparticles are different from its bulk form because bulk gold is yellow
solid and it is inert in nature and used for jewelry [10]. As the noblest of all metals, gold is
very stable (e.g. it does not react with oxygen or sulphur). And are reported to be anti-oxidant
5
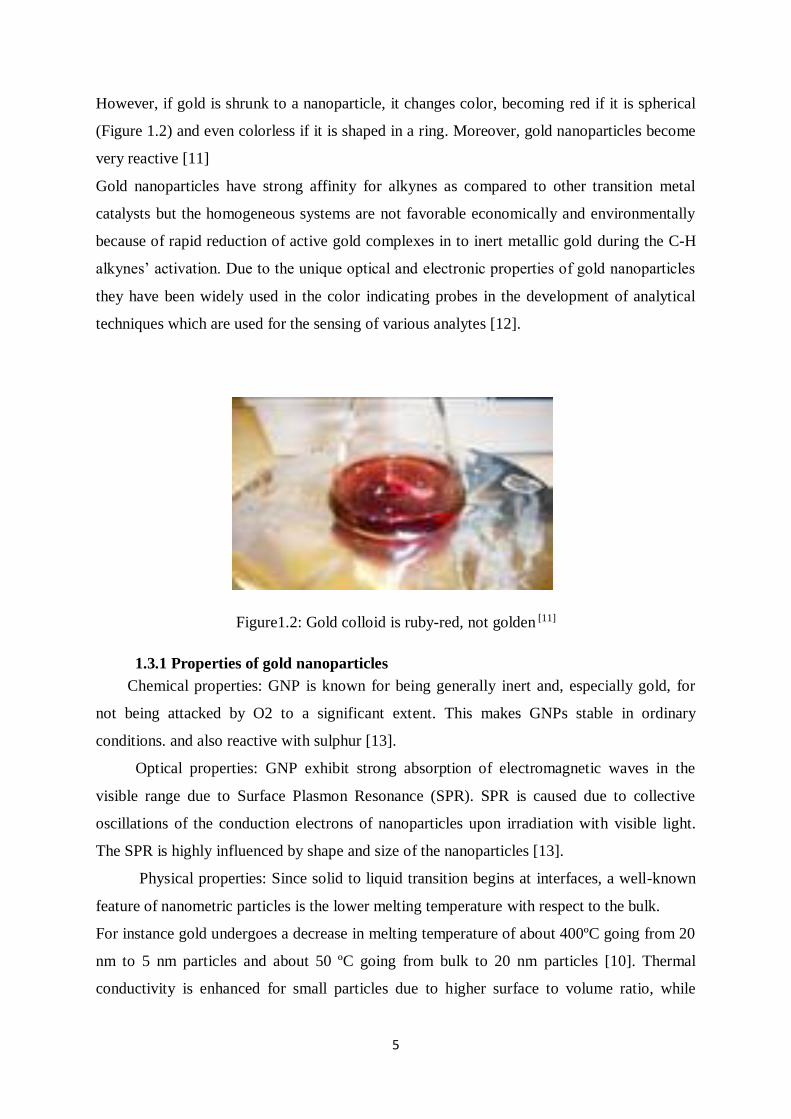
However, if gold is shrunk to a nanoparticle, it changes color, becoming red if it is spherical
(Figure 1.2) and even colorless if it is shaped in a ring. Moreover, gold nanoparticles become
very reactive [11]
Gold nanoparticles have strong affinity for alkynes as compared to other transition metal
catalysts but the homogeneous systems are not favorable economically and environmentally
because of rapid reduction of active gold complexes in to inert metallic gold during the C-H
alkynes’ activation. Due to the unique optical and electronic properties of gold nanoparticles
they have been widely used in the color indicating probes in the development of analytical
techniques which are used for the sensing of various analytes [12].
Figure1.2: Gold colloid is ruby-red, not golden [11]
1.3.1 Properties of gold nanoparticles
Chemical properties: GNP is known for being generally inert and, especially gold, for
not being attacked by O2 to a significant extent. This makes GNPs stable in ordinary
conditions. and also reactive with sulphur [13].
Optical properties: GNP exhibit strong absorption of electromagnetic waves in the
visible range due to Surface Plasmon Resonance (SPR). SPR is caused due to collective
oscillations of the conduction electrons of nanoparticles upon irradiation with visible light.
The SPR is highly influenced by shape and size of the nanoparticles [13].
Physical properties: Since solid to liquid transition begins at interfaces, a well-known
feature of nanometric particles is the lower melting temperature with respect to the bulk.
For instance gold undergoes a decrease in melting temperature of about 400ºC going from 20
nm to 5 nm particles and about 50 ºC going from bulk to 20 nm particles [10]. Thermal
conductivity is enhanced for small particles due to higher surface to volume ratio, while

6
phonons energy become higher for very small particles and Raman spectroscopy can be used
to measure cluster Size [15].
Electrical Properties: nanoparticles are good conductors, which is why they are used in
electronics and wiring. Metals are good conductors because their electrons are not bound to
individual atoms instead forming a “cloud” around the atomic cores. This cloud of electrons
is mobile allowing metal to transport charge (electrons) easily [16].
1.4 problem Statement
Failure to store and handle vaccines properly can reduce vaccine potency, resulting in
inadequate immune responses in patients and poor protection against disease.
Patients lose confidence in vaccines and their providers when revaccination is necessary
because the vaccines they received may have been compromised (exposed to inappropriate
conditions/temperatures or handled improperly).
1.5 Objective
Introduce an indicator based on the use of gold nanoparticles that detect vaccines container
temperatures change from freezing to unfreezing manners in stores and after transportation
and Distributions.
Specific objectives
1. Biosynthesis GNPs; Get stabilized, biocompatible GNPs in a clean, nontoxic
environmentally with low cost which it used in medical applications by using plant
seeds extracts.
2. Characterize GNPs by using various techniques, which provide important information
for the understanding of different physicochemical features of materials like UV-VIS
spectrophotometer and transition electron microscope.
3. Use the synthesized material to study temperature changes from freezing to
unfreezing manner and Use the study to perform vaccine container efficiency
detector.
4. Test the indicator in vaccine stores (unites refrigerators and small cold container).
5. Marketing and offering the labels for customers in cheap price.
1.6 Methodology
The concept of the new bio analytical application for the detection of vaccine freezing
temperatures' is based on the use of GNRs, located close to vaccines or eventually inside a

7
Container and refrigerators. In freezing case the GNRs bulk are colorless due to electron
relaxation.
When the temperature changes the GNRs are converted from bulk to colloidal manner and
will return to original gold color.
In the first part of this study will produce GNPs by using plant extracts as biosynthetic
method. According to black cumin seeds (Nigella sativa ) and fenugreek seeds (Trigonella
foenum-graecum) as reducing agents for the reduction of gold salts to the corresponding gold
nanoparticles. The GNPs generated through these plants-mediated processes were
characterized to give information about size and shapes for making them very useful for
biomedicine application.
In the second part, the work includes using of produced GNPs to develop vaccines container
efficiency detector which sensitive to color change when the temperature change.
The method steps:
Figure 1.3: block diagram of label design
Test the
detector
Design
irreversible
freezing
detector
Study the
color change
Based on
temperature
Synthesize and
characterize
gold
nanoparticles
8
1.7 Thesis layout
This thesis consists of five chapters: chapter one includes project introduction, problem
statement and project objectives. Then Chapter two is a Biosynthesis of Gold Nanoparticle
by Fenugreek (trigonella foenum) and black Seed (Nigella sativa ( extracts. And Chapter
three is Characterization of gold Nanoparticles While Chapter four explain the Vaccines
container detector based on gold nanoparticles. Finally Chapter five includes conclusion
and recommendations.

9
CHAPTER TWO
Biosynthesis of Gold Nanoparticle

10
2.Biosynthesis of Gold Nanoparticle
2.1 introduction
Synthesis of metal nanoparticles is one of the most active and promising areas of research in
nanotechnology because they display unique properties different from those of bulk metals
due to their unique size and shape dependent characteristics [17].
2.2 Methods of the synthesis of nanoparticles
Nanoparticles are broadly classified in to two categories, Organic nanoparticles and
inorganic nanoparticles. Organic nanoparticles include carbon nanoparticles and inorganic
nanoparticles include metal nanoparticles (Ag, Au, Pt, and Pd), magnetic nanoparticles and
semi-conductor nanoparticles (TiO2, SiO2, and ZnO2).
In general there are two processes used in the synthesis of nanoparticles: top-down
process and bottom-up process. In top-down process bulk material is broken down into
particles at nanoscale with different lithographic techniques such as grinding, milling etc, and
in bottom-up approach, atoms self-accumulate to new nuclei which convert into a particle of
nanoscale (figure 2.1) [18].
Figure 2.1: Protocols employed for synthesis of nanoparticles (a) bottom to top approach and
(b) top to bottom approach [19]
Nanoparticles can be produced by either conventional physical and chemical methods or
modern green (biological) synthesis.
11
2.2.1 Conventional methods
The conventional methods include ion sputtering, solvothermal synthesis, reduction
and sol–gel technique. However, overall these methods are energy demanding, expensive,
and are not eco-friendly. Due to the utilization of toxic chemicals and nonpolar solvents and
later on synthetic additives or capping agents, their applications in clinical and biomedical
fields are prohibited. Consequently, the need for the development of a clean, reliable,
biocompatible, benign, and ecofriendly process to synthesize nanoparticles leads to turning
researchers toward ‘green’ chemistry and bioprocesses [18].
The possibilities of employing plants in the deliberate synthesis of nanoparticles are
attracting growing interest as an important source towards a reliable and environmentally
benign method of metallic nanoparticles synthesis and its characterization (figure 2.2).
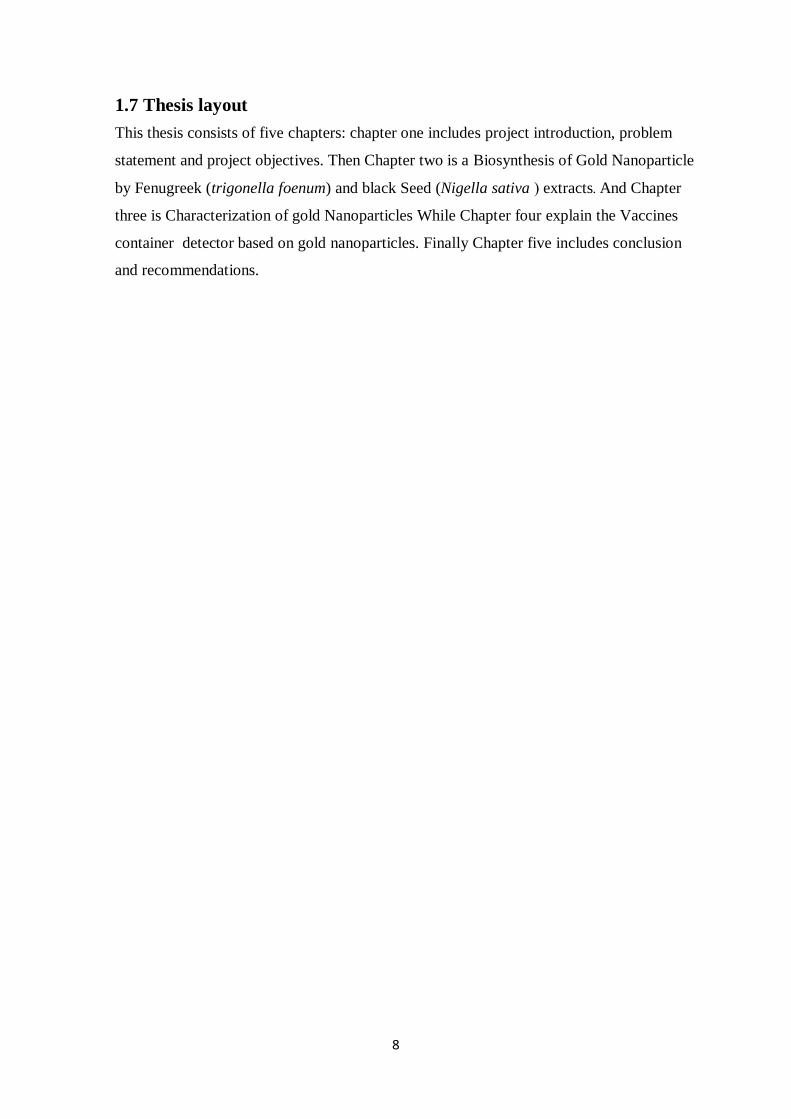
2.2.2 Green (biological) methods
The green (biological) methods of synthesizing nanoparticles using naturally occurring
reagents such as vitamins, sugars, plant extracts, biodegradable polymers and
microorganisms as reductants and capping agents are proven to be more environmental
friendly and effective. Plant parts such as leaf, root, latex, seed, and stem are being used for
metal nanoparticle synthesis. The key active agents in some of these syntheses are believed to
be polyphenols present.
Greener synthesis of nanoparticles provides advancement over other methods as it is simple,
cost-effective, and relatively reproducible and often results in more stable materials [13].
Figure 2.2: Steps involved in the synthesis of nanoparticles[18].
12
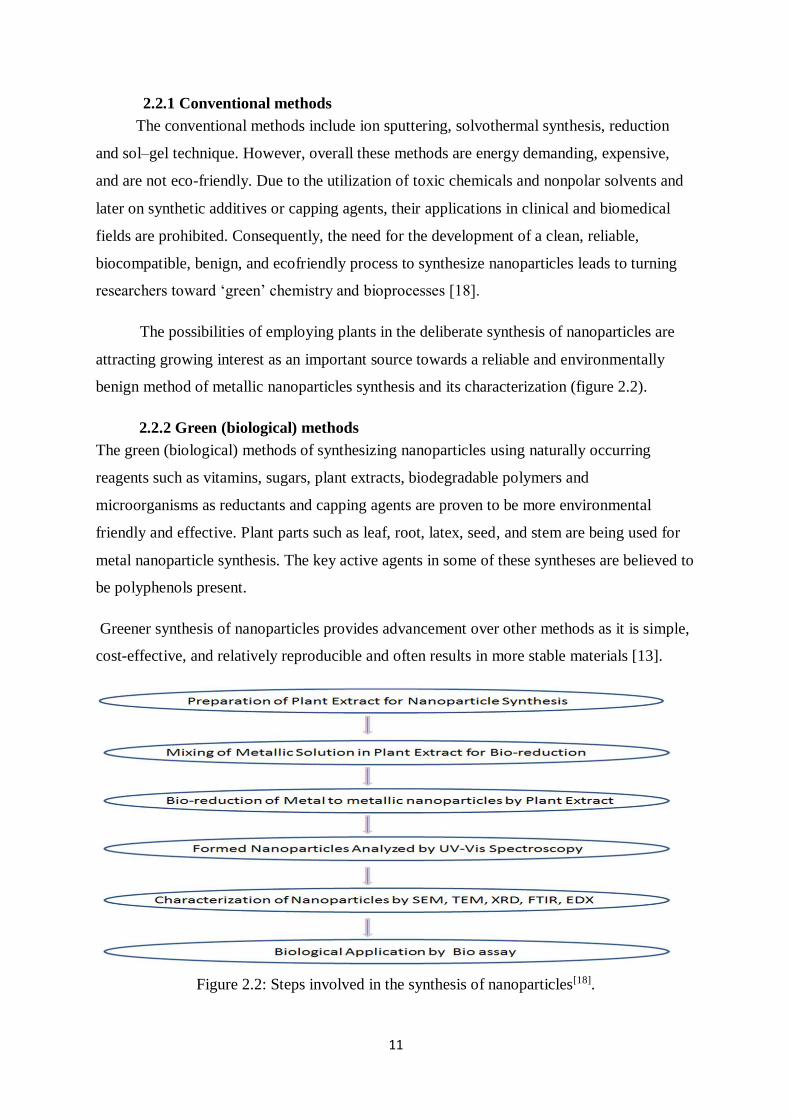
2.2.2.1 Plant seeds extract methods:
The plant extracts were prepared using unexplored two types of seeds: black seed
(Nigella sativa) and fenugreek seed (Trigonella foenum graecum). Black seed, as shown in
(figure 2.3a), is a member of the Ranonculaceae family and native to some parts of the
mediterranean region. Recently, many medical properties have been attributed to the black
cumin seeds, including antineoplastic (antitumour), antibacterial, antifungal, antihelmenthic
and treatment of asthma. The seeds which used for culinary, as well as medical purposes,
have been shown to contain high levels of antioxidants [20]. While fenugreek (T. foenum-
graecum) seed as shown in (figure 2.3b) is an herb that is commonly found growing in the
Mediterranean region of the world. While the seeds and leaves are primarily used as a
culinary spice, it is also used to treat a variety of health problems in Egypt, Greece, Italy and
South Asia. Fenugreek seeds have been found to contain protein, vitamin C, niacin,
potassium, and diosgenin (which are a compound that has properties similar to estrogen).
Other active constituents in fenugreek are alkaloids, lysine and L-tryptophan, as well as
steroidal saponins (diosgenin, yamogenin, tigogenin, and neotigogenin) [21, 22]. Fenugreek
has also been reported to exhibit pharmacological properties such as antitumor, antiviral,
antimicrobial, anti-inflammatory, hypotensive and antioxidant activity [22].
Figure 2.3: (a): Blak seed (Nigella sativa) (b): Fenugreek seed(Trigonellafoenum
graecum)
13
2.3 Reviewof gold nanoparticles syntheses
2.3.1 Review of synthesis gold nanoparticles by plant
In 2014 in batra et al, they develop research about “Phytofabrication of nanoparticles through
plant as nanofactories”.In recent years, nanoscience and nanotechnology have emerged as a
new area of fundamental science and are receiving global attention due to their extensive
applications. Conventionally nanoparticles were manufactured by physical and chemical
techniques. The recent development and implementation of new technologies have led to a
new trend, the nano-revolution unfolding the role of plants in bio- and green synthesis of
nanoparticles which seems to have drawn a quite unequivocal attention to the synthesis of
stable nanoparticles. Although nanoparticles can be synthesized through many conventional
methods, biological route of the synthesis is more competent than the physical and chemical
techniques. Biologically synthesized nanoparticles have enjoyed an upsurge of applications in
various sectors. Hence, the present study envisions biosynthesis of nanoparticles from plants
which are emerging as nanofactories. Hence, the present review summarizes the literature
reported thus far and envisions plants as emerging sources of nanofactories along with
applications, the mechanism behind phytosynthesis of nanoparticles and the mechanism of
antibacterial action of nanoparticles [23].
2.3.2 Review of synthesis gold nanoparticles by Fenugreek seed
s.Aswathy etal developed new synthesis methods for monodispersed nanocrystals using
cheap and nontoxic chemicals, environmentally benign solvents and renewable materials
remains a challenge to the scientific community. Most of the current methods involve known
protocols which may be potentially harmful to either environment or human health. Recent
research has been focused on green synthesis methods to produce new nanomaterials,
ecofriendly and safer with sustainable commercial viability. The present work reports the
green synthesis of gold nanoparticles using the aqueous extract of fenugreek (Trigonella
foenum-graecum) as reducing and protecting agent. The pathway is based on the reduction of
AuCl_4 by the extract of fenugreek. This method is simple, efficient, economic and nontoxic.
Gold nanoparticles having different sizes in the range from 15 to 25 nm could be obtained by
controlling the synthesis parameters [24].

14
2.4 Experimental method
This work attempted to illustrate the process of synthesis of gold nanoparticles by
using plant seed extract containing the two types of seeds: black seed (Nigella sativa) and
fenugreek seed (Trigonella foenum graecum).
2.4.1 Materials for synthesis of GNPs:
The fenugreek, black seeds and the Gum Arabic powder were purchased from a local
herbal shop in the Sudan. Hydrogen tetrachloroaurate tetrahydrate (HAuCl4.3H2O)
purchased from lab course trading enterprise Co. Ltd. (sudan) and used without further
purification.
2.4.2 The instrument
Sensitive balance to weighting seeds and Hydrogen tetrachloroaurate trihydrate (Gold salt)
[KERN Scale], Centrifuge [centurion K2 series] 8000 rpm, Microwave LG [MS3040S/00]
2450 MHz and Refrigerator at 4°𝑐.
2.4.3 Bio synthise of GNP
2.4.3.1 Preparation of fenugreekand black Seeds Extract
The carefully weighted 8 g fenugreek and black seeds were washed with deionised water
to remove any contaminant or dust particles. Fenugreek seeds were maintained for 24 h in 50
ml of deionised water at 25 º. for black seeds were maintained for 72 h, after the incubation
period for tow of seeds, the supernatant was decanted and centrifuged 6000 rpm for 15 min
at room temperature. Then it was stored at 4º in refrigerator. And used within 3 days for
subsequent GNPs synthesis.
(a) (b)
15
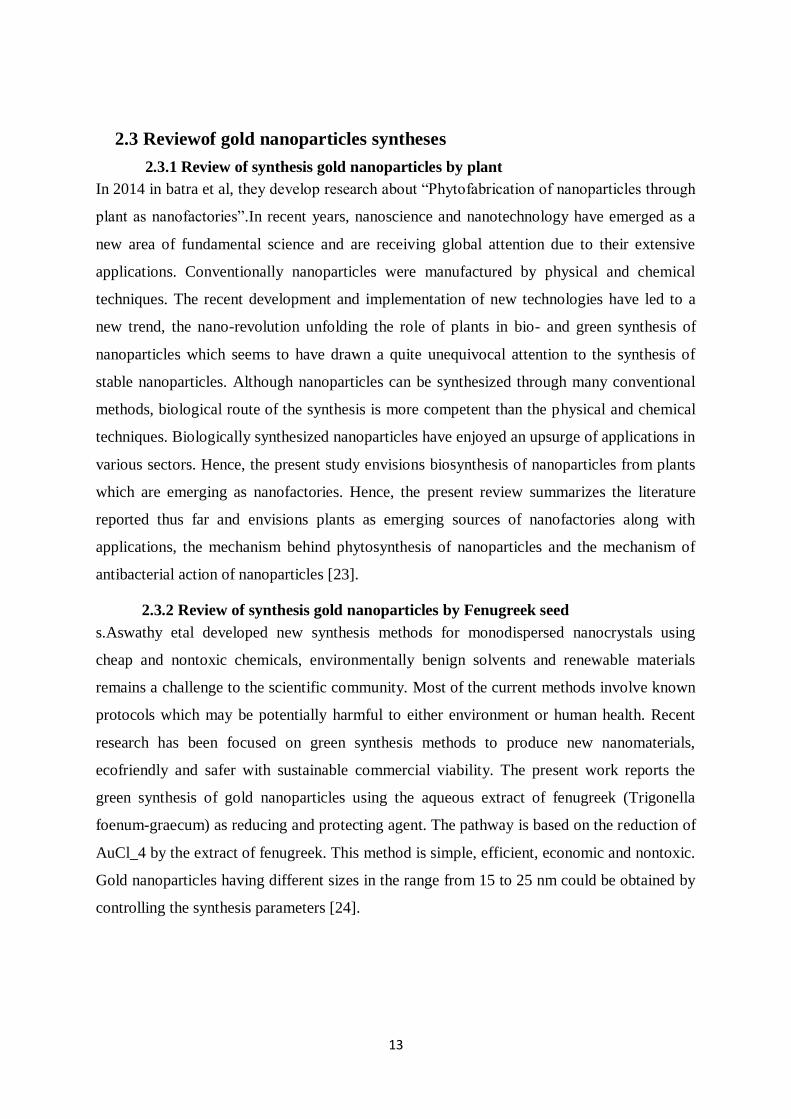
(c) (d)
Figure 2.4: (a) Black seeds (b) Black seeds extract (c) fenugreek seed (d) fenugreek seed
extract
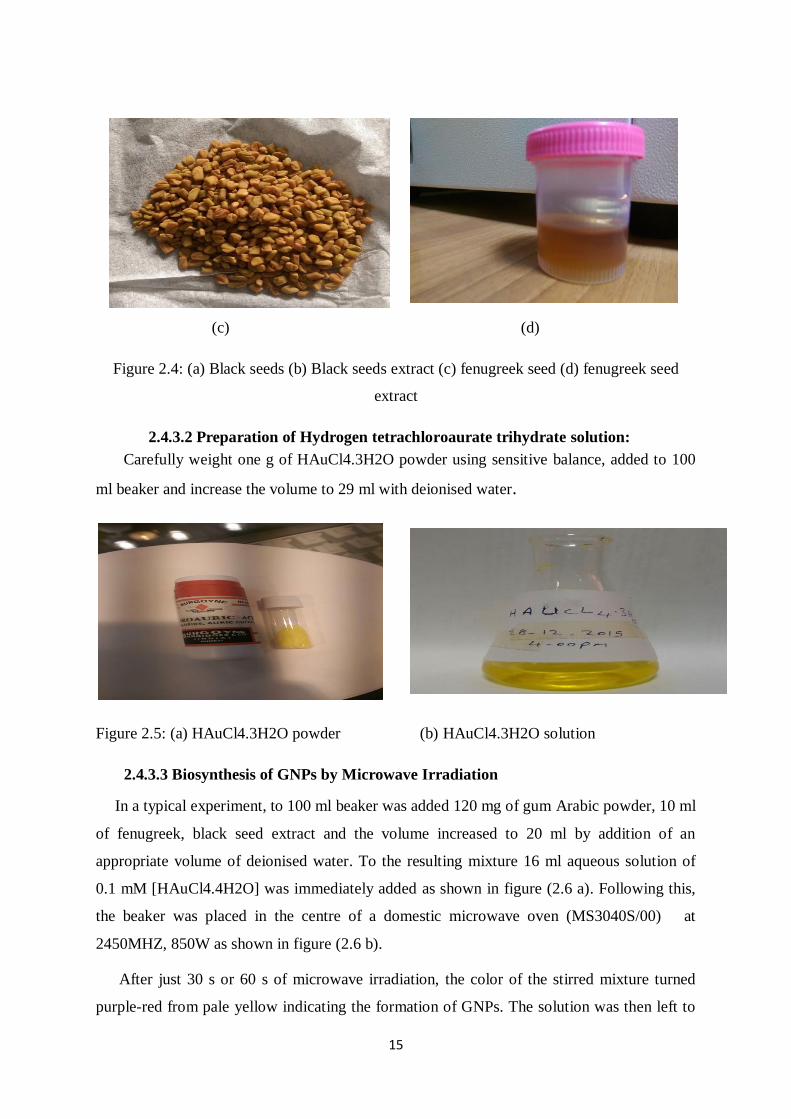
2.4.3.2 Preparation of Hydrogen tetrachloroaurate trihydrate solution:
Carefully weight one g of HAuCl4.3H2O powder using sensitive balance, added to 100
ml beaker and increase the volume to 29 ml with deionised water.
Figure 2.5: (a) HAuCl4.3H2O powder (b) HAuCl4.3H2O solution
2.4.3.3 Biosynthesis of GNPs by Microwave Irradiation
In a typical experiment, to 100 ml beaker was added 120 mg of gum Arabic powder, 10 ml
of fenugreek, black seed extract and the volume increased to 20 ml by addition of an
appropriate volume of deionised water. To the resulting mixture 16 ml aqueous solution of
0.1 mM [HAuCl4.4H2O] was immediately added as shown in figure (2.6 a). Following this,
the beaker was placed in the centre of a domestic microwave oven (MS3040S/00) at
2450MHZ, 850W as shown in figure (2.6 b).
After just 30 s or 60 s of microwave irradiation, the color of the stirred mixture turned
purple-red from pale yellow indicating the formation of GNPs. The solution was then left to

16
cool to room temperature and the rapid reduction is complete within 2 min by stable light
purple- red color of the solution which gives 10 ml colloid. To obtain 8 and 6 ml colloids the
addition of the fenugreek and black seed extract is varied as 8, 6 ml, respectively.
(a) (b)
(c)
Figure 2.6: synthesized GNPs by microwave irradiation; (a) the resulting mixture, (b)
synthesized GNPs after microwave irradiation, (c) Synthesized GNPs after microwave
irradiation at 30s

17
2.4.4 Results and discussion
Depending on (figure 2.6 b and c) GNPs generated by reduction of gold precursor of
Au+3(HAuCl ) to Au0(HAuCl ) by a reducing agent (bacterial biomass, plant seed extract) in
the presence of a stabilizer (gum arabic) which keeps NPs apart, thus avoiding their
aggregation.
After just 30 s of microwave irradiation, the color of the stirred mixture turned purple-red
from pale yellow indicating the formation of GNPs
The colloidal gold is stable for long duration in absence of any special of stabilizing agent
[23].
GNPs solutions were synthesized by fenugreek looked visibly the same after 4 months of
synthesizing.
2.4.5 Conclusion
The green (biological) synthesis of gold nanoparticles using the plant extracts was prepared
using two types of seeds: black seed (Nigella sativa) and fenugreek seed (Trigonella foenum
graecum) as reducing and capping agents. This method is simple, efficient, economic and
environmentally benign. Further, the as-prepared gold NPs show size-dependent catalytic
activity.
This work visually describes each stages of GNPs synthesis from the preparation of black
seed and fenugreek extracts with adding gold salt in presence of Gum Arabic to keeps NPs
apart from aggregation , the color of resulting mixture of final solution turned purple-red
from pale yellow indicating the formation of GNPs after using microwave irradiation method
Gum Arabic (GA) which belongs to the arabinogalactan-protein family is the oldest and
best known of all the tree gum exudates. Today, this natural gum is widely used in the
pharmaceutical and food industry as an emulsifier [25].
In the microwave method of synthesis, microwave radiations are introduced in the
reaction solution. The microwave-assisted synthesis of nanoparticles has become popular due
to its simplicity, ease of operation, rapid volumetric heating and kinetics, short reaction
period and increasing yield of products compared to the conventional heating methods [26,
27]. Microwaves are a form of electromagnetic energy, with frequencies in the range of
300MHz to 300 GHz. The commonly used frequency is 2456 GHz
Several factors such as pH, temperature, concentration of plant extract, concentration of
metal solution, incubation/ reaction time etc, affect the synthesis, size and shape of
nanoparticles [23].

18
CHAPTER THREE
Characterization of gold Nanoparticles

19
3. Characterization of gold Nanoparticles
3.1 Introduction
To understand the control of synthesis and their applications, it is very important to
characterize the nanoparticles. There are many different techniques available for the
characterization of nanoparticles [28].
The characterization will give information about the absorption spectrum of the Plasmon
band, Size, shape and the morphology of the gold nanoparticles.
3.2 Physicochemical characterization of nanomaterials
The nanomaterials can be characterized using various techniques, which provide important
information for the understanding of different physicochemical features of materials. Some of the
most extensively used techniques for characterization of Nanomaterial‟s are as follows [5]:
(a) Optical Spectroscopy
(i) Ultraviolet-visible (UV-Vis) spectroscopy.
(ii) Fourier transforms infrared (FTIR) spectroscopy.
(iii) Fluorescence spectroscopy.
(b) X-ray diffraction (XRD).
(c) Scanning electron microscopy (SEM).
(d) Transmission electron microscopy (TEM).
(e) Atomic force microscopy (AFM).
(f) Thermal Analysis (TA).
3.2.1 Optical Spectroscopy
Optical spectroscopy has been widely used for the characterization of nanomaterials and the
techniques can be generally categorized into two groups: Ultraviolet-visible (UV-Vis)
spectroscopy and emission (fluorescence) and vibration (infrared) spectroscopy.
The former determines the electronic structures of atoms, ions, molecules or crystals through
exciting electrons from the ground to excited states (absorption) and relaxing from the
excited to ground states (emission). The vibration technique involves the interactions of
photons with species in a sample that results in energy transfer to or from the sample via
vibrational excitation or de-excitation. The vibration frequencies provide the information of
chemical bonds in the detecting samples [5].

20
3.2.1.1 UV-Vis Spectroscopy
It deals with the study of electronic transitions between orbitals or bands of atoms, ions or
molecules in gaseous, liquid and solid state [29]. The metallic nanoparticles are known to
exhibit different characteristic colors [30]. This absorption of electromagnetic radiation by
metallic nanoparticles originates from the coherent oscillation of the valence band electrons
induced by an interaction with the electromagnetic field [31].These resonances are known as
surface Plasmon, which occur only in the case of nanoparticles and not in the case of bulk
metallic particles [32].
Figure 3.1: UV-Vis Spectroscopy [uv-1800-SHIMADZU [33]
3.2.1.1.1 Color in metal colloids (surface Plasmon’s)
One of the distinguishing properties of metal nanoparticles in general is their optical
properties, which are different from those of their bulk counterpart. This is due to an effect
called localized surface Plasmon resonance. In simple terms, when light hits a metal surface
(of any size) some of the light wave propagates along the metal surface giving rise to a
surface Plasmon a group of surface conduction electrons that propagate in a direction parallel
to the metal/dielectric (or metal/vacuum) interface. When a Plasmon is generated in a
conventional bulk metal, electrons can move freely in the material and no effect is registered.
In the case of nanoparticles, the surface Plasmon is localized in space, so it oscillates back
and forth in a synchronized way in a small space, and the effect is called Localized Surface
Plasmon Resonance (LSPR). When the frequency of this oscillation is the same as the
frequency of the light that it generated it (i.e. the incident light), the Plasmon is said to be in
resonance with the incident light.
One of the consequences of the LSPR effect in metal nanoparticles is that they have very
strong visible absorption due to the resonant coherent oscillation of the Plasmon. As a result,
colloids of metal nanoparticles such as gold or silver can display colors which are not found

21
in their bulk form, such as red, purple or orange, depending on the shape, size and
surrounding media of the nanoparticles [11].
3.2.1.2 Fourier Transform Infrared Spectroscopy
Fourier transforms infrared (FTIR) spectroscopy deals with the vibration of chemical bonds
in a molecule at various frequencies depending on the elements and types of bonds. After
absorbing electromagnetic radiation the frequency of vibration of a bond increases leading to
transition between ground state and several excited states. These absorption frequencies
represent excitations of vibrations of the chemical bonds and thus are specific to the type of
bond and the group of atoms involved in the vibration. The energy corresponding to these
frequencies correspond to the infrared region (4000–400 cm-1) of the electromagnetic
spectrum. The term Fourier transform (FT) refers to a recent development in the manner in
which the data are collected and converted from an interference pattern to an infrared
absorption spectrum that is like a molecular "fingerprint" [34]. The FTIR measurement can
be utilized to study the presence of protein molecule in the solution, as the FTIR spectra in
the 1400–1700 cm-1 region provides information about the presence of –CO- and –NH-
groups [35].
Figure 3.2: FTIR spectroscopy [2400s-SHIMAZU] [36]
3.2.2 X-Ray Diffraction
X-ray diffraction is a very important technique that has long been used to determine the
crystal structure of solids, including lattice constants and geometry, identification of
unknown materials, orientation of single crystals, defects, etc. [37]. The X-ray diffraction
patterns are obtained by measurement of the angles at which an X-ray beam is diffracted by
the crystalline phases in the specimen. Bragg s (equation 3.1) relates the distance between
22
two (h, k, and l) planes (d) and the angle of diffraction (2θ) as: n λ = 2dsinθ, where, λ =
wavelength of X-rays, n = an integer known as the order of reflection (h, k and l represent
Miller indices of the respective planes) [38]. From the diffraction patterns, the uniqueness of
nanocrystal structure, phase purity, degree of crystallinity and unit cell parameters of the
nanocrystalline materials can be determined. X-ray diffraction technique is nondestructive
and does not require elaborate sample preparation, which partly explains the wide use of
XRD methods in material characterization.
X-ray diffraction broadening analysis has been widely used to determine the crystal size of
nanoscale materials. The average size of the nanoparticles can be estimated using the Debye–
Scherrer equation:
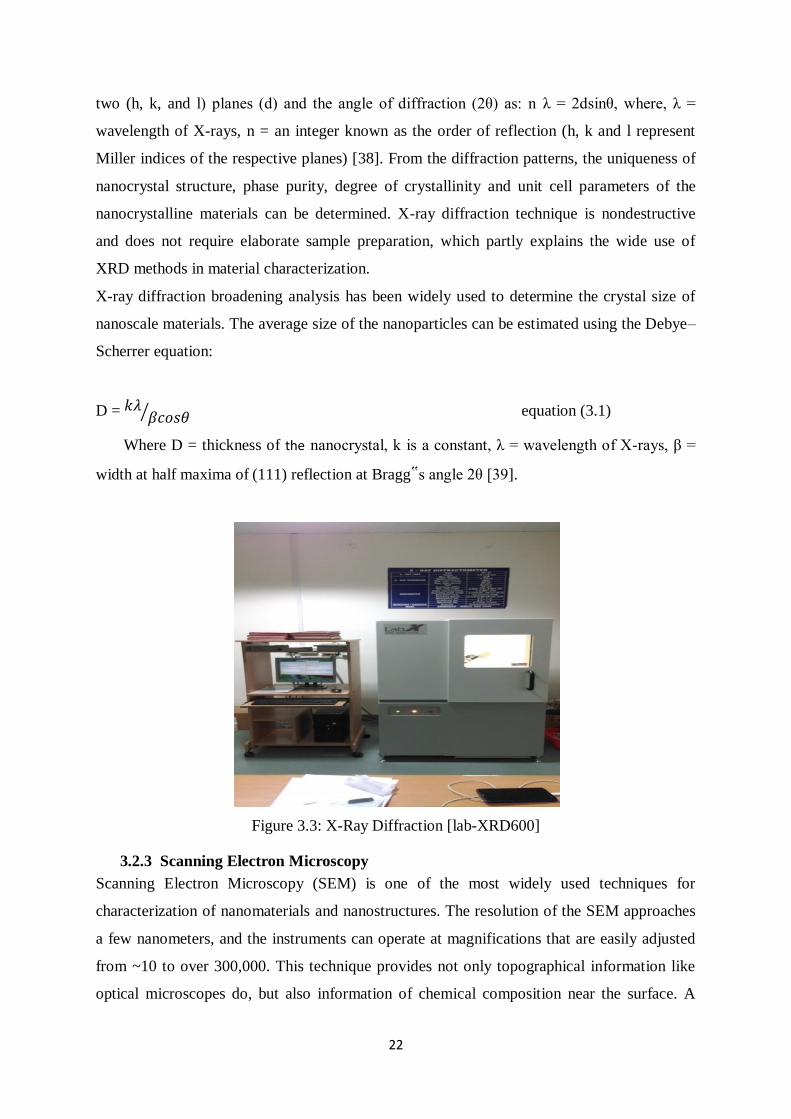
D = 𝑘𝜆𝛽𝑐𝑜𝑠𝜃⁄ equation (3.1)
Where D = thickness of the nanocrystal, k is a constant, λ = wavelength of X-rays, β =
width at half maxima of (111) reflection at Bragg‟s angle 2θ [39].
Figure 3.3: X-Ray Diffraction [lab-XRD600]
3.2.3 Scanning Electron Microscopy
Scanning Electron Microscopy (SEM) is one of the most widely used techniques for
characterization of nanomaterials and nanostructures. The resolution of the SEM approaches
a few nanometers, and the instruments can operate at magnifications that are easily adjusted
from ~10 to over 300,000. This technique provides not only topographical information like
optical microscopes do, but also information of chemical composition near the surface. A

23
scanning electron microscope can generate an electron beam scanning back and forth over a
solid sample. The interaction between the beam and the sample produces different types of
signals providing detailed information about the surface structure and morphology of the
sample. When an electron from the beam encounters a nucleus in the sample, the resultant
coulombic attraction leads to a deflection in the electron's path, known as Rutherford elastic
scattering. A fraction of these electrons will be completely backscattered, reemerging from
the incident surface of the sample. Since the scattering angle depends on the atomic number
of the nucleus, the primary electrons arriving at a given detector position can be used to
produce images containing topological and compositional information [40]. The high-energy
incident electrons can also interact with the loosely bound conduction band electrons in the
sample. However, the amount of energy given to these secondary electrons as a result of the
interactions is small, and so they have a very limited range in the sample. Hence, only those
secondary electrons that are produced within a very short distance from the surface are able
to escape from the sample. As a result, high-resolution topographical images can be obtained
in this detection mode [41].
Figure3.4: Scanning Electron Microscopy [5]
3.2.4 Transmission Electron Microscopy
Transmission electron microscopy (TEM) is typically used for high resolution imaging of
thin films of a solid sample for nanostructural and compositional analysis.
The technique involves: (i) irradiation of a very thin sample by a high-energy electron beam,
which is diffracted by the lattices of a crystalline or semicrystalline material and propagated

24
along different directions, (ii) imaging and angular distribution analysis of the forward-
scattered electrons (unlike SEM where backscattered electrons are detected), and (iii) energy
analysis of the emitted X-rays [42] The topographic information obtained by TEM in the
vicinity of atomic resolution can be utilized for structural characterization and identification
of various phases of nanomaterials, viz., hexagonal, cubic or lamellar[45] One shortcoming
of TEM is that the electron scattering information in a
TEM image originates from a three-dimensional sample, but is projected onto a two
dimensional detector. Therefore, structural information along the electron beam direction is
superimposed at the image plane. Selected area diffraction (SAD) offers a unique advantage
to determine the crystal structure of individual nanomaterials, such as
nanocrystals and nanorods, and the crystal structures of different parts of the sample. In SAD,
the condenser lens is defocused to produce parallel illumination at the specimen and a
selected-area aperture is used to limit the diffracting volume. SAD patterns are often used to
determine the Bravais lattices and lattice parameters of crystalline materials by the same
procedure used in XRD [43].
In addition to the capability of structural characterization and chemical analyses, TEM has
been also explored for the other applications in nanotechnology. Examples include the
determination of melting points of nanocrystals, in which, an electron beam is used to heat up
the nanocrystals and the melting points are determined by the disappearance of electron
diffraction [44]. Another example is the measurement of mechanical and electrical properties
of individual nanowires and nanotubes [45].
Figure3.5: transition Electron Microscopy [5]

25
Table 3.1: a summary of characterization techniques [28]
Technique Measures Sample Sensitivity
TEM particle size and
characterization
Required<1mg
sample Solid on
substrate
down to 1 nm
SEM particle size and
characterization
conductive or
sputter coated
down to 1 nm
AFM particle size and
characterization
Air or liquid 1 nm-8 μ m
X-ray diffraction
(XRD)
(>1mg) required
average particle size
for a bulk sample
Arger crystalline
samples
down to 1 nm
Fourier transform
infrared
spectroscopy (FTIR)
Substituent groups Solid for ATR-IR or
liquid
20𝐴01 μ m
26
3.3 Review of gold nanoparticles characterization
3.3.1 Review of black seed characterization
Fregoon et al developed a research about “Biosynthesis of Controllable Size and Shape Gold
Nanoparticles by Black Seed (Nigella Sativa) Extract”. They found that the rapid and non-
toxic method developed for the preparation of biocompatible gold nanoparticles by
use of black seed (Nigella sativa) extract as antioxidant to treataqueous chloroauric
acid solution by two different synthetic routes: microwave irradiation and thermo-
induced procedures. The resulted nanoparticles were characterized and investigated by
ultraviolet-visible (UV-Vis) spectrophotometry, transmission electron microscopy
(TEM), energy-dispersive X-ray (EDX) spectroscopy, and X-ray diffraction (XRD).
The size and shape of the nanoparticles were found to be very sensitive to the quantity
of the extract also found that reaction temperature has a significant role in production
of gold nanoparticles with different shapes. The XRD studies reflect an interesting
feature indicates that gold nanocrystals are highly anisotropic in nature, mainly
triangular and hexagonal shapes, and that the particles are (111) oriented. The
observed characteristics suggest the application of the biocompatible gold
nanoparticles to future in vivo imaging and therapy [17].
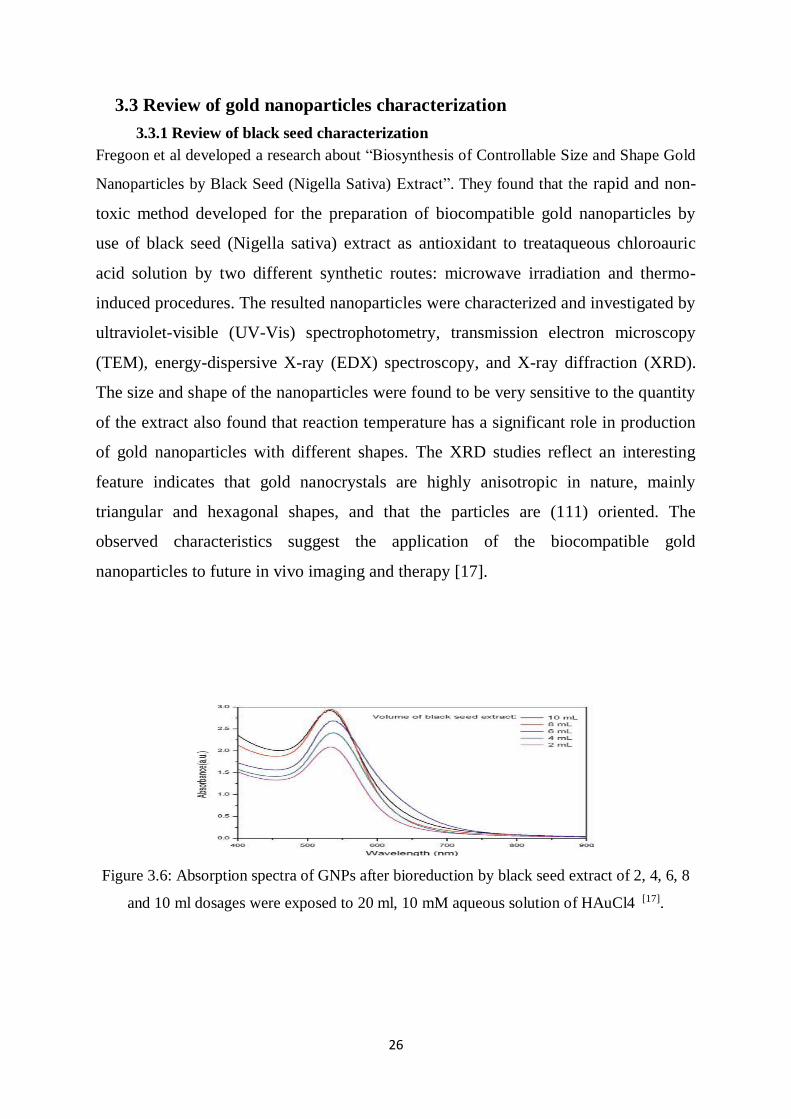
Figure 3.6: Absorption spectra of GNPs after bioreduction by black seed extract of 2, 4, 6, 8
and 10 ml dosages were exposed to 20 ml, 10 mM aqueous solution of HAuCl4 [17].

27
Figure3.7: TEM images illustrating the biosynthesis of GNPs using microwave irradiation by
exposing (A) 4 ml, (B) 6 ml, (C) and (D) 8 ml, (E) and (F) 10 ml black seed extract to 20 ml,
10 mM aqueous HAuCl4. Scale bars: (A), (D) and (E) 50 nm; (B), (C) and (F) 100 nm [17].
3.3.2 Review of fenugreek characterization
Aswathy et al developed new synthesis methods for monodispersed nanocrystals using cheap
and nontoxic chemicals, environmentally benign solvents and renewable materials remains a
challenge to the scientific community. The nanoparticles have been characterized by UV–
Visible spectroscopy, transmission electron microscopy (TEM), X-ray diffraction (XRD) and
FTIR analysis. The high crystallinity of nanoparticles is evident from clear lattice fringes in
the HRTEM images, bright circular spots in the SAED pattern and peaks in the XRD pattern.
FTIR spectrum indicates the presence of different functional groups present in the
biomolecule capping the nanoparticles. The synthesized gold nanoparticles show good
catalytic activity for the reduction of 4-nitrophenol to 4-aminophenol by excess NaBH4. The
catalytic activity is found to be size-dependent, the smaller nanoparticles showing faster
activity [24].

28
Figure 3.8: (a–c) TEM images of gold colloid g4 at different magnification and (d), (e) TEM
images of gold colloid h4 at different magnification, (f) SAED pattern [24].
3.4 Experimental Method
3.4.1Materials
Three samples of GNPS were characterized: (1) black seed 10ml, (2) fenugreek 8ml and (3)
fenugreek 10ml For TEM and XRD. And for UV – VIS spectroscopy all previous samples
were characterized with adding fenugreek 6ml
3.4.2 Instrumentations
3.4.2.1 UV–VIS Absorption Spectroscopy:
Optical absorption spectra of the fenugreek seed extracted reduced GNPs were recorded
using a UV-1800 UV–Vis-spectrophotometer (Shimadzu, Japan) with 2 ml of GNPs solution
in a 1 cm optical path cuvette.
3.4.2.2 Fourier Transform Infrared Spectroscopy
3.4.2.3 Transition Electron Microscopy
The morphology of the GNPs was analyzed using the transition electron microscope
(TEM) [JEOL-JEM-2100]
29
3.4.2.4 X-ray Diffractometer (XRD)
Resulting solutions of the developed GNPs were dried for the determination of the formation
of Au by XRD [LAB-XRD600].
3.4.3 Result and Discussion
3.4.3.1 UV-Vis spectroscopy
3.4.3.1.1 black seed 10ml
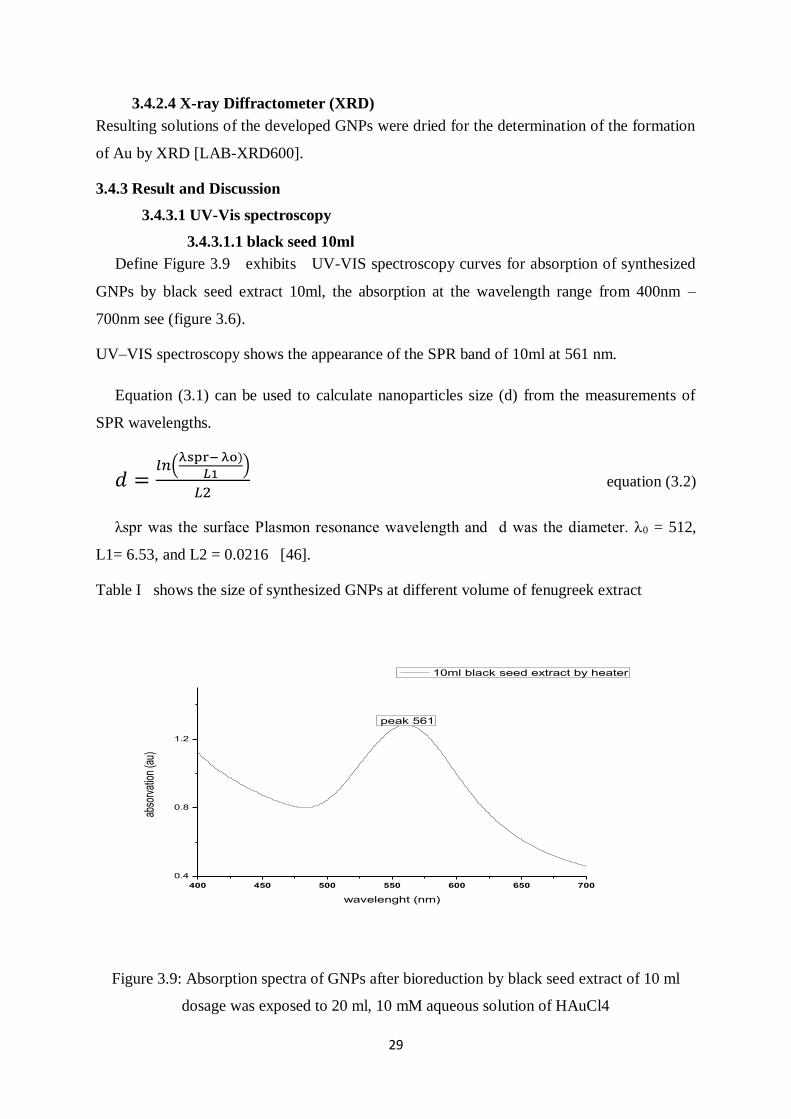
Define Figure 3.9 exhibits UV-VIS spectroscopy curves for absorption of synthesized
GNPs by black seed extract 10ml, the absorption at the wavelength range from 400nm –
700nm see (figure 3.6).
UV–VIS spectroscopy shows the appearance of the SPR band of 10ml at 561 nm.
Equation (3.1) can be used to calculate nanoparticles size (d) from the measurements of
SPR wavelengths.
𝑑 =𝑙𝑛(
λspr− λo)
𝐿1)
𝐿2 equation (3.2)
λspr was the surface Plasmon resonance wavelength and d was the diameter. λ0 = 512,
L1= 6.53, and L2 = 0.0216 [46].
Table I shows the size of synthesized GNPs at different volume of fenugreek extract
400 450 500 550 600 650 700
0.4
0.8
1.2
peak 561
abso
rvat
ion
(au)
wavelenght (nm)
10ml black seed extract by heater
Figure 3.9: Absorption spectra of GNPs after bioreduction by black seed extract of 10 ml
dosage was exposed to 20 ml, 10 mM aqueous solution of HAuCl4

30
3.4.3.1.2 Fenugreek seed UV-VIS Result
Define Figure 3.10 exhibits UV-VIS curves for absorption of synthesized GNPs by
different amounts of the fenugreek seed extract, the absorption at the wavelength range from
400nm – 700nm.
UV–VIS spectra that were recorded at different dosages of extract for the reaction with the
aqueous HAuCl4 show the appearance of the SPR band of 6 ml at 535.5 nm and 8ml at 534
nm while that of 10 ml at 535.6 nm.
This means that as the amount of fenugreek extract increased (6ml to 10ml) the peak shift
to towards red or blue color .This is because the lowest quantities of the extract failed to
protect most of the nascent nanoparticles from aggregating due to absence of sufficient of
biomolecules act as protecting agents. In additional, this is responsible for the formation of
the few particles.
Table 3.2: GNPs size determined by Equation 3.1
However, the equation (3.2) cannot be used for particles smaller than 25nm because the
experimentally observed wavelength is lower than what would be expected. Recall that the
surface Plasmon resonance (SPR) wavelength for spherical GNPs is usually around 540 nm
and this experiment had a range of 534-535.6 nm. However, when particles were smaller than
25 nm, the wavelength of SPR was smaller than 520 nm. The wavelength may be smaller for
particles smaller than 25 nm because of the increase of the ratio of surface atoms to bulk
atoms for small particle diameters.
The position of SPR band in UV–Visible spectra is sensitive to particle size, shape, local
refractive index and its interaction with medium. The amount of the black seed extract was
found to be an important parameter in size disparity of GNPs.
Volume of Fenugreek extract Absorption GNPs size [d]
6 ml 535.5nm 59.28nm
8ml 534.0nm 56.23nm
10ml 535.6nm 59.48nm

31
.
Figure 3.10: Absorption spectra of GNPs after bioreduction by fenugreek seed extract of 6, 8
and 10 ml dosages were exposed to 20 ml, 10 mM aqueous solution of HAuCl4
3.4.3.2 Fourier Transform Infrared Spectroscopy (FTIR) result
FTIR measurements were carried out to identify the possible biomolecules present in
fenugreek seed extract which are responsible for the reduction and capping of gold NPs. The
spectrum (Figure 3.11) shows bands at (3454.24, 2084.91, 1647.10, 495.67, 472.53, 457.10
and 441.67) cm-1.
The IR band due to O–H stretch, H–bonded is observed at 3454.24cm-1 it’s strong and board
absorption is identified as the alcohols, phenols.
The band located at 1647.10 cm-1 is due to the C=C tretching vibrations, is assigned as amid
alkenes [47].
The bands (2084.91, 495.67, 472.53, 457.10 and 441.67) cm-1 may be assigned to the in plane
and out of plane bending for benzene ring [48]. It is well-known that proteins can bind to
gold NPs through free carboxylate group [49]. The presence of bands at 3454.24, 2084.91,
1647 cm -1 indicates that gold NPs are possibly bound to proteins through carboxylate group.
The phytochemical analysis of the dried seed extract of fenugreek has been reported to show
the presence of proteins, vitamins, flavonoids, terpenoids, carotenoids, cumarins, curcumins,
lignin, saponin and plant sterol [50]. The flavonoids present in the seed extract are powerful
reducing agents which may be responsible for the reduction of chloroauric acid. The

32
carboxylate group present in proteins can act as surfactant to attach on the surface of gold
NPs and it stabilizes gold NPs through electrostatic stabilization. Thus it is found that
fenugreek seed extract has the ability to perform dual functions of reduction and stabilization
of gold NPs.
Figure 3.11: FTIR spectrum of gold nanoparticles. The inset shows the possible mechanism
of formation of gold nanoparticles.
33
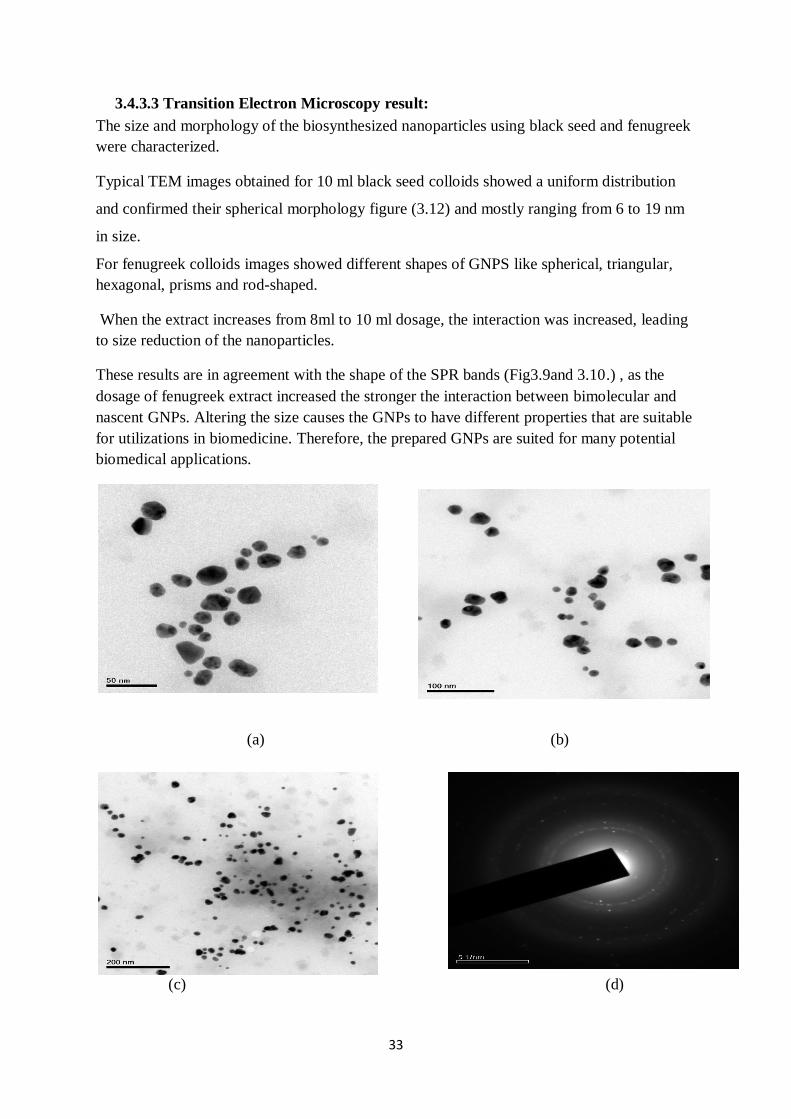
3.4.3.3 Transition Electron Microscopy result:
The size and morphology of the biosynthesized nanoparticles using black seed and fenugreek
were characterized.
Typical TEM images obtained for 10 ml black seed colloids showed a uniform distribution
and confirmed their spherical morphology figure (3.12) and mostly ranging from 6 to 19 nm
in size.
For fenugreek colloids images showed different shapes of GNPS like spherical, triangular,
hexagonal, prisms and rod-shaped.
When the extract increases from 8ml to 10 ml dosage, the interaction was increased, leading
to size reduction of the nanoparticles.
These results are in agreement with the shape of the SPR bands (Fig3.9and 3.10.) , as the
dosage of fenugreek extract increased the stronger the interaction between bimolecular and
nascent GNPs. Altering the size causes the GNPs to have different properties that are suitable
for utilizations in biomedicine. Therefore, the prepared GNPs are suited for many potential
biomedical applications.
(a) (b)
(c) (d)

34
10 20 30
2
4
6
8
10
pa
rtic
le n
um
be
r
particle size
black seed
(e)
Figure 3.12 : (a–c) TEM images of black seed 10ml gold colloid at different magnification
,(d) SAED and (e) histogram of particle size number for corresponding image at 50 nm
(a) (b)
(c) (d)
35
5 10 15 20 25 30 350
2
4
6
8
10
12
pa
rtic
le n
um
be
r
particle size
Fenugreek 8 ml
(e)
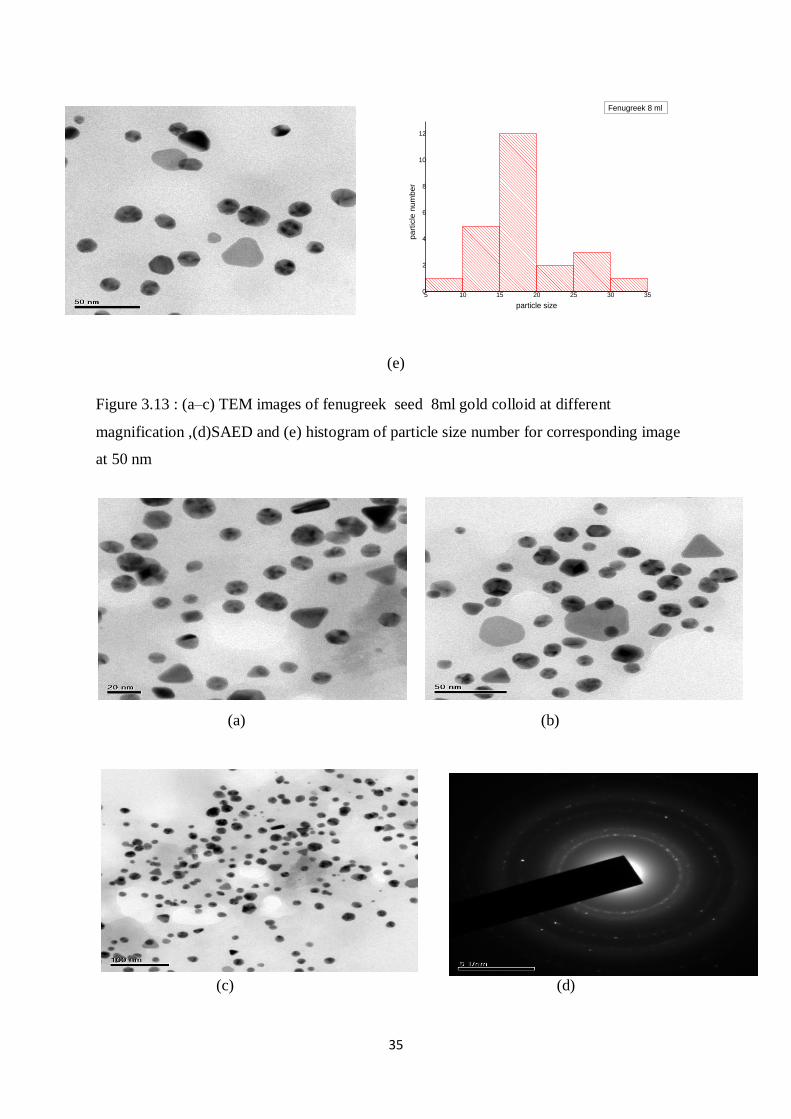
Figure 3.13 : (a–c) TEM images of fenugreek seed 8ml gold colloid at different
magnification ,(d)SAED and (e) histogram of particle size number for corresponding image
at 50 nm
(a) (b)
(c) (d)

36
10 20 30 40 500
2
4
6
8
10
12
14
16
18
pa
rtic
le n
um
be
r
particle size
feungreek 10ml
(e)
Figure 3.14: (a–c) TEM images of fenugreek seed 10ml gold colloid at different
magnification, (d) SAED and (e) histogram of particle size number for corresponding image
at 50 nm

37
Energy-Dispersive X-ray (EDX) Spectroscopy
In the EDX spectrum of the GNPs, TEM imaging and the corresponding EDX analysis
shown in figure 3.15 confirms the presence of Au in solution.
Copper peaks were also visible in the EDX spectra which were due to the Cu support grid.
The lack of other elemental peaks and high amount of Au in the spectra confirms the purity
of the gold in the transformed product. The presence of carbon and oxygen spots in the
spectrum of black seed confirms the presence of stabilizers composed of alkyl chains
(a)
(b) (c )
Figure 3.15: EDX spectrum of GNPs samples (a) black seed 10ml, (b) fenugreek 8ml and
(c) Fenugreek 10ml.
3.4.3.4 XRD result:
As apparent from the figure,
Figure 3.16 shows the XRD pattern of dried gold nanoparticles. The XRD peaks are found to
be broad indicating the formation of nanoparticles. there is a broad peak that appeared at 2θ =
20° which can be attributed with 2θ values of 38°, 44°, 64.6°, and 77°. These bands

38
correspond to the 111, 200, 220, and 311 sets of lattice planes, which may be indexed as the
bands for face centred cubic structures of Au. The XRD pattern, thus, clearly demonstrates
that the Au NPs synthesized by the present green method are crystalline in nature. For black
seed the peak corresponding to 111 plane is more intense than the other planes suggesting
that 111 is the predominant orientation as confirmed by the high resolution TEM
measurement.
20 30 40 50 60 70 80
100
150
200
250
300
350
400
450
500
550
600
650
700
750
311
220200
111
inte
nsity
(a.u
)
2 theta(deg)
BS 10ml
(a)
20 30 40 50 60 70 80
100
150
200
250
300
350
400
450
500
550
600
311
220
200
111
inte
nsity
a.u)
2 theta(deg)
FS 8ml
(b)

39
20 30 40 50 60 70 80
100
150
200
250
300
350
400
450
500
550
600
650
200
311
220
111
inten
sity(
a.u)
2theta(deg)
FS10ml
(c)
Figure 3.16: XRD pattern of gold nanoparticles (a) black seed 10ml, (b) fenugreek 8ml and
(c) fenugreek 10ml.
3.4.4. Conclusion
Colloidal gold nanoparticles were synthesized according to the plant extract method and
characterized by UV-VIS absorption spectroscopy, FTIR, transmission electron microscopy
and X-ray diffraction. It was found that the concentration of the precursors affects the size of
the nanoparticles. The result finding the Typical TEM images obtained for 10 ml black seed
colloids consist of almost uniformly sized spherical nanoparticles, while fenugreek consist of
different shapes of GNPS.
The particle diameters can be determined through experimental techniques. The best
technique to use depends on the size of the particles. For example Equation (3.1) from UV-
Vis spectroscopy can be used to calculate diameters of the particles when the absorbance
ratio is known.
Since GNPs can form numerous shapes; such as prisms and rods, can determining the Size
and Shape of Gold equation to calculate the diameters of these particles can be developed.
Another idea to focus on for further research could be which shape is better for different
applications. For example, each shape of GNPs have different physical properties thus
making it useful to determine which shape is better in areas such as diagnostics, therapeutics,
catalysis, optical sensing, and in further nanotechnology. Thus, a study could be conducted to
learn how shape affects the application GNPs used [46].
40
CHAPTER FOUR
Vaccines detector based on
goldnanoparticles

41
4.Vaccines detector based on goldnanoparticles
4.1 Introduction
Applications of nanoparticles in diagnosis, treatment, and monitoring of biological systems
are slowly coalescing into a new field, often referred to as ‘nanomedicine’[51]. Materials
with nanoscale dimensions are of great interest in biomedical applications because their size
is comparable to, or smaller than, that of many important biological entities such as genes (2
nm wide and 10–100 nm long), proteins (5–50 nm), viruses (20–450 nm), or cells (10–100
μm) [52]. These tiny particles can access otherwise unreachable regions of the organism and
engage in interactions at molecular level or deliver a therapeutic load. For these reasons, it is
widely accepted that systems incorporating either inorganic or organic nanoparticles have the
potential to change dramatically the landscape of the biomedical field [53].
Due to their unique physical and chemical properties, gold nanoparticles are poised to play an
important role in this exciting and dynamic field.
4.2 Properties of Colloidal Gold Relevant for Biomedical Applications
The unique properties of gold nanoparticles exploited in the bio-medical field depend on the
size, shape, morphology, surface chemistry, and electrical charge. The ability to tailor these
features as well as the biocompatibility of colloidal gold is central to all biomedical
applications [54].
The various properties of different nanoparticles relative to bulk metals are summarized
below.
Optical function: The surface absorption plasmon of Au can express various colors by
changing the size of the particle, the form or shape of the particle, and the rate of
condensation. A new paint that has the durability of an inorganic pigment and the vivid color
of an organic substrate can be made. Nanoparticles smaller than the wavelength of light can
be used to make high penetration conductivity materials (there is little absorption, dispersion,
and reflection).
Catalyst function: Reaction efficiencies can be enhanced since the specific surface area
of such nanoparticles is large compared with existing particles; to the extent that the surface
terrace is regular at the atomic level, a hyperactive catalyst with high selectivity can be made:
for example, Au nanoparticles.

42
Thermal function: When the particle diameter is small (less than 10 nm), the melting
point is also lower than a bulk metal. Electronic wiring can be made with nanoparticles that
have a low boiling point, for example, a polymer.
Electrical function: Since superconductivity transition temperature rises so that particle
diameter is small (less than 1 nm), it can be used to make high temperature superconductivity
material.
Mechanical function: Since the mechanical characteristics improve, mechanical strength
can be sharply raised by mixing the nanoparticles with metals or ceramics.
Magnetic function: The attractive force of a magnetic metal increases on reduction of the
particle diameter, such that soft-magnetic materials can be made in the form of an alloy of
nanoparticles. Moreover, a permanent magnet can be made if the nanoparticles are smaller
than the magnetic domain made to magnetize [55].
Surface Functionalization and Biocompatibility: The applied coating makes the
nanoparticles biocompatible and imparts colloidal stability in both water and physiological
media. In addition, modification of the particle surface by suitable (bio)molecules provides
desired characteristics for the intended applications [51, 56, 57].
4.3 Biological and Medical Applications of Colloidal Gold
Nanotechnology is producing short-term impacts in the areas of:[58]
Medical diagnostic tools and sensors
Drug delivery
Catalysts (many applications in chemistry and pharmaceuticals)
Alloys (e.g., steel and materials used in prosthetics)
Improved and body-friendly implants
Biosensors and chemical sensors
Bioanalysis tools
Bioseparation technologies
Medical imaging
Filters
4.4Vaccines container efficiency detector
A particular example of gold nanoparticle application under study of vaccines quality and
potency, Because of the extremely strong optical absorption of gold colloids, this colorimetric
method is sensitive enough to be able to detect freezing manner change.

43
This analysis highlights that exposure of vaccines to freezing temperatures is pervasive, as
well as within both the storage and transport segments of the cold chain.
4.4.1Value of Vaccine Storage and Handling Best Practices
Failure to store and handle vaccines properly can reduce vaccine potency, resulting in
inadequate immune responses in patients and poor protection against disease. Patients lose
confidence in vaccines and their providers when revaccination is necessary because the
vaccine(s) they received may have been compromised (exposed to inappropriate conditions/
temperatures or handled improperly).Storage and handling errors can also result in significant
financial loss if the vaccine cannot be used [59].
4.4.2 What is the Vaccine Cold Chain?
The vaccine cold chain is a temperature-controlled environment used to maintain and
distribute vaccines in optimal condition. The cold chain relies on three main elements:
Well-trained personnel
Reliable transportation and storage equipment
Efficient management procedures
The cold chain begins with the cold storage unit at the manufacturing plant, extends through
transport of vaccine(s) to the distributor, then delivery and storage at the provider facility, and
ends with administration of vaccine to the patient. Appropriate storage conditions must be
maintained at every link in the cold chain [59].
4.4.3 Vaccine and Diluent Storage Temperatures
Freezer Temperature
Store frozen vaccines (e.g., varicella-containing vaccines [VAR, HZV, and MMRV]) in a
freezer between -58°F and +5°F (-50°C and -15°C) until reconstitution and administration.
These vaccines can deteriorate rapidly after removal from the freezer. Measles, mumps, and
rubella vaccine (MMR) can be stored in a refrigerator or in a freezer.
Refrigerator Temperature
Store all other routinely recommended vaccines in a refrigerator between 35°F and 46°F (2°C
and 8°C), with a desired average temperature of 40°F (5°C).This will allow for slight
temperature fluctuations while still maintaining the recommended temperature range.

44
Diluents
Some diluents must be stored in the refrigerator. Other diluents have an option of being
stored at room temperature (no warmer than 77°F [25°C]) or in the refrigerator [59].
4.4.4 Vaccine Potency
Excessive heat, cold, or light exposure can damage vaccines, resulting in reduced potency.
Once potency is lost, it cannot be restored. Each time vaccines are exposed to improper
conditions, potency is reduced further. Eventually, if the cold chain is not properly
maintained, potency will be lost, and the vaccines become useless.
While exposure to any inappropriate conditions can affect potency of refrigerated vaccines, a
single exposure to freezing temperatures will destroy some. Liquid vaccines that contain an
aluminum adjuvant can permanently lose potency when exposed to freezing temperatures.
Monitor the temperature of your storage unit(s) regularly [59].
4.4.5 Vaccine Appearance after Exposure to Inappropriate Storage Conditions
Some vaccines may show physical evidence that potency has been reduced when
exposed to inappropriate storage conditions. This may appear as clumping in the solution that
does not go away when the vial is shaken .Other vaccines may look normal when exposed to
inappropriate storage conditions .For example, inactivated vaccines exposed to freezing
temperatures (i.e., 32°F [0°C] or colder) may not appear frozen and give no indication of
reduced or lost potency like Adacel, Boostrix, Cervarix, Comvax, Daptacel, Decavac.
Vaccine appearance is not a reliable indicator that vaccines have been stored under
appropriate conditions. Figure [59].
4.4.5 Review paper of Vaccines container efficiency detector
In 2008 Fredy Kurniawan aus Surabaya, Indonesia im März, prepared Freezing indicator
from Gold nanoparticles which can change its color irreversibly when the solution become
frozen (0o C± 0.5), is one of the interesting property This property is used for the
development of freezing indicator. This indicator may be useful for specific application. An
attempt to stabilize nanoparticles has been performed by adding some additives. It is expected
that the additives will give longer storage time or faster respond to temperature change. The
list of the additives used can be seen in the table 4.1[60].

45
Table 4.1: the additives [60]
NO Name of additives
1 Sodium cellulose phosphate
2 Zinc Dust
3 Silica Gel
4 Silver Iodide (home made, without purification)
4 Glucose
6 Snowmax 20μg/ml
7 Snowmax 80μg/ml
8 Snowmax 100μg/ml
9 No additive
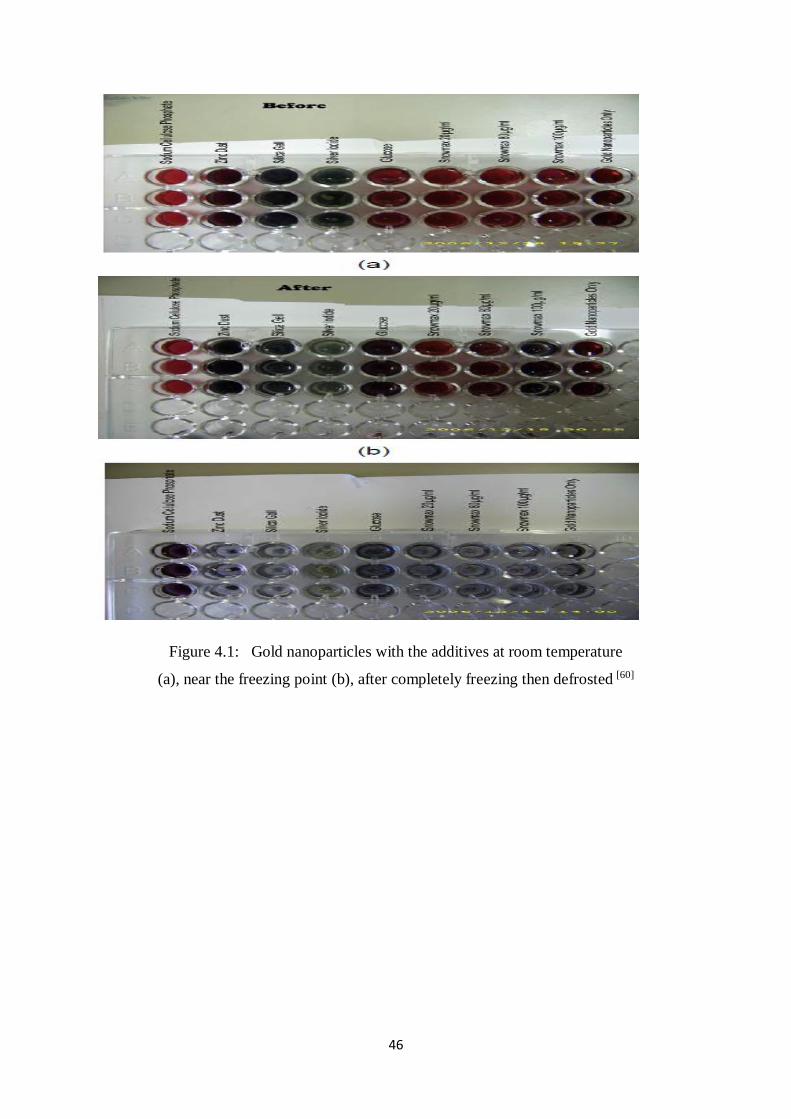
The result of the test demonstrates at figure (4.2). It shows that zinc dust, silica gel, silver
iodide (homemade, without purification) affect instability of the gold nanoparticles solution.
The color of gold nanoparticles changes after addition of the additives in room temperature
(Fig. 4.1a). Snowmax 100 μg/ml is considered to be the one of the fast additives that can
change color (Fig 4.1b). After the gold nanoparticles is frozen completely, all the solution
become colorless (Fig 4.1c)
46
Figure 4.1: Gold nanoparticles with the additives at room temperature
(a), near the freezing point (b), after completely freezing then defrosted [60]

47
4.4.6 Experimental method
The concept of the detection of vaccine freezing temperatures' is based on the use of GNRs,
located close to vaccines or eventually inside a Container and refrigerators. In freezing case
the GNRs solution were frozen and become colorless due to electron relaxation.If the
temperature was changed, the GNRs were converted from frozen manner to colloidal manner
and the color converted from colorless to original gold nanoparticles color.
In normal case the gold nanoparticles need long period to change color in freezing manner.
An attempt to evaluate nanoparticles has been performed by adding different amount s of
some additives like glucose and silica gel. It is expected that the additives will give longer
storage time or faster respond to temperature change.
Figure 4.2: powders of glucose and silica gel
4.4.6.1Materials
In this work tow materiales were selected to prepare freezing Glucose [61] and silicagel [62]
were provided by Sudan university lab, all chemicals were used . deionized water was used
for most of solution preparations
4.4.6.2The instrument
Sensitive balance [KERN Scale] to weighting glucose and silica gel.
Freezer SANYO /ULTRA LOW (-80) and MRI LIBHER (-15) to monitor freezing manners.
48
4.4.6.3 Experiment detailes
The experiment was prepared by two ways
4.4.6.3.1No additive materials to GNPs solution
Weighted 1 ml of fenugreek GNPs solution and then located in freezer adjusted -15 and then
monitor the samples.
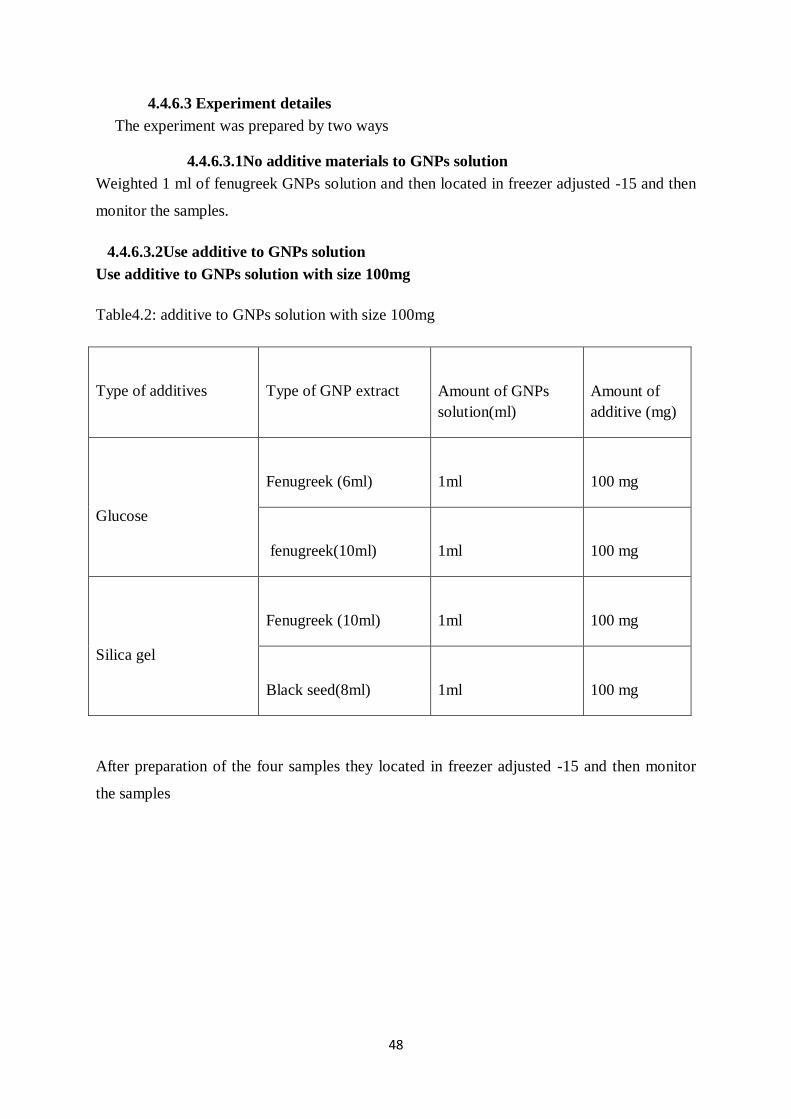
4.4.6.3.2Use additive to GNPs solution
Use additive to GNPs solution with size 100mg
Table4.2: additive to GNPs solution with size 100mg
Type of additives
Type of GNP extract
Amount of GNPs
solution(ml)
Amount of
additive (mg)
Glucose
Fenugreek (6ml)
1ml
100 mg
fenugreek(10ml)
1ml
100 mg
Silica gel
Fenugreek (10ml)
1ml
100 mg
Black seed(8ml)
1ml
100 mg
After preparation of the four samples they located in freezer adjusted -15 and then monitor
the samples

49
Use additive to GNPs solution with size 300 and 700 mgs
Table 4.3: additive to GNPs solution with size 300 and 700 mgs of chemical materials
Type of additives
Type of GNP
extract
Amount of GNPs
solution
(ml)
Amount of
dionized water
(ml)
Amount of
additive
(mg)
Glucose
Fenugreek (10ml)
1ml
1ml
300 mg
0.5ml
1.5ml
700 mg
Black seed(10ml)
1ml
1ml
300 mg
0.5ml
1.5ml
700 mg
Silica gel
Fenugreek (10ml)
1ml
1ml
300 mg
0.5ml
1.5ml
700 mg
Black seed(10ml)
0.4ml
1ml
300 mg
0.5ml
1.5ml
700 mg
After preparation of the eight samples they located in freezer adjusted -15 and then monitor
the samples

50
4.4.6.4 Result and Discussion
4.4.6 .1 In freezing case:
Found that the samples with adding (100 mg of glucose or silica) in response to the degree of
freezing when placed in a refrigerator (-15) the color change during 20 days and slowly.
When it was changed to a refrigerator (-80), noted that the sample No. 2 responded to freeze
quickly and in just one week and become colorless but note that the GNPs are clustered in the
bottom of the tube and the rest of the liquid freezes and change its color. But the rest of the
samples observed change did not happen to them.
Samples with 300 and 700 mg of glucose and silica gel response to freezing through one
week under -150 C and -800 C.
Samples with added glucose and silica (300mg), No change occur in color except for the
sample (300mg of glucose with 0.5ml of GNPs solution).
Sample of fenugreek with added( glucose 700mg), found that the samples changed direction
to become a colorless, we note that the sample to change color from dark purple to lighter and
tended to become colorless response to the freeze and faster when compared to black seed
with added ( glucose 700mg) (see appendix).
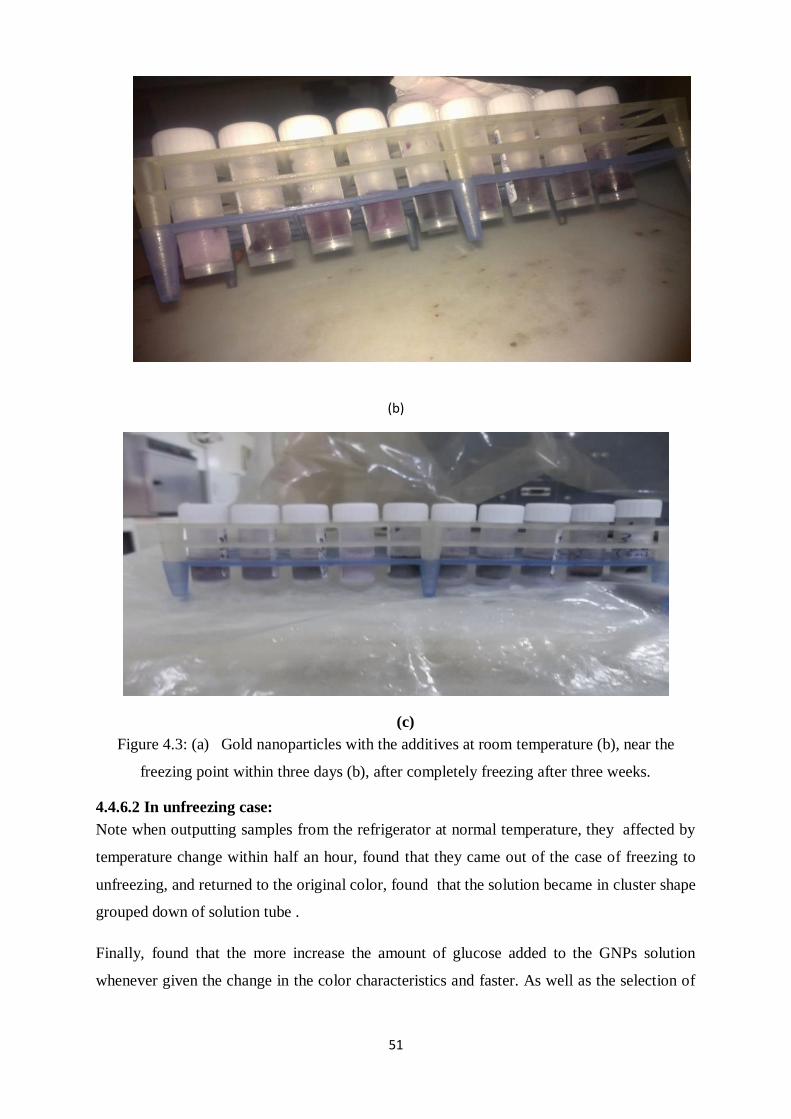
(a)
51
(b)
(c)
Figure 4.3: (a) Gold nanoparticles with the additives at room temperature (b), near the
freezing point within three days (b), after completely freezing after three weeks.
4.4.6.2 In unfreezing case:
Note when outputting samples from the refrigerator at normal temperature, they affected by
temperature change within half an hour, found that they came out of the case of freezing to
unfreezing, and returned to the original color, found that the solution became in cluster shape
grouped down of solution tube .
Finally, found that the more increase the amount of glucose added to the GNPs solution
whenever given the change in the color characteristics and faster. As well as the selection of
52
glucose Itself gives a change in the characteristics and best results when compared to choose
silica gel.
also found that the fenugreek in response to the change in temperature faster than black seed
, as well as change color characteristics in a short time, which gives a good indication to an
application in vaccines to check the degree of preservation and freezing.
4.4.6.5 Conclusion
The development of new synthesis methods for vaccine irreversible detector using cheap
and nontoxic chemicals, environmentally benign solvents and renewable materials remains a
challenge to the scientific community.
Gold nanoparticles can be proposed as a new alternative for freezing indicator. The
suggestion is to stick the freezing indicator on the each packaging of the vaccine. Once the
freezing indicator change colour to colourless, that indicates that the vaccine has been
exposed to freezing state [60].
In normal case the gold nanoparticles need long period to change color in freezing
manner so the suggestion to add some chemical additives to give longer storage time or faster
respond to temperature change.
Freezing of nanoparticles is a very complex process that requires a major investigation
of the formulation and the process conditions. Many parameters of the formulation may
decide the success of freezing as the nanoparticles composition (type of polymer, type and
concentration of chemical materials, interaction between chemical materials and
nanoparticles solution).
Furthermore, the applied conditions of freezing can impact the stabilization of nanoparticles
during and after freezing, especially the temperature, and the duration of each stage of the
process.

53
CHAPTER five
Conclusion and Recommendation

54
5. Conclusion and Recommendation
5.1 Conclusion
Gold nanoparticles Nanoparticles have wide applications in the field of biomedicine such as
drug delivery, imaging, diagnosis and therapeutics due to their extremely small size, high
surface area, stability, non-cytotoxicity, physical and chemical properties.
Recent research has been focused on green synthesis methods to produce new nanomaterial,
eco-friendly and safer with sustainable commercial viability.
Gold nanoparticle was synthesis using biological method, the black seed, and fenugreek seed
extracts as reducing agent for aqueous solution of gold salt and gum Arabic as stabilizer.
The synthesized GNPs are characterized using UV-VIS spectrophotometer, FTIR,
transition electron microscope and XRD analysis
Fourier transform infrared spectroscopy (FTIR) measurements were carried out to identify
the possible biomolecules in the aqueous extract of seeds, which are responsible for the
reduction of the Au+ ions and capping of the resulting Au NPs.
It was found that the concentration of the precursors affects the size of the nanoparticles.
The result finding the Typical TEM images obtained for 10 ml black seed colloids consist of
almost uniformly sized spherical nanoparticles, while fenugreek consist of different shapes of
GNPS.
The XRD studies reflect an interesting feature indicates that gold nanocrystals are highly
anisotropic in nature, mainly triangular and hexagonal shapes, and that the particles are (111)
oriented.
The development of new synthesis methods for vaccine irreversible detector using cheap and
nontoxic chemicals, environmentally benign solvents and renewable materials remains a
challenge to the scientific community. Most of the current methods involve known protocols
which may be potentially harmful to either environment or human health.
The finding of the present study, the selection of chemical material is important to give good
result. also the fenugreek in response to the change in temperature faster than black seed , as

55
well as change color characteristics in a short time, which gives a good indication to an
application in vaccines to check the degree of preservation and freezing.
5.2 Recommendation
This review briefly dealt with the roles of GNPs as detector in vaccines stores. Particular
attention, moreover, was given to the temperature as the significant for detection of freezing.
1. Add different amount of glucose and silica gel started from 700mg to give best result of
colourless.
2. Analyse the addition of glucose and silica gel to GNP samples by UV-VIS spectroscopy to
study optical properties.
3. Synthesis Vaccines container efficiency detector by addition other chemical materials and
evaluate it to choose the best one.
4. Designing simple and inexpensive analytical systems to arrive to final shape of detector.
56
References 1. Malsch, N.H. ed., 2005. Biomedical nanotechnology. Crc Press.
2. Roco, M.C. and Bainbridge, W.S., 2002. Converging Technologies for Improving Human
Performance, National Science Foundation. Arlington, Virginia.
3. Roco, M.C., 2003. Nanotechnology: convergence with modern biology and
medicine. Current opinion in biotechnology, 14(3), pp.337-346.
4. Ishijima, A. and Yanagida, T., 2001. Single molecule nanobioscience.Trends in
biochemical sciences, 26(7), pp.438-444.
5. Park, J.H., Lim, Y.T., Park, O.O., Kim, J.K., Yu, J.W. and Kim, Y.C., 2004. Polymer/gold
nanoparticle nanocomposite light-emitting diodes: enhancement of electroluminescence
stability and quantum efficiency of blue-light-emitting polymers. Chemistry of
materials, 16(4), pp.688-692.
6. Eustis, S. and El-Sayed, M.A., 2006. Why gold nanoparticles are more precious than pretty
gold: noble metal surface plasmon resonance and its enhancement of the radiative and
nonradiative properties of nanocrystals of different shapes. Chemical Society Reviews, 35(3),
pp.209-217.
7. Quantum Mechanical Continuum Solvation Models Tomasi, J., Mennucci, B. and Cammi,
R., Chemical Reviews (Washington, DC, United States) (2005), 105 (8), 2999-3093 CODEN:
CHREAY; ISSN: 0009-2665.
8. Deb, S., Patra, H.K., Lahiri, P., Dasgupta, A.K., Chakrabarti, K. and Chaudhuri, U., 2011.
Multistability in platelets and their response to gold nanoparticles. Nanomedicine:
Nanotechnology, Biology and Medicine, 7(4), pp.376-384.
9. Roco, M.C., 1999. Nanoparticles and nanotechnology research. Journal of Nanoparticle
Research, 1(1), pp.1-6.
10. Burda, C., Chen, X., Narayanan, R. and El-Sayed, M.A., 2005. Chemistry and properties
of nanocrystals of different shapes. Chemical reviews, 105(4), pp.1025-1102.
11. Fiiipponi, L. and Sutherland, D. eds., 2012. Nanotechnologies: Principles, Applications,
Implications and Hands-on Activities: a Compendium for Educators. European Union,
Directorate General for Research and Innovation.
12. Murawala, P., Tirmale, A., Shiras, A. and Prasad, B.L.V., 2014. In situ synthesized BSA
capped gold nanoparticles: Effective carrier of anticancer drug Methotrexate to MCF-7 breast
cancer cells. Materials Science and Engineering: C, 34, pp.158-167.
13. Greenwood, N.N. and Earnshaw, A., 1997. Chemistry of the Elements, Reed Educational
and Professional Publishing Ltd. Woburn, MA, USA.

57
15. Daniel, M.C. and Astruc, D., 2004. Gold nanoparticles: assembly, supramolecular
chemistry, quantum-size-related properties, and applications toward biology, catalysis, and
nanotechnology. Chemical reviews, 104(1), pp.293-346.
16. Winter, J., 2012. Gold nanoparticle biosensors.
17. Fragoon, A., Li, J., Zhu, J. and Zhao, J., 2012. Biosynthesis of controllable size and shape
gold nanoparticles by black seed (Nigella sativa) extract.Journal of nanoscience and
nanotechnology, 12(3), pp.2337-2345.
18. Jain, N., Bhargava, A., Majumdar, S., Tarafdar, J.C. and Panwar, J., 2011. Extracellular
biosynthesis and characterization of silver nanoparticles using Aspergillus flavus NJP08: a
mechanism perspective. Nanoscale, 3(2), pp.635-641.
19. Ahmed, S., Ahmad, M., Swami, B.L. and Ikram, S., 2016. A review on plants extract
mediated synthesis of silver nanoparticles for antimicrobial applications: a green
expertise. Journal of Advanced Research, 7(1), pp.17-28.
20. Gali-Muhtasib, H., El-Najjar, N. and Schneider-Stock, R., 2006. The medicinal potential
of black seed (Nigella sativa) and its components.Advances in Phytomedicine, 2, pp.133-153.
21. Abdel-Nabey, A.A. and Damir, A.A., 1990. Changes in some nutrients of fenugreek
(Trigonella Foenum graecum L.) seeds during water boiling. Plant Foods for Human
Nutrition, 40(4), pp.267-274.
22. Bukhari, S.B., Bhanger, M.I. and Memon, S., 2008. Antioxidative activity of extracts
from fenugreek seeds (Trigonella foenum-graecum). Pakistan Journal of Analytical &
Environmental Chemistry, 9(2).
23. Mittal, J., Batra, A., Singh, A. and Sharma, M.M., 2014. Phytofabrication of
nanoparticles through plant as nanofactories. Advances in Natural Sciences: Nanoscience and
Nanotechnology, 5(4), p.043002.
24. Aromal, S.A. and Philip, D., 2012. Green synthesis of gold nanoparticles using Trigonella
foenum-graecum and its size-dependent catalytic activity.Spectrochimica Acta Part A:
Molecular and Biomolecular Spectroscopy, 97, pp.1-5.
25. Wandrey, C., Bartkowiak, A. and Harding, S.E., 2010. Materials for encapsulation.
In Encapsulation technologies for active food ingredients and food processing (pp. 31-100).
Springer New York.
26. Namboodiri, V.V. and Varma, R.S., 2001. Microwave-accelerated Suzuki cross-coupling
reaction in polyethylene glycol (PEG). Green Chem., 3(3), pp.146-148.
27. Komarneni, S., 2003. Nanophase materials by hydrothermal, microwave-hydrothermal
and microwave-solvothermal methods. CURRENT SCIENCE-BANGALORE-, 85(12),
pp.1730-1734.
58
28. Umer, A., Naveed, S., Ramzan, N. and Rafique, M.S., 2012. Selection of a suitable
method for the synthesis of copper nanoparticles. Nano, 7(05), p.1230005.
29. Jørgensen, C.K., 1962. Absorption spectra of transition group complexes of sulphur-
containing ligands. Journal of Inorganic and Nuclear Chemistry,24(12), pp.1571-1585.
30. Mie, G., 1976. Contributions to the optics of turbid media, particularly of colloidal metal
solutions. Contributions to the optics of turbid media, particularly of colloidal metal solutions
Transl. into ENGLISH from Ann. Phys.(Leipzig), v. 25, no. 3, 1908 p 377-445, 1, pp.377-
445.
31. Faraday, M., 1857. The Bakerian lecture: experimental relations of gold (and other
metals) to light. Philosophical Transactions of the Royal Society of London, 147, pp.145-181.
32. Papavassiliou, G.C., 1979. Optical properties of small inorganic and organic metal
particles. Progress in Solid State Chemistry, 12(3), pp.185-271.
33. shimadzu uv-vis spectrometer.pdf
34. Griffiths, P.R. and De Haseth, J.A., 2007. Fourier transform infrared spectrometry (Vol.
171). John Wiley & Sons.
35. Banwell C. N., McCash E. M., Fundamentals of Molecular Spectroscopy, McGraw-Hill,
United Kingdom, Ch-3, 1996, 55.
36. shimadzu FTIR spectrometer.pdf
37. Wang, Z.L. ed., 2000. Characterization of nanophase materials (pp. 13-14). New York:
Wiley-Vch.
38. Glusker, J.P., 1998. The teaching of crystallography: a historical survey.Acta
Crystallographica Section A: Foundations of Crystallography, 54(6), pp.707-715.
39. Droessler, L.M., Watt, A.A. and Assender, H.E., 2014. Lead Oxides for
Photovoltaics (Doctoral dissertation, University of Oxford).
40. Smith, B.J. and Whalley, W.B., 1988. A note on the characteristics and possible origins of
desert varnishes from southeast Morocco. Earth Surface Processes and Landforms, 13(3),
pp.251-258.
41. Echlin, P., Fiori, C.E., Goldstein, J., Joy, D.C. and Newbury, D.E., 2013.Advanced
scanning electron microscopy and X-ray microanalysis. Springer Science & Business Media.
42. Hanley, S.J., Revol, J.F., Godbout, L. and Gray, D.G., 1997. Atomic force microscopy
and transmission electron microscopy of cellulose from Micrasterias denticulata; evidence for
a chiral helical microfibril twist.Cellulose, 4(3), pp.209-220.
43. Wang, Z.L. ed., 2000. Characterization of nanophase materials (pp. 13-14). New York:
Wiley-Vch.

59
44. Stock, S.R. and Veis, A., 2003. Preliminary microfocus X-ray computed tomography
survey of echinoid fossil microstructure. Geological Society, London, Special
Publications, 215(1), pp.225-235.
45. Wulf, A., 2012. Determining the Size and Shape of Gold Nanoparticles(Doctoral
dissertation).
47. Toderas, F., Iosin, M. and Astilean, S., 2009. Luminescence properties of gold
nanorods. Nuclear Instruments and Methods in Physics Research Section B: Beam
Interactions with Materials and Atoms, 267(2), pp.400-402.
48. Devi Prasad, A.G., Komal Kumar, J. and Sharanappa, P., 2011. Fourier transform infrared
spectroscopic study of rare and endangered medicinal plants. Romanian Journal of
Biophysics, 21(3, Cop), pp.221-230.
49. Smitha, S.L., Philip, D. and Gopchandran, K.G., 2009. Green synthesis of gold
nanoparticles using Cinnamomum zeylanicum leaf broth.Spectrochimica Acta Part A:
Molecular and Biomolecular Spectroscopy,74(3), pp.735-739.
50. Bukhari, S.B., Bhanger, M.I. and Memon, S., 2008. Antioxidative activity of extracts
from fenugreek seeds (Trigonella foenum-graecum). Pakistan Journal of Analytical &
Environmental Chemistry, 9(2).
51. Moghimi, S.M., Hunter, A.C. and Murray, J.C., 2005. Nanomedicine: current status and
future prospects. The FASEB journal, 19(3), pp.311-330.
52. Pankhurst, Q.A., Connolly, J., Jones, S.K. and Dobson, J.J., 2003. Applications of
magnetic nanoparticles in biomedicine. Journal of physics D: Applied physics, 36(13),
p.R167.
53. Hullmann, A., 2006. The economic development of nanotechnology-An indicators based
analysis. EU report.
54. Sau, T.K. and Goia, D.V., 2012. Biomedical Applications of Gold Nanoparticles. In Fine
Particles in Medicine and Pharmacy (pp. 101-145). Springer US.
55. Horikoshi, S. and Serpone, N., 2013. Introduction to nanoparticles.Microwaves in
Nanoparticle Synthesis: Fundamentals and Applications, pp.1-24.
56. Love, J.C., Estroff, L.A., Kriebel, J.K., Nuzzo, R.G. and Whitesides, G.M., 2005. Self-
assembled monolayers of thiolates on metals as a form of nanotechnology. Chemical
reviews, 105(4), pp.1103-1170.
57. McNeil, S.E., 2005. Nanotechnology for the biologist. Journal of Leukocyte
Biology, 78(3), pp.585-594.
58. Malsch, N.H. ed., 2005. Biomedical nanotechnology. Crc Press.
60
59. Poland, G.A., Shefer, A.M., McCauley, M., Webster, P.S., Whitley-Williams, P.N., Peter,
G., National Vaccine Advisory Committee and Ad Hoc Working Group for the Development
of Standards for Adult Immunization Practices, 2003. Standards for adult immunization
practices. American journal of preventive medicine, 25(2), pp.144-150.
60. Kurniawan, F., 2009. New analytical applications of gold nanoparticles(Doctoral
dissertation).
61. POCDscientifi , Material Safety Data Sheet d-Glucose , 2012 Page 1 of 3
62. Baccile, N., Babonneau, F., Thomas, B. and Coradin, T., 2009. Introducing ecodesign in
silica sol–gel materials. Journal of Materials Chemistry, 19(45), pp.8537-8559.
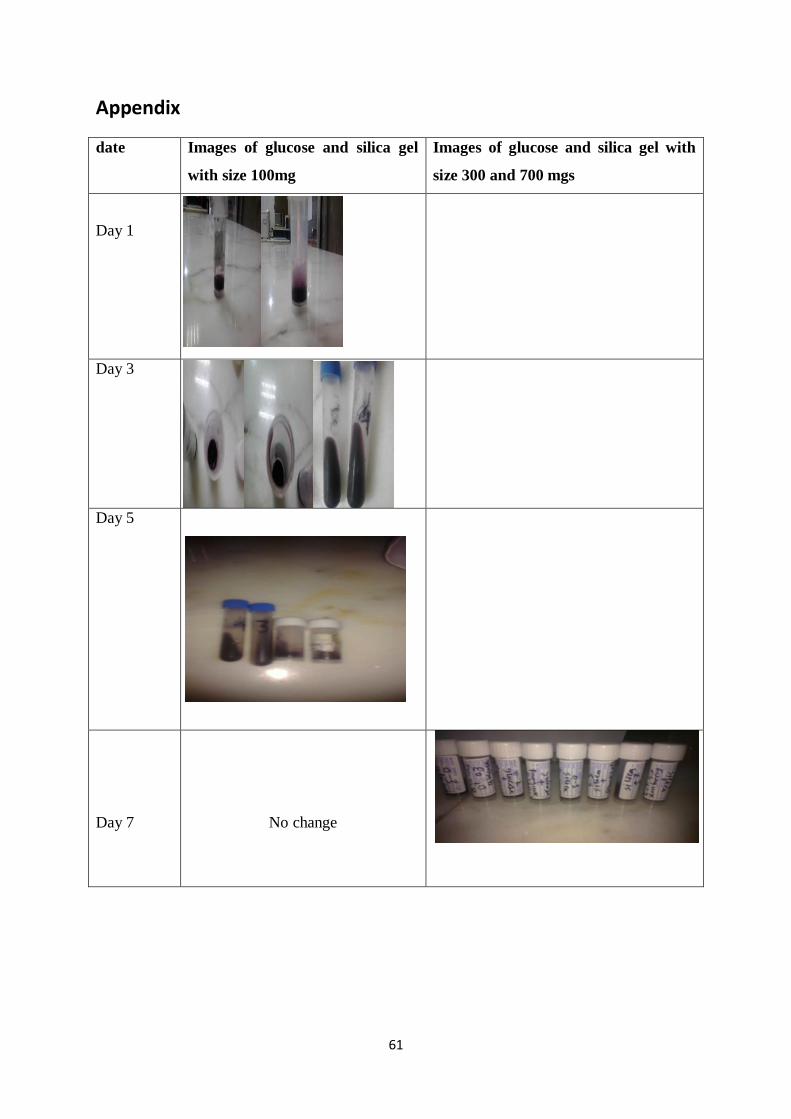
61
Appendix
date Images of glucose and silica gel
with size 100mg
Images of glucose and silica gel with
size 300 and 700 mgs
Day 1
Day 3
Day 5
Day 7
No change

62
Day 9
No change
Day 11 No change
Day 13 The samples unfreezing and they returned to original colors for unexpected
malfunction of freezer at (-150 C)and then changed to freezer (-800 C)
Day 15

63
Day 17
Day 19
Day 21
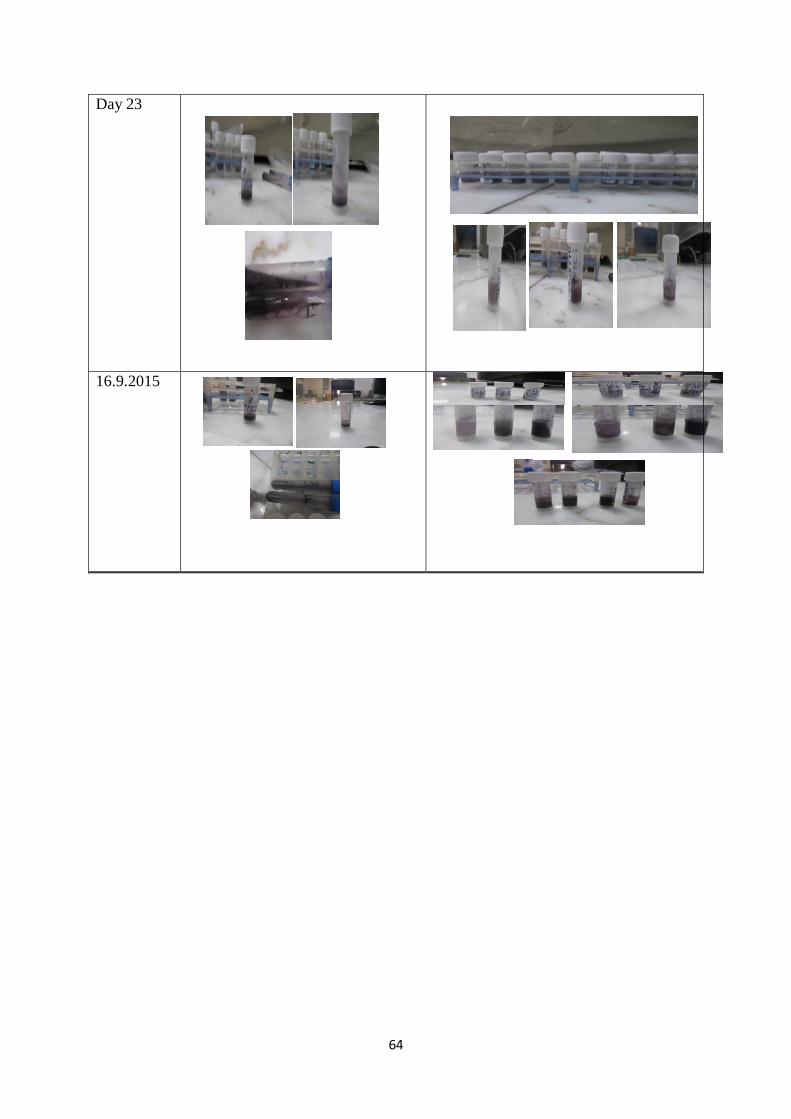
64
Day 23
16.9.2015
Related Documents