Introduction to GIS using Quantum GIS 1.8.0-Lisboa Introduction The purpose of this tutorial is to introduce you to the use of all Quantum GIS (QGIS) functions. Each lesson is designed to instruct you in one or more of these functions. If you are unfamiliar with geographic information systems (GIS), one resource you can review is the Guide to Geographic Information Systems (www.gis.com). Table of contents 1. Adding layers 2. The toolbar 3. Changing names of layers, layer colors, and labeling 4. Making a layer active and exploring the data 5. Using the query builder 6. Changing layer properties, symbolizing data, and creating/editing data 7. Creating new GIS data 8. Map units, scale, and coordinates 9. Printing a map and saving as a graphics file Adding layers The purpose of Lesson 1 is to demonstrate how to add layers to QGIS. What you will learn in this lesson will be useful if you are running QGIS for the first time, or if you need to create a new database. 1. Go to MassGIS (http://www.mass.gov/anf/research-and-tech/it-serv-and-support/application- serv/office-of-geographic-information-massgis/datalayers/cen2000towns.html) to download the US Census (2000) town layer as polygons. Also download (http://www.mass.gov/anf/research- and-tech/it-serv-and-support/application-serv/office-of-geographic-information- massgis/datalayers/cen2000hydro.html). Run the .exe file to unzip both sets of data. 2. Start Quantum GIS by going to Start > All Programs > Quantum GIS Lisboa > Quantum GIS Desktop (1.8.0). 3. Click on the Add Vector Layer button ( ), click Browse, and navigate to the folder where you stored the data. Add the two shapefiles you just downloaded (.shp). Note: you may use the Ctrl or Shift keys to select more than one theme at a time. The Ctrl key allows you to select specific individual themes; the Shift key allows you to highlight a range of themes. 4. Download a USGS color ortho image (aerial photograph) from MassGIS for the MIT campus and Back Bay part of Boston (http://www.mass.gov/anf/research-and-tech/it-serv-and- support/application-serv/office-of-geographic-information- massgis/datalayers/colororthos2008.html). Click download, then use Method 2 for 30 cm imagery (this will download an image with 30 cm x 30 cm resolution). Download tile 23429005.zip and extract the data into your working folder.

Welcome message from author
This document is posted to help you gain knowledge. Please leave a comment to let me know what you think about it! Share it to your friends and learn new things together.
Transcript

Introduction to GIS using Quantum GIS 1.8.0-Lisboa
Introduction
The purpose of this tutorial is to introduce you to the use of all Quantum GIS (QGIS) functions. Each
lesson is designed to instruct you in one or more of these functions. If you are unfamiliar with
geographic information systems (GIS), one resource you can review is the Guide to Geographic
Information Systems (www.gis.com).
Table of contents
1. Adding layers
2. The toolbar
3. Changing names of layers, layer colors, and labeling
4. Making a layer active and exploring the data
5. Using the query builder
6. Changing layer properties, symbolizing data, and creating/editing data
7. Creating new GIS data
8. Map units, scale, and coordinates
9. Printing a map and saving as a graphics file
Adding layers
The purpose of Lesson 1 is to demonstrate how to add layers to QGIS. What you will learn in this lesson
will be useful if you are running QGIS for the first time, or if you need to create a new database.
1. Go to MassGIS (http://www.mass.gov/anf/research-and-tech/it-serv-and-support/application-
serv/office-of-geographic-information-massgis/datalayers/cen2000towns.html) to download the
US Census (2000) town layer as polygons. Also download (http://www.mass.gov/anf/research-
and-tech/it-serv-and-support/application-serv/office-of-geographic-information-
massgis/datalayers/cen2000hydro.html). Run the .exe file to unzip both sets of data.
2. Start Quantum GIS by going to Start > All Programs > Quantum GIS Lisboa > Quantum GIS
Desktop (1.8.0).
3. Click on the Add Vector Layer button ( ), click Browse, and navigate to the folder where you
stored the data. Add the two shapefiles you just downloaded (.shp).
Note: you may use the Ctrl or Shift keys to select more than one theme at a time. The Ctrl key allows
you to select specific individual themes; the Shift key allows you to highlight a range of themes.
4. Download a USGS color ortho image (aerial photograph) from MassGIS for the MIT campus and
Back Bay part of Boston (http://www.mass.gov/anf/research-and-tech/it-serv-and-
support/application-serv/office-of-geographic-information-
massgis/datalayers/colororthos2008.html). Click download, then use Method 2 for 30 cm
imagery (this will download an image with 30 cm x 30 cm resolution). Download tile
23429005.zip and extract the data into your working folder.

5. Click on the Add Raster Layer button ( ) and navigate to the folder where you stored the data.
Click 23429005.sid then click Open.
Note: When searching for data, make sure “Files of type” is selected as “All files (*,*)” so all data files
will appear.
6. Turn the three layers on and off by checking the small box to the left of the name of each layer
in the Map Legend. If you still cannot see the image, right click the layer name and go to Zoom
to Layer Extent.
7. Change the order of the layers on the map. The order that layers are listed in the Table of
Contents dictates the order that they draw on the map. Click the layer names then drag to make
the order 1) Census2000hydro_poly, 2) 23429005, and 3) Census2000towns_poly.
8. Save your QGIS project file. In the File menu click Save Project As. Choose a name and save it to
the directory with the data you downloaded.
QGIS allows users to save a record of the layers that have been added to a map display, along with the
map display. This allows users to recover a map display including the layers in the map, symbolization,
visibility, units of measurement, and other display settings. We recommend saving frequently with any
GIS software.
The toolbar
1. Look at the QGIS Toolbar. Move your mouse over each tool icon. Notice that the software will
indicate the name of each tool.
2. Click on the Zoom In button ( ). You will notice that your cursor turns into a magnifying glass
with a plus sign (+) inside the glass. Click your left mouse button over the map and continue to
hold the button down. As you do, drag the mouse in any direction. You will notice that a white
box appears on the map and increases or decreases in size depending on how you move your
mouse. If you release the left mouse button the Map View will zoom to the new "map extents"
(i.e., min x, max x, min y, and max y) represented by the window you created with the tool.
Notice also that theme will zoom in to a larger-scale (i.e. more detailed map). Using this tool,
you can click anywhere on the theme in the Map View and drag a box in any direction.
3. Click on the Zoom Out button ( ). The cursor will turn into a magnifying glass with a minus
sign (-) inside the glass. Move the magnifying glass over the zoomed in theme on your map view.
Click your left mouse button one time. You will notice that the theme will "zoom out" to a
smaller-scale (i.e., less detailed map). If you continue to click the left mouse button, the map will
continue to get smaller.
4. Zoom Full ( ) will zoom to the full extent of all the layers in the map.
5. Pan ( ) drags the Map View in any direction.

6. If you want more screen real estate, you can turn the Table of Contents on or off. Choose View
> Panels and click Layers. For now, leave the Layers checkbox enabled.
Changing names of layers, layer colors, and labeling
The layer properties dialog box enables one to change a variety of display properties for each layer,
including symbology and labeling. There are two ways you can get to the layer properties dialog box: 1)
right click the layer name then click properties, or 2) click the icon just below the layer name.
1. Under the General tab, change the display name of census2000hydro_poly to “water”
2. Change the layer from filled to a blue outline with no fill (Style tab, Change button with the
wrench). Press OK when you are done.
Within the Style tab, note that it is possible to “Set a Color as Transparent” by sliding the Transparency
button over to a specific percentage. By doing this the color will be transparent and will allow features
on the layer over which the transparent theme lies to be seen. Press OK when you are done modifying
the style.
QGIS provides the capability to label feature themes based on a user-specified text field from the layers
database.
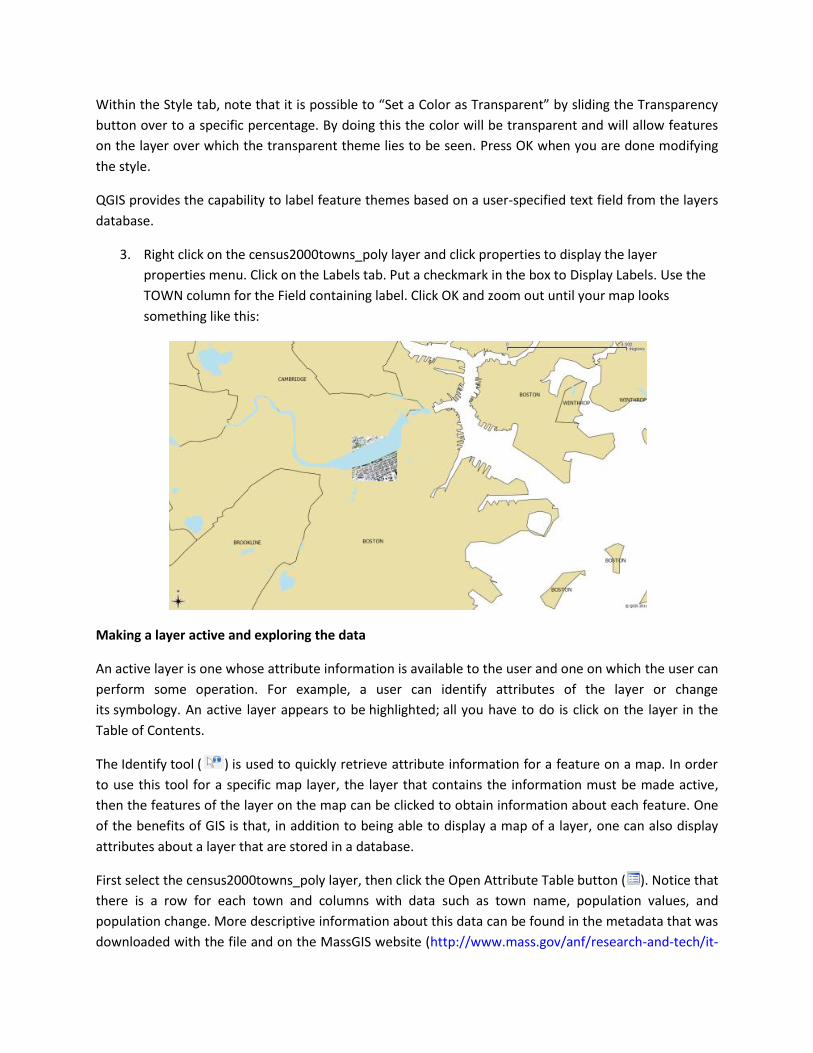
3. Right click on the census2000towns_poly layer and click properties to display the layer
properties menu. Click on the Labels tab. Put a checkmark in the box to Display Labels. Use the
TOWN column for the Field containing label. Click OK and zoom out until your map looks
something like this:
Making a layer active and exploring the data
An active layer is one whose attribute information is available to the user and one on which the user can
perform some operation. For example, a user can identify attributes of the layer or change
its symbology. An active layer appears to be highlighted; all you have to do is click on the layer in the
Table of Contents.
The Identify tool ( ) is used to quickly retrieve attribute information for a feature on a map. In order
to use this tool for a specific map layer, the layer that contains the information must be made active,
then the features of the layer on the map can be clicked to obtain information about each feature. One
of the benefits of GIS is that, in addition to being able to display a map of a layer, one can also display
attributes about a layer that are stored in a database.
First select the census2000towns_poly layer, then click the Open Attribute Table button ( ). Notice that
there is a row for each town and columns with data such as town name, population values, and
population change. More descriptive information about this data can be found in the metadata that was
downloaded with the file and on the MassGIS website (http://www.mass.gov/anf/research-and-tech/it-

serv-and-support/application-serv/office-of-geographic-information-
massgis/datalayers/cen2000towns.html) where you downloaded the data.
Click on the Select Feature tool ( ), and select several of the polygons representing Massachusetts
towns. Holding the Ctrl key will allow you to select more than one feature.
When a record is selected on the map or in the table it changes color so it is distinguishable from the
non-selected records. Also notice a set of helpful tools in the bottom of the attribute table dialog box
which offer options such as move selection to the top, invert selection, show selected only, or search
selected only.
Using the query builder
The query builder tool enables you to find all map features that meet a certain criterion or criteria. For
example, suppose you were working with a map of the United States and wanted to find all cities with a
population of 1 million people or greater. The following is an outline of how to use the Query
Builder tool:
1. Right click the layer for which you want to find map features, and select Open Attribute Table.
2. In right hand corner click the Advanced search button. The Build Query dialogue box will appear.
3. From the Fields Menu, choose the desired field by double clicking it.
4. Choose the appropriate mathematical operation for your query.
5. Click Test and search results box will appear and show how many matching features that meet
the criterion will be displayed. Click OK
6. Click OK again to run the query.
7. Click Clear to clear any previous queries.
Build the following query using the census2000towns_poly layer:
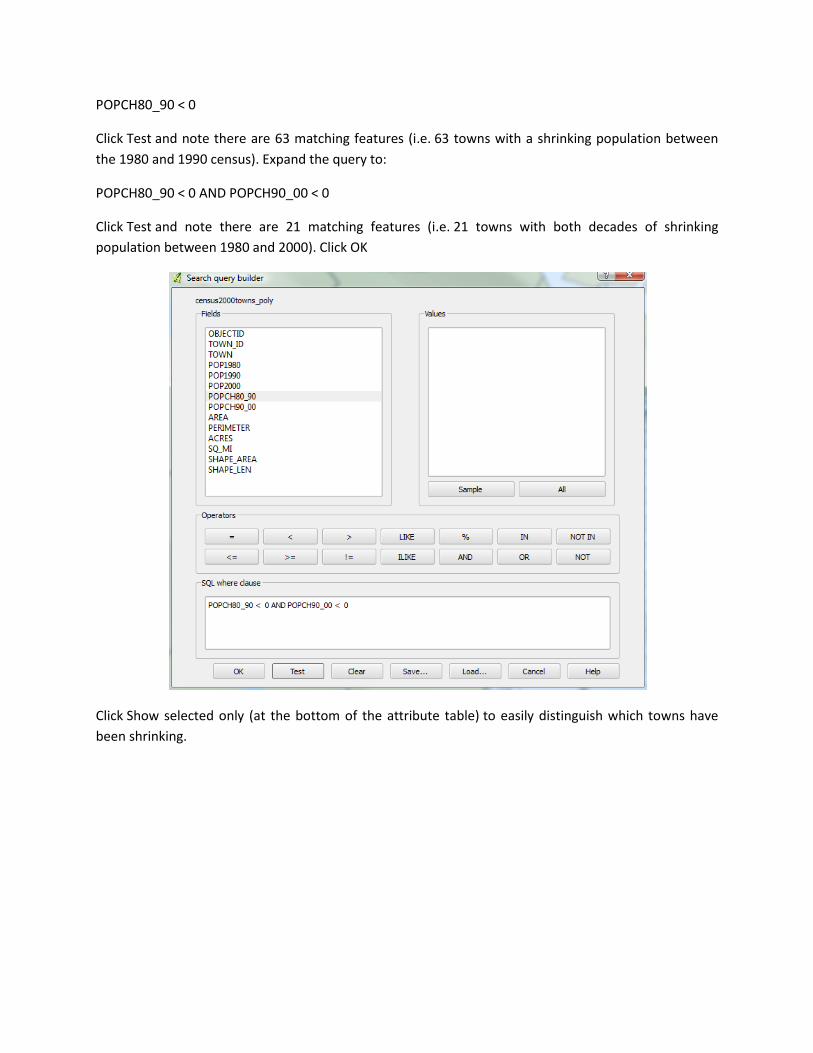
POPCH80_90 < 0
Click Test and note there are 63 matching features (i.e. 63 towns with a shrinking population between
the 1980 and 1990 census). Expand the query to:
POPCH80_90 < 0 AND POPCH90_00 < 0
Click Test and note there are 21 matching features (i.e. 21 towns with both decades of shrinking
population between 1980 and 2000). Click OK
Click Show selected only (at the bottom of the attribute table) to easily distinguish which towns have
been shrinking.

Look at the map to see the selected features and visualize the areas with shrinking towns. Make sure
Labels are turned off at the full extent. After you’ve completed this step, you can clear the selected
features (this button is to the right of the Select single feature button).
Changing layer properties, symbolizing data, and creating/editing data
There are four symbology renderers in the Legend Type drop down box that allows you to choose
between the symbolization options: Single Symbol, Graduated Symbol, Continuous Color, and Unique
Value. Use graduated symbol to look at the population change between the 1990 and 2000 census in
the state of Massachusetts by town.
1. Right click and open the layer properties dialog box for census2000towns_poly, and go to the
Style tab.
2. Change the style to Graduated in the drop-down menu in the top left.
3. Select POPCH90_00 as the column.
4. Choose Equal Interval as the mode (an equal number of features/rows from the specified field
and a color will be assigned to each class) with five classes (or “breaks”). Click classify and apply.
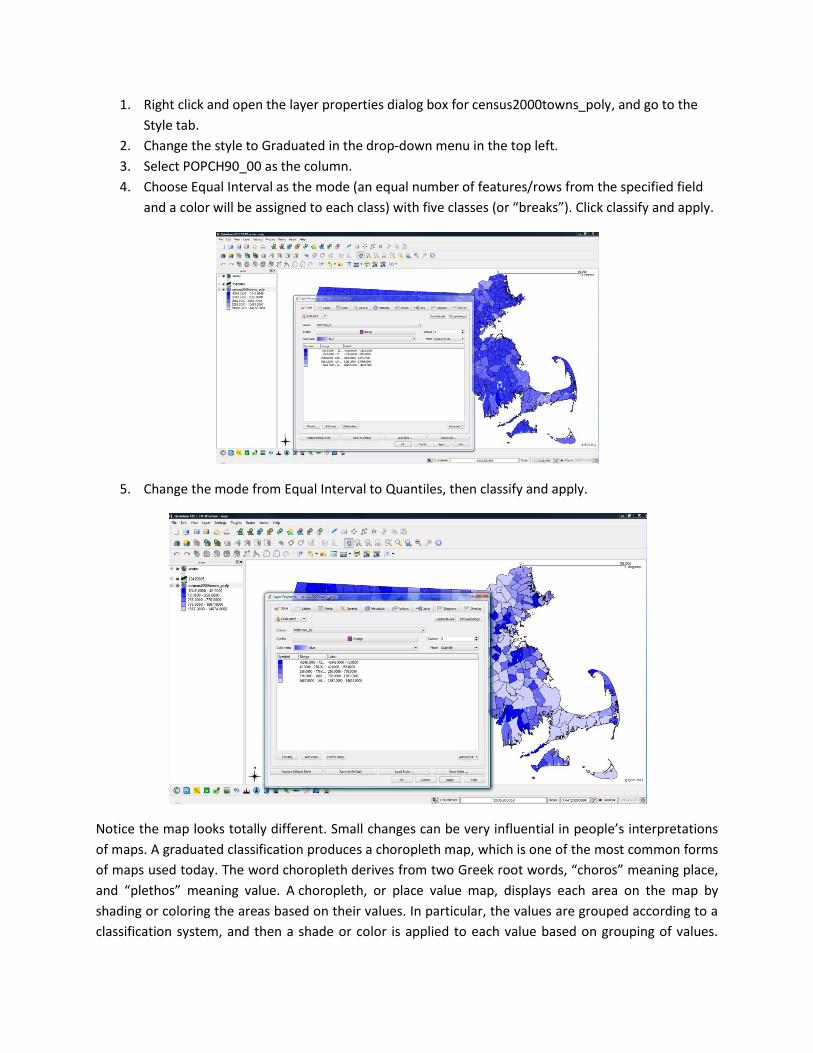
5. Change the mode from Equal Interval to Quantiles, then classify and apply.
Notice the map looks totally different. Small changes can be very influential in people’s interpretations
of maps. A graduated classification produces a choropleth map, which is one of the most common forms
of maps used today. The word choropleth derives from two Greek root words, “choros” meaning place,
and “plethos” meaning value. A choropleth, or place value map, displays each area on the map by
shading or coloring the areas based on their values. In particular, the values are grouped according to a
classification system, and then a shade or color is applied to each value based on grouping of values.

Shades or colors are usually graduated from light to dark with dark meaning more of the value and
light meaning less of the value.
Creating new GIS data
We will create polygons to represent buildings by
tracing (“digitizing”) from the aerial photograph.
1. Zoom in close on layer 23429005, until you
can clearly make out individual buildings.
2. Click the New Shapefile Layer button ( ).
Make the type polygon and add a text
attribute for building names abbreviated
as bldgname. Make sure to click Add to
attributes list.
3. Press OK. Save the new file as buildings.shp
to your working directory.
4. Click the toggle editing button ( ).
5. Click the Add Feature button ( ).
6. Left click on 3 corners of the building then
right click on the last to close the polygon.
You will be prompted to fill out the attribute
table for your new polygon, so enter a name for the building.
7. Click the save edits button ( ) to save your new building. Toggle out of edit mode by clicking
the toggle editing button.
Map units, scale, and coordinates
The purpose of this lesson is to familiarize you with how to set map units, how to determine map scale
for the map shown in the Map View, and how to determine coordinate values for features shown in
the Map View.
1. Look down at the bottom of the screen at the Status Bar. There are two things shown.
One displays an X/Y coordinate, and the other shows the scale. The map units must be set in
order for the scale of the map in the Map View to be indicated.
2. To see what the map units are, or to set them, click Settings > Options > Map tools tab. Notice
the map units are set to meters for these files.
3. Click Settings > Project Properties > General Tab and make sure the layer units are set to
“Meters”, and click OK.
Notice that the scale bar on your map is metric. Every GIS file has map units stored within it. If the
software does not automatically read what they are, then one should check the metadata to find out
what they are and set them manually in the QGIS project. If no map units are specified, an Incorrect
Measure Results box pop-ups and tells you where to fix the coordinates.

Printing a map and saving as a graphics file
The purpose of this lesson is to demonstrate how to use QGIS to print basic maps in landscape format
containing a theme list (legend), the map scale, a title, and a north arrow, as well as save a map as a .jpg,
.qpt or a .pdf file.
1. You can save the map as you see it as an image file. Click File > Save as Image
A dialog box will appear where you should specify the name of your file and save it with your other
work. There are many formats to choose from. JPEG and PNG are widely supported formats that are
easy to insert into text documents and presentations. Or you can create a more meaningful map by
adding the components important for understanding it, such as a title, legend, scale bar, North arrow,
data sources, date created, and any other notes. You can do all these things using Composer.
2. Click File > New Print Composer.
3. In the General tab (on the right) you can specify things like page size and orientation. Choose
landscape in this case.
4. To add the QGIS map canvas, click on the Add new map from QGIS map canvas button ( ) in
the print composer toolbar, and drag a rectangle on the composer canvas with the left mouse
button to add the map.
5. Click on the Label button ( ), and click inside the map to insert a title. In the Item Properties
Tab (on the right), type the name of your map, adjust the font, and the alignment. Towards the
bottom of this dialog box is General options where you can also adjust the frame color, position
and size.
6. Click on the Add Image button, ( ) and draw a square. In the Item Tab in the Preview Box
scroll down until you find a North Arrow and select it.
7. Press the Add new scalebar button ( ). As you draw your box the scale will appear. In the Item
Tab you can adjust what type of scale you want.

8. You can also save a map as a graphics file (.jpg, .pdf, or .qpt). To do so, choose one of the
following buttons: (.qpt, .jpg, and .pdf, respectively). An example of what your map
could look like (without much work on its cartographic design) is below.
Have fun with QGIS!
Related Documents