Number Thirty-Two Spring 2017 CSLS-OECD Special Issue from the First OECD Global Forum on Productivity

Welcome message from author
This document is posted to help you gain knowledge. Please leave a comment to let me know what you think about it! Share it to your friends and learn new things together.
Transcript

Publications Mail Agreement Number 40049476
International Productivity Monitor
Num
ber Thirty-Two, Spring 2017
Number Thirty-Two Spring 2017
CSLS-OECD Special Issue from the First OECD Global Forum on Productivity
International Productivity MonitorThe International Productivity Monitor is published by the Centre for the Study of Living Standards (CSLS) to support
policy analysis and development in the productivity area. The objective of the Monitor is to focus attention on the
importance of productivity for improving living standards and quality of life. The Monitor publishes high-quality arti-
cles on productivity issues, trends and developments in Canada and other countries and serves as a vehicle for the inter-
national discussion of productivity topics. Print and on-line versions are published twice a year. The articles are largely
non-technical in nature and understandable to a wide audience of productivity researchers and analysts as well as the
general public. The publication is distributed to anyone interested in productivity issues on a complimentary basis.
While most articles are invited, submissions will be considered. The CSLS thanks the TD Bank for financial support.
EditorAndrew Sharpe Centre for the Study of Living Standards
Giuseppe Nicoletti OECD
Editorial BoardCraig Alexander Conference Board of Canada
Pierre Fortin Université du Québec à MontréalWulong Gu Statistics Canada
Claude Lavoie Finance CanadaLarry Shute ISED Canada
Pierre St. Amant Bank of Canada
International Advisory CommitteeMartin N. Baily Brookings Institution
Ernie Berndt MITNicholas Bloom Stanford University
Gilbert Cette Banque de FrancePaul Conway New Zealand Productivity Commission
Erwin Diewert University of British ColumbiaLucy Eldridge U.S. Bureau of Labor StatisticsJohn Fernand Federal Reserve Board of San Francisco
Kevin Fox University of New South WalesDennis Fixler U.S. Bureau of Economic Analysis
Barbara Fraumeni Central University for Economic Research, ChinaRobert J. Gordon Northwestern University
Jonathan Haskel Imperial CollegeCharles Hulten University of Maryland
Lawrence Jeffrey Johnson International Labour OrganizationDale Jorgenson Harvard University
Larry Mishel Economic Policy InstitutePascal Petit Université Paris-Nord
Juan Rebolledo Mexican Ministry of Finance and Public CreditMarshall Reinsdorf International Monetary Fund
Jaana Remes McKinsey Global InstitutePaul Schreyer OECDDaniel Sichel Wellesley College
Chad Syverson University of ChicagoBart van Ark University of Groningen and Conference Board
Ilya Voskobnikov Higher School of Economics, MoscowEdward Wolff New York University
Harry Wu Hitotsubaski University
The articles should not be reported as representing the official views of the OECD or of its member
countries. The opinions expressed and arguments employed are those of the author(s).
Centre for the Study of Living Standards
151 Slater Street, Suite 710 Ottawa, Ontario,
Canada K1P 5H3
613-233-8891
[email protected] www.csls.ca
The International Productivity Monitor is indexed
in the Journal of Economic Literature (JEL)
on CD, e-JEL, and EconLit.
ISSN 1492-9759 print
ISSN 1492-9767 on-line
© Centre for the Study of Living Standards, 2017.
I N T E R N A T I O N A L P R O D U C T I V I T Y M O N I T O R N U M B E R T H I R T Y - TW O , S P R I N G 2 0 1 7
Table of Contents
Editors’ Overview 1
Total Factor Productivity in Advanced Countries: A Long-term Perspective 6
Antonin Bergeaud, Remy Lecat and Gilbert Cette
Decomposing the Productivity-Wage Nexus in Selected OECD Countries, 25
1968-2013
Andrew Sharpe and James Uguccioni
The Decoupling of Median Wages from Productivity in OECD Countries 44
Cyrille Schwellnus, Andreas Kappeler and Pierre-Alain Pionnier
The Relationship Between Global Value Chains and Productivity 61
Chiara Criscuolo and Jonathan Timmis
It’s a Small, Small World... A Guided Tour of the Belgian Production 84
Network
Emmanuel Dhyne and Cedric Duprez
Firm-level Productivity Differences: Insight from the OECD’s 97
MultiProd Project
Giuseppe Berlingieri, Patrick Blanchenay, Sara Calligaris and Chiara Criscuolo
Productivity and Reallocation: Evidence from the Universe of Italian Firms 116
Andrea Linarello and Andrea Petrella
Portugal: A Paradox in Productivity 137
Ricardo Pineheiro Alves
The Role of Urban Agglomerations for Economic and Productivity Growth 161
Rudiger Ahrend, Alexander Lembcke and Abel Schumann
Challenges in the Measurement of Public Sector Productivity in OECD 180
Countries
Edwin Lau, Zsuzsanna Lonti and Rebecca Schultz
Pro-Productivity Institutions: Learning from National Experience 196
Sean Dougherty and Andrea Renda

PUBLICATIONS MAIL AGREEMENT NO 40049476
RETURN UNDELIVERABLE CANADIAN ADDRESSES TO:
CSLS
710-151 Slater Street
Ottawa ON K1P 5H3
email: [email protected]
IN T E R N A T I O N A L PR O D U C T I V I T Y MO N I T O R 1
Editor’s Overview
The 32nd issue of the International Productivity Monitor is a special issue produced in collaboration
with the OECD. All articles published in this issue were selected from papers presented at the First
Annual Conference of the OECD Global Forum on Productivity held in Lisbon, Portugal, July 7-8,
2016.
The Forum was established by a large group of OECD member countries in 2015 to provide a plat-
form for the mutual exchange of information and international cooperation between public bodies
with a responsibility for promoting productivity-enhancing policies. The primary purpose of the
Forum is to shed light on the structural and policy drivers of productivity, especially in the context
of the generalized slowdown in productivity growth affecting OECD countries. It helps generate
synergies in policy-oriented research; share data, results and insights; and facilitate the diffusion of
best policy practices leveraging on both cross-country analysis and country-specific experiences. To
this end, the Forum organizes conferences and workshops connecting policy-makers, academics
and other stakeholders and proposes and coordinates research programs in areas related to produc-
tivity, notably by encouraging collaboration with national experts, to extend and support work done
at the OECD.
The issue contains 11 articles by leading pro-
ductivity researchers from eight countries on a
range of topics: long-term productivity trends,
decoupling of wage/productivity growth, pro-
ductivity in global value chains, insights for pro-
ductivity analysis from firm-level productivity
data, productivity trends and drivers in Portu-
gal, the contribution of agglomeration econo-
mies to productivity, public sector productivity
measurement issues, and pro-productivity insti-
tutions.
Productivity growth is by far the most impor-
tant source of long-term improvements in living
standards, but trend productivity growth has
been slowing down markedly over the past
decades and especially since the beginning of the
century. Trend productivity growth is a long-
run phenomenon largely driven by the underly-
ing pace of technological advance. The first arti-
cle in the issue by Banque de France economists
Antonin Bergeaud, Gilbert Cette and Rémy
Lecat provides background for the articles that
follow by presenting new estimates for long-
term total factor productivity (TFP) growth in
four advanced economies (United States, Japan,
the United Kingdom and the Euro area) over the
1890-2015 period. Based on a long-period pro-
ductivity database that the authors have con-
structed, the new TFP estimates take account of
the improved quality of inputs: labour, as prox-
ied by educational attainment, and capital, as
proxied by the average age of equipment. The
role of two General Purpose Technologies (elec-
tricity and information and communication
technologies (ICT)) in long-term productivity
growth is explored. Even after adjustment for
changes in the quality of inputs, the authors find
that much of TFP remains unaccounted for and
confirm the secular trend decline in TFP
growth. A third key finding is that the diffusion
of ICT in recent decades has had a much weaker
impact on TFP than the diffusion of electricity
in earlier decades.
While productivity growth creates the condi-
tions for improving real incomes, recent experi-
ence shows that productivity gains do not
2 NU M B E R 32 , S P R I N G 2017
automatically translate into higher wages for all
workers. Indeed, in recent years many OECD
countries have seen a decoupling of wage growth
from productivity growth, particularly for the
median worker. This trend has negative implica-
tions for the development of inclusive econo-
mies and societies.
The second and third articles in the issue, by
Cyrille Schwellnus, Andreas Kappeler and
Pierre-Alain Pionnier from the OECD and
Andrew Sharpe and James Uguccioni from
the Centre for the Study of Living Standards
(CSLS) respectively, examine in depth this
decoupling phenomenon from different per-
spectives.
The OECD authors focus on two factors to
account for decoupling - trends in the labour
share in GDP and the ratio of median to average
wages, a wage inequality measure. They also
argue that the most appropriate definition of the
aggregate economy for decoupling analysis
should exclude the primary, housing and non-
market sectors. Based on this definition, they
find that median compensation growth lagged
labour productivity growth in 15 of 24 OECD
countries over the 1995-2013 period. Growing
wage inequality was the main reason for this
decoupling, as median compensation grew at a
slower pace than average compensation in 22 of
24 countries. In contrast, the labour share fell in
only 15 countries.
The CSLS authors develop a methodology
that decomposes the relationship between pro-
ductivity and wages into four factors. In addition
to the labour share and wage inequality, they add
the relationship between consumer and pro-
ducer wages which they call labour's terms of
trade , and changes in the importance o f
employer contributions to social programs in
labour compensation. Data limitations restrict
the analysis to 11 countries for the 1986-2013
period. In 9 of the 11 countries median real
hourly earnings lagged labour productivity, with
the largest gap in the United States. Of the four
factors, rising wage inequality was again the
most important taking place in 10 countries.
With production of final products increas-
ingly fragmented across countries, global value
chains (GVC) represent a new and important
feature of the world economy. These new pro-
duction networks have implications for produc-
tivity, a topic addressed in the fourth article by
Chiara Criscuolo and Jonathan Timmis from
the OECD. GVCs is a broader concept than off-
shoring as it also includes indirect linkages along
the supply chain network and reflects the desti-
nation of firm production, that is whether this
production is embodied in the exports of third
countries. The authors quantify GVC participa-
tion in terms of the share of gross exports com-
prised by the backward and forward components
of GVCs. They calculate that this share varied
significantly in OECD countries in 2011, from
70 per cent in Luxembourg to 30 per cent in
New Zealand and 32 per cent in the United
States. Between 1995 and 2011 all OECD coun-
tries saw increased GVC participation in gross
exports, with the largest increase taking place in
Iceland, Korea, Hungary, Poland and Turkey.
GVCs can foster productivity growth in a
number of ways - greater specialization in tasks,
increased competition in factor input markets,
and knowledge spillovers to local firms from
multinational corporations, the main drivers of
GVCs. The authors conclude that that the inter-
national fragmentation of production as repre-
sented by GVCs may have stagnated since 2011,
throwing into doubt whether the productivity
gains from GVCs will continue to be realized.
Aggregate productivity is the result of a myr-
iad of firm-level productivity outcomes and
partly depends on the ability of the highest pro-
ductivity firms to gain market shares and attract
the resources they need to grow. In recent years,
productivity studies based on micro-level data
have flourished, thanks to the increasing avail-
IN T E R N A T I O N A L PR O D U C T I V I T Y MO N I T O R 3
ability of firm-level datasets. These data can
provide important new insights into the behav-
iour of firms and the determinants of productiv-
ity growth.
This issue of the International Productivity
Monitor contains three articles that uses firm-
level datasets to shed light on productivity
issues. The first uses transaction data to quantify
the integration into the world economy of firms
in the Belgium production network. The second
uses a unique dataset covering the universe of
Italian firms to estimate the role of allocative
efficiency in productivity growth. The third
highlights the insights on productivity, and
especially the increasing dispersion of domestic
productivity outcomes, based on the new
OECD's firm-level Multifactor Productivity
(Multiprod) project.
Exploiting a unique database that captures the
domestic and international transactions of
nearly 900,000 firms in the Belgium production
network , Emmanuel Dhyne and Cédric
Duprez of the National Bank of Belgium pro-
vide a detailed account of the participation of
these firms in global and local value chains.
They find that the number of exporting firms is
relatively small, at less than 5 per cent of total
firms. But 80 per cent of firms supplied inputs to
the rest of the world, either directly or through
third companies. They also find that almost all
Belgium firms use foreign inputs, either directly
or indirectly through importers. Based on an
econometric analysis of the dataset, the authors
show that the most productive firms are the ones
most deeply integrated into the global economy.
Italy has experienced very poor productivity
performance in recent years. But this situation
does not appear to be due to a lack of dynamism
in resource reallocation by Italian firms, Andrea
Linarello and Andrea Petrella from the Bank
of Italy use a unique dataset covering the uni-
verse of Italian firms to estimate the role of
allocative efficiency in productivity growth.
They find that that the net entry of firms con-
tributed positively to aggregate labour produc-
tivity growth every year from 2005 to 2013.
Rather it was the productivity growth of surviv-
ing firms that was negative and hence responsi-
ble for Italy's fall in labour productivity over the
period. The authors also find that reallocation
of labour was strongest in industries more
exposed to import competition.
A key stylized fact that has emerged in recent
years with the increasing availability of firm-
level databases is the existence of large differ-
ences in multifactor productivity (MFP) levels
across firms, a finding with important policy
implications. Giuseppe Berlingieri, Sara Cal-
ligaris and Chiara Criscuolo from the OECD
and Patrick Blanchenay from the University of
Toronto shed light on productivity heterogene-
ity using data from the OECD's firm-level Mul-
tifactor Productivity (Multiprod) project. This
project, implemented in close cooperation with
micro data providers in OECD countries, has
assembled aggregate indicators drawn from con-
fidential micro data to provide a comprehensive
picture of productivity patterns at the firm level
over the past two decades. The authors docu-
ment the high dispersion of MFP levels in both
manufacturing and non-financial services in 16
OECD countries and find that this dispersion
has been increasing over time, especially in ser-
vices.
Countries with low productivity levels have
the potential to catch-up with countries with
high productivity levels if they can successfully
adopt the technology of the most advanced
countries. This technological convergence pro-
cess explains the faster productivity growth of
many countries in recent years relative to the
technology leaders. Portugal experienced this
catch up process until the early 1990s, with pro-
ductivity growth exceeding that in the United
States and the EU average. Since then, however,
the country's productivity growth has underper-
4 NU M B E R 32 , S P R I N G 2017
formed. In the eighth article in this issue,
Ricardo Pinheiro Alves from the GEE and
IADE-UE provides a comprehensive overview
of Portugal's productivity performance and
drivers. He identifies a number of barriers to
productivity growth, including weak business
sector R&D, excessive labour market segmenta-
tion, a high mortality rate for new firms, a low
share of workers in more productive medium-
sized and large firms relative to the EU average,
and an insufficient level of openness of the econ-
omy. The author puts forward a number of poli-
cies that can reduce the level of resource
misallocation and boost productivity growth,
including greater product market competition,
the development of a tax system that rewards
risk takers, and the establishment of an indepen-
dent productivity commission to promote pro-
productivity policies.
It has long been recognized that urban areas
have higher levels of productivity than non-
urban areas, with the productivity premium
increasing with the size of the city. In the ninth
article in this issue, Rüdiger Ahrend, Alex-
ander C. Lembcke and Abel Schuman from
the OECD document this relationship using an
international harmonized definition of urban
areas not based on administrative units. They
then explore the mechanisms for the relation-
ship between urbanization and productivity.
One obvious reason is that average levels of edu-
cation are higher in urban areas than in non-
urban areas through self-selection. Second, dif-
ferent types of agglomeration economies,
including knowledge spillovers, the sharing of
infrastructure costs over a larger population
base, and better labour market matching due to
the larger numbers of workers and jobs, boost
productivity. The authors estimate that a 10 per
cent increase in the population of an urban area
is associated with an increase in productivity of
0.2 to 0.5 per cent. An important new finding of
the authors is that a region's closeness to an
urban area, as measured by road-based travel
distances and travel times, has a significant pos-
itive effect on its productivity.
The measurement of productivity in the pub-
lic or non-market sector has long been a chal-
lenge for economists. In the market sector,
output is priced and price indexes can then be
constructed and used to deflate the nominal
value of output to produce a real output series
essential for measurement of productivity
growth. In the non-market sector, output is not
priced and inputs are used as a proxy for real
output, often with the assumption of zero pro-
ductivity growth.
In the tenth article in the issue, Edwin Lau,
Zsuzsanna Lonti, and Rebecca Schultz from
the OECD provides a comprehensive overview
of issues related to public sector productivity
measurement. The authors surveyed OECD
members to obtain information on their prac-
tices related to public sector productivity mea-
surement. They found that only seven countries
reported measures of productivity for the whole
publ ic sec tor, indicat ing much room for
improvement. The authors recommend that
OECD countries focus attention on improving
both public sector productivity measures and
performance. They suggest a number of ways
forward, including standardization of govern-
ment inputs and output, benchmarking of gov-
ernment activities relative to best practices, and
the development of productivity-enhancing
strategies related to human resource manage-
ment and digitization.
A recent development in OECD countries has
been the establishment of organizations with a
mandate to promote productivity-enhancing
reforms. The Australian Productivity Commis-
sion is likely the best known example of such
organizations. In the eleventh and final article of
this issue, Sean Dougherty from the OECD
and Andrea Renda from the Centre for Euro-
pean Policy Studies and Duke University, ana-
IN T E R N A T I O N A L PR O D U C T I V I T Y MO N I T O R 5
lyze and compare ten of these organizations,
which include government advisory councils,
standing inquiry bodies, and ad hoc task forces.
The authors find that pro-productivity institu-
tions can indeed contribute to productivity
growth by facilitating public debate on policy
issues and evidence-based policy-making. They
identify the characteristics needed for such
institutions to be successful, including sufficient
resources to fulfill their tasks, a broad mandate
oriented toward long-term well-being of the
population, and the ability to reach out to the
general public.
Andrew Sharpe
Executive Director,
Center for the Study of Living Standards
Editor, International Productivity Monitor
Ottawa, Canada
Giuseppe Nicoletti
Head of Division, Structural Policy Analysis,
Economics Department, OECD
Guest Editor,
International Productivity Monitor
Paris, France
June, 2017
INT E R N A T I ON A L PRO DU C T I V I T Y MON I T OR 6
Total Factor Productivity in Advanced Countries: A Long-term Perspective
Antonin Bergeaud
Banque de France and Paris School of Economics-EHESS
Gilbert Cette Banque de France, Université Aix-Marseille
(Aix-Marseille School of Economics), CNRS and EHESS
Rémy Lecat
Banque de France1
ABSTRACT
Changes in GDP during the 20th century have been mainly driven by total factor productivity
(TFP). This article synthesizes results from our research based on the long period (1890-
2015) productivity database we have constructed. In particular, we aim to refine our TFP
measure by including the contribution of the improved quality of factor inputs and technology
diffusion to TFP growth in four developed areas or countries: the United States, the euro area,
the United Kingdom, and Japan. Two types of factor quality are considered: the average level
of education and the average age of equipment. Two technological shocks corresponding to
two general purpose technologies are investigated: electricity and information and
communication technologies (ICT). However, even after these adjustments, long-term
patterns of TFP growth do not change, with two major waves appearing over the past century
and much of TFP growth remaining unaccounted for by quality-adjusted factors of production
and technology diffusion. Our estimates show that the productivity impact of the recent ICT
wave remains much smaller than that from the electricity wave, and that the post-1973 and
the most recent slowdowns in TFP growth are confirmed.
GDP per capita indicators are often used to
analyze standards of living.2 This measure
allows country comparisons that can be made
either in terms of levels or growth rates, these
two dimensions being linked by convergence
processes. The large literature devoted to this
topic shows that numerous factors can influence
GDP per capita growth and convergence (Bau-
1 Antonin Bergeaud is an economist at The Department of Structural Policies, Banque de France and teaches at
The Paris School of Economics – School for Advanced Studies in the Social Sciences (EHESS), Paris; Rémy Lecat
is an economist at the Department of Structural Policies, Banque de France; Gilbert Cette is an economist at
The Economics and International Relations General Directorate, Banque de France and Associate Professor at
Aix-Marseille School of Economics – The National Center for Scientific Research (CNRS), EHESS. The authors
would like to thank, without implicating, participants of the 2016 OECD Global Forum on Productivity, of the
Bank of Korea International 2017 International Conference, of the 2017 BIS Seminar, of the 2017 Banque de
France Secular Stagnation Conference, Giuseppe Nicoletti, Andrew Sharpe and three anonymous referees for
very helpful advises and comments. This analysis reflects the opinions of the authors and do not necessarily
express the views of the institutions they belong to. Email: Gilbert Cette, [email protected].
2 This measure is however frequently criticized, notably in the famous Stiglitz, Sen and Fitoussi (2009)
report, as it excludes many dimensions that impact the well-being of the population.
7 NUMB E R 32 , S P R I NG 2017
��� �����������
�����
����
�����
����
�����
����
�����
����
�����
����
�����
����
�����
����
�����
����
�����
����
�����
����
�����
����
�����
����
��� ��� ��� ��� ��� ��� ��� ��� ��� ��� ��� ��� ���
�������
���������
�� ��� ��� ��� �� ��� ��� ��� ��� ��� �� ���
���!������ ��� ��� ��� ��� ��� ��� ��� ��� ��� ��� ��� ��
" ���# ���
$���
��� ��� ��� ��� ��� ���� ��� ��� ��� ��� ��� ���
%�!$&'�$(�� ���� ���� ���� ��� ���� ���� ��� ���� ��� ���� ���� ���
)*� ��� ��� ��� ��� ��� �� ��� ��� ��� ��� �� ����
"!$��$�� +����
�����
����
�����
����
�����
����
�����
����
�����
����
�����
����
�����
����
�����
����
�����
����
�����
����
�����
����
�����
����
��� ��� ��� ��� ��� ��� �� ��� ��� ��� ��� ��� ���
�������
���������
��� ��� �� ��� ��� �� �� ��� ��� �� ��� ���
���!������ ��� ��� ��� ��� ��� ��� ��� ��� ��� �� ��� ����
" ���# ���
$���
��� ���� ���� ���� ��� ���� ���� ���� ��� ��� ���� ���
%�!$&'�$(�� ���� ���� ���� ��� ���� ���� ���� ���� ��� ��� ��� ����
)*� ��� ��� �� ��� ��� ��� ��� ��� ��� ��� ��� ���
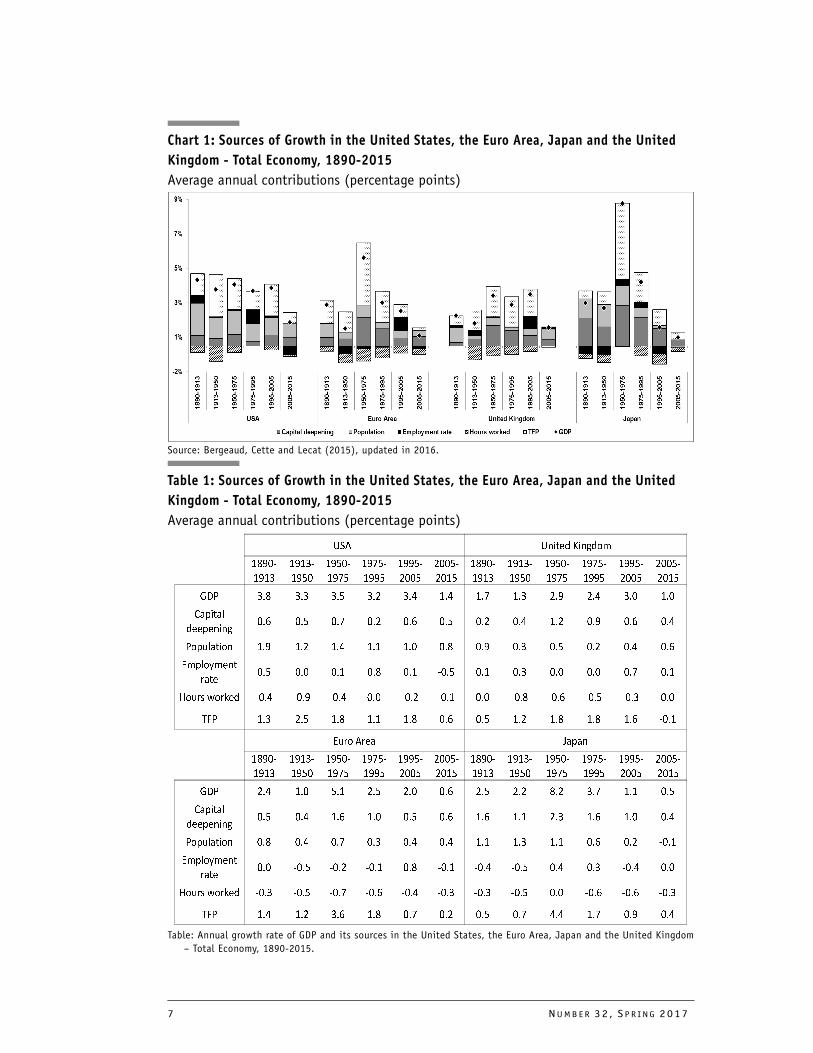
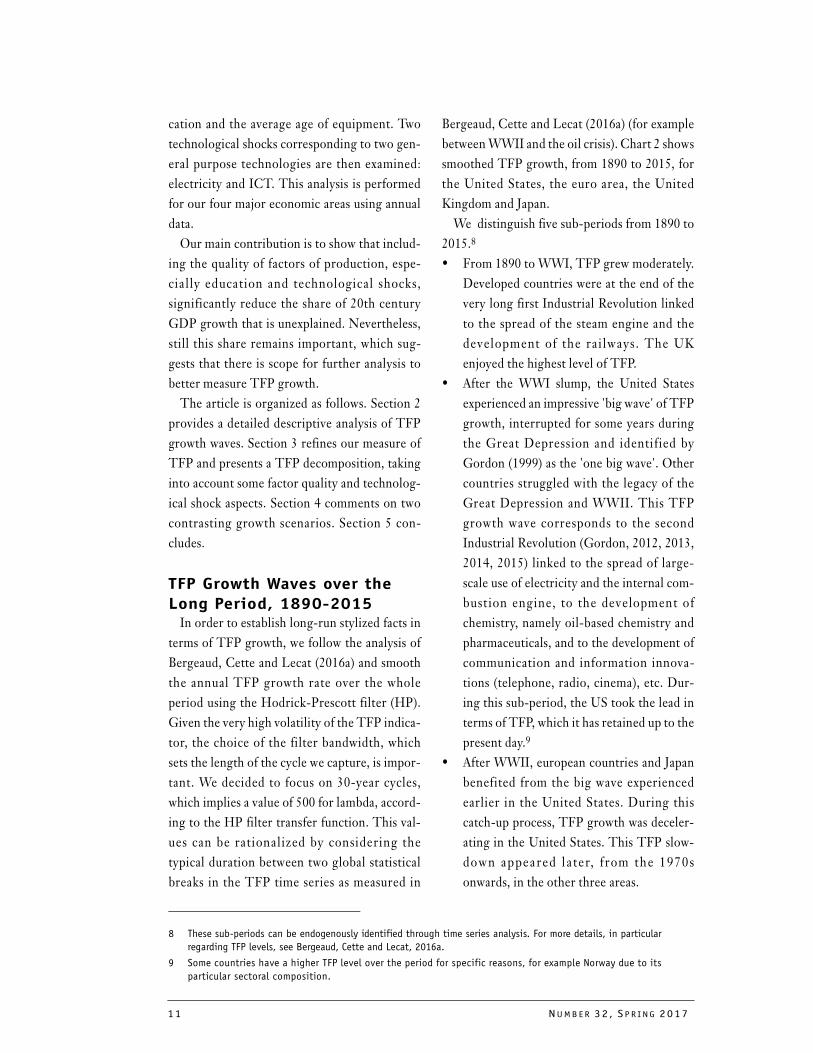
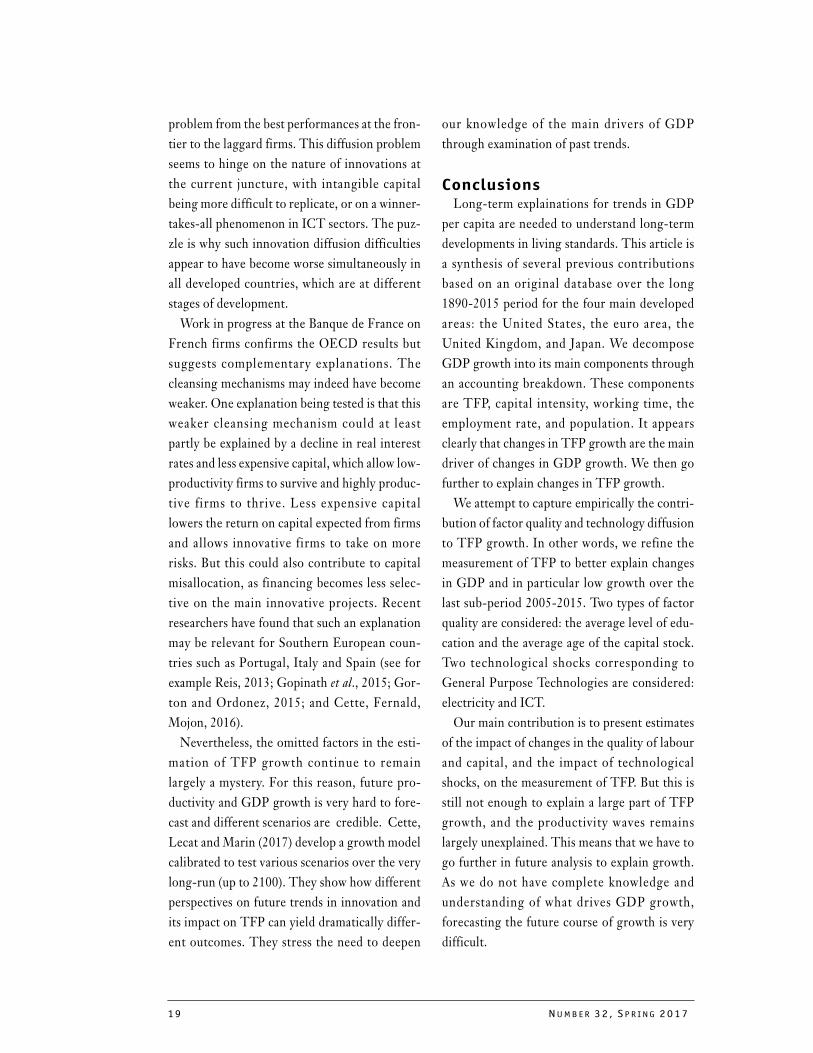
Chart 1: Sources of Growth in the United States, the Euro Area, Japan and the United
Kingdom - Total Economy, 1890-2015
Average annual contributions (percentage points)
Source: Bergeaud, Cette and Lecat (2015), updated in 2016.
Table 1: Sources of Growth in the United States, the Euro Area, Japan and the United
Kingdom - Total Economy, 1890-2015
Average annual contributions (percentage points)
Table: Annual growth rate of GDP and its sources in the United States, the Euro Area, Japan and the United Kingdom
– Total Economy, 1890-2015.
INT E R N A T I ON A L PRO DU C T I V I T Y MON I T OR 8
mol, 1986 ; Barro, 1991 being ones of the semi-
nal papers). Numerous factors can influence
GDP per capita growth and convergence. The
most important appear to be institutions, edu-
cation, and of course innovation and technolog-
ical progress, which are in turn l inked to
education and institutions.3 In Bergeaud, Cette
and Lecat (2015), we have shown that there is
an ove r a l l c onve rgenc e p ro ce s s among
advanced countries, mainly after WWII, rely-
ing mostly on capital intensity and then on
TFP, while developments in hours worked and
employment rates are more contrasted. But this
convergence process is not continuous and
slowed down or was even reversed since 1990,
as the convergence of the euro zone, the UK,
and Japan stopped well before attaining the
U.S. level of GDP per capita.
In this article, we review some of the findings
from our earlier research based on an original
database for 17 developed countries from 1890
to 2015. The construction of this dataset is
described in the Appendix, and at length in Ber-
geaud, Cette and Lecat (2016a, 2016b). All of
this can be found in a dedicated website (see Box
1 for more information).4 In a nutshell, we built
capital data from investment series divided into
five different assets (structures, communication
equipment, computers, software, and other non-
ICT equipment) on the assumption of constant
depreciation rates for each of the five asset
classes (See Appendix). This allows one to
account for the shift from structures to equip-
ment that occurred around the 1920s, the emer-
gence of ICT capital, and overall to better
measure the stock of capital. For investment,
(GDP, labour, and population), we rely on the
updating of the estimates of economic historians
such as Angus Maddison and others by Bolt and
Van Zanden (2014), as described in Bergeaud,
Cette and Lecat (2016a).
Chart 1 and corresponding figures in Table 1
show average GDP growth rates for different
sub-periods of the whole 1890-2015 period for
the three developed countries (United States,
Japan and the United Kingdom) and the euro
3 On the role of education and institutions, see for example Barro (1991), Barro and Sala-I-Martin (1997), and,
for more recent assessments, Aghion et al. (2008); Madsen (2010a and 2010b); Crafts and O'Rourke (2013);
and Acemoglu et al. (2014). On the impact of institutional and educational factors on innovation and techno-
logical progress, see, among others, Aghion and Howitt (1998, 2006 and 2009).
4 www.longtermproductivity.com
Box 1: The Long-Term Productivity Database
The database presented in this article (Bergeaud-Cette-Lecat or BCL database) has evolved con-
tinuously since its first version in 2013. As soon as the series are improved or new sources enable
us to add countries to the database, a new version of the BCL database is constructed. The most
recent version of the database can be found at www.longtermproductivity.com. The database cur-
rently covers 17 countries: United States, Japan, Germany, France, United Kingdom, Italy, Spain,
Canada, Australia, the Netherlands, Belgium, Switzerland, Sweden, Denmark, Norway, Portugal
and Finland. It is composed of series for GDP per capita, labour productivity, total factor produc-
tivity, average age of equipment, and capital intensity. The underlying series used to construct
these measures (GDP, population etc.) are not currently available for download, but can be
obtained by request. Data sources are described in a file in the database. The website provides an
application that enables users to plot the latest series and to compare several countries. All of the
data available on the website can be freely used provided that they are properly acknowledged.
The Appendix to the article offers a longer description.
9 NUMB E R 32 , S P R I NG 2017
zone.5 Chart 1 also provides an accounting
decomposition of GDP growth based on a sim-
ple Cobb-Douglas production function.6 In this
decomposition, the three main components of
GDP growth are population growth, the growth
in the number of hours worked per inhabitant
and hourly labour productivity growth. The
contribution of the number of hours worked per
capita to growth is itself decomposed into two
sub-components: the employment rate, here the
ratio of employment to the total population, and
the number of hours worked per worker. The
sum of the population and average working time
per worker components corresponds to the
overall contribution of the total number of
hours worked to growth. And the contribution
of hourly labour productivity growth is itself
also decomposed into two sub-components:
total factor productivity (TFP) and capital deep-
ening.
Formally, with K being
the stock of physical capital, L the number of
workers, and H the average annual hours worked
per worker, so that (LH) represents the total
number of hours worked. Denoting the total
population as Pop, we have:
(1)
Where capital deepening is represented by
, and the hourly labour productivity
is . As well, employment rate is
determined by , and the number of
hours worked per employee is . Log differen-
tiating this last expression gives the decomposi-
tion that is represented in Chart 1.
Chart 1 shows that hourly labour productivity
growth is the main contributor to GDP growth
in the four economic areas considered. The
overall contribution of hours worked (which
corresponds to the sum of the contributions
made by change in the population, the employ-
ment rate and average working time) is generally
small, if not nil. Within hourly labour produc-
tivity growth, the contribution of the TFP sub-
component is the largest, with that of capital
deepening being smaller. The TFP contribution
varies considerably from sub-period to sub-
period, with these variations generally being the
main driver of changes in GDP growth. How-
ever, in our accounting we define TFP as a resid-
ual encompassing any variation of output that
cannot be explained by the aggregation of phys-
ical capital and labour. As such, Chart 1 gives no
real explanation for these large changes in GDP
growth other than the small f luctuations
explained by the hours worked component. This
is why, as Abramovitz (1956) wrote, TFP is tra-
ditionally considered ‘a measure of our igno-
rance.’
GDP growth appears very low during the
2005-2015 sub-period in the four economic
areas studied. And the main reason for this low
growth is a small contribution from TFP, espe-
cially when compared with previous sub-peri-
ods. Once again, our accounting framework
cannot give any more insight on this slowdown
since it is driven almost entirely by a slowdown
in TFP growth.
These observations raise important questions:
are we facing a risk of 'secular stagnation'? This
expression was coined by Hansen (1939) and was
5 The euro area is defined as the aggregation of the zone's eight of the largest countries: Germany, France, Italy,
Spain, the Netherlands, Belgium, Portugal and Finland. These countries represent more than 93 per cent of
the euro area's 2010 GDP. See Bergeaud, Cette and Lecat (2016a) for more details.
6 In this decomposition, we assume constant returns to scale and an elasticity of output to capital that is
constant and equal to 0.3 in the four economic areas for the whole period. For more details, see Ber-
geaud, Cette and Lecat (2015).
GDP TFPKα
LH( )1 α–( )
=
GDP TFPK
LH-------
α
L
Pop----------
H× Pop×
××=
K LH( )⁄( )α
TFP K LH( )⁄( )α
×
L POP( )⁄
H
INT E R N A T I ON A L PRO DU C T I V I T Y MON I T OR 10
used again to describe the current situation
notably by Summers (2014, 2015) and Eichen-
green (2015). This low TFP growth is now well
documented and affects most of the advanced
economies.7 In our four areas, the slowdown of
TFP can be observed from the end of the 1960s,
and intensifies during the 1970s, the 1980s and
the 1990s. One notable exception is the UK,
which experienced very steady TFP growth
from the 1950s to the late 1990s (Broadberry
and O'Mahony, 2004) and had more rapid TFP
growth during the period 1975-2005 than 1950-
1975. As for the United States, we clearly
observe from the mid-1990s an acceleration due
to faster improvements in the productive perfor-
mances of information and communication
technologies (ICT hereafter). Jorgenson (2001)
was the first of numerous economists to stress
this point. For some authors such as Gordon
(2012, 2013, 2014, 2015), this situation could be
the future for long-term productivity.
TFP plays the most important role in explain-
ing GDP dynamism. As shown in Bergeaud,
Cette and Lecat (2015), convergence across
advanced countries, which took place mostly in
the post WWII period, proceeded mostly from
TFP convergence, followed by capital deepen-
ing. Rapid TFP growth in the euro area and
Japan in 1950-1975 represented catching up to
the TFP level generated by the rapid TFP
growth experienced by the United States over
the 1913-50 period.
We now seek to refine our measure of TFP by
including factor quality adjustment and technol-
ogy diffusion indicators over the 1890-2015
period. In other words, we investigate the
importance of some potential factors that can
improve our measure of TFP growth in order to
better understand changes in growth and to give
insight into why TFP growth has been low over
the 2005-2015 sub-period. We consider two fac-
tor quality dimensions: the average level of edu-
7 See for example for the United States, Gordon (2012, 2013, 2014, 2015), or Byrne, Oliner and Sichel (2013),
and for other advanced countries, Crafts and O'Rourke (2013), or Bergeaud, Cette and Lecat (2016a).
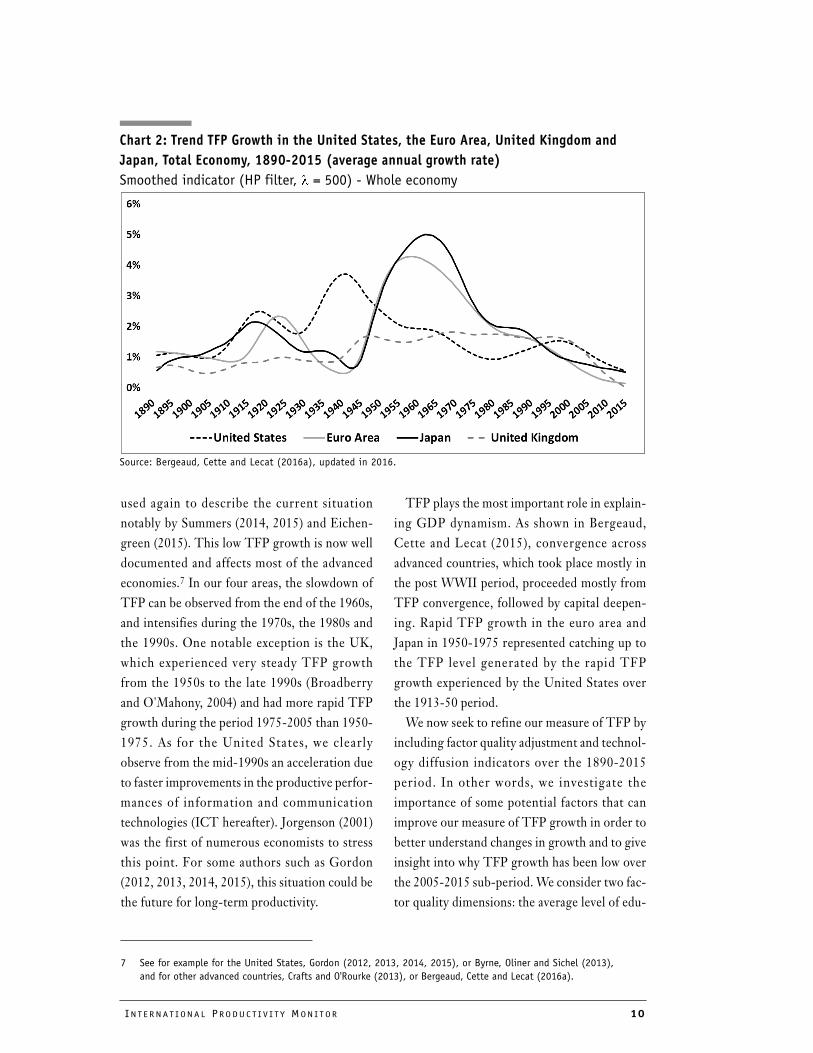
Chart 2: Trend TFP Growth in the United States, the Euro Area, United Kingdom and
Japan, Total Economy, 1890-2015 (average annual growth rate)
Smoothed indicator (HP filter, λ = 500) - Whole economy
Source: Bergeaud, Cette and Lecat (2016a), updated in 2016.
11 NUMB E R 32 , S P R I NG 2017
cation and the average age of equipment. Two
technological shocks corresponding to two gen-
eral purpose technologies are then examined:
electricity and ICT. This analysis is performed
for our four major economic areas using annual
data.
Our main contribution is to show that includ-
ing the quality of factors of production, espe-
cially education and technological shocks,
significantly reduce the share of 20th century
GDP growth that is unexplained. Nevertheless,
still this share remains important, which sug-
gests that there is scope for further analysis to
better measure TFP growth.
The article is organized as follows. Section 2
provides a detailed descriptive analysis of TFP
growth waves. Section 3 refines our measure of
TFP and presents a TFP decomposition, taking
into account some factor quality and technolog-
ical shock aspects. Section 4 comments on two
contrasting growth scenarios. Section 5 con-
cludes.
TFP Growth Waves over the Long Period, 1890-2015In order to establish long-run stylized facts in
terms of TFP growth, we follow the analysis of
Bergeaud, Cette and Lecat (2016a) and smooth
the annual TFP growth rate over the whole
period using the Hodrick-Prescott filter (HP).
Given the very high volatility of the TFP indica-
tor, the choice of the filter bandwidth, which
sets the length of the cycle we capture, is impor-
tant. We decided to focus on 30-year cycles,
which implies a value of 500 for lambda, accord-
ing to the HP filter transfer function. This val-
ues can be rationalized by considering the
typical duration between two global statistical
breaks in the TFP time series as measured in
Bergeaud, Cette and Lecat (2016a) (for example
between WWII and the oil crisis). Chart 2 shows
smoothed TFP growth, from 1890 to 2015, for
the United States, the euro area, the United
Kingdom and Japan.
We distinguish five sub-periods from 1890 to
2015.8
• From 1890 to WWI, TFP grew moderately.
Developed countries were at the end of the
very long first Industrial Revolution linked
to the spread of the steam engine and the
development of the rai lways. The UK
enjoyed the highest level of TFP.
• After the WWI slump, the United States
experienced an impressive 'big wave' of TFP
growth, interrupted for some years during
the Great Depression and identified by
Gordon (1999) as the 'one big wave'. Other
countries struggled with the legacy of the
Great Depression and WWII. This TFP
growth wave corresponds to the second
Industrial Revolution (Gordon, 2012, 2013,
2014, 2015) linked to the spread of large-
scale use of electricity and the internal com-
bustion engine, to the development of
chemistry, namely oil-based chemistry and
pharmaceuticals, and to the development of
communication and information innova-
tions (telephone, radio, cinema), etc. Dur-
ing this sub-period, the US took the lead in
terms of TFP, which it has retained up to the
present day.9
• After WWII, european countries and Japan
benefited from the big wave experienced
earlier in the United States. During this
catch-up process, TFP growth was deceler-
ating in the United States. This TFP slow-
down appeared l ater, f rom the 1970s
onwards, in the other three areas.
8 These sub-periods can be endogenously identified through time series analysis. For more details, in particular
regarding TFP levels, see Bergeaud, Cette and Lecat, 2016a.
9 Some countries have a higher TFP level over the period for specific reasons, for example Norway due to its
particular sectoral composition.
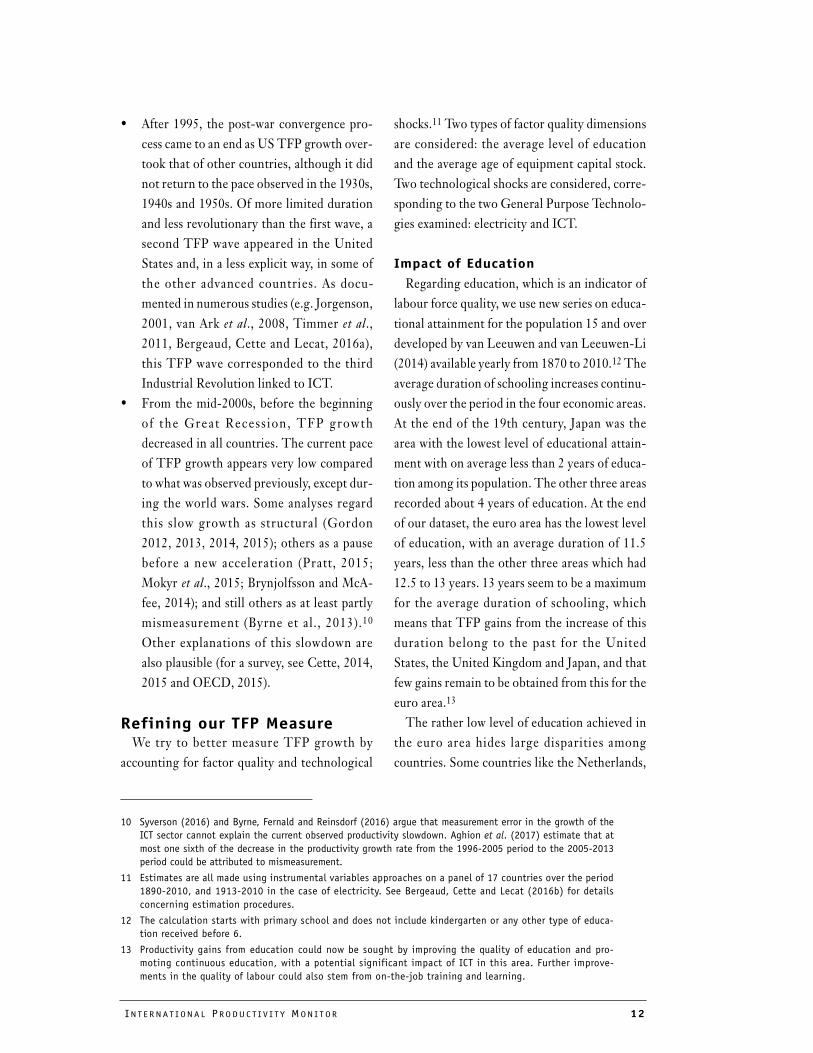
INT E R N A T I ON A L PRO DU C T I V I T Y MON I T OR 12
• After 1995, the post-war convergence pro-
cess came to an end as US TFP growth over-
took that of other countries, although it did
not return to the pace observed in the 1930s,
1940s and 1950s. Of more limited duration
and less revolutionary than the first wave, a
second TFP wave appeared in the United
States and, in a less explicit way, in some of
the other advanced countries. As docu-
mented in numerous studies (e.g. Jorgenson,
2001, van Ark et al., 2008, Timmer et al.,2011, Bergeaud, Cette and Lecat, 2016a),
this TFP wave corresponded to the third
Industrial Revolution linked to ICT.
• From the mid-2000s, before the beginning
of the Great Recess ion, TFP growth
decreased in all countries. The current pace
of TFP growth appears very low compared
to what was observed previously, except dur-
ing the world wars. Some analyses regard
this slow growth as structural (Gordon
2012, 2013, 2014, 2015); others as a pause
before a new acceleration (Pratt, 2015;
Mokyr et al., 2015; Brynjolfsson and McA-
fee, 2014); and still others as at least partly
mismeasurement (Byrne et al., 2013).10
Other explanations of this slowdown are
also plausible (for a survey, see Cette, 2014,
2015 and OECD, 2015).
Refining our TFP MeasureWe try to better measure TFP growth by
accounting for factor quality and technological
shocks.11 Two types of factor quality dimensions
are considered: the average level of education
and the average age of equipment capital stock.
Two technological shocks are considered, corre-
sponding to the two General Purpose Technolo-
gies examined: electricity and ICT.
Impact of Education
Regarding education, which is an indicator of
labour force quality, we use new series on educa-
tional attainment for the population 15 and over
developed by van Leeuwen and van Leeuwen-Li
(2014) available yearly from 1870 to 2010.12 The
average duration of schooling increases continu-
ously over the period in the four economic areas.
At the end of the 19th century, Japan was the
area with the lowest level of educational attain-
ment with on average less than 2 years of educa-
tion among its population. The other three areas
recorded about 4 years of education. At the end
of our dataset, the euro area has the lowest level
of education, with an average duration of 11.5
years, less than the other three areas which had
12.5 to 13 years. 13 years seem to be a maximum
for the average duration of schooling, which
means that TFP gains from the increase of this
duration belong to the past for the United
States, the United Kingdom and Japan, and that
few gains remain to be obtained from this for the
euro area.13
The rather low level of education achieved in
the euro area hides large disparities among
countries. Some countries like the Netherlands,
10 Syverson (2016) and Byrne, Fernald and Reinsdorf (2016) argue that measurement error in the growth of the
ICT sector cannot explain the current observed productivity slowdown. Aghion et al. (2017) estimate that at
most one sixth of the decrease in the productivity growth rate from the 1996-2005 period to the 2005-2013
period could be attributed to mismeasurement.
11 Estimates are all made using instrumental variables approaches on a panel of 17 countries over the period
1890-2010, and 1913-2010 in the case of electricity. See Bergeaud, Cette and Lecat (2016b) for details
concerning estimation procedures.
12 The calculation starts with primary school and does not include kindergarten or any other type of educa-
tion received before 6.
13 Productivity gains from education could now be sought by improving the quality of education and pro-
moting continuous education, with a potential significant impact of ICT in this area. Further improve-
ments in the quality of labour could also stem from on-the-job training and learning.
13 NUMB E R 32 , S P R I NG 2017
Germany and France have levels of educational
attainment comparable to that of the United
States. On the other hand, other countries such
as Spain, Portugal and Italy lag behind. For
example, the average duration of schooling in
Portugal in 2010 was below 8 years.
Many s t ud i e s , u s i ng m i c r o o r mac ro
approaches, have focused on estimating the
returns on education, corresponding to the wage
or productivity gains associated with an average
increase of one year in educational attainment.
There is a broad empirical consensus in most
micro studies on a private return on education of
between 4 per cent and 8 per cent in developed
countries. The standard equation for the macro-
economic return to education takes the follow-
ing form (Barro and Lee, 2010):
(2)
Where a lower case x stands for the logarithm
of variable X from equation (1), s is our mea-
sure of education attainment, ε is a residual that
we will consider to be an improved measure of
TFP and is the log of labour produc-
tivity. Finally, θ is a coefficient measuring the
impact of education on productivity. Our esti-
mates of this equation indicate a return of edu-
cation to GDP of 4.9 per cent, which means
that an increase of one year in educational
attainment would increase labour productivity
(or TFP as typically measured) by 4.9 per cent.
From this result, and from the fact that educa-
tion attainment increased by 7 to 11 years in
our four areas, we can attribute 16-23 per cent
of the cumulative rise in TFP over the 1890-
2010 period to rising education; that is, 34.3
percentage points (4.9 per cent x 7 years) to
53.9 percentage points (4.9 per cent x 11 years)
over the long period starting in 1890. Of
course, this result rests upon the assumption
that the elasticity of productivity with respect
to education is constant across time and coun-
tries. We make this assumption in order to pro-
duce estimates comparable with the literature
(e.g. Barro and Lee, 2010). It is also consistent
with our assumption of constancy for other
parameters (e.g. the depreciation rate and the
elasticity of substitution between capital and
labour).14
We have calculated the average age of the cap-
ital stock for equipment. This is an indicator of
the quality of this factor and should therefore be
incorporated into the production function. We
estimate the contribution of this factor from a
Solow residual regression, as we cannot calibrate
directly the quality correction we should apply
to the capital stock. This simply corresponds to
the intuitive idea of a vintage effect: older capital
is expected to be less productive than newer cap-
ital, as suggested by Solow (1959, 1962) and
developed subsequently by numerous authors
(Gittleman et al., 2003; Wolff, 1991, 1996;
Greenwood et al., 1997; Mairesse, 1977, 1978;
Mairesse and Pescheux, 1980; Cette and Szpiro,
1989). In theory, capital stock series should be
constructed using quality-adjusted investment
series (through appropriate investment defla-
tors). Changes in average age would then not
impact TFP. But national accounts can only par-
tially take into account embodied technical
progress, which is not fully included in declines
in investment prices and increase in real invest-
ment. Consequently, the accounting split
between capital deepening and TFP within
labour productivity growth is biased in favour of
the latter. Using an indicator of the age of equip-
ment is therefore a way to correct this bias and
gdp l– h α k l– h–( )( )
1 α–( )θs ε
+
+
=–
gdp l– h–
14 There is evidence that suggests a decline in the marginal return from educational attainment due to the fact
that tertiary education yields lower gains in terms of productivity than primary and secondary schooling (Psa-
charopoulos and Patrinos, 2004).
INT E R N A T I ON A L PRO DU C T I V I T Y MON I T OR 14
to consider the impact of embodied technical
progress.
It appears that variations in the average age of
equipment differ across economic areas: the
range of these variations is 5 years for Japan
(from a minimum of 4 years to a maximum of 9
years), 4 years for the euro area (from 5.3 years
to 9.3 years), and 3 years in the United States
(from 5.7 years to 8.7 years) and the United
Kingdom (from 6 years to 9 years). The average
age increased significantly during the Great
Depression in the United States, resulting from
low investment; it greatly decreased during
WWII due to the war effort, and more modestly
during the ICT wave, as investment was needed
to incorporate the new technology. In the euro
area and the UK, it increased strongly during
WWII, as the conflict depressed investment,
and decreased in the post-war reconstruction
period. It has been on an increasing trend since
1990 in Japan due to the banking crisis, and
since the financial crisis in other areas, as credit
constraints and low demand prospects weigh on
investment. Smaller conter-cyclical fluctuations
can be observed.
As with education, many studies, using micro
or macro approaches, have estimated the impact
of changes in the average age of capital on TFP.
The results show that an increase of one year in
the average age usually had a negative impact on
TFP of -1 per cent to -6.5 per cent, with results
concentrated around -4 per cent. Using an equa-
tion we include a regressor to capture the effect
of the age of capital stock, similar to the one for
education. We estimate an impact of -3 per cent,
which means that average age variations during
the period, from the minimum to the maximum
values of capital age, would have changed TFP
levels by 15 per cent (3 per cent x 5 years) in
Japan, 12 per cent (3 per cent x 4 years) in the
euro area, and 9 per cent (3 per cent x 3 years) in
the United States and the United Kingdom. On
average over the whole period, age plays no role
in explaining changes in GDP and only has
cyclical effects.
Impact of Electricity
To measure the diffusion of technology over
the whole period, we have drawn on the CHAT
database constructed by Comin and Hobijn
(2009). This database provides annual estimates
of the diffusion of more than 100 technologies
for a large set of countries. We have selected one
technology which is often considered to be rep-
resentative of the development of technologies
during the 20th century, i.e. the production of
electricity in kilowatt hours (Comin et al., 2006aand 2006b). Data have been completed with
series using the World Development Indicators
from the World Bank up to 2013 and have been
standardized by total population.
This indicator, which we consider as a proxy
for the diffusion of electrical machinery and
devices, has increased over time in the four eco-
nomic areas, but this rate of increase has slowed
since the 1970s. In line with the literature that
focuses on the impact of electricity on US pro-
ductivity growth (Bakker et al., 2015), the take-off of electricity in the United States started at
the beginning of the 20th century and acceler-
ated during the 1920s. The UK lags just behind
with a take-off that started in the 1930s, while
the euro zone and Japan started to massively
adopt electricity after WWII. The take-off date
depends both on the fall in electricity prices and
on a reorganization of the production process
to fully benefit from electricity (David, 1990).
Here again, we make the assumption that the
elasticity of TFP to electricity production per
inhabitant is constant over time. The constant
elasticity assumption, as it has also been used for
the impact on productivity of education and cap-
ital age, appears preferable to an ad hoc rule.
15 NUMB E R 32 , S P R I NG 2017
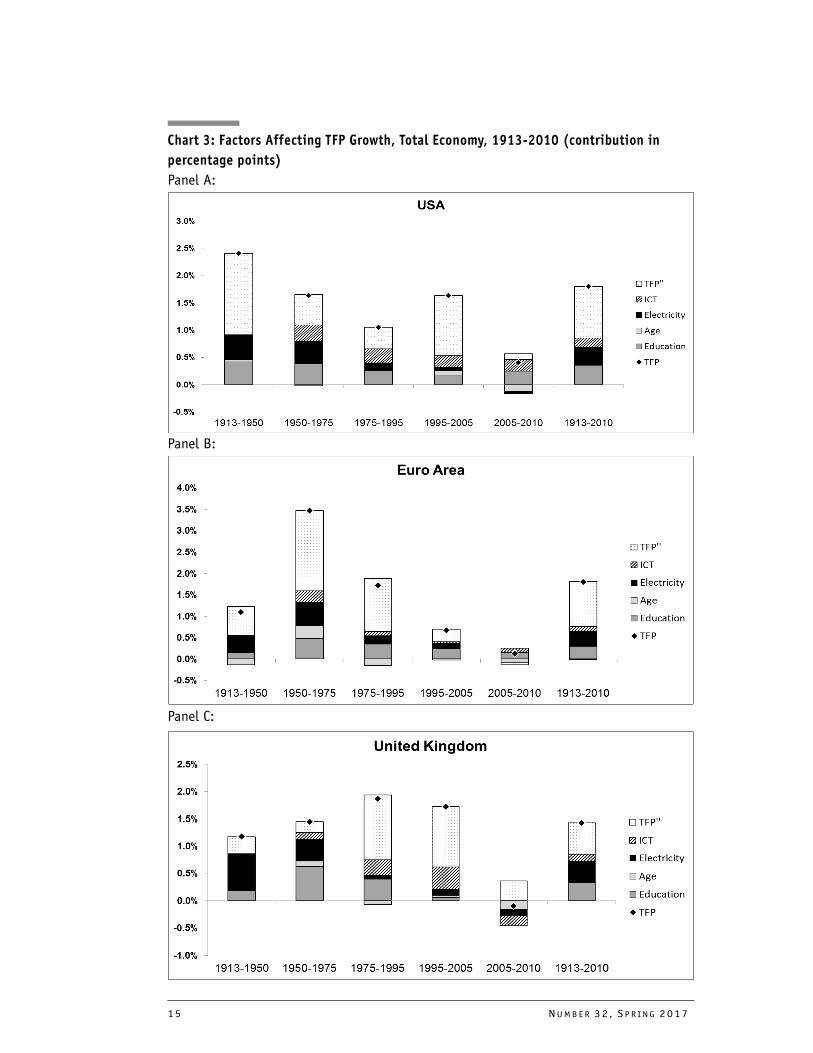
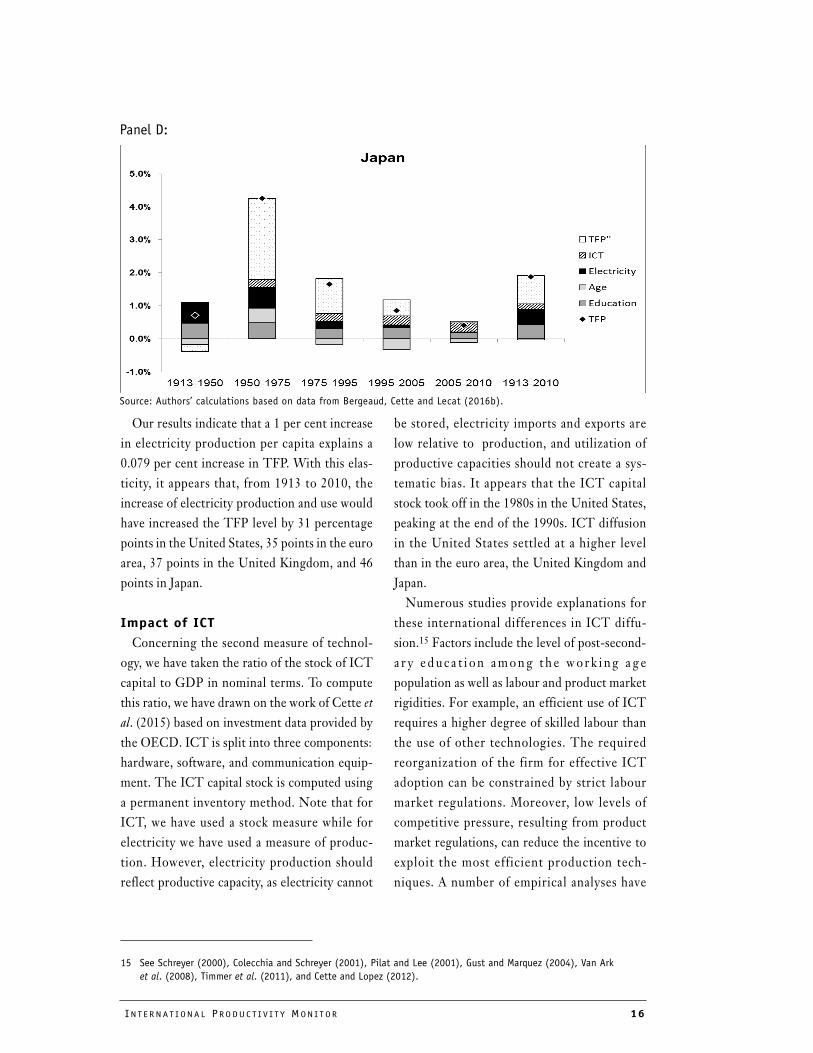
Chart 3: Factors Affecting TFP Growth, Total Economy, 1913-2010 (contribution in
percentage points)
Panel A:
Panel B:
Panel C:
INT E R N A T I ON A L PRO DU C T I V I T Y MON I T OR 16
Our results indicate that a 1 per cent increase
in electricity production per capita explains a
0.079 per cent increase in TFP. With this elas-
ticity, it appears that, from 1913 to 2010, the
increase of electricity production and use would
have increased the TFP level by 31 percentage
points in the United States, 35 points in the euro
area, 37 points in the United Kingdom, and 46
points in Japan.
Impact of ICT
Concerning the second measure of technol-
ogy, we have taken the ratio of the stock of ICT
capital to GDP in nominal terms. To compute
this ratio, we have drawn on the work of Cette etal. (2015) based on investment data provided by
the OECD. ICT is split into three components:
hardware, software, and communication equip-
ment. The ICT capital stock is computed using
a permanent inventory method. Note that for
ICT, we have used a stock measure while for
electricity we have used a measure of produc-
tion. However, electricity production should
reflect productive capacity, as electricity cannot
be stored, electricity imports and exports are
low relative to production, and utilization of
productive capacities should not create a sys-
tematic bias. It appears that the ICT capital
stock took off in the 1980s in the United States,
peaking at the end of the 1990s. ICT diffusion
in the United States settled at a higher level
than in the euro area, the United Kingdom and
Japan.
Numerous studies provide explanations for
these international differences in ICT diffu-
sion.15 Factors include the level of post-second-
a r y e d u c a t i on among t h e wo rk i ng a g e
population as well as labour and product market
rigidities. For example, an efficient use of ICT
requires a higher degree of skilled labour than
the use of other technologies. The required
reorganization of the firm for effective ICT
adoption can be constrained by strict labour
market regulations. Moreover, low levels of
competitive pressure, resulting from product
market regulations, can reduce the incentive to
exploit the most efficient production tech-
niques. A number of empirical analyses have
15 See Schreyer (2000), Colecchia and Schreyer (2001), Pilat and Lee (2001), Gust and Marquez (2004), Van Ark
et al. (2008), Timmer et al. (2011), and Cette and Lopez (2012).
Panel D:
Source: Authors’ calculations based on data from Bergeaud, Cette and Lecat (2016b).
17 NUMB E R 32 , S P R I NG 2017
confirmed the importance of these factors.16
Among others, Cette and Lopez (2012) show,
through an econometric approach, that the
United States benefits from the highest level of
ICT diffusion because of a higher level of post-
secondary education among the working age
population and less restrictive product and
labour market regulations.
Our estimates indicate that a 1 percentage
point increase in the ratio of ICT capital stock to
GDP would lead to an increase of 1.56 per cent
in the level of TFP. With this elasticity, it
appears that, from 1913 to 2010, ICT diffusion
as a production factor would have increased
TFP by 14 per cent in the United States, 9 per
cent in the euro zone, 11 per cent in the United
Kingdom and 13 per cent in Japan. This impact
is of course concentrated in the post-1950
period.
From these results, we build two new TFP
indicators. TFP' is TFP corrected for the
impact of the duration of education and changes
in average capital equipment age. TFP'' is TFP'
corrected for the impact of electricity produc-
tion per inhabitant and changes in the ICT cap-
ital to GDP ratio. In Panels A to D of Chart 3,
we present results for the four areas for the
same benchmark years as in Chart 1, but start-
ing in 1913 because of the high volatility of
electricity production before that period and
ending in 2010 because of the availability of
education data.
From Chart 3, we see that variations in human
capital and the age of capital are significant
omitted factors in the estimation of TFP
growth. Over the whole 1890-2010 period,
human capital and the age of physical capital
together account for 21 per cent of US TFP
growth, 17 per cent in the euro zone, 25 per cent
in the United Kingdom and 26 per cent in Japan.
However, it appears that the amplitude of TFP'
growth does not differ much from that of TFP.
In particular, the 'one big wave' that occurred
during the 20th century is still persistent with
respect to the United States. This is also the case
for the wave in the mid-1990s. This result is
robust to different sets of credible values con-
cerning the elasticity of TFP to the duration of
education and to the average age of capital.
Nevertheless, education significantly contrib-
uted to the first TFP wave in the US, with a con-
tribution of 0.42 percentage point per year
during the 1913-1950 period, only slightly
decreasing in the following periods (0.38 points
in 1950-1974 and 0.34 points in 1974-1990),
consistent with findings of Goldin and Katz
(2008). Hence, the early opening-up of educa-
tion to the masses in the US yielded a lasting
contribution to productivity and partly explains
the American lead. Indeed, the increase in the
contribution of education appears one period
later, in the 1950s, in the euro zone and the
United Kingdom. In Japan, education posts a
significant contribution throughout the century
due to the initial very low level of education.
The age of capital makes a significant positive
contribution mainly during the reconstruction
period after World War II in the euro area and
Japan, and also in the United Kingdom. Con-
versely, it has made a significant negative contri-
bution since the 1970s in the euro area and
Japan. In the four areas, equipment has aged
from the 2000s, with a negative contribution to
TFP growth.
The TFP growth waves are still evident in
TFP', which is also corrected for the impact of
the two General Purpose Technology shocks
considered (electricity and ICT), especially as
far as the 'one big wave' is concerned. However,
the amplitude of this 'one big wave' has been
16 See Gust and Marquez (2004), Aghion et al. (2009), Guerrieri et al. (2011) and Cette and Lopez (2012) who
use country-level panel data, as well as Cette et al. (2017) who employ sectoral-level panel data.
INT E R N A T I ON A L PRO DU C T I V I T Y MON I T OR 18
reduced and is almost 40 per cent lower for
TFP'' than for TFP' in the United States.
Although the difference in contribution is not
very large across areas, the spread of electricity
contributed significantly to the American
advance on the euro zone, as its contribution
peaked in the 1913-1950 period, while it
increased during the 1950-1974 period in the
euro zone. The United Kingdom appears not to
have lagged in terms of the diffusion of electric-
ity, with a very large contribution in the 1913-
1950 period.
Broadberry and Crafts (1990) trace the pro-
ductivity lead that the United States achieved
over the United Kingdom during this period to
barriers to competition allowing high-cost pro-
ducers to remain in business. The contribution
of ICT to TFP growth appears to be smaller
than that of electricity in all four economic
areas. This result seems consistent with results
from Crafts (2002) and Jalava and Pohjola
(2008). A possible explanation is that the diffu-
sion of electricity was concomitant with the
increasing skill of the labour force, robust post-
war investments and a young population, which
was not necessarily the case with ICT. The low
contribution of ICT diffusion to the second pro-
ductivity wave (the gap between TFP' and TFP"
from ICT diffusion is not large) may be due to
an underestimation of the productivity wave
itself or of ICT diffusion.
Indeed, due to the price decrease of this type
of product, investment in ICT can accelerate the
capital deepening process in ICT-using indus-
tries, leading to an increase in capital intensity
and hence in labour productivity, but not neces-
sarily in TFP. But, as already noted, national
accounts take only partially into account the
embodied technological progress in ICT invest-
ment price indexes, which means that it is not
fully included in increases in investment volume
and falls in investment prices (see the synthesis
by Van Ark, (2016) on these aspects). Conse-
quently, the accounting split between capital
deepening and TFP within labour productivity
growth is biased, the role of the capital deepen-
ing component being undervalued and, con-
ve r s e l y, t h e r o l e o f TFP g rowth b e ing
overvalued.
ICT investment data compiled by national
accountants (and taken into account here as ICT
investment) underestimate productive ICT
expenditure . Indeed, spending on ICT is
regarded as investment only when the corre-
sponding products are physically isolated.
Therefore, generally speaking, ICT that is
included in productive investment (for example
machine tools or robots) is not counted as ICT
investment but as intermediate consumption of
companies producing these capital goods. Ber-
etti and Cette (2009) and Cette et al. (2016) cor-rect macro ICT investment data by considering
intermediate consumption in ICT components
integrated in non-ICT productive investment.
Their main result is that the amount of ‘indirect
ICT investment’ appears to be significant.
How can we further improve measurement of
TFP in order to reduce the share of unexplained
GDP growth? A first way would be to include
the quality of the labour input in the production
function, for example by trying to measure the
quality of education. Second, spillovers from
both capital and labour that we are not factoring
in can be captured. Third, other fundamental
innovations that are encompassed by TFP can
be identified and estimated.
What to Expect for the Future?Regard ing the produc t i v i ty s lowdown
observed during the 2000s, analyses carried out
by the OECD at the firm level suggest that this
slowdown does not appear to be observed for the
most productive firms, in other words, at the
productivity frontier (Andrews et al., 2015). The
productivity slowdown appears to be a diffusion
19 NUMB E R 32 , S P R I NG 2017
problem from the best performances at the fron-
tier to the laggard firms. This diffusion problem
seems to hinge on the nature of innovations at
the current juncture, with intangible capital
being more difficult to replicate, or on a winner-
takes-all phenomenon in ICT sectors. The puz-
zle is why such innovation diffusion difficulties
appear to have become worse simultaneously in
all developed countries, which are at different
stages of development.
Work in progress at the Banque de France on
French firms confirms the OECD results but
suggests complementary explanations. The
cleansing mechanisms may indeed have become
weaker. One explanation being tested is that this
weaker cleansing mechanism could at least
partly be explained by a decline in real interest
rates and less expensive capital, which allow low-
productivity firms to survive and highly produc-
tive firms to thrive. Less expensive capital
lowers the return on capital expected from firms
and allows innovative firms to take on more
risks. But this could also contribute to capital
misallocation, as financing becomes less selec-
tive on the main innovative projects. Recent
researchers have found that such an explanation
may be relevant for Southern European coun-
tries such as Portugal, Italy and Spain (see for
example Reis, 2013; Gopinath et al., 2015; Gor-
ton and Ordonez, 2015; and Cette, Fernald,
Mojon, 2016).
Nevertheless, the omitted factors in the esti-
mation of TFP growth continue to remain
largely a mystery. For this reason, future pro-
ductivity and GDP growth is very hard to fore-
cast and different scenarios are credible. Cette,
Lecat and Marin (2017) develop a growth model
calibrated to test various scenarios over the very
long-run (up to 2100). They show how different
perspectives on future trends in innovation and
its impact on TFP can yield dramatically differ-
ent outcomes. They stress the need to deepen
our knowledge of the main drivers of GDP
through examination of past trends.
ConclusionsLong-term explainations for trends in GDP
per capita are needed to understand long-term
developments in living standards. This article is
a synthesis of several previous contributions
based on an original database over the long
1890-2015 period for the four main developed
areas: the United States, the euro area, the
United Kingdom, and Japan. We decompose
GDP growth into its main components through
an accounting breakdown. These components
are TFP, capital intensity, working time, the
employment rate, and population. It appears
clearly that changes in TFP growth are the main
driver of changes in GDP growth. We then go
further to explain changes in TFP growth.
We attempt to capture empirically the contri-
bution of factor quality and technology diffusion
to TFP growth. In other words, we refine the
measurement of TFP to better explain changes
in GDP and in particular low growth over the
last sub-period 2005-2015. Two types of factor
quality are considered: the average level of edu-
cation and the average age of the capital stock.
Two technological shocks corresponding to
General Purpose Technologies are considered:
electricity and ICT.
Our main contribution is to present estimates
of the impact of changes in the quality of labour
and capital, and the impact of technological
shocks, on the measurement of TFP. But this is
still not enough to explain a large part of TFP
growth, and the productivity waves remains
largely unexplained. This means that we have to
go further in future analysis to explain growth.
As we do not have complete knowledge and
understanding of what drives GDP growth,
forecasting the future course of growth is very
difficult.
INT E R N A T I ON A L PRO DU C T I V I T Y MON I T OR 20
Policies can influence TFP and GDP per cap-
ita growth. Relevant policies are ones that sup-
port innovation and foster greater productivity
benefits from technological shocks. Examples
are policies to reduce anti-competitive barriers
on the product market, introduce more flexibil-
ity into the labour market, and increase the edu-
cation level of the working age population (see
on these aspects Aghion and Howitt, 1998,
2006, 2009, and Aghion et al. 2008 for an empir-
ical illustration). The challenge in the coming
years for the four economic areas considered in
this analysis will be not to miss the opportunities
arising from a possible new TFP growth wave
linked to a new technology shock. The increase
of the participation rate in the euro area over the
past two decades illustrates the large role played
by policy. But compared to the United States,
GDP per capita in the euro area still suffers from
lower employment rates, which gives room for
new policies.
ReferencesAbramovitz, Moses (1956) "Resource and Output
Trends in the US Since 1870," American Eco-nomic Review, Vol. 46, May, pp. 5-23.
Acemoglu, Daron, Suresh Naidu, Pascual Restrepo and James Robinson (2014) "Democracy Does Cause Growth," NBER Working Paper Series, No. 20004, March.
Aghion, Philippe, Philippe Askenazy, Renaud Bour-lès, Gilbert Cette and Nicolas Dromel (2008) "Education, Market Rigidities and Growth," Economics Letters, No. 102, pp. 62-65.
Aghion, Philippe and Peter Howitt (1998) "Endoge-neous Growth Theory," (Cambridge, MA: MIT Press).
Aghion, Philippe and Peter Howitt (2006) "Joseph Schumpeter Lecture - Appropriate Growth Pol-icy: A Unifying Framework," Journal of the euro-pean Economic Association, Vol. 4(2-3), No. 04-05, pp. 269-314. (Cambridge, MA: MIT Press).
Aghion, Philippe and Peter Howitt (2009) "The Economics of Growth," (Cambridge, MA: MIT Press).
Aghion, Philippe, Antonin Bergeaud, Timo Boppart, Peter Klenow and Huiyu Li (2017) "Missing Growth from Creative Destruction," mimeo Stanford.
Andrews, Dan, Chiara Criscuolo and Peter Gal (2015) "Frontier Firms, Technology Diffusion and Public Policy: Micro Evidence from OECD Countries," OECD Global Productivity Forum background paper.
Bakker, Gerben, Nicholas Crafts and Pieter Woltjer (2015) "A Vision of the Growth Process in a Technologically Progressive Economy: the United States, 1899-1941," CAGE Online Working Paper Series 257, Competitive Advan-tage in the Global Economy (CAGE).
Barro, Robert (1991) "Economic Growth in a Cross Section of Countries," Quarterly Journal of Eco-nomics, May, pp. 407-443.
Barro, Robert and Xavier Sala-I-Martin (1997) "Technological Diffusion, Convergence, and Growth," Journal of Economic Growth, Vol. 2, pp. 1-27.
Barro, Robert and Jong-Wha Lee (2010) "A New Data Set of Educational Attainment in the World, 1950-2010," NBER Working Papers 15902, National Bureau of Economic Research, Inc.
Baumol, William (1986) "Productivity Growth, Convergence and Welfare: What the Long-Run Data Show?" Amarican Economic Review, Vol. 76, pp. 1072-1085.
Beretti, Paul-Antoine and Gilbert Cette (2009) "Indirect ICT Investment," Applied Economics Letters, Vol. 16, pp. 1713-1716.
Bergeaud, Antonin, Gilbert Cette and Remy Lecat (2015) "GDP Per Capita in Advanced Countries Over the 20th Century," Working papers No. 549, Banque de France, April.
Bergeaud, Antonin, Gilbert Cette and Remy Lecat (2016a) "Productivity Trends from 1890 to 2012 in Advanced Countries," Review of Income and Wealth, Vol. 62, issue 3, pp. 420-444.
Bergeaud, Antonin, Gilbert Cette and Remy Lecat (2016b) "The Role of Production Factor Quality and Technology Diffusion in 20th Century Pro-ductivity Growth," Working papers No. 588, Banque de France, April, forthcoming in Clio-metrica.
Bolt, Jutta and Jan Luiten van Zanden (2014) "The Maddison Project: Collaborative Research on Historical National Accounts," Economic History Review, Vol. 67, pp. 627-651.
Broadberry, Stephen and Nicholas Crafts (1990) "Explaining Anglo-American Productivity Dif-ferences in the Mid-Twentieth Century," Oxford Bulletin of Economics and Statistics, Vol. 52, No. 4, pp. 375-402.
Broadberry, Stephen and Mary O'Mahony (2004) "Britain's Productivity Gap with the United States and europe: A Historical Perspective," National Institute Economic Review, National Insti-
21 NUMB E R 32 , S P R I NG 2017
tute of Economic and Social Research, Vol. 189, No. 1, pp. 72-85, July.
Brynjolfsson, Erik and Andrew MCafee (2014) "The Second Machine Age - Work, Progress, and Prosperity in a Time of Brilliant Technologies."
Byrne, David, Stephen Oliner and Daniel Sichel (2013) "Is the Information Technology Revolu-tion Over?" International Productivity Monitor, No. 25, Spring, pp. 20-36.
Byrne, David, John Fernald and Marshall Reinsdorf (2016) "Does the United States Have a Produc-tivity Slowdown or a Measurement Problem?" Brookings Papers on Economic Activity, March.
Cette, Gilbert (2014) "Does ICT Remain a Powerful Engine of Growth," Revue d'Economie Politique, Vol. 124, No. 4, July-August, pp. 473-492.
Cette, Gilbert (2015) "Which Role for ICTs as a Productivity Driver Over the Last Years and the Next Future?" Digiworld Economic Journal, Com-munications & Strategies, No. 100, 4th quarter, pp. 65-83.
Cette, Gilbert, Christian Clerc and Lea Bresson (2015) "Contribution of ICT Diffusion to Labor Productivity Growth: The United States, Can-ada, the eurozone, and the United Kingdom, 1970-2013," International Productivity Monitor, No. 28, Spring, pp. 81-88.
Cette, Gilbert, John Fernald and Benoit Mojon (2016) "The Pre-Great Recession Slowdown in Productivity," European Economic Review, Vol. 88, September, pp. 3-20.
Cette, Gilbert, Remy Lecat and Carole Marin (2017) "Long-Term Growth and Productivity Projec-tions in Advanced Countries," Working papers No. 617, Banque de France, Forthcoming in OECD Journal: Economic Studies.
Cette, Gilbert and Jimmy Lopez (2012) "ICT Demand Behaviour: An International Compari-son," Economics of Innovation and New Technology, Vol. 21, No. 4, June, pp. 397-410.
Cette, Gilbert, Jimmy Lopez and Jacques Mairesse (2017) " Upstream Product Market Regulations, ICT, R&D and Productivity," The Review of Income and Wealth, series 63, supplement 1, Feb-ruary, pp. S68-S89.
Cette, Gilbert, Jimmy Lopez, Giorgio Presidente and Vincenzo Spieza (2016) "Measuring 'Indi-rect Investment' in ICT," OECD, Working Paper DSTI/CDEP/MADE(2016)4, 03-Nov-2016.
Cette, Gilbert and Daniel Szpiro (1989) "Une Inter-prétation du Ralentissement de la Productivité Industrielle au Moment du Second Choc Pétro-lier," Economie et Prévision, No. 87, 1989-1, pp. 33-42.
Cette, Gilbert, Yusuf Kocoglu and Jacques Mairesse (2009) "Productivity Growth and
Levels in France, Japan, the United Kingdom and the United States in the Twentieth Cen-tury.", NBER Working Paper: 15577.
Clark, Colin (1957) "The Condition of Economic Progress," London, MacMillan.
Colecchia Alessandra and Paul Schreyer (2001) "ICT Investment and Economic Growth in the 1990s: Is the United States a Unique Case?" OECD Science, Technology and Industry Working Papers 2001/07, OECD.
Comin, Diego and Bart Hobijn (2009) "The CHAT Dataset," Harvard Business School Working Papers 10-035, Harvard Business School.
Comin, Diego, Bart Hobijn and Emilie Rovito (2006a) "Five Facts You Need to Know About Technology Diffusion," NBER working papers series, No. 11928, January.
Comin, Diego, Bart Hobijn and Emilie Rovito (2006b) "World technology usage lags," NBER working papers series, No. 12677, November.
Crafts, Nicholas (2002) "The Solow Productivity Paradox in Historical Perspective," CEPR, Dis-cussion Paper Series, No. 3142, January.
Crafts, Nicholas and Kevin O'Rourke (2013) "Twen-tieth Century Growth," Oxford University Eco-nomic and Social History Series _117, Economics Group, Nuffield College, University of Oxford.
David, Paul A. (1990) "The Dynamo and the Com-puter: An Historical Perspective on the Modern Productivity Paradox," American Economic Review, Papers and Proceedings, Vol 80, No. 2, pp. 355-361.
Eichengreen, Barry (2015) "Secular Stagnation: The Long View," American Economic Review, Papers & Proceedings, Vol. 105, No. 5, pp. 66-70.
Gittleman, Maury, Thijs Ten Raa and Edward Wolff (2003) "The Vintage Effect in TFP Growth: An Analysis of the Age Structure of Capital," NBER Working Papers 9768, National Bureau of Eco-nomic Research, Inc.
Goldin, Claudia and Lawrence Katz (2008) "The Race Between Education and Technology," Belknap Press.
Gopinath, Gita, Sebnem Kalemli-Ozcan, Loukas Karabarbounis, and Carolina Villegas-Sanchez (2015) "Capital Allocation and Productivity in South europe," NBER Working Paper, No. 21453.
Gordon, Robert (1999) "US Economic Growth since 1970: One Big Wave?" American Economic Review, Vol. 89, No. 2, pp.123-128.
Gordon, Robert (2012) "Is U.S. Economic Growth Over? Faltering Innovation Confronts the Six Headwinds," National Bureau of Economic Research, NBER Working Papers 18315, 2012.
INT E R N A T I ON A L PRO DU C T I V I T Y MON I T OR 22
Gordon, Robert (2013) "US Productivity Growth: The Slowdown has Returned After a Temporary Revival," International Productivity Monitor, No. 25, Spring, pp. 13-19.
Gordon, Robert (2014) "The Demise of US Eco-nomic Growth: Restatement, Rebuttal, and Reflections," National Bureau of Economic Research, Inc, NBER Working Papers, No. 19895, February.
Gordon, Robert (2015) "Secular Stagnation: A Sup-ply-Side View," American Economic Review, Papers & Proceedings, Vol. 105, No. 5, pp. 54-59.
Gorton, Gary and Guillermo Ordonez (2015) "Good Booms, Bad Booms," Manuscript, University of Pennsylvania.
Greenwood, Jeremy, Zvi Hercowitz, and Per Krusell (1997) "Long-Run Implications of Investment-Specific Technological Change," American Eco-nomic Review, Vol. 87, No. 3, pp. 342-362.
Guerrieri, Paolo, Matteo Luciani and Valentina Meliciani (2011) "The Determinants of Invest-ment in Information and Communication Tech-nologies," Economics of Innovation and New Technology, Vol. 20, No. 4, pp. 387-403.
Gust, Christopher and Jaime Marquez (2004) "Inter-national Comparisons of Productivity Growth: The Role of Information Technology and Regu-latory Practices," Labour Economics, Vol. 11, No.1, pp. 33-58, February.
Hansen, Alvin (1939) "Economic Progress and Declining Population Growth," American Eco-nomic Review, Vol. 29, No.1, pp. 1-39.
Hjerppe, Riitta (1996) "The Finnish Economy 1860-1985; Growth and Structural Changes," Bank of Finland, Government printing center.
Huberman, Michael and Chris, Minns (2007) "The Times they are not Changin': Days and Hours of Work in Old and New Worlds, 1870-2000," Explorations in Economic History, Vol. 44, No.4, pp. 538-567, October.
Jalava, Jukka and Matti Pohjola (2008) "The Roles of Electricity and ICT in Economic Growth: Case Finland," Explorations in Economic history, Vol. 45, pp. 270-287.
Jorgenson, Dale (2001) "Information Technology and the US Economy," American Economic Review, Vol. 91, March, No. 1, pp. 1-32.
Maddison, Angus (2001) "The World Economy, a Mil-lennial Perspective," OECD publishing, 2001.
Madsen, Jakob (2010a) "Growth and Capital Deep-ening Since 1870: Is it All Technological Progress?" Journal of Macroeconomics,Vol. 32, pp. 641-656.
Madsen, Jakob (2010b) "The Anatomy of Growth in the OECD Since 1870," Journal of Monetary Eco-nomics, Vol. 57, pp. 753-767.
Mairesse, Jacques (1977) "Deux Essais d'Estimation du Taux Moyen de Progrès Technique Incorporé au Capital," Annales de l'INSEE, No. 28, Octo-ber-December, pp. 41-76.
Mairesse, Jacques (1978) "New Estimates of Embod-ied and Disembodied Technical Progress," Annales de l'INSEE, No. 30-31, April-Septem-ber, pp. 681-720.
Mairesse, Jacques and Jean-Michel Pescheux (1980) "Fonction de Production et Mesure du Capital : La Robustesse des Estimations," Annales de l'INSEE, No. 38-39, April-September, pp. 63-75.
Mokyr, Joel, Chris Vickers and Nicolas L. Ziebarth (2015) "The History of Technological Anxiety and the Future of Economic Growth: Is this Time Different?," Journal of Economic Perspective, Vol. 29, No. 3, Summer, pp. 31-50.
OECD (2015) "The Future of Productivity," (Paris: OECD Publishing).
Pilat Dirk and Frank Lee (2001) "Productivity Growth in ICT-Producing and ICT-Using Industries: A Source of Growth Differentials in the OECD?," OECD Science, Technology and Industry Working Papers 2001/04, OECD.
Pratt, Gill (2015) "Is a Cambrian Explosion Coming from Robotics?" Journal of Economic Perspective, Vol. 29, No. 3, Summer, pp. 51-60.
Prados de la Escosura, Leandro (2003) "El Progreso Economico de España (1850-2000)," Fundacion BBVA edition 1, number 201136.
Psacharopoulos, George and Harry Anthony Patri-nos (2004) "Returns to Investment in Education: a Further Update," Education Economics, Taylor & Francis Journals, Vol. 12, No. 2, pp. 111-134.
Reis, Ricardo (2013) "The Portuguese Slump and Crash and the euro Crisis," Brookings Papers on Economic Activity, No. 46, pp. 143-193, Spring.
Solow, Robert (1959) "Investment and Technical Change," in Mathematical Methods in the Social Sciences, Stanford.
Solow, Robert (1962) "Technical Progress, Capital Formation, and Economic Growth," American Economic Review, Vol. 52, No. 2, Papers and Pro-ceedings, May, pp. 76-86.
Schreyer, Paul (2000) "The Contribution of Infor-mation and Communication Technology to Out-put Growth: A Study on the G7 Countries," OECD Science, Technology and Industry Work-ing Papers 200/2, OECD.
Stiglitz, Joseph, Amartya Sen and Jean-Paul Fitoussi (2009) "The Measurement of Economic Perfor-mance and Social Progress Revisited. Reflections and Overview. Commission on the Measurement of Economic Performance and Social Progress," Paris.
23 NUMB E R 32 , S P R I NG 2017
Summers, Larry (2014) "U.S. Economic Prospects: Secular Stagnation, Hysteresis, and the Zero Lower Bound," Business Economics, Vol. 49, No. 2, pp. 65-74.
Summers, Larry (2015) "Demand Side Secular Stag-nation," American Economic Review, Papers & Pro-ceedings, Vol. 105, No.5, pp. 60-65.
Syverson, Charles (2016) "Challenges to Mismea-surement Explanations for the US Productivity Slowdown," NBER Working Paper No. 21974
Timmer, Marcel, Robert Inklaar, Mary O'Mahony and Bart Van Ark (2011) "Productivity and Eco-nomic Growth in europe: A Comparative Indus-try Perspective," International Productivity Monitor, No. 21, Spring, pp. 3-23.
Van Ark, Bart, Mary O'Mahony and Marcel Timmer (2008) "The Productivity Gap between europe and the United States: Trends and Causes," Jour-nal of Economic Perspectives, Vol. 22, No.1, Win-ter, pp. 25-44.
Van Ark, Bart (2016) "The Productivity Paradox of the New Digital Economy," International Produc-tivity Monitor, No. 31, Fall, pp. 3-18.
Van Leeuwen, Bas and Jieili van Leeuwen-Li (2014) "Education Since 1820," in van Zanden JL et al. (eds) How Was Life? Global Well-being Since 1820. OECD Publishing, (Paris: OECD Publi-cations), pp. 88-101
Villa, Pierre (1994) "Un Siècle de Données Macro-économiques," INSEE Résultats, Série Économie générale, pp. 86-87.
Wolff, Edward (1991) "Capital Formation and Pro-ductivity Convergence Over the Long Term," American Economic Review, Vol. 81, No. 3, June, pp. 565-579.
Wolff, Edward (1996) "The Productivity Slowdown: The Culprit at Last? Follow-Up on Hulten and Wolff," American Economic Review, Vol. 86, No. 5, December, pp. 1239-1252.
Appendix: Construction of the SeriesIn this appendix, we describe our dataset more
in details and explain some of the choices we
made regarding the estimation of TFP.
Background
The Bergeaud, Cette and Lecat (BCL) long
term productivity database was created in 2013
as part of an effort to update the long-term TFP
series used in Cette et al. (2009). The database is
updated yearly. More countries are added when
information becomes available. The latest vin-
tage of the database can be downloaded from the
website: www.longtermproductivity.com. In
2016, the current version of the BCL database
includes 17 countries: the United States, Japan,
Germany, France, the United Kingdom, Italy,
Spain, Canada, Australia, the Netherlands, Bel-
gium, Switzerland, Sweden, Denmark, Norway,
Portugal and Finland. Series are available for
labour productivity, GDP per capita, capital
intensity, average age of equipment, and TFP,
defined as the Solow residual of a Cobb-Douglas
production function with two inputs: capital
stock and total hours worked.
Main hypothesis
To calculate our TFP series we need data on
real GDP (Y), total hours worked (H), employ-
ment (N), population (P) and real capital stock
(K). Capital stock estimates are based on long-
term information on investment (I). Series for
GDP and capital are given in national curren-
cies, expressed in constant 2010 prices, and con-
verted to US dollars by purchasing power parity
(PPP) estimates for 2010, with a conversion rate
from the Penn World Tables.
The perpetual inventory method (PIM) is
used to construct the capital series from data on
investment. Equipment and building investment
(IE and IB) and capital (KE and KB) are distin-
guished with different life expectancy. The
annual depreciation rates, noted δ, have been
chosen according to Cette et al. (2009 and 2015)as 10 per cent for non-ICT equipment, 30 per
cent for software and computers, 15 per cent for
communication equipment and 2.5 per cent for
buildings. In addition, for each year, we updated
the given capital stock with a war and natural
disasters damage coefficient (dt) (with 0 < dt >1)
in order to take into consideration capital
destruction.
The PIM corre sponds to the r e l a t ion
This relation assumes that the whole investment
Κτ 1+ Κτ 1 δ–( ) lτ 1 δ–×+×( ) 1 dτ 1+–( )×=
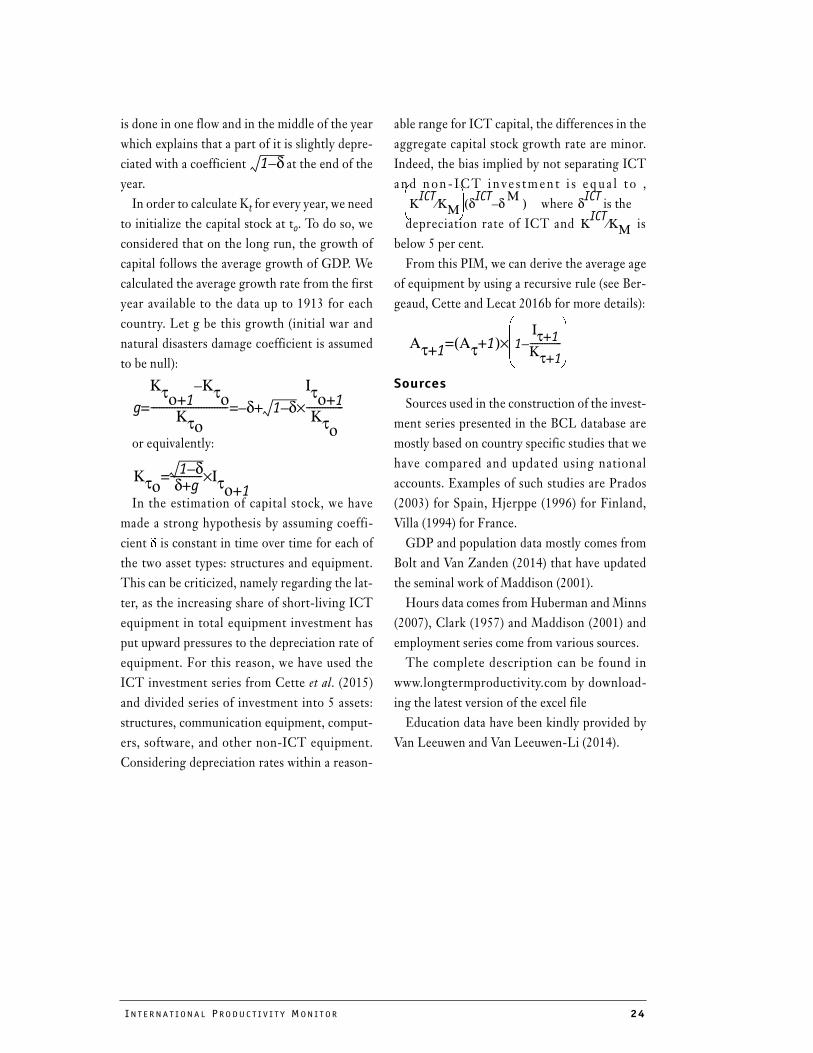
INT E R N A T I ON A L PRO DU C T I V I T Y MON I T OR 24
is done in one flow and in the middle of the year
which explains that a part of it is slightly depre-
ciated with a coefficient at the end of the
year.
In order to calculate Kt for every year, we need
to initialize the capital stock at to. To do so, we
considered that on the long run, the growth of
capital follows the average growth of GDP. We
calculated the average growth rate from the first
year available to the data up to 1913 for each
country. Let g be this growth (initial war and
natural disasters damage coefficient is assumed
to be null):
or equivalently:
In the estimation of capital stock, we have
made a strong hypothesis by assuming coeffi-
cient δ is constant in time over time for each of
the two asset types: structures and equipment.
This can be criticized, namely regarding the lat-
ter, as the increasing share of short-living ICT
equipment in total equipment investment has
put upward pressures to the depreciation rate of
equipment. For this reason, we have used the
ICT investment series from Cette et al. (2015)and divided series of investment into 5 assets:
structures, communication equipment, comput-
ers, software, and other non-ICT equipment.
Considering depreciation rates within a reason-
able range for ICT capital, the differences in the
aggregate capital stock growth rate are minor.
Indeed, the bias implied by not separating ICT
and non - ICT i n ve s tmen t i s e q u a l t o ,
where is the
depreciation rate of ICT and is
below 5 per cent.
From this PIM, we can derive the average age
of equipment by using a recursive rule (see Ber-
geaud, Cette and Lecat 2016b for more details):
Sources
Sources used in the construction of the invest-
ment series presented in the BCL database are
mostly based on country specific studies that we
have compared and updated using national
accounts. Examples of such studies are Prados
(2003) for Spain, Hjerppe (1996) for Finland,
Villa (1994) for France.
GDP and population data mostly comes from
Bolt and Van Zanden (2014) that have updated
the seminal work of Maddison (2001).
Hours data comes from Huberman and Minns
(2007), Clark (1957) and Maddison (2001) and
employment series come from various sources.
The complete description can be found in
www.longtermproductivity.com by download-
ing the latest version of the excel file
Education data have been kindly provided by
Van Leeuwen and Van Leeuwen-Li (2014).
1 δ–
g
Κτο 1+Κτο
–
Κτο
----------------------------- δ– 1 δ–
Ιτο 1+Κτο
--------------×+= =
Κτο1 δ–
δ g+------------ Ιτο 1+
×=
ΚICT
ΚΜ
⁄
δICT
δΜ
–( ) δICT
ΚICT
ΚΜ
⁄
Ατ 1+ Ατ 1+( ) 1Ιτ 1+
Κτ 1+
-------------–
×=
INT E R N A T I ON A L PRO DU C T I V I T Y MON I T OR 25
Decomposing the Productivity-Wage Nexus in Selected OECD Countries, 1986-2013
Andrew Sharpe
Centre for the Study of Living Standards
James Uguccioni
Centre for the Study of Living Standards1
ABSTRACT
Standard economic theory predicts that in the long run, productivity growth ought to
drive aggregate real wage growth. We consider this prediction in the case of 11 OECD
countries, and find that eight of the 11 experienced slower median real wage growth than
labour productivity growth over the 1986-2013 period. We decompose the gap between
labour productivity growth and median real wage growth into four components: wage
inequality, changes in the importance of employer contributions to social insurance
programs, differences between the prices of output and consumption, and changes to
labour's share of income. The decompositions ultimately show that there is no common
cause for the productivity-wage gap, though most countries did see wage inequality grow
and labour's share of income fall to some degree over our period of study.
In the face of growing inequality in advanced
economies, the OECD (2014) has initiated a sig-
nificant research effort aimed at understanding
and promoting inclusive growth. The aim is to
advance policies to ensure that the benefits of
growth are broadly shared. Across OECD coun-
tries, governments are searching for ways to
ensure that subsets of society are not left behind
by economic growth. For example, the Canadian
government has installed a Cabinet Committee
on Inclusive Growth, Opportunities and Inno-
vation with the mandate to "[consider] strategies
designed to promote inclus ive economic
growth, opportunity, employment and social
security" in Canada.
These efforts are timely because evidence on
wage growth suggests that economic growth has
not been broadly shared in recent decades. In
eight of the 11 OECD countries examined in
this article, median real wage growth since the
mid-1980s has not kept pace with labour pro-
ductivity growth. The size of the growth gap
between labour productivity and median real
wages differs across countries, but the qualita-
tive pattern is consistent: workers are growing
more productive, but those productivity gains
are not being matched by growth in the typical
worker's wage.
Economic history and economic theory sug-
gest that labour productivity growth should
1 Andrew Sharpe is the Excecutive Director at the Centre for the Study of Living Standards (CSLS) James Uguc-
cioni was an economist at the CSLS at the time of writing. The authors would like to thank Guiseppe Nicoletti
and two anonymous referees for useful comments. This is an abridged and revised version of Uguccioni and
Sharpe (2016). The paper was first presented at the OECD's First Global Forum on Productivity held in Lisbon,
Portugal July 7-8, 2016: Email: [email protected].
26 NUMB E R 32 , S P R I NG 2017
generate rising living standards for workers over
time, so the apparent disconnect between labour
productivity growth and wage growth is puz-
zling. What factors account for it? In this article,
we show that the gap between labour productiv-
ity growth and median hourly earnings growth
can be decomposed into contributions from the
following four sources:
• rising earnings inequality;
• changes in the importance of employer
contributions to social insurance programs
as a form of labour compensation;
• rising relative prices for consumer goods;
and
• a decline in labour's share of aggregate
income.
Each of these components has its own impli-
cations for the welfare of workers. To the extent
that the productivity-earnings gap simply
reflects a rising share of labour compensation
being paid in the form of employer contribu-
tions to social insurance plans, for example, it is
not obvious that workers are any worse off. On
the other hand, rising earnings inequality or a
decline in labour's share of income might repre-
sent more serious obstacles to broad-based pros-
perity.
We perform the decomposition for 11 OECD
countries: Canada, Denmark, France, Finland,
Germany, Ireland, the Netherlands, Norway,
Spain, the United Kingdom, and the United
States. The decompositions show that the pro-
ductivity-wage growth gap has no single com-
mon cause across the countries, but most
countries did experience rising earnings ine-
quality and a decline in labour's share of income
over our period of study. The decompositions
typically run from the mid to late 1980s through
to 2010 or 2013, depending on the availability of
household survey data for a given country.
The article is comprised of five sections. The
first discusses literature that provides context
for our analysis. The second section describes
our f ramework for decomposing the gap
between labour productivity growth and median
real hourly wage growth. Section three presents
the results of the decomposition. The fourth
section discusses wage growth throughout the
wage distribution in more detail. Section five
concludes.
Literature ReviewThe failure of real wages to keep pace with
labour productivity is not a new observation.
Fisher and Hostland (2002) observe that labour
productivity outstripped real wage growth in
Canada from 1994 to 2001. Bartlett and Tapp
(2012) found that labour productivity growth
outpaced labour compensation growth from the
mid-1990s through to 2012 in Canada. The gap,
however, is not limited to Canada. The Interna-
tional Labour Organization (2015) observed
that labour productivity growth exceeded real
wage growth from 1999 to 2013 in developed
countries across the board.
Decompositions allow analysts to identify the
proximate sources of the gap between labour
productivity growth and real wage growth. In a
study of the American non-farm business sector
from 1970 to 2006, Feldstein (2008) found that
average real wage growth was indeed lower than
labour productivity growth. The difference was
a matter of prices. When he adjusted wages for
inflation using the non-farm business sector
output price index (rather than the consumer
price index), he found that wages grew at
approximately the same rate as labour produc-
tivity.
For research that relates the growth of wages
and labour productivity, Feldstein stresses the
importance of accounting for differences in
price indexes and the importance of using total
compensation (i.e. including supplementary
labour income and fringe benefits) instead of
only wages and salaries when calculating a wage
for comparison with labour productivity. We
INT E R N A T I ON A L PRO DU C T I V I T Y MON I T OR 27
heed both of Feldstein's concerns in our analy-
sis.
While Feldstein's decomposition provides a
framework for relating labour productivity
growth to average wage growth, he fails to con-
sider how wage growth was actually experienced
by the workers near the median - a better mea-
sure of the wage of the typical 'middle class'
worker. Sharpe et al. (2008a; 2008b) consider
how wage growth was experienced by the
median worker, decomposing the gap between
labour productivity growth and real median
wage growth in Canada into four contributing
factors: rising inequality, poor terms of trade for
labour, a decrease in labour's share of income,
and measurement inconsistencies.2 They find
that from 1980 to 2005, labour productivity
grew 1.26 percentage points per year faster than
median real earnings. They decompose the gap
into their four factors, attributing 0.35 percent-
age points per year to inequality, 0.42 percent-
age points per year to terms of trade for labour,
0.25 percentage points per year to labour's share
of income, and 0.25 percentage points per year
to measurement issues. This report follows the
method of Sharpe et al. but extends the analysis
to ten additional OECD countries.
Pessoa and Van Reenen (2012) perform a
decomposition of median wage growth and pro-
ductivity growth similar to the one presented in
Sharpe et al. (2008b) for the United Kingdom
and the United States. They propose that there
are two different types of measurements for the
divergence - "gross decoupling" and "net decou-
pling". The former measures differences in
growth between labour productivity and median
hourly real earnings, while the latter measures
differences in growth between labour productiv-
ity and average labour compensation per hour
(deflated with the same deflator). Gross decou-
pling accounts for changes to labour's share of
income, labour's terms of trade, changes median
and mean hourly earnings, and the wedge
between labour compensation and earnings,
while net decoupling only accounts for changes
to labour's share of income. Ultimately, Pessoa
and Van Reenen (2012) find little evidence of net
decoupling in the UK, but significant gross
decoupling in the United States and the UK. In
the UK, gross decoupling was driven by differ-
ences between mean and median earnings and
the wedge between earnings and labour com-
pensation.
Pessoa and Van Reenen (2012) recognize that
both gross decoupling and net decoupling are
important policy indicators. Gross decoupling
relates the "true middle" of the earnings distri-
bution to labour productivity. It also deflates
earnings with the CPI and labour productivity
with the GDP deflator, capturing any difference
in the prices faced by firms and workers. This is
an important distinction to make because firms
and consumers can at times face very different
prices. Changes in capital equipment prices
affect firms more than consumers, for example.
Net decoupling, on the other hand, is impor-
tant because it challenges one of the main styl-
ized facts cited by economists - labour's stable
share of income. Pessoa and Van Reenen observe
that net decoupling could occur for many rea-
sons, including shocks which disturb the long
run equilibrium, technological bias against
labour, changes to the level of competition in
the market (in the product market it results in
setting higher prices, while in the labour market
it results in setting lower wages), and finally
changes to labour supply due to structural phe-
nomena like globalization.
Mishel and Gee (2012) use the methodology
developed by Sharpe et al (2008b) to compare
2 The term "measurement inconsistencies" refers to the combined effect of employer social contributions and
changes in hours of work per worker.
28 NUMB E R 32 , S P R I NG 2017
the growth of median real wage in the United
States with labour productivity. Like most of the
literature, they also find a significant gap
between growth in labour productivity and
median real wages: 1.56 percentage points
between 1973 and 2011. Rising wage inequality
accounted for 0.61 percentage points, while
labour's terms of trade accounted for another
0.44 percentage points. They specifically point
to the erosion of labour standards, globalization,
high trade deficits, and the rising share of capital
depreciation in GDP to explain both growing
inequality and the changes in the distribution of
income towards capital.
A recent OECD study by Schwellnus et al.
(2017) provides an analysis of the decoupling of
median wages from productivity in OECD
countries for the 1995-2013 period based on
trends in labour’s share and the ratio of median
to average wages. It finds that labour productiv-
ity grew faster than median wages in 15 of 24
countries.
Empirical FrameworkOur decomposition of the gap between labour
productivity growth and median real hourly
earnings growth follows the approach developed
in Sharpe et al. (2008a). In this section, we for-
mally describe this approach.
Decomposition Method
The starting point for the decomposition is
the following accounting identity:
(1)
Here, YL is total nominal labour compensa-
tion, PC is the price of consumption goods, and L
is total hours worked. Y is total nominal output
(or income) in the economy and PY is the price of
output.
Thus, the ratio denotes average
real hourly labour compensation in units of con-
sumption goods (i.e. the "consumer wage"). On
the right-hand side, the ratio denotes
real output per hour in units of output goods;
that is, labour productivity. is labour's
share of total income in the economy. The
remaining term is the relative price of
output goods in terms of consumption goods;
following the literature, we will refer to this as
"labour's terms of trade."
For any variable X , let the notation ∆%X
denote the per cent growth rate of X. Then
expressing equation (1) in growth rates, we
obtain:
∆%Average Real Hourly Compensation =
∆% Labour Productivity + ∆% Labour Share
∆% Labour Terms of Trade (2)
Our goal is to explain changes in the gap
between labour productivity and median real
hourly earnings. Let ∆% Gap denote the pro-
ductivity-earnings growth gap. Formally, it is
defined by:
∆% Gap = ∆% Labour Productivity (3)
- ∆% Median Real Hourly Earnings
Rearranging (2) and using (3) to eliminate
labour productivity growth, we obtain:
∆% Gap = ∆% Average Real Hourly
Compensation - (4)
∆% Median Real Hourly Earnings -
∆% Labour Share-∆% Labour Terms of Trade
Now, the change in average real hourly earn-
ings relative to median real hourly earnings is an
indicator of the change in earnings inequality
over time. Thus, we define the change in ine-
quality as:
∆% Inequality =
∆% Average Real Hourly Earnings - (5)
∆% Median Real Hourly Earnings
Finally, we need to relate average real hourly
compensation to average real hourly earnings.
YL
PC
L×-------------------
YL
PY
L×-------------------
YL
Y------
PY
PC
------××=
YL
PC
L×( )⁄
Y PY
L×( )⁄
YL
Y⁄
PY
PC
⁄
INT E R N A T I ON A L PRO DU C T I V I T Y MON I T OR 29
The difference between these two measures
reflects the impact of changes in employer con-
tributions to social insurance programs:
∆% Average Real Hourly Compensation -
∆% Average Real Hourly Earnings = (6)
∆% Employer Social Contributions
Substituting (5) and (6) into (4) yields the
overall decomposition:
∆% Gap = ∆% Inequality +
∆% Employer Social Contributions - (7)
∆% Labour Terms of Trade -
∆% Labour Share
equation (7) is the final decomposition formula.
We find the accounting approach very useful.
It draws our attention to the relationships
between the productivity earnings gap and sev-
eral other economic phenomena such as: rising
earnings inequality, the changing impact of laws
governing employer contributions to social
insurance programs. It lends a disciplined, quan-
titative characterization to those relationships.
It suggests areas for future research that might
clarify the causal mechanisms at play.
The decomposition in equation (7) does not,
on its own, justify any statements about cause
and effect and does not explain the trends
observed. To address such questions would
require a structural model that explains why
each of the components change the way it did.
Data Sources
Our analysis rel ies on two data sources:
national accounts and household surveys.3 For
estimates based on national accounts data, we
employ the OECD National Accounts from the
OECD Stat public-use database. For estimates
that rely on household surveys (median and
average earnings from household surveys), we
rely on the micro-datasets made available by the
Luxembourg Income Study. Table 1 details the
specific survey(s) used for each country. The
length of our time series varies by country with
household survey availability. Generally, the
series span from 1986 or 1987 to 2010 or 2013.
Germany and Ireland are the two exceptions to
the rule, with our time series for the two coun-
tries spanning 1994 to 2010.4
To create our median and average wage series
for each country, we used the annual labour
income for both part- t ime and ful l - t ime
employees from the relevant household survey.
We excluded self-employed from our sample
when generating the distribution of annual
labour income in a given country because of data
issues in differentiating labour income from
returns to capital.5 In order to create average
hourly real wage and median hourly real wage
estimates, we then divided through by the aver-
age hours worked per person employed and
deflated each series with the CPI.6
3 The data series used in this article can be found at http://csls.ca/reports/csls2016-16-DataAppendix.pdf.
4 Ireland began in 1994 simply due to data availability. We opted to begin our German series in 1994
because it was the first household survey after East and West Germany were reunited, and we lack micro-
data from East Germany prior to the Wall coming down.
5 The primary difficulty with self-employed data is that their annual income comes both from the labour
the self-employed put in their business and the return on the capital they have invested. Most countries
have tax systems set up in such a way that dividends from a business are treated differently than salaries
paid out from the business. As such, the self-employed will naturally take into account tax implications
when deciding how they will be remunerated in a given year. By excluding the self-employed, we avoid
any changes to labour income which are the result of changes to the tax treatment of dividends. More-
over, as our decomposition is an exercise in growth, so long as "true" self-employed labour income did
not grow faster or slower than labour income did for employees, we do not lose any information by drop-
ping the self-employed.
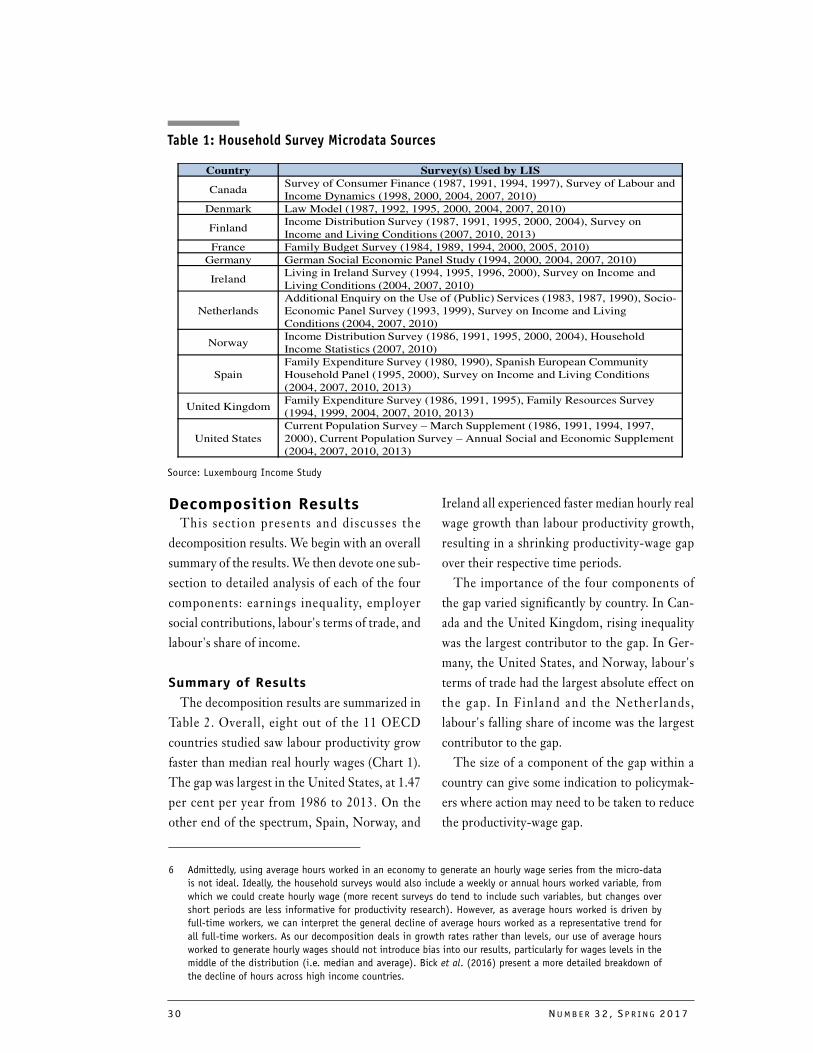
30 NUMB E R 32 , S P R I NG 2017
Decomposition ResultsThis sect ion presents and discusses the
decomposition results. We begin with an overall
summary of the results. We then devote one sub-
section to detailed analysis of each of the four
components: earnings inequality, employer
social contributions, labour's terms of trade, and
labour's share of income.
Summary of Results
The decomposition results are summarized in
Table 2. Overall, eight out of the 11 OECD
countries studied saw labour productivity grow
faster than median real hourly wages (Chart 1).
The gap was largest in the United States, at 1.47
per cent per year from 1986 to 2013. On the
other end of the spectrum, Spain, Norway, and
Ireland all experienced faster median hourly real
wage growth than labour productivity growth,
resulting in a shrinking productivity-wage gap
over their respective time periods.
The importance of the four components of
the gap varied significantly by country. In Can-
ada and the United Kingdom, rising inequality
was the largest contributor to the gap. In Ger-
many, the United States, and Norway, labour's
terms of trade had the largest absolute effect on
the gap. In Finland and the Netherlands,
labour's falling share of income was the largest
contributor to the gap.
The size of a component of the gap within a
country can give some indication to policymak-
ers where action may need to be taken to reduce
the productivity-wage gap.
6 Admittedly, using average hours worked in an economy to generate an hourly wage series from the micro-data
is not ideal. Ideally, the household surveys would also include a weekly or annual hours worked variable, from
which we could create hourly wage (more recent surveys do tend to include such variables, but changes over
short periods are less informative for productivity research). However, as average hours worked is driven by
full-time workers, we can interpret the general decline of average hours worked as a representative trend for
all full-time workers. As our decomposition deals in growth rates rather than levels, our use of average hours
worked to generate hourly wages should not introduce bias into our results, particularly for wages levels in the
middle of the distribution (i.e. median and average). Bick et al. (2016) present a more detailed breakdown of
the decline of hours across high income countries.
Table 1: Household Survey Microdata Sources
Source: Luxembourg Income Study
Country Survey(s) Used by LIS
CanadaSurvey of Consumer Finance (1987, 1991, 1994, 1997), Survey of Labour and
Income Dynamics (1998, 2000, 2004, 2007, 2010)
Denmark Law Model (1987, 1992, 1995, 2000, 2004, 2007, 2010)
FinlandIncome Distribution Survey (1987, 1991, 1995, 2000, 2004), Survey on
Income and Living Conditions (2007, 2010, 2013)
France Family Budget Survey (1984, 1989, 1994, 2000, 2005, 2010)
Germany German Social Economic Panel Study (1994, 2000, 2004, 2007, 2010)
IrelandLiving in Ireland Survey (1994, 1995, 1996, 2000), Survey on Income and
Living Conditions (2004, 2007, 2010)
Netherlands
Additional Enquiry on the Use of (Public) Services (1983, 1987, 1990), Socio-
Economic Panel Survey (1993, 1999), Survey on Income and Living
Conditions (2004, 2007, 2010)
NorwayIncome Distribution Survey (1986, 1991, 1995, 2000, 2004), Household
Income Statistics (2007, 2010)
Spain
Family Expenditure Survey (1980, 1990), Spanish European Community
Household Panel (1995, 2000), Survey on Income and Living Conditions
(2004, 2007, 2010, 2013)
United KingdomFamily Expenditure Survey (1986, 1991, 1995), Family Resources Survey
(1994, 1999, 2004, 2007, 2010, 2013)
United States
Current Population Survey – March Supplement (1986, 1991, 1994, 1997,
2000), Current Population Survey – Annual Social and Economic Supplement
(2004, 2007, 2010, 2013)
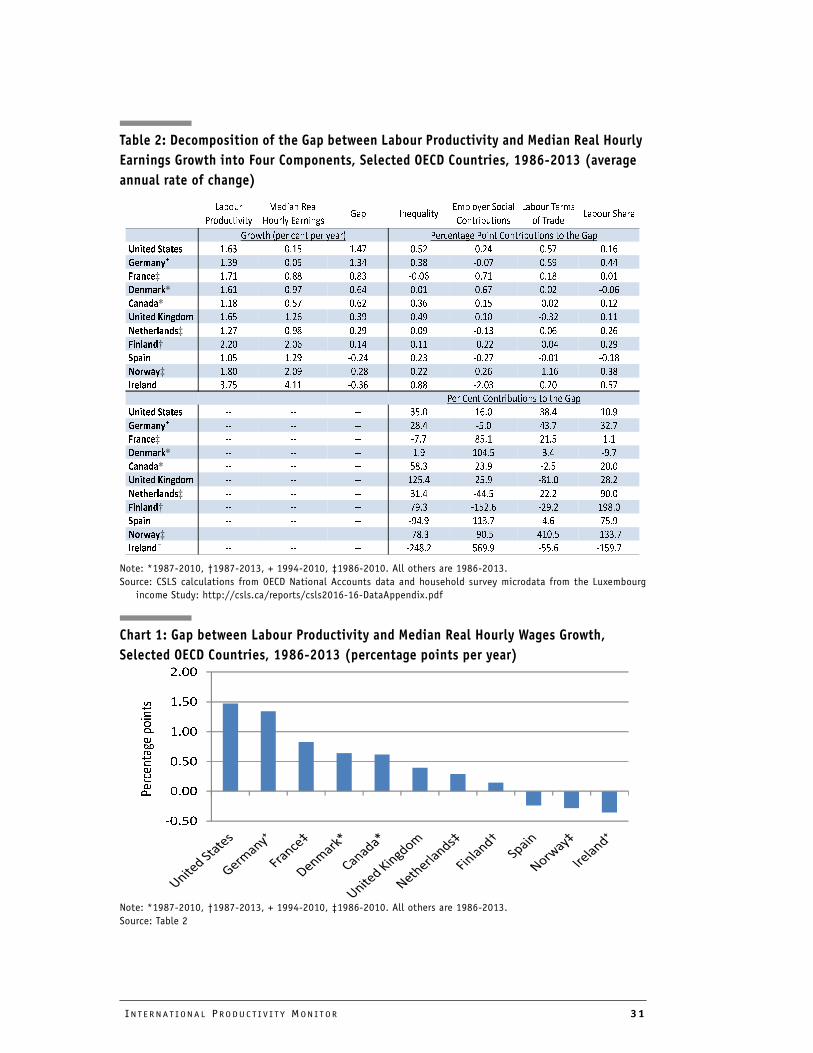
INT E R N A T I ON A L PRO DU C T I V I T Y MON I T OR 31
�����
����
����
����
����
����
�
�
�
�
�
�
�
�
�
�
�
�
�
�
Table 2: Decomposition of the Gap between Labour Productivity and Median Real Hourly
Earnings Growth into Four Components, Selected OECD Countries, 1986-2013 (average
annual rate of change)
Note: *1987-2010, †1987-2013, + 1994-2010, ‡1986-2010. All others are 1986-2013.
Source: CSLS calculations from OECD National Accounts data and household survey microdata from the Luxembourg
income Study: http://csls.ca/reports/csls2016-16-DataAppendix.pdf
�������
������ ���
�����������
���������������
��� ����������
���������������
�������������
�������������
� �����
��������!���
���"�!�#����������������$ ����������������������������������!�����
����������� %&'( )&%* %&+, )&*- )&-+ )&*, )&%'
��� ��� %&(. )&)* %&(+ )&(/ 0)&), )&*. )&++
�����‡ %&,% )&// )&/( 0)&)' )&,% )&%/ )&)%
��� ��* %&'% )&., )&'+ )&)% )&', )&)- 0)&)'
���* %&%/ )&*, )&'- )&(' )&%* 0)&)- )&%-
������������� %&'* %&-' )&(. )&+. )&%) 0)&(- )&%%
���������‡ %&-, )&./ )&-. )&). 0)&%( )&)' )&-'
������† -&-) -&)' )&%+ )&%% 0)&-- 0)&)+ )&-.
���� %&)* %&-. 0)&-+ )&-( 0)&-, 0)&)% 0)&%/
�����‡ %&/) -&). 0)&-/ )&-- )&-' 0%&%' )&(/
������� (&,* +&%% 0)&(' )&// 0-&)( )&-) )&*,
���������������������������!�����
����������� 00 00 00 (*&) %'&) (/&+ %)&.
��� ��� 00 00 00 -/&+ 0*&) +(&, (-&,
�����‡ 00 00 00 0,&, /*&% -%&* %&%
��� ��* 00 00 00 %&. %)+&* (&+ 0.&,
���* 00 00 00 */&( -(&. 0-&* -)&)
������������� 00 00 00 %-*&+ -*&. 0/%&) -/&-
���������‡ 00 00 00 (%&+ 0++&* --&- .)&)
������† 00 00 00 ,.&( 0%*-&' 0-.&- %./&)
���� 00 00 00 0.+&. %%(&, +&' ,*&.
�����‡ 00 00 00 0,/&( 0.)&* +%)&* 0%((&,
������� 00 00 00 0-+/&- *'.&. 0**&' 0%*.&,
Chart 1: Gap between Labour Productivity and Median Real Hourly Wages Growth,
Selected OECD Countries, 1986-2013 (percentage points per year)
Note: *1987-2010, †1987-2013, + 1994-2010, ‡1986-2010. All others are 1986-2013.
Source: Table 2
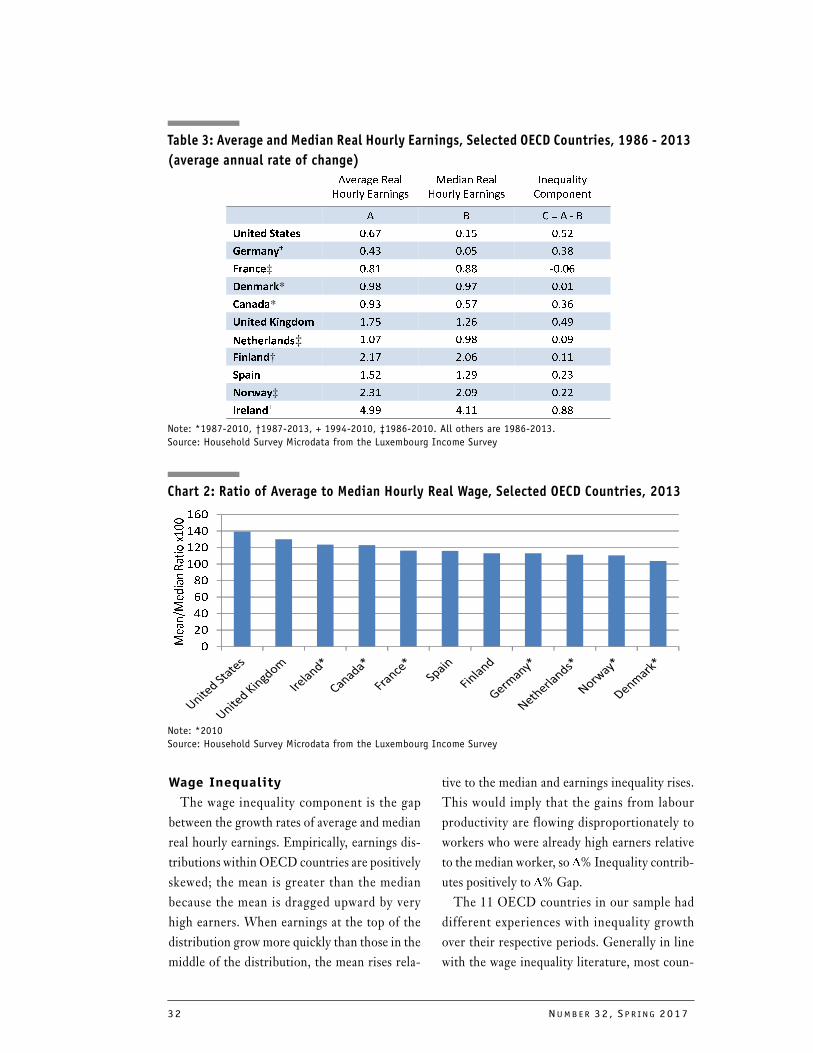
32 NUMB E R 32 , S P R I NG 2017
������������
��� ���������
�����������
��� ���������
�������� �
���������
� � ������� �
����������� ��� ��!" ��"#
��� ��� ��$% ���" ��%&
�����‡ ��&! ��&& �����
��� ��* ��'& ��' ���!
���* ��'% ��" ��%�
������������� !� " !�#� ��$'
���������‡ !�� ��'& ���'
������† #�! #��� ��!!
���� !�"# !�#' ��#%
�����‡ #�%! #��' ��##
������� $�'' $�!! ��&&
Table 3: Average and Median Real Hourly Earnings, Selected OECD Countries, 1986 - 2013
(average annual rate of change)
Note: *1987-2010, †1987-2013, + 1994-2010, ‡1986-2010. All others are 1986-2013.
Source: Household Survey Microdata from the Luxembourg Income Survey
�
��
��
��
��
���
���
���
���
�
�
�
�
�
�
�
�
�
�
�
�
�
�
�
�
�
�
�
Wage Inequality
The wage inequality component is the gap
between the growth rates of average and median
real hourly earnings. Empirically, earnings dis-
tributions within OECD countries are positively
skewed; the mean is greater than the median
because the mean is dragged upward by very
high earners. When earnings at the top of the
distribution grow more quickly than those in the
middle of the distribution, the mean rises rela-
tive to the median and earnings inequality rises.
This would imply that the gains from labour
productivity are flowing disproportionately to
workers who were already high earners relative
to the median worker, so ∆% Inequality contrib-
utes positively to ∆% Gap.
The 11 OECD countries in our sample had
different experiences with inequality growth
over their respective periods. Generally in line
with the wage inequality literature, most coun-
Chart 2: Ratio of Average to Median Hourly Real Wage, Selected OECD Countries, 2013
Note: *2010
Source: Household Survey Microdata from the Luxembourg Income Survey
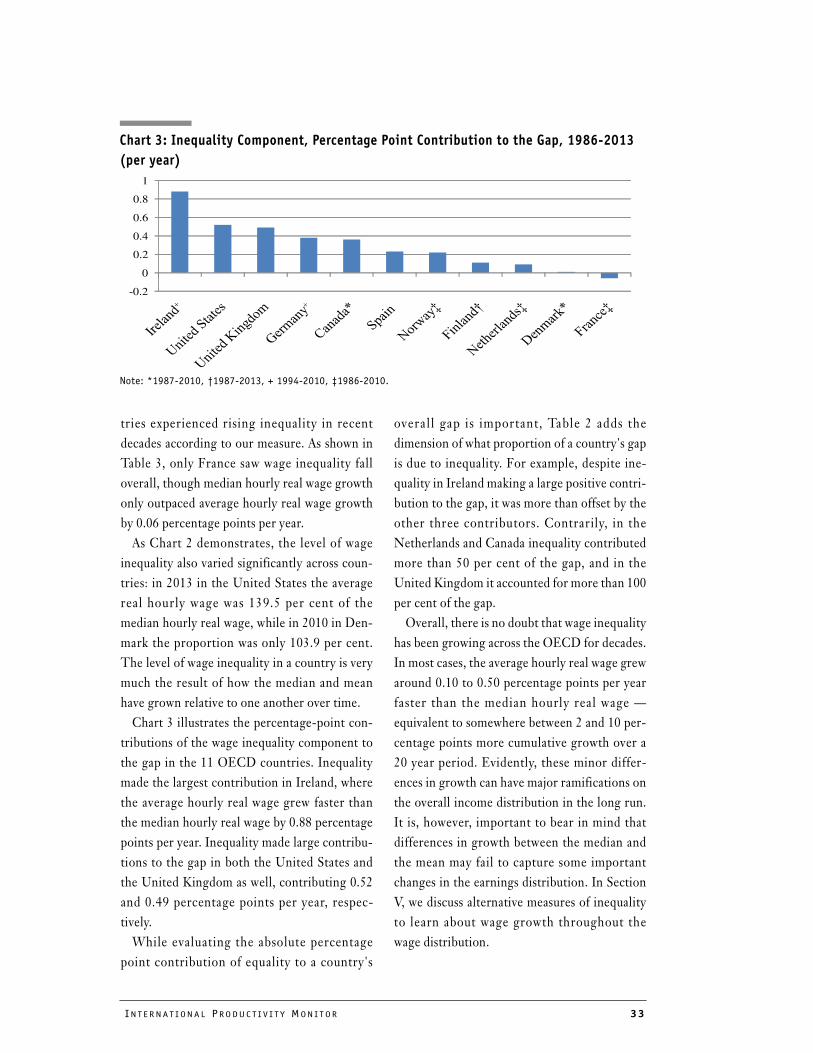
INT E R N A T I ON A L PRO DU C T I V I T Y MON I T OR 33
-0.2
0
0.2
0.4
0.6
0.8
1
Chart 3: Inequality Component, Percentage Point Contribution to the Gap, 1986-2013
(per year)
Note: *1987-2010, †1987-2013, + 1994-2010, ‡1986-2010.
tries experienced rising inequality in recent
decades according to our measure. As shown in
Table 3, only France saw wage inequality fall
overall, though median hourly real wage growth
only outpaced average hourly real wage growth
by 0.06 percentage points per year.
As Chart 2 demonstrates, the level of wage
inequality also varied significantly across coun-
tries: in 2013 in the United States the average
real hourly wage was 139.5 per cent of the
median hourly real wage, while in 2010 in Den-
mark the proportion was only 103.9 per cent.
The level of wage inequality in a country is very
much the result of how the median and mean
have grown relative to one another over time.
Chart 3 illustrates the percentage-point con-
tributions of the wage inequality component to
the gap in the 11 OECD countries. Inequality
made the largest contribution in Ireland, where
the average hourly real wage grew faster than
the median hourly real wage by 0.88 percentage
points per year. Inequality made large contribu-
tions to the gap in both the United States and
the United Kingdom as well, contributing 0.52
and 0.49 percentage points per year, respec-
tively.
While evaluating the absolute percentage
point contribution of equality to a country's
overall gap is important, Table 2 adds the
dimension of what proportion of a country's gap
is due to inequality. For example, despite ine-
quality in Ireland making a large positive contri-
bution to the gap, it was more than offset by the
other three contributors. Contrarily, in the
Netherlands and Canada inequality contributed
more than 50 per cent of the gap, and in the
United Kingdom it accounted for more than 100
per cent of the gap.
Overall, there is no doubt that wage inequality
has been growing across the OECD for decades.
In most cases, the average hourly real wage grew
around 0.10 to 0.50 percentage points per year
faster than the median hourly real wage —
equivalent to somewhere between 2 and 10 per-
centage points more cumulative growth over a
20 year period. Evidently, these minor differ-
ences in growth can have major ramifications on
the overall income distribution in the long run.
It is, however, important to bear in mind that
differences in growth between the median and
the mean may fail to capture some important
changes in the earnings distribution. In Section
V, we discuss alternative measures of inequality
to learn about wage growth throughout the
wage distribution.
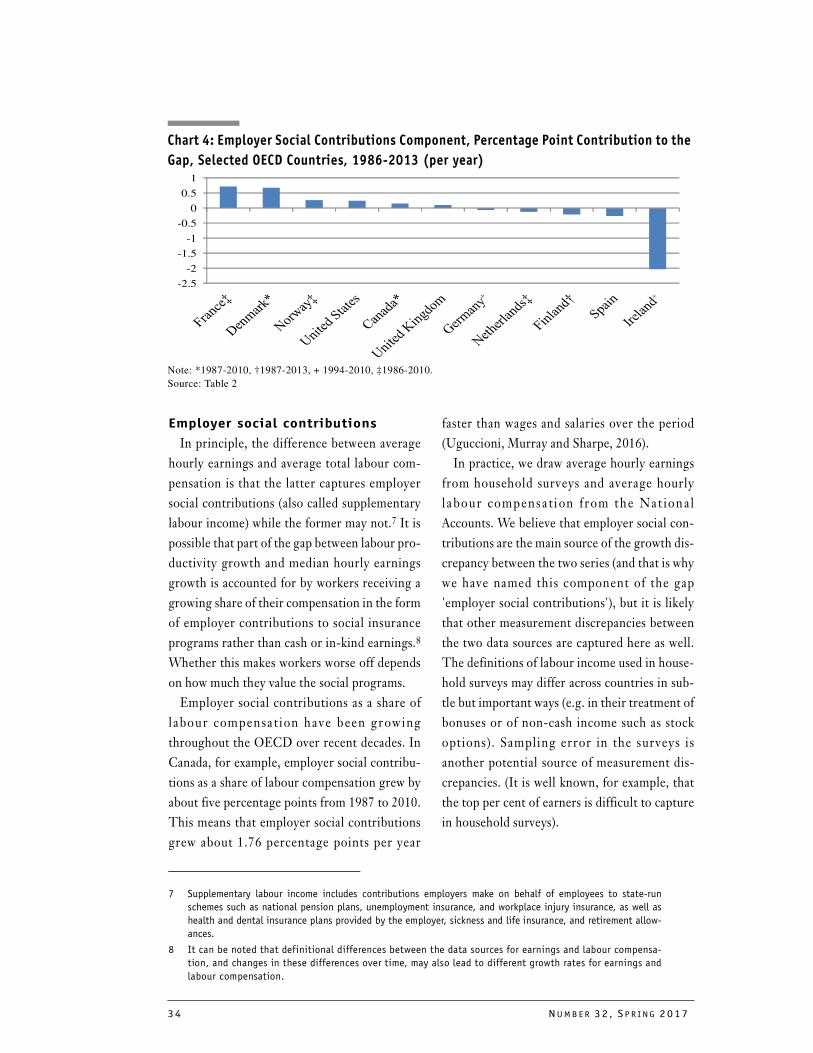
34 NUMB E R 32 , S P R I NG 2017
-2.5
-2
-1.5
-1
-0.5
0
0.5
1
Employer social contributions
In principle, the difference between average
hourly earnings and average total labour com-
pensation is that the latter captures employer
social contributions (also called supplementary
labour income) while the former may not.7 It is
possible that part of the gap between labour pro-
ductivity growth and median hourly earnings
growth is accounted for by workers receiving a
growing share of their compensation in the form
of employer contributions to social insurance
programs rather than cash or in-kind earnings.8
Whether this makes workers worse off depends
on how much they value the social programs.
Employer social contributions as a share of
labour compensat ion have been growing
throughout the OECD over recent decades. In
Canada, for example, employer social contribu-
tions as a share of labour compensation grew by
about five percentage points from 1987 to 2010.
This means that employer social contributions
grew about 1.76 percentage points per year
faster than wages and salaries over the period
(Uguccioni, Murray and Sharpe, 2016).
In practice, we draw average hourly earnings
from household surveys and average hourly
labour compensat ion f rom the Nat ional
Accounts. We believe that employer social con-
tributions are the main source of the growth dis-
crepancy between the two series (and that is why
we have named this component of the gap
'employer social contributions'), but it is likely
that other measurement discrepancies between
the two data sources are captured here as well.
The definitions of labour income used in house-
hold surveys may differ across countries in sub-
tle but important ways (e.g. in their treatment of
bonuses or of non-cash income such as stock
options). Sampling error in the surveys is
another potential source of measurement dis-
crepancies. (It is well known, for example, that
the top per cent of earners is difficult to capture
in household surveys).
7 Supplementary labour income includes contributions employers make on behalf of employees to state-run
schemes such as national pension plans, unemployment insurance, and workplace injury insurance, as well as
health and dental insurance plans provided by the employer, sickness and life insurance, and retirement allow-
ances.
8 It can be noted that definitional differences between the data sources for earnings and labour compensa-
tion, and changes in these differences over time, may also lead to different growth rates for earnings and
labour compensation.
Chart 4: Employer Social Contributions Component, Percentage Point Contribution to the
Gap, Selected OECD Countries, 1986-2013 (per year)
Note: *1987-2010, †1987-2013, + 1994-2010, ‡1986-2010.
Source: Table 2
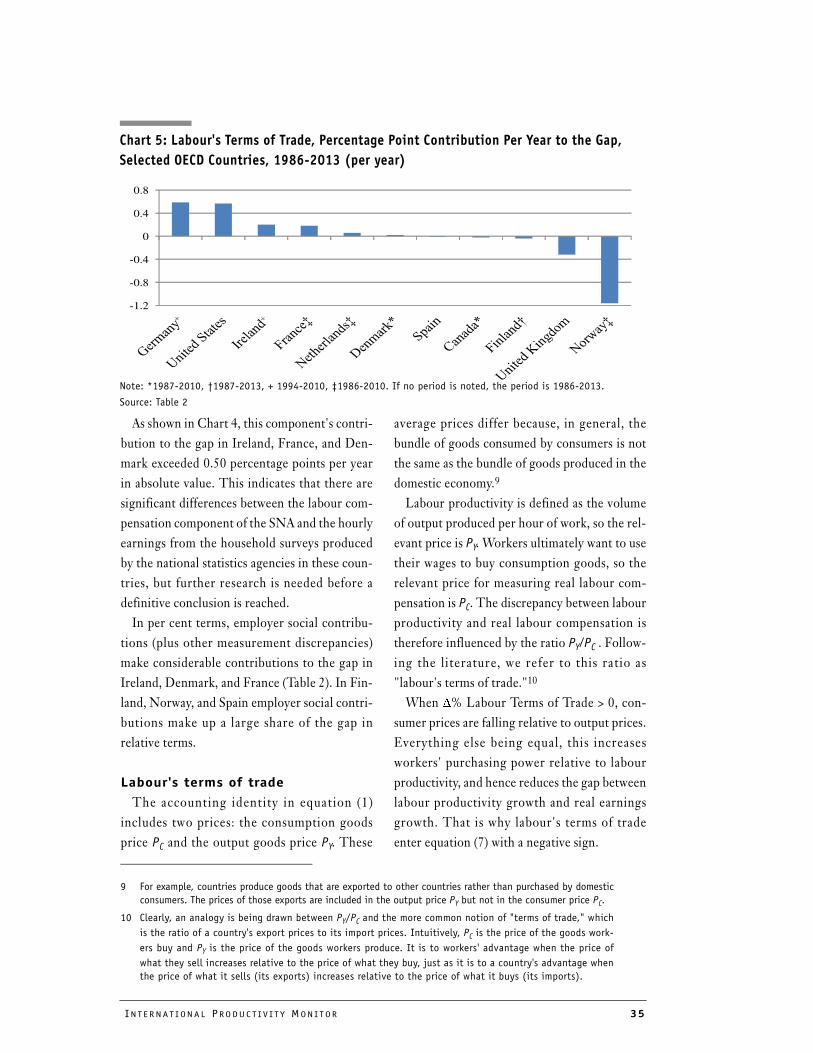
INT E R N A T I ON A L PRO DU C T I V I T Y MON I T OR 35
-1.2
-0.8
-0.4
0
0.4
0.8
As shown in Chart 4, this component's contri-
bution to the gap in Ireland, France, and Den-
mark exceeded 0.50 percentage points per year
in absolute value. This indicates that there are
significant differences between the labour com-
pensation component of the SNA and the hourly
earnings from the household surveys produced
by the national statistics agencies in these coun-
tries, but further research is needed before a
definitive conclusion is reached.
In per cent terms, employer social contribu-
tions (plus other measurement discrepancies)
make considerable contributions to the gap in
Ireland, Denmark, and France (Table 2). In Fin-
land, Norway, and Spain employer social contri-
butions make up a large share of the gap in
relative terms.
Labour's terms of trade
The accounting identity in equation (1)
includes two prices: the consumption goods
price PC and the output goods price PY. These
average prices differ because, in general, the
bundle of goods consumed by consumers is not
the same as the bundle of goods produced in the
domestic economy.9
Labour productivity is defined as the volume
of output produced per hour of work, so the rel-
evant price is PY. Workers ultimately want to use
their wages to buy consumption goods, so the
relevant price for measuring real labour com-
pensation is PC. The discrepancy between labour
productivity and real labour compensation is
therefore influenced by the ratio PY/PC . Follow-
ing the literature, we refer to this ratio as
"labour's terms of trade."10
When ∆% Labour Terms of Trade > 0, con-
sumer prices are falling relative to output prices.
Everything else being equal, this increases
workers' purchasing power relative to labour
productivity, and hence reduces the gap between
labour productivity growth and real earnings
growth. That is why labour's terms of trade
enter equation (7) with a negative sign.
9 For example, countries produce goods that are exported to other countries rather than purchased by domestic
consumers. The prices of those exports are included in the output price PY but not in the consumer price PC.
10 Clearly, an analogy is being drawn between PY/PC and the more common notion of "terms of trade," which
is the ratio of a country's export prices to its import prices. Intuitively, PC is the price of the goods work-
ers buy and PY is the price of the goods workers produce. It is to workers' advantage when the price of
what they sell increases relative to the price of what they buy, just as it is to a country's advantage when
the price of what it sells (its exports) increases relative to the price of what it buys (its imports).
Chart 5: Labour's Terms of Trade, Percentage Point Contribution Per Year to the Gap,
Selected OECD Countries, 1986-2013 (per year)
Note: *1987-2010, †1987-2013, + 1994-2010, ‡1986-2010. If no period is noted, the period is 1986-2013.
Source: Table 2
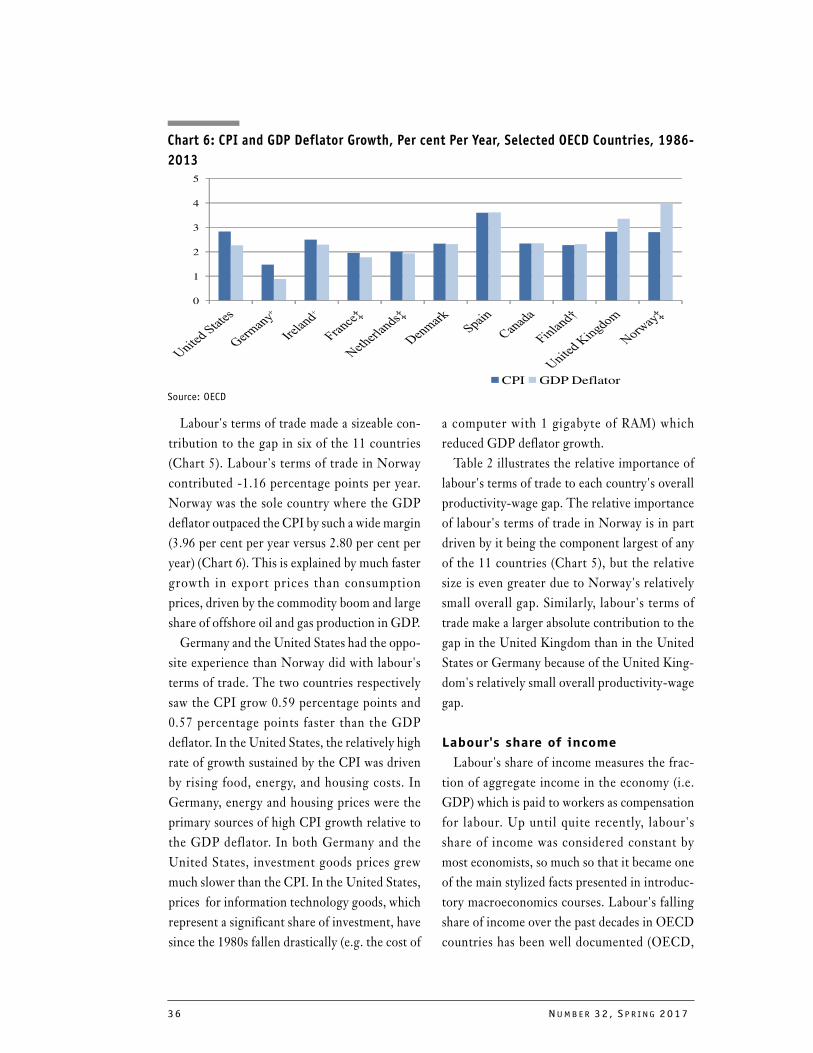
36 NUMB E R 32 , S P R I NG 2017
0
1
2
3
4
5
CPI GDP Deflator
Labour's terms of trade made a sizeable con-
tribution to the gap in six of the 11 countries
(Chart 5). Labour's terms of trade in Norway
contributed -1.16 percentage points per year.
Norway was the sole country where the GDP
deflator outpaced the CPI by such a wide margin
(3.96 per cent per year versus 2.80 per cent per
year) (Chart 6). This is explained by much faster
growth in export prices than consumption
prices, driven by the commodity boom and large
share of offshore oil and gas production in GDP.
Germany and the United States had the oppo-
site experience than Norway did with labour's
terms of trade. The two countries respectively
saw the CPI grow 0.59 percentage points and
0.57 percentage points faster than the GDP
deflator. In the United States, the relatively high
rate of growth sustained by the CPI was driven
by rising food, energy, and housing costs. In
Germany, energy and housing prices were the
primary sources of high CPI growth relative to
the GDP deflator. In both Germany and the
United States, investment goods prices grew
much slower than the CPI. In the United States,
prices for information technology goods, which
represent a significant share of investment, have
since the 1980s fallen drastically (e.g. the cost of
a computer with 1 gigabyte of RAM) which
reduced GDP deflator growth.
Table 2 illustrates the relative importance of
labour's terms of trade to each country's overall
productivity-wage gap. The relative importance
of labour's terms of trade in Norway is in part
driven by it being the component largest of any
of the 11 countries (Chart 5), but the relative
size is even greater due to Norway's relatively
small overall gap. Similarly, labour's terms of
trade make a larger absolute contribution to the
gap in the United Kingdom than in the United
States or Germany because of the United King-
dom's relatively small overall productivity-wage
gap.
Labour's share of income
Labour's share of income measures the frac-
tion of aggregate income in the economy (i.e.
GDP) which is paid to workers as compensation
for labour. Up until quite recently, labour's
share of income was considered constant by
most economists, so much so that it became one
of the main stylized facts presented in introduc-
tory macroeconomics courses. Labour's falling
share of income over the past decades in OECD
countries has been well documented (OECD,
Chart 6: CPI and GDP Deflator Growth, Per cent Per Year, Selected OECD Countries, 1986-
2013
Source: OECD
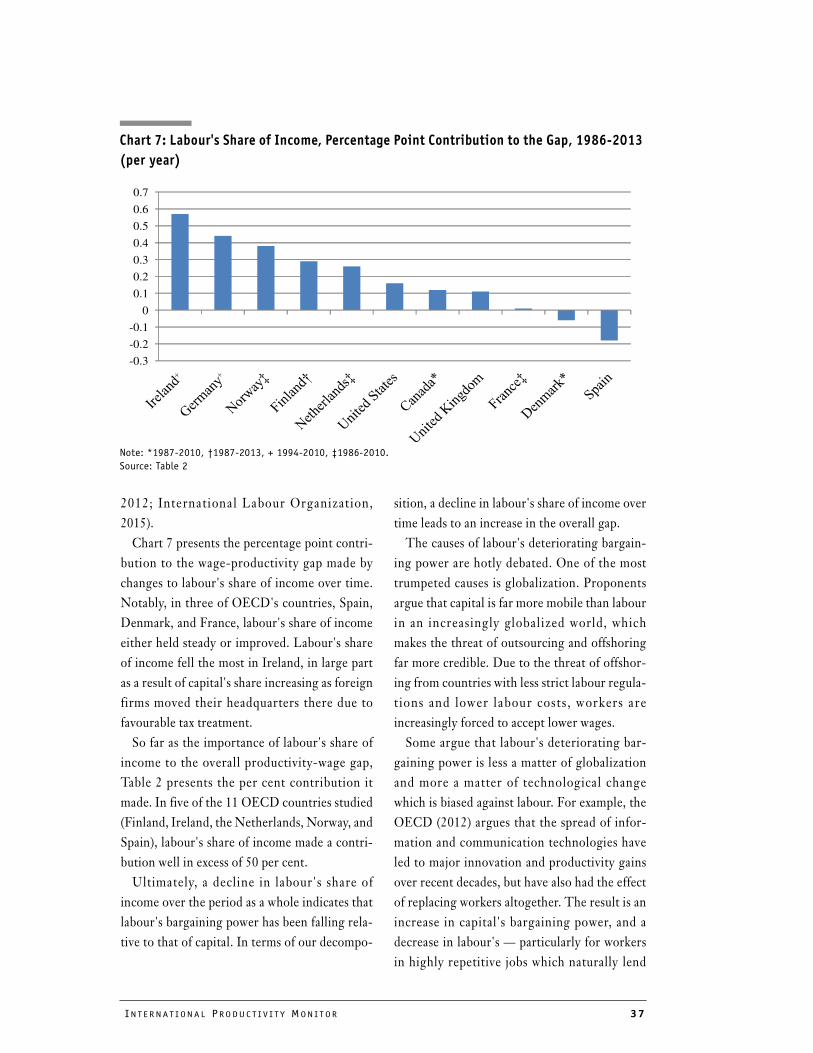
INT E R N A T I ON A L PRO DU C T I V I T Y MON I T OR 37
-0.3
-0.2
-0.1
0
0.1
0.2
0.3
0.4
0.5
0.6
0.7
Chart 7: Labour's Share of Income, Percentage Point Contribution to the Gap, 1986-2013
(per year)
Note: *1987-2010, †1987-2013, + 1994-2010, ‡1986-2010.
Source: Table 2
2012; International Labour Organization,
2015).
Chart 7 presents the percentage point contri-
bution to the wage-productivity gap made by
changes to labour's share of income over time.
Notably, in three of OECD's countries, Spain,
Denmark, and France, labour's share of income
either held steady or improved. Labour's share
of income fell the most in Ireland, in large part
as a result of capital's share increasing as foreign
firms moved their headquarters there due to
favourable tax treatment.
So far as the importance of labour's share of
income to the overall productivity-wage gap,
Table 2 presents the per cent contribution it
made. In five of the 11 OECD countries studied
(Finland, Ireland, the Netherlands, Norway, and
Spain), labour's share of income made a contri-
bution well in excess of 50 per cent.
Ultimately, a decline in labour's share of
income over the period as a whole indicates that
labour's bargaining power has been falling rela-
tive to that of capital. In terms of our decompo-
sition, a decline in labour's share of income over
time leads to an increase in the overall gap.
The causes of labour's deteriorating bargain-
ing power are hotly debated. One of the most
trumpeted causes is globalization. Proponents
argue that capital is far more mobile than labour
in an increasingly globalized world, which
makes the threat of outsourcing and offshoring
far more credible. Due to the threat of offshor-
ing from countries with less strict labour regula-
tions and lower labour costs , workers are
increasingly forced to accept lower wages.
Some argue that labour's deteriorating bar-
gaining power is less a matter of globalization
and more a matter of technological change
which is biased against labour. For example, the
OECD (2012) argues that the spread of infor-
mation and communication technologies have
led to major innovation and productivity gains
over recent decades, but have also had the effect
of replacing workers altogether. The result is an
increase in capital's bargaining power, and a
decrease in labour's — particularly for workers
in highly repetitive jobs which naturally lend
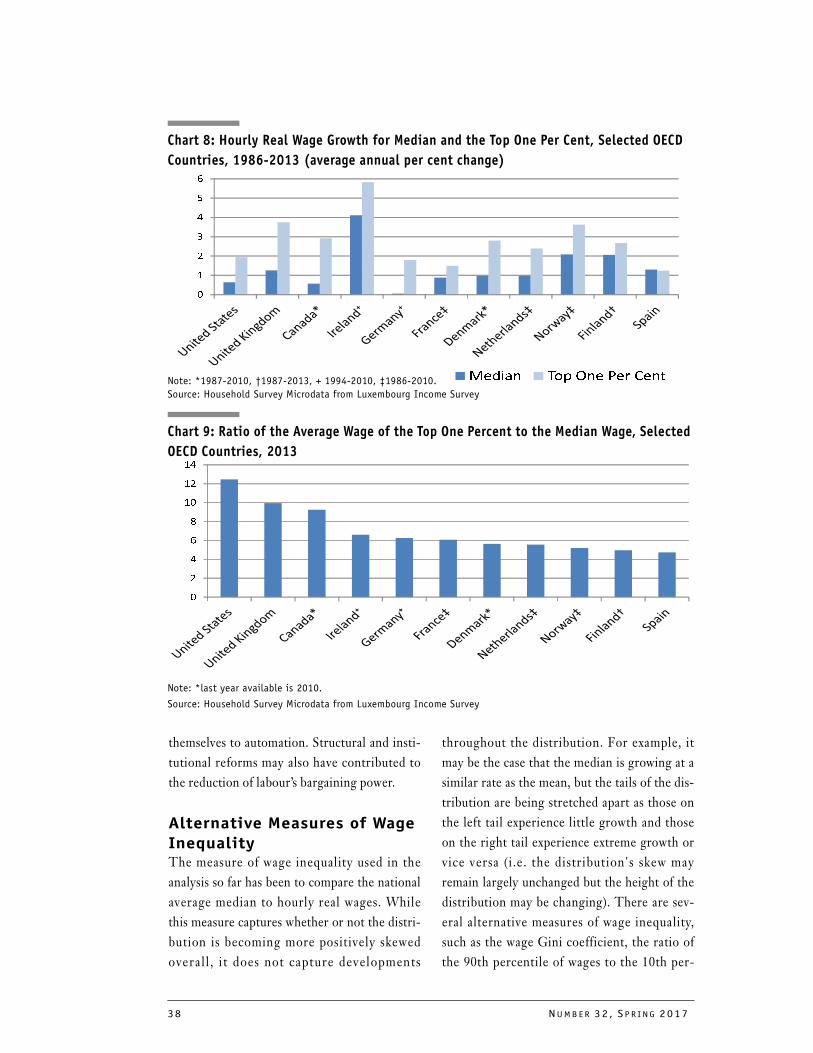
38 NUMB E R 32 , S P R I NG 2017
�
�
�
�
�
�
�
������ ������� ����
Chart 8: Hourly Real Wage Growth for Median and the Top One Per Cent, Selected OECD
Countries, 1986-2013 (average annual per cent change)
Note: *1987-2010, †1987-2013, + 1994-2010, ‡1986-2010.
Source: Household Survey Microdata from Luxembourg Income Survey
�
�
�
�
�
��
��
��
themselves to automation. Structural and insti-
tutional reforms may also have contributed to
the reduction of labour’s bargaining power.
Alternative Measures of Wage InequalityThe measure of wage inequality used in the
analysis so far has been to compare the national
average median to hourly real wages. While
this measure captures whether or not the distri-
bution is becoming more positively skewed
overall , i t does not capture developments
throughout the distribution. For example, it
may be the case that the median is growing at a
similar rate as the mean, but the tails of the dis-
tribution are being stretched apart as those on
the left tail experience little growth and those
on the right tail experience extreme growth or
vice versa (i.e. the distribution's skew may
remain largely unchanged but the height of the
distribution may be changing). There are sev-
eral alternative measures of wage inequality,
such as the wage Gini coefficient, the ratio of
the 90th percentile of wages to the 10th per-
Chart 9: Ratio of the Average Wage of the Top One Percent to the Median Wage, Selected
OECD Countries, 2013
Note: *last year available is 2010.
Source: Household Survey Microdata from Luxembourg Income Survey
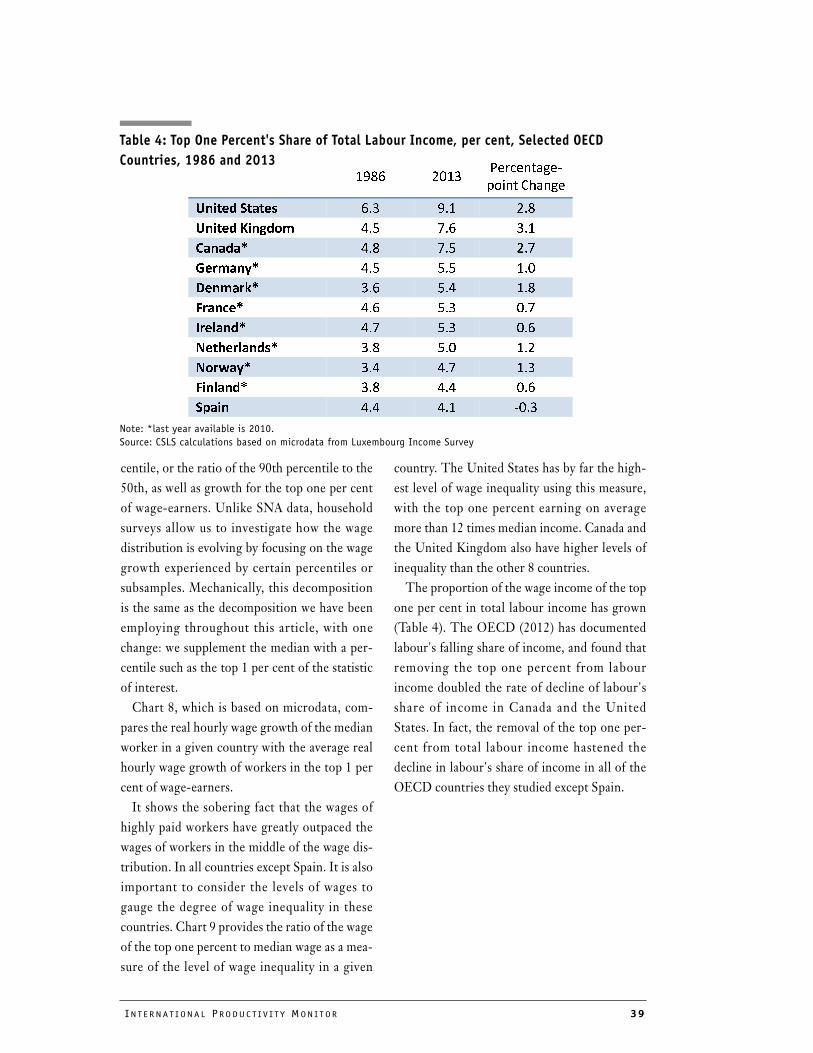
INT E R N A T I ON A L PRO DU C T I V I T Y MON I T OR 39
centile, or the ratio of the 90th percentile to the
50th, as well as growth for the top one per cent
of wage-earners. Unlike SNA data, household
surveys allow us to investigate how the wage
distribution is evolving by focusing on the wage
growth experienced by certain percentiles or
subsamples. Mechanically, this decomposition
is the same as the decomposition we have been
employing throughout this article, with one
change: we supplement the median with a per-
centile such as the top 1 per cent of the statistic
of interest.
Chart 8, which is based on microdata, com-
pares the real hourly wage growth of the median
worker in a given country with the average real
hourly wage growth of workers in the top 1 per
cent of wage-earners.
It shows the sobering fact that the wages of
highly paid workers have greatly outpaced the
wages of workers in the middle of the wage dis-
tribution. In all countries except Spain. It is also
important to consider the levels of wages to
gauge the degree of wage inequality in these
countries. Chart 9 provides the ratio of the wage
of the top one percent to median wage as a mea-
sure of the level of wage inequality in a given
country. The United States has by far the high-
est level of wage inequality using this measure,
with the top one percent earning on average
more than 12 times median income. Canada and
the United Kingdom also have higher levels of
inequality than the other 8 countries.
The proportion of the wage income of the top
one per cent in total labour income has grown
(Table 4). The OECD (2012) has documented
labour's falling share of income, and found that
removing the top one percent from labour
income doubled the rate of decline of labour's
share of income in Canada and the United
States. In fact, the removal of the top one per-
cent from total labour income hastened the
decline in labour's share of income in all of the
OECD countries they studied except Spain.
���� ����
��� ���
���� ������
����������� ��� ��� ���
������������ � ��� ��� ���
���� ��� ��� ���
������� ��� ��� ���
������� ��� ��� ���
������ ��� ��� ���
������� ��� ��� ���
���������� ��� ��� ���
� ���� ��� ��� ���
������� ��� ��� ���
���� ��� ��� ����
Table 4: Top One Percent's Share of Total Labour Income, per cent, Selected OECD
Countries, 1986 and 2013
Note: *last year available is 2010.
Source: CSLS calculations based on microdata from Luxembourg Income Survey
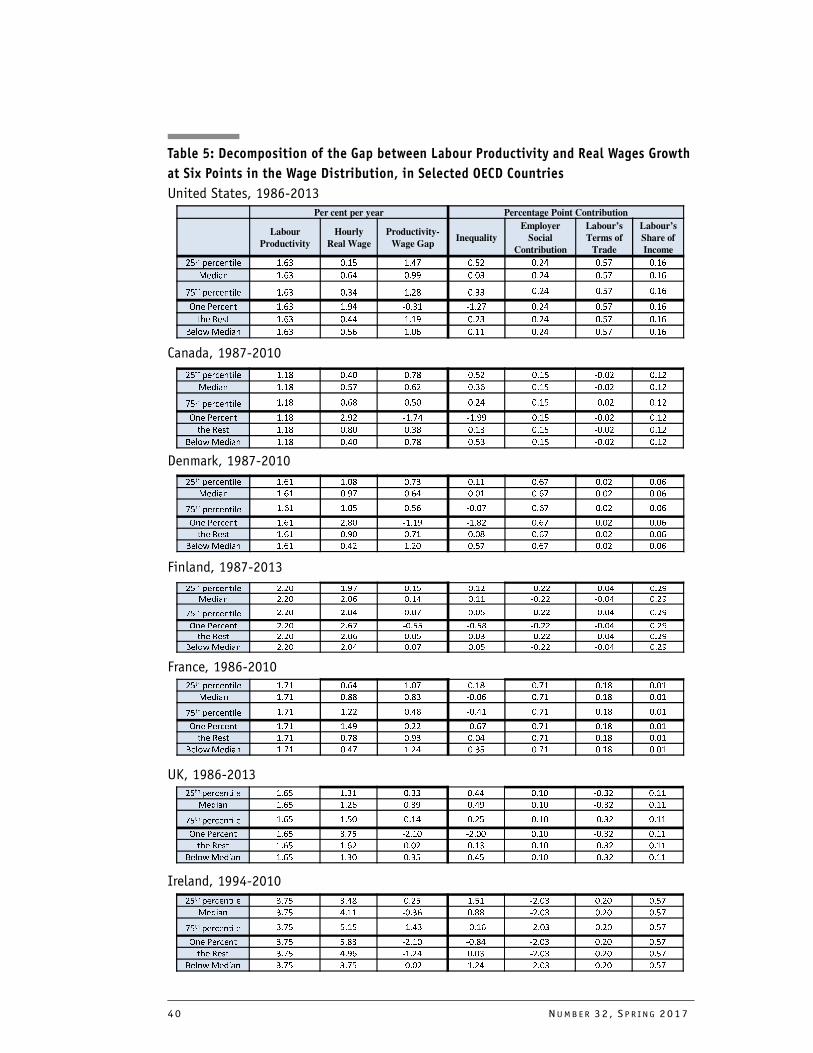
40 NUMB E R 32 , S P R I NG 2017
��
��
�������� �� � ���� ���� ���� ����� ���� ���
����� �� � ���� ����� ���� ����� ���� ���
�
��
��������
�� � ���� ����� ����� ����� ���� ���
����������� �� � ���� ����� ����� ����� ���� ���
�������� �� � ���� ����� ���� ����� ���� ���
��� ������ �� � �� � ����� ���� ����� ���� ���
��
��
�������� �� � ���� ���� ���� ���� ����� ����
����� �� � ��� ���� ���� ���� ����� ����
��
��
��������
�� � ���� ���� ���� ���� ����� ����
����������� �� � ���� ����� ����� ���� ����� ����
�������� �� � �� � ���� ���� ���� ����� ����
���������� �� � ���� ���� ���� ���� ����� ����
��
��
�������� �� � ���� ��� ���� �� � ���� ����
����� �� � ���� ���� ����� �� � ���� ����
�
��
��������
�� � ���� ���� ����� �� � ���� ����
����������� �� � ���� ���� ���� �� � ���� ����
�������� �� � �� � ���� ���� �� � ���� ����
��� ������ �� � ��� ���� ���� �� � ���� ����
��
��
�������� ���� ��� �� � �� � ����� ����� ����
����� ���� ���� �� � �� ����� ����� ����
��
��
��������
���� ���� ���� ���� ����� ����� ����
����������� ���� ���� ����� ����� ����� ����� ����
�������� ���� ���� ���� ���� ����� ����� ����
��� ������ ���� ���� ���� ���� ����� ����� ����
��
��
�������� �� � ��� ���� ���� �� � ���� ���
����� �� � ���� �� � ���� �� � ���� ���
��
��
��������
�� � ���� ��� ����� �� � ���� ���
����������� �� � �� � ����� ��� � �� � ���� ���
�������� �� � ���� ���� ��� �� � ���� ���
���������� �� � ���� ���� ���� �� � ���� ���
��
��
�������� ��� ���� ��� ���� ���� ����� ����
����� ��� ���� ���� ���� ���� ����� ����
��
��
��������
��� ��� ���� ���� ���� ����� ����
����������� ��� ���� ����� ����� ���� ����� ����
�������� ��� �� � ��� ���� ���� ����� ����
��� ������ ��� ���� ��� ���� ���� ����� ����
Per cent per year Percentage Point Contribution
Labour
Productivity
Hourly
Real Wage
Productivity-
Wage GapInequality
Employer
Social
Contribution
Labour’s
Terms of
Trade
Labour’s
Share of
Income
��
��
�������� �� �� ����� ����� ����� ����� ����� ��� �
����� �� � �� � ���� ���� ����� ����� ��� �
��
��
�������� �� � ���� ���� ����
����� ����� ��� �
����������� �� � ���� ����� ����� ����� ����� ��� �
�������� �� � ���� ���� ���� ����� ����� ��� �
��� ������ �� � ��� ��� ���� ����� ����� ��� �
Table 5: Decomposition of the Gap between Labour Productivity and Real Wages Growth
at Six Points in the Wage Distribution, in Selected OECD Countries
United States, 1986-2013
Canada, 1987-2010
Denmark, 1987-2010
Finland, 1987-2013
France, 1986-2010
UK, 1986-2013
Ireland, 1994-2010
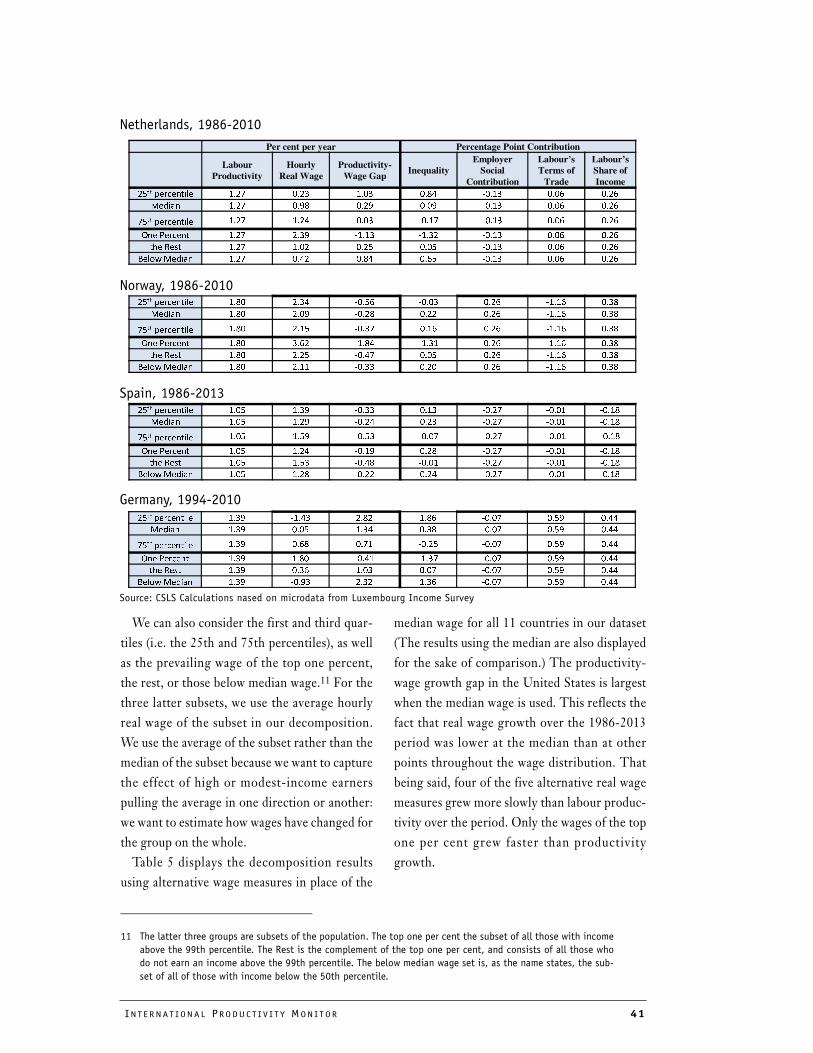
INT E R N A T I ON A L PRO DU C T I V I T Y MON I T OR 41
��
��
�������� �� � ���� ���� ���� ����� ���� ����
����� �� � ���� �� � �� � ����� ���� ����
��
��
��������
�� � ���� ���� ����� ����� ���� ����
����������� �� � ���� ����� ��� � ����� ���� ����
�������� �� � �� � ��� ���� ����� ���� ����
��� ������ �� � ���� �� � �� � ����� ���� ����
��
��
�������� ���� ���� ����� ���� ����� ����� ����
����� ���� ���� ����� ���� ����� ����� ����
��
��
��������
���� ���� ����� ����� ����� ����� ����
����������� ���� ���� ����� ��� ����� ����� ����
�������� ���� ���� ���� ����� ����� ����� ����
���������� ���� ��� ����� ���� ����� ����� ����
��
��
�������� �� � ���� ����� ����� ���� ����� ���
����� �� � ���� ���� ���� ���� ����� ���
��
��
��������
�� � ���� ����� ���� ���� ����� ���
����������� �� � ���� ��� � ����� ���� ����� ���
�������� �� � ���� ����� ���� ���� ����� ���
��� ������ �� � ���� ����� ���� ���� ����� ���
Per cent per year Percentage Point Contribution
Labour
Productivity
Hourly
Real Wage
Productivity-
Wage GapInequality
Employer
Social
Contribution
Labour’s
Terms of
Trade
Labour’s
Share of
Income
��
��
�������� ��� ���� ���� ���� ����� ���� ����
����� ��� ���� ���� ���� ����� ���� ����
�
��
��������
��� ���� ���� ���� ����� ���� ����
����������� ��� ���� ����� ����� ����� ���� ����
�������� ��� ���� ���� ���� ����� ���� ����
��� ������ ��� ���� ���� ���� ����� ���� ����
Netherlands, 1986-2010
Norway, 1986-2010
Spain, 1986-2013
Germany, 1994-2010
Source: CSLS Calculations nased on microdata from Luxembourg Income Survey
We can also consider the first and third quar-
tiles (i.e. the 25th and 75th percentiles), as well
as the prevailing wage of the top one percent,
the rest, or those below median wage.11 For the
three latter subsets, we use the average hourly
real wage of the subset in our decomposition.
We use the average of the subset rather than the
median of the subset because we want to capture
the effect of high or modest-income earners
pulling the average in one direction or another:
we want to estimate how wages have changed for
the group on the whole.
Table 5 displays the decomposition results
using alternative wage measures in place of the
median wage for all 11 countries in our dataset
(The results using the median are also displayed
for the sake of comparison.) The productivity-
wage growth gap in the United States is largest
when the median wage is used. This reflects the
fact that real wage growth over the 1986-2013
period was lower at the median than at other
points throughout the wage distribution. That
being said, four of the five alternative real wage
measures grew more slowly than labour produc-
tivity over the period. Only the wages of the top
one per cent grew faster than productivity
growth.
11 The latter three groups are subsets of the population. The top one per cent the subset of all those with income
above the 99th percentile. The Rest is the complement of the top one per cent, and consists of all those who
do not earn an income above the 99th percentile. The below median wage set is, as the name states, the sub-
set of all of those with income below the 50th percentile.
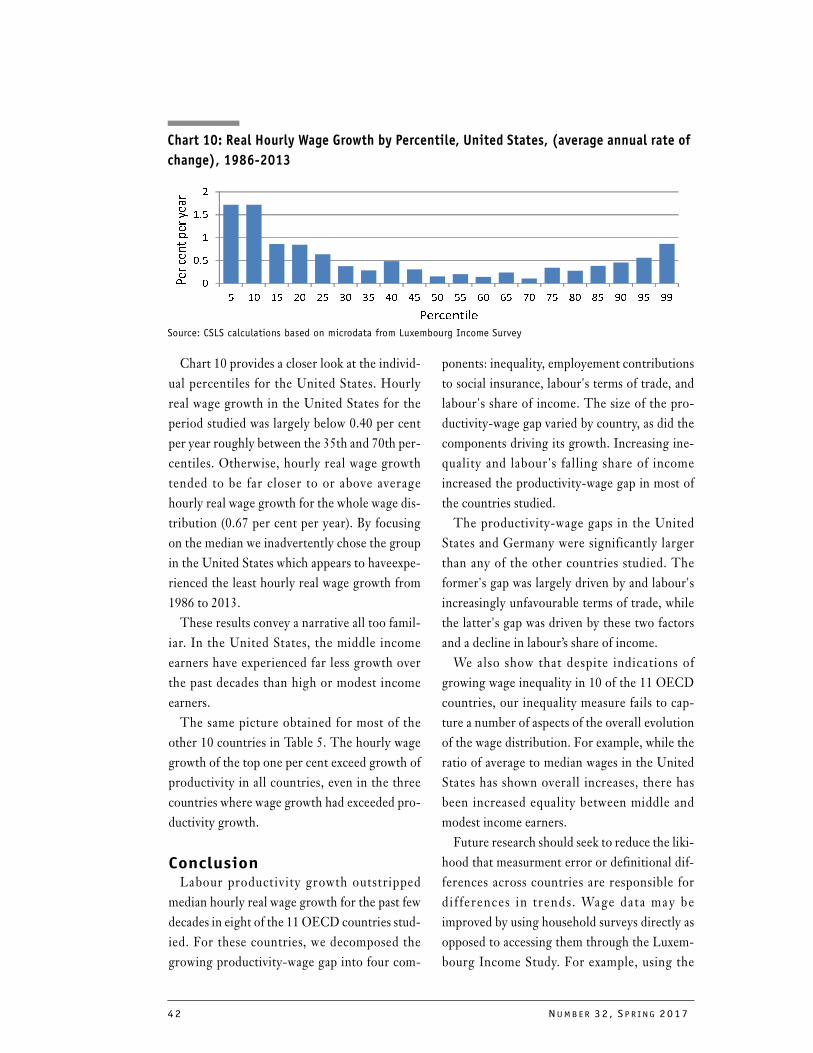
42 NUMB E R 32 , S P R I NG 2017
�
���
�
���
�
� �� �� �� �� �� �� �� �� �� �� �� �� � � � � �� �� ��
�
�
�
�
�
�
�
�
�
�
�
�
�
�
�
����������
Chart 10 provides a closer look at the individ-
ual percentiles for the United States. Hourly
real wage growth in the United States for the
period studied was largely below 0.40 per cent
per year roughly between the 35th and 70th per-
centiles. Otherwise, hourly real wage growth
tended to be far closer to or above average
hourly real wage growth for the whole wage dis-
tribution (0.67 per cent per year). By focusing
on the median we inadvertently chose the group
in the United States which appears to haveexpe-
rienced the least hourly real wage growth from
1986 to 2013.
These results convey a narrative all too famil-
iar. In the United States, the middle income
earners have experienced far less growth over
the past decades than high or modest income
earners.
The same picture obtained for most of the
other 10 countries in Table 5. The hourly wage
growth of the top one per cent exceed growth of
productivity in all countries, even in the three
countries where wage growth had exceeded pro-
ductivity growth.
ConclusionLabour productivity growth outstripped
median hourly real wage growth for the past few
decades in eight of the 11 OECD countries stud-
ied. For these countries, we decomposed the
growing productivity-wage gap into four com-
ponents: inequality, employement contributions
to social insurance, labour's terms of trade, and
labour's share of income. The size of the pro-
ductivity-wage gap varied by country, as did the
components driving its growth. Increasing ine-
quality and labour's falling share of income
increased the productivity-wage gap in most of
the countries studied.
The productivity-wage gaps in the United
States and Germany were significantly larger
than any of the other countries studied. The
former's gap was largely driven by and labour's
increasingly unfavourable terms of trade, while
the latter's gap was driven by these two factors
and a decline in labour’s share of income.
We also show that despite indications of
growing wage inequality in 10 of the 11 OECD
countries, our inequality measure fails to cap-
ture a number of aspects of the overall evolution
of the wage distribution. For example, while the
ratio of average to median wages in the United
States has shown overall increases, there has
been increased equality between middle and
modest income earners.
Future research should seek to reduce the liki-
hood that measurment error or definitional dif-
ferences across countries are responsible for
di f ferences in trends. Wage data may be
improved by using household surveys directly as
opposed to accessing them through the Luxem-
bourg Income Study. For example, using the
Chart 10: Real Hourly Wage Growth by Percentile, United States, (average annual rate of
change), 1986-2013
Source: CSLS calculations based on microdata from Luxembourg Income Survey
INT E R N A T I ON A L PRO DU C T I V I T Y MON I T OR 43
Labour Force Survey for Canada it is possible to
create an annual wage series without needing to
interpolate missing values from 1997 to 2016.
The lack of inclusive growth we observe in
many OECD countries has significant societal
implications. There may be less political support
for productivity-enhancing policies in the future
if the benefits of productivity growth are not
shared equitably. The incentives for employees
to work hard may diminish if they believe that
they are not receiving their "fair share" of the
firm's productivity gains. Finally, the current
taxes and transfers system may not be well
equipped to offset the growing trend of wage
inequality among workers if it was designed
assuming labour productivity growth will lead to
real wage growth for all workers.
ReferencesBartlett, Randal, and Stephen Tapp (2012) “An
Assessment of Canada's Labour Market Perfor-mance,” Office of the Parliamentary Budget Officer, Available at: http://pbo-dpb.gc.ca/web/default/files/files/files/Labour_Note_2012_EN.pdf .
Bick, Alexander, Nicola Fuchs-Schündeln, and David Lagakos (2016) "How do Average Hours Worked Vary with Development? Cross-Country Evi-dence and Implications," NBER Working Paper 21874. Available at: http://www.nber.org/papers/w21874.
Feldstein, Martin S. (2008) "Did Wages Reflect Growth in Productivity?" NBER Working Paper 13953. Available at: http://www.nber.org/papers/w13953.pdf.
Fisher, Tony and Doug Hostland (2002) "The Long View: Labour Productivity, Labour Income, and Living Standards in Canada," Review of Economic Performance and Social Progress, pp. 57-67. (Ottawa: Center for the Study of Living Stan-dards and Montreal: Institute for Research on Public Policy).
International Labour Organization (2015) Global Wage Report 2014/15: Wage and Income Ine-quality. Available at: http://www.ilo.org/wcmsp5/groups/public/---dgreports/---dcomm/
---publ/documents/publication/wcms_324678.pdf.
Mishel, Lawrence and Kar-Fai Gee (2012) "Why Aren't Workers Benefiting from Labour Produc-tivity Growth in the United States?" Interna-tional Productivity Monitor, No. 23. Spring, pp. 31-43.
OECD (2014) All On Board: Making Inclusive Growth Happen. Available at: https://www.oecd.org/inclusive-growth/All-on-Board-Making-Inclu-sive-Growth-Happen.pdf.
OECD (2012) "Labour Losing to Capital: What Explains the Declining Labour Share?" OECD Employment Outlook. Available at: http://www.oecd.org/els/emp/EMO%202012%20Eng_Chapter%203.pdf.
Pessoa, Joao Paulo, and John Van Reenan (2012) "Decoupling of Wage Growth and Productivity Growth? Myth and Reality," Resolution Founda-tion. Available at: http://www.livingstan-dards.org/wp-content/uploads/2012/02/Decoupling-of-wages-and-productivity.pdf.
Schwellnus C., A. Kappeler and P. Pionnier (2017) “The Decoupling of Median Wages from Pro-ductivity in OECD Countries,”International Pro-ductivity Monitor, Vol. 32, pp. 44-60.
Sharpe, Andrew, Jean-François Arsenault, and Peter Harrison (2008a) "Why Have Real Wages Lagged Labour Productivity Growth in Can-ada?" International Productivity Monitor, No. 17. Spring, pp. 17-26.
Sharpe, Andrew, Jean-François Arsenault, and Peter Harrison (2008b) "The Relationship between Real Wage Growth in Canada and OECD Coun-tries," CSLS Research Report Number 8, http://www.csls.ca/reports/csls2008-8.pdf.
Schwellnus C., A. Kappeler and P. Pionnier (2017) “The Decoupling of Median Wages from Pro-ductivity in OECD Countries,” International Productivity Monitor, No. 32. Spring, pp. 44-60.
Uguccioni, James, Alexander Murray and Andrew Sharpe (2016) "Decomposing: Labour Produc-tivity and Real Wage Earnings in Canada, 1976-2014," CSLS Research Report Number15, November..http://www.csls.ca/reports/csls2016-15.pdf.
Uguccioni, James and Andrew Sharpe (2016) "Decomposing the Productivity-Wage Nexus in Selected OECD Countries, 1986-2012," CSLS Research Report Number 16, November..http://www.csls.ca/reports/csls2016-16.pdf.
INT E R N A T I ON A L PRO DU C T I V I T Y MON I T OR 44
The Decoupling of Median Wages from Productivity in OECD Countries
Cyrille Schwellnus, Andreas Kappeler and Pierre-Alain Pionnier
OECD1
ABSTRACT
Over the past two decades, aggregate labour productivity growth in most
OECD countries has decoupled from real median compensation growth, implying
that increasing productivity is no longer sufficient to raise real wages for the typical
worker. This article provides a quantitative description of decoupling in OECD
countries over the past two decades, with the results suggesting that it is explained by
declines in both labour shares and the ratio of median to average wages (a partial
measure of wage inequality). Labour shares have declined in about two thirds of the
OECD countries covered by the analysis. However, the contribution of labour shares
to decoupling is smaller if sectors are excluded for which labour shares are driven by
changes in commodity and asset prices (primary and housing sectors) or by
imputation choices (non-market sectors). The ratio of median to average wages has
declined in all but two of the OECD countries covered by the analysis and appears to
reflect disproportionate wage growth at the very top of the wage distribution rather
than stagnating median wages. The causes of these developments will be analysed in
follow-up research.
In the long run, raising productivity is the
only way to raise living standards, with real
wages being the most direct mechanism through
which the benefits of productivity growth are
transferred to workers. Over the past two
decades, however, aggregate labour productivity
growth in most OECD countries has decoupled
from real median compensation growth.2
Increasing productivity no longer appears to be
sufficient to raise real wages for the typical
worker, suggesting that there is a role for public
policies to support a broader sharing of the ben-
efits of productivity gains in the economy.
This article analyses the extent of decoupling
of wages from productivity growth in OECD
countries over the past two decades. It analyses
1 Cyrille Schwellnus and Andreas Kappeler are economists in the Economics Department of the OECD. Pierre-
Alain Pionnier is an economist of the Statistics Directorate of the OECD. The authors would like to thank
Andrea Bassanini, Orsetta Causa, Antoine Goujard, Mikkel Hermansen, Alexander Hijzen, Yosuke Jin, Christine
Lewis, Catherine Mann, Giuseppe Nicoletti, Rory O’Farrell, Nicolas Ruiz, Jean-Luc Schneider, Paul Schreyer.
Peter van de Ven, and two anonymous referees for helpful discussions and suggestions. The support of Sarah
Michelson in putting together the document is gratefully acknowledged. The statistical data for Israel are sup-
plied by and under the responsibility of the relevant Israeli authorities. The use of such data by the OECD is
without prejudice to the status of the Golan Heights, East Jerusalem and Israeli settlements in the West Bank
under the terms of international law. Emails: [email protected]; [email protected]; and
2 Real compensation growth is based on the value added deflator.
45 NUMB E R 32 , S P R I NG 2017
whether developments at the macro level mainly
reflect changes in labour shares or changes in
wage inequality. Existing studies have mainly
focused on the United States (Bivens and
Mishel, 2015) and Canada (Sharpe et al., 2008),
finding that in these countries there has been
substantial decoupling of real median wages
from labour productivity over the past three
decades. The only recent cross-country study
(Uguccioni and Sharpe, 2017) finds that there
are large cross-country differences in decou-
pling of real median wages from productivity.
The main contributions of this article are to (i)
provide evidence on decoupling for the broadest
possible range of OECD countries and (ii) to
address a number of measurement issues that are
likely to bias estimates of decoupling.
The analysis shows that for the covered
OECD countries as a whole, total-economy
decoupling over the period 1995-2014 is
explained by declines in both total-economy
labour shares and the ratio of median to average
wages (a partial measure of wage inequality).
These declines are fully accounted for by pre-
2005 developments. Excluding sectors for which
labour shares are driven by changes in commod-
ity and asset prices or for which labour shares
are driven by imputation choices (primary, hous-
ing and non-market sectors) lessens the contri-
bution of labour shares to decoupling. For a
number of countries, declines in total-economy
labour shares reflect increases in housing rents,
which are related to increases in house prices.
For commodity-producing countries, declines
in total-economy labour shares largely reflect
increases in commodity rents. These are, in
turn, related to price increases on global markets
on which national policies have limited leverage.
While labour shares have declined signifi-
cantly in about two thirds of the analysed
OECD countries covered in this article, all but
two countries have experienced significant
declines in the ratio of median to average wages
over the past two decades. The increase in wage
inequality as measured by the decoupling of
median from average wage growth appears to
reflect disproportionate wage growth at the very
top of the wage distribution. While wage growth
at the 90th percentile (top 10 percentile) of the
wage distribution has been similar to growth at
the median, average wage growth for the top 1
per cent has exceeded growth at the median by a
multiple.
This article is organised as follows. The first
section describes the conceptual framework for
decomposing macro-level decoupling into con-
tributions from labour share and wage inequal-
ity developments, and provides descriptive
evidence for the covered OECD countries. Sec-
tion 2 investigates the role of the primary, hous-
ing, and non-market sectors as well as capital
stock depreciation in total-economy labour
share developments. Sector-level data on wage
inequality for the sample of OECD countries
covered by the analysis are not available so that
no such analysis can be conducted for the wage
inequality component. Section 3 nonetheless
provides a more disaggregated perspective on
wage inequality developments by analysing the
role of disproportionate wage growth of top
earners. Section 4 concludes.
Macro-level Decoupling: OverviewFramework
Conceptua l ly, macro- leve l decoupl ing
between real compensation growth of the
median worker and labour productivity growth
can be decomposed into the growth differential
between average compensation and labour pro-
ductivity and the growth differential between
median and average compensation.
Using the notation ∆ per cent X to denote the
per cent growth rate of X, macro-level decou-
pling in this article is defined as follows:
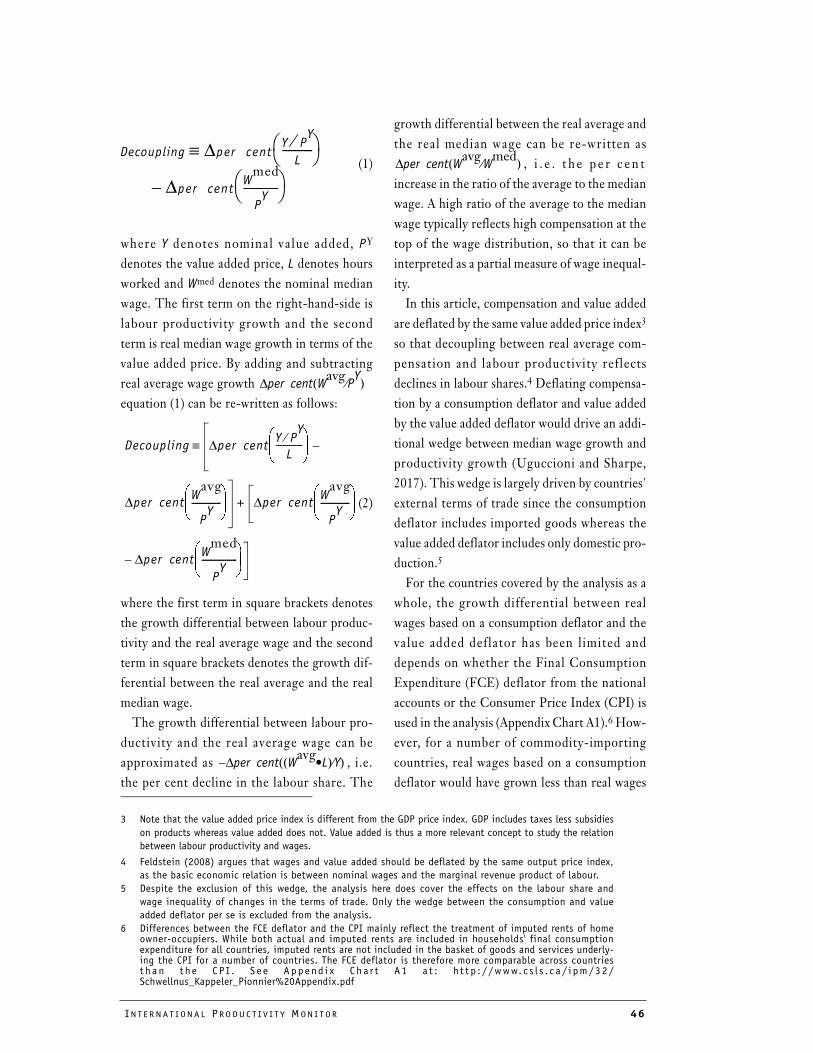
INT E R N A T I ON A L PRO DU C T I V I T Y MON I T OR 46
(1)
where Y denotes nominal value added, PY
denotes the value added price, L denotes hours
worked and Wmed denotes the nominal median
wage. The first term on the right-hand-side is
labour productivity growth and the second
term is real median wage growth in terms of the
value added price. By adding and subtracting
real average wage growth
equation (1) can be re-written as follows:
(2)
where the first term in square brackets denotes
the growth differential between labour produc-
tivity and the real average wage and the second
term in square brackets denotes the growth dif-
ferential between the real average and the real
median wage.
The growth differential between labour pro-
ductivity and the real average wage can be
approximated as , i.e.
the per cent decline in the labour share. The
growth differential between the real average and
the real median wage can be re-written as
, i . e . t h e p e r c e n t
increase in the ratio of the average to the median
wage. A high ratio of the average to the median
wage typically reflects high compensation at the
top of the wage distribution, so that it can be
interpreted as a partial measure of wage inequal-
ity.
In this article, compensation and value added
are deflated by the same value added price index3
so that decoupling between real average com-
pensation and labour productivity reflects
declines in labour shares.4 Deflating compensa-
tion by a consumption deflator and value added
by the value added deflator would drive an addi-
tional wedge between median wage growth and
productivity growth (Uguccioni and Sharpe,
2017). This wedge is largely driven by countries'
external terms of trade since the consumption
deflator includes imported goods whereas the
value added deflator includes only domestic pro-
duction.5
For the countries covered by the analysis as a
whole, the growth differential between real
wages based on a consumption deflator and the
value added deflator has been limited and
depends on whether the Final Consumption
Expenditure (FCE) deflator from the national
accounts or the Consumer Price Index (CPI) is
used in the analysis (Appendix Chart A1).6 How-
ever, for a number of commodity-importing
countries, real wages based on a consumption
deflator would have grown less than real wages
Decoupling ∆per c– entY P
Y⁄L
----------
∆per c– entW
med
PY
------------------ –
≡
∆per c– ent Wavg
PY
⁄( )
Decoupling ∆per c– entY P
Y⁄
L------------
∆per c– entW
avg
PY
---------------
–
∆per c– entW
avg
PY
---------------
∆per c– entW
med
PY
------------------
–
+
≡
∆per c– ent Wavg
L•( ) Y⁄( )–
3 Note that the value added price index is different from the GDP price index. GDP includes taxes less subsidies
on products whereas value added does not. Value added is thus a more relevant concept to study the relation
between labour productivity and wages.
4 Feldstein (2008) argues that wages and value added should be deflated by the same output price index,
as the basic economic relation is between nominal wages and the marginal revenue product of labour.
5 Despite the exclusion of this wedge, the analysis here does cover the effects on the labour share and
wage inequality of changes in the terms of trade. Only the wedge between the consumption and value
added deflator per se is excluded from the analysis.
6 Differences between the FCE deflator and the CPI mainly reflect the treatment of imputed rents of homeowner-occupiers. While both actual and imputed rents are included in households' final consumptionexpenditure for all countries, imputed rents are not included in the basket of goods and services underly-ing the CPI for a number of countries. The FCE deflator is therefore more comparable across countriest h a n t he C P I . S e e A p p end i x C h a r t A 1 a t : h t t p : / /www. c s l s . c a / i pm /3 2 /Schwellnus_Kappeler_Pionnier%20Appendix.pdf
∆per c– ent Wavg
Wmed
⁄( )
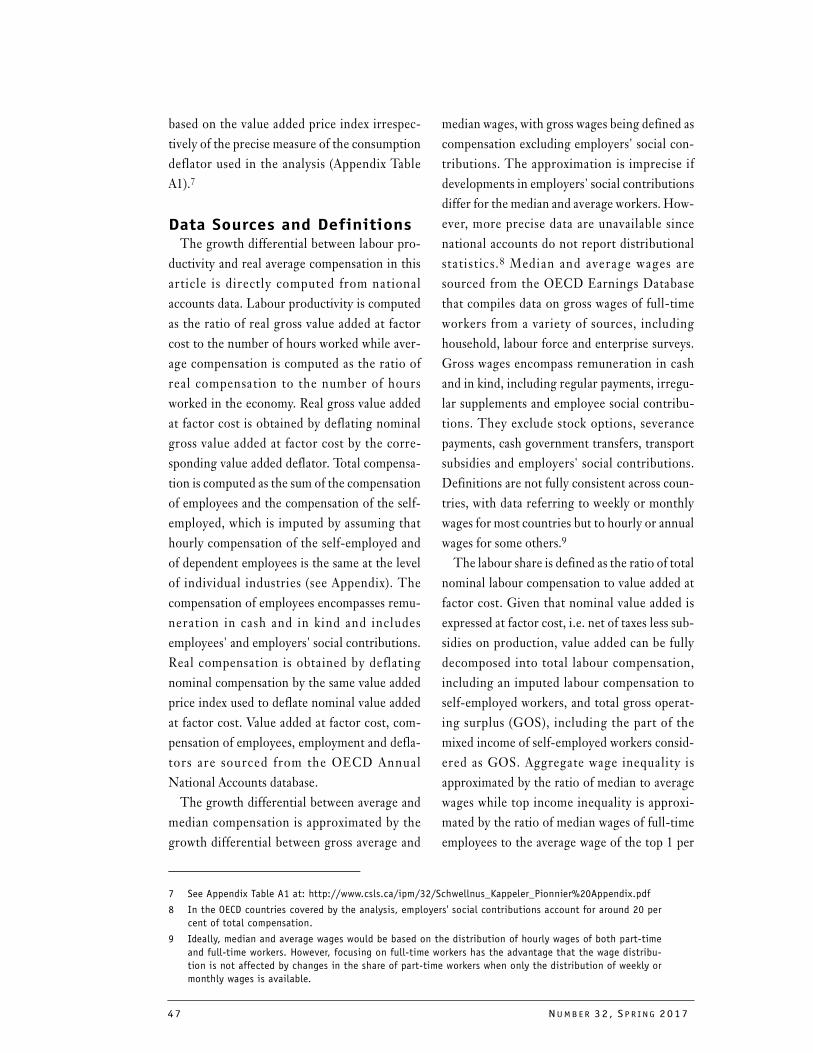
47 NUMB E R 32 , S P R I NG 2017
based on the value added price index irrespec-
tively of the precise measure of the consumption
deflator used in the analysis (Appendix Table
A1).7
Data Sources and DefinitionsThe growth differential between labour pro-
ductivity and real average compensation in this
article is directly computed from national
accounts data. Labour productivity is computed
as the ratio of real gross value added at factor
cost to the number of hours worked while aver-
age compensation is computed as the ratio of
real compensation to the number of hours
worked in the economy. Real gross value added
at factor cost is obtained by deflating nominal
gross value added at factor cost by the corre-
sponding value added deflator. Total compensa-
tion is computed as the sum of the compensation
of employees and the compensation of the self-
employed, which is imputed by assuming that
hourly compensation of the self-employed and
of dependent employees is the same at the level
of individual industries (see Appendix). The
compensation of employees encompasses remu-
neration in cash and in kind and includes
employees' and employers' social contributions.
Real compensation is obtained by deflating
nominal compensation by the same value added
price index used to deflate nominal value added
at factor cost. Value added at factor cost, com-
pensation of employees, employment and defla-
tors are sourced from the OECD Annual
National Accounts database.
The growth differential between average and
median compensation is approximated by the
growth differential between gross average and
median wages, with gross wages being defined as
compensation excluding employers' social con-
tributions. The approximation is imprecise if
developments in employers' social contributions
differ for the median and average workers. How-
ever, more precise data are unavailable since
national accounts do not report distributional
statist ics.8 Median and average wages are
sourced from the OECD Earnings Database
that compiles data on gross wages of full-time
workers from a variety of sources, including
household, labour force and enterprise surveys.
Gross wages encompass remuneration in cash
and in kind, including regular payments, irregu-
lar supplements and employee social contribu-
tions. They exclude stock options, severance
payments, cash government transfers, transport
subsidies and employers' social contributions.
Definitions are not fully consistent across coun-
tries, with data referring to weekly or monthly
wages for most countries but to hourly or annual
wages for some others.9
The labour share is defined as the ratio of total
nominal labour compensation to value added at
factor cost. Given that nominal value added is
expressed at factor cost, i.e. net of taxes less sub-
sidies on production, value added can be fully
decomposed into total labour compensation,
including an imputed labour compensation to
self-employed workers, and total gross operat-
ing surplus (GOS), including the part of the
mixed income of self-employed workers consid-
ered as GOS. Aggregate wage inequality is
approximated by the ratio of median to average
wages while top income inequality is approxi-
mated by the ratio of median wages of full-time
employees to the average wage of the top 1 per
7 See Appendix Table A1 at: http://www.csls.ca/ipm/32/Schwellnus_Kappeler_Pionnier%20Appendix.pdf
8 In the OECD countries covered by the analysis, employers' social contributions account for around 20 per
cent of total compensation.
9 Ideally, median and average wages would be based on the distribution of hourly wages of both part-time
and full-time workers. However, focusing on full-time workers has the advantage that the wage distribu-
tion is not affected by changes in the share of part-time workers when only the distribution of weekly or
monthly wages is available.
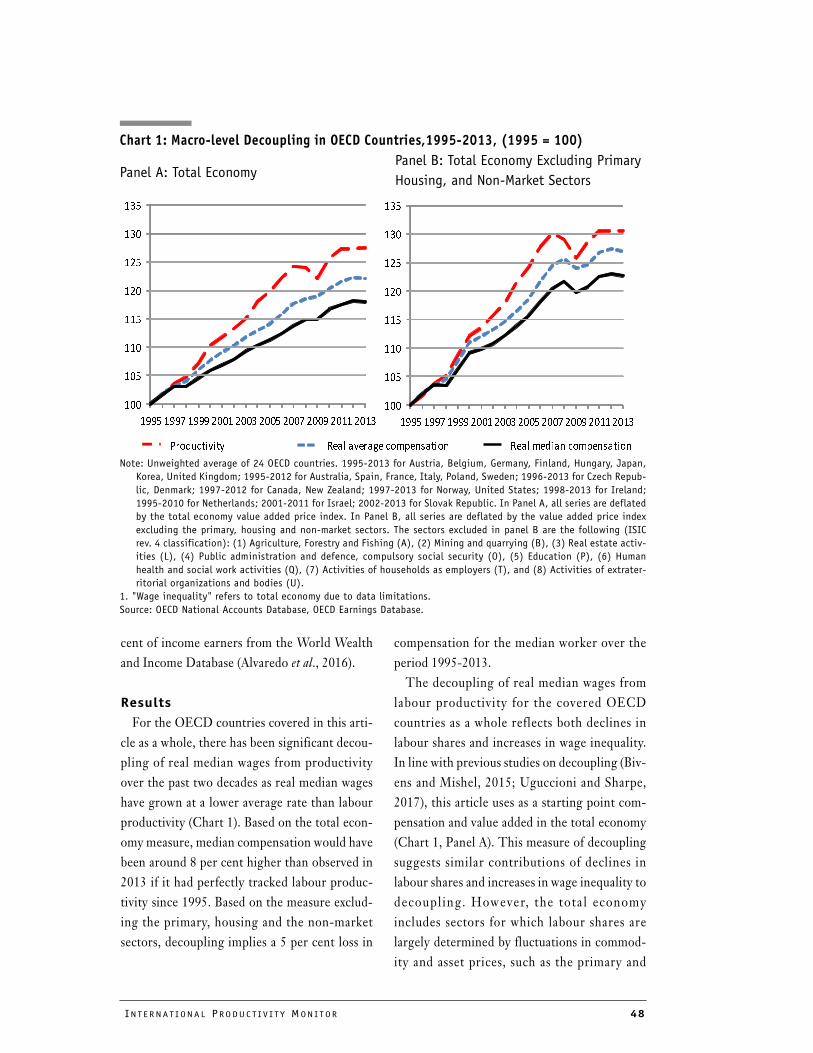
INT E R N A T I ON A L PRO DU C T I V I T Y MON I T OR 48
Chart 1: Macro-level Decoupling in OECD Countries,1995-2013, (1995 = 100)
Note: Unweighted average of 24 OECD countries. 1995-2013 for Austria, Belgium, Germany, Finland, Hungary, Japan,
Korea, United Kingdom; 1995-2012 for Australia, Spain, France, Italy, Poland, Sweden; 1996-2013 for Czech Repub-
lic, Denmark; 1997-2012 for Canada, New Zealand; 1997-2013 for Norway, United States; 1998-2013 for Ireland;
1995-2010 for Netherlands; 2001-2011 for Israel; 2002-2013 for Slovak Republic. In Panel A, all series are deflated
by the total economy value added price index. In Panel B, all series are deflated by the value added price index
excluding the primary, housing and non-market sectors. The sectors excluded in panel B are the following (ISIC
rev. 4 classification): (1) Agriculture, Forestry and Fishing (A), (2) Mining and quarrying (B), (3) Real estate activ-
ities (L), (4) Public administration and defence, compulsory social security (O), (5) Education (P), (6) Human
health and social work activities (Q), (7) Activities of households as employers (T), and (8) Activities of extrater-
ritorial organizations and bodies (U).
1. "Wage inequality" refers to total economy due to data limitations.
Source: OECD National Accounts Database, OECD Earnings Database.
���������� �� �� �� ���������� ��������� ���������������������� ������ ��������� ���������
���
���
���
���
���
���
���
���
���� ���� ���� ���� ���� ���� ���� ���� ���� ����
���
���
���
���
���
���
���
���
���� ���� ���� ���� ���� ���� ���� ���� ���� ����
�������� ��������
���������� �� �� �� ���������� ��������� ���������������������� ������ ��������� ���������
���
���
���
���
���
���
���
���
���� ���� ���� ���� ���� ���� ���� ���� ���� ����
���
���
���
���
���
���
���
���
���� ���� ���� ���� ���� ���� ���� ���� ���� ����
cent of income earners from the World Wealth
and Income Database (Alvaredo et al., 2016).
Results
For the OECD countries covered in this arti-
cle as a whole, there has been significant decou-
pling of real median wages from productivity
over the past two decades as real median wages
have grown at a lower average rate than labour
productivity (Chart 1). Based on the total econ-
omy measure, median compensation would have
been around 8 per cent higher than observed in
2013 if it had perfectly tracked labour produc-
tivity since 1995. Based on the measure exclud-
ing the primary, housing and the non-market
sectors, decoupling implies a 5 per cent loss in
compensation for the median worker over the
period 1995-2013.
The decoupling of real median wages from
labour productivity for the covered OECD
countries as a whole reflects both declines in
labour shares and increases in wage inequality.
In line with previous studies on decoupling (Biv-
ens and Mishel, 2015; Uguccioni and Sharpe,
2017), this article uses as a starting point com-
pensation and value added in the total economy
(Chart 1, Panel A). This measure of decoupling
suggests similar contributions of declines in
labour shares and increases in wage inequality to
decoupling. However, the total economy
includes sectors for which labour shares are
largely determined by fluctuations in commod-
ity and asset prices, such as the primary and
Panel A: Total EconomyPanel B: Total Economy Excluding Primary
Housing, and Non-Market Sectors
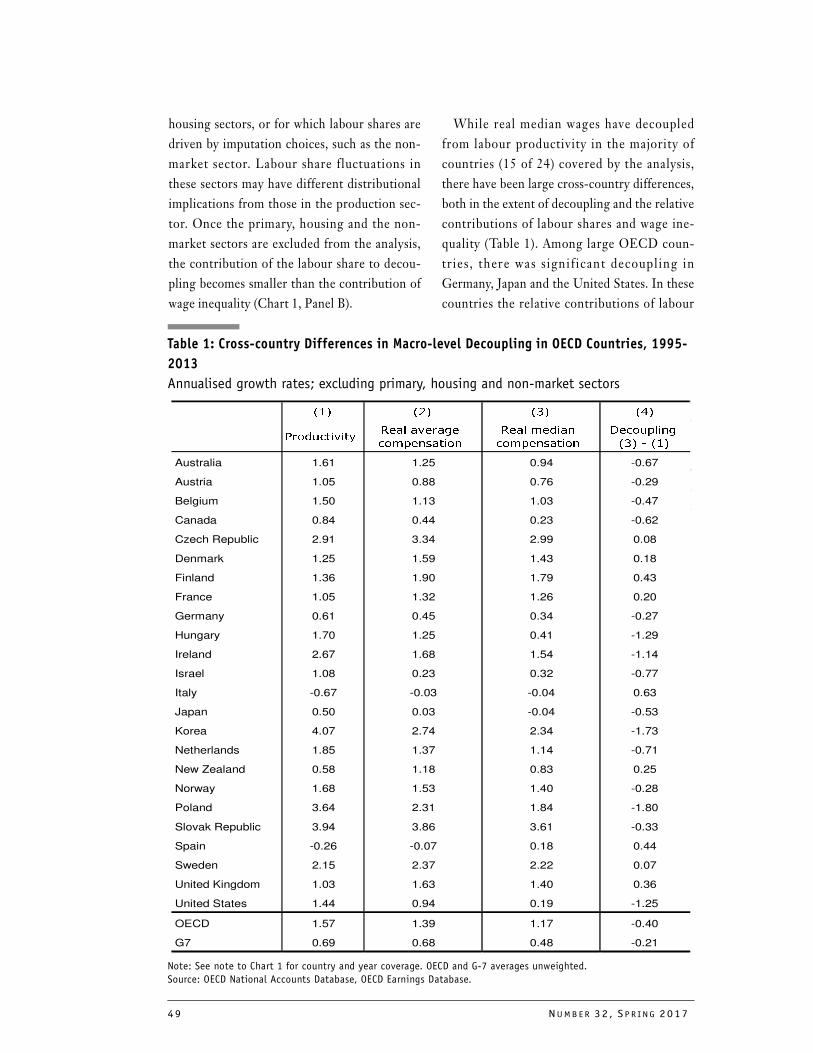
49 NUMB E R 32 , S P R I NG 2017
��� ��� ��� ���
���� ��� �
�������������
������� ��
�����������
������� ��
����������
����� ���
Australia 1.61 1.25 0.94 -0.67
Austria 1.05 0.88 0.76 -0.29
Belgium 1.50 1.13 1.03 -0.47
Canada 0.84 0.44 0.23 -0.62
Czech Republic 2.91 3.34 2.99 0.08
Denmark 1.25 1.59 1.43 0.18
Finland 1.36 1.90 1.79 0.43
France 1.05 1.32 1.26 0.20
Germany 0.61 0.45 0.34 -0.27
Hungary 1.70 1.25 0.41 -1.29
Ireland 2.67 1.68 1.54 -1.14
Israel 1.08 0.23 0.32 -0.77
Italy -0.67 -0.03 -0.04 0.63
Japan 0.50 0.03 -0.04 -0.53
Korea 4.07 2.74 2.34 -1.73
Netherlands 1.85 1.37 1.14 -0.71
New Zealand 0.58 1.18 0.83 0.25
Norway 1.68 1.53 1.40 -0.28
Poland 3.64 2.31 1.84 -1.80
Slovak Republic 3.94 3.86 3.61 -0.33
Spain -0.26 -0.07 0.18 0.44
Sweden 2.15 2.37 2.22 0.07
United Kingdom 1.03 1.63 1.40 0.36
United States 1.44 0.94 0.19 -1.25
OECD 1.57 1.39 1.17 -0.40
G7 0.69 0.68 0.48 -0.21
Table 1: Cross-country Differences in Macro-level Decoupling in OECD Countries, 1995-
2013
Annualised growth rates; excluding primary, housing and non-market sectors
Note: See note to Chart 1 for country and year coverage. OECD and G-7 averages unweighted.
Source: OECD National Accounts Database, OECD Earnings Database.
housing sectors, or for which labour shares are
driven by imputation choices, such as the non-
market sector. Labour share fluctuations in
these sectors may have different distributional
implications from those in the production sec-
tor. Once the primary, housing and the non-
market sectors are excluded from the analysis,
the contribution of the labour share to decou-
pling becomes smaller than the contribution of
wage inequality (Chart 1, Panel B).
While real median wages have decoupled
from labour productivity in the majority of
countries (15 of 24) covered by the analysis,
there have been large cross-country differences,
both in the extent of decoupling and the relative
contributions of labour shares and wage ine-
quality (Table 1). Among large OECD coun-
tries, there was s ignif icant decoupling in
Germany, Japan and the United States. In these
countries the relative contributions of labour
INT E R N A T I ON A L PRO DU C T I V I T Y MON I T OR 50
���
���
���
���
���
���
��
�
�
��
��
���� �������� ����� �� �����
���� �������
shares and wage inequality differed significantly.
For instance, in the United States around 40 per
cent of overall decoupling (0.5 percentage
points of 1.25 percentage points) is explained by
declines in labour shares while this factor
explains virtually all decoupling in Japan. In a
number of other OECD countries, real median
wages have grown at similar or even higher rates
than labour productivity. These countries
include a number of large countries, such as
France, Italy and the United Kingdom, where
labour shares have increased and wage inequal-
ity has remained broadly constant or increased
only modestly over the period.
Dissecting Labour Share Developments
Several recent studies have emphasised that
distributional and policy implications of labour
share changes depend on the inclusion of capital
depreciation and housing rents in value added
(Rognlie, 2015; Bridgman, 2014). This section
provides an in-depth analysis of labour share
developments, including for OECD countries
for which overall decoupling cannot be com-
puted because data on the wage distribution are
unavailable.10
Gross or net labour shares?
Even though most analyses of labour shares
are based on gross value added, only value added
10 The labour share analysis is based on National Accounts data only. Therefore, the country sample and time
coverage changes compared to the overall decoupling analysis, which also makes use of Labour Force Surveys.
Notably, the labour share analysis includes additionally the year 2014 and the following countries: Esto-
nia, Greece, Latvia, Lithuania, Luxembourg, Portugal and Slovenia. The labour share analysis also changes
the time coverage for a number of countries. For instance, the labour share analysis for Norway covers
1995-2014, instead of 1997-2013; the labour share analysis for Slovak Republic covers 1995-2014,
instead of 2002-2013. For further details see Footnotes to Chart 1 and Table 2.
Chart 2: Changes in Gross and Net Labour Shares in OECD Countries, 1995-2014
Percentage Points
Note: Three-year averages starting and ending in indicated years. OECD and G7 refer to unweighted averages for the
relevant countries included in the figure. 1995-2013 for Australia, Canada, France, Korea, Latvia, Mexico, Portugal;
1996-2014 for Chile; 1997-2014 for United Kingdom; 1996-2012 for New Zealand.
Source: OECD National Accounts Database.
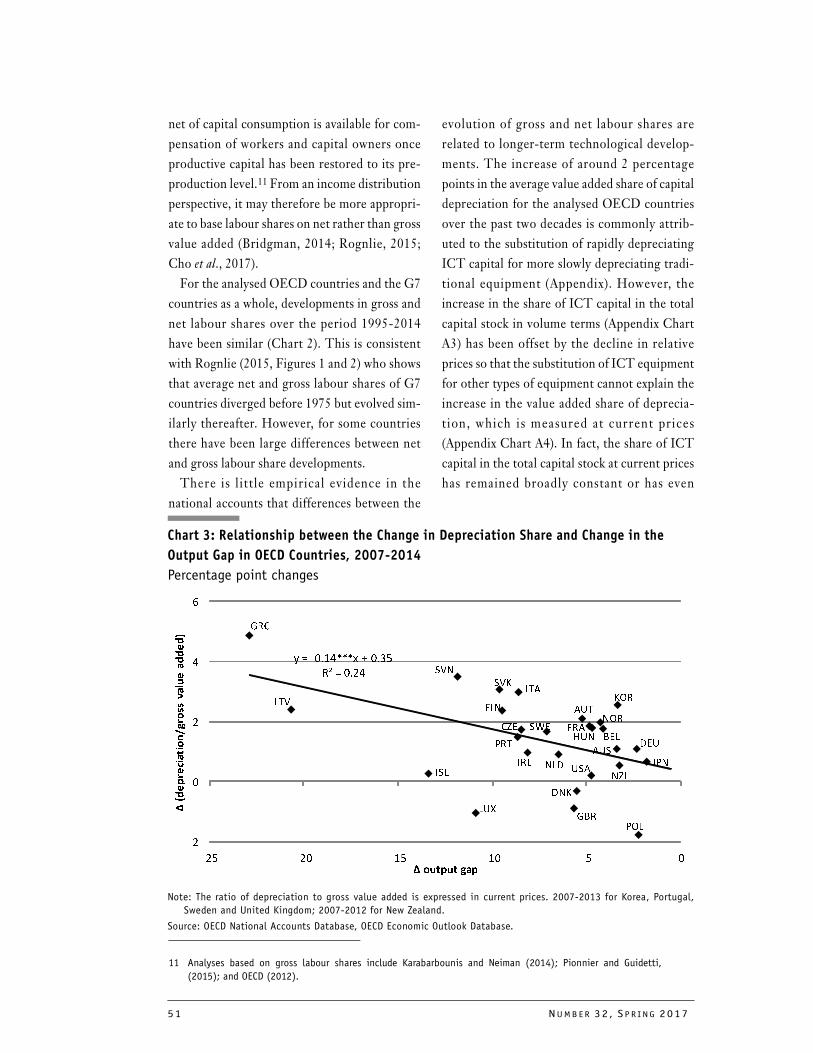
51 NUMB E R 32 , S P R I NG 2017
Chart 3: Relationship between the Change in Depreciation Share and Change in the
Output Gap in OECD Countries, 2007-2014
Percentage point changes
Note: The ratio of depreciation to gross value added is expressed in current prices. 2007-2013 for Korea, Portugal,
Sweden and United Kingdom; 2007-2012 for New Zealand.
Source: OECD National Accounts Database, OECD Economic Outlook Database.
net of capital consumption is available for com-
pensation of workers and capital owners once
productive capital has been restored to its pre-
production level.11 From an income distribution
perspective, it may therefore be more appropri-
ate to base labour shares on net rather than gross
value added (Bridgman, 2014; Rognlie, 2015;
Cho et al., 2017).
For the analysed OECD countries and the G7
countries as a whole, developments in gross and
net labour shares over the period 1995-2014
have been similar (Chart 2). This is consistent
with Rognlie (2015, Figures 1 and 2) who shows
that average net and gross labour shares of G7
countries diverged before 1975 but evolved sim-
ilarly thereafter. However, for some countries
there have been large differences between net
and gross labour share developments.
There is little empirical evidence in the
national accounts that differences between the
evolution of gross and net labour shares are
related to longer-term technological develop-
ments. The increase of around 2 percentage
points in the average value added share of capital
depreciation for the analysed OECD countries
over the past two decades is commonly attrib-
uted to the substitution of rapidly depreciating
ICT capital for more slowly depreciating tradi-
tional equipment (Appendix). However, the
increase in the share of ICT capital in the total
capital stock in volume terms (Appendix Chart
A3) has been offset by the decline in relative
prices so that the substitution of ICT equipment
for other types of equipment cannot explain the
increase in the value added share of deprecia-
tion, which is measured at current prices
(Appendix Chart A4). In fact, the share of ICT
capital in the total capital stock at current prices
has remained broadly constant or has even
11 Analyses based on gross labour shares include Karabarbounis and Neiman (2014); Pionnier and Guidetti,
(2015); and OECD (2012).
���������������
���������
��
�
�
�
�
�� ��� �� ��� � �
�
�
�
�
�
�
�
�
�
�
�
�
�
�
�
�
�
�
�
�
�
�
�
�
�
�
�
�
������������
���
���
��
��
�
���
���
��
���
���
���
���
���
�
��
���
�
���
���
���
�
���
���
���
���
���
��
INT E R N A T I ON A L PRO DU C T I V I T Y MON I T OR 52
declined for OECD countries (Appendix Chart
A5).12
There is more support in the data for the
hypothesis that the share of depreciation in
gross value added is highly counter-cyclical,
which implies that net labour share develop-
ments are largely driven by the business cycle
rather than structural developments. The rela-
tionship between changes in the share of depre-
ciation in value added and changes in output
gaps appears to be negative (Chart 3). Greece,
for instance, experienced the largest widening of
the output gap over 2007 and 2014 and is the
country in the sample for which the share of
depreciation in value added increased most. The
increase in the value added share of depreciation
appears to mainly reflect cyclical developments
rather than a long-term structural change driven
by the long-term decrease in ICT prices.
In sum, the business cycle affects gross value
added much more than capital consumption,
thus implying that the value added share of
depreciation is highly counter-cyclical. This
makes it difficult to separate structural changes
— which are the main focus of this article —
from cyclical changes in the net labour share.
Consequently, the remainder of the article
focuses on gross labour shares.
Total-economy labour shares or
labour shares excluding the
primary, housing and non-market
sectors?13
The decline in the total-economy labour
share observed in many OECD countries may
partly be driven by developments in specific
industries for which there are significant con-
ceptual and measurement issues. For instance,
total-economy labour shares are partly driven by
developments in housing rents. Although the
typical worker may actually benefit more from
increases in housing rents than from other forms
of capital income, the overwhelming part of
housing rents ends up in gross operating surplus
(i.e. capital income) in the national accounts.
Given that the labour share in the housing sec-
tor is well below the labour share of the total
economy, an increase in the share of housing to
total value added puts downward pressure on the
total-economy labour share (Box 1).
A further issue with total-economy labour
shares is that labour share developments are
partly driven by commodity price developments
and by imputation choices in the non-market
sector (Table 1). For countries with large pri-
mary sectors (agriculture, forestry, fishing, min-
ing and quarrying as well as extraction of oil and
gas), developments in total-economy labour
shares are largely driven by developments in
commodity prices; when commodity prices
increase, aggregate profits rise without com-
mensurate increases in aggregate wages.14 In
Norway, for instance, where the oil and gas sec-
12 See Appendix at: http://www.csls.ca/ipm/32/Schwellnus_Kappeler_Pionnier%20Appendix.pdf
13 This article uses industry accounts and imputes labour compensation of the self-employed at the industry
level rather than following the approach of Rognlie (2015) and Karabarbounis-Neiman (2014) of using
the non-financial corporations' institutional account without correction for the self-employed. As in
Rognlie (2015) and Karabarbounis-Neiman (2014). Pionnier and Guidetti (2015) have shown that in the
national accounts of some countries self-employed workers are allocated to the non-financial corpora-
tions' institutional sector, thereby affecting levels and trends of non-financial corporations' labour
shares.
14 The decline in the aggregate labour share partly reflects a change in industry composition: as commodity
prices increase, the share of the mining sector - for which the labour share is low - in total value added
increases.
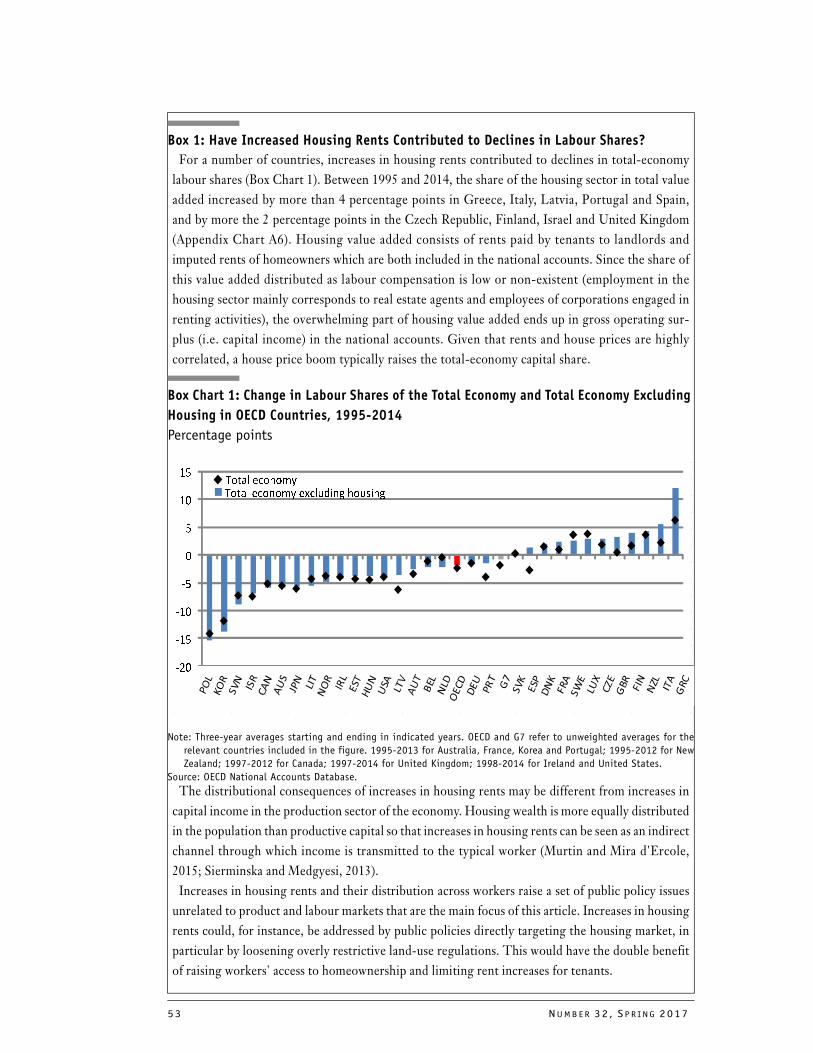
53 NUMB E R 32 , S P R I NG 2017
���
���
���
��
�
�
��
��
����� �������� �������������
����� �����
Box 1: Have Increased Housing Rents Contributed to Declines in Labour Shares?
For a number of countries, increases in housing rents contributed to declines in total-economy
labour shares (Box Chart 1). Between 1995 and 2014, the share of the housing sector in total value
added increased by more than 4 percentage points in Greece, Italy, Latvia, Portugal and Spain,
and by more the 2 percentage points in the Czech Republic, Finland, Israel and United Kingdom
(Appendix Chart A6). Housing value added consists of rents paid by tenants to landlords and
imputed rents of homeowners which are both included in the national accounts. Since the share of
this value added distributed as labour compensation is low or non-existent (employment in the
housing sector mainly corresponds to real estate agents and employees of corporations engaged in
renting activities), the overwhelming part of housing value added ends up in gross operating sur-
plus (i.e. capital income) in the national accounts. Given that rents and house prices are highly
correlated, a house price boom typically raises the total-economy capital share.
Box Chart 1: Change in Labour Shares of the Total Economy and Total Economy Excluding
Housing in OECD Countries, 1995-2014
Percentage points
Note: Three-year averages starting and ending in indicated years. OECD and G7 refer to unweighted averages for the
relevant countries included in the figure. 1995-2013 for Australia, France, Korea and Portugal; 1995-2012 for New
Zealand; 1997-2012 for Canada; 1997-2014 for United Kingdom; 1998-2014 for Ireland and United States.
Source: OECD National Accounts Database.
The distributional consequences of increases in housing rents may be different from increases in
capital income in the production sector of the economy. Housing wealth is more equally distributed
in the population than productive capital so that increases in housing rents can be seen as an indirect
channel through which income is transmitted to the typical worker (Murtin and Mira d'Ercole,
2015; Sierminska and Medgyesi, 2013).
Increases in housing rents and their distribution across workers raise a set of public policy issues
unrelated to product and labour markets that are the main focus of this article. Increases in housing
rents could, for instance, be addressed by public policies directly targeting the housing market, in
particular by loosening overly restrictive land-use regulations. This would have the double benefit
of raising workers' access to homeownership and limiting rent increases for tenants.
���
���
���
��
�
�
��
��
����������� �������������
�������� �������
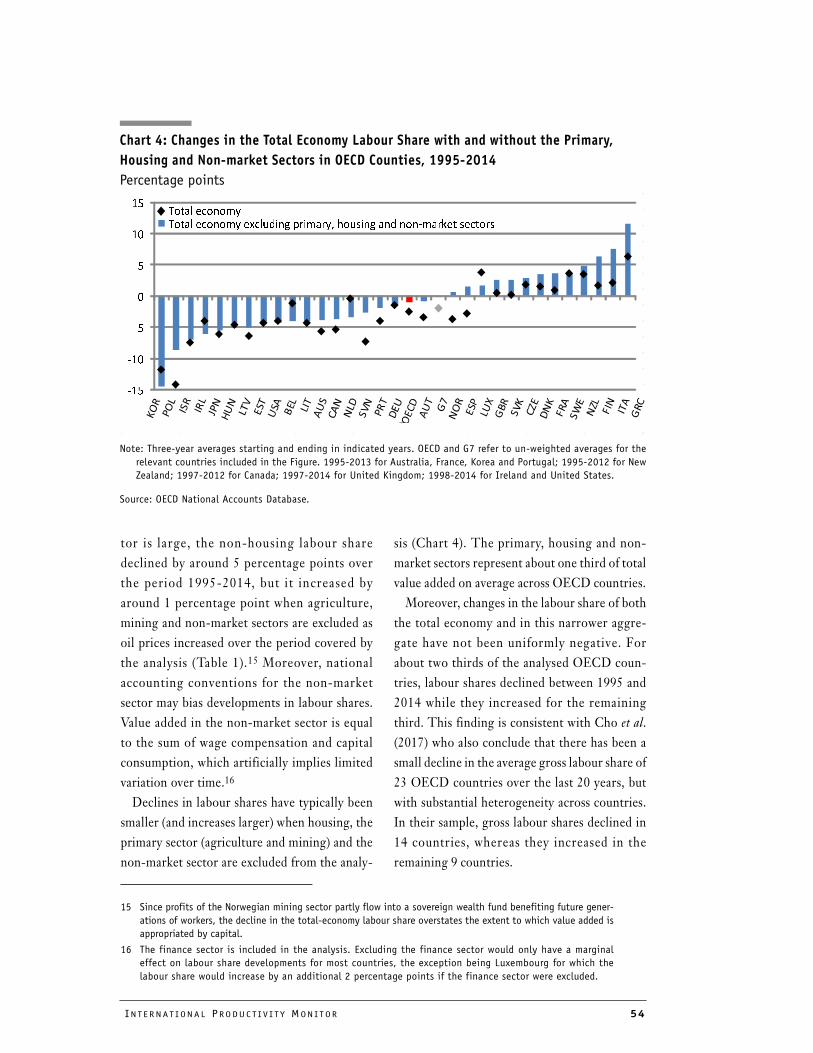
INT E R N A T I ON A L PRO DU C T I V I T Y MON I T OR 54
���
���
��
�
�
��
��
������� ��� ������ �������������� �� � � ��������������
������� ���
tor is large, the non-housing labour share
declined by around 5 percentage points over
the period 1995-2014, but it increased by
around 1 percentage point when agriculture,
mining and non-market sectors are excluded as
oil prices increased over the period covered by
the analysis (Table 1).15 Moreover, national
accounting conventions for the non-market
sector may bias developments in labour shares.
Value added in the non-market sector is equal
to the sum of wage compensation and capital
consumption, which artificially implies limited
variation over time.16
Declines in labour shares have typically been
smaller (and increases larger) when housing, the
primary sector (agriculture and mining) and the
non-market sector are excluded from the analy-
sis (Chart 4). The primary, housing and non-
market sectors represent about one third of total
value added on average across OECD countries.
Moreover, changes in the labour share of both
the total economy and in this narrower aggre-
gate have not been uniformly negative. For
about two thirds of the analysed OECD coun-
tries, labour shares declined between 1995 and
2014 while they increased for the remaining
third. This finding is consistent with Cho et al.
(2017) who also conclude that there has been a
small decline in the average gross labour share of
23 OECD countries over the last 20 years, but
with substantial heterogeneity across countries.
In their sample, gross labour shares declined in
14 countries, whereas they increased in the
remaining 9 countries.
15 Since profits of the Norwegian mining sector partly flow into a sovereign wealth fund benefiting future gener-
ations of workers, the decline in the total-economy labour share overstates the extent to which value added is
appropriated by capital.
16 The finance sector is included in the analysis. Excluding the finance sector would only have a marginal
effect on labour share developments for most countries, the exception being Luxembourg for which the
labour share would increase by an additional 2 percentage points if the finance sector were excluded.
Chart 4: Changes in the Total Economy Labour Share with and without the Primary,
Housing and Non-market Sectors in OECD Counties, 1995-2014
Percentage points
Note: Three-year averages starting and ending in indicated years. OECD and G7 refer to un-weighted averages for the
relevant countries included in the Figure. 1995-2013 for Australia, France, Korea and Portugal; 1995-2012 for New
Zealand; 1997-2012 for Canada; 1997-2014 for United Kingdom; 1998-2014 for Ireland and United States.
Source: OECD National Accounts Database.
���
���
��
�
�
��
��
����������� �������������������������������������������
�������� �������
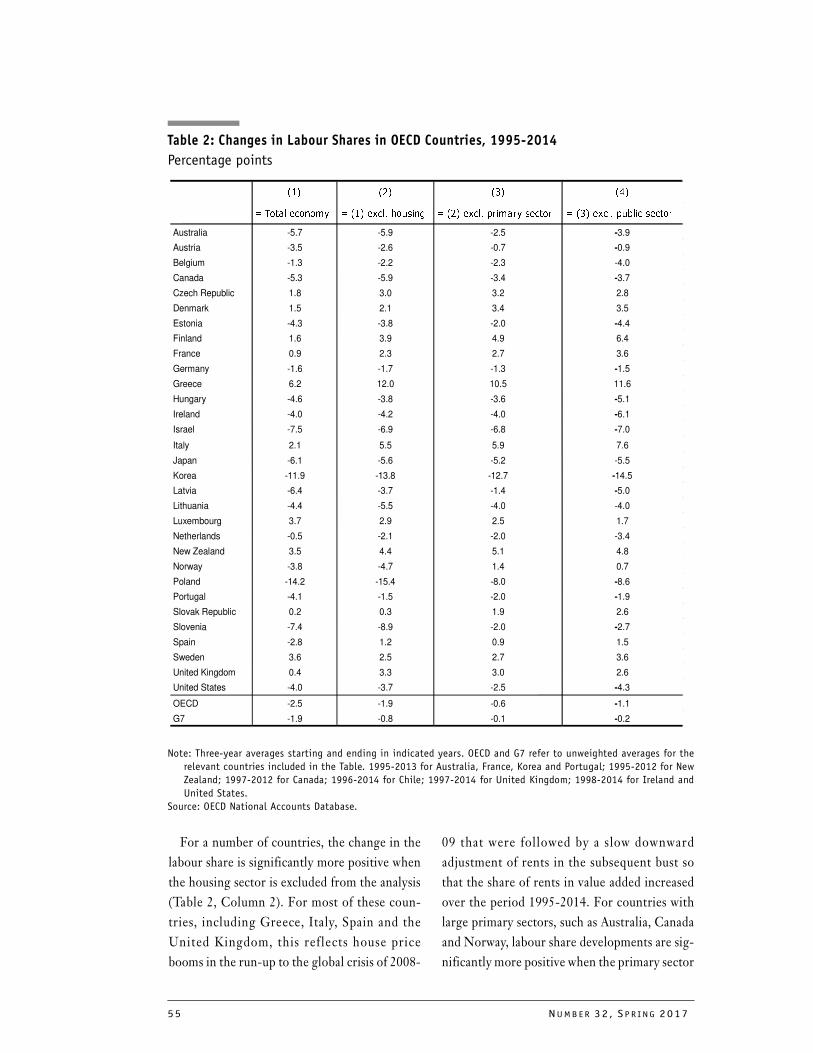
55 NUMB E R 32 , S P R I NG 2017
��� ��� ��� ���
���� ������ ��������� �������� ��������� ��������������� ��������� ����� ��������
Australia -5.7 -5.9 -2.5 -3.9
Austria -3.5 -2.6 -0.7 -0.9
Belgium -1.3 -2.2 -2.3 -4.0
Canada -5.3 -5.9 -3.4 -3.7
Czech Republic 1.8 3.0 3.2 2.8
Denmark 1.5 2.1 3.4 3.5
Estonia -4.3 -3.8 -2.0 -4.4
Finland 1.6 3.9 4.9 6.4
France 0.9 2.3 2.7 3.6
Germany -1.6 -1.7 -1.3 -1.5
Greece 6.2 12.0 10.5 11.6
Hungary -4.6 -3.8 -3.6 -5.1
Ireland -4.0 -4.2 -4.0 -6.1
Israel -7.5 -6.9 -6.8 -7.0
Italy 2.1 5.5 5.9 7.6
Japan -6.1 -5.6 -5.2 -5.5
Korea -11.9 -13.8 -12.7 -14.5
Latvia -6.4 -3.7 -1.4 -5.0
Lithuania -4.4 -5.5 -4.0 -4.0
Luxembourg 3.7 2.9 2.5 1.7
Netherlands -0.5 -2.1 -2.0 -3.4
New Zealand 3.5 4.4 5.1 4.8
Norway -3.8 -4.7 1.4 0.7
Poland -14.2 -15.4 -8.0 -8.6
Portugal -4.1 -1.5 -2.0 -1.9
Slovak Republic 0.2 0.3 1.9 2.6
Slovenia -7.4 -8.9 -2.0 -2.7
Spain -2.8 1.2 0.9 1.5
Sweden 3.6 2.5 2.7 3.6
United Kingdom 0.4 3.3 3.0 2.6
United States -4.0 -3.7 -2.5 -4.3
OECD -2.5 -1.9 -0.6 -1.1
G7 -1.9 -0.8 -0.1 -0.2
For a number of countries, the change in the
labour share is significantly more positive when
the housing sector is excluded from the analysis
(Table 2, Column 2). For most of these coun-
tries, including Greece, Italy, Spain and the
United Kingdom, this reflects house price
booms in the run-up to the global crisis of 2008-
09 that were followed by a slow downward
adjustment of rents in the subsequent bust so
that the share of rents in value added increased
over the period 1995-2014. For countries with
large primary sectors, such as Australia, Canada
and Norway, labour share developments are sig-
nificantly more positive when the primary sector
Table 2: Changes in Labour Shares in OECD Countries, 1995-2014
Percentage points
Note: Three-year averages starting and ending in indicated years. OECD and G7 refer to unweighted averages for the
relevant countries included in the Table. 1995-2013 for Australia, France, Korea and Portugal; 1995-2012 for New
Zealand; 1997-2012 for Canada; 1996-2014 for Chile; 1997-2014 for United Kingdom; 1998-2014 for Ireland and
United States.
Source: OECD National Accounts Database.
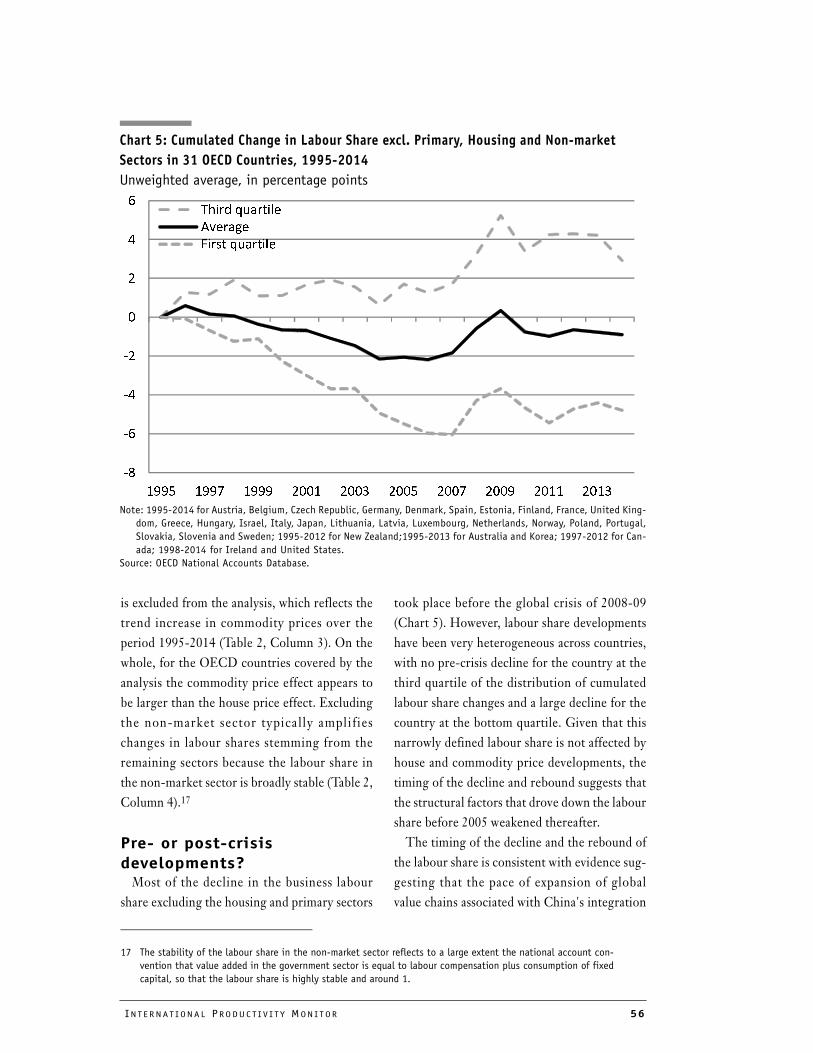
INT E R N A T I ON A L PRO DU C T I V I T Y MON I T OR 56
is excluded from the analysis, which reflects the
trend increase in commodity prices over the
period 1995-2014 (Table 2, Column 3). On the
whole, for the OECD countries covered by the
analysis the commodity price effect appears to
be larger than the house price effect. Excluding
the non-market sector typically amplifies
changes in labour shares stemming from the
remaining sectors because the labour share in
the non-market sector is broadly stable (Table 2,
Column 4).17
Pre- or post-crisis developments?
Most of the decline in the business labour
share excluding the housing and primary sectors
took place before the global crisis of 2008-09
(Chart 5). However, labour share developments
have been very heterogeneous across countries,
with no pre-crisis decline for the country at the
third quartile of the distribution of cumulated
labour share changes and a large decline for the
country at the bottom quartile. Given that this
narrowly defined labour share is not affected by
house and commodity price developments, the
timing of the decline and rebound suggests that
the structural factors that drove down the labour
share before 2005 weakened thereafter.
The timing of the decline and the rebound of
the labour share is consistent with evidence sug-
gesting that the pace of expansion of global
value chains associated with China's integration
17 The stability of the labour share in the non-market sector reflects to a large extent the national account con-
vention that value added in the government sector is equal to labour compensation plus consumption of fixed
capital, so that the labour share is highly stable and around 1.
Chart 5: Cumulated Change in Labour Share excl. Primary, Housing and Non-market
Sectors in 31 OECD Countries, 1995-2014
Unweighted average, in percentage points
Note: 1995-2014 for Austria, Belgium, Czech Republic, Germany, Denmark, Spain, Estonia, Finland, France, United King-
dom, Greece, Hungary, Israel, Italy, Japan, Lithuania, Latvia, Luxembourg, Netherlands, Norway, Poland, Portugal,
Slovakia, Slovenia and Sweden; 1995-2012 for New Zealand;1995-2013 for Australia and Korea; 1997-2012 for Can-
ada; 1998-2014 for Ireland and United States.
Source: OECD National Accounts Database.
��
��
��
��
�
�
�
�
��� ��� ���� ���� ���� ��� ��� ���� ���� ����
� ������������
�������
��������������
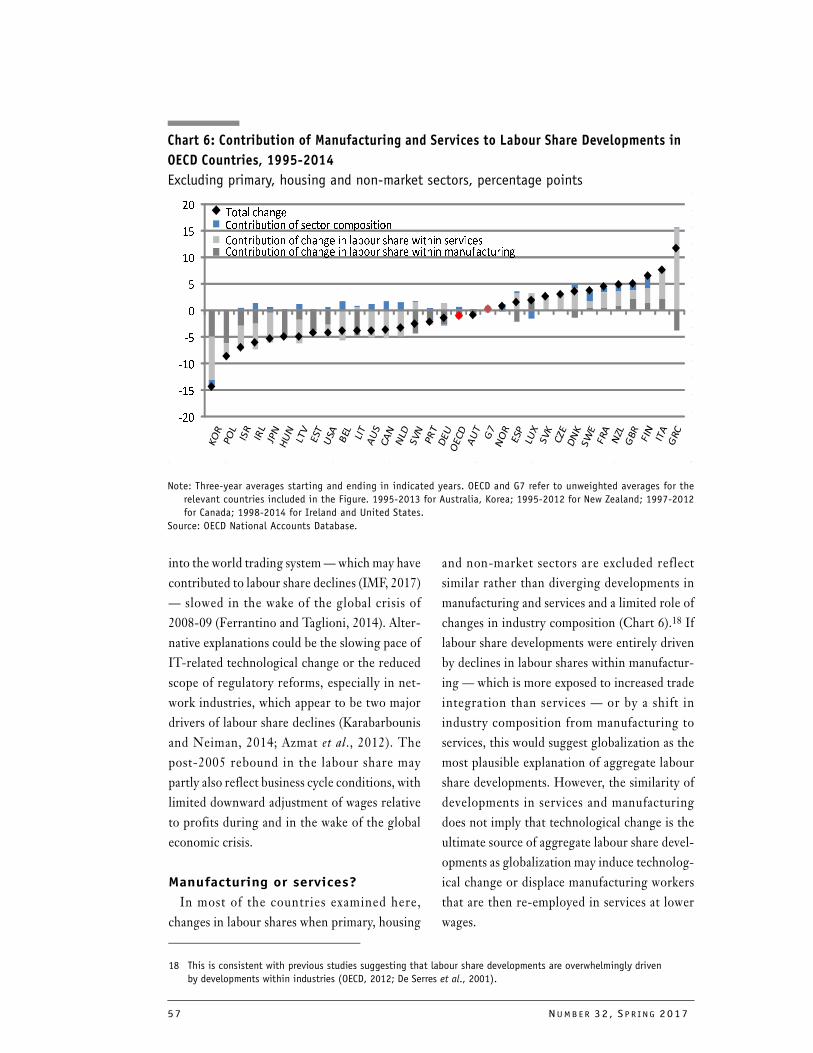
57 NUMB E R 32 , S P R I NG 2017
into the world trading system — which may have
contributed to labour share declines (IMF, 2017)
— slowed in the wake of the global crisis of
2008-09 (Ferrantino and Taglioni, 2014). Alter-
native explanations could be the slowing pace of
IT-related technological change or the reduced
scope of regulatory reforms, especially in net-
work industries, which appear to be two major
drivers of labour share declines (Karabarbounis
and Neiman, 2014; Azmat et al., 2012). The
post-2005 rebound in the labour share may
partly also reflect business cycle conditions, with
limited downward adjustment of wages relative
to profits during and in the wake of the global
economic crisis.
Manufacturing or services?
In most of the countries examined here,
changes in labour shares when primary, housing
and non-market sectors are excluded reflect
similar rather than diverging developments in
manufacturing and services and a limited role of
changes in industry composition (Chart 6).18 If
labour share developments were entirely driven
by declines in labour shares within manufactur-
ing — which is more exposed to increased trade
integration than services — or by a shift in
industry composition from manufacturing to
services, this would suggest globalization as the
most plausible explanation of aggregate labour
share developments. However, the similarity of
developments in services and manufacturing
does not imply that technological change is the
ultimate source of aggregate labour share devel-
opments as globalization may induce technolog-
ical change or displace manufacturing workers
that are then re-employed in services at lower
wages.
18 This is consistent with previous studies suggesting that labour share developments are overwhelmingly driven
by developments within industries (OECD, 2012; De Serres et al., 2001).
Chart 6: Contribution of Manufacturing and Services to Labour Share Developments in
OECD Countries, 1995-2014
Excluding primary, housing and non-market sectors, percentage points
Note: Three-year averages starting and ending in indicated years. OECD and G7 refer to unweighted averages for the
relevant countries included in the Figure. 1995-2013 for Australia, Korea; 1995-2012 for New Zealand; 1997-2012
for Canada; 1998-2014 for Ireland and United States.
Source: OECD National Accounts Database.
���
���
���
��
�
�
��
��
��
����� ����������������������
����� ��������������������� �������������������
����� ��������������������� ��������������� ��� ���
������������
���
���
���
��
�
�
��
��
��
����� ����������������������
����� ����������������� �����������������������
����� ����������������� �������������������������
�����������
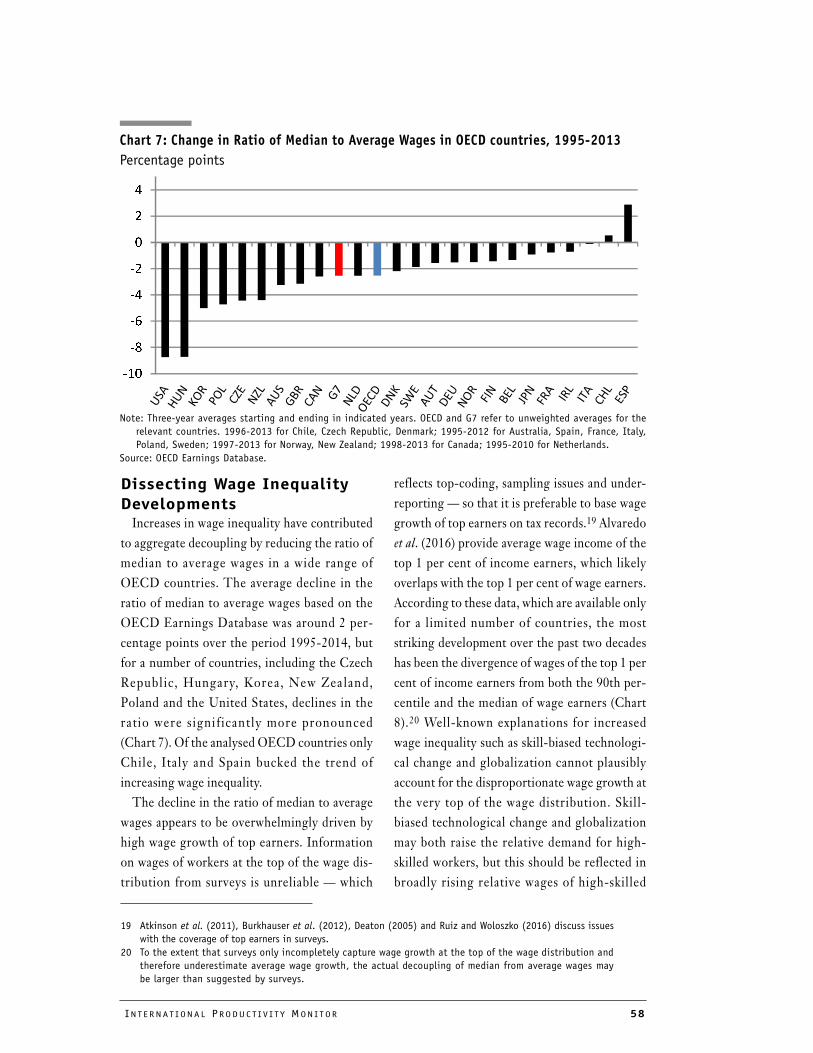
INT E R N A T I ON A L PRO DU C T I V I T Y MON I T OR 58
���
��
��
��
��
�
�
�
Dissecting Wage Inequality Developments
Increases in wage inequality have contributed
to aggregate decoupling by reducing the ratio of
median to average wages in a wide range of
OECD countries. The average decline in the
ratio of median to average wages based on the
OECD Earnings Database was around 2 per-
centage points over the period 1995-2014, but
for a number of countries, including the Czech
Republic, Hungary, Korea, New Zealand,
Poland and the United States, declines in the
ratio were s ignificantly more pronounced
(Chart 7). Of the analysed OECD countries only
Chile, Italy and Spain bucked the trend of
increasing wage inequality.
The decline in the ratio of median to average
wages appears to be overwhelmingly driven by
high wage growth of top earners. Information
on wages of workers at the top of the wage dis-
tribution from surveys is unreliable — which
reflects top-coding, sampling issues and under-
reporting — so that it is preferable to base wage
growth of top earners on tax records.19 Alvaredo
et al. (2016) provide average wage income of the
top 1 per cent of income earners, which likely
overlaps with the top 1 per cent of wage earners.
According to these data, which are available only
for a limited number of countries, the most
striking development over the past two decades
has been the divergence of wages of the top 1 per
cent of income earners from both the 90th per-
centile and the median of wage earners (Chart
8).20 Well-known explanations for increased
wage inequality such as skill-biased technologi-
cal change and globalization cannot plausibly
account for the disproportionate wage growth at
the very top of the wage distribution. Skill-
biased technological change and globalization
may both raise the relative demand for high-
skilled workers, but this should be reflected in
broadly rising relative wages of high-skilled
19 Atkinson et al. (2011), Burkhauser et al. (2012), Deaton (2005) and Ruiz and Woloszko (2016) discuss issues
with the coverage of top earners in surveys.
20 To the extent that surveys only incompletely capture wage growth at the top of the wage distribution and
therefore underestimate average wage growth, the actual decoupling of median from average wages may
be larger than suggested by surveys.
Chart 7: Change in Ratio of Median to Average Wages in OECD countries, 1995-2013
Percentage points
Note: Three-year averages starting and ending in indicated years. OECD and G7 refer to unweighted averages for the
relevant countries. 1996-2013 for Chile, Czech Republic, Denmark; 1995-2012 for Australia, Spain, France, Italy,
Poland, Sweden; 1997-2013 for Norway, New Zealand; 1998-2013 for Canada; 1995-2010 for Netherlands.
Source: OECD Earnings Database.
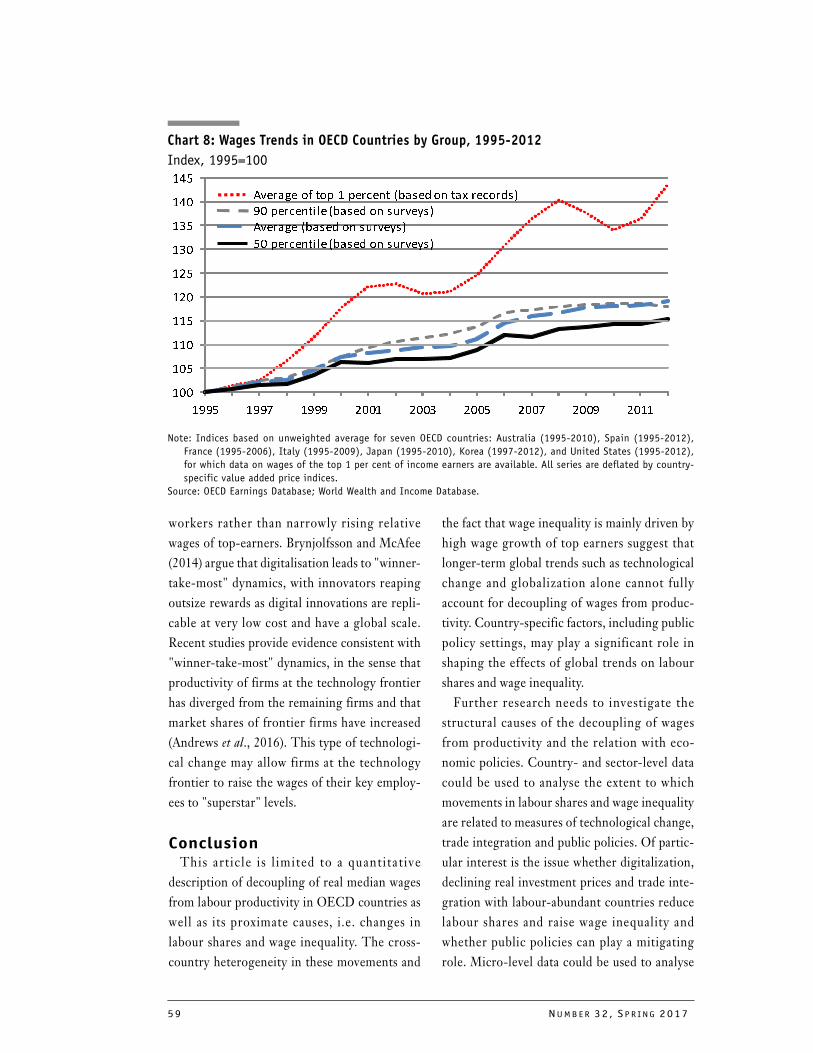
59 NUMB E R 32 , S P R I NG 2017
workers rather than narrowly rising relative
wages of top-earners. Brynjolfsson and McAfee
(2014) argue that digitalisation leads to "winner-
take-most" dynamics, with innovators reaping
outsize rewards as digital innovations are repli-
cable at very low cost and have a global scale.
Recent studies provide evidence consistent with
"winner-take-most" dynamics, in the sense that
productivity of firms at the technology frontier
has diverged from the remaining firms and that
market shares of frontier firms have increased
(Andrews et al., 2016). This type of technologi-
cal change may allow firms at the technology
frontier to raise the wages of their key employ-
ees to "superstar" levels.
ConclusionThis artic le is l imited to a quantitative
description of decoupling of real median wages
from labour productivity in OECD countries as
well as its proximate causes, i.e. changes in
labour shares and wage inequality. The cross-
country heterogeneity in these movements and
the fact that wage inequality is mainly driven by
high wage growth of top earners suggest that
longer-term global trends such as technological
change and globalization alone cannot fully
account for decoupling of wages from produc-
tivity. Country-specific factors, including public
policy settings, may play a significant role in
shaping the effects of global trends on labour
shares and wage inequality.
Further research needs to investigate the
structural causes of the decoupling of wages
from productivity and the relation with eco-
nomic policies. Country- and sector-level data
could be used to analyse the extent to which
movements in labour shares and wage inequality
are related to measures of technological change,
trade integration and public policies. Of partic-
ular interest is the issue whether digitalization,
declining real investment prices and trade inte-
gration with labour-abundant countries reduce
labour shares and raise wage inequality and
whether public policies can play a mitigating
role. Micro-level data could be used to analyse
Chart 8: Wages Trends in OECD Countries by Group, 1995-2012
Index, 1995=100
Note: Indices based on unweighted average for seven OECD countries: Australia (1995-2010), Spain (1995-2012),
France (1995-2006), Italy (1995-2009), Japan (1995-2010), Korea (1997-2012), and United States (1995-2012),
for which data on wages of the top 1 per cent of income earners are available. All series are deflated by country-
specific value added price indices.
Source: OECD Earnings Database; World Wealth and Income Database.
���
���
���
���
���
���
���
���
���
���
���� ���� ���� ���� ���� ���� ���� ���� ����
�� ���������������������� �������� ����������
���������������� ��������������
�� �� �� ��������������
���������������� ��������������
INT E R N A T I ON A L PRO DU C T I V I T Y MON I T OR 60
the transmission of productivity gains to wages
at the firm level, in particular whether macro-
level decoupling reflects changes in the compo-
sition of firms or changes within firms and the
role of public policies in these developments.
ReferencesAlvaredo F., A. B. Atkinson and S. Morelli (2016)
"The Challenge of Measuring UK Wealth Ine-quality in the 2000s," Fiscal Studies, Vol. 37, No. 1, pp. 13-33.
Andrews D., C. Criscuolo and P. Gal (2016) "The Global Productivity Slowdown, Technology Divergence and Public Policy: A Firm Level Perspective," OECD Economics Department Working Paper for WP1, ECO/CPE/WP1(2016)26.
Atkinson, A., T. Piketty, and E. Saez (2011) "Top Incomes in the Long Run of History," Journal of Economic Literature, Vol. 49, No. 1, pp. 3-71.
Azmat, G., A. Manning and J. Van Reenen (2012) "Privatization and the Decline of Labour's Share: International Evidence from Network Industries," Economica, No. 79/315, pp. 470-92.
Bivens, J. and L. Mishel (2015) "Understanding the Historic Divergence Between Productivity and a Typical Worker's Pay," EPI Briefing Papers, No. 406, Economic Policy Institute, Washington.
Bridgman, B. (2014) “Is Labor's Loss Capital's Gain? Gross versus Net Labor Shares,” Bureau of Eco-nomic Analysis, mimeo, October.
Brynjolfsson, E. and A. McAfee (2014) “The Second Machine Age - Work, Progress, and Prosperity in a Time of Brilliant Technologies,” WW Norton & Company.
Burkhauser, R., S. Feng, S. Jenkins, and J. Larrimore (2012) "Recent Trends in Top Incomes Shares in the United States: Reconciling Estimates from March CPS and IRS Tax Return Data," Review of Economics and Statistics, Vol. XCIV, pp. 371-388.
Cho, T., S. Hwang and P. Schreyer (2017) "Has the Labour Share Declined? It Depends," OECD Statistics Working Papers No. 2017/01, OECD Publishing, Paris.
Deaton, A. (2005) "Measuring Poverty in a Growing World (or Measuring Growth in a Poor World)," Review of Economics and Statistics, Vol. LXXXVII, pp. 1-19.
De Serres, A., S. Scarpetta and C. de la Maisonneuve (2001) "Falling Wage Shares in Europe and the United States: How Important is Aggregation Bias?" Empirica, Vol. 28, pp. 375-400.
Feldstein, M. S. (2008) "Did Wages Reflect the Growth in Productivity?" NBER Working
Paper, No. 13953, National Bureau of Economic Research.
Ferrantino, M. and D. Taglioni (2014) "Global Value Chains in the Current Trade Slowdown," World Bank Economic Premise, No. 137.
IMF (2017) “Understanding the Downward Trend in Labor Income Shares,” in Chaper 3 in World Eco-nomic Outlook April.
International Labour Organisation (2015a) “The Labour Share in G20 Economies,” ILO, IMF, OECD, WB, Report prepared for the G20 Employment Working Group Antalya, Turkey, 26-27 February.
International Labour Organisation (2015b) “Income Inequality and Labour Income Share in G20 countries: Trends, Impacts and Causes,” ILO, IMF, OECD, WB, Report prepared for the G20 Employment Ministeres Meeting and Joint Meeting with the G20 Finance Ministers, Ancara, Turkey, 3-4 September.
Karabarbounis, L. and B. Neiman (2014) "The Glo-bal Decline of the Labour Share," Quarterly Journal of Economics, Vol. 129, No. 1, pp. 61-103.
Murtin, F. and M. Mira d'Ercole (2015) "Household Wealth Inequality Across OECD Countries: New OECD Evidence," OECD Statistics Brief , No. 21, OECD Publishing, Paris.
OECD (2012) “Labour Losing to Capital: What Explains the Declining Labour Share?” Chapter 3 in OECD Employment Outlook, Publishing, Paris.
Pionnier, P-A. and E. Guidetti (2015) "Comparing Profit Shares in Value-Added in Four OECD Countries: Towards More Harmonized National Accounts," Statistics Directorate Working Papers, No. 61, OECD Publishing, Paris.
Rognlie, M. (2015) "Deciphering the Fall and Rise in the Net Capital Share," Brookings Papers on Eco-nomic Activity, March.
Ruiz, N. and N. Woloszko (2016) "What Do House-hold Surveys Suggest About the Top 1% Incomes and Inequality in OECD Countries?" OECD Economics Department Working Papers, No. 1265, OECD Publishing, Paris.
Sharpe, A., J-F. Arsenault and P. Harrison (2008) "Why Have Real Wages Lagged Labour Produc-tivity Growth in Canada?" International Produc-tivity Monitor, No. 17, Fall, 16-27.
Sierminska, E. and M. Medgyesi (2013) "The Distri-bution of Wealth Between Households," Research note, No. 11, European Commission.
Sharpe and Uguccioni (2017) "Decomposing the Productivity-Wage Nexus in Selected OECD Countries, 1986-2013," International Productiv-ity Monitor, Vol. 32, Spring.
INT E R N A T I ON A L PRO DU C T I V I T Y MON I T OR 61
The Relationship Between Global Value Chains and Productivity
Chiara Criscuolo
OECD
Jonathan Timmis
OECD1
ABSTRACT
We review the evidence linking Global Value Chains (GVCs) and productivity. GVCs are a
key feature of the world economy, with production increasingly fragmented across borders.
However research has uncovered that GVCs are not primarily global in nature, but focused
around regional clusters of production, and services and multinationals (MNEs) play a key
role in these networks. A broad literature using both industry and firm-level data has
uncovered that participating in GVCs can stimulate productivity growth through a myriad of
channels. These include the potential for firm specialisation in core tasks, access to imported
inputs, knowledge spillovers from foreign firms and pro-competitive effects of foreign
competition. However, there are many potential obstacles to seizing the opportunities for
growth. The changing organisation of production across firms and countries emphasises the
importance of some well-established policy levers (such as trade policy) as well as some of
those previously under-explored (such as domestic service market competition).
Embeddedness within GVCs may also expose firms to new sources of risk and affect
resilience of economies, as a shock to one part of the supply chain can propagate throughout
production networks.
Global Value Chains (GVCs) are a key feature
of the world economy. Production is increas-
ingly fragmented across country borders, with
various parts of the production process, from
design to distribution, segmented across differ-
ent countries (Baldwin, 2012). Firms are part of
complex production networks that embody
diverse goods and services inputs from other
domestic and foreign firms.2 Trade flows of any
firm and country embody the value-added of a
myriad of different countries and suppliers fur-
ther up the value chain. This article provides a
brief overview of what we currently know about
the links between GVCs and productivity.
1 Chiara Criscuolo is a Senior Economist, and Jonathan Timmis is an Economist, within the Directorate for Sci-
ence Technology and Innovation for the OECD. The authors would like to thank Nick Johnstone, Dirk Pilat,
Andy Wyckoff, Giuseppe Nicoletti, participants at the 2016 Conference of the Global Forum on Productivity,
three anonymous referees and the editor for helpful comments and suggestions. The opinions expressed and
arguments employed herein are those of the authors and do not necessarily reflect the official views of the
OECD or of the governments of its member countries. The statistical data for Israel are supplied by and under
the responsibility of the relevant Israeli authorities. The use of such data by the OECD is without prejudice to
the status of the Golan Heights, East Jerusalem and Israeli settlements in the West Bank under the terms of
international law. Emails: [email protected] and [email protected]
2 Richard Baldwin calls this "the second great unbundling," i.e. the end of the need to perform most pro-
duction stages next to each other: because of rapidly falling communication and coordination costs, pro-
duction can be sliced and diced into separate fragments that can be spread around the globe.
62 NUMB E R 32 , S P R I NG 2017
GVCs reflect the segmentation of production
across multiple countries.3 Part of the literature
often focuses on the outsourcing/offshoring
aspect of GVCs, measured by gross trade in
intermediate inputs (goods or services).4 How-
ever, GVC participation is much wider than
simply trading intermediate goods or offshor-
ing. The availability of inter-country input-out-
put tables has enabled different measures of
GVC participation that reflect foreign value
added that is both directly and indirectly
embodied in trade.5 Whilst the offshoring deci-
sion of inputs is clearly relevant, backward GVC
participation also reflects indirect linkages along
the whole supply chain network (such as suppli-
ers of suppliers etc.), reflecting the ultimate
sources of value-added. In addition, offshoring
concerns only the sourcing of inputs, but for-
ward GVC participation reflects the destination
of value added, i.e. whether domestic value
added is used in the exports of third countries
(customers of customers).
The arrival of new trade in value-added met-
rics has uncovered that GVCs are becoming an
increasingly important feature of the world
economy, allowing measurement of all the
sources of value-added ultimately embedded in
exports. These metrics are an alternative way of
expressing trade flows. Instead of being based on
the source of gross trade observed at the border,
these value-added metrics reflect the sources of
value-added embodied in these gross flows.6
They show that a substantial proportion of
value-added comes from foreign firms and sec-
tors — the so-called measure of "GVC partici-
pat ion" (wh ich may be a c ro s s d i f f e r ent
unaffiliated firms-between-firm trade — or
between foreign affiliates of MNEs — within-
firm trade). Production is increasingly clustered
in regional supply chains, and services and mul-
tinationals (MNEs) play a key role in these net-
works.
The evidence presented in this article derives
from complementary industry and firm-level
sources. A small, but growing, body of work has
begun to use these newer industry-level mea-
sures to examine links between GVC participa-
tion and productivity (e.g. Contantinecu et al.,
2017; Kummritz, 2016; Taglioni and Winkler,
2016). These build upon earlier studies using
industry-level measures of offshoring from the
perspective of the offshoring country (e.g.
Egger and Egger, 2006; Amiti and Wei, 2009;
Winkler, 2010). In contrast, the recent avail-
ability of detailed firm-level data has allowed a
deep examination of the productivity mecha-
nisms for some aspects of GVC participation,
such as firm offshoring, gross trade in goods and
foreign direct investment (FDI). However, stud-
ies examining broader aspects of GVCs, such as
the role of services or intangible inputs and also
indirect participation in GVCs at the firm level
(for example as a domestic supplier of exporters)
are only recently being uncovered (e.g. Dhyne
and Rubinova, 2016).
This research has uncovered that participat-
ing in GVCs can stimulate productivity growth
through many possible channels, as we outline
3 A range of related concepts have been introduced, including offshoring (Feenstra and Hanson, 1996), trade in
intermediates (Antweiler and Trefler, 2002), fragmentation (Deardorff, 2001; Jones and Kierzkowski, 2001,
Arndt and Kierzkowski, 2001), slicing the value chain (Krugman, 1995); trade in tasks (Grossman and Rossi
Hansberg, 2008 ) and vertical specialization (Hummels, Ishii, and Yi, 2001).
4 For example, see materials offshoring measures of Feenstra and Hanson (1996, 1999) or services offshor-
ing of Amiti and Wei (2009).
5 See for example, Johnson and Noguera, 2012, Koopman et al., 2014, which build on the vertical special-
ization measures of Hummels et al., 2001.
6 Accordingly, aggregating these different domestic and foreign sources of value-added results in gross
trade itself.
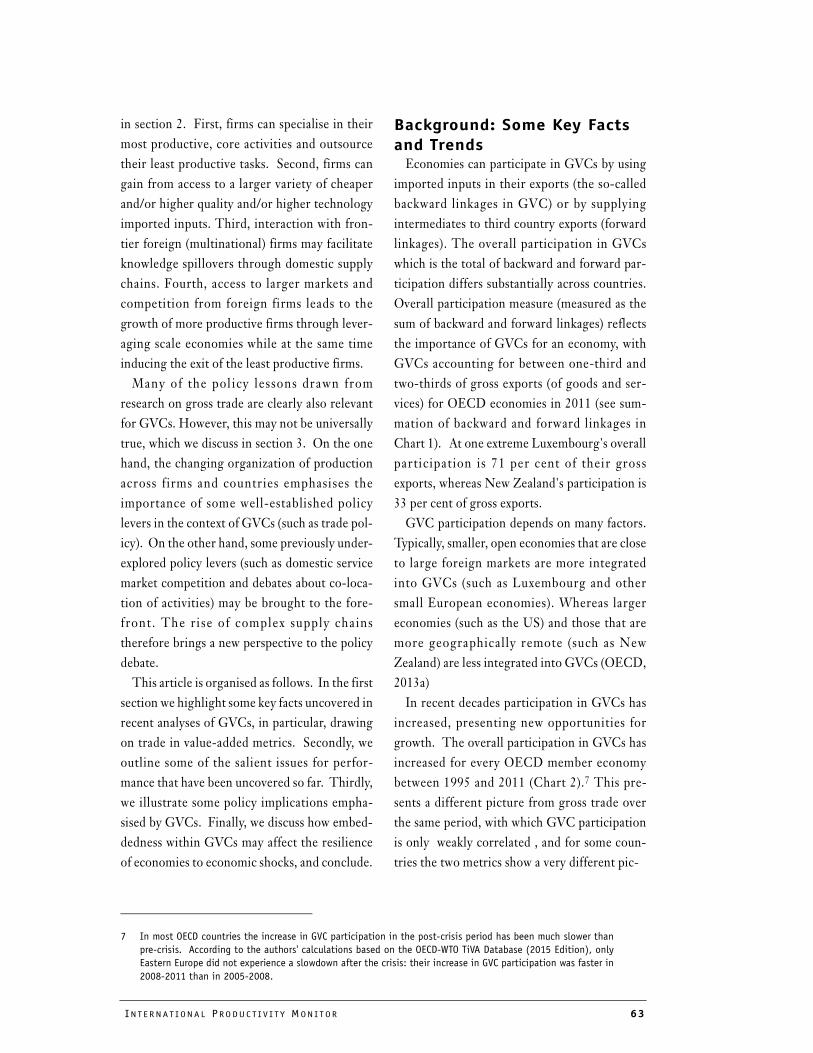
INT E R N A T I ON A L PRO DU C T I V I T Y MON I T OR 63
in section 2. First, firms can specialise in their
most productive, core activities and outsource
their least productive tasks. Second, firms can
gain from access to a larger variety of cheaper
and/or higher quality and/or higher technology
imported inputs. Third, interaction with fron-
tier foreign (multinational) firms may facilitate
knowledge spillovers through domestic supply
chains. Fourth, access to larger markets and
competition from foreign firms leads to the
growth of more productive firms through lever-
aging scale economies while at the same time
inducing the exit of the least productive firms.
Many of the pol icy lessons drawn from
research on gross trade are clearly also relevant
for GVCs. However, this may not be universally
true, which we discuss in section 3. On the one
hand, the changing organization of production
across firms and countries emphasises the
importance of some well-established policy
levers in the context of GVCs (such as trade pol-
icy). On the other hand, some previously under-
explored policy levers (such as domestic service
market competition and debates about co-loca-
tion of activities) may be brought to the fore-
front . The ri se of complex supply chains
therefore brings a new perspective to the policy
debate.
This article is organised as follows. In the first
section we highlight some key facts uncovered in
recent analyses of GVCs, in particular, drawing
on trade in value-added metrics. Secondly, we
outline some of the salient issues for perfor-
mance that have been uncovered so far. Thirdly,
we illustrate some policy implications empha-
sised by GVCs. Finally, we discuss how embed-
dedness within GVCs may affect the resilience
of economies to economic shocks, and conclude.
Background: Some Key Facts and TrendsEconomies can participate in GVCs by using
imported inputs in their exports (the so-called
backward linkages in GVC) or by supplying
intermediates to third country exports (forward
linkages). The overall participation in GVCs
which is the total of backward and forward par-
ticipation differs substantially across countries.
Overall participation measure (measured as the
sum of backward and forward linkages) reflects
the importance of GVCs for an economy, with
GVCs accounting for between one-third and
two-thirds of gross exports (of goods and ser-
vices) for OECD economies in 2011 (see sum-
mation of backward and forward linkages in
Chart 1). At one extreme Luxembourg's overall
participation is 71 per cent of their gross
exports, whereas New Zealand's participation is
33 per cent of gross exports.
GVC participation depends on many factors.
Typically, smaller, open economies that are close
to large foreign markets are more integrated
into GVCs (such as Luxembourg and other
small European economies). Whereas larger
economies (such as the US) and those that are
more geographically remote (such as New
Zealand) are less integrated into GVCs (OECD,
2013a)
In recent decades participation in GVCs has
increased, presenting new opportunities for
growth. The overall participation in GVCs has
increased for every OECD member economy
between 1995 and 2011 (Chart 2).7 This pre-
sents a different picture from gross trade over
the same period, with which GVC participation
is only weakly correlated , and for some coun-
tries the two metrics show a very different pic-
7 In most OECD countries the increase in GVC participation in the post-crisis period has been much slower than
pre-crisis. According to the authors' calculations based on the OECD-WTO TiVA Database (2015 Edition), only
Eastern Europe did not experience a slowdown after the crisis: their increase in GVC participation was faster in
2008-2011 than in 2005-2008.
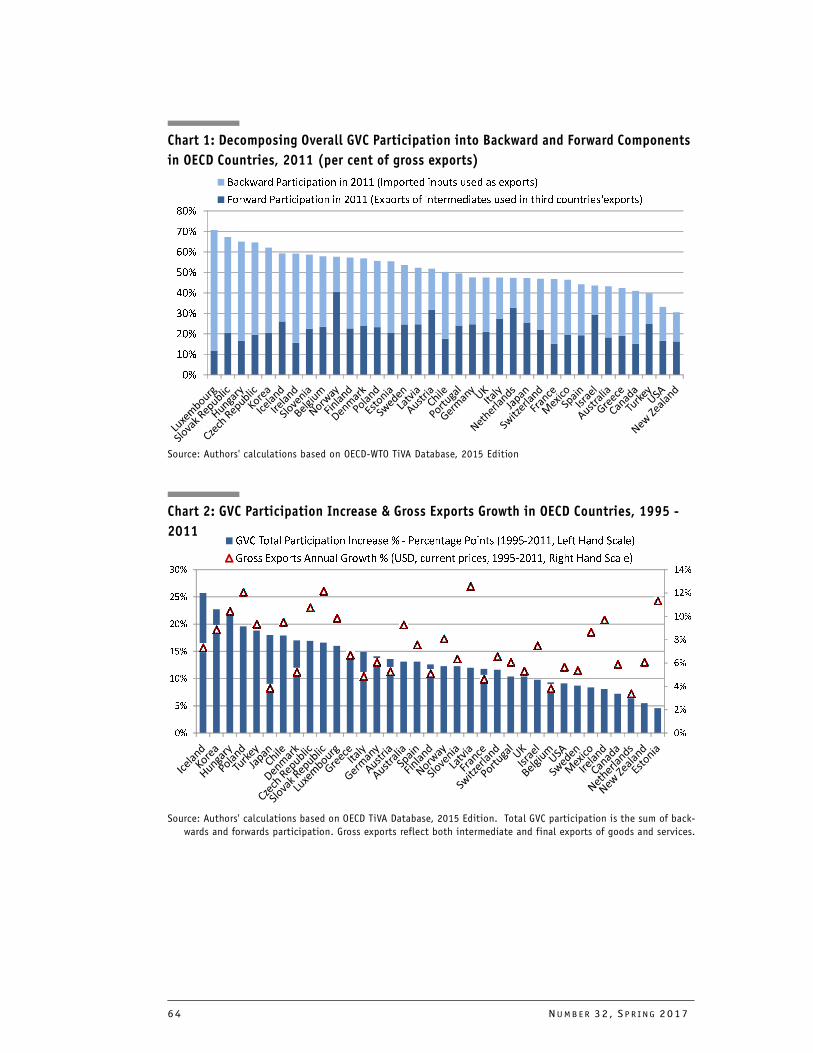
64 NUMB E R 32 , S P R I NG 2017
��
��
��
��
��
���
���
���
��
��
���
���
���
���
��
������������� ���������� ��������� �� ��������������������������������� �! ��"
������#$������%��&�����'�(����)!*�� &��������� ���������������+��(����� �! ��"
Chart 2: GVC Participation Increase & Gross Exports Growth in OECD Countries, 1995 -
2011
Source: Authors' calculations based on OECD TiVA Database, 2015 Edition. Total GVC participation is the sum of back-
wards and forwards participation. Gross exports reflect both intermediate and final exports of goods and services.
��
���
���
���
���
���
���
��
��
�� ����������� ������������������������������������������������
!������������ �����������������"��������#������������������������$���� ��������%�������
Chart 1: Decomposing Overall GVC Participation into Backward and Forward Components
in OECD Countries, 2011 (per cent of gross exports)
Source: Authors' calculations based on OECD-WTO TiVA Database, 2015 Edition
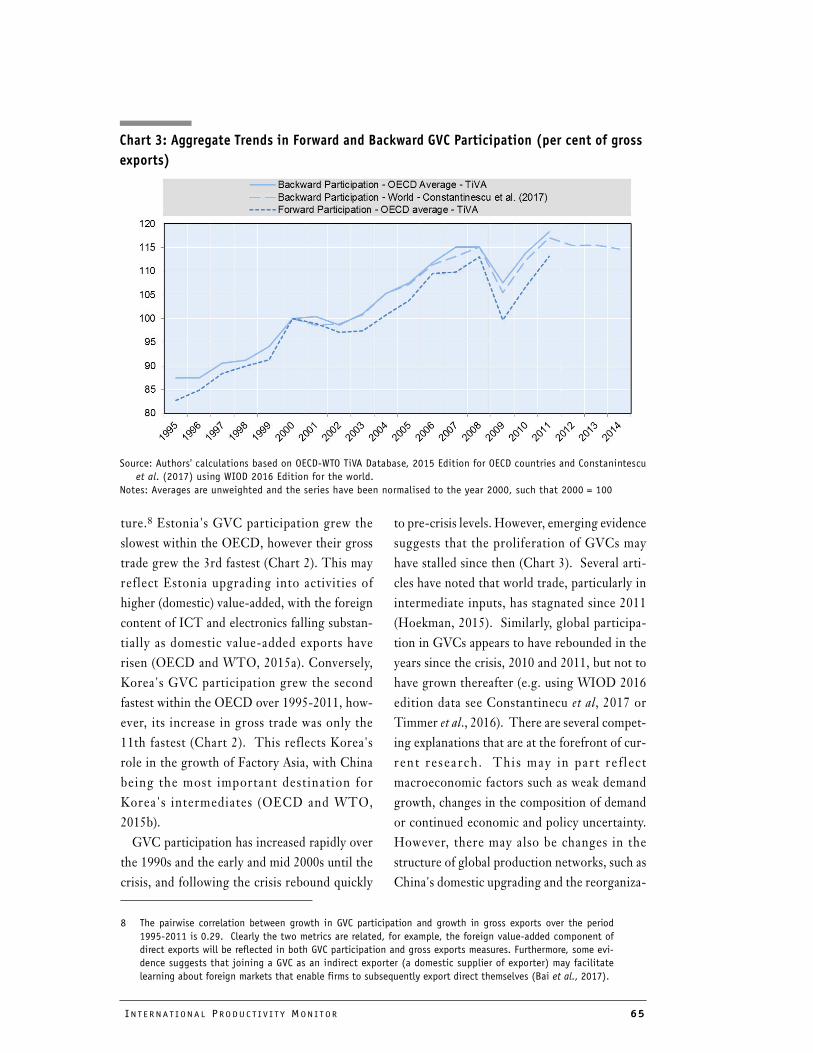
INT E R N A T I ON A L PRO DU C T I V I T Y MON I T OR 65
Chart 3: Aggregate Trends in Forward and Backward GVC Participation (per cent of gross
exports)
Source: Authors' calculations based on OECD-WTO TiVA Database, 2015 Edition for OECD countries and Constanintescu
et al. (2017) using WIOD 2016 Edition for the world.
Notes: Averages are unweighted and the series have been normalised to the year 2000, such that 2000 = 100
ture.8 Estonia's GVC participation grew the
slowest within the OECD, however their gross
trade grew the 3rd fastest (Chart 2). This may
reflect Estonia upgrading into activities of
higher (domestic) value-added, with the foreign
content of ICT and electronics falling substan-
tially as domestic value-added exports have
risen (OECD and WTO, 2015a). Conversely,
Korea's GVC participation grew the second
fastest within the OECD over 1995-2011, how-
ever, its increase in gross trade was only the
11th fastest (Chart 2). This reflects Korea's
role in the growth of Factory Asia, with China
being the most important destination for
Korea's intermediates (OECD and WTO,
2015b).
GVC participation has increased rapidly over
the 1990s and the early and mid 2000s until the
crisis, and following the crisis rebound quickly
to pre-crisis levels. However, emerging evidence
suggests that the proliferation of GVCs may
have stalled since then (Chart 3). Several arti-
cles have noted that world trade, particularly in
intermediate inputs, has stagnated since 2011
(Hoekman, 2015). Similarly, global participa-
tion in GVCs appears to have rebounded in the
years since the crisis, 2010 and 2011, but not to
have grown thereafter (e.g. using WIOD 2016
edition data see Constantinecu et al, 2017 or
Timmer et al., 2016). There are several compet-
ing explanations that are at the forefront of cur-
rent resea rch. Thi s may in par t re f l ec t
macroeconomic factors such as weak demand
growth, changes in the composition of demand
or continued economic and policy uncertainty.
However, there may also be changes in the
structure of global production networks, such as
China's domestic upgrading and the reorganiza-
8 The pairwise correlation between growth in GVC participation and growth in gross exports over the period
1995-2011 is 0.29. Clearly the two metrics are related, for example, the foreign value-added component of
direct exports will be reflected in both GVC participation and gross exports measures. Furthermore, some evi-
dence suggests that joining a GVC as an indirect exporter (a domestic supplier of exporter) may facilitate
learning about foreign markets that enable firms to subsequently export direct themselves (Bai et al., 2017).
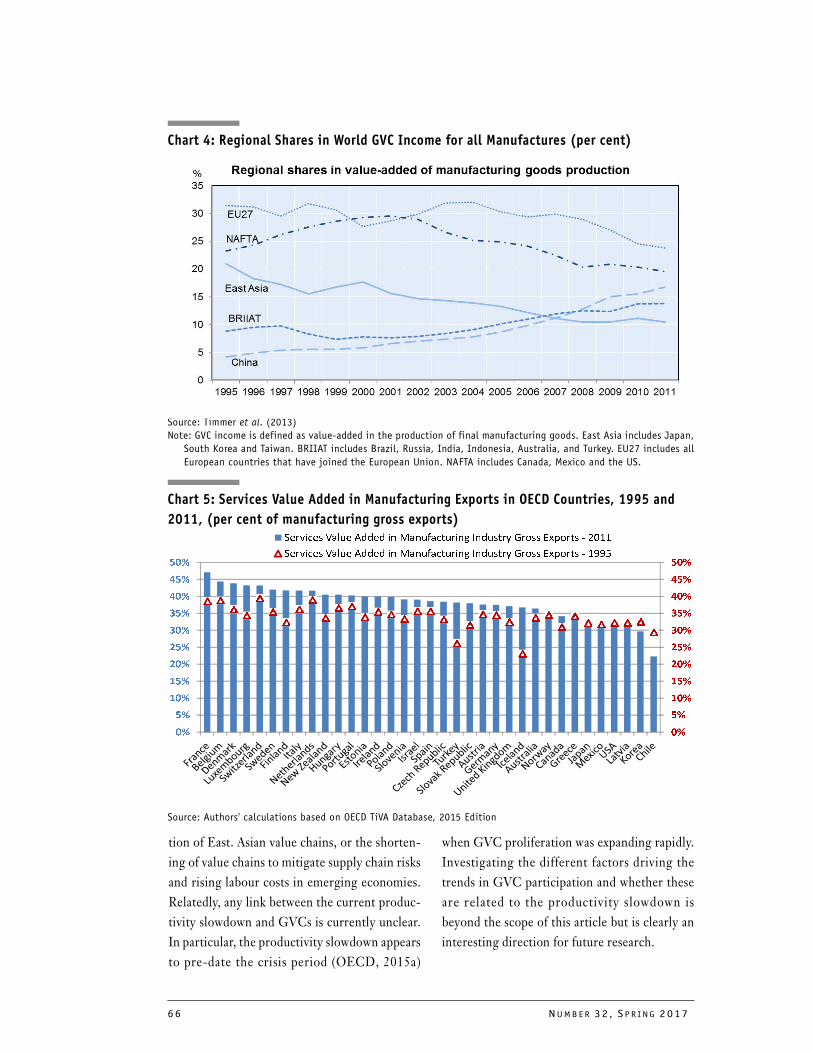
66 NUMB E R 32 , S P R I NG 2017
��
��
���
���
���
���
���
���
���
���
���
��
��
���
���
���
���
���
���
���
���
���
������������� �������������������������������������������� ����
������������� �������������������������������������������� ���
Chart 5: Services Value Added in Manufacturing Exports in OECD Countries, 1995 and
2011, (per cent of manufacturing gross exports)
Source: Authors' calculations based on OECD TiVA Database, 2015 Edition
tion of East. Asian value chains, or the shorten-
ing of value chains to mitigate supply chain risks
and rising labour costs in emerging economies.
Relatedly, any link between the current produc-
tivity slowdown and GVCs is currently unclear.
In particular, the productivity slowdown appears
to pre-date the crisis period (OECD, 2015a)
when GVC proliferation was expanding rapidly.
Investigating the different factors driving the
trends in GVC participation and whether these
are related to the productivity slowdown is
beyond the scope of this article but is clearly an
interesting direction for future research.
Chart 4: Regional Shares in World GVC Income for all Manufactures (per cent)
Source: Timmer et al. (2013)
Note: GVC income is defined as value-added in the production of final manufacturing goods. East Asia includes Japan,
South Korea and Taiwan. BRIIAT includes Brazil, Russia, India, Indonesia, Australia, and Turkey. EU27 includes all
European countries that have joined the European Union. NAFTA includes Canada, Mexico and the US.
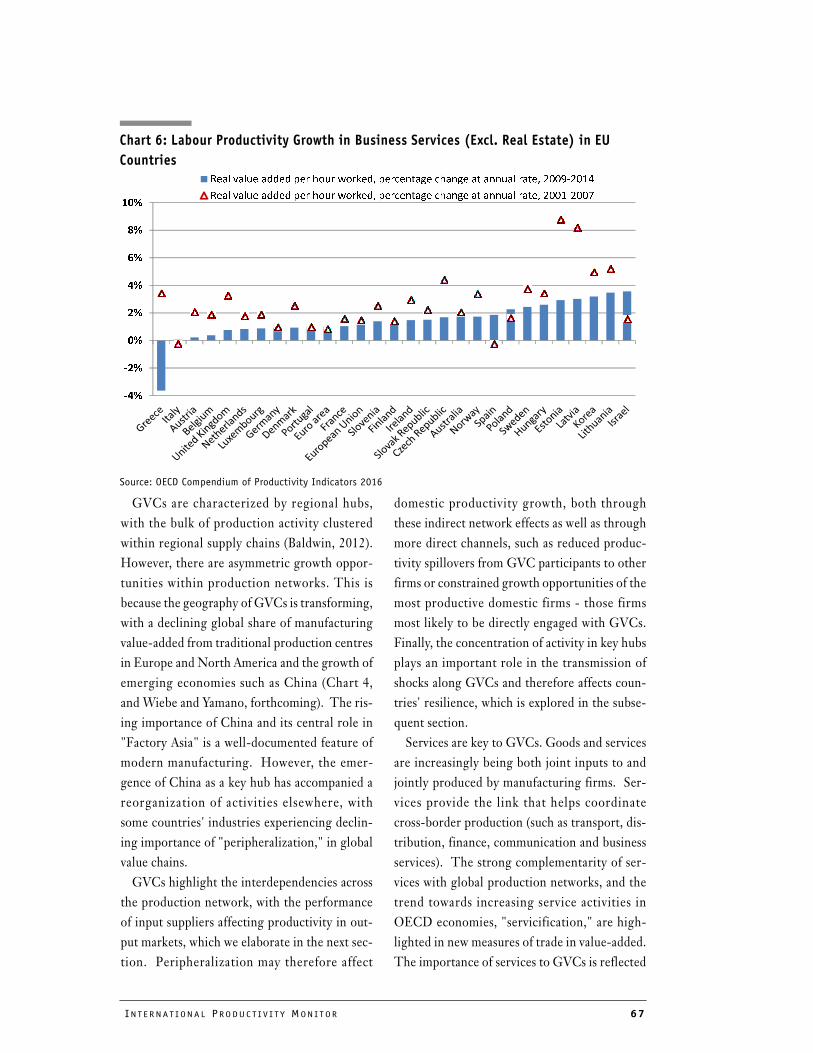
INT E R N A T I ON A L PRO DU C T I V I T Y MON I T OR 67
���
���
��
��
��
��
��
���
����������������������� ����������������������������������������������
����������������������� ����������������������������������������������
Chart 6: Labour Productivity Growth in Business Services (Excl. Real Estate) in EU
Countries
Source: OECD Compendium of Productivity Indicators 2016
GVCs are characterized by regional hubs,
with the bulk of production activity clustered
within regional supply chains (Baldwin, 2012).
However, there are asymmetric growth oppor-
tunities within production networks. This is
because the geography of GVCs is transforming,
with a declining global share of manufacturing
value-added from traditional production centres
in Europe and North America and the growth of
emerging economies such as China (Chart 4,
and Wiebe and Yamano, forthcoming). The ris-
ing importance of China and its central role in
"Factory Asia" is a well-documented feature of
modern manufacturing. However, the emer-
gence of China as a key hub has accompanied a
reorganization of activities elsewhere, with
some countries' industries experiencing declin-
ing importance of "peripheralization," in global
value chains.
GVCs highlight the interdependencies across
the production network, with the performance
of input suppliers affecting productivity in out-
put markets, which we elaborate in the next sec-
tion. Peripheralization may therefore affect
domestic productivity growth, both through
these indirect network effects as well as through
more direct channels, such as reduced produc-
tivity spillovers from GVC participants to other
firms or constrained growth opportunities of the
most productive domestic firms - those firms
most likely to be directly engaged with GVCs.
Finally, the concentration of activity in key hubs
plays an important role in the transmission of
shocks along GVCs and therefore affects coun-
tries' resilience, which is explored in the subse-
quent section.
Services are key to GVCs. Goods and services
are increasingly being both joint inputs to and
jointly produced by manufacturing firms. Ser-
vices provide the link that helps coordinate
cross-border production (such as transport, dis-
tribution, finance, communication and business
services). The strong complementarity of ser-
vices with global production networks, and the
trend towards increasing service activities in
OECD economies, "servicification," are high-
lighted in new measures of trade in value-added.
The importance of services to GVCs is reflected
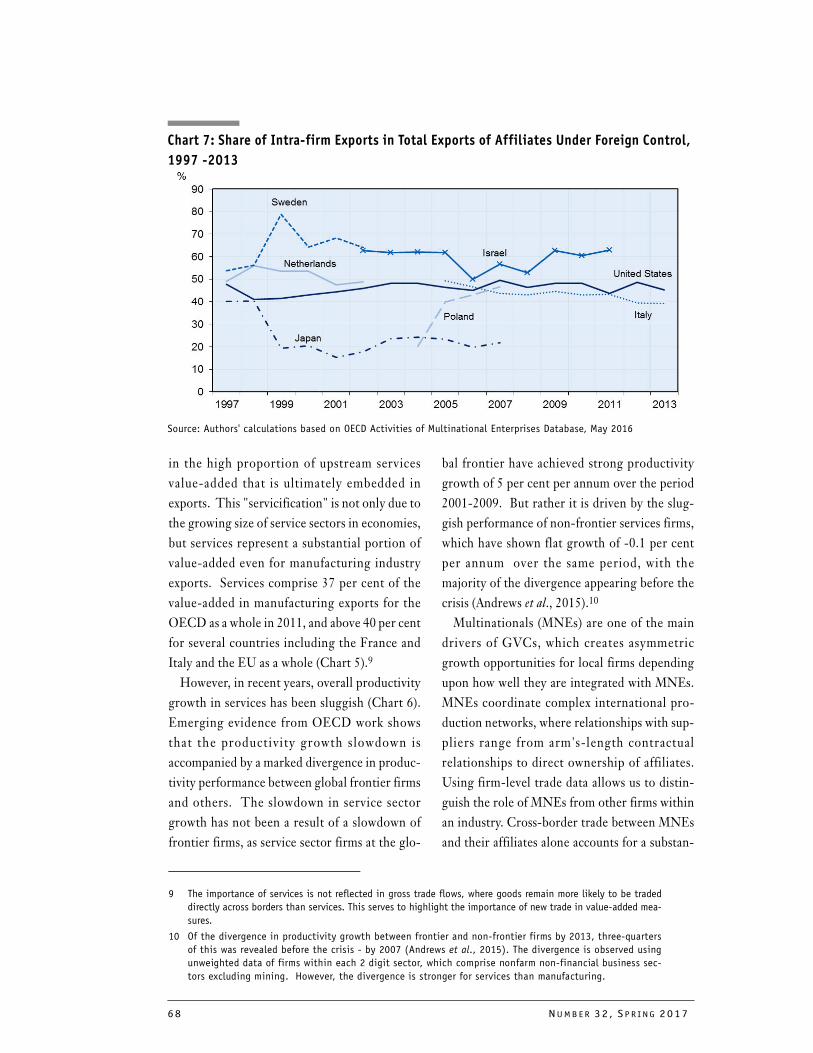
68 NUMB E R 32 , S P R I NG 2017
Chart 7: Share of Intra-firm Exports in Total Exports of Affiliates Under Foreign Control,
1997 -2013
Source: Authors' calculations based on OECD Activities of Multinational Enterprises Database, May 2016
in the high proportion of upstream services
value-added that is ultimately embedded in
exports. This "servicification" is not only due to
the growing size of service sectors in economies,
but services represent a substantial portion of
value-added even for manufacturing industry
exports. Services comprise 37 per cent of the
value-added in manufacturing exports for the
OECD as a whole in 2011, and above 40 per cent
for several countries including the France and
Italy and the EU as a whole (Chart 5).9
However, in recent years, overall productivity
growth in services has been sluggish (Chart 6).
Emerging evidence from OECD work shows
that the productivity growth slowdown is
accompanied by a marked divergence in produc-
tivity performance between global frontier firms
and others. The slowdown in service sector
growth has not been a result of a slowdown of
frontier firms, as service sector firms at the glo-
bal frontier have achieved strong productivity
growth of 5 per cent per annum over the period
2001-2009. But rather it is driven by the slug-
gish performance of non-frontier services firms,
which have shown flat growth of -0.1 per cent
per annum over the same period, with the
majority of the divergence appearing before the
crisis (Andrews et al., 2015).10
Multinationals (MNEs) are one of the main
drivers of GVCs, which creates asymmetric
growth opportunities for local firms depending
upon how well they are integrated with MNEs.
MNEs coordinate complex international pro-
duction networks, where relationships with sup-
pliers range from arm's-length contractual
relationships to direct ownership of affiliates.
Using firm-level trade data allows us to distin-
guish the role of MNEs from other firms within
an industry. Cross-border trade between MNEs
and their affiliates alone accounts for a substan-
9 The importance of services is not reflected in gross trade flows, where goods remain more likely to be traded
directly across borders than services. This serves to highlight the importance of new trade in value-added mea-
sures.
10 Of the divergence in productivity growth between frontier and non-frontier firms by 2013, three-quarters
of this was revealed before the crisis - by 2007 (Andrews et al., 2015). The divergence is observed using
unweighted data of firms within each 2 digit sector, which comprise nonfarm non-financial business sec-
tors excluding mining. However, the divergence is stronger for services than manufacturing.
INT E R N A T I ON A L PRO DU C T I V I T Y MON I T OR 69
tial portion of world trade in goods, comprising
nearly half of US exports (Chart 7). Although
data on MNE contribution to GVCs more
broadly are not directly available, emerging
research combining input-output and firm-level
data estimates that MNEs and their affiliates
abroad may account for one third of global pro-
duction and 50-60 per cent of global exports (De
Backer et al., 2017).
Participating in GVCs provides an opportu-
nity for knowledge spillovers from these multi-
nationals to local firms for two reasons. First,
MNE firms are typically the firms at the global
productivity frontier (OECD, 2015a). Second,
MNEs generate knowledge spillovers along the
value chain through sharing knowledge with
domestic suppliers and encouraging the adop-
tion of new practices (see Alfaro, (2014) for a
review of the academic literature). The mobility
of workers from MNEs to other domestic firms
can also be an important channel for knowledge
transfers, which can lead to productivity gains
for their new employers (Balsvik, 2011). How-
ever, such spillovers are unlikely to be realized
universally, as only firms with sufficient absorp-
tive capacity are likely to achieve the potentially
available productivity gains; we discuss this fur-
ther in the next section.
Key Implications for ProductivityUnderstanding the productivity effects of
GVCs is the focus of a growing literature. A
large body of research has used firm-level data
on trade in goods and foreign ownership to
uncover links between trade participation, off-
shoring, or multinational status and productiv-
ity. Far less is known about the link between
productivity and broader aspects of GVCs
shown to be important using industry GVC par-
ticipation metrics, such as indirect participation
in GVCs (as a supplier of exporters) or the role
of services and intangibles. However, new find-
ings are emerging using novel data on domestic
supplier networks of trading firms and input
linkages across industries and countries. In this
section we draw on this emerging literature
where possible, to highlight the pertinent per-
formance implications of GVCs that have been
uncovered so far.
Specialization, Offshoring and
Productivity
Specialization in tasks is an important source
of GVC productivity gains. The growth of
GVCs has led to increasing specialization in spe-
cific activities within value chains, with firms
often no longer part of complete domestic sup-
ply chains. Reductions in trade costs and inno-
vations in ICT have increased the scope of tasks
that can be offshored in recent years (OECD
and World Bank, 2015). By specializing in those
core tasks most efficiently provided by the firm,
and offshoring less efficient parts of the produc-
tion process abroad, firms can reap productivity
gains (Grossman and Rossi-Hansberg, 2008).
This specialization process is linked to the abil-
ity to import cheap, additional and/or higher
quality varieties of offshored inputs (which we
discuss in the following section), which could be
an improvement on previous in-house inputs, or
from efficiency gains from the restructuring of
internal processes (which we discuss in the sec-
tion on growth and upscaling).
Measuring offshoring is often problematic at
the firm-level, given limited information on the
precise tasks previously performed in-house or
intermediate inputs sourced from other domes-
tic firms. Accordingly, firm productivity studies
often employ industry-level measures of off-
shoring or proxies for firm offshoring, such as
firm imports of materials or services. Empiri-
cally these productivity gains have been shown
to extend to both the offshoring of manufactur-
ing production processes and service functions
70 NUMB E R 32 , S P R I NG 2017
( see for example , Ami t i and Wei , 2009 ;
Schwörer, 2013; Winkler, 2010).
Foreign Inputs
Trade in goods, services and intangible inputs
is at the heart of global value chains. The bulk of
trade is comprised not of final goods or services,
but of trade in intermediate parts and compo-
nents and intermediate services. Among OECD
economies , t rade in intermedia te inputs
accounted for 56 per cent of total goods trade
and 73 per cent of services trade over the period
1995-2005 (Miroudot et al., 2009). Firms can
integrate into GVCs by supplying intermediate
inputs for the exports of firms in other countries
or as users of foreign inputs in their own exports.
GVCs present a new means to access interna-
tional markets: economies need no longer build
complete supply chains at home; instead, they
can leverage foreign inputs in their production.
The available variety and quality of foreign
inputs (capital, labour and intermediates) can
positively impact firm productivity. The avail-
ability of previously unobtainable varieties of
imported inputs provides additional possibilities
for production, allowing firms to save on costs
or upgrade the quality of their inputs. Increases
in the available variety and quality of imported
intermediate goods and capital can therefore
positively impact firm productivity. A large lit-
erature finds that productivity gains in firms that
directly import these inputs (Amiti and Konings,
2007; Goldberg et al., 2010; Topalova and Khan-
delwal, 2011; Bas and Strauss-Kahn, 2015;
Halpern et al., 2015).
In addition, foreign competit ion in the
domestic input market may also lead to price
reductions or quality improvements for domes-
tic suppliers, benefiting users of domestic inputs
too. These pro-competitive effects in domestic
input markets can also lead to productivity gains
for firms that source inputs locally (Amiti and
Konings, 2007). Emerging evidence is also
revealing how the liberalization of service mar-
kets, particularly the entry of new foreign ser-
v i c e p r ov i de r s , c an l e ad t o s ubs t an t i a l
productivity gains in downstream manufactur-
ing firms (Arnold et al., 2011; Arnold et al.,
2016). However, firm-level research on how
users of domestic inputs are affected is not as
developed as research on firms that use foreign
inputs directly.
However, imported inputs also reflect the
embodiment of the skills, factors of production
and technologies used to produce them. These
skills, factors and technologies are embodied in
all prior stages of the value chain, which high-
lights the importance of measurement using
value-added (rather than gross) trade metrics.
Whilst research on this area is at a relatively
nascent stage, recent work at the OECD using
industry data highlights that the jobs embodied
in value-added exports are increasingly shifting
towards higher levels of skill (OECD, forthcom-
ing). Therefore imported inputs may allow
access to a greater variety of human capital than
is available domestically.11 Industries that
source intermediates that embody a higher
R&D knowledge content tend to have higher
total factor productivity in levels (Nishioka and
Ripoll, 2012), suggesting embodied R&D can be
a form of technology transfer to local firms.
MNEs are an important vehicle for provision
of foreign knowledge and services inputs to affil-
iates within the firm group. In Chart 7 earlier,
we saw that MNEs cross-border trade with their
affiliates accounts for a substantial portion of
world trade in goods. However, MNEs are also
an important source of knowledge and services
for their affiliates (OECD, World Bank and
11 Note however, that local skills remain pertinent for GVC participation, particularly for knowledge-intensive
activities, with ongoing OECD work directed in this area (OECD, World Bank and WTO, 2014; Jamet and Squic-
ciarini, 2016).
INT E R N A T I ON A L PRO DU C T I V I T Y MON I T OR 71
WTO, 2014). Moreover, the possession of stra-
tegic assets (such as investments in knowledge,
R&D and skills) can be an important motivation
for foreign direct investment (FDI), in order to
protect the use of these assets (see Antras and
Yeaple, 2014).12 MNEs may transfer knowledge
and services embodied in intermediate goods, as
highlighted above, or choose to provide direct
disembodied transfers to their affiliates, which
we consider in the next section (Keller and
Yeaple, 2013).
MNEs, Knowledge Spillovers and
Upgrading
GVCs are a well-established vehicle for pro-
ductivity spillovers to local firms. A substantial
part of GVC integration is mediated through
FDI, and such multinational enterprises are typ-
ically at the global frontier of productivity, inno-
vation and technology. Exposure to the global
frontier can provide an opportunity for local
firms to increase productivity through learning
about advanced technologies or superior organi-
zational and managerial practices (Ciuriak,
2013, Saia et al., 2015; Guadalupe et al, 2012).
A large literature has investigated FDI spill-
overs and arrives at a broad consensus in favour
of positive productivity spillovers to industries
that supply multinationals through backward
linkages (Javorcik, 2004), with little evidence
through other linkages (Havránek and Iršova,
2011; Alfaro, 2014).13 Lead firms tend to
demand more or better quality inputs from sup-
pliers and may directly share knowledge and
technology and encourage the adoption of new
practices to achieve this.
The literature generally uses aggregated
industry-level measures of linkages and little is
currently known about how spillovers are trans-
mitted firm-to-firm along the value chain.
Examining the diffusion of knowledge from the
frontier throughout supply chains may be a
fruitful application of new data on firm linkages
in production networks and further research in
this area would be valuable.
Knowledge acquisition is an important motive
for FDI, which may increase the scope for
knowledge diffusion. Firms may relocate some
activities, including innovation activities, to
obtain access to so-called strategic assets -
skilled workers, technological expertise, or the
presence of competitors and suppliers - and
learn from their experience (OECD, 2008).
Firms locate in leading edge countries close to
the technology frontier, in order to benefit from
the diffusion of advanced technologies (Griffith
et al, 2004). In addition, MNE acquisition of
foreign firms can lead to a relocation of innova-
tive activities to where they are most efficiently
undertaken and increase knowledge diffusion to
affiliates within the group (Stiebale, 2016).
Knowledge spillovers from the frontier accrue
asymmetrically, benefitting firms with sufficient
absorptive capacity. A prerequisite for local
firms to gain from spillovers is sufficient capac-
ity to absorb frontier technologies. By investing
in their own tacit knowledge, such as through
engaging in R&D, firms can increase their abil-
ity to absorb new technologies (Griffith et al,
2004). This can pose a particular challenge for
firms far from the frontier, with low absorptive
capacity, as they are unlikely to benefit from
exposure to frontier technologies (Saia et al.,
2015). In addition, positive spillovers may be
offset by MNEs crowding out some local firms,
at least in the short-term following entry of
MNEs (Aitken and Harrison, 1999; Kosová,
2010). The additional competition in output
12 This is because writing and enforcing contracts over the use of strategic assets with an arm's length supplier
may not be possible.
13 Less consistent evidence is found in favour of horizontal spillovers, to firms within the same industry, or
through forward linkages to firms downstream (Iršova and Havránek, 2013).
72 NUMB E R 32 , S P R I NG 2017
markets and increased demand for inputs may
lead to lower growth rates and exit of local firms
far from the frontier.
Investments in knowledge based capital is an
important dr iver o f GVC upgrading and
growth. Empirical evidence confirms the links
between innovation, value creation and eco-
nomic growth (OECD, 2010a). The value cre-
ated by a GVC is unevenly distributed and
depends on the ability of participants to supply
sophisticated and hard-to-imitate products and
services (OECD, 2013a). To upgrade the effi-
ciency of production processes or increase the
value-added of their products requires invest-
ment in organisational capital, skills and ICT to
complement the necessary product/process
innovations (OECD, 2013b). Value-added cre-
ation is distributed unevenly along the value
chain, with the highest value-added often relat-
ing to more upstream processes (such as R&D,
design) or more downstream processes (such as
marketing) rather than in the middle (such as
assembly). Increasingly, the bulk of the value
added of products or services stem from forms of
knowledge-based capital such as brands, basic
R&D, design and the complex integration of
software with new organisational processes
(OECD, 2013b). However, there are many
aspect s o f upgrad ing tha t ar e cur rent ly
unknown. In particular, we know little about the
extent of interdependencies between activities,
for instance, whether complex manufacturing
capabilities are a pre-requisite to engage in
high-value added activities like R&D, design
and marketing.
Growth and Upscaling
To participate directly in GVCs requires scale.
For the largest, most productive firms that are
able to export, access to new customers in for-
eign markets can not only lead to increased
learning and innovation (Crespi, Criscuolo and
Haskel, 2008) but also incentivize complemen-
tary investments and the restructuring of inter-
nal processes to meet the additional demand.
These may include investment in communica-
tion technology and product innovation (Lileeva
and Trefler, 2010) or investments in process
innovat ion (Bustos , 2011) . In addit ion,
expanded production can make more complex
organizational structures efficient, improving
decision making within firms. Evidence from
Portuguese and US firms suggests that increased
demand or trade liberalization leads to firms
investing in additional layers of management
within the firm, raising their productivity (Cali-
endo and Rossi-Hansberg, 2012; Caliendo et al.,
2016).
However, small firms are often not able to
build the necessary internal capabilities to meet
the s tr ic t product and qual i ty s t andards
demanded, or overcome external barriers such
as regulations and customs procedures. Build-
ing such capabilities can require substantial
investment in process and product innovations,
managerial and workforce skills development
and adoption of modern technologies. Only
firms with sufficient scale are able to incur the
substantial sunk costs to develop these capabili-
ties necessary for GVC integration. However,
unlike trade in final goods, GVCs present
opportunities for SMEs to become specialized
in a subset of productive tasks, which may allevi-
ate some of the barriers to SME participation.
Scale requirements are likely to be a particular
problem for firms operating in small, geograph-
ically isolated economies. Firm size tends to
grow with market size, meaning that smaller
markets are likely to have fewer firms with suffi-
cient scale to participate directly in GVCs.14
14 For European countries, the size of the domestic market is correlated almost one-for-one with the number of
exporting firms (Mayer and Ottaviano, 2008).
INT E R N A T I ON A L PRO DU C T I V I T Y MON I T OR 73
Upscaling may yield productivity gains. The
cost of many productivity-enhancing invest-
ments, including those concerning GVC partic-
ipation listed above, is largely fixed. Such
investments are only viable for sufficiently large
firms that can spread the fixed costs over high
sales volumes. Firm upscaling may therefore
contribute to productive investments. Firm-
level research shows correlations consistent with
this narrative; larger manufacturing firms are on
average more productive, across many dimen-
sions, than smaller firms and are more likely to
invest in skills, ICT and R&D (OECD, 2010b,
2013a; Gonzàlez et al., 2012).
However, new trade in value-added metrics
highlight the importance of indirect contribu-
tions to the value chain, not apparent in trade in
final goods metrics. Indirect participation can
provide a way to overcome many of the barriers
to scale. Through intermediaries and interna-
tional buyers, domestic producers can avoid
design and marketing costs, search costs and
reduce foreign market information barriers, and
benefit from the transfer of knowledge from for-
eign firms (Artopoulos et al., 2013). Many firms
are indirectly connected to GVCs, for instance,
as domestic suppliers of exporters, and therefore
gross trade flows will understate the importance
of SMEs to global supply chains. Unfortunately
data on the SME contribution to GVCs are
often not available and, therefore, relatively
strong assumptions are required to decompose
industry-level TiVA data into the contribution
of SMEs and large firms.15 Exploratory and on-
going work a t the OECD, us ing such an
approach, highlights a sizeable contribution of
SMEs to value-added trade flows which far
exceeds their contr ibution to gross trade
(OECD and World Bank, 2015).
Scale issues remain pertinent for indirect con-
tributions to the value chain. Exporting firms
are likely to pass down relevant product and
quality standards, demanded by their foreign
customers, to domestic suppliers. Accordingly,
domestic suppliers have to overcome additional
sunk costs to supply exporting firms, which only
sufficiently large suppliers can do. Emerging
evidence on domestic micro-linkages between
firms is consistent with this narrative; Belgian
suppliers of exporters are indeed larger and
more productive than suppliers of non-export-
ers (Dhyne and Rubinova, 2016).
What Does this Mean for Policy?GVCs can provide new avenues for growth, as
highlighted in previous sections. However,
there are many potential barriers to deeper
GVC integration and to firms' ability to seize
the opportunities for growth. Many of these
obstacles will be familiar to those versed in the
comprehensive literature on trade in final goods
and FDI. However, some of these barriers are
particularly relevant for GVCs, such as trade
policy, when goods cross borders multiple times.
In this section, we focus on these most promi-
nent obstacles and their policy implications.
Trade Policy
Global value chains amplify the productivity
effects of removing trade barriers relative to
trade in final goods. The complex web of inter-
15 Piacentini and Fortanier (2015) outline a preliminary disaggregation of industry-level OECD TiVA data using
firm-level data from the OECD Structural and Demographic Business Statistics Database and OECD/Eurostat
Trade by Enterprise Characteristics Database. The purchases of domestic inputs by SMEs and large firms are
estimated from the residual between output, value-added and imports. Purchases of foreign inputs are seg-
mented based on the share of goods imports purchased by SMEs and large firms. SME and large firm supply of
inputs is assumed to be in proportion to their respective share of industry gross output. The authors highlight
that their results depend heavily on these assumptions chosen to estimate the unobserved transactions
between firms of different sizes.
74 NUMB E R 32 , S P R I NG 2017
national production networks means intermedi-
ate goods often cross borders multiple times,
each time accumulating additional tariffs and
other trade costs. In addition, tariffs are levied
on the gross value of the good (including
imported inputs and previously incurred trade
costs), rather than on the value added domesti-
cally at the last production stage. Since exports
often embody a substantial proportion of for-
eign value-added this means a low nominal tariff
can translate into a high tariff on value-added
trade (Miroudot et al., 2013a).
Global value chains increase the interdepen-
dence of trade policy, highlighting the impor-
tance o f reg ional and mul t i la tera l t rade
agreements. Industries and countries are tied
together through the network of forward and
backward linkages. Downstream industries are
affected by the whole system of trade costs
incurred by their suppliers and conversely the
whole network of suppliers is impacted by final
goods trade costs. Accordingly, trade in value-
added is affected not only by bilateral trade
costs, but is also tied to third country barriers,
through which intermediate inputs travel before
reaching their destination (Noguera, 2012).
Border Bottlenecks
Trade facilitation is important to achieve the
gains from deeper GVC integration. The effi-
ciency of customs and port procedures shape the
global value chain, more so than trade in final
goods. Customs administrative procedures and
clearing processes raise the cost of accessing
export markets and importing intermediates,
with the costs accumulating when inputs are
traded many times as in GVCs. This raises costs
both in monetary terms and in time delays, the
latter requiring firms to hold larger inventories
and working capital. For particularly time-sen-
sitive products or those with uncertain demand,
the effect of delays can be substantial, with each
day in transit costing up to 2 per cent of the
value of the good (Hummels and Schaur, 2013).
Recent OECD analysis f inds that a small
improvement in trade facilitation performance
can increase value-added imports by between
1.5 and 3.5 per cent (Moïsé and Sorescu,
2015).16
Coordination of Standards
The diversity of standards has become one of
the major barriers to integrating into GVCs.
Technical barriers to trade cover 30 per cent of
international trade and more than 60 per cent of
agricultural products are affected by sanitary
and phytosanitary measures in particular (Nicita
and Gourdon, 2013). Whilst product quality
and safety standards are needed to protect final
consumers and the environment, these are far
from harmonized across countries and there is
little mutual recognition of alternative standards
(OECD, 2013a). In addition, these standards
are not always applied with the same consis-
tency, with import refusals varying over the
business cycle (Grundke and Moser, 2016). This
in turn might hinder the development and the
introduction of innovative products which
would ultimately lead to productivity growth.
However, not all standards are imposed by
national regulatory authorities. Multinationals
and upstream buyers themselves may impose
their own private quality standards on down-
stream suppliers (World Economic Forum,
2015). These may vary across buyers as well as
markets and if these standards are more strin-
gent and heterogeneous than those imposed by
national authorities, this may reduce the effec-
tiveness of national standard coordination and
present an additional barrier to GVC integra-
tion.
16 Specifically, an increase of 0.1 on a scale of 0 to 2 for an index of trade facilitation.
INT E R N A T I ON A L PRO DU C T I V I T Y MON I T OR 75
The cost of diverse standards can be amplified
within GVCs, much more so than final goods
trade, as the compliance needs to be coordinated
at each stage of production and for each market
ultimately supplied. Compliance can require
firms to make costly investments in duplicate
production processes, specific packaging and
labelling, or to undertake multiple certification
processes for the same product.17 These compli-
ance costs are particularly acute for SMEs and
are a major obstacle to their GVC participation
(OECD and World Bank, 2015; OECD, 2013c).
Policies to Promote Competitive
Domestic Markets
Fully leveraging GVCs requires efficient
domestic markets and removal of internal barri-
ers to competition. New data on trade in value-
added have highlighted that service inputs are
much more important to GVCs than was recog-
nized under prior analyses of trade in final goods
(Chart 5). Services are a key element in manu-
facturing competitiveness and are required for
the coordination of complex international sup-
ply chains. Production at each stage requires a
suite of complementary services, including
transport and logistics, finance, communication,
and other business and professional services. In
addition, R&D and design services are involved
in upstream stages and distribution networks,
advertising and marketing services downstream.
Global production networks are therefore
shaped by the quality and cost of these comple-
mentary services.
Addressing the barriers to competition in
local service markets and trade in services is par-
ticularly salient, given the significance of ser-
vices to GVCs in particular. OECD members
have few explicit barriers to services trade but
there are several differences in regulation.
OECD work on Service Trade Restrictiveness
Indicators reveals restrictions on foreign owner-
ship, restrictions on the movement of people
(e.g. quotas, stay duration limits), barriers to
competition and regulatory transparency even
amongst advanced economies. Indeed, evidence
suggests services trade costs have remained per-
sistently high over recent decades, despite sub-
stantial liberalization in goods trade (Miroudot
et al., 2013b). Pro-competitive domestic regula-
tions and the liberalization of trade in services
are important to ensure the efficient functioning
of the supply chain, which may be particularly
important for geographically isolated countries
(Hallaert et al., 2011) and would also improve
the productivity of the domestic downstream
markets which also use these services (Bourlès et
al., 2013).
Lifting barriers to competition in goods mar-
kets can also promote integration within GVCs,
and increase innovation and productivity. Lift-
ing product market regulations can spur produc-
tivity growth through increased competition,
increasing GVC participation. Productivity
growth can be achieved through several chan-
nels. First, increased competition and entry of
new firms strengthens the efficiency incentives
of incumbents and provides incumbents incen-
tives to innovate to maintain their market posi-
tion. In addition, by providing easier and
cheaper access to inputs, reductions in red tape
can also lead to gains in downstream industries
utilising these intermediates (Abe, 2013).
Policies to Bolster SME
Participation
Addressing the barriers to small and medi-
uem-sized enterprises (SMEs) upscaling is key
to encouraging GVC participation. The possi-
b i l i t y o f ind irec t part ic ipat ion in GVCs
17 Undertaking multiple certification processes as well as repeat testing of goods already tested in other coun-
tries may also increase the administration costs to public authorities.
76 NUMB E R 32 , S P R I NG 2017
(through domestic supply of exporters) and task
specialization, give many SMEs new opportuni-
ties, particularly relative to those in final goods
trade alone (as mentioned earlier). However,
GVC participation still requires additional capi-
tal, for example, through required investment in
product and process innovation and working
capital to finance exports, and access to finance
is a particular challenge for the upscaling of
SMEs. GVCs therefore highlight policies that
address credit market imperfections and support
development of complementary sources of
exended financing, such as venture capital mar-
kets (OECD and World Bank, 2015).
The issue of SME upscaling is also intimately
connected with the reallocation of resources.
Policies that impede labour market flexibility
and limit immigration might restrict the ability
of SMEs to hire additional, skilled workers to
scale-up production. Bankruptcy legislation and
judicial efficiency can encourage experimenta-
tion with innovation and new technologies, if
failures are not penalized too severely, and speed
the reallocation of resources from exiting firms
to more p r oduc t i ve u s e s (Andrews and
Criscuolo, 2013).
Policies to Facilitate Innovation
and Spillovers
Policies that develop absorptive capacity are
key to ensuring productivity spillovers. Knowl-
edge-based capital is a central part of GVCs,
with upstream activities including R&D, design
and innovation often comprising the highest
share of value-added in the production chain
(Baldwin, 2013). However, sufficient absorptive
capacity on the part of local firms and workers is
a prerequisite to benefiting from the trickle-
down of spillovers. Building absorptive capacity
includes developing local innovation and
enhancing human capital. Given the well-known
market failures affecting investment in innova-
tion, several countries promote innovation
through incentives to collaborate between firms
and universities, R&D fiscal incentives and state
funding of basic research. Recent OECD work
(Andrews et al., 2015) suggests that university-
industry collaboration might play an important
role in helping laggard firms benefit from
knowledge spillovers from frontier firms, espe-
cially if they are SMEs.
Investment in innovation is an important
driver of GVCs and is central to moving into
higher value-added activities. Success in GVCs
requires investment in knowledge based assets
that extend far beyond R&D, for example, in
capabilities for efficiently reorganizing produc-
tion, in producing and commercializing more
sophisticated and complex products and for suc-
cessfully moving into higher-value downstream
or upstream activities. Thus, innovation policies
for succeeding in GVCs need to take a much
broader view than just R&D. Policies that
encourage stronger links between firms and
research, educational and training institutions
can facilitate the knowledge transfers required
for upgrading in GVCs. However, GVC partic-
ipation often implies a relocation of innovation
to where it is most efficiently undertaken, as
noted earlier, and this restructuring can lead to
overall increases in innovation and greater diffu-
sion within firms (Stiebale, 2016). This comple-
ments within-country research finding that
location-specific incentives for innovation (such
as state-level R&D tax credits) may simply real-
locate innovation from one location to another,
rather than increasing aggregate innovation
(Wilson, 2009). Location-specific incentives for
innovation may therefore mute one of the
potential channels for gains from GVCs.
Policies to Realize New Technology
Potential
Reaping the benefits of new technologies
requires policies that support complementary
investments in knowledge based capital. The
INT E R N A T I ON A L PRO DU C T I V I T Y MON I T OR 77
rise of GVCs has been made possible by falling
transport costs and advances in communication
technology over the recent decades (OECD,
2013a). Many new disruptive technologies are
on the horizon with the potential to transform
production, for instance, through nanotechnol-
ogy, 3D printing, advances in robotics or
enhanced data analytics using machine-to-
machine communication (OECD, 2015b).
However, adoption of new technologies,
which is the focus of subsidies or tax credit poli-
cies, cannot by itself lead to substantial produc-
tivity gains, unless it is complemented by
changes in the organization of work (Brynjolfs-
son and Hitt, 2000). What matters more than
adoption, is how the technology is used within
organizations. Accordingly, a large body of evi-
dence on recent technological advances, such as
ICT, highlights that the performance effects of
new technologies depend on complementary
firm-level investments, such as in organization
structures, management capability and skills
development (Draca et al., 2006; Biagi, 2013).
Shocks, Resilience and GrowthEmbeddedness within a GVC affects the resil-
ience of economies to macroeconomic shocks.18
International trade is a key mechanism for the
cross-country transmission of shocks and GVCs
can intensify this propagation relative to trade in
final goods alone. The international fragmenta-
tion of production means industries in different
countries are connected through a complex web
of intermediate input linkages. Accordingly, a
shock to one part of the supply chain can propa-
gate throughout the production network. This
was as highlighted by the 2016 Kunamoto earth-
quake when Japanese supplier disruption led to
the temporary shutdown of US auto plants and
by the 2011 Tohoku earthquakes (Boehm,
Flaaen, and Pandalai-Nayar, 2015) and Thai-
land's great floods in the same year (Fujita,
2013).
Through these interconnections, firms are
potentially exposed to a myriad of risks, includ-
ing geopolitical risks (such as political violence),
infrastructure risks (such as the 2010 Icelandic
volcano eruption and disrupted air travel), and
financial risks (such as the recent economic cri-
sis) (OECD, 2013a). In the aggregate, growing
evidence supports the role of GVCs as a conduit
for shocks, with strong correlations between
countries' GVC links and business cycle co-
movement (Burstein et al., 2008; Bergin et al.,
2009; Ng, 2010).
Mitigating supply chain risks implies a pro-
ductivity trade-off. The small margin of error
that firms typically build into value chains in
order to reduce costs considerably increases
risks (OECD, 2013a). Firms can mitigate their
vulnerability to (supply) shocks through holding
additional input inventories (Kahn, 1987;
Alessandria, Kaboski and Midrigan, 2011) or
diversifying their range of input suppliers
(OECD, 2013a). However, holding additional
inventories is costly to the firm as it ties up
working capital. Supplier diversification may
increase input costs through purchasing in
smaller quantities (per supplier), sourcing from
more expensive suppliers and the costs of trans-
acting with more firms or countries. Therefore,
in an effort to mitigate supply shocks, firms may
incur higher production costs and reduce their
productivity even during normal times.
Resilience is also determined by position
within a GVC. Evidence for the United States
suggests that industry growth is more strongly
determined by industries that are directly linked
(as customers or suppliers) and less correlated
with indirect links (e.g. with the suppliers of
their suppliers) (Carvalho, 2014 and OECD,
18 See OECD, 2013a: Chapter 8 for an extensive discussion of resilience.
78 NUMB E R 32 , S P R I NG 2017
2013a). In addition, position within a GVC
determines resilience to different types of
shocks. Downstream industries are relatively
more vulnerable to supply shocks higher up the
value chain.
GVC position (and hence resilience) is deter-
mined by productive investments. Firms can
reduce their vulnerability to supply shocks by
moving up the value chain and specializing in
upstream activities such as design, R&D and
innovation. Firms can also move up the value
chain by improving efficiency or increasing the
value-added of their products; either by upgrad-
ing their existing product mix, adding new prod-
ucts or moving into new value chains (OECD,
2013a). These often require substantial produc-
tive investments. However, moving up the value
chain does not immunize firms to GVC shocks.
Rather, their position determines the type of
shocks a firm is more exposed to. Upstream
industries further from the final consumers are
more exposed to demand shocks (Acemoglu et
al., 2015).
Increasing task specialization may also impact
the resilience to shocks. The unbundling of the
supply chains has permitted specialization in
activities for which there is a comparative advan-
tage. Firms can join a production network, spe-
cialising in a small part of the value chain, and at
an aggregate level, developed economies are
increasingly specialising in specific upstream or
downstream activities (such as R&D, marketing,
design). Indeed, the specialization in productive
tasks is one of the oft-cited mechanisms through
which productivity gains of GVCs are realised
(e.g. OECD, World Bank and WTO, 2014).
However, specialization can reduce resilience to
shocks, particularly in the production of com-
plex goods, where many countries and suppliers
perform highly specialized tasks. Risks increase
with the customization of the task and the
greater number of countries linked through pro-
duction networks (Taglioni and Winkler, 2016).
Conversely, the micro-structure of GVC sup-
ply chain networks can also generate macroeco-
nomic shocks. Linkages between firms and
industries are not evenly distributed; instead, a
minority of multinational firms are the drivers
of GVCs and production networks are dispro-
portionately dependent on a minority of input
suppliers. This is true within domestic produc-
tion networks, such as the United States (Car-
valho, 2014), and emerging evidence finds
similar results for global supply chains (Cerina et
al., 2015). These key hubs can propagate dis-
ruptions to many other sectors, amplifying
microeconomic fluctuations in one part of the
economy into a macroeconomic shock. Evi-
dence for the US suggests that fluctuations in
these key sectors are highly correlated with
aggregate manufacturing growth since the
1960s (Acemoglu et al., 2012; Carvalho, 2014).
MNEs may also play an important role in prop-
agation of shocks, with emerging evidence sug-
gesting intra-firm trade exhibited greater
volatility than arm's length trade during the
recent economic crisis (Altomonte et al., 2012).
Evidence on resilience to shocks is only start-
ing to emerge. However, structural policies that
facilitate the flexible operation of markets
appear to be important (Canova et al., 2012;
Caldera Sanchez et al., 2015). This comple-
ments a wide breadth of recent research con-
cerning preventing shocks, and monetary and
macro-prudential policy prescriptions. Flexible
labour and product market policies increase the
scope for firms to adjust in response to shocks
across many dimensions, with policies found to
be more important for firms in volatile sectors
(e.g. Calvino et al., 2016). First, increased com-
petit ion in goods and factor markets may
increase the flexibility of wages and prices,
enabling firms to absorb such shocks. Second,
flexible labour and product market policies may
accelerate the exit of the least productive firms
and the reallocation of factors more generally to
INT E R N A T I ON A L PRO DU C T I V I T Y MON I T OR 79
more productive activities across firms. Third,
such policies may ease the reorganization of
activities and reallocation of factors within firms
to mitigate the effect of shocks. For example,
evidence from trade shocks suggest f irms
respond by transitioning from traditional manu-
facturing activities into provision of services
(Breinlich et al ., 2014), product upgrading
(Amiti and Khandelwal, 2013) or through
investment in innovation.19 However, there may
be an important distinction in short and medium
term effects of such policies. For example, strin-
gent labour market policies may cushion the ini-
tial impact of shocks but stifle the reallocation
and recovery process, extending the impact of
the shock (Caldera Sanchez et al., 2015).
ConclusionRecent decades have witnessed the wide-
spread growth of GVCs across many developed
and emerging economies. The unbundling of
production across complex networks, involving
the inputs of goods, services and intangibles
from many firms and many countries, has pre-
sented new channels for growth. The recent
availability of detailed firm-level data, combined
with new trade in value-added metrics have
uncovered many of these mechanisms. How-
ever, the rise of complex GVCs presents some
additional policy complexities, such as the
importance of domestic competitiveness in ser-
vices and facilitating firms to join domestic sup-
ply chains of exporters.
GVCs are not primarily global in nature, but
focused around regional clusters of production.
The geography of GVCs has changed signifi-
cantly in the last decades with some countries
and industries having become key hubs in
regional production (such as China's emergence
onto the world stage). Eastern European coun-
tries have become increasingly connected to
European value chains, whilst other regions
have remained relatively peripheral (e.g. South
America or New Zealand). Therefore the pro-
ductivity effects of GVCs are likely to be heter-
ogeneous across countries, as well as firms and
workers. Further research is warranted to exam-
ine how the changes in the geography and struc-
ture of GVCs (such as becoming a key hub or
peripheral) affect productivity.
However, emerging evidence suggests that the
fragmentation of production may have stag-
nated since 2011, raising the question of the
extent to which further productivity gains from
GVCs can be realized going forward. On the
horizon there are many structural and techno-
logical factors that are likely to influence GVCs,
leading to further reorganization of production
networks. These include rising demand and
labour costs in emerging economies, an uncer-
tain policy environment and the arrival of new
digital and production technologies such as 3D
printing, advances in robotics or enhanced data
analytics using machine-to-machine communi-
cation. Some of these advances may lead to a
reorganization of some activities closer to
sources of demand (e.g. 3D printing, rising
emerging economy labour costs), whilst others
may lead to increasing complexity of production
networks (e.g. advances in communication tech-
nologies, services liberalization). Further
research is needed to uncover whether these fac-
tors will reverse the recent stagnation of produc-
t ion f ragmenta t ion and thei r e f f ec t s on
productivity.
ReferencesAbe, M. (2013) "Global Supply Chains: Why they
Emerged, Why they Matter, and Where they are Going," in D.K. Elms and P. Low (eds.), Global
19 It is somewhat unclear precisely how innovation investments respond to shocks. Bloom et al. (2016) and
Hombert and Matray (2016) suggest increasing innovation in response to trade shocks; although Autor et al.
(2016) find the reverse.
80 NUMB E R 32 , S P R I NG 2017
Value Chains in a Changing World, WTO Pub-lications.
Acemoglu, D., V.M. Carvalho, A. Ozdaglar and A. Tahbaz-Salehi (2012) "The Network Origins of Aggregate Fluctuations," Econometrica, Vol. 80, No. 5, pp. 1977-2016.
Acemoglu, D., U. Akcigit, and W. Kerr (2015) "Net-works and the Macroeconomy: An Empirical Exploration," in M. Eichenbaum and J. Parker (eds.), NBER MacroEconomics Annual 2015, Vol. 30.
Aitken, B.J. and A.E. Harrison (1999) "Do Domestic Firms Benefit from Direct Foreign Investment? Evidence from Venezuela," American Economic Review, Vol. 89, No. 3, pp. 605-618.
Alessandria G.and Kaboski J.P. and V. Midrigan (2011) "US Trade and Inventory Dynamics," American Economic Review, Vol. 101, No. 3, pp. 303-307.
Alfaro, L. (2014) "Foreign Direct Investment: Effects, Complementarities, and Promotion," Harvard Business School Working article, No. 15-006.
Altomonte, C., F. Di Mauro, G. Ottaviano, A. Rungi and V. Vicard (2012) "Global Value Chains Dur-ing the Great Trade Collapse: A Bullwhip Effect?" CEP Discussion article, No. 1131.
Amiti, M. and J. Konings (2007) "Trade Liberaliza-tion, Intermediate Inputs, and Productivity: Evi-dence from Indonesia," American Economic Review, Vol. 97, No. 5, pp. 1611-38.
Amiti, M. and S-J. Wei (2009) "Service Offshoring and Productivity: Evidence for the US," World Economy, Vol. 32, No. 2, pp. 203-220.
Amiti, M. and A. Khandelwal (2013) "Import Com-petition and Quality Upgrading," Review of Economics and Statistics, Vol. 95(2), pp. 476-90.
Antweiler, W. and D. Trefler (2002) "Increasing Returns and All That: A View from Trade," American Economic Review, Vol. 92(1), pp. 93-119.
Andrews, D. and C. Criscuolo (2013) "Knowledge Based Capital, Innovation and Resource Alloca-tion," OECD Economics Department Working articles, No. 1046, OECD Publishing.
Andrews, D., C. Criscuolo and P.N. Gal (2015) "Frontier Firms, Technology Diffusion and Pub-lic Policy: Micro Evidence from OECD Coun-tries," OECD Productivity Working articles, No. 2, OECD Publishing.
Antras, P. and S. R. Yeaple (2014) "Multinational Firms and the Structure of the Firm," in G. Gopinath, E. Helpman and K. Rogoff (eds.), Handbook of International Economics, Vol. 4.
Arndt, S. and H. Kierzkowski (2001) "Fragmenta-tion. New production patterns in the world Economy," Oxford University Press.
Arnold, J.M., B.S. Javorcik and A. Mattoo (2011) "Does services liberalization benefit manufactur-ing firms?: Evidence from the Czech Republic," Journal of International Economics, Vol. 85, No. 1, pp. 136-146.
Arnold, J.M., B.S. Javorcik, M. Lipscomb and A. Mattoo (2016) "Services Reform and Manufac-turing Performance: Evidence from India," Eco-nomic Journal, Vol. 126, Issue 590, pp. 1-39.
Artopoulos A., D. Friel and J.C. Hallak (2013) "Export emergence of differentiated goods from developing countries: Export pioneers and busi-ness practices in Argentina," Journal of Develop-ment Economics, Vol. 105, pp. 19-35.
Autor, D., D. Dorn, G. Hanson, G. Pisano and P. Shu (2016) "Foreign Competition and Domestic Innovation: Evidence from U.S. Patents," Mimeo.
Bai, X., K. Krishna and H. Ma (2017) "How you export matters: Export mode, learning and pro-ductivity in China," Journal of International Economics, Vol. 104, pp. 122-137.
Baldwin, R. (2012) "Trade and industrialisation after globalisation's 2nd unbundling: How building and joining a supply chain are different and why it matters," CEPR Discussion article, No. 9103.
Baldwin, R. (2013) "Global supply chains: why they emerged, why they matter, and where they are going," in D.K. Elms and P. Low (eds.), Global value chains in a changing world, WTO Publica-tions.
Balsvik, R. (2011) "Is labor mobility a channel for spillovers from Multinationals? Evidence from Norwegian manufacturing," Review of Econom-ics and Statistics, Vol. 93, No. 1, pp. 285-297.
Bas, M. and V. Strauss-Kahn (2015) "Input-trade lib-eralization, export prices and quality upgrading" Journal of International Economics, Vol. 95, No. 2, pp. 250-262.
Bergin, P., R. Freenstra, R.C. Hanson and H. Gor-don (2009) "Offshoring and Volatility: Evidence from Mexico's Maquiladora Industry," American Economic Review, Vol. 99, pp. 1664-1671.
Biagi, F. (2013) "ICT and Productivity: A Review of the Literature," European Commission Institute for Prospective Technological Studies Digital Economy Working article, No. 2013/09.
Bloom, N., M. Draca and J. Van Reenen (2016) "Trade Induced Technical Change? The Impact of Chinese Imports on Innovation, IT and Pro-ductivity," Review of Economic Studies, Vol. 83, No. 1, pp. 87-117.
Boehm, Christoph E., Aaron Flaaen, and Nitya Pan-dalai-Nayar. 2015. "Input Linkages and the Transmission of Shocks: Firm-Level Evidence from the 2011 T?hoku Earthquake." Finance and Economics Discussion Series 2015-094.
INT E R N A T I ON A L PRO DU C T I V I T Y MON I T OR 81
Washington: Board of Governors of the Federal Reserve System.
Bourlès, R., G. Cette, J. Lopez, J. Mairesse and G. Nicoletti (2013) "Do Product Market Regula-tions In Upstream Sectors Curb Productivity Growth? Panel Data Evidence for OECD Coun-tries," Review of Economics and Statistics, Vol. 95, No. 3, pp. 1750-1768.
Breinlich, H., A. Soderbery and G. Wright (2014) "From Selling Goods to Selling Services: Firm Responses to Trade Liberalization," CEPR Working article, No. 10116.
Brynjolfsson, E. and L. Hitt (2000) "Beyond Com-putation: Information Technology, Organiza-tional Transformation and Business Performance," Journal of Economic Perspec-tives, Vol. 14, No. 4, pp. 23-48.
Burstein, A., C. Kurz and L. Tesar (2008) "Trade Production Sharing and the International Trans-mission of Business Cycles," Journal of Mone-tary Economics, Vol. 55, pp. 775-795.
Caldera Sanchez, A., M. Rasmussen, O. Röhn (2015) "Economic resilience: what role for policies?," OECD Economics Department Working arti-cles, No. 1251
Calvino, F., C. Criscuolo and C. Menon (2016) "No Country for Young Firms? Start-up Dynamics and National Policies," OECD Science, Tech-nology and Innovation Policy articles, No. 29.
Canova, F., L. Coutinho and Z. Kontolemis (2012) "Measuring the macroeconomic resilience of industrial sectors in the EU and assessing the role of product market regulations," European Economy - Occasional articles, No. 112.
Carvalho, V.M. (2014) "From Micro to Macro via Production Networks," Journal of Economic Perspectives, Vol. 28, No. 4, pp 23-47.
Cerina, F., Z. Zhu, A. Chessa and M. Riccaboni (2015) "World Input-Output Network," PLOS One, Vol. 10, No. 7, pp. 1-21.
Caliendo, L. and E. Rossi-Hansberg (2012) "The Impact of Trade on Organization and Productiv-ity," Quarterly Journal of Economics, Vol. 127(3), pp. 1393-1467.
Caliendo, L., G. Mion, L. Opromolla and E. Rossi-Hansberg (2016) "Productivity and Organization in Portuguese Firms," Mimeo.
Ciuriak, D. (2013) "Learning by Exporting: A Work-ing Hypothesis," Mimeo.
Constantinescu, C., A. Mattoo and M. Ruta (2017) "Does Vertical specialization Increase Productiv-ity?," World Bank Policy Research Working arti-cle 7978.
Crespi, G., Criscuolo, C. and Haskel, J. (2008) "Pro-ductivity, exporting, and the learning-by-export-ing hypothesis: direct evidence from UK firms". Canadian Journal of Economics, 41: 619-638.
De Backer, K. and S. Miroudot (2017) "Multina-tional Enterprises and Global Value Chains: New Insights on the Trade-investment Nexus," DSTI/CIIE(2017)1, OECD Publishing.
Draca, M., R. Sadun and J. Van Reenen (2006) "Pro-ductivity and ICT: A Review of the Evidence," CEP Discussion article, No. 749.
Dhyne, E. and S. Rubínová (2016) "The supplier network of exporters: Connecting the dots," NBB Working article, No. 296.
Deardorff, A. (2001) " V. Fragmentation in Simple Trade Models". North American Journal of Eco-nomics and Finance, Vol. 12, pp. 121 - 37.
Egger, H. and P. Egger (2006) "International Out-sourcing and the Productivity of Low-skilled Labour in the EU," Economic Inquiry, Vol. 44 (1), pp. 98-108.
Feenstra, R. and G. Hanson (1996) "Foreign Invest-ment, Outsourcing, and Relative Wages" in R. Feenstra, G. Grossman, and D. Irwin (eds.), Political Economy of Trade Policy: Essays in Honor of Jagdish Bhagwati, MIT Press.
Feenstra, R. and G. Hanson (1999) "The Impact of Outsourcing and High-technology Capital on Wages: Estimates for the United States, 1979-1990," Quarterly Journal of Economics, Vol. 114, pp. 907-40.
Fujita, M. (2013) "The lessons from the Great East Japan Earthquake and the Great Floods in Thai-land," Voxeu, 18 November.
Goldberg, P.K., A.K. Khandelwal, N. Pavcnik and P. Topalova (2010) "Imported Intermediate Inputs and Domestic Product Growth: Evidence from India" Quarterly Journal of Economics, Vol. 125, No. 4, pp. 1727-67.
Gonzàlez, X., D. Miles-Touya and C. Pazó (2012) "R&D, Worker Training, and Innovation: Firm-level evidence," Universidade de Vigo, Departa-mento de Economía Aplicada, Working article, No. 12/03.
Griffith, R., S. Redding and J. Van Reenen (2004) "Mapping the two faces of R&D: Productivity growth in a panel of OECD industries," Review of Economics and Statistics, Vol. 84, No. 4, pp. 883-895.
Grossman, G. M. and E. Rossi-Hansberg (2008) "Trading Tasks: A Simple Theory of Offshor-ing," American Economic Review, Vol. 95, No. 5, pp. 1978-1997.
Grundke, R. and C. Moser (2016) "Hidden Protec-tionism? Evidence from Non-tariff Barriers to Trade in the United States," Mimeo, University of Salzburg.
Guadalupe, M., O. Kuzmina and C. Thomas (2012) "Innovation and Foreign Ownership," American Economic Review, Vol. 102, No. 7, pp. 3594-3627.
82 NUMB E R 32 , S P R I NG 2017
Hallaert, J., R. Cavazos Cepeda and G. Kang (2011) "Estimating the Constraints to Trade of Devel-oping Countries," OECD Trade Policy articles, No. 116, OECD Publishing.
Halpern, L., M. Koren and A. Szeidl (2015) "Imported Inputs and Productivity," American Economic Review, Vol. 105, No. 12, pp. 3660-3703.
Havránek, T. and Z. Iršova (2011) "Estimating verti-cal spillovers from FDI: Why results vary and what the true effect is," Journal of International Economics, Vol. 85, No. 2, pp. 234-244.
Hoekman, B. (2015) (ed.), "The Global Trade Slow-down: A New Normal?" A VoxEU eBook, Lon-don: CEPR Press and EUI.
Hombert, J. and A. Matray (2016) "Can Innovation Help U.S. Manufacturing Firms Escape Import Competition from China?," Mimeo.
Hummels, D., J. Ishii, Jun and K-M, Yi (2001) "The nature and growth of vertical specialization in world trade," Journal of International Econom-ics, Vol. 54(1), pp. 75-96.
Hummels, D. and G. Schaur (2013) "Time as a Trade Barrier," American Economic Review, Vol, 103, No. 7, pp. 2935-2959.
Iršova, Z. and T. Havránek (2013) "Determinants of Horizontal Spillovers from FDI: Evidence from a Large Meta-Analysis," World Development, Vol. 42, pp. 1-15.
Jamet, S. and M. Squicciarini (2016) "Skills and Glo-bal Value Chains: A first characterisation," DSTI/EAS/IND/WPIA(2016)1, OECD Pub-lishing.
Javorcik, B.S. (2004) "Does Foreign Direct Invest-ment Increase the Productivity of Domestic Firms? In Search of Spillovers Through Back-ward Linkages." American Economic Review, 94(3): 605-627.
Johnson, R. and G. Noguera (2012) "Accounting for intermediates: Production sharing and trade in value added," Journal of International Econom-ics, Vol. 86, pp. 224-236.
Jones, R. and H. Kierzkowski (2001) "A Framework for Fragmentation" in S. Arndt and H. Kierz-kowski (eds.), Fragmentation: New Production Patterns in the World Economy, Oxford Univer-sity Press.
Kahn, J. (1987) "Inventories and the volatility of production," American Economic Review, Vol. 77, No. 4, pp. 667-679.
Keller, W. and S. R. Yeaple (2013) "The Gravity of Knowledge," American Economic Review, Vol. 103, No. 4, pp. 1414-1444.
Koopman, R., Z. Wang and S-J Wei (2014) "Tracing value-added and double counting in gross
exports," American Economic Review, Vol. 104(2), pp. 459-94.
Krugman, P. (1995) "Growing World Trade: Causes and Consequences," Brookings articles on Eco-nomic Activity, 1:1995
Kummritz, V. (2016) "Do Global Value Chains Cause Industrial Development?" CTEI Working article No. 2016-01.
Kosová, R. (2010) "Do foreign firms crowd out domestic firms? Evidence from the Czech Republic," Review of Economics and Statistics, Vol. 92, No. 4, pp. 861-881.
Mayer, T. and G.I.P. Ottaviano (2008) "The Happy Few: The Internationalisation of European Firms," Intereconomics, Vol. 43, No. 3, pp. 135-148.
Miroudot, S., R. Lanz and A. Ragoussis (2009) "Trade in Intermediate Goods and Services," OECD Trade Policy articles, No. 93, OECD Publishing.
Miroudot, S., D. Rouzet and F. Spinelli (2013a) "Trade Policy Implications of Global Value Chains: Case Studies," OECD Trade Policy arti-cles, No. 161, OECD Publishing.
Miroudot, S., J. Sauvage and B. Shepherd (2013b) "Measuring the cost of international trade in ser-vices," World Trade Review, Vol. 12, pp. 719-735.
Moïsé, E. and S. Sorescu (2015) "Contribution of Trade Facilitation Measures to the Operation of Supply Chains," OECD Trade Policy articles, No. 181, OECD Publishing.
Ng, E. (2010) "Production Fragmentation and Busi-ness Cycle Comovements," Journal of Interna-tional Economics, Vol. 82, No. 1, pp. 1-14.
Nishioka, S. and M. Ripoll (2012) "Productivity, trade and the R&D content of intermediate inputs," European Economic Review, Vol. 56, pp. 1573-1592.
Nicita, A. and J. Gourdon (2013) "A Preliminary Analysis on Newly Collected Data on Non-Tar-iff Measures," UNCTAD Policy Issues in Inter-national Trade and Commodities, No. 53.
Noguera, G. (2012) "Trade Costs and Gravity for Gross and Value Added Trade," unpublished.
OECD (2008) "The Internationalisation of Business R&D: Evidence, Impacts and Implications," OECD Publishing.
OECD (2010a) "The OECD Innovation Strategy: Getting a Head Start on Tomorrow," OECD Publishing.
OECD (2010b) "Measuring Innovation: A New Per-spective," OECD Publishing.
OECD (2013a) "Interconnected Economies: Bene-fiting from Global Value Chains," OECD Pub-lishing.
INT E R N A T I ON A L PRO DU C T I V I T Y MON I T OR 83
OECD (2013b) "Supporting Investment in Knowl-edge Capital, Growth and Innovation," OECD Publishing.
OECD (2013c) "Entrepreneurship at a Glance 2013," OECD Publishing.
OECD, World Bank and WTO (2014) "Global Value Chains: Challenges, Opportunities, and Implications for Policy" Report Prepared for Submission to the G20 Trade Ministers Meeting Sydney, Australia.
OECD (2015a) "The Future of Productivity," OECD Publishing.
OECD (2015b) "Data-Driven Innovation: Big Data for Growth and Well-Being," OECD Publish-ing.
OECD and World Bank (2015) "Inclusive global value chains: policy options in trade and comple-mentary areas for GVC integration by small and medium enterprises and low-income developing countries," OECD and World Bank Group Pub-lishing.
OECD and WTO (2015a) "Trade in Value Added: Estonia," October 2015 TiVA Country Notes, OECD and World Trade Organisation Publish-ing.
OECD and WTO (2015b) "Trade in Value Added: Korea," October 2015 TiVA Country Notes, OECD and World Trade Organisation Publish-ing.
OECD (forthcoming) "Global Value Chains and Trade in Value-Added: An Initial Assessment of the Impact on Jobs and Productivity," OECD Trade Policy articles, OECD Publishing.
Piacentini, M. and F. Fortanier (2015) "Firm Heter-ogeneity and Trade in Value Added," STD/CSSP/WPTGS(2015)231, OECD Publishing.
Saia, A., D. Andrews and S. Albrizio (2015) "Produc-tivity Spillovers from the Global Frontier and Public Policy: Industry-Level Evidence," OECD Economics Department Working articles, No. 1238, OECD Publishing.
Schwörer, T. (2013) "Offshoring, domestic outsourc-ing and productivity: evidence for a number of European countries," Review of World Econom-ics, Vol. 149, No. 1, pp. 131-149.
Stiebale, J. (2016) "Cross-border M&As and innova-tive activity of acquiring and target firms," Jour-nal of International Economics, Vol. 99, pp. 1-15.
Taglioni, D. and D. Winkler (2016) "Making Global Value Chains Work for Development," Trade and Development Series, World Bank.
Timmer, M., B. Los, R. Stehrer and G.J. de Vries (2013) "Fragmentation, incomes and jobs: an analysis of European competitiveness," Eco-nomic Policy, Vol. 28, Issue 76, pp. 613-661.
Timmer, M., B. Los, R. Stehrer and G.J. de Vries (2016) "An Anatomy of the Global Trade Slow-down based on the WIOD 2016 Release," GGDC Research Memorandum, No. 162, Uni-versity of Groningen
Topalova, P. and A.K. Khandelwal (2011) "Trade Liberalization and Firm Productivity: The Case of India" Review of Economics and Statistics, Vol. 93, No. 3, pp. 995-1009.
Wiebe, K.S. and N. Yamano (forthcoming) "3x3x3 Analysing Global Value Chains using the OECD Inter-Country Input-Output Tables," OECD Science, Technology and Industry Working arti-cles.
Wilson, D. J. (2009) "Beggar thy neighbour? The in-state, out-of-state and aggregate effects of R&D tax credits," Review of Economics and Statistics, Vol. 91, No. 2, pp. 431-436.
Winkler, D. (2010) "Services Offshoring and its Impact on Productivity and Employment: Evi-dence from Germany, 1995-2006," World Econ-omy, Vol. 33, No. 2, pp. 1672-1701.
World Economic Forum (2015) "What Companies Want from the World Trading System," Avail-able from: www3.weforum.org/docs/WEF_GAC_Trade_II_2015.pdf
INT E R N A T I ON A L PRO DU C T I V I T Y MON I T OR 84
It’s a Small, Small World... A Guided Tour of the Belgian Production Network
Emmanuel Dhyne
University of Mons and National Bank of Belgium
Cédric Duprez
National Bank of Belgium1
ABSTRACT
This article presents stylized facts about the participation of Belgian firms in global and
local value chains, using transaction data at the firm level to depict the Belgian production
network and its integration in the world economy. These data allow the identification of the
various channels through which a Belgian firm has access to the world market, either to
source its inputs or to sell its output. We also discuss how the level of efficiency of individual
firms is related to their position in the local and global value chains.
Production fragmentation is a pervasive phe-
nomenon in the world economy. Firms buy
inputs from other firms and sell their output for
intermediate use, giving rise to a sequencing of
production stages.2 This fragmentation has
been mostly viewed as an international process,
with some countries specialized in early stages of
production (design of the product), some in
medium stages (early production stages) and
others in final stages (final assembly, marketing,
distribution), but this process may also occur
locally. Newly available international input/out-
put tables have enabled an analysis of interna-
tional supply linkages and the extent to which
value added is sequentially created along the
global value chains (Timmer et al., 2014; Koop-
man et al., 2014). Sectoral linkages within coun-
tries and how they affect technological diffusion
have also been studied, mostly using input/out-
put tables (Acemoglu et al., 2012).
However, little work has been done on domes-
tic production networks at the firm level due to
lack of data availability.3 The goal of this article
is to provide a description of the integration into
the globalized economy of firms that are not
directly involved in international trade. To do
so, we provide a detailed description of the orga-
nization of a domestic production network and
1 The authors are economists in the Economics and Research Department at the National Bank of Belgium. This
article has benefited from comments made by participants at various CompNet network workshops and confer-
ences, especially J. Amador, R. Baldwin, E. Bartelsman, F. di Mauro and M. Timmer, and at the First OECD Glo-
bal Forum on Productivity held in July 2016 in Lisbon. The authors would also like to thank two anonymous
referees and A. Sharpe for fruitful comments. The views expressed are those of the authors and do not neces-
sarily reflect the views of the National Bank of Belgium. The statistical evidence presented does not violate
the confidentiality restrictions associated with the underlying data. No information allowing the identification
of a single firm has been released. Remaining errors are ours only. Emails: [email protected];
2 See, for example, Antras and Chor (2013) and Fally and Hillberry (2014) for theoretical frameworks high-
lighting the role of the sequentiality of production.
85 NUMB E R 32 , S P R I NG 2017
how i t integrates i t se l f into global value
chains (GVC).
At the firm level, the integration into GVC
has largely been addressed by analyzing the
decision to export or to import. The widely used
new trade models with heterogeneous firms
(Melitz and Redding, 2014) show a positive rela-
tion between the level of technological effi-
ciency of a firm and its export status (Bernard
and Jensen, 1999; Ottaviano and Mayer, 2007).4
In related literature, there are firm-level studies
that stress the link between imported intermedi-
ate inputs and productivity (Antras et al., 2016;
Bernard et al., 2009; Amiti and Konings, 2007).
Recent research, however, has questioned the
exclusive focus on exporting (or importing)
firms. Some empirical papers have shown that
many firms are exporting indirectly through
trade intermediaries or other manufacturing
firms.5 More generally, one finds evidence that
many firms are indirectly connected to the rest
of the world. Some firms supply parts and com-
ponents that are then integrated into exports.
Others buy inputs whose parts or components
are imported.
Exporting and importing firms therefore act
as connectors of the domestic production net-
work to the rest of the world. Dhyne and Duprez
(2015) documented that phenomenon using a
sample of around 350,000 Belgian firms.6 In
their sample, the number of exporting firms is
relatively small (less than 5 per cent of firms), of
which almost half export less than 10 per cent of
their turnover. However, almost 80 per cent of
their sample supplied inputs to the rest of the
world, either directly or indirectly through third
companies. Overall, around 20 per cent of their
sample, on average, ultimately exported at least
10 per cent of their output, and almost 10 per
cent exported at least 25 per cent of their output.
The situation is even more striking when it
comes to imports. Almost all Belgian firms use
foreign inputs, obtaining supplies directly or
indirectly from importers, particularly in the
case of energy and commodities.
This article provides additional evidence on
indirect international trade by showing how
close firms are to world markets, either as a
source of inputs or a destination for output. The
data used make it possible to identify potential
commercial channels through which a domestic
firm can source foreign inputs or serve foreign
demand. Using a similar dataset, Dhyne and
Rubinova (2016) found evidence of a perfor-
mance premium that rises with the proximity to
foreign demand. We extend this result by show-
ing that the same applies to the import side. In
the spirit of Antras et al. (2016), we also find a
stronger impact of the distance to foreign inputs
on firm performance than that normally associ-
ated with the distance to foreign demand.
Describing and understanding the organiza-
tion of domestic production networks at a very
disaggregated level is crucial to understanding
3 Atalay et al. (2011) use transaction data to characterize the organization of the production network in the
United States, but their sample only covers large firms and their main customers. Bernard et al. (2016b) use
the collection of the main supplier/customer relations for Japanese firms, but do not observe the size of the
transactions. To our knowledge, the Belgian business-to-business (B2B) transaction data is the first micro
dataset available that provides an exhaustive description of the inter-firm linkages, including the magnitude
of those transactions.
4 The impact of export activities on TFP growth has also been addressed to test the learning-by-exporting
assumption, but empirical evidence is not as clear.
5 For instance, Bernard et al. (2010) have shown that wholesalers and retailers play a major role in US
exports. Similarly, Bernard et al. (2016a) have found that a significant share of the value of products sold
abroad by Belgian manufacturing exporters is not directly produced by those firms.
6 While also considering Belgian data, their analysis is restricted to the sample of firms registered in the
Central Balance Sheet Office of the National Bank of Belgium, which only covers around 50 per cent of
the VAT affiliates considered in this article.
INT E R N A T I ON A L PRO DU C T I V I T Y MON I T OR 86
the evolution of total factor productivity in
advanced economies (Oberfield, 2013). Over the
last decades, the development of information
and communication technologies and the reduc-
tion in transport costs have completely over-
hauled the organization of production and
corporate boundaries. Efficient or cost-saving
production may require fragmentation of the
production process among multiple producers.
Firms have more and more intensively out-
sourced or offshored tasks they were doing in-
house and concentrated on the business activi-
ties where they are most efficient. For example,
it has been commonly observed in many coun-
tries that firms have increasingly outsourced
support activities like catering, cleaning and
security services to specific service providers
(Goldschmidt and Schmieder, 2017).
These changes have led to the organization of
production in very complex networks reshaping
the way technological or trade shocks propagate
within an economy. Analyzing the spread of
shocks through the network may provide very
useful insight for understanding the global TFP
slowdown observed in the last decade and why
the technology gap between frontier firms and
laggards has been widening. While these impor-
tant questions are clearly beyond the scope of
our article, we intend to contribute to this liter-
ature by providing a first description of the pro-
duct ion ne twork and i l lu s t ra te how the
integration of individual firms into the Belgian
production network and the global economy
affects productivity.
This article is structured as follows. The first
main section presents the new database. A sec-
ond section provides an initial set of network-
related statistics that describe the Belgian pro-
duction network and its development over the
2002-2014 period. The third section is dedi-
cated to the analysis of the proximity of Belgian
firms to foreign markets, while section the
fourth section investigates the link between our
measures of proximity and the firm’s economic
performance. The fifth and final section pre-
sents some tentative conclusions.
The Belgian Production Network
In order to document firms’ involvement in
the international fragmentation of production as
well as the organization of the production net-
work, we use two datasets which are available for
the 2002-2014 period. The first dataset man-
aged by the National Bank of Belgium provides
firm-level information on exports and imports
by product and by country.7
The second dataset comes from the annual
declarations of deliveries by business customers
to the Belgian tax administration. It records for
every VAT-registered business the annual value
of its deliveries to any other VAT affiliate, as
long as this amount is greater than or equal to
250 euros per year. This annual value of sales
from firm i to firm j is called a transaction. This
transaction is not split between the potentially
multiple goods and services traded between
firms i and j. It only represents the total value of
goods and services traded between those two
firms. However, we may observe bilateral trade
between those two firms. In this case, we
observe both the transaction between i (as a
seller) and j (as a buyer) and its reverse transac-
tion between j (as a seller) and i (as a buyer). This
7 The term firm refers to any legal entity registered by the tax administration under a VAT number. It is therefore
a legal concept of a firm that is used. This concept covers all kinds of organisations from the Belgian affiliates
of multinationals to the local corner store or the self-employed. A given firm may have more than one plant
operating under the same VAT number. Transactions between those plants are not observed in our data. Alter-
natively, some organizations may decide to use more than one VAT number to handle specific activities (for
example, on VAT number will deal with production, another with domestic business relations and a third one
with exports). Trade between the different VAT affiliates is observed.
87 NUMB E R 32 , S P R I NG 2017
dataset therefore provides all the linkages
between all Belgian firms. These data, described
in Dhyne, Magerman and Rubinova (2015),
enable us to fully characterize the local produc-
tion network.
Merging these two datasets therefore gives a
full picture of any domestic or international
linkages that involve at least one Belgian firm.
We will discuss in the next two sections some
facts about the organization of the domestic
production network and its interrelation with
world markets, but first it is useful to discuss the
specificities of such a dataset.
The firm-to-firm transaction data can be
viewed as a kind of input-output matrix where
each row and each column is a firm. In that
respect, it is therefore a very suitable tool for
analyzing the organization of production chains
at the national level, in the same way that world
input/output tables (Timmer et al., 2014) pro-
vide a description of the contribution of a given
industry in a given country to global value
chains. Still, this dataset departs from traditional
I/O tables in a number of ways.
First, we have no information of what is
traded between two firms. We are therefore not
able to distinguish between intermediate inputs
and investment inputs. In our data, buying an
investment good is considered as an intermedi-
ate purchase. Conversely, investment expendi-
ture is part of final demand in an input-output
framework.
Second, the manner in which wholesale and
retail trade intermediaries are recorded is funda-
mentally different from that of standard I/O
tables. In standard I/O tables, the contribution
of the wholesalers and retailers to the economy
and their intermediate deliveries to other sec-
tors is measured in terms of the value added gen-
erated by wholesalers and retailers. In our
transaction data, we observe gross transactions
to or from trade intermediaries. The contribu-
tion of wholesalers and retailers in the network
is therefore much larger than in standard I/O
tables. These firms, as shown in section 2, play a
crucial role in the domestic production network.
They are in fact most of the time the ultimate
step between the producer and the final con-
sumer. They are also a key player in connecting
firms.
Third, there is no intra-firm trade in our
dataset, which means that the diagonal of our
firm-to-firm I/O matrix is 0. On the contrary, in
standard I/O tables, the main action is in the
diagonal. This affects measures of production
fragmentation, as the Antras et al . (2012)
upstreamness indicator.
Stylized Facts on Domestic Trade
Before looking at how Belgian firms are
involved in GVCs, we first describe the Belgian
production network. As we do not restrict our
analysis by any firm characteristics such as size
or productivity level, we obtain the largest cov-
erage of the Belgian economy available for our
analysis. This means we use the set of all legal
entities that are registered with a VAT number
both for tax declarations and in international
trade data. Each year, we observe between
676,000 and 861,000 VAT declarants, which is
twice the number of firms that have to report
their annual financial statement to the National
Bank of Belgium Central Balance Sheet Office.
The difference is due to the self-employed or
fiscal representatives of foreign firms that do not
have to file a financial statement.
Characteristic 1: Belgian Firms Typically
Have a Small Number of Domestic Custom-
ers and Domestic Suppliers
On average, we observe around 20 domestic
business customers for each firm (Table 1).8
8 By customers, we only refer to business customers. Firms may also serve final demand and may have many
households in their client portfolio, but these transactions are not observed in our dataset.
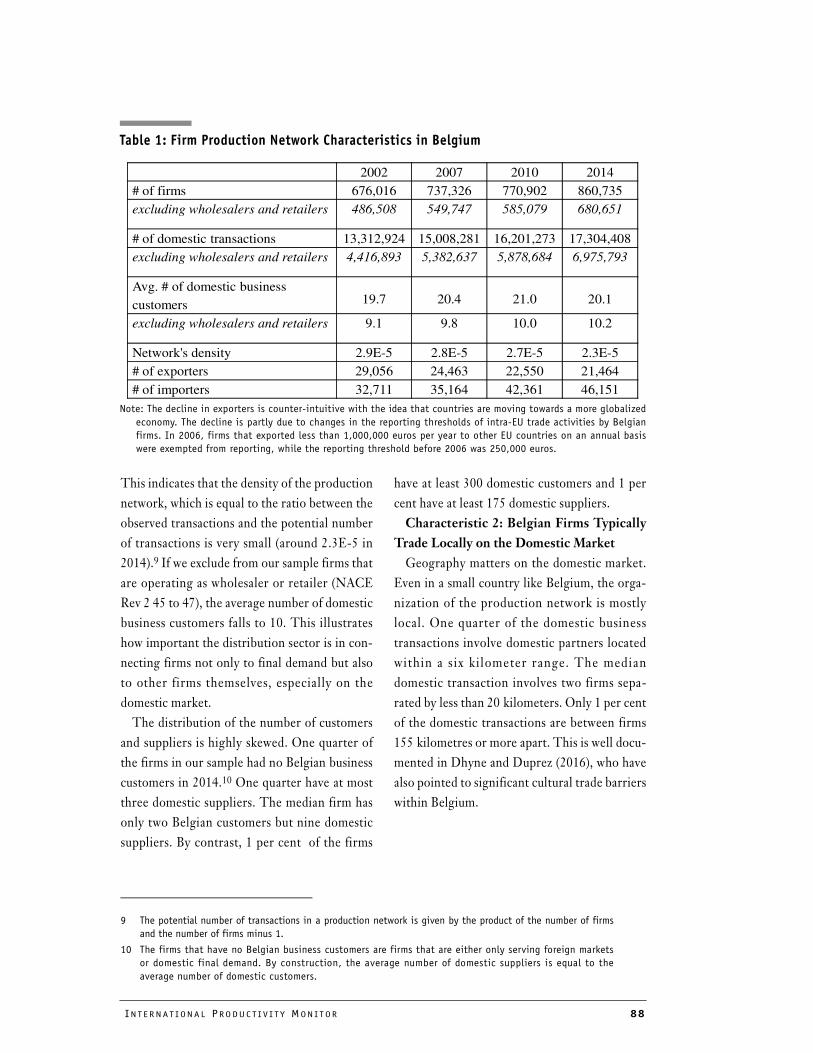
INT E R N A T I ON A L PRO DU C T I V I T Y MON I T OR 88
2002 2007 2010 2014
# of firms 676,016 737,326 770,902 860,735
excluding wholesalers and retailers 486,508 549,747 585,079 680,651
# of domestic transactions 13,312,924 15,008,281 16,201,273 17,304,408
excluding wholesalers and retailers 4,416,893 5,382,637 5,878,684 6,975,793
Avg. # of domestic business
customers 19.7 20.4 21.0 20.1
excluding wholesalers and retailers 9.1 9.8 10.0 10.2
Network's density 2.9E-5 2.8E-5 2.7E-5 2.3E-5
# of exporters 29,056 24,463 22,550 21,464
# of importers 32,711 35,164 42,361 46,151
Table 1: Firm Production Network Characteristics in Belgium
Note: The decline in exporters is counter-intuitive with the idea that countries are moving towards a more globalized
economy. The decline is partly due to changes in the reporting thresholds of intra-EU trade activities by Belgian
firms. In 2006, firms that exported less than 1,000,000 euros per year to other EU countries on an annual basis
were exempted from reporting, while the reporting threshold before 2006 was 250,000 euros.
This indicates that the density of the production
network, which is equal to the ratio between the
observed transactions and the potential number
of transactions is very small (around 2.3E-5 in
2014).9 If we exclude from our sample firms that
are operating as wholesaler or retailer (NACE
Rev 2 45 to 47), the average number of domestic
business customers falls to 10. This illustrates
how important the distribution sector is in con-
necting firms not only to final demand but also
to other firms themselves, especially on the
domestic market.
The distribution of the number of customers
and suppliers is highly skewed. One quarter of
the firms in our sample had no Belgian business
customers in 2014.10 One quarter have at most
three domestic suppliers. The median firm has
only two Belgian customers but nine domestic
suppliers. By contrast, 1 per cent of the firms
have at least 300 domestic customers and 1 per
cent have at least 175 domestic suppliers.
Characteristic 2: Belgian Firms Typically
Trade Locally on the Domestic Market
Geography matters on the domestic market.
Even in a small country like Belgium, the orga-
nization of the production network is mostly
local. One quarter of the domestic business
transactions involve domestic partners located
within a s ix kilometer range. The median
domestic transaction involves two firms sepa-
rated by less than 20 kilometers. Only 1 per cent
of the domestic transactions are between firms
155 kilometres or more apart. This is well docu-
mented in Dhyne and Duprez (2016), who have
also pointed to significant cultural trade barriers
within Belgium.
9 The potential number of transactions in a production network is given by the product of the number of firms
and the number of firms minus 1.
10 The firms that have no Belgian business customers are firms that are either only serving foreign markets
or domestic final demand. By construction, the average number of domestic suppliers is equal to the
average number of domestic customers.
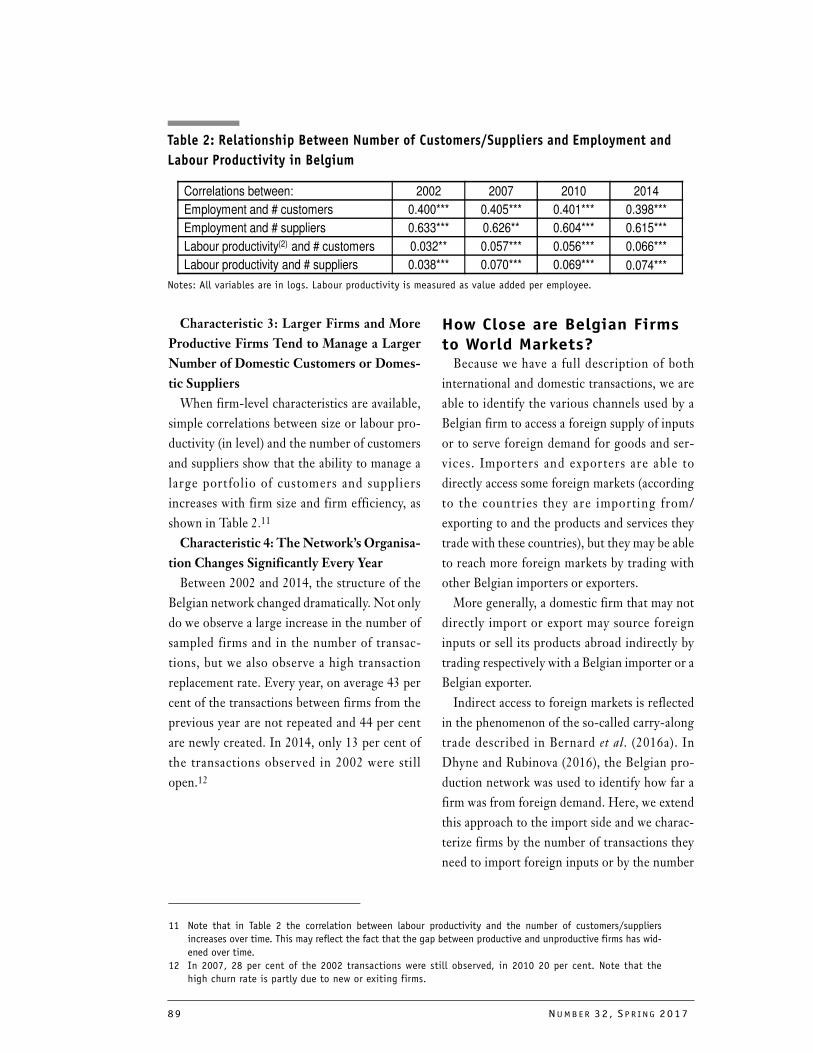
89 NUMB E R 32 , S P R I NG 2017
Correlations between: 2002 2007 2010 2014
Employment and # customers 0.400*** 0.405*** 0.401*** 0.398***
Employment and # suppliers 0.633*** 0.626** 0.604*** 0.615***
Labour productivity(2) and # customers 0.032** 0.057*** 0.056*** 0.066***
Labour productivity and # suppliers 0.038*** 0.070*** 0.069*** 0.074***
Table 2: Relationship Between Number of Customers/Suppliers and Employment and
Labour Productivity in Belgium
Notes: All variables are in logs. Labour productivity is measured as value added per employee.
Characteristic 3: Larger Firms and More
Productive Firms Tend to Manage a Larger
Number of Domestic Customers or Domes-
tic Suppliers
When firm-level characteristics are available,
simple correlations between size or labour pro-
ductivity (in level) and the number of customers
and suppliers show that the ability to manage a
large portfolio of customers and suppliers
increases with firm size and firm efficiency, as
shown in Table 2.11
Characteristic 4: The Network’s Organisa-
tion Changes Significantly Every Year
Between 2002 and 2014, the structure of the
Belgian network changed dramatically. Not only
do we observe a large increase in the number of
sampled firms and in the number of transac-
tions, but we also observe a high transaction
replacement rate. Every year, on average 43 per
cent of the transactions between firms from the
previous year are not repeated and 44 per cent
are newly created. In 2014, only 13 per cent of
the transactions observed in 2002 were still
open.12
How Close are Belgian Firms to World Markets?
Because we have a full description of both
international and domestic transactions, we are
able to identify the various channels used by a
Belgian firm to access a foreign supply of inputs
or to serve foreign demand for goods and ser-
vices. Importers and exporters are able to
directly access some foreign markets (according
to the countries they are importing from/
exporting to and the products and services they
trade with these countries), but they may be able
to reach more foreign markets by trading with
other Belgian importers or exporters.
More generally, a domestic firm that may not
directly import or export may source foreign
inputs or sell its products abroad indirectly by
trading respectively with a Belgian importer or a
Belgian exporter.
Indirect access to foreign markets is reflected
in the phenomenon of the so-called carry-along
trade described in Bernard et al. (2016a). In
Dhyne and Rubinova (2016), the Belgian pro-
duction network was used to identify how far a
firm was from foreign demand. Here, we extend
this approach to the import side and we charac-
terize firms by the number of transactions they
need to import foreign inputs or by the number
11 Note that in Table 2 the correlation between labour productivity and the number of customers/suppliers
increases over time. This may reflect the fact that the gap between productive and unproductive firms has wid-
ened over time.
12 In 2007, 28 per cent of the 2002 transactions were still observed, in 2010 20 per cent. Note that the
high churn rate is partly due to new or exiting firms.
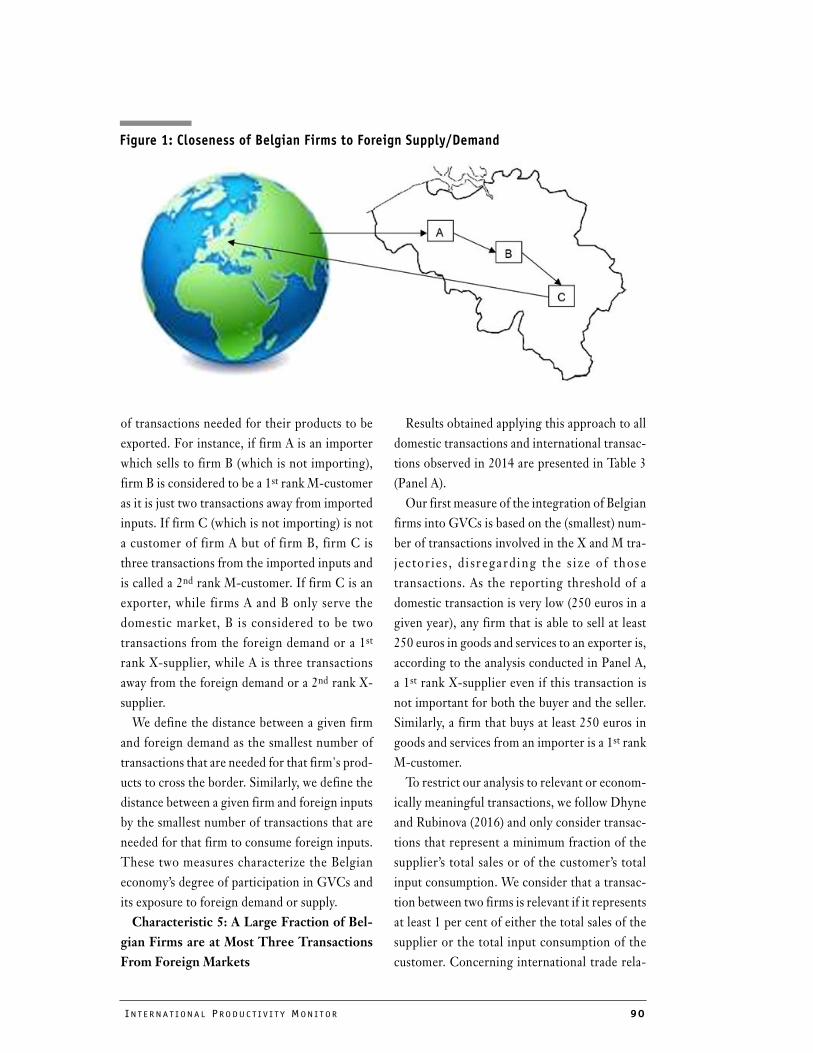
INT E R N A T I ON A L PRO DU C T I V I T Y MON I T OR 90
of transactions needed for their products to be
exported. For instance, if firm A is an importer
which sells to firm B (which is not importing),
firm B is considered to be a 1st rank M-customer
as it is just two transactions away from imported
inputs. If firm C (which is not importing) is not
a customer of firm A but of firm B, firm C is
three transactions from the imported inputs and
is called a 2nd rank M-customer. If firm C is an
exporter, while firms A and B only serve the
domestic market, B is considered to be two
transactions from the foreign demand or a 1st
rank X-supplier, while A is three transactions
away from the foreign demand or a 2nd rank X-
supplier.
We define the distance between a given firm
and foreign demand as the smallest number of
transactions that are needed for that firm's prod-
ucts to cross the border. Similarly, we define the
distance between a given firm and foreign inputs
by the smallest number of transactions that are
needed for that firm to consume foreign inputs.
These two measures characterize the Belgian
economy’s degree of participation in GVCs and
its exposure to foreign demand or supply.
Characteristic 5: A Large Fraction of Bel-
gian Firms are at Most Three Transactions
From Foreign Markets
Results obtained applying this approach to all
domestic transactions and international transac-
tions observed in 2014 are presented in Table 3
(Panel A).
Our first measure of the integration of Belgian
firms into GVCs is based on the (smallest) num-
ber of transactions involved in the X and M tra-
jec tor ies , di sregarding the s ize o f those
transactions. As the reporting threshold of a
domestic transaction is very low (250 euros in a
given year), any firm that is able to sell at least
250 euros in goods and services to an exporter is,
according to the analysis conducted in Panel A,
a 1st rank X-supplier even if this transaction is
not important for both the buyer and the seller.
Similarly, a firm that buys at least 250 euros in
goods and services from an importer is a 1st rank
M-customer.
To restrict our analysis to relevant or econom-
ically meaningful transactions, we follow Dhyne
and Rubinova (2016) and only consider transac-
tions that represent a minimum fraction of the
supplier’s total sales or of the customer’s total
input consumption. We consider that a transac-
tion between two firms is relevant if it represents
at least 1 per cent of either the total sales of the
supplier or the total input consumption of the
customer. Concerning international trade rela-
Figure 1: Closeness of Belgian Firms to Foreign Supply/Demand
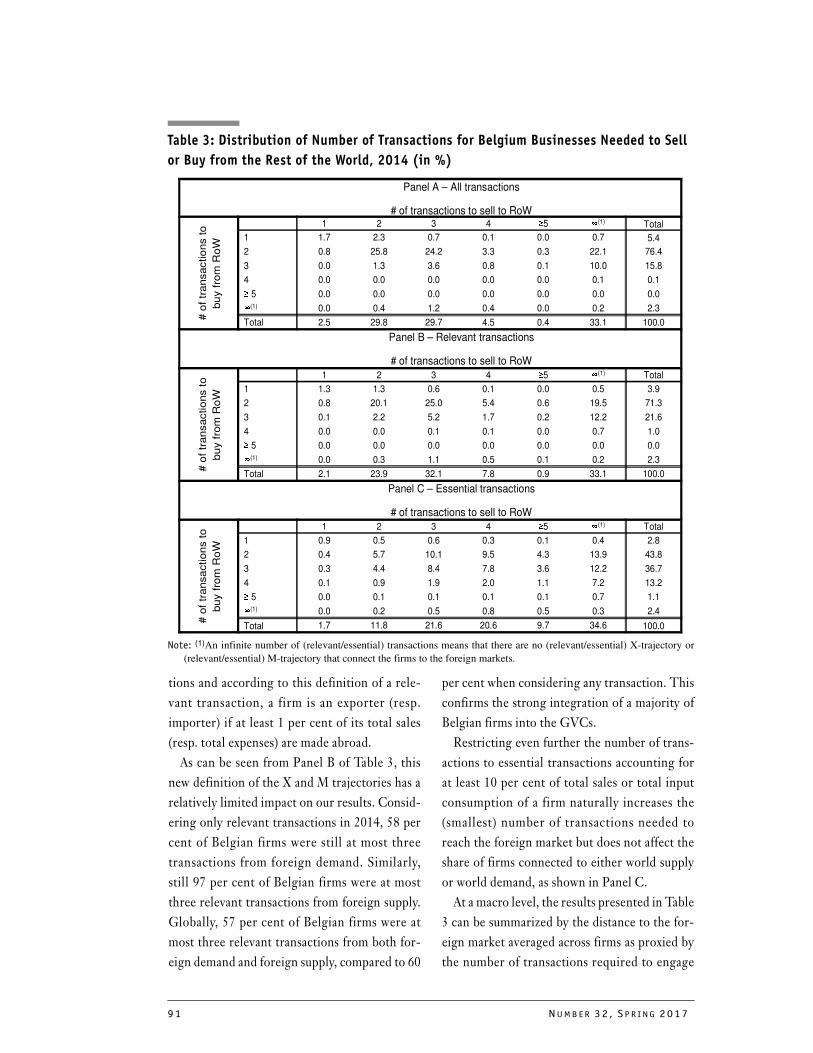
91 NUMB E R 32 , S P R I NG 2017
Panel A – All transactions
# of transactions to sell to RoW# o
f tr
ansactio
ns to
bu
y f
rom
RoW
1 2 3 4 �5 �
(1) Total
1 1.7 2.3 0.7 0.1 0.0 0.7 5.4
2 0.8 25.8 24.2 3.3 0.3 22.1 76.4
3 0.0 1.3 3.6 0.8 0.1 10.0 15.8
4 0.0 0.0 0.0 0.0 0.0 0.1 0.1
� 5 0.0 0.0 0.0 0.0 0.0 0.0 0.0
�
(1) 0.0 0.4 1.2 0.4 0.0 0.2 2.3
Total 2.5 29.8 29.7 4.5 0.4 33.1 100.0
Panel B – Relevant transactions
# of transactions to sell to RoW
# o
f tr
an
sactio
ns to
bu
y f
rom
Ro
W
1 2 3 4 �5 �
(1) Total
1 1.3 1.3 0.6 0.1 0.0 0.5 3.9
2 0.8 20.1 25.0 5.4 0.6 19.5 71.3
3 0.1 2.2 5.2 1.7 0.2 12.2 21.6
4 0.0 0.0 0.1 0.1 0.0 0.7 1.0
� 5 0.0 0.0 0.0 0.0 0.0 0.0 0.0
�
(1) 0.0 0.3 1.1 0.5 0.1 0.2 2.3
Total 2.1 23.9 32.1 7.8 0.9 33.1 100.0
Panel C – Essential transactions
# of transactions to sell to RoW
# o
f tr
an
sa
ction
s t
o
buy f
rom
Ro
W
1 2 3 4 �5 �
(1) Total
1 0.9 0.5 0.6 0.3 0.1 0.4 2.8
2 0.4 5.7 10.1 9.5 4.3 13.9 43.8
3 0.3 4.4 8.4 7.8 3.6 12.2 36.7
4 0.1 0.9 1.9 2.0 1.1 7.2 13.2
� 5 0.0 0.1 0.1 0.1 0.1 0.7 1.1
�
(1) 0.0 0.2 0.5 0.8 0.5 0.3 2.4
Total 1.7 11.8 21.6 20.6 9.7 34.6 100.0
tions and according to this definition of a rele-
vant transaction, a firm is an exporter (resp.
importer) if at least 1 per cent of its total sales
(resp. total expenses) are made abroad.
As can be seen from Panel B of Table 3, this
new definition of the X and M trajectories has a
relatively limited impact on our results. Consid-
ering only relevant transactions in 2014, 58 per
cent of Belgian firms were still at most three
transactions from foreign demand. Similarly,
still 97 per cent of Belgian firms were at most
three relevant transactions from foreign supply.
Globally, 57 per cent of Belgian firms were at
most three relevant transactions from both for-
eign demand and foreign supply, compared to 60
per cent when considering any transaction. This
confirms the strong integration of a majority of
Belgian firms into the GVCs.
Restricting even further the number of trans-
actions to essential transactions accounting for
at least 10 per cent of total sales or total input
consumption of a firm naturally increases the
(smallest) number of transactions needed to
reach the foreign market but does not affect the
share of firms connected to either world supply
or world demand, as shown in Panel C.
At a macro level, the results presented in Table
3 can be summarized by the distance to the for-
eign market averaged across firms as proxied by
the number of transactions required to engage
Table 3: Distribution of Number of Transactions for Belgium Businesses Needed to Sell
or Buy from the Rest of the World, 2014 (in %)
Note: (1)An infinite number of (relevant/essential) transactions means that there are no (relevant/essential) X-trajectory or
(relevant/essential) M-trajectory that connect the firms to the foreign markets.
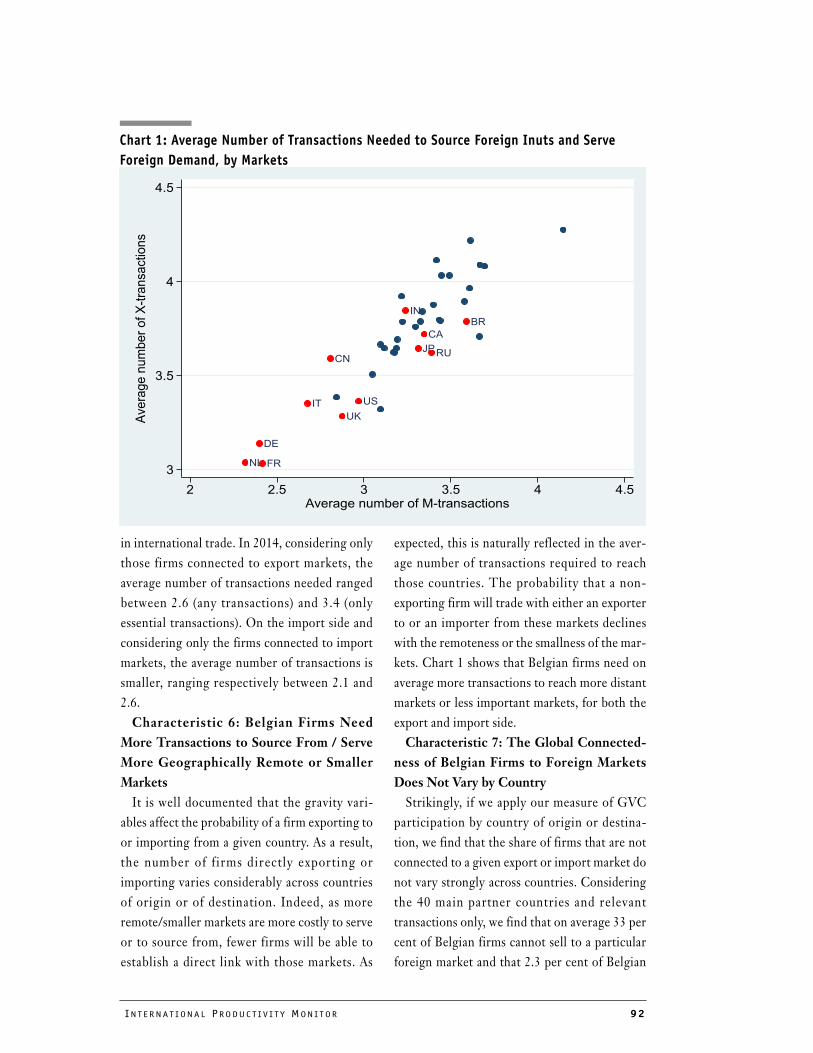
INT E R N A T I ON A L PRO DU C T I V I T Y MON I T OR 92
Chart 1: Average Number of Transactions Needed to Source Foreign Inuts and Serve
Foreign Demand, by Markets
in international trade. In 2014, considering only
those firms connected to export markets, the
average number of transactions needed ranged
between 2.6 (any transactions) and 3.4 (only
essential transactions). On the import side and
considering only the firms connected to import
markets, the average number of transactions is
smaller, ranging respectively between 2.1 and
2.6.
Characteristic 6: Belgian Firms Need
More Transactions to Source From / Serve
More Geographically Remote or Smaller
Markets
It is well documented that the gravity vari-
ables affect the probability of a firm exporting to
or importing from a given country. As a result,
the number of firms directly exporting or
importing varies considerably across countries
of origin or of destination. Indeed, as more
remote/smaller markets are more costly to serve
or to source from, fewer firms will be able to
establish a direct link with those markets. As
expected, this is naturally reflected in the aver-
age number of transactions required to reach
those countries. The probability that a non-
exporting firm will trade with either an exporter
to or an importer from these markets declines
with the remoteness or the smallness of the mar-
kets. Chart 1 shows that Belgian firms need on
average more transactions to reach more distant
markets or less important markets, for both the
export and import side.
Characteristic 7: The Global Connected-
ness of Belgian Firms to Foreign Markets
Does Not Vary by Country
Strikingly, if we apply our measure of GVC
participation by country of origin or destina-
tion, we find that the share of firms that are not
connected to a given export or import market do
not vary strongly across countries. Considering
the 40 main partner countries and relevant
transactions only, we find that on average 33 per
cent of Belgian firms cannot sell to a particular
foreign market and that 2.3 per cent of Belgian
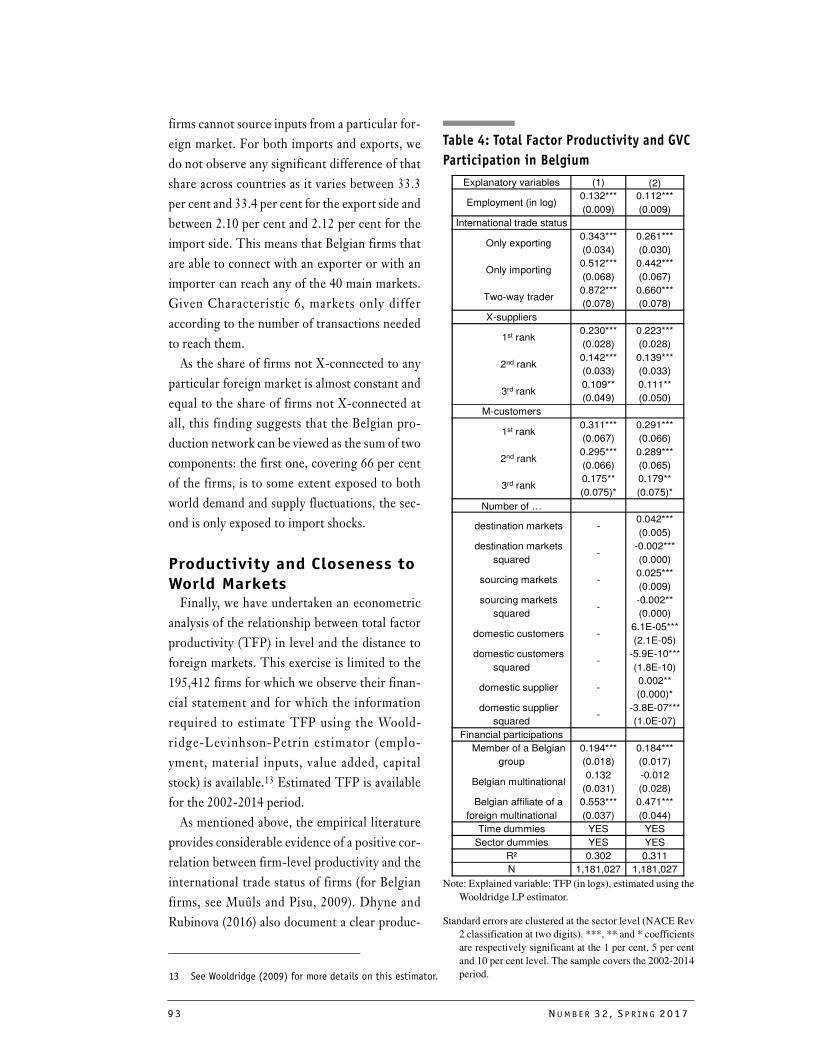
93 NUMB E R 32 , S P R I NG 2017
Explanatory variables (1) (2)
Employment (in log)0.132***
(0.009)
0.112***
(0.009)
International trade status
Only exporting0.343***
(0.034)
0.261***
(0.030)
Only importing0.512***
(0.068)
0.442***
(0.067)
Two-way trader0.872***
(0.078)
0.660***
(0.078)
X-suppliers
1st rank0.230***
(0.028)
0.223***
(0.028)
2nd rank0.142***
(0.033)
0.139***
(0.033)
3rd rank0.109**
(0.049)
0.111**
(0.050)
M-customers
1st rank0.311***
(0.067)
0.291***
(0.066)
2nd rank0.295***
(0.066)
0.289***
(0.065)
3rd rank0.175**
(0.075)*
0.179**
(0.075)*
Number of …
destination markets -0.042***
(0.005)
destination markets
squared-
-0.002***
(0.000)
sourcing markets -0.025***
(0.009)
sourcing markets
squared-
-0.002**
(0.000)
domestic customers -6.1E-05***
(2.1E-05)
domestic customers
squared-
-5.9E-10***
(1.8E-10)
domestic supplier -0.002**
(0.000)*
domestic supplier
squared-
-3.8E-07***
(1.0E-07)
Financial participations
Member of a Belgian
group
0.194***
(0.018)
0.184***
(0.017)
Belgian multinational0.132
(0.031)
-0.012
(0.028)
Belgian affiliate of a
foreign multinational
0.553***
(0.037)
0.471***
(0.044)
Time dummies YES YES
Sector dummies YES YES
R² 0.302 0.311
N 1,181,027 1,181,027
Table 4: Total Factor Productivity and GVC
Participation in Belgium
Note: Explained variable: TFP (in logs), estimated using the
Wooldridge LP estimator.
Standard errors are clustered at the sector level (NACE Rev
2 classification at two digits). ***, ** and * coefficients
are respectively significant at the 1 per cent, 5 per cent
and 10 per cent level. The sample covers the 2002-2014
period.
firms cannot source inputs from a particular for-
eign market. For both imports and exports, we
do not observe any significant difference of that
share across countries as it varies between 33.3
per cent and 33.4 per cent for the export side and
between 2.10 per cent and 2.12 per cent for the
import side. This means that Belgian firms that
are able to connect with an exporter or with an
importer can reach any of the 40 main markets.
Given Characteristic 6, markets only differ
according to the number of transactions needed
to reach them.
As the share of firms not X-connected to any
particular foreign market is almost constant and
equal to the share of firms not X-connected at
all, this finding suggests that the Belgian pro-
duction network can be viewed as the sum of two
components: the first one, covering 66 per cent
of the firms, is to some extent exposed to both
world demand and supply fluctuations, the sec-
ond is only exposed to import shocks.
Productivity and Closeness to World Markets
Finally, we have undertaken an econometric
analysis of the relationship between total factor
productivity (TFP) in level and the distance to
foreign markets. This exercise is limited to the
195,412 firms for which we observe their finan-
cial statement and for which the information
required to estimate TFP using the Woold-
ridge-Levinhson-Petrin estimator (emplo-
yment, material inputs, value added, capital
stock) is available.13 Estimated TFP is available
for the 2002-2014 period.
As mentioned above, the empirical literature
provides considerable evidence of a positive cor-
relation between firm-level productivity and the
international trade status of firms (for Belgian
firms, see Muûls and Pisu, 2009). Dhyne and
Rubinova (2016) also document a clear produc-
13 See Wooldridge (2009) for more details on this estimator.
INT E R N A T I ON A L PRO DU C T I V I T Y MON I T OR 94
tivity ranking according to the distance to
export markets. Here we extend this type of
analysis by also controlling for distance to
import markets and other firm characteristics
(firm size, number of customers, number of sup-
pliers, number of destination markets, number
of sourcing markets, etc.). Distance to foreign
markets is computed considering the number of
relevant transactions. The numbers of custom-
ers/suppliers/destination markets/sourcing
markets are also evaluated considering only the
relevant transactions.
While we cannot interpret the results pre-
sented in Table 4 as causal relations because of
endogeneity issues between TFP (in level) and
some of our explanatory variables, we still
observe significant correlations between effi-
ciency and our control variables.
As commonly observed, within NACE 2-digit
sectors, the most productive firms tend to be the
largest ones. They also tend to be more deeply
integrated into the global economy. Two-way
traders are the most efficient firms in the Bel-
gian economy, followed by firms that only
import and then firms that only export.
Firms that are active on international markets
are followed in the productivity ranking by 1st
rank M-customer and 1st rank X-supplier. We
observe a clear productivity ranking based on
the two distances to foreign markets. M-cus-
tomers that are closer to foreign inputs are more
efficient, reflecting their potentially greater
ability to source better inputs (Dhyne and
Duprez, 2017). Similarly X-suppliers that are
closer to foreign demand are more efficient. As
the productivity premium is higher for import-
ers than for exporters, we find the distance to
imports has a greater influence than the distance
to exports.
The less efficient firms are those which are
more than four transactions away from the for-
eign markets. These firms suffer a productivity
handicap of 67 per cent in comparison to the
most efficient ones.
Total factor productivity also seems to be
related to the number of transactions a firm is
able to engage in. Among the exporting firms,
serving more markets increases efficiency. Simi-
larly, sourcing inputs from more markets is
related to higher efficiency. The marginal effect
of the number of destination or sourcing mar-
kets declines but remains positive in the obser-
vation range in our sample.
A posi t ive (non-l inear) re lat ion is a lso
observed between efficiency and the number of
domestic customers and domestic suppliers but
the impact of these local transactions on effi-
ciency is much more limited than the impact of
international transactions.
Finally, as expected, firms that are members of
a Belgian or a foreign group tend to also be more
productive. Foreign affiliates of multinationals
have the largest productivity premium.
Concluding RemarksThe purpose of this article has been to provide
some facts about the degree of integration of the
Belgian economy into global value chains and to
describe the organization of the domestic pro-
duction network.
Using a unique dataset that makes it possible
to observe domestic or international transac-
tions involving at least one Belgian firm, we find
that most Belgian firms have a limited number
of domestic suppliers or domestic business cus-
tomers; most of their domestic transactions are
local; and larger and more efficient firms are
able to manage larger customer or supplier port-
folios.
In terms of GVC participation, we find that,
even if the share of directly exporting or import-
ing firms is small in the Belgian production net-
work (between 2 and 5 per cent of Belgian VAT
affiliates), Belgian firms require on average
between 2.6 and 3.4 transactions to serve foreign
95 NUMB E R 32 , S P R I NG 2017
demand and between 2.1 and 2.6 transactions to
source foreign inputs. Only one-third of Belgian
firms are totally disconnected from demand
from the rest of the world. This share does not
vary by destination countries, but firms that can
export indirectly need more transactions to
reach more remote and less important foreign
markets. We also find a clear productivity rank-
ing of Belgian firms according to their closeness
to foreign markets.
These results have a number of important pol-
icy implications. First, they illustrate the poten-
t i a l d am ag e a s s o c i a t e d w i t h r i s i n g
protectionism. Our f indings suggest that
restraining imports would not only hamper
direct importers but almost the entire produc-
tion network as well.
Second, the results could also affect the way
policy-makers should address the competitive-
ness issue. Because exporters or importers are
essential for the integration of an economy into
global value chains, the economic debate on the
competitiveness of a country has mostly focused
on changes in its exporters’ competitive posi-
tion.14 However, focusing only on the competi-
tiveness of the exporting/importing firms does
not seem to be sufficient in itself to assess the
competitiveness of an economy.
Third, it is also important to look at the firms
that are indirectly connected to international
markets. These firms tend to lag behind in terms
of technological efficiency. As described in
Andrews et al. (2016), their technological gap
has tended to widen during the recent period,
jeopardizing their ability to survive and flourish
in the global value chains. Evidence based on the
CompNet Database (Compnet, 2014) also sug-
gests that, when Belgian firms are compared to
their German or French counterparts, it was the
less efficient Belgian firms that suffered a sharp
deterioration in their competitiveness over the
1998-2011 period, being unable to offset the
increase in labour costs with productivity gains
(National Bank of Belgium, 2013). This may
push more firms out of the internationally inte-
grated value chains and have a negative long-run
impact on the growth potential of the Belgian
economy, as trade and especially international
trade can serve as a vector of technological spill-
over.
This article also points out the potential for
new information from the analysis of production
networks. This type of data allows a better
understanding of the exposure of an economy to
external shocks and how shocks propagate
throughout the economy. It also challenges the
way we measure productivity, raising the issue of
production boundaries and how they affect our
measures of performance.
ReferencesAcemoglu, D., V. Carvalho, A. Ozdaglar, and A. Tah-
baz-Salehi (2012) “Network Origins of Aggre-gate Fluctuations,” Econometrica, Vol. 80, pp. 1977–2016.
Amiti, M. and J. Konings (2007) "Trade Liberaliza-tion, Intermediate Inputs, and Productivity: Evi-dence from Indonesia," American Economic Review, Vol. 97, No. 5, pp. 1611-1638.
Andrews, D., C. Criscuolo, and P. N. Gal (2016) "The Best Versus the Rest: The Global Produc-tivity Slowdown, Divergence Across Firms and the Role of Public Policy," OECD Productivity Working Papers No. 5.
Antràs, P. and D. Chor (2013) “Organizing the Glo-bal Value Chain,” Econometrica, Vol. 81, No. 6. pp. 2127–2204.
Antràs, P., D. Chor, T. Fally, and R. Hillberry (2012) “Measuring the Upstreamness of Production and Trade Flows,” American Economic Review, Vol. 102, pp. 412–416.
Antràs, P., T. Fort, and F. Tintelnot (2016) "The Margins of Global Sourcing: Theory and Evi-dence from U.S. Firms," mimeo.
Atalay, E., A. Hortaçsu, J. Roberts and C. Syverson (2011) "Network Structure of Production," Pro-ceedings of the National Academy of Sciences of the
14 In the public debate, imports are mostly considered as harmful for domestic producers. However, imports as a
source of better quality inputs for domestic producers is also a key determinant of the competitiveness of an
economy.

INT E R N A T I ON A L PRO DU C T I V I T Y MON I T OR 96
United States of America, Vol. 118, No. 3, pp. 5199-5202.
Bernard, A. and J.B. Jensen (1999) “Exceptional Exporter Performance: Cause, Effect, or Both?” Journal of International Economics, Vol. 47, No. 1, pp. 1-25.
Bernard, A., A. Moxnes and Y. Saito (2016a) "Pro-duction Networks, Geography and Firm Perfor-mance," mimeo.
Bernard, A., A. Moxnes and Y. Saito (2016b) "Carry-Along Trade," mimeo.
Bernard, A., J. B. Jensen and P. Schott (2009) “Importers, Exporters, and Multinationals: A Portrait of Firms in the U.S. that Trade Goods,” in Dunne,T., Jensen, J.B.,Roberts,M.J. (eds.) Producer Dynamics: New Evidence from Micro Data (Chicago: University of Chicago Press).
Bernard, A., J. B. Jensen, S. Redding and P. Schott (2010) "Wholesalers and Retailers in US Trade," American Economic Review, Vol. 100, No. 2, pp. 408-413.
CompNet Task Force (2014) “Micro-based Evidence of EU Competitiveness: The CompNet Data-base,” European Central Bank Working Paper Series No. 1634.
Dhyne, E. and C. Duprez (2015) "Has the Crisis Altered the Belgian Economy's DNA?" Economic Review of the National Bank of Belgium, Septem-ber, pp. 29-40.
Dhyne, E. and C. Duprez (2016) "Three Regions, Three Economies?" Economic Review of the National Bank of Belgium, December, pp. 65-80.
Dhyne, E. and C. Duprez (2017) "Local Sourcing and Production Efficiency," mimeo.
Dhyne, E. and S. Rubinova (2016) "The Supplier Network of Exporters: Connecting the Dots," National Bank Belgium Working Paper Series, No. 296.
Dhyne, E., G. Magerman and S. Rubinova (2015) "The Belgian Production Network 2002-2012," National Bank Belgium Working Paper Series, No. 288.
Fally T. and R. Hillberry (2014) “A Coasian Model of International Production Chains,” mimeo.
Goldschmidt, D. and J. Schmieder (2017) "The Rise of Domestic Outsourcing and the Evolution of the German Wage Structure," Quarterly Journal of Economics, forthcoming.
Koopman, R., Z. Wang and S.-J. Wei (2014) "Trac-ing Value-Added and Double Counting in Gross Exports," American Economic Review, Vol. 104, No. 2, pp. 459-94.
Melitz, M. and S. Redding (2014) “Heterogeneous Firms and Trade,” in Handbook of International Economics, Vol. 4.
Muûls, M. and M. Pisu (2009) "Imports and Exports at the Level of the Firm: Evidence from Bel-gium," World Economy, Vol. 32, No. 5, pp. 692-734.
National Bank of Belgium (2013) Annual Report.Oberfield, E. (2013) “Business Networks, Produc-
tion Chains, and Productivity: A Theory of Input-Output Architecture,” Mimeo.
Ottaviano, G. and T. Mayer (2007) "The Happy Few: the Internationalisation of European Firms," Bruegel Blueprint, No. 3.
Timmer, M. P., A. A., Erumban, B. Los, R. Stehr-erand G.J. de Vries (2014) "Slicing Up Global Value Chains," Journal of Economic Perspectives, Spring 2014.
Wooldridge, J. (2009) “On Estimating Firm-level Production Functions Using Proxy Variables to Control for Unobservables,” Economic Letters, Vol. 104, No. 3, pp. 112-114.
INT E R N A T I ON A L PRO DU C T I V I T Y MON I T OR 97
Firm-level Productivity Differences: Insights from the OECD’s MultiProd Project
Giuseppe Berlingieri
OECD and ESSEC
Patrick Blanchenay University of Toronto
Sara Calligaris
OECD
Chiara Criscuolo
OECD1
ABSTRACT
Productivity plays a central role in shaping the welfare of societies and the competitiveness
of countries. Productivity differences, for instance, explain a large share of the differences in
income per capita across countries. This article investigates the role of productivity
heterogeneity across 18 countries over the period 2001-2012. In particular, it analyses the
evidence that emerges from the distributed micro-data approach carried out in the OECD
MultiProd project. The main outcome of the project is a unique dataset of harmonized cross-
country moments that are representative for the population of firms and comparable across
countries even at a detailed industry level. We look at the 90-10 percentile ratio of labour
productivity and multifactor productivity and show that: i) productivity dispersion is high in
both manufacturing and non-financial market services; ii) it has increased over time,
especially in services; iii) a substantial part of this dispersion comes from differences among
firms within the same sector of activity in each country; iv) this within-sector dispersion
remains the most important component of the overall dispersion for the entire period.
One of the main objectives of economic
research is to understand why some nations are
more developed than others. A simple measure
of economic development, output per capita,
illustrates the large disparity found across coun-
tries. These disparities largely reflect different
levels of productivity across countries. Hall and
Jones (1999), for example, find that in the
United States output per worker, a measure of
labour productivity (LP, henceforth), is 35 times
greater than in Niger. LP differences can be par-
tially explained by differences in physical and
human capital (Caselli, 1999). However, the
main reason for the disparity between these two
1 This article has benefited from helpful feedback from Dirk Pilat, Nick Johnstone, Giuseppe Nicoletti, and CIIE
delegates at the OECD. We would also like to thank the editor Andrew Sharpe and two anonymous referees for
useful comments and suggestions. All errors remain our own. Emails: [email protected],
98 NUMB E R 32 , S P R I NG 2017
countries comes from differences in aggregate
multifactor productivity (MFP, henceforth),
which reflects the overall efficiency with which
inputs are combined in the production process.
More generally, Prescott (1998) suggests that
differences in aggregate MFP are the main
driver of international income differences found
both across countries and over time. This point
is further illustrated by Klenow and Rodiguez-
Clare (1997), who conduct a cross-country anal-
ysis of 98 nations and suggest that 90 per cent of
the country divergence in growth of output per
worker correspond to disparity in MFP growth.2
In turn, aggregate productivity growth
depends closely on MFP at the firm level. If
firms increase the efficiency with which they
turn inputs into outputs, they can contribute to
overall efficiency gains. However, empirical evi-
dence finds substantial heterogeneity in MFP
across firms, even within narrowly defined
industries. In the US manufacturing sector, the
MFP ratio between an industry's 90th and 10th
percentile plants is on average 1.92, implying
that plants in the 90th percentile roughly make
twice the amount with the same inputs as those
plants in the 10th percentile (Syverson, 2004).
Such dispersion is not only found in developed
countries but also in developing ones. For
instance, Hsieh and Klenow (2009) find that the
ratio of MFP between 90th and 10th percentiles
in the manufacturing industries of China and
India is on average more than 5:1.
In light of the large dispersion of firms' MFP,
analysing industry average productivity does not
offer the complete picture: countries might dis-
play the same average but very different under-
lying distributions. This fact has important
policy implications. For instance, low average
productivity can be explained by either too few
firms at the top (lack of innovation), or too many
firms at the bottom (weak market selection), two
different situations that would entail very differ-
ent policies.3 To better design policy strategies,
it is therefore essential to understand how firm-
level productivity patterns translate into aggre-
gate productivity.
Economists typically attribute differences in
MFP across firms to either slow technology
adoption or inefficient technology usage.4 In
addition, a growing body of literature attributes
high aggregate MFP not only to the efficiency of
technology use and speed of adoption but also to
the efficient allocation of resources across firms.
Resource reallocation can raise aggregate pro-
ductivity when there is a flow of inputs from
low- to high-productivity firms. Conversely,
when factors are allocated in an inefficient man-
ner, aggregate productivity is adversely affected.
These important issues have been investigated
by two intrinsically interrelated branches of the
literature. The reallocation literature typically
focuses on the drivers of resource reallocation,
such as creative destruction, and upscaling and
downscaling of firms, together with the factors
that may influence them, such as technological
change, regulation and recessions. The misallo-
cation literature typically identifies a specific
distortion or a bundle of distortions (policies
and/or institutions) and examines the extent to
which they adversely impact aggregate produc-
tivity. The results obtained in the misallocation
literature show that distortions in the economy
can have a quantitatively important effect on
aggregate productivity.5
2 See Hsieh and Klenow (2010) and Hopenhayn (2014) for a more recent review of the literature.
3 On this topic see, for example, Malerba and Orsenigo (1995 and 1996), Breschi et al. (2000) and Van Dijk
(2000).
4 See Parente and Prescott (1994), Comin and Hobijin (2006), Schmitz (2005) and Bloom et al. (2013).
5 See Restuccia and Rogerson (2013) for a review on the misallocation literature, and Foster et al. (2001,
2002, 2014) for examples of works in the reallocation literature.
INT E R N A T I ON A L PRO DU C T I V I T Y MON I T OR 99
The OECD contributes to this debate by pro-
viding new policy relevant evidence through the
multifactor productivity (MultiProd) project.
This project provides a comprehensive picture
of productivity patterns across a large set of
countries over the last two decades.6 In particu-
lar, the project collects micro-aggregated data
and moments of the productivity distribution
that allow for a cross-country analysis of a wide
variety of topics, including productivity hetero-
geneity, allocative efficiency, misallocation,
aggregate productivity growth, and the link
between productivity and wages. A similar
approach has been used in the past in academic
circles (see, for example, Bartelsman, Scarpetta,
and Schivardi, 2005; Bartelsman, Haltiwanger,
and Scarpetta, 2009), as well as within the
OECD (OECD, 2003), the World Bank and,
more recently, the European Central Bank.
One of the main contributions of the Multi-
Prod project is to build cross-country harmo-
nized micro-aggregated data of paramount
importance for understanding differences in
productivity performance across countries. The
project relies on a distributed microdata meth-
odology, and the micro-aggregated results (at
the cell level) are collected, checked and analy-
sed at the OECD.7
An important aspect of the methodology is to
make sure the data are comparable across coun-
tries. Therefore, productivity is measured in
exactly the same way across countries, condi-
tional on the available data. To further ensure
harmonization and representativeness, in partic-
ular for countries where MultiProd relies on
production surveys, an appropriate set of
weights is built using information from business
registers, which typically cover the whole popu-
lation of firms. We use these weights to reweight
production surveys.
Many studies based on micro-level datasets
adopt a resampling procedure in order to
achieve a representative dataset (to name a few,
for example, Schwellnus and Arnold, 2008, and
Arnold et al., 2008). However, MultiProd is to
our knowledge the first project based on a dis-
tributed microdata approach to have imple-
mented a highly disaggregated, var iable-
specific, reweighting strategy for both represen-
tativeness and aggregation. This reweighting
strategy allows us to compute moments repre-
sentative for the population of businesses and
suitable for cross-country comparison even at
the two-digit industry or at a more disaggre-
gated level.
The output of the algorithm is a collection of
statistics at different levels of aggregation over
the 1994-2012 period, depending on data avail-
ability. It allows for various decompositions of
aggregate productivity level, growth and disper-
sion to understand the role of particular indus-
tries or groups of firms in explaining aggregate
outcomes (e.g. small vs large; multinational cor-
porations; old vs young; low vs high productiv-
ity; etc.). For instance, changes in the overall
productivity dispersion are decomposed to
quantify how much of an increase in dispersion
is due to an increase in within-industry disper-
sion and how much comes from a reallocation of
resources to industries characterized by a higher
dispersion. Moreover, the role of the largest
firms can be investigated in great detail and
compared to that of the most productive firms
("frontier firms"). Finally, MultiProd attempts
6 The time period is to some extent country specific depending on data availability and is limited to more
recent years for some countries. For more details on MultiProd, see Berlingieri et al., (2017).
7 The OECD pioneered this methodology at the beginning of the 2000s (OECD, 2003). It currently follows
the distributed microdata approach in three ongoing projects: MultiProd (Multifactor Productivity),
DynEmp (Dynamics of Employment) and MicroBeRD (Microdata-based Analysis of Business Expenditure on
R&D). See further details in Section 2.
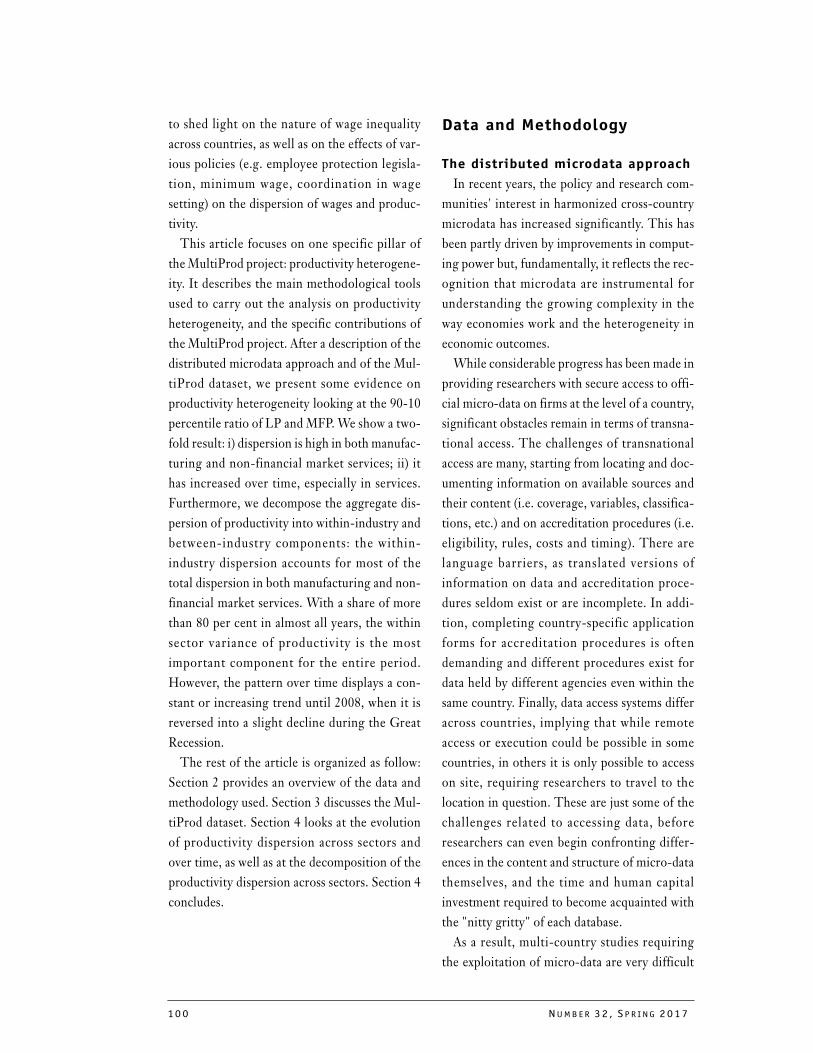
100 NUMB E R 32 , S P R I NG 2017
to shed light on the nature of wage inequality
across countries, as well as on the effects of var-
ious policies (e.g. employee protection legisla-
tion, minimum wage, coordination in wage
setting) on the dispersion of wages and produc-
tivity.
This article focuses on one specific pillar of
the MultiProd project: productivity heterogene-
ity. It describes the main methodological tools
used to carry out the analysis on productivity
heterogeneity, and the specific contributions of
the MultiProd project. After a description of the
distributed microdata approach and of the Mul-
tiProd dataset, we present some evidence on
productivity heterogeneity looking at the 90-10
percentile ratio of LP and MFP. We show a two-
fold result: i) dispersion is high in both manufac-
turing and non-financial market services; ii) it
has increased over time, especially in services.
Furthermore, we decompose the aggregate dis-
persion of productivity into within-industry and
between-industry components: the within-
industry dispersion accounts for most of the
total dispersion in both manufacturing and non-
financial market services. With a share of more
than 80 per cent in almost all years, the within
sector variance of productivity is the most
important component for the entire period.
However, the pattern over time displays a con-
stant or increasing trend until 2008, when it is
reversed into a slight decline during the Great
Recession.
The rest of the article is organized as follow:
Section 2 provides an overview of the data and
methodology used. Section 3 discusses the Mul-
tiProd dataset. Section 4 looks at the evolution
of productivity dispersion across sectors and
over time, as well as at the decomposition of the
productivity dispersion across sectors. Section 4
concludes.
Data and Methodology
The distributed microdata approach
In recent years, the policy and research com-
munities' interest in harmonized cross-country
microdata has increased significantly. This has
been partly driven by improvements in comput-
ing power but, fundamentally, it reflects the rec-
ognition that microdata are instrumental for
understanding the growing complexity in the
way economies work and the heterogeneity in
economic outcomes.
While considerable progress has been made in
providing researchers with secure access to offi-
cial micro-data on firms at the level of a country,
significant obstacles remain in terms of transna-
tional access. The challenges of transnational
access are many, starting from locating and doc-
umenting information on available sources and
their content (i.e. coverage, variables, classifica-
tions, etc.) and on accreditation procedures (i.e.
eligibility, rules, costs and timing). There are
language barriers, as translated versions of
information on data and accreditation proce-
dures seldom exist or are incomplete. In addi-
tion, completing country-specific application
forms for accreditation procedures is often
demanding and different procedures exist for
data held by different agencies even within the
same country. Finally, data access systems differ
across countries, implying that while remote
access or execution could be possible in some
countries, in others it is only possible to access
on site, requiring researchers to travel to the
location in question. These are just some of the
challenges related to accessing data, before
researchers can even begin confronting differ-
ences in the content and structure of micro-data
themselves, and the time and human capital
investment required to become acquainted with
the "nitty gritty" of each database.
As a result, multi-country studies requiring
the exploitation of micro-data are very difficult
INT E R N A T I ON A L PRO DU C T I V I T Y MON I T OR 101
to conduct, and often rely on the formation and
co-ordination of networks of national research-
ers, with each team having access to their
respective national micro-data. The compara-
bility of the country level results needs therefore
to be insured via the use of a common protocol
for data collection and aggregation and a com-
mon model specification for the econometric
analysis.
The OECD pioneered this methodology,
called distributed microdata analysis, at the
beginning of the 2000s (OECD, 2003). It cur-
rently follows this approach in three ongoing
projects: MultiProd, DynEmp, and MicroB-
eRD.8 The distributed micro-data analysis
involves running a common code in a decentral-
ized manner by representatives in national sta-
tistical agencies or experts in public institutions,
who have access to the national micro-level data.
At this stage, micro-aggregated data are gener-
ated by the centrally designed, but locally exe-
cuted, program codes, which are then sent for
comparative cross-country analysis to the
OECD. Figure 1 summarizes how the distrib-
uted micro-data approach works.
The advantages of this novel data collection
methodology are manifold: it puts a lower bur-
den on national statistical agencies and limits
running costs for such endeavours. Importantly,
it also overcomes the confidentiality constraints
of directly using national micro-level statistical
databases while at the same time achieving a
high degree of harmonization and comparability
across countries, sectors and over time.
In spite of these advantages, this procedure is
still not widely applied today when collecting
statistical information. This may have to do with
the amount of time needed to set up and manage
the network as well as to develop a well-func-
tioning, "error-free" program code which is able
8 MultiProd, DynEmp, and MicroBeRD are projects carried out by the Directorate for Science, Technology and
Innovation (STI) at the OECD. The DynEmp project provides harmonized microaggregated data to analyse
employment dynamics (www.oecd.org/sti/dynemp) and MicroBERD provides information on R&D activity in
firms from official business R&D surveys (www.oecd.org/sti/rdtax).
Figure 1: Distributed Micro-data Analysis
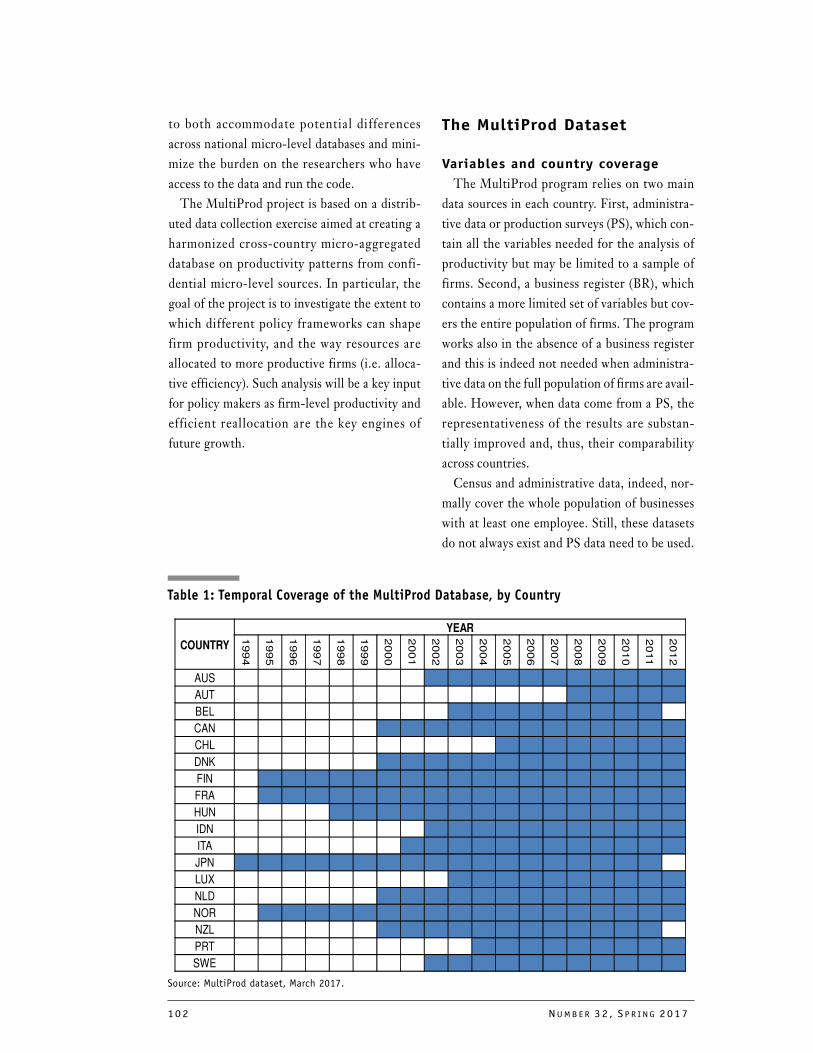
102 NUMB E R 32 , S P R I NG 2017
COUNTRY
YEAR
199
4
199
5
199
6
199
7
199
8
199
9
200
0
200
1
200
2
200
3
200
4
200
5
200
6
200
7
200
8
200
9
201
0
2011
201
2
AUS
AUT
BEL
CAN
CHL
DNK
FIN
FRA
HUN
IDN
ITA
JPN
LUX
NLD
NOR
NZL
PRT
SWE
Table 1: Temporal Coverage of the MultiProd Database, by Country
Source: MultiProd dataset, March 2017.
to both accommodate potential differences
across national micro-level databases and mini-
mize the burden on the researchers who have
access to the data and run the code.
The MultiProd project is based on a distrib-
uted data collection exercise aimed at creating a
harmonized cross-country micro-aggregated
database on productivity patterns from confi-
dential micro-level sources. In particular, the
goal of the project is to investigate the extent to
which different policy frameworks can shape
firm productivity, and the way resources are
allocated to more productive firms (i.e. alloca-
tive efficiency). Such analysis will be a key input
for policy makers as firm-level productivity and
efficient reallocation are the key engines of
future growth.
The MultiProd Dataset
Variables and country coverage
The MultiProd program relies on two main
data sources in each country. First, administra-
tive data or production surveys (PS), which con-
tain all the variables needed for the analysis of
productivity but may be limited to a sample of
firms. Second, a business register (BR), which
contains a more limited set of variables but cov-
ers the entire population of firms. The program
works also in the absence of a business register
and this is indeed not needed when administra-
tive data on the full population of firms are avail-
able. However, when data come from a PS, the
representativeness of the results are substan-
tially improved and, thus, their comparability
across countries.
Census and administrative data, indeed, nor-
mally cover the whole population of businesses
with at least one employee. Still, these datasets
do not always exist and PS data need to be used.
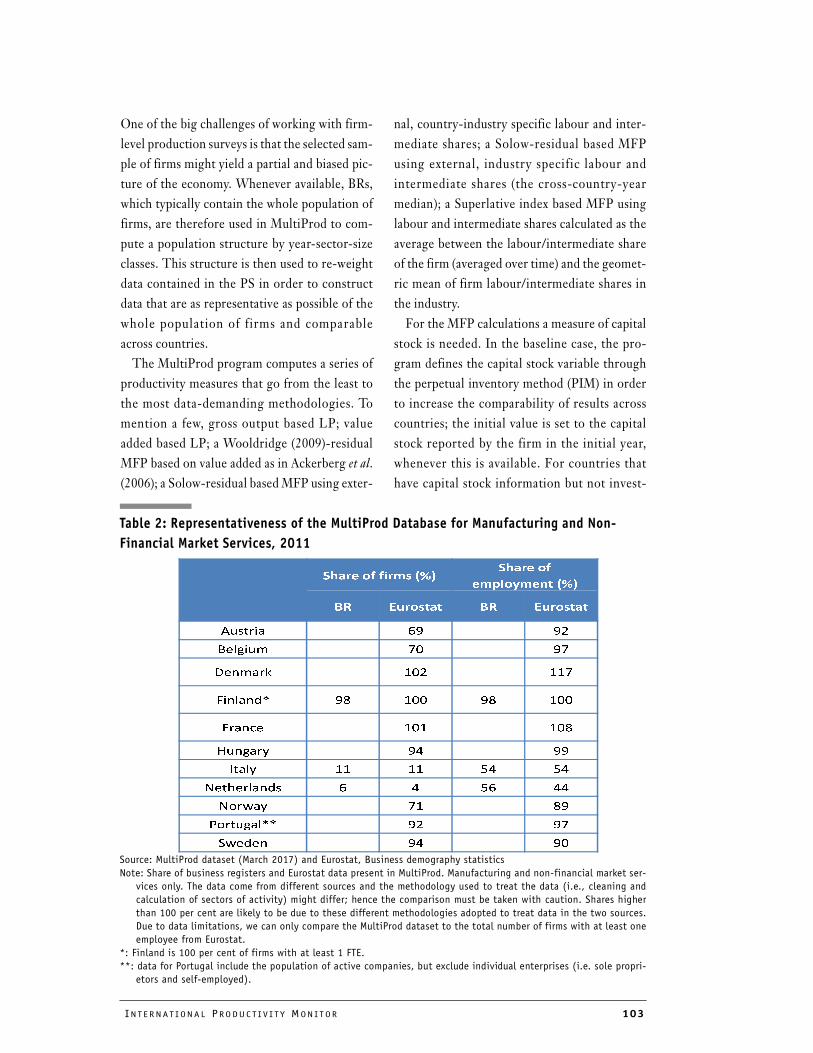
INT E R N A T I ON A L PRO DU C T I V I T Y MON I T OR 103
�������������� �
���������
���������� �
�� �������� �� ��������
������� �
�� ���� �� �
������� �� ���
��� ���� � ��� � ���
������ ��� ���
������� �
��� � �� �� �� ��
��!�� ���� � � �� ��
"�#�� �� �
$"����� �� �
%#���� � �
Table 2: Representativeness of the MultiProd Database for Manufacturing and Non-
Financial Market Services, 2011
Source: MultiProd dataset (March 2017) and Eurostat, Business demography statistics
Note: Share of business registers and Eurostat data present in MultiProd. Manufacturing and non-financial market ser-
vices only. The data come from different sources and the methodology used to treat the data (i.e., cleaning and
calculation of sectors of activity) might differ; hence the comparison must be taken with caution. Shares higher
than 100 per cent are likely to be due to these different methodologies adopted to treat data in the two sources.
Due to data limitations, we can only compare the MultiProd dataset to the total number of firms with at least one
employee from Eurostat.
*: Finland is 100 per cent of firms with at least 1 FTE.
**: data for Portugal include the population of active companies, but exclude individual enterprises (i.e. sole propri-
etors and self-employed).
One of the big challenges of working with firm-
level production surveys is that the selected sam-
ple of firms might yield a partial and biased pic-
ture of the economy. Whenever available, BRs,
which typically contain the whole population of
firms, are therefore used in MultiProd to com-
pute a population structure by year-sector-size
classes. This structure is then used to re-weight
data contained in the PS in order to construct
data that are as representative as possible of the
whole population of firms and comparable
across countries.
The MultiProd program computes a series of
productivity measures that go from the least to
the most data-demanding methodologies. To
mention a few, gross output based LP; value
added based LP; a Wooldridge (2009)-residual
MFP based on value added as in Ackerberg et al.
(2006); a Solow-residual based MFP using exter-
nal, country-industry specific labour and inter-
mediate shares; a Solow-residual based MFP
using external, industry specific labour and
intermediate shares (the cross-country-year
median); a Superlative index based MFP using
labour and intermediate shares calculated as the
average between the labour/intermediate share
of the firm (averaged over time) and the geomet-
ric mean of firm labour/intermediate shares in
the industry.
For the MFP calculations a measure of capital
stock is needed. In the baseline case, the pro-
gram defines the capital stock variable through
the perpetual inventory method (PIM) in order
to increase the comparability of results across
countries; the initial value is set to the capital
stock reported by the firm in the initial year,
whenever this is available. For countries that
have capital stock information but not invest-
104 NUMB E R 32 , S P R I NG 2017
ment data, the capital stock becomes the main
measure of capital. Finally, labour is measured
by the number of employees or persons engaged
(depending on data availability).
At the time of writing, 18 countries have been
successfully included in the MultiProd database
(namely, Australia, Austria, Belgium, Canada,
Chile, Denmark, Finland, France, Hungary,
Italy, Indonesia, Japan, Luxembourg, Nether-
lands, Norway, New Zealand, Portugal and
Sweden). The data for each of the countries
included so far are collected annually and at
firm-level.
For most countries the time period covered by
MultiProd spans between the early 2000s and
2012. Table 1 details for each country the exact
period covered. MultiProd collects data for all
sectors of the entire economy, whenever avail-
able. However, for the purposes of this analysis
we have restricted our sample to the manufac-
turing and non-financial market services sector.
To provide an idea of the coverage for the
European countries contained in the MultiProd
dataset, Table 2 reports for 2011 the share of
firms and employment with respect to both the
Business Register (when available) and to Euro-
stat data (annual business demography by size
class database). The table is constructed for the
manufacturing and non-financial market service
sectors. The data from Eurostat refer to the total
number of firms or the total number of firms
with at least one employee, in accordance with
the micro-data used in MultiProd.
Comparing across different data sources is
never easy, but data from Eurostat give a good
benchmark to compare our data. The coverage
is rather high in most of the countries (and
results are very similar for each year of the sam-
ple). In particular, we have datasets covering
roughly the population of firms for all countries
reported in the table, except for Italy and the
Netherlands. However, for these two countries
the full BR is available, and thus the samples are
reweighted. For instance, Italy has a skewed dis-
tribution with a large mass of very small firms
which cannot be captured by production sur-
veys. The survey used by MultiProd contains
only 11 per cent of the total population of firms
(both with respect to the BR and to the data pub-
lished by Eurostat) but it accounts for 54 per
cent of total employment. At the same time we
have access to the entire population of firms
from the Business Register, which we use to
reweight our sample moments.
In the Netherlands the situation is similar,
with the only existing survey of firms represent-
ing a very small share of firms, but the BR allows
us to re-weight those firms ex-post in order to
make the reported statistics representative of the
total economy. In other words, in all countries
except Italy and the Netherlands each firm has a
weight equal (or close) to one, whereas the Ital-
ian and the Dutch datasets have been reweighted
using the BR, which cover the population of
firms.9
The weighting procedure entails the follow-
ing two main steps:
1) Preparation of the population struc-
ture from the Business Registry (BR): the num-
ber of firms by year, industry, size class is
obtained from the BR, using the most detailed
industry level available and seven size classes
(with thresholds at 5, 10, 20, 50, 100 and 250
employees).
2) Calculation of actual weights: the
weights are computed, for each variable, as the
number of firms in the population of the corre-
sponding industry and size class divided by the
number of firms in the survey, after having
cleaned the data through an outlier filter.
9 The weights are variable-specific, hence missing information or outliers might cause weight to be different
from one even in the presence of data containing the entire population of businesses.
INT E R N A T I ON A L PRO DU C T I V I T Y MON I T OR 105
Output
MultiProd output is a collection of files that
contain statistics for different variables com-
puted yearly at a detailed sectoral level.10 The
program is flexible to allow for multiple levels of
aggregation at which the output is produced
and, for each of those levels, the types of aggre-
gated data to be included.
The statistics are never collected at the level
of the individual firm. Instead the programme
splits firms along various dimensions, into cells,
and for each cell collects aggregate annual data.
In addition, these statistics are collected in terms
of both levels and growth rates. The dimensions
used for the split are the following, which can be
specified at different levels of aggregation:
• Sector: 1-digit (STAN A7) aggregation level
and 2-digit (STAN A38) aggregation level;
• Firm-level productivity distribution: split-
ting firms into productivity quantiles (with
productivity defined in various ways, such as
LP, MFP à la Wooldridge 2009, MFP à la
Solow);
• Gross output distribution: splitting firms
into quantiles based on gross output;
• Size class: splitting firms into groups based
on employment levels;
• Age of the firm: splitting firms into groups
based on age;
• Ownership: independent firm vs. affiliate of
a business group, and nationality of the
group;
• Demographics: entrants, exitors, incum-
bents, etc.
The output is provided also combining the
previous dimensions together (e.g. the interac-
tion of age and size classes).11
Several statistics are collected:
• Basic moments: mean, median, standard
deviation, and number of non-missing val-
ues, for a series of variables.
• Several measures of aggregate productivity:
decomposition of both aggregate LP and/or
MFP, together with allocative efficiency
measures (Olley-Pakes 1996 covariance
terms).
• Measures of allocative efficiency based on
Hsieh and Klenow (2009), and Petrin and
Sivadasan (2013) to analyse the role of allo-
cation and selection.
• Distribution characteristics for productivity
levels, productivity growth rates, output and
wages. These include both non-parametric
measures such as percentiles and parameters
of the distributions (e.g., pareto).
• Descriptive statistics of firm characteristics
(including growth rate and wage dispersion)
by quantiles of the productivity distribution
in levels and growth, and by quantiles of the
sales distribution.
• Characteristics (productivity, age, persis-
tence, size, ownership, investments etc.) of
firms at the productivity frontier.
• Employment dynamics by quantiles of the
productivity distribution.
• Estimated parameters from distributed
regressions at the firm level, with the aim of
establishing a set of stylised facts for each
country regarding the relationship between
productivity, firm characteristics (size, age,
previous performance, ownership, etc.) and
structural characteristics (concentration,
misallocation, sectoral policies, etc.).
• Tabulations of firms with negative value
added and graphs of the sectors' productiv-
ity distributions.
The output produced by the program covers a
wide range of topics: productivity heterogene-
10 For further details see Berlingieri et al.(2017).
11 However note that, although possible, the code never combines more than three dimensions at the same
time; the reason is that the number of firms in each cell would become small enough to incur confidenti-
ality problems, especially at high levels of industry disaggregation.
106 NUMB E R 32 , S P R I NG 2017
ity; allocative efficiency; granularity; and wage
dispersion and its link to productivity.
In order to examine the effects of policies and
macro shocks on productivity heterogeneity we
collect information about the distribution of
productivity (using different measures for it, as
described before). In particular, we aggregate
productivity and its variance to the sector level,
and we decompose productivity dispersion into
within- versus between-sector and within- ver-
sus between- quantile dispersion. Given the rel-
evance of this topic, this article is focused
exclusively on this block of results.
The access to firm-level data across multiple
countries also allows us to conduct an extensive
examination of allocative efficiency over time
and across countries, applying a number of dif-
ferent methods. The methods used are: the
Olley and Pakes (1996) static productivity
decomposition, as well as a dynamic version of it
(Melitz and Polanec, 2015); measurement of job
reallocation; measurement of productivity dis-
persion in the top and bottom size quantile of
firms in each sector and comparison to the pro-
ductivity dispersion in the whole sector; mea-
surement of misallocation according to the
Hsieh and Klenow (2009) procedure with some
refinements; a description of the distribution of
firm-level distortions in each input and their
overall impact on aggregate productivity; analy-
sis of the gap between the value of the marginal
product of an input and its marginal cost as in
Petrin and Sivadasan (2013); and run of distrib-
uted firm-level regressions of these measures of
misallocation on firm characteristics such as
size, age, and ownership.
In addition, the role of the largest firms can be
investigated in great detail and compared to that
of the most productive firms ("frontier firms").
This analysis sheds light on the so-called "gran-
ular" hypothesis, which posits that aggregate
fluctuations are the results of microeconomic
shocks and not economy-wide shocks, as usually
assumed.12 Such idiosyncratic shocks, even if
they are uncorrelated, may not cancel on aver-
age if sectors are dominated by a small number
of large firms. This fact can have important
implications for policies aimed at increasing
economic resilience, and highlights the impor-
tance of studying firm-level data to better
understand aggregate outcomes. The MultiProd
project can offer new insights on this hypothesis
by analysing how much of a country's economic
activity is driven by a small number of important
firms, and how much of the observed productiv-
ity variation is indeed the result of microeco-
nomic variations. The program collects a
number of indicators, such as: the market share
and the share of employment accounted for by
the top decile of firms in terms of gross output
and productivity; the sectoral level Hirsch-Her-
findahl Index (HHI); the decomposition of
aggregate productivity in both level and growth
between the contribution of the largest firms
and that of the other firms.
Finally, data collected in the MultiProd
project are instrumental to understand the evo-
lution of the between-firm component of wage
dispersion, which has been found to account for
a large share of the wage inequality of individu-
als (see, for example, Dunne et al., 2004, Card et
al., 2013, Card et al., 2014, Song et al., 2015). In
particular the program decomposes the wage
dispersion in the within and between contribu-
tion both for industry and productivity quan-
tiles; calculates the share of each industry and
productivity quantile in the overall within com-
ponent of wage dispersion; identifies the impact
12 With "granularity" we refer to the extent to which economic activity in general, and aggregate productivity in
particular, is driven by a small number of large firms. When large firms represent a disproportionate share of
the economy, indeed, aggregate fluctuations may be governed by idiosyncratic shocks to these large firms.
This hypothesis - called the "granular hypothesis" and proposed in Gabaix (2011) - suggests that aggregate
fluctuations can be traced back to micro shocks hitting a small number of large firms.
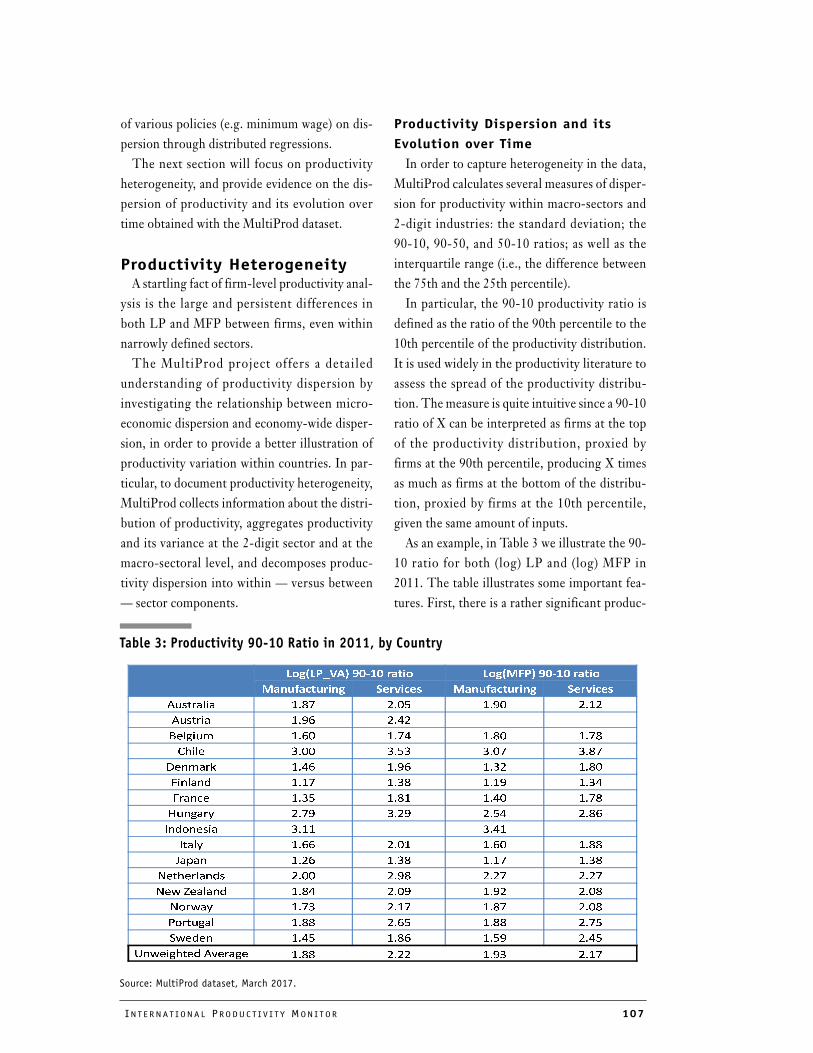
INT E R N A T I ON A L PRO DU C T I V I T Y MON I T OR 107
of various policies (e.g. minimum wage) on dis-
persion through distributed regressions.
The next section will focus on productivity
heterogeneity, and provide evidence on the dis-
persion of productivity and its evolution over
time obtained with the MultiProd dataset.
Productivity HeterogeneityA startling fact of firm-level productivity anal-
ysis is the large and persistent differences in
both LP and MFP between firms, even within
narrowly defined sectors.
The MultiProd project offers a detai led
understanding of productivity dispersion by
investigating the relationship between micro-
economic dispersion and economy-wide disper-
sion, in order to provide a better illustration of
productivity variation within countries. In par-
ticular, to document productivity heterogeneity,
MultiProd collects information about the distri-
bution of productivity, aggregates productivity
and its variance at the 2-digit sector and at the
macro-sectoral level, and decomposes produc-
tivity dispersion into within — versus between
— sector components.
Productivity Dispersion and its
Evolution over Time
In order to capture heterogeneity in the data,
MultiProd calculates several measures of disper-
sion for productivity within macro-sectors and
2-digit industries: the standard deviation; the
90-10, 90-50, and 50-10 ratios; as well as the
interquartile range (i.e., the difference between
the 75th and the 25th percentile).
In particular, the 90-10 productivity ratio is
defined as the ratio of the 90th percentile to the
10th percentile of the productivity distribution.
It is used widely in the productivity literature to
assess the spread of the productivity distribu-
tion. The measure is quite intuitive since a 90-10
ratio of X can be interpreted as firms at the top
of the productivity distribution, proxied by
firms at the 90th percentile, producing X times
as much as firms at the bottom of the distribu-
tion, proxied by firms at the 10th percentile,
given the same amount of inputs.
As an example, in Table 3 we illustrate the 90-
10 ratio for both (log) LP and (log) MFP in
2011. The table illustrates some important fea-
tures. First, there is a rather significant produc-
Table 3: Productivity 90-10 Ratio in 2011, by Country
Source: MultiProd dataset, March 2017.
����������� ������� ��������� �������
������������� �������� ������������� ��������
��������� �� �� ��
������� �� �
������� �� �� �� ��
����� ��� ��� ��� ���
������� �� �� � ��
������� � �� � ��
������ �� � �� ��
�����! �� � � �� ��
"��#����� � $ �� $
"���! �� � �� ��
%�&�� � �� � ��
'���������� �� �� � �
'�()*������ �� �� � ��
'#�(�! �� � �� ��
+#������ �� �� �� ��
,(���� �� �� �� ��
-�(������� �.�����
�� �� �
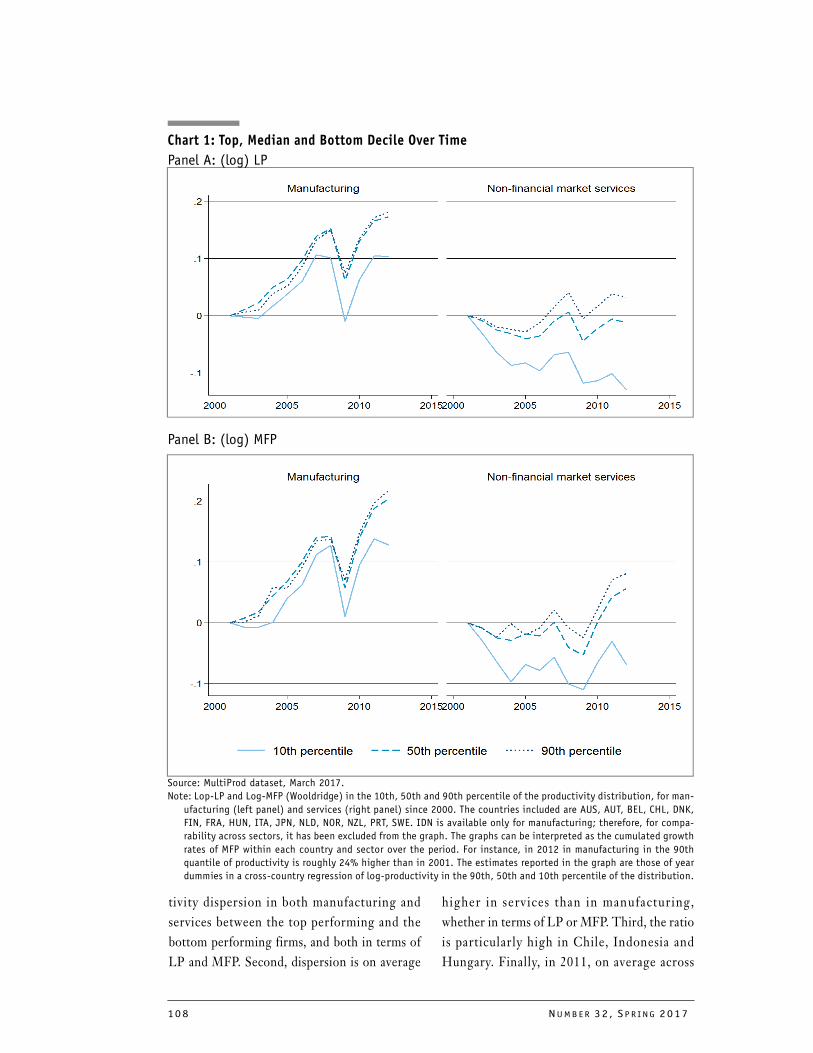
108 NUMB E R 32 , S P R I NG 2017
Source: MultiProd dataset, March 2017.
Note: Lop-LP and Log-MFP (Wooldridge) in the 10th, 50th and 90th percentile of the productivity distribution, for man-
ufacturing (left panel) and services (right panel) since 2000. The countries included are AUS, AUT, BEL, CHL, DNK,
FIN, FRA, HUN, ITA, JPN, NLD, NOR, NZL, PRT, SWE. IDN is available only for manufacturing; therefore, for compa-
rability across sectors, it has been excluded from the graph. The graphs can be interpreted as the cumulated growth
rates of MFP within each country and sector over the period. For instance, in 2012 in manufacturing in the 90th
quantile of productivity is roughly 24% higher than in 2001. The estimates reported in the graph are those of year
dummies in a cross-country regression of log-productivity in the 90th, 50th and 10th percentile of the distribution.
Chart 1: Top, Median and Bottom Decile Over Time
Panel A: (log) LP
Panel B: (log) MFP
tivity dispersion in both manufacturing and
services between the top performing and the
bottom performing firms, and both in terms of
LP and MFP. Second, dispersion is on average
higher in services than in manufacturing,
whether in terms of LP or MFP. Third, the ratio
is particularly high in Chile, Indonesia and
Hungary. Finally, in 2011, on average across
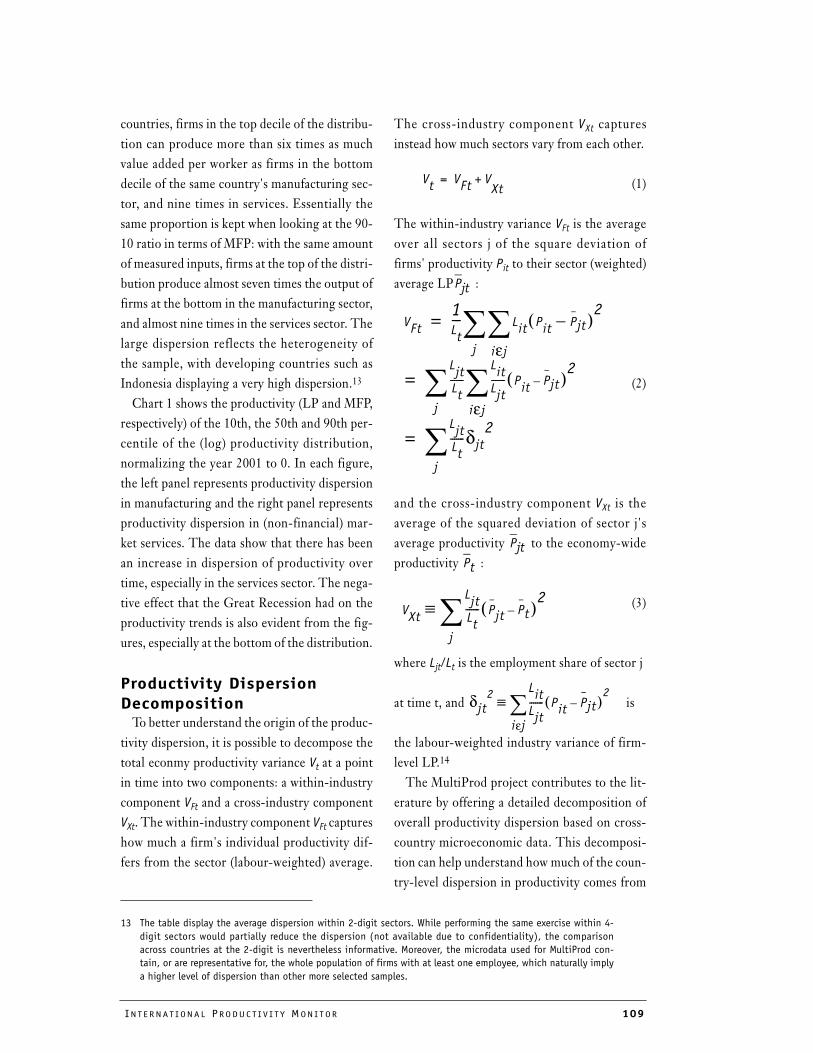
INT E R N A T I ON A L PRO DU C T I V I T Y MON I T OR 109
countries, firms in the top decile of the distribu-
tion can produce more than six times as much
value added per worker as firms in the bottom
decile of the same country's manufacturing sec-
tor, and nine times in services. Essentially the
same proportion is kept when looking at the 90-
10 ratio in terms of MFP: with the same amount
of measured inputs, firms at the top of the distri-
bution produce almost seven times the output of
firms at the bottom in the manufacturing sector,
and almost nine times in the services sector. The
large dispersion reflects the heterogeneity of
the sample, with developing countries such as
Indonesia displaying a very high dispersion.13
Chart 1 shows the productivity (LP and MFP,
respectively) of the 10th, the 50th and 90th per-
centile of the (log) productivity distribution,
normalizing the year 2001 to 0. In each figure,
the left panel represents productivity dispersion
in manufacturing and the right panel represents
productivity dispersion in (non-financial) mar-
ket services. The data show that there has been
an increase in dispersion of productivity over
time, especially in the services sector. The nega-
tive effect that the Great Recession had on the
productivity trends is also evident from the fig-
ures, especially at the bottom of the distribution.
Productivity Dispersion
DecompositionTo better understand the origin of the produc-
tivity dispersion, it is possible to decompose the
total econmy productivity variance Vt at a point
in time into two components: a within-industry
component VFt and a cross-industry component
VXt. The within-industry component VFt captures
how much a firm's individual productivity dif-
fers from the sector (labour-weighted) average.
The cross-industry component VXt captures
instead how much sectors vary from each other.
(1)
The within-industry variance VFt is the average
over all sectors j of the square deviation of
firms' productivity Pit to their sector (weighted)
average LP :
(2)
and the cross-industry component VXt is the
average of the squared deviation of sector j's
average productivity to the economy-wide
productivity :
(3)
where Ljt/Lt is the employment share of sector j
at time t, and is
the labour-weighted industry variance of firm-
level LP.14
The MultiProd project contributes to the lit-
erature by offering a detailed decomposition of
overall productivity dispersion based on cross-
country microeconomic data. This decomposi-
tion can help understand how much of the coun-
try-level dispersion in productivity comes from
13 The table display the average dispersion within 2-digit sectors. While performing the same exercise within 4-
digit sectors would partially reduce the dispersion (not available due to confidentiality), the comparison
across countries at the 2-digit is nevertheless informative. Moreover, the microdata used for MultiProd con-
tain, or are representative for, the whole population of firms with at least one employee, which naturally imply
a higher level of dispersion than other more selected samples.
Vt
VFt
V+Xt
=
Pjt
VFt
1Lt
--- Lit
Pit
Pjt–( )2
Ljt
Lt
-------Lit
Ljt
------- Pit
Pjt–( )2
Ljt
Lt
-------δjt
2
j
∑=
iεj
∑j
∑=
iεj
∑j
∑=
Pjt
Pt
VXt
Ljt
Lt
------- Pjt Pt–( )2
j
∑≡
δjt2
Lit
Ljt
------- Pit
Pjt–( )2
iεj
∑≡
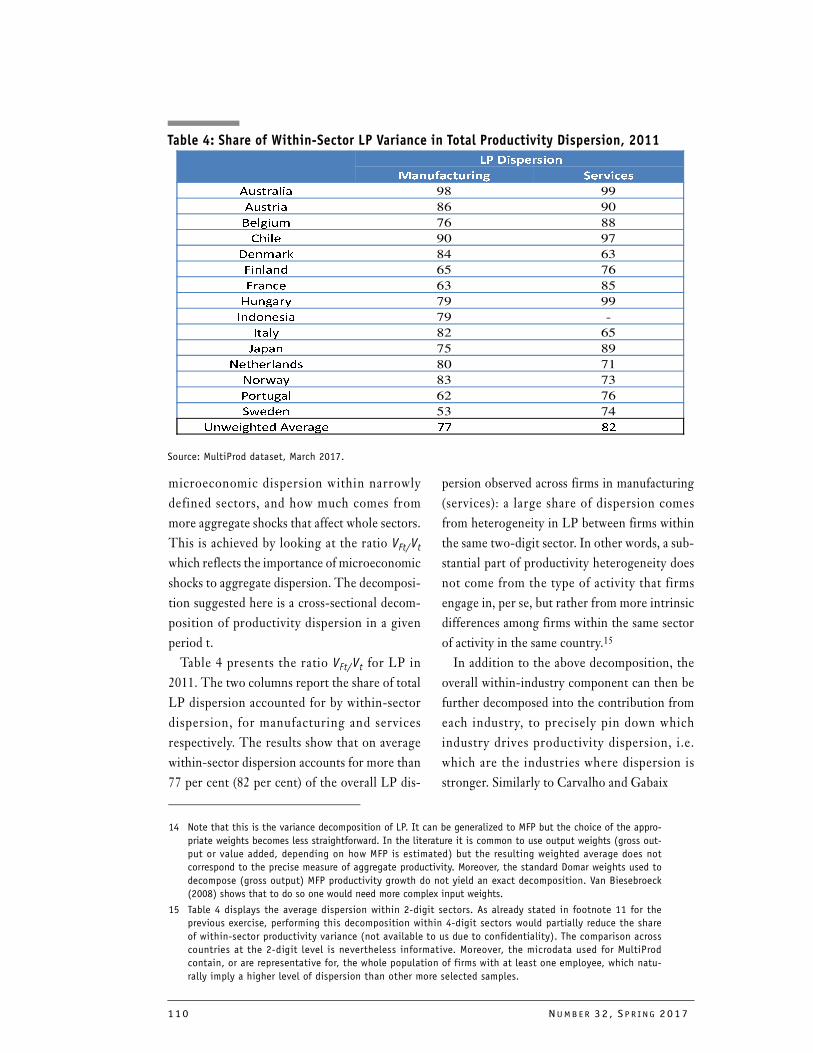
110 NUMB E R 32 , S P R I NG 2017
�����������
� ��� ������ �������
��������� 98 99
������� 86 90
����� 76 88
��� 90 97
������ 84 63
������� 65 76
����� 63 85
������� 79 99
�������� 79 -
����� 82 65
����� 75 89
��������� 80 71
������ 83 73
�������� 62 76
���� 53 74
�������� � ��� !! "#
Table 4: Share of Within-Sector LP Variance in Total Productivity Dispersion, 2011
Source: MultiProd dataset, March 2017.
microeconomic dispersion within narrowly
defined sectors, and how much comes from
more aggregate shocks that affect whole sectors.
This is achieved by looking at the ratio VFt/Vt
which reflects the importance of microeconomic
shocks to aggregate dispersion. The decomposi-
tion suggested here is a cross-sectional decom-
position of productivity dispersion in a given
period t.
Table 4 presents the ratio VFt/Vt for LP in
2011. The two columns report the share of total
LP dispersion accounted for by within-sector
dispersion, for manufacturing and services
respectively. The results show that on average
within-sector dispersion accounts for more than
77 per cent (82 per cent) of the overall LP dis-
persion observed across firms in manufacturing
(services): a large share of dispersion comes
from heterogeneity in LP between firms within
the same two-digit sector. In other words, a sub-
stantial part of productivity heterogeneity does
not come from the type of activity that firms
engage in, per se, but rather from more intrinsic
differences among firms within the same sector
of activity in the same country.15
In addition to the above decomposition, the
overall within-industry component can then be
further decomposed into the contribution from
each industry, to precisely pin down which
industry drives productivity dispersion, i.e.
which are the industries where dispersion is
stronger. Similarly to Carvalho and Gabaix
14 Note that this is the variance decomposition of LP. It can be generalized to MFP but the choice of the appro-
priate weights becomes less straightforward. In the literature it is common to use output weights (gross out-
put or value added, depending on how MFP is estimated) but the resulting weighted average does not
correspond to the precise measure of aggregate productivity. Moreover, the standard Domar weights used to
decompose (gross output) MFP productivity growth do not yield an exact decomposition. Van Biesebroeck
(2008) shows that to do so one would need more complex input weights.
15 Table 4 displays the average dispersion within 2-digit sectors. As already stated in footnote 11 for the
previous exercise, performing this decomposition within 4-digit sectors would partially reduce the share
of within-sector productivity variance (not available to us due to confidentiality). The comparison across
countries at the 2-digit level is nevertheless informative. Moreover, the microdata used for MultiProd
contain, or are representative for, the whole population of firms with at least one employee, which natu-
rally imply a higher level of dispersion than other more selected samples.
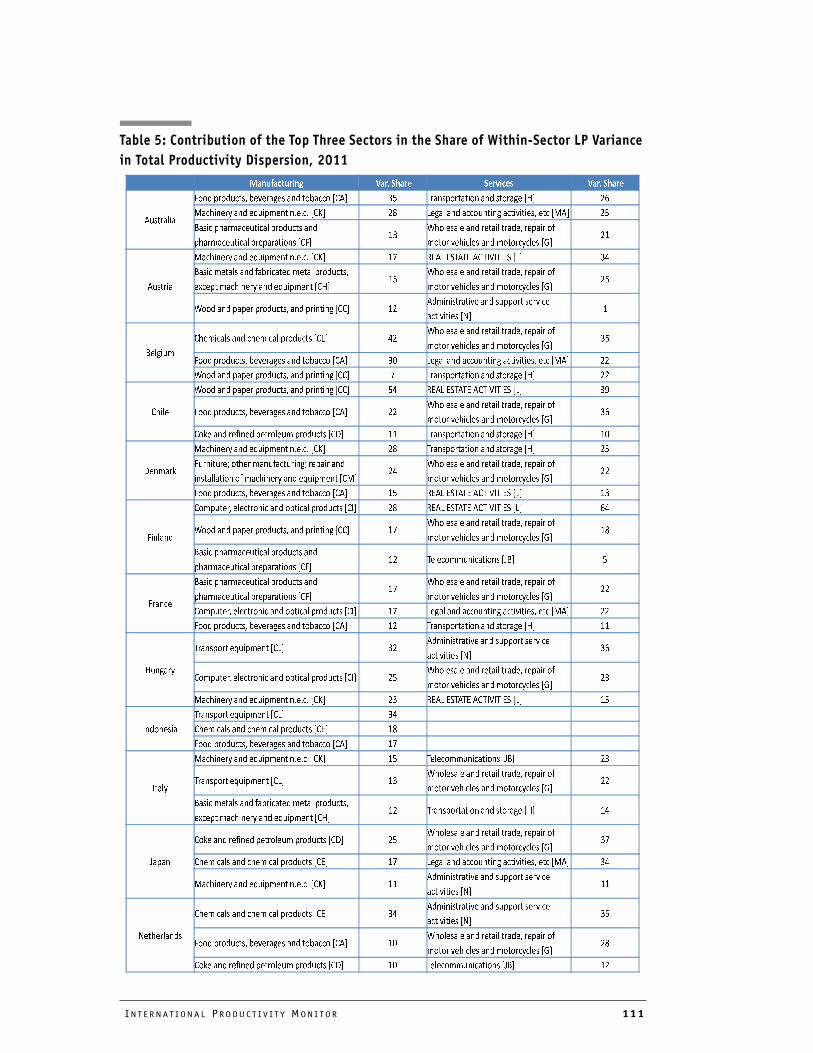
INT E R N A T I ON A L PRO DU C T I V I T Y MON I T OR 111
����������� ���� ����� ������� ���� �����
���������
�� �������������������������������� �� ����� ��������������������� ��
�������� ������!�� "�����#�#�#���$� �% &��������������������������������������� ��
'����� ���"���������� �����������
���"���������� �� �����������
(�
)���������������������������� ����*�
"����������������"��� ������+�
�(
�������
�������� ������!�� "�����#�#�#���$� (, -.�&�./���.����010�0./��&� �2
'�����"����������*����������"����� ��������
�3�� ��"������� ������!�� "��������
(�
)���������������������������� ����*�
"����������������"��� ������+�
��
)������ � ��� ������������ ������������ (�
��"������������������ �����������
������������4�
(
'�����"
���"�������������"����� ���������.� 2�
)���������������������������� ����*�
"����������������"��� ������+�
��
�� �������������������������������� �5 &��������������������������������������� ��
)������ � ��� ������������ ������������ , ����� ��������������������� ��
�����
)������ � ��� ������������ ������������ �2 -.�&�./���.����010�0./��&� �6
�� �������������������������������� ��
)���������������������������� ����*�
"����������������"��� ������+�
��
�7��������*����� ������"� ���������8� (( ����� ��������������������� (5
8��"��7
�������� ������!�� "�����#�#�#���$� �% ����� ��������������������� ��
��������9������"���*��������9��� ��������
������������*�"������� ������!�� "��������
�2
)���������������������������� ����*�
"����������������"��� ������+�
��
�� �������������������������������� (� -.�&�./���.����010�0./��&� (�
������
�" �������������������� ������ ���������0� �% -.�&�./���.����010�0./��&� �2
)������ � ��� ������������ ������������ (,
)���������������������������� ����*�
"����������������"��� ������+�
(%
'����� ���"���������� �����������
���"���������� �� �����������
(� �����""�����������:'� �
�����
'����� ���"���������� �����������
���"���������� �� �����������
(,
)���������������������������� ����*�
"����������������"��� ������+�
��
�" �������������������� ������ ���������0� (, &��������������������������������������� ��
�� �������������������������������� (� ����� ��������������������� ((
������
����� ����!�� "������&� ��
��"������������������ �����������
������������4�
��
�" �������������������� ������ ���������0� ��
)���������������������������� ����*�
"����������������"��� ������+�
��
�������� ������!�� "�����#�#�#���$� �� -.�&�./���.����010�0./��&� (�
0�������
����� ����!�� "������&� �2
���"�������������"����� ���������.� (%
�� �������������������������������� (,
0���
�������� ������!�� "�����#�#�#���$� (� �����""�����������:'� ��
����� ����!�� "������&� (�
)���������������������������� ����*�
"����������������"��� ������+�
��
'�����"����������*����������"����� ��������
�3�� ��"������� ������!�� "��������
(� ����� ��������������������� (2
:� ��
�7��������*����� ������"� ���������8� ��
)���������������������������� ����*�
"����������������"��� ������+�
�,
���"�������������"����� ���������.� (, &��������������������������������������� �2
�������� ������!�� "�����#�#�#���$� ((
��"������������������ �����������
������������4�
((
4����������
���"�������������"����� ���������.� �2
��"������������������ �����������
������������4�
��
�� �������������������������������� (5
)���������������������������� ����*�
"����������������"��� ������+�
�%
�7��������*����� ������"� ���������8� (5 �����""�����������:'� (�
Table 5: Contribution of the Top Three Sectors in the Share of Within-Sector LP Variance
in Total Productivity Dispersion, 2011
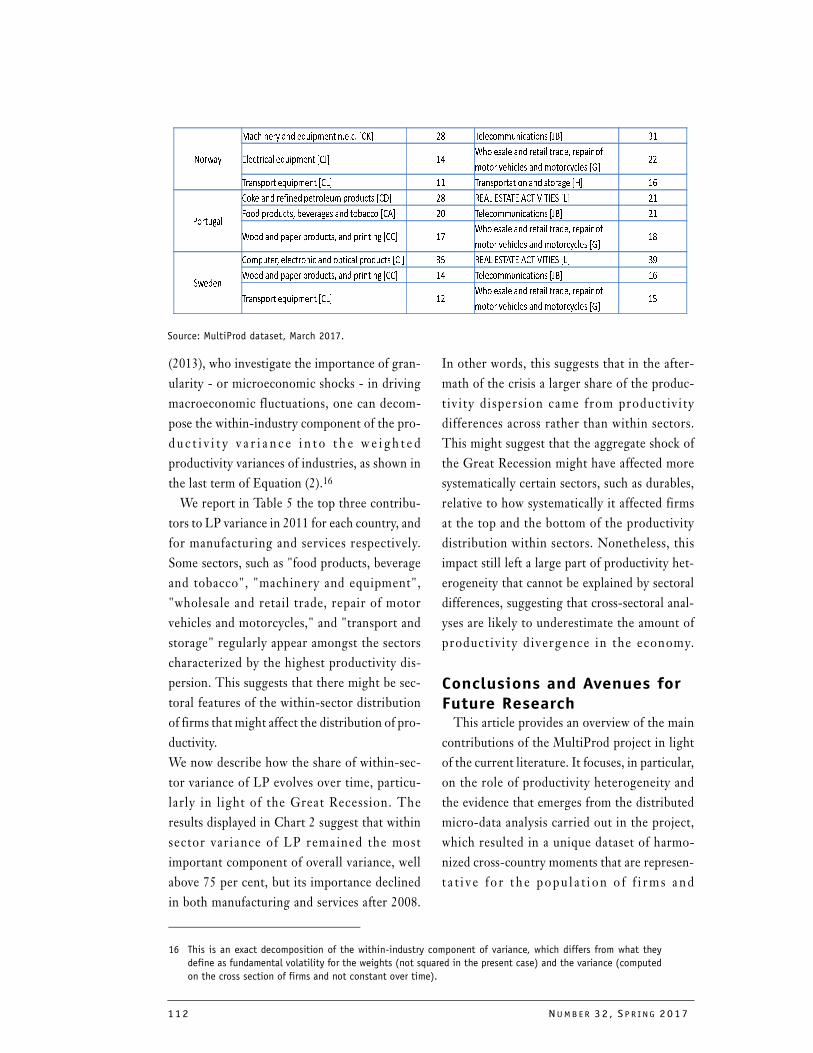
112 NUMB E R 32 , S P R I NG 2017
������
������� ��� �������� ������ ���� �� ���������������� ���� !
"�������� �������� ���� !#
$������� ��� ����� �����% ����� �&
����� '����� ��� ����������� �(�
��
��������� �������� ��)� !! ������������� ��� �����*� �+� !,
-����*��
��.� ��� ��&��� ��������� �������� ��/� �� 0"1) "2�1�" 1��343�3"2 �)� �!
5��� ��������% 6�'���*�� ��� ��6���� ��1� �7 ���������������� ���� �!
$��� ��� ����� ��������% ��� �����* ���� !8
$������� ��� ����� �����% ����� �&
����� '����� ��� ����������� �(�
!�
2�����
��������% ��������� ��� ������ �������� ��3� 9 0"1) "2�1�" 1��343�3"2 �)� :
$��� ��� ����� ��������% ��� �����* ���� !# ���������������� ���� !,
��������� �������� ��)� !�
$������� ��� ����� �����% ����� �&
����� '����� ��� ����������� �(�
!9
Source: MultiProd dataset, March 2017.
(2013), who investigate the importance of gran-
ularity - or microeconomic shocks - in driving
macroeconomic fluctuations, one can decom-
pose the within-industry component of the pro-
d u c t i v i t y v a r i a n c e i n t o t h e w e i gh t e d
productivity variances of industries, as shown in
the last term of Equation (2).16
We report in Table 5 the top three contribu-
tors to LP variance in 2011 for each country, and
for manufacturing and services respectively.
Some sectors, such as "food products, beverage
and tobacco", "machinery and equipment",
"wholesale and retail trade, repair of motor
vehicles and motorcycles," and "transport and
storage" regularly appear amongst the sectors
characterized by the highest productivity dis-
persion. This suggests that there might be sec-
toral features of the within-sector distribution
of firms that might affect the distribution of pro-
ductivity.
We now describe how the share of within-sec-
tor variance of LP evolves over time, particu-
larly in light of the Great Recession. The
results displayed in Chart 2 suggest that within
sector var iance of LP remained the most
important component of overall variance, well
above 75 per cent, but its importance declined
in both manufacturing and services after 2008.
In other words, this suggests that in the after-
math of the crisis a larger share of the produc-
t iv ity dispersion came from product iv i ty
differences across rather than within sectors.
This might suggest that the aggregate shock of
the Great Recession might have affected more
systematically certain sectors, such as durables,
relative to how systematically it affected firms
at the top and the bottom of the productivity
distribution within sectors. Nonetheless, this
impact still left a large part of productivity het-
erogeneity that cannot be explained by sectoral
differences, suggesting that cross-sectoral anal-
yses are likely to underestimate the amount of
product iv ity divergence in the economy.
Conclusions and Avenues for
Future ResearchThis article provides an overview of the main
contributions of the MultiProd project in light
of the current literature. It focuses, in particular,
on the role of productivity heterogeneity and
the evidence that emerges from the distributed
micro-data analysis carried out in the project,
which resulted in a unique dataset of harmo-
nized cross-country moments that are represen-
t a t i v e f o r t h e popu l a t i on o f f i rms and
16 This is an exact decomposition of the within-industry component of variance, which differs from what they
define as fundamental volatility for the weights (not squared in the present case) and the variance (computed
on the cross section of firms and not constant over time).
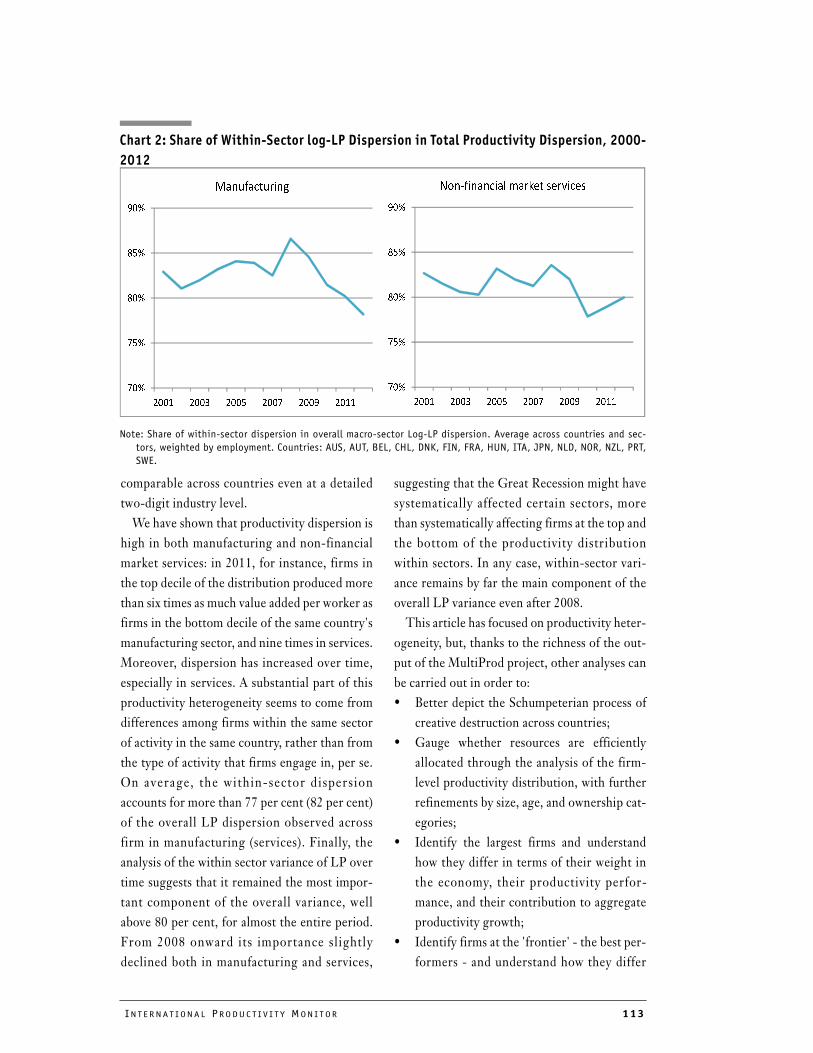
INT E R N A T I ON A L PRO DU C T I V I T Y MON I T OR 113
comparable across countries even at a detailed
two-digit industry level.
We have shown that productivity dispersion is
high in both manufacturing and non-financial
market services: in 2011, for instance, firms in
the top decile of the distribution produced more
than six times as much value added per worker as
firms in the bottom decile of the same country's
manufacturing sector, and nine times in services.
Moreover, dispersion has increased over time,
especially in services. A substantial part of this
productivity heterogeneity seems to come from
differences among firms within the same sector
of activity in the same country, rather than from
the type of activity that firms engage in, per se.
On average, the within-sector dispersion
accounts for more than 77 per cent (82 per cent)
of the overall LP dispersion observed across
firm in manufacturing (services). Finally, the
analysis of the within sector variance of LP over
time suggests that it remained the most impor-
tant component of the overall variance, well
above 80 per cent, for almost the entire period.
From 2008 onward its importance slightly
declined both in manufacturing and services,
suggesting that the Great Recession might have
systematically affected certain sectors, more
than systematically affecting firms at the top and
the bottom of the productivity distribution
within sectors. In any case, within-sector vari-
ance remains by far the main component of the
overall LP variance even after 2008.
This article has focused on productivity heter-
ogeneity, but, thanks to the richness of the out-
put of the MultiProd project, other analyses can
be carried out in order to:
• Better depict the Schumpeterian process of
creative destruction across countries;
• Gauge whether resources are efficiently
allocated through the analysis of the firm-
level productivity distribution, with further
refinements by size, age, and ownership cat-
egories;
• Identify the largest firms and understand
how they differ in terms of their weight in
the economy, their productivity perfor-
mance, and their contribution to aggregate
productivity growth;
• Identify firms at the 'frontier' - the best per-
formers - and understand how they differ
Chart 2: Share of Within-Sector log-LP Dispersion in Total Productivity Dispersion, 2000-
2012
Note: Share of within-sector dispersion in overall macro-sector Log-LP dispersion. Average across countries and sec-
tors, weighted by employment. Countries: AUS, AUT, BEL, CHL, DNK, FIN, FRA, HUN, ITA, JPN, NLD, NOR, NZL, PRT,
SWE.
���
���
���
���
���
���� ��� ���� ���� ���� ����
�����������
���
���
���
���
���
���� ��� ���� ���� ���� ����
��� ����������������������
114 NUMB E R 32 , S P R I NG 2017
across countries, what drives their perfor-
mance, and how much they contribute to
aggregate productivity growth;
• Investigate the cross-country differences in
firm-level productivity performance and
allocative efficiency before, during and after
the financial crisis;
• Investigate the relationship between pro-
ductivity and wage dispersion, and gauge to
what extent heterogeneity in productivity
has contributed to wage inequality; and
• Examine the effectiveness of various policy
frameworks aimed at shaping firm produc-
tivity and enhancing resource allocation to
more productive firms.
These are just some of the possible interesting
avenues that we plan to address in subsequent
work. Last but not least we aim at linking differ-
ences in these important features of productivity
dynamics and dis tr ibut ions to s tructural
changes, such as digitalization and globaliza-
tion, and country framework conditions and
policies.
ReferencesAckerberg, Daniel, Kevin Caves, and Garth Frazer
(2006) "Structural Identification of Production Functions," http://mpra.ub.uni-muenchen.de/38349/.
Arnold, Jens, Giuseppe Nicoletti, and Stefano Scar-petta (2008) "Regulation, Allocative Efficiency and Productivity in OECD Countries: Industry and Firm-Level Evidence," OECD Economics Department Working Papers, No. 616.
Bartelsman, Eric, John Haltiwanger, and Stefano Scarpetta (2009) "Measuring and Analyzing Cross-Country Differences in Firm Dynamics," in Producer Dynamics: New Evidence from Micro Data, pp. 15-76. (Chicago: University of Chi-cago Press).
Bartelsman, Eric, Stefano Scarpetta, and Fabiano Schivardi (2005) "Comparative Analysis of Firm Demographics and Survival: Evidence from Micro-Level Sources in OECD Countries," OECD Economics Department Working Papers, No. 348.
Berlingieri, Giuseppe, Patrick Blanchenay, and Chi-ara Criscuolo (2017) “The Great Divergence(s),”
OECD Science, Technology and Industry Policy Papers, No. 39.
Berlingieri, Giuseppe, Patrick Blanchenay, Sara Cal-ligaris and Chiara Criscuolo (2017) “The Multi-Prod project: A Comprehensive Overview,” OECD Science, Technology and Industry Work-ing Papers, No. 2017/04.
Bloom, Nicholas, Benn Eifert, Aprajit Mahajan, David McKenzie, and John Roberts (2013) "Does Management Matter? Evidence from India," Quarterly Journal of Economics, Vol. 128, No. 1, pp. 1-51.
Breschi, Stefano, Franco Malerba, and Luigi Ors-enigo (2000) "Technological Regimes and Schumpeterian Patterns of Innovation," Economic Journal, Vol. 110, No. 463, pp. 388-410.
Card, David, Francesco Devicienti, and Agata Maida (2014) "Rent-Sharing, Holdup, and Wages: Evi-dence from Matched Panel Data," Review of Eco-nomic Studies, Vol. 81, No.1, pp. 84-111.
Card, David, Jörg Heining, and Patrick Kline (2013) "Workplace Heterogeneity and the Rise of West German Wage Inequality," Quarterly Journal of Economics, Vol. 128, No. 3, pp. 967-1015.
Carvalho, Vasco M., and Xavier Gabaix (2013) "The Great Diversification and Its Undoing," Ameri-can Economic Review, Vol. 103, No. 5, pp. 1697-1727.
Caselli, Francesco (1999) "Technological Revolu-tions," American Economic Review, Vol. 89, No. 1, pp. 78-102.
Comin, Diego, and Bart Hobijn (2006) An Explora-tion of Technology Diffusion. National Bureau of Economic Research Working Paper No. 12314.
Dunne, Timothy, Lucia Foster, John Haltiwanger, and Kenneth R. Troske (2004) "Wage and Pro-ductivity Dispersion in United States Manufac-turing: The Role of Computer Investment," Journal of Labor Economics, Vol. 22, Nol. 2, pp. 397-429.
Foster, Lucia, Cheryl Grim, and John Haltiwanger (2014) “Reallocation in the Great Recession: Cleansing or Not?” National Bureau of Eco-nomic Research. Working Paper No. 20427.
Foster, Lucia, John C. Haltiwanger, and Cornell John Krizan (2001) "Aggregate Productivity Growth. Lessons from Microeconomic Evi-dence," in New Developments in Productivity Anal-ysis, pp. 303-72. (Chicago: University of Chicago Press).
Foster, Lucia, John Haltiwanger, and C. J. Krizan (2002) “The Link Between Aggregate and Micro Productivity Growth: Evidence from Retail Trade,” National Bureau of Economic Research, Working Paper No. 9120.
INT E R N A T I ON A L PRO DU C T I V I T Y MON I T OR 115
Gabaix, Xavier (2011), "The Granular Origins of Aggregate Fluctuations", Econometrica, Vol. 79, No. 3, pp. 733-772.
Hall, Robert E., and Charles I. Jones (1999) "Why Do Some Countries Produce So Much More Output Per Worker than Others?" Quarterly Journal of Economics, Vol. 114, No. 1, pp. 83-116.
Hopenhayn, Hugo A (2014) "Firms, Misallocation, and Aggregate Productivity: A Review," Annual Review of Economics, Vol. 6, No. 1, pp. 735-770.
Hsieh, Chang-Tai, and Peter J. Klenow (2009) "Mis-allocation and Manufacturing TFP in China and India," Quarterly Journal of Economics, Vol. 124, No. 4, pp. 1403-48.
Hsieh, Chang-Tai, and Peter J. Klenow (2010) "Development Accounting," American Economic Journal: Macroeconomics Vol. 2 No. 1, pp. 207-23.
Klenow, Peter and Andres Rodriguez-Clare (1997) "The Neoclassical Revival in Growth Econom-ics: Has It Gone Too Far?" in NBER Macroeco-nomics Annual, Vol. 12, pp. 73-114. (Cambridge: MIT Press).
Malerba, Franco and Luigi Orsenigo (1995) "Schumpeterian Patterns of Innovation," Cam-bridge Journal of Economics, Vol. 19, No. 1, pp. 47-65.
Malerba, Franco and Luigi Orsenigo (1996) "Schumpeterian Patterns of Innovation are Technology-Specific," Research Policy, Vol. 25, No. 3, pp. 451-478.
Melitz, Marc J. and Sašo Polanec (2015) "Dynamic Olley-Pakes Productivity Decomposition with Entry and Exit," RAND Journal of Economics, Vol. 46, No. 2, pp. 362-375.
OECD (2003) The Sources of Economic Growth in OECD Countries, (Paris: OECD Publishing).
Olley, G. Steven and Ariel Pakes (1996) "The Dynamics of Productivity in the Telecommuni-cations Equipment Industry," Econometrica, Vol. 64, No. 6, pp. 1263-97.
Parente, Stephen L. and Edward C. Prescott (1994) "Barriers to Technology Adoption and Develop-ment," Journal of Political Economy, Vol. 102, No. 2, pp. 298-321.
Petrin, Amil and Jagadeesh Sivadasan (2013) "Esti-mating Lost Output From Allocative Ineffi-ciency, with an Application to Chile and Firing Costs," Review of Economics and Statistics, Vol. 95, No. 1, pp. 286-301.
Prescott, Edward C (1998) "Lawrence R. Klein Lec-ture 1997: Needed: A Theory of Total Factor Productivity," International Economic Review, Vol. 11, No. 4, pp. 525-51.
Restuccia, Diego, and Richard Rogerson (2013) "Misallocation and Productivity," Review of Eco-nomic Dynamics, Vol. 16, No. 1, pp. 1-10.
Schmitz Jr, James A (2005) "What Determines Pro-ductivity? Lessons from the Dramatic Recovery of the US and Canadian Iron Ore Industries Fol-lowing Their Early 1980s Crisis," Journal of Political Economy, Vol. 113, No. 3, pp. 582-625.
Schwellnus, Cyrille and Jens Arnold (2008) "Do Corporate Taxes Reduce Productivity and Investment at the Firm Level?: Cross-Country Evidence from the Amadeus Dataset," OECD Economics Department Working Papers, No. 641, (Paris: OECD Publishing)
Song, Jae, David J. Price, Fatih Guvenen, Nicholas Bloom, and Till von Wachter (2015) “Firming Up Inequality,” Working Papers 21199, National Bureau of Economic Research.
Syverson, Chad (2004) "Product Substitutability and Productivity Dispersion," Review of Economics and Statistics, Vol. 86, No. 2, pp. 534-50.
Van Biesebroeck, Johannes (2008) "Aggregating and Decomposing Productivity," Review of Business and Economics, Vol. 53, No. 2, pp. 122-46.
van Dijk, Machiel (2000) "Technological regimes and industrial dynamics: the evidence from Dutch manufacturing," Industrial and Corporate Change, Vol. 9, No. 2, pp. 173-194.
Wooldridge, Jeffrey M (2009) "On Estimating Firm-Level Production Functions Using Proxy Vari-ables to Control for Unobservables," Economics Letters, Vol. 104, No. 3, pp. 112-14.
INT E R N A T I ON A L PRO DU C T I V I T Y MON I T OR 116
Productivity and Reallocation: Evidence from the Universe of Italian Firms
Andrea Linarello and Andrea Petrella
Bank of Italy, Structural Economic Analysis Directorate1
ABSTRACT
This article investigates the contribution of allocative efficiency to aggregate labour
productivity growth in Italy between 2005 and 2013. Exploiting a unique dataset that covers
the universe of firms, we find that allocative efficiency increased during the period of
observation. We show that the dynamics of aggregate labour productivity benefited from
the reallocation of resources among continuing firms and from the net effect of business
demography. Among industries, we find that reallocation has been stronger in industries that
are more exposed to import competition from developing countries. Moreover, we document
that the observed adjustments have not evenly affected all firms across the productivity
distribution: selection has become tougher for firms belonging to the lower tail, forcing the
exit of the least productive firms and favoring the reallocation of the workforce to the best
performing ones.
Thanks to the increasing availability of firm-
level data, a growing theoretical and empirical
literature has documented large and persistent
productivity differences across countries and
firms within narrowly defined sectors (Bartels-
man et al., 2005). This research agenda has con-
siderably improved our understanding of
aggregate productivity dynamics by highlight-
ing two distinct mechanisms of adjustment. On
the one hand, aggregate productivity is the
result of technological and managerial decisions
made by entrepreneurs (Aghion et al., 2009;
Bloom and Van Reenen, 2010); on the other
hand, it reflects the ability of an economy to
allocate resources towards its most productive
units (Hsieh and Klenow, 2009).
Several studies have documented that the
share of aggregate productivity explained by
the latter, i.e. allocative efficiency, is substan-
tial in an accounting sense. In the United States
it accounts for 50 per cent of aggregate labour
productivity;2 in Europe its importance is
smaller and ranges between 15 and 38 per cent
(Bartelsman et al., 2009). Moreover, it explains
a substantial part of productivity differentials
among countries (Andrews and Cingano,
2014). Intuitively, the larger the share of
employment that goes to more productive
firms, the higher the aggregate productivity.
1 The authors are advisors in the Structural Economic Analysis Directorate at the Bank of Italy. They are grateful
to Matteo Bugamelli, Francesca Lotti, Paolo Sestito and Corrado Abbate for helpful comments, as well as
Maria Gabriela Ladu for excellent research assistance. This article also benefited from the comments of two
anonymous referees and the editor. The views expressed herein are those of the authors and do not
involve the responsibil ity of the Bank of Italy. Emails: andrea.l inarel [email protected];
2 Allocative efficiency is defined as zero when resources are randomly allocated across firms. In this situa-
tion aggregate labour productivity would be 50 per cent lower than the actual level.
117 NUMB E R 32 , S P R I NG 2017
One interesting conclusion of this line of
research is that misallocation of resources
across firms due to frictions in factor and out-
put markets may lower aggregate productivity.
Despite the increasing interest from both
academic researchers and policy makers on
misallocation, the most instructive measure of
firm-level heterogeneity to detect possible dis-
tortions in the allocation of resources still is
debated. Following the pioneering contribution
of Hsieh and Klenow (2009), several studies
used the dispersion in revenue productivity to
proxy for misallocation. Although Hsieh and
Klenow (2009) acknowledge that dispersion of
marginal revenue products alone cannot be
interpreted as misallocation because the results
might be influenced by measurement error and
model misspecification, the importance of
these two factors in explaining productivity
gaps is still an open question. Recently, how-
ever, Bartelsman et al. (2013) argued, both the-
oretically and empirically, that within-industry
covariance between size and productivity, also
known as OP covariance (Olley and Pakes,
1996), is a robust measure to assess misalloca-
tion.
In this article we will focus on labour produc-
tivity dynamics in Italy, which has been disap-
pointing with respect to its main Euro area
partners; in particular, our aim is to investigate
the contribution of allocative efficiency to its
aggregate dynamic. We take advantage of a
unique dataset covering the universe of Italian
firms operating in the private business non-
agriculture and non-financial sector over the
period 2005–2013. Data on the universe of
firms, while largely available for other countries
(among others, United States, France and Bel-
gium), is new for Italy and it is the outcome of a
collaboration between the Bank of Italy (BoI)
and the Italian National Statistical Agency
(ISTAT). The dataset combines information
from several statistical, administrative and fiscal
sources. It contains information on firm loca-
tion, legal form, date of incorporation, industry
classification, number of persons employed,
turnover and value added.
In order to assess the importance of allocative
efficiency in Italy, we follow Olley and Pakes
(OP) (1996) and decompose aggregate labour
productivity into the unweighted firm-level
average productivity and the OP covariance
term between labour productivity and size. We
find that the contribution of the OP covariance
to aggregate labour productivity increased by
almost 7 percentage points between 2005 and
2013. We then apply the dynamic decomposi-
tion proposed by Melitz and Polanec (2015)
to aggregate labour productivity growth. This
allows us to distinguish between two mecha-
nisms affecting allocative efficiency: first, the
reallocation of resources among existing firms;
second, the selection, i.e. entry and exit, of
firms in the market.
Our results show that, among incumbents,
between 2005 and 2013 the reallocation com-
ponent contributed positively to aggregate pro-
ductivity growth. Its contribution was larger (in
absolute value), with the exception of some
years during the crisis, than the decline
observed throughout the entire period in aver-
age productivity. The net contribution of firm
demography is always positive in our data: the
exit of the least productive firms more than
compensates the entry of newborn firms, whose
productivity level is on average lower than that
of incumbent firms.
We then look at the correlation between our
measures of reallocation and selection and
some industry structural characteristics. Not
surprisingly, when we focus on the effect of the
business cycle, we find that average productivity
and reallocation among existing firms increased
more in the industries experiencing a boom.
This is consistent with the evidence that firms
invest in productivity-enhancing technology
INT E R N A T I ON A L PRO DU C T I V I T Y MON I T OR 118
and machinery when they exper ience an
increase in market size (Syverson, 2011). We
also document that the contribution of entry
and exit to aggregate productivity growth is
countercyclical, i.e. it is lower in industries
that experience a boom. This result is consis-
tent with the cleansing hypothesis, i.e. that
recessions are periods of tougher selection for
business initiatives (Caballero and Hammour,
1994; Foster et al., 2014). Moreover, we show
that the reallocation effect is stronger in sectors
that were more exposed to competition from
developing countries; a fiercer competitive
environment — especially in low value-added
sectors — might have favored an improvement
of allocative efficiency through the exit of the
least productive firms and the reallocation of
resources towards the most productive ones. A
similar mechanism has been highlighted for
United States manufacturing firms by Bernard et
al. (2006), as a consequence of the exposure to
low-wage country imports.
We conclude our analysis by providing
some suggestive evidence of the underlying
forces behind the observed increase in alloca-
tive efficiency. We explore the role of firm
entry, exit and employment growth along the
productivity distribution. Between 2005 and
2013, we find that the entry rate declined and
the exit rate increased for firms in the low tail
of the productivity distribution. Moreover, aver-
age employment growth declined for all percen-
t i les of the product iv i ty d is tr ibut ion: in
particular employment growth became negative
for the leas t productive f irms, whi le it
remained positive for the most productive
ones. These results suggest that the Italian
economy undertook some structural adjust-
ments, eventually reinforced during the crisis,
that led to the exit of low productivity firms and
that favored the reallocation of workforce
towards the best performing ones.
Taken as a whole, our results suggest that
behind the poor productivity performance of the
Italian economy, which is driven by the decline
in average productivity within firms, the reallo-
cation of inputs and business demography
show positive dynamics. There are, however,
some drawbacks in the measure of productivity
and allocative efficiency that we use that
deserve some discussion. First, our measure
of productivity (value added per worker) might
not be informative about the underling
dynamics of technical efficiency, as it may
reflect changes in prices and markups. Second,
the correlation between changes in the OP
covariance and dispersion-based measures of
misallocation (in the spirit of Hsieh and Kle-
now (2009)) can be either positive or negative
from a theoretical point of view, suggesting that
some caution is needed when interpreting the
evidence arising from either of these two mea-
sures. Finally, although the OP covariance has
attractive features, it can be negatively corre-
lated with model-based measures, where the
dynamics of aggregate productivity are typically
captured by changes in output that are not
explained by changes in inputs expenditure (in
the spirit of Solow (1957).3
Recently, several studies have explored the
misallocation hypothesis as one of the possible
causes behind the productivity slowdown expe-
rienced by many advanced economies (Cette et
al., 2016). Gopinath et al. (2015) show that the
decline in real interest rates, observed in South-
ern Europe, was associated with capital inflows
increasingly misallocated towards firms with
high net worth, though not necessarily being
the most productive. García-Santana et al.
(2016) document, for the case of Spain, that the
increase in misallocation has been more severe
3 See Petrin and Levinsohn (2012) for a detailed discussion.
119 NUMB E R 32 , S P R I NG 2017
in those industries in which the influence of the
public sector is larger (e.g. through licensing or
regulations).
Several contributions have also analyzed the
role of allocative efficiency in Italy. Gam-
beroni et al. (2016) — using data on incorpo-
rated firms with more than 20 employees —
show an increase in allocative efficiency after
the global financial crisis in Italy, as well as in
other European countries. Calligaris et al.
(2016), using data on incorporated firms, doc-
ument for the Italian manufacturing sector an
increase in allocative efficiency starting in 2008.
The evidence provided in this article is
broadly in line with the analysis conducted so
far on the Italian case, highlighting a significant
role of allocative efficiency in shaping produc-
tivity dynamics. However, while existing studies
struggle to find a positive reallocation of labour
before 2008, our results show that the contri-
bution of the OP covariance to aggregate pro-
ductivity growth before the crisis was positive,
although limited. Part of this discrepancy can
be attributed, as discussed above, to the differ-
ent methodology used to measure misalloca-
tion. Another important difference is due to
data sources used: as a matter of fact, while the
existing evidence on allocative efficiency in
Italy is limited to the subsample of incorpo-
rated firms, one of our main contributions to the
current debate is that of using data for a much
broader set of firms. Moreover, we propose a
simple, though effective, method to exploit the
detailed sectoral disaggregation of our dataset,
in order to net out our results from sectoral
composition effects and cyclical conditions at
the sector level.
DataOur firm-level dataset covers all active firms
for 2005 to 2013, i.e. firms whose production
processes were active for at least 6 months in a
given business year. The construction of the
dataset is the result of collaboration between
the Bank of Italy (BoI) and the Italian
National Statistical Agency (ISTAT). The
dataset combines information from the business
registry (Archivio Statistico delle Imprese Attive
- ASIA) with other statistical, administrative and
fiscal sources. It contains information on firm
location, legal status, incorporation date, indus-
try classification (NACE rev. 2), number of
persons employed, turnover, and value added.4
The construction heavily relies on work doneat ISTAT over the past few years for the con-struction of the FRAME-SBS dataset, an inte-grated firm-level census dataset that covers allactive firms. While the census FRAME-SBSrepresents the source of information in ourdataset starting from 2012, the joint effort ofBoI and ISTAT contributed to filling the gapsbackwards and building a longer time series ofdata, suitable for studying the evolution of theItalian economy starting from the mid- 2000s.
Our aim is to exploit the microeconomic het-erogeneity behind aggregate trends in labourproductivity. With this aim at hand, weexclude from our dataset several sectors. First,we exclude agriculture, mining and quarries(NACE divisions 1-9), and regulated sectorssuch as gas, energy and waste (NACE divisions35-39) for which labour productivity dynamicscould reflect changes in prices that are indepen-dent from the firms’ underlying productivity.Second, we exclude the financial sector (NACEdivisions 64-66) for which data are not avail-able. Third, we exclude the non-business servicesector (NACE divisions 84-88 and 90-99),because their overlapping with the public sectormight influence the productivity dynamics.Finally we exclude some sectors for whichaggregate labour productivity computed usingfirm-level data significantly diverges from esti-mates inferred from National Account data.5
4 See Abbate et al. (2017) for a detailed description of the dataset
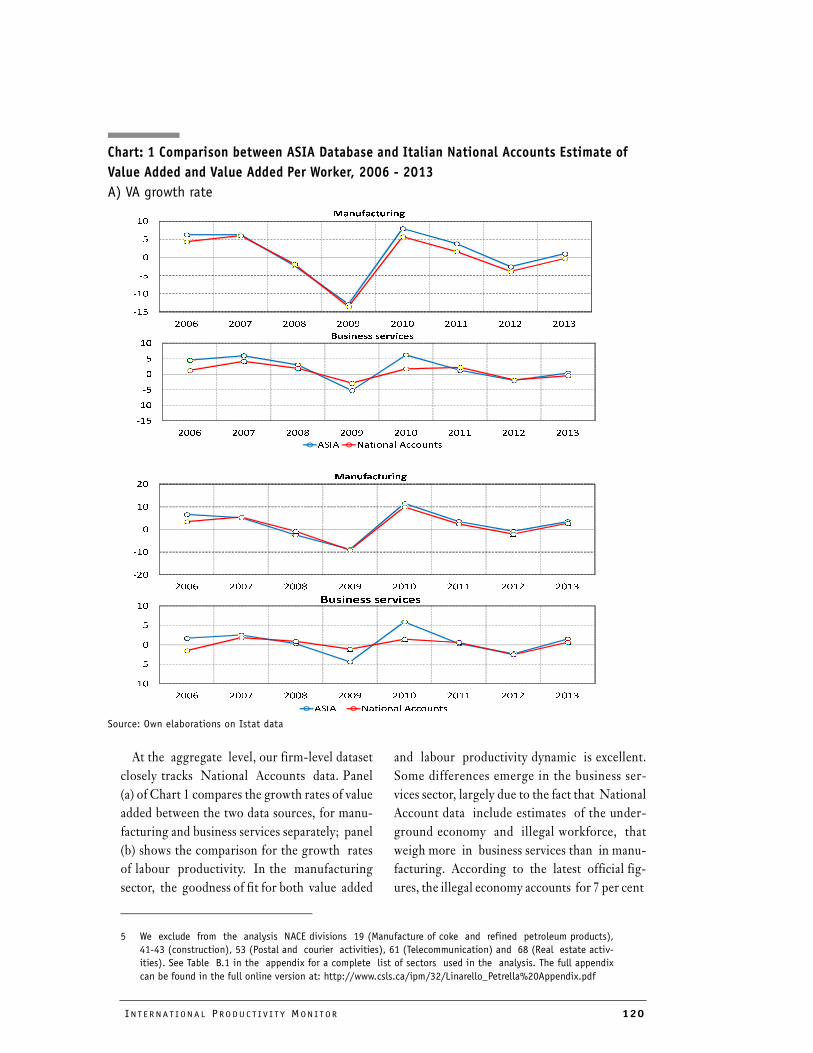
INT E R N A T I ON A L PRO DU C T I V I T Y MON I T OR 120
At the aggregate level, our firm-level datasetclosely tracks National Accounts data. Panel(a) of Chart 1 compares the growth rates of valueadded between the two data sources, for manu-facturing and business services separately; panel(b) shows the comparison for the growth ratesof labour productivity. In the manufacturingsector, the goodness of fit for both value added
and labour productivity dynamic is excellent.Some differences emerge in the business ser-vices sector, largely due to the fact that NationalAccount data include estimates of the under-ground economy and illegal workforce, thatweigh more in business services than in manu-facturing. According to the latest official fig-ures, the illegal economy accounts for 7 per cent
5 We exclude from the analysis NACE divisions 19 (Manufacture of coke and refined petroleum products),
41-43 (construction), 53 (Postal and courier activities), 61 (Telecommunication) and 68 (Real estate activ-
ities). See Table B.1 in the appendix for a complete list of sectors used in the analysis. The full appendix
can be found in the full online version at: http://www.csls.ca/ipm/32/Linarello_Petrella%20Appendix.pdf
Chart: 1 Comparison between ASIA Database and Italian National Accounts Estimate of
Value Added and Value Added Per Worker, 2006 - 2013
A) VA growth rate
Source: Own elaborations on Istat data
���
���
�
��
��
���� ���� ���� ���� ���� ���� ���� ���
�����������
�� ���������������
���
��
�
�
��
���� ���� ���� ���� ���� ���� ���� ���
���������������
���
���
��
�
�
��
���� ���� ���� ��� ���� ���� ���� ���
�����������
�� � �����������������
���
���
��
�
�
��
���� ���� ���� ��� ���� ���� ���� ���
���� ���� ��� �
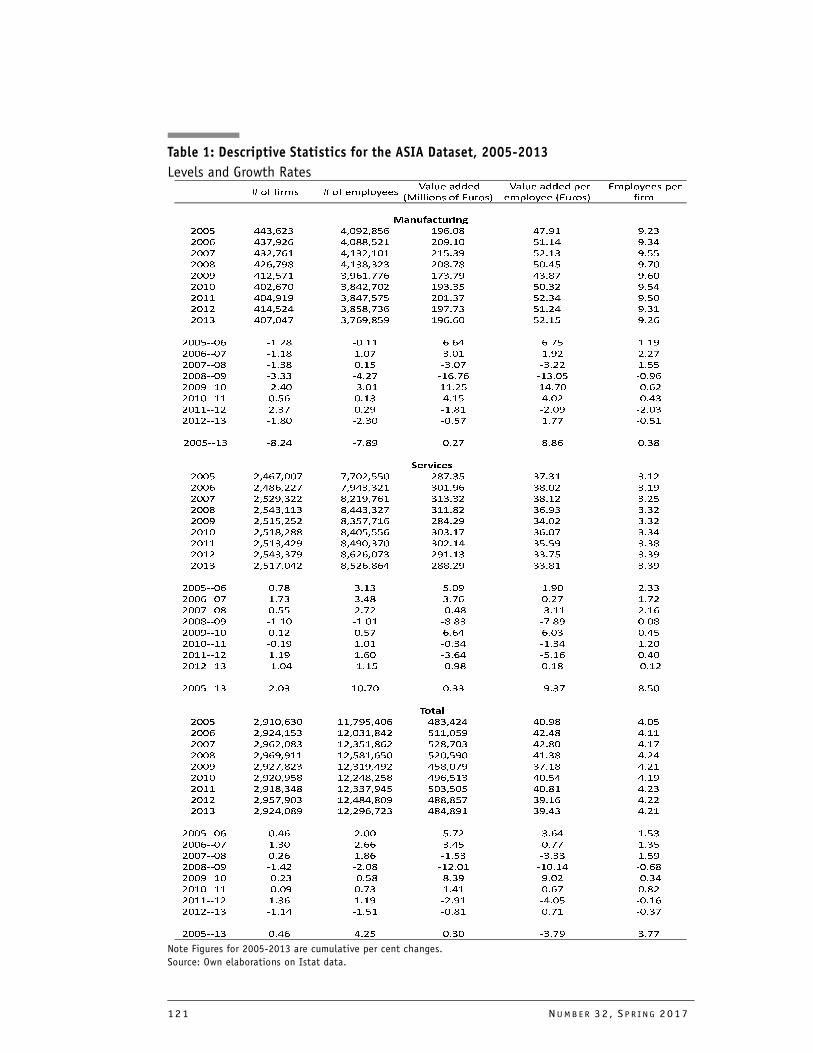
121 NUMB E R 32 , S P R I NG 2017
����������� �����������
���������
��������������������
�����������
������������
���������
�����
������������
���� �������� ���������� ��� ��� �! ��� � ���
���� ��!����� ���������� ��� ��� �� ��� � ���
���! ����!��� ���������� ��� ��� �� ��� � ���
���� ����!��� ���������� ��� !�� �� ��� � !��
���� �����!�� ������!!�� �!� !�� �� �!� � ���
���� �����!�� ������!��� ��� ��� �� ��� � ���
���� �������� ����!��!�� ��� �!� �� ��� � ���
���� �������� ������!��� ��! !�� �� ��� � ���
���� ��!���!� ��!������� ��� ��� �� ��� � ���
����""��� "� ��� "� ��� � ��� � !�� � ���
����""�!� "� ��� � �!� � ��� � ��� � �!�
���!""��� "� ��� � ��� "� �!� "� ��� � ���
����""��� "� ��� "� �!� "�� !�� "�� ��� "� ���
����""��� "� ��� "� ��� �� ��� �� !�� "� ���
����""��� � ��� � ��� � ��� � ��� "� ���
����""��� � �!� � ��� "� ��� "� ��� "� ���
����""��� "� ��� "� ��� "� �!� � !!� "� ���
����""��� "� ��� "! ��� � �!� � ��� � ���
� ��� ��
���� ����!���!� !�!������� ��! ��� �! ��� � ���
���� ��������!� !��������� ��� ��� �� ��� � ���
���! ���������� ������!��� ��� ��� �� ��� � ���
���� ���������� ��������!� ��� ��� �� ��� � ���
���� ���������� ����!�!��� ��� ��� �� ��� � ���
���� ���������� ���������� ��� �!� �� �!� � ���
���� ���������� �������!�� ��� ��� �� ��� � ���
���� �������!�� �������!�� ��� ��� �� !�� � ���
���� ����!����� ���������� ��� ��� �� ��� � ���
����""��� � !�� � ��� � ��� � ��� � ���
����""�!� � !�� � ��� � !�� � �!� � !��
���!""��� � ��� � !�� "� ��� "� ��� � ���
����""��� "� ��� "� ��� "� ��� "! ��� � ���
����""��� � ��� � �!� � ��� � ��� � ���
����""��� "� ��� � ��� "� ��� "� ��� � ���
����""��� � ��� � ��� "� ��� "� ��� � ���
����""��� "� ��� "� ��� "� ��� � ��� "� ���
����""��� � ��� �� !�� � ��� "� �!� � ���
������
���� ���������� ���!������� �������� �� ��� � ���
���� ���������� ����������� �������� �� ��� � ���
���! ���������� ����������� ����!��� �� ��� � �!�
���� ���������� ����������� �������� �� ��� � ���
���� ����!����� ����������� �����!�� �! ��� � ���
���� ���������� ����������� �������� �� ��� � ���
���� ���������� �����!����� �������� �� ��� � ���
���� ����!����� ����������� ������!� �� ��� � ���
���� ���������� �������!��� �������� �� ��� � ���
����""��� � ��� � ��� � !�� � ��� � ���
����""�!� � ��� � ��� � ��� � !!� � ���
���!""��� � ��� � ��� "� ��� "� ��� � ���
����""��� "� ��� "� ��� "�� ��� "�� ��� "� ���
����""��� "� ��� "� ��� � ��� � ��� "� ���
����""��� "� ��� � !�� � ��� � �!� � ���
����""��� � ��� � ��� "� ��� "� ��� "� ���
����""��� "� ��� "� ��� "� ��� � !�� "� �!�
����""��� � ��� � ��� � ��� "� !�� � !!�
Table 1: Descriptive Statistics for the ASIA Dataset, 2005-2013
Levels and Growth Rates
Note Figures for 2005-2013 are cumulative per cent changes.
Source: Own elaborations on Istat data.
INT E R N A T I ON A L PRO DU C T I V I T Y MON I T OR 122
of people employed and 6 per cent of value
added in manufacturing, against 16 per cent
and more than 20 per cent in business services.
Tables 1 and 2 report descriptive statistics
from our firm-level dataset. The number of
firms in the manufacturing sector declined
almost every year; in 2013 there were about
36,000 fewer firms than in 2005. In business
services, the number of firms does not exhibit
a clear pattern, and in 2013 there were more
firms than at the beginning of the period.
Between 2005 and 2013, average firm size —
measured by the number of persons employed
— increased in both sectors: in 2013 the aver-
age firm employed 9.3 people in the manufac-
turing sector and 3.4 in the business service
sector.
In our final dataset, aggregate labour produc-
tivity — measured as real value added per
employee — increased between 2005 and 2007,
and declined during the global financial crisis
(2007–09) and the sovereign debt crisis (2011–
13); overall, it was 3.8 per cent lower in 2013
than in 2005. The aggregate dynamics reflect
different patterns between manufacturing and
services: in the former, aggregate labour pro-
ductivity increased 8.9 per cent between 2005
and 2013, while in the latter it declined by 9.4
per cent. Before the crisis, the increase of labour
productivity in the manufacturing sector was
due to a rise of value added greater than the one
of employment a f te r 2008; ins tead , the
ad justment of the labour force has been
stronger. In business services, the negative
growth of aggregate labour productivity reflects
both a constant increase in the number of
people employed, and a decline in value added
since 2007.
Productivity DecompositionsAggregate labour productivity (�) in year t
corresponds to the weighted average of the
individual firm’s productivity (ρi ), with the
weights (�i ) being the firms’ share of total
employees. More formally:
(1)
Aggregate productivity can be further decom-
posed as the sum of the unweighted average
firm productivity and the covariance
between firm productivity and the share of
employees:
(2)
The covariance term is often referred to as
static “Olley and Pakes (OP) covariance”. In
Olley and Pakes (1996), this decomposition —
applied to the US telecommunications indus-
try — allowed the authors to distinguish
between the efficiency gains deriving from a
reallocation of resources towards the most
productive firms (measured by the increase in
the OP covariance), and those arising from the
productivity growth of individual firms (cap-
tured by the changes in the average productivity
term). The former component has been found to
explain the largest share of the observed produc-
tivity gain.
Recent developments in the economic litera-
ture devote increasing attention to allocative
efficiency, since it reflects institutional and reg-
ulatory features that distort the functioning of
the markets. As an example, Olley and Pakes
(1996) document that, in the 1980s, the aggre-
gate productivity of the US telecommunica-
tions industry grew considerably after an
episode of market liberalization, and that this
increase was largely due to an improvement of
allocative efficiency. In another study, Bartels-
man et al. (2013) quantify the contribution of
Φt
ρit
ωit
i 1=
η
∑=
ρ( )
Φt
ρt Cov ρit
ωit
,( )+
ρt ρit
ρt
–( ) ωit
ωt–( )
η
∑+
=
=
123 NUMB E R 32 , S P R I NG 2017
allocative efficiency, by showing that US
aggregate labour productivity is roughly 50 per
cent higher with respect to a hypothetical sce-
nario where workers are randomly allocated
across firms.
In addition to studying the contribution of
allocative efficiency to aggregate productivity,
it is possible to analyze the dynamics of
aggregate productivity through a decompo-
sition that assesses — for any pair of years —
the relative contribution of three groups of
firms: the ones that survive (also called
incumbents), entrants and exiting firms.
The demographic processes play a role in
determining the productivity dynamics,
since entrants and exiting firms are different
(also with respect to the incumbents) in terms
of productivity. For incumbents, it is possible
to further distinguish the contribution of
two more components: (i) the variation in
the efficiency of individual firms (so-called
within margin); and (ii) the reallocation of
resources to firms characterized by different
productivity levels (so-called between mar-
gin).
In order to rewrite equation (2) in dynamic
terms, firms are divided in three groups g, as
mentioned above:6 entrants (E) that were not
active at time t-1 and enter the market at time t;
exiting (X) firms that were active at time t-1 and
exit from the market at time t; and incumbents
(S) that are active on the market in both peri-
ods. With these definitions in hand, equation
(2) can be rewritten as:
(3)
where the weights wgt correspond to the share
of employees in group g, Fgt represents the
aggregate productivity of group g, and G = {E,
X, S}.
A dynamic version of equation (2) can be
derived based on the methodology — known as
dynamic OP decomposition — recently pro-
posed by Melitz and Polanec (2015). Consider-
ing two consecutive time periods, it is possible
to express the aggregate productivity of the
first period (�1 ) as the weighted average of the
productivity of the firms that will survive and
that of the firms that will exit the market; anal-
ogously, the aggregate productivity of the sec-
ond period (�2) can be expressed as the weighted
average of the productivity of the firms that have
survived and that of the firms that have entered
the market:
(4)
(5)
The difference between Ö2 and Ö1 returns
the variation in aggregate productivity:
(6)
where the first term (�S2 ���S1) represents the
productivity variation for the firms that are
active on the market in both periods (the
incumbents); the second (�E2 ���S2 ) is the con-
tribution of entrants, which is positive (nega-
tive) if their productivity is higher (lower) than
that of the incumbent firms; the third (�S1 �
�X 1) is the contribution of firms that exit the
market, which is positive (negative) if their
productivity is lower (higher) than that of the
incumbents. The term (�S2 ���S1) can be fur-
ther decomposed into the variation of the
6 In all the analyses presented below, firm demography has been purged of false entrants and false exits, in
the spirit of Geurts and Van Biesebroeck (2014). To identify false entry and exits, we use an admin-
istrative register of events that collects information on corporate operations. As a consequence, we are able
to exclude from our data operations such as mergers and spinoffs.
Φt
ρit
ωit
i 1=
η
∑ Φgt
ωgt
gεG
∑= =
Φ1
ΦS1
ωS1
ΦX1
ωX1
+=
Φ2
ΦS2
ωS2
ΦE2
ωE2
+=
Φ2
Φ1
– ΦS2
ΦS1
–( )
ωE2
ΦE2
ΦS2
–( )
ωX1
ΦS1
ΦX1
–( )
+
+
=
INT E R N A T I ON A L PRO DU C T I V I T Y MON I T OR 124
incumbents’ average productivity (∆ ) and
the one of the covariance between incum-
bents’ productivity and the share of employ-
ees (∆CovS), capturing the intensity of the
reallocation process. To sum up, the variation
of aggregate productivity can be expressed as
the sum of the following four components (the
first being average productivity, followed by
reallocation, entry and exit respectively):
(7)
where the sum of average productivity and
reallocation add up to the contribution of
the incumbents, and the sum of entry and
exit add up to the contribution of net firm
demography.7
ResultsBaseline Results
We first have applied the static decomposi-
tion in equation (2) to Italian aggregate labour
productivity for the total economy, and for
manufacturing and services separately. In the
2005-13 period, the weight of allocative effi-
ciency has risen by nearly 7
percentage points from 35.3 per cent to 42.2 per
cent at the end of the period, growing more
strongly and steadily in manufacturing than in
services. In Appendix Table B1 we report the
static OP contribution for each 2-digit sector
between 2005 and 2013.
The increasing importance of the static OP
covariance for aggregate productivity is sug-
gestive of the fact that reallocation may have
played a major role in shaping the dynamics of
Italian labour productivity in the period of
observation. The decomposition outlined in
equation (7) allows us to shift our focus to the
growth rate of aggregate productivity — a
more relevant variable both for policy and wel-
fare considerations — and to have a more com-
plete picture of the reallocation process,
including firm demography as well.
Table 2 shows the results obtained applying
the above-mentioned decomposition to our
firm-level data. The first column contains the
contribution of incumbent firms’ average pro-
ductivity to the dynamics of aggregate produc-
tivity; this contribution reflects both variations
in technical efficiency at the firm level and
fluctuations in the demand faced by firms, that
may influence — especially in the short run —
the pricing strategies of firms.8 The second col-
umn shows the contribution of the reallocation
among the surviving firms; in other words, it
tells how much of the observed productivity
dynamics depends on reallocation of employ-
ment shares to the most efficient firms. The
contribution of entry (third column) is typically
negative, as it reflects the lower productivity
of these firms with respect to the incumbents;
7 For sake of simplicity, we have described here the baseline Melitz and Polanec (2015) decomposition,
which defines aggregate productivity as a weighted average of individual firms’ log productivities. Despite
returning a straightforward decomposition, this approach has two drawbacks: (i) the growth of aggregate
productivity measured in logs does not correspond to that of aggregate productivity measured in levels, which
is the one that should be preferred when evaluating welfare implications (Petrin and Levinsohn, 2012);
(ii) in the baseline decomposition, the covariance term would not be invariant to changes in average pro-
ductivity (i.e. a uniform increase in productivity for all firms would also map into the covariance term,
rather than on the within-firm productivity term only). Melitz and Polanec (2015: 374) explain how these
issues can be addressed, by performing the decomposition on data in levels and by defining a scale-indepen-
dent covariance term. All the results presented in this article are obtained using this decomposition in
levels.
ρs
Φ2
Φ1
– ∆ρs ∆Covs
ωE2
ΦE2
ΦS2
–( )
ωX1
ΦS1
ΦX1
–( )
+
+
+
=
Cov ρit ωit,( )( ) Φt⁄( )
8 It has to be stressed that we are not able to perfectly control for price variations, since the deflators at
our disposal are disaggregated at the 2-digits level. Hence, price variations may still show up in our
data, as long as they depart from the average price dynamics within each 2-digit sector.
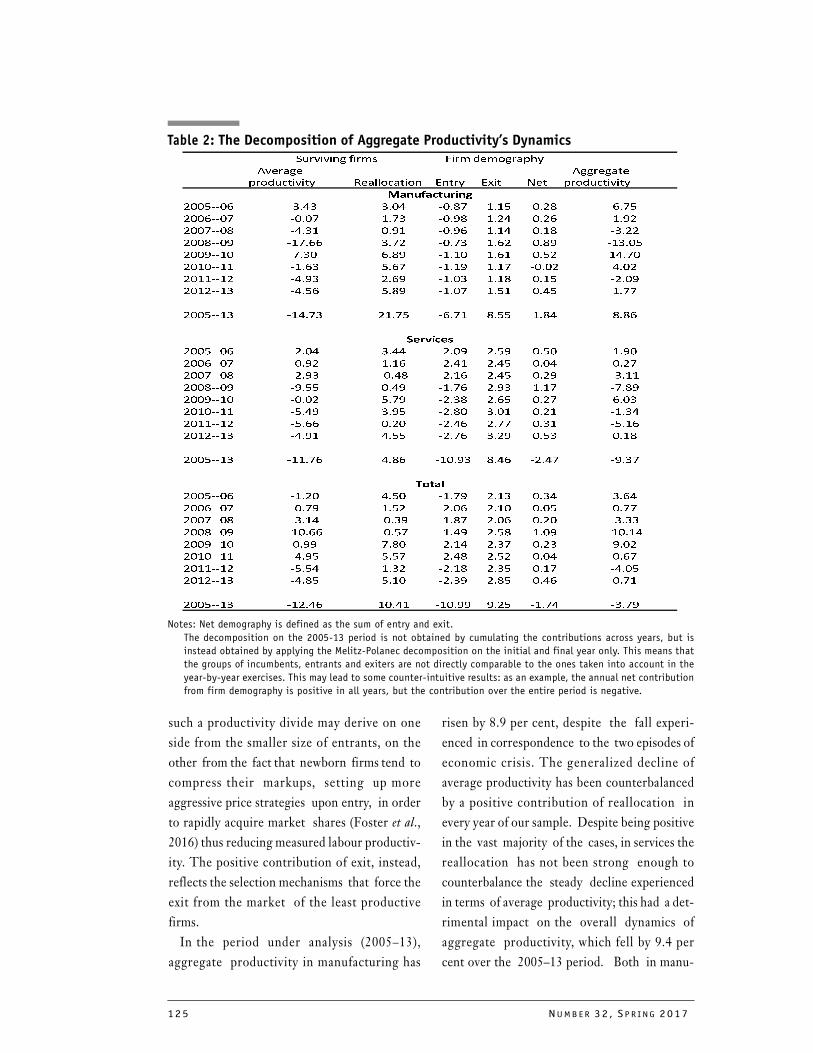
125 NUMB E R 32 , S P R I NG 2017
������������� ���� ��������
��������
��� �������� ������������ ����� ���� ���
����������
��� ��������
�����������
������� !"#! !"�# ��"$% &"&� �"�$ "%�
��� ���% ��"�% &"%! ��"'$ &"�# �"� &"'�
���%���$ �#"!& �"'& ��"' &"&# �"&$ �!"��
���$���' �&%" !"%� ��"%! &" � �"$' �&!"��
���'��&� %"!� "$' �&"&� &" & �"�� &#"%�
��&���&& �&" ! �" % �&"&' &"&% ��"�� #"��
��&&��&� �#"'! �" ' �&"�! &"&$ �"&� ��"�'
��&���&! �#"� �"$' �&"�% &"�& �"#� &"%%
������&! �&#"%! �&"%� � "%& $"�� &"$#� $"$
��� ���
������� ��"�# !"## ��"�' �"�' �"�� &"'�
��� ���% ��"'� &"& ��"#& �"#� �"�# �"�%
���%���$ ��"'! ��"#$ ��"& �"#� �"�' �!"&&
���$���' �'"�� �"#' �&"% �"'! &"&% �%"$'
���'��&� ��"�� �"%' ��"!$ �" � �"�% "�!
��&���&& ��"#' !"'� ��"$� !"�& �"�& �&"!#
��&&��&� ��" �"�� ��"# �"%% �"!& ��"&
��&���&! �#"'& #"�� ��"% !"�' �"�! �"&$
������&! �&&"% #"$ �&�"'! $"# ��"#% �'"!%
�����
������� �&"�� #"�� �&"%' �"&! �"!# !" #
��� ���% ��"%' &"�� ��"� �"&� �"�� �"%%
���%���$ �!"&# ��"!' �&"$% �"� �"�� �!"!!
���$���' �&�" ��"�% �&"#' �"�$ &"�' �&�"&#
���'��&� �"'' %"$� ��"&# �"!% �"�! '"��
��&���&& �#"'� �"�% ��"#$ �"�� �"�# �" %
��&&��&� ��"�# &"!� ��"&$ �"!� �"&% �#"��
��&���&! �#"$� �"&� ��"!' �"$� �"# �"%&
������&! �&�"# &�"#& �&�"'' '"�� �&"%# �!"%'
such a productivity divide may derive on one
side from the smaller size of entrants, on the
other from the fact that newborn firms tend to
compress their markups, setting up more
aggressive price strategies upon entry, in order
to rapidly acquire market shares (Foster et al.,
2016) thus reducing measured labour productiv-
ity. The positive contribution of exit, instead,
reflects the selection mechanisms that force the
exit from the market of the least productive
firms.
In the period under analysis (2005–13),
aggregate productivity in manufacturing has
risen by 8.9 per cent, despite the fall experi-
enced in correspondence to the two episodes of
economic crisis. The generalized decline of
average productivity has been counterbalanced
by a positive contribution of reallocation in
every year of our sample. Despite being positive
in the vast majority of the cases, in services the
reallocation has not been strong enough to
counterbalance the steady decline experienced
in terms of average productivity; this had a det-
rimental impact on the overall dynamics of
aggregate productivity, which fell by 9.4 per
cent over the 2005–13 period. Both in manu-
Table 2: The Decomposition of Aggregate Productivity’s Dynamics
Notes: Net demography is defined as the sum of entry and exit.
The decomposition on the 2005-13 period is not obtained by cumulating the contributions across years, but is
instead obtained by applying the Melitz-Polanec decomposition on the initial and final year only. This means that
the groups of incumbents, entrants and exiters are not directly comparable to the ones taken into account in the
year-by-year exercises. This may lead to some counter-intuitive results: as an example, the annual net contribution
from firm demography is positive in all years, but the contribution over the entire period is negative.
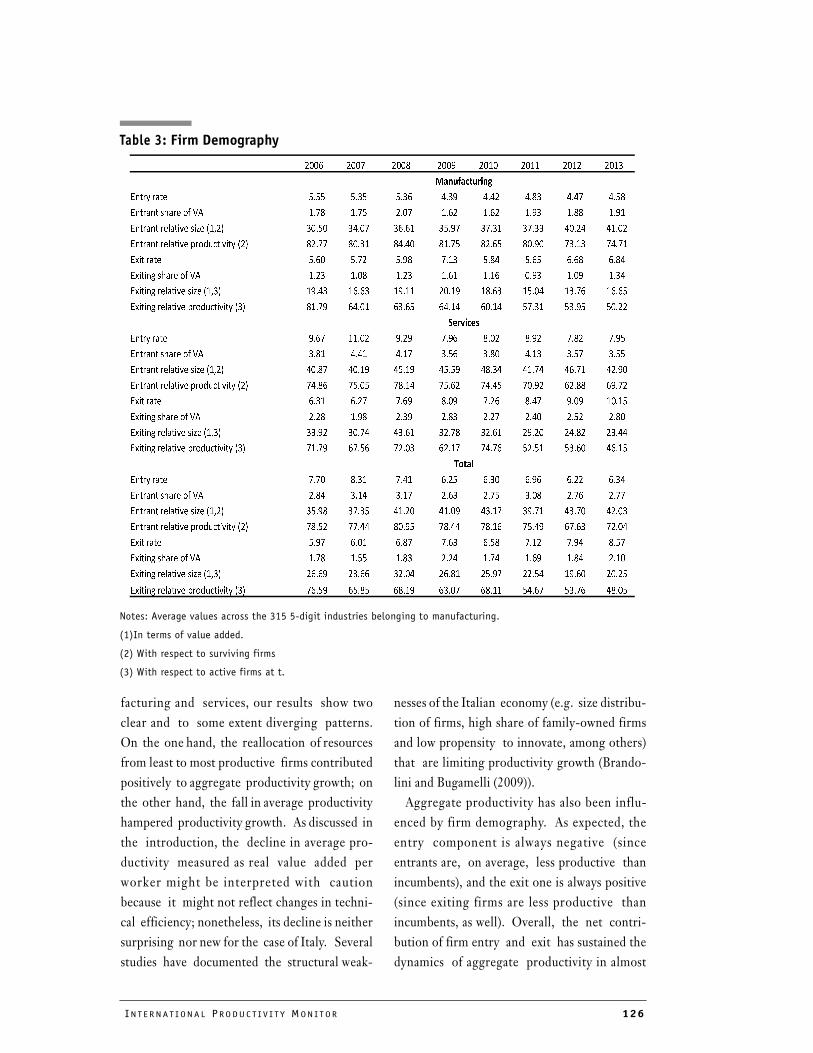
INT E R N A T I ON A L PRO DU C T I V I T Y MON I T OR 126
���� ���� ���� ���� ���� ���� ���� ����
�����������
�� ����� ���� ���� ���� ���� ���� ���� ���� ����
���������������� ���� ���� ���� ���� ���� ���� ���� ����
����������������������� ����� ����� ����� ����� ����� ����� ����� �����
��������������!��"#$����� ��� ����� ����� ����� ����� ����� ����� ����� �����
%������� ���� ���� ���� ���� ���� ���� ���� ����
%���&������������ ���� ���� ���� ���� ���� ���� ���� ����
%���&������������������� ����� ����� ����� ����� ����� ����� ����� �����
%���&����������!��"#$����� ��� ����� ����� ����� ����� ����� ����� ����� �����
��� ���
�� ����� ���� ����� ���� ���� ���� ���� ���� ����
���������������� ���� ���� ���� ���� ���� ���� ���� ����
����������������������� ����� ����� ����� ����� ����� ����� ����� �����
��������������!��"#$����� ��� ����� ����� ����� ����� ����� ����� ����� �����
%������� ���� ���� ���� ���� ���� ���� ���� �����
%���&������������ ���� ���� ���� ���� ���� ���� ���� ����
%���&������������������� ����� ����� ����� ����� ����� ����� ����� �����
%���&����������!��"#$����� ��� ����� ����� ����� ����� ����� ����� ����� �����
�����
�� ����� ���� ���� ���� ���� ���� ���� ���� ����
���������������� ���� ���� ���� ���� ���� ���� ���� ����
����������������������� ����� ����� ����� ����� ����� ����� ����� �����
��������������!��"#$����� ��� ����� ����� ����� ����� ����� ����� ����� �����
%������� ���� ���� ���� ���� ���� ���� ���� ����
%���&������������ ���� ���� ���� ���� ���� ���� ���� ����
%���&������������������� ����� ����� ����� ����� ����� ����� ����� �����
%���&����������!��"#$����� ��� ����� ����� ����� ����� ����� ����� ����� �����
Table 3: Firm Demography
Notes: Average values across the 315 5-digit industries belonging to manufacturing.
(1)In terms of value added.
(2) With respect to surviving firms
(3) With respect to active firms at t.
facturing and services, our results show two
clear and to some extent diverging patterns.
On the one hand, the reallocation of resources
from least to most productive firms contributed
positively to aggregate productivity growth; on
the other hand, the fall in average productivity
hampered productivity growth. As discussed in
the introduction, the decline in average pro-
ductivity measured as real value added per
worker might be interpreted with caution
because it might not reflect changes in techni-
cal efficiency; nonetheless, its decline is neither
surprising nor new for the case of Italy. Several
studies have documented the structural weak-
nesses of the Italian economy (e.g. size distribu-
tion of firms, high share of family-owned firms
and low propensity to innovate, among others)
that are limiting productivity growth (Brando-
lini and Bugamelli (2009)).
Aggregate productivity has also been influ-
enced by firm demography. As expected, the
entry component is always negative (since
entrants are, on average, less productive than
incumbents), and the exit one is always positive
(since exiting firms are less productive than
incumbents, as well). Overall, the net contri-
bution of firm entry and exit has sustained the
dynamics of aggregate productivity in almost
127 NUMB E R 32 , S P R I NG 2017
all years, despite being relatively small in mag-
nitude; the contribution of firm demography
has been substantially higher in the years of
deepest financial crisis (2008–09), as a result of
an increase in the exit component induced by a
more pronounced selectivity on the market.
Ultimately, the contribution of firm demogra-
phy depends on two factors: on one side, the
rates of entry/exit from the market; on the
other, the relative productivity of entering and
exiting firms with respect to the incumbents.
The dynamics of these two factors is reported
in Table 3. Services are characterized by sub-
stantially higher entry and exit rates relative to
manufacturing. Moreover, while in manufactur-
ing the exit rate is always higher than the entry
rate,9 in services it is usually the opposite,10 if we
exclude the sudden tightening up of the selec-
tion process in the most acute phase of the sov-
ereign debt crisis (2012 and 2013).
Entry rates in both manufacturing and ser-
vices have shrunk over time, while the pattern
followed by exit rates is less clear-cut; it is
apparent, though, that exit rates suddenly
increased in the years of crisis, suggesting that
recessions influence firm demography mainly
by pushing firms out of the market, rather
than by preventing the entrance of new firms.
Looking at relative size and productivity of
these firms with respect to incumbents, new
entrants in manufacturing tend to be smaller but
more productive with respect to those in ser-
vices. Relative productivity has been declining
for both entering and exiting firms throughout
the whole period of observation, more intensely
in manufacturing, where — as shown in Table 2
— the process of reallocation has sustained
the aggregate productivity of incumbents.
Netting from Sectoral Composition
The results of the aggregate labour productiv-
ity decomposition presented in Table 2 may
crucially depend on composition effects: the
relative weight of the four components could be
different across more narrowly-defined sectors,
as it is likely to be influenced by structural sec-
toral characteristics — such as the degree of
competitiveness or the exposure to interna-
tional trade, for example. In order to check
whether our results are significantly affected by
these composition effects, we have replicated
the dynamic OP decomposition on each nar-
rowly-defined sector (according to the 5-digit
Ateco 2007 classification), pooled together all
the sectors, and estimated for each component
the following OLS model:
(8)
where ∆y is one of the four components of
aggregate labour productivity growth between
year t and t - 1 (as defined in equation (7)), s
indexes 5-digit sectors, t indexes years, δs are
sector fixed effects, δt are fixed effects for
year t, and εst is an error term. The idea
behind this specification is to control for
invariant sectoral characteristics by means of
the sectoral fixed effects δs . The year fixed
effects δt estimated under this framework can
thus be interpreted as the contribution of each
component to the dynamics of aggregate pro-
ductivity, net of the composition effects dis-
cussed above.11
For each component, Chart 2 plots the esti-
mated year fixed effects for the total economy.
The results presented in Table 2 are broadly
confirmed; moreover, the evolution over time
of the various components emerges now more
clearly, highlighting in particular the steadily-
increasingly positive role of reallocation in
9 This is coherent with other data sources — such as the Infocamere database — that provide information on
firm demography in manufacturing.
10 This pattern has been also documented in Lotti (2007).
∆yst
δs
δt
εst
+ +=
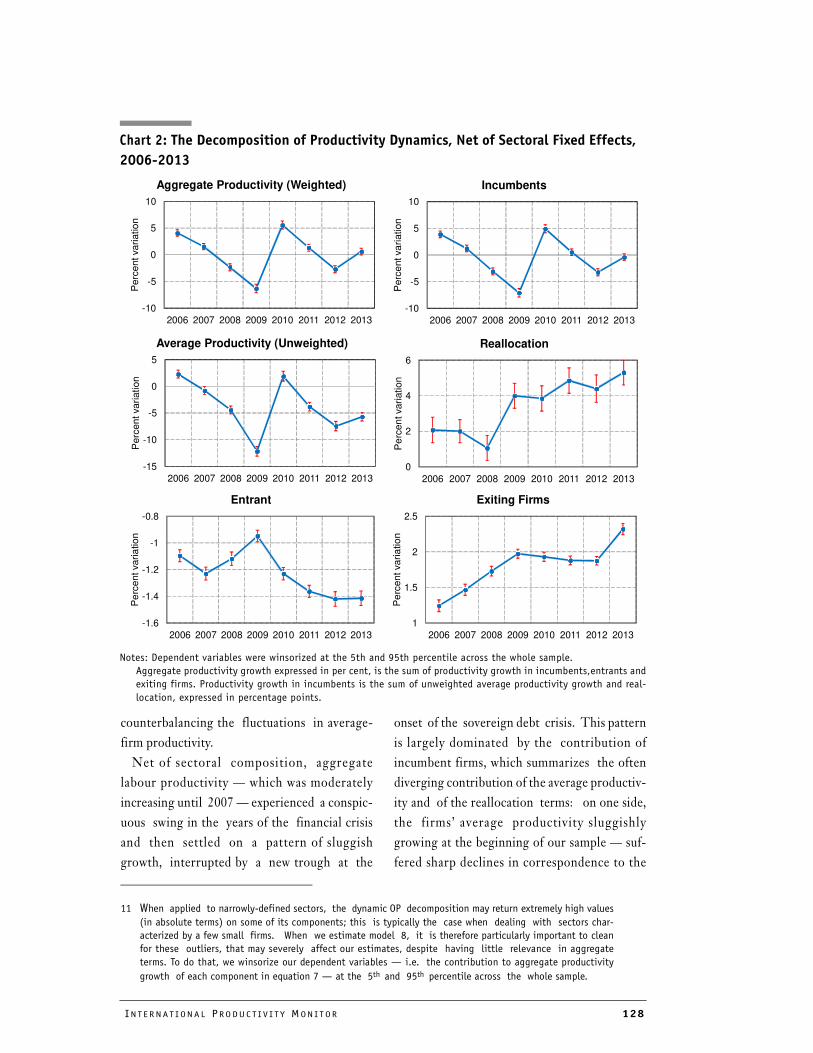
INT E R N A T I ON A L PRO DU C T I V I T Y MON I T OR 128
Chart 2: The Decomposition of Productivity Dynamics, Net of Sectoral Fixed Effects,
2006-2013
Notes: Dependent variables were winsorized at the 5th and 95th percentile across the whole sample.
Aggregate productivity growth expressed in per cent, is the sum of productivity growth in incumbents,entrants and
exiting firms. Productivity growth in incumbents is the sum of unweighted average productivity growth and real-
location, expressed in percentage points.
-10
-5
0
5
10
2006 2007 2008 2009 2010 2011 2012 2013
Perc
ent va
riation
Incumbents
-15
-10
-5
0
5
2006 2007 2008 2009 2010 2011 2012 2013
Perc
ent variation
Average Productivity (Unweighted)
0
2
4
6
2006 2007 2008 2009 2010 2011 2012 2013
Pe
rcen
t vari
ation
Reallocation
-1.6
-1.4
-1.2
-1
-0.8
2006 2007 2008 2009 2010 2011 2012 2013
Pe
rcent varia
tion
Entrant
1
1.5
2
2.5
2006 2007 2008 2009 2010 2011 2012 2013
Pe
rcent varia
tion
Exiting Firms
-10
-5
0
5
10
2006 2007 2008 2009 2010 2011 2012 2013
Perc
ent variatio
n
Aggregate Productivity (Weighted)
counterbalancing the fluctuations in average-
firm productivity.
Net of sectoral composition, aggregate
labour productivity — which was moderately
increasing until 2007 — experienced a conspic-
uous swing in the years of the financial crisis
and then settled on a pattern of sluggish
growth, interrupted by a new trough at the
onset of the sovereign debt crisis. This pattern
is largely dominated by the contribution of
incumbent firms, which summarizes the often
diverging contribution of the average productiv-
ity and of the reallocation terms: on one side,
the firms’ average productivity sluggishly
growing at the beginning of our sample — suf-
fered sharp declines in correspondence to the
11 When applied to narrowly-defined sectors, the dynamic OP decomposition may return extremely high values
(in absolute terms) on some of its components; this is typically the case when dealing with sectors char-
acterized by a few small firms. When we estimate model 8, it is therefore particularly important to clean
for these outliers, that may severely affect our estimates, despite having little relevance in aggregate
terms. To do that, we winsorize our dependent variables — i.e. the contribution to aggregate productivity
growth of each component in equation 7 — at the 5th and 95th percentile across the whole sample.
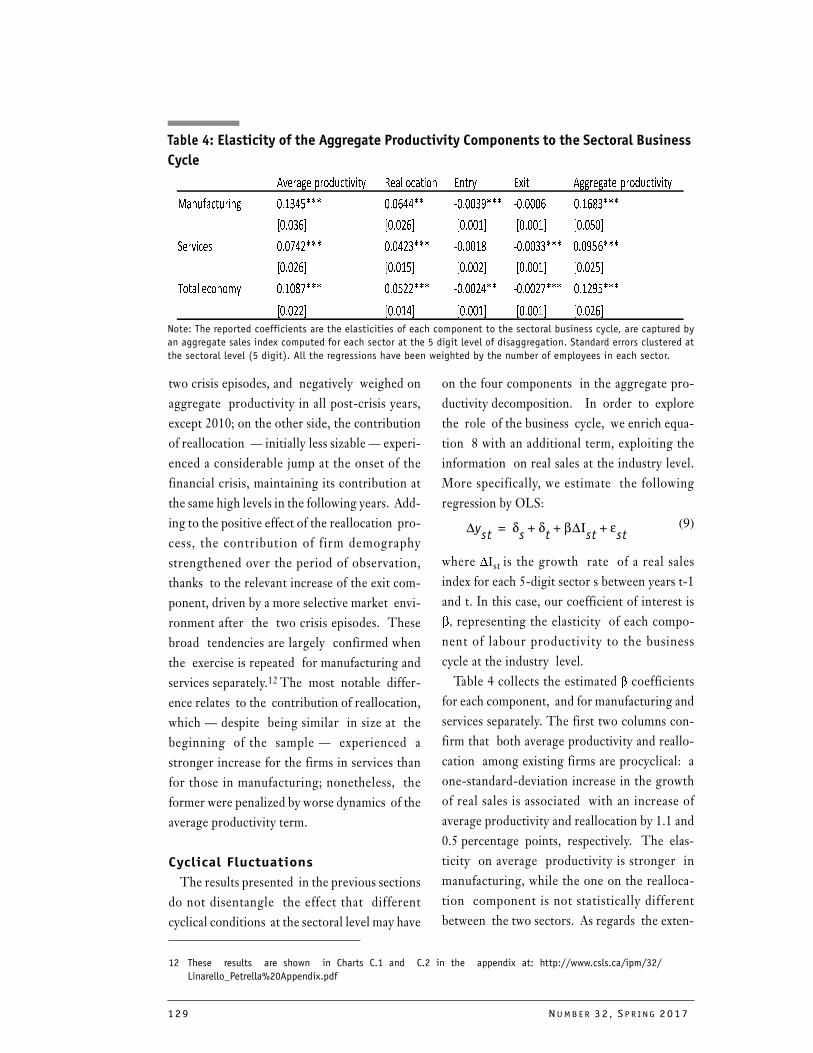
129 NUMB E R 32 , S P R I NG 2017
������������ ��� � ������� �� �� �� ��� ������� ������ ��� �
������� ����� ��������� ��������� ������ ��� ���������� ����!����
"�����#�� "���$�#�� "�����#�� "�����#�� "�����#��
%������& ���'�$��� ����$���� ������!��� ���������� ��� �����
"���$�#�� "�����#�� "����$#�� "�����#�� "���$�#
( ������)� ����!'��� ����$$��� �����$���� �����$'��� ���$ ����
"���$$#�� "�����#�� "�����#�� "�����#�� "���$�#
two crisis episodes, and negatively weighed on
aggregate productivity in all post-crisis years,
except 2010; on the other side, the contribution
of reallocation — initially less sizable — experi-
enced a considerable jump at the onset of the
financial crisis, maintaining its contribution at
the same high levels in the following years. Add-
ing to the positive effect of the reallocation pro-
cess, the contribution of firm demography
strengthened over the period of observation,
thanks to the relevant increase of the exit com-
ponent, driven by a more selective market envi-
ronment after the two crisis episodes. These
broad tendencies are largely confirmed when
the exercise is repeated for manufacturing and
services separately.12 The most notable differ-
ence relates to the contribution of reallocation,
which — despite being similar in size at the
beginning of the sample — experienced a
stronger increase for the firms in services than
for those in manufacturing; nonetheless, the
former were penalized by worse dynamics of the
average productivity term.
Cyclical Fluctuations
The results presented in the previous sections
do not disentangle the effect that different
cyclical conditions at the sectoral level may have
on the four components in the aggregate pro-
ductivity decomposition. In order to explore
the role of the business cycle, we enrich equa-
tion 8 with an additional term, exploiting the
information on real sales at the industry level.
More specifically, we estimate the following
regression by OLS:
(9)
where ∆Ist is the growth rate of a real sales
index for each 5-digit sector s between years t-1
and t. In this case, our coefficient of interest is
β, representing the elasticity of each compo-
nent of labour productivity to the business
cycle at the industry level.
Table 4 collects the estimated � coefficients
for each component, and for manufacturing and
services separately. The first two columns con-
firm that both average productivity and reallo-
cation among existing firms are procyclical: a
one-standard-deviation increase in the growth
of real sales is associated with an increase of
average productivity and reallocation by 1.1 and
0.5 percentage points, respectively. The elas-
ticity on average productivity is stronger in
manufacturing, while the one on the realloca-
tion component is not statistically different
between the two sectors. As regards the exten-
12 These results are shown in Charts C.1 and C.2 in the appendix at: http://www.csls.ca/ipm/32/
Linarello_Petrella%20Appendix.pdf
∆yst
δs
δt
β∆Ιst
εst
+ + +=
Table 4: Elasticity of the Aggregate Productivity Components to the Sectoral Business
Cycle
Note: The reported coefficients are the elasticities of each component to the sectoral business cycle, are captured by
an aggregate sales index computed for each sector at the 5 digit level of disaggregation. Standard errors clustered at
the sectoral level (5 digit). All the regressions have been weighted by the number of employees in each sector.
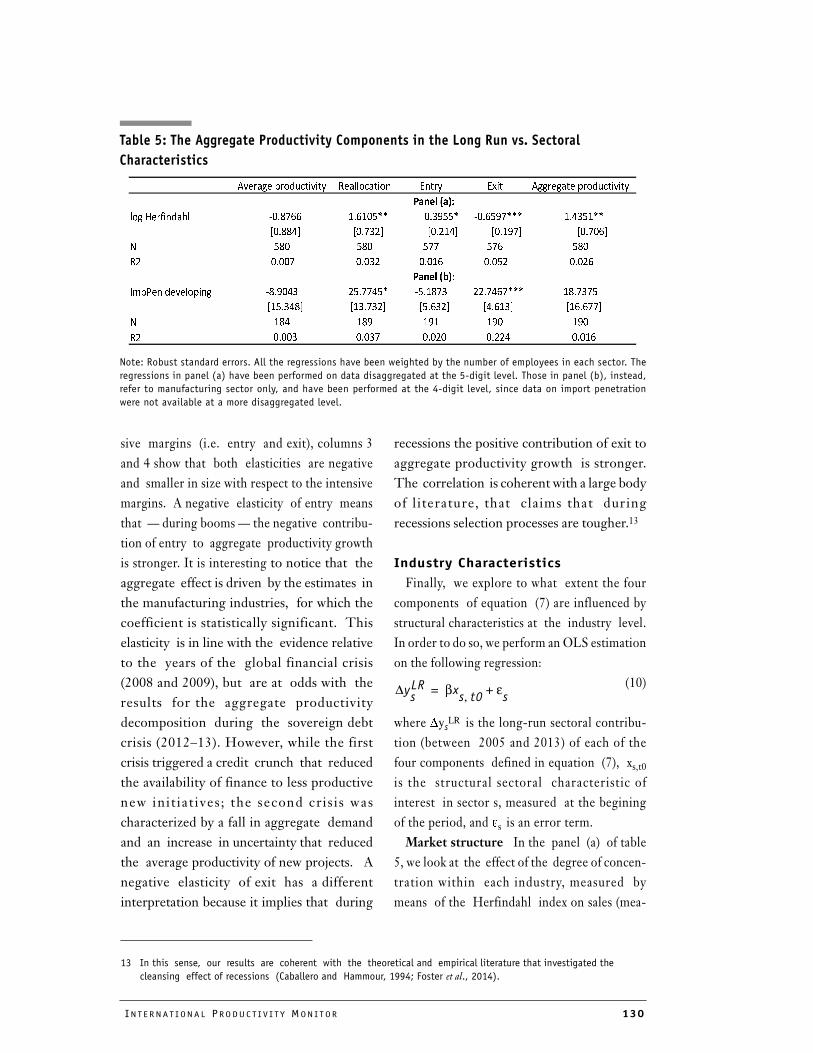
INT E R N A T I ON A L PRO DU C T I V I T Y MON I T OR 130
������������ ��� � ������� �� �� �� ��� ������� ������ ��� ����
���������
������������
�������������� ������ ��!"�� �����������"� ��#!�� �
$����#%������� $���!&% $��&�#% $���"�% $�����%��
'�������
��� ��� ��� ��� ���
�&��������������������� ���!& ����� ����&� ���&����
��������
()�*�����������
���"�#! &����#� ������! &&��#�� ����!��
$���!#�% $�!��!&% $���!&% $#���!% $������%
'���������# ��" �"� �"� �"�
�&�������
����! ���!� ���&� ��&&# �����
Table 5: The Aggregate Productivity Components in the Long Run vs. Sectoral
Characteristics
Note: Robust standard errors. All the regressions have been weighted by the number of employees in each sector. The
regressions in panel (a) have been performed on data disaggregated at the 5-digit level. Those in panel (b), instead,
refer to manufacturing sector only, and have been performed at the 4-digit level, since data on import penetration
were not available at a more disaggregated level.
sive margins (i.e. entry and exit), columns 3
and 4 show that both elasticities are negative
and smaller in size with respect to the intensive
margins. A negative elasticity of entry means
that — during booms — the negative contribu-
tion of entry to aggregate productivity growth
is stronger. It is interesting to notice that the
aggregate effect is driven by the estimates in
the manufacturing industries, for which the
coefficient is statistically significant. This
elasticity is in line with the evidence relative
to the years of the global financial crisis
(2008 and 2009), but are at odds with the
results for the aggregate productivity
decomposition during the sovereign debt
crisis (2012–13). However, while the first
crisis triggered a credit crunch that reduced
the availability of finance to less productive
new init iat ives ; the second cris is was
characterized by a fall in aggregate demand
and an increase in uncertainty that reduced
the average productivity of new projects. A
negative elasticity of exit has a different
interpretation because it implies that during
recessions the positive contribution of exit to
aggregate productivity growth is stronger.
The correlation is coherent with a large body
of literature, that claims that during
recessions selection processes are tougher.13
Industry Characteristics
Finally, we explore to what extent the four
components of equation (7) are influenced by
structural characteristics at the industry level.
In order to do so, we perform an OLS estimation
on the following regression:
(10)
where ∆ysLR is the long-run sectoral contribu-
tion (between 2005 and 2013) of each of the
four components defined in equation (7), xs,t0
is the structural sectoral characteristic of
interest in sector s, measured at the begining
of the period, and εs is an error term.
Market structure In the panel (a) of table
5, we look at the effect of the degree of concen-
tration within each industry, measured by
means of the Herfindahl index on sales (mea-
13 In this sense, our results are coherent with the theoretical and empirical literature that investigated the
cleansing effect of recessions (Caballero and Hammour, 1994; Foster et al., 2014).
∆ysLR βx
s t0,εs
+=
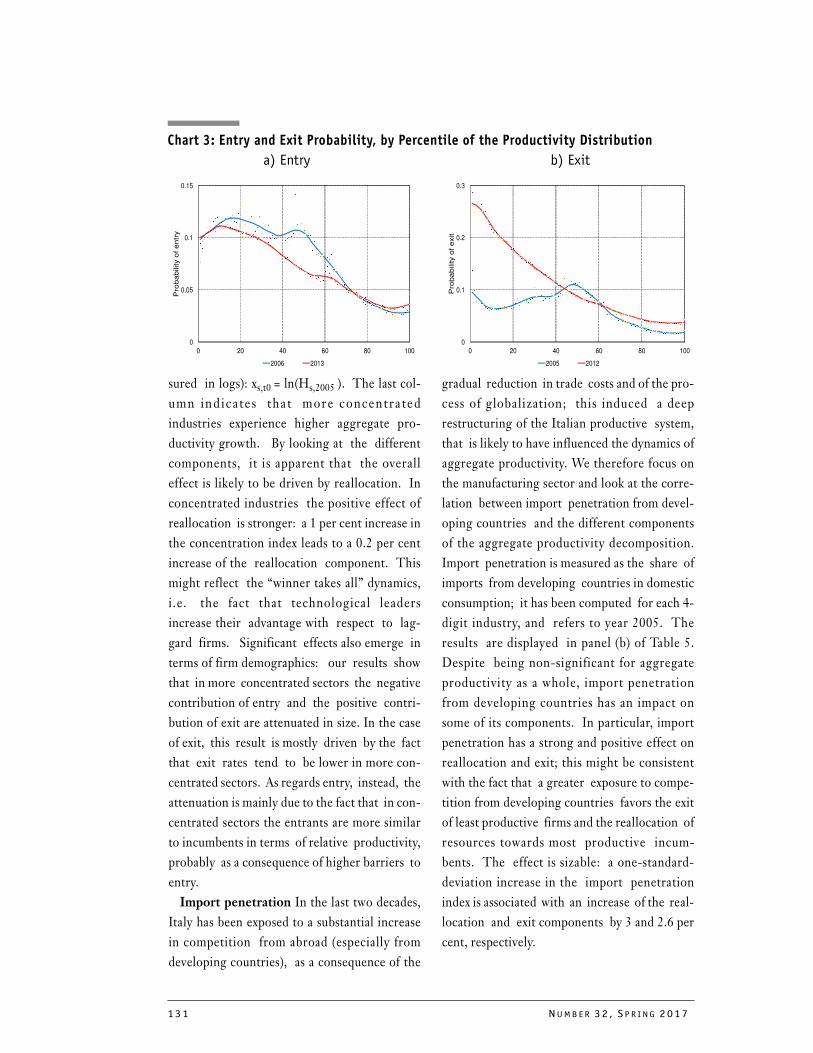
131 NUMB E R 32 , S P R I NG 2017
sured in logs): xs,t0 = ln(Hs,2005 ). The last col-
umn indic a te s that more concentra ted
industries experience higher aggregate pro-
ductivity growth. By looking at the different
components, it is apparent that the overall
effect is likely to be driven by reallocation. In
concentrated industries the positive effect of
reallocation is stronger: a 1 per cent increase in
the concentration index leads to a 0.2 per cent
increase of the reallocation component. This
might reflect the “winner takes all” dynamics,
i.e. the fact that technological leaders
increase their advantage with respect to lag-
gard firms. Significant effects also emerge in
terms of firm demographics: our results show
that in more concentrated sectors the negative
contribution of entry and the positive contri-
bution of exit are attenuated in size. In the case
of exit, this result is mostly driven by the fact
that exit rates tend to be lower in more con-
centrated sectors. As regards entry, instead, the
attenuation is mainly due to the fact that in con-
centrated sectors the entrants are more similar
to incumbents in terms of relative productivity,
probably as a consequence of higher barriers to
entry.
Import penetration In the last two decades,
Italy has been exposed to a substantial increase
in competition from abroad (especially from
developing countries), as a consequence of the
gradual reduction in trade costs and of the pro-
cess of globalization; this induced a deep
restructuring of the Italian productive system,
that is likely to have influenced the dynamics of
aggregate productivity. We therefore focus on
the manufacturing sector and look at the corre-
lation between import penetration from devel-
oping countries and the different components
of the aggregate productivity decomposition.
Import penetration is measured as the share of
imports from developing countries in domestic
consumption; it has been computed for each 4-
digit industry, and refers to year 2005. The
results are displayed in panel (b) of Table 5.
Despite being non-significant for aggregate
productivity as a whole, import penetration
from developing countries has an impact on
some of its components. In particular, import
penetration has a strong and positive effect on
reallocation and exit; this might be consistent
with the fact that a greater exposure to compe-
tition from developing countries favors the exit
of least productive firms and the reallocation of
resources towards most productive incum-
bents. The effect is sizable: a one-standard-
deviation increase in the import penetration
index is associated with an increase of the real-
location and exit components by 3 and 2.6 per
cent, respectively.
Chart 3: Entry and Exit Probability, by Percentile of the Productivity Distribution
a) Entry b) Exit
0
0.05
0.1
0.15
0 20 40 60 80 100
Pro
bab
ility o
f e
ntr
y
2006 2013
0
0.1
0.2
0.3
0 20 40 60 80 100
Pro
ba
bility o
f e
xit
2005 2012
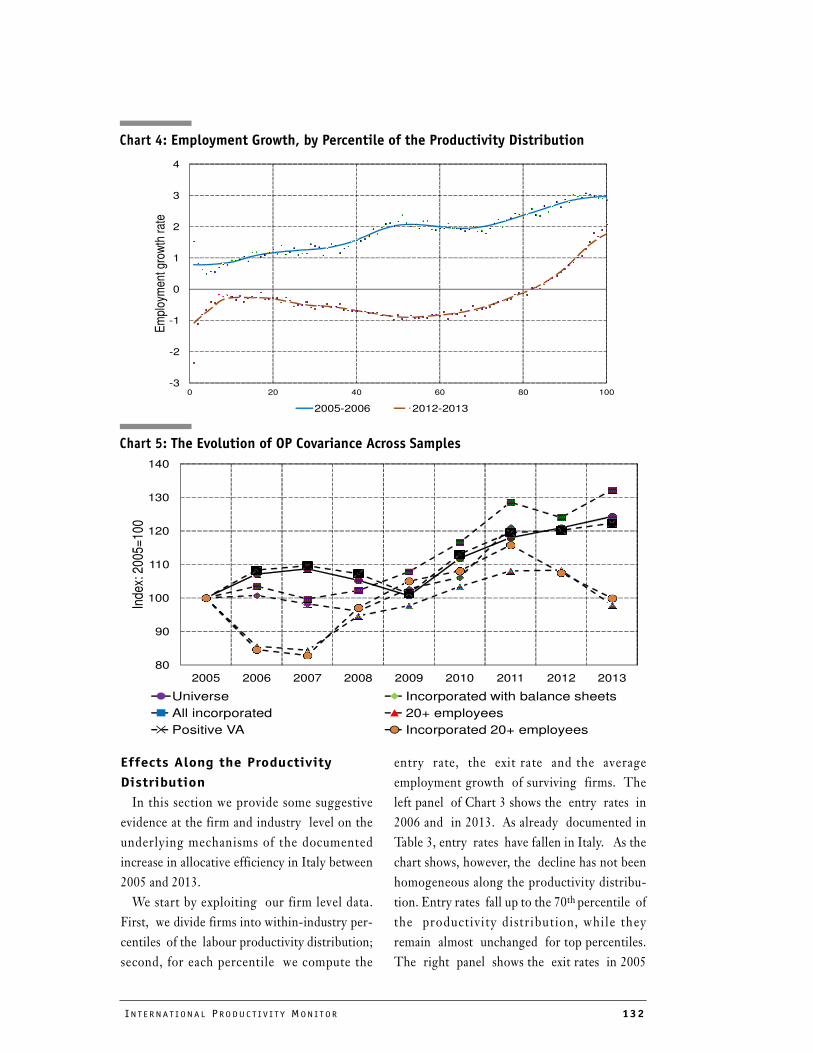
INT E R N A T I ON A L PRO DU C T I V I T Y MON I T OR 132
Effects Along the Productivity
Distribution
In this section we provide some suggestive
evidence at the firm and industry level on the
underlying mechanisms of the documented
increase in allocative efficiency in Italy between
2005 and 2013.
We start by exploiting our firm level data.
First, we divide firms into within-industry per-
centiles of the labour productivity distribution;
second, for each percentile we compute the
entry rate, the exit rate and the average
employment growth of surviving firms. The
left panel of Chart 3 shows the entry rates in
2006 and in 2013. As already documented in
Table 3, entry rates have fallen in Italy. As the
chart shows, however, the decline has not been
homogeneous along the productivity distribu-
tion. Entry rates fall up to the 70th percentile of
the productivity distribution, while they
remain almost unchanged for top percentiles.
The right panel shows the exit rates in 2005
Chart 4: Employment Growth, by Percentile of the Productivity Distribution
-3
-2
-1
0
1
2
3
4
0 20 40 60 80 100
Em
ploy
men
t gro
wth
rat
e
2005-2006 2012-2013
Chart 5: The Evolution of OP Covariance Across Samples
80
90
100
110
120
130
140
2005 2006 2007 2008 2009 2010 2011 2012 2013
Inde
x: 2
005=
100
Universe Incorporated with balance sheets
All incorporated 20+ employees
Positive VA Incorporated 20+ employees
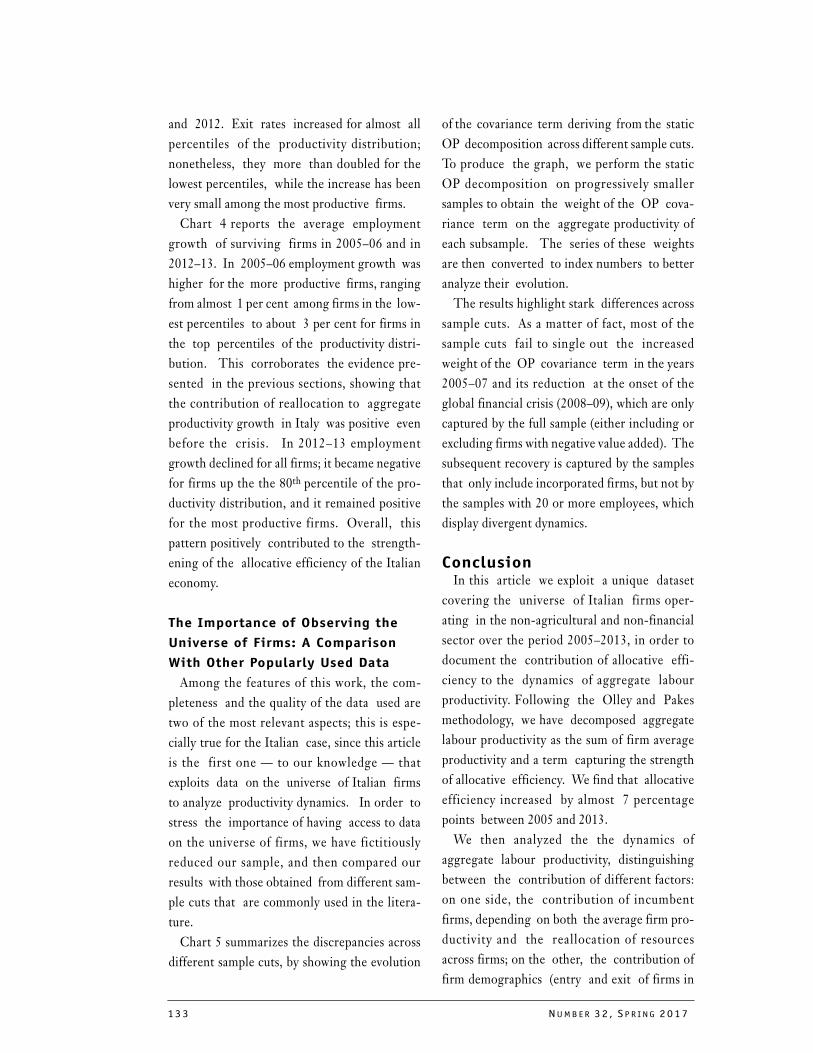
133 NUMB E R 32 , S P R I NG 2017
and 2012. Exit rates increased for almost all
percentiles of the productivity distribution;
nonetheless, they more than doubled for the
lowest percentiles, while the increase has been
very small among the most productive firms.
Chart 4 reports the average employment
growth of surviving firms in 2005–06 and in
2012–13. In 2005–06 employment growth was
higher for the more productive firms, ranging
from almost 1 per cent among firms in the low-
est percentiles to about 3 per cent for firms in
the top percentiles of the productivity distri-
bution. This corroborates the evidence pre-
sented in the previous sections, showing that
the contribution of reallocation to aggregate
productivity growth in Italy was positive even
before the crisis. In 2012–13 employment
growth declined for all firms; it became negative
for firms up the the 80th percentile of the pro-
ductivity distribution, and it remained positive
for the most productive firms. Overall, this
pattern positively contributed to the strength-
ening of the allocative efficiency of the Italian
economy.
The Importance of Observing the
Universe of Firms: A Comparison
With Other Popularly Used Data
Among the features of this work, the com-
pleteness and the quality of the data used are
two of the most relevant aspects; this is espe-
cially true for the Italian case, since this article
is the first one — to our knowledge — that
exploits data on the universe of Italian firms
to analyze productivity dynamics. In order to
stress the importance of having access to data
on the universe of firms, we have fictitiously
reduced our sample, and then compared our
results with those obtained from different sam-
ple cuts that are commonly used in the litera-
ture.
Chart 5 summarizes the discrepancies across
different sample cuts, by showing the evolution
of the covariance term deriving from the static
OP decomposition across different sample cuts.
To produce the graph, we perform the static
OP decomposition on progressively smaller
samples to obtain the weight of the OP cova-
riance term on the aggregate productivity of
each subsample. The series of these weights
are then converted to index numbers to better
analyze their evolution.
The results highlight stark differences across
sample cuts. As a matter of fact, most of the
sample cuts fail to single out the increased
weight of the OP covariance term in the years
2005–07 and its reduction at the onset of the
global financial crisis (2008–09), which are only
captured by the full sample (either including or
excluding firms with negative value added). The
subsequent recovery is captured by the samples
that only include incorporated firms, but not by
the samples with 20 or more employees, which
display divergent dynamics.
ConclusionIn this article we exploit a unique dataset
covering the universe of Italian firms oper-
ating in the non-agricultural and non-financial
sector over the period 2005–2013, in order to
document the contribution of allocative effi-
ciency to the dynamics of aggregate labour
productivity. Following the Olley and Pakes
methodology, we have decomposed aggregate
labour productivity as the sum of firm average
productivity and a term capturing the strength
of allocative efficiency. We find that allocative
efficiency increased by almost 7 percentage
points between 2005 and 2013.
We then analyzed the the dynamics of
aggregate labour productivity, distinguishing
between the contribution of different factors:
on one side, the contribution of incumbent
firms, depending on both the average firm pro-
ductivity and the reallocation of resources
across firms; on the other, the contribution of
firm demographics (entry and exit of firms in
INT E R N A T I ON A L PRO DU C T I V I T Y MON I T OR 134
the market), mainly driven by selection mech-
anisms. The reallocation component — net of
sectoral composition effects — positively con-
tributed to the dynamics of aggregate produc-
tivity in all years, even before the burst of the
global financial crisis (years 2005–07 in our
sample). Over the whole period 2005–13, it
steadily increased its relevance. The net con-
tribution of firm demography is always positive
in our sample: the positive contribution linked
to the exit of least productive firms more than
compensated the negative contribution arising
from the entry of small low-productivity new-
born firms.
The contribution of the different components
to the dynamics of aggregate productivity varies
according to the business cycle. Average pro-
ductivity and reallocation are both procyclical,
consistent with the evidence that firms tend to
invest more when they experience a positive
demand shock. The contribution of entry and
exit is, instead, countercyclical, pointing at a
more stringent selection process during reces-
sions. Reallocation is also stronger in sectors
that were more exposed to competition from
developing countries; this might have favored
an improvement of allocative efficiency through
the exit of the least productive firms and the
subsequent reallocation of resources towards
the most productive incumbents.
Over the period of observation, the different
response of entry rates, exit rates and employ-
ment growth along the productivity distribution
also provides some suggestive evidence on the
mechanisms behind the observed increase in
allocative efficiency. In the same time span,
exit rates increased and entry rates dropped
for firms in the low tail of the productivity dis-
tribution, suggesting that the prolonged phase
of recession gave rise to a more selective envi-
ronment. Moreover, average firm employment
growth declined across the whole distribution,
becoming negative for the firms in the lower
tail. Overall, these results suggest that the struc-
tural adjustment of the Italian productive sys-
tem — already in action before the global
financial crisis — reinforced during the pro-
longed period of recession; such adjustment pre-
dominantly occurred through the exit of the
least productive firms and the reallocation of
workforce to the best performing ones.
To our knowledge, this article is the first
one that analyzes productivity dynamics using
detailed data on the universe of Italian firms.
The advantage of using complete and high-qual-
ity data is non-negligible: we show that differ-
ent sample cuts, often used in the literature, fail
to capture the changes in the incidence of alloc-
ative efficiency over aggregate productivity.
ReferencesAbbate, C. C., M. G. Ladu, and A. Linarello (2017)
“An Integrated Dataset of Italian Firms: 2005–2013”, Bank of Italy Occasional Paper, forth-coming.
Aghion, P., R. Blundell, R. Griffith, P. Howitt, and S. Prantl (2009) “The Effects of Entry on Incumbent Innovation and Productivity,” Review of Economics and Statistics, Vol. 91, No. 1, pp. 20–32.
Andrews, D. and F. Cingano (2014) “Public Policy and Resource Allocation: Evidence from Firms in OECD Countries,” Economic Policy, Vol. 29, No. 78, pp. 253–296.
Bartelsman, E., S. Scarpetta, and F. Schivardi (2005) “Comparative Analysis of Firm Demo- Graphics and Survival: Evidence from Micro-Level Sources in OECD Countries,” Industrial and Corporate Change, Vol. 14, No.3, pp. 365–391.
Bartelsman, E., J. Haltiwanger, and S. Scarpetta (2009) “Measuring and Analyzing Cross- Coun-try Differences in Firm Dynamics,” Producer Dynamics: New Evidence from Micro Data. (Chi-cago: University of Chicago Press), pp. 15–76.
Bartelsman, E., J. Haltiwanger, and S. Scarpetta (2013) “ Cross-country Differences in Produc-tivity: The Role of Allocation and Selection,” American Economic Review, Vol. 103, No.1, pp. 305–334.
Bernard, A. B., J. B. Jensen, and P. K. Schott (2006) “Survival of the Best Fit: Exposure to Low-Wage Countries and the (uneven) Growth of US Manufacturing Plants,” Journal of International Economics, Vol. 68, No.1, pp. 219–237.
Bloom, N. and J. Van Reenen (2010) “Why do Man-agement Practices Differ Across Firms and
135 NUMB E R 32 , S P R I NG 2017
Countries?” Journal of Economic Perspectives, Vol. 24, No. 1, pp. 203–224.
Brandolini, A. and M. Bugamelli (2009) “Report on Trends in the Italian Productive
System,” Bank of Italy Occasional Paper Vol. 45, pp. 1–169.
Caballero, R. J. and M. L. Hammour (1994) “The Cleansing Effect of Recessions,” American Eco-nomic Review, Vol. 84, No. 5, pp. 1350–1368.
Calligaris, S., M. Del Gatto, F. Hassan, G. I. P. Otta-viano, and F. Schivardi (2016) “Italy’s Productiv-ity Conundrum: A Study on Resource Misallocation,” European Economy Discussion Paper 030, European Commission.
Cette, G., J. Fernald, and B. Mojon (2016). “The Pre-Great Recession Slowdown in Pro- ductiv-ity,” European Economic Review.
Foster, L., C. Grim, and J. Haltiwanger (2014) “Reallocation in the Great Recession: Cleaning or Not?” Working Paper No. 20427. National Bureau of Economic Research.
Foster, L., J. Haltiwanger, and C. Syverson (2016) “The Slow Growth of New Plants: Learning About Demand?” Economica, Vol. 83, No. 329, pp. 91–129.
Gamberoni, E., C. Giordano, and P. Lopez-Garcia (2016) “Capital and Labour (Mis)allocation in the Euro Area: Some Stylized Facts and Deter-minants,” Bank of Italy Occasional Paper Vol. 349, pp. 1-57.
García-Santana, M., E. Moral-Benito, J. Pijoan-Mas, and R. Ramos (2016) “Growing like Spain: 1995-2007”, Banco de España Working Paper No. 1609.
Geurts, K. and J. Van Biesebroeck (2014) “Job Cre-ation, Firm Creation, and De Novo Entry,” CEPR Discussion Paper No. DP10118.
Gopinath, G., S. Kalemli-Ozcan, L. Karabarbounis, and C. Villegas-Sanchez (2015) “Capi- tal Allo-cation and Productivity in South Europe,” Working Paper 21453, National Bureau of Eco-nomic Research.
Hsieh, C.-T. and P. J. Klenow (2009) “Misalloca-tion and Manufacturing TFP in China and India,” Quarterly Journal of Economics, Vol. 124, No. 4, pp. 1403–1448.
Lotti, F. (2007) “Firm Dynamics in Manufacturing and Services: A Broken Mirror?” Industrial and Corporate Change, Vol. 16, No. 3, pp. 347–369.
Melitz, M. J. and S. Polanec (2015) “Dynamic Olley-Pakes Productivity Decomposition with Entry and Exit,” RAND Journal of Economics, Vol. 46, No. 2, pp. 362–375.
Olley, G. S. and A. Pakes (1996) “The Dynamics of Productivity in the Telecommunications Equip-ment Industry,” Econometrica, Vol. 64, No. 6, pp. 1263–1297.
Petrin, A. and J. Levinsohn (2012) “Measuring Aggregate Productivity Growth Using Plant-Level Data,” RAND Journal of Economics, Vol. 43, No. 4, pp. 705–725.
Solow, R. M. (1957) “Technical Change and the Aggregate Production Function,” Review of Eco-nomics and Statistics, Vol. 39, No. 3, pp. 312–320.
Syverson, C. (2011) “What Determines Productiv-ity?” Journal of Economic Literature, Vol. 49, No. 2, pp. 326–365.
INT E R N A T I ON A L PRO DU C T I V I T Y MON I T OR 136
Appendix:14 Dealing with Missing Values
The validity of our empirical exercise cru-
cially rests on the quality of the data used. One
of the main concerns is therefore related to the
non-negligible share of firms —especially in the
years between 2005 and 2010— for which we are
not able to measure value added. As docu-
mented in Abbate et al. (2017), the missing
information has been filled by imputing the
median value added per worker within cells
defined by industry classification, size class,
location and legal form.
We present an additional exercise that aims at
checking the robustness of our estimates against
the exclusion of the imputed information on
value added. It would be desirable for us that
the results of this exercise closely followed
those presented in Table 2; that would allow us
to claim that the imputation performed did not
significantly distort our estimates. Appendix
Table 2 displays the results obtained excluding
from the analysis the records with imputed
value added: they are completely in line with
those presented above both in terms of average
productivity and reallocation; some slight dif-
ference emerges in the net contribution of firm
demography, which is sometimes negative,
especially in services. The results obtained for
period 2012–13 exactly replicate those pre-
sented in Table 2, since in those years data did
not present missing values.
Overall, this robustness exercise suggests
that the imputation method used to fill in the
missing information did not significantly distort
the results of our decomposition.
Alternative Productivity Measure
We have performed the decomposition exer-
cise using as an alternative measure of produc-
tivity, namely sales per worker. Since the
information on sales is always present in our
database, we would be comforted if the relative
importance of the four components was similar
to the one resulting from the previous exercise
on value added per worker. Of course, the two
measures differ in many respects. Though dif-
ferent, however, value added per worker and
sales per worker broadly share similar dynam-
ics, as shown in Appendix Chart 3: in manufac-
turing, the dynamics of sales per worker tracks
quite closely the one of value added per
worker; in services, the two dynamics are still
similar, despite showing bigger discrepancies,
especially in the last part of the sample. More-
over, it is interesting to look at sales per worker,
since it can represent a valid alternative for mea-
suring labour productivity (as in Bartelsman et
al. (2013)).
Appendix Table 3 shows the decomposition
applied to sales per worker. The results con-
firm that the reallocation has sustained aggre-
gate dynamics in both manufacturing and
services, though experiencing larger swings
than in the previous exercise and turning nega-
tive in a few cases; the contribution of average
sales per worker is largely negative throughout
all the sample, just like the average productivity
component in Table 2. Entry and exit still offer
a negative and positive contribution, respec-
tively, but their net effect —even if small— is
not positive in all periods; it is confirmed,
however, that the largest contributions from
firm demography were registered in the years
of the financial crisis (2008–09).
14 Full appendix available at: http://www.csls.ca/ipm/32/Linarello_Petrella%20Appendix.pdf
INT E R N A T I ON A L PRO DU C T I V I T Y MON I T OR 137
Portugal: A Paradox in Productivity
Ricardo Pinheiro Alves
GEE, IADE-UE1
ABSTRACT
Portugal has a lower level of productivity than advanced economies but, paradoxically, the
recent improvement in several of its determinants did not lead to convergence in productivity
levels. The objective of this paper is to better understand the larger slowdown in productivity
growth in Portugal than the one occurring in those countries by considering its main
determinants. It presents a set of different reasons for the divergence with developed
economies since the mid-1990s that are associated with an increasing misallocation of capital,
labour and skills both at a sectoral and firm level. Moreover, it outlines some policy proposals
to enhance aggregate productivity growth in the Portuguese economy within a framework of
growing integration in global markets.
Portugal is experiencing a slowdown of pro-ductivity growth, similar to the one occurring inadvanced economies. Given that aggregate pro-ductivity growth is the main source of per capitaincome growth, this slowdown is associated witha slower improvement of living standards.A number of hypotheses do explain the pro-
ductivity slowdown: a decline in the birth rate ofinnovative firms able to deal with greater regula-tory complexity (OECD, 2015a); insufficientinvestment in infrastructure, equipment, R&Dand information and communication technol-ogy (ICT); weak aggregate demand (Sakellarisand Wilson, 2004; Jorgenson et al, 2008; Adler etal., 2017); a slower pace of technology diffusion(Andrews et al., 2015); non-competitive productmarkets and capital misallocation (Isaksson,2007; Dias et al., 2015); rigid labour markets andrapid ageing of the population leading to skills
and labour mismatches and insufficient knowl-edge-based and human capital accumulation(Bloom et al., 2012; Adler et al., 2017; Aiyar etal., 2016).In a neoclassical world, Portugal, poorer than
most developed economies, is expected to con-verge both in the level of productivity and in theaverage wealth of the population. That was thegoal when Portugal became a European Com-munity member.The objective of this article is to understand
why this expected convergence has not hap-pened. The article consists of four sections. Thefirst section compares the recent evolution ofproductivity in Portugal and the most developedcountries, the EU core and G7, confirming thatthe Portuguese economy is falling behind inproductivity levels.2 The second section exam-ines the state of productivity determinants or
1 Ricardo Alves is the Director of Gabinete de Estratégia e Estudos (GEE) and Assistant Professor at Instituto de
Arte, Design e Empresa - Universidade Europeia (IADE-UE). This article does not necessarily represent the
views of these institutions. I thank Andrew Sharpe and two referees for their invaluable comments, sugges-
tions, references and editing help. I also thank Guida Nogueira for research assistance. Email:
2 EU core includes the following 15 countries that were members in 2003: Italy, Belgium, The Netherlands,
Luxembourg, France, Germany, UK, Denmark, Ireland, Portugal, Spain, Finland, Sweden, Austria and
Greece. Exceptions are explicitly stated in the charts. For example, Luxembourg is only included for LP
but not in MFP. Austria and Greece are not included in both.
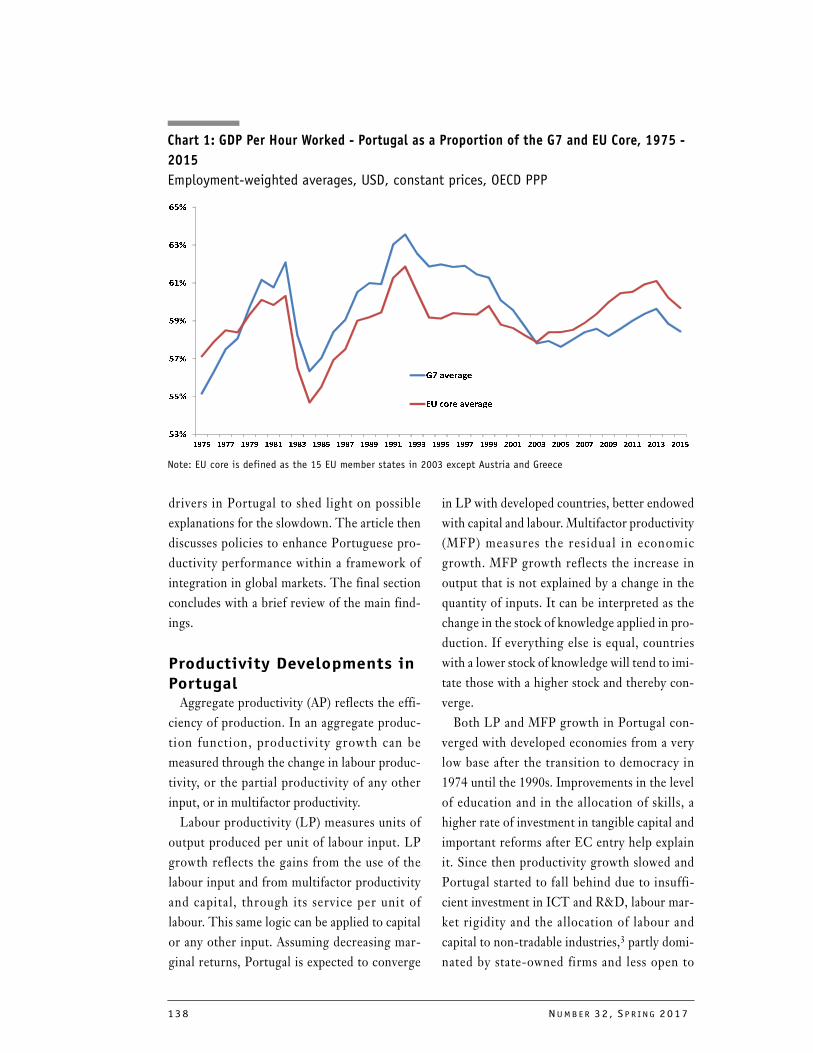
138 NU M B E R 32 , S P R I NG 2017
���
���
���
���
���
���
���
���� ���� ���� ���� ���� ���� ���� ���� ���� ���� ���� ���� ���� ���� ���� ���� ���� ���� ���� ���� ����
���� ��
���� ��� ��
Chart 1: GDP Per Hour Worked - Portugal as a Proportion of the G7 and EU Core, 1975 -
2015
Employment-weighted averages, USD, constant prices, OECD PPP
Note: EU core is defined as the 15 EU member states in 2003 except Austria and Greece
drivers in Portugal to shed light on possibleexplanations for the slowdown. The article thendiscusses policies to enhance Portuguese pro-ductivity performance within a framework ofintegration in global markets. The final sectionconcludes with a brief review of the main find-ings.
Productivity Developments in PortugalAggregate productivity (AP) reflects the effi-
ciency of production. In an aggregate produc-tion function, productivity growth can bemeasured through the change in labour produc-tivity, or the partial productivity of any otherinput, or in multifactor productivity.Labour productivity (LP) measures units of
output produced per unit of labour input. LPgrowth reflects the gains from the use of thelabour input and from multifactor productivityand capital, through its service per unit oflabour. This same logic can be applied to capitalor any other input. Assuming decreasing mar-ginal returns, Portugal is expected to converge
in LP with developed countries, better endowedwith capital and labour. Multifactor productivity(MFP) measures the residual in economicgrowth. MFP growth reflects the increase inoutput that is not explained by a change in thequantity of inputs. It can be interpreted as thechange in the stock of knowledge applied in pro-duction. If everything else is equal, countrieswith a lower stock of knowledge will tend to imi-tate those with a higher stock and thereby con-verge.Both LP and MFP growth in Portugal con-
verged with developed economies from a verylow base after the transition to democracy in1974 until the 1990s. Improvements in the levelof education and in the allocation of skills, ahigher rate of investment in tangible capital andimportant reforms after EC entry help explainit. Since then productivity growth slowed andPortugal started to fall behind due to insuffi-cient investment in ICT and R&D, labour mar-ket rigidity and the allocation of labour andcapital to non-tradable industries,3 partly domi-nated by state-owned firms and less open to
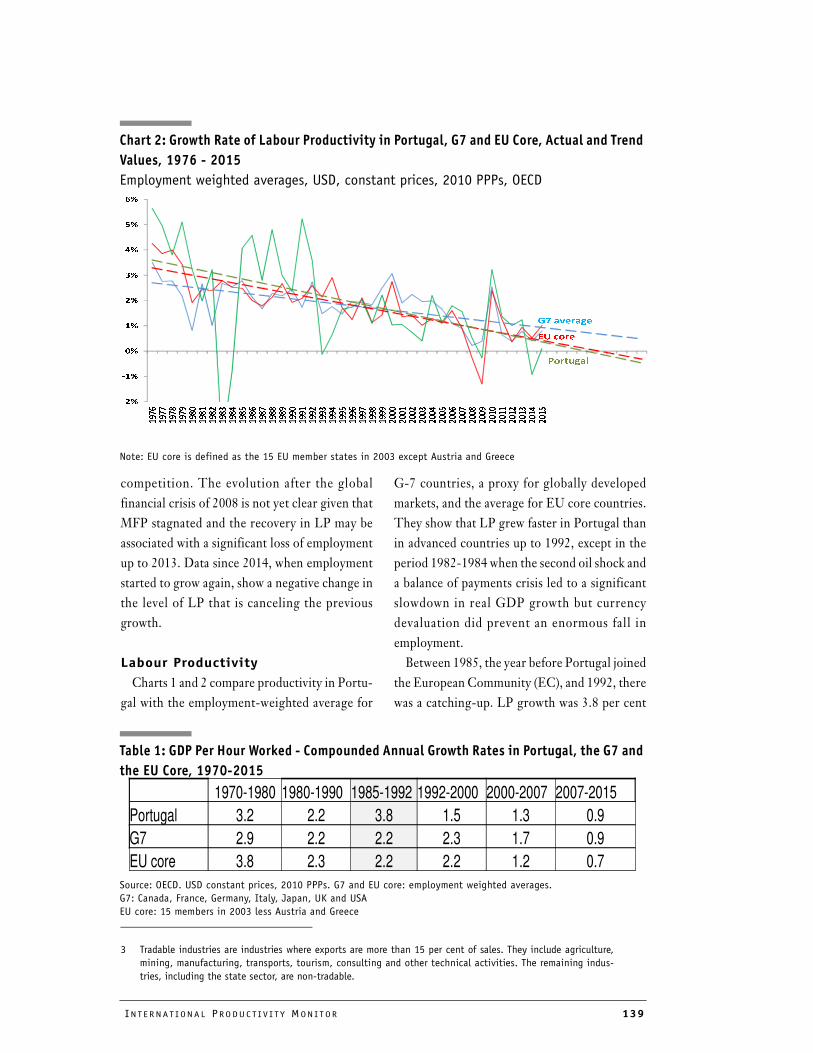
INT E R N A T I ON A L PRO DU C T I V I T Y MON I T OR 139
���
���
��
��
��
��
��
��
�
�
�
�
�
�
�
�
�
�
�
�
�
�
�
�
�
�
�
�
�
�
�
�
�
�
�
�
�
�
�
�
�
�
�
�
�
�
�
�
�
�
�
�
�
�
�
�
�
�
�
�
�
�
�
�
�
�
�
�
�
�
�
�
�
�
�
�
�
�
�
�
�
�
�
�
�
�
�
�
�
�
�
�
�
�
�
�
�
�
�
�
�
�
�
�
�
�
�
�
�
�
�
�
�
�
�
�
�
�
�
�
�
�
�
�
�
�
�
�
�
�
�
�
�
�
�
�
�
�
�
�
�
�
�
�
�
�
�
�
�
�
�
�
�
�
�
�
�
�
�
�
�
��������
��� ���
������
1970-1980 1980-1990 1985-1992 1992-2000 2000-2007 2007-2015
Portugal 3.2 2.2 3.8 1.5 1.3 0.9
G7 2.9 2.2 2.2 2.3 1.7 0.9
EU core 3.8 2.3 2.2 2.2 1.2 0.7
Chart 2: Growth Rate of Labour Productivity in Portugal, G7 and EU Core, Actual and Trend
Values, 1976 - 2015
Employment weighted averages, USD, constant prices, 2010 PPPs, OECD
Note: EU core is defined as the 15 EU member states in 2003 except Austria and Greece
competition. The evolution after the globalfinancial crisis of 2008 is not yet clear given thatMFP stagnated and the recovery in LP may beassociated with a significant loss of employmentup to 2013. Data since 2014, when employmentstarted to grow again, show a negative change inthe level of LP that is canceling the previousgrowth.
Labour Productivity
Charts 1 and 2 compare productivity in Portu-gal with the employment-weighted average for
G-7 countries, a proxy for globally developedmarkets, and the average for EU core countries.They show that LP grew faster in Portugal thanin advanced countries up to 1992, except in theperiod 1982-1984 when the second oil shock anda balance of payments crisis led to a significantslowdown in real GDP growth but currencydevaluation did prevent an enormous fall inemployment. Between 1985, the year before Portugal joined
the European Community (EC), and 1992, therewas a catching-up. LP growth was 3.8 per cent
3 Tradable industries are industries where exports are more than 15 per cent of sales. They include agriculture,
mining, manufacturing, transports, tourism, consulting and other technical activities. The remaining indus-
tries, including the state sector, are non-tradable.
Table 1: GDP Per Hour Worked - Compounded Annual Growth Rates in Portugal, the G7 and
the EU Core, 1970-2015
Source: OECD. USD constant prices, 2010 PPPs. G7 and EU core: employment weighted averages.
G7: Canada, France, Germany, Italy, Japan, UK and USA
EU core: 15 members in 2003 less Austria and Greece
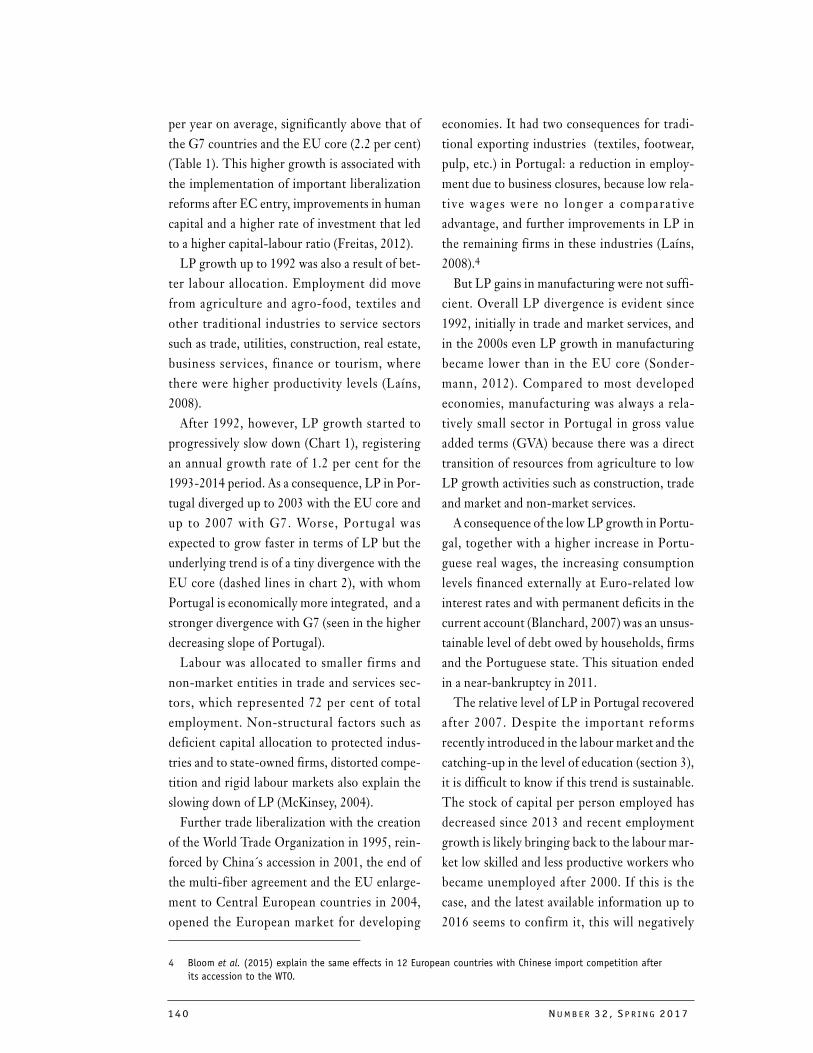
140 NU M B E R 32 , S P R I NG 2017
per year on average, significantly above that ofthe G7 countries and the EU core (2.2 per cent)(Table 1). This higher growth is associated withthe implementation of important liberalizationreforms after EC entry, improvements in humancapital and a higher rate of investment that ledto a higher capital-labour ratio (Freitas, 2012). LP growth up to 1992 was also a result of bet-
ter labour allocation. Employment did movefrom agriculture and agro-food, textiles andother traditional industries to service sectorssuch as trade, utilities, construction, real estate,business services, finance or tourism, wherethere were higher productivity levels (Laíns,2008). After 1992, however, LP growth started to
progressively slow down (Chart 1), registeringan annual growth rate of 1.2 per cent for the1993-2014 period. As a consequence, LP in Por-tugal diverged up to 2003 with the EU core andup to 2007 with G7. Worse, Portugal wasexpected to grow faster in terms of LP but theunderlying trend is of a tiny divergence with theEU core (dashed lines in chart 2), with whomPortugal is economically more integrated, and astronger divergence with G7 (seen in the higherdecreasing slope of Portugal).Labour was allocated to smaller firms and
non-market entities in trade and services sec-tors, which represented 72 per cent of totalemployment. Non-structural factors such asdeficient capital allocation to protected indus-tries and to state-owned firms, distorted compe-tition and rigid labour markets also explain theslowing down of LP (McKinsey, 2004).Further trade liberalization with the creation
of the World Trade Organization in 1995, rein-forced by China´s accession in 2001, the end ofthe multi-fiber agreement and the EU enlarge-ment to Central European countries in 2004,opened the European market for developing
economies. It had two consequences for tradi-tional exporting industries (textiles, footwear,pulp, etc.) in Portugal: a reduction in employ-ment due to business closures, because low rela-tive wages were no longer a comparat iveadvantage, and further improvements in LP inthe remaining firms in these industries (Laíns,2008).4 But LP gains in manufacturing were not suffi-
cient. Overall LP divergence is evident since1992, initially in trade and market services, andin the 2000s even LP growth in manufacturingbecame lower than in the EU core (Sonder-mann, 2012). Compared to most developedeconomies, manufacturing was always a rela-tively small sector in Portugal in gross valueadded terms (GVA) because there was a directtransition of resources from agriculture to lowLP growth activities such as construction, tradeand market and non-market services.A consequence of the low LP growth in Portu-
gal, together with a higher increase in Portu-guese real wages, the increasing consumptionlevels financed externally at Euro-related lowinterest rates and with permanent deficits in thecurrent account (Blanchard, 2007) was an unsus-tainable level of debt owed by households, firmsand the Portuguese state. This situation endedin a near-bankruptcy in 2011.The relative level of LP in Portugal recovered
after 2007. Despite the important reformsrecently introduced in the labour market and thecatching-up in the level of education (section 3),it is difficult to know if this trend is sustainable.The stock of capital per person employed hasdecreased since 2013 and recent employmentgrowth is likely bringing back to the labour mar-ket low skilled and less productive workers whobecame unemployed after 2000. If this is thecase, and the latest available information up to2016 seems to confirm it, this will negatively
4 Bloom et al. (2015) explain the same effects in 12 European countries with Chinese import competition after
its accession to the WTO.
INT E R N A T I ON A L PRO DU C T I V I T Y MON I T OR 141
1995-2000 2000-2010 2010-2013
Portugal 0.7 0.0 0.0
EU core* 1.3 0.4 0.1
G7 1.1 0.4 0.3
Chart 3: Multifactor Productivity Growth - Portugal, EU Core and G7, 1995 - 2013
1995 = 100, OECD
EU core: 15 members in 2003 less Austria, Luxembourg and Greece
Table 2: Multifactor Productivity - Compounded Annual Growth Rates in Portugal, the G7
and the EU Core, 1995-2013
Yearly compounded growth rates
Source: OECD.stat
EU Core: (the above EU countries and Belgium, Denmark, Finland, Ireland, Spain, The Netherlands and Sweden).
Unavailable data for Greece, Austria and Luxembourg.
affect LP growth in the near future and rein-force its decreasing trend.
Multifactor Productivity
Multifactor productivity (MFP) growth wasalso higher in Portugal than in most other devel-oped economies between the 1970s and thebeginning of the 1990s. According to Eckaus(2008), the average annual growth rate of MFPin Portugal was 0.4 percentage points higherthan in the EU core between 1975 and 1985 and2.1 points higher between 1985 and 1990. After1990, the rate of growth fell off but it was stillabove the EU core average by 0.2 points in
1990-1995. Throughout this period MFP inPortugal also grew faster than in the UnitedStates and Japan. Eckaus explains this situation through catch-
up from a very low base, improvements inhuman capital due to a doubling of the averageyears of education for the working age popula-tion, and foreign investment (both private andEU funds) in non-traditional sectors such as theauto industry and ICT sector. Liberalizationreforms after the entry to the EC in 1986 mostprobably helped. However, MFP growth slowed at the end of
the 1990s,5 falling below that of the G7 and EU
142 NU M B E R 32 , S P R I NG 2017
core countries (Chart 3 and Table 2). Multifac-tor productivity grew by 0.2 per cent per yearbetween 1995 and 2013, with no growthbetween 1999 and 2013. Portugal was not con-verging in MFP with most advanced countries.Balta and Mohl (2014), using a different
methodology, find that the TFP-based techno-logical gap between advanced and "laggard"economies (Portugal, Spain and Italy) within theEuro area persisted or widened (depending onthe industries) in the decade preceding the glo-bal financial crisis. In some non-tradable indus-tries (utilities, construction and some services)that grew substantially in Portugal during thisperiod, there was even negative MFP growthpartly due to insufficient investment in R&Dand ICT, or, during the crisis, due to capital mis-allocation (Gopinath et al., 2017).The insufficient investment in intangibles is
consistent with the consumption-based modelof economic growth in Portugal after 1995. Anexternal inflow of money associated with lowinterest rates from Euro membership, togetherwith wage growth in non-tradable sectors, led togrowing consumption levels. This situation inturn led to a deterioration in the current accountand a substantial increase in external debt.Resources were misallocated to non-tradableand protected industries where MFP declinedand total investment was not boosted by thesurge in domestic demand (Reis, 2013). Theshare of GVA in wholesale and retail trade, stateservices and construction was, in 2000, morethan 10 percentage points greater in Portugalthan in the Euro core countries.
Distributional Features
In OECD countries, the productivity growthslowdown is associated with a widening disper-sion of productivity gains in each sector and withhigher wage dispersion (Berlingieri et al, 2017;Andrews et al., 2015). Neo-Schumpeteriangrowth theory states that firms at the frontierare able to innovate and adopt new technologiesand knowledge, thus maintaining a higher rateof productivity growth. The remaining firms,however, may face a slowdown in productivitygrowth when there are frictions in technologyand innovation diffusion through learning orcatching-up. This is observed in many markets where the
effects of digital technologies and globalizationled to winner-take-most dynamics and is morepronounced in industries where recent productmarket reforms were less pro-competition, sug-gesting that policy decisions are limiting the dif-fusion process (Andrews et al, 2016).A question, then, is whether this is happening
in Portugal. Chart 4, based on the OECD´sMultiprod output shows the sectoral evolutionof the standard deviation of LP and MFP growthrates between 2004 and 2012. In most industriesa stabilization or a reduction in the dispersioncan be observed. The dispersion of LP growthrates in the manufacturing sector has increased,but that was not the case for MFP. The standarddeviation at a 3-digit industry level also showsstability in the degree of dispersion.6 An expla-nation would be that, in global terms, none ofthe Portuguese firms are at the global frontierand the data only compare firms at the nationalfrontier with the laggards, where productivityconvergence seems to be easier (Bartelsman etal., 2008). However, at least some Portuguese
5 From this point on these are OECD numbers, while those presented in Eckaus (2008) are estimates for the EC.
6 With certain exceptions the industries where an increase in the standard deviation includes: pharmaceu-
tical products, chemicals, wood and paper, rubber and plastics, electrical equipment, furniture, accommo-
dation and food services, legal and accounting services, and advertising and market research. Industries
with a decrease include: computers, electronic and optical products, publishing, audiovisual and broad-
casting activities, IT, electricity and gas, real estate, and telecommunications.
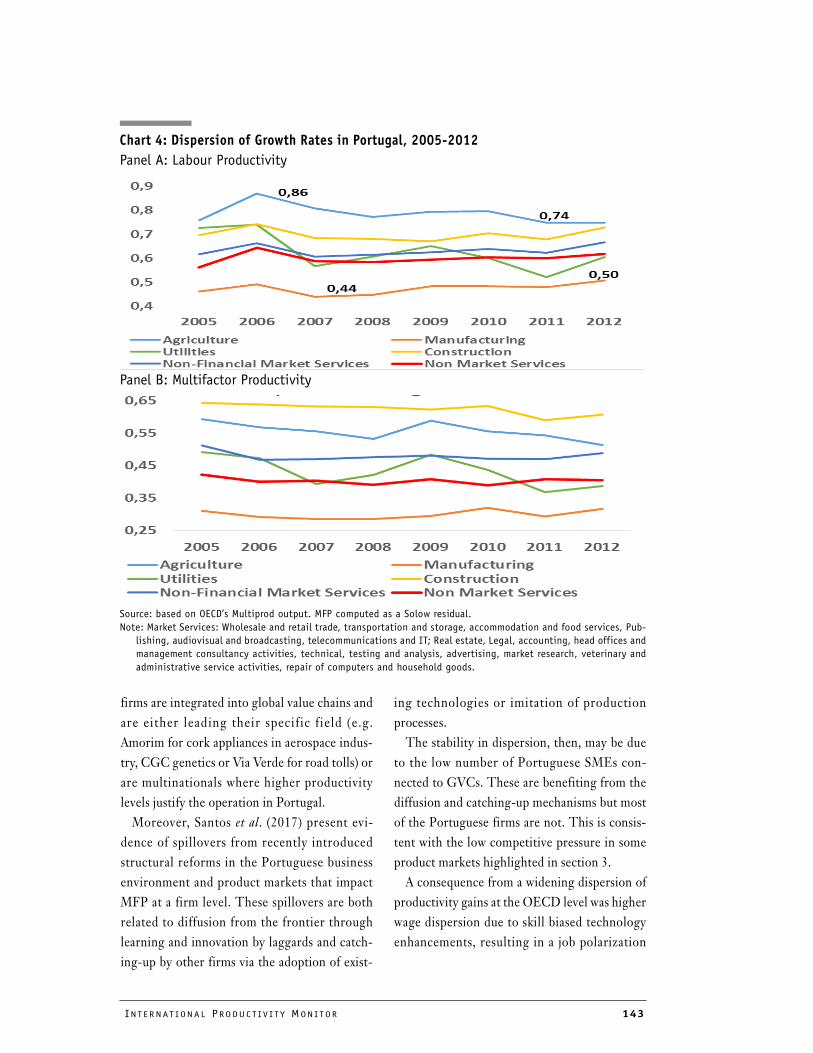
INT E R N A T I ON A L PRO DU C T I V I T Y MON I T OR 143
Panel B: Multifactor Productivity
Source: based on OECD’s Multiprod output. MFP computed as a Solow residual.
Note: Market Services: Wholesale and retail trade, transportation and storage, accommodation and food services, Pub-
lishing, audiovisual and broadcasting, telecommunications and IT; Real estate, Legal, accounting, head offices and
management consultancy activities, technical, testing and analysis, advertising, market research, veterinary and
administrative service activities, repair of computers and household goods.
firms are integrated into global value chains andare either leading their specific field (e.g.Amorim for cork appliances in aerospace indus-try, CGC genetics or Via Verde for road tolls) orare multinationals where higher productivitylevels justify the operation in Portugal. Moreover, Santos et al. (2017) present evi-
dence of spillovers from recently introducedstructural reforms in the Portuguese businessenvironment and product markets that impactMFP at a firm level. These spillovers are bothrelated to diffusion from the frontier throughlearning and innovation by laggards and catch-ing-up by other firms via the adoption of exist-
ing technologies or imitation of productionprocesses. The stability in dispersion, then, may be due
to the low number of Portuguese SMEs con-nected to GVCs. These are benefiting from thediffusion and catching-up mechanisms but mostof the Portuguese firms are not. This is consis-tent with the low competitive pressure in someproduct markets highlighted in section 3.A consequence from a widening dispersion of
productivity gains at the OECD level was higherwage dispersion due to skill biased technologyenhancements, resulting in a job polarization
Chart 4: Dispersion of Growth Rates in Portugal, 2005-2012
Panel A: Labour Productivity
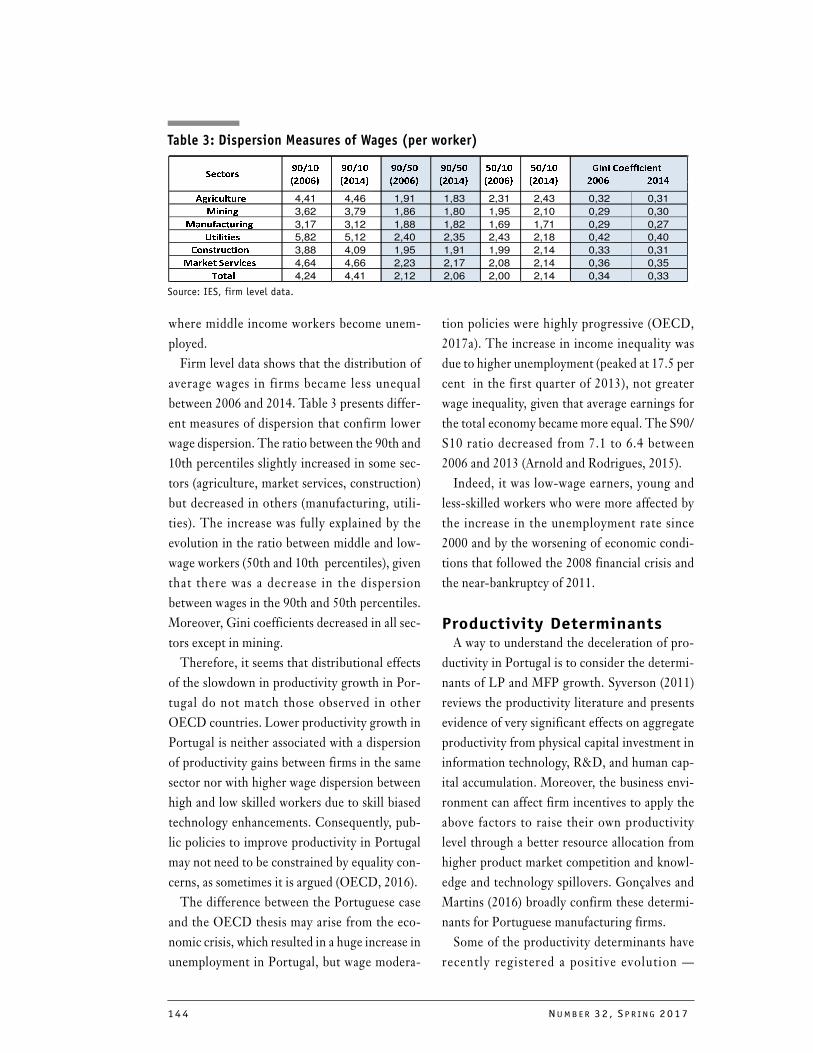
144 NU M B E R 32 , S P R I NG 2017
���������� 4,41 4,46 1,91 1,83 2,31 2,43 0,32 0,31
����� 3,62 3,79 1,86 1,80 1,95 2,10 0,29 0,30
��� �������� 3,17 3,12 1,88 1,82 1,69 1,71 0,29 0,27
�������� 5,82 5,12 2,40 2,35 2,43 2,18 0,42 0,40
������������ 3,88 4,09 1,95 1,91 1,99 2,14 0,33 0,31
������������ 4,64 4,66 2,23 2,17 2,08 2,14 0,36 0,35
����� 4,24 4,41 2,12 2,06 2,00 2,14 0,34 0,33
�����
������
�����
������
������ �����
����
������
!����
������
!����
������
!����
������
!����
����������
where middle income workers become unem-ployed. Firm level data shows that the distribution of
average wages in firms became less unequalbetween 2006 and 2014. Table 3 presents differ-ent measures of dispersion that confirm lowerwage dispersion. The ratio between the 90th and10th percentiles slightly increased in some sec-tors (agriculture, market services, construction)but decreased in others (manufacturing, utili-ties). The increase was fully explained by theevolution in the ratio between middle and low-wage workers (50th and 10th percentiles), giventhat there was a decrease in the dispersionbetween wages in the 90th and 50th percentiles.Moreover, Gini coefficients decreased in all sec-tors except in mining.Therefore, it seems that distributional effects
of the slowdown in productivity growth in Por-tugal do not match those observed in otherOECD countries. Lower productivity growth inPortugal is neither associated with a dispersionof productivity gains between firms in the samesector nor with higher wage dispersion betweenhigh and low skilled workers due to skill biasedtechnology enhancements. Consequently, pub-lic policies to improve productivity in Portugalmay not need to be constrained by equality con-cerns, as sometimes it is argued (OECD, 2016). The difference between the Portuguese case
and the OECD thesis may arise from the eco-nomic crisis, which resulted in a huge increase inunemployment in Portugal, but wage modera-
tion policies were highly progressive (OECD,2017a). The increase in income inequality wasdue to higher unemployment (peaked at 17.5 percent in the first quarter of 2013), not greaterwage inequality, given that average earnings forthe total economy became more equal. The S90/S10 ratio decreased from 7.1 to 6.4 between2006 and 2013 (Arnold and Rodrigues, 2015).Indeed, it was low-wage earners, young and
less-skilled workers who were more affected bythe increase in the unemployment rate since2000 and by the worsening of economic condi-tions that followed the 2008 financial crisis andthe near-bankruptcy of 2011.
Productivity DeterminantsA way to understand the deceleration of pro-
ductivity in Portugal is to consider the determi-nants of LP and MFP growth. Syverson (2011)reviews the productivity literature and presentsevidence of very significant effects on aggregateproductivity from physical capital investment ininformation technology, R&D, and human cap-ital accumulation. Moreover, the business envi-ronment can affect firm incentives to apply theabove factors to raise their own productivitylevel through a better resource allocation fromhigher product market competition and knowl-edge and technology spillovers. Gonçalves andMartins (2016) broadly confirm these determi-nants for Portuguese manufacturing firms. Some of the productivity determinants have
recently registered a positive evolution —
Table 3: Dispersion Measures of Wages (per worker)
Source: IES, firm level data.
INT E R N A T I ON A L PRO DU C T I V I T Y MON I T OR 145
investment in R&D, ICT capital growth, formaleducation, birth rate of new firms or increasingintegration on global markets. Thus, other rea-sons must explain why Portugal is not converg-ing in terms of productivity.
Investment in Equipment and
Infrastructure
Portugal benefited from a huge inflow of for-eign capital after EC entry in 1986. Thisincluded both private and official EU funds, andpurely financial and FDI flows and it resulted inan increase in the net stock of capital per personemployed. According to OECD data, the inflowresulted in capital intensity growth of 4.6 percent per year between 1995 and 2013, signifi-cantly above the EU core (2.7 per cent) and G7(2.4 per cent) averages.7 However, this growth in capital intensity was
accompanied by a decrease in both LP and MFPgrowth rates, as noted earlier in the article. Cap-ital services from this inflow appear not to havebeen of a sufficiently "high quality" nature tohave had a significant positive impact on pro-ductivity (e.g. Sakellaris and Wilson, 2004).Capital productivity fell 46 per cent in Portugalbetween 1995 and 2013.8 The unproductive use of capital in the Portu-
guese economy i s a l so conf irmed by thedecreased, almost to nil, of the capital perworker contribution to trend labour productiv-ity growth (adjusted for cyclical effects) in Por-tugal between 2000 and 2015 (Ollivaud et al.,2016).The weak effect of this capital inflow on pro-
ductivity is unexpected given the low relativelevel of capital per worker in Portugal, half ofthe EU15 core. But capital misallocation and
excessive consumption of imported goods andservices explain this situation. A between-sector misallocation of capital
since the 1990s can be seen in the growth ofnon-tradable sectors and in investment in infra-structure and housing. Reis (2013) hypothesizesthat the financial integration after 1995 was notreflected in ‘financial deepening‘ in the tradablesector but through the expansion of less produc-tive private and state firms in the non-tradablesector. Indeed, a significant part of capital was chan-
neled to state and/or ‘protected’ industries suchas wholesale and retail trade, real estate or con-struction, which registered higher profits butlower LP (OECD productivity indicators). Moreover, there was considerable investment
in infrastructure and housing during the 1990s,when the stock of capital in structures was 257per cent of GDP while the stock of transporta-tion and other equipment was only 78 per centof GDP. This difference, although partiallyreflecting the longer life-time of structures,shows that investment in Portugal was too con-centrated. Even when capital inflows started toslow down after 2000, structures still repre-sented 60 per cent of total new investment, wellabove other EU countries and despite the dubi-ous economic (but not political) rationale forsuch investment. The construction sector repre-sented 11.5 per cent of total employment in2000, well above that of the EU core countries(6.2 per cent). For example, part of a third high-way between Lisbon and Porto (urban areas with2.8 and 3.6 million people, respectively) wasbuilt, when the second highway had a very lowlevel of traffic. Many road investments weremade under badly negotiated public-private
7 Capital intensity is the ratio of capital services (the flow of productive services that capital delivers in pro-
duction) per hour worked.
8 Capital productivity is measured as the ratio between the volume of GDP and the volume of capital input,
defined as the flow of capital services. Capital services are estimated by the OECD using the rate of
change of the productive capital stock, which considers the reduction in the productive capacity of fixed
capital assets. A common computation method for all countries ensures comparability.
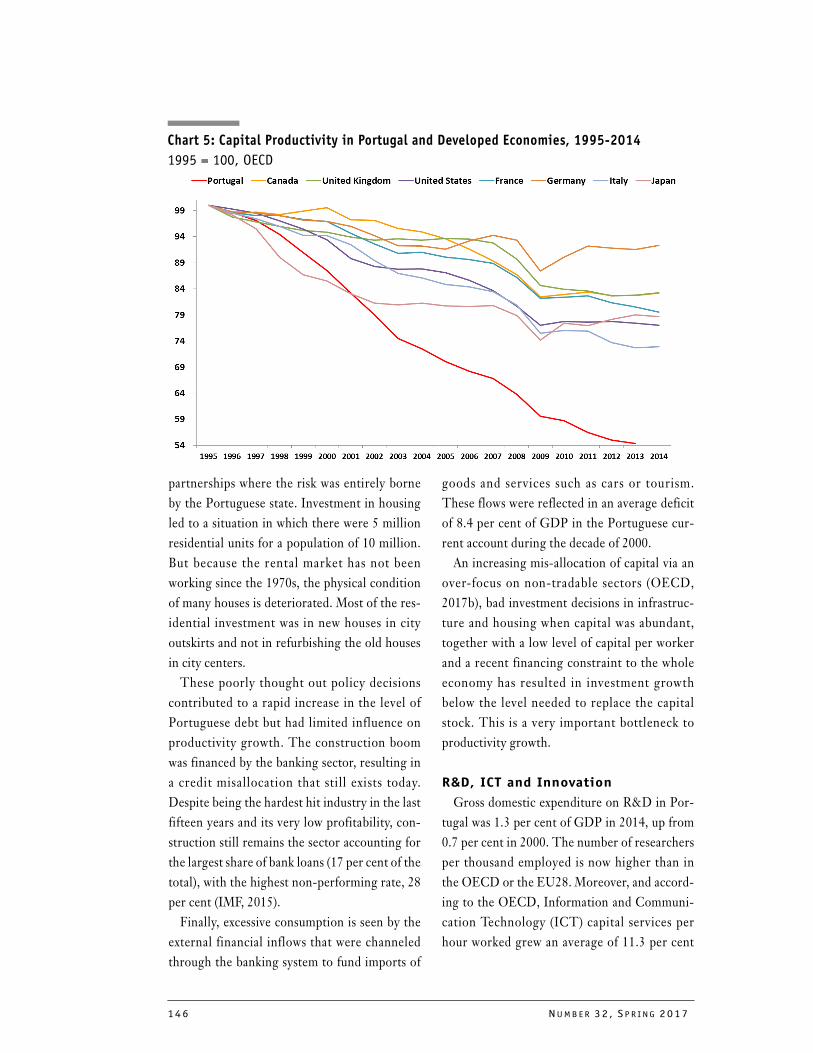
146 NU M B E R 32 , S P R I NG 2017
partnerships where the risk was entirely borneby the Portuguese state. Investment in housingled to a situation in which there were 5 millionresidential units for a population of 10 million.But because the rental market has not beenworking since the 1970s, the physical conditionof many houses is deteriorated. Most of the res-idential investment was in new houses in cityoutskirts and not in refurbishing the old housesin city centers. These poorly thought out policy decisions
contributed to a rapid increase in the level ofPortuguese debt but had limited influence onproductivity growth. The construction boomwas financed by the banking sector, resulting ina credit misallocation that still exists today.Despite being the hardest hit industry in the lastfifteen years and its very low profitability, con-struction still remains the sector accounting forthe largest share of bank loans (17 per cent of thetotal), with the highest non-performing rate, 28per cent (IMF, 2015).Finally, excessive consumption is seen by the
external financial inflows that were channeledthrough the banking system to fund imports of
goods and services such as cars or tourism.These flows were reflected in an average deficitof 8.4 per cent of GDP in the Portuguese cur-rent account during the decade of 2000.An increasing mis-allocation of capital via an
over-focus on non-tradable sectors (OECD,2017b), bad investment decisions in infrastruc-ture and housing when capital was abundant,together with a low level of capital per workerand a recent financing constraint to the wholeeconomy has resulted in investment growthbelow the level needed to replace the capitalstock. This is a very important bottleneck toproductivity growth.
R&D, ICT and Innovation
Gross domestic expenditure on R&D in Por-tugal was 1.3 per cent of GDP in 2014, up from0.7 per cent in 2000. The number of researchersper thousand employed is now higher than inthe OECD or the EU28. Moreover, and accord-ing to the OECD, Information and Communi-cation Technology (ICT) capital services perhour worked grew an average of 11.3 per cent
Chart 5: Capital Productivity in Portugal and Developed Economies, 1995-2014
1995 = 100, OECD
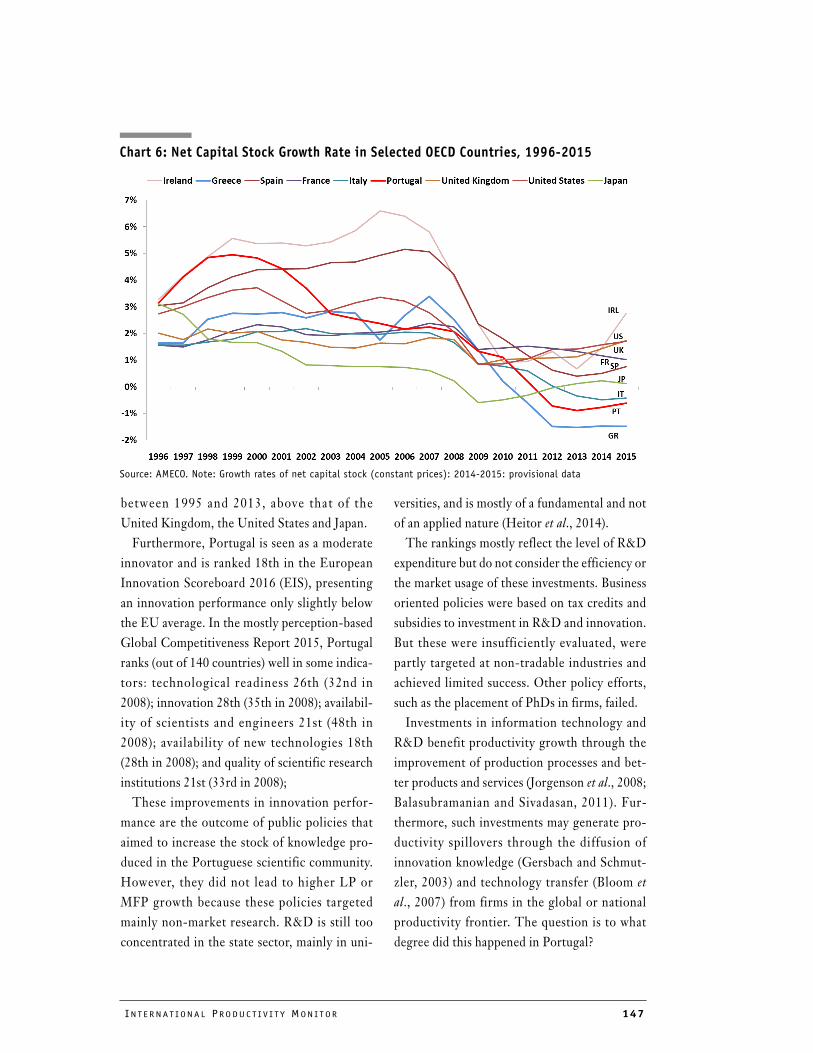
INT E R N A T I ON A L PRO DU C T I V I T Y MON I T OR 147
Chart 6: Net Capital Stock Growth Rate in Selected OECD Countries, 1996-2015
Source: AMECO. Note: Growth rates of net capital stock (constant prices): 2014-2015: provisional data
between 1995 and 2013, above that of theUnited Kingdom, the United States and Japan.Furthermore, Portugal is seen as a moderate
innovator and is ranked 18th in the EuropeanInnovation Scoreboard 2016 (EIS), presentingan innovation performance only slightly belowthe EU average. In the mostly perception-basedGlobal Competitiveness Report 2015, Portugalranks (out of 140 countries) well in some indica-tors: technological readiness 26th (32nd in2008); innovation 28th (35th in 2008); availabil-ity of scientists and engineers 21st (48th in2008); availability of new technologies 18th(28th in 2008); and quality of scientific researchinstitutions 21st (33rd in 2008); These improvements in innovation perfor-
mance are the outcome of public policies thataimed to increase the stock of knowledge pro-duced in the Portuguese scientific community.However, they did not lead to higher LP orMFP growth because these policies targetedmainly non-market research. R&D is still tooconcentrated in the state sector, mainly in uni-
versities, and is mostly of a fundamental and notof an applied nature (Heitor et al., 2014).The rankings mostly reflect the level of R&D
expenditure but do not consider the efficiency orthe market usage of these investments. Businessoriented policies were based on tax credits andsubsidies to investment in R&D and innovation.But these were insufficiently evaluated, werepartly targeted at non-tradable industries andachieved limited success. Other policy efforts,such as the placement of PhDs in firms, failed. Investments in information technology and
R&D benefit productivity growth through theimprovement of production processes and bet-ter products and services (Jorgenson et al., 2008;Balasubramanian and Sivadasan, 2011). Fur-thermore, such investments may generate pro-ductivity spillovers through the diffusion ofinnovation knowledge (Gersbach and Schmut-zler, 2003) and technology transfer (Bloom etal., 2007) from firms in the global or nationalproductivity frontier. The question is to whatdegree did this happened in Portugal?
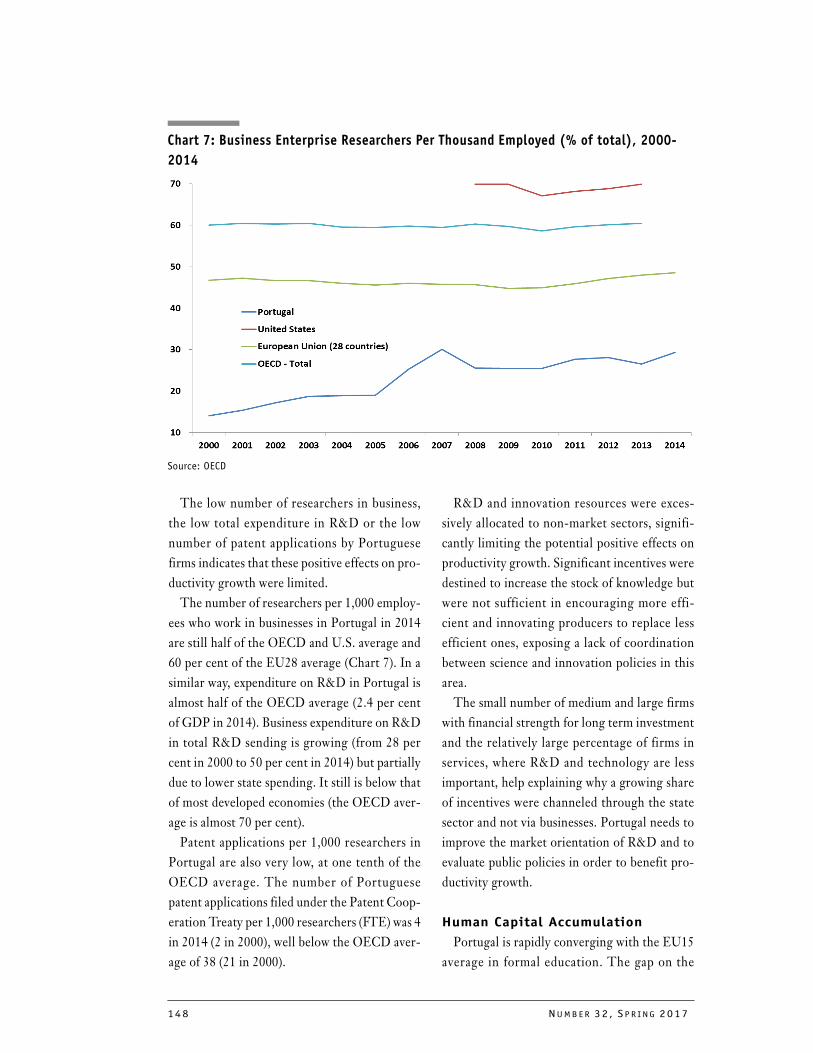
148 NU M B E R 32 , S P R I NG 2017
The low number of researchers in business,the low total expenditure in R&D or the lownumber of patent applications by Portuguesefirms indicates that these positive effects on pro-ductivity growth were limited. The number of researchers per 1,000 employ-
ees who work in businesses in Portugal in 2014are still half of the OECD and U.S. average and60 per cent of the EU28 average (Chart 7). In asimilar way, expenditure on R&D in Portugal isalmost half of the OECD average (2.4 per centof GDP in 2014). Business expenditure on R&Din total R&D sending is growing (from 28 percent in 2000 to 50 per cent in 2014) but partiallydue to lower state spending. It still is below thatof most developed economies (the OECD aver-age is almost 70 per cent). Patent applications per 1,000 researchers in
Portugal are also very low, at one tenth of theOECD average. The number of Portuguesepatent applications filed under the Patent Coop-eration Treaty per 1,000 researchers (FTE) was 4in 2014 (2 in 2000), well below the OECD aver-age of 38 (21 in 2000).
R&D and innovation resources were exces-sively allocated to non-market sectors, signifi-cantly limiting the potential positive effects onproductivity growth. Significant incentives weredestined to increase the stock of knowledge butwere not sufficient in encouraging more effi-cient and innovating producers to replace lessefficient ones, exposing a lack of coordinationbetween science and innovation policies in thisarea.The small number of medium and large firms
with financial strength for long term investmentand the relatively large percentage of firms inservices, where R&D and technology are lessimportant, help explaining why a growing shareof incentives were channeled through the statesector and not via businesses. Portugal needs toimprove the market orientation of R&D and toevaluate public policies in order to benefit pro-ductivity growth.
Human Capital Accumulation
Portugal is rapidly converging with the EU15average in formal education. The gap on the
Chart 7: Business Enterprise Researchers Per Thousand Employed (% of total), 2000-
2014
Source: OECD
INT E R N A T I ON A L PRO DU C T I V I T Y MON I T OR 149
workforce with tertiary education was reducedby 5 percentage points in the last 15 years (to 8.2percentage points). In secondary education, 12years of formal education is legally required inPortugal. The recent results of PISA andTIMSS tests show that this convergence is notonly a question of formal educational attainmentbut also of educational performance. However, this convergence in education
attainment toward the EU average coincidedwith the slowing down of productivity growth.Human capital accumulation aris ing fromincreased education and training is expected toacce lerate LP and MFP growth (Fox andSmeets, 2011). In the case of Portugal, it was notsufficient. Three reasons may explain why:wasted resources, poorly-aligned incentives andinsufficient policy evaluation.Primary and secondary education in Portugal
is still too centralized and schools have littleautonomy. Financing is too dependent on thestate and is not associated with school perfor-mance. Real expenditure grew by 33 per centsince 2008, the largest increase among OECDcountries except Turkey (OECD, 2016) .Because the number of students fell by 6 percent, the growth in expenditure per student waseven higher. Overall, Portugal has spent 6.1 percent of GDP in education in 2013 (4.6 per centin 2008), above the OECD average of 5.2 percent.An increase would be justifiable if the goal was
to improve adult education, where the gap ineducation is wider and long-term unemploy-ment is concentrated. But this seems not to bethe case because only 0.3 per cent of persons 25and over were enrolled in upper secondary edu-cation in 2014. Training and vocational programs oriented
toward the needs of employers improve skills ofemployees and help the unemployed re-enterthe labour market. But the effectiveness of thesepolicies varies considerably and has room for
improvement. The number of graduates in voca-tional programs is growing rapidly although it isstill below the OECD average. In 2014, 41 percent of 25-34 years-old with upper secondaryeducation had graduated from a vocational pro-gram, below the OECD average of 59 per cent(OECD, 2015b). The employment rate for thisgroup was around 80 per cent, indicating a highlevel of effectiveness. Training policies benefited from a recent
attempt to increase on-the-job training and tointegrate employers and other stakeholders intheir design. But although Portugal receivedfinancial support from the EU in the last 30years for these policies, their use was seldomduly evaluated, often resulting in a waste ofresources with no sustainable effects for thebeneficiaries. Poorly-aligned incentives do not help. Educa-
tion funds are allocated to the Ministry of Edu-cation while vocational and training funds aredivided between the Ministries of Education andLabour. In practical terms, several governmentbranches compete for these centrally managedfunds, presenting a long and often confusingrange of policy measures and programs. More-over, both unions and employers saw frequentlyEU funds as a way to finance their activities andgovernments usually felt obliged to spend themto avoid the perception of not taking advantageof their avai labil ity, independently of theexpected return. A second point is that employment-friendly
labour market institutions facilitate a bettermatching between supply and demand. Despiterecent improvements — the reduction in theregulatory differences between permanent andtemporary contracts and in severance payments,and a review of the definition of fair dismissal(OECD, 2017a) — Portugal still remains theOECD country with the strictest employmentprotection legislation for individual dismissals(OECD, 2017b).
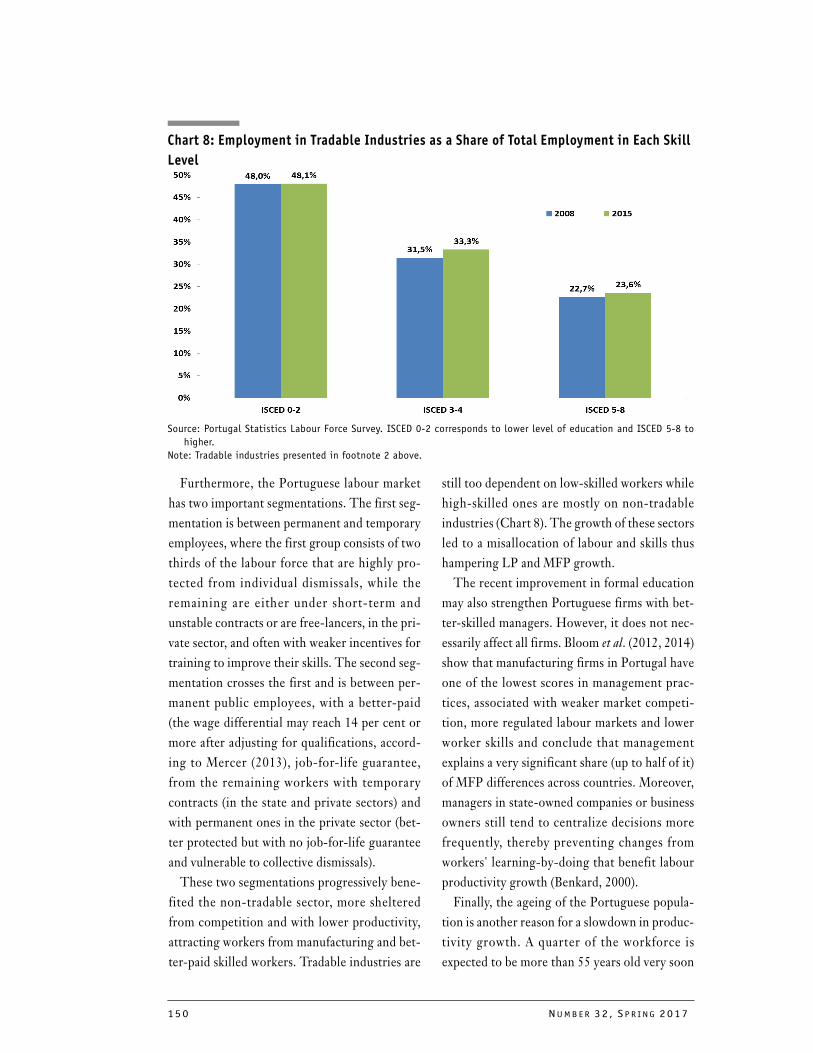
150 NU M B E R 32 , S P R I NG 2017
Furthermore, the Portuguese labour markethas two important segmentations. The first seg-mentation is between permanent and temporaryemployees, where the first group consists of twothirds of the labour force that are highly pro-tected from individual dismissals, while theremaining are either under short-term andunstable contracts or are free-lancers, in the pri-vate sector, and often with weaker incentives fortraining to improve their skills. The second seg-mentation crosses the first and is between per-manent public employees, with a better-paid(the wage differential may reach 14 per cent ormore after adjusting for qualifications, accord-ing to Mercer (2013), job-for-life guarantee,from the remaining workers with temporarycontracts (in the state and private sectors) andwith permanent ones in the private sector (bet-ter protected but with no job-for-life guaranteeand vulnerable to collective dismissals). These two segmentations progressively bene-
fited the non-tradable sector, more shelteredfrom competition and with lower productivity,attracting workers from manufacturing and bet-ter-paid skilled workers. Tradable industries are
still too dependent on low-skilled workers whilehigh-skilled ones are mostly on non-tradableindustries (Chart 8). The growth of these sectorsled to a misallocation of labour and skills thushampering LP and MFP growth.The recent improvement in formal education
may also strengthen Portuguese firms with bet-ter-skilled managers. However, it does not nec-essarily affect all firms. Bloom et al. (2012, 2014)show that manufacturing firms in Portugal haveone of the lowest scores in management prac-tices, associated with weaker market competi-tion, more regulated labour markets and lowerworker skills and conclude that managementexplains a very significant share (up to half of it)of MFP differences across countries. Moreover,managers in state-owned companies or businessowners still tend to centralize decisions morefrequently, thereby preventing changes fromworkers' learning-by-doing that benefit labourproductivity growth (Benkard, 2000).Finally, the ageing of the Portuguese popula-
tion is another reason for a slowdown in produc-tivity growth. A quarter of the workforce isexpected to be more than 55 years old very soon
Chart 8: Employment in Tradable Industries as a Share of Total Employment in Each Skill
Level
Source: Portugal Statistics Labour Force Survey. ISCED 0-2 corresponds to lower level of education and ISCED 5-8 to
higher.
Note: Tradable industries presented in footnote 2 above.
INT E R N A T I ON A L PRO DU C T I V I T Y MON I T OR 151
and this age group may be less able and willingto effectively use new technologies, dampeninginnovation. Aiyar et al. (2016) find Portugal asone of the worse affected countries by labourforce aging in terms of future MFP growth. Thisresult should be seen cautiously because it isassumed that human capital at that age will notimprove. However, the percentage of Portu-guese youth (20-24 years old) with a degree isnow similar to the EU15 average and, even if itwill take some time, the younger Portugueseworkers will be more productive when growingolder.The remarkable progress in formal education
in the last 15 years has been associated withwasted resources, non-aligned incentives andincreasing labour and skills misallocation tolow-productivity sectors due to double labourmarket segmentation. These must be improvedso that productivity growth can accelerate, evenwith an ageing population.
Business Dynamism
Policy incentives for new firms to be created,grow and thrive were in place for many years:venture capital, business angels, seed financingand an entrepreneurial ecosystem. These incen-tives were complemented by a friendly businessenvironment where new laws were implementedin a way intended not to be harmful for eco-nomic activity. Important legal simplificationsand cost reductions for the establishment of newfirms were implemented in the last 10 years thusreducing barriers to entry. Portugal was one of the countries with the
greatest improvement in OECD's Product Mar-ket Reforms indicator between 2008 and 2013.It now ranks 9th among the EU countries and12th out of 33 OECD countries. In a similarway, Portugal has the 25th most favourable busi-ness environment among 189 economies in theWorld Bank's Ease of Doing Business Index(World Bank, 2017)
Moreover, the country has a high birth rate offirms (number of new firms as a percentage ofexisting firms). In 2013, it was 14.3 per cent, thefourth highest among 26 European countries. Asin other countries, there is a on-going trendwhere young entrepreneurs create internet-based firms.The examples of business dynamism high-
lighted above may indicate that the Schumpet-erean process of creative destruction is in placein Portugal. However, its effects are not beingfelt in terms of productivity growth because twomain problems are affecting business dynamism.The first is that new Portuguese firms have
also a high mortality rate. Despite the high birthrate, the number of firms have decreased 4%between 2008 and 2012, recovering afterwards.This is not a problem if the new firms, with ahigher productivity level, are replacing old andstagnant ones. However, most of these start-upsare not able to grow. Between 2009 and 2013only 6 per cent of the Portuguese firms were lessthan 2 years old (OECD, 2017b). This requiresan evaluation of policy incentives. Moreover, half of the small firms are more
than 10 years old (OECD, 2017b) but some con-tinue to exist despite being in a near insolventsituation. In the period 2010-2014, 41 per centof Portuguese firms had interest payments thatexceeded the cash-flow they could generate in atleast one fiscal year. Around 20 per cent of firmspaid more in interest than the generated cash-flow in every one of those 5 years. Their sur-vival, even considering tax evasion, indicatesthat barriers to exit are more present than thehigh mortality rate might imply and confirm awithin-industry resource misallocation (Dias etal., 2015). Braguinsky et al. (2013) also show that Portu-
guese firms, in contrast to firms in other devel-oped countries, are even shrinking and thatseveral labour laws discriminate against mediumand large firms, a disincentive to grow. This
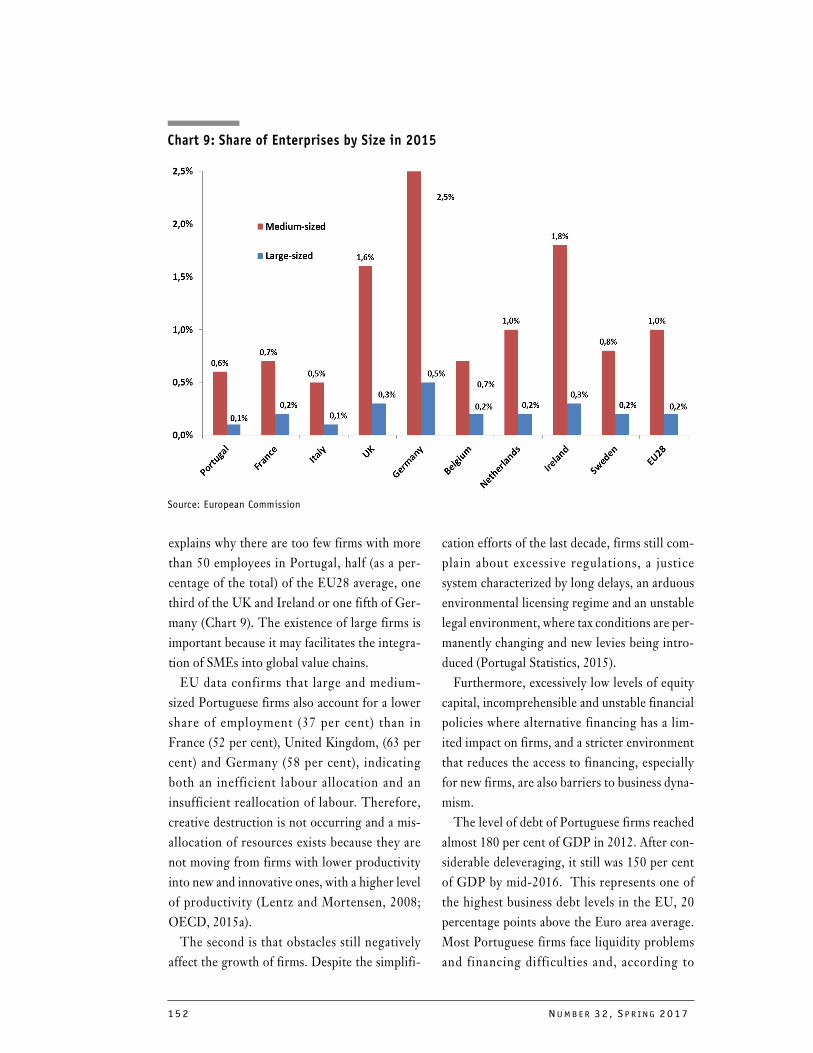
152 NU M B E R 32 , S P R I NG 2017
explains why there are too few firms with morethan 50 employees in Portugal, half (as a per-centage of the total) of the EU28 average, onethird of the UK and Ireland or one fifth of Ger-many (Chart 9). The existence of large firms isimportant because it may facilitates the integra-tion of SMEs into global value chains.EU data confirms that large and medium-
sized Portuguese firms also account for a lowershare of employment (37 per cent) than inFrance (52 per cent), United Kingdom, (63 percent) and Germany (58 per cent), indicatingboth an inefficient labour allocation and aninsufficient reallocation of labour. Therefore,creative destruction is not occurring and a mis-allocation of resources exists because they arenot moving from firms with lower productivityinto new and innovative ones, with a higher levelof productivity (Lentz and Mortensen, 2008;OECD, 2015a).The second is that obstacles still negatively
affect the growth of firms. Despite the simplifi-
cation efforts of the last decade, firms still com-plain about excessive regulations, a justicesystem characterized by long delays, an arduousenvironmental licensing regime and an unstablelegal environment, where tax conditions are per-manently changing and new levies being intro-duced (Portugal Statistics, 2015). Furthermore, excessively low levels of equity
capital, incomprehensible and unstable financialpolicies where alternative financing has a lim-ited impact on firms, and a stricter environmentthat reduces the access to financing, especiallyfor new firms, are also barriers to business dyna-mism. The level of debt of Portuguese firms reached
almost 180 per cent of GDP in 2012. After con-siderable deleveraging, it still was 150 per centof GDP by mid-2016. This represents one ofthe highest business debt levels in the EU, 20percentage points above the Euro area average.Most Portuguese firms face liquidity problemsand financing difficulties and, according to
Chart 9: Share of Enterprises by Size in 2015
Source: European Commission
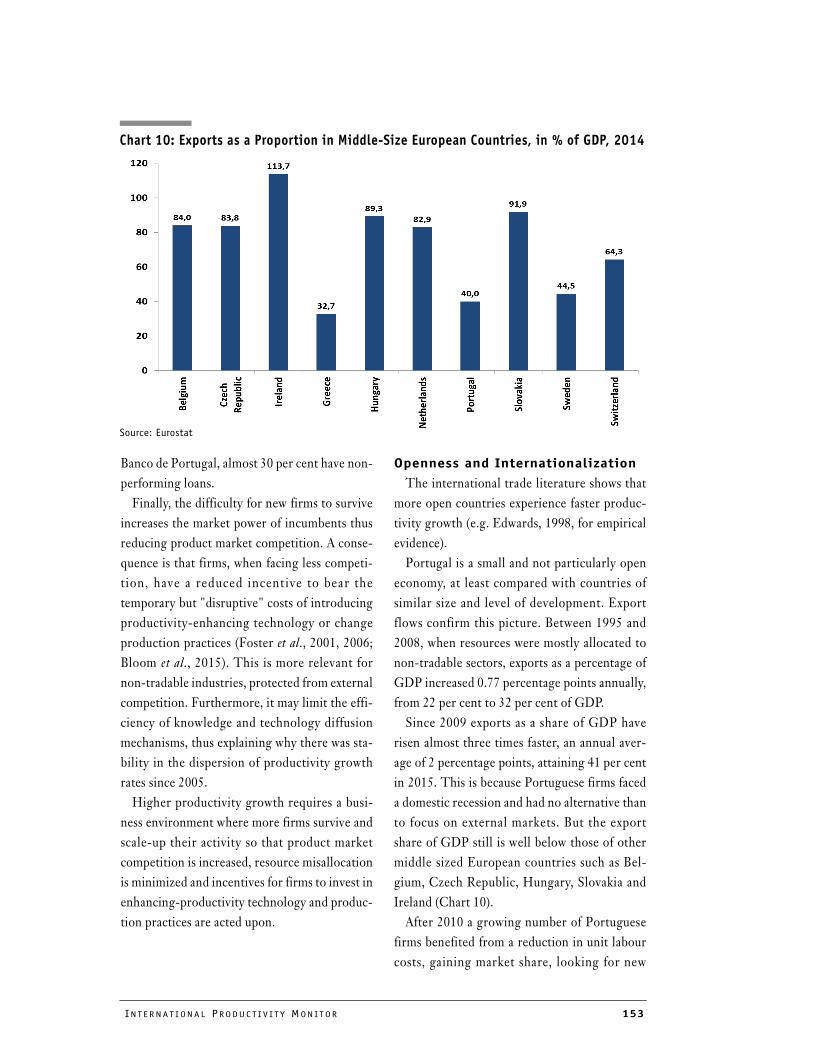
INT E R N A T I ON A L PRO DU C T I V I T Y MON I T OR 153
Banco de Portugal, almost 30 per cent have non-performing loans. Finally, the difficulty for new firms to survive
increases the market power of incumbents thusreducing product market competition. A conse-quence is that firms, when facing less competi-tion, have a reduced incentive to bear thetemporary but "disruptive" costs of introducingproductivity-enhancing technology or changeproduction practices (Foster et al., 2001, 2006;Bloom et al., 2015). This is more relevant fornon-tradable industries, protected from externalcompetition. Furthermore, it may limit the effi-ciency of knowledge and technology diffusionmechanisms, thus explaining why there was sta-bility in the dispersion of productivity growthrates since 2005.Higher productivity growth requires a busi-
ness environment where more firms survive andscale-up their activity so that product marketcompetition is increased, resource misallocationis minimized and incentives for firms to invest inenhancing-productivity technology and produc-tion practices are acted upon.
Openness and Internationalization
The international trade literature shows thatmore open countries experience faster produc-tivity growth (e.g. Edwards, 1998, for empiricalevidence).Portugal is a small and not particularly open
economy, at least compared with countries ofsimilar size and level of development. Exportflows confirm this picture. Between 1995 and2008, when resources were mostly allocated tonon-tradable sectors, exports as a percentage ofGDP increased 0.77 percentage points annually,from 22 per cent to 32 per cent of GDP.Since 2009 exports as a share of GDP have
risen almost three times faster, an annual aver-age of 2 percentage points, attaining 41 per centin 2015. This is because Portuguese firms faceda domestic recession and had no alternative thanto focus on external markets. But the exportshare of GDP still is well below those of othermiddle sized European countries such as Bel-gium, Czech Republic, Hungary, Slovakia andIreland (Chart 10). After 2010 a growing number of Portuguese
firms benefited from a reduction in unit labourcosts, gaining market share, looking for new
Chart 10: Exports as a Proportion in Middle-Size European Countries, in % of GDP, 2014
Source: Eurostat
154 NU M B E R 32 , S P R I NG 2017
markets and increasing the internationalizationof their activities. The number of exportingfirms grew 6 per cent per year from 2010 to2014, when 1 in 5 Portuguese companiesexported goods or services. Although the economics literature usually
finds that more productive firms are the onesthat start exporting, some research shows firmsexperiencing productivity growth after enteringforeign markets (De Loecker, 2007). Moreover,an increase in competition abroad can also raisethe incentive of firms to engage in innovativeactivities and induce them to make difficult pro-ductivity-enhancing investments, such as qualityupgrading in plants, leveraging the benefits ofproductivity gains across larger markets andleading to aggregate productivity growth via the"within" firm component (Syverson, 2011).Export developments show that the Portu-
guese economy is improving its external com-petitiveness but from a low base. Portuguesefirms are slowly adapting to a context wheredeveloping countries have almost free access tothe EU market. Given that Portuguese export-ers are more productive than non-exporters, paybetter wages, invest more on human capital andgenerate larger spillover effects (Correia andGouveia, 2016), a higher growth in exportswould help to reallocate resources to these sec-tors and minimize the inefficient allocation tonon-tradable industries.The idea of a relatively closed economy is
confirmed by the low level of FDI stocks in Por-tugal, 51 per cent of GDP, below most of the EUmiddle-size economies and of EU28 average (80per cent). Part of it may be associated with itsperipheral location in the EU single market andthe comparative disadvantage related to produc-tion costs, skilled labour and productivity rela-tive to Eastern European countries. The EUentry by these countries in 2004 negatively
affected the Portuguese economy by deviatingFDI flows from countries such as Germany orItaly to the new EU members. These invest-ments are usually export-oriented and thus allo-ca te r e sources t oward t r adabl e s ec tor s .Moreover, FDI driven spillovers may accountfor a substantial portion of productivity growth,especially in high-tech sectors (Keller andYeaple, 2009).A low degree of openness is also seen in Por-
tuguese receipts from the sale and use of patents,non-patented knowledge, drawings and models,brands and technical consulting services. A fourfold increase in technological receipts as a pro-portion of GDP took place between 2005 to2014. But receipts are much lower than in othercountries (Chart 11). Given that tradable sectorssuch as ICT, electronics, machinery or pharma-ceuticals are the largest investors in R&D,higher and growing receipts may be associatedwith a better allocation of capital and labour. The level of participation in global value
chains also confirms that Portugal is not as openas it is usually referred to as a small-open econ-omy (Chart 12).9 The progressive fragmenta-tion of international trade is making Portuguesefirms more integrated in global value chains andimproving the value added of their production,but at a slow pace when compared with EasternEuropean countries. Portugal is below countriesof similar size such as Sweden, Ireland, Hungaryor the Czech Republic, and more so in forwardlinkages, thus delaying potential benefits forproductivity growth (Criscuolo et al., 2016).Although the Portuguese economy is becom-
ing more open, the level of openness is stillinsufficient when compared with similarlydeveloped economies. More openness, and morecompetitive firms operating in global markets, isa way to improve resource allocation and reversethe sluggish productivity pace in Portugal.
9 The GVC participation index adds up backward linkages, the import content of exports, and forward linkages,
the domestic content incorporated in the exports of other countries.
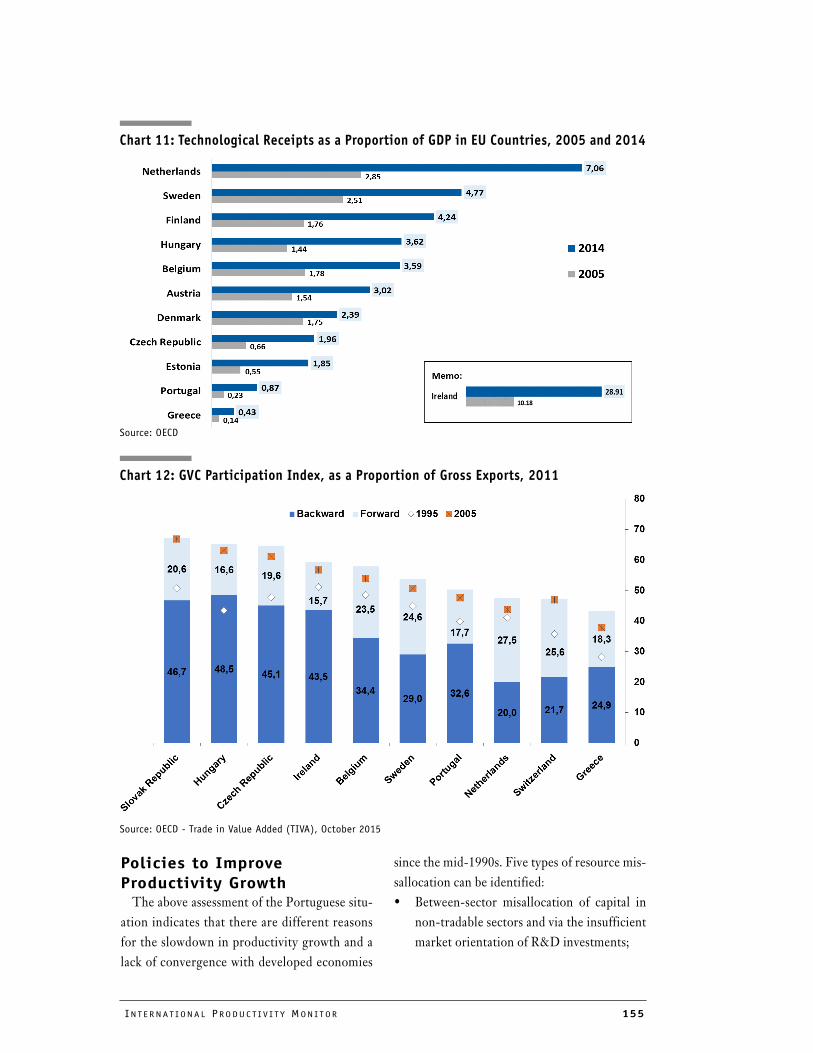
INT E R N A T I ON A L PRO DU C T I V I T Y MON I T OR 155
Policies to Improve Productivity GrowthThe above assessment of the Portuguese situ-
ation indicates that there are different reasonsfor the slowdown in productivity growth and alack of convergence with developed economies
since the mid-1990s. Five types of resource mis-sallocation can be identified:• Between-sector misallocation of capital in
non-tradable sectors and via the insufficientmarket orientation of R&D investments;
Chart 11: Technological Receipts as a Proportion of GDP in EU Countries, 2005 and 2014
Source: OECD
Chart 12: GVC Participation Index, as a Proportion of Gross Exports, 2011
Source: OECD - Trade in Value Added (TIVA), October 2015
156 NU M B E R 32 , S P R I NG 2017
• Between-sector misallocation of labour andskills in non-tradable, including state,industries where workers are better paid butthe level of productivity is lower;
• Within-sector misallocation of capital andlabour related to the survival of excessivelyindebted and economically non-viable zom-bie firms;
• Between-firms resource misallocation aris-ing from the insufficient number of firmsable to grow and become large; and
• Within-firms resource misallocation fromlow competitive pressure to innovate innon-tradable sectorsGiven that the potential return of policy
reforms is significant (e.g. Bouis and Duval,2011), improved public policies are needed tochange incentives, reduce market inefficiencies,and enhance aggregate productivity growth(Albrizio and Nicoletti, 2016).
Markets
Greater product market competition is neces-sary in oligopolistic sectors such as wholesaletrade, wholesale banking, professional services,energy and other network industries, by remov-ing institutional barriers to entry and to growth.Tax and other targeted policies to attract FDI, inareas such as health or tourism, could improvecapital utilization, raise the capital per workerratio and facilitate the up-scaling of firms andproductivity acceleration. This enhanced competition would reduce
mark-ups and rent-seeking, and increase physi-cal and human capital stocks in tradable indus-tries, including foreign and private investmentin equipment and ICT, thus d iminishingbetween-firms and within-firms misallocation.An evaluation of policies to implement a
transparent and simple set of public incentivesthat promote a change of resources from shel-tered to tradable sectors is needed. In this way,the insolvency of non-viable and excessively
indebted zombie firms is achieved by cancellingcredit lines, subsidies and other public policiesthat sustain their survival while helping toreduce credit misallocation in the banking sec-tor (McGowan et al., 2017). Such action wouldaccelerate the replacement of zombie firms byfreeing the portfolio of lenders in order to reori-ent financing to growing firms with higher pro-ductivity levels, thus reducing within-industryand between-sector inefficiencies. Formal education, specific training and learn-
ing-by-doing should improve human capital inaccordance with the expected needs of employ-ers. Secondary and tertiary education curriculacan include on-the-job training, access to ter-tiary education can be complemented withdetailed information about future job prospectsand graduate courses should be less compart-mentalized so that students can have flexiblechoices when deciding their future careers. This is important due to the expected positive
effects on LP through better between-sectorskills allocation and because formal education isassociated with a higher employment rate andwith a wage premium. Tertiary education inPortugal produced, in 2012, a wage premium of68 per cent over upper secondary education,above the OECD average of 55 per cent. Coordinated policies in the areas of education
and employment are also required so that incen-tives are aligned and oriented to improve theskills of workers and to prompt managers infamily and state owned firms to correct practicesthat negatively affect productivity growth(Bloom et al., 2014). Human capital accumulation should be com-
plemented with a less segmented labour marketthat r educed upon the cu rrent ly h igh lyrestricted allocation of skil ls and workersbetween tradable and non-tradable activities andthe state and private sectors. This is achieved byestablishing the same laws throughout the econ-omy so that asymmetric employment guarantees
INT E R N A T I ON A L PRO DU C T I V I T Y MON I T OR 157
are dismantled, learning-by-doing potential isenjoyed, performance-based bonuses and pro-motions are available and labour market match-ing is improved. The attraction of specializedmigrant workers may compensate for a lack ofskills and help minimize the effects of an agingand declining population.A flexible labour market would prevent hys-
teresis effects caused by unemployment fromhampering structural change thus facilitatingthe transfer of resources from low to high pro-ductivity activities while reducing labour slackand long-term unemployment. This can be rein-forced by decreasing economic rents in certainnon-tradable sectors in order to balance relativewages with tradable sectors and by wage settinginstitutions to ensure wages reflect differencesin labour productivity. Third, the last decade has shown that the sim-
plification and deregulation of administrativeprocedures are not sufficient if the number ofnew laws and regulations is not reduced. Theselaws are currently promulgated by too manyjurisdictions at the local, national, EU and inter-national level, including regulatory agencies atdifferent layers. The principle that all situationsought to be anticipated by the legislator shouldbe replaced with regulatory predictability basedon common sense and general principles so thatorganizational slack is limited.The business environment can be improved in
an array of ways: less corruption, stronger publicentities, better defined property rights, lowerrequirements to investment and for enforcing acontract, and a lower tax burden and compliancecosts (Julio et al., 2013; Arnold and Barbosa,2015). Furthermore, market distortions such aslegal requirements that create negative incen-tives to becoming larger should be eliminatedand an excessive and confusing number of taxes,subsidies and policy programs to be made sim-pler and manageable by small firms so thatbetween-firms allocation is bettered.
Firms
Portuguese f irms are too small and tooindebted. Favourable conditions are needed forfirms to scale-up and to enter international mar-kets. Public policies can help by targeting newand innovative firms and by removing barriersfor zombie firms to exit.One way is to improve the effectiveness of the
different financing policies by simplifying theinst itutional sett ing and to c lose the gapbetween their medium and long term needs andthe willingness of lenders to provide it. The dif-ficulty of firms to grow and the small number oflarge firms indicate that alternative sources offinancing are not truly effective. Policy incen-tives should be changed so that firms may reacha sustainable debt-to-equity ratio: eliminationof the tax debt bias and promotion of profit rein-vestments by entrepreneurs. Moreover, the taxsystem should reward those that are more proneto take risks and initiative.Dynamic firms operating in liberalized mar-
kets are keener on taking advantage of policiesthat support R&D spending and technologydevelopments. This is a way for firms to increasethe number of researchers, patent applicationsand investment in other intangible capital, thusbenefiting from diffusion mechanisms, prompt-ing applied R&D and improving within-firmresource allocation.Too many firms are exclusively focused on the
domestic market. For productivity to accelerate,the relatively small size of the Portuguese econ-omy requires access to larger markets to achievescale economies. SMEs may also take advantage of global value
chains by adjusting their activity to externaldemand. This can be done by developing incen-tives to supply larger exporting companies withdifferentiated products and services. It is a wayto survive and to achieve efficiency gains fromhigher integration in global markets.
158 NU M B E R 32 , S P R I NG 2017
As long as firms grow and develop their con-nections to international markets, technologydiffusion can more easily cross borders, thus cre-ating better conditions to benefit from knowl-edge spreading externalities and promoting theattraction of foreign investment in R&D and awidespread use of digita l technologies toimprove productivity in production processes(IMF, 2016).Moreover, if these internationalization efforts
were also directed to academic and scientificstakeholders and if labour market segmentationbetween the state and private sectors is miti-gated, domestic knowledge and technology dif-fusion could be reinforced and skills becomeallocated to industries with higher level of pro-ductivity.Some of the above policies are being imple-
mented. But often there is a loss of continuity inpublic policies when a new government takesoffice. Moreover, policy evaluation is not under-taken on a regular basis, thus hurting the abilityto continuously learn and improve public policy.Therefore, evaluation from a productivity per-spective can lead to better policies. The best option may be to establish an inde-
pendent productivity council, similar to those inAustralia and New Zealand (Banks, 2015). Thisadvising body would have the aim to evaluateand to identify and underline the benefits ofpro-productivity policies, thus being useful incounterbalancing interests opposed to reforms.
ConclusionThe growing integration of the Portuguese
economy into global markets was expected tolead to a convergence in productivity to the mostdeveloped countries. Paradoxically, this has nothappened. After 40 years of democracy and eco-nomic integration Portugal still has almost thesame gap in labour productivity with developedcountries.
Since the 1990s, inappropriate incentivesincreased resource misallocation at industry andfirm levels, exacerbating market inefficiencies.Insufficient policy evaluation explains why it istaking so long to correct them.The recent improvement in some productivity
determinants has not been sufficient. Economicpolicy was too focused on creating jobs indepen-dently of their sustainability while ignoringreforms to improve resource allocation and pro-ductivity growth.The policy proposals in this article may help
to enhance resource allocation, to improve com-petitiveness and to achieve a higher economicreturn. More is needed from the public sector,namely stable and effective policies that are con-tinuously evaluated. More is also needed from the private sector.
Portuguese f i rms are st i l l too smal l , tooindebted and structurally too dependent ondomestic demand. But firms are the key for thePortuguese economy to become better inte-grated into global value chains so that the globalproduct iv i ty f ront ier i s more f requent lyreached.
ReferencesAdler, G., R. Duval, D. Furceri, S. Kiliç Çelik, K.
Koloskova, and M. Poplawski-Ribeiro (2017) "Gone with the Headwinds: Global Productiv-ity," IMF Staff Discussion Note 17/04.
Aiyar, Shekhar, Christian Ebeke and Xiaobo Shao (2016) "The Impact of Workforce Aging on European Productivity," IMF Working Paper 238.
Albrizio, Silvia and Giuseppe Nicoletti (2016) "Boosting Productivity: A Framework for Analy-sis and a Checklist for Policy," presented at the Global Forum on Productivity, Lisbon.
Andrews, D., C. Criscuolo and P. Gal (2015) "Fron-tier Firms, Technology Diffusion and Public Policy: Micro Evidence from OECD Eountries," OECD Productivity Working Paper.
Andrews, Dan, Chiara Criscuolo and Peter Gal (2016) "The Best versus the Rest - The Global Productivity Slowdown, Divergence across Firms and the Role of Public Policy," OECD Productivity Working Paper.
INT E R N A T I ON A L PRO DU C T I V I T Y MON I T OR 159
Arnold, Jens, Natália Barbosa (2015) "Structural Policies and Productivity: Evidence from Portu-guese Firms," OECD Economics Department Working Papers, No. 1259, Paris.
Arnold, Jens, C. Farinha Rodrigues (2015) "Reduc-ing Inequality and Poverty in Portugal," OECD Economics Department Working Paper No. 1258, Paris.
Balasubramanian, Natarajan, and Jagadeesh Siva-dasan (2011) "What Happens When Firms Patent? New Evidence from U.S. Economic Census Data," Review of Economics and Statistics, Vo. 93, No. 1, pp.126-46.
Balta and Mohl (2014) "The Drivers of Total Factor Productivity in Catching-up Economies," in Quarterly Report on the Euro Area, Vol. 13, issue 1, April.
Banks, Gary (2015) "Institutions to Promote Pro-Productivity Policies: Logic and Lessons," paper presented at "Global Dialogue on the Future of Productivity Growth: Towards an OECD Pro-ductivity Network," Mexico City, July 6-7.
Bartelsman, Eric J., Jonathan E. Haskel, and Ralf Martin (2008) "Distance to Which Frontier? Evidence on Productivity Convergence from International Firm-Level Data," Centre for Eco-nomic Policy Research Discussion Paper 7032.
Benkard, C. Lanier (2000) "Learning and Forget-ting: The Dynamics of Aircraft Production," American Economic Review, Vol. 90, No. 4, pp. 1034-54.
Berlingieri, Giuseppe, Patrick Blanchaney and Chi-ara Criscuolo (2017) "The Great Divergence(s)" OECD Science, Technology and Innovation,” Working Paper, forthcoming.
Berlingieri, Blanchenay, Calligaris and Criscuolo (2017) “Firm-level Productivity Differences: Insight from the OECD’s Multifactor MultiProd Project,” International Productivity Monitor, Vol. 32, pp. 97-115.
Blanchard, Olivier (2007) "Adjustment within the Euro: The Difficult Case of Portugal," Portu-guese Economic Journal, Vol. 6, pp. 1-21.
Bloom, Nicholas, Mark Schankerman, and John Van Reenen (2007) "Identifying Technology Spill-overs and Product Market Rivalry," NBER Working Paper 13060.
Bloom, Nicholas, Christos Genakos, Raffaella Sadun, and John Van Reenen (2012) "Manage-ment Practices Across Firms and Countries," NBER Working Paper 17850, February.
Bloom, Nicholas, Renata Lemos, Raffaella Sadun, Daniela Scur, and John Van Reenen (2014) "The New Empirical Economics of Management," NBER Working Paper 20102, May.
Bloom, Nicholas, Mirko Draca, and John Van Reenen (2015) "Trade Induced Technical
Change? The Impact of Chinese Imports on Innovation, IT and Productivity," Review of Eco-nomics Studies, Vol. 83, No. 1, pp. 87-117.
Bouis, R. and R. Duval (2011) "Raising Potential Growth After the Crisis: A Quantitative Assess-ment of the Potential Gains from Various Struc-tural Reforms in the OECD Area and Beyond," OECD Economics Department Working Papers, No. 835, (Paris: OECD Publishing).
Braguinsky, Serguey, Lee G. Branstetter, and André Regateiro (2013) "The Incredible Shrinking Portuguese Firms," NBER Working Paper 17265.
Correia, A.L., Gouveia, A.F., (2016) "What Determines Firm-level Export Capacity? Evi-dence from Portuguese Firms," GEE Papers No. 57, April, http://www.gee.min-economia.pt/.
Criscuolo, Chiara and Jonathan Timmis (2017) "The Relationship Between Global Value Chains and Productivity," International Productivity Monitor, Vol, 32. pp. 61-83.
De Loecker, Jan. (2007) "Do Exports Generate Higher Productivity? Evidence from Slovenia,” Journal of International Economics, Vol. 73, No. 1, pp. 69-98.
Dias, Daniel, Carlos Marques, and Christine Rich-mond (2015) "Misallocation and Productivity in the Lead Up to the Eurozone Crisis," Interna-tional Finance Discussion Papers 1146.
Eckaus, Richard (2008) "Portugal: Then and Now," in Challenges Ahead for the Portuguese Economy, Francesco Franco ed., ICS.
Edwards, Sebastian (1998) "Openness, productivity and growth: what do we really know?" Economic Journal, Vol. 108, (March), pp. 383-398.
Foster, Lucia, John Haltiwanger, and C. J. Krizan (2001) "Aggregate Productivity Growth: Lessons from Microeconomic Evidence," in New Develop-ments in Productivity Analysis, Charles Hulten, Edwin Dean, and Michael Harper, (eds.), (Chi-cago: University of Chicago Press), pp. 303-363. University of Chicago Press.
Foster, Lucia, John Haltiwanger, and C. J. Krizan (2006) "Market Selection, Reallocation, and Restructuring in the U.S. Retail Trade Sector in the 1990s," Review of Economics and Statistics, Vol. 88, No. 4, pp. 748-58.
Fox, Jeremy T., and Valérie Smeets. (2011) "Does Input Quality Drive Measured Differences in Firm Productivity?" National Bureau of Eco-nomic Research Working Paper 16853.
Freitas, Miguel L. (2012) "O Capital," chapter 3 in História Económica de Portugal 1700-2000, volume III, Orgs. Pedro Lains and Álvaro Ferreira da Silva.
Gersbach, Hans, and Armin Schmutzler (2003) "Endogenous Technological Spillovers: Causes
160 NU M B E R 32 , S P R I NG 2017
and Consequences," Journal of Economics and Management Strategy, Vol. 12, No. 2, pp. 179-205.
Gopinath, Gita, S. Kalemli-Ozcan, L. Karabarbounis and C. Villegas-Sanchez (2017) "Capital Alloca-tion and Productivity in South Europe," Quar-terly Journal of Economics, (Forthcoming).
Gonçalves, Daniel and Ana Martins (2016) "The Determinants of TFP Growth in the Portuguese Manufacturing Sector," GEE Papers Vol. 62, http://www.gee.min-economia.pt/
Heitor, Manuel, Hugo Horta and Joana Mendonça (2014) "Developing Human Capital and Research Capacity: Science Policies Promoting Brain Gain," Technological Forecasting and Social Change, Vol. 78, No. 8, pp. 1299-1309.
IMF (2015) "Portugal selected issues," IMF Country Report No. 15/127, May.
IMF (2016) "Fiscal Policies for Innovation and Growth," Fiscal Monitor Chapter 2, April.
Isaksson, Anders (2007) "Determinants of Total Fac-tor Productivity: A Literature Review,” Staff Working Paper, UNIDO.
Jorgenson, Dale W., Mun S. Ho, and Kevin J. Stiroh. (2008) "A Retrospective Look at the U.S. Pro-ductivity Growth Resurgence," Journal of Eco-nomic Perspectives, Vol. 22, No. 1, pp. 3-24.
Julio, P., R. Pinheiro-Alves and J. Tavares (2013) "Foreign Direct Investment and Institutional Reform: Evidence and an Application to Portu-gal," Portuguese Economic Journal Vol. 12, pp. 215-250.
Keller, Wolfgang, and Stephen R. Yeaple. (2009) "Multinational Enterprises, International Trade, and Productivity Growth: Firm Level Evidence from the United States," Review of Economics and Statistics, Vol. 91, No. 4, pp. 821-31.
Lains, P. (2008) "The Portuguese Economy in the Irish Mirror, 1960-2004," Open Economies Review, Vol. 19, pp. 667-683
Lentz, Rasmus, and Dale T. Mortensen. (2008) "An Empirical Model of Growth through Product Innovation," Econometrica, Vol. 76, No. 6, pp. 1317-73.
McGowan, Müge Adalet, Dan Andrews and Valen-tine Millot (2017) "The Walking Dead? Zombie Firms and Productivity Performance in OECD
Countries," OECD Economics Department Working Paper No. 1372
McKinsey Global Institute (2004) "Portugal 2010. Increasing Productivity Growth in Portugal."
Mercer (2013) "Análise Comparativa das Remuner-ações Praticadas No Sector Público e No Sector Privado," February.
OECD (2015a) "The Future of Productivity," OECD Publishing, Paris.
OECD (2015b) "OECD Skills Strategy - Diagnostic Report Portugal," Paris.
OECD (2016) "The Productivity-Equality Nexus: A Concept Paper," (Paris: OECD Publishing).
OECD (2017a) "Labour Market Reforms in Portu-gal 2011-2015," (Paris: OECD Publishing).
OECD (2017b) "Economic Survey of Portugal," (Paris: OECD Publishing).
Ollivaud, P., Y. Guillemette and D. Turner (2016) "Links between Weak Investment and the Slow-down in OECD Productivity and Potential Out-put Growth," OECD Economics Department Working Papers 1304.
Portugal Statistics (2015) "Custos de Contexto - a Perspetiva das Empresas," October, Lisboa.
Reis, Ricardo (2013) "The Portuguese Slump and Crash and the Euro Crisis," Brookings Papers on Economic Activity, Spring.
Sakellaris, Plutarchos and Daniel J. Wilson. (2004) "Quantifying Embodied Technological Change," Review of Economic Dynamics, Vol. 7, No. 1, pp. 1-26.
Santos, S, A. Gouveia and I. Gonçalves (2017) "The Short-term Impact of Structural Reforms on Productivity Growth: Beyond Direct Effects," GEE paper 65, http://www.gee.min-econo-mia.pt/.
Sondermann, David (2012) "Productivity in the Euro Area: Any Evidence of Convergence?" ECB WP series Vol. 1, pp. 431, April.
Syverson, Chad (2011) "What Determines Produc-tivity?" Journal of Economic Literature, Vol. 49, No. 2, pp. 326-365.
World Bank (2017) “Ease of Doing Business Index,” World Bank Group.
INT E R N A T I ON A L PRO DU C T I V I T Y MON I T OR 161
The Role of Urban Agglomerations for Economic and Productivity Growth
Rüdiger Ahrend, Alexander C. Lembcke and Abel Schumann
OECD1
ABSTRACT
This article discusses how urban agglomerations – cities – affect economic productivity. It
uses an internationally harmonized definition of cities that aims to capture the true extent
of an urban agglomeration and is not limited by administrative city boundaries. It shows
that labour productivity increases with city size. Among OECD metropolitan areas,
agglomerations with more than 500,000 inhabitants, a 1 per cent population increase is
associated with a 0.12 per cent increase in average labour productivity. Partly, this is
explained by “sorting” as more productive workers tend to live in bigger cities. But bigger
cities provide additional “agglomeration economies” to those working in them. Comparable
workers are 0.02-0.05 per cent more productive in cities with a 1 per cent larger population.
These differences compound to significant differentials, e.g. a similar worker in Madrid (6
million inhabitants) is, on average, nearly 15 per cent more productive than a worker in
Toledo (120,000 inhabitants). Furthermore, the paper also shows that cities affect
economic performance beyond their boundaries. Since 1995, per capita GDP growth in
regions within 90 minutes driving of a large urban agglomeration has been approximately
0.4 percentage points higher than in those with no large urban agglomeration within 300
minutes of driving.
Cities and urban agglomerations are the most
productive places in OECD countries. More
than 75 per cent of the most productive regions
in terms of output (gross domestic product) per
worker are urban and more than half are regions
with a metropolitan area of 1.5 million or more
inhabitants (OECD, 2016a). One of the univer-
sal patterns found across countries and regions is
that across cities of all sizes, city size is positively
correlated with productivity levels. The more
people that live in a city, the higher the average
level of productivity of its inhabitants. A city of
20,000 inhabitants is likely to have more pro-
ductive residents than a city of 10,000 inhabit-
1 Rüdiger Ahrend is the Head of the Urban Programme, Alexander C. Lembcke and Abel Schumann are Econo-
mists/Policy Analysts, all in the Regional Development Policy Division of the OECD Centre for Entrepreneurship,
SMEs, Local Development and Tourism. The authors would like to thank the editors and two anonymous refer-
ees for comments on an earlier draft that significantly improved the paper. Prior versions of the paper benefit-
ted from comments by members of the Regional Development Policy Division and participants in the OECD
Applied Economics Work-in-Progress Seminar, as well as an ERSA workshop at the University of Barcelona. This
article should not be reported as representing the official views of the OECD or of its member countries. The
opinions expressed and arguments employed are those of the authors. The statistical data for Israel are sup-
plied by and under the responsibility of the relevant Israeli authorities. The use of such data by the OECD is
without prejudice to the status of the Golan Heights, East Jerusalem and Israeli settlements in the West Bank
under the terms of international law. Emails: [email protected]; [email protected]; Rudi-
162 NUMB E R 32 , S P R I NG 2017
ants, just as a city of 2 million inhabitants is
likely to have more productive residents than a
city of 1 million inhabitants.
Several mechanisms are responsible for this
phenomenon. One explanation lies in the fact
that urban populations are equipped with skills
and qualifications that make them on average
more productive. For example, urban dwellers
are on average more highly educated than
inhabitants of rural areas. This gap arises on the
one hand, because institutions of higher educa-
tion tend to be located in urban areas, making
access for local residents easier and more afford-
able and also increasing the educated workforce
as people who come to study in a city are more
likely to stay after they graduate. On the other
hand, cities offer more and better job opportuni-
ties for highly educated people, thus attracting
people with high levels of education and offer-
ing better matches between worker skills and the
jobs they fill.2 This might be particularly rele-
vant for highly educated "power" couples as
larger cities make it more likely for both part-
ners to find suitable jobs (Costa and Kahn,
2000).
Beyond differences in skills and education,
there is another important set of mechanisms
that make workers in cities, and especially larger
cities, more productive. This set is summarized
under the term "agglomeration economies".
Agglomeration economies increase the level of
productivity in cities independent from individ-
ual characteristics of their inhabitants. Several
channels through which agglomeration econo-
mies occur are frequently mentioned.3
One mechanism concerns knowledge and the
innovations it spurs. Closer proximity and more
face to face contact between workers can lead to
a faster spread of new ideas within cities, thus
causing firms to adopt new innovative produc-
tion techniques more quickly. Another mecha-
nism is related to scale and the capacity to share
infrastructure or input facilities. Since most
infrastructure investments include fixed costs
that are to some degree independent from the
number of users, larger cities with a higher num-
ber of users can use infrastructure more effi-
ciently on average. The same applies to local
inputs. A law firm specializing in exports and
investment to a specific country requires a large
enough local demand. Finally, the greater num-
ber of businesses and workers in cities makes it
easier for businesses to find workers that closely
match the required profiles and workers can
work in jobs that better match their skills.
All these mechanisms increase the productiv-
ity of workers in cities beyond the level that they
would have in less densely populated areas.
These ideas are not new, but build on a long his-
tory of research, with early discussion of the
concept of agglomeration benefits ranging back
to the 19th century economist Alfred Marshall
and gains from specialization being a key aspect
of Adam Smith's work.
The influence of cities on productivity goes
beyond their own borders . For example ,
Camagni, Capello and Caragliu (2015) find that
productivity in second tier cities (with less than
1 million inhabitants in the larger urban zone) is
positively affected by the presence of other cit-
ies. Partridge et al. (2009a) estimate positive
effects on population growth in US counties that
are close to higher tiered urban centres, but also
find evidence that the largest urban areas
adversely affect growth in mid-sized metropoli-
tan areas in their vicinity. Looking at long run
2 Andersson, Burgess and Lane (2007) find that in denser counties in California and Florida high-skill workers
are more likely to be matched with firms that have high average skill levels. Studies for Italy and Portugal
find positive but weaker evidence for such "assortative" matching (Andini et al, 2013 and Figueiredo, Guima-
rães and Woodward, 2014).
3 See Duranton and Puga (2004) for a detailed discussion.
INT E R N A T I ON A L PRO DU C T I V I T Y MON I T OR 163
trends and using the loss in market access of cit-
ies close to the border between East and West
Germany after the postwar division, Redding
and Sturm (2008) find strong adverse effects on
population growth, especially in the early years
following the split.
Thus, it is likely that distances to cities can
determine levels of productivity and economic
growth. This effect can be positive, as larger cit-
ies provide specialized services and serve as hubs
for trade and transport. For less-densely popu-
lated rural areas, cities can be an essential part of
their economy as they markets for products,
concentrate public and private services, e.g.
patent offices or marketing agencies and provide
greater variety in shopping and cultural ameni-
ties. Obviously, the closer a region is located to
a city, the easier it is for its businesses to access
these functions and the easier for residents and
businesses in the region to "borrow" agglomera-
tion economies from the city.4 Conversely, the-
ore t i c a l d i s cu s s i on s a l so h i gh l i ght tha t
concentration of activity in metropolitan centres
might cast "agglomeration shadows" on smaller
cities and surrounding areas as the core benefits
from productivity and population growth at the
expense of surrounding areas (Fujita, Krugman
and Venables, 1999).
This article presents evidence from several
OECD research projects on the determinants of
productivity and growth in cities and regions.
Primarily, it summarizes evidence collected in
Ahrend et al. (2014) and Ahrend and Schumann
(2014). Its contribution is threefold. First, in
order to better understand how cities affect
countries as a whole, it assesses how closeness to
urban centres affects economic growth in all
regions. Instead of using geographical distance,
the article focuses on road-based travel distance
and in particular travel time.5 These variables
are more important in determining the accessi-
bility of a city from a region and are therefore
more likely to influence the region's economic
performance.
Second, it aims to understand the economic
benefits of cities themselves and estimates the
magnitude of these "agglomeration economies"
for five OECD member countries on two conti-
nents. In other words, it estimates the difference
in productivity of comparable workers in cities
of different sizes.
As a third contribution, the article uses an
internationally harmonized - functional - defini-
tion of urban areas (FUAs) as the unit of obser-
vation rather than an administrat ive c i ty
definition, as does most related literature.6 This
is important, because administrative boundaries
of cities are often arbitrary and do not corre-
spond to the economic and social realities that
define a city. In contrast, the definition of FUAs
4 Camagni, Capello and Caragliu (2016), for example, find that for Europe, proximity to high-level urban func-
tions in other cities is positively associated with productivity and its growth. The authors rely on house prices
as a proxy for the productivity differential between cities arguing that it reflects the net benefits of a city,
including the productivity benefits they provide. The concept of borrowed size is often attributed to Alonso
(1973), who highlighted that smaller cities can sustain urban functions that would typically require larger cit-
ies (and markets) if they are located close enough to larger cities.
5 The focus on road-based travel compared to other modes, e.g. rail-based travel, is due to the fact that in
Europe (the focus of this part of the study), 92.5 per cent of kilometres travelled by ground transport are
travelled by road-based transport (Eurostat, 2017; data for 2014).
6 Many countries have their own function-based regional delineations. For example, Metropolitan Statisti-
cal Areas in the United States aim to combine areas with close economic ties. France and the United
Kingdom have definitions of local labour markets based on commuting flows (Zone d'Emploi and Travel
to Work Areas respectively) that cover the whole country. The advantage of the FUA definition developed
by the European Union and the OECD is that it applies the same methodology for all countries (with
threshold values adapted for North American and Asian OECD countries) and allows to divide countries
into dense urban centres, the surrounding less densely populated commuting zone and low density areas
that lie outside (functional) urban areas.
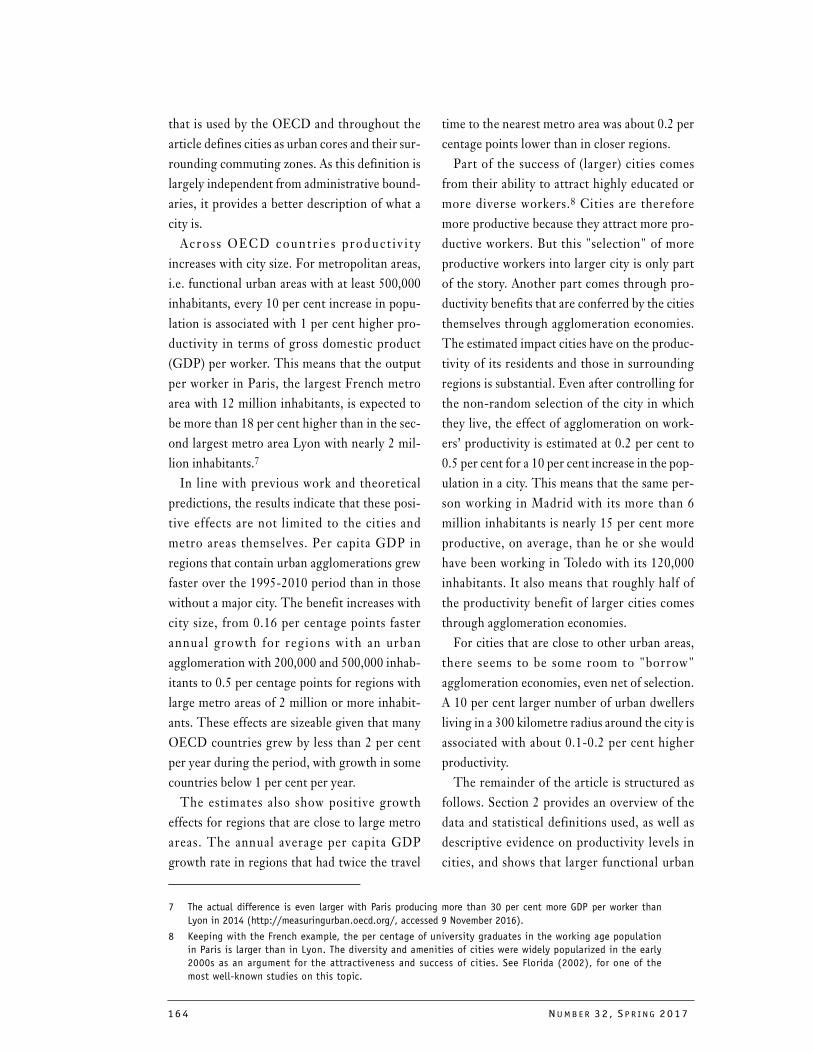
164 NUMB E R 32 , S P R I NG 2017
that is used by the OECD and throughout the
article defines cities as urban cores and their sur-
rounding commuting zones. As this definition is
largely independent from administrative bound-
aries, it provides a better description of what a
city is.
Ac ro s s OECD count r i e s p roduc t i v i t y
increases with city size. For metropolitan areas,
i.e. functional urban areas with at least 500,000
inhabitants, every 10 per cent increase in popu-
lation is associated with 1 per cent higher pro-
ductivity in terms of gross domestic product
(GDP) per worker. This means that the output
per worker in Paris, the largest French metro
area with 12 million inhabitants, is expected to
be more than 18 per cent higher than in the sec-
ond largest metro area Lyon with nearly 2 mil-
lion inhabitants.7
In line with previous work and theoretical
predictions, the results indicate that these posi-
tive effects are not limited to the cities and
metro areas themselves. Per capita GDP in
regions that contain urban agglomerations grew
faster over the 1995-2010 period than in those
without a major city. The benefit increases with
city size, from 0.16 per centage points faster
annual growth for regions with an urban
agglomeration with 200,000 and 500,000 inhab-
itants to 0.5 per centage points for regions with
large metro areas of 2 million or more inhabit-
ants. These effects are sizeable given that many
OECD countries grew by less than 2 per cent
per year during the period, with growth in some
countries below 1 per cent per year.
The estimates also show positive growth
effects for regions that are close to large metro
areas. The annual average per capita GDP
growth rate in regions that had twice the travel
time to the nearest metro area was about 0.2 per
centage points lower than in closer regions.
Part of the success of (larger) cities comes
from their ability to attract highly educated or
more diverse workers.8 Cities are therefore
more productive because they attract more pro-
ductive workers. But this "selection" of more
productive workers into larger city is only part
of the story. Another part comes through pro-
ductivity benefits that are conferred by the cities
themselves through agglomeration economies.
The estimated impact cities have on the produc-
tivity of its residents and those in surrounding
regions is substantial. Even after controlling for
the non-random selection of the city in which
they live, the effect of agglomeration on work-
ers’ productivity is estimated at 0.2 per cent to
0.5 per cent for a 10 per cent increase in the pop-
ulation in a city. This means that the same per-
son working in Madrid with its more than 6
million inhabitants is nearly 15 per cent more
productive, on average, than he or she would
have been working in Toledo with its 120,000
inhabitants. It also means that roughly half of
the productivity benefit of larger cities comes
through agglomeration economies.
For cities that are close to other urban areas,
there seems to be some room to "borrow"
agglomeration economies, even net of selection.
A 10 per cent larger number of urban dwellers
living in a 300 kilometre radius around the city is
associated with about 0.1-0.2 per cent higher
productivity.
The remainder of the article is structured as
follows. Section 2 provides an overview of the
data and statistical definitions used, as well as
descriptive evidence on productivity levels in
cities, and shows that larger functional urban
7 The actual difference is even larger with Paris producing more than 30 per cent more GDP per worker than
Lyon in 2014 (http://measuringurban.oecd.org/, accessed 9 November 2016).
8 Keeping with the French example, the per centage of university graduates in the working age population
in Paris is larger than in Lyon. The diversity and amenities of cities were widely popularized in the early
2000s as an argument for the attractiveness and success of cities. See Florida (2002), for one of the
most well-known studies on this topic.
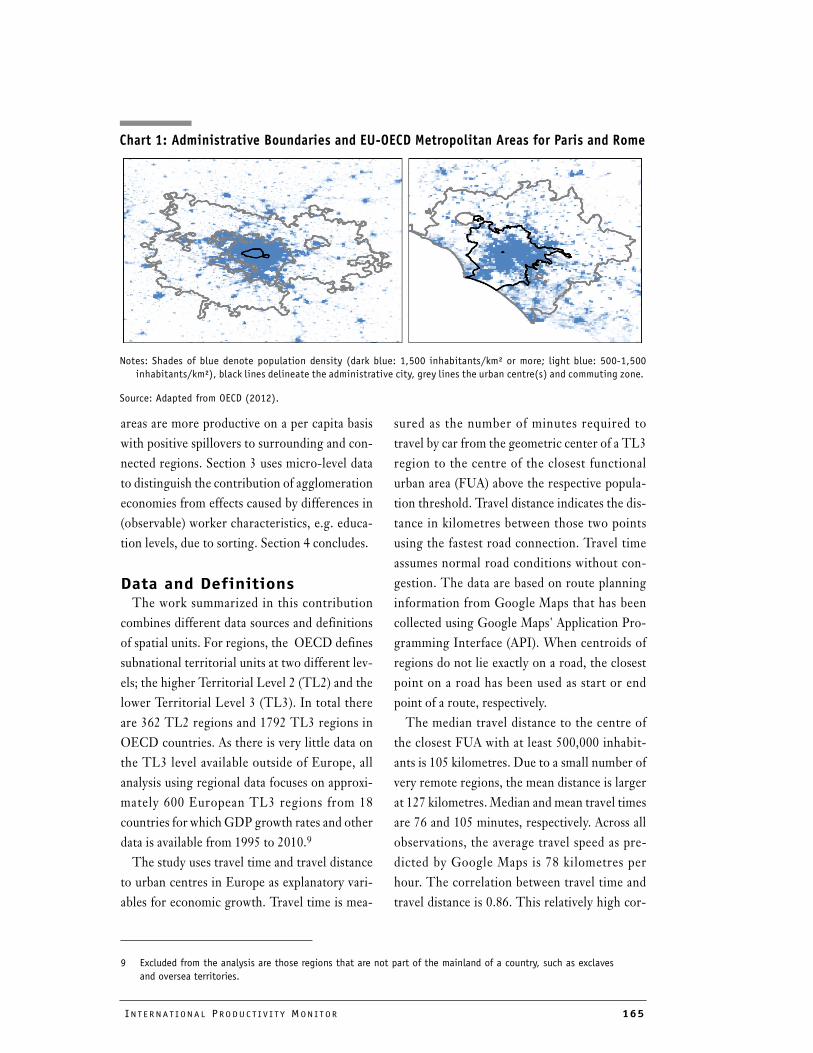
INT E R N A T I ON A L PRO DU C T I V I T Y MON I T OR 165
areas are more productive on a per capita basis
with positive spillovers to surrounding and con-
nected regions. Section 3 uses micro-level data
to distinguish the contribution of agglomeration
economies from effects caused by differences in
(observable) worker characteristics, e.g. educa-
tion levels, due to sorting. Section 4 concludes.
Data and DefinitionsThe work summarized in this contribution
combines different data sources and definitions
of spatial units. For regions, the OECD defines
subnational territorial units at two different lev-
els; the higher Territorial Level 2 (TL2) and the
lower Territorial Level 3 (TL3). In total there
are 362 TL2 regions and 1792 TL3 regions in
OECD countries. As there is very little data on
the TL3 level available outside of Europe, all
analysis using regional data focuses on approxi-
mately 600 European TL3 regions from 18
countries for which GDP growth rates and other
data is available from 1995 to 2010.9
The study uses travel time and travel distance
to urban centres in Europe as explanatory vari-
ables for economic growth. Travel time is mea-
sured as the number of minutes required to
travel by car from the geometric center of a TL3
region to the centre of the closest functional
urban area (FUA) above the respective popula-
tion threshold. Travel distance indicates the dis-
tance in kilometres between those two points
using the fastest road connection. Travel time
assumes normal road conditions without con-
gestion. The data are based on route planning
information from Google Maps that has been
collected using Google Maps' Application Pro-
gramming Interface (API). When centroids of
regions do not lie exactly on a road, the closest
point on a road has been used as start or end
point of a route, respectively.
The median travel distance to the centre of
the closest FUA with at least 500,000 inhabit-
ants is 105 kilometres. Due to a small number of
very remote regions, the mean distance is larger
at 127 kilometres. Median and mean travel times
are 76 and 105 minutes, respectively. Across all
observations, the average travel speed as pre-
dicted by Google Maps is 78 kilometres per
hour. The correlation between travel time and
travel distance is 0.86. This relatively high cor-
9 Excluded from the analysis are those regions that are not part of the mainland of a country, such as exclaves
and oversea territories.
Chart 1: Administrative Boundaries and EU-OECD Metropolitan Areas for Paris and Rome
Notes: Shades of blue denote population density (dark blue: 1,500 inhabitants/km² or more; light blue: 500-1,500
inhabitants/km²), black lines delineate the administrative city, grey lines the urban centre(s) and commuting zone.
Source: Adapted from OECD (2012).
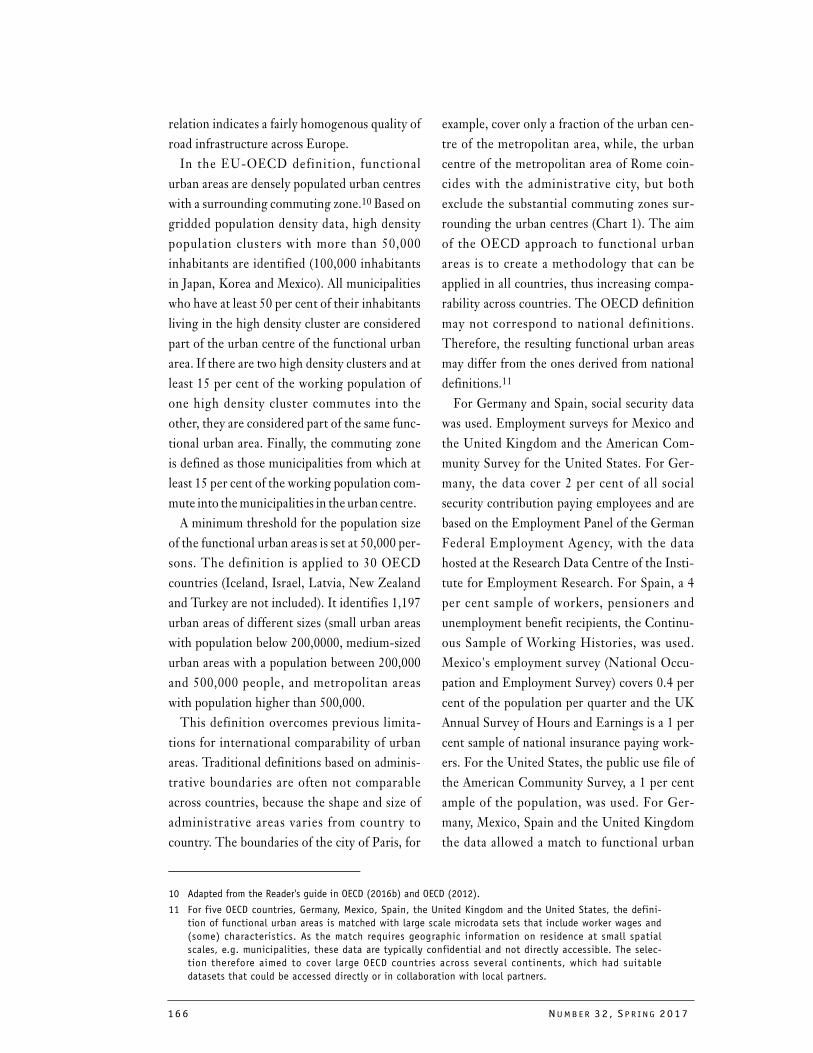
166 NUMB E R 32 , S P R I NG 2017
relation indicates a fairly homogenous quality of
road infrastructure across Europe.
In the EU-OECD definition, functional
urban areas are densely populated urban centres
with a surrounding commuting zone.10 Based on
gridded population density data, high density
population clusters with more than 50,000
inhabitants are identified (100,000 inhabitants
in Japan, Korea and Mexico). All municipalities
who have at least 50 per cent of their inhabitants
living in the high density cluster are considered
part of the urban centre of the functional urban
area. If there are two high density clusters and at
least 15 per cent of the working population of
one high density cluster commutes into the
other, they are considered part of the same func-
tional urban area. Finally, the commuting zone
is defined as those municipalities from which at
least 15 per cent of the working population com-
mute into the municipalities in the urban centre.
A minimum threshold for the population size
of the functional urban areas is set at 50,000 per-
sons. The definition is applied to 30 OECD
countries (Iceland, Israel, Latvia, New Zealand
and Turkey are not included). It identifies 1,197
urban areas of different sizes (small urban areas
with population below 200,0000, medium-sized
urban areas with a population between 200,000
and 500,000 people, and metropolitan areas
with population higher than 500,000.
This definition overcomes previous limita-
tions for international comparability of urban
areas. Traditional definitions based on adminis-
trative boundaries are often not comparable
across countries, because the shape and size of
administrative areas varies from country to
country. The boundaries of the city of Paris, for
example, cover only a fraction of the urban cen-
tre of the metropolitan area, while, the urban
centre of the metropolitan area of Rome coin-
cides with the administrative city, but both
exclude the substantial commuting zones sur-
rounding the urban centres (Chart 1). The aim
of the OECD approach to functional urban
areas is to create a methodology that can be
applied in all countries, thus increasing compa-
rability across countries. The OECD definition
may not correspond to national definitions.
Therefore, the resulting functional urban areas
may differ from the ones derived from national
definitions.11
For Germany and Spain, social security data
was used. Employment surveys for Mexico and
the United Kingdom and the American Com-
munity Survey for the United States. For Ger-
many, the data cover 2 per cent of all social
security contribution paying employees and are
based on the Employment Panel of the German
Federal Employment Agency, with the data
hosted at the Research Data Centre of the Insti-
tute for Employment Research. For Spain, a 4
per cent sample of workers, pensioners and
unemployment benefit recipients, the Continu-
ous Sample of Working Histories, was used.
Mexico's employment survey (National Occu-
pation and Employment Survey) covers 0.4 per
cent of the population per quarter and the UK
Annual Survey of Hours and Earnings is a 1 per
cent sample of national insurance paying work-
ers. For the United States, the public use file of
the American Community Survey, a 1 per cent
ample of the population, was used. For Ger-
many, Mexico, Spain and the United Kingdom
the data allowed a match to functional urban
10 Adapted from the Reader's guide in OECD (2016b) and OECD (2012).
11 For five OECD countries, Germany, Mexico, Spain, the United Kingdom and the United States, the defini-
tion of functional urban areas is matched with large scale microdata sets that include worker wages and
(some) characteristics. As the match requires geographic information on residence at small spatial
scales, e.g. municipalities, these data are typically confidential and not directly accessible. The selec-
tion therefore aimed to cover large OECD countries across several continents, which had suitable
datasets that could be accessed directly or in collaboration with local partners.
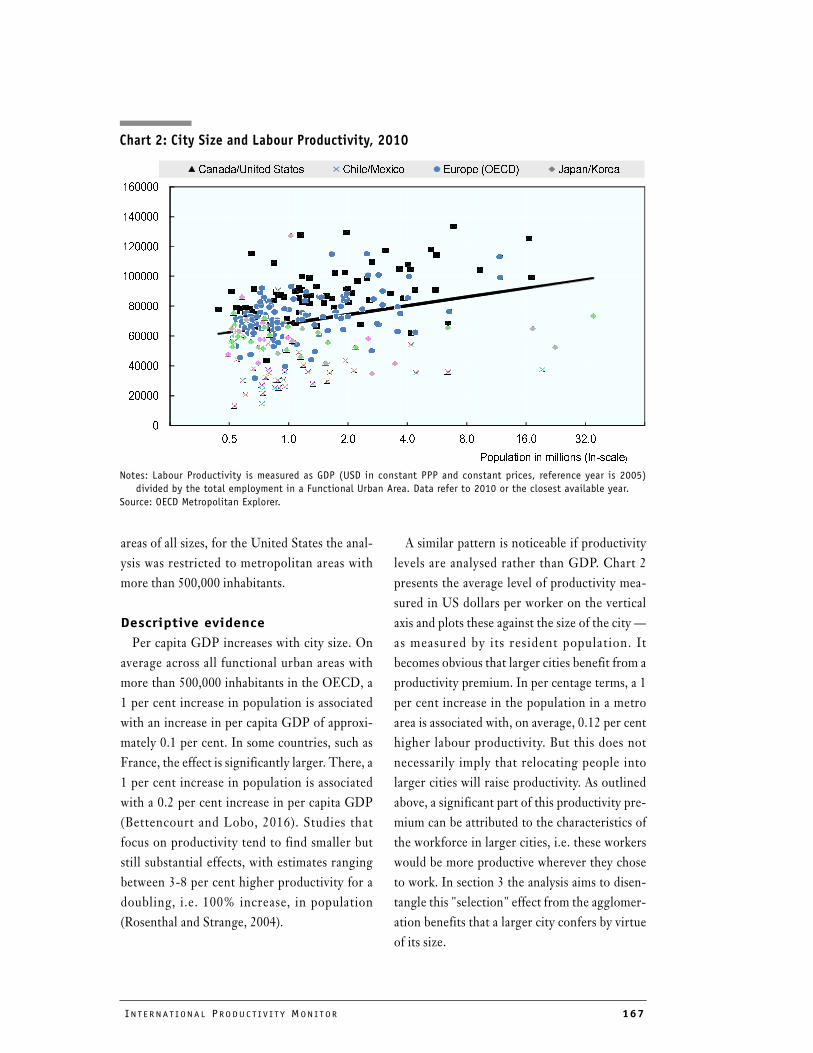
INT E R N A T I ON A L PRO DU C T I V I T Y MON I T OR 167
areas of all sizes, for the United States the anal-
ysis was restricted to metropolitan areas with
more than 500,000 inhabitants.
Descriptive evidence
Per capita GDP increases with city size. On
average across all functional urban areas with
more than 500,000 inhabitants in the OECD, a
1 per cent increase in population is associated
with an increase in per capita GDP of approxi-
mately 0.1 per cent. In some countries, such as
France, the effect is significantly larger. There, a
1 per cent increase in population is associated
with a 0.2 per cent increase in per capita GDP
(Bettencourt and Lobo, 2016). Studies that
focus on productivity tend to find smaller but
still substantial effects, with estimates ranging
between 3-8 per cent higher productivity for a
doubling, i.e. 100% increase, in population
(Rosenthal and Strange, 2004).
A similar pattern is noticeable if productivity
levels are analysed rather than GDP. Chart 2
presents the average level of productivity mea-
sured in US dollars per worker on the vertical
axis and plots these against the size of the city —
as measured by its resident population. It
becomes obvious that larger cities benefit from a
productivity premium. In per centage terms, a 1
per cent increase in the population in a metro
area is associated with, on average, 0.12 per cent
higher labour productivity. But this does not
necessarily imply that relocating people into
larger cities will raise productivity. As outlined
above, a significant part of this productivity pre-
mium can be attributed to the characteristics of
the workforce in larger cities, i.e. these workers
would be more productive wherever they chose
to work. In section 3 the analysis aims to disen-
tangle this "selection" effect from the agglomer-
ation benefits that a larger city confers by virtue
of its size.
Chart 2: City Size and Labour Productivity, 2010
Notes: Labour Productivity is measured as GDP (USD in constant PPP and constant prices, reference year is 2005)
divided by the total employment in a Functional Urban Area. Data refer to 2010 or the closest available year.
Source: OECD Metropolitan Explorer.
0.5 1.0 2.0 4.0 8.0 16.0 32.0
0
20000
40000
60000
80000
100000
120000
140000
160000
Population in millions (ln-scale)
Canada/United States Chile/Mexico Europe (OECD) Japan/Korea
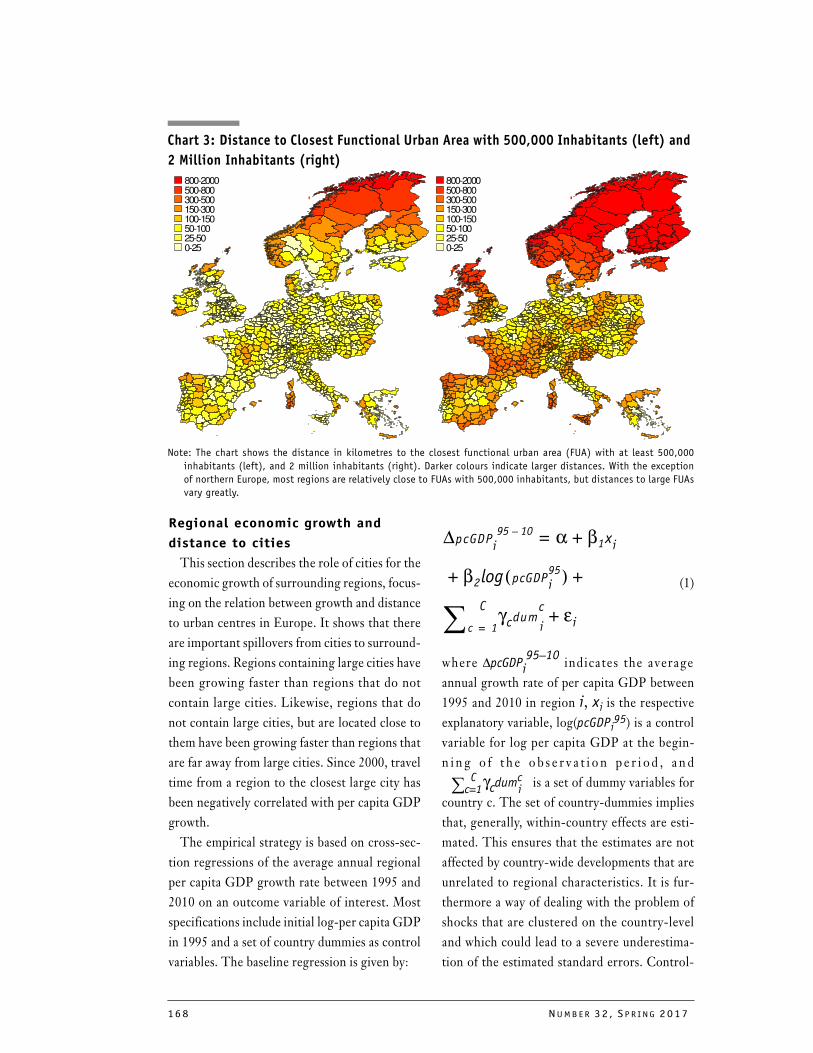
168 NUMB E R 32 , S P R I NG 2017
800-2000
500-800
300-500
150-300
100-150
50-100
25-50
0-25
800-2000
500-800
300-500
150-300
100-150
50-100
25-50
0-25
Regional economic growth and
distance to cities
This section describes the role of cities for the
economic growth of surrounding regions, focus-
ing on the relation between growth and distance
to urban centres in Europe. It shows that there
are important spillovers from cities to surround-
ing regions. Regions containing large cities have
been growing faster than regions that do not
contain large cities. Likewise, regions that do
not contain large cities, but are located close to
them have been growing faster than regions that
are far away from large cities. Since 2000, travel
time from a region to the closest large city has
been negatively correlated with per capita GDP
growth.
The empirical strategy is based on cross-sec-
tion regressions of the average annual regional
per capita GDP growth rate between 1995 and
2010 on an outcome variable of interest. Most
specifications include initial log-per capita GDP
in 1995 and a set of country dummies as control
variables. The baseline regression is given by:
(1)
where indicates the average
annual growth rate of per capita GDP between
1995 and 2010 in region i, xi is the respective
explanatory variable, log(pcGDPi95) is a control
variable for log per capita GDP at the begin-
n i n g o f t h e o b s e r v a t i o n p e r i o d , a n d
is a set of dummy variables for
country c. The set of country-dummies implies
that, generally, within-country effects are esti-
mated. This ensures that the estimates are not
affected by country-wide developments that are
unrelated to regional characteristics. It is fur-
thermore a way of dealing with the problem of
shocks that are clustered on the country-level
and which could lead to a severe underestima-
tion of the estimated standard errors. Control-
∆pcGDPi95 10– α β1xi
β2 pcGDPi95( )log
C
c 1=γcdum
c
iεi+∑
+
+ +
=
∆pcGDPi95 10–
Cc 1=
γcdumci∑
Chart 3: Distance to Closest Functional Urban Area with 500,000 Inhabitants (left) and
2 Million Inhabitants (right)
Note: The chart shows the distance in kilometres to the closest functional urban area (FUA) with at least 500,000
inhabitants (left), and 2 million inhabitants (right). Darker colours indicate larger distances. With the exception
of northern Europe, most regions are relatively close to FUAs with 500,000 inhabitants, but distances to large FUAs
vary greatly.
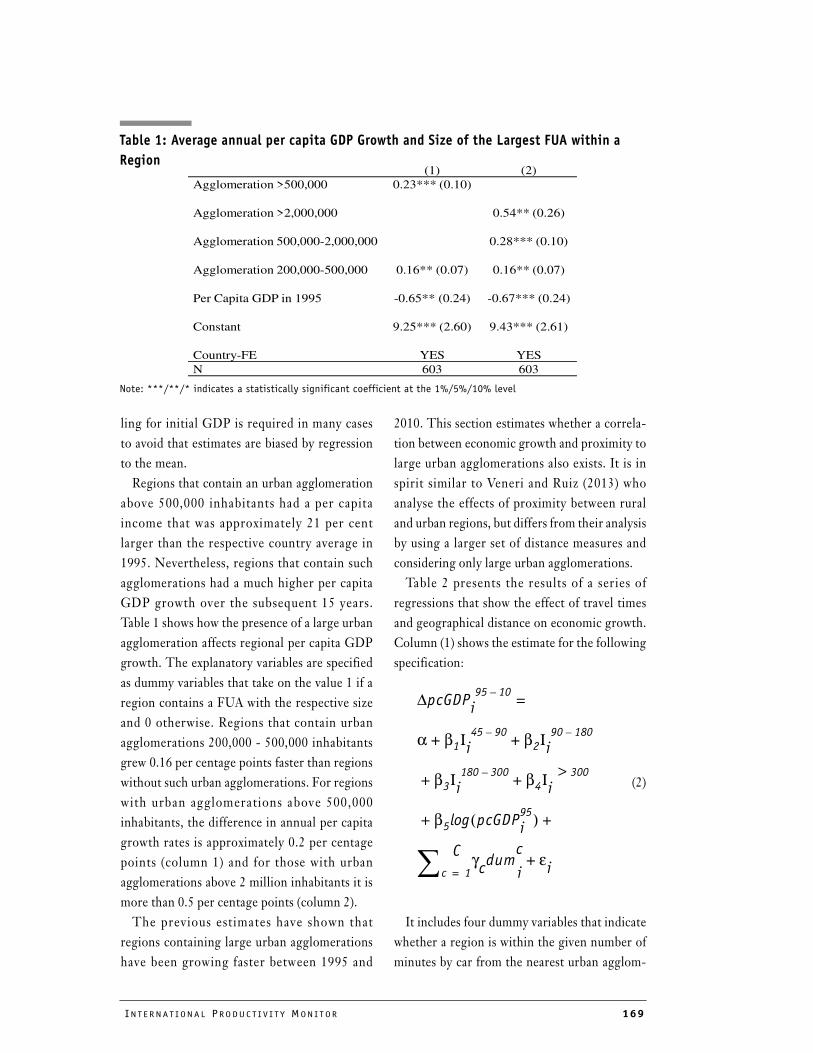
INT E R N A T I ON A L PRO DU C T I V I T Y MON I T OR 169
(1) (2)
Agglomeration >500,000 0.23*** (0.10)
Agglomeration >2,000,000 0.54** (0.26)
Agglomeration 500,000-2,000,000 0.28*** (0.10)
Agglomeration 200,000-500,000 0.16** (0.07) 0.16** (0.07)
Per Capita GDP in 1995 -0.65** (0.24) -0.67*** (0.24)
Constant 9.25*** (2.60) 9.43*** (2.61)
Country-FE YES YES
N 603 603
Table 1: Average annual per capita GDP Growth and Size of the Largest FUA within a
Region
Note: ***/**/* indicates a statistically significant coefficient at the 1%/5%/10% level
ling for initial GDP is required in many cases
to avoid that estimates are biased by regression
to the mean.
Regions that contain an urban agglomeration
above 500,000 inhabitants had a per capita
income that was approximately 21 per cent
larger than the respective country average in
1995. Nevertheless, regions that contain such
agglomerations had a much higher per capita
GDP growth over the subsequent 15 years.
Table 1 shows how the presence of a large urban
agglomeration affects regional per capita GDP
growth. The explanatory variables are specified
as dummy variables that take on the value 1 if a
region contains a FUA with the respective size
and 0 otherwise. Regions that contain urban
agglomerations 200,000 - 500,000 inhabitants
grew 0.16 per centage points faster than regions
without such urban agglomerations. For regions
with urban agglomerations above 500,000
inhabitants, the difference in annual per capita
growth rates is approximately 0.2 per centage
points (column 1) and for those with urban
agglomerations above 2 million inhabitants it is
more than 0.5 per centage points (column 2).
The previous estimates have shown that
regions containing large urban agglomerations
have been growing faster between 1995 and
2010. This section estimates whether a correla-
tion between economic growth and proximity to
large urban agglomerations also exists. It is in
spirit similar to Veneri and Ruiz (2013) who
analyse the effects of proximity between rural
and urban regions, but differs from their analysis
by using a larger set of distance measures and
considering only large urban agglomerations.
Table 2 presents the results of a series of
regressions that show the effect of travel times
and geographical distance on economic growth.
Column (1) shows the estimate for the following
specification:
(2)
It includes four dummy variables that indicate
whether a region is within the given number of
minutes by car from the nearest urban agglom-
∆pcGDPi95 10–
α β1Ιi45 90–
β2Ιi90 180–
β3Ιi180 300–
β4Ιi
1 300>
β5 pcGDPi95
( )log
C
c 1=γcdum
c
iεi
+∑
+ +
+ +
+ +
=
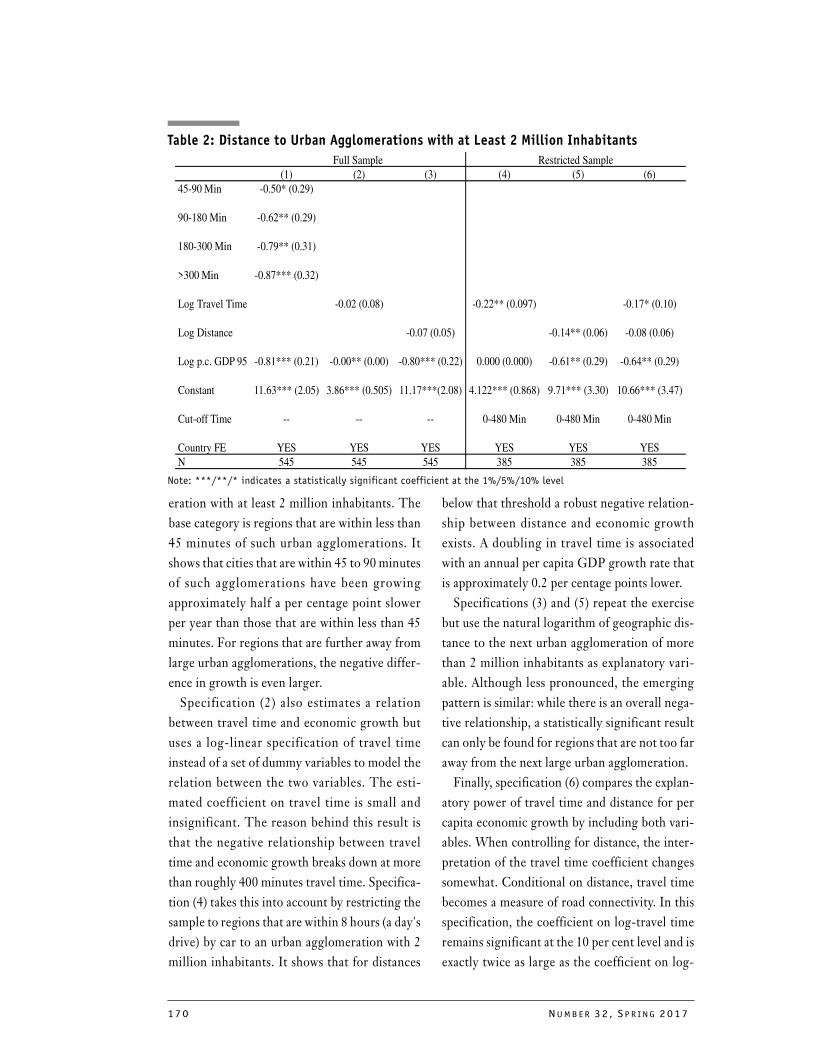
170 NUMB E R 32 , S P R I NG 2017
Full Sample Restricted Sample
(1) (2) (3) (4) (5) (6)
45-90 Min -0.50* (0.29)
90-180 Min -0.62** (0.29)
180-300 Min -0.79** (0.31)
>300 Min -0.87*** (0.32)
Log Travel Time -0.02 (0.08) -0.22** (0.097) -0.17* (0.10)
Log Distance -0.07 (0.05) -0.14** (0.06) -0.08 (0.06)
Log p.c. GDP 95 -0.81*** (0.21) -0.00** (0.00) -0.80*** (0.22) 0.000 (0.000) -0.61** (0.29) -0.64** (0.29)
Constant 11.63*** (2.05) 3.86*** (0.505) 11.17***(2.08) 4.122*** (0.868) 9.71*** (3.30) 10.66*** (3.47)
Cut-off Time -- -- -- 0-480 Min 0-480 Min 0-480 Min
Country FE YES YES YES YES YES YES
N 545 545 545 385 385 385
Table 2: Distance to Urban Agglomerations with at Least 2 Million Inhabitants
Note: ***/**/* indicates a statistically significant coefficient at the 1%/5%/10% level
eration with at least 2 million inhabitants. The
base category is regions that are within less than
45 minutes of such urban agglomerations. It
shows that cities that are within 45 to 90 minutes
of such agglomerations have been growing
approximately half a per centage point slower
per year than those that are within less than 45
minutes. For regions that are further away from
large urban agglomerations, the negative differ-
ence in growth is even larger.
Specification (2) also estimates a relation
between travel time and economic growth but
uses a log-linear specification of travel time
instead of a set of dummy variables to model the
relation between the two variables. The esti-
mated coefficient on travel time is small and
insignificant. The reason behind this result is
that the negative relationship between travel
time and economic growth breaks down at more
than roughly 400 minutes travel time. Specifica-
tion (4) takes this into account by restricting the
sample to regions that are within 8 hours (a day's
drive) by car to an urban agglomeration with 2
million inhabitants. It shows that for distances
below that threshold a robust negative relation-
ship between distance and economic growth
exists. A doubling in travel time is associated
with an annual per capita GDP growth rate that
is approximately 0.2 per centage points lower.
Specifications (3) and (5) repeat the exercise
but use the natural logarithm of geographic dis-
tance to the next urban agglomeration of more
than 2 million inhabitants as explanatory vari-
able. Although less pronounced, the emerging
pattern is similar: while there is an overall nega-
tive relationship, a statistically significant result
can only be found for regions that are not too far
away from the next large urban agglomeration.
Finally, specification (6) compares the explan-
atory power of travel time and distance for per
capita economic growth by including both vari-
ables. When controlling for distance, the inter-
pretation of the travel time coefficient changes
somewhat. Conditional on distance, travel time
becomes a measure of road connectivity. In this
specification, the coefficient on log-travel time
remains significant at the 10 per cent level and is
exactly twice as large as the coefficient on log-
INT E R N A T I ON A L PRO DU C T I V I T Y MON I T OR 171
distance, which turns insignificant. Both point
estimates on the two coefficients are directly
comparable in their magnitude because both
variables are in logarithmic terms. Therefore,
the coefficients can be interpreted as the effect
of a per centage change of the explanatory vari-
able on the outcome. As both variables also have
similar standard deviations, a fixed per centage
change has a comparable importance for both
variables. Therefore, the difference in the esti-
mated coefficients implies that actual distance is
of lower importance than travel time for eco-
nomic growth.
Although travel time between regions and
large urban agglomerations is strongly corre-
lated with economic growth, the picture is less
clear with respect to smaller urban agglomera-
tions. While some specifications (not shown)
suggest that closeness to small and medium-
sized urban agglomerations had a positive effect
on economic growth between 1995 and 2010,
coefficients are imprecisely estimated and typi-
cally not statistically significant.
Several issues potentially bias the estimates
above. One potential source of bias is attenua-
tion bias, since expected travel time from
regional centroid to centroid of the FUA is only
an imperfect measure of actual travel times.
Another source of bias is related to reverse cau-
sality. Travel time was measured in 2013, after
the end of the observation period. If policy mak-
ers respond to expected or actual growth rates
by investing in infrastructure, it is possible that
the differences in travel time are at least partly
caused by per capita GDP growth. If fast grow-
ing regions receive more infrastructure invest-
ments, the estimate on travel time would be
negatively biased (i.e. its effect would be overes-
timated). Correspondingly, if slow growing
regions receive more infrastructure invest-
ments, the effects would be underestimated.
Furthermore, travel time might be correlated
to other factors that affect growth rates over the
observation period. Such factors would intro-
duce omitted variable bias in the estimates.
Especially in sparsely populated regions, for
example, the actual investment into road con-
struction can have a sizable impact on per capita
GDP. It might therefore be the case that part of
the higher growth in better connected regions
comes from the investment that made them bet-
ter connected in the first place. In this case, the
coefficient on travel time would be positively
biased.
Agglomeration Economies in Functional Urban AreasTo understand the role of agglomeration
economies and the importance of cities for the
production in a country, the productivity pre-
mium needs to be separated into two parts. The
first part is productivity that is attributable to
the worker. For example, larger cities have a
larger per centage of highly educated workers. If
these workers were to move to another city, this
c ity would become more productive , not
because of agglomeration economies, but
because inherently more productive workers
"sorted" into the city. This sorting is not ran-
dom. Typically, inherently more productive
workers sort into larger cities. This part of the
productivity premium therefore needs to be sep-
arated from the second part, the agglomeration
economies that arise through a larger popula-
tion being concentrated in an area. These econ-
omies appear as an externality to the worker,
something they cannot take with them when
they move to a smaller city.12
12 Several recent papers highlight that workers actually do retain some of the benefits when moving from a
larger to a smaller city, in line with arguments that highlight the importance of networks and experience they
can gain during the time they live in the larger city (e.g. de la Roca and Puga, 2016, for Spain).
172 NUMB E R 32 , S P R I NG 2017
Methodology
Empirical work attempting to quanti fy
agglomeration economies, while accounting for
selective sorting, has followed two paths. The
first is based on the equilibrium location deci-
sions of firms — under the assumption that firms
will locate where they are most productive (e.g.
Ellison and Glaeser, 1997; Rosenthal and
Strange, 2003). The second strand of empirical
work, the one followed in this article, focuses
instead on the productivity of workers. Empiri-
cal work along these lines has found a relation
between urban density and productivity — prox-
ied by wages — that continues to hold after con-
trolling for both observable and (permanent)
unobservable individual characteristics (e.g.
Glaeser and Maré, 2001 or Combes, Duranton
and Gobillon, 2008).13
In our research, the analysis follows a com-
mon empirical strategy applied across five
OECD countries. This not only ensures that the
individual country results are comparable, but
allows for pooled regressions on the full sample
of cities from five countries. The latter aspect is
of critical importance, given the limited number
of cities in each country. Pooling helps create a
sample with mass not only among small and
medium-sized cities or administratively congru-
ent cites, but also among large or very frag-
mented cities. The harmonized approach is
made possible through the use of an internation-
ally comparable definition of "city" that is based
on economic linkages, rather than administra-
tive boundaries.
Administrative and functional definitions of
cities do not always coincide. Many people who
work in central London, for example, commute
to work from London's surrounding municipal-
ities. Likewise, manufacturing plants that are
located on the outskirts of a city could require
workers to commute out. According to an
administrative definition, such commuting
workers would not live and work in the same
urban area, whereas a functional definition
avoids this bias. More generally, a sole focus on
the central administrative unit of a city will
underestimate the population size of an urban
area, overestimate the density, and might over-
or underestimate its productivity. The empirical
analysis of this article therefore employs the
Functional Urban Area (FUA) definition of cit-
ies (see section 2).
While it is possible to consider aggregate pro-
ductivity at the FUA level, e.g. per worker GDP
(Chart 2), the evident positive slope combines
agglomeration economies with other sources of
higher productivity in larger cities. Crucially,
productivity in larger cities is higher because
they tend to attract more skilled and productive
workers. To disentangle the agglomeration
component and this non-random sorting of
ski l led indiv idua ls , a two-step empir ical
approach is applied separately to national
microdata surveys for the five countries in the
study.14 While it is possible to estimate agglom-
eration benefits directly in the microdata, the
confidential nature of the datasets used would
not allow pooling all 5 samples. Instead, the esti-
mation is split into two parts, estimating pro-
ductivity dif ferences across cit ies in each
country and then explaining these differences in
a pooled sample based on city characteristics. An
important caveat that remains despite the two-
step estimation is that the sorting that can be
taken into account is only the sorting of individ-
13 Much of the literature uses wages as a proxy for productivity. Under standard wage setting mechanisms, the
marginal product of labour should be reflected in wages. Even if higher wages are offset by larger commuting
and housing costs (from the perspective of the worker), if there were no productivity advantages in urban
areas firms would move to low-wage locations.
14 See Combes et al. (2011) for a theoretical discussion of this methodology and Combes et al. (2008) for
earlier implementations of the empirical methodology.
INT E R N A T I ON A L PRO DU C T I V I T Y MON I T OR 173
uals based on observable factors such as educa-
tion or age.
In the first step, the functional EU-OECD
definition of cities is matched with large-scale
administrative or survey-based microdata of
workers from each of the five countries. The
resulting data sets are then used to estimate pro-
ductivity differentials — net of individual skill
differences and other individual level observ-
ables — across cities using an OLS regression of
the natural logarithm of wages on individual
level characteristics and a set of fixed effects for
each city-year combination.15
(3)
denotes the natural logarithm of
wages for individual i in city a in country c at
time t, Χ a vector of individual characteristics, d
a vector of dummy variables (one for each city
and year) that take the value 1 if the individual
resides in city a at time t, and ε denotes an error
term. The coefficient vector of interest, γ, cap-
tures the productivity differential across cities,
net of (observable) skill differences.
Since the primary concern in this study is to
create comparable estimates for all five coun-
tries (Germany, Mexico, Spain, United King-
dom, and United States), the specific controls
that can be included are limited to the controls
available in all five data sets. Not all variables are
available in all countries and the different data
sources include both panel data and repeated
cross-sections. The common set of controls
selected includes age (and its square to allow for
decreasing returns to experience), education
(dummies for degree categories), occupation
(dummies for occupational categories), gender
(dummy) and an indicator for part-time work
(dummy) to account for possible level differ-
ences in wages of part time and full time work-
ers, in addition to the city-year fixed effects.16
The city-year fixed effects obtained in the first
step capture city productivity differentials, net
of the observable skill-relevant characteristics of
the urban workforce for each of the five coun-
tries (c). The estimated productivity differen-
tials are used as the dependent variable
in the second step, in which they are regressed
on indicators for structural and organisational
determinants of city productivity — both time
varying and non-time varying Ζa(c).
Additional country-year fixed effects dct control
for time-fixed differences across countries,
national business cycles and country specific
inflation (the first step estimates nominal pro-
ductivity differentials).
(4)
The estimates are based on a balanced panel of
all cities for the three years that are available for
all five countries (2005-2007). The standard
errors in the OLS estimations are clustered at
the city level to allow for heteroscedasticity and
arbitrary autocorrelation over time (for each
city) in the error term.17
15 This model follows the seminal work by Mincer (1974) and the large body of empirical literature that followed
it. The German data is right-censored, which introduces a bias in OLS estimation. However, comparing the
results from a Tobit model, which accounts for censoring, and the OLS model shows that the bias is negligible
(Ahrend and Lembcke, 2016).
yia c( )t βΧia c( )t
γa c( )t
dia c( )t εia c( )t+ +
=
yia c( )t
16 Panel data are only available for three countries (Germany, Spain, and United Kingdom). The common
specification can therefore not account for individual specific unobserved skill differences in the first
step. While this would be an important improvement, it comes at a cost: identification of productivity
differentials would only rely on individuals who move between cities, a group that is likely highly
selected as mobility is costly (Combes et al., 2011). In addition if agglomeration benefits are persistent
(de la Roca and Puga, 2016), recent movers will have lower/higher productivity than the average compa-
rable worker in the FUA if they moved from a smaller/larger FUA.
γ̂a c( )t
Qa c( )t
γ̂a c( )t δQa c( )t µΖa c( )
θdct υa c( )t
+
+ +
=
174 NUMB E R 32 , S P R I NG 2017
The two-step estimation accounts for selec-
tive sorting based on observable characteristics,
but other aspects might influence productivity
in cities, resulting in biased estimates. One con-
cern is reverse causation, which could result in
either upward or downward bias. For example, a
posi t ive product ivi ty shock can resul t in
increased job opportunities, attracting new resi-
dents to a city, which would result in an upward
bias in the estimated agglomeration economies.
One small step to reduce the possibility of
reverse causality is a definition for Functional
Urban Areas that is based an earlier time period
(2001) than the estimated city-year productivity
differentials (2005-2007), which ensures that
potential changes in the boundaries of successful
cities are not influencing the results.
To further reduce the potential confounding
factors additional controls are introduced to the
specification. These include a capital city and
port city dummies18 and indicators that capture
the industrial and skill structure of cities, calcu-
lated from the five estimation samples. To cap-
ture the industrial structure, the indicators are
the share of employees working in 1-digit indus-
tries, with manufacturing split into four catego-
ries based on technology intensity, and the
Herfindahl index of employment shares at the 2-
digit industry. The Herfindahl index is defined
for each city as the sum of the squared employ-
ment shares in each industry.19 For human capi-
tal, the share of university degree holders among
the 25-64 year old workforce in the city is used.
Summary statistics for each of the indicators are
presented in Ahrend et al. (2014), which also
includes further descriptions of the data sets.20
Results
As a benchmark, it is useful to put numbers to
the suggestive trends for agglomeration econo-
mies in the descriptive graph of Section 2.
Country-by-country regressions show produc-
tivity to be higher in larger cities across all five
countries in this study. When city productivity
differentials are regressed on city population,
the estimated elasticities range from 0.015
(United Kingdom) to 0.063 (United States).
That is, a worker in an U.S. city with a popula-
tion that is 10 per cent larger than that of
another comparable U.S. city is, on average,
about 0.63 per cent more productive.21 The
main results from the pooled regression,
17 As the specifications include country fixed effects the standard errors should ideally be clustered at the coun-
try level. With 5 countries in the sample this is not feasible and spatial autocorrelation in the error could be
a source of bias in the standard errors. In order to affect the statistical significance of the estimates, unob-
served shocks to the productivity level in a city would have to be strongly correlated with shocks to nearby
cities. While some correlation is undoubtedly present and possibly sizeable in some cases (e.g. the smaller
FUAs surrounding London are benefitting from the capital's pull), the effect would need to be large in general
to create concerns for the statistical significance of the key results presented here.
18 Port cities based on Lloyd's List "Ports" (http://directories.lloydslist.com/, accessed 01.07.2013).
19 Spain and Germany are exceptions. For Spain, internal OECD estimates for city population are used. For
Germany, only total employment can be observed; after the results from the last German census, munici-
pality level population data became unavailable. To estimate population in German FUAs the ratio of
employment to population for 2000 (OECD estimates) is used to rescale the observed employment levels
for all years.
20 Despite the additional controls, the specification remains the estimation of a partial equilibrium. In a
general equilibrium, residents might be willing to accept lower productivity (and therefore wages) if
they are compensated by lower cost of living or higher amenities (e.g. in the Rosen-Roback model;
Roback, 1982). This might create a bias if larger cities are associated with higher (dis)amenities, result-
ing in (upward) downward biased estimates.
21 Interpreting the elasticity multiplied by 100 as the per cent increase in productivity associated with a
"doubling in city size" is commonly used in the literature to give an idea of the size of the impact. The
interpretation is not exact as the log-approximation error is only negligible for small changes. The exact
marginal effect for a doubling in city size is the product of the estimated coefficient and the natural log
of 2 (approximately equal to 0.693).
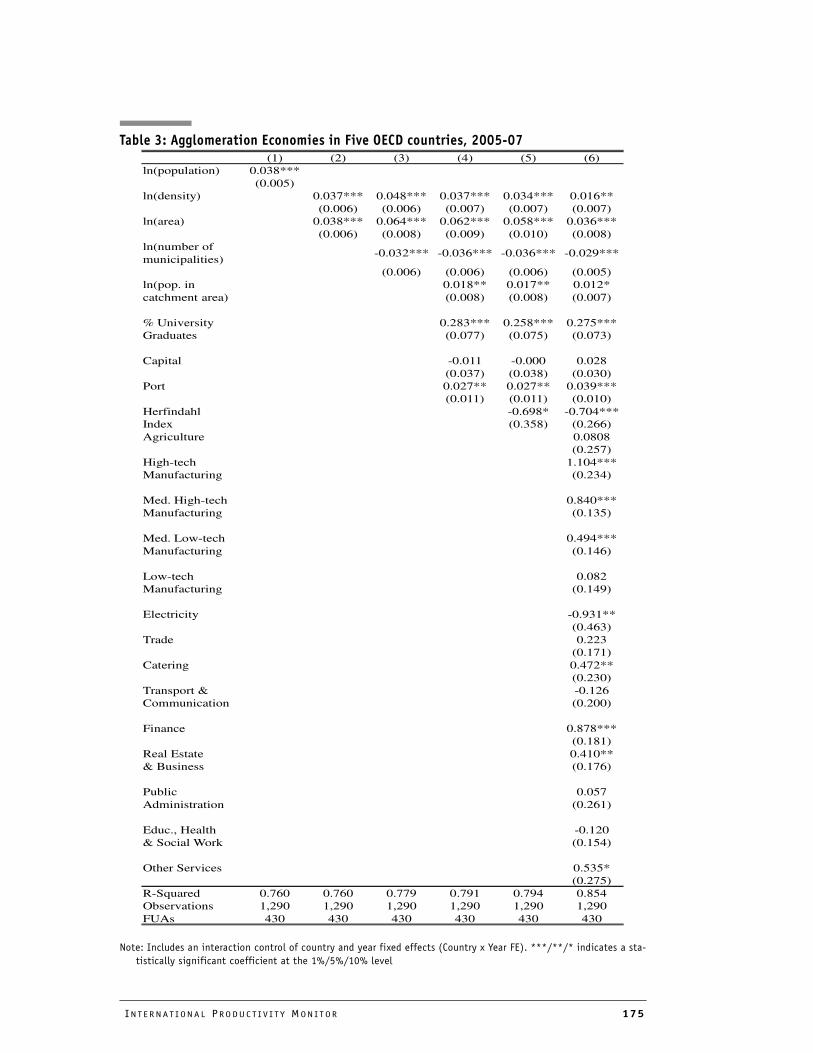
INT E R N A T I ON A L PRO DU C T I V I T Y MON I T OR 175
(1) (2) (3) (4) (5) (6)
ln(population) 0.038***
(0.005)
ln(density) 0.037*** 0.048*** 0.037*** 0.034*** 0.016**
(0.006) (0.006) (0.007) (0.007) (0.007)
ln(area) 0.038*** 0.064*** 0.062*** 0.058*** 0.036***
(0.006) (0.008) (0.009) (0.010) (0.008)
ln(number of
municipalities)-0.032*** -0.036*** -0.036*** -0.029***
(0.006) (0.006) (0.006) (0.005)
ln(pop. in 0.018** 0.017** 0.012*
catchment area) (0.008) (0.008) (0.007)
% University 0.283*** 0.258*** 0.275***
Graduates (0.077) (0.075) (0.073)
Capital -0.011 -0.000 0.028
(0.037) (0.038) (0.030)
Port 0.027** 0.027** 0.039***
(0.011) (0.011) (0.010)
Herfindahl -0.698* -0.704***
Index (0.358) (0.266)
Agriculture 0.0808
(0.257)
High-tech 1.104***
Manufacturing (0.234)
Med. High-tech 0.840***
Manufacturing (0.135)
Med. Low-tech 0.494***
Manufacturing (0.146)
Low-tech 0.082
Manufacturing (0.149)
Electricity -0.931**
(0.463)
Trade 0.223
(0.171)
Catering 0.472**
(0.230)
Transport & -0.126
Communication (0.200)
Finance 0.878***
(0.181)
Real Estate 0.410**
& Business (0.176)
Public 0.057
Administration (0.261)
Educ., Health -0.120
& Social Work (0.154)
Other Services 0.535*
(0.275)
R-Squared 0.760 0.760 0.779 0.791 0.794 0.854
Observations 1,290 1,290 1,290 1,290 1,290 1,290
FUAs 430 430 430 430 430 430
Table 3: Agglomeration Economies in Five OECD countries, 2005-07
Note: Includes an interaction control of country and year fixed effects (Country x Year FE). ***/**/* indicates a sta-
tistically significant coefficient at the 1%/5%/10% level
176 NUMB E R 32 , S P R I NG 2017
reported in Table 3, present equally strong evi-
dence for sizeable agglomeration benefits.22
They indicate that, a city with 10 per cent more
residents is associated with 0.38 per cent higher
productivity (specification 1).
The source of agglomeration economies can
be further disentangled by a specification that
uses both population density and surface area of
the city. The coefficient of (the natural loga-
rithm of) population density gives the elasticity
of city productivity with respect to its popula-
tion size, holding constant the surface area cov-
ered by the city. The coefficient on (the natural
logarithm of) city surface area captures the
impact of an expansion of city limits while pop-
ulation density remains constant; that is, when
population and area expand at the same rate.
Finally, the difference between the area and the
density coefficients gives the estimated impact
of increasing the surface area covered by a city
while holding the total population constant (i.e.
decreasing density with the given population
spreading out over a larger surface).
Interestingly, coefficients for population den-
sity and area are similar (Table 3, specification
2), indicating that both an increased population
for a given surface area, and an increased spatial
extent, while population density remains con-
stant, have similar productivity effects. How-
ever, an increase in the surface area — for a
given population — does not increase produc-
tivity, as suggested by the difference of the two
coefficients that comes to zero. The introduc-
tion of additional city characteristics as controls
leads to estimated agglomeration elasticities
ranging from 0.02 to 0.05, with highly statisti-
cally significant coefficients in all specifications
(Table 3, remaining specifications). The num-
ber of municipalities within a city, a measure of
administrative fragmentation, is negatively cor-
related with productivity. It indicates that
between two cities of the same size, in the same
country, if one has twice the number of munici-
palities within its functional boundaries it is on
average about 2-4 per cent less productive.
Aggregate human capital, measured by the
share of university graduates in the c i ty,
increases productivity. A 10 per centage point
increase in the share of university graduates is
associated with a 2.8 per cent increase in pro-
ductivity. It is important to note that this result
does not indicate the direct impact of human
capital on productivity, but only the externality
associated with working in a city with a large
share of university graduates in the workforce.
And, while port cities exhibit higher productiv-
ity — on average port cities are 2.7-3.9 per cent
more productive than comparable cities without
a port — there appears to be no evidence that
capitals differ systematically from other cities.
Industrial specialization, measured by the
normalized Herfindahl Index of employment
shares at the 2 digit industry level, has a negative
and weakly significant impact. This suggests
that a diversified industrial structure has a posi-
tive impact on productivity. However, variation
in estimates across specifications suggests that
this finding is not overly robust.
Moreover, clear evidence can be found that
cities with a large share of employees in specific
industries exhibit higher productivity. The base
category in the regressions is the share of
employees in construction, such that when an
increase in an industry share is considered, the
share of employees in construction is reduced by
the same amount. The results (specification 6 in
Table 3) indicate that a 1 per centage point
increase in the share of high-tech manufacturing
workers (and a concomitant 1 per centage point
decrease in the share of construction workers) is,
22 Pooling estimates has the advantage of creating a sizeable sample that allows the introduction of additional
controls, the price for this advantage is that the estimated elasticity is assumed to be the same in each coun-
try.
INT E R N A T I ON A L PRO DU C T I V I T Y MON I T OR 177
on average, associated with 1.1 per cent higher
productivity in the city. This productivity pre-
mium gradually reduces with the technological
intensity of the manufacturing industry: it is 0.8
and 0.5 per cent for medium-high-tech and
medium-low-tech manufacturing, respectively,
while it becomes insignificant for low-tech man-
ufacturing.
The productivity premium for financial inter-
mediation is estimated at 0.9 per cent for a 1 per
centage point increase in the employment share,
while that of business services and real estate
activity is 0.4 per cent. Interestingly, it is not
only the knowledge-intensive services that yield
a productivity premium, but also technology-
intensive manufacturing.
The final variable considered to determine
productivity is the proximity of a Functional
Urban Area to other cities (population in the
catchment areas). The variable aims to incorpo-
rate the idea that the exchange of people, ideas
and goods is greatly simplified by close connec-
tions between places. The indicator measures
the number of people that residents of a given
city can directly interact with, within a "reason-
able" amount of time, the idea being that a meet-
ing of several hours can take place going back
and forth within a day. It is defined as (the natu-
ral logarithm) of all inhabitants in other Func-
tional Urban Areas within a 300 kilometre
radius around a city, divided by the distance.
For the sample of all cities the estimates in
Table 3 indicate that, ceteris paribus, a 10 per
cent increase in the (distance weighted) number
of city residents within 300km is associated with
0.1-0.2 per cent higher productivity. While this
effect suggests that cities benefit from proximity
to other urban agglomerations, it is unlikely to
capture the full impact of the position of a city
within its local network of cities and rural areas.
For example, estimates by Partridge et al.
(2009b) for the United States show that the
impact on earnings differs for counties with cit-
ies of different sizes and that it is the distance to
large agglomerations that create the strongest
benefits, rather than general market potential.
ConclusionThis article provides cross-country estimates
of agglomeration economies for functional
urban areas that are independent of administra-
tive boundaries. Using an internationally har-
monized definition developed by the EU and the
OECD allows pooling comparable FUAs from
five OECD countries. We find strong support
for the presence of agglomeration economies.
Estimates indicate that for two comparable
workers living in functional urban areas that dif-
fer by 10 per cent in terms of population size,
productivity is, on average, between 0.2 per cent
and 0.5 per cent higher for the worker living in
the larger city. This effect is sizeable; it implies
that a worker in the metropolitan area of Ham-
burg with 3 million inhabitants is expected to be
6-14 per cent more productive than a compara-
ble worker in the functional urban area of
Bayreuth which has less than 200 thousand
inhabitants. Thus, the article provides an impor-
tant addition to the existing l iterature on
agglomeration economies, which generally pro-
vides estimates of similar magnitudes but study
much narrower contexts.
Furthermore, the article highlights that the
presence of large cities translated into higher
regional growth over the 1995 to 2010 period.
Regions that contain a city of at least 500,000
inhabitants experienced annual per capita
growth rates that were approximately 0.2 per
centage points higher than those of regions
without cities of this size. Regions that con-
tained cities of more than 2 million inhabitants
even grew by 0.3 to 0.5 per centage points per
capita and year more than those without cities of
this size. The presence of big cities plays a role
for regional growth even if cities are some dis-
tance away. Among regions that do not contain a
178 NUMB E R 32 , S P R I NG 2017
large functional urban area with more than 2
million inhabitants, those that are closest to one
(typically within 45 to 60 minutes by car) grew
the fastest. Each doubling of travel time reduces
average regional per capita GDP growth by 0.2
per centage points per year.
More generally, the article demonstrates the
important role that cities play in determining
productivity and economic prosperity not just
for their own residents, but also far beyond their
boundaries. By concentrating economic activity
in space, cities increase the productivity of their
residents and make it possible to provide spe-
cialized services that would not be economically
viable otherwise. Surrounding regions benefit
from these services. Due to this influence, cities
matter for the economic performance of large
regions and helping cities to achieve strong eco-
nomic performances can benefit the entire
country.
ReferencesAhrend, R., E. Farchy, I. Kaplanis and A.C. Lembcke
(2014) “What Makes Cities More Productive? Evidence on the Role of Urban Governance from Five OECD Countries,” OECD Regional Development Working Papers, No. 2014/05, (Paris: OECD Publishing), http://dx.doi.org/10.1787/5jz432cf2d8p-en.
Ahrend, R. and A. C. Lembcke (2016) “Does it Pay to Live in Big(ger) Cities? The Role of Agglom-eration Benefits, Local Amenities, and Costs of Living,” OECD Regional Development Work-ing Papers, No. 2016/09, (Paris: OECD Publish-ing), http://dx.doi.org/10.1787/e0490ba8-en.
Ahrend, R. and A. Schumann (2014) “Does Regional Economic Growth Depend on Proximity to Urban Centres?” OECD Regional Develop-ment Working Papers, No. 2014/07, (Paris: OECD Publishing), http://dx.doi.org/10.1787/5jz0t7fxh7wc-en.
Alonso, W. (1973) “Urban Zero Population Growth, Daedalus,” Vol. 102, No. 4, pp. 191-206.
Andersson, F., S. Burgess and J.I. Lane (2007) “Cit-ies, Matching and the Productivity Gains of Agglomeration,” Journal of Urban Economics, Vol. 61, pp. 112-128.
Andini, M., G. de Blasio, G. Duranton and W. Strange (2013) “Marshallian Labour Market
Pooling: Evidence from Italy,” Regional Science and Urban Economics, Vol. 43, pp. 1008-1022.
Bettencourt, L.M.A and J. Lobo (2016) “Urban Scal-ing in Europe,” Journal of The Royal Society Inter-face, Vol 13.
Camagni, R., R. Capello and A. Caragliu (2015) “The Rise of Second-Rank Cities: What Role for Agglomeration Economies?” European Planning Studies, Vol. 23, No. 6, pp. 1069-1089.
Camagni, R., R. Capello and A. Caragliu (2016) “Static vs. Dynamic Agglomeration Economies. Spatial Context and Structural Evolution Behind Urban Growth,” Papers in Regional Science, Vol. 95, No. 1, pp. 133-158.
Combes, P.-P., Duranton, G. and L. Gobillon (2008) “Spatial Wage Disparities: Sorting Matters,” Journal of Urban Economics, Vol. 63, No. 2, pp. 723-742.
Combes, P.-P., G. Duranton and L. Gobillon (2011) “The Identification of Agglomeration Econo-mies,” Journal of Economic Geography, Vol. 11, pp. 253-266.
Costa, D.L. and M.E. Kahn (2000) “Power Couples: Changes in the Locational Choice of the College Educated, 1940-1990,” Quarterly Journal of Eco-nomics, Vol. 115, No. 4, pp. 1287-1315.
De La Roca, J. and D. Puga (2016) “Learning by Working in Big Cities,” Review of Economic Stud-ies, Vol. 84, No. 1, pp. 106-142
Duranton, G. and D. Puga (2004) “Micro-Founda-tions of Urban Agglomeration Economies,” in Henderson, J.V. and J.F. Thisse (eds.), Hand-book of Regional and Urban Economics, Vol. 4, Ch. 48, pp. 2063-2117.
Ellison, G. and E.L. Glaeser (1997) “Geographic Concentration in U.S. Manufacturing Industries: A Dartboard Approach,” Journal of Political Econ-omy, Vol. 105, No. 5, pp. 889-927.
Eurostat (2017) “Modal Split of Passenger Transport (tsdtr210),” Statistical Database, accessed May 29, 2017.
Figueiredo, O., P. Guimarães and D. Woodward (2014) “Firm-Worker Matching in Industrial Clusters,” Journal of Economic Geography, Vol. 14, pp. 1-19.
Florida, R. (2002) “The Rise of the Creative Class: And How It’s Transforming Work, Leisure, Community and Everyday Life,” (New York: Basic Books).
Fujita, M., P. Krugman and A.J. Venables (1999) “The Spatial Economy: Cities, Regions and International Trade,” (Cambridge, MA: MIT Press).
Glaeser, E.L.. and D. Maré (2001) “Cities and Skills,” Journal of Labor Economics, Vol. 19, No. 2, pp. 316-342.
INT E R N A T I ON A L PRO DU C T I V I T Y MON I T OR 179
Mincer, J. (1974) “Schooling, Experience and Earn-ing,” National Bureau of Economic Research.
OECD (2012) “Redefining "Urban": A New Way to Measure Metropolitan Areas,” (Paris: OECD Pub-lishing).
OECD (2016a) “OECD Regional Outlook 2016: Pro-ductive Regions for Inclusive Societies,” (Paris: OECD Publishing)
OECD (2016b) “OECD Regions at a Glance 2016,” (Paris: OECD Publishing).
Partridge, M.D., D.S. Rickman, K. Ali and M.R. Olfert (2009) “Agglomeration Spillovers and Wage and Housing Cost Gradients Across the Urban Hierarchy,” Journal of International Eco-nomics, Vol. 78, No. 1, pp. 126-140.
Redding, S.J. and D. M. Sturm (2008) “The Costs of Remoteness: Evidence from German Division and Reunification,” American Economics Review, Vol. 98, No. 5, pp. 1766-1797.
Roback, J. (1982) “Wages, Rents, and the Quality of Life,” Journal of Political Economy, Vol. 90, No. 6, pp. 1257-1278.
Rosenthal, S.S. and W.C. Strange (2003) “Geogra-phy, Industrial Organization and Agglomera-tion,” Review of Economics and Statistics, Vol. 85, No. 2, pp. 377-393.
Rosenthal, S.S. and W.C. Strange (2004) “Evidence on the Nature and Sources of Agglomeration Economies,” in V. Henderson, and J.F. Thisse (eds.) Handbook of Regional and Urban Economics, Vol. 4, Elsevier, pp. 2243-2291.
Veneri, P. and V. Ruiz (2013) “Urban-to-Rural Popu-lation Growth Linkages: Evidence from OECD TL3 Regions,” OECD Regional Development Working Papers, No. 2013/03, (Paris: OECD Publishing), http://dx.doi.org/10.1787/5k49lcrq88g7-en.
INT E R N A T I ON A L PRO DU C T I V I T Y MON I T OR 180
Challenges in the Measurement of Public Sector Productivity in OECD Countries
Edwin Lau, Zsuzsanna Lonti and Rebecca Schultz
OECD1
ABSTRACT
Productivity is one of the main engines of economic growth. While most existing work on
productivity has focused on the private sector, there is great value in better understanding
productivity in the public sector, given government's important role in the provision of
goods and services and its substantial contribution to overall GDP. However, the
measurement of public sector productivity as a first step towards better understanding its
dynamics is fraught with challenges, as the public sector differs substantially from the
private sector in some of its key characteristics. This article examines current country
practices and challenges to measure public sector productivity and identifies five areas to
further enhance measurement efforts: (i) improvements to input measurement and cost
accounting, (ii) standardization and comparability of measures, (iii) output measurement
beyond the education and health sectors, (iv) a typology of activities at the micro level,
and (v) intra-governmental co-ordination on productivity measurement. The article also
calls for further research on the policy drivers for public sector productivity to delve deeper
into how governance frameworks can be mobilized to achieve greater public sector
productivity in support of effective public governance and ultimately the well-being of
citizens.
Productivity, understood as the volume of
output produced for each unit of input, is one of
the main engines of economic growth. While
most OECD work on productivity develop-
ments has focused on the private sector, there is
great value in better understanding productivity
in the public sector, given that government is a
main provider of goods and services to citizens
and government production is responsible for a
substantial share of GDP. However, under-
standing public sector productivity poses several
challenges. The public sector differs substan-
tially from the private sector in some of its key
characteristics.
This article examines current practices and
challenges to measure and improve public sector
productivity and suggests ways forward to
address measurement challenges and delve
deeper into how governance frameworks and
processes can be mobilized to achieve greater
1 Edwin Lau is the Head of Reform of the Public Sector Division, Public Governance Directorate, OECD;
Zsuzsanna Lonti is a Senior Project Manager Government at a Glance, Public Governance Directorate, OECD;
and Rebecca Schultz works as a Policy Analyst, Public Governance Directorate, OECD. This article is an
abridged and revised version of Lau (2017). This article builds on the work currently undertaken by the OECD’
s Public Governance Directorate on public sector productivity. The authors would like to thank Luiz de Mello,
Alessandro Lupi and Delphine Moretti from the OECD’s Public Governance Directorate for their contribution to
this article and Peter van de Ven from the Statistics Directorate of the OECD as well as the anonymous
reviewers and the editor of the journal for their useful comments. Emails: [email protected],
181 NUMB E R 32 , S P R I NG 2017
public sector productivity that supports effective
public governance and ultimately the well-being
of citizens.
Productivity refers to how much output is
produced for each unit of input, calculated as the
ratio of a volume measure of output to a volume
measure of input use (OECD, 2016a).2 Raising
productivity — the ability of economic actors to
produce more outputs with better-combined
inputs, or use fewer inputs to provide the same
outputs — is the engine of economic growth.
Improving public sector productivity is high
on many countries' political agendas.3 OECD
countries are facing significant demographic
challenges with their aging populations and
increasing dependency ratios that will affect
both the demand for public services and the
capacity to deliver them. In order to accommo-
date these developments, either more resources
are needed or the productivity of the public sec-
tor has to increase. Also, most OECD countries
are still experiencing fragile public finances with
high debts and continuing deficits, so there is
still a need for retrenchment over the medium
term. Public managers are obliged to maximize
the return to the public, including making the
most out of the available talent in the public sec-
tor, and are accountable to the citizens for the
efficient operations and results achieved of the
public sector.
UK estimates show that different rates of
growth in public sector productivity have signif-
icant effects on the public sector debt relative to
GDP (DCLG, 2015). Moreover, trust in gov-
ernment is also declining in OECD countries,
especially in those countries that were the hard-
est hit by the last economic and financial crisis.
The provision of better quality public services
through better resource utilization — which
means increasing productivity — could help
improve citizens' views on government, and
more specifically on the public institutions pro-
viding these services.
Public sector productivity has a significant
impact on the performance of the national econ-
omy and societal well-being. First and foremost,
the public sector is a major direct producer of
goods and services: on average government pro-
duction costs represents 21.9 per cent of GDP
across OECD countries and gross value added of
government amounted to 12.3 per cent of GDP
in 2015 (Chart 1).4 Governments are the main,
and sometimes only, providers of key goods and
services, such as education, health, social ser-
vices, transportation and infrastructure. In fact,
OECD governments are responsible for 70 per
cent of final consumption expenditures5 on
health goods and services and for 84 per cent of
final consumption expenditures on education. In
addition, the public sector is a key enabler of the
2 As such, the concept of productivity is distinct from related concepts like "value for money", which "implies
that reforms must lead to better quality of services for citizens and businesses or to savings, or to both"
(OECD, 2015c), or cost-effectiveness, which refers to the extent to which an activity attains its desired objec-
tives (OECD, 2013).
3 Public sector in this analysis refers to "general government" as defined in the System of National
Accounts, which does not include public corporations that produce primarily for the market. It encom-
passes central government, state and regional government, local government and social security funds.
"Government units are unique kinds of legal entities established by political processes that have legisla-
tive, judicial or executive authority over other institutional units within a given area. Viewed as institu-
tional units, the principal functions of government are to assume responsibility for the provision of
goods and services to the community or to individual households and to finance their provision out of
taxation or other incomes, to redistribute income and wealth by means of transfers, and to engage in
non-market production (EC, IMF, OECD, UN and World Bank 2009:4:17).
4 Production costs encompass compensation of employees, goods and services used and financed by gov-
ernment (e.g. outsourcing) and other production costs, which include the consumption of fixed capital
(depreciation of capital) and other taxes on production less other subsidies on production. Gross value
added is the difference between gross output and intermediate consumption.
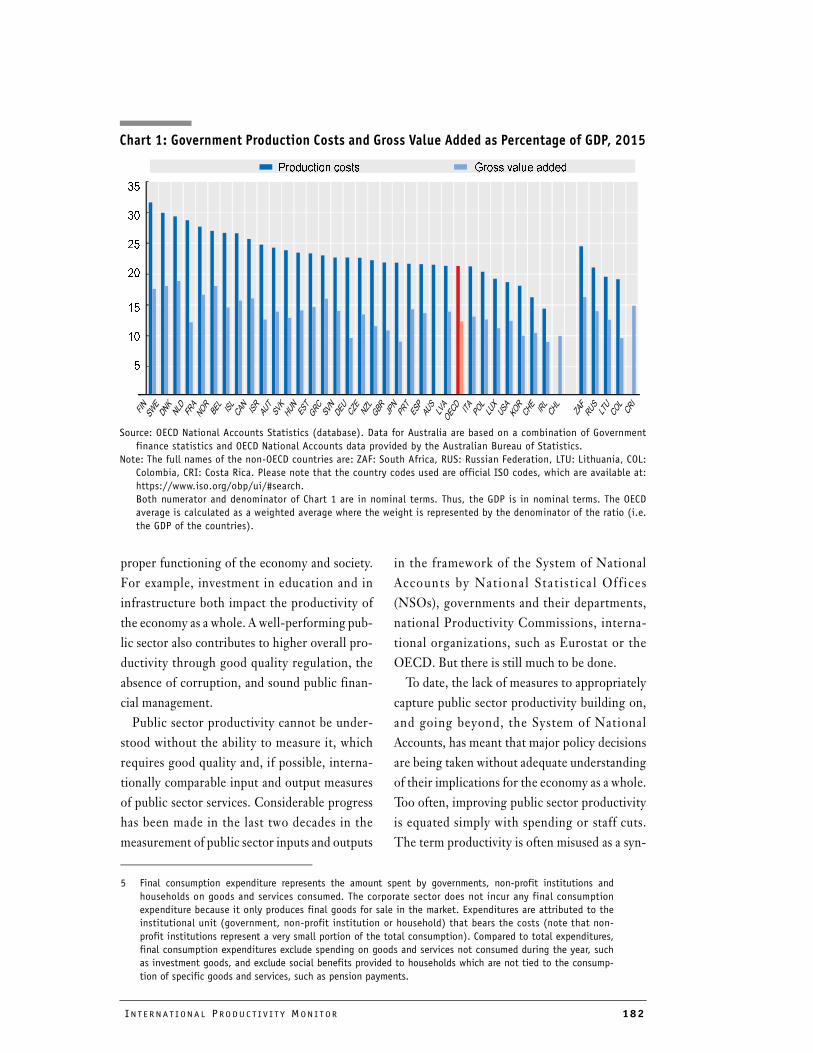
INT E R N A T I ON A L PRO DU C T I V I T Y MON I T OR 182
5
10
15
20
25
30
35
Production costs Gross value added
proper functioning of the economy and society.
For example, investment in education and in
infrastructure both impact the productivity of
the economy as a whole. A well-performing pub-
lic sector also contributes to higher overall pro-
ductivity through good quality regulation, the
absence of corruption, and sound public finan-
cial management.
Public sector productivity cannot be under-
stood without the ability to measure it, which
requires good quality and, if possible, interna-
tionally comparable input and output measures
of public sector services. Considerable progress
has been made in the last two decades in the
measurement of public sector inputs and outputs
in the framework of the System of National
Accounts by Nat ional Sta t is t ica l Off ices
(NSOs), governments and their departments,
national Productivity Commissions, interna-
tional organizations, such as Eurostat or the
OECD. But there is still much to be done.
To date, the lack of measures to appropriately
capture public sector productivity building on,
and going beyond, the System of National
Accounts, has meant that major policy decisions
are being taken without adequate understanding
of their implications for the economy as a whole.
Too often, improving public sector productivity
is equated simply with spending or staff cuts.
The term productivity is often misused as a syn-
5 Final consumption expenditure represents the amount spent by governments, non-profit institutions and
households on goods and services consumed. The corporate sector does not incur any final consumption
expenditure because it only produces final goods for sale in the market. Expenditures are attributed to the
institutional unit (government, non-profit institution or household) that bears the costs (note that non-
profit institutions represent a very small portion of the total consumption). Compared to total expenditures,
final consumption expenditures exclude spending on goods and services not consumed during the year, such
as investment goods, and exclude social benefits provided to households which are not tied to the consump-
tion of specific goods and services, such as pension payments.
0
5
10
15
20
25
30
35
Chart 1: Government Production Costs and Gross Value Added as Percentage of GDP, 2015
Source: OECD National Accounts Statistics (database). Data for Australia are based on a combination of Government
finance statistics and OECD National Accounts data provided by the Australian Bureau of Statistics.
Note: The full names of the non-OECD countries are: ZAF: South Africa, RUS: Russian Federation, LTU: Lithuania, COL:
Colombia, CRI: Costa Rica. Please note that the country codes used are official ISO codes, which are available at:
https://www.iso.org/obp/ui/#search.
Both numerator and denominator of Chart 1 are in nominal terms. Thus, the GDP is in nominal terms. The OECD
average is calculated as a weighted average where the weight is represented by the denominator of the ratio (i.e.
the GDP of the countries).
183 NUMB E R 32 , S P R I NG 2017
onym for austerity program, rather than search-
ing for strategic agility, improving the mix and
use of inputs, and enhancing the quality of out-
puts for better public outcomes. A better under-
s t and i ng o f pub l i c s e c to r p roduc t i v i t y
measurement challenges can therefore provide
insights into how public sector productivity can
be improved.
This article is based on a short survey carried
out by the OECD at the end of 2016 and early
2017 on country practices in productivity mea-
surement.6 The survey was designed as a map-
ping exercise to collect basic information on
countries' general efforts to measure public sec-
tor productivity from a managerial perspective.
Data presented are self-reported and aim at cap-
turing countries' (exploratory) managerial
efforts to measure public sector productivity
rather than measuring public sector productivity
in their national accounts systems. The survey
was sent to senior budget officials and produc-
tivity commissioners in OECD member and
partner countries to collect information on (i)
the methodologies applied to measure public
service productivity, (e.g. use of cost accounting
and quality adjustment); (ii) targeted sectors,
organizations and functions; (iii) main organisa-
tions responsible for this work; and (iv) the use
of productivity measures in government. Thirty
OECD member and two partner countries
responded to the survey.
The article first presents an overview of exist-
ing efforts to measure public sector productiv-
ity, followed by an analysis of the specificities of
productivity measures for the public sector. It
concludes with five concrete suggestions to
enhance existing measures of public sector pro-
ductivity and reflects on the role of measure-
ment to support further research on ways to
improve public sector productivity.
Which Aspects of Public
Sector Productivity Be
Measured?Productivity in the public sector can be mea-
sured at several levels depending on the focus of
the inquiry. At the macro level, the productivity
of the whole public sector is calculated, which
allows for the estimation of the public sector's
contribution to the performance of the whole
economy and to a more accurate estimate of
GDP growth. At the meso level, the focus is on
the productivity of the various policy sectors,
such as education or health. At the micro level,
the performance of individual organizations —
e.g. ministries, agencies, hospitals, schools,
municipalities — as well as key activities and
functions, e.g. shared services, procurement or
waste collection etc. — can be compared not
only within countries but also across countries.
Measurement on all three levels face similar
methodological challenges, such as the identifi-
cation of the concrete services provided, sepa-
rating out the inputs expended on those services
and effective ways to capture changes in quality
over time, etc. A recent OECD survey has col-
lected information on countries' current efforts
to measure public sector productivity on the dif-
ferent levels.7
Macro level
Macro level measurement of productivity is
useful to establish trends over time in one coun-
try, and also compare those trends across coun-
tries. It is less useful for management purposes,
as macro-level data encompasses a diverse set of
activities of numerous units. Given its aggregate
6 The artcile also draws on a review of recent developments in the measurement of public sector productivity
commissioned by the OECD (Robano, 2016) and a paper prepared for the Meeting of the Performance and
Results Working Party (Dunleavy, 2016).
7 See Box 1 in the online Appendix available at: http://www.csls.ca/ipm/32/Lau%20Appendix.pdf
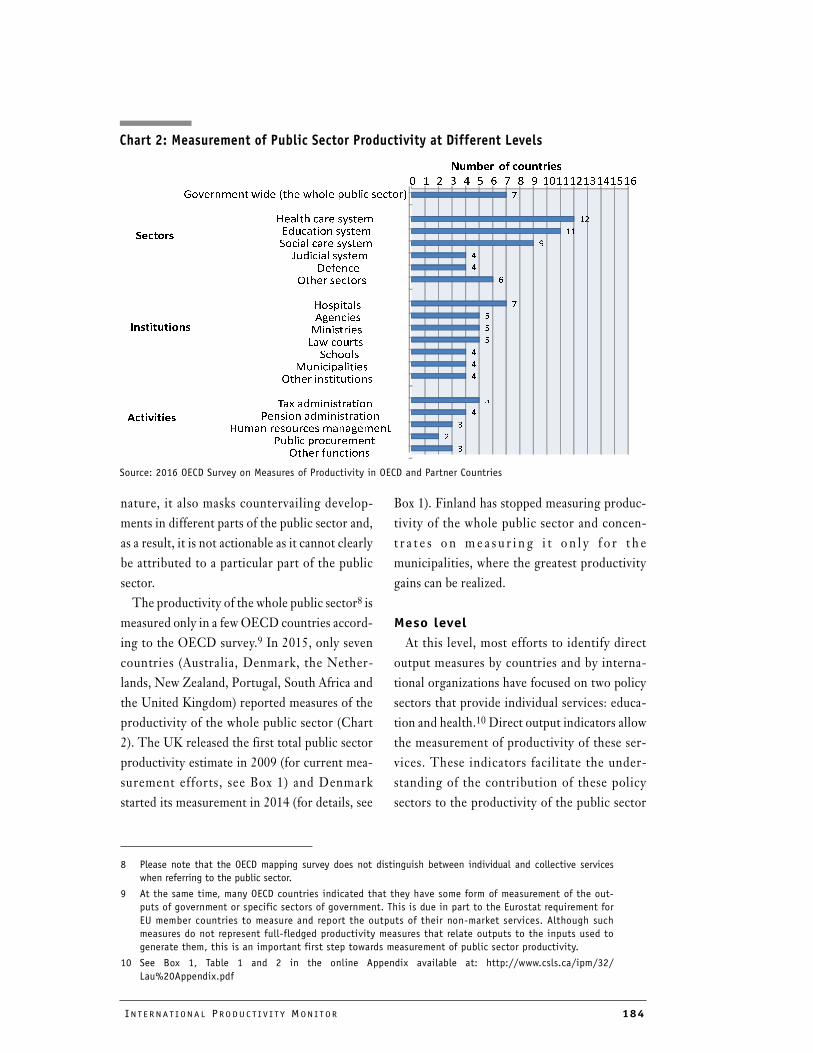
INT E R N A T I ON A L PRO DU C T I V I T Y MON I T OR 184
nature, it also masks countervailing develop-
ments in different parts of the public sector and,
as a result, it is not actionable as it cannot clearly
be attributed to a particular part of the public
sector.
The productivity of the whole public sector8 is
measured only in a few OECD countries accord-
ing to the OECD survey.9 In 2015, only seven
countries (Australia, Denmark, the Nether-
lands, New Zealand, Portugal, South Africa and
the United Kingdom) reported measures of the
productivity of the whole public sector (Chart
2). The UK released the first total public sector
productivity estimate in 2009 (for current mea-
surement efforts, see Box 1) and Denmark
started its measurement in 2014 (for details, see
Box 1). Finland has stopped measuring produc-
tivity of the whole public sector and concen-
t r a t e s o n m e a s u r i n g i t o n l y f o r t h e
municipalities, where the greatest productivity
gains can be realized.
Meso level
At this level, most efforts to identify direct
output measures by countries and by interna-
tional organizations have focused on two policy
sectors that provide individual services: educa-
tion and health.10 Direct output indicators allow
the measurement of productivity of these ser-
vices. These indicators facilitate the under-
standing of the contribution of these policy
sectors to the productivity of the public sector
8 Please note that the OECD mapping survey does not distinguish between individual and collective services
when referring to the public sector.
9 At the same time, many OECD countries indicated that they have some form of measurement of the out-
puts of government or specific sectors of government. This is due in part to the Eurostat requirement for
EU member countries to measure and report the outputs of their non-market services. Although such
measures do not represent full-fledged productivity measures that relate outputs to the inputs used to
generate them, this is an important first step towards measurement of public sector productivity.
10 See Box 1, Table 1 and 2 in the online Appendix available at: http://www.csls.ca/ipm/32/
Lau%20Appendix.pdf
Chart 2: Measurement of Public Sector Productivity at Different Levels
Source: 2016 OECD Survey on Measures of Productivity in OECD and Partner Countries
�
��
��
�
�
�
�
�
�
�
�
�
�
�
�
�
�
�
�
� � � � � � � � ��������������
������ ������� ��
�� ��������������������������������������
�!�����!����"����
#���!������"����
$���!���!����"����
%�����!���"����
&�'����
(������������
�����!��
)*������
+���������
,!��������
$������
+������!������
(�����������������
-!.�!��������!����
/�������!��������!����
��!�������������!�!*�����
/�����������������
(�����'��������
������
���� ��� ���
�� � � ��
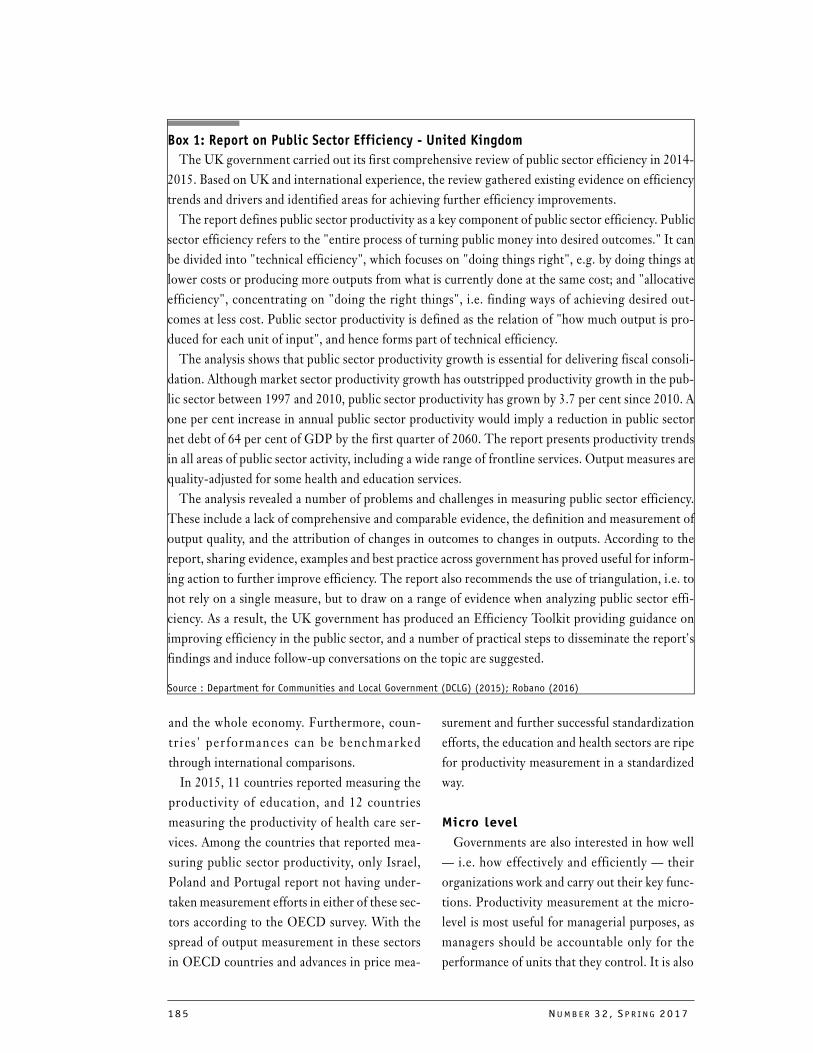
185 NUMB E R 32 , S P R I NG 2017
and the whole economy. Furthermore, coun-
tr ies ' performances can be benchmarked
through international comparisons.
In 2015, 11 countries reported measuring the
productivity of education, and 12 countries
measuring the productivity of health care ser-
vices. Among the countries that reported mea-
suring public sector productivity, only Israel,
Poland and Portugal report not having under-
taken measurement efforts in either of these sec-
tors according to the OECD survey. With the
spread of output measurement in these sectors
in OECD countries and advances in price mea-
surement and further successful standardization
efforts, the education and health sectors are ripe
for productivity measurement in a standardized
way.
Micro level
Governments are also interested in how well
— i.e. how effectively and efficiently — their
organizations work and carry out their key func-
tions. Productivity measurement at the micro-
level is most useful for managerial purposes, as
managers should be accountable only for the
performance of units that they control. It is also
Box 1: Report on Public Sector Efficiency - United Kingdom
The UK government carried out its first comprehensive review of public sector efficiency in 2014-
2015. Based on UK and international experience, the review gathered existing evidence on efficiency
trends and drivers and identified areas for achieving further efficiency improvements.
The report defines public sector productivity as a key component of public sector efficiency. Public
sector efficiency refers to the "entire process of turning public money into desired outcomes." It can
be divided into "technical efficiency", which focuses on "doing things right", e.g. by doing things at
lower costs or producing more outputs from what is currently done at the same cost; and "allocative
efficiency", concentrating on "doing the right things", i.e. finding ways of achieving desired out-
comes at less cost. Public sector productivity is defined as the relation of "how much output is pro-
duced for each unit of input", and hence forms part of technical efficiency.
The analysis shows that public sector productivity growth is essential for delivering fiscal consoli-
dation. Although market sector productivity growth has outstripped productivity growth in the pub-
lic sector between 1997 and 2010, public sector productivity has grown by 3.7 per cent since 2010. A
one per cent increase in annual public sector productivity would imply a reduction in public sector
net debt of 64 per cent of GDP by the first quarter of 2060. The report presents productivity trends
in all areas of public sector activity, including a wide range of frontline services. Output measures are
quality-adjusted for some health and education services.
The analysis revealed a number of problems and challenges in measuring public sector efficiency.
These include a lack of comprehensive and comparable evidence, the definition and measurement of
output quality, and the attribution of changes in outcomes to changes in outputs. According to the
report, sharing evidence, examples and best practice across government has proved useful for inform-
ing action to further improve efficiency. The report also recommends the use of triangulation, i.e. to
not rely on a single measure, but to draw on a range of evidence when analyzing public sector effi-
ciency. As a result, the UK government has produced an Efficiency Toolkit providing guidance on
improving efficiency in the public sector, and a number of practical steps to disseminate the report's
findings and induce follow-up conversations on the topic are suggested.
Source : Department for Communities and Local Government (DCLG) (2015); Robano (2016)
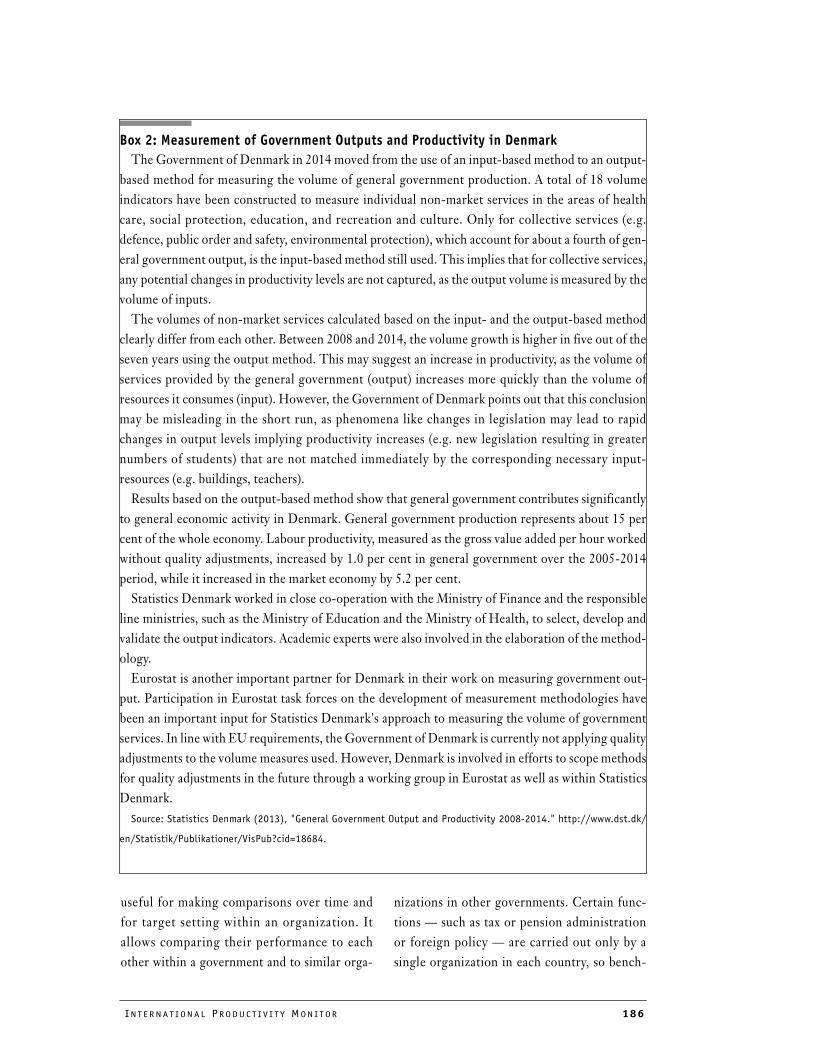
INT E R N A T I ON A L PRO DU C T I V I T Y MON I T OR 186
useful for making comparisons over time and
for target setting within an organization. It
allows comparing their performance to each
other within a government and to similar orga-
nizations in other governments. Certain func-
tions — such as tax or pension administration
or foreign policy — are carried out only by a
single organization in each country, so bench-
Box 2: Measurement of Government Outputs and Productivity in Denmark
The Government of Denmark in 2014 moved from the use of an input-based method to an output-
based method for measuring the volume of general government production. A total of 18 volume
indicators have been constructed to measure individual non-market services in the areas of health
care, social protection, education, and recreation and culture. Only for collective services (e.g.
defence, public order and safety, environmental protection), which account for about a fourth of gen-
eral government output, is the input-based method still used. This implies that for collective services,
any potential changes in productivity levels are not captured, as the output volume is measured by the
volume of inputs.
The volumes of non-market services calculated based on the input- and the output-based method
clearly differ from each other. Between 2008 and 2014, the volume growth is higher in five out of the
seven years using the output method. This may suggest an increase in productivity, as the volume of
services provided by the general government (output) increases more quickly than the volume of
resources it consumes (input). However, the Government of Denmark points out that this conclusion
may be misleading in the short run, as phenomena like changes in legislation may lead to rapid
changes in output levels implying productivity increases (e.g. new legislation resulting in greater
numbers of students) that are not matched immediately by the corresponding necessary input-
resources (e.g. buildings, teachers).
Results based on the output-based method show that general government contributes significantly
to general economic activity in Denmark. General government production represents about 15 per
cent of the whole economy. Labour productivity, measured as the gross value added per hour worked
without quality adjustments, increased by 1.0 per cent in general government over the 2005-2014
period, while it increased in the market economy by 5.2 per cent.
Statistics Denmark worked in close co-operation with the Ministry of Finance and the responsible
line ministries, such as the Ministry of Education and the Ministry of Health, to select, develop and
validate the output indicators. Academic experts were also involved in the elaboration of the method-
ology.
Eurostat is another important partner for Denmark in their work on measuring government out-
put. Participation in Eurostat task forces on the development of measurement methodologies have
been an important input for Statistics Denmark's approach to measuring the volume of government
services. In line with EU requirements, the Government of Denmark is currently not applying quality
adjustments to the volume measures used. However, Denmark is involved in efforts to scope methods
for quality adjustments in the future through a working group in Eurostat as well as within Statistics
Denmark.
Source: Statistics Denmark (2013), "General Government Output and Productivity 2008-2014." http://www.dst.dk/
en/Statistik/Publikationer/VisPub?cid=18684.
187 NUMB E R 32 , S P R I NG 2017
marking them can only be done internationally.
Considerable work has been done for example
on the international comparison of tax adminis-
trations since 2006 in OECD countries (OECD,
2015b). However, while the mandate of these tax
administrations might be similar, their function-
ing and productivity is largely dependent on the
tax policies and the tax codes that they adminis-
ter. As a result, international comparisons of
their efficiency/productivity could pinpoint
changes that might be necessary not only in tax
administration, but also in tax policy.
In the same vein, the productivity of a hospital
is strongly dependent on its case and function
mix, the socio-economic background of its
patients and other factors, and not just on how
efficiently it carries out disease treatments. This
is why comparisons of performance on disease
treatments across hospitals should be inter-
preted with caution. However, the collection of
productivity data for schools, hospitals or
municipalit ies could also produce greater
insights into the possible causes for their differ-
ences in performance. With the increase of the
number of observations, more sophisticated
econometric techniques can be applied, such as
fixed effects regression analysis and stochastic
frontier analysis (Dunleavy, 2016).
Governments may also want to compare how
productive certain functions/practices are. This
type of measurement is in its infancy. The selec-
tion of the functions for which analysis should
be carried out could be based on the following
principles:
• the functions are carried out by most gov-
ernments;
• they contribute substantially to the produc-
tivity of the public sector;
• inputs and outputs of the function can be
defined;
• administrative data on these inputs and out-
puts are readily available; and
• different models exist on how the function is
carried out.
An area that fits these principles is the public
procurement function. A pilot project on how to
measure the productivity/value for money of the
public procurement function is planned in a
number of OECD countries as part of the
OECD work on Civil Service Effectiveness.
Opinions on the usefulness of measuring the
productivity of agencies diverge. Dunleavy
(2016) advocates strongly for measuring pro-
ductivity at the agency level and comparing pro-
ductivity paths (trends over time). He considers
transactional services the most promising area
for productivity measurement and makes the
case that the measurement of productivity of
collective services — e.g. defence or police — is
not insurmountable. He also argues that the
long-run inability to develop widely used mea-
sures of government productivity reflects on one
hand a considerable failure of imagination and
focus in economics and public management
studies, and on the other hand some very sus-
tained resistance by civil servants, public sector
professionals and some politicians to the appli-
cation of ‘crude’ and ‘limited’ measures of gov-
ernment activities.
Specificities of the Public
Sector and its Impact on
Productivity Measurement The measurement of public sector productiv-
ity is rife with considerable difficulties that ema-
nate from the specificities of the public sector.
First, the public sector provides mainly services
— such as education, health, social services,
policing, etc. — and the measurement of service
output is more complicated than the measure-
ment of the production of goods, even in the pri-
vate sector. Services are also heavily reliant on
intangibles and tacit knowledge and are often
process-based. Furthermore, a large share of
government services are not bought and sold,
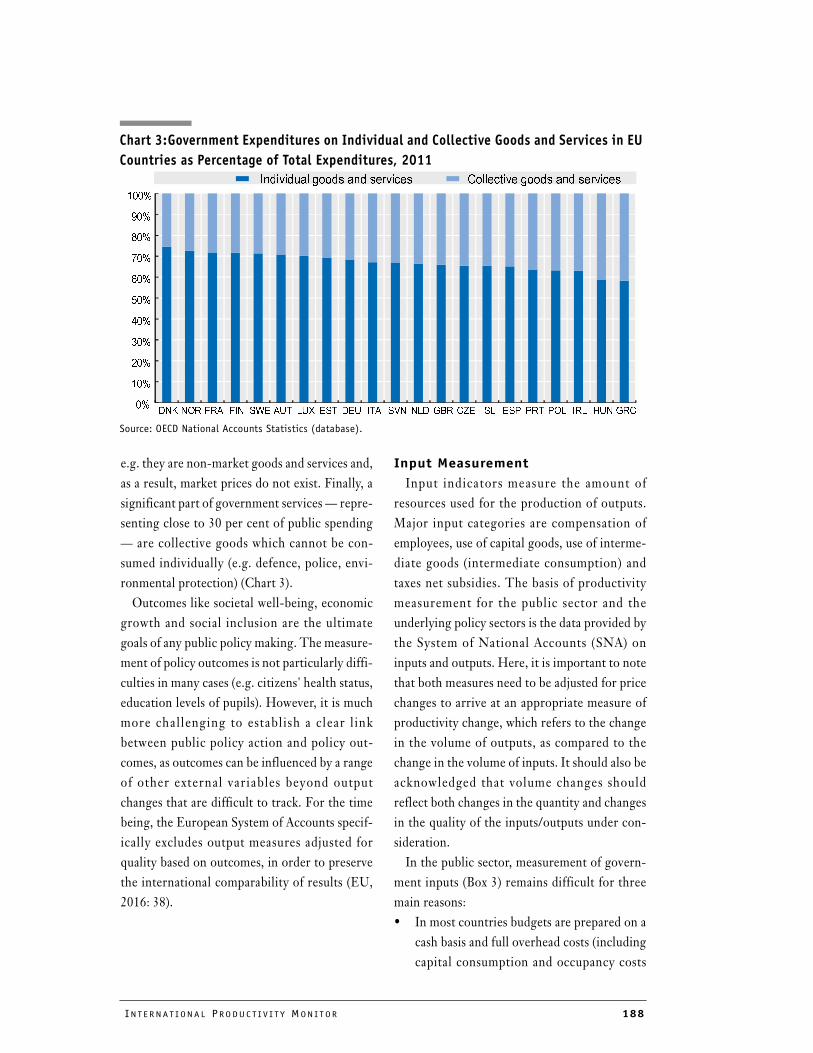
INT E R N A T I ON A L PRO DU C T I V I T Y MON I T OR 188
0%
10%
20%
30%
40%
50%
60%
70%
80%
90%
100%
DNK NOR FRA FIN SWE AUT LUX EST DEU ITA SVN NLD GBR CZE ISL ESP PRT POL IRL HUN GRC
Individual goods and services Collective goods and services
e.g. they are non-market goods and services and,
as a result, market prices do not exist. Finally, a
significant part of government services — repre-
senting close to 30 per cent of public spending
— are collective goods which cannot be con-
sumed individually (e.g. defence, police, envi-
ronmental protection) (Chart 3).
Outcomes like societal well-being, economic
growth and social inclusion are the ultimate
goals of any public policy making. The measure-
ment of policy outcomes is not particularly diffi-
culties in many cases (e.g. citizens' health status,
education levels of pupils). However, it is much
more challenging to establish a clear l ink
between public policy action and policy out-
comes, as outcomes can be influenced by a range
of other external variables beyond output
changes that are difficult to track. For the time
being, the European System of Accounts specif-
ically excludes output measures adjusted for
quality based on outcomes, in order to preserve
the international comparability of results (EU,
2016: 38).
Input Measurement
Input indicators measure the amount of
resources used for the production of outputs.
Major input categories are compensation of
employees, use of capital goods, use of interme-
diate goods (intermediate consumption) and
taxes net subsidies. The basis of productivity
measurement for the public sector and the
underlying policy sectors is the data provided by
the System of National Accounts (SNA) on
inputs and outputs. Here, it is important to note
that both measures need to be adjusted for price
changes to arrive at an appropriate measure of
productivity change, which refers to the change
in the volume of outputs, as compared to the
change in the volume of inputs. It should also be
acknowledged that volume changes should
reflect both changes in the quantity and changes
in the quality of the inputs/outputs under con-
sideration.
In the public sector, measurement of govern-
ment inputs (Box 3) remains difficult for three
main reasons:
• In most countries budgets are prepared on a
cash basis and full overhead costs (including
capital consumption and occupancy costs
Chart 3:Government Expenditures on Individual and Collective Goods and Services in EU
Countries as Percentage of Total Expenditures, 2011
Source: OECD National Accounts Statistics (database).
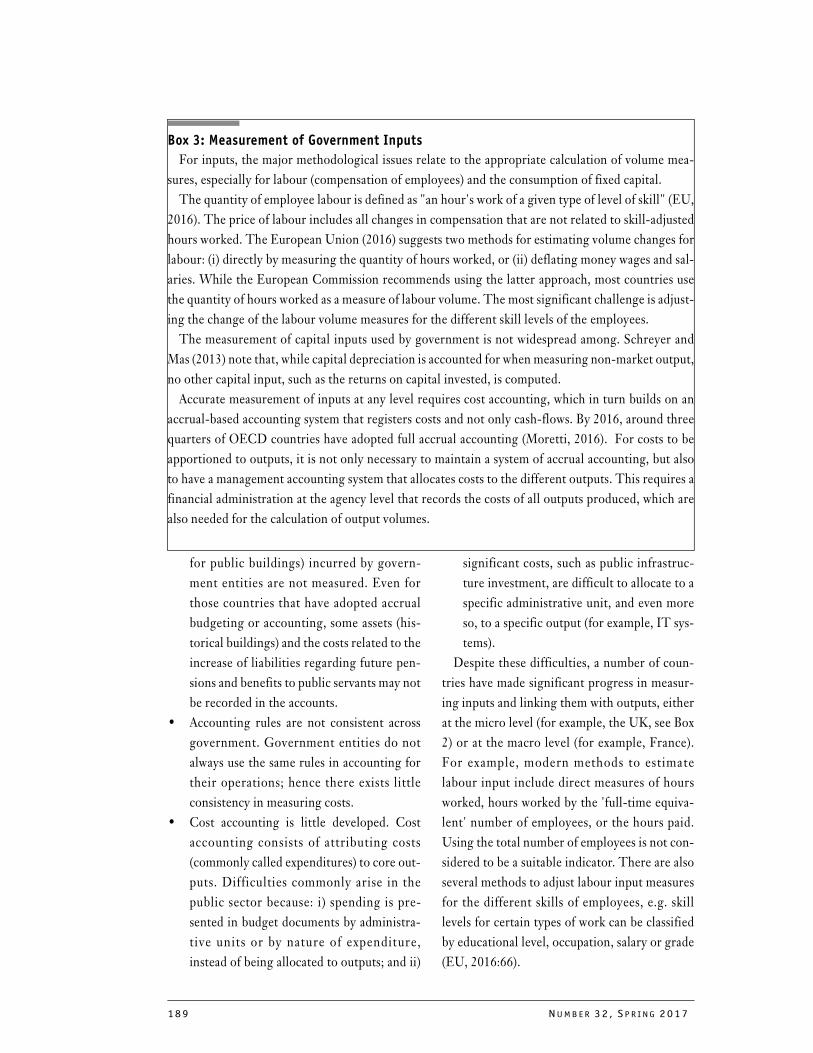
189 NUMB E R 32 , S P R I NG 2017
for public buildings) incurred by govern-
ment entities are not measured. Even for
those countries that have adopted accrual
budgeting or accounting, some assets (his-
torical buildings) and the costs related to the
increase of liabilities regarding future pen-
sions and benefits to public servants may not
be recorded in the accounts.
• Accounting rules are not consistent across
government. Government entities do not
always use the same rules in accounting for
their operations; hence there exists little
consistency in measuring costs.
• Cost accounting is little developed. Cost
accounting consists of attributing costs
(commonly called expenditures) to core out-
puts. Difficulties commonly arise in the
public sector because: i) spending is pre-
sented in budget documents by administra-
tive units or by nature of expenditure,
instead of being allocated to outputs; and ii)
significant costs, such as public infrastruc-
ture investment, are difficult to allocate to a
specific administrative unit, and even more
so, to a specific output (for example, IT sys-
tems).
Despite these difficulties, a number of coun-
tries have made significant progress in measur-
ing inputs and linking them with outputs, either
at the micro level (for example, the UK, see Box
2) or at the macro level (for example, France).
For example, modern methods to estimate
labour input include direct measures of hours
worked, hours worked by the 'full-time equiva-
lent' number of employees, or the hours paid.
Using the total number of employees is not con-
sidered to be a suitable indicator. There are also
several methods to adjust labour input measures
for the different skills of employees, e.g. skill
levels for certain types of work can be classified
by educational level, occupation, salary or grade
(EU, 2016:66).
Box 3: Measurement of Government Inputs
For inputs, the major methodological issues relate to the appropriate calculation of volume mea-
sures, especially for labour (compensation of employees) and the consumption of fixed capital.
The quantity of employee labour is defined as "an hour's work of a given type of level of skill" (EU,
2016). The price of labour includes all changes in compensation that are not related to skill-adjusted
hours worked. The European Union (2016) suggests two methods for estimating volume changes for
labour: (i) directly by measuring the quantity of hours worked, or (ii) deflating money wages and sal-
aries. While the European Commission recommends using the latter approach, most countries use
the quantity of hours worked as a measure of labour volume. The most significant challenge is adjust-
ing the change of the labour volume measures for the different skill levels of the employees.
The measurement of capital inputs used by government is not widespread among. Schreyer and
Mas (2013) note that, while capital depreciation is accounted for when measuring non-market output,
no other capital input, such as the returns on capital invested, is computed.
Accurate measurement of inputs at any level requires cost accounting, which in turn builds on an
accrual-based accounting system that registers costs and not only cash-flows. By 2016, around three
quarters of OECD countries have adopted full accrual accounting (Moretti, 2016). For costs to be
apportioned to outputs, it is not only necessary to maintain a system of accrual accounting, but also
to have a management accounting system that allocates costs to the different outputs. This requires a
financial administration at the agency level that records the costs of all outputs produced, which are
also needed for the calculation of output volumes.
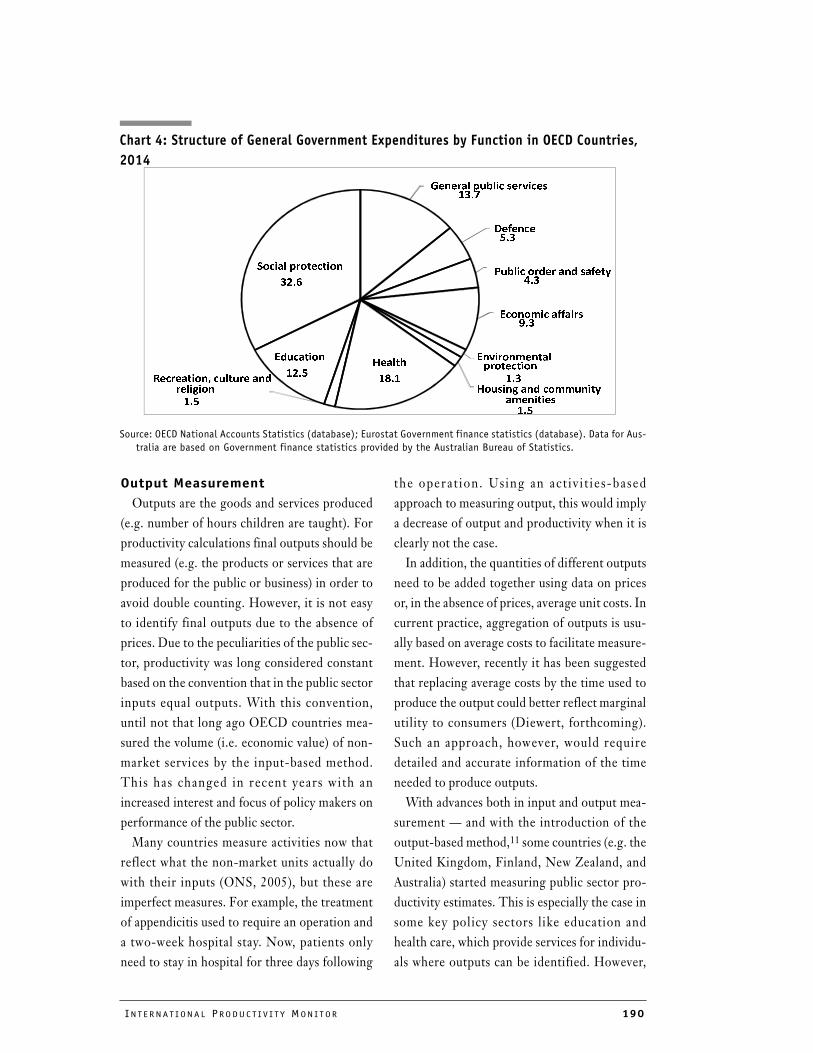
INT E R N A T I ON A L PRO DU C T I V I T Y MON I T OR 190
Output Measurement
Outputs are the goods and services produced
(e.g. number of hours children are taught). For
productivity calculations final outputs should be
measured (e.g. the products or services that are
produced for the public or business) in order to
avoid double counting. However, it is not easy
to identify final outputs due to the absence of
prices. Due to the peculiarities of the public sec-
tor, productivity was long considered constant
based on the convention that in the public sector
inputs equal outputs. With this convention,
until not that long ago OECD countries mea-
sured the volume (i.e. economic value) of non-
market services by the input-based method.
This has changed in recent years with an
increased interest and focus of policy makers on
performance of the public sector.
Many countries measure activities now that
reflect what the non-market units actually do
with their inputs (ONS, 2005), but these are
imperfect measures. For example, the treatment
of appendicitis used to require an operation and
a two-week hospital stay. Now, patients only
need to stay in hospital for three days following
the operat ion. Using an ac t iv i t ies-based
approach to measuring output, this would imply
a decrease of output and productivity when it is
clearly not the case.
In addition, the quantities of different outputs
need to be added together using data on prices
or, in the absence of prices, average unit costs. In
current practice, aggregation of outputs is usu-
ally based on average costs to facilitate measure-
ment. However, recently it has been suggested
that replacing average costs by the time used to
produce the output could better reflect marginal
utility to consumers (Diewert, forthcoming).
Such an approach, however, would require
detailed and accurate information of the time
needed to produce outputs.
With advances both in input and output mea-
surement — and with the introduction of the
output-based method,11 some countries (e.g. the
United Kingdom, Finland, New Zealand, and
Australia) started measuring public sector pro-
ductivity estimates. This is especially the case in
some key policy sectors like education and
health care, which provide services for individu-
als where outputs can be identified. However,
Chart 4: Structure of General Government Expenditures by Function in OECD Countries,
2014
Source: OECD National Accounts Statistics (database); Eurostat Government finance statistics (database). Data for Aus-
tralia are based on Government finance statistics provided by the Australian Bureau of Statistics.
������������� ������
����
�������
���
��������������� �����
���
���������������
���
��������������
����������
���
�� �� ��������������
��������
���
�����!
�"��#���������$�����������
���� ���
���
��������
�%��
&����������������
�%�'
191 NUMB E R 32 , S P R I NG 2017
for collective services, the identification of out-
puts is extremely complicated, and the use of
input method is still common practice (EU,
2016). Similarly, a lack of standardized method-
ologies presents a challenge to international
comparisons of public sector productivity at one
point in time. For now, only developments in
public sector productivity over time within
countries can be compared.
The Atkinson Review (ONS, 2005) was
undertaken in the UK and pioneered important
methodological developments that constituted a
significant advance in the measurement of pub-
lic sector outputs. Since 2006 Eurostat has been
requiring EU members to measure and report
the outputs of their non-market services, a pre-
requisite of productivity measurement. The
OECD has also been working on providing
advice on how to measure the volume of output
for education and health services (OECD, 2010)
in a first attempt to internationally standardize
output measures for these two sectors, and to
develop output price indexes for some services
(e.g. health).
Government's spending on health care and
education in OECD countries represented on
average 18.1 per cent and 12.5 per cent of total
government expenditure respectively in 2014
(Chart 4). These services also are very important
for economic growth as well as for individual
well-being. The data required to identify and
measure the outputs are commonly based on
administrative sources, for the most part readily
available, but in some countries also comple-
mented by survey data. Direct output volume
measurement requires information on prices, or
in the absence of prices unit costs — average
costs per unit of output12 — and quantities of
homogeneous products.
The measurement of volumes has three
dimensions: it needs to take account of varia-
tions in quantities, variations in the composition
of the aggregate product, and variations in the
quality of goods and services (EU, 2016). There
are different practices followed by OECD coun-
tries to apply quality adjustment.13
Output measurement is critical to productiv-
ity measurement. While outputs refer to goods
and services produced by the public sector, from
a performance perspective, what really matters
are the outcomes, i.e. the results that policy
makers intend to achieve through the produc-
tion of those public goods and services. Coun-
tries often have important differences in their
definition of outputs and/or outcomes for the
same activities. For example, in the case of edu-
cation, in some countries the output is identified
as the number of pupils; in others, the number of
hours children are taught. But children go to
school to learn. As a result, the outcome for edu-
cation is considered to be the performance of
students, in practice measured by standardized
tests, such as PISA.
While the quality adjustment of outputs may
seek to take achievement of outcomes into
account in the measurement of outputs, in prac-
tice, it is often hard to delineate outputs and out-
comes and even harder to identify outcomes that
can be solely attributed to public sector activi-
ties and their outputs. For example, the achieve-
ment of students on standardized tests are not
solely the results of the number of hours they are
11 In the output-based method units of quantity for non-market services are defined. By doing this, it is possi-
ble to apply the general principles for calculating volume indices for those services. This can be done in two
ways: directly by calculating a weighted average of quantity changes in a homogeneous number of represen-
tative outputs/activities (i.e. direct volume) or by deflation, using as deflator of a price index and unit cost
index (i.e. indirect volume).
12 The average costs per unit of output does not include changes in the prices of intermediate products
(Lorenzoni, 2015).
13 See Box 2 in the online Appendix available at: http://www.csls.ca/ipm/32/Lau%20Appendix.pdf
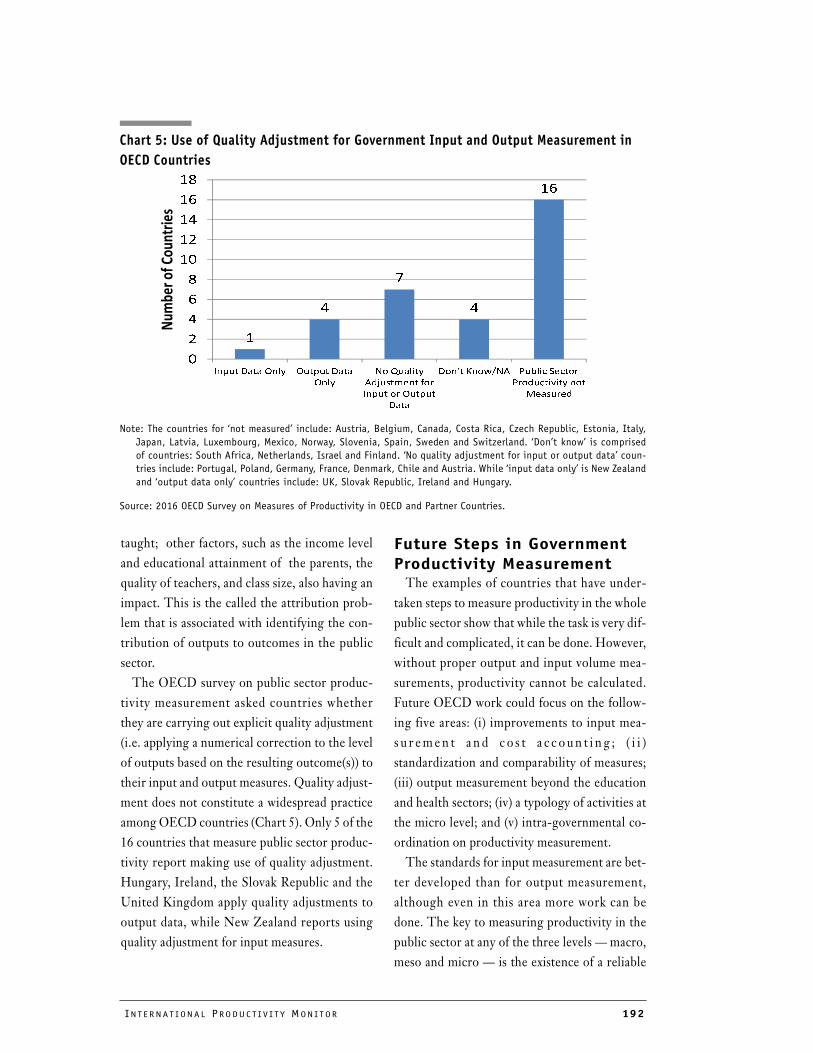
INT E R N A T I ON A L PRO DU C T I V I T Y MON I T OR 192
�
�
�
�
��
�
�
�
�
�
��
��
��
��
��
������������� �����������
��
� ��������
������������ ��
������ ��������
����
� ������ ���� ���������� ��
�� ����� ����� ��
!�������
�������������� ���
taught; other factors, such as the income level
and educational attainment of the parents, the
quality of teachers, and class size, also having an
impact. This is the called the attribution prob-
lem that is associated with identifying the con-
tribution of outputs to outcomes in the public
sector.
The OECD survey on public sector produc-
tivity measurement asked countries whether
they are carrying out explicit quality adjustment
(i.e. applying a numerical correction to the level
of outputs based on the resulting outcome(s)) to
their input and output measures. Quality adjust-
ment does not constitute a widespread practice
among OECD countries (Chart 5). Only 5 of the
16 countries that measure public sector produc-
tivity report making use of quality adjustment.
Hungary, Ireland, the Slovak Republic and the
United Kingdom apply quality adjustments to
output data, while New Zealand reports using
quality adjustment for input measures.
Future Steps in Government
Productivity MeasurementThe examples of countries that have under-
taken steps to measure productivity in the whole
public sector show that while the task is very dif-
ficult and complicated, it can be done. However,
without proper output and input volume mea-
surements, productivity cannot be calculated.
Future OECD work could focus on the follow-
ing five areas: (i) improvements to input mea-
s u r emen t a n d c o s t a c c o un t i n g ; ( i i )
standardization and comparability of measures;
(iii) output measurement beyond the education
and health sectors; (iv) a typology of activities at
the micro level; and (v) intra-governmental co-
ordination on productivity measurement.
The standards for input measurement are bet-
ter developed than for output measurement,
although even in this area more work can be
done. The key to measuring productivity in the
public sector at any of the three levels — macro,
meso and micro — is the existence of a reliable
Chart 5: Use of Quality Adjustment for Government Input and Output Measurement in
OECD Countries
Note: The countries for ‘not measured’ include: Austria, Belgium, Canada, Costa Rica, Czech Republic, Estonia, Italy,
Japan, Latvia, Luxembourg, Mexico, Norway, Slovenia, Spain, Sweden and Switzerland. ‘Don’t know’ is comprised
of countries: South Africa, Netherlands, Israel and Finland. ‘No quality adjustment for input or output data’ coun-
tries include: Portugal, Poland, Germany, France, Denmark, Chile and Austria. While ‘input data only’ is New Zealand
and ‘output data only’ countries include: UK, Slovak Republic, Ireland and Hungary.
Source: 2016 OECD Survey on Measures of Productivity in OECD and Partner Countries.
193 NUMB E R 32 , S P R I NG 2017
cost accounting system that is able to separate
out the input costs to the various outputs. Dif-
ferent steps can be taken to move this agenda
forward: i) harmonizing accounting methods in
the public sector, in order to ensure consistency
in measuring costs; ii) designing new public sec-
tor financial IT systems not only as accounting
tools, but as enablers for productivity measure-
ment; iii) using feedback/knowledge of public
managers to understand which cost data are
meaningful and useful to improve productivity
in their specific area of work.
Much more effort can be undertaken with
regards to output measurement. Given that it is
easier to identify the final outputs for individual
services for individuals, it is most developed for
education, health care and social care services.
Next steps to be taken include broadening out-
put measurement to other individual services.
Developing methodologies to measure collec-
tive service outputs still seems a rather distant
goal and will take a considerable amount of
resources and time. Mixed methods using the
output method for some key services and the
input method for the remainder can provide
interim solutions.
A standardization of measurement practices
would also be useful to enhance comparability.
International organizations, such as the Euro-
pean Commission and the OECD, have contrib-
uted to developing a methodology for price and
volume measurement in national accounts. The
work is the most advanced for the health care
and education services. In order to compare pro-
ductivity in these sectors across countries, fur-
ther standardizat ion of input and output
measurement is needed. This might require
some countries to change the indicators they
currently use, e.g. from the number of pupils to
the number of pupil hours taught.
There is little known about how countries
measure productivity at the microlevel, i.e. the
organization/function level. Most frequently,
existing micro level measurements exist in the
education and health area in the form of league
tables comparing the performance of individual
schools and hospitals. However, the measure-
ment of productivity or value for money of vari-
ous government functions would be equally
beneficial. There is great interest from countries
in this microlevel measurement and great scope
for learning from each other. The UK example
(see Box 2) shows how this could be carried out.
The OECD Secretariat is planning case studies
to look at how productivity/value for money can
be measured for the procurement function and
for digitalization.
Finally, intra-governmental co-ordination is
essential to advance measurement efforts. Insti-
tutional responsibilities for measuring public
sector productivity are different across coun-
tries. Frequently, efforts are led by National Sta-
tistical Offices with the involvement of line
ministries, who are in the best position to decide
on the most important final outputs to be
counted in their area. The assignment of clear
responsibility for public sector productivity
measurement to a specific institution and pro-
viding it with adequate resources to fulfil this
task can help clarify roles and facilitate co-ordi-
nation of data collection. Productivity Commis-
sions, as for example in Australia and New
Zealand, or Productivity Boards have measured
productivity in specific public sector domains
(Dougherty and Renda, 2017), and could also
play a useful role in co-ordinating and promot-
ing productivity measurement in the public sec-
tor.
ConclusionThe drivers of public sector performance and
productivity are manifold. While this presents a
number of challenges, it also means that govern-
ments can mobilize various tools and improve
different processes to increase public sector pro-
ductivity. This article lays the groundwork for
INT E R N A T I ON A L PRO DU C T I V I T Y MON I T OR 194
further OECD research to better understand
public sector productivity and how it can be
improved. It suggests several ways forward to
address measurement challenges and to delve
deeper into how governance frameworks and
processes can be mobilized to achieve greater
public sector productivity.
As a first step, efforts should be made to accu-
rately measure the productivity of the public
sector to help focus attention on public sector
productivity as a policy objective, to support
benchmarking and to identify and compare pos-
sible strategies to improve productivity. Further
development and standardization of measures of
government output and the inputs used to gen-
erate them beyond the education and health sec-
tors are worthwhile. Furthermore, there is great
value and interest in assessing public sector pro-
ductivity in greater detail on the microlevel, i.e.
evaluating closely the productivity of individual
government organizations and functions.
Additional research on the policy drivers for
public sector productivity is also required.
These include implementing digital govern-
ment strategies, strategic human resource man-
agement, creating an enabling environment
conducive to innovation, and understanding
better the impact of budgeting and regulatory
practices. New approaches should be able to
consider the complexity of trade-offs and ten-
sions. An example is associated with the increas-
ing uptake by public sectors of new technologies
that go beyond pure financial decisions, such as
convenience and personal data protection, or
leveraging the economies of scale inherent to
cloud computing. And there are ways to assess
the impact on productivity and public value cre-
ation brought about by new forms of deploying
technology (e.g. shared ICT services and how
they contribute to public sector productivity) or
sharing and processing data.
Only by better understanding the internal
workings of the 'black box' by which govern-
ments transform inputs into outputs and ulti-
mately public outcomes can we map the drivers
of productivity, promote the diffusion of innova-
tions to strengthen public sector productivity
and improve public sector effectiveness. This
task is made more difficult by the rising com-
plexity of government relationships and part-
nerships, in a context of co-design and co-
delivery. Boundary crossing activities and effects
(for example, when productivity increases take
place through the collaboration of organiza-
tions, sectors and citizens) are frequently not
accounted for in current measurement systems.
So while innovation is certainly a vector for
improving productivity in the public sector, as it
is in the private sector, it also represents a mea-
surement challenge as innovation projects in
general can have multiple actors, at both the
same and different levels of the public sector.
Thus it can be difficult to isolate the specific
impact and effect of particular project and/or
particular organisation within a project.
ReferencesCastelli A, Dawson D, Gravelle H and Street A
(2007) “Improving the Measurement of Health System Output Growth,” Health Economics, Vol. 16, No. 10, pp. 1091-107.
Department for Communities and Local Gov-ernment (DCLG) (2015) “Public Sector Effi-ciency: Final Report” from the cross-Whitehall analysts' group July. Strategic Analysis Team, Analysis and Innovation Directorate. mimeo, PPT presentation.
Diewert, W.E. (forthcoming) "Productivity Mea-surement in the Public Sector: Theory and Prac-tice," Oxford Handbook on Productivity.
Dunleavy, P. and L. Carrera (2013) Growing the Pro-ductivity of Government Services, Edward Elgar Publishing.
Dunleavy, P. (2016) "Public Sector Productivity - Measurement Challenges, Performance Infor-mation and Prospects for Improvement," November. https://www.researchgate.net/publi-cation/312595136_Public_Sector_Productivity_-_Measurement_Challenges_Performance_Information_and_Prospects_for_Improvement
195 NUMB E R 32 , S P R I NG 2017
Dougherty, S. and A. Renda (2017) "Pro-Productiv-ity Institutions: Learning from National Experi-ence," International Productivity Monitor, Spring, Vol. 32.
European Communities, International Monetary Fund, Organisation for Economic Co-operation and Development, United Nations and World Bank (2009) “System of National Accounts 2008,” Available at: https://unstats.un.org/unsd/nationalaccount/docs/SNA2008.pdf.
European Union (2016) Handbook on Prices and Vol-ume Measures in National Accounts, Eurostat, http://ec.europa.eu/eurostat/documents/3859598/7152852/KS-GQ-14-005-EN-N.pdf/839297d1-3456-487b-8788-24e47b7d98b2.
Gutacker N., C. Bojke, S. Daidone, N. Devlin, D. Parkin and A. Street (2011) “Truly Inefficient or Providing Better Quality of Care? Analysing the Relationship Between Risk-Adjusted Hospital Costs and Patients' Health Outcomes” Centre for Health Economics. University of York.
Lau, Edwin (2017) “Understanding Public Sector Productivity,” OECD Working Paper Series, forthcoming.
Lorenzoni, Luca (2015) “Note on Price and Volume Measures for Health Care,” Document prepared for the OECD Working Party on National Accounts, http://www.oecd.org/officialdocu-ments/publicdisplaydocumentpdf/?cote=STD/CSSP/WPNA(2015)14&docLanguage=En.
Moretti, D. (2016) "Accrual Practices and Reform Experiences in OECD Countries Results of the 2016 OECD Accruals Survey," OECD Journal on Budgeting, Vol. 16, No. 1.
Netherlands Institute for Social Research (2015) “The Netherlands Public Sector Achievement in 36 Countries,” https://www.scp.nl/english/Pub-lications/Publications_by_year/Publications_2015/Public_sector_achievement_in_36_countries.
National Health Services Information Centre (2011) Provisional Monthly Patient Reported Outcome Measures (PROMs) in England. DOI: http://dx.doi.org/10.1787/9789264060784-en
OECD (2010) Improving Health Sector Efficiency: The Role of Information and Communication Technolo-gies. OECD Health Policy Studies, OECD Pub-lishing, Paris. http://dx.doi.org/10.1787/9789264084612-en
OECD (2013) Government at a Glance 2013, OECD Publishing, Paris.
OECD (2015a) Building on Basics, OECD Publishing, Paris.
OECD (2015b) Tax Administration 2015: Comparative Information on OECD and Other Advanced and Emerging Economies, OECD Publishing, Paris.
OECD (2015c) The State of Public Finances 2015.
OECD (2016) OECD Compendium of Productivity Indicators 2016, OECD Publishing, Paris.
Office for National Statistics (2005) Atkinson Review: Final report. Measurement of Government Output and Productivity for the National Accounts.
Robano, Virginia (2016) "Measuring Public Sector Productivity," Background document prepared for the OECD.
Schreyer P. and M. Mas (2013) “Measuring Health Services in the National Accounts: an Interna-tional Perspective,” http://www.nber.org/chap-ters/c13116.pdf.
Schreyer, P. (2010) “Towards Measuring the Volume Output of Education and Health Services: A Handbook," OECD Statistics Working Papers, 2010/02, OECD Publishing. DOI:10.1787/ 5kmd34g1zk9x-en
Statistics Denmark (2013) “General Government Output and Productivity,” http://www.dst.dk/Site/Dst/Udgivelser/GetPub-File.aspx?id=18683&sid=gengov.
INT E R N A T I ON A L PRO DU C T I V I T Y MON I T OR 196
Pro-Productivity Institutions: Learning from National Experience
Sean Dougherty
OECD
Andrea Renda CEPS and Duke University1
ABSTRACT
This article analyses and compares ten institutions that have a mandate to promote
productivity-enhancing reforms. The selected bodies include government advisory councils,
standing inquiry bodies, and ad hoc task forces. We find that well-designed pro-productivity
institutions can generally improve the quality of the policy process and political debate, and
can make a significant contribution to evidence-based policy-making. Our findings also
support the view that concentrating knowledge and research on productivity in one
independent, highly skilled and reputed body can help create the momentum and the
knowledge that are required to promote long-term productivity growth. Institutions located
outside government have more leeway in promoting reforms that challenge vested interests
and produce results that go beyond the electoral cycle. Smart government bodies can allow
experimental policy-making and a more adaptive, evidence-based policy process. To be
successful, pro-productivity institutions require sufficient resources, skills, transparency and
procedural accountability to fulfil their tasks; a sufficiently broad mission, oriented towards
long-term well-being and with both supply-side and demand-side considerations; policy
evaluation functions; and the ability to reach out to the general public in a variety of ways.
Over the past two decades, promoting pro-
ductivity growth has risen as one of the key chal-
lenges facing policy-makers around the world.
Despite being widely acknowledged as an inter-
mediate, rather than final, goal of economic pol-
icy, productivity is considered as a key driver of
long-run economic prosperity. As Paul Krug-
man (1994) famously observed, “productivity
isn’t everything, but in the long run it is almost
everything. A country’s ability to improve its
standard of living over time depends almost
entirely on its ability to raise its output per
worker.” Against this background, economic
data since 2000, and particularly since the Great
Recession, show a slowdown in productivity
growth that reflects a mix of cyclical and struc-
tural factors (OECD, 2016a). Explanations vary
across countries, and include weak investment in
1 Sean Dougherty is Senior Advisor in the OECD's Economics Department and Public Governance Directorate;
Andrea Renda is Senior Research Fellow and Head of Regulatory Policy at Centre for European Policy Studies
(CEPS and Senior Fellow at Duke University's Kenan Institute for Ethics. This article is a revised and abridged
version of a paper initially prepared for the OECD Global Forum on Productivity meeting in Lisbon, Portugal
(Renda and Dougherty, 2016). It benefitted from Patrick Lenain’s guidance and useful comments by Gary
Banks, Filippo Cavassini, Giuseppe Nicoletti, Fernando Filho, Murray Sherwin, Andrew Sharpe and three anony-
mous referees. Constructive feedback was also received at the Centre for CEPS Ideas Lab and an OECD internal
seminar. Emails: [email protected]; [email protected].
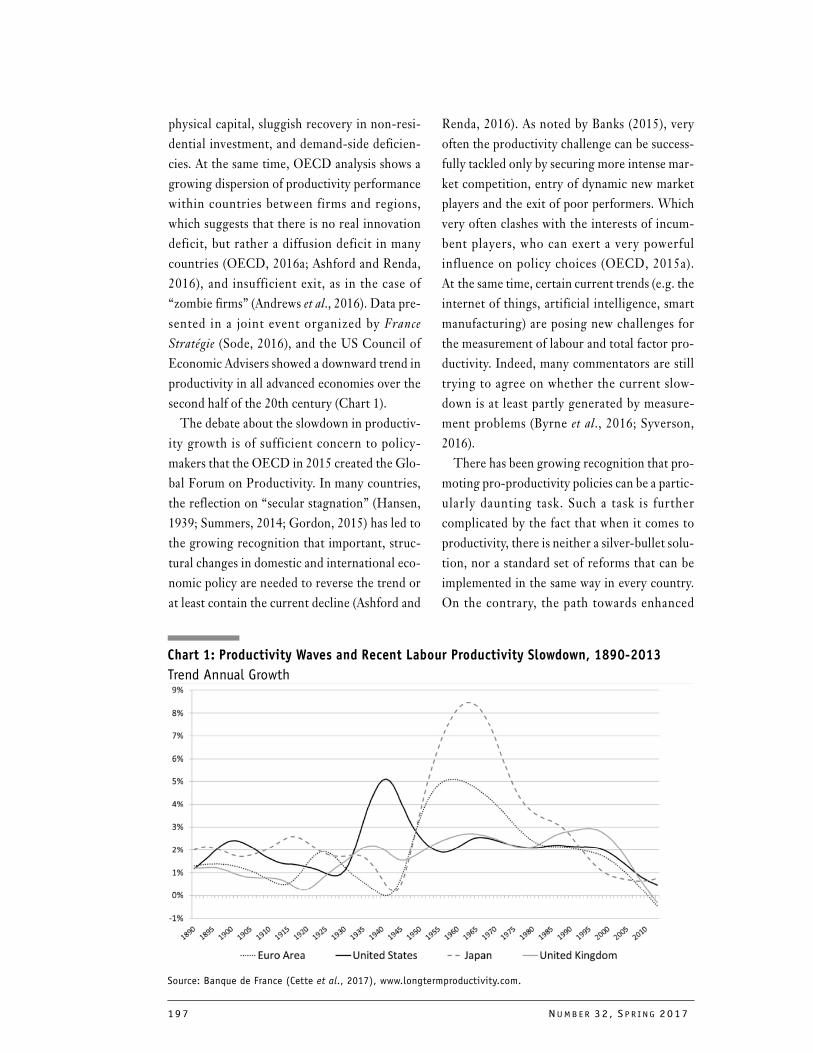
197 NUMB E R 32 , S P R I NG 2017
Chart 1: Productivity Waves and Recent Labour Productivity Slowdown, 1890-2013
Trend Annual Growth
Source: Banque de France (Cette et al., 2017), www.longtermproductivity.com.
physical capital, sluggish recovery in non-resi-
dential investment, and demand-side deficien-
cies. At the same time, OECD analysis shows a
growing dispersion of productivity performance
within countries between firms and regions,
which suggests that there is no real innovation
deficit, but rather a diffusion deficit in many
countries (OECD, 2016a; Ashford and Renda,
2016), and insufficient exit, as in the case of
“zombie firms” (Andrews et al., 2016). Data pre-
sented in a joint event organized by France
Stratégie (Sode, 2016), and the US Council of
Economic Advisers showed a downward trend in
productivity in all advanced economies over the
second half of the 20th century (Chart 1).
The debate about the slowdown in productiv-
ity growth is of sufficient concern to policy-
makers that the OECD in 2015 created the Glo-
bal Forum on Productivity. In many countries,
the reflection on “secular stagnation” (Hansen,
1939; Summers, 2014; Gordon, 2015) has led to
the growing recognition that important, struc-
tural changes in domestic and international eco-
nomic policy are needed to reverse the trend or
at least contain the current decline (Ashford and
Renda, 2016). As noted by Banks (2015), very
often the productivity challenge can be success-
fully tackled only by securing more intense mar-
ket competition, entry of dynamic new market
players and the exit of poor performers. Which
very often clashes with the interests of incum-
bent players, who can exert a very powerful
influence on policy choices (OECD, 2015a).
At the same time, certain current trends (e.g. the
internet of things, artificial intelligence, smart
manufacturing) are posing new challenges for
the measurement of labour and total factor pro-
ductivity. Indeed, many commentators are still
trying to agree on whether the current slow-
down is at least partly generated by measure-
ment problems (Byrne et al., 2016; Syverson,
2016).
There has been growing recognition that pro-
moting pro-productivity policies can be a partic-
ularly daunting task. Such a task is further
complicated by the fact that when it comes to
productivity, there is neither a silver-bullet solu-
tion, nor a standard set of reforms that can be
implemented in the same way in every country.
On the contrary, the path towards enhanced
INT E R N A T I ON A L PRO DU C T I V I T Y MON I T OR 198
productivity varies according to the peculiarity
of the national economy and its institutional set-
tings. Other important factors that further chal-
lenge policy-makers include the partly demand-
driven nature of the productivity slowdown,
which makes traditional supply-side recipes less
likely to be effective by themselves (Anzoategui
et al., 2016); and the need to guarantee an insti-
tutional setting that is conducive to the promo-
tion and implementation of pro-productivity
reforms. In this respect, a plethora of institu-
tions can be put to work with a view to trigger-
ing a more intense and meaningful debate on
which productivity policies are most suited for a
given country. When well-designed, transpar-
ently governed and adequately staffed, such
institutions can serve a key function in ‘neutral-
ising’ the undue influence of vested interests in
key reform areas (Banks, 2015).
This debate is the focus of this article. As elab-
orated by Gary Banks (2015), there are a multi-
tude of institutions directly or indirectly
affecting policies impacting on productivity.
Some of these institutions can be directly estab-
lished by governments through legislation (e.g.
competition authorities, foreign trade tribunals,
auditing bodies, public think tanks; regulatory
oversight bodies, central bank research units,
departmental bureaus, and standing bodies that
advise governments in various forms). Others,
like privately funded research centres and think
tanks, are stimulated by the practice of open
government (e.g. the use of public stakeholder
consultation on proposed legislation; or on ret-
rospective reviews of legislation, see OECD,
2015b). As also noted by Banks (2015), these
institutions appear to flourish more easily and
effectively whenever countries adopt good gov-
ernance practices, and in particular develop a
culture of evidence-based policy, coupled with
arrangements aimed at boosting the transpar-
ency and accountability of government.
In this context, this article discusses national
experiences on ten selected pro-productivity
institutions. It examines the contribution that
such institutions can make to building consen-
sus, convincing stakeholders, confronting vested
interests, establishing credibility and educating
leaders. The ten case studies are the productivity
commissions of Australia, Chile, Denmark,
Mexico, Norway, and New Zealand; the Irish
Competitiveness Council; France Stratégie; the
US Council of Economic Advisers; and the
European Political Strategy Centre in the Euro-
pean Commission. We focus on current institu-
tions at the national level, rather than intra-
governmental or supra-national bodies such as
the OECD itself, or earlier institutions such as
the European Productivity Agency (EPA, 1952-
60), which once had affiliates at the national
level.2
As the reader will realize, these institutions
differ in many respects, including their overall
size (e.g. staff), date of creation, institutional
location, mandate and mission, tasks and deliv-
erables, and budget. In this respect, it is not our
goal to draw comparative judgments. Some of
the institutions we selected do not explicitly
mention productivity in their statutes or mission
statements. As a matter of fact, this wide hetero-
geneity observed across countries when it comes
to institutional design and governance allowed
only for a collection of examples of successes and
challenges that have been experienced by the ten
surveyed institutions.
This article is aimed at collecting and synthe-
sizing the opinion of high-level representatives
of those institutions, and also external opinions
by prominent decision-makers or commentators
with direct knowledge. We conducted ten in-
depth interviews with staff members of the
2 More information on the EPA can be found at http://archives.eui.eu/en/isaar/40.
199 NUMB E R 32 , S P R I NG 2017
selected institutions between June and August
2016 as well as a number of interviews with
external experts selected in agreement with the
OECD, between August and November 2016.
The importance of these experiences is height-
ened by the European Council recommendation
that all Eurozone countries create or designate
Productivity Boards by early 2018.3
This paper will proceed by first describing the
main features of the ten selected institutions,
and second by identifying similarities and differ-
ences among them. Finally, after considering
the institutions' strengths and weaknesses, seven
lessons are drawn from their experience to date.
The Ten Surveyed InstitutionsBased on their names, our ten selected institu-
tions include six productivity commissions,
three advisory councils located at the centre of
government and one competitiveness council.4
However, the boundaries between these institu-
tions are more blurred than it might seem, and
the similarities within categories are also not
always obvious or precise, as explained below.
The six Productivity Commissions are composed
of two major sub-groups that can be identified.
• Four institutions (Australia, Chile,
Mexico, New Zealand) feature a design
that can be said to have been signifi-
cantly inspired by the Australian experi-
ence, already extensively described in
Banks (2015). However, the Australian
Productivity Commission features a size
and degree of independence and institu-
tionalisation that has no equivalent in
other countries.5 In particular, in Mex-
ico and Chile the institutions appear to
rely on highly limited resources.6 In
Mexico, the Commission meets only
four times per year (though the subcom-
mittees work with continuity). The Pro-
ductivity Commission of New Zealand
is somewhere in the middle , with
approximately 20 staff members and
enough budget to perform its own
research and interact with stakeholders
during the conduct inquiries. Also the
age of these institutions is very differ-
ent: the Australian Productivity Com-
mis s ion was crea ted in 1998 (and
followed related institutions that have
existed since the 1920s), while the other
institutions were created very recently,
and the Chi lean Commis s ion was
appointed only in 2015.
• Two productivity commissions (Den-
mark and Norway) were set up as tem-
porary ad hoc task forces, with limited
in-house research capacity and strong
(but not necessarily complete) multi-
stakeholder representation.7 Both insti-
tutions took the form of high-level
multi-stakeholder fora that met regu-
larly for a limited period of time (two
3 Infomation on the National Productivity Boards is provided in a summary prepared by the European Parlia-
ment a t : www.eu ropa r l . e u ropa . eu /RegDa t a/e tude s/ATAG/2016/574423/
IPOL_ATA%282016%29574423_EN.pdf
4 See the OECD’s work on centre of government institutions.
5 The Australian Productivity Commission has 163 staff members selected from the best available research-
ers on the marketplace, and an overall budget that allows for dealing with five large inquiries at the
same time (although it currently does more than that).
6 The Chilean national productivity commission relies on a high-level multi-stakeholder board composed of
eight members, supported by a secretariat of no more than seven researchers, and a budget that should
suffice for two in depth inquiries per year (but is reportedly barely sufficient for one); the Mexican Pro-
ductivity Commission is a permanent multi-stakeholder advisory platform supported by three full-time
members of the economic productivity unit at the Ministry of Finance, although these members have the
possibility of leveraging competence existing in their ministry and other institutions.
7 For example, the Norwegian Productivity Commission could not manage to engage workers’ unions, who
were very reluctant and opposed to the process.
INT E R N A T I ON A L PRO DU C T I V I T Y MON I T OR 200
years), without producing fresh research
or new data, and ended up producing a
report with a set of recommendations on
how to re - l aunch and reform the
national economy in light of existing
challenges (oil price fluctuations for
Norway, productivity slowdown for
Denmark).
Three institutions are not explicitly framed as
productivity commissions, and established as
councils that primarily advise the head of gov-
ernment. These are France Stratégie, the US
Council of Economic Advisers, and the Euro-
pean Political Strategy Centre (EPSC). These
institutions have different sizes, and functions,
and are by no means homogenous: for example,
France Stratégie is involved in policy evaluation,
whereas neither the CEA nor the EPSC play this
role.
One institution, the Irish Competitiveness
Council, was created with a specific mandate on
preserving the international competitiveness of
Ireland, and as such mostly looks at the possible
reforms that would make the country more
attractive for international investors.
Table 1 summarizes of the key features of the
ten selected institutions. The degree of diversity
is remarkable. However, these institutions all
strive to place productivity at the centre of the
debate, with different resources, strategies, tools
and instruments. A review of what has proven to
work and what might have been done differently
could prove useful for all those countries wish-
ing to set up similar institutions in the future.
A Fast-Changing LandscapeIt is useful to locate these institutions within
the broader set of pro-productivity institutions
identified by Banks (2015), who identifies eleven
types of pro-productivity institutions: privately
funded think tanks, publicly funded think tanks,
trade tribunals, competition authorities, audit
bodies, regulatory gatekeepers, departmental
bureaus, central bank research units, advisory
councils, ad hoc task forces, and standing
inquiry bodies.
Within that broad range of institutions, our
choice fell on a narrow subset of examples (see
Table 2): while the Australian and New Zealand
Productivity Commissions and the Irish Com-
petitiveness Council were set up as stand-alone
inquiry bodies, the Mexican and Chilean institu-
tions, together with the US Council of Eco-
nomic Advisers, the EPSC and France Stratégie,
can more properly be classified as advisory
councils (in the case of Mexico, heavily sup-
ported by a departmental bureau); and the Dan-
ish and Norwegian Productivity Commissions
can be classified as ad hoc task forces.8 Our
research broadly confirms the initial assessment
contained in the institutional scorecard devel-
oped by Banks (2015), with some differences
especially for what concerns advisory councils
and ad hoc task forces. As will be explained in
more detail below, a number of countries have
recently appointed similar institutions, without
endowing them with the necessary skills and
research capacity.
One significant finding of our research is the
growing importance and perceived usefulness of
pro-productivity institutions, and more specifi-
cally productivity commissions and advisory
councils.9 The challenges faced by many gov-
ernments and the horizontal, systemic nature of
many of the reforms needed to boost productiv-
ity are leading countries to create independent
8 The Danish Productivity Commission focused systematically on issues of productivity, stressing that higher
productivity growth is a basic driver of the long run growth in real incomes. The Norwegian Productivity Com-
mission was more eclectic, acknowledging that some policy measures such as measures to bring low-skilled
workers into may reduce labour productivity but may nevertheless improve economic efficiency and welfare.
9 Parallel work at the OECD is currently examining aspects of other types of regulatory institutions (OECD,
2016b; OECD, 2017).
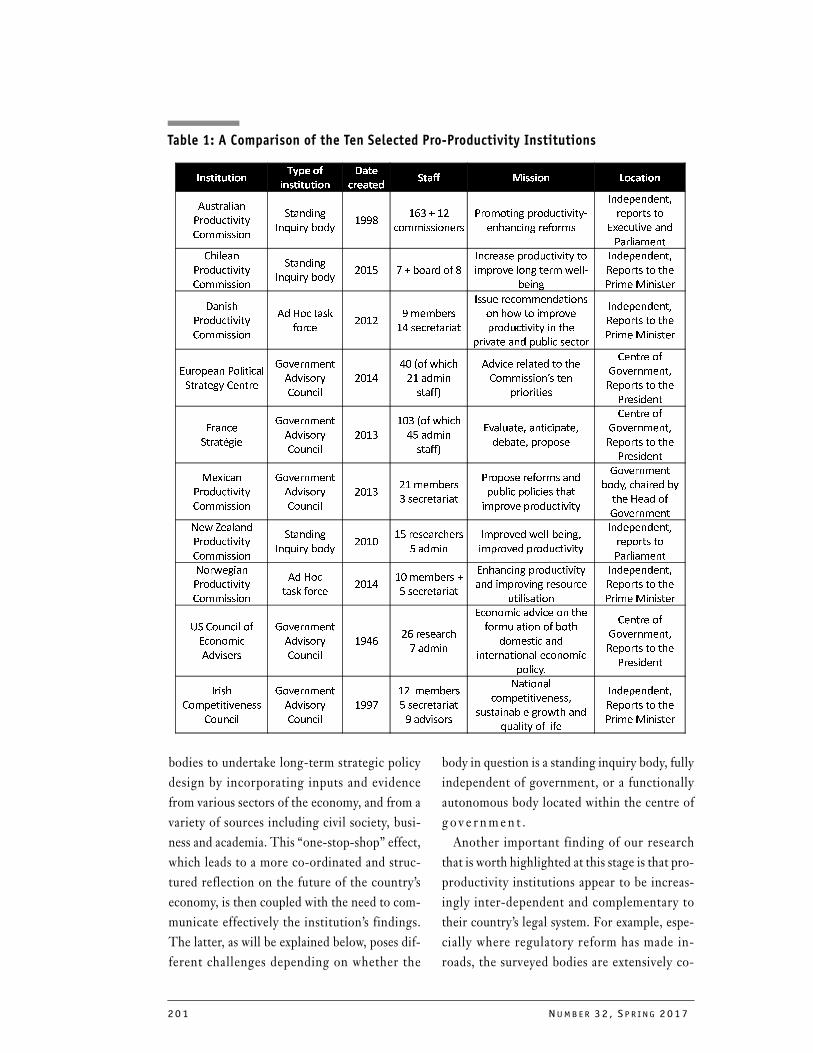
201 NUMB E R 32 , S P R I NG 2017
Table 1: A Comparison of the Ten Selected Pro-Productivity Institutions
bodies to undertake long-term strategic policy
design by incorporating inputs and evidence
from various sectors of the economy, and from a
variety of sources including civil society, busi-
ness and academia. This “one-stop-shop” effect,
which leads to a more co-ordinated and struc-
tured reflection on the future of the country’s
economy, is then coupled with the need to com-
municate effectively the institution’s findings.
The latter, as will be explained below, poses dif-
ferent challenges depending on whether the
body in question is a standing inquiry body, fully
independent of government, or a functionally
autonomous body located within the centre of
g o v e r nmen t .
Another important finding of our research
that is worth highlighted at this stage is that pro-
productivity institutions appear to be increas-
ingly inter-dependent and complementary to
their country’s legal system. For example, espe-
cially where regulatory reform has made in-
roads, the surveyed bodies are extensively co-
�����������
���� �
�����������
�����
�������
��� ������� ��������
���������
��� ��������
���������
��� ��
�������� �
����
������
������������
�������� �� ��������!
�"������#����
� � � ��$
�� ������
%&��������
���������
�"����
��� ��������
���������
��� ��
�������� �
�'�( )����� �#�
������� �� ����������
�� �����������*���!
����
� � � ��$
+� �������"�
�����,������
-���"
��� ��������
���������
� .�����/
#����
�'��
��������
�0�����������
������������ �����
�"�*���� ����
�� ����������"�
������� �����������
� � � ��$
+� �������"�
�����,������
%��� �����������
�������������
1�������
� ������
������
�'�0
0'2�#*"��"
��� ��
���##3
� ���������� ���"�
���������4���
���������
������#
1�������$
+� �������"�
����� ��
5����
�����6���
1�������
� ������
������
�'��
�'�2�#*"��"
0(� ��
���##3
%�������$����� ���$
�����$ �� ���
������#
1�������$
+� �������"�
����� ��
,�&���
��� ��������
���������
1�������
� ������
������
�'��
���������
������������
��� �����#�����
����� ��������"��
�� ���� �� ��������
1�������
�� �$�"���� ��
�"�.�� �#
1�������
7�*8����
��� ��������
���������
��� ��
�������� �
�'�'
�(�������"���
(� ��
�� ���� *���!����$
�� ���� �� ��������
� � � ��$
�� ������
���������
7��*����
��� ��������
���������
� .��
���/#����
�'�0
�'��������
(�����������
%"���� �� ��������
� �� �������������
����������
� � � ��$
+� �������"�
�����,������
9��������#
%������
� ������
1�������
� ������
������
��0�
���������"
)� ��
%������� ������"�
#����������#���"
��������
�����������������
�����:
������#
1�������$
+� �������"�
����� ��
����"
��� ����������
������
1�������
� ������
������
���)
���������
(�����������
�� ������
7������
��� ����������$
�������������*�"�
��������#��#�
� � � ��$
+� �������"�
�����,������
INT E R N A T I ON A L PRO DU C T I V I T Y MON I T OR 202
operating with regulatory gatekeepers (in Mex-
ico, the United States, and to a lesser extent Aus-
tral ia and New Zealand) ; in other cases ,
temporary task forces co-exist with other exist-
ing publicly funded think tanks or advisory
councils (e.g. Denmark). And in most of the
selected countries, central banks and (especially
in the United States and Australia) competition
authorities produce influential research, which
provides support to public policy in the form of
evidence and influential recommendations. The
role of privately funded think tanks is most
apparent in Australia, France, the European
Union and the United States.10
Furthermore, these institutions increasingly
co-operate with each other. The Australian Pro-
ductivity Commission regularly co-operates
with the New Zealand Productivity Commis-
sion, up to the level of producing joint reports,
and has provided assistance and strategic advice
also to the Mexican and Chilean productivity
commissions.11 The US Council of Economic
Advisers and France Stratégie cooperate in the
production and analysis of productivity data.12
The Norwegian Productivity Commission capi-
talized on the format and experience of the Dan-
ish productivity commission, for instance by
including among its members the former chair
of the Danish Commission.
But overall, there is no dedicated standing
network of productivity institutions such as, for
example, the International Competition Net-
work for competition authorities, or more
regional networks such as the European Compe-
tition Network, or the Nordic Cooperation
Agreement between the Danish, Iceland and
Norway Competition Authorities. However, the
recently established OECD Global Forum on
Productivity includes all of these institutions as
members of its Steering Group.
A Closer Look at the Selected
BodiesIn this section we provide a more detailed
analysis of a number of features of the ten
selected bodies.13
Relationship with government
In terms of the relationship with government,
there are two key decisions involved in the
establishment of a pro-productivity body:
• Whether the body should be single or multi-
stakeholder: whether to involve various rep-
resentatives of civil society in a key decision-
making function (e.g. on the board).
In our sample, the Danish, Norwegian and
Chilean Productivity Commissions, the Mexi-
can Productivity Commission and the Irish
National Competitiveness Council are multi-
stakeholder;14 whereas the others are not.
Multi-stakeholder institutions are sometimes
public-private, sometimes organized to repre-
sent all relevant stakeholders. Typically single-
stakeholder bodies tend to be more research-
oriented.
• Whether the body should be located inside gov-
ernment, or independent of government. In our
10 See for instance, www2.jiia.or.jp/pdf/osirase/
2015_Global_Go_To_Think_Tank_Index_Top_USandNonUS__.pdf.
11 For additional information on the joint activities of the Australian and New Zealand Productivity Com-
missions. see: www.pc.gov.au/inquiries/completed/australia-new-zealand.
12 An example of this productivity data is available at www.strategie.gouv.fr/publications/solving-produc-
tivity-conundrum
13 More details on each body and each aspect covered in the currenct section are available in Renda and
Dougherty (2016), which also illustrates their diversity.
14 In Chile, the members of the board are named based on their “technical” and “cross-cutting” compe-
tences. The Danish Productivity Commission was an independent expert committee, but made consider-
able efforts to maintain a fruitful dialogue with relevant stakeholders, although some of its
recommendations generated some predictable resistance from interest groups that benefit from current
anticompetitive regulations. The Norwegian body is considered as multi-stakeholder even though one
important stakeholder, unions, were eventually not directly involved.
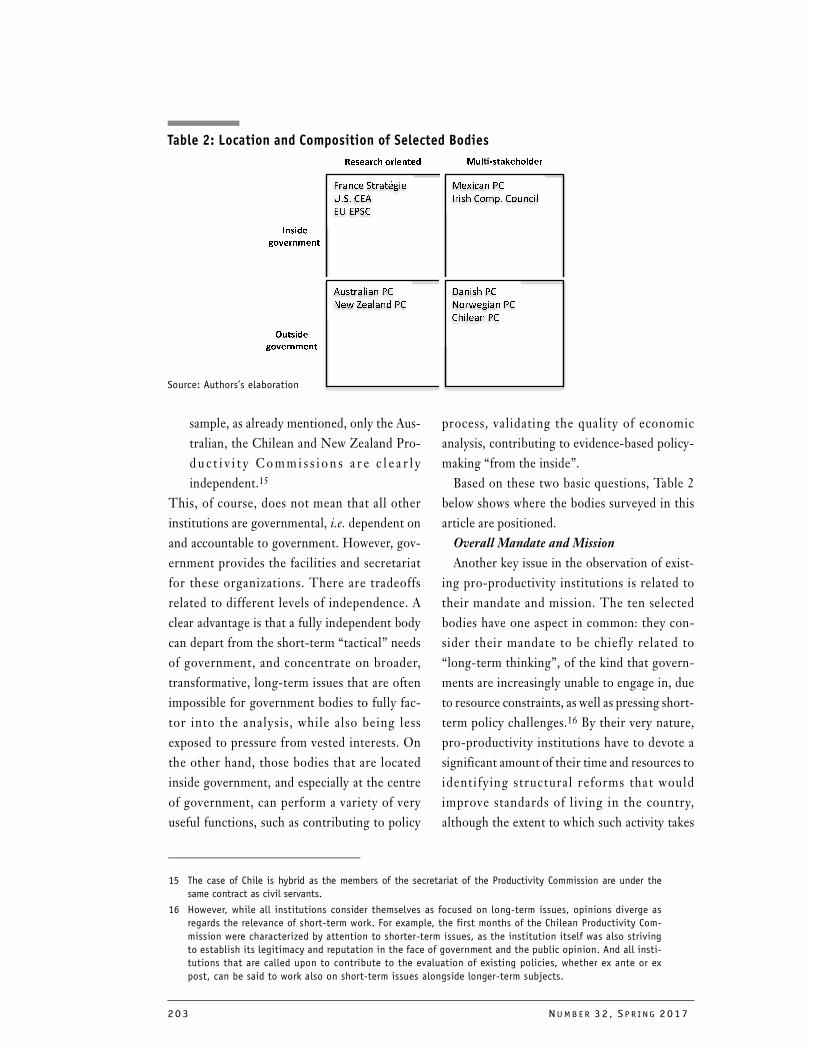
203 NUMB E R 32 , S P R I NG 2017
���������������
� � �����
��������
�����������
���������� ����������
��������������
���������������
���������
������������
�����������
��
��������
���������
��������
���������
���������������
�
��� ������������
sample, as already mentioned, only the Aus-
tralian, the Chilean and New Zealand Pro-
d u c t i v i t y Commi s s i o n s a r e c l e a r l y
independent.15
This, of course, does not mean that all other
institutions are governmental, i.e. dependent on
and accountable to government. However, gov-
ernment provides the facilities and secretariat
for these organizations. There are tradeoffs
related to different levels of independence. A
clear advantage is that a fully independent body
can depart from the short-term “tactical” needs
of government, and concentrate on broader,
transformative, long-term issues that are often
impossible for government bodies to fully fac-
tor into the analysis, while also being less
exposed to pressure from vested interests. On
the other hand, those bodies that are located
inside government, and especially at the centre
of government, can perform a variety of very
useful functions, such as contributing to policy
process, validating the quality of economic
analysis, contributing to evidence-based policy-
making “from the inside”.
Based on these two basic questions, Table 2
below shows where the bodies surveyed in this
article are positioned.
Overall Mandate and Mission
Another key issue in the observation of exist-
ing pro-productivity institutions is related to
their mandate and mission. The ten selected
bodies have one aspect in common: they con-
sider their mandate to be chiefly related to
“long-term thinking”, of the kind that govern-
ments are increasingly unable to engage in, due
to resource constraints, as well as pressing short-
term policy challenges.16 By their very nature,
pro-productivity institutions have to devote a
significant amount of their time and resources to
identifying structural reforms that would
improve standards of living in the country,
although the extent to which such activity takes
15 The case of Chile is hybrid as the members of the secretariat of the Productivity Commission are under the
same contract as civil servants.
16 However, while all institutions consider themselves as focused on long-term issues, opinions diverge as
regards the relevance of short-term work. For example, the first months of the Chilean Productivity Com-
mission were characterized by attention to shorter-term issues, as the institution itself was also striving
to establish its legitimacy and reputation in the face of government and the public opinion. And all insti-
tutions that are called upon to contribute to the evaluation of existing policies, whether ex ante or ex
post, can be said to work also on short-term issues alongside longer-term subjects.
Table 2: Location and Composition of Selected Bodies
Source: Authors’s elaboration
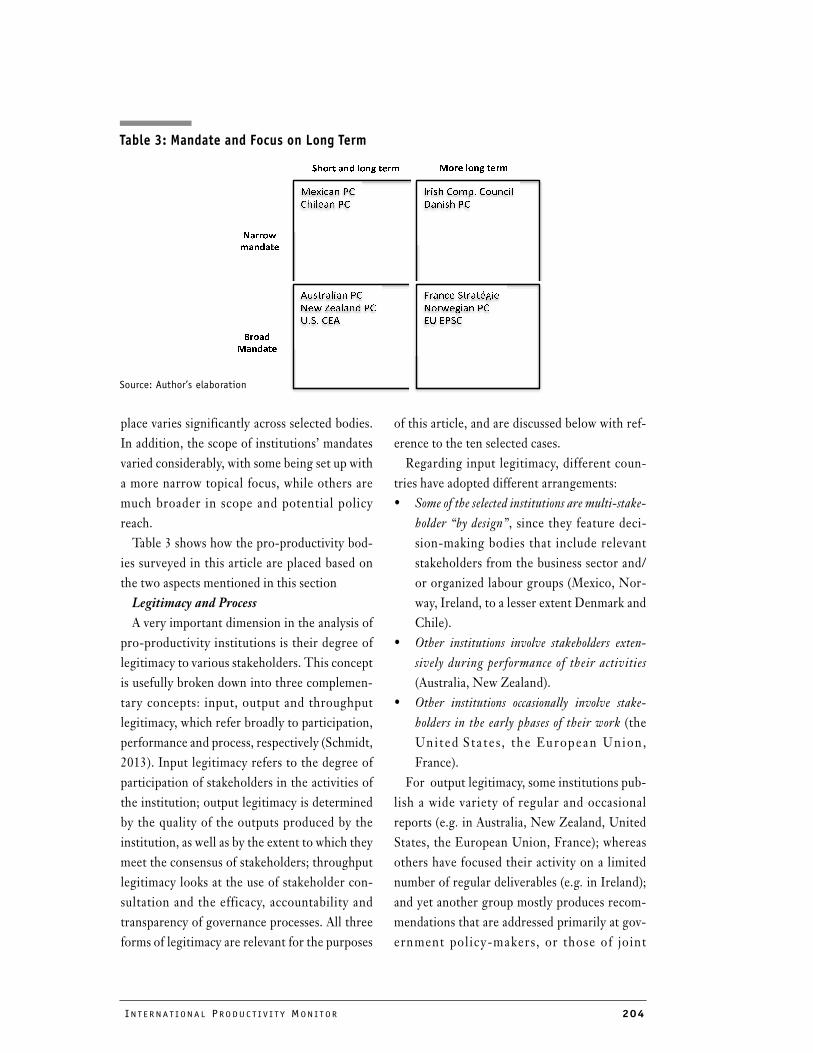
INT E R N A T I ON A L PRO DU C T I V I T Y MON I T OR 204
����������
��������
�
� ���������������
��������
�
��
���� ��������
��������������
��������
�
� ������� ��� ���
�� �� �������
�������
�
��������
������
�������
������
����������������
������������
place varies significantly across selected bodies.
In addition, the scope of institutions’ mandates
varied considerably, with some being set up with
a more narrow topical focus, while others are
much broader in scope and potential policy
reach.
Table 3 shows how the pro-productivity bod-
ies surveyed in this article are placed based on
the two aspects mentioned in this section
Legitimacy and Process
A very important dimension in the analysis of
pro-productivity institutions is their degree of
legitimacy to various stakeholders. This concept
is usefully broken down into three complemen-
tary concepts: input, output and throughput
legitimacy, which refer broadly to participation,
performance and process, respectively (Schmidt,
2013). Input legitimacy refers to the degree of
participation of stakeholders in the activities of
the institution; output legitimacy is determined
by the quality of the outputs produced by the
institution, as well as by the extent to which they
meet the consensus of stakeholders; throughput
legitimacy looks at the use of stakeholder con-
sultation and the efficacy, accountability and
transparency of governance processes. All three
forms of legitimacy are relevant for the purposes
of this article, and are discussed below with ref-
erence to the ten selected cases.
Regarding input legitimacy, different coun-
tries have adopted different arrangements:
• Some of the selected institutions are multi-stake-
holder “by design”, since they feature deci-
sion-making bodies that include relevant
stakeholders from the business sector and/
or organized labour groups (Mexico, Nor-
way, Ireland, to a lesser extent Denmark and
Chile).
• Other institutions involve stakeholders exten-
sively during performance of their activities
(Australia, New Zealand).
• Other institutions occasionally involve stake-
holders in the early phases of their work (the
Uni ted Sta te s , the European Union ,
France).
For output legitimacy, some institutions pub-
lish a wide variety of regular and occasional
reports (e.g. in Australia, New Zealand, United
States, the European Union, France); whereas
others have focused their activity on a limited
number of regular deliverables (e.g. in Ireland);
and yet another group mostly produces recom-
mendations that are addressed primarily at gov-
ernment policy-makers, or those of joint
Table 3: Mandate and Focus on Long Term
Source: Author’s elaboration
205 NUMB E R 32 , S P R I NG 2017
interest with the private sector (e.g. Mexico,
Chile, Norway, Denmark).17
In addition, the productivity commissions of
Australia and New Zealand and the bodies sur-
veyed in the United States, France, Ireland and
the European Union feature varying degrees of
capacity to produce new research, whereas the
commissions established in Mexico, Norway and
Denmark mostly compile existing information,
without producing new knowledge through in-
house research. In Chile budget constraints so
far made it very difficult for the productivity
commission to embark upon its own research
initiatives, and on a few occasions research work
was outsourced to the private sector.
Moreover, while institutions like the Austra-
lian Productivity Commission and the US
Council of Economic Advisers have existed for
several decades and have consolidated their rep-
utation and prestige, virtually placing them at
the same level of highly independent and
authoritative institutions such as central banks,
other institutions are either chiefly dependent
on the personality of their chairperson (e.g.
France), or are still striving to achieve a signifi-
cant degree of reputation. In the case of Chile, a
focus on short-term pressing issues has become
almost inevitable in order to signal the salience
and importance of the commission’s work.
Most institutions apply techniques aimed at
increasing the impact of their publications on
public opinion and ensuring that employees
have strong incentives to produce work of the
highest quality. These include drafting blog
posts and op-eds to summarize the results of
research undertaken and/or explain policy rec-
ommendations (e.g. the United States, Chile,
the European Union, France, Australia); and
relying on third party academics to evaluate or
referee the quality of specific deliverables (e.g.
New Zealand). But even more powerful, in this
respect, is the performance of extensive public
consultation on draft reports, a practice that is
typical of the Productivity Commissions of Aus-
tralia and New Zealand when carrying out their
sectoral inquiries.
All in all, output quality seems to be one of the
most valuable and fragile assets for a pro-pro-
ductivity institution. Even one of the most
established of the surveyed institutions, the Aus-
tralian Productivity Commission, seems to be
particularly aware of being “one bad report
away” from losing its reputation. This, in turn,
determines the need to secure sufficient budget,
such that the institution can hire top-level
researchers, and research can take place in-
house, with all due peer review arrangements.
Finally, the level of throughput legitimacy of
the pro-productivity institutions is heavily
dependent on sound internal governance
arrangements (due process), as well as the extent
to which these institutions contribute to an
open, transparent and accountable policy pro-
cess. Against this background, a number of
potential challenges have emerged from the
interviews.
• On the one hand, when the pro-productivity
institution is independent of government the
terms of reference have to be clearly stated, so
that responsibilities can be easily allocated
between the institution and the receiving
end. In some countries (e.g. Ireland, Den-
mark, Norway) terms of reference (TORs)
have been drafted for the institution as a
whole, and were made available to the pub-
lic. In Australia, Chile and New Zealand
TORs are specified for each inquiry. Espe-
cially in Australia and New Zealand, the
17 The Danish Productivity Commission came up with more than 100 policy recommendations many of which
have found their way (sometimes in modified form) into subsequent legislation both during the previous and
the current government. Overall, the commission’s policy recommendations have had a significant impact and
there is considerable awareness of the Danish productivity problem in policy circles.
INT E R N A T I ON A L PRO DU C T I V I T Y MON I T OR 206
TOR-based process is extremely transpar-
ent and inclusive, which certainly contrib-
utes to high levels of throughput legitimacy.
• On the other hand, institutions located at the
centre of government often work on the basis of a
specific mandate established by an administra-
tive act. This is the case for the US Council
of Economic Advisers (law), France Stratégie
(decree) and the EPSC (decision). These
institutions perform a number of activities,
only a subset of which can be subject to a
transparent, inclusive process. However, all
keep track of their activities (e.g. the EPSC
reports all the meetings held by its Chair
with stakeholders) and reach out to a wider
audience to show the content and direction
of their work through notes, publications
and blog posts.
But throughput legitimacy goes beyond the
existence and clar ity of the mandate, and
encompasses also the efficacy of decision-mak-
ing, and the quality of the process. These two
dimensions are more difficult to capture for
institutions like the ones under scrutiny in this
article, compared to what occurs for institutions
that are more directly involved in policy-mak-
ing. However, the quality of internal governance
and organization can also exert a significant
impact on advisory bodies. For example, the
existence of a board that is larger in number
than the underlying staff was reported as poten-
tially hampering the efficacy of the decision-
making process in the Chilean National Produc-
t i v i ty Commis s ion .18 A s imi l ar problem
emerged in Mexico due to the very limited num-
ber of government staff working to support the
activity of the productivity commission. Cur-
rently there are only three dedicated staff,
whereas a reasonable number would be two or
three times that number of full-time, relatively
senior staff to fully support the functioning of
the Commission. Budget and resource con-
straints also surfaced in the case of more estab-
l ished inst itutions such as the Austral ian
Productivity Commission.19
Resources and skills: coping with scarcity
Many of the surveyed institutions appear to be
coping with resource limitations, both in terms
of funding and human talent. At the same time,
several interesting practices have emerged,
which help these bodies achieve results by lever-
aging the potential of external experts as well as
government staff. The following stand out as
particularly interesting and/or innovative:
• France Stratégie was given the mandate to
co-ordinate as many as eight other existing
institutions.20 In this manner, France
Stratégie can tap into the existing knowledge
of several well-established, high quality
institutions without necessarily having to
hire personnel with competence in such a
wide array of f ields. France Stratégie ’s
co-ordination function is being strength-
ened in light of the European Council’s
2016 recommendation that all Eurozone
countries create or designate Productivity
Boards.
• In New Zealand, a Productivity Hub was
created as a partnership of agencies, which
aims to improve how policy can contribute
18 In the case of the US Council of Economic Advisers, one possible issue was the very short duration of member
positions: however, such short duration reportedly helps attracting top-level scholars, who cannot leave their
academic positions for more than two years.
19 Although its budget would reportedly be compatible with running as many as five inquiries at the same
time, the Commission currently has nine on the table.
20 The Council for Economic Analysis; the Advisory Council on the Future of the Pension System; the Advi-
sory Council on Employment Policy; the High Family Council; the High Council for the Future of Health
Insurance; the High Council for the Financing of Social Protection; the National Industry Council; and
the CEPII, a research centre in international economics.
207 NUMB E R 32 , S P R I NG 2017
to the productivity performance of the New
Zealand economy and the well-being of
New Zealanders. The Hub Board is made up
of representatives from the Productivity
Commission, the Ministry of Business,
Innovation and Employment, Statistics
New Zealand and the Treasury. Several
other agencies and non-government groups
are active in the partnership.
• The Mexican Productivity Commission can
rely on a very small secretariat rooted in the
Ministry of Finance. However, the secretar-
iat can leverage expertise from the whole
government administration. To this end,
the creation of five sub-committees in
charge of high priority issues has proven
essential for a smooth and effective working
of the institution.21
Independently of the resources available to
them, many of the surveyed institutions face
problems due to the lack of sufficient capacity or
skills in those parts of administrations that
receive policy recommendations and would be
in charge of implementing them. Well-estab-
lished productivity commissions consider the
lack of capacity in their interlocutors among the
key constraints they face to an expansion of their
activities.
Are pro-productivity institutions plugged
into the policy process?
Banks (2015) notes that pro-productivity
institutions can be expected to be more effective
when they are ‘plugged in’ to policy-making
processes bearing on productive performance,
or at least to be in a position to directly influence
decision-making in those areas. Our analysis
broadly confirms this idea, and shows that there
are many ways in which an institution like the
ones considered here can become plugged into
the policy process at the national level. Where a
culture of evidence-based policy-making is more
developed, pro-productivity institutions can
engage more effectively with the executive, and
be involved in the regulatory governance cycle.
In this respect, legal systems like Australia, Mex-
ico, the United States, and the EU (European
Commission) have a clear advantage over others,
which have experimented less with better regu-
lation tools (OECD, 2015c, 2016a). That said,
the following experiences stand out as particu-
larly relevant:
• The US Council of Economic Advisers reg-
ularly co-operates with the regulation over-
sight body (Office of Information and
Regulatory Affairs) in the ex ante economic
analysis of the impacts of new federal regu-
lations, in particular when the quality of
economic analysis is at stake; and it had a
role also in overseeing the first steps of the
retrospective regulatory reviews mandated
in 2012.22
• France Stratégie is in charge of evaluating
public policies for the French government.
In order to fulfil this mandate, it performs ad
hoc policy evaluation and acts also through
dedicated initiatives and bodies.
• The Chilean Productivity Commission
achieved a major milestone recently when
President Bachelet officially endorsed the
first of its 21 recommendations, which
entails that all new major legislative propos-
als be subject to a specific productivity
impact assessment.
21 All subcommittees feature a multi-stakeholder composition, with strong participation from the government
side. They meet independently of the plenary sessions of the Commission, which meets normally four times
per year. See www.gob.mx/cms/uploads/attachment/file/6672/Acta_sesion1_CNP.pdf.
22 The Economic Report of the President for 2016 observes that while macroeconomic issues continue to be
an important part of the CEA’s portfolio, in recent decades the CEA has devoted an increasing amount of
attention to microeconomic issues that arise in the context of legislation, regulatory processes, and
other administrative actions.
INT E R N A T I ON A L PRO DU C T I V I T Y MON I T OR 208
• The Mexican Productivity Commission co-
operates extensively with the regulatory
oversight body COFEMER, which partici-
pates in the sessions and works with the sub-
committees in the identification of areas for
the reduction of administrative burdens and
regulatory costs; and carries out both ex ante
and ex post evaluations of existing regulation.
Being involved in ex post evaluation is more
difficult for those institutions which largely play
an advisory role, rather than being nested in the
centre of government. For example, the Danish
Productivity Commission came up with more
than 100 policy recommendations, many of
which have found their way (sometimes in mod-
ified form) into subsequent legislation both dur-
ing the previous and the current government.
The Norwegian Productivity Commission
issued 180 recommendations, some of which
have been implemented. Both commissions did
not have much time to assess the impact of their
recommendations, given the broadness and
complexity of their mandates. On the other
hand, their main role was identifying important
problems and helping to pave the way for (some)
controversial reforms by influencing public
opinion and the political debate. Many of the
policy recommendations reportedly needed fur-
ther technical analysis before they could be put
into practice, but this is probably best done in
the relevant ministries and government bodies
and/or in other expert committees with a more
narrow and specific focus.
However, there are ways to follow up on pol-
icy recommendations and put pressure on
administrations to actually implement them.
For example, in Ireland, the Jobs Action Plan
forced administrations to report on the imple-
mentation of recommendations issued by the
Competitiveness Council in its Competitiveness
Challenge report on a regular basis. And the
New Zealand Productivity Commission is con-
sidering commissioning external work on the
actual implementation and impact of the recom-
mendations issued.
Communication and outreach: the
quest for keeping productivity
under the spotlight
As already mentioned in the introduction to
this article, developing an effective narrative for
pro-productivity reforms is often difficult due to
the distributional impacts that these reforms
often create, requiring at times that powerful
incumbents be subject to enhanced competition,
or that entirely new business models enter the
marketplace. Productivity has been termed by
one of our interviewees as facing both an
“awareness problem” and an “image problem”.
On the one hand, it is hard to communicate why
productivity should be a key concern for eco-
nomic policy in the long run; on the other hand,
it is common to hear opinions that associate pro-
ductivity-oriented reforms with of job losses and
reduced safeguards for employees or other social
groups. As an example, it reportedly turned out
impossible to involve workers’ unions in the
activities of the Norwegian Productivity Com-
mission.
Many of the interviewed institutions still face
important challenges in building a convincing
narrative for productivity, and keeping the issue
under the spotlight in public debate. Of course,
the government and politicians will continue to
play a key role in communicating such narratives
to the public.
Overall, it is possible to distinguish between
institutions that have diversified their activities
to adopt a very broad notion of productivity,
most often overlapping with long-term well-
being; and institutions that strive to keep pro-
ductivity at the core of the activity of govern-
ment. Emerging lessons include the following.
• Focusing on long-term well-being, rather than
productivity stricto sensu, is important to
elicit trust and signal the relevance of the
institution’s work. Institutions in Australia,
209 NUMB E R 32 , S P R I NG 2017
New Zealand, France, and the European
Commission all follow this strategy, both
due to their broader official mandate and
also to enhance their legitimacy.
• A balanced combination of long and short-term
actions is also important, where possible, to keep
the institution’s mission under the spotlight. In
some cases, a focus on short-term actions
has proven inevitable to very young institu-
tions wishing to signal their relevance (e.g.
Chile); in other cases, a relatively narrow
focus has been combined with the need for
actionable short term recommendations
(e.g. Ireland); and in yet another set of cir-
cumstances the institution has been used at
times also as a “crisis unit” (e.g, the US
Council of Economic Advisers during the
f inanc ia l cr i s i s at the end of the la s t
decade).23
• Communicating the expected impacts of proposed
reforms is essential for stakeholders to
understand the relevance and salience of
recommendations issued by the institution.
This is leading several institutions to enter
the evaluation space and also to become
more visible in the media, which are often
thirsty for figures to show.
• Periodic reporting on productivity, and/or the
creation of one or more landmark reports can
help keeping proposed reforms under the spot-
light. This is more easily achieved when the
mandate of the institution at hand is rela-
tively narrow. For example, the Irish Com-
p e t i t i v e n e s s Coun c i l i s b e c om i ng
increasingly influential in Irish politics due
to the quality and impact of its yearly reports
on the Competitiveness Scorecard and on
the Cost of Doing Business in Ireland.
• A strong political commitment to follow up on
the recommendations issued by the institution is
essential. The example of the Jobs Action
Plan in Ireland is an important one, where
the government has demonstrated the com-
mitment to follow up on the recommenda-
tions of the competitiveness council by
mandating that administrations report on
their achievements on a regular basis.
In addition to these pre-conditions, the insti-
tutions interviewed are adopting a number of
strategies to keep their mission on the radar of
policy-makers and public opinion. This includes
putting a strong emphasis on frequent public
communication and engagement. In most cases
this also involves the publication of blog posts;
the development of user-friendly recommenda-
tions with attractive graphics; and the delivery
of regular public speeches and interviews. Their
mere existence in some cases exerts an impact on
the private sector. For example, in Chile the cre-
ation of the productivity commission has report-
edly led both the industry association and the
workers’ union to start considering the creation
of parallel bodies. More generally, to the extent
that the creation of pro-productivity institutions
contributes to the diffusion of a culture of evi-
dence-based policy-making, this can also lead
academics, stakeholder groups, and think tanks
to become gradually more involved in the public
debate.
Emerging LessonsThis section discusses some of the emerging
lessons from the interviews that were conducted
for the purposes of this research. A number of
these echo the more general findings of Banks
(2015).
23 Under the leadership of CEA Chairs Edward Lazear, Christina Romer, and Austan Goolsbee, the CEA played a
role in designing countercyclical measures that were passed in response to the 2008-09 global financial crisis
and its aftermath. The Council conducted the overall macroeconomic analysis that helped identify the need
for, and design of, countercyclical fiscal measures, most notably the American Recovery and Reinvestment Act
of 2009. See www.whitehouse.gov/sites/default/files/docs/ERP_2016_Chapter_7.pdf.
INT E R N A T I ON A L PRO DU C T I V I T Y MON I T OR 210
Lesson 1: Context matters: there is
no one-size-fits-all solution when
it comes to pro-productivity
institutions
The selected jurisdictions have adopted very
different solutions in terms of overall functions,
design, governance, process, and degree of
transparency and stakeholder engagement for
pro-productivity institutions. The impression
gathered through the interviews is that context
matters, and that different legal systems might
find specific arrangements more appropriate
than others. This, in turn, means that those
institutions that can be considered as “success
stories” since they managed to remain in place
for several decades and are well embedded in
their countries’ institutional architecture, such
as the Australian Productivity Commission, or
the US Council of Economic Advisers, may not
be easy to transplant from one legal system to
another.24
Perhaps the clearest example in this respect is
the assistance provided by the Australian Pro-
ductivity Commission to governments wishing
to set up similar bodies in countries like New
Zealand, Mexico, Chile and Argentina (not cov-
ered in this article). It appeared clear from the
outset that for various reasons none of these
countries could exactly replicate the Australian
model, which can be traced back to almost a cen-
tury-long experience involving similar statutory
bodies and can rely on a consolidated tradition
of transparent, accountable, evidence-based
policy process. The new productivity commis-
sions ended up being often less financially
endowed and in some cases less transparent and
independent than the Australian one, but still
contributed to a marked improvement in their
country’s policy debate.
Other countries have decided to set up pro-
productivity institutions as a response to a spe-
cific shock or an emerging policy problem, as
was the case for the oil crisis in Norway, evi-
dence of a slowdown in productivity growth in
Denmark, or the need to preserve cost competi-
tiveness in Ireland. These emergency-led strate-
gies have led to a narrower scope for the
initiatives, be that in terms of duration of the
mandate (Norway, Denmark) or in terms of the
institution’s activities (Ireland).
As a result, there is a strong need to adapt
institutional and governance arrangements for
pro-productivity institutions to national legal
and political culture, as also flagged by the per-
sons interviewed. This can be an iterative pro-
cess, as once institutions gain more legitimacy,
they may be able to pursue a more ambitious
approach. To be sure, a key decision to be made
is whether the pro-productivity institution to be
created should be temporary or permanent in
nature. Our findings suggest that there are
ad van t ag e s and d i s a dvan t age s o f bo t h
approaches. A temporary institution should
however be given a narrower mandate, and pos-
sibly a narrower focus, otherwise it may end up
developing too superficial policy recommenda-
tions, without reaching a sufficient level of
detail.
24 Defining success is not easy for many of the institutions analysed in this article, especially since a few of
them have been established very recently, and it would be premature to draw conclusions on their effective-
ness in achieving their statutory mission. However, some of them have been in place for longer, and were
already subject to a number of external evaluations. This is the case of the Australian Productivity Commis-
sion, as reported by Banks (2015: 19), who finds that past quantitative estimates of the gains from reforms,
in particular in industry assistance and economic policy areas, “suggest big returns on the ‘investment’ by
government in the Commission and its staff”. In the case of the Council of Economic Advisers, the literature
pointed at ups and downs in the influence exerted by the Council on economic policy-making in the White
House (McCaleb, 1986). Recently a White House report pronounced the CEA, on the occasion of its
70th anniversary, “a durable and effective advocate for the public interest” (White House, 2016).
211 NUMB E R 32 , S P R I NG 2017
Lesson 2: Pro-productivity
institutions are no panacea: they
should be part of an effort to
embrace good governance and
evidence-based policy-making
In addition to institutional design and gover-
nance aspects, our work supports the view that
the effectiveness of a pro-productivity institu-
tion can significantly depend on the extent to
which good governance and better regulation
principles are embedded in the legal system.
Pro-productivity institutions can issue as many
policy recommendations as they wish, but the
uptake of such recommendations in the adminis-
tration will largely depend on the administra-
tion’s capacity to absorb and implement them,
on the political commitment towards following
up on these recommendations, and on the extent
to which government relies on evidence to
design its regulatory reform proposals.
Against this background, the issue of pro-pro-
ductivity institutions and reforms cannot, and
should not, be kept separate from that of regula-
tory governance and reform. In some cases lack
of commitment can result in badly designed
institutions, with insufficient resources to
meaningfully contribute to public debate. A
well-designed productivity institution sur-
rounded by government administrations that
lack transparency and accountability arrange-
ments, effective public management practices,
and skills is doomed to remain a preacher in the
desert, and represent a waste of money to tax-
payers.25
Lesson 3: Political commitment is
essential
An essential element that emerged from the
interviews is that without a strong political com-
mitment, pro-productivity institutions are
unlikely to flourish or become prominent in the
overall political landscape. There are various
ways in which the role and work of a pro-pro-
ductivity institution can be given importance
and impact at the government level. They
include:
• Providing a strong legal basis and both de
jure and de facto independence to the institu-
tion;26
• Chairing a multi-stakeholder body at the
highest political level (Mexico);27
• Appointing highly reputed academics to
head standing inquiry bodies or advisory
counci l s at the centre of government
(United States, Chile, Ireland, Denmark);
• Mandating research on specific pressing
policy issues, to be analysed by the institu-
tion in a transparent and in-depth manner
(Australia, New Zealand);
• Committing to explicitly discuss or even to
formally adopt and implement the institu-
tion’s recommendat ions (Mexico, Ire-
land);28
25 In this context it is thus useful to compare the results of our survey with those of the OECD Regulatory Policy Out-
look. www.oecd.org/publications/oecd-regulatory-policy-outlook-2015-9789264238770-en.htm.26 For example, the Australian Productivity Commission was created as an independent authority by an Act
of Parliament in 1998, whereas the New Zealand Productivity Commission was set up as an independent
crown entity. In Chile, the legal basis of the Productivity Commission is now being strengthened, in an
attempt to consolidate the standing and legitimacy of the institution.
27 The fact that the President of Mexico participates in one of the sessions of the productivity commission
reportedly motivated all stakeholders to engage in active and fruitful involvement and participation; at
the same time, such a presence is limited to one meeting to avoid that the discussion becomes too for-
mal, and that the debate within the commission becomes less open.
28 Recommendations are being made binding for government administrations in Mexico. Some countries
mandate that governments report on their adoption of recommendations on a regular basis (e.g. in Ire-
land, limited to the Jobs Action Plan); or that government responds to the recommendations with a
communication or a motivated statement (often, in Australia and New Zealand).
INT E R N A T I ON A L PRO DU C T I V I T Y MON I T OR 212
• Involving the institution in the design and/
or in the evaluation of policies (United
States, France, Chile);
• Providing the institution with capacity to
start its own research projects, in addition to
responding to government requests (Austra-
lia, New Zealand).
Lesson 4: Independence is
important, although its extent can
vary depending on the
circumstances
Most of the surveyed institutions consider
their independence to be a key asset, which con-
tributes extensively to the legitimacy of their
output. At the same time, some of the institu-
tions at hand report to their governments, rather
than to parliaments or other non-governmental
institutions. This can make them potentially less
independent in formulating policy recommen-
dations. However, the experience of market reg-
ulators suggests that how this reporting works in
practice is critical, and other factors such as ten-
ure, funding and transparency are at least as crit-
ical in affecting independence (Banks, 2012;
OECD, 2016b; OECD, 2017). The common
features that appear to be essential for a fruitful
role of a pro-productivity institution are the
need to avoid governmental control on the con-
tent and scope of the recommendations; aswell
as the possibility to act autonomously, not just
react to specific mandates issued by govern-
ment.
Against this background, independence and
autonomy are always destined to remain rela-
tive, rather than absolute. For example, while a
number of the productivity commissions mod-
elled on the Australian example consider them-
selves to be fully independent, this situation has
to be qualified since in many circumstances their
ability to undertake their own initiatives and
research is constrained by their limited budgets,
In additiion, workload commissioned by gov-
ernment can crowd out the possibility for inde-
pendent research.
The lack of full independence is of course
more likely when institutions are purely internal
to the administration, even if functional auton-
omy is explicitly granted. It is, however, impor-
tant that clear provisions are in place to secure
that the fields of research and the ultimate rec-
ommendations produced by such institutions
are not entirely pre-determined by the centre of
government, which normally acts as the main
recipient of such recommendations, and is in
charge of translating them into concrete policy
steps.
At the same time, institutions should remain
“plugged in” to the policy-making process,
in order to enhance the liklihood that recom-
mendations will be adopted. And they should
feature, whenever possible, champions from the
government administration, which can increase
the ownership of the reforms and guarantee
continuity in the activities of the institutions
they contribute to.29 One possibility to be con-
sidered in this respect is either the sharing or the
secondment of personnel from government to
the independent pro-productivity institutions,
which may contribute to enhancing over time
the capacity of government to implement the
reforms proposed by the pro-productivity insti-
tution. The impact of these practices may be
greater if seconded personnel have solid techni-
cal expertise, and go back to positions of influ-
ence in the administration at the end of the
secondment period, thereby increasing govern-
ment’s ability to understand and implement the
proposed reforms.
From a slightly different angle, it is interest-
ing to observe that the “TOR system” is more
29 This is the case, for instance, of Mexico and Chile, which however seem to rely on too small a staff of very
skilled civil servants that back the activity of advisory-type bodies.
213 NUMB E R 32 , S P R I NG 2017
appropriate for truly independent bodies, than
for “internal” advisory bodies. But even for
independent bodies, TORs should not be the
only way for a pro-productivity institution to
produce research and policy recommendations.
Within the TOR system, it is essential to ensure
that stakeholders have a say on the main pre-
mises and results, in order to avoid governments
exerting undue control over the results of com-
missioned research. More generally, quality,
transparency and political commitment are all
factors that result from, and also reinforce, the
independence of a pro-productivity institution,
and as such should be adequately considered
when designing such an institution for a given
legal system.
All in all, some of our interviews have cast
important doubts on the ability of non-indepen-
dent (or not fully independent) bodies to pro-
pose disruptive changes and/or courageous
reforms. Such lack of independence undermines
the role that pro-productivity institutions can
play as “long term public policy design work-
shops,” that develop systemic reforms needed to
boost productivity. Accordingly, sufficient inde-
pendence, particularly in developing ideas and
forming policy recommendations, seems to
stand out as a core requirement for the effective-
ness, legitimacy and overall impact of pro-pro-
ductivity institutions.
Lesson 5: Budget and human
resources must be sufficient for
high-quality research and quality
control
The need for autonomy and independence is
also reflected in the need for sufficient budget
and resources to organize the institution’s
research work, as well as to adequately engage
with stakeholders, e.g. through extensive public
consultation. One aspect relates to whether bud-
gets are determined annually, or on a multi-year
basis, which can help to shield the institutions
from undue influence (OECD, 2014). While
certain institutions only focus on the compila-
tion of relevant research with no ambition to
produce new data and information (e.g. in Den-
mark and Norway,), most institutions have the
ambition to be active in the production of new
findings, whether through inquiries or desk/
empirical research. However, the budget and
human resources they are endowed with are not
always compatible with this ambition.
As a consequence, if the role of a pro-produc-
tivity institution is to be taken seriously suffi-
cient resources need to be made available to
attract an adequate number of high- quality
researchers, as well as to allow for peer review,
public consultation, and quality control of
research methodologies and results.30
In terms of specific expertise, while the role of
economists is widely acknowledged, that of
other experts, for example in, innovation, educa-
tion and public administration, is often underes-
timated. In Denmark and Norway, several
outside observers offered the criticism that pro-
ductivity commissions were dominated by econ-
omists, and one of our interviewees suggested
that the commissions could probably have bene-
fited from a greater participation from political
scientists with special insight into public admin-
istration, given that a large part of their agendas
focused on productivity problems in the public
sector.
The availability of resources is even more
important when coupled with a mandate that, in
addition to specific “on demand” research,
30 For example, the Norwegian Commission was well supported by competent staff from the relevant economic
ministries and also drew on analytical work by Norwegian academic experts and consultants. The Danish com-
mission had a relatively small secretariat (considering its very broad mandate) and could have benefited from
having more resources, although its members tried to draw as much as possible on outside expertise and rele-
vant academic research.
INT E R N A T I ON A L PRO DU C T I V I T Y MON I T OR 214
allows for the institutions own research initia-
tives. When this is explicitly foreseen (e.g. Aus-
tralia, Chile, New Zealand), most often the
budget is insufficient to leave space for sponta-
neous initiatives, and this is potentially weaken-
ing the pro-productivity potential of these
institutions’ work.
Lesson 6: Institutions should
engage with stakeholders
Openness and transparency are increasingly
important for pro-productivity institutions.
Some institutions consult stakeholders through-
out the course of their activities; others are
multi-stakeholder by design, and yet other insti-
tutions meet constantly with stakeholders or
reach out to the public opinion even if their core
activity would be advising the government.
Institutions that engaged with the private sector
and labour early in the consultation process
report their involvement being highly construc-
tive, although these experiences are somewhat
limited.
While the scope and design of the institution
determines the best way in which it can interact
with stakeholders, the need for such interaction
has emerged from our analysis as an essential
pillar of setting up an effective pro-productivity
body. These forms of engagement might involve
the use of an open government approach and
open access instruments, or wiki platforms for
interaction with external stakeholders. To date,
however, few of the institutions have broadly
embraced these new instruments.
Possible arrangements that can strengthen the
level of interaction with stakeholders, include
the adoption of minimum consultation stan-
dards (especially in TOR-based standing inquiry
bodies); commitment or obligation to respond
to submissions with a motivated statement of
acceptance or rejection; the organization of
workshops or online fora related to individual
policy issues; the use of blogs with comment sec-
tions to stimulate interaction, and many more.
Lesson 7: It is important to
combine short- and long-term
thinking in the institution to
preserve legitimacy and salience
Our analysis has highlighted that all pro-pro-
ductivity institutions consider long-term think-
ing to be their core business. These institutions
focus on structural reforms because other orga-
nizations have little time to do so. Short-ter-
mism in government is often caused by the need
to preserve political consensus, the constraints
exerted by the electoral cycle, and shrinking
budgets (Thompson, 2010). Having an institu-
tion think about issues that require reform in the
country’s public policies is increasingly essen-
tial.
However, it would be naïve to imagine that an
institution can at the same time be plugged into
the policy process, provide influential policy
recommendations to government, and stay away
entirely from short-term issues. In addition, rel-
atively new institutions often find short-term
issues to be a useful opportunity to enhance
their reputation and legitimacy for the wider
public. In addition, reports that focus on short-
term as well as long-term initiatives have proven
to be very useful. Bodies can also play a useful
role by “framing” short-term issues from a long-
term perspective, capturing economy-wide ram-
ifications and incorporating future social, eco-
nomic and technological transitions in their
analysis.
Accordingly, there seems to be reason to
believe that a combination of short- and long-
term research and advocacy is to be preferred to
a less balanced approach, as it can increase the
effectiveness and legitimacy of pro-productivity
institutions, and in addition makes them more
easily plugged into the policy-making process.
215 NUMB E R 32 , S P R I NG 2017
Lesson 8: Pro-productivity
institutions should be “plugged
into” the policy process
Pro-productivity institutions can represent a
great complement to regulatory oversight bod-
ies in ensuring that the economic analysis
behind legislation and regulation is sound, and
that the “long-term” is adequately accounted for
when designing or evaluating new policy inter-
ventions. This occurs especially in the United
States, but also to various degrees in Mexico and
Chile. Elsewhere, the link between these institu-
tions and oversight bodies in charge of the regu-
latory governance cycle is weaker.
Depending on the institutional location of the
pro-productivity institution, the arrangements
that might promote a further involvement in the
policy process can vary. The ones that seem
more effective and important include the fol-
lowing:
• Coupling policy recommendations with a
preliminary impact analysis, which incor-
porates an assessment of the distribu-
tional impacts of proposed reforms. This
could help government bodies in charge of
ex ante regulatory impact analysis in con-
ducting their evaluation; it would also help
the data produced “speak for themselves”,
including for media outreach and policy
advocacy purposes; and it would also incen-
tivize pro-productivity institutions to for-
mula te “ac t ionable” , ev idence-based
recommendations.
• Carrying out early stakeholder consulta-
tion on proposed reforms. This can lead to
the collection of data and stakeholder posi-
tions in a way that facilitates government in
the subsequent phases of the policy cycle.
• Assisting regulatory oversight bodies in
validating the quality of economic analy-
sis of proposed new regulation. Especially
when pro-productivity institutions can rely
on highly skilled economists, this role could
prove very important for government.
• Assisting government departments and
ministries in the retrospective review of
existing rules, or clusters of rules. Pro-
productivity institutions are well positioned
to help governments run an in-depth evalu-
ation of entire policy areas, individual pieces
of legislation/regulation, or the perfor-
mance of specific industry sectors.
• Evaluating the functioning of the whole
regulatory system. Independent bodies
that possess a consolidated reputation are
well positioned to perform such an evalua-
tion.
Concluding Remarks and
Policy ImplicationsThis article contains the results of a compara-
tive analysis of ten pro-productivity institutions,
and draws a number of lessons that could prove
useful for the institutions themselves, and for
governments and legislatures that are currently
considering whether to create new pro-produc-
tivity institutions. The ten selected institutions
can be classified as advisory councils, standing
inquiry bodies or ad hoc task forces, and do not
exhaust the possible choices available to a given
country when it comes to stimulating and pro-
moting the debate on pro-productivity reforms.
Moreover, the peculiarity of legal systems and
the importance of context in determining the
optimal design, mandate, mission and gover-
nance of pro-productivity institutions limit the
possible extension of individual findings to all
other institutional settings.
That said, this article broadly confirms earlier
work for the OECD (Banks, 2015) regarding the
usefulness of setting up pro-productivity institu-
tions, and the importance of conceiving of an
overall institutional setting that leaves space for
long-term thinking and strategic policy design.
And while, with the exception of Australia, it is
INT E R N A T I ON A L PRO DU C T I V I T Y MON I T OR 216
difficult to correlate the existence of pro-pro-
ductivity institutions with stronger economic
performance, it is acknowledged that gover-
nance indicators and institutional capacity indi-
cators (e.g. government effectiveness) are more
correlated with growth and economic perfor-
mance than most other indicators, including
regulatory indicators (Han et al., 2014; Furceri
and Mourougane, 2010).31
OECD countries face the challenge of slower
productivity growth. The reforms needed to
restore inclusive growth and sustainable devel-
opment call on governments to adopt a long-
term perspective, overcome vested interest and
incumbency stances and cross-sectoral bound-
aries by crafting new policies that favour and
promote systemic change and socio-economic
transformations. One way to face this challenge
is to ensure that the overall governance and
institutional setting is conducive to such
reforms.
The creation of pro-productivity institutions
is a meaningful way to pursue this goal. When
well designed, pro-productivity institutions can
make a very important contribution to the eco-
nomic policy debate. While not a panacea, they
can orchestrate and promote a multi-stake-
holder, evidence-based dialogue on the causes of
the productivity slowdown in their countries, as
well as on possible solutions. Resource and time-
constrained governments are not as well posi-
tioned as independent, highly skilled, multi-
stakeholder institutions in playing this role.
However, it takes smart and effective govern-
ments to engage with independent pro-produc-
tivity institutions, to fully understand their
recommendations and translate them into con-
crete reform initiatives.
Our analysis adds to existing knowledge in
several respects. We find that, despite existing
constraints, well-designed productivity commis-
sions can generally improve the overall quality
of the political debate over economic, social and
environmental reforms, and contribute to evi-
dence-based policy-making. Our results also
support the view that centralizing knowledge
and research on productivity in one independent
and highly skilled body can help create the
momentum and the knowledge required to pro-
mote long-term productivity growth. And
importantly, we find evidence that while institu-
tions located outside government have more
leeway in promoting reforms that challenge
vested interests and produce results over a time
span that goes beyond the electoral cycle, the
existence of smart government bodies can
engage to a much larger extent in experimental
policy-making and pave the way for a more
adaptive policy process, based on evidence.
In all this, it is of utmost importance that these
bodies be given sufficient resources, skills,
transparency and procedural accountability to
fulfil their tasks; a sufficiently broad mission,
which looks at long-term well-being and at both
supply-side and demand-side; policy evaluation
functions, be they related to the bodies’ own
proposed reforms, or to existing or proposed
government policies; and the ability to reach out
to the general public in a variety of ways, from
consultation to advocacy, use of social media,
and other forms of communication.
ReferencesAndrews, D., C. Criscuolo, P.N. Gal (2016) “The
Best Versus the Rest: The Global Productivity Slowdown, Divergence Across Firms and the Role of Public Policy,” OECD Productivity Working Papers, No. 5, http://oe.cd/GFP
Ashford, N. and A. Renda (2016) Aligning Policies for Low-Carbon Systemic Innovation in Europe, CEPS Report, www.ceps.eu/publications/aligning-poli-cies-low-carbon-systemic-innovation-europe.
31 In Australia, estimates have been made of the gains from reforms advocated by the Productivity Commission
and adopted by government. Such gains added up to 5 per cent of GDP in the case of the ‘microeconomic
reform program’ of the 1980s and 1990s.
217 NUMB E R 32 , S P R I NG 2017
Anzoategui, D., Comin, D., Gertler, M., Martinez, J. (2016) “Endogenous Technology Adoption and R&D as Sources of Business Cycle Persistence,” NBER Working Paper No. 22005, February .
Banks, G. (2012) “Independent Policy Advice and the Productivity Commission,” Australian Insti-tute of Administrative Law Forum, July.
Banks, G. (2015) “Institutions to Promote Pro-Pro-ductivity Policies: Logic and Lessons,” OECD Productivity Working Papers, No. 1, http://oe.cd/GFP.
Bergeaud A., R. Lecat and G. Cette (2017) “Total Factor Productivity in Advanced Countries: A Long-term Perspective,” International Produc-tivity Monitor, Vol. 32. pp. 6-24.
Byrne, D., J. Fernald and M. Reinsdorf (2016) “Does the United States Have a Productivity Slowdown or a Measurement Problem?” Brookings Papers on Economic Activity, Spring.
Furceri, D. and A. Mourougane (2010) “Structural Indicators: A Critical Review,” OECD Journal: Economic Studies, Vol. 2010/1, OECD Publica-tions, Paris.
Goldin, I. and P. Lamy (2014) “Overcoming Short-Termism: A Pathway for Global Progress,” Washington Quarterly, https://twq.elliott.gwu.edu/sites/twq.elliott.gwu.edu/files/downloads/Goldin_Lamy_PDF.pdf
Gordon, J., Zhao, S. and Gretton, P. (2015) “On Productivity: Concepts and Measurement,” Pro-ductivity Commission Staff Research Note, Can-berra, February.
Gordon, R. (2016) “The Rise and Fall of American Growth,” (Princeton, New Jersey: Princeton University Press).
Han, X., H. Khan, and J. Zhuang (2014) “Do Gover-nance Indicators Explain Development Perfor-mance? A Cross-Country Analysis," Asian Development Bank Economics Working Paper Series, No. 417.
Hansen, A.H. (1939) “Economic Progress and Declining Population Growth,” American Eco-nomic Review, Vol. 29, No. 1, pp. 1–15.
Krugman, P. (1994) “The Age of Diminished Expectations,” (Cambridge: MIT Press).
McCaleb, Thomas S. (1986) “The Council of Eco-nomic Advisers after Forty Years,” Cato Journal, Vol. 6, No. 2, pp. 685–693.
OECD (2014) “The Governance of Regulators, OECD Best Practice Principles for Regulatory Policy,” (Paris: OECD Publishing).
OECD (2015a) “Policy Shaping and Policy-making, the Governance of Inclusive Growth,” (Paris: OECD Publishing).
OECD (2015b) Regulatory Policy Outlook 2015, (Paris: OECD Publishing).
OECD (2015c) “The Future of Productivity,” OECD Publishing, http://oe.cd/GFP.
OECD (2016a) “The Productivity-Inclusiveness Nexus,” Report of a Meeting of the OECD Council at Ministerial Level, Paris, 1-2 June 2016. www.oecd.org/global-forum-productivity/library/The-Productivity-Inclusiveness-Nexus-Preliminary.pdf.
OECD (2016b) “Being an Independent Regulator: The Governance of Regulators,” (Paris: OECD Publishing).
OECD (2017) “Shaping Policy Advisory Systems for Strategic Advice: A Comparative Public Gover-nance Perspective,” (Paris: OECD Publishing), forthcoming.
Productivity Commission (PC) (2005) “Review of the National Competition Policy Arrange-ments,” Inquiry Report No. 33, Canberra.
Productivity Commission (PC) (2014) Public Infra-structure Inquiry Report No. 71, Productivity Commission, Melbourne.
Ramos, Gabriela (2016) “The Productivity and Equality Nexus: Is There a Benefit in Addressing them Together?” www.oecdinsights.org.
Renda, A. and Dougherty, S. (2016) “Pro-Productiv-ity Institutions: Learning From National Experi-ence,” OECD Productivity Working Papers, No. 7, http://oecd/GFP.
Schmidt, V. A. (2013), “Democracy and Legitimacy in the European Union Revisited: Input, Output and ‘Throughput’,” Political Studies, Vol. 61, pp. 2-22.
Sode, A. (2016) “Solving the Productivity Conun-drum,” France Strategie Brief, www.strate-gie.gouv.fr/sites/strategie.gouv.fr/files/atoms/files/ns-fs-solving-productivity-february-2016.pdf.
Summers, L.H. (2014) “Reflections on the ‘New Secular Stagnation Hypothesis,” in Secular Stag-nation: Facts, Causes, and Cures, edited by Coen Teulings and Richard Baldwin, pp. 27–40. (Lon-don: CEPR Press).
Syverson, C. (2016) “Challenges to Mismeasurement Explanations for the U.S. Productivity Slow-down,” NBER Working Paper No. 21974, Feb-ruary.
Thompson, D.F. (2010) “Representing Future Gen-erations: Political Presentism and Democratic Trusteeship,” Critical Review of International Social and Political Philosophy, Vol. 13, No. 1, pp. 17-37.
White House (2016) 2016 Economic Report of the Pres-ident, https://obamawhitehouse.archives.gov/administration/eop/cea/economic-report-of-the-President/2016.

The Centre for the Studyof Living Standards
THE CENTRE FOR THE STUDY OF LIVING STANDARDS (CSLS) is a national,
independent, not-for-profit research organization which began operations in
August 1995. Its objectives are twofold. First, to contribute to a better under-
standing of trends and determinants of productivity, living standards, and eco-
nomic well-being in Canada through research. Second, to contribute to public
debate by developing and advocating specific policies to improve the standard of
living of Canadians.
The activities of the CSLS are motivated by the following general principles:
1) in the long run, productivity growth is the key to improved living standards;
2) in the short to medium term, elimination of any output gap is the most effec-
tive way to raise living standards;
3) the equitable sharing of productivity gains among all groups in society is an
essential element of the economic growth process;
4) increased cooperation among the various groups which make up our society
can contribute significantly to better living standards; and
5) reliable data are crucial to the monitoring and analysis of living standards and
to the development of effective policies to increase living standards.
A BOARD OF DIRECTORS composed of well-known economists and persons with
experience in economic policy making at a senior level directs the activities of
the CSLS. The following individuals currently serve on the Board:
Chair Don Drummond
Executive Director Andrew Sharpe
Secretary/Treasurer Richard Van Loon
Board Members Jock A. Finlayson Pierre Fortin
Helen Heslop Michael Horgan
Maureen O’Neil Lars Osberg
Chris Ragan Craig Riddell
Frances Woolley
Related Documents