The Productivity-Wage Nexus in Selected OECD Countries Andrew Sharpe Executive Director Centre of the Study of Living Standards Presented to the 2016 Conference of the Global Forum on Productivity Session on Productivity Divergence and Wage Inequality in Lisbon, July 7-8, 2016 1

Welcome message from author
This document is posted to help you gain knowledge. Please leave a comment to let me know what you think about it! Share it to your friends and learn new things together.
Transcript

The Productivity-Wage Nexus in Selected OECD Countries
Andrew Sharpe Executive Director
Centre of the Study of Living Standards
Presented to the 2016 Conference of the Global Forum on Productivity Session on Productivity Divergence and Wage Inequality in Lisbon,
July 7-8, 2016
1
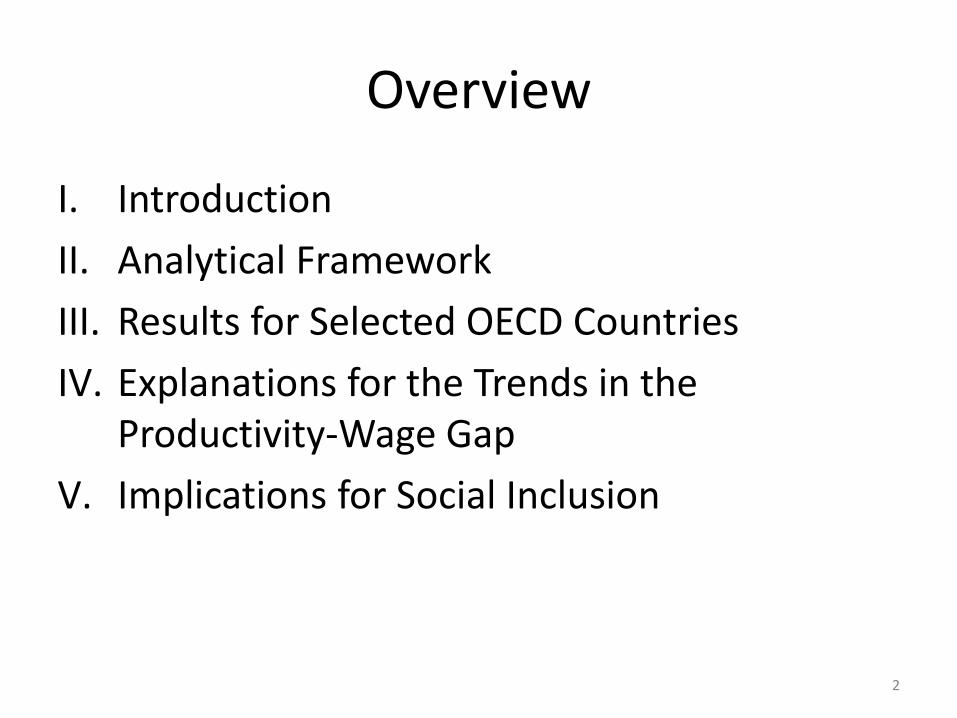
Overview
I. Introduction
II. Analytical Framework
III. Results for Selected OECD Countries
IV. Explanations for the Trends in the Productivity-Wage Gap
V. Implications for Social Inclusion
2

Decomposing the Relationship between Labour Productivity Growth and Median Real Wages
There are two key relationships, each with two underlying components:
1) Productivity (output per hour) and average hourly labour compensation, mediated by:
• Share of labour income in GDP
• Differences between the producer wage (wage/GDP deflator) and the consumer wage (wage/CPI)
2) Average hourly labour compensation versus median hourly labour compensation, mediated by:
• Differences in labour income estimates from national accounts and household surveys
• Differences in median and average hourly labour income
3
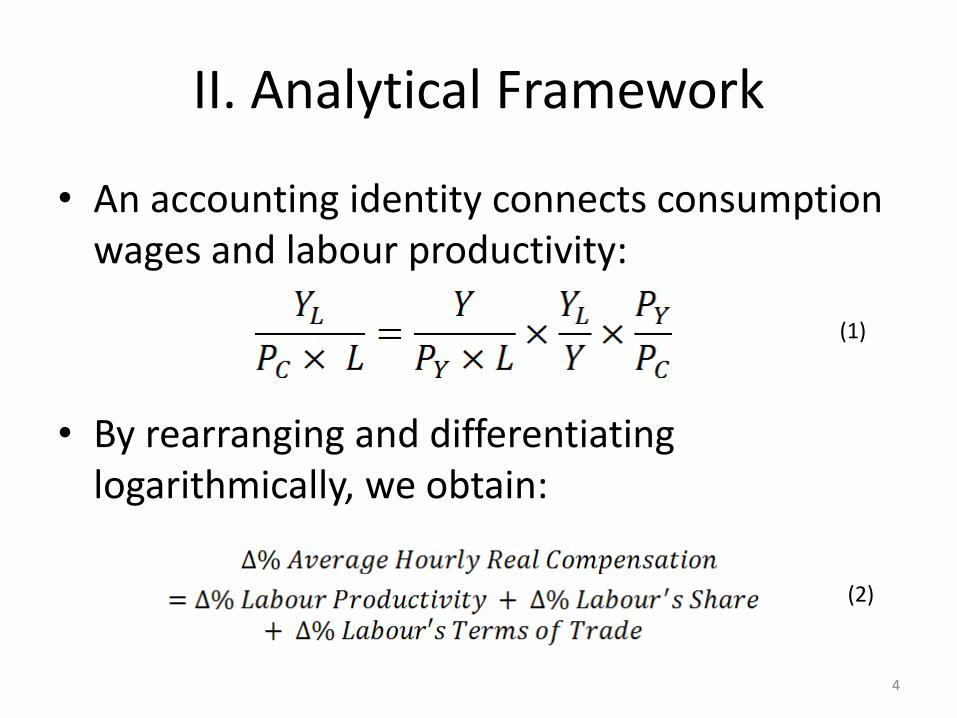
II. Analytical Framework
• An accounting identity connects consumption wages and labour productivity:
• By rearranging and differentiating logarithmically, we obtain:
(1)
(2)
4

II. Analytical Framework
• We define the productivity-wage gap as:
• By substituting (3) into (2), we obtain:
• Finally, we define:
(3)
(4)
(5)
(6)
5

II. Analytical Framework
• By substituting (5) and (6) into (4) we obtain our decomposition:
(7)
6

III. Results for OECD Countries
• Results provided generally for the period of 1986 to 2010/13, varying by country depending upon availability of household survey data from the Luxembourg Income Study in:
‒ Canada ‒ Denmark ‒ Finland ‒ France ‒ Germany ‒ Ireland
‒ Netherlands ‒ Norway ‒ Spain ‒ United Kingdom ‒ United States
7

Percentage point contribution
1986-2010
Labour Productivity Growth (per
cent per year)
Median Hourly Real Labour
Income Growth (per
cent per year)
Productivity-Wage Gap
(percentage points per
year)
Inequality Data
Source Differences
Labour’s Terms of
Trade (inverse contribution)
Labour’s Share of Income (inverse
contribution)
United States‡
1.63 0.15 1.47 0.52 0.24 0.57 0.16
Germany⁺ 1.39 0.05 1.34 0.38 -0.07 0.59 0.44
France 1.71 0.88 0.83 -0.06 0.71 0.18 0.01
Denmark* 1.61 0.97 0.64 0.01 0.67 0.02 -0.06
Canada* 1.18 0.57 0.62 0.36 0.15 -0.02 0.12
United Kingdom‡
1.65 1.26 0.39 0.49 0.10 -0.32 0.11
Netherlands 1.27 0.98 0.29 0.09 -0.13 0.06 0.26
Finland† 2.20 2.06 0.14 0.11 -0.22 -0.04 0.29
Spain‡ 1.05 1.29 -0.24 0.23 -0.27 -0.01 -0.18
Norway 1.80 2.09 -0.28 0.22 0.26 -1.16 0.38
Ireland⁺ 3.75 4.11 -0.36 0.88 -2.03 0.20 0.57
*1987-2010; †1987-2013; ⁺1994-2010; ‡1986-2013
8
Summary of Results on the Productivity-Wage Nexus

Productivity-Wage Gap, 1986 to 2010/13, percentage points per year
-0.5
0
0.5
1
1.5
2
9

Ratio of Average to Median Hourly Real Wage, 2010/13, per cent
80
90
100
110
120
130
140
150
160
10

Contribution to the Productivity-Wage Gap: Inequality, 1986 to 2010/13, percentage points per year
-0.5
-0.25
0
0.25
0.5
0.75
1
11

Contribution to the Productivity-Wage Gap: Data Source Differences, 1986 to 2010/13,
percentage points per year
-1.5
-1
-0.5
0
0.5
1
1.5
12

Reasons for Data Source Differences
• Household surveys fail to capture top income earners
• Treatment and potential underestimation of SLI and fringe benefits by household surveys
13
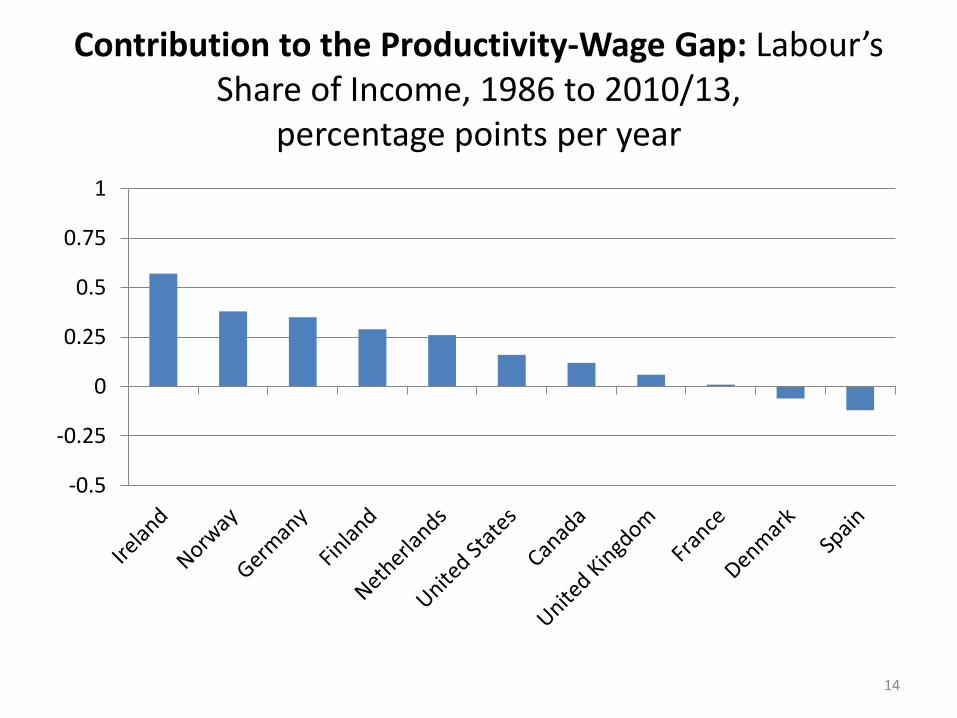
Contribution to the Productivity-Wage Gap: Labour’s Share of Income, 1986 to 2010/13,
percentage points per year
-0.5
-0.25
0
0.25
0.5
0.75
1
14

Change in Labour’s Share of Income, 1986 to 2010/13, percentage points
-12
-10
-8
-6
-4
-2
0
2
4
15
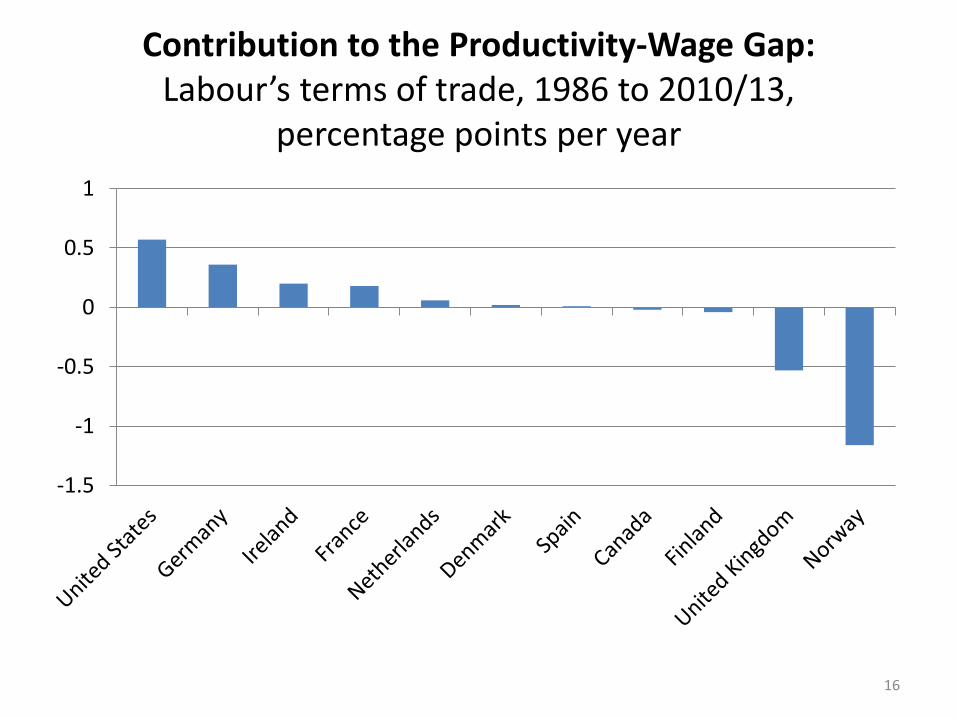
Contribution to the Productivity-Wage Gap: Labour’s terms of trade, 1986 to 2010/13,
percentage points per year
-1.5
-1
-0.5
0
0.5
1
16

CPI and GDP Deflator Growth, 1986 to 2010/13, per cent per year
0
1
2
3
4
5
CPI GDP Deflator
17

IV. Explanation for the Trends in the Productivity-Wage Gap
• Measurement issues
• Discrepancies between the CPI and GDP Deflator
– Export Prices
– ICT investment
• Bargaining power changes linked to
– Globalization
– Skill-biased technological change
18

V. Implications for Societal Inclusion
• There will be less political support for productivity-enhancing policies if productivity gains are not equitably shared
• Growing labour market inequality contributed to increased overall inequality if tax and transfers do not offset labour market inequality trends
• The incentives for employees to work hard will diminish if employees believe that they are not receiving their fair share of productivity gains
• Countries with large gaps between productivity and wages are less successful in the OECD Living Standards, especially in the equality component of the index
19
Related Documents