International Journal of Environment Volume: 11 | Issue: 01| Jan. - March| 2022 EISSN: 2706-7939 ISSN: 2077-4508 DOI: 10.36632/ije/2022.11.1.3 Journal homepage: www.curresweb.com Pages: 23-40 Corresponding Author: A.O.A. Ismail, Soil, Water, and Environment Institute, ARC, Giza, Egypt. E-mail: [email protected] 23 Effect of Gypsum Application on the Behavior of Some Rice Varieties under Salt Affected Soil Conditions 1 Ismail A.O.A., 1 Hamad M.M.H., 2 El-Hawary M.M. and 3 Gad K.I. 1 Soils, Water & Environment Research Institute, ARC, Giza, Egypt. 2 Crop Physiology Research Department, Field Crops Research Institute, ARC, 12619, Egypt. 3 Wheat Research Department, Field Crops Research Institute, ARC, 12619, Egypt Received: 15 Feb. 2021 Accepted: 20 Mar. 2022 Published: 30 Mar. 2022 ABSTRACT Rice cultivation in the salt-affected soil in northern Delta regions is an important issue to confront soil deterioration. Therefore, adopting rice varieties of lower water demand and maintaining optimum productivity is becoming one of the national issues coincident with the current circumstances and expected water shortage. For this purpose, the behavior of some rice genotypes during the two summer seasons of 2018 and 2019 under gypsum amended salt-affected soil conditions and their relations is of interest. However, gypsum application positively enhanced rice varieties' growth parameters, photosynthetic pigments, relative water content, leaves potassium content, yield, yield attributes and crop water productivity (WP), meanwhile leaves sodium content, proline content, and Na + /K + ratio influenced negatively. In addition, relative reduction in the soil layer's salt content and sodium adsorption ratio (SAR), whose recorded values seemed to be affected predominantly by the crop duration period. On the other hand, Egyptian hybrid one (EHR1) rated the highest grain yield, followed by Giza 178 with the corresponding values of 4.66 and 4.26 t fed. -1 , respectively. Despite that, Sakha 107 followed by Giza 177 rated the highest water productivity varieties with the corresponding values of 0.86 and 0.80 kg m -3 , respectively. Keywords: Rice, gypsum, water productivity, soil salinity 1. Introduction Salt-affected soil is a widespread phenomenon threatening agricultural lands and increases progressively as time goes on, particularly in those countries with arid and semi-arid climate conditions, which reached about 1 billion hectares of soil (Yang, 2006; Ivushkin et al., 2019). In Egypt, salt-affected soil covers about 60% of the northern parts of Delta Egypt (Ouda and Zohry, 2015), and it has increased gradually (AbdelRahman et al., 2022). Furthermore, the issue is getting more worrying due to climatic turbulence and heat waves in light of water scarcity (El-Marsafawy et al., 2019). Not only that, but the representative studied area of the Sahel El-Husainia plain is at risk of being exposed to two directions of seawater intrusion from El-Manzala lake on the north side and the Suez Canal on the east side. Moreover, the blended water of the El-Salam Canal is the only irrigation water source. For these reasons, soil leaching requirements and rice cultivation are the prevalent tools for salinity control, upward flux, and conserve plant root zone (El-Mowelhi, 1993; Ouda and Zohry, 2015). Soil salinity has a greater detrimental efficiency on the wheat plant development that resulted in a reduction in all growth parameters, i.e., seed emergency (Maas and Poss, 1989) and mineral constitute and ion accumulation (Hu et al., 2006). In the similar pattern to wheat, rice exhibited drastic perturbation in the physiological response and generating high levels of reactive oxygen species, ROS, that resulted in impaired the photosynthetic functions and increase oxidative damage that led to plant toxicity (Jahan et al., 2021; Liu et al., 2022). On the other hand, the ion concentration and chemical composition of downstream flow characterized by high salinity that may causes additional osmotic stress on crops that lead to a significant interruption on the physiological processes (Ashraf 2004; Slama

Welcome message from author
This document is posted to help you gain knowledge. Please leave a comment to let me know what you think about it! Share it to your friends and learn new things together.
Transcript

International Journal of Environment Volume: 11 | Issue: 01| Jan. - March| 2022
EISSN: 2706-7939 ISSN: 2077-4508 DOI: 10.36632/ije/2022.11.1.3 Journal homepage: www.curresweb.com Pages: 23-40
Corresponding Author: A.O.A. Ismail, Soil, Water, and Environment Institute, ARC, Giza, Egypt. E-mail: [email protected]
23
Effect of Gypsum Application on the Behavior of Some Rice Varieties under Salt Affected Soil Conditions
1Ismail A.O.A., 1Hamad M.M.H., 2El-Hawary M.M. and 3Gad K.I. 1Soils, Water & Environment Research Institute, ARC, Giza, Egypt. 2Crop Physiology Research Department, Field Crops Research Institute, ARC, 12619, Egypt. 3 Wheat Research Department, Field Crops Research Institute, ARC, 12619, Egypt
Received: 15 Feb. 2021 Accepted: 20 Mar. 2022 Published: 30 Mar. 2022 ABSTRACT Rice cultivation in the salt-affected soil in northern Delta regions is an important issue to confront soil deterioration. Therefore, adopting rice varieties of lower water demand and maintaining optimum productivity is becoming one of the national issues coincident with the current circumstances and expected water shortage. For this purpose, the behavior of some rice genotypes during the two summer seasons of 2018 and 2019 under gypsum amended salt-affected soil conditions and their relations is of interest. However, gypsum application positively enhanced rice varieties' growth parameters, photosynthetic pigments, relative water content, leaves potassium content, yield, yield attributes and crop water productivity (WP), meanwhile leaves sodium content, proline content, and Na+/K+ ratio influenced negatively. In addition, relative reduction in the soil layer's salt content and sodium adsorption ratio (SAR), whose recorded values seemed to be affected predominantly by the crop duration period. On the other hand, Egyptian hybrid one (EHR1) rated the highest grain yield, followed by Giza 178 with the corresponding values of 4.66 and 4.26 t fed.-1, respectively. Despite that, Sakha 107 followed by Giza 177 rated the highest water productivity varieties with the corresponding values of 0.86 and 0.80 kg m-3, respectively. Keywords: Rice, gypsum, water productivity, soil salinity
1. Introduction
Salt-affected soil is a widespread phenomenon threatening agricultural lands and increases progressively as time goes on, particularly in those countries with arid and semi-arid climate conditions, which reached about 1 billion hectares of soil (Yang, 2006; Ivushkin et al., 2019). In Egypt, salt-affected soil covers about 60% of the northern parts of Delta Egypt (Ouda and Zohry, 2015), and it has increased gradually (AbdelRahman et al., 2022). Furthermore, the issue is getting more worrying due to climatic turbulence and heat waves in light of water scarcity (El-Marsafawy et al., 2019). Not only that, but the representative studied area of the Sahel El-Husainia plain is at risk of being exposed to two directions of seawater intrusion from El-Manzala lake on the north side and the Suez Canal on the east side. Moreover, the blended water of the El-Salam Canal is the only irrigation water source. For these reasons, soil leaching requirements and rice cultivation are the prevalent tools for salinity control, upward flux, and conserve plant root zone (El-Mowelhi, 1993; Ouda and Zohry, 2015).
Soil salinity has a greater detrimental efficiency on the wheat plant development that resulted in a reduction in all growth parameters, i.e., seed emergency (Maas and Poss, 1989) and mineral constitute and ion accumulation (Hu et al., 2006). In the similar pattern to wheat, rice exhibited drastic perturbation in the physiological response and generating high levels of reactive oxygen species, ROS, that resulted in impaired the photosynthetic functions and increase oxidative damage that led to plant toxicity (Jahan et al., 2021; Liu et al., 2022). On the other hand, the ion concentration and chemical composition of downstream flow characterized by high salinity that may causes additional osmotic stress on crops that lead to a significant interruption on the physiological processes (Ashraf 2004; Slama
Inter. J of Envi., 11(1): 23-40, 2022 EISSN: 2706-7939 ISSN: 2077-4508 DOI: 10.36632/ije/2022.11.1.3
24
et al. 2015) which obstruct plant growth and reduce soil productivity (Munns 2005). Furthermore, the gradual uses of wastewater contributing in soil salinity and sodicity development (Chaganti et al., 2021).
Rice (Oryza sativa L.) is a worldwide growing crop, not just for salinity control, but as a consuming cereal food, similar to wheat and maize, for more than half of the world population (Lou et al., 2012; Anis et al., 2016; Moonmoon et al., 2017). From this point of view, the rapid population increase represents an overburden pressure on agricultural production of rice and cereal grains, in general, and due to the scarcity of water resources in arid and semi-arid areas aggravated by salinity development (Xiao et al., 2022), water rationalization has become an urgent necessity (Ali and Wani, 2021). Therefore, developing rice strains characterized by a short growth period and adapted to salt stress becomes an important issue. The Rice plant, in general, is one of the salt-sensitive crops and has varying responses during the different growth stages (Zeng et al., 2002). It is a relative most salt-tolerant at the germination, active tillering, and maturity growth stages. Despite this, it is most sensitive at the early seedling and reproductive stages (Munns and Tester, 2008).
The salt-affected soils showed a significant response to various restoration processes worldwide. The results revealed that soil responses varied according to the reclamation mechanisms method (Ryu et al., 2021) and techniques used and depended mainly on the type and efficiency of the amendments materials (Qadir et al., 2021; Xiao et al., 2022), water quality (Sharma and Minhas, 2005), and the application method. Generally, gypsum is one of the most important and cheapest ameliorant materials (Mokoi and Verplancke, 2010; Shi et al., 2022). Although it is slow to dissolve, it has pleiotropic positive effects on soil and plants (Singh et al., 2016; Rosolem et al., 2017; Holland et al., 2018). And through the release of calcium ions, the adsorbed sodium is substituted on the colloidal soil surfaces (Schultz et al., 2017), reducing clay dispersion and coagulating soil particles supporting aggregate stability (Luo et al., 2015) for these reasons, facilitating soil permeability and salts washing, especially the sodium ion. In addition, increasing calcium ions in the soil solution increases the plant's ability to withstand salt stress (Liu et al., 2022). As a result improving plant physiological functions resulted in improved crop productivity (Islam et al., 2019; Abdul Qadir et al., 2022).
Therefore, this study aims to study the effect of gypsum application on the performance of some newly cultivated rice strains in the studied area, which have a different growth cycle and their impacts on salt washing out of the soil. In addition, crop productivity and water unit efficiency are of concern. 2. Materials and Methods 2.1. Experimental site and layout:
A field trial was executed for two successive rice cropping seasons within the side in the salt-affected soil nearby El-Manzala lake (31˚00ʹ15˝ N 32˚ 08ʹ15˝ E) of South El Husainia Plain, El Sharqia governorate, Egypt, during the years 2018 and 2019, to assess the impact of gypsum treatment on seven rice genotypes and some soil properties. The productivity and physiological reaction of the involved rice varieties, i.e., growth parameters, photosynthetic pigments, relative water content, yield, and yield attributes of the interest. In addition, proline, Na+, and K+ contents in rice plant leaves were measured. In addition, the soil layer`s salt content for 0.6 m depth and their sodium adsorption ratio (SAR) besides water productivity are of top concern. The experimental design was implemented in the split-plot scheme with three replications during the study period and following flood irrigation technique as the prevalent site activities. Again, principle plots received rice varieties, and at the same time, the subplots have acquired a gypsum treatment assigned as G● on the opposite side of the Go plot without gypsum. The experimental plot size was 5mX15m (75 m2) and the post winter crop (wheat) followed precisely the experimental lay out with the common farmer practices.
2.2. Soil sampling, analysis, and gypsum dose:
Soil samples from the experimental area were collected in 20cm increments to a depth of 0.6 m in the first year before land preparation, and their physical and chemical parameters are shown in Table 1. At rice harvesting time, representative soil layer samples were obtained for each plot in a similar manner to initial samples for chemical analysis to examine the effects of gypsum and crop duration (in light of its measurements to the applied water) on soil parameters. According to Richards (1954), the electrical conductivity of the saturated soil paste extract (ECe) was used to assess the soil layers' salt content.

Inter. J of Envi., 11(1): 23-40, 2022 EISSN: 2706-7939 ISSN: 2077-4508 DOI: 10.36632/ije/2022.11.1.3
25
Meanwhile the cations analysis of the soil paste extract was used to calculate the sodium adsorption ratio (SAR) as an indicator for ESP (exchangeable sodium percent) terms as stated by Suarez (2001), Chaganti et al. (2021) and Yahya et al. (2022). In addition, before starting the second summer season, the soil bulk density of each replicate was determined using the undisturbed core method (Richards, 1954). ESP was assessed according to the following equations:
ESP = ((1.475*SAR) -1.26) / ((0.01475*SAR) + 0.9874) Eq. (1) The 5.33 ton / fed soil gypsum requirement was calculated based on gypsum purity (90%) and
Na:Ca exchange efficiency factor (1.25) and be evenly divided between the two summers. Soil gypsum requirements (GR) values were calculated based on reducing the estimated ESP of the surface soil layer from 19.68% to 10%. Based on Richards (1954) 1 mill-equivalent (meq) of Ca2+ is required to replaced 1meq Na+ of 100g soil, or in other terms 0.86 (g) of pure gypsum is accounted for substituting 1meq Na+ per each kg of soil. Consequently, GR per feddan was calculated based on the following equations:
GR (kg) per kg of soil = (ESP initial - ESP final) * CEC *0.86
Eq.(2)100*1000
Feddan weight (kg) = Area (m2)*bulk density (kg m-3)*soil depth (m). Eq. (3)
GR (ton fed-1) = Eq. (2) * Eq. (3)
* 100
*1.25 Eq.(4)1000 Gypsum purity
2.3. Experimental plot preparation:
Before commencing the experiment, the soil was chiseled twice to a depth of 20 cm, followed by straight shank sub-soiling at 2.5 m and 45-50 cm depths (at the start of the experiment), gypsum dose manually broadcasted, properly blended by rotavator, and lastly, land leveling was created. The main plots were divided by a light drain ditch (40cm depth), whereas the experimental area had a subsurface drainage net (15m spacing and 60-70cm depth) linked to a shallow open drain of 0.9 m. The ditching drain and plot sides were smooth-toned to avoid lateral water movement and precisely exact water readings. Table 1: Initial analysis of some physical and chemical properties of the experimental soil layers.
Depth cm
Clay % Silt % Sand % Texture pb g cm-3 CaCO3% O.M % pH
(1:2.5) ESP
0 - 20 53.38 28.17 18.45 clay 1.41 80.18 1.15 8.41 19.68 ±2.1 ±1.5 ± 1.2 ±0.01 ±3.3 ±0.04 ±0.16 ±3.7
20 - 40 58.78 25.2 16.02 clay 1.43 64.47 0.79 8.37 21.73 ±2.4 ±1.31 ±0.9 ±0.01 ±2.7 ±0.02 ±0.21 ±4.0
40 - 60 62.42 23.99 13.59
clay 1.45 57.76 0.4 8.28 26.84
±3.0 ±1.8 ±1.6 ±0.01 ±2.4 ±0.01 ±0.19 ±3.4
Soluble cations and anions (mmolc L-1) Depth
cm ECe
dSm-1 Na+ Ca2+ Mg2+ K+ CO3
2- HCO3- Cl- SO4
2-
0 - 20 6.6 49.86 5.45 10.85 0.96 nd 3.10 50.68 13.34 ±0.89 ±3.6 ±0.95 ±1.17 ±0.9 ±0.7 ±4.1 ±2.6
20 - 40 9.87 75.63 8.37 21.17 1.05 nd 2.50 80.44 23.28 ±0.94 ±3.9 ±1.03 ±1.6 ±0.6 ±0.4 ±4.3 ±3.5
40 - 60 22.4 145.93 18.99 45.35 1.55 nd 2.44 167.76 41.62 ±1.6 ±4.8 ±.1.4 ±1.8 ±0.4 ±0.6 ±6.2 ±4.1
Note ± indicate stander deviation, ρb: bulk density, CaCO3: calcium carbonate, OM: organic matter, SAR and ECe: Sodium adsorption ratio and electrical conductivity of saturated soil past extract, nd: not detected. * CEC: Cation exchange capacity of soil layer 0-20 cm = 38.9 (cmolc kg-1), and estimated soil gypsum requirements = 5.33 ton/fed-1 for 20cm soil depth.

Inter. J of Envi., 11(1): 23-40, 2022 EISSN: 2706-7939 ISSN: 2077-4508 DOI: 10.36632/ije/2022.11.1.3
26
2.4. Irrigation water supply:- For irrigation water measurements, a water pump with a valve and a calibrated water meter
(m3) was employed, and water was conveyed via a polyethylene sheet in front of the pump. The quantity of water given to plots is accurately under control, and the measures include the amount of water needed for soil preparation (7-day ponding with following increments until a constant steady infiltration). In addition, the amount of irrigation water provided for each treatment was recorded to determine the overall amount of water applied during the crop growth phase, which ends 15 days before harvest. During irrigation days (5-6 days intervals), the average water depth of all treatments was roughly 5 cm. According to Israelsen and Hansen (1962), the water productivity WP, or water usage efficiency, was calculated as follows:
WUE = Rice grain yield (kg fed.-1) /Total water used (m3 fed.-1).
It's worth noting that throughout the study period, irrigation water quality was tested twice a
month; in addition, water samples were monitored for EC values and subjected to chemical tests when the recorded EC value changed; and the average data is presented in Table 2.
Table 2: Chemical analysis of the irrigation water used. Average of (1st and 2nd seasons). ECiw (dS m-1) pH SAR 2.15 ± 0.63 7.18 ± 0.04 4.38 ± 1.24 Cations Anions (g m-3) Na+ 244 ±83.0 HCO3
- 179.1 ±26.8
K+ 21.61 ±6.8 Cl- 254.7 ±86.8
Ca2+ 84.96 ±16.6 SO42- 1003 ±290.8
Mg2+ 61.65 ±17.4 NO3- 17.5 ±2.2
NH4+ 15.56 ± 3.3 mean ± stander deviation
ECiw and SAR: Electrical conductivity and Sodium adsorption ratio of irrigation water, respectively.
2.5. Rice varieties:-
Two types of rice are the common varieties cultivated in the studied area, namely Giza 178 and Sakha 101, each of them revealed the adequate performance and relative yield (Mehana et al., 2021) , the latter characterized by a long growth period and more applied water. Very few studies focused on estimating the applied irrigation water of these species under the site conditions. Furthermore, adopting varieties with different growth cycles in the region requires also a deep study dealing with the growth performance of the concerned tested rice cultivars, i.e., the applied water amount of them and the extent of their response to the addition of amending soil gypsum, besides the impact of these factors on the salt content of soil layers. It may be worth mentioning that the tested genotype is supported by the Department of Field Crops Research Institute according to their appropriate performance in vast conditions (Moursi and Abdelkhalek, 2015; Abd El- Megeed et al., 2016; EL-Habet et al., 2018). On the other hand, the rice variety Sakha 101was excluded due to its extensive water requirements during the first growing season (2018), following the agriculture Ministry prohibitions. However, Table 3 summarizes the pedigree of the tested varieties.
Table 3: The studied seven Egyptian rice genotypes and their pedigree and type
No Genotypes Pedigree Type
1 Egyptian hybrid one (EHR1) IR69625A / Giza178 Indica 2 Giza 178 Giza 175 / Milyang 49 Indica- japonica 3 Giza 177 Giza 171 / YomjiNo.1 // Pi No.4 Japonica 4 Sakha107 Giza177 / BL1 Japonica 5 Sakha 106 Giza 177 / Hexi 30 Japonica 6 Sakha 104 GZ 4096-8-1 / GZ 4100-9-1 Japonica 7 Sakha 101 Giza 176 / Milyang 79 Japonica
Inter. J of Envi., 11(1): 23-40, 2022 EISSN: 2706-7939 ISSN: 2077-4508 DOI: 10.36632/ije/2022.11.1.3
27
Rice varieties seeds soaked overnight, left to dry, then broadcasted. All seed types received the prevalent practices according to the recommendations of the Egyptian Field Crops Research Institute at the site. 2.6. Growth characters:-
A random five plants per replicate were used to determine leaf area index (LAI), net assimilation rate (NAR), and crop growth rate (CGR) in terms of g m-2day-1 at 65, 80 and 95 days after seeding (DAS) following Hunt (1990) formulas as follow: - Leaf area index (LAI) = leaf area of plant (cm2) /land area occupied by plant (cm2). - Net assimilation rate, in g m-2day-1 (NAR) = (W2-W1) (logeA2-loge A1) / (A2-A1) (t2-t1). - Crop growth rate, in in g m-2day-1 (CGR) = (W2-W1) / (t2-t1). Where:- A2-A1; differences in leaf area between the two samples, W2-W1; differences in dry matter accumulation of whole plants between two periods in (g), t2-t1; Number of days between two successive periods (day), and Loge: Natural logarithm. In addition, other plant samples were oven dried (70 °C) until a constant weight. Meanwhile, At 80 (DAS), based on the fresh weight, photosynthetic pigments (chlorophyll a, chl a, chlorophyll b, chl b, and carotenoids) in terms of mg/g, leaf proline concentration in terms of µg/g, and relative water content percentage (RWC %) were determined following Metzener et al. (1965), Bates et al. (1973), and Cao et al. (2015), respectively. The equation used for the calculated RWC percentage, could be represented by- RWC (%) = (Fresh weight‐Dry weight) x 100 / (Turgid weight‐Dry weight).
On the other hand, at the same period potassium and sodium content (mmol/kg) in wheat plant dry weight was determined following Allen et al. (1974) method. In addition, at harvest time yield and yield attributes, i.e., plant height (cm), panicle length (cm) and panicle weight (g) were determined and after harvest 1000-grain weight (g), grain and straw yields ton/ feddan (t fed.-1) were determined. Data of the two seasons were subjected to statistical analysis of variance according to Steel and Torrie (1980). The treatments average was compared using LSD test at 0.05 level of significant. 3. Results and Discussion 3.1. Growth and growth analysis:-
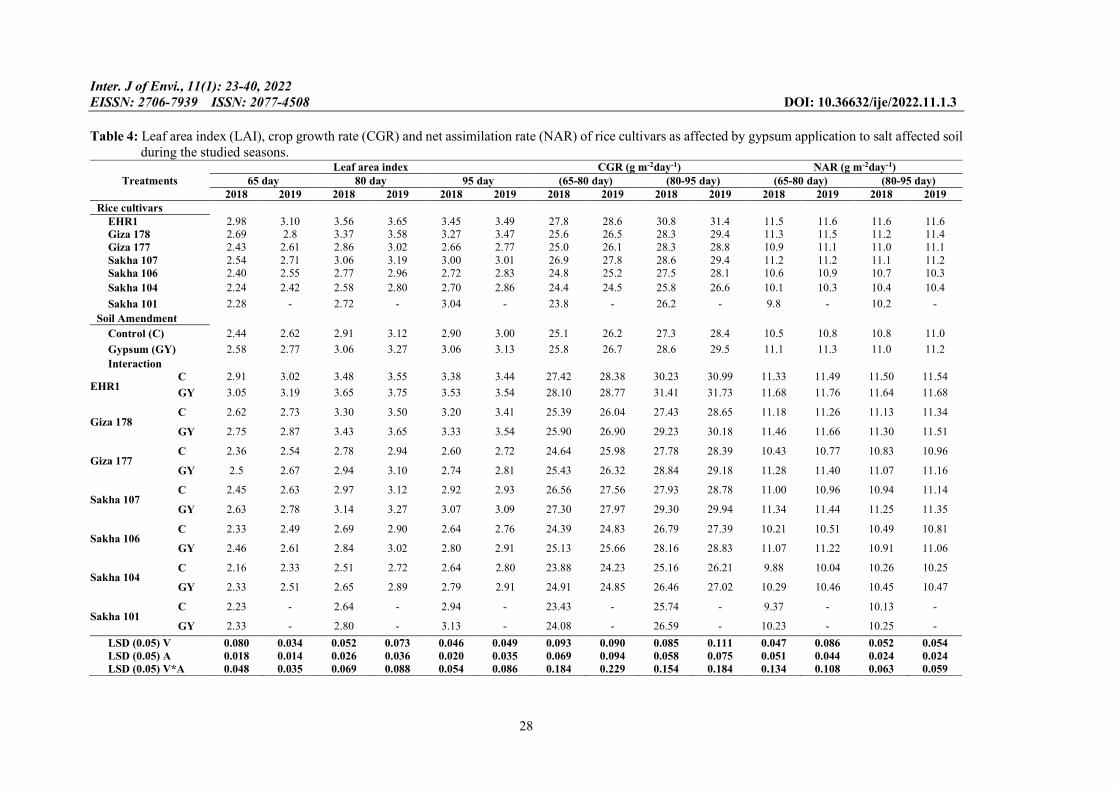
Data in table 4 indicated that LAI, CGR, and NAR values of different rice cultivars were increased significantly as the time progressed, i.e., 65- 80 and 80-95 DAS, respectively, with the superiority of the Egyptian hybrid one (EHR1) variety followed by Giza 178 over the tested rice varieties. Meanwhile, the Sakha 104 was inferior, and a similar trend followed during the studied second season. The superiority of the studied plant characters for gypsum treatments is possibly due to more chances for released Ca2+ effect on soil improving as the time goes on (Zayed et al., 2017a). In addition, those plants of the control treatments recorded higher values in the second season, concerning the previously mentioned plant parameters, which seemed to be affected by the reduction in soil layers salinity. Moreover, the varietal differences in the concerned parameters may be because of the differences in the genetic structure among the rice cultivars related to the dry matter partitioning and salinity response (Kanawapee et al., 2013) besides the rice cultivar duration. Moreover, the results of Abd El-Megeed et al. (2016) and Shimizu et al. (2022) indicated that EHR1 and Giza 178 varieties of high performance even under high saline conditions (Zayed et al., 2013). 3.2. Photosynthetic pigments:-
Data in table 5 revealed a significant variation in the measurements values of photosynthetic pigments contents, which involved chlorophyll a and chlorophyll b besides carotenoids, within the rice genotypes during the studied periods. At 80 DAS, photosynthetic pigments content in leaves of EHR1, recorded the highest values over the other studied cultivars. Meanwhile, Sakha 107, Giza177 and
Inter. J of Envi., 11(1): 23-40, 2022 EISSN: 2706-7939 ISSN: 2077-4508 DOI: 10.36632/ije/2022.11.1.3
28
Table 4: Leaf area index (LAI), crop growth rate (CGR) and net assimilation rate (NAR) of rice cultivars as affected by gypsum application to salt affected soil during the studied seasons.
Treatments Leaf area index CGR (g m-2day-1) NAR (g m-2day-1)
65 day 80 day 95 day (65-80 day) (80-95 day) (65-80 day) (80-95 day) 2018 2019 2018 2019 2018 2019 2018 2019 2018 2019 2018 2019 2018 2019
Rice cultivars EHR1 2.98 3.10 3.56 3.65 3.45 3.49 27.8 28.6 30.8 31.4 11.5 11.6 11.6 11.6 Giza 178 2.69 2.8 3.37 3.58 3.27 3.47 25.6 26.5 28.3 29.4 11.3 11.5 11.2 11.4 Giza 177 2.43 2.61 2.86 3.02 2.66 2.77 25.0 26.1 28.3 28.8 10.9 11.1 11.0 11.1 Sakha 107 2.54 2.71 3.06 3.19 3.00 3.01 26.9 27.8 28.6 29.4 11.2 11.2 11.1 11.2 Sakha 106 2.40 2.55 2.77 2.96 2.72 2.83 24.8 25.2 27.5 28.1 10.6 10.9 10.7 10.3
Sakha 104 2.24 2.42 2.58 2.80 2.70 2.86 24.4 24.5 25.8 26.6 10.1 10.3 10.4 10.4
Sakha 101 2.28 - 2.72 - 3.04 - 23.8 - 26.2 - 9.8 - 10.2 -
Soil Amendment
Control (C) 2.44 2.62 2.91 3.12 2.90 3.00 25.1 26.2 27.3 28.4 10.5 10.8 10.8 11.0
Gypsum (GY) 2.58 2.77 3.06 3.27 3.06 3.13 25.8 26.7 28.6 29.5 11.1 11.3 11.0 11.2
Interaction
EHR1 C 2.91 3.02 3.48 3.55 3.38 3.44 27.42 28.38 30.23 30.99 11.33 11.49 11.50 11.54
GY 3.05 3.19 3.65 3.75 3.53 3.54 28.10 28.77 31.41 31.73 11.68 11.76 11.64 11.68
Giza 178 C 2.62 2.73 3.30 3.50 3.20 3.41 25.39 26.04 27.43 28.65 11.18 11.26 11.13 11.34
GY 2.75 2.87 3.43 3.65 3.33 3.54 25.90 26.90 29.23 30.18 11.46 11.66 11.30 11.51
Giza 177 C 2.36 2.54 2.78 2.94 2.60 2.72 24.64 25.98 27.78 28.39 10.43 10.77 10.83 10.96
GY 2.5 2.67 2.94 3.10 2.74 2.81 25.43 26.32 28.84 29.18 11.28 11.40 11.07 11.16
Sakha 107 C 2.45 2.63 2.97 3.12 2.92 2.93 26.56 27.56 27.93 28.78 11.00 10.96 10.94 11.14
GY 2.63 2.78 3.14 3.27 3.07 3.09 27.30 27.97 29.30 29.94 11.34 11.44 11.25 11.35
Sakha 106 C 2.33 2.49 2.69 2.90 2.64 2.76 24.39 24.83 26.79 27.39 10.21 10.51 10.49 10.81
GY 2.46 2.61 2.84 3.02 2.80 2.91 25.13 25.66 28.16 28.83 11.07 11.22 10.91 11.06
Sakha 104 C 2.16 2.33 2.51 2.72 2.64 2.80 23.88 24.23 25.16 26.21 9.88 10.04 10.26 10.25
GY 2.33 2.51 2.65 2.89 2.79 2.91 24.91 24.85 26.46 27.02 10.29 10.46 10.45 10.47
Sakha 101 C 2.23 - 2.64 - 2.94 - 23.43 - 25.74 - 9.37 - 10.13 -
GY 2.33 - 2.80 - 3.13 - 24.08 - 26.59 - 10.23 - 10.25 -
LSD (0.05) V 0.080 0.034 0.052 0.073 0.046 0.049 0.093 0.090 0.085 0.111 0.047 0.086 0.052 0.054 LSD (0.05) A 0.018 0.014 0.026 0.036 0.020 0.035 0.069 0.094 0.058 0.075 0.051 0.044 0.024 0.024 LSD (0.05) V*A 0.048 0.035 0.069 0.088 0.054 0.086 0.184 0.229 0.154 0.184 0.134 0.108 0.063 0.059

Inter. J of Envi., 11(1): 23-40, 2022 EISSN: 2706-7939 ISSN: 2077-4508 DOI: 10.36632/ije/2022.11.1.3
29
relatively Giza 178 seemed to be; in general, close to each other’s with the concerned parameters, the lowest values being shared with the cultivars Sakha 101 or Sakha 104. These results indicated that salt tolerant and moderately tolerant cultivars, opposite to moderately sensitive, sensitive and highly sensitive , were significantly higher in their chlorophyll under the stress conditions (Kanawapee et al., 2012). The relative variation among the tested varieties under salt affected soil stress may be account for their genetic backgrounds as reported by Zayed et al. (2017b) and Gerona et al. (2019) and findings of Shimizu et al., (2022). Table 5: Photosynthetic pigments (chlorophyll a, chlorophyll b and carotenoids) content of some rice
varieties leaves at 80 days as affected by gypsum application to salt affected soil during the studied seasons
Treatments
Photosynthetic pigments (mg g-1 FW) Chl a Chl b Carotenoids
2018 2019 2018 2019 2018 2019 Rice cultivars
EHR1 0.463 0.482 0.179 0.188 0.109 0.114 Giza 178 0.452 0.476 0.173 0.184 0.102 0.107 Giza 177 0.444 0.457 0.162 0.171 0.099 0.104 Sakha 107 0.460 0.476 0.176 0.184 0.102 0.105 Sakha 106 0.427 0.448 0.154 0.164 0.088 0.092 Sakha 104 0.401 0.412 0.147 0.155 0.082 0.086 Sakha 101 0.392 - 0.150 - 0.084 -
Soil Amendment Control (C) 0.421 0.450 0.157 0.169 0.092 0.098 Gypsum (GY) 0.447 0.467 0.168 0.180 0.098 0.104 Interaction
EHR1 C 0.451 0.473 0.173 0.180 0.106 0.110 GY 0.475 0.490 0.184 0.195 0.112 0.117
Giza 178 C 0.441 0.470 0.167 0.179 0.099 0.105 GY 0.462 0.482 0.178 0.189 0.104 0.109
Giza 177 C 0.436 0.444 0.157 0.166 0.096 0.101 GY 0.451 0.470 0.166 0.177 0.102 0.107
Sakha 107 C 0.448 0.469 0.170 0.179 0.098 0.102 GY 0.471 0.484 0.182 0.189 0.105 0.108
Sakha 106 C 0.413 0.441 0.149 0.158 0.084 0.088 GY 0.442 0.454 0.160 0.170 0.091 0.096
Sakha 104 C 0.385 0.404 0.141 0.150 0.078 0.083 GY 0.417 0.420 0.153 0.159 0.085 0.089
Sakha 101 C 0.372 - 0.144 - 0.081 - GY 0.411 - 0.155 - 0.088 -
LSD (0.05) V 0.005 0.004 0.003 0.003 0.007 0.009 LSD (0.05) A 0.002 0.001 0.002 0.002 0.001 0.001 LSD (0.05) V*A 0.006 0.003 0.005 0.005 0.002 0.002
Results also revealed that the amended treatment with gypsum application compared to the check
treatment resulted in a significant variation in the all measurements of photosynthetic pigment contents during the studied seasons. Similar behavior was recorded as the interaction effect of between tested rice varieties and gypsum application are considered. These detectable results reflected the enhancement effect of Ca2+ released due to gypsum dissolution on retarding the Na+ destruction effect related to clay dispersion or that of the osmotic stress consequently reduced ROS production that resulted in significant increases in photosynthetic pigments functions (Rahman et al. 2016). In addition, enhancement in nutrients availability because of pH reduction by sulfate ions may be other possibility for enhancing physiological performance (Cha-um et al. 2011; Zayed et al. 2017b).
3.3. Relative water content, proline, Na+, K+ and Na+/K+ ratio
The values of RWC, proline, Na+, K+, and Na+/K+ ratio, in general, significantly varied among the tested rice varieties during the first summer season (Table 6). Although Sakha 101 was not cultivated during the second summer season (2019), rice cultivars commonly followed a similar trend as those obtained during the first season. Giza 178 and EHR1, contrary to Sakha varieties 101, 104, and 106, recorded the highest values for RWC percentage and K+ content despite their inferiority for proline and

Inter. J of Envi., 11(1): 23-40, 2022 EISSN: 2706-7939 ISSN: 2077-4508 DOI: 10.36632/ije/2022.11.1.3
30
Na+ content beside Na+/K+ ratio. These results indicated that both cultivars were more salinity tolerant, i.e., with a higher RWC percentage with a lower Na+/K+ ratio, and such parameters are predominantly used to assess salinity tolerance species (Suriya-arunroj et al., 2004). On the other hand, Sakha 101, 104, and 106 varieties seemed susceptible to experimental stress conditions with lower affinity for K+ absorption and contained high Na+ values (Mekawy et al. 2015; Abdelaziz et al. 2018). Therefore, increasing the Na+/K+ ratio resulted in rising proline content (Munns et al., 2002; Monsur et al. 2020). That is true since stressed plants revealed higher proline accumulation that plays a principal role in osmotic adjustment by maintaining protein and cellular structures and controlling free radical components. In addition, reduced ROS accumulation consequently enhances rice tolerance to abiotic stress (Nahar et al., 2016; Kibria et al., 2017). Zayed et al., (2017a) and Shimizu et al., (2022) found similar results. Table 6: Relative water content, proline, sodium, potassium content and Na+/K+ ratio in leaves of some
rice varieties at 80 days as affected by gypsum application to salt affected soil during the studied seasons
Treatments
Relative water content (%)
Proline (µg g-1 FW)
Leaf Na+content (mmol kg-1)
Leaf K+content (mmol kg-1)
Na+/K+ ratio
2018 2019 2018 2019 2018 2019 2018 2019 2018 2019 Rice cultivars
EHR1 87.5 88.8 104 100 206 197 323 331 0.64 0.60 Giza 178 88.6 89.4 100 95 178 171 322 327 0.55 0.52 Giza 177 81.5 82.6 117 113 227 216 304 310 0.75 0.70 Sakha 107 83.3 85.0 112 107 221 207 311 319 0.71 0.65 Sakha 106 79.6 80.3 121 119 241 228 289 295 0.84 0.77 Sakha 104 77.6 78.3 131 122 260 248 295 305 0.88 0.82 Sakha 101 83.1 - 127 - 251 - 282 - 0.89 -
Soil Amendment Control (C) 81.2 82.1 120 112 235 221 296 306 0.80 0.72 Gypsum (GY) 84.8 86.0 112 107 217 201 311 323 0.70 0.63
Interaction
EHR1
C 85.2 86.7 107 103 218 208 314 321 0.69 0.65
GY 89.8 90.9 101 97 193 185 331 342 0.58 0.54
Giza 178 C 86.5 87.4 103 98 189 184 315 319 0.60 0.58
GY 90.7 91.3 97 92 166 158 328 335 0.51 0.47
Giza 177 C 79.4 80.5 120 115 236 225 297 303 0.79 0.74
GY 83.5 84.7 114 112 218 206 310 317 0.70 0.65
Sakha 107 C 81.8 83.0 114 109 227 216 304 312 0.75 0.69
GY 84.7 86.9 110 104 215 197 319 325 0.68 0.61
Sakha 106 C 77.8 78.7 124 121 248 234 280 287 0.88 0.82
GY 81.5 82.0 118 116 234 223 297 304 0.79 0.73
Sakha 104 C 75.9 76.4 139 126 268 257 286 294 0.94 0.87
GY 79.3 80.3 122 119 251 239 304 315 0.83 0.76
Sakha 101 C 81.8 - 130 - 261 - 274 - 0.95 -
GY 84.4 - 123 - 242 - 290 - 0.83 -
LSD (0.05) V 0.19 0.28 8.94 9.13 5.50 1.94 3.97 6.62 0.017 0.007 LSD (0.05) A 0.12 0.09 1.39 0.63 2.22 1.26 7.00 1.10 0.008 0.005 LSD (0.05) V*A 0.062 0.04 3.68 1.54 5.86 3.08 1.85 2.70 0.022 0.012
Results also revealed that irrespective of rice varieties, the gypsum application significantly
improves plant leaves water content and K content despite a remarkable significant reduction in proline, Na+, and Na+/K+ ratio with the superiority of the second season. This behavior may account for the relative decrease in soil salt content (EC) and SAR values, compared to those of un-amended treatment, of the plant's root zone (soil parameters) under gypsum treatment resulting in enhanced physicochemical properties and reducing osmotic stress that facilitates plant water uptake. These results are in agreements with those found by Sheoran et al., (2021).
Concerning interaction effect, obtained results revealed that gypsum-treated plants significantly have higher RWC and K+ content despite their inferiority regarding proline and Na+ contents besides Na+/K+

Inter. J of Envi., 11(1): 23-40, 2022 EISSN: 2706-7939 ISSN: 2077-4508 DOI: 10.36632/ije/2022.11.1.3
31
ratio, compared to control treatment. Giza 178 and EHR1 surpass the tested rice cultivars for the concerned parameters, even under the control treatment. These may reveal their ability to prevent Na+ transport and accumulation in leaves (Munns and Tester, 2008). In contrast, salt-sensitive plants are more susceptible to growth reduction. These may be because of the energy spent on the production and proline storage (Chen et al. 2007).
However, the migration of hazardous salts in the soil after gypsum application and increased availability of the essential mineral ions particularly Ca2 + and K + facilitate the adaptation of plants to salt stress, comparison with controls (Mann et al., 2019). Moreover, soluble Ca2+ may contribute to reduce and regulate the binding Na+ to the cell wall and plasma membrane that helps to improve cell integrity and plasma membrane functions (Lauchli, 1990; Rengel, 1992). Accordingly, the soluble Ca2+ liberated from gypsum dissolution may be accounting for alleviating Na + stressful effects on rice growth (Chi et al., 2012).
3.4. Yield and yield components
Data in Table (7) reveal that EHR1 gave a significant increase in plant height, panicle length, panicle weight, grain yield and straw yield as compared with other rice cultivars under stress conditions during the two seasons, while Sakha 101 gave the highest 1000- grain weight in the 1st season and Sakha 106 gave a significant increase in 1000-grain weight in the 2nd season. These findings came in line with those of Zayed et al., (2007); Aamer and Tabl (2019), who observed that rice cultivars significantly differed in their grain and straw yield as well as yield attributes. However, Zeng et al. (2003) stated that there were significant correlations between LAI and yield components in both salt-tolerant and sensitive genotypes and confirmed the significant contribution of LAI to grain yield.
Table 7: Yield and yield components of some rice varieties as affected by gypsum application to salt
affected soil during the studied seasons.
Treatments
Plant height (cm)
Panicle length (cm)
Panicle weight (g)
1000-grain weight (g)
Grain yield (t fed.-1)
Straw yield (t fed.-1)
2018 2019 2018 2019 2018 2019 2018 2019 2018 2019 2018 2019 Rice cultivars
EHR1 102 105 24.9 25.0 3.56 3.80 29.2 30.1 4.62 4.70 5.33 5.38 Giza 178 98.5 99.2 23.0 23.7 2.99 3.15 23.3 23.8 4.23 4.29 5.31 5.35 Giza 177 96.7 97.7 22.8 23.4 3.07 3.20 31.0 32.3 3.95 4.06 5.12 5.19 Sakha 107 99.8 99.8 23.1 23.2 3.19 3.29 32.2 33.9 4.08 4.12 5.15 5.24 Sakha 106 95.5 96.3 22.3 22.4 3.09 3.26 33.5 34.5 3.74 3.82 5.10 5.17 Sakha 104 95.7 94.0 22.4 22.4 3.29 3.37 33.9 33.7 3.38 3.43 5.17 5.27 Sakha 101 94.3 - 21.6 - 3.20 - 34.7 - 4.19 - 5.14 -
Soil Amendment Control (C) 96.1 97.7 22.2 22.8 3.05 3.18 30.3 30.8 3.84 3.87 5.12 5.20 Gypsum (GY) 99.0 99.7 23.6 24.0 3.35 3.51 31.9 32.0 4.21 4.27 5.25 5.33
Interaction
EHR1 C 101.3 103.3 24.00 24.17 3.41 3.65 28.0 29.5 4.37 4.43 5.27 5.33
GY 103.3 107.0 25.83 25.83 3.71 3.94 30.3 30.7 4.88 4.97 5.38 5.42
Giza 178 C 97.7 98.7 22.17 23.00 2.83 2.96 22.5 23.0 3.99 4.08 5.24 5.27
GY 99.3 99.7 23.83 24.33 3.15 3.33 24.0 24.5 4.46 4.50 5.38 5.43
Giza 177 C 95.7 96.7 22.17 23.00 2.91 3.05 30.0 31.6 3.75 3.83 5.04 5.12
GY 97.7 98.7 23.50 23.83 3.24 3.36 32.0 33.1 4.15 4.29 5.19 5.26
Sakha 107 C 98.3 99.3 22.50 22.50 3.03 3.12 31.4 33.3 3.88 3.85 5.06 5.14
GY 101.3 100.3 23.67 23.83 3.34 3.46 33.0 34.6 4.27 4.38 5.24 5.34
Sakha 106 C 94.3 95.3 21.83 22.00 2.95 3.09 32.8 34.0 3.45 3.64 5.07 5.11
GY 96.7 97.3 22.67 22.83 3.23 3.42 34.2 34.9 4.02 3.99 5.14 5.23
Sakha 104 C 93.3 92.3 21.83 22.33 3.13 3.21 33.5 33.4 3.31 3.36 5.14 5.23
GY 98.0 95.3 23.00 23.17 3.44 3.52 34.4 34.1 3.44 3.49 5.21 5.31
Sakha 101 C 92.3 - 20.67 - 3.08 - 34.1 - 4.10 - 5.05 -
GY 96.3 - 22.67 - 3.31 - 35.3 - 4.29 - 5.22 -
LSD (0.05) V 0.718 1.097 0.408 0.136 0.017 0.015 0.523 0.402 0.037 0.025 0.028 0.022
LSD (0.05) A 0.468 0.453 0.198 0.148 0.015 0.015 0.345 0.219 0.015 0.012 0.011 0.013 LSD (0.05) V*A 1.238 1.109 0.523 0.363 0.041 0.037 0.914 0.535 0.040 0.028 0.028 0.031

Inter. J of Envi., 11(1): 23-40, 2022 EISSN: 2706-7939 ISSN: 2077-4508 DOI: 10.36632/ije/2022.11.1.3
32
With respect to the effect of gypsum application on plant height, panicle length, panicle weight, 1000-grain weight, grain yield and straw yield produced significant increase as compared with untreated control plants in the two seasons. This could be due to higher reclamation efficiency in terms of chemical soil properties and such progress in soil reclamation might resulted in an evident reduction in osmotic potential (Hafez et al., 2015; Murtaza et al. 2017). However, Saqib et al., (2020) concluded that under salt stressed gypsum application produced the favorable growth conditions for rice crop which was reflected by improved yield and yield components. 3.5. Soil characteristics and irrigation water Applied:
The total applied irrigation water, the water use efficiency in terms of water productivity (WP), and soil layers salt content of the cultivated rice varsities during the two-studied summer seasons are summarized in Table 8 and Figs. 1 and 2. Table 8: The applied water, water productivity and soil layer salt content of the rice varieties under
gypsum application during the studied seasons.
Treatments
Applied water (m3) WP (kg m-3)
Salt content (kg fad-1)
(0-20) cm (20-40) cm (40-60) cm 2018 2019 2018 2019 2018 2019 2018 2019 2018 2019
Rice cultivars EHR1 5848 5930 0.790 0.792 3116 2790 8454 5930 21354 11610 Giza 178 5649 5699 0.748 0.752 3250 3063 8825 5787 23833 13583 Giza 177 4953 5021 0.797 0.808 3712 3260 10101 6591 28234 15406 Sakha 107 4736 4744 0.861 0.867 4306 3789 11296 7243 32080 16223 Sakha 106 5205 5197 0.716 0.734 3504 3058 9993 6277 27564 14274 Sakha 104 5736 5698 0.589 0.601 3245 3266 10004 7792 24423 14259 Sakha 101 6823 - 0.614 - 3030 - 7481 - 19836 -
Soil Amendment Control (C) 5505 5334 0.703 0.728 3569 3068 10187 8139 26713 18929 Gypsum (GY) 5623 5429 0.758 0.790 3334 3341 8714 5068 23952 9523
Interaction
EHR1 C 5780 5845 0.756 0.757 3231 2514 9034 6824 22791 14620
GY 5917 6015 0.824 0.827 3001 3067 7873 5036 19916 8600
Giza 178 C 5610 5681 0.711 0.719 3326 2706 9385 6993 25800 17201
GY 5688 5718 0.785 0.786 3173 3422 8264 4582 21867 9965
Giza 177 C 4910 5015 0.764 0.764 3726 3181 10803 8541 29898 21180
GY 4995 5028 0.830 0.853 3699 3340 9399 4641 26571 9632
Sakha 107 C 4710 4689 0.824 0.821 4731 4037 12302 9735 33500 22144
GY 4762 4800 0.897 0.913 3881 3540 10290 4752 30661 10302
Sakha 106 C 5030 5078 0.686 0.717 3586 3062 10628 8228 28494 20185
GY 5380 5316 0.746 0.750 3422 3053 9358 4326 26633 8364
Sakha 104 C 5708 5697 0.580 0.590 3307 2907 10769 8514 25751 18242
GY 5763 5699 0.597 0.612 3183 3625 9238 7070 23096 10275
Sakha 101 C 6789 - 0.604 - 3078 - 8386 - 20754 -
GY 6857 - 0.625 - 2982 - 6576 - 18918 -
LSD (0.05) V 14.4 11.9 0.006 0.004 20.83 63.00 40.58 43.82 153.2 117.4
LSD (0.05) A 6.76 6.12 0.003 0.003 4.32 39.88 12.64 40.13 27.05 133.7 LSD (0.05) V*A 0.45 0.003 0.014 0.011 11.43 97.70 33.45 98.30 71.56 327.4

Inter. J of Envi., 11(1): 23-40, 2022 EISSN: 2706-7939 ISSN: 2077-4508 DOI: 10.36632/ije/2022.11.1.3
33
Fig. 1: Mean effect of the gypsum application, treated (G●) and untreated (Go), on the average EC values (A) and salt content (B) of different soil depths after rice harvesting of the studied summer seasons 2018 and 2019 as compared to the initial soil values.
In general, the average soil layers salinity (ECe) values and their related salt layers content of the experimental area; were reduced, because of rice cultivation, in the first season (2018) as compared with the initial soil layers values (Table 1). In addition, gradual decreasing pattern by extending rice plantation for the second summer season, particularly with gypsum application Fig.1 (A and B). The reduction percentage in the ECe values of the control treated soil (no gypsum application) was about 43.42, 23.55, and 22.72, compared to the initial soil values. These values are corresponding to 54.74, 23.57, and 22.72 % reduction in the salt content of different soil layers (0:20, 20:40, and 40:60 cm, respectively). The average reduction of soil layer salt content for the control treatment was 27.5% compared to an average of 35.8 % for gypsum application. Furthermore, the average accumulated reduction in soil layers salt content (0- 0.6 m depth) among the rice cultivars during the experimental period were about 46 and 68% for control and gypsum treatments, respectively, compared to the initial soil.
These results highlighted role of rice cultivation for the salt affected soils in particular combined with gypsum application to facilitate salt leaching efficiency. These findings closely agreed with those of Ismail et al. (2013) and in agreement with Hafez et al. (2015) and Aboelsoud et al. (2020) who supported the importance of gypsum application for north Delta clay salt affected soil of Egypt. Moreover, the above results also compatible with the two years field study in arid climate conditions by Chaganti et al. (2021) indicated that gypsum and sulfur application is significantly powerful for reducing soil sodicity irrigated with brackish water.
As to the effect of rice variety, the highest value of irrigation water applied was 6823 m3 fed.-1 in the first season when cultivating Sakha 101, vice versa Sakha 107, which has lower values of 4736 and 4744 m3 fed-1 under first and second growing seasons. Data also showed a considerable reduction in the applied water used for different rice cultivars compared with Sakha 101. The rice cultivars Sakha 107, Giza 177, Sakha 106, Giza 178, Sakha 104, and EHR1 saved water by about 30.6, 27.4, 23.7, 17.2, 15.9, and 14.3 % compared with Sakha 101 Table 8 and Fig 2. B. These variable behavior may account for the differences among rice varieties related to their vegetative and reproductive durations during the crop period (Abd El-Megeed et al., 2016). Despite this, the values of soil layers' salt content of Sakha 101 up to depths of 0.6 m were inferior compared to other rice cultivars Table 8 and Fig. 2 (A and B). These results may suggest that under control management of salt-affected soil conditions, the highest water applied variety is the lowest soil layers content. Concerning the effect of soil
0
5
10
15
20
25
Soil Go G● Go G●
Initial 2018 2019
EC
dS
m-1
0 - 0.2 m 0.2 - 0.4 m 0.4 - 0.6 m(A)
0
5
10
15
20
25
30
35
soil Go G● Go G●
Initial End of 2018 End of 2019
Sa
lt c
on
ten
t to
nfe
d -1
0 - 0.2 m 0.2 -0.4 m 0.4 - 0.6 m(B)

Inter. J of Envi., 11(1): 23-40, 2022 EISSN: 2706-7939 ISSN: 2077-4508 DOI: 10.36632/ije/2022.11.1.3
34
Fig. 2: Soil salt content ton fed-1 of 0.6 m soil depth (A and C) and the applied water (B and D) m3fed-1 of rice cultivars during the studied summer seasons 2018 and 2019, respectively.
amendment application on the irrigation water applied, gypsum application increased the irrigation water added in the 1st and 2nd seasons by about 2.1 and 1.8% compared with control (untreated with gypsum). These results, as expected, revealed the role of released Ca2+ ions in reducing clay dispersion degree through Na+ replacing and enhancing aggregate formation resulting in improved soil hydraulic properties that facilitated salt leaching (Skene and Oades, 1995; Xiao et al., 2022). 3.6. Water productivity and leaching efficiency:
The amount of water applied to produce 1 kg of rice yield under the condition of this experiment is shown in Table (8). The lower the amount of water used to produce 1 kg, the higher the WP.
Considering the rice cultivars, regardless of gypsum treatment, results declared that WP values of the rice cultivars coincidentally behaved the corresponding order in the first and second seasons, the latter being superior. The results also indicated that Sakha 107 cultivar, followed by Giza 177, among the studied varieties ranked the first order for WP with values of 0.861 and 0.867 for the first and second seasons, respectively, meanwhile the lowest values of 0.589 and 0.601 were account for Sakha 104. These results could be a resultant of relative variations among rice cultivars in their crop duration (Abd El-Megeed et al. 2016; Abdallah et al., 2022). In addition, Mehana et al., (2021) reported that Giza 177 recorded the highest crop among Giza 178 and Sakha 104 as far as WP is concerned.
Concerning the effect of amending treatment, regardless rice cultivars varieties, data indicated that WP positively responded to gypsum application by an average relative increase of 7.82 and 8.5 % for the first and second summer seasons, respectively. These findings might be accountable for the
0
10
20
30
40
50
Salt c
on
tent to
n fed -
1
Rice cultivars soil salt content up to 0.6 m depth of summer harvesting
season 2018.
Sakha 101 EHR1 Giza 178Sakha 104 Sakha 106 Giza 177
Sakha 107
(A)
0
2
4
6
8
Applie
d w
ate
r 10
3m
3
The applied water (103 m3 fed-1) for rice cultivars during crop period of
summer season 2018.
Sakha 101 EHR1 Giza 178Sakha 104 Sakha 106 Giza 177
Sakha 107
(B)
0
5
10
15
20
25
30
Salt c
on
tent to
n fed -1
Rice cultivars soil salt content up to 0.6 m depth of summer harvesting
season 2019.
EHR1 Giza 178 Sakha 106
Sakha 104 Giza 177 Sakha 107
(C)
0
2
4
6
8
Applie
d w
ate
r 10
3m
3
The applied water (103 m3 fed-1) for rice cultivars during crop period of
summer season 2019.
EHR1 Giza 178 Sakha 106
Sakha 104 Giza 177 Sakha 107
(D)

Inter. J of Envi., 11(1): 23-40, 2022 EISSN: 2706-7939 ISSN: 2077-4508 DOI: 10.36632/ije/2022.11.1.3
35
relative salt content reduction under gypsum treatment and the principal role of released Ca2+ in improving plant capability to mitigate biotic stress along with enhancing its nutrient content, which led to increased crop productivity (Abdul Qadir et al., 2022; Liu et al., 2022). Furthermore, the interaction effect of Sakha 107, in contrast to Sakha 104, surpasses the other rice varieties for WP during the two-studied season, 2018 and 2019, with values of 0.897 and 0.913, respectively. Moreover, and despite the higher water applied under the experimental conditions, the WP values for the studied rice cultivars under gypsum treatment were relatively comparable with those reported by Mehana et al. (2021) and Abdallah et al. (2022) for Giza 177, Giza 178, Sakha 106 and 107, respectively, with the exception being obtained with Sakha 104. These findings may explore the role of gypsum application as far as WP is considered.
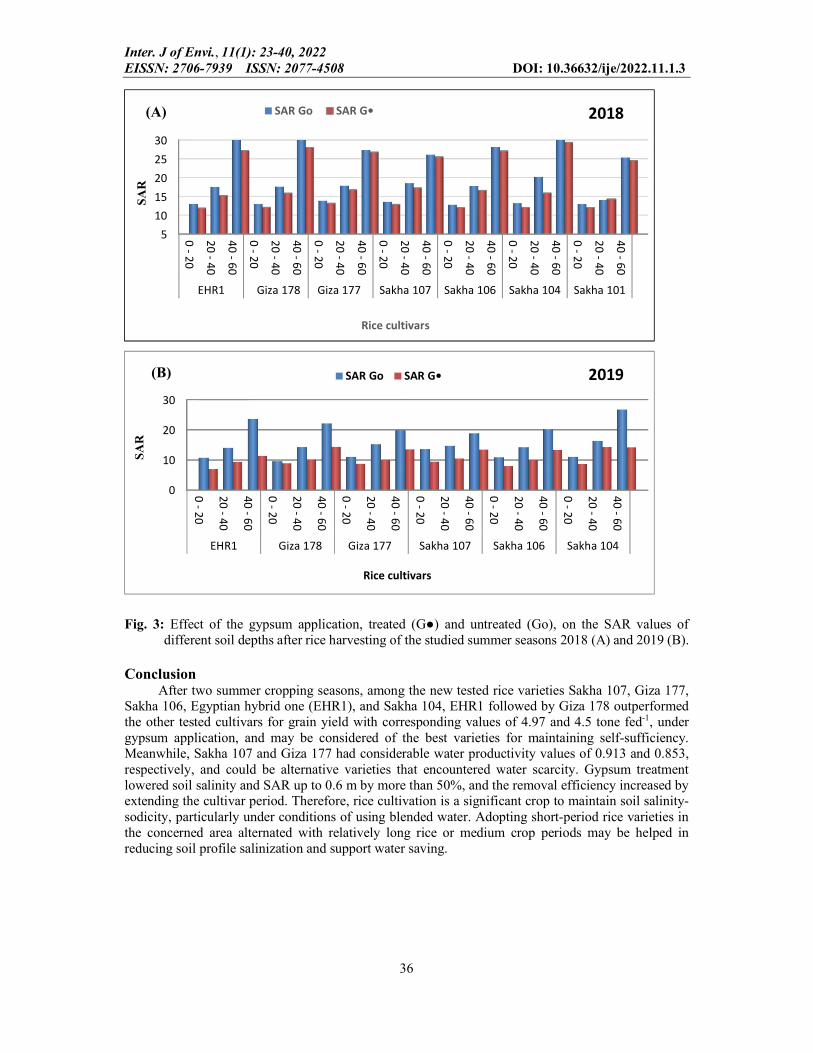
About the relation between the applied water and related soil salt content of 60 cm depth data (Table 8) declared that, with the first cropping season of 2018, gypsum application would improve salt removal by an average of 13% compared to control treatment that received no gypsum. Meanwhile, the second season of gypsum application contributes to salt leaching capacity by an average of 40% compared to the control treatment. These results may be because of the applied second gypsum doses at the beginning of the second season. Concerning the SAR parameter as the indicator for soil sodium status, Fig. 3 (A and B) revealed, in
general, a noticeable reduction in the surface soil layer 0 - 0.2 m with an almost gradual increase with subsequent soil layers for the tested rice varieties even those plots of the control treatment (not amended). These behaviors were observed also by the second summer season of 2019 with considerable inferiority as far as gypsum application is concerned. It may be worth to mention that the average reduction in SAR values for 0.6 m depth of plots that received gypsum treatment surpass those of the control treatment by about 8% during the first season. Meanwhile, with the second season the reduction was superior with an average of 30%. These results could be a result of accumulation of Na+ ions by the layer (40-60) and in relatively some layers of the tested rice varieties (Fig 3). Besides, using deep plowing (sub-soiler) during experimental set up facilitate water movement and gypsum losses from surface layer which seemed to be contribute for reduce SAR of second layer. These results in good agreement with those of Ryu et al., (2021) who found that sub-soiling treatment lead to enhance soil infiltration rate by about 150 and 49% for the shear point and 0.25m distance from the cutting point. Meanwhile, it rose up to 4% between the medial cut points. The results also declared that SAR values were reduced within the soil profile of 0.6 m. These results may be explained according to Luo et al. (2015) and Chaganti et al. (2021) on the base of Ca2+ supplemented by CaCO3 dissolution that would enhance SAR of the soil profile and seemed to be also affected by water quality. In addition, biological reactions of rice root plants under flooding conditions led to an increasing redox system that resulted in the enhancement of CaCO3 solubilization (Singh and Singh, 2022).
Inter. J of Envi., 11(1): 23-40, 2022 EISSN: 2706-7939 ISSN: 2077-4508 DOI: 10.36632/ije/2022.11.1.3
36
Fig. 3: Effect of the gypsum application, treated (G●) and untreated (Go), on the SAR values of different soil depths after rice harvesting of the studied summer seasons 2018 (A) and 2019 (B).
Conclusion
After two summer cropping seasons, among the new tested rice varieties Sakha 107, Giza 177, Sakha 106, Egyptian hybrid one (EHR1), and Sakha 104, EHR1 followed by Giza 178 outperformed the other tested cultivars for grain yield with corresponding values of 4.97 and 4.5 tone fed-1, under gypsum application, and may be considered of the best varieties for maintaining self-sufficiency. Meanwhile, Sakha 107 and Giza 177 had considerable water productivity values of 0.913 and 0.853, respectively, and could be alternative varieties that encountered water scarcity. Gypsum treatment lowered soil salinity and SAR up to 0.6 m by more than 50%, and the removal efficiency increased by extending the cultivar period. Therefore, rice cultivation is a significant crop to maintain soil salinity-sodicity, particularly under conditions of using blended water. Adopting short-period rice varieties in the concerned area alternated with relatively long rice or medium crop periods may be helped in reducing soil profile salinization and support water saving.
5
10
15
20
25
30
0 - 2
0
20
- 40
40
- 60
0 - 2
0
20
- 40
40
- 60
0 - 2
0
20
- 40
40
- 60
0 - 2
0
20
- 40
40
- 60
0 - 2
0
20
- 40
40
- 60
0 - 2
0
20
- 40
40
- 60
0 - 2
0
20
- 40
40
- 60
EHR1 Giza 178 Giza 177 Sakha 107 Sakha 106 Sakha 104 Sakha 101
SA
R
Rice cultivars
2018SAR Go SAR G•(A)
0
10
20
30
0 - 2
0
20
- 40
40
- 60
0 - 2
0
20
- 40
40
- 60
0 - 2
0
20
- 40
40
- 60
0 - 2
0
20
- 40
40
- 60
0 - 2
0
20
- 40
40
- 60
0 - 2
0
20
- 40
40
- 60
EHR1 Giza 178 Giza 177 Sakha 107 Sakha 106 Sakha 104
SA
R
Rice cultivars
2019SAR Go SAR G•(B)

Inter. J of Envi., 11(1): 23-40, 2022 EISSN: 2706-7939 ISSN: 2077-4508 DOI: 10.36632/ije/2022.11.1.3
37
References Aamer, S.M., and D.M. Tabl, 2019. Performance of some Egyptian rice cultivars under different
potassium fertilization rates. Egyptian Acad. J. Biolog. Sci., 10(1): 25-33. Abdallah, A.A., M.I. Aboyousef, S.A. Hammoud, S.E. Sedeek, R.A. El-Namaky, M.M. El-Malky, et
al., 2022. Sakha 107 Egyptian Rice Variety with High Yielding and Good Grain Quality under Water Shortage. J. of Plant Production, Mansoura Univ., 13(3): 85-98.
Abdelaziz, M.N., T.D. Xuan, A.M. Mekawy, H. Wang, and T.D. Khanh, 2018. Relationship of salinity tolerance to Na+ exclusion, proline accumulation, and antioxidant enzyme activity in rice seedlings. Agriculture, 8, 166. https://doi.org/10.3390/agriculture8110166
Abd El-Megeed, A., W.H. El-Kallawy, and M.M.A. Osman, 2016. Performance of some Egyptian rice varieties for some agronomical and physiological traits. J. Agric. Res. Kafr El-Sheikh Univ. 1: 127-135.
Abdel Rahman, M.A., A. A. Afifi, P. D’Antonio, S.S. Gabr, and A. Scopa, 2022. Detecting and mapping salt-affected soil with arid integrated indices in feature space using multi-temporal Landsat imagery. Remote Sensing, 14(11), 2599.
Abdul Qadir, A., G. Murtaza, M. Zia-ur-Rehman, and E.A. Waraich, 2022. Application of Gypsum or Sulfuric Acid Improves Physiological Traits and Nutritional Status of Rice in Calcareous Saline-Sodic Soils. Journal of Soil Science and Plant Nutrition, 1-13 doi.org/10.1007/s42729-022-00776-1
Aboelsoud, H., B. Engel, and K. Gad, 2020. Effect of planting methods and gypsum application on yield and water productivity of wheat under salinity conditions in North Nile Delta. Agronomy, 6: 853.
Ali, J., and S.H. Wani, 2021. Rice Improvement: Physiological, Molecular Breeding and Genetic Perspectives. Springer, Cham.Pp:498
Allen, S. E., H. M. Grimshaw, J.A. Parkinson, C. Quarmby, and J. D. Roberis, 1974. Chemical Analysis of Ecological Materials. Black Well Sci. Puplication Oseney. Oxford, London, pp: 565.
Anis, G., A. El Sabagh, A. Ghareb, and I. El-Rewainy, 2016. Evaluation of promising lines in rice (Oryza sativa L.) to agronomic and genetic performance under Egyptian condition. Inter. J. of Agron. and Agric. Resea., 8(3): 52-57.
Ashraf, M., 2004. Some important physiological selection criteria for salt tolerance in plants. Flora 199: 361–376.
Bates, L.S., R.P. Waldren, and L.D. Teare, 1973. Rapid determination of free proline for water-stress studies. Plant and soil. 39: 205-207.
Chaganti, V.N., G. Ganjegunte, G. Niu, A. Ulery, J.M. Enciso, R. Flynn, N. Meki, and J.R. Kiniry, 2021. Yield response of canola as a biofuel feedstock and soil quality changes under treated urban wastewater irrigation and soil amendment application. Industrial Crops and Products, 170, 113659.
Cao, Y.Y., M.T. Yang, S.Y. Chen, Z.Q. Zhou, X. Li, X.J. Wang, and J.G. Bai, 2015. Exogenous sucrose influenses antioxidant enzyme activities and reduces lipid peroxidation in water-stressed cucumber leaves. Biol. Plant., 59: 147-153.
Cha-um, S., Y. Pokasombat, and C. Kirdmanee, 2011. Remediation of salt-affected soil by gypsum and farmyard manure − Importance for the production of Jasmine rice. Australian J. Crop Sci., 5(4): 458-465.
Chen, Z., T.A. Cuin, M. Zhou, A. Twomey, B.P. Naidu, and S. Shabala, 2007. Compatible solute accumulation and stress-mitigating effects in barley genotypes contrasting in their salt tolerance. J. Exp. Bot., 58(15/16):4245–4255.
Chi, C.M., C.W. Zhao, X.J. Sun, and Z.C. Wang, 2012. Reclamation of saline-sodic soil properties and improvement of rice (Oriza sativa L.) growth and yield using desulfurized gypsum in the west of Songnen Plain, northeast China. Geoderma, 187 & 188: 24-30.
EL-Habet, H., T. Abd El-Megeed, and M. Osman, 2018. Performance of some Rice Genotypes under Both Different Nitrogen Levels and Plant Spaces. Journal of Plant Production, 10: 845-858. doi: 10.21608/jpp.2018.36446
Inter. J of Envi., 11(1): 23-40, 2022 EISSN: 2706-7939 ISSN: 2077-4508 DOI: 10.36632/ije/2022.11.1.3
38
El-Marsafawy, S., N. Bakr, T. Elbana, and H. El-Ramady, 2019. Climate. In: El-Ramady H., Alshaal T., Bakr N., Elbana T., Mohamed E., Belal AA. (eds) The Soils of Egypt. World Soils Book Series. Springer, Cham. pp 69-92. https://link.springer.com/book/10.1007%2F978-3-319-95516-2.
El-Mowelhi, N.M., 1993. The extent of irrigation lands particularly salt affected soils in Egypt. Zaragoza: CIHEAM, 155-168.
Gerona, M.B., M.P. Deocampo, J.A. Egdane, A.M. Ismail, and M.L. Dionisio-Sese, 2019. Physiological Responses of contrasting rice genotypes to salt stress at reproductive stage. Rice Sci., 26(4): 207-219.
Hafez, E.M., W.H. Abou El Hassan, I.A. Gaafar, and M.F. Seleiman, 2015. Effect of gypsum application and irrigation intervals on clay saline-sodic soil characterization, rice water use efficiency, growth, and yield. J. of Agric. Science, 7(12): 208-219.
Holland, J.A., A. Bennett, B. Newton, P. McKenzie, T. White, R. George, J.S. Pakeman, D.A. Bailey, R. Fornara, and R.C. Hayes, 2018. Liming impacts on soils, crops and biodiversity in the UK; a review. Sci. Total Environ., 610: 316-332. DOI: 10.1016/j.scitotenv.2017.08.020
Hu, Y., Z. Burucs, and U. Schmidhalter, 2006. Short-term effect of drought and salinity on growth and mineral elements in wheat seedlings. Journal of plant nutrition, 29(12), 2227-2243. DOI: 10.1080/01904160600975111
Hunt, R., 1990. Basic growth analysis. Published by the Academic Division of Unwin Hyman Ltd., London. pp.55-72.
Islam, M.S., S. Khanam, M.S. Haque, M.T.R. Mondal, and M.A. Topu, 2019. Improvement of yield of salt tolerant rice genotypes/varieties through gypsum application. Asian Journal of Crop, Soil Science and Plant Nutrition, 01(02), 22-27. https://doi.org/10.18801/ajcsp.010219.04
Israelsen, O.W., and Hansen, V.E., 1962. Irrigation Principles and Practices. 3rd Edition, Wiley International Edition, New York.
Ivushkin, K., H. Bartholomeus, A.K. Bregt, A. Pulatov, B. Kempen, and L. De Sousa, 2019. Global mapping of soil salinity change. Remote sensing of environment, 231, 111260.
Jahan, B., F. Rasheed, Z. Sehar, M. Fatma, N. Iqbal, A. Masood; N.A. Anjum, and N.A. Khan, 2021. Coordinated role of nitric oxide, ethylene, nitrogen, and sulfur in plant salt stress tolerance. Stresses, 1: 14. doi.org/10.3390/stresses1030014
Kanawapee, N., J. Sanitchon, W. Lontom, and P. Theerakulpisut, 2012. Evaluation of salt tolerance at the seedling stage in rice genotypes by growth performance, ion accumulation, proline and chlorophyll content. Plant Soil 358, 235–249.
Kanawapee, N., J. Sanitchon, P. Srihaban, and P. Theerakulpisut, 2013. Physiological changes during development of rice (Oryza sativa L.) varieties differing in salt tolerance under saline field condition. Plant Soil, 370: 89–101.
Kibria, M.G., M. Hossain, Y. Murata, and M.A. Hoque, 2017. Antioxidant defense mechanisms of salinity tolerance in rice genotypes. Rice Science, 24(3): 155–162.
Lauchli, A., 1990. Calcium, salinity and the plasma membrane. In R. T. Leonard & P. K. Hepler (Eds.), Calcium in Plant Growth (pp. 26-35). Am. Soc. Plant Physiol., Rochville.
Liu, C., B. Mao, D. Yuan, C. Chu, and M. Duan, (2022). Salt tolerance in rice: physiological responses and molecular mechanisms. The Crop Journal, 10: 13-15. doi.org/10.1016/j.cj.2021.02.010
Lou, W.P., L.H. Wu, H.Y. Chen, and Z.W. Ji, 2012. Assessment of rice yield loss due to torrential rain: A case study of Yuhang Country, Zhejiang Province, China. Nattural Hazards, 60: 311-320.
Luo, J.Q., L.L. Wang, Q.S. Li, Q.K. Zhang, B.Y. He, Y. Wang, L.P. Qin, and S.S. Li, 2015. Improvement of hard saline–sodic soils using polymeric aluminum ferric sulfate (PAFS). Soil and Tillage Research, 149, 12-20.
Maas, E.V., and J.A. Poss, 1989. Salt sensitivity of wheat at various growth stages. Irrigation Science, 10(1), 29-40.
Mann, A.; A. Kumar; M. Saha; C. Lata; A. Kumar (2019). Stress induced changes in osmoprotectants, Ionic relations, antioxidants activities and protein profiling characterize SporoboolusmarginatusHochst. Ex A. Rich. Salt tolerance mechanism. Indian J. Exp. Biol., 57: 672-679.

Inter. J of Envi., 11(1): 23-40, 2022 EISSN: 2706-7939 ISSN: 2077-4508 DOI: 10.36632/ije/2022.11.1.3
39
Mehana, M., M. Abdelrahman, Y. Emadeldin, J.S. Rohila, and R. Karthikeyan, 2021. Impact of genetic improvements of rice on its water use and uffects of ulimate uariability in Egypt. Agriculture, 11, 865.
Mekawy, A.M., D.V. Assaha, H. Yahagi, Y.Tada, A. Ueda, and H. Saneoka, 2015. Growth, Physiological adaptation, and gene expression analysis of two Egyptian rice cultivars under salt stress. Plant Physiology and Biochemistry. 87: 17-25.
Metzener, H., H. Rav, and H. Senger, 1965. UntersuchungenZurSynchronisier-barkeiteinzelner pigment. Mangol-mutanten von Chlorella. Planta, 65: 186-194.
Mokoi, J., and H. Verplancke, 2010. Effect of gypsum placement on the physical properties of a saline sandy loam soil. Aust. J Crop Sci., 4: 556-563.
Monsur, M.B., N.A. Ivy, M.M. Haque, M. Hasanuzzaman, A. El Sabagh, and Md. M. Rohman, 2020. Oxidative Stress Tolerance Mechanism in Rice under Salinity. Phyton-Intern. J. of Exper. Bota., 89(3): 497-517.
Moonmoon, S., M.S.A. Fakir, M.T. Islam, 2017. Effect of Drought Stress on Grain Dry Weight, Photosynthesis and Chlorophyll in Six Rice Genotypes. Schol. J of Agri. and Vete. Sci., 4(1): 13-17.
Moursi, E.A., and A. A. Abdelkhalek, 2015. Water requirement components of some egyptian rice varieties in North Nile Delta. Alexandria Science exchange journal, 36: 131-140.
Munns, R., 2002. Comparative physiology of salt and water stress. Plant Cell Environ 25:239–250. Munns, R., 2005. Genes and salt tolerance: bringing them together. New Phytol 167:645–663. Munns, R., and M. Tester, 2008. Mechanisms of salinity tolerance. Annu. Rev. lant Biol., 59: 651-681. Munns, R., S. Hussain, A.R. Rivelli, R.A. James, A.G. Condon, M.P. Linsay, E.S. Lagudah et al., 2002.
Avenues for increasing salt tolerance of crops, and the role of physiological based selection traits. Plant and Soil, 247: 93-105.
Murtaza, B., G. Murtaza, M. Sabir, G. Owens, G. Abbas, M. Imran, G.M. Shah, 2017. Amelioration of saline–sodic soil with gypsum can increase yield and nitrogen use efficiency in rice–wheat crop-ping system. Archives of Agronomy and Soil Science, 63(9), 1267– 1280. https://doi.org/10.1080/03650340.2016.1276285
Nahar, K., M. Hasanuzzaman, and M. Fujita, 2016. Roles of osmolytes in plant adaptation to drought and salinity. In Osmolytes and Plants Acclimation to Changing Environment: Emerging Omics Technologies. Springer, 37–68.
Ouda, S., and A.E.H. Zohry, 2015. Crop Rotation: An Approach to Save Irrigation Water under Water Scarcity in Egypt. WatSave Innovative Water Management Award.
Qadir, A.A., G. Murtaza, M. Zia-ur-Rehman, and E.A. Waraich, 2021. Efect of chemical reclamation on the physiological and chemical response of rice grown in varying salinity and sodicity conditions. Intl J Agric Biol 26:97–104. https://doi.org/10.17957/ijab/15.1813
Rahman A., K. Nahar, M. Hasanuzzaman, and M. Fujita, 2016. Calcium supplementation improves Na+/K+ ratio, antioxidant defense and glyoxalase systems in salt-stressed rice seedlings. Front Plant Sci., 7: 609.
Richards, L.A., 1954. "Diagnosis and improvement of saline and alkali soils". United States Department of Agriculture, Washington, D. C. USA, Hand book 60.
Rengel, Z., 1992. The role of calcium in salt toxicity. Plant Cell Environ., 15: 625-632. Rosolem, C.A., K. Ritz, H. Cantarella, M.V. Galdos, M.J. Hawkesford, W.R. Whalley, and S.J.
Mooney, 2017. Enhanced Plant rooting and crop system management for improved N use efficiency. Adv. Agron., 146: 205-239.
Ryu, J.H., S.H. Lee, Y.Y. Oh, and B.H. Kang, 2021. Effect of gypsum application and subsoiling on soil physico-chemical property of saemangeum reclaimed Tide Land. Korean J. Soil Sci. Fert., 1: 48-57.
Saqib, A.I., K. Ahmed, A.R. Naseem, G. Qadir, M.Q. Nawaz, M. Khalid, I.A. Warraich, and M. Arif, 2020. Integrated use of humic acid and gypsum under saline-sodic conditions. Pakistan Journal of Agricultural Research, 33(3): 684-691.
Schultz, E., A. Chatterjee, T. DeSutter, and D. Franzen, 2017. Sodic soil reclamation potential of gypsum and biochar additions: influence on physico-chemical properties and soil respiration. Comm Soil Sci Plant Anal 48: 1792–1803. https://doi.org/10.1080/00103624. 2017.1395449

Inter. J of Envi., 11(1): 23-40, 2022 EISSN: 2706-7939 ISSN: 2077-4508 DOI: 10.36632/ije/2022.11.1.3
40
Sharma, B.R., and P.S. Minhas, 2005. Strategies for managing saline/alkali waters for sustainable agricultural production in South Asia. Agric. Water Manag., 78: 136-151.
Sheoran, P., N. Basak, A. Kumar, R.K. Yadav, R. Singh, R. Sharma, K. Raman, S. Kumar ... & Sharma, P. C. (2021). Ameliorants and salt tolerant varieties improve rice-wheat production in soils undergoing sodification with alkali water irrigation in Indo–Gangetic Plains of India. Agricultural Water Management, 243, 106492. https://doi.org /10.1016/j.agwat.2020.106492
Shi, J., T. Long, L. Zheng, S. Gao, and L. Wang, 2022. Neutralization of industrial alkali-contaminated soil by different agents: Effects and Environmental Impact. Sustainability, 14, 5850.
Shimizu, K., S. M. Bassiouni, B.A. Zayed, and W. Cao, 2022. Effects of saline conditions on germination percentages and photosynthetic rates of Egyptian salt-tolerant rice varieties. Journal of Arid Land Studies, 31(4), 77-83.
Singh, S., and V. Singh, 2022. Nutrient management in salt affected soils for sustainable crop production. Annals of Plant and Soil Research, 2: 182-193.
Singh, Y.P., R. Singh, D.K. Sharma, V.K. Mishra, and S. Arora, 2016. Optimizing gypsum levels for amelioration of sodic soils to enhance grain yield and quality of rice (Oryza sativa L.). J. Indian Soc. Soil Sci., 64(1): 33-40.
Skene, T.M., and J.M. Oades, 1995. The effects of sodium adsorption ratio and electrolyte concentration on water quality: laboratory studies. Soil science, 1: 65-73.
Slama, I., C. Abdelly, A. Bouchereau, T. Flowers, and A. Savoure, 2015. Diversity, distribution and roles of osmoprotective compounds accumulated in halophytes under abiotic stress. Ann Bot., 115:433– 447.
Steel, R.G.D., and J.H. Torrie, 1980. Principles and procedures of statistics, 2nd Ed., McGraw-Hill Co., New York, USA.
Suarez, D.L., 2001. Sodic soil reclamation: Modelling and field study. Aust. J. Soil Res., 39(6), 1225-1246.
Suriya-arunroj, D., N. Supapoj, T. Toojinda, and A. Vanavichit, 2004. Relative leaf water content as an efficient method for evaluating rice cultivars for tolerance to salt stress. Science Asia, 30: 411-415.
Xiao, F., B. Zhou, H. Wang, M. Duan, and L. Feng, 2022. Effects of different soil amendments on physicochemical property of soda saline-alkali soil and crop yield in Northeast China. International Journal of Agricultural and Biological Engineering, 15(1), 192-198.
Yahya, K.E., Z. Jia, W. Luo, H. YuanChun, and M.A. Ame, 2022. Enhancing salt leaching efficiency of saline-sodic coastal soil by rice straw and gypsum amendments in Jiangsu coastal area. Ain Shams Engineering Journal, 15: 101721.
Yang, J., 2006. Recent evolution of soil salinization in China and its driving processes. In The 18th Word Congress of Soil Science. A presentation in part, 156 (153.154).
https://www.ldd.go.th/18wcss/techprogram/P13368.HTM. Zayed, B.A., W.M. ElKhoby, S.M. Shehata, and M.H. Ammar, 2007. Role of potassium application on
the productivity of some inbred and hybrid rice varieties under newly reclaimed saline soils. African Crop Science Society, 8: 53-60.
Zayed, B.A., R.A. EL- Namaky, S.E.M. Seedek, and H.F. El-Mowafi, 2013. Exploration hybrid rice under saline soil conditions in Egypt. J. Plant Production, Mansoura Univ., 4(1): 1-13.
Zayed, B.A., W.H. El-Kellawy, A.M. Okasha, and M.M. Abd El-Hamed, 2017a. Improvement of salinity soil properties and rice productivity under different irrigation intervals and gypsum rates.J. Plant Production, Mansoura Univ., 8(3): 361-368.
Zayed, B.A., R.A. Khedr, A.A. Hadifa, and A.M. Okasha, 2017b. Some anti-oxidants, physio-morphological, and yield of varying rice varieties affected by salinity levels. J. Plant Production, Mansoura Univ., 8(7): 747-754.
Zeng, I., M.C. Shannon, and C.M. Grieve, 2002. Evaluation of salt tolerance in rice genotypes by multiple agronomic parameters. Euphytica, 127: 235-245.
Zeng, L., J.A. Poss, C. Wilson, A.E. Draz, G.B. Gregorio, and C.M. Grieve, 2003. Evaluation of salt .292-ers. Euphytica, 129: 281tolerance in rice genotypes by physiological charact
Related Documents