International Journal of Business, Economics and Law, Vol. 19, Issue 1 (August) ISSN 2289-1552 2019 1 COMPARATIVE STUDY: FINANCIAL PERFORMANCE OF INDONESIA STATE-OWNED ENTERPRISES IN CONSTRUCTION AND PROPERTY INDUSTRY FOR THE PERIOD OF 2009-2018 Fransiscus X John Brazer Wiwiek Mardawiyah Daryanto ABSTRACT During Mr. Joko Widodo leadership (2014-2019), infrastructure and residential are the main focus of the Indonesian government. In contrast with the previous leadership, Mr. Susilo Bambang Yudhoyono (2009-2013) whose focusing on energy subsidies, public health and education. It’s reflected from Indonesia infrastructure and residential budget that rise from 18 4 trillion rupiah in 2009 into 415 trillion rupiah in 2019 that will be injected to the Indonesia State-Owned Enterprises (SOE) in construction and residential industry, including PT Adhi Karya (ADHI), PT Pembangunan Perumahan (PTPP), PT Waskita Karya (WSKT) and PT Wijaya Karya (WIKA). This study aims to measure and analyze the impact of the huge injected capital to the SOE financial performance and health condition using Financial Ratio Analysis (FRA) based on SOE Minister’s Decree No. KEP-100/MBU/2002, for period 2009-2018. The eight financial ratios used are return on equity, return on investment, cash ratio, current ratio, collection period, inventory turnover, total asset turnover and total equity to total assets, then validated using the SOE Minister's Decree. The results of companies financial health condition for period 2009-2018 are ; ADHI (AA, AA, AA, AA, AA, AA, A, BBB, A, A), PTPP (AA, AA, AA, AA, AA, AA, AA, A, A, A), WSKT (AA, AA, AA, AA, AA, AA, A, A, A, A), WIKA (AA, AA, AA, AA, AA, AA, AA, A, A, A) respectively. In conclusion the huge injected capital, on the contrary, give a negative impact to the SOE financial performance reflecting from their decreasing performance in period 2014-2019. Therefore, the companies should improve their efficiency, collection method and maintain their cashflow prudently. Keywords: financial ratio analysis, financial health assessment of state-owned enterprises, state-owned companies in construction and property I. INTRODUCTION During Mr. Joko Widodo leadership, Indonesia had taken many aggressive action in developing Indonesia into a leading country in ASEAN region. It is reflected from an increasing number of Indonesia government spending as shown on figure 1.1 below. Figure 1.1 Indonesian Infrastructure and Residential Spending 2009-2019 (in trillion rupiah) Source: Indonesian Ministry of Finance APBN Data 2019 As shown in the figure above, Indonesian infrastructure and residential budget is increasing from 184 trilion rupiah in 2009 into 415 trillion rupiah in 2019. Before Mr. Joko Widodo presidential era, during Mr. Susilo Bambang Yudhoyono leadership (2009- 2014), the Indonesian government spending focus mainly in energy subsidies, education, and health. The huge increasing budget is injected to the Indonesian SOE in property and construction industry that hopefully, will increasing the companies performance. The previous research about the impact of the capital injection by the government to the national SOE financial performance has been conducted in the banking sector. Lin et al. (2019) stated that injecting capital and government support have increased the SOE performance in banking industry evidence in Taiwan and Yoo (2017) also stated the same thing with the sample of the Bank of Korea. The finding shows that the injected capital by the government will stimulate the SOEs operation and improve their financial condition. This study is conducted to investigate, validate and comparing the impact (whether it’s a positive impact or even a negative impact) of the increasing investment in the infrastructure and low-income citizen housing development by the Indonesian government to the Indonesian SOE’s property and construction SOE’s financial performance and health condition. Mr. Susilo B.Y. Leadership Mr. Joko W. Leadership

Welcome message from author
This document is posted to help you gain knowledge. Please leave a comment to let me know what you think about it! Share it to your friends and learn new things together.
Transcript
International Journal of Business, Economics and Law, Vol. 19, Issue 1 (August)
ISSN 2289-1552 2019
1
COMPARATIVE STUDY: FINANCIAL PERFORMANCE OF INDONESIA STATE-OWNED
ENTERPRISES IN CONSTRUCTION AND PROPERTY INDUSTRY FOR THE PERIOD OF
2009-2018
Fransiscus X John Brazer
Wiwiek Mardawiyah Daryanto
ABSTRACT
During Mr. Joko Widodo leadership (2014-2019), infrastructure and residential are the main focus of the Indonesian
government. In contrast with the previous leadership, Mr. Susilo Bambang Yudhoyono (2009-2013) whose focusing on energy
subsidies, public health and education. It’s reflected from Indonesia infrastructure and residential budget that rise from 184
trillion rupiah in 2009 into 415 trillion rupiah in 2019 that will be injected to the Indonesia State-Owned Enterprises (SOE) in
construction and residential industry, including PT Adhi Karya (ADHI), PT Pembangunan Perumahan (PTPP), PT Waskita
Karya (WSKT) and PT Wijaya Karya (WIKA). This study aims to measure and analyze the impact of the huge injected capital to
the SOE financial performance and health condition using Financial Ratio Analysis (FRA) based on SOE Minister’s Decree No.
KEP-100/MBU/2002, for period 2009-2018. The eight financial ratios used are return on equity, return on investment, cash
ratio, current ratio, collection period, inventory turnover, total asset turnover and total equity to total assets, then validated
using the SOE Minister's Decree. The results of companies financial health condition for period 2009-2018 are ; ADHI (AA, AA,
AA, AA, AA, AA, A, BBB, A, A), PTPP (AA, AA, AA, AA, AA, AA, AA, A, A, A), WSKT (AA, AA, AA, AA, AA, AA, A, A, A, A),
WIKA (AA, AA, AA, AA, AA, AA, AA, A, A, A) respectively. In conclusion the huge injected capital, on the contrary, give a
negative impact to the SOE financial performance reflecting from their decreasing performance in period 2014-2019. Therefore,
the companies should improve their efficiency, collection method and maintain their cashflow prudently.
Keywords: financial ratio analysis, financial health assessment of state-owned enterprises, state-owned companies in
construction and property
I. INTRODUCTION
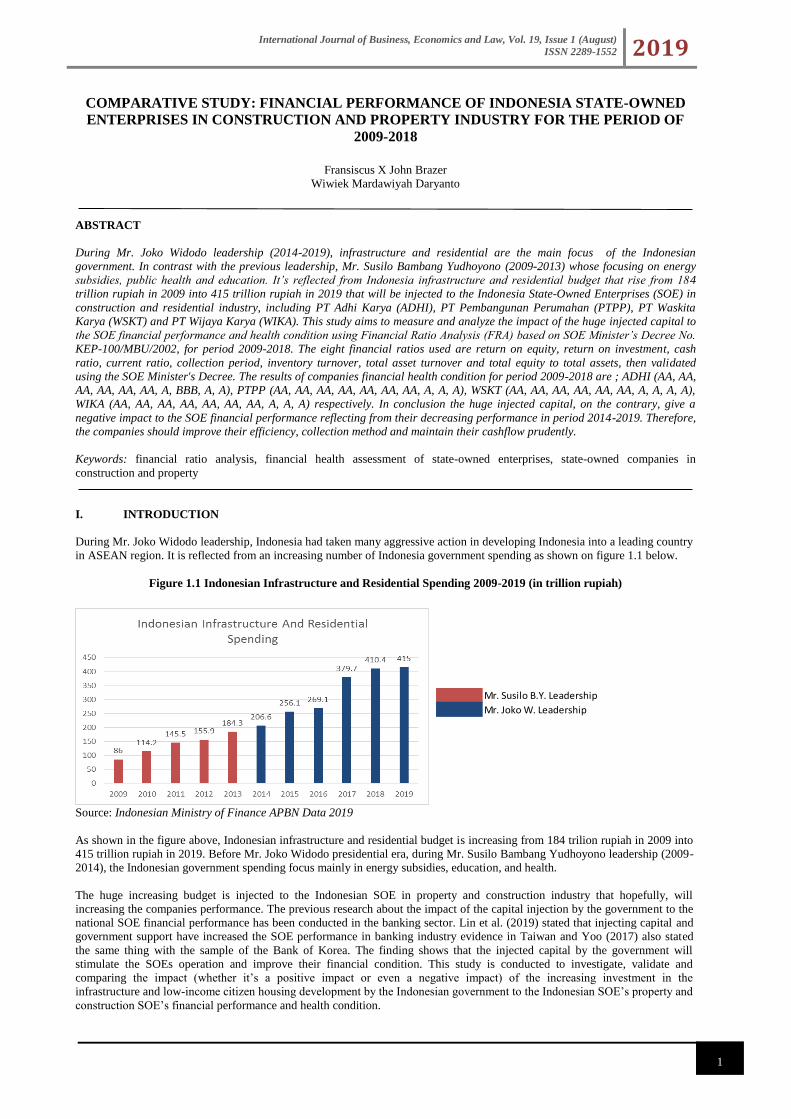
During Mr. Joko Widodo leadership, Indonesia had taken many aggressive action in developing Indonesia into a leading country
in ASEAN region. It is reflected from an increasing number of Indonesia government spending as shown on figure 1.1 below.
Figure 1.1 Indonesian Infrastructure and Residential Spending 2009-2019 (in trillion rupiah)
Source: Indonesian Ministry of Finance APBN Data 2019
As shown in the figure above, Indonesian infrastructure and residential budget is increasing from 184 trilion rupiah in 2009 into
415 trillion rupiah in 2019. Before Mr. Joko Widodo presidential era, during Mr. Susilo Bambang Yudhoyono leadership (2009-
2014), the Indonesian government spending focus mainly in energy subsidies, education, and health.
The huge increasing budget is injected to the Indonesian SOE in property and construction industry that hopefully, will
increasing the companies performance. The previous research about the impact of the capital injection by the government to the
national SOE financial performance has been conducted in the banking sector. Lin et al. (2019) stated that injecting capital and
government support have increased the SOE performance in banking industry evidence in Taiwan and Yoo (2017) also stated
the same thing with the sample of the Bank of Korea. The finding shows that the injected capital by the government will
stimulate the SOEs operation and improve their financial condition. This study is conducted to investigate, validate and
comparing the impact (whether it’s a positive impact or even a negative impact) of the increasing investment in the
infrastructure and low-income citizen housing development by the Indonesian government to the Indonesian SOE’s property and
construction SOE’s financial performance and health condition.
Mr. Susilo B.Y. Leadership
Mr. Joko W. Leadership
International Journal of Business, Economics and Law, Vol. 19, Issue 1 (August)
ISSN 2289-1552 2019
2
Financial Ratio Analysis (FRA) used to measure and analyze the company financial performance. Previous research about
financial performance has been discussed in many sectors such as hospital, bank, and small business. Edmister (1972) stated that
financial ratio is really useful to measure the performance of small business and it can be used to predict the failure. The finding
shows that debt and profitability ratios are important indicators to analyze their financial performances. Washington (2001)
stated that research on the ability of financial models to provide an early warning of corporate failure is favorable. The users of
business information are often stakeholders who rely heavily on financial reports. In 2002, Indonesian government, under the
Ministry of SOE, had decides the mandatory guidance that should be used by the Indonesian SOEs to measure their financial
performance and health condition using selected financial ratio analysis. The guidance was the decree of Ministry of SOEs no.
KEP-100/MBU/2002 that used in this study.
This study focus on the four biggest Indonesia SOEs in property and construction industry, namely PT Adhi Karya (Persero)
Tbk.,PT Pembangunan Perumahaan (Persero) Tbk., PT Waskita Karya (Persero) Tbk and PT Wijaya Karya (Persero) Tbk. that
have already published their annual report in period 2009-2018.
Indonesia State-Owned Enterprises (SOE) in Construction and Property Industry.
Indonesia’s biggest State-Owned Enterprise (SOE) construction and property consist of PT Adhi Karya (ADHI), PT
Pembangunan Perumahan (PTPP), PT Waskita Karya (WSKT) and PT Wijaya Karya (WIKA) that delegated majority of the
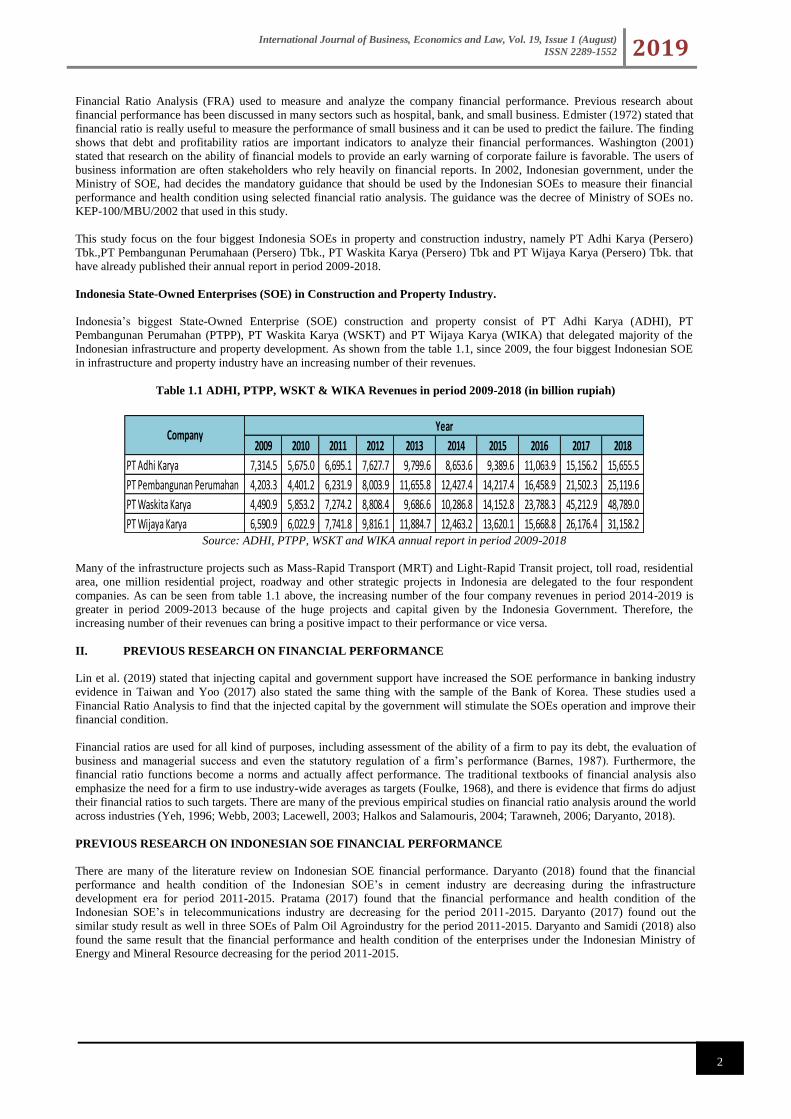
Indonesian infrastructure and property development. As shown from the table 1.1, since 2009, the four biggest Indonesian SOE
in infrastructure and property industry have an increasing number of their revenues.
Table 1.1 ADHI, PTPP, WSKT & WIKA Revenues in period 2009-2018 (in billion rupiah)
Source: ADHI, PTPP, WSKT and WIKA annual report in period 2009-2018
Many of the infrastructure projects such as Mass-Rapid Transport (MRT) and Light-Rapid Transit project, toll road, residential
area, one million residential project, roadway and other strategic projects in Indonesia are delegated to the four respondent
companies. As can be seen from table 1.1 above, the increasing number of the four company revenues in period 2014-2019 is
greater in period 2009-2013 because of the huge projects and capital given by the Indonesia Government. Therefore, the
increasing number of their revenues can bring a positive impact to their performance or vice versa.
II. PREVIOUS RESEARCH ON FINANCIAL PERFORMANCE
Lin et al. (2019) stated that injecting capital and government support have increased the SOE performance in banking industry
evidence in Taiwan and Yoo (2017) also stated the same thing with the sample of the Bank of Korea. These studies used a
Financial Ratio Analysis to find that the injected capital by the government will stimulate the SOEs operation and improve their
financial condition.
Financial ratios are used for all kind of purposes, including assessment of the ability of a firm to pay its debt, the evaluation of
business and managerial success and even the statutory regulation of a firm’s performance (Barnes, 1987). Furthermore, the
financial ratio functions become a norms and actually affect performance. The traditional textbooks of financial analysis also
emphasize the need for a firm to use industry-wide averages as targets (Foulke, 1968), and there is evidence that firms do adjust
their financial ratios to such targets. There are many of the previous empirical studies on financial ratio analysis around the world
across industries (Yeh, 1996; Webb, 2003; Lacewell, 2003; Halkos and Salamouris, 2004; Tarawneh, 2006; Daryanto, 2018).
PREVIOUS RESEARCH ON INDONESIAN SOE FINANCIAL PERFORMANCE
There are many of the literature review on Indonesian SOE financial performance. Daryanto (2018) found that the financial
performance and health condition of the Indonesian SOE’s in cement industry are decreasing during the infrastructure
development era for period 2011-2015. Pratama (2017) found that the financial performance and health condition of the
Indonesian SOE’s in telecommunications industry are decreasing for the period 2011-2015. Daryanto (2017) found out the
similar study result as well in three SOEs of Palm Oil Agroindustry for the period 2011-2015. Daryanto and Samidi (2018) also
found the same result that the financial performance and health condition of the enterprises under the Indonesian Ministry of
Energy and Mineral Resource decreasing for the period 2011-2015.
2009 2010 2011 2012 2013 2014 2015 2016 2017 2018
PT Adhi Karya 7,314.5 5,675.0 6,695.1 7,627.7 9,799.6 8,653.6 9,389.6 11,063.9 15,156.2 15,655.5
PT Pembangunan Perumahan 4,203.3 4,401.2 6,231.9 8,003.9 11,655.8 12,427.4 14,217.4 16,458.9 21,502.3 25,119.6
PT Waskita Karya 4,490.9 5,853.2 7,274.2 8,808.4 9,686.6 10,286.8 14,152.8 23,788.3 45,212.9 48,789.0
PT Wijaya Karya 6,590.9 6,022.9 7,741.8 9,816.1 11,884.7 12,463.2 13,620.1 15,668.8 26,176.4 31,158.2
YearCompany
International Journal of Business, Economics and Law, Vol. 19, Issue 1 (August)
ISSN 2289-1552 2019
3
III. METHODOLOGY
This study uses financial ratio to measure the company financial performance. Financial ratio became a basic tool, indicator and
norm to measure the company performance (Barnes,1987). In 2002, Indonesian Government under the Ministry of SOE issued
the mandatory guidance to measure the financial performance and health condition of the Indonesian SOEs named the decree of
the Ministry of State Owned Enterprises No.KEP-100/MBU/2002. This guidance includes the financial ratio as one of the
indicators to measure the Indonesian SOEs financial performance and health condition and still used in the present.
PT Adhi Karya (ADHI), PT Pembangunan Perumahan (PTPP), PT Waskita Karya (WSKT) and PT Wijaya Karya (WIKA) as the
respondent companies, are the Indonesian SOE in construction and property industry. Therefore, the decree of the Ministry of
State Owned Enterprises No.KEP-100/MBU/2002 should be used as a mandatory guidance to measure those companies financial
performance and health condition.
The Decree Of Ministry Of State Owned Enterprises (SOEs)
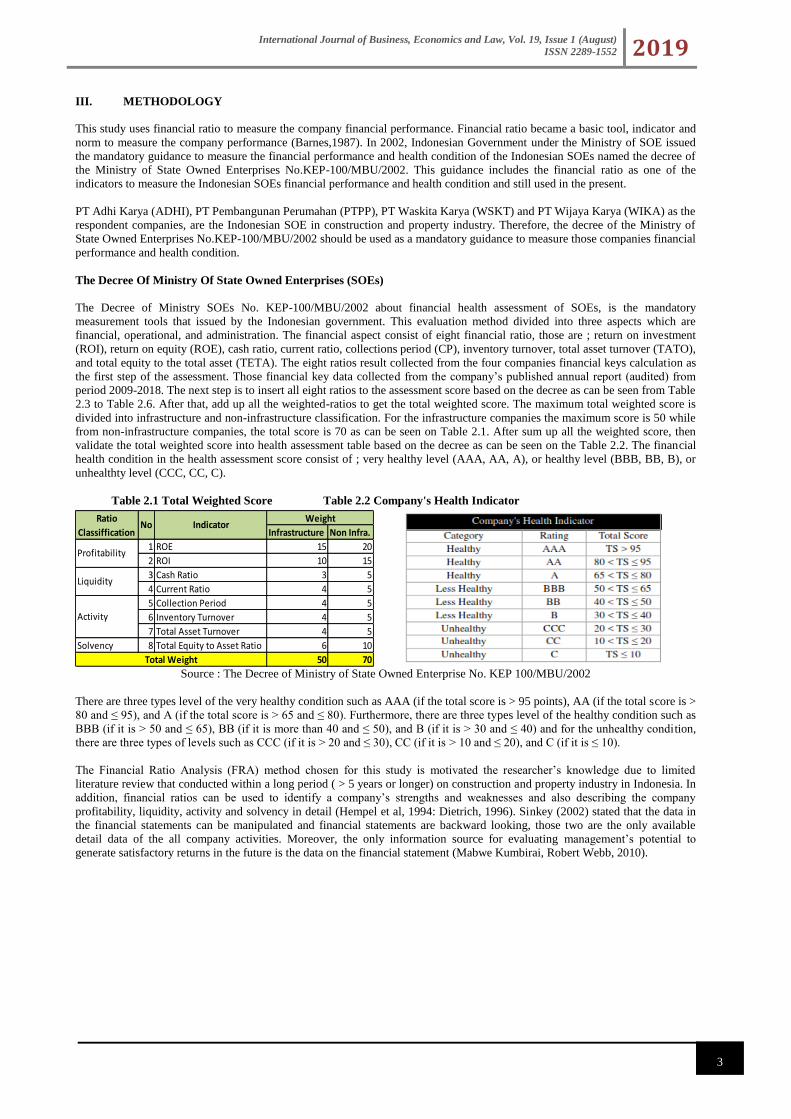
The Decree of Ministry SOEs No. KEP-100/MBU/2002 about financial health assessment of SOEs, is the mandatory
measurement tools that issued by the Indonesian government. This evaluation method divided into three aspects which are
financial, operational, and administration. The financial aspect consist of eight financial ratio, those are ; return on investment
(ROI), return on equity (ROE), cash ratio, current ratio, collections period (CP), inventory turnover, total asset turnover (TATO),
and total equity to the total asset (TETA). The eight ratios result collected from the four companies financial keys calculation as
the first step of the assessment. Those financial key data collected from the company’s published annual report (audited) from
period 2009-2018. The next step is to insert all eight ratios to the assessment score based on the decree as can be seen from Table
2.3 to Table 2.6. After that, add up all the weighted-ratios to get the total weighted score. The maximum total weighted score is
divided into infrastructure and non-infrastructure classification. For the infrastructure companies the maximum score is 50 while
from non-infrastructure companies, the total score is 70 as can be seen on Table 2.1. After sum up all the weighted score, then
validate the total weighted score into health assessment table based on the decree as can be seen on the Table 2.2. The financial
health condition in the health assessment score consist of ; very healthy level (AAA, AA, A), or healthy level (BBB, BB, B), or
unhealthty level (CCC, CC, C).
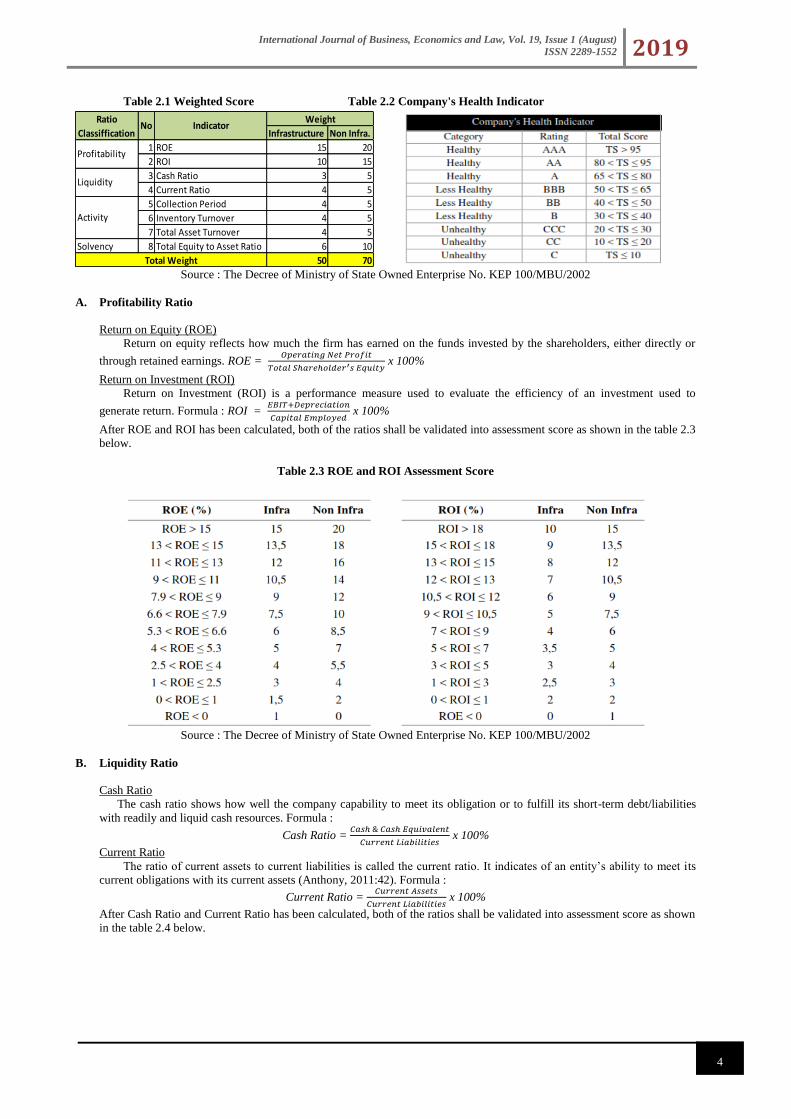
Table 2.1 Total Weighted Score Table 2.2 Company's Health Indicator
Source : The Decree of Ministry of State Owned Enterprise No. KEP 100/MBU/2002
There are three types level of the very healthy condition such as AAA (if the total score is > 95 points), AA (if the total score is >
80 and ≤ 95), and A (if the total score is > 65 and ≤ 80). Furthermore, there are three types level of the healthy condition such as
BBB (if it is > 50 and ≤ 65), BB (if it is more than 40 and ≤ 50), and B (if it is > 30 and ≤ 40) and for the unhealthy condition,
there are three types of levels such as CCC (if it is > 20 and ≤ 30), CC (if it is > 10 and ≤ 20), and C (if it is ≤ 10).
The Financial Ratio Analysis (FRA) method chosen for this study is motivated the researcher’s knowledge due to limited
literature review that conducted within a long period ( > 5 years or longer) on construction and property industry in Indonesia. In
addition, financial ratios can be used to identify a company’s strengths and weaknesses and also describing the company
profitability, liquidity, activity and solvency in detail (Hempel et al, 1994: Dietrich, 1996). Sinkey (2002) stated that the data in
the financial statements can be manipulated and financial statements are backward looking, those two are the only available
detail data of the all company activities. Moreover, the only information source for evaluating management’s potential to
generate satisfactory returns in the future is the data on the financial statement (Mabwe Kumbirai, Robert Webb, 2010).
Infrastructure Non Infra.
1 ROE 15 20
2 ROI 10 15
3 Cash Ratio 3 5
4 Current Ratio 4 5
5 Collection Period 4 5
6 Inventory Turnover 4 5
7 Total Asset Turnover 4 5
Solvency 8 Total Equity to Asset Ratio 6 10
50 70
WeightRatio
ClassifficationIndicator
Total Weight
No
Profitability
Liquidity
Activity
International Journal of Business, Economics and Law, Vol. 19, Issue 1 (August)
ISSN 2289-1552 2019
4
Table 2.1 Weighted Score Table 2.2 Company's Health Indicator
Source : The Decree of Ministry of State Owned Enterprise No. KEP 100/MBU/2002
A. Profitability Ratio
Return on Equity (ROE)
Return on equity reflects how much the firm has earned on the funds invested by the shareholders, either directly or
through retained earnings. ROE = 𝑂𝑝𝑒𝑟𝑎𝑡𝑖𝑛𝑔 𝑁𝑒𝑡 𝑃𝑟𝑜𝑓𝑖𝑡
𝑇𝑜𝑡𝑎𝑙 𝑆ℎ𝑎𝑟𝑒ℎ𝑜𝑙𝑑𝑒𝑟′𝑠 𝐸𝑞𝑢𝑖𝑡𝑦 x 100%
Return on Investment (ROI)
Return on Investment (ROI) is a performance measure used to evaluate the efficiency of an investment used to
generate return. Formula : ROI = 𝐸𝐵𝐼𝑇+𝐷𝑒𝑝𝑟𝑒𝑐𝑖𝑎𝑡𝑖𝑜𝑛
𝐶𝑎𝑝𝑖𝑡𝑎𝑙 𝐸𝑚𝑝𝑙𝑜𝑦𝑒𝑑 x 100%
After ROE and ROI has been calculated, both of the ratios shall be validated into assessment score as shown in the table 2.3
below.
Table 2.3 ROE and ROI Assessment Score
Source : The Decree of Ministry of State Owned Enterprise No. KEP 100/MBU/2002
B. Liquidity Ratio
Cash Ratio
The cash ratio shows how well the company capability to meet its obligation or to fulfill its short-term debt/liabilities
with readily and liquid cash resources. Formula :
Cash Ratio = 𝐶𝑎𝑠ℎ & 𝐶𝑎𝑠ℎ 𝐸𝑞𝑢𝑖𝑣𝑎𝑙𝑒𝑛𝑡
𝐶𝑢𝑟𝑟𝑒𝑛𝑡 𝐿𝑖𝑎𝑏𝑖𝑙𝑖𝑡𝑖𝑒𝑠 x 100%
Current Ratio
The ratio of current assets to current liabilities is called the current ratio. It indicates of an entity’s ability to meet its
current obligations with its current assets (Anthony, 2011:42). Formula :
Current Ratio = 𝐶𝑢𝑟𝑟𝑒𝑛𝑡 𝐴𝑠𝑠𝑒𝑡𝑠
𝐶𝑢𝑟𝑟𝑒𝑛𝑡 𝐿𝑖𝑎𝑏𝑖𝑙𝑖𝑡𝑖𝑒𝑠 x 100%
After Cash Ratio and Current Ratio has been calculated, both of the ratios shall be validated into assessment score as shown
in the table 2.4 below.
Infrastructure Non Infra.
1 ROE 15 20
2 ROI 10 15
3 Cash Ratio 3 5
4 Current Ratio 4 5
5 Collection Period 4 5
6 Inventory Turnover 4 5
7 Total Asset Turnover 4 5
Solvency 8 Total Equity to Asset Ratio 6 10
50 70
WeightRatio
ClassifficationIndicator
Total Weight
No
Profitability
Liquidity
Activity
International Journal of Business, Economics and Law, Vol. 19, Issue 1 (August)
ISSN 2289-1552 2019
5
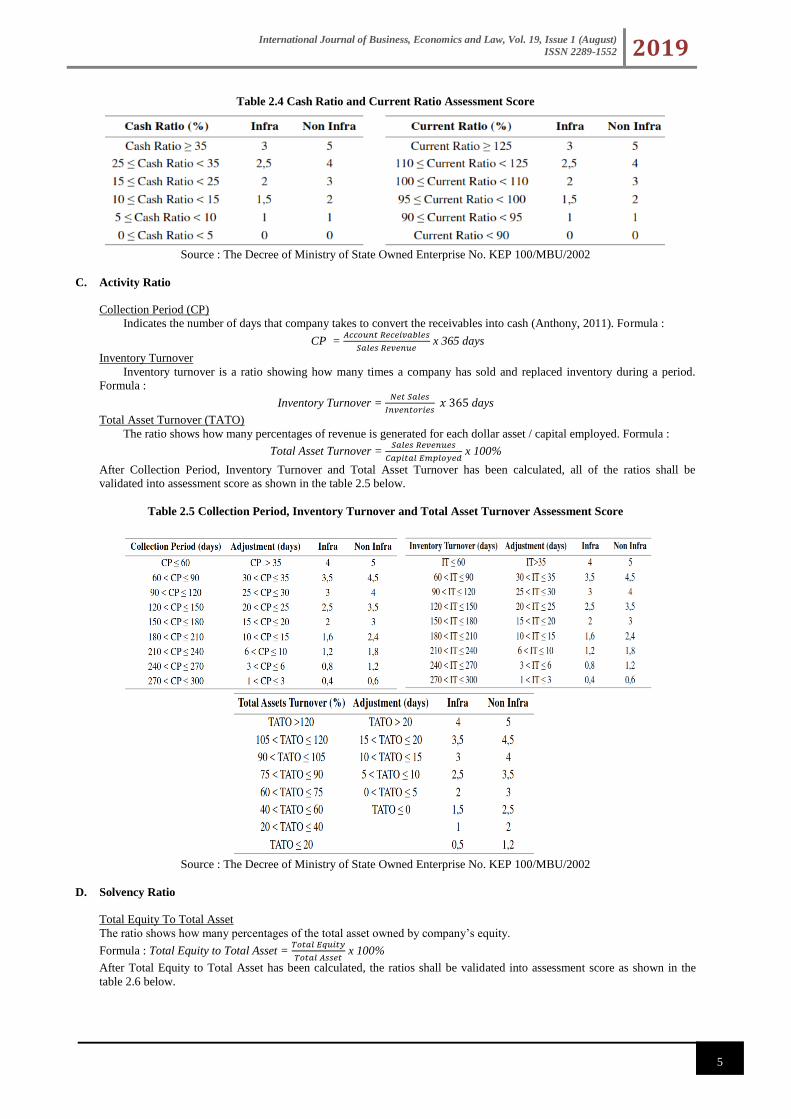
Table 2.4 Cash Ratio and Current Ratio Assessment Score
Source : The Decree of Ministry of State Owned Enterprise No. KEP 100/MBU/2002
C. Activity Ratio
Collection Period (CP)
Indicates the number of days that company takes to convert the receivables into cash (Anthony, 2011). Formula :
CP = 𝐴𝑐𝑐𝑜𝑢𝑛𝑡 𝑅𝑒𝑐𝑒𝑖𝑣𝑎𝑏𝑙𝑒𝑠
𝑆𝑎𝑙𝑒𝑠 𝑅𝑒𝑣𝑒𝑛𝑢𝑒 x 365 days
Inventory Turnover
Inventory turnover is a ratio showing how many times a company has sold and replaced inventory during a period.
Formula :
Inventory Turnover = 𝑁𝑒𝑡 𝑆𝑎𝑙𝑒𝑠
𝐼𝑛𝑣𝑒𝑛𝑡𝑜𝑟𝑖𝑒𝑠 𝑥 365 days
Total Asset Turnover (TATO)
The ratio shows how many percentages of revenue is generated for each dollar asset / capital employed. Formula :
Total Asset Turnover = 𝑆𝑎𝑙𝑒𝑠 𝑅𝑒𝑣𝑒𝑛𝑢𝑒𝑠
𝐶𝑎𝑝𝑖𝑡𝑎𝑙 𝐸𝑚𝑝𝑙𝑜𝑦𝑒𝑑 x 100%
After Collection Period, Inventory Turnover and Total Asset Turnover has been calculated, all of the ratios shall be
validated into assessment score as shown in the table 2.5 below.
Table 2.5 Collection Period, Inventory Turnover and Total Asset Turnover Assessment Score
Source : The Decree of Ministry of State Owned Enterprise No. KEP 100/MBU/2002
D. Solvency Ratio
Total Equity To Total Asset
The ratio shows how many percentages of the total asset owned by company’s equity.
Formula : Total Equity to Total Asset = 𝑇𝑜𝑡𝑎𝑙 𝐸𝑞𝑢𝑖𝑡𝑦
𝑇𝑜𝑡𝑎𝑙 𝐴𝑠𝑠𝑒𝑡 x 100%
After Total Equity to Total Asset has been calculated, the ratios shall be validated into assessment score as shown in the
table 2.6 below.
International Journal of Business, Economics and Law, Vol. 19, Issue 1 (August)
ISSN 2289-1552 2019
6
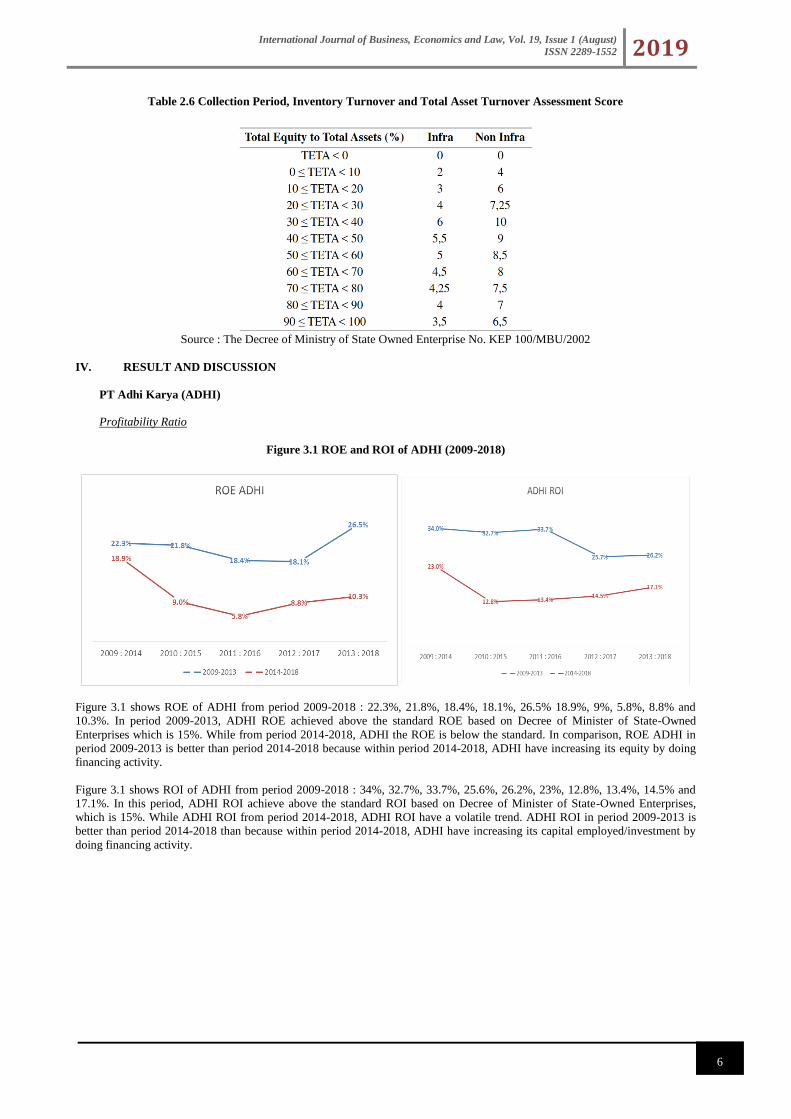
Table 2.6 Collection Period, Inventory Turnover and Total Asset Turnover Assessment Score
Source : The Decree of Ministry of State Owned Enterprise No. KEP 100/MBU/2002
IV. RESULT AND DISCUSSION
PT Adhi Karya (ADHI)
Profitability Ratio
Figure 3.1 ROE and ROI of ADHI (2009-2018)
Figure 3.1 shows ROE of ADHI from period 2009-2018 : 22.3%, 21.8%, 18.4%, 18.1%, 26.5% 18.9%, 9%, 5.8%, 8.8% and
10.3%. In period 2009-2013, ADHI ROE achieved above the standard ROE based on Decree of Minister of State-Owned
Enterprises which is 15%. While from period 2014-2018, ADHI the ROE is below the standard. In comparison, ROE ADHI in
period 2009-2013 is better than period 2014-2018 because within period 2014-2018, ADHI have increasing its equity by doing
financing activity.
Figure 3.1 shows ROI of ADHI from period 2009-2018 : 34%, 32.7%, 33.7%, 25.6%, 26.2%, 23%, 12.8%, 13.4%, 14.5% and
17.1%. In this period, ADHI ROI achieve above the standard ROI based on Decree of Minister of State-Owned Enterprises,
which is 15%. While ADHI ROI from period 2014-2018, ADHI ROI have a volatile trend. ADHI ROI in period 2009-2013 is
better than period 2014-2018 than because within period 2014-2018, ADHI have increasing its capital employed/investment by
doing financing activity.
International Journal of Business, Economics and Law, Vol. 19, Issue 1 (August)
ISSN 2289-1552 2019
7
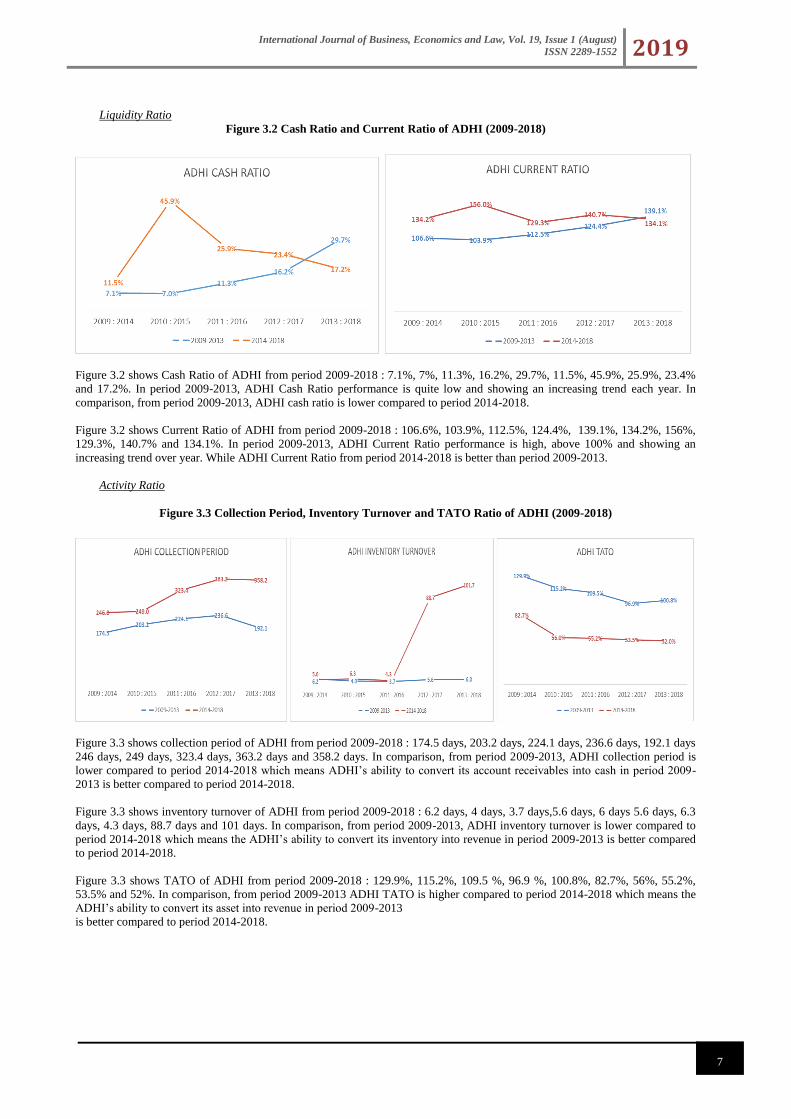
Liquidity Ratio
Figure 3.2 Cash Ratio and Current Ratio of ADHI (2009-2018)
Figure 3.2 shows Cash Ratio of ADHI from period 2009-2018 : 7.1%, 7%, 11.3%, 16.2%, 29.7%, 11.5%, 45.9%, 25.9%, 23.4%
and 17.2%. In period 2009-2013, ADHI Cash Ratio performance is quite low and showing an increasing trend each year. In
comparison, from period 2009-2013, ADHI cash ratio is lower compared to period 2014-2018.
Figure 3.2 shows Current Ratio of ADHI from period 2009-2018 : 106.6%, 103.9%, 112.5%, 124.4%, 139.1%, 134.2%, 156%,
129.3%, 140.7% and 134.1%. In period 2009-2013, ADHI Current Ratio performance is high, above 100% and showing an
increasing trend over year. While ADHI Current Ratio from period 2014-2018 is better than period 2009-2013.
Activity Ratio
Figure 3.3 Collection Period, Inventory Turnover and TATO Ratio of ADHI (2009-2018)
Figure 3.3 shows collection period of ADHI from period 2009-2018 : 174.5 days, 203.2 days, 224.1 days, 236.6 days, 192.1 days
246 days, 249 days, 323.4 days, 363.2 days and 358.2 days. In comparison, from period 2009-2013, ADHI collection period is
lower compared to period 2014-2018 which means ADHI’s ability to convert its account receivables into cash in period 2009-
2013 is better compared to period 2014-2018.
Figure 3.3 shows inventory turnover of ADHI from period 2009-2018 : 6.2 days, 4 days, 3.7 days,5.6 days, 6 days 5.6 days, 6.3
days, 4.3 days, 88.7 days and 101 days. In comparison, from period 2009-2013, ADHI inventory turnover is lower compared to
period 2014-2018 which means the ADHI’s ability to convert its inventory into revenue in period 2009-2013 is better compared
to period 2014-2018.
Figure 3.3 shows TATO of ADHI from period 2009-2018 : 129.9%, 115.2%, 109.5 %, 96.9 %, 100.8%, 82.7%, 56%, 55.2%,
53.5% and 52%. In comparison, from period 2009-2013 ADHI TATO is higher compared to period 2014-2018 which means the
ADHI’s ability to convert its asset into revenue in period 2009-2013
is better compared to period 2014-2018.
International Journal of Business, Economics and Law, Vol. 19, Issue 1 (August)
ISSN 2289-1552 2019
8
Solvency Ratio
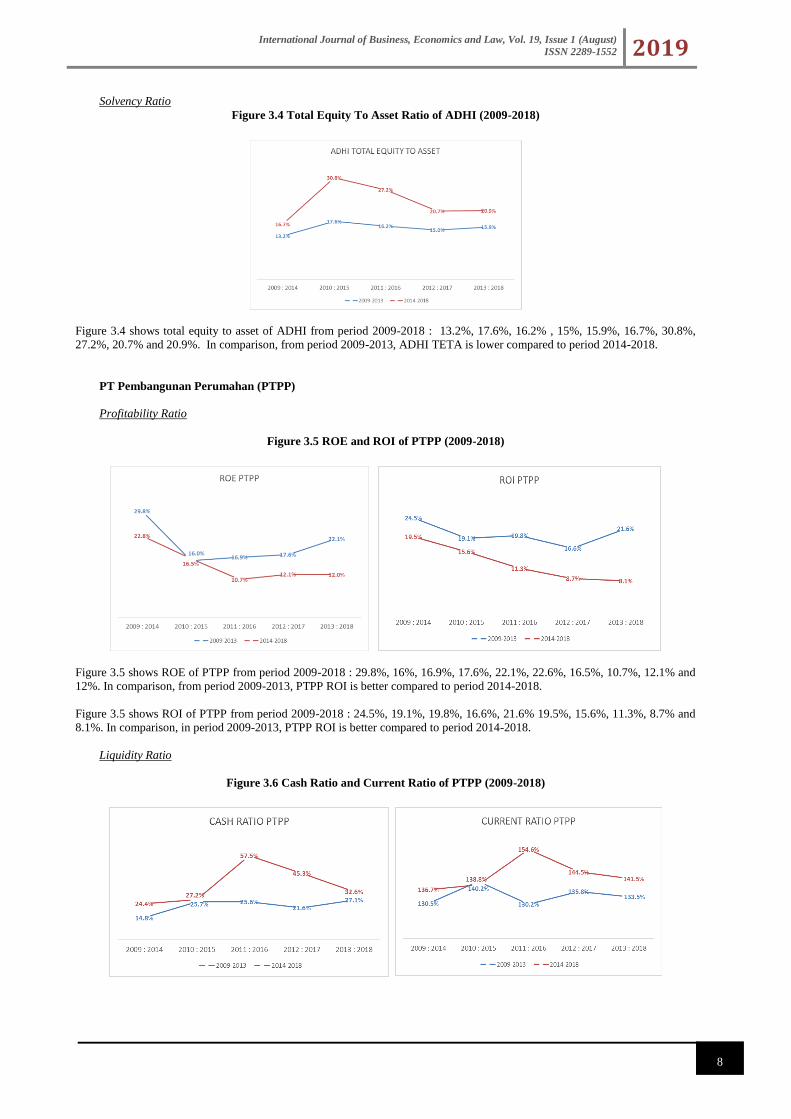
Figure 3.4 Total Equity To Asset Ratio of ADHI (2009-2018)
Figure 3.4 shows total equity to asset of ADHI from period 2009-2018 : 13.2%, 17.6%, 16.2% , 15%, 15.9%, 16.7%, 30.8%,
27.2%, 20.7% and 20.9%. In comparison, from period 2009-2013, ADHI TETA is lower compared to period 2014-2018.
PT Pembangunan Perumahan (PTPP)
Profitability Ratio
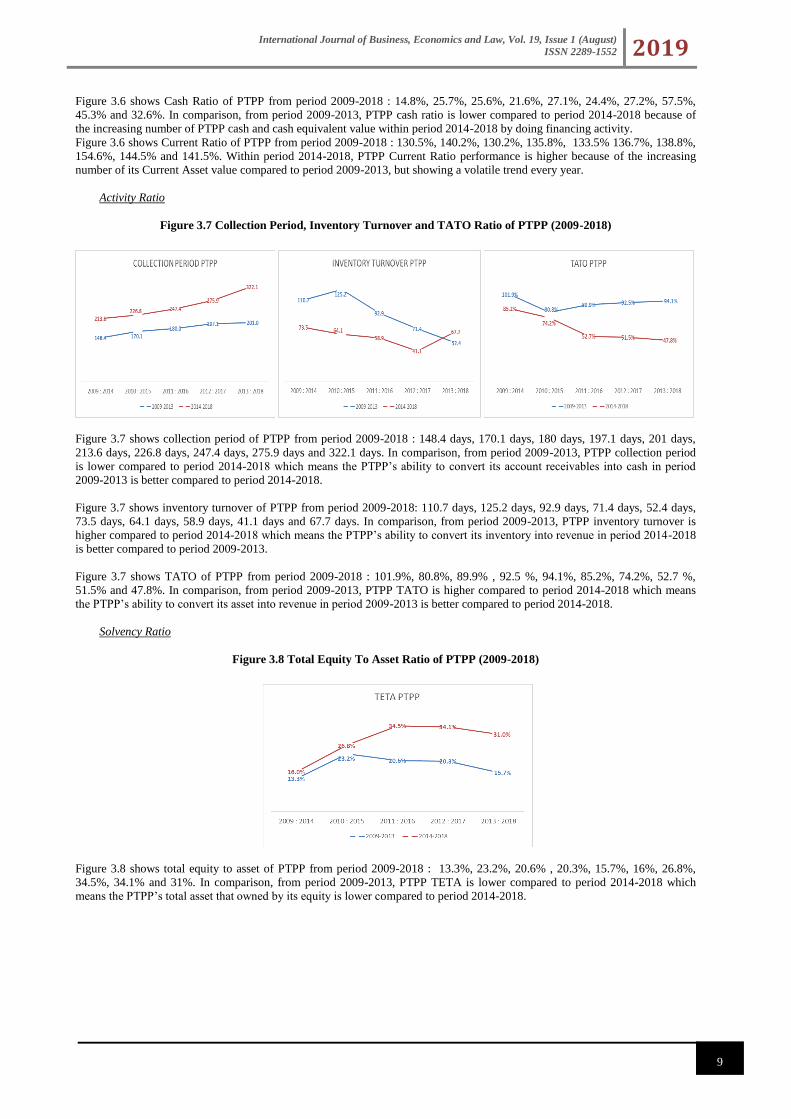
Figure 3.5 ROE and ROI of PTPP (2009-2018)
Figure 3.5 shows ROE of PTPP from period 2009-2018 : 29.8%, 16%, 16.9%, 17.6%, 22.1%, 22.6%, 16.5%, 10.7%, 12.1% and
12%. In comparison, from period 2009-2013, PTPP ROI is better compared to period 2014-2018.
Figure 3.5 shows ROI of PTPP from period 2009-2018 : 24.5%, 19.1%, 19.8%, 16.6%, 21.6% 19.5%, 15.6%, 11.3%, 8.7% and
8.1%. In comparison, in period 2009-2013, PTPP ROI is better compared to period 2014-2018.
Liquidity Ratio
Figure 3.6 Cash Ratio and Current Ratio of PTPP (2009-2018)
International Journal of Business, Economics and Law, Vol. 19, Issue 1 (August)
ISSN 2289-1552 2019
9
Figure 3.6 shows Cash Ratio of PTPP from period 2009-2018 : 14.8%, 25.7%, 25.6%, 21.6%, 27.1%, 24.4%, 27.2%, 57.5%,
45.3% and 32.6%. In comparison, from period 2009-2013, PTPP cash ratio is lower compared to period 2014-2018 because of
the increasing number of PTPP cash and cash equivalent value within period 2014-2018 by doing financing activity.
Figure 3.6 shows Current Ratio of PTPP from period 2009-2018 : 130.5%, 140.2%, 130.2%, 135.8%, 133.5% 136.7%, 138.8%,
154.6%, 144.5% and 141.5%. Within period 2014-2018, PTPP Current Ratio performance is higher because of the increasing
number of its Current Asset value compared to period 2009-2013, but showing a volatile trend every year.
Activity Ratio
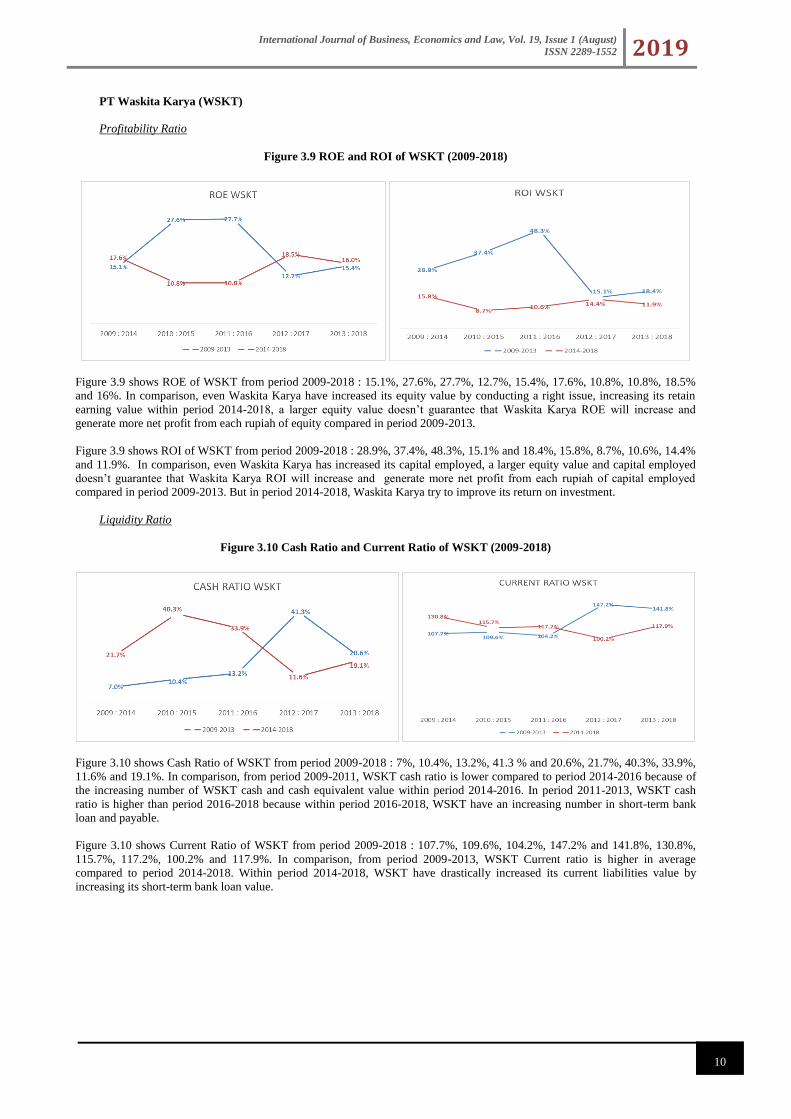
Figure 3.7 Collection Period, Inventory Turnover and TATO Ratio of PTPP (2009-2018)
Figure 3.7 shows collection period of PTPP from period 2009-2018 : 148.4 days, 170.1 days, 180 days, 197.1 days, 201 days,
213.6 days, 226.8 days, 247.4 days, 275.9 days and 322.1 days. In comparison, from period 2009-2013, PTPP collection period
is lower compared to period 2014-2018 which means the PTPP’s ability to convert its account receivables into cash in period
2009-2013 is better compared to period 2014-2018.
Figure 3.7 shows inventory turnover of PTPP from period 2009-2018: 110.7 days, 125.2 days, 92.9 days, 71.4 days, 52.4 days,
73.5 days, 64.1 days, 58.9 days, 41.1 days and 67.7 days. In comparison, from period 2009-2013, PTPP inventory turnover is
higher compared to period 2014-2018 which means the PTPP’s ability to convert its inventory into revenue in period 2014-2018
is better compared to period 2009-2013.
Figure 3.7 shows TATO of PTPP from period 2009-2018 : 101.9%, 80.8%, 89.9% , 92.5 %, 94.1%, 85.2%, 74.2%, 52.7 %,
51.5% and 47.8%. In comparison, from period 2009-2013, PTPP TATO is higher compared to period 2014-2018 which means
the PTPP’s ability to convert its asset into revenue in period 2009-2013 is better compared to period 2014-2018.
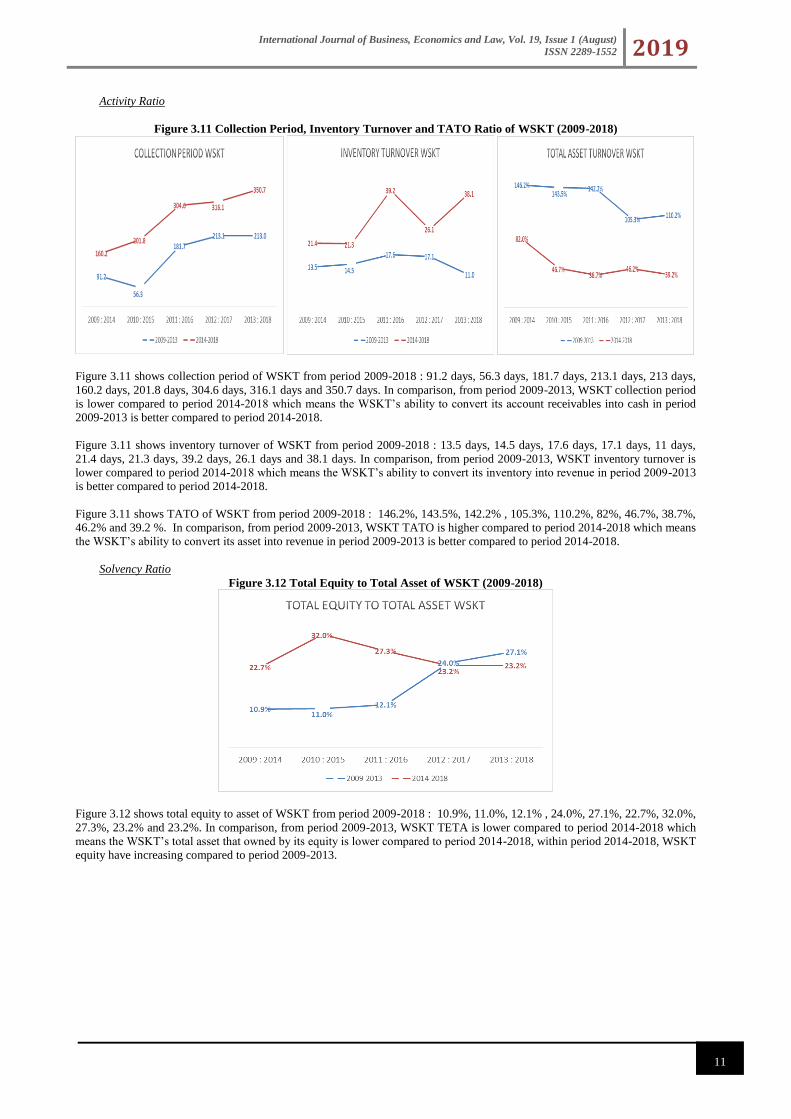
Solvency Ratio
Figure 3.8 Total Equity To Asset Ratio of PTPP (2009-2018)
Figure 3.8 shows total equity to asset of PTPP from period 2009-2018 : 13.3%, 23.2%, 20.6% , 20.3%, 15.7%, 16%, 26.8%,
34.5%, 34.1% and 31%. In comparison, from period 2009-2013, PTPP TETA is lower compared to period 2014-2018 which
means the PTPP’s total asset that owned by its equity is lower compared to period 2014-2018.
International Journal of Business, Economics and Law, Vol. 19, Issue 1 (August)
ISSN 2289-1552 2019
10
PT Waskita Karya (WSKT)
Profitability Ratio
Figure 3.9 ROE and ROI of WSKT (2009-2018)
Figure 3.9 shows ROE of WSKT from period 2009-2018 : 15.1%, 27.6%, 27.7%, 12.7%, 15.4%, 17.6%, 10.8%, 10.8%, 18.5%
and 16%. In comparison, even Waskita Karya have increased its equity value by conducting a right issue, increasing its retain
earning value within period 2014-2018, a larger equity value doesn’t guarantee that Waskita Karya ROE will increase and
generate more net profit from each rupiah of equity compared in period 2009-2013.
Figure 3.9 shows ROI of WSKT from period 2009-2018 : 28.9%, 37.4%, 48.3%, 15.1% and 18.4%, 15.8%, 8.7%, 10.6%, 14.4%
and 11.9%. In comparison, even Waskita Karya has increased its capital employed, a larger equity value and capital employed
doesn’t guarantee that Waskita Karya ROI will increase and generate more net profit from each rupiah of capital employed
compared in period 2009-2013. But in period 2014-2018, Waskita Karya try to improve its return on investment.
Liquidity Ratio
Figure 3.10 Cash Ratio and Current Ratio of WSKT (2009-2018)
Figure 3.10 shows Cash Ratio of WSKT from period 2009-2018 : 7%, 10.4%, 13.2%, 41.3 % and 20.6%, 21.7%, 40.3%, 33.9%,
11.6% and 19.1%. In comparison, from period 2009-2011, WSKT cash ratio is lower compared to period 2014-2016 because of
the increasing number of WSKT cash and cash equivalent value within period 2014-2016. In period 2011-2013, WSKT cash
ratio is higher than period 2016-2018 because within period 2016-2018, WSKT have an increasing number in short-term bank
loan and payable.
Figure 3.10 shows Current Ratio of WSKT from period 2009-2018 : 107.7%, 109.6%, 104.2%, 147.2% and 141.8%, 130.8%,
115.7%, 117.2%, 100.2% and 117.9%. In comparison, from period 2009-2013, WSKT Current ratio is higher in average
compared to period 2014-2018. Within period 2014-2018, WSKT have drastically increased its current liabilities value by
increasing its short-term bank loan value.
International Journal of Business, Economics and Law, Vol. 19, Issue 1 (August)
ISSN 2289-1552 2019
11
Activity Ratio
Figure 3.11 Collection Period, Inventory Turnover and TATO Ratio of WSKT (2009-2018)
Figure 3.11 shows collection period of WSKT from period 2009-2018 : 91.2 days, 56.3 days, 181.7 days, 213.1 days, 213 days,
160.2 days, 201.8 days, 304.6 days, 316.1 days and 350.7 days. In comparison, from period 2009-2013, WSKT collection period
is lower compared to period 2014-2018 which means the WSKT’s ability to convert its account receivables into cash in period
2009-2013 is better compared to period 2014-2018.
Figure 3.11 shows inventory turnover of WSKT from period 2009-2018 : 13.5 days, 14.5 days, 17.6 days, 17.1 days, 11 days,
21.4 days, 21.3 days, 39.2 days, 26.1 days and 38.1 days. In comparison, from period 2009-2013, WSKT inventory turnover is
lower compared to period 2014-2018 which means the WSKT’s ability to convert its inventory into revenue in period 2009-2013
is better compared to period 2014-2018.
Figure 3.11 shows TATO of WSKT from period 2009-2018 : 146.2%, 143.5%, 142.2% , 105.3%, 110.2%, 82%, 46.7%, 38.7%,
46.2% and 39.2 %. In comparison, from period 2009-2013, WSKT TATO is higher compared to period 2014-2018 which means
the WSKT’s ability to convert its asset into revenue in period 2009-2013 is better compared to period 2014-2018.
Solvency Ratio
Figure 3.12 Total Equity to Total Asset of WSKT (2009-2018)
Figure 3.12 shows total equity to asset of WSKT from period 2009-2018 : 10.9%, 11.0%, 12.1% , 24.0%, 27.1%, 22.7%, 32.0%,
27.3%, 23.2% and 23.2%. In comparison, from period 2009-2013, WSKT TETA is lower compared to period 2014-2018 which
means the WSKT’s total asset that owned by its equity is lower compared to period 2014-2018, within period 2014-2018, WSKT
equity have increasing compared to period 2009-2013.
International Journal of Business, Economics and Law, Vol. 19, Issue 1 (August)
ISSN 2289-1552 2019
12
PT Wijaya Karya (WIKA)
Profitability Ratio
Figure 3.13 ROE and ROI of WIKA (2009-2018)
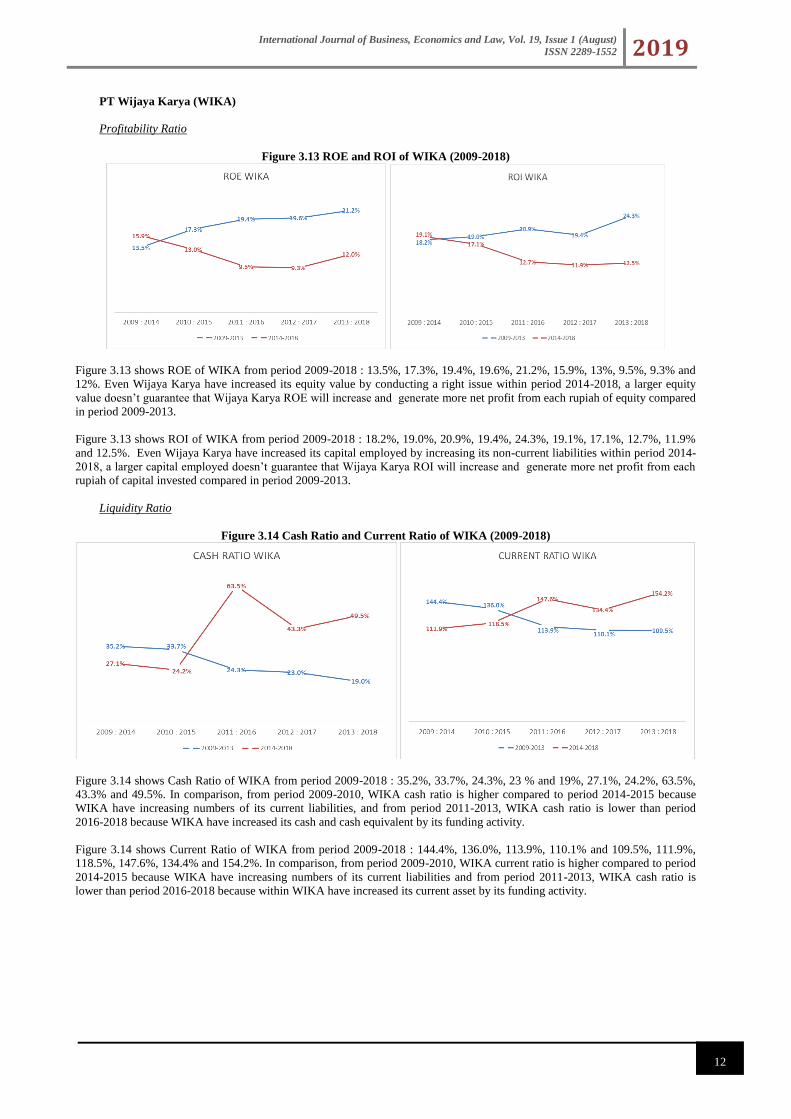
Figure 3.13 shows ROE of WIKA from period 2009-2018 : 13.5%, 17.3%, 19.4%, 19.6%, 21.2%, 15.9%, 13%, 9.5%, 9.3% and
12%. Even Wijaya Karya have increased its equity value by conducting a right issue within period 2014-2018, a larger equity
value doesn’t guarantee that Wijaya Karya ROE will increase and generate more net profit from each rupiah of equity compared
in period 2009-2013.
Figure 3.13 shows ROI of WIKA from period 2009-2018 : 18.2%, 19.0%, 20.9%, 19.4%, 24.3%, 19.1%, 17.1%, 12.7%, 11.9%
and 12.5%. Even Wijaya Karya have increased its capital employed by increasing its non-current liabilities within period 2014-
2018, a larger capital employed doesn’t guarantee that Wijaya Karya ROI will increase and generate more net profit from each
rupiah of capital invested compared in period 2009-2013.
Liquidity Ratio
Figure 3.14 Cash Ratio and Current Ratio of WIKA (2009-2018)
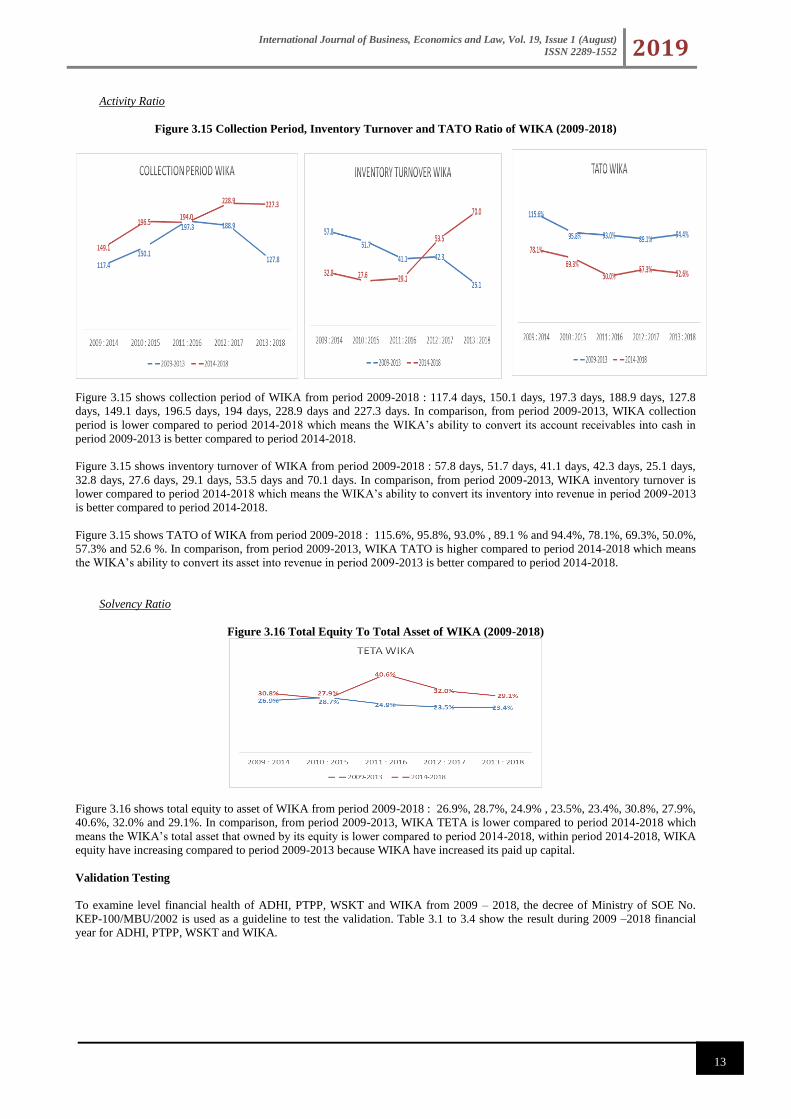
Figure 3.14 shows Cash Ratio of WIKA from period 2009-2018 : 35.2%, 33.7%, 24.3%, 23 % and 19%, 27.1%, 24.2%, 63.5%,
43.3% and 49.5%. In comparison, from period 2009-2010, WIKA cash ratio is higher compared to period 2014-2015 because
WIKA have increasing numbers of its current liabilities, and from period 2011-2013, WIKA cash ratio is lower than period
2016-2018 because WIKA have increased its cash and cash equivalent by its funding activity.
Figure 3.14 shows Current Ratio of WIKA from period 2009-2018 : 144.4%, 136.0%, 113.9%, 110.1% and 109.5%, 111.9%,
118.5%, 147.6%, 134.4% and 154.2%. In comparison, from period 2009-2010, WIKA current ratio is higher compared to period
2014-2015 because WIKA have increasing numbers of its current liabilities and from period 2011-2013, WIKA cash ratio is
lower than period 2016-2018 because within WIKA have increased its current asset by its funding activity.
International Journal of Business, Economics and Law, Vol. 19, Issue 1 (August)
ISSN 2289-1552 2019
13
Activity Ratio
Figure 3.15 Collection Period, Inventory Turnover and TATO Ratio of WIKA (2009-2018)
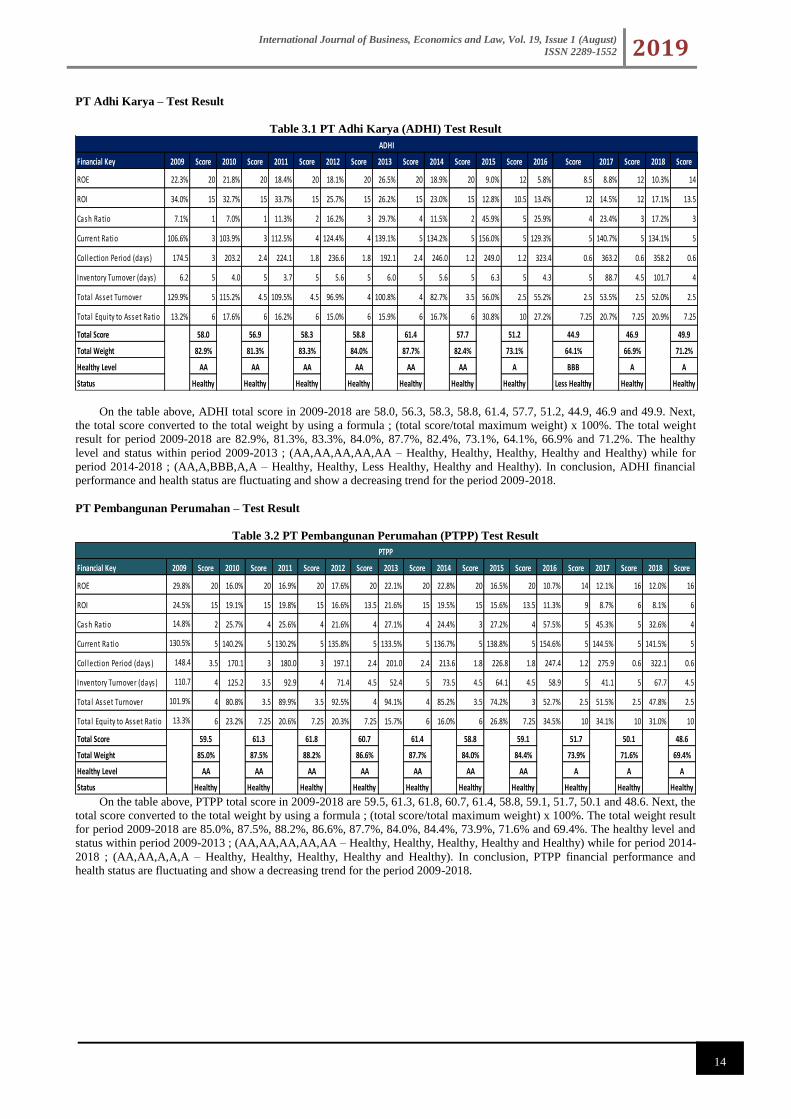
Figure 3.15 shows collection period of WIKA from period 2009-2018 : 117.4 days, 150.1 days, 197.3 days, 188.9 days, 127.8
days, 149.1 days, 196.5 days, 194 days, 228.9 days and 227.3 days. In comparison, from period 2009-2013, WIKA collection
period is lower compared to period 2014-2018 which means the WIKA’s ability to convert its account receivables into cash in
period 2009-2013 is better compared to period 2014-2018.
Figure 3.15 shows inventory turnover of WIKA from period 2009-2018 : 57.8 days, 51.7 days, 41.1 days, 42.3 days, 25.1 days,
32.8 days, 27.6 days, 29.1 days, 53.5 days and 70.1 days. In comparison, from period 2009-2013, WIKA inventory turnover is
lower compared to period 2014-2018 which means the WIKA’s ability to convert its inventory into revenue in period 2009-2013
is better compared to period 2014-2018.
Figure 3.15 shows TATO of WIKA from period 2009-2018 : 115.6%, 95.8%, 93.0% , 89.1 % and 94.4%, 78.1%, 69.3%, 50.0%,
57.3% and 52.6 %. In comparison, from period 2009-2013, WIKA TATO is higher compared to period 2014-2018 which means
the WIKA’s ability to convert its asset into revenue in period 2009-2013 is better compared to period 2014-2018.
Solvency Ratio
Figure 3.16 Total Equity To Total Asset of WIKA (2009-2018)
Figure 3.16 shows total equity to asset of WIKA from period 2009-2018 : 26.9%, 28.7%, 24.9% , 23.5%, 23.4%, 30.8%, 27.9%,
40.6%, 32.0% and 29.1%. In comparison, from period 2009-2013, WIKA TETA is lower compared to period 2014-2018 which
means the WIKA’s total asset that owned by its equity is lower compared to period 2014-2018, within period 2014-2018, WIKA
equity have increasing compared to period 2009-2013 because WIKA have increased its paid up capital.
Validation Testing
To examine level financial health of ADHI, PTPP, WSKT and WIKA from 2009 – 2018, the decree of Ministry of SOE No.
KEP-100/MBU/2002 is used as a guideline to test the validation. Table 3.1 to 3.4 show the result during 2009 –2018 financial
year for ADHI, PTPP, WSKT and WIKA.
International Journal of Business, Economics and Law, Vol. 19, Issue 1 (August)
ISSN 2289-1552 2019
14
PT Adhi Karya – Test Result
Table 3.1 PT Adhi Karya (ADHI) Test Result
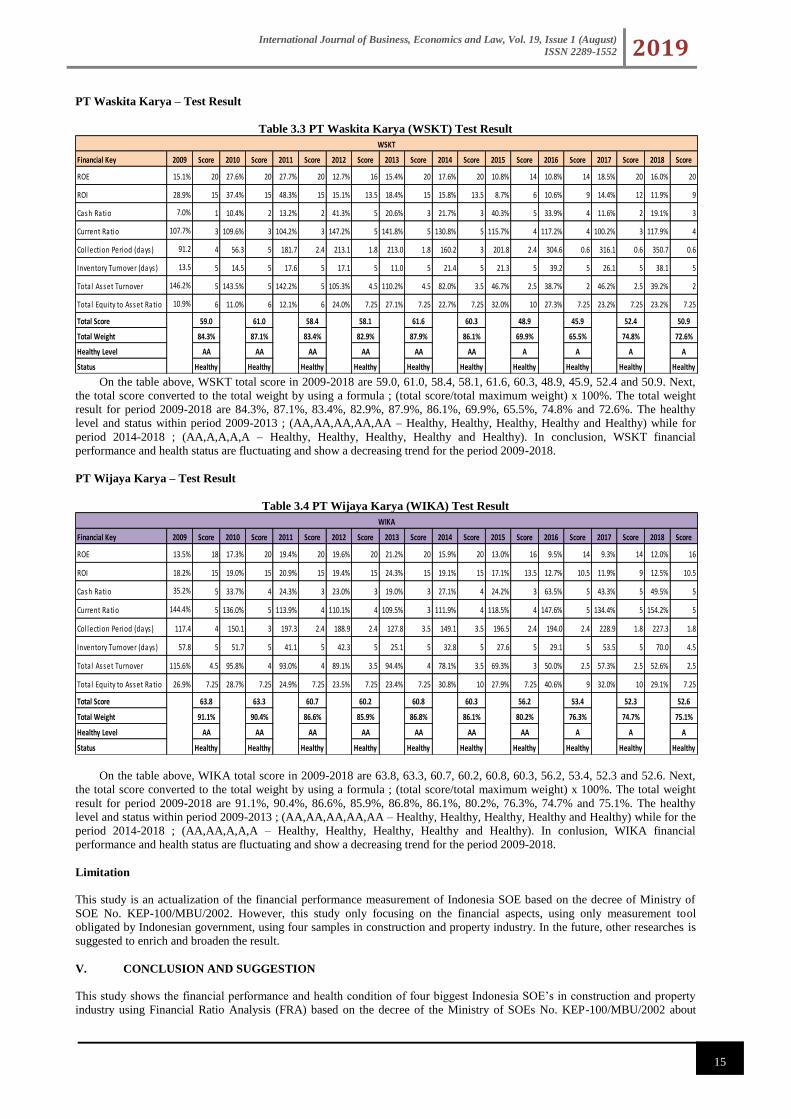
On the table above, ADHI total score in 2009-2018 are 58.0, 56.3, 58.3, 58.8, 61.4, 57.7, 51.2, 44.9, 46.9 and 49.9. Next,
the total score converted to the total weight by using a formula ; (total score/total maximum weight) x 100%. The total weight
result for period 2009-2018 are 82.9%, 81.3%, 83.3%, 84.0%, 87.7%, 82.4%, 73.1%, 64.1%, 66.9% and 71.2%. The healthy
level and status within period 2009-2013 ; (AA,AA,AA,AA,AA – Healthy, Healthy, Healthy, Healthy and Healthy) while for
period 2014-2018 ; (AA,A,BBB,A,A – Healthy, Healthy, Less Healthy, Healthy and Healthy). In conclusion, ADHI financial
performance and health status are fluctuating and show a decreasing trend for the period 2009-2018.
PT Pembangunan Perumahan – Test Result
Table 3.2 PT Pembangunan Perumahan (PTPP) Test Result
On the table above, PTPP total score in 2009-2018 are 59.5, 61.3, 61.8, 60.7, 61.4, 58.8, 59.1, 51.7, 50.1 and 48.6. Next, the
total score converted to the total weight by using a formula ; (total score/total maximum weight) x 100%. The total weight result
for period 2009-2018 are 85.0%, 87.5%, 88.2%, 86.6%, 87.7%, 84.0%, 84.4%, 73.9%, 71.6% and 69.4%. The healthy level and
status within period 2009-2013 ; (AA,AA,AA,AA,AA – Healthy, Healthy, Healthy, Healthy and Healthy) while for period 2014-
2018 ; (AA,AA,A,A,A – Healthy, Healthy, Healthy, Healthy and Healthy). In conclusion, PTPP financial performance and
health status are fluctuating and show a decreasing trend for the period 2009-2018.
Financial Key 2009 Score 2010 Score 2011 Score 2012 Score 2013 Score 2014 Score 2015 Score 2016 Score 2017 Score 2018 Score
ROE 22.3% 20 21.8% 20 18.4% 20 18.1% 20 26.5% 20 18.9% 20 9.0% 12 5.8% 8.5 8.8% 12 10.3% 14
ROI 34.0% 15 32.7% 15 33.7% 15 25.7% 15 26.2% 15 23.0% 15 12.8% 10.5 13.4% 12 14.5% 12 17.1% 13.5
Cash Ratio 7.1% 1 7.0% 1 11.3% 2 16.2% 3 29.7% 4 11.5% 2 45.9% 5 25.9% 4 23.4% 3 17.2% 3
Current Ratio 106.6% 3 103.9% 3 112.5% 4 124.4% 4 139.1% 5 134.2% 5 156.0% 5 129.3% 5 140.7% 5 134.1% 5
Col lection Period (days) 174.5 3 203.2 2.4 224.1 1.8 236.6 1.8 192.1 2.4 246.0 1.2 249.0 1.2 323.4 0.6 363.2 0.6 358.2 0.6
Inventory Turnover (days) 6.2 5 4.0 5 3.7 5 5.6 5 6.0 5 5.6 5 6.3 5 4.3 5 88.7 4.5 101.7 4
Total Asset Turnover 129.9% 5 115.2% 4.5 109.5% 4.5 96.9% 4 100.8% 4 82.7% 3.5 56.0% 2.5 55.2% 2.5 53.5% 2.5 52.0% 2.5
Total Equity to Asset Ratio 13.2% 6 17.6% 6 16.2% 6 15.0% 6 15.9% 6 16.7% 6 30.8% 10 27.2% 7.25 20.7% 7.25 20.9% 7.25
Total Score 58.0 56.9 58.3 58.8 61.4 57.7 51.2 44.9 46.9 49.9
Total Weight 82.9% 81.3% 83.3% 84.0% 87.7% 82.4% 73.1% 64.1% 66.9% 71.2%
Healthy Level AA AA AA AA AA AA A BBB A A
Status Healthy Healthy Healthy Healthy Healthy Healthy Healthy Less Healthy Healthy Healthy
ADHI
Financial Key 2009 Score 2010 Score 2011 Score 2012 Score 2013 Score 2014 Score 2015 Score 2016 Score 2017 Score 2018 Score
ROE 29.8% 20 16.0% 20 16.9% 20 17.6% 20 22.1% 20 22.8% 20 16.5% 20 10.7% 14 12.1% 16 12.0% 16
ROI 24.5% 15 19.1% 15 19.8% 15 16.6% 13.5 21.6% 15 19.5% 15 15.6% 13.5 11.3% 9 8.7% 6 8.1% 6
Cash Ratio 14.8% 2 25.7% 4 25.6% 4 21.6% 4 27.1% 4 24.4% 3 27.2% 4 57.5% 5 45.3% 5 32.6% 4
Current Ratio 130.5% 5 140.2% 5 130.2% 5 135.8% 5 133.5% 5 136.7% 5 138.8% 5 154.6% 5 144.5% 5 141.5% 5
Col lection Period (days) 148.4 3.5 170.1 3 180.0 3 197.1 2.4 201.0 2.4 213.6 1.8 226.8 1.8 247.4 1.2 275.9 0.6 322.1 0.6
Inventory Turnover (days) 110.7 4 125.2 3.5 92.9 4 71.4 4.5 52.4 5 73.5 4.5 64.1 4.5 58.9 5 41.1 5 67.7 4.5
Total Asset Turnover 101.9% 4 80.8% 3.5 89.9% 3.5 92.5% 4 94.1% 4 85.2% 3.5 74.2% 3 52.7% 2.5 51.5% 2.5 47.8% 2.5
Total Equity to Asset Ratio 13.3% 6 23.2% 7.25 20.6% 7.25 20.3% 7.25 15.7% 6 16.0% 6 26.8% 7.25 34.5% 10 34.1% 10 31.0% 10
Total Score 59.5 61.3 61.8 60.7 61.4 58.8 59.1 51.7 50.1 48.6
Total Weight 85.0% 87.5% 88.2% 86.6% 87.7% 84.0% 84.4% 73.9% 71.6% 69.4%
Healthy Level AA AA AA AA AA AA AA A A A
Status Healthy Healthy Healthy Healthy Healthy Healthy Healthy Healthy Healthy Healthy
PTPP
International Journal of Business, Economics and Law, Vol. 19, Issue 1 (August)
ISSN 2289-1552 2019
15
PT Waskita Karya – Test Result
Table 3.3 PT Waskita Karya (WSKT) Test Result
On the table above, WSKT total score in 2009-2018 are 59.0, 61.0, 58.4, 58.1, 61.6, 60.3, 48.9, 45.9, 52.4 and 50.9. Next,
the total score converted to the total weight by using a formula ; (total score/total maximum weight) x 100%. The total weight
result for period 2009-2018 are 84.3%, 87.1%, 83.4%, 82.9%, 87.9%, 86.1%, 69.9%, 65.5%, 74.8% and 72.6%. The healthy
level and status within period 2009-2013 ; (AA,AA,AA,AA,AA – Healthy, Healthy, Healthy, Healthy and Healthy) while for
period 2014-2018 ; (AA,A,A,A,A – Healthy, Healthy, Healthy, Healthy and Healthy). In conclusion, WSKT financial
performance and health status are fluctuating and show a decreasing trend for the period 2009-2018.
PT Wijaya Karya – Test Result
Table 3.4 PT Wijaya Karya (WIKA) Test Result
On the table above, WIKA total score in 2009-2018 are 63.8, 63.3, 60.7, 60.2, 60.8, 60.3, 56.2, 53.4, 52.3 and 52.6. Next,
the total score converted to the total weight by using a formula ; (total score/total maximum weight) x 100%. The total weight
result for period 2009-2018 are 91.1%, 90.4%, 86.6%, 85.9%, 86.8%, 86.1%, 80.2%, 76.3%, 74.7% and 75.1%. The healthy
level and status within period 2009-2013 ; (AA,AA,AA,AA,AA – Healthy, Healthy, Healthy, Healthy and Healthy) while for the
period 2014-2018 ; (AA,AA,A,A,A – Healthy, Healthy, Healthy, Healthy and Healthy). In conlusion, WIKA financial
performance and health status are fluctuating and show a decreasing trend for the period 2009-2018.
Limitation
This study is an actualization of the financial performance measurement of Indonesia SOE based on the decree of Ministry of
SOE No. KEP-100/MBU/2002. However, this study only focusing on the financial aspects, using only measurement tool
obligated by Indonesian government, using four samples in construction and property industry. In the future, other researches is
suggested to enrich and broaden the result.
V. CONCLUSION AND SUGGESTION
This study shows the financial performance and health condition of four biggest Indonesia SOE’s in construction and property
industry using Financial Ratio Analysis (FRA) based on the decree of the Ministry of SOEs No. KEP-100/MBU/2002 about
Financial Key 2009 Score 2010 Score 2011 Score 2012 Score 2013 Score 2014 Score 2015 Score 2016 Score 2017 Score 2018 Score
ROE 15.1% 20 27.6% 20 27.7% 20 12.7% 16 15.4% 20 17.6% 20 10.8% 14 10.8% 14 18.5% 20 16.0% 20
ROI 28.9% 15 37.4% 15 48.3% 15 15.1% 13.5 18.4% 15 15.8% 13.5 8.7% 6 10.6% 9 14.4% 12 11.9% 9
Cash Ratio 7.0% 1 10.4% 2 13.2% 2 41.3% 5 20.6% 3 21.7% 3 40.3% 5 33.9% 4 11.6% 2 19.1% 3
Current Ratio 107.7% 3 109.6% 3 104.2% 3 147.2% 5 141.8% 5 130.8% 5 115.7% 4 117.2% 4 100.2% 3 117.9% 4
Col lection Period (days) 91.2 4 56.3 5 181.7 2.4 213.1 1.8 213.0 1.8 160.2 3 201.8 2.4 304.6 0.6 316.1 0.6 350.7 0.6
Inventory Turnover (days) 13.5 5 14.5 5 17.6 5 17.1 5 11.0 5 21.4 5 21.3 5 39.2 5 26.1 5 38.1 5
Total Asset Turnover 146.2% 5 143.5% 5 142.2% 5 105.3% 4.5 110.2% 4.5 82.0% 3.5 46.7% 2.5 38.7% 2 46.2% 2.5 39.2% 2
Total Equity to Asset Ratio 10.9% 6 11.0% 6 12.1% 6 24.0% 7.25 27.1% 7.25 22.7% 7.25 32.0% 10 27.3% 7.25 23.2% 7.25 23.2% 7.25
Total Score 59.0 61.0 58.4 58.1 61.6 60.3 48.9 45.9 52.4 50.9
Total Weight 84.3% 87.1% 83.4% 82.9% 87.9% 86.1% 69.9% 65.5% 74.8% 72.6%
Healthy Level AA AA AA AA AA AA A A A A
Status Healthy Healthy Healthy Healthy Healthy Healthy Healthy Healthy Healthy Healthy
WSKT
Financial Key 2009 Score 2010 Score 2011 Score 2012 Score 2013 Score 2014 Score 2015 Score 2016 Score 2017 Score 2018 Score
ROE 13.5% 18 17.3% 20 19.4% 20 19.6% 20 21.2% 20 15.9% 20 13.0% 16 9.5% 14 9.3% 14 12.0% 16
ROI 18.2% 15 19.0% 15 20.9% 15 19.4% 15 24.3% 15 19.1% 15 17.1% 13.5 12.7% 10.5 11.9% 9 12.5% 10.5
Cash Ratio 35.2% 5 33.7% 4 24.3% 3 23.0% 3 19.0% 3 27.1% 4 24.2% 3 63.5% 5 43.3% 5 49.5% 5
Current Ratio 144.4% 5 136.0% 5 113.9% 4 110.1% 4 109.5% 3 111.9% 4 118.5% 4 147.6% 5 134.4% 5 154.2% 5
Col lection Period (days) 117.4 4 150.1 3 197.3 2.4 188.9 2.4 127.8 3.5 149.1 3.5 196.5 2.4 194.0 2.4 228.9 1.8 227.3 1.8
Inventory Turnover (days) 57.8 5 51.7 5 41.1 5 42.3 5 25.1 5 32.8 5 27.6 5 29.1 5 53.5 5 70.0 4.5
Total Asset Turnover 115.6% 4.5 95.8% 4 93.0% 4 89.1% 3.5 94.4% 4 78.1% 3.5 69.3% 3 50.0% 2.5 57.3% 2.5 52.6% 2.5
Total Equity to Asset Ratio 26.9% 7.25 28.7% 7.25 24.9% 7.25 23.5% 7.25 23.4% 7.25 30.8% 10 27.9% 7.25 40.6% 9 32.0% 10 29.1% 7.25
Total Score 63.8 63.3 60.7 60.2 60.8 60.3 56.2 53.4 52.3 52.6
Total Weight 91.1% 90.4% 86.6% 85.9% 86.8% 86.1% 80.2% 76.3% 74.7% 75.1%
Healthy Level AA AA AA AA AA AA AA A A A
Status Healthy Healthy Healthy Healthy Healthy Healthy Healthy Healthy Healthy Healthy
WIKA
International Journal of Business, Economics and Law, Vol. 19, Issue 1 (August)
ISSN 2289-1552 2019
16
financial health assessment of SOE focusing on financial aspects that consist of profitability ratio, liquidity ratio, activity ratio
and solvency ratio. The results obtained of the financial health condition of the respondent companies are; Period 2009-2018:
ADHI (AA, AA, AA, AA, AA, AA, AA, A, BBB, A), PTPP (AA, AA, AA, AA, AA, AA, AA, A, A, A), WSKT (AA, AA, AA,
AA, AA, AA, A, A, A, A), WIKA (AA, AA, AA, AA, AA, AA, AA, A, A, A) in sequence. It can be concluded that the huge
injected capital and huge national projects given by the Indonesian government, give a negative impact to financial performance
and health condition of the Indonesian SOEs in construction and property industry. This reflected from the decreasing
performance and health condition of the Indonesian SOEs in period 2014-2018 compared to period 2009-2013. Therefore, the
respondent companies should increase their profit by conducting an operational efficiency, create a better collection method and
manage their cashflow prudently.
REFERENCES
Alexander, G. J., and Rogene A. Buchholz (1978) “Corporate social responsibility and stock market performance.”Academy of
Management Journal, 21 (3): 479-486.
Annual Reports 2011 – 2015 of PT. Adhi Karya (Persero) Tbk, Consolidated Financial Statements with Independent Auditors’
Report years ended December 31, 2009 – 2018.
Annual Reports 2011 – 2015 of PT. Pembangunan Perumahan (Persero) Tbk, Consolidated Financial Statements with
Independent Auditors’ Report years ended December 31, 2009 – 2018.
Annual Reports 2011 – 2015 of PT. Waskita Karya (Persero) Tbk, Consolidated Financial Statements with Independent
Auditors’ Report years ended December 31, 2009 – 2018.
Annual Reports 2011 – 2015 of PT. Wijaya Karya (Persero) Tbk, Consolidated Financial Statements with Independent
Auditors’ Report years ended December 31, 2009 – 2018.
Anthony, R. N., Hawkins, David F., Merchant & Kenneth A., (2011). Accounting: Text and Cases 13th Ed, New York NY,
McGraw Hill.
Barnes, P. (1987). The Analysis and Use of Financial Ratios: A Review Article. Journal of Business Finance and Accounting, 14
(4).
Damodaran, A. (2015). Appllied Corporate Finance 4th Ed, Hoboken, NJ, Wiley.
Daryanto, W. M. (2017). Jurnal Ilmiah Manajemen dan Bisnis, Vol. 3 No. 1:108-126.
Daryanto, Wiwiek M. (2017). Financial Performance Analysis and Evaluation of Palm Oil Agroindustry: An Indonesia
Experience. Jurnal Ilmiah Manajemen dan Bisnis. Vol. 3, Nomor 1, Maret 2017. ISSN 2460 8424, pp 108-126.
Daryanto, W..M, Samidi, S. (2018). Measuring The Financial Performance Of Enterprises Under Ministry Of Energy And
Mineral Resources (Emr): An Indonesia Experience. International Journal of Engineering & Technology, 7 (3.21) (2018)
16-23.
Daryanto, W.M. (2018). Financial Performance Measurement Of State-Owned Enterprises Under Aviation To Support Visit
Wonderful 2018 In Indonesia : International Journal of Business, Economics and Law, Vol. 16, Issue 1 (August) ISSN
2289-1552.
Daryanto, W.M. (2018). Measuring Financial Performance Of Cement Industry During Infrastructure Development In Indonesia
: South East Asia Journal of Contemporary Business, Economics and Law, Vol. 16, Issue 1(August) ISSN 2289-1560.
Daryanto, Wiwiek M., Samidi S. (2018). Measuring the Financial Performance of Enterprises Under Ministry of Energy and
Mineral Resources (EMR) an Indonesia Experience. International Journal of Engineering & Technology, 7 (3.21): 16-23.
Dietrich, J. (1996). Financial Services and Financial Institutions: Value Creation in Theory and Practice Prentice Hall.
Edmister, R.O. (1972). An empirical test of financial ratio analysis for small business failure prediction. Journal of Financial and
Quantitative Analysis, 7(2), 1477-1493.
Foulke, R. (1968). Practical Financial Statement Analysis, 6th Ed., McGraw-Hill, New York.
Gitman, L. J., Zutter, Chad J. (2015). Principles of Managerial Finance14 th, Upper Saddle River, NJ, Pearson.
Harahap, S.S. (2002). Analisa Kritis Atas Laporan Keuangan, Jakarta : PT. Raja Grafindo.
Helfert, E.A. (1997). Techniques of Financial Analysis 9 th Ed, New York NY, McGraw-Hill.Higgins, R. C. 2000. Analysis for
Financial Management 6th Ed, The University of Washington, Irwin McGraw-Hill.
Kementerian Badan Usaha Milik Negara. Salinan Keputusan Menteri Badan Usaha Milik Negara Nomor : KEP-100/MBU/2002.
Retrivied on 30 November 2016 from http://www.bumn.go.id/on.
Kumbirai, M., Webb, R. (2010). A Financial Ratio Analysis of Commercial Bank Performance in South Africa. African Review
of Economics and Finance 2 (1), pp 30-53.
Lacewell, S., K. (2003). “Do Efficient Institutions Score Well Using Ratio Analysis? An Examination Of Commercial
Banks in The 1990s”. Journal of Commercial Banking and Finance 2, pp 17-33.
Lan, Joe. (2012). 16 Financial Ratios for Analyzing a Company’s Strengths and Weaknesses. Retrieved from
http://www.aaii.com/journal/article/16-financial-ratios-for-analyzing-a-companys-strengths-and-weaknesses.touch.
Lin, J.-H., Lii P.-C, Huang F. and Chen,S. (2019). Cross-Border Lending, Government Capital Injection and Bank Performance.
International Journal of Financial Studies, 7 (21).
McGuire, J. B., A. Sundgren, and T. Schneeweis (1988) “Corporate social responsibility and firm financial performance.”
Academy of Management Journal, 31 (4): 854- 872.
Megaladevi, P. (2015). A study on financial performance analysis of the selected paper company with special reference to Tamil
Nadu Newsprint and papers limited.International Journal of Recent Research Aspects, 2(4), 22-24.
Perdana, A.S. (2018). Financial Performance Evaluation And Correlation Of Selected Key Financial Ratio And Stock Price: A
Case Study Of Indonesia LQ 45 State Owned Enterprises Construction Companies. Master of Business Administration
Program School of Business Management Institut Teknologi Bandung.
Pratama, Sasotya. (2017). Measuring Financial Performance of PT. Pos Indonesia during The E-Commerce Booming. Ipmi
International Journal of Business Studies 1 (1), 29-37.
International Journal of Business, Economics and Law, Vol. 19, Issue 1 (August)
ISSN 2289-1552 2019
17
Ross, S., Randolph W. (2018). Fundamentals of Corporate Finance, 11th Edition. New York NY, McGraw Hill.
Sinkey, J. (2002). Commercial Bank Financial Management: In the Financial-Services Industry 6th Edition Prentice Hall, Upper
Saddle River, NJ.
Tarawneh, M. (2006). A Comparison of Financial Performance in the Banking Sector: Some Evidence from Omani Commercial
Banks. InternationalResearch Journal of Finance and Economics 3, pp 103-112.
Vance, S. C.(1975) “Are socially responsible corporations good investment risks?” Management Review, 64: 18-24.
Waddock, S. A., and Samuel B. Graves (1997) “The corporate social performance- financial performance link.” Strategic
Management Journal, 18 (4): 303-319.
Webb, R.M. (2003). Levels of efficiency in UK retail banks: a DEA window analysis. International Journal of the Economics of
Business Vol 10 (3), pp 305-322.
Webb, R., Kumbirai, M. (2010). A financial Ratio Analysis of Commercial Bank Performance in South Africa. African Review
of Economics and Finance, Vol. 2, No. 1.
William, B. (2002). The Four Pillars of Investing. New York NY, McGraw Hill. Fess, W. (2005). Accounting 21 st Ed, Thomson
Corporation. SouthWestern.
Yeh, Q-J (1996). Application of Data Envelopment Analysis in Conjunction with Financial Ratios for Bank Performance
Evaluation. JORS 47(8): 980-988.
Yoo, J. (2017). Capital Injection to Banks Versus Debt Relief to Households. International Journal of Central Banking. Vol. 13
No. 3.
Fransiscus X John Brazer
School of Business and Management
Institut Teknologi Bandung,
12950, Jakarta, Indonesia
Email: [email protected]
Wiwiek Mardawiyah Daryanto
Sekolah Tinggi Manajemen IPMI,
Jakarta, 12750, Jakarta, Indonesia
Email: [email protected],
Related Documents