Resources to Reserves Oil & Gas Technologies for the Energy Markets of the Future INTERNATIONAL ENERGY AGENCY

Welcome message from author
This document is posted to help you gain knowledge. Please leave a comment to let me know what you think about it! Share it to your friends and learn new things together.
Transcript

Resourcesto
ReservesOil & Gas Technologies
for the Energy Marketsof the Future
INTERNATIONALENERGY AGENCY

INTERNATIONALENERGY AGENCY
Resourcesto
ReservesOil & Gas Technologies
for the Energy Marketsof the Future

INTERNATIONAL ENERGY AGENCY
The International Energy Agency (IEA) is an autonomous body which was established inNovember 1974 within the framework of the Organisation for Economic Co-operation andDevelopment (OECD) to implement an international energy programme.
It carries out a comprehensive programme of energy co-operation among twenty-six of theOECD’s thirty member countries. The basic aims of the IEA are:
• to maintain and improve systems for coping with oil supply disruptions;• to promote rational energy policies in a global context through co-operative relations with
non-member countries, industry and international organisations;• to operate a permanent information system on the international oil market;• to improve the world’s energy supply and demand structure by developing alternative
energy sources and increasing the efficiency of energy use;• to assist in the integration of environmental and energy policies.
The IEA member countries are: Australia, Austria, Belgium, Canada, the Czech Republic,Denmark, Finland, France, Germany, Greece, Hungary, Ireland, Italy, Japan, the Republic ofKorea, Luxembourg, the Netherlands, New Zealand, Norway, Portugal, Spain, Sweden,Switzerland, Turkey, the United Kingdom, the United States. The European Commission takespart in the work of the IEA.
ORGANISATION FOR ECONOMIC CO-OPERATION AND DEVELOPMENT
The OECD is a unique forum where the governments of thirty democracies work together toaddress the economic, social and environmental challenges of globalisation. The OECD is alsoat the forefront of efforts to understand and to help governments respond to new developmentsand concerns, such as corporate governance, the information economy and the challenges ofan ageing population. The Organisation provides a setting where governments can comparepolicy experiences, seek answers to common problems, identify good practice and work to co-ordinate domestic and international policies.
The OECD member countries are: Australia, Austria, Belgium, Canada, the Czech Republic,Denmark, Finland, France, Germany, Greece, Hungary, Iceland, Ireland, Italy, Japan, Korea,Luxembourg, Mexico, the Netherlands, New Zealand, Norway, Poland, Portugal, the SlovakRepublic, Spain, Sweden, Switzerland, Turkey, the United Kingdom and the United States.The European Commission takes part in the work of the OECD.
© OECD/IEA, 2005
No reproduction, copy, transmission or translation of this publication may be madewithout written permission. Applications should be sent to:
International Energy Agency (IEA), Head of Publications Service,9 rue de la Fédération, 75739 Paris Cedex 15, France.

FOREWORD
Soaring oil prices have again spotlighted the old question. Are we running out ofoil? The doomsayers are again conveying grim messages through the front pagesof major newspapers. “Peak oil” is now part of the general public's vocabulary,along with the notion that oil production may have peaked already, heralding aperiod of inevitable decline.
The IEA has long maintained that none of this is a cause for concern. Hydrocarbonresources around the world are abundant and will easily fuel the world throughits transition to a sustainable energy future. What is badly needed, however, iscapital investment in projects to unlock new hydrocarbon resources, be theynon-conventional, or in deepwater offshore locations, or in countries wheregeopolitical factors have restricted investment. While today's high oil prices havenow started to mobilise capital, the entire supply chain in the upstream oil andgas industry is nevertheless stretched after years of low investment. Since newprojects take several years to materialise, high oil prices may be with us forseveral years to come.
Technological progress has always been the key factor to prove the doomsayerswrong. We expect that technology will once again drive costs down, providingmore attractive returns for investors. Technology will enable new resources to bedeveloped cost-effectively and it will accelerate implementation of new projects.
This book reviews current and future technology trends in the upstream oil andgas industry. It confirms that exciting innovations are on the horizon, with thepotential to fulfill expectations of secure energy supplies in an expanding worldeconomy, but also to mitigate fossil fuels' impact on the global climate. Ithighlights how governments can help create the conditions for technology todeliver its promises.
It is our hope that this publication will make a significant contribution tobroadening knowledge of the scene behind the petrol pumps and pipelines andinform the ongoing debate on the future of worldwide energy supply.
Claude Mandil
Executive Director
FOREWORD 3


ACKNOWLEDGEMENTS
The lead author of this book was Christian Besson, working within a broad,collective effort drawing on extensive input from many colleagues at the IEA andexperts around the globe.
At the IEA, Antonio Pflüger, Head of the Energy Technology CollaborationDivision, provided the driving force behind this project. The work of Dolf Gielenon the IEA Energy Technology Perspectives model provided the basis for someof the material in Chapter 7. He himself participated in numerous helpfuldiscussions. Fatih Birol, Neil Hirst, Jacek Podkanski and Fridtjof Unander providedvery useful comments.
Jostein Dahl Karlsen, Chair of the IEA Advisory Group on Oil and Gas Technology,supported the project from the outset, providing access to key data and contacts.The IEA Working Party on Fossil Fuels and the IEA Committee on Energy Researchand Technology also provided invaluable support.
Any attempt to cite all the experts who contributed input and advice is boundto fail. We gratefully acknowledge the guidance of the following experts andapologise to those we have missed: Thomas Ahlbrandt (USGS), Takashi Amano(Mitsubishi Heavy Industry), Tor Austad (University of Stavanger), MondherBenHassine (NRCan), Stephen Cassiani (ExxonMobil), Paul Ching (Shell), ThorkilChristensen (Danish Maritime), Jim Clarke (BP), Scott Dallimore (NRCan),Maurice Dusseault (University of Waterloo), Anna-Inger Eide (NorwegianPetroleum Directorate) and her colleagues at NPD, Carol Fairbrother (NRCan),Lenn Flint (Lenef Consulting), Marc Florette (Gaz de France), Peter Gerling (BGR,German Institute for Geosciences), Per Gerhard Grini (Statoil), François Kalaydjan(IFP), Fritz Krusen (ConocoPhilips), Fikri Kuchuk (Schlumberger), Oh Yoon Kwon(Korean Ship Builders Association), Rick Marsh (Alberta Energy Utilities Board),Alain Morash (Total), Rod Nelson (Schlumberger), Rolf Ødegaard (Statoil), KentPerry (GTI), Danny Scorpecci (OECD), David Sweet (ILNGA) and Brad Wark (NRCan).
The lead author takes sole responsibility for any possible errors or omissions, inspite of all these important contributions.
The manuscript was skilfully edited by Mary Harries White and the layoutprepared by Corinne Hayworth. Special thanks are due to Corinne and toBertrand Sadin, who brilliantly handled the difficult task of preparing all the manyillustrations.
Comments and questions should be addressed to [email protected].
ACKNOWLEDGEMENTS 5


TABLE OF CONTENTS
Executive Summary . . . . . . . . . . . . . . . . . . . . . . . . . . . . . . . . . . . . . . .13
Introduction . . . . . . . . . . . . . . . . . . . . . . . . . . . . . . . . . . . . . . . . . . . .19
Chapter 1. Setting the Scene . . . . . . . . . . . . . . . . . . . . . . . . . . . . .23
Demand for oil and gas 23
Resources and reserves 24
Geographical distribution 29
Oil and gas transport 31
Structure of the oil and gas industry 31
Research and development 33
The role of technology 35
Chapter 2. “Conventional” Oil and Gas . . . . . . . . . . . . . . . . . . . . .41
OPEC Middle East 43
Other regions 45
Improved recovery 51
What is recovery? 51Trends 51
By-passed oil 53Residual oil 58
Recovery in carbonate reservoirs 61Summary on improved oil recovery 62
New conventional resources: deepwater, Arctic, deep reservoirs 65
Deepwater 66Arctic 71Super-deep reservoirs 73
Chapter 3. Non-Conventional Oil Resources:Heavy Oil, Bitumen, Oil Sands, Oil Shales . . . . . . . . . . .75
Heavy oil, bitumen and oil sands 75
Oil shales 82
Chapter 4. Non-Conventional Gas Resources andMethane Hydrates . . . . . . . . . . . . . . . . . . . . . . . . . . . .85
Non-conventional gas 85
Coal bed methane 85Tight gas 88
Methane hydrates: resources for the long-term future? 89
TABLE OF CONTENTS 7

8 OIL AND GAS TECHNOLOGIES FOR THE ENERGY MARKETS OF THE FUTURE
Chapter 5. Transportation . . . . . . . . . . . . . . . . . . . . . . . . . . . . . . .93
Gas transportation 93
Traditional transport chains: pipelines and liquefied natural gas 93Emerging options 96
Oil and gas shipping bottlenecks 101
Chapter 6. Environment and Safety . . . . . . . . . . . . . . . . . . . . . . .103
Environmental footprint 103
CO2 and climate change 108
Security and safety 108
Chapter 7. Getting on Track . . . . . . . . . . . . . . . . . . . . . . . . . . . . .109
Modelling future technology trends 109
Impact of technology on future supply 110
The role of governments 117
Key conclusions 118
References . . . . . . . . . . . . . . . . . . . . . . . . . . . . . . . . . . . . . . . . . . . .121
List of Boxes
Box 1 • “Conventional” and “non-conventional” 26
Box 2 • Peak oil 38
Box 3 • Russia and Former Soviet Union (FSU) countries 46
Box 4 • 4D seismic surveys 54
Box 5 • Electromagnetic surveys 55
Box 6 • Cross-well surveys 55
Box 7 • Behind-casing logging 56
Box 8 • Re-entry drilling, multilaterals, coiled tubing drilling 56
Box 9 • Chemical enhanced oil recovery 58
Box 10 • Microbial enhanced oil recovery 61
Box 11 • United States Geological Survey resources estimates 63
Box 12 • The IEA Implementing Agreement on Enhanced Oil Recovery 65
Box 13 • The IEA Implementing Agreement on Multiphase Flow Sciences 69
Box 14 • Steam assisted gravity drainage 80
Box 15 • Gas-to-liquids basics 97
Box 16 • Flaring: a special case of stranded gas 99
Box 17 • An example of modern development – Wytch Farm 106
Box 18 • An example of modern development – the Europipe gas pipeline landing 107
Box 19 • Cost curves and learning curves 113
List of figures
Figure ES.1 • Oil cost curve, including technological progress 17
Figure 0.1 • Cumulative global oil investment needs, 2003-2030 20
Figure 0.2 • Cumulative natural gas investment needs, 2003-2030 20
Figure 1.1 • World primary energy demand over time in IEA Reference Scenario 23
Figure 1.2 • Percentage share of transport in global oil demand,percentage share of oil in transport energy demand 23
Figure 1.3 • Example of cores of oil-bearing rock 24
Figure 1.4 • Typical oil- or gas-bearing sedimentary layers 24
Figure 1.5 • World hydrocarbon resources 25
Figure 1.6 • Classification of hydrocarbon resources 27
Figure 1.7 • Crude oil and NGL reserves at end-2003 28
Figure 1.8 • Evolution of proven oil reserves as a function of time 29
Figure 1.9 • World proven reserves of natural gas 29
Figure 1.10 • Distribution of proven reserves of conventional oil 30
Figure 1.11 • OPEC and OPEC Middle East percentage shares of world oil supply 30
CHAPTER 1 • SETTING THE SCENE 9
10 OIL AND GAS TECHNOLOGIES FOR THE ENERGY MARKETS OF THE FUTURE
Figure 1.12 • Oil flows and major chokepoints, 2003 31
Figure 1.13 • Public oil and gas upstream R&D spending 33
Figure 1.14 • R&D spending of major companies 34
Figure 1.15 • From a wooden shack … 35
Figure 1.16 • … to a North Sea offshore platform 35
Figure 1.17 • From paper to immersive 3D 36
Figure 1.18 • From wooden pipeline … 36
Figure 1.19 • … to liquefied natural gas carriers 36
Figure 1.20 • Impact of technology on production from the North Sea 37
Figure 1.21 • Theoretical shape of amount of oil discovered as a function of time 38
Figure 1.22 • Annual oil discoveries and production for USA Lower 48 39
Figure 2.1 • World oil production by source 41
Figure 2.2 • ExxonMobil's production projections 41
Figure 2.3 • World ultimately recoverable conventional oil 42
Figure 2.4 • World ultimately recoverable conventional gas 43
Figure 2.5 • Technology impact on costs for offshore USA 45
Figure 2.6 • Example of conventional well construction 48
Figure 2.7 • Sketch of casing being expanded by an expanding tool 49
Figure 2.8 • New equipment for integrated completion services 50
Figure 2.9 • Un-recovered oil left over in United States fields 52
Figure 2.10 • Evolution of expected recovery factor in Norway 52
Figure 2.11 • By-passed oil 53
Figure 2.12 • 3D seismic picture of fluvial sediments 3 000 metres below ground 54
Figure 2.13 • Schematics of multilateral wells 57
Figure 2.14 • Coiled tubing unit 57
Figure 2.15 • Residual oil left in small pores after water has displaced the oil from large pores 59
Figure 2.16 • Trend in injecting hydrocarbon gas for enhanced oil recovery in Norway 60
Figure 2.17 • Estimated cost of various enhanced oil recovery methods 62
Figure 2.18 • United States Geological Survey reserve growth function 64
Figure 2.19 • World ultimately recoverable conventional oil, with breakdownof undiscovered oil and addition of enhanced oil recovery 65
Figure 2.20 • Future oil and gas deepwater potential in the world 66
Figure 2.21 • Evolution of deepwater technology 67
Figure 2.22 • Key technology challenges for deepwater and ultra-deepwater 68
Figure 2.23 • Evolving deepwater operations, from large surface facilitiesto subsea technologies 69
Figure 2.24 • Cost impact of evolving offshore technology in the Norwegian sectorof the North Sea 70
Figure 2.25 • Impact of technology in making smaller hydrocarbon accumulations economical 70
Figure 2.26 • Share of Arctic in undiscovered oil and gas resources 71

Figure 2.27 • Arctic hazards 72
Figure 2.28 • New transport solutions for Arctic seas 72
Figure 2.29 • Estimates of hydrocarbon resources as a function of burial depth 73
Figure 2.30 • Map of sediment thickness 74
Figure 3.1 • Heavy oil resources in the world 76
Figure 3.2 • Oil sands outcrop in Canada 76
Figure 3.3 • Oil production costs from Canadian oil sands 77
Figure 3.4 • Schematic representation of steam assisted gravity drainage 80
Figure 3.5 • Schematic representation of steam assisted gravity drainage – cross-section 81
Figure 3.6 • Distribution of oil shales around the world 82
Figure 3.7 • Cost structure for Stuart Shale project proposal, Australia 83
Figure 4.1 • Coal bed methane gas production in the United States 86
Figure 4.2 • United States coal bed methane resources 87
Figure 4.3 • Methane hydrate ice-like structure 89
Figure 4.4 • Hydrates existence domain as a function of pressure and temperature 89
Figure 4.5 • Map of confirmed methane hydrate presence 90
Figure 5.1 • New offshore re-gasification technology 94
Figure 5.2 • Reduction in pipeline transportation costs over time 95
Figure 5.3 • Composite reinforced line pipe 95
Figure 5.4 • Evolution of capital costs of gas-to-liquids plants 98
Figure 5.5 • Prototype small-scale gas-to-liquids plant 98
Figure 5.6 • Estimates of amounts of flared gas 100
Figure 5.7 • Applicability of various gas transport technologies 101
Figure 6.1 • Oil production 1920s-style in the oil fields of Baku, Azerbaijan 103
Figure 6.2 • Oil production facility in the 1990s - the Wytch Farm field, United Kingdom 104
Figure 6.3 • Trends in key environmental impact indicators 105
Figure 6.4 • Tapping larger volumes of reservoir with a smaller surface footprint in Alaska 106
Figure 6.5 • Decreasing drill-site footprints in Alaska 107
Figure 7.1 • Oil cost curve, including technological progress 112
Figure 7.2 • Oil cost curve, alternative presentation 112
Figure 7.3 • Incremental costs of finding, developing, and producing new oil and gasresources in the United States 113
Figure 7.4 • Oil, gas and coal cost curves from Rogner 115
Figure 7.5 • Non-conventional oil cost curves from Greene 115
Figure 7.6 • Canadian oil sands learning curves 116
CHAPTER 1 • SETTING THE SCENE 11


EXECUTIVE SUMMARY
Over the coming decades, the world will continue to rely heavily on large-scalesupplies of oil and gas. According to demand projections from the IEA WorldEnergy Outlook (WEO) Reference Scenario, the share of these two fuels in theworld energy fuel mix will actually increase from around 57% in 2002 to some60% in 2030, if energy policies worldwide do not change.
As a result, demand for oil and gas will expand by nearly 70% over thesethree decades. Even if governments took more vigorous steps to addressenvironmental and energy-security concerns, as modelled in the IEA World EnergyOutlook's Alternative Scenario, worldwide demand for oil would be only 11%lower than under the IEA Reference Scenario's projections, and demand for gasonly 10% lower. In addition, as output from the world's existing productionsources inevitably declines, probably at a rate around 5% per year, this decline willneed to be compensated with new supplies.
The hydrocarbon resources in place around the world are sufficiently abundantto sustain likely growth in the global energy system for the foreseeable future.But keeping pace with today's demand growth projections will oblige thehydrocarbon industry to take on a new, diverse set of business and technologicalchallenges. This is largely because it will be more technically demanding todevelop remaining world oil and gas resources and bring them to markets thanwas the case for previous output.
Ensuring the right conditions for sustained and accelerated technologicalprogress in the oil and gas upstream sector will be a key factor for success insecuring global security of supply for all countries.
The purpose of this book is to:
■ Review future needs for technological advances to meet the challenges facingthe hydrocarbon industry in the 21st century.
■ Discuss embedded policy implications.
■ Measure the impact that technological progress can be expected to have ontomorrow's hydrocarbon resources availability.
The big challenges for the future
Measured in units of oil equivalent, roughly 10 trillion barrels of conventional oiland gas are in place, and at least as much non-conventional oil and gas. Out ofthese 20 trillion barrels of oil equivalent (boe), 5 to 10 trillion can be consideredtechnically, but not necessarily economically, recoverable, depending on recoveryrates, technological progress and long-term price assumptions.
EXECUTIVE SUMMARY 13
14 RESOURCES TO RESERVES
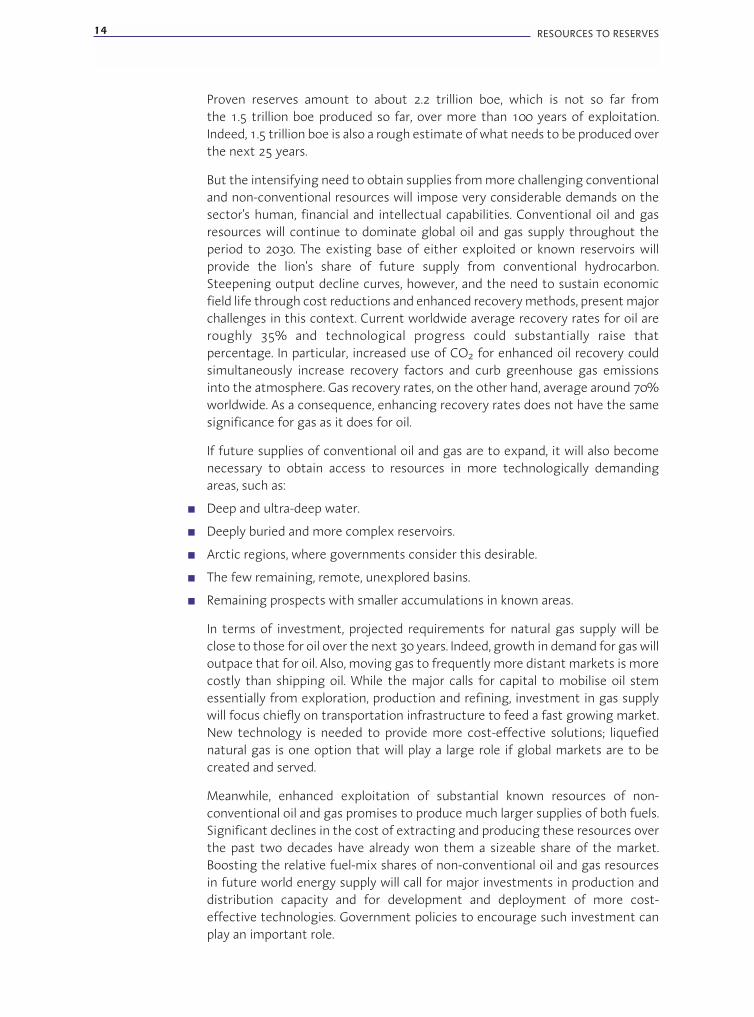
Proven reserves amount to about 2.2 trillion boe, which is not so far fromthe 1.5 trillion boe produced so far, over more than 100 years of exploitation.Indeed, 1.5 trillion boe is also a rough estimate of what needs to be produced overthe next 25 years.
But the intensifying need to obtain supplies from more challenging conventionaland non-conventional resources will impose very considerable demands on thesector's human, financial and intellectual capabilities. Conventional oil and gasresources will continue to dominate global oil and gas supply throughout theperiod to 2030. The existing base of either exploited or known reservoirs willprovide the lion's share of future supply from conventional hydrocarbon.Steepening output decline curves, however, and the need to sustain economicfield life through cost reductions and enhanced recovery methods, present majorchallenges in this context. Current worldwide average recovery rates for oil areroughly 35% and technological progress could substantially raise thatpercentage. In particular, increased use of CO2 for enhanced oil recovery couldsimultaneously increase recovery factors and curb greenhouse gas emissionsinto the atmosphere. Gas recovery rates, on the other hand, average around 70%worldwide. As a consequence, enhancing recovery rates does not have the samesignificance for gas as it does for oil.
If future supplies of conventional oil and gas are to expand, it will also becomenecessary to obtain access to resources in more technologically demandingareas, such as:
■ Deep and ultra-deep water.
■ Deeply buried and more complex reservoirs.
■ Arctic regions, where governments consider this desirable.
■ The few remaining, remote, unexplored basins.
■ Remaining prospects with smaller accumulations in known areas.
In terms of investment, projected requirements for natural gas supply will beclose to those for oil over the next 30 years. Indeed, growth in demand for gas willoutpace that for oil. Also, moving gas to frequently more distant markets is morecostly than shipping oil. While the major calls for capital to mobilise oil stemessentially from exploration, production and refining, investment in gas supplywill focus chiefly on transportation infrastructure to feed a fast growing market.New technology is needed to provide more cost-effective solutions; liquefiednatural gas is one option that will play a large role if global markets are to becreated and served.
Meanwhile, enhanced exploitation of substantial known resources of non-conventional oil and gas promises to produce much larger supplies of both fuels.Significant declines in the cost of extracting and producing these resources overthe past two decades have already won them a sizeable share of the market.Boosting the relative fuel-mix shares of non-conventional oil and gas resourcesin future world energy supply will call for major investments in production anddistribution capacity and for development and deployment of more cost-effective technologies. Government policies to encourage such investment canplay an important role.
Given the broad span of challenges, expanding the global supply from bothconventional and non-conventional resources will thus demand importantadvances in key technologies and the related science base to foster:
■ Industry's technical capability to expand and meet projected needs.
■ Further reductions in recovery costs.
■ Successful handling of more challenging economics and greater investment risk.
Focus of the study
This study takes a detailed look at what kind of technological progress is requiredto underpin future oil and gas supply. The question is examined in terms of coretechnology, but also in terms of the role to be played by industry, scientificresearch, academia and governments in furthering technological progress in theindustry.
The following technology areas are highlighted as central to ensuring futuresupplies.
■ Improved ability to characterise reservoir heterogeneities and to image fluidmovements, particularly in large carbonate reservoirs.
■ Low-cost wells.
■ A range of information technology-based, intelligent “e-field” systems allowingreal-time management of reservoirs.
■ A more streamlined, standardised, “assembly-line” approach to all operations inoil and gas fields.
■ Renewed emphasis on better-performing enhanced oil recovery techniques,including the use of CO2 to combine oil recovery with climate-change mitigation.
■ Improving deepwater technologies to secure viability at a water depth of up tosome 4 000 metres.
■ Technologies for safe and environmentally sound operations in Arctic regions.
■ Technologies for economical production of non-conventional resources, inparticular heavy oils, bitumen, oil shales and non-conventional gas.
■ Technologies to minimise the environmental footprint of all oil and gasoperations.
■ Technologies and actions to ease shipping bottlenecks.
■ Technologies that reinforce the safety of installations.
Major ongoing industrial developments in each of these areas are explored andsummarised.
EXECUTIVE SUMMARY 15
16 RESOURCES TO RESERVES
Key conclusions and recommendations
The key problem is not the limit of geological resources. The overriding questionstoday revolve around the technologies, prices and policies that will make the world'svast resources economically recoverable and turn them into proven reserves.
First, it will be necessary to mobilise some very large-scale investments, estimatedat some USD 5 trillion over the coming three decades1. Then a widespread anddetermined R&D effort will be needed to bring in the technologies required.Industry clearly has the means, capabilities and incentives to perform the requiredR&D. Measures encouraging that effort would be beneficial. Public policy can playa key role in numerous ways, notably by focusing on the following:
■ Providing a framework favourable to investment in new resources, includingappropriate licensing, taxation, royalties and support for demonstration projects.Experience has shown that these can be instrumental in catalysing thetechnology learning required to make non-conventional resources competitive.
■ Providing a policy climate that ensures continued active co-operation betweentechnology developers in IEA countries and hydrocarbon resources holders inOPEC countries.
■ Taking the lead in promoting technology development and facilitatinginvestments that can reduce shipping bottlenecks.
■ Actively participating in developing and facilitating the implementation oftechnologies that improve the safety of installations.
■ Ensuring that CO2 emissions reduction is given sufficient value to foster morewidespread CO2 enhanced oil recovery (EOR) and thus higher recovery rates.
■ Supporting basic science in the biology and ecology of subsurface bacterialsystems, since this can trigger breakthroughs in use of biotechnologies toenhance recovery or to transform heavy hydrocarbons.
■ Vigilantly supporting industry's efforts to reduce its environmental footprint andthus to access resources in new areas.
■ Continuing to spearhead science and technology advances linked to futureexploitation of methane hydrate deposits, while ensuring strong industryparticipation. These resources are potentially very important to long-term supplybut currently too far off for sole reliance on industry contributions.
From discussions with industry experts on the impact of future technologies, ashared perspective has emerged on the future availability of various types ofresource, as a function of oil prices, but also taking into account likely technologicalprogress. This perspective is expressed graphically in Figure ES.1. It shows thevarious oil prices (Brent) at which the exploitation of various volumes of differentresources becomes an economical option. The cost of capture and storage of CO2produced during the extraction of non-conventional oils is taken into account.
1. Projected oil and gas investment requirements are not discussed at any length in this study. This figure of USD 5 trillion for worldwide
upstream operations and transportation comes from analyses in the IEA World Energy Outlook 2004.

EXECUTIVE SUMMARY 17
Currently, most companies base their investment decisions on a long-term priceof USD 20 to USD 25 per barrel. The graph suggests that accepting a long-termprice of, for example, USD 30/barrel would make an appreciable difference to theeconomic recoverability of large amounts of oil.
The analysis here focuses only on oil, for which extraction represents thedominant cost. Where gas is concerned, reserves are plentiful and the economicsare dominated by the cost of transportation. Development of liquefied naturalgas and other transportation technologies will determine the future supplyequation.
Figure ES.1 • Oil cost curve, including technological progress:availability of oil resources as a function of economic price
0
10
20
30
40
50
60
70
80
0 1000 2000 3000 4000 5000 6000Available oil in billion barrels
Include CO mitigation costs2
(to make CO neutral compared to conventional)2
Econ
omic
pric
e20
04(U
SD)
Alreadyproduced
WEO requiredcumulative
need to 2030Arctic
Deep water
Super deep
EOR
Otherconv. oilOPEC
ME
Oilshales
Heavy oilBitumen
The x axis represents cumulative accessible oil. The y axis represents the price atwhich each type of resource becomes economical.
Source: IEA.

INTRODUCTION
Oil and gas will continue to play a key role in energy supply for IEA countries andthe world at large throughout the first half of this century. This is the consensusview held by numerous studies on prospective energy markets, including the IEAWorld Energy Outlook (WEO). Their predictions assume the oil and gas industry'scontinuing ability to deliver hydrocarbons in the quantities required under thevarious price scenarios used in each study. Although different models usedifferent methodologies, their common assumption is essentially based, in turn,on extrapolation of the industry's track-record in expanding reserves, recoveryand production.
Sustaining such production trends, however, depends on three key factors.
■ Sufficient capital investment in exploration, wells, production facilities,transportation, processing plants, refineries. The importance of such capitalinvestment has been stressed in various IEA publications over recent years, asillustrated in Figures 0.1 and 0.2 (next page).
■ Sufficient skilled human resources. This is a major challenge for the industry ingeneral. Various downsizing exercises carried out by major oil companies overthe past 20 years have distorted the industry's age pyramid and manyprofessionals will reach retirement age in the next 10 years. The industry's imagetends to make it less attractive for young, educated people than other “greener”industries, particularly in IEA countries. At the same time, due to shifts ofproduction from industrialised to developing countries and the legitimate wishto favour the local work force in such countries, it is now becoming urgent totrain large numbers of young professionals from many different nations. Providingadequate skilled staff is a well known challenge in industry management circlesand one that is being addressed, in part, by various players.
While this topic is not discussed in this study, it is nevertheless worth stressingthat attracting and training enough skilled professionals are going to be crucialto security of supply in a scenario where oil and gas remain a large component inenergy use in IEA countries.
■ Continuing technological progress. Most projections assume various levels ofsustained improvement in technologies to expand recoverable reserves in knownfields or to develop new, more challenging fields. Projections are based heavily onextrapolating past industry trends. There are three reasons, however, why suchassumptions may need to be re-examined.
● As the industry moves on to more and more “difficult” oil and gas deposits,the pace of technological progress will need to accelerate significantly if pastproduction trends are to be maintained.
● Although technological advances appear to be continuous when averagedover time, such advances actually come in discrete steps as successivenew techniques are deployed. There is no guarantee that the required keytechnologies will actually emerge in time to make new supplies available inthe way that the models project.
INTRODUCTION 19

20 RESOURCES TO RESERVES
● Technological progress also needs investment; and long lead times are ofteninvolved. Wide price fluctuations over the past 25 years have led to relativelymodest investments in research and development (R&D) in the oil and gasindustry. These investments tend to be postponed in the absence of a stableplanning horizon, thus undermining the industry's ability to assure sustainedproduction in the required timescales. Indeed, it can be argued that some ofthe impressive technical progress seen in the oil and gas industry during the1990s was the result of high R&D spending at the end of the 1970s and early1980s, and that reduced R&D expenditures in the 1990s may have already“locked-in” a period of slower progress.
Figure 0.1 • Cumulative global oil investment needs, 2003-2030
0 100 200 300 400 500 600 700 800
Tankers and pipelines
Other transition economies
Developing Asia
Latin America
Other OECD
Russia
Africa
Middle East
United States and Canada
USD billion in year 2000
Exploration anddevelopment
Non-conventionaloil
Refining
Source: WEO-2004, IEA.
Figure 0.2 • Cumulative natural gas investment needs, 2003-2030
0 100 200 300 400 500 600 700 800
United States and Canada
Other OECD
Russia
Other developing Asia
Middle East
Latin America
Africa
Other transition economies
China
Shipping
USD billion in year 2000
Upstream
Downstream
Source: WEO-2004, IEA.

INTRODUCTION 21
Ensuring the conditions for continuing rapid technological progress in the oil andgas industry is therefore a key requirement for security of supply in IEA countries.
The oil and gas “upstream” industry (exploration, production and transport)involves a vast number of technologies, each of them constantly evolving. It is ofcourse far beyond the scope of this book to attempt any discussion of the futureevolution of each of the very numerous technologies involved. Large numbers ofexisting specialised publications take up this subject in relation to the variousbranches of the industry. Our focus here is rather on the impact of key areas oftechnology on future security of supply.
Picking those areas, of course, means making choices in the face of muchuncertainty. Past history has shown that the oil and gas industry is very activein pushing the technology envelope but also relatively risk adverse. As a result,changes take time. The R&D teams of the key industry players are alreadyworking on the technologies that are likely to bring major change to the industrybefore 2030. There are few surprises in store. Nevertheless, picking thetechnologies most likely to succeed offers plenty of scope for error. If they wereasked to identify the key technologies that have brought change to the oil andgas industry over the past 25 years, most observers would point to 3D seismicand horizontal wells. But a glance through technical journals from 25 years ago(1980) reveals that, while 3D seismic and horizontal wells were indeed on thehorizon, much R&D investment was going to chemical enhanced oil recoverytechniques, or to exploitation of oil shales, from which essentially no commercialimpact has resulted to this day. Readers may wish to keep uncertainties such asthis in mind.


Chapter 1 • SETTING THE SCENE
Demand for oil and gas
The past century has seen a steadily growing role for oil and gas in fuellingdevelopment around the globe. All the studies on energy's future tell us that oiland gas will remain dominant in world energy supply well into this century. TheIEA World Energy Outlook (IEA WEO-2004) projects that, without new energy andenvironmental policies, demand for oil will continue to grow at 1.6% per year(Figure 1.1). Indeed, oil is expected to continue providing more than 90% oftransport vehicles' energy requirements up till at least 2030 (Figure 1.2). Naturalgas demand will grow even faster, at 2.3% per year. Since it provides “cleaner”energy than other fossil fuels, gas is claiming a rapidly growing share of theelectricity generation market. Even in scenarios like the IEA Alternative Scenario(IEA WEO-2004) which factor in strong policies to curb CO2 emissions, projectedgrowth in oil and gas consumption remains significant.
CHAPTER 1 • SETTING THE SCENE 23
Figure 1.1 • World primary energy demand over time in IEA Reference Scenario
1 000
0
2 000
3 000
4 000
5 000
6 000
7 000
1970 1980 1990 2000 2010 2020 2030
Mto
e
Coal
Oil
Gas
NuclearHydro
Other
0102030405060708090
100
1971 1980 1990 2002 2010 2020 2030
Share of transportin globaloil demand
Share of oilin globaltransport demand
“Other” encompasses both traditional and modern renewables (biomass, wind, solar, etc.)Source: WEO-2004, IEA.
Source: WEO-2004, IEA.
Figure 1.2 • Percentage share of transport in global oil demand,percentage share of oil in transport energy demand
24 RESOURCES TO RESERVES
Resources and reserves
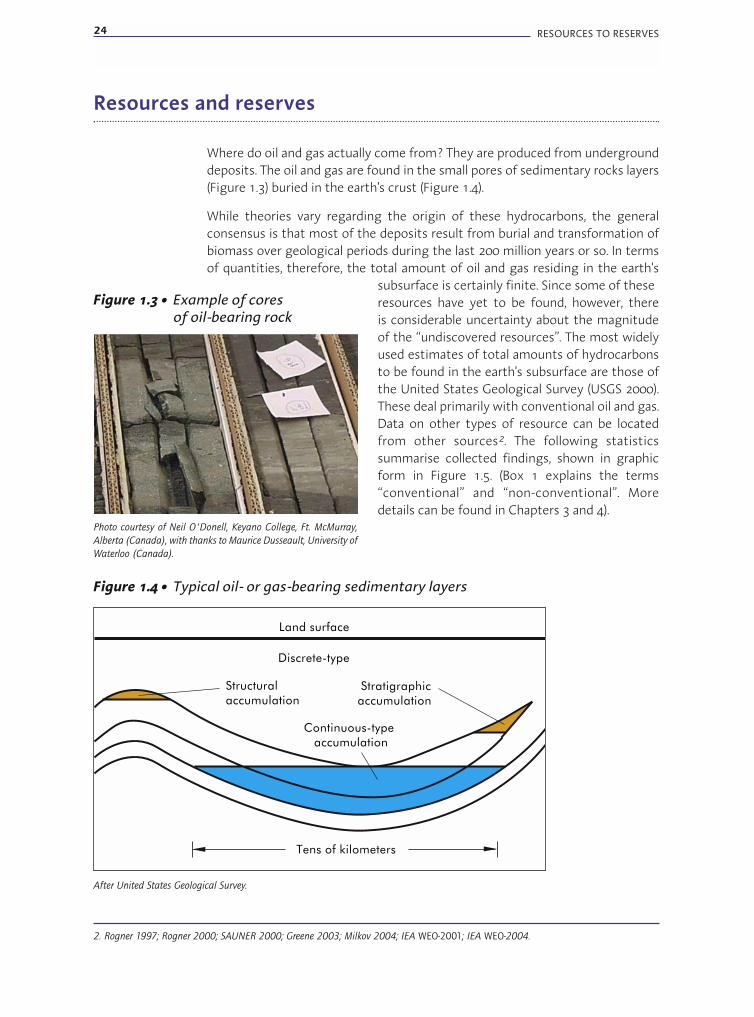
Where do oil and gas actually come from? They are produced from undergrounddeposits. The oil and gas are found in the small pores of sedimentary rocks layers(Figure 1.3) buried in the earth's crust (Figure 1.4).
While theories vary regarding the origin of these hydrocarbons, the generalconsensus is that most of the deposits result from burial and transformation ofbiomass over geological periods during the last 200 million years or so. In termsof quantities, therefore, the total amount of oil and gas residing in the earth's
subsurface is certainly finite. Since some of theseresources have yet to be found, however, thereis considerable uncertainty about the magnitudeof the “undiscovered resources”. The most widelyused estimates of total amounts of hydrocarbonsto be found in the earth's subsurface are those ofthe United States Geological Survey (USGS 2000).These deal primarily with conventional oil and gas.Data on other types of resource can be locatedfrom other sources2. The following statisticssummarise collected findings, shown in graphicform in Figure 1.5. (Box 1 explains the terms“conventional” and “non-conventional”. Moredetails can be found in Chapters 3 and 4).
Tens of kilometers
Discrete-type
Land surface
Continuous-typeaccumulation
Stratigraphicaccumulation
Structuralaccumulation
2. Rogner 1997; Rogner 2000; SAUNER 2000; Greene 2003; Milkov 2004; IEA WEO-2001; IEA WEO-2004.
Figure 1.3 • Example of coresof oil-bearing rock
Photo courtesy of Neil O'Donell, Keyano College, Ft. McMurray,
Alberta (Canada), with thanks to Maurice Dusseault, University of
Waterloo (Canada).
Figure 1.4 • Typical oil- or gas-bearing sedimentary layers
After United States Geological Survey.

CHAPTER 1 • SETTING THE SCENE 25
■ Oil
● Some 7 to 8 trillion barrels of conventional oil. Of these, 3.3 trillion barrelsare considered technically (or ultimately) recoverable; 1.0 trillion have alreadybeen produced3.
● Seven trillion barrels of non-conventional oil (heavy oil, bitumen, oil sands, andoil shales). Estimated technically recoverable quantities vary from 1 trillion to3 trillion barrels; roughly 0.01 trillion barrels have been produced to date.
■ Gas
● 450 trillion cubic metres of technically recoverable conventional gas, or2.8 trillion barrels of oil equivalent (boe), of which about 80 trillion cubicmetres have already been produced (0.5 trillion boe). There are few estimatesof “non-technically recoverable” conventional gas, but recovery factors forconventional gas tend to be high, typically around 70%.
● At least 250 trillion cubic metres of non-conventional gas, or 1.5 trillion boe(coal bed methane, tight gas, gas shales), although there is no reliableestimate world wide and there could be two or three times more. About0.01 trillion boe of non-conventional gas have already been produced.
● Between 1 000 and 10 000 000 trillion cubic metres of gas locked in theform of hydrates at seabed level or in permafrost (between 6 trillion and60 000 trillion boe). Estimates vary widely, but it is generally agreed thatresources here are significantly larger than those of conventional gas. Therecoverability status is unknown.
Figure 1.5 • World hydrocarbon resources
0
1
2
3
4
5
6
7
8
Conventionaloil
Non-conventionaloil
Conventionalgas
Non-conventionalgas
Gashydrates
Alreadyproduced
“Technicallyrecoverable”
Trill
ion
barre
ls oi
l equ
ival
ent
The thin lighter yellow band in the conventional oil bar and the lighter blue band in theconventional gas bar represent the contribution of future enhanced oil recovery techniquesbeyond that assumed in the USGS analysis (see Box 11 for more details).
3. These numbers include natural gas liquids (NGL), the small amount of oil that condenses out when gas is produced from many gas fields.
Similarly, the gas numbers include “associated gas”, which is gas dissolved in oil reservoirs.
Based on USGS and IEA data.
O&G chap1.qxd 5/09/05 14:48 Page 25

26 RESOURCES TO RESERVES
Box 1 • “Conventional” and “non-conventional”
There is no universally agreed definition of what is meant by conventional oil or gas, asopposed to non-conventional hydrocarbons. Roughly speaking, any source of hydrocarbonsthat requires production technologies significantly different from the mainstream in currentlyexploited reservoirs is described as non-conventional. However, this is clearly an imprecise andtime-dependant definition. In the long-term future, in fact, non-conventional, heavy oils maywell become the norm rather than the exception.
OilSome experts use a definition based on oil density, or API gravity (American PetroleumInstitute gravity). For example, all oils with API gravity below 20 (i.e. density greater than0.934 g/cm3) are considered to be non-conventional. This includes “heavy oils”, bitumen andtar deposits. While this classification has the merit of precision, it does not always reflectwhich technologies are used for production. For example, some oils with 20 API gravitylocated in deep offshore reservoirs in Brazil are extracted using entirely conventionaltechniques. Other experts focus on the viscosity of the oil. They regard as conventional any oilwhich can flow at reservoir temperature and pressure without recourse to viscosity-reductiontechnology. But such oils may still need special processing at the surface if they are tooviscous to flow at surface conditions.
Oil shales are generally regarded as non-conventional, although they do not fit into the abovedefinitions. More details on this can be found in Chapter 3. Also classified as non-conventionalare both oil derived from processing coal with coal-to-liquids (CTL) technologies and oil derivedfrom gas through gas-to-liquids (GTL) technologies. The raw materials are nevertheless perfectlyconventional fossil fuels. These will be discussed briefly in Chapters 5 and 7.
Another approach, used notably by the United States Geological Survey, is to denominatenon-conventional (oil or gas) according to the geological setting of the reservoir. Thehydrocarbon is conventional if the reservoir sits above water or water-bearing sediments andif it is relatively localised. If neither is the case, the hydrocarbon is non-conventional. This typeof definition has a sound geological basis, but does not always connect with the technologiesrequired for production, which are the main concern in this study.
GasThe definitions are just as hazy for gas. Generally, the industry classifies as non-conventionalthe gas that is found in unusual types of reservoir. The main types are coal bed methane(CBM), which is gas associated with deeply buried coal seams, and “tight gas”, gas fromreservoirs with very low permeability that can only be produced at economic rates throughspecial production technologies (systematic use of stimulation techniques). While CBM hasan unambiguous definition, there is a continuum between conventional and tight reservoirs,without any sharp transition. Stimulation techniques are also frequently used forconventional reservoirs. This question is discussed further in Chapter 4.
One can also list “lean gas” and “sour gas”, gas contained in conventional gas reservoirs, butwith a high concentration of impurities (nitrogen and carbon dioxide for lean gas, hydrogensulphide for sour gas) that negatively impacts the economics.
CHAPTER 1 • SETTING THE SCENE 27
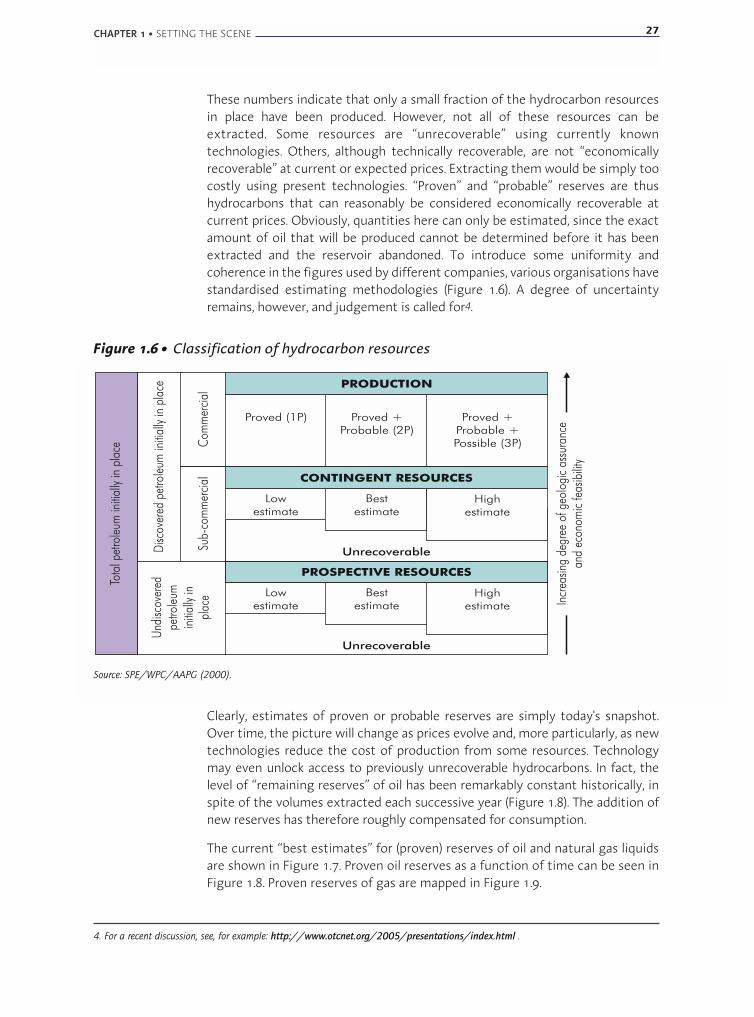
These numbers indicate that only a small fraction of the hydrocarbon resourcesin place have been produced. However, not all of these resources can beextracted. Some resources are “unrecoverable” using currently knowntechnologies. Others, although technically recoverable, are not “economicallyrecoverable” at current or expected prices. Extracting them would be simply toocostly using present technologies. “Proven” and “probable” reserves are thushydrocarbons that can reasonably be considered economically recoverable atcurrent prices. Obviously, quantities here can only be estimated, since the exactamount of oil that will be produced cannot be determined before it has beenextracted and the reservoir abandoned. To introduce some uniformity andcoherence in the figures used by different companies, various organisations havestandardised estimating methodologies (Figure 1.6). A degree of uncertaintyremains, however, and judgement is called for4.
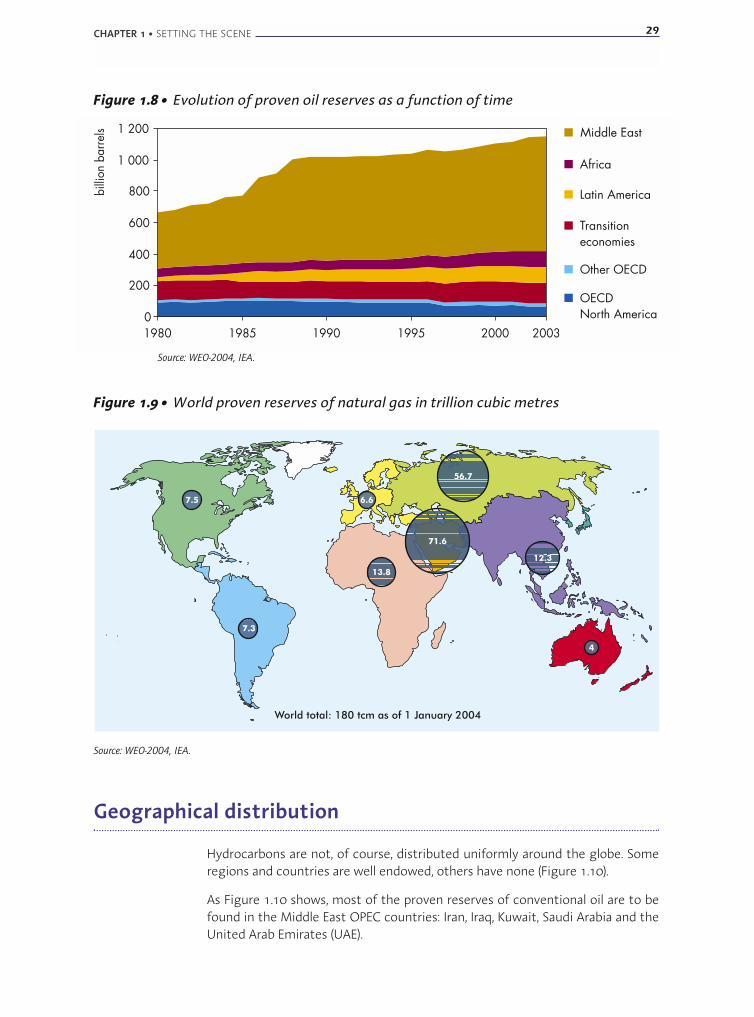
Clearly, estimates of proven or probable reserves are simply today's snapshot.Over time, the picture will change as prices evolve and, more particularly, as newtechnologies reduce the cost of production from some resources. Technologymay even unlock access to previously unrecoverable hydrocarbons. In fact, thelevel of “remaining reserves” of oil has been remarkably constant historically, inspite of the volumes extracted each successive year (Figure 1.8). The addition ofnew reserves has therefore roughly compensated for consumption.
The current “best estimates” for (proven) reserves of oil and natural gas liquidsare shown in Figure 1.7. Proven oil reserves as a function of time can be seen inFigure 1.8. Proven reserves of gas are mapped in Figure 1.9.
Figure 1.6 • Classification of hydrocarbon resources
Source: SPE/WPC/AAPG (2000).
4. For a recent discussion, see, for example: http://www.otcnet.org/2005/presentations/index.html .

28 RESOURCES TO RESERVES
Figure 1.7 • Crude oil and NGL reserves at end-2003,according to various sources
0 200 400 600 800 1 000 1 200 1 400
World Oil
OPEC
BP
IHS
O&GJ
billion barrels
Source: WEO-2004, IEA.
These numbers should be seen in the light of figures both for oil and gas alreadyproduced to date and for annual production rates (30 billion barrels of oil and3 trillion cubic metres of gas in 2004). The ratio of proven reserves to currentyearly production gives a very rough feel of how many more years of outputremain, on the basis of reserves as they stand today. That is, roughly 40 years foroil and 60 years for gas.
The fairly constant level of remaining reserves has led some stakeholders toconsider that such levels will continue indefinitely, and that evolving technologywill mobilise whatever volumes of hydrocarbons are needed. Others, however,stress that hydrocarbons are unquestionably finite, and that close to one-half ofthe earth's proven reserves of conventional oil has already been consumed.Because of the uncertainties over the respective amounts of resources andreserves, it is difficult to predict the moment of “peak oil5”, when productionmight be expected to start to decline. Estimates range from today to 2050 orbeyond. In fact, many experts agree that conventional oil outside OPEC MiddleEast has either peaked already, or will do so over the next ten years. Optimistsretort that, even if this were so, non-conventional hydrocarbons are abundantand technology will make it possible to tap them at reasonable cost.
The key questions, however, are not about when conventional oil production willpeak, but about the cost involved (not forgetting the cost of CO2 emissions) inmaking non-conventional hydrocarbons available or increasing the recovery ratesof conventional hydrocarbons, as well as about the impact of energy efficiencygains. It is the answers to these questions that will determine how far, and when,other primary sources of energy like coal, nuclear or renewable energies willsupersede hydrocarbons in the role they play today.
5. The term “peak oil” is commonly used to denote the point of maximum production worldwide; see Box 2 for a short discussion.
CHAPTER 1 • SETTING THE SCENE 29
Geographical distribution
Hydrocarbons are not, of course, distributed uniformly around the globe. Someregions and countries are well endowed, others have none (Figure 1.10).
As Figure 1.10 shows, most of the proven reserves of conventional oil are to befound in the Middle East OPEC countries: Iran, Iraq, Kuwait, Saudi Arabia and theUnited Arab Emirates (UAE).
Figure 1.9 • World proven reserves of natural gas in trillion cubic metres
7.3
7.5 6.6
12.3
4
13.8
71.6
56.7
World total: 180 tcm as of 1 January 2004
Source: WEO-2004, IEA.
Figure 1.8 • Evolution of proven oil reserves as a function of time
0
200
400
600
800
1 000
1 200
1980 1985 1990 1995 2000 2003
billi
on b
arre
ls Middle East
Africa
Latin America
Transitioneconomies
Other OECD
OECDNorth America
Source: WEO-2004, IEA.

30 RESOURCES TO RESERVES
Figure 1.11 • OPEC and OPEC Middle East percentage shares of world oil supply
OPEC
OPEC Middle East
0
10
20
30
40
50
60
1970 1980 1990 2000 2010 2020 2030
Source: WEO-2004, IEA.
Figure 1.10 • Distribution of proven reserves of conventional oil,according to various sources, in percentages
0
10
20
30
40
50
60
70
OECD Transitioneconomies
MiddleEast
Africa LatinAmerica
Asia
O&GJ
World Oil
BP
OPEC
IHS
Source: WEO-2004, IEA.
Similarly, conventional gas is located primarily in Russia and the Former SovietUnion (FSU) countries, and in Iran, Qatar and Saudi Arabia, as shown in Figure 1.9.
Since these reserves are often not in the same regions as the markets they serve,considerations of security and diversity of supply are among the importantfactors to be placed in the balance in decisions over squeezing morehydrocarbons from deposits in other regions closer to home or over developingnon-conventional hydrocarbons. Underlining this point, the IEA World EnergyOutlook 2004 Reference Scenario predicts that 43% of the world's oil supply willbe coming from the OPEC Middle East countries by 2030, compared with 25% in2004 (Figure 1.11).
Oil and gas transport
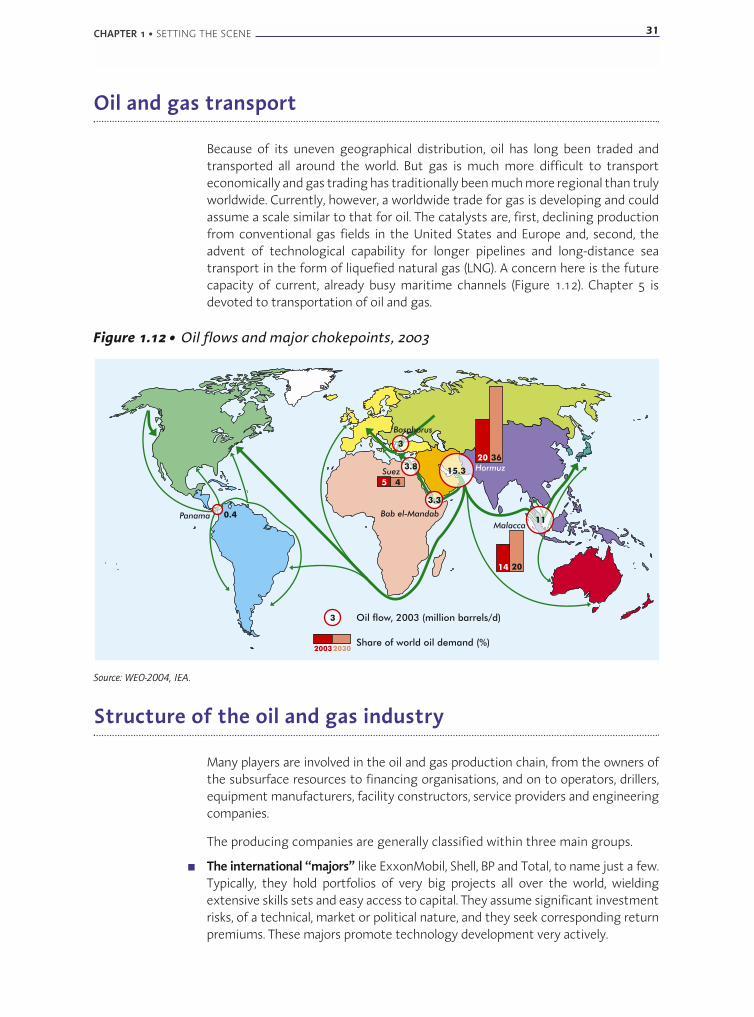
Because of its uneven geographical distribution, oil has long been traded andtransported all around the world. But gas is much more difficult to transporteconomically and gas trading has traditionally been much more regional than trulyworldwide. Currently, however, a worldwide trade for gas is developing and couldassume a scale similar to that for oil. The catalysts are, first, declining productionfrom conventional gas fields in the United States and Europe and, second, theadvent of technological capability for longer pipelines and long-distance seatransport in the form of liquefied natural gas (LNG). A concern here is the futurecapacity of current, already busy maritime channels (Figure 1.12). Chapter 5 isdevoted to transportation of oil and gas.
CHAPTER 1 • SETTING THE SCENE 31
Figure 1.12 • Oil flows and major chokepoints, 2003
11
15.33.8
3.3
0.4
Suez
Bosphorus
Panama Bab el-Mandab
Hormuz
Malacca
3
3
5
14
20
20
4
36
Oil flow, 2003 (million barrels/d)
Share of world oil demand (%)20032030
Source: WEO-2004, IEA.
Structure of the oil and gas industry
Many players are involved in the oil and gas production chain, from the owners ofthe subsurface resources to financing organisations, and on to operators, drillers,equipment manufacturers, facility constructors, service providers and engineeringcompanies.
The producing companies are generally classified within three main groups.
■ The international “majors” like ExxonMobil, Shell, BP and Total, to name just a few.Typically, they hold portfolios of very big projects all over the world, wieldingextensive skills sets and easy access to capital. They assume significant investmentrisks, of a technical, market or political nature, and they seek corresponding returnpremiums. These majors promote technology development very actively.

32 RESOURCES TO RESERVES
■ The “independents”, which are smaller, private companies specialising in smaller-scale projects focusing on specific geographical areas or types of reservoir.Working with a smaller cost base, they are usually adept at managing olderreservoirs or reacting quickly to swings in oil and gas prices and taking onprojects offering rapid returns. These companies are often innovative indeveloping new types of resource and in leveraging their local knowledge.
■ The “major resources holders”, national companies which own and often operatethe fields in their home countries. Some of the many examples are Saudi-Aramco,PDVSA (Venezuela) and PEMEX (Mexico). The major resource holders tend topractice longer-term resource management (in contrast with the net-present-value approach and significant discount rates seen among private companies).With some notable exceptions, they tend to be followers of new technologiesrather than developers. Together, these companies produce about 70% ofworldwide oil and gas consumption. They control more than 90% of provenreserves.
Of course, all the companies co-exist within a continuum. Some nationalcompanies are active internationally, for example, and some independentcompanies compete with majors for the same types of project. A particularlystrong trend among national companies is towards participation in projectsoutside their own countries, be it to diversify investment risks, as with Norway'sStatoil or Malaysia's Petronas, or to target supply security, as with companies innet-importer countries like China's CNPC and Sinopec, or ONGC, the Indiannational oil company. The latter are prime examples of companies with a rapidlygrowing international presence and a readiness to take on more risky or lesseconomically attractive projects because corporate policy is driven by security ofsupply more than by economics on a project-by-project basis.
Subsequent chapters of this study will examine the dynamics of developing newresources. A key to understanding these dynamics is a grasp of the huge initialcapital investment required to develop a field: exploration surveys, well drillingand construction, production and treatment facilities, transport (pipelines,tankers, LNG plants). Capital depreciation represents a large portion ofhydrocarbon production cost. While this varies widely around the world, 60% isprobably a typical value. Marginal production costs, on the other hand, arerelatively low, ranging from less than USD 1 per barrel in Saudi Arabia to up toUSD 10 per barrel in difficult offshore, Arctic regions. The pay-back period forlarge capital investments is often ten years or more. This is why many of themajor companies plan projects on the basis of an oil price of around USD 20, evenif the current price is much higher.
The producing companies act as planners, architects and project managers formost of the exploration and production projects. They rely heavily on service andsupply companies for the actual implementation. Drilling contractors own andoperate drilling rigs. Engineering companies design and build productionfacilities. Service companies perform seismic surveys and most of the operationsrequired in wells. The service and supply sector thus plays a key role in technologydevelopment, alongside the producing companies themselves.

Research and development
In their role as prime developers of new technology, the service providers andequipment manufacturers work closely with the major oil and gas companies.The leading international oil and gas groups are the most active in taking upinnovative concepts, but some national oil companies are also key players, asillustrated in the deepwater oil technology activities of Brazil's Petrobras. Themajor service companies and equipment manufacturers ensure that newtechnology is available rapidly worldwide for all customers. In addition, smaller,local companies also frequently contribute greatly to advancing technology byleveraging their local knowledge to try more risky ideas, often in partnership withlocal independents.
While some figures can be cited for industry-funded and national R&Drespectively, statistics on total R&D spending on upstream oil and gastechnology are difficult to come by (IFP 2005). A plausible ball park figure for theindustry as a whole might be between USD 5 billion and USD 10 billion per year.This represents less than 1% of the industry's turnover.
Public R&D spending, as reported by IEA member countries, is shown in Figure 1.13.From a high level after the oil shocks of the 1970s, this upstream oil and gas R&Dspending declined steadily during the period of relatively low oil prices of the1990s. A handful of countries account for the bulk of this funding (Australia,Canada, France, Japan, Norway, United States). Some see such outlay as crucial inorder to support their national oil and gas production. France and Japan are theonly non-producing countries investing significantly in oil and gas R&D.
The R&D investments of large, publicly listed companies can be traced throughtheir annual reports. Figure 1.14 shows the trends and volumes of spending for agroup of the foremost producing and service companies. Large oil companies, too,cut back on R&D investment during the 1990s as they adapted to lower oil pricesby outsourcing more activities, focusing on core businesses and consolidating.
CHAPTER 1 • SETTING THE SCENE 33
Figure 1.13 • Public oil and gas upstream R&D spending
0
100
200
300
400
500
2002200019981996199419921990
Milli
on U
SD R&D funding
From IEA database, using figures reported by IEA member countries and extrapolations by the IEA.

34 RESOURCES TO RESERVES
Their R&D efforts have often been refocused on a limited number of areas seento offer the possibility of a competitive advantage, for instance in exploration insome specific types of reservoir. For their part, service companies havemaintained substantial and growing levels of R&D investment. A comparisonbetween Figures 1.13 and 1.14 shows clearly that R&D spending among privatecompanies far exceeds public expenditures, as to be expected within a matureindustry.
The R&D contributions of small and medium-sized companies (SMEs) are moredifficult to gauge. In Europe, the European Oil and Gas Innovation Forum(EUROGIF) groups more than 2 500 European supply and service companies in theoil and gas industry. They account for more than 250 000 jobs and an annualturnover exceeding USD 50 billion. Their reported R&D spending amounts toroughly USD 2 billion per year (Marquette 2004). A reasonable guess is that about25% of that comes from SMEs.
While public information is scarce on R&D investment among national oilcompanies, anecdotal evidence suggests this has been growing. For example,R&D centres have been launched by Saudi Aramco, Petrobras and Petronas.Overall, however, it is likely that 90% of the R&D in the oil and gas upstreamsector is undertaken in IEA countries.
Even if partly offset by increases in R&D investment in the service and supplysector, the decline in R&D investment among large oil companies andgovernments could be a worrying sign that technological progress might beslower over coming years than in the past.
Figure 1.14 • R&D spending of major companies M
illion
USD
5 Major InternationalOil Companies
5 Largest ServiceCompanies
0
500
1000
1500
2000
2500
3000
3500
4000
4500
1990 1992 1994 1996 1998 2000 2002 2004
From public sources, courtesy of Schlumberger.
The role of technology
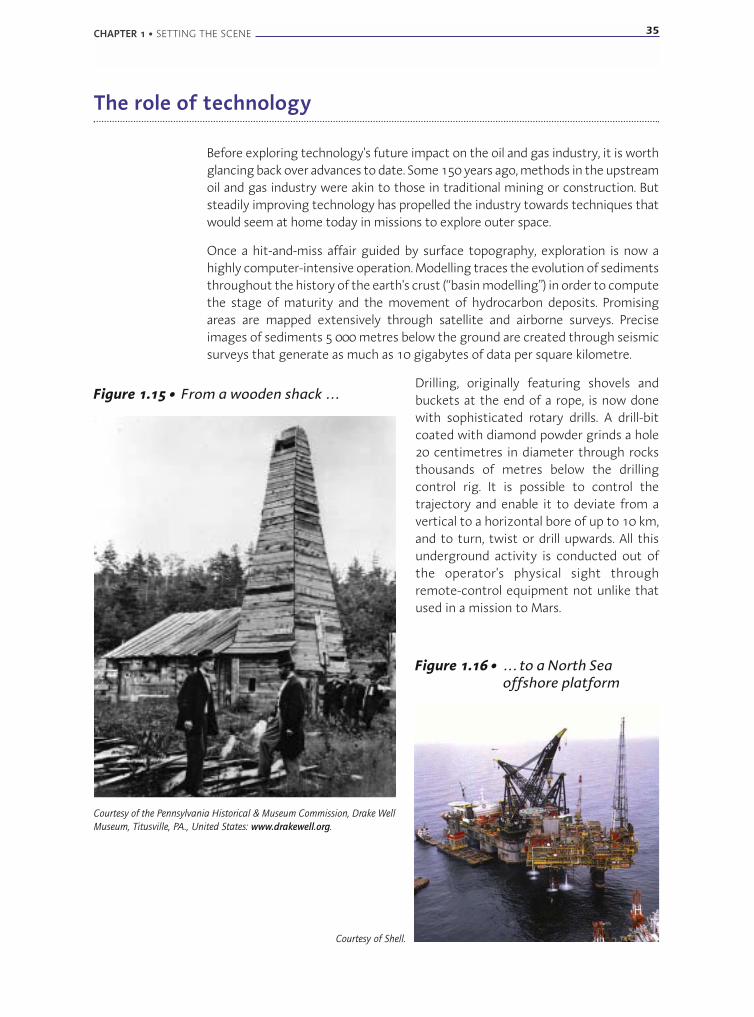
Before exploring technology's future impact on the oil and gas industry, it is worthglancing back over advances to date. Some 150 years ago, methods in the upstreamoil and gas industry were akin to those in traditional mining or construction. Butsteadily improving technology has propelled the industry towards techniques thatwould seem at home today in missions to explore outer space.
Once a hit-and-miss affair guided by surface topography, exploration is now ahighly computer-intensive operation. Modelling traces the evolution of sedimentsthroughout the history of the earth's crust (“basin modelling”) in order to computethe stage of maturity and the movement of hydrocarbon deposits. Promisingareas are mapped extensively through satellite and airborne surveys. Preciseimages of sediments 5 000 metres below the ground are created through seismicsurveys that generate as much as 10 gigabytes of data per square kilometre.
Drilling, originally featuring shovels andbuckets at the end of a rope, is now donewith sophisticated rotary drills. A drill-bitcoated with diamond powder grinds a hole20 centimetres in diameter through rocksthousands of metres below the drillingcontrol rig. It is possible to control thetrajectory and enable it to deviate from avertical to a horizontal bore of up to 10 km,and to turn, twist or drill upwards. All thisunderground activity is conducted out ofthe operator's physical sight throughremote-control equipment not unlike thatused in a mission to Mars.
CHAPTER 1 • SETTING THE SCENE 35
Figure 1.16 • … to a North Seaoffshore platform
Courtesy of Shell.
Figure 1.15 • From a wooden shack …
Courtesy of the Pennsylvania Historical & Museum Commission, Drake Well
Museum, Titusville, PA., United States: www.drakewell.org.

36 RESOURCES TO RESERVES
Offshore drilling, which started with platforms resting on the seabed in a fewmetres of water, now involves dynamically positioned vessels able to controltheir positions in deep sea to within fractions of metres. Today's enormousfloating structures carry vast arrays of facilities and stand above depths of3 000 metres.
In the old days, reservoir management was largely a question of adjusting a valveto control the natural flow of the hydrocarbons. It now involves a closed loop ofsophisticated computer simulations (“reservoir simulators”), which drive thepositions of new wells and the injection of water, gas or more complex fluids tomaximise the amount of hydrocarbons produced. Field development is optimised
using massive amounts of data from measurementstaken within the wells or at surface level and visualisedin three dimensions in “virtual reality” rooms.
Figure 1.17 • From paper to immersive 3D
Court
esy
of
Shel
l.
Figure 1.19 • … to liquefied natural gas carriers
Courtesy of Statoil.
Figure 1.18 • From wooden pipeline …
Photo courtesy of S.T. Peas, Meadville, PA,
USA, with thanks to Syracuse University and
Onondaga Historical Society, Syracuse, NY, USA.
Regular technological advances are pushing back the frontiers of operatingcapability at extreme depths, under extreme reservoir pressure, or in difficulttemperatures or geographical situations.
Ever more sophisticated pipelines, tankers and LNG carriers now enablehydrocarbons to travel all around the world.
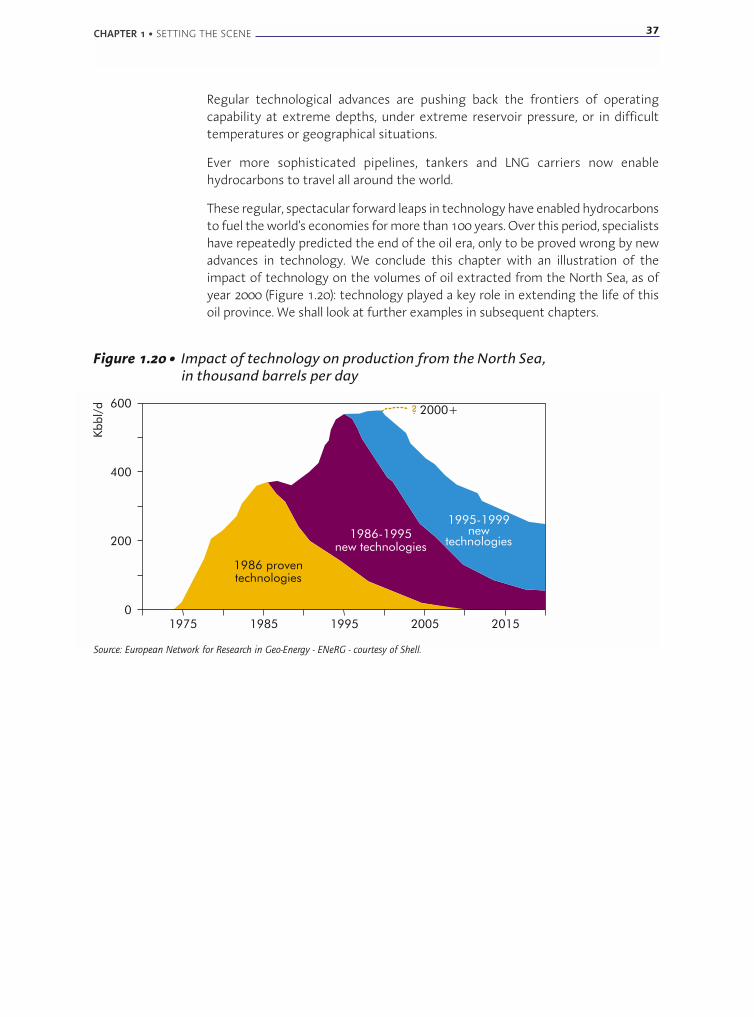
These regular, spectacular forward leaps in technology have enabled hydrocarbonsto fuel the world's economies for more than 100 years. Over this period, specialistshave repeatedly predicted the end of the oil era, only to be proved wrong by newadvances in technology. We conclude this chapter with an illustration of theimpact of technology on the volumes of oil extracted from the North Sea, as ofyear 2000 (Figure 1.20): technology played a key role in extending the life of thisoil province. We shall look at further examples in subsequent chapters.
CHAPTER 1 • SETTING THE SCENE 37
Figure 1.20 • Impact of technology on production from the North Sea,in thousand barrels per day
1975 1985 1995 2005 2015
600
400
200
0
1995-1999new
technologies1986-1995
new technologies
? 2000+
technologies
1986 proventechnologies
Kbbl/
d
Source: European Network for Research in Geo-Energy - ENeRG - courtesy of Shell.
38 RESOURCES TO RESERVES
Box 2 • Peak oil
The issue of “peak oil”, the time when worldwide oil production will begin to decrease, has
generated a large amount of literature and controversy. The purpose of this box is to give an
elementary introduction to this issue.
The idea of peak oil originates in the work of M.K. Hubbert, a geologist at Shell and the USGS
who successfully predicted the peak in oil production in the USA. There are various ways to
“derive” the Hubbert curve; here we use one that focuses on the exploration process.
In the initial stage of exploration for a resource such as oil, the success rate for discoveries is
small because geologists do not know where it is best to explore. But as more oil is found, we
learn more about places where it is likely to be found, and the success rate increases. However,
because the amount of oil in the ground is finite, there eventually comes a time when most
of it has been found, and it becomes more and more difficult to find additional reservoirs: the
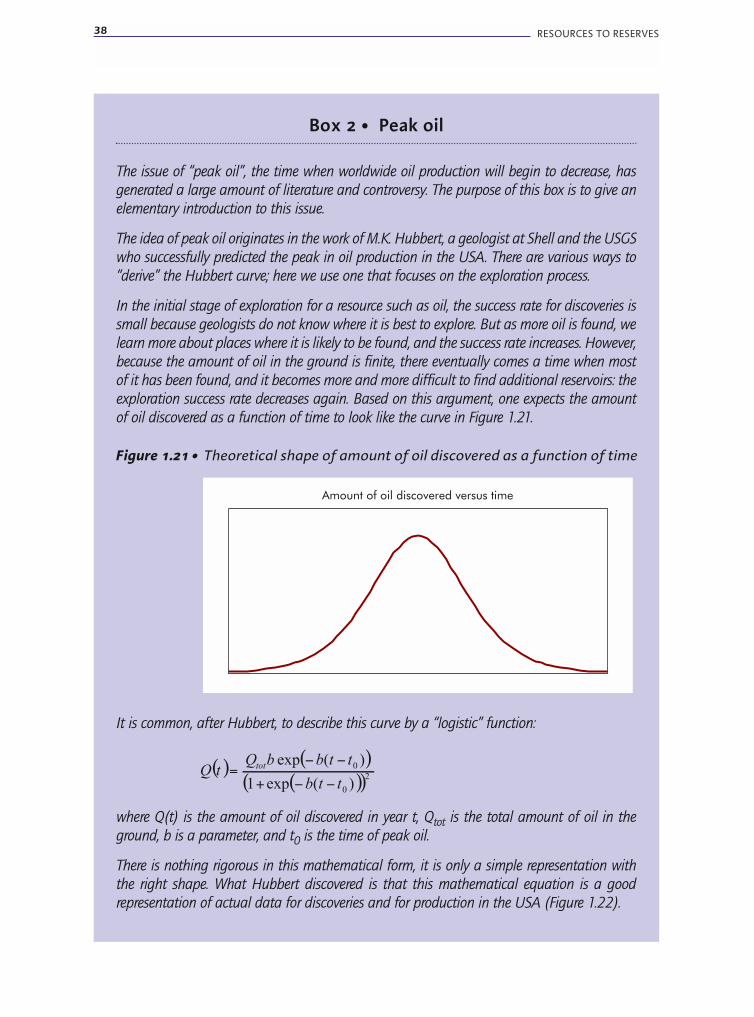
exploration success rate decreases again. Based on this argument, one expects the amount
of oil discovered as a function of time to look like the curve in Figure 1.21.
It is common, after Hubbert, to describe this curve by a “logistic” function:
where Q(t) is the amount of oil discovered in year t, Qtot is the total amount of oil in the
ground, b is a parameter, and t0 is the time of peak oil.
There is nothing rigorous in this mathematical form, it is only a simple representation with
the right shape. What Hubbert discovered is that this mathematical equation is a good
representation of actual data for discoveries and for production in the USA (Figure 1.22).
Figure 1.21 • Theoretical shape of amount of oil discovered as a function of time
Amount of oil discovered versus time
! " ! "! "! "!"
"
#$%&'(#$%&'
!!"!!""#
!# !$!
!!#
!!$ )
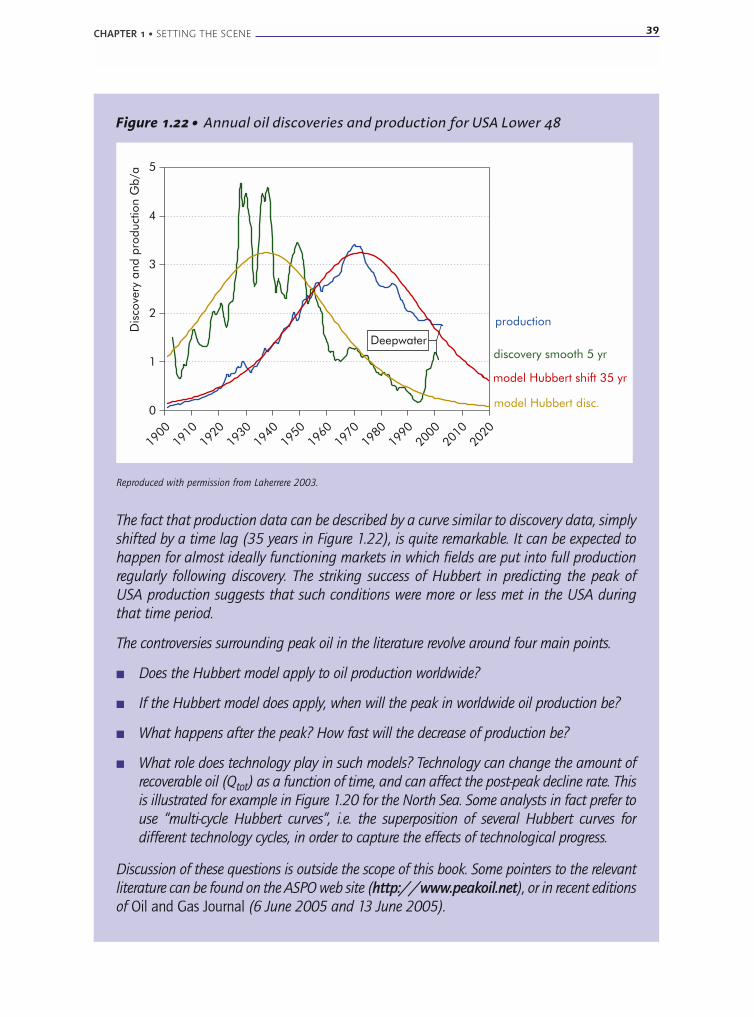
The fact that production data can be described by a curve similar to discovery data, simply
shifted by a time lag (35 years in Figure 1.22), is quite remarkable. It can be expected to
happen for almost ideally functioning markets in which fields are put into full production
regularly following discovery. The striking success of Hubbert in predicting the peak of
USA production suggests that such conditions were more or less met in the USA during
that time period.
The controversies surrounding peak oil in the literature revolve around four main points.
■ Does the Hubbert model apply to oil production worldwide?
■ If the Hubbert model does apply, when will the peak in worldwide oil production be?
■ What happens after the peak? How fast will the decrease of production be?
■ What role does technology play in such models? Technology can change the amount of
recoverable oil (Qtot) as a function of time, and can affect the post-peak decline rate. This
is illustrated for example in Figure 1.20 for the North Sea. Some analysts in fact prefer to
use “multi-cycle Hubbert curves”, i.e. the superposition of several Hubbert curves for
different technology cycles, in order to capture the effects of technological progress.
Discussion of these questions is outside the scope of this book. Some pointers to the relevant
literature can be found on the ASPO web site (http://www.peakoil.net), or in recent editions
of Oil and Gas Journal (6 June 2005 and 13 June 2005).
CHAPTER 1 • SETTING THE SCENE 39
Figure 1.22 • Annual oil discoveries and production for USA Lower 48
0
1
2
3
4
5
1900
1910
1920
1930
1940
1950
1960
1970
1980
1990
2000
2010
2020
discovery smooth 5 yr
production
model Hubbert disc.
model Hubbert shift 35 yr
Dis
cove
ryand
pro
duct
ion
Gb/a
Deepwater
Reproduced with permission from Laherrere 2003.

Chapter 2 • “CONVENTIONAL” OIL AND GAS
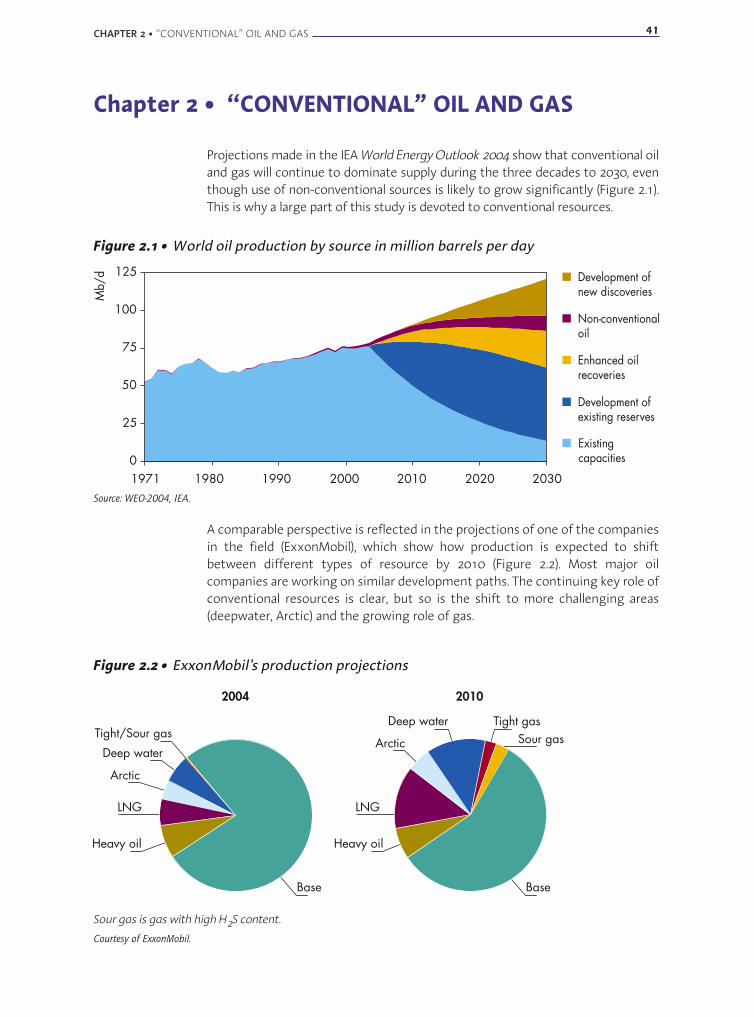
Projections made in the IEA World Energy Outlook 2004 show that conventional oiland gas will continue to dominate supply during the three decades to 2030, eventhough use of non-conventional sources is likely to grow significantly (Figure 2.1).This is why a large part of this study is devoted to conventional resources.
A comparable perspective is reflected in the projections of one of the companiesin the field (ExxonMobil), which show how production is expected to shiftbetween different types of resource by 2010 (Figure 2.2). Most major oilcompanies are working on similar development paths. The continuing key role ofconventional resources is clear, but so is the shift to more challenging areas(deepwater, Arctic) and the growing role of gas.
CHAPTER 2 • “CONVENTIONAL” OIL AND GAS 41
Figure 2.1 • World oil production by source in million barrels per day
Existingcapacities
Enhanced oilrecoveries
Development ofnew discoveries
Development ofexisting reserves
Non-conventionaloil
0
25
50
75
100
125
19801971 1990 2000 2010 2020 2030
Mb/
d
Deep water
Deep water
Arctic
LNG
Base
Heavy oil Heavy oil
Tight/Sour gasTight gas
Sour gas
20102004
Arctic
Base
LNG
Source: WEO-2004, IEA.
Sour gas is gas with high H2S content.
Courtesy of ExxonMobil.
Figure 2.2 • ExxonMobil's production projections
42 RESOURCES TO RESERVES
In this chapter, we shall look, first, at the geographical locations of both presentand future major conventional oil and gas resources, then at the issues affectingextraction and the technology solutions currently used to maximise output.
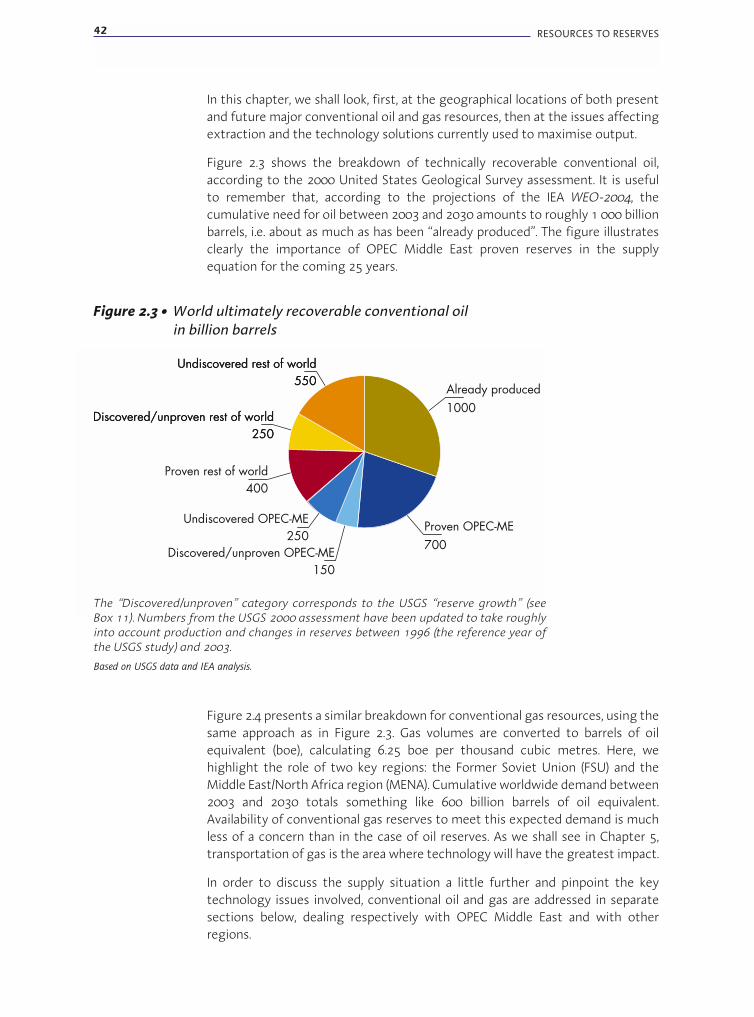
Figure 2.3 shows the breakdown of technically recoverable conventional oil,according to the 2000 United States Geological Survey assessment. It is usefulto remember that, according to the projections of the IEA WEO-2004, thecumulative need for oil between 2003 and 2030 amounts to roughly 1 000 billionbarrels, i.e. about as much as has been “already produced”. The figure illustratesclearly the importance of OPEC Middle East proven reserves in the supplyequation for the coming 25 years.
Discovered/unproven rest of world250
Discovered/unproven rest of world250
Undiscovered rest of world550
Undiscovered rest of world550
Proven rest of world400
Discovered/unproven OPEC-ME150
Undiscovered OPEC-ME250
Proven OPEC-ME700
Already produced1000
Figure 2.3 • World ultimately recoverable conventional oilin billion barrels
The “Discovered/unproven” category corresponds to the USGS “reserve growth” (seeBox 11). Numbers from the USGS 2000 assessment have been updated to take roughlyinto account production and changes in reserves between 1996 (the reference year ofthe USGS study) and 2003.
Based on USGS data and IEA analysis.
Figure 2.4 presents a similar breakdown for conventional gas resources, using thesame approach as in Figure 2.3. Gas volumes are converted to barrels of oilequivalent (boe), calculating 6.25 boe per thousand cubic metres. Here, wehighlight the role of two key regions: the Former Soviet Union (FSU) and theMiddle East/North Africa region (MENA). Cumulative worldwide demand between2003 and 2030 totals something like 600 billion barrels of oil equivalent.Availability of conventional gas reserves to meet this expected demand is muchless of a concern than in the case of oil reserves. As we shall see in Chapter 5,transportation of gas is the area where technology will have the greatest impact.
In order to discuss the supply situation a little further and pinpoint the keytechnology issues involved, conventional oil and gas are addressed in separatesections below, dealing respectively with OPEC Middle East and with otherregions.

CHAPTER 2 • “CONVENTIONAL” OIL AND GAS 43
OPEC Middle East
A number of countries have both vast proven reserves and large ratios of provenreserves to production, combined with low production costs. Typically, these areOPEC Middle East countries (e.g. Saudi Arabia has 80 years reserves to productionratio), but also others like Venezuela. Their main focus is on careful, long-termexploitation of their reservoirs, on maximising recovery rates and on providing foradequate revenues far into the future. They have a partial monopoly and canattempt to improve their short-term returns by exercising their monopolyinfluence. Their prime technology needs relate to reservoir management andrecovery improvements, discussed at length under the “Improved recovery”section later in this chapter. In all probability, these countries also possesssignificant undiscovered resources. But their incentive to explore and developthem is modest, given their comfortable reserves-to-production ratios at present.
Although they are seldom technology trend-setters, some of these countries -Saudi Arabia and the United Arab Emirates, for instance - are active in followingthe latest technology developments coming from international companies andleveraging these to optimise costs and reservoir management. Examples includeSaudi Aramco's extensive use of horizontal and multilateral wells in what istermed a “maximum reservoir contact approach” (Saleri 2004). Other countries(Iran, Iraq or Libya) are still lagging behind, due to past or ongoing restrictionsover access to technology. All countries are likely to benefit significantly from thevarious developments described in later sections of this chapter.
The Reference Scenario of the IEA WEO-2004 projects that OPEC Middle East oilproduction between now and 2030 will more than double. Long-term access amongMiddle East producers to the latest technologies will therefore be crucial, even inalternative scenarios involving reduced reliance on OPEC Middle East countries.
Rest of world discovered/unproven150
Rest of world discovered/unproven150
Rest of world undiscovered350
Rest of world undiscovered350
FSU discovered/unproven150
FSU undiscovered250
FSU proven350
MENA undiscovered200
Already produced450
Rest of world proven350
Rest of world proven350
MENA discovered/unproven200
MENA proven350
Figure 2.4 • World ultimately recoverable conventional gasin billion barrels oil equivalent
Based on USGS data, Cedigaz data and IEA analysis.

44 RESOURCES TO RESERVES
Partnerships between such producers and the technology developers will remainfundamental to security of supply for IEA countries and the entire world. Moredetails on future supply from the Middle East and North Africa region is due tobe presented in the upcoming IEA World Energy Outlook 2005 (IEA WEO-2005).
In this region, improved capability in monitoring fluid movements between wellscould be the most significant future technological development. There areimportant reasons for this. The region is characterised by large-size reservoirs,from which oil is extracted relatively slowly in an attempt to maximise long-termrecovery using a relatively limited number of wells. For example, many of thelarge Middle East reservoirs obtain their output through “peripheral waterflooding”, a technique in which water is injected from the edges of the reservoirto try to obtain a slow but extensive sweep of the entire reservoir. In contrast, inthe traditional “five-spot pattern” used in many other countries, each producingwell is surrounded by four injector wells relatively close to each other, thusensuring a relatively rapid sweep of the oil by the water, rapid oil production anda favourable result in terms of net present value.
Since a well is not only a channel for injecting and producing fluids but also theprime conduit for acquiring information about what is actually happening in thereservoir, there are drawbacks with the peripheral water flooding approach. Whenthere are only a few, widely spaced wells, tracking of fluid movement in thereservoir is limited and fewer opportunities exist to validate reservoir models.This can occasionally lead to unpleasant surprises when production suddenlydeclines unexpectedly. It is a particular concern with carbonate reservoirs whichmay contain significant incidence of unrecognised breaks in formationhomogeneity (see the “Improved recovery” section further on).
A recent and widely discussed occurrence of this phenomenon involved the Yibalfield in Oman (Mijnssen 2003). Although this field had many wells, an insufficientacquisition of well surveillance data led to a failure to spot fault zones creating ahigh permeability path for water to bypass the remaining oil. The drilling ofhorizontal wells intersecting these zones contributed to a very abrupt drop in oilproduction. From 225 000 barrels per day (b/d) in 1997, output declined to95 000 b/d in 2001. Interestingly, recognition of the problem led to new plansoffering a potential increase in the recovery factor from 40% to more than 50%.
Further development of techniques described under the “Improved recovery”section (notably four-dimensional seismic, cross-well surveys), coupled withlow-cost drilling of observation wells exclusively to acquire information, can beexpected to play a very significant role in the future management of MiddleEast reservoirs.
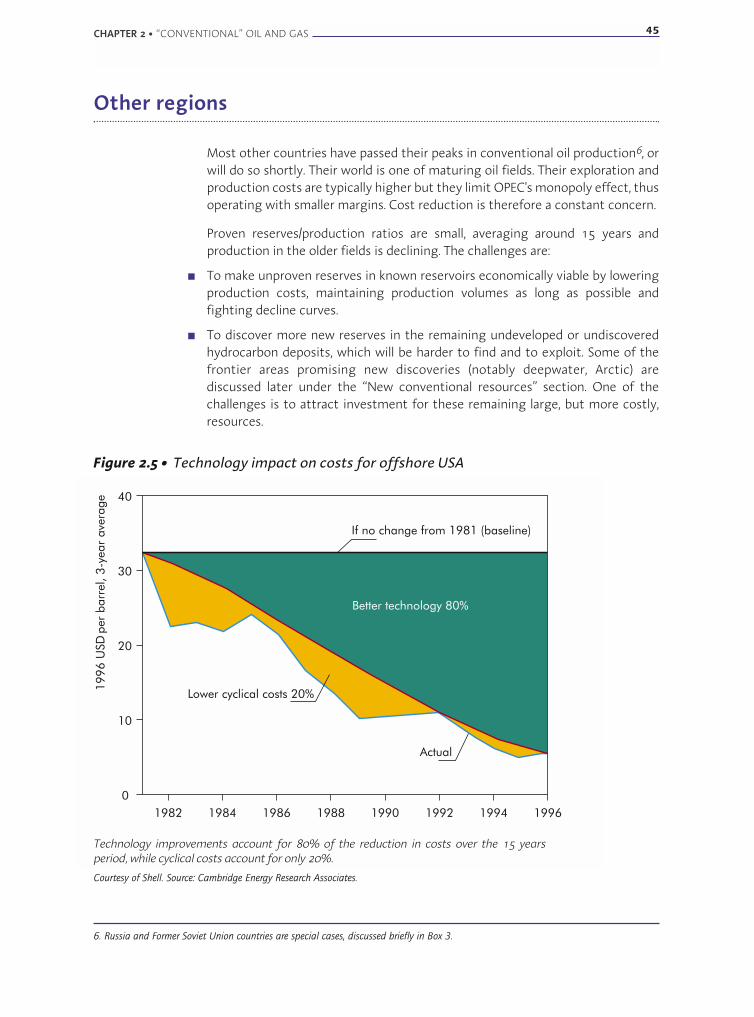
CHAPTER 2 • “CONVENTIONAL” OIL AND GAS 45
6. Russia and Former Soviet Union countries are special cases, discussed briefly in Box 3.
Other regions
Most other countries have passed their peaks in conventional oil production6, orwill do so shortly. Their world is one of maturing oil fields. Their exploration andproduction costs are typically higher but they limit OPEC's monopoly effect, thusoperating with smaller margins. Cost reduction is therefore a constant concern.
Proven reserves/production ratios are small, averaging around 15 years andproduction in the older fields is declining. The challenges are:
■ To make unproven reserves in known reservoirs economically viable by loweringproduction costs, maintaining production volumes as long as possible andfighting decline curves.
■ To discover more new reserves in the remaining undeveloped or undiscoveredhydrocarbon deposits, which will be harder to find and to exploit. Some of thefrontier areas promising new discoveries (notably deepwater, Arctic) arediscussed later under the “New conventional resources” section. One of thechallenges is to attract investment for these remaining large, but more costly,resources.
1996
USD
per
barr
el, 3
-yea
rav
erag
e 40
30
20
10
01982 1984 1986 1988 1990 1992 1994 1996
Lower cyclical costs 20%
If no change from 1981 (baseline)
Actual
Better technology 80%
Figure 2.5 • Technology impact on costs for offshore USA
Technology improvements account for 80% of the reduction in costs over the 15 yearsperiod, while cyclical costs account for only 20%.
Courtesy of Shell. Source: Cambridge Energy Research Associates.
46 RESOURCES TO RESERVES
On the latter point, one of the major issues for the coming 25 years will be howto attract enough capital to ensure adequate supplies of fossil fuels, as underlinedin IEA publications (IEA WEO-2003 and IEA WEO-2004). On the other hand, theIEA WEO-2004 Reference Scenario also assumes a fairly moderate, relativelystable oil market environment, with prices between USD 22 and USD 29 perbarrel. Attracting large amounts of capital in a moderate price context will bepossible only if the cost of exploring, producing, transporting and transforminghydrocarbons is low enough to ensure adequate return on capital.
As hydrocarbon production shifts to more difficult fields, the onus will be onvigorously advancing technology to curb rising costs. Even with already provenreserves, which are by definition already profitable using current technology andat current prices, substantial capital investment must in any case be mobilised toextract the hydrocarbons. If this capital is to be secured, further cost cuts will benecessary in order to increase return on capital. The degree to which this isabsolutely critical is illustrated in Figure 2.1. Current production declines veryrapidly if not sustained by new investment.
Over the years, technological progress has been a principal enabling factor incontrolling the cost of exploration and production of oil and gas. Major advances inthe 1980s and 1990s like three-dimensional seismic and horizontal wells have hada dramatic impact on the industry. Figure 2.5, for example, shows an estimate of therole of technology in reducing costs in offshore production in the United States.
When considering approaches for the future, it should not be forgotten thatcost-effectiveness cannot be reduced to a couple of breakthrough technologies.It covers a multitude of small improvements in all aspects of the industry'sactivities. Three main areas can nevertheless be identified: low-cost wells, i-fieldtechnologies, and the economies of scale possible in mature fields. They arediscussed in turn below.
Box 3 • Russia and Former Soviet Union (FSU) countries
Russia — and to some extent other FSU countries — deserve special mention as they are notprominent in the above discussion centring on OPEC Middle East and other regions. Theynevertheless play a key role in the world supply of oil and gas.
OilRussia has very sizeable oil reserves (IEA WEO-2004), amounting to some 70 billion barrelsof proven reserves, as well as what must be the equivalent in discovered but not yet provenresources. In addition, Russia has a potential in excess of 100 billion barrels of undiscoveredoil in the vast, poorly explored territories of Eastern Siberia and on the Northern and Easternseaboards.
After peaking in the 1980s, production declined rapidly in the early 1990s, before staging animpressive recovery between 1997 and 2004. This recent increase in production is largelyassociated with the introduction of modern technologies, following an influx of westernexpertise and practices.
CHAPTER 2 • “CONVENTIONAL” OIL AND GAS 47
The current structure of the industry is still changing, with both State and private sector
playing significant roles. Rather like in the Middle East producing countries, the State brings
strong political views to the industry, but the private companies have been leading the
introduction of more modern technologies.
Although substantial mileage remains in more widespread use of technologies developed
in other countries, much innovation may well be spurred within Russia itself by the
characteristics of the country: remote location of reservoirs, large transportation distances,
difficult climate, highly educated workforce, relatively low labour and industrial equipment
costs. Given the right political and economic environment, Russia will probably play a
key role in oil exploration and production innovation over the next 20 years, starting with
local, custom-made, cost-effective technologies, which could later be exported and applied
in other regions.
GasAs shown in Figure 1.9 (Chapter 1), Russia and the FSU states have about one-third of the
proven gas reserves in the world, and probably a similar fraction of conventional gas
resources. They also possess considerable potential for non-conventional gas (especially coal
bed methane and methane hydrates; see Chapter 4). Russia is — and is likely to remain — the
primary source for meeting the growing gas needs of the European countries. There is also
strong interest from China and Japan in gas supplies from eastern Russia, as well as other
FSU gas producers like Kazakhstan and Turkmenistan.
The gas sector is largely dominated by the state company Gazprom. Although a few smaller
independent producers like Novatek have now emerged, Gazprom continues to leverage its
monopoly on long-distance transport to play a role in all major projects. Currently, most
production comes from a few, ageing giant fields (Medvezhye, Urengoy, Yamburg), which are
due for replacement by new green-field developments over the coming few years. Gazprom
brought on stream the large Zapolyar field in 2003, and the company is holding extensive
discussions with possible western partners to develop the super giant Shtokman field in the
Barents Sea. It is expected that this field will require capital investment in excess of USD 20
billion. To date, participation of international companies has been limited to the Sakhalin
Island fields in the Far East.
As in the case of oil, factors such as remoteness, climate and long distances to markets create
a great need for new technologies in the sector. Gazprom has a long tradition of internal
investment in technology, with a number of active R&D laboratories. It has been relatively
slow (compared with the oil sector) in adopting western technical practices. Many experts
believe that, beyond the difficult offshore developments (Sakhalin, Shtokman) for which
Russia considers western technology necessary, appropriate use of innovative technologies
can provide a key to realising a very large potential for efficiency and recovery improvements
in existing fields, as well as in the transportation system. How and when this need for
technology and investment is met will depend in large part on how the structure of the gas
industry evolves in Russia.
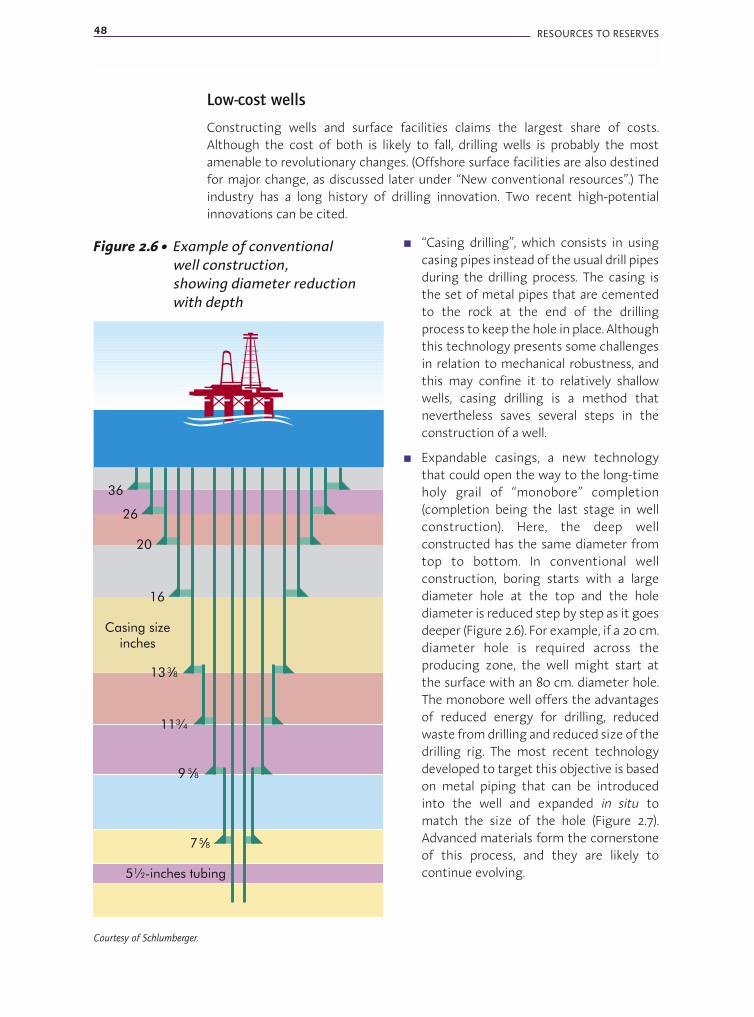
48 RESOURCES TO RESERVES
Low-cost wells
Constructing wells and surface facilities claims the largest share of costs.Although the cost of both is likely to fall, drilling wells is probably the mostamenable to revolutionary changes. (Offshore surface facilities are also destinedfor major change, as discussed later under “New conventional resources”.) Theindustry has a long history of drilling innovation. Two recent high-potentialinnovations can be cited.
■ “Casing drilling”, which consists in usingcasing pipes instead of the usual drill pipesduring the drilling process. The casing isthe set of metal pipes that are cementedto the rock at the end of the drillingprocess to keep the hole in place. Althoughthis technology presents some challengesin relation to mechanical robustness, andthis may confine it to relatively shallowwells, casing drilling is a method thatnevertheless saves several steps in theconstruction of a well.
■ Expandable casings, a new technologythat could open the way to the long-timeholy grail of “monobore” completion(completion being the last stage in wellconstruction). Here, the deep wellconstructed has the same diameter fromtop to bottom. In conventional wellconstruction, boring starts with a largediameter hole at the top and the holediameter is reduced step by step as it goesdeeper (Figure 2.6). For example, if a 20 cm.diameter hole is required across theproducing zone, the well might start atthe surface with an 80 cm. diameter hole.The monobore well offers the advantagesof reduced energy for drilling, reducedwaste from drilling and reduced size of thedrilling rig. The most recent technologydeveloped to target this objective is basedon metal piping that can be introducedinto the well and expanded in situ tomatch the size of the hole (Figure 2.7).Advanced materials form the cornerstoneof this process, and they are likely tocontinue evolving.
Casing sizeinches
5½-inches tubing
36
26
20
16
11¾
7
133/8
9 5/8
5/8
Figure 2.6 • Example of conventionalwell construction,showing diameter reductionwith depth
Courtesy of Schlumberger.
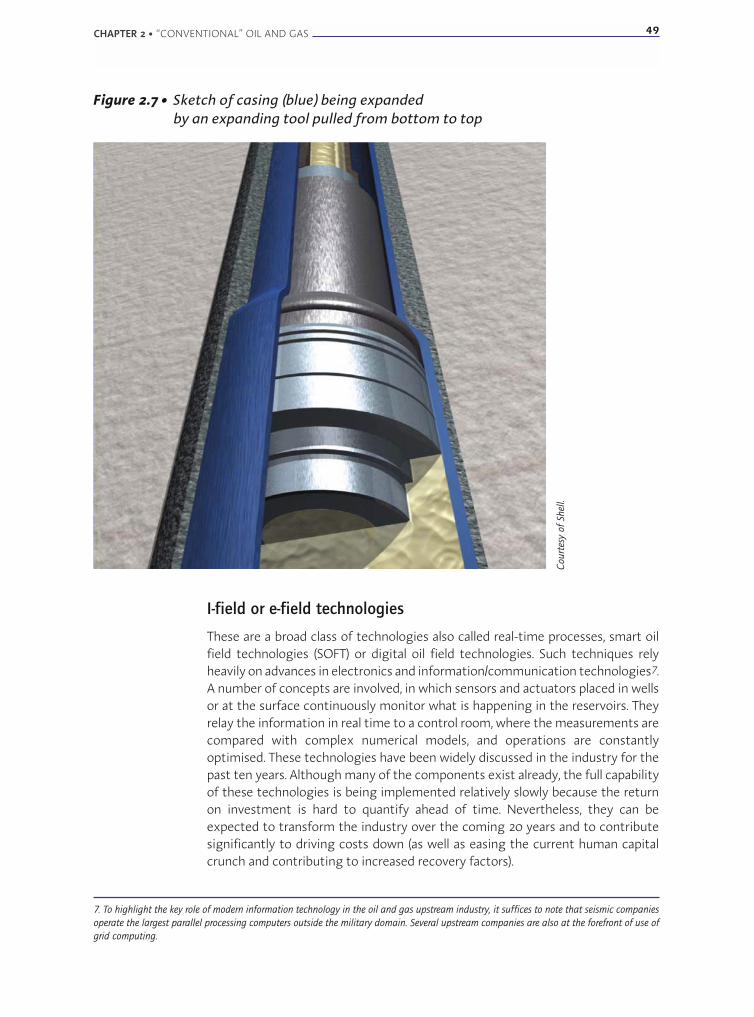
I-field or e-field technologies
These are a broad class of technologies also called real-time processes, smart oilfield technologies (SOFT) or digital oil field technologies. Such techniques relyheavily on advances in electronics and information/communication technologies7.A number of concepts are involved, in which sensors and actuators placed in wellsor at the surface continuously monitor what is happening in the reservoirs. Theyrelay the information in real time to a control room, where the measurements arecompared with complex numerical models, and operations are constantlyoptimised. These technologies have been widely discussed in the industry for thepast ten years. Although many of the components exist already, the full capabilityof these technologies is being implemented relatively slowly because the returnon investment is hard to quantify ahead of time. Nevertheless, they can beexpected to transform the industry over the coming 20 years and to contributesignificantly to driving costs down (as well as easing the current human capitalcrunch and contributing to increased recovery factors).
CHAPTER 2 • “CONVENTIONAL” OIL AND GAS 49
Figure 2.7 • Sketch of casing (blue) being expandedby an expanding tool pulled from bottom to top
Court
esy
of
Shel
l.
7. To highlight the key role of modern information technology in the oil and gas upstream industry, it suffices to note that seismic companies
operate the largest parallel processing computers outside the military domain. Several upstream companies are also at the forefront of use of
grid computing.
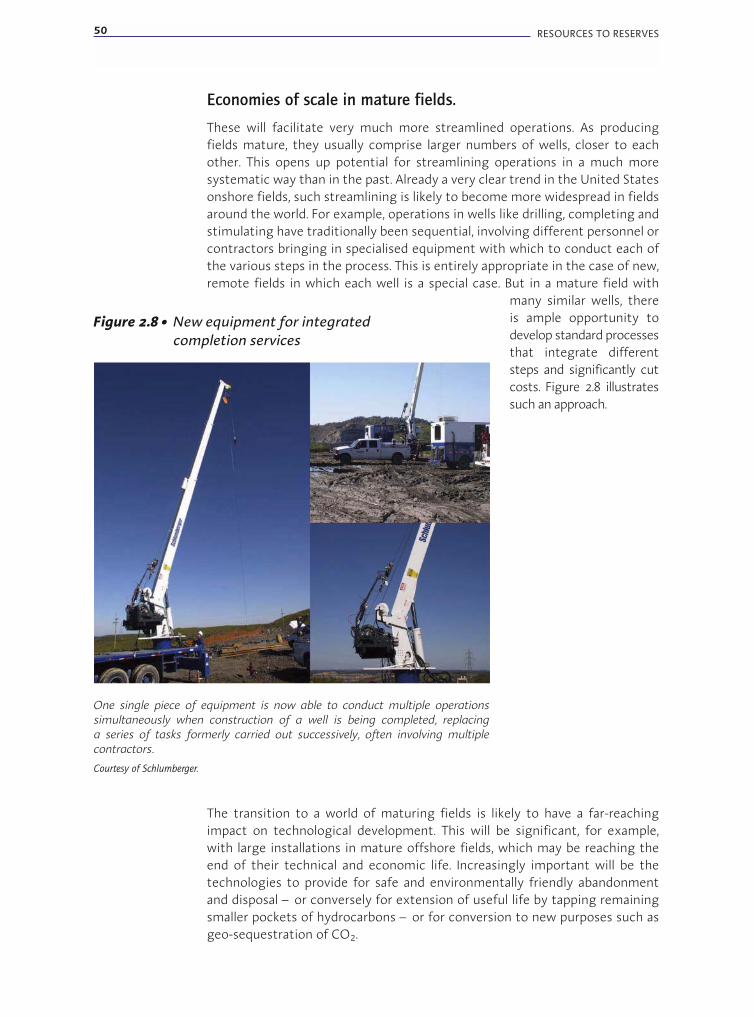
50 RESOURCES TO RESERVES
Economies of scale in mature fields.
These will facilitate very much more streamlined operations. As producingfields mature, they usually comprise larger numbers of wells, closer to eachother. This opens up potential for streamlining operations in a much moresystematic way than in the past. Already a very clear trend in the United Statesonshore fields, such streamlining is likely to become more widespread in fieldsaround the world. For example, operations in wells like drilling, completing andstimulating have traditionally been sequential, involving different personnel orcontractors bringing in specialised equipment with which to conduct each ofthe various steps in the process. This is entirely appropriate in the case of new,remote fields in which each well is a special case. But in a mature field with
many similar wells, thereis ample opportunity todevelop standard processesthat integrate differentsteps and significantly cutcosts. Figure 2.8 illustratessuch an approach.
Figure 2.8 • New equipment for integratedcompletion services
One single piece of equipment is now able to conduct multiple operationssimultaneously when construction of a well is being completed, replacinga series of tasks formerly carried out successively, often involving multiplecontractors.
Courtesy of Schlumberger.
The transition to a world of maturing fields is likely to have a far-reachingimpact on technological development. This will be significant, for example,with large installations in mature offshore fields, which may be reaching theend of their technical and economic life. Increasingly important will be thetechnologies to provide for safe and environmentally friendly abandonmentand disposal – or conversely for extension of useful life by tapping remainingsmaller pockets of hydrocarbons – or for conversion to new purposes such asgeo-sequestration of CO2.
Improved recovery
What is recovery?When oil contained in the pores of the sedimentary rocks forming the reservoiris extracted, it needs to be replaced by something else. The replacement can befluids already contained in the reservoir, such as water located below the oil, orgas located above the oil or in solution. This oil production mechanism is called“primary” recovery. But water or gas can also be injected into the reservoir toreplace or “sweep” the oil. This is called “secondary” recovery, even though theprocess often runs from the very start of production. Finally, more complexmaterials can be injected (polymer solutions in water, surfactants, steam,microbes) and this is called “tertiary” recovery. Needless to say, the materialsinjected must carry less value than the oil extracted.
While the figures vary widely, depending on the reservoir characteristics, primaryrecovery can typically extract 10% to 30% of the oil in place, and secondaryrecovery an additional 10% to 30% (a total of 30% to 50%). Extracting muchmore than 40% of the reservoir's oil usually requires additional steps in the wayof tertiary recovery, which may or may not be economical.
The above refers to oil. Gas reservoirs typically have much higher recovery factorsof 70% to 80%. Improved recovery in gas reservoirs has therefore received littleattention. There exist, however, gas reservoirs, like those underlain by strongactive aquifers, for which recovery can be low for reasons very similar to those inoil reservoirs. The technologies discussed below are applicable in such cases.
TrendsIt is well known that in most reservoirs one-half to two-thirds of the hydrocarbonsin place are actually left in the ground at the time the field is abandoned as nolonger economical. Average oil recovery rates world wide are currently around35%8. This is illustrated vividly by Figure 2.9 for the United States.
Some fields are now reaching 50% recovery rates. Norway, for example, has beenparticularly active in bringing up the recovery levels, as shown in Figure 2.10.Increasing the worldwide average recovery rate to 45% in existing fields wouldusher in “new” oil reserves larger than those of Saudi Arabia. It should be notedthat the assumptions on recovery rates made in the USGS estimates ofworldwide ultimately recoverable hydrocarbons (Figure 1.5) are not explicit. Theyinclude a “reserve growth” factor for known fields, which is based on historicalexperience in the United States. This takes into account a certain amount ofenhanced oil recovery (EOR), since CO2 injection or thermal recovery are usedextensively in the United States, but it does not reflect the potential oftechniques not widely used, for instance polymer floods or microbial EOR (MEOR).
CHAPTER 2 • “CONVENTIONAL” OIL AND GAS 51
8. Numbers of this order are often quoted, but rarely supported by abundant data. In fact, it is in principle necessary to look at abandoned
reservoirs, estimate original oil in place (which is always somewhat uncertain) and compare it with actual cumulative production up till
abandonment. Also, because such analysis looks at the past, it does not necessarily take into account current, more advanced technology
practices. The data available is mainly from the United States.
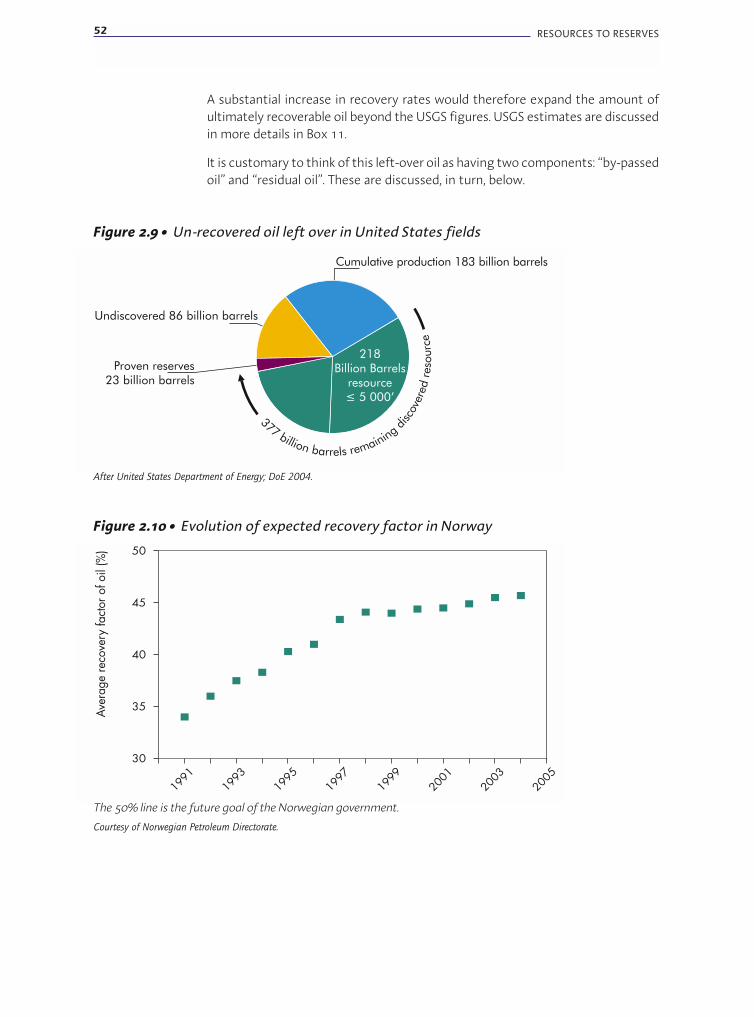
52 RESOURCES TO RESERVES
A substantial increase in recovery rates would therefore expand the amount ofultimately recoverable oil beyond the USGS figures. USGS estimates are discussedin more details in Box 11.
It is customary to think of this left-over oil as having two components: “by-passedoil” and “residual oil”. These are discussed, in turn, below.
Undiscovered 86 billion barrels
Proven reserves23 billion barrels
Cumulative production 183 billion barrels
218Billion Barrels
resource5 000’�
377billion barrels remaining
disc
over
edre
sourc
e
Figure 2.9 • Un-recovered oil left over in United States fields
After United States Department of Energy; DoE 2004.
30
35
40
45
50
2005
2003
2001
1999
1997
1995
1993
1991
Aver
age
reco
very
fact
or o
f oil
(%)
Figure 2.10 • Evolution of expected recovery factor in Norway
The 50% line is the future goal of the Norwegian government.
Courtesy of Norwegian Petroleum Directorate.
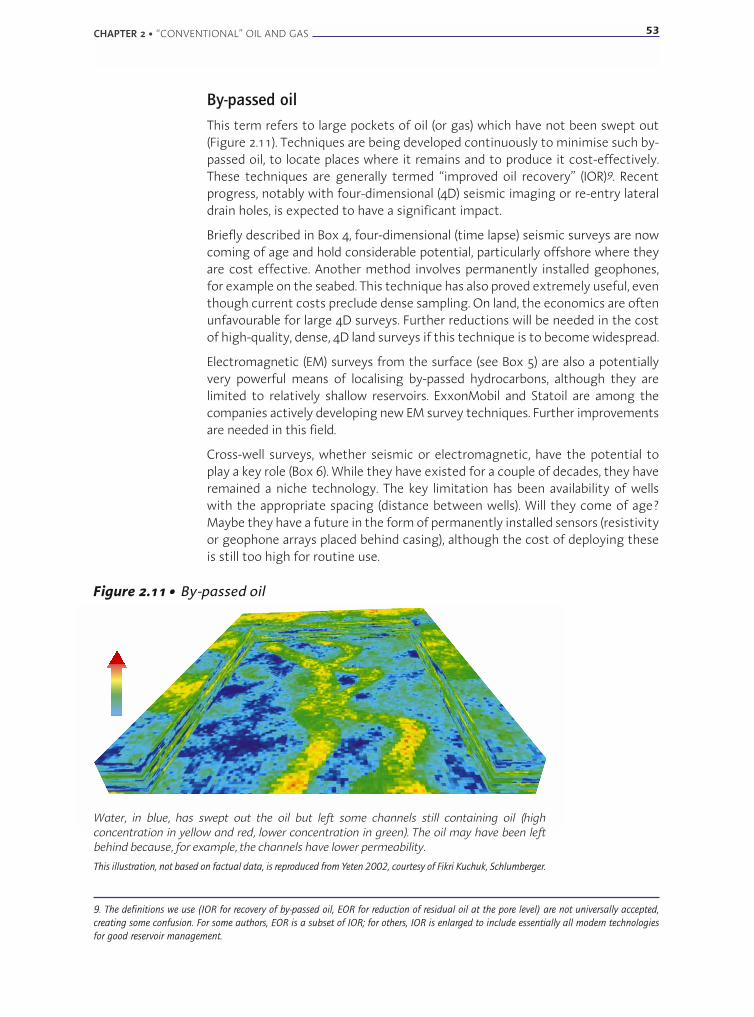
By-passed oil
This term refers to large pockets of oil (or gas) which have not been swept out(Figure 2.11). Techniques are being developed continuously to minimise such by-passed oil, to locate places where it remains and to produce it cost-effectively.These techniques are generally termed “improved oil recovery” (IOR)9. Recentprogress, notably with four-dimensional (4D) seismic imaging or re-entry lateraldrain holes, is expected to have a significant impact.
Briefly described in Box 4, four-dimensional (time lapse) seismic surveys are nowcoming of age and hold considerable potential, particularly offshore where theyare cost effective. Another method involves permanently installed geophones,for example on the seabed. This technique has also proved extremely useful, eventhough current costs preclude dense sampling. On land, the economics are oftenunfavourable for large 4D surveys. Further reductions will be needed in the costof high-quality, dense, 4D land surveys if this technique is to become widespread.
Electromagnetic (EM) surveys from the surface (see Box 5) are also a potentiallyvery powerful means of localising by-passed hydrocarbons, although they arelimited to relatively shallow reservoirs. ExxonMobil and Statoil are among thecompanies actively developing new EM survey techniques. Further improvementsare needed in this field.
Cross-well surveys, whether seismic or electromagnetic, have the potential toplay a key role (Box 6). While they have existed for a couple of decades, they haveremained a niche technology. The key limitation has been availability of wellswith the appropriate spacing (distance between wells). Will they come of age?Maybe they have a future in the form of permanently installed sensors (resistivityor geophone arrays placed behind casing), although the cost of deploying theseis still too high for routine use.
CHAPTER 2 • “CONVENTIONAL” OIL AND GAS 53
Figure 2.11 • By-passed oil
Water, in blue, has swept out the oil but left some channels still containing oil (highconcentration in yellow and red, lower concentration in green). The oil may have been leftbehind because, for example, the channels have lower permeability.
This illustration, not based on factual data, is reproduced from Yeten 2002, courtesy of Fikri Kuchuk, Schlumberger.
9. The definitions we use (IOR for recovery of by-passed oil, EOR for reduction of residual oil at the pore level) are not universally accepted,
creating some confusion. For some authors, EOR is a subset of IOR; for others, IOR is enlarged to include essentially all modern technologies
for good reservoir management.
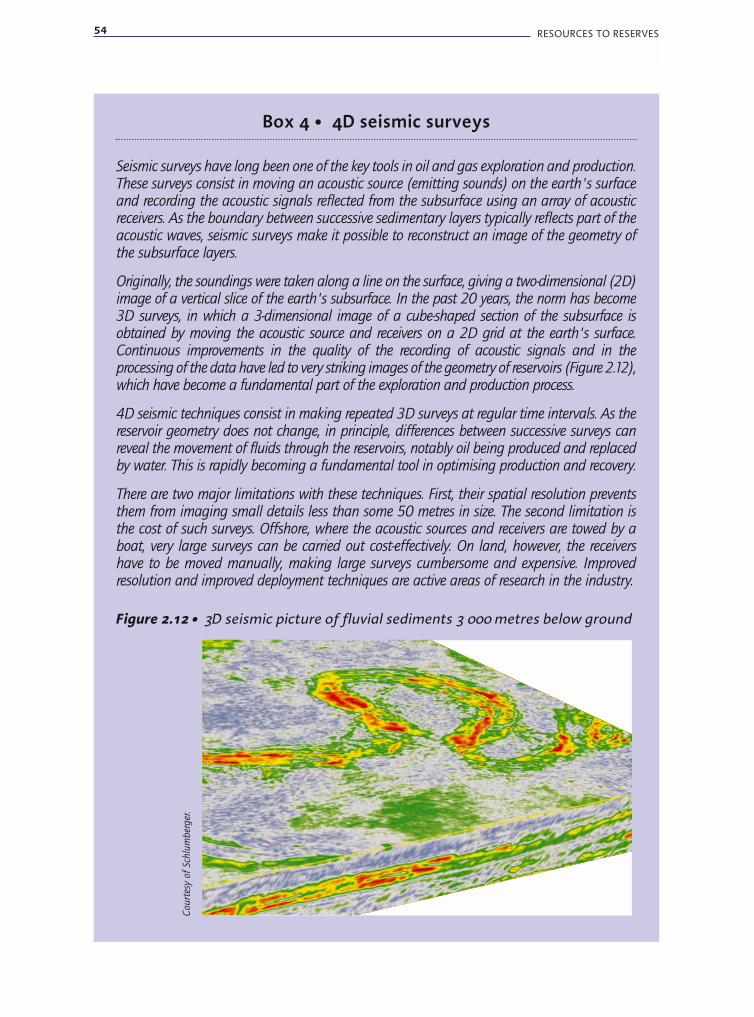
54 RESOURCES TO RESERVES
Box 4 • 4D seismic surveys
Seismic surveys have long been one of the key tools in oil and gas exploration and production.These surveys consist in moving an acoustic source (emitting sounds) on the earth's surfaceand recording the acoustic signals reflected from the subsurface using an array of acousticreceivers. As the boundary between successive sedimentary layers typically reflects part of theacoustic waves, seismic surveys make it possible to reconstruct an image of the geometry ofthe subsurface layers.
Originally, the soundings were taken along a line on the surface, giving a two-dimensional (2D)image of a vertical slice of the earth's subsurface. In the past 20 years, the norm has become3D surveys, in which a 3-dimensional image of a cube-shaped section of the subsurface isobtained by moving the acoustic source and receivers on a 2D grid at the earth's surface.Continuous improvements in the quality of the recording of acoustic signals and in theprocessing of the data have led to very striking images of the geometry of reservoirs (Figure 2.12),which have become a fundamental part of the exploration and production process.
4D seismic techniques consist in making repeated 3D surveys at regular time intervals. As thereservoir geometry does not change, in principle, differences between successive surveys canreveal the movement of fluids through the reservoirs, notably oil being produced and replacedby water. This is rapidly becoming a fundamental tool in optimising production and recovery.
There are two major limitations with these techniques. First, their spatial resolution preventsthem from imaging small details less than some 50 metres in size. The second limitation isthe cost of such surveys. Offshore, where the acoustic sources and receivers are towed by aboat, very large surveys can be carried out cost-effectively. On land, however, the receivershave to be moved manually, making large surveys cumbersome and expensive. Improvedresolution and improved deployment techniques are active areas of research in the industry.
Figure 2.12 • 3D seismic picture of fluvial sediments 3 000 metres below ground
Court
esy
of
Schlu
mber
ger
.
Another technique, known as “behind-casing logging”, is described in Box 7. Thisis a routine technique nowadays and has a large impact on re-assessment of oldfields for un-produced layers of hydrocarbon. Its importance will definitelycontinue to grow.
Once by-passed oil has been identified, it needs to be accessed. Because eachremaining pocket may be small, this can be done economically only if the cost islow enough for drilling and completing new wells, re-entering existing wells orcompleting lateral well bores. Considerable progress has been made with coiledtubing drilling and re-entry, for example, but more is needed, particularlyoffshore (see Box 8).
CHAPTER 2 • “CONVENTIONAL” OIL AND GAS 55
Box 5 • Electromagnetic surveys
Unlike seismic (acoustic) surveys, which respond primarily to the geometry of the reservoirsand only to a much smaller extent to the nature of the fluids, electromagnetic measurementtechniques are well suited, in principle, to remotely differentiating between oil and water. Thisis because oil-containing rocks tend to have much lower electrical conductivity than water-containing rocks. This sensitivity is routinely used in well-logging (taking measurements inwells) and is a key part of any assessment of oil in-place. Electromagnetic measurementstaken from the surface also have a long history and they have been used extensively in themineral mining industry10. But in the oil and gas industry, where interest is in deeply buriedsediments, their handicap is very poor spatial resolution in comparison with seismic surveys,and this has prevented extensive application. Recently, however, interest in this technologyhas been revived by the convergence of two factors: measurement capability and emergenceof the deepwater market. In the deepwater context, the reservoirs of interest are still very deepbelow the sea's surface, but often not very deep below the seabed. This enables modernelectromagnetic measurement techniques, using instruments placed near the seabed, toimage oil and water distribution — and their behaviour over time — with acceptable resolution.
10. Note that static magnetic surveys also have a long history of use in geological mapping; here we are concerned with AC surveys.
Box 6 • Cross-well surveys
In cross-well surveys, a source (acoustic or electromagnetic) is typically placed in one well andcorresponding receivers in another nearby well. From this an image can be obtained ofreservoir geometry and/or fluid distribution in the space between the wells. Because of theproximity to the reservoir, these images can provide much better spatial resolution, showingfiner details than images obtained from the surface. The principal limitations are the need toaccess two wells that are not too far apart, and to do so without disturbing ongoingproduction. Also, as this technique essentially provides information on a 2D slice of thereservoir only, its use to inform production decisions is more difficult than the 3D imagesprovided by surface seismic imaging. These technologies, initially introduced in the 1980s,have been steadily refined but their capacity to evolve is still considerable.
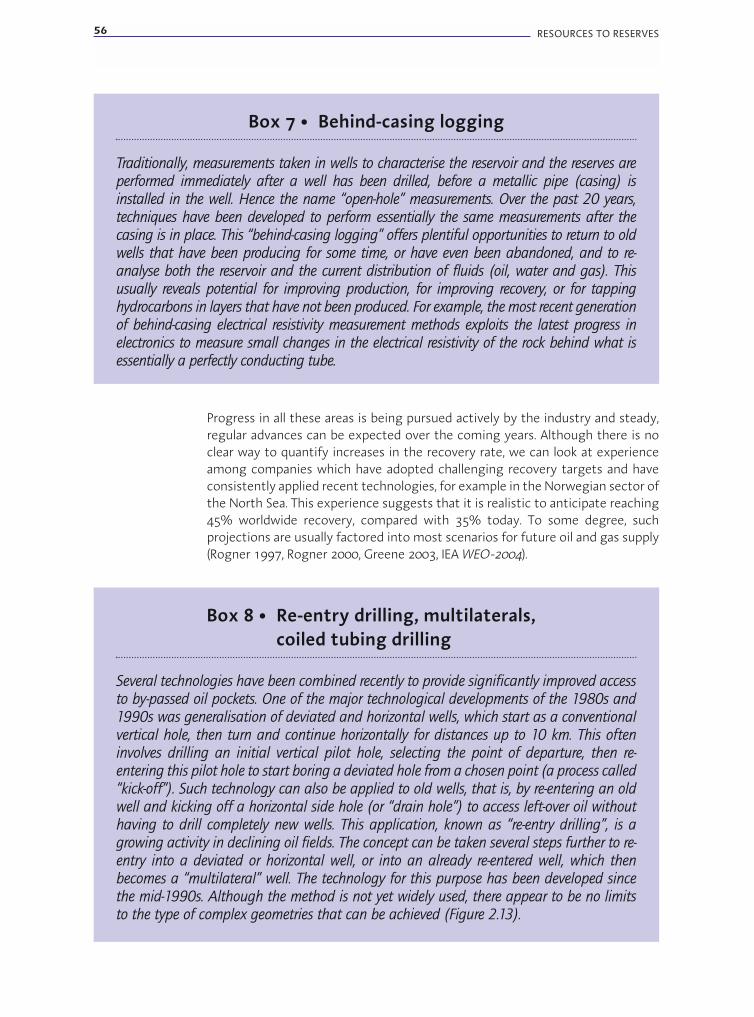
56 RESOURCES TO RESERVES
Progress in all these areas is being pursued actively by the industry and steady,regular advances can be expected over the coming years. Although there is noclear way to quantify increases in the recovery rate, we can look at experienceamong companies which have adopted challenging recovery targets and haveconsistently applied recent technologies, for example in the Norwegian sector ofthe North Sea. This experience suggests that it is realistic to anticipate reaching45% worldwide recovery, compared with 35% today. To some degree, suchprojections are usually factored into most scenarios for future oil and gas supply(Rogner 1997, Rogner 2000, Greene 2003, IEA WEO-2004).
Box 7 • Behind-casing logging
Traditionally, measurements taken in wells to characterise the reservoir and the reserves areperformed immediately after a well has been drilled, before a metallic pipe (casing) isinstalled in the well. Hence the name “open-hole” measurements. Over the past 20 years,techniques have been developed to perform essentially the same measurements after thecasing is in place. This “behind-casing logging” offers plentiful opportunities to return to oldwells that have been producing for some time, or have even been abandoned, and to re-analyse both the reservoir and the current distribution of fluids (oil, water and gas). Thisusually reveals potential for improving production, for improving recovery, or for tappinghydrocarbons in layers that have not been produced. For example, the most recent generationof behind-casing electrical resistivity measurement methods exploits the latest progress inelectronics to measure small changes in the electrical resistivity of the rock behind what isessentially a perfectly conducting tube.
Box 8 • Re-entry drilling, multilaterals,coiled tubing drilling
Several technologies have been combined recently to provide significantly improved accessto by-passed oil pockets. One of the major technological developments of the 1980s and1990s was generalisation of deviated and horizontal wells, which start as a conventionalvertical hole, then turn and continue horizontally for distances up to 10 km. This ofteninvolves drilling an initial vertical pilot hole, selecting the point of departure, then re-entering this pilot hole to start boring a deviated hole from a chosen point (a process called“kick-off”). Such technology can also be applied to old wells, that is, by re-entering an oldwell and kicking off a horizontal side hole (or “drain hole”) to access left-over oil withouthaving to drill completely new wells. This application, known as “re-entry drilling”, is agrowing activity in declining oil fields. The concept can be taken several steps further to re-entry into a deviated or horizontal well, or into an already re-entered well, which thenbecomes a “multilateral” well. The technology for this purpose has been developed sincethe mid-1990s. Although the method is not yet widely used, there appear to be no limitsto the type of complex geometries that can be achieved (Figure 2.13).

CHAPTER 2 • “CONVENTIONAL” OIL AND GAS 57
While cost savings with re-entry drilling to access
by-passed oil are significant because the drilling
of entirely new wells is no longer necessary, large,
expensive, conventional drilling rigs still need to
be mobilised for re-entry drilling. Coiled tubing
drilling, although not confined to re-entry drilling,
really comes into its own in this context. Instead
of using drill pipe coming in lengths of 10 metres
or so that need to be lifted and screwed together
as drilling progresses, coiled tubing involves a
small diameter drill pipe that can be coiled and
uncoiled as required (Figure 2.14). This, is turn,
has been made possible by advances in materials
sciences and permits re-entry drilling with a
smaller, more mobile and more cost-effective unit.
Figure 2.14 • Coiled tubing unit
Courtesy of Schlumberger.
Figure 2.13 • Schematics of multilateral wells
Ana
drill
Multibranched
Multilateral Well Configurations
Forked
Laterals into horizontal hole
Stacked laterals
Laterals into vertical hole
Dual-opposing laterals
Fracturedreservoirs
Layeredreservoirs
Shallow ordepleted reservoirs
Courtesy of Schlumberger.

58 RESOURCES TO RESERVES
Residual oil
This term refers to the hydrocarbons which remain in small pores of the rockafter secondary recovery (Figure 2.15). Numerous techniques exist for enhancedrecovery of residual oil, but essentially they all suffer from high costs. Cost-effective EOR is a key technical challenge for the industry.
Many techniques were developed in the early 1980s: polymer floods, surfactantfloods, CO2 or natural gas injection and various kinds of microbial treatment(Boxes 9 and 10). All involve poor economics, so that most research in this fieldhas been stopped. The fundamental reason for the poor economics is simply thatthe volumes required are very large because all the pore space needs to be filledwith the EOR material, which must therefore be very low-cost11.
Hydrocarbon gas and CO2 are particularly interesting materials for EOR.Depending on reservoir pressure and temperature, these gases can be immisciblewith oil and act primarily to push (sweep) the oil in a secondary recovery mode.Or they can be miscible, in which case they increase the mobility of the oil andimprove recovery beyond what is possible with secondary recovery, a processthat can then be classified as tertiary recovery.
Box 9 • Chemical enhanced oil recovery(surfactants, polymers …)
Surfactants are molecules with one hydrophilic (“water-loving”) side and one side that ishydrophobic, or rather lipophilic (“oil-loving”). As such, they can accumulate at theinterfaces between oil and water, changing the interfacial tension between the two andallowing small droplets of oil to be “solubilised” in water. Such substances are extensivelyused in detergents or shampoos. In the EOR context, they can be added to water injectedinto the reservoir and will help entrain more oil into the water. In technical terms, bychanging the interfacial tension, they reduce the “residual oil saturation” (the amount ofoil that cannot be pushed out by water).
Polymers are longer molecules which, added to the injection water at concentrations of afew tenths of percent, can play several roles, depending on the nature and properties of thepolymer used. By imparting higher viscosity to the injected water, they favour a moreregular displacement of oil by water. They often also have the ability to affect “wettability”and interfacial tension, thereby acting through mechanisms similar to those of surfactants.Finally, their viscosity often varies as a function of the size of the pores (“shear thinning”behaviour), and that can improve “areal sweep” by mitigating the tendency of water toflow through the higher permeability paths only. Other chemical substances can also beused to influence wettability, thereby affecting recovery.
Chemical EOR techniques were researched aggressively at the end of the 1970s and early1980s. But they have turned out to be uneconomical within the context of relatively lowoil prices over the past 20 years. Only a few pilot projects have remained active since thenand technical progress in this area has been very slow. Russia and China are the onlycountries to have continued using variants of polymer EOR to any significant extent.
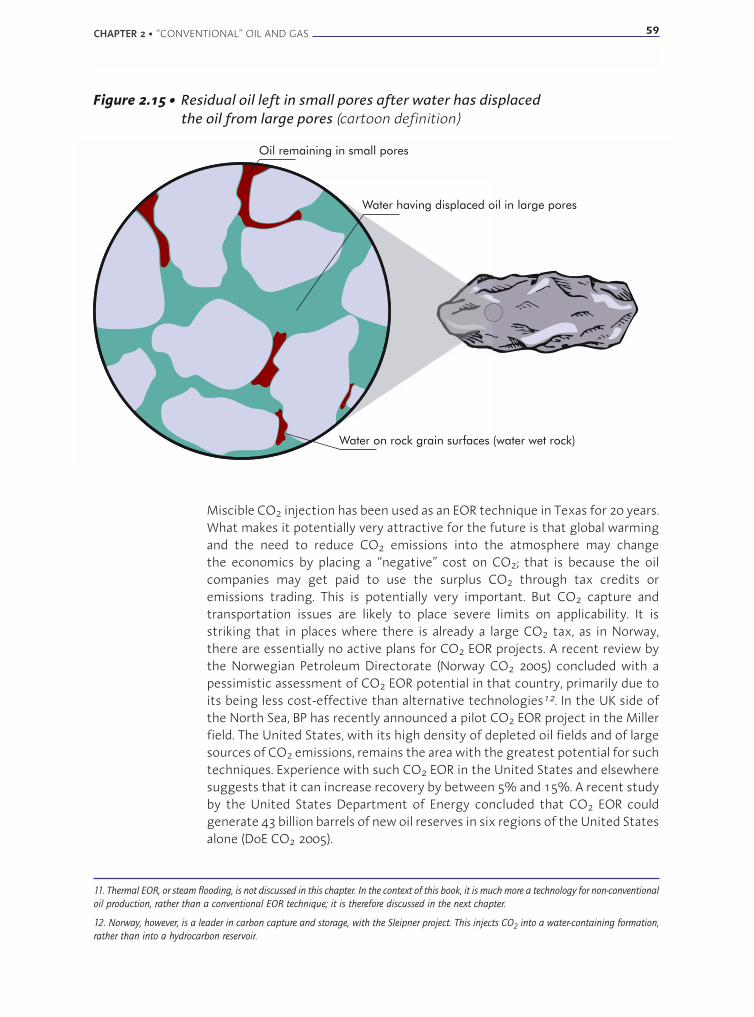
CHAPTER 2 • “CONVENTIONAL” OIL AND GAS 59
11. Thermal EOR, or steam flooding, is not discussed in this chapter. In the context of this book, it is much more a technology for non-conventional
oil production, rather than a conventional EOR technique; it is therefore discussed in the next chapter.
12. Norway, however, is a leader in carbon capture and storage, with the Sleipner project. This injects CO2 into a water-containing formation,
rather than into a hydrocarbon reservoir.
Oil remaining in small pores
Water having displaced oil in large pores
Water on rock grain surfaces (water wet rock)
Figure 2.15 • Residual oil left in small pores after water has displacedthe oil from large pores (cartoon definition)
Miscible CO2 injection has been used as an EOR technique in Texas for 20 years.What makes it potentially very attractive for the future is that global warmingand the need to reduce CO2 emissions into the atmosphere may changethe economics by placing a “negative” cost on CO2; that is because the oilcompanies may get paid to use the surplus CO2 through tax credits oremissions trading. This is potentially very important. But CO2 capture andtransportation issues are likely to place severe limits on applicability. It isstriking that in places where there is already a large CO2 tax, as in Norway,there are essentially no active plans for CO2 EOR projects. A recent review bythe Norwegian Petroleum Directorate (Norway CO2 2005) concluded with apessimistic assessment of CO2 EOR potential in that country, primarily due toits being less cost-effective than alternative technologies12. In the UK side ofthe North Sea, BP has recently announced a pilot CO2 EOR project in the Millerfield. The United States, with its high density of depleted oil fields and of largesources of CO2 emissions, remains the area with the greatest potential for suchtechniques. Experience with such CO2 EOR in the United States and elsewheresuggests that it can increase recovery by between 5% and 15%. A recent studyby the United States Department of Energy concluded that CO2 EOR couldgenerate 43 billion barrels of new oil reserves in six regions of the United Statesalone (DoE CO2 2005).
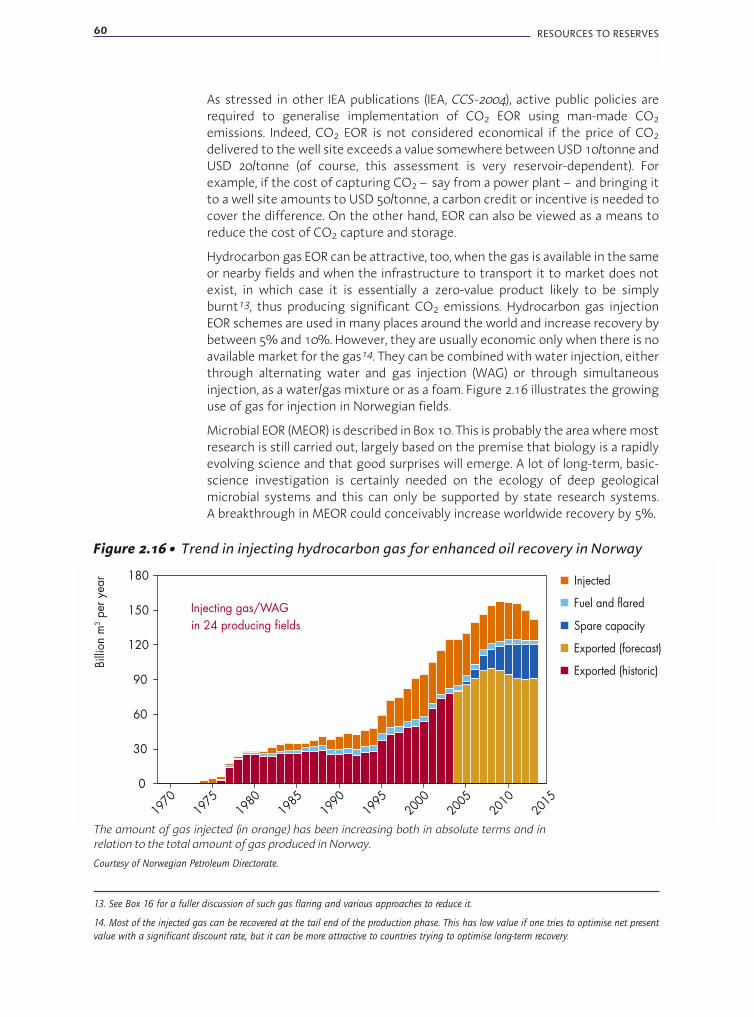
60 RESOURCES TO RESERVES
As stressed in other IEA publications (IEA, CCS-2004), active public policies arerequired to generalise implementation of CO2 EOR using man-made CO2emissions. Indeed, CO2 EOR is not considered economical if the price of CO2delivered to the well site exceeds a value somewhere between USD 10/tonne andUSD 20/tonne (of course, this assessment is very reservoir-dependent). Forexample, if the cost of capturing CO2 – say from a power plant – and bringing itto a well site amounts to USD 50/tonne, a carbon credit or incentive is needed tocover the difference. On the other hand, EOR can also be viewed as a means toreduce the cost of CO2 capture and storage.
Hydrocarbon gas EOR can be attractive, too, when the gas is available in the sameor nearby fields and when the infrastructure to transport it to market does notexist, in which case it is essentially a zero-value product likely to be simplyburnt13, thus producing significant CO2 emissions. Hydrocarbon gas injectionEOR schemes are used in many places around the world and increase recovery bybetween 5% and 10%. However, they are usually economic only when there is noavailable market for the gas14. They can be combined with water injection, eitherthrough alternating water and gas injection (WAG) or through simultaneousinjection, as a water/gas mixture or as a foam. Figure 2.16 illustrates the growinguse of gas for injection in Norwegian fields.
Microbial EOR (MEOR) is described in Box 10. This is probably the area where mostresearch is still carried out, largely based on the premise that biology is a rapidlyevolving science and that good surprises will emerge. A lot of long-term, basic-science investigation is certainly needed on the ecology of deep geologicalmicrobial systems and this can only be supported by state research systems.A breakthrough in MEOR could conceivably increase worldwide recovery by 5%.
Injected
Fuel and flared
Spare capacity
Exported (forecast)
Exported (historic)
0
30
60
90
120
150
180
1970
1975
1980
1985
1990
1995
2000
2005
2010
2015
Injecting gas/WAGin 24 producing fields
Billi
on m
3 per
yea
r
Figure 2.16 • Trend in injecting hydrocarbon gas for enhanced oil recovery in Norway
The amount of gas injected (in orange) has been increasing both in absolute terms and inrelation to the total amount of gas produced in Norway.
Courtesy of Norwegian Petroleum Directorate.
13. See Box 16 for a fuller discussion of such gas flaring and various approaches to reduce it.
14. Most of the injected gas can be recovered at the tail end of the production phase. This has low value if one tries to optimise net present
value with a significant discount rate, but it can be more attractive to countries trying to optimise long-term recovery.

Recovery in carbonate reservoirsA special word is necessary regarding carbonate reservoirs. The IEA World EnergyOutlook 2004 Reference Scenario projects a massive increase in oil productionfrom the Middle East, from 20 million barrels per day in 2002 to 50 millionbarrels per day in 2030. The region is dominated by carbonate reservoirs. Half ofworldwide proven reserves are in such carbonate reservoirs, in which productionperformance is notoriously more difficult to predict than in reservoirs dominatedby silicate minerals. There are usually two reasons for this. First, carbonatereservoir rocks are particularly heterogeneous, with small features that aredifficult to detect using seismic or other measurements, as in the case offractures, or “stylolites” (thin impermeable geological features) that sometimesdramatically affect the movement of fluids in the reservoir. The second reason isthat the rocks tend to be “oil wet”, which means that oil tends to stick to the rockbetter than water, thus reducing recovery from water injection. Significantprogress in understanding and managing such reservoirs is likely to be needed ifthe Middle East region is to deliver the large production increase projected by theIEA Reference Scenario.
The key to industry's capacity to develop the required technologies will be closepartnerships between the holders of the main carbonate reservoirs (primarilystate companies in the Middle East) and the technology providers (primarilylocated in IEA countries).
CHAPTER 2 • “CONVENTIONAL” OIL AND GAS 61
Box 10 • Microbial enhanced oil recovery (MEOR)
Several approaches to MEOR have been considered. One possibility is to try to stimulate
the activity of organisms naturally occurring in the reservoirs by feeding appropriate
nutrients through injection wells. Another is to inject suitable organisms that will colonise
the reservoir, prompted either by injected nutrients or by metabolising in-situ hydrocarbons.
The hope is that the metabolitic products of microbial activity — typically bio-polymers,
bio-surfactants and gas — can act to enhance oil mobility. Another possibility involves
organisms whose natural activity has the effect of degrading hydrocarbons, thus making
them less viscous and able to flow more easily. But most bacteria prefer to metabolise light
hydrocarbons, with the opposite effect.
In principle, by exploiting the organisms' ability to replicate in situ, MEOR can get around
the problems of other EOR techniques relating to the large injection volumes required.
Although some positive effects have been reported, control of the process remains a major
challenge. Indeed, microbial techniques can also be used to plug selected zones of the
reservoir, improving the sweep of remaining zones by injection water. This process is known
as “conformance control” and man-made polymers can also be used for such a purpose.
Applications of this sort illustrate the negative effects that can also occur until more is
understood about the development of bacterial colonies in reservoirs.

62 RESOURCES TO RESERVES
Summary on improved oil recoveryAs we have seen, many enhanced oil recovery techniques were developed in theearly 1980s, but their further development was abandoned during thesubsequent period of low oil prices. From this, a guess can be made regarding thepoint at which they will become economic again. Oil prices peaked in 1982 atabout USD 65 per barrel15 (2004 USD ), a price considered right to make EOReconomic. Assuming reasonable technical progress since 1982, it can beexpected that interest will be triggered again at sustained oil prices of roughlyUSD 40/barrel (2004 USD ). The sketch in Figure 2.17, published by Schlumbergerin 1992 (Schlumberger 1992) and based on work at the French PetroleumInstitute (IFP), implies significant EOR potential at USD 30/barrel in 1990 USD(equivalent to USD 43 in 2004 USD, on an inflation-adjusted basis). More recently(Oil and Gas Journal, March 2005), Cano Petroleum (www.canopetro.com) quotedlifting costs of USD 2/barrel to USD 4/barrel and full costs between USD 12 andUSD 25/barrel for its planned projects in Oklahoma and Texas. These figuresare based on alkaline-surfactant-polymer (ASP) injection, in which a solution ofsodium hydroxide, surfactants and polymers is pumped in, with claimedadditional recovery of 20% to 30% of original oil in place in very old fields. This isa delicate process, however, which remains to be fully proven.
Further cost reductions will call for some new fundamental research on rock-fluidinterfaces and how they can be affected by small amounts of additives. Suchresearch is needed now if it is to have an impact by 2030.
15. This is the peak in yearly averaged price; the price was actually higher for short periods between 1980 and 1982.
0
10
20
30
40
50
10 20 30 40 50 60 70 80
Polymer
60
0Recovery (% OIP)
Waterflood
CO2
Surfactant
ThermalCos
tUSD
/bbl
(199
0U
SD)
Figure 2.17 • Estimated cost of various enhanced oil recovery methods,in 1990 USD per barrel
Courtesy of Schlumberger.
CHAPTER 2 • “CONVENTIONAL” OIL AND GAS 63
Box 11 • United States Geological Survey resources estimates,reserves growth and enhanced oil recovery
The most widely used estimates of world hydrocarbon resources come from the USGS WorldPetroleum Assessment 2000. Viewed against other studies, its main merit is its publicavailability and the rather detailed descriptions of its methodology. The Assessment startswith a list of “petroleum systems”, or geological regions around the world capable of beinghydrocarbon-bearing. For each, the resources estimate comprises three parts: proven reserves,undiscovered resources and “reserves growth”.
Proven reserves are taken from published data or estimates from a panel of geologists familiarwith the area. Undiscovered resources are estimated by a panel of geologists and assignedvarious probabilities regarding occurrence, size, depth or recovery factor.
Reserves growth is estimated as a multiplication factor over proven reserves, depending onwhen the reservoir was discovered. The idea is to account for the fact that proven reserves(plus cumulative production) in a given reservoir tend to increase with time. There can bemany reasons for that. Initial estimates can be conservative, or additional drilling in or nearthe reservoir can reveal additional reserves. Or known resources in the reservoir that wereoriginally technically recoverable but non-economical can become economical — andtherefore proven — as a result of technological progress or changes in economic assumptions(for example, as infrastructure develops to produce the proven reserves, other resources may“piggy-back” economically on previous investments). Again, technological progress andsimply experience can bring higher recovery than originally planned. USGS derives anaverage historical reserve growth factor from a database of United States fields (shown inFigure 2.18) and applies it to all fields in the world. The process is also applied toundiscovered fields on the basis of their (statistically) assumed discovery date, the geologistshaving estimated their sizes by analogy with proven reserves in known reservoirs.
This process clearly assumes some EOR, since EOR may already be assumed in the figures forproven reserves, also because the reserve growth curve, calibrated on United States data,contains the amount of EOR historically performed in that country. However, the Assessmentdoes not take account of any contribution from EOR techniques not part of normal historicalpractice, or from greater use of currently practiced EOR. The underlying recovery rate is notclearly defined, but it is probably a bit higher than the historical United States rate. Indeed,other authors (Rogner 1997, Rogner 2000, Greene 2003) use figures similar to those ofUSGS, assuming that they correspond to a recovery of 40%, and that higher recoveries yieldadditional resources.
As discussed at the beginning of this chapter, estimates of recoverable resourcesfrom USGS assume some EOR, but by no means all the potential of the technologiesdiscussed above. Conservative recovery rate increases of 5% of oil in place add atleast 300 billion barrels of extra recoverable oil to the USGS figures. Indeed, someauthors (Rogner 1997; Rogner 2000) put this amount at 600 billion barrels. Thegeographical distribution of such “additional” oil should follow the pattern of theoriginal oil in place, and therefore look fairly similar to the distribution of provenreserves (see Figure 1.10 in Chapter 1), although there might be slightly more in theUnited States (with a potential for at least an extra 50 billion barrels).
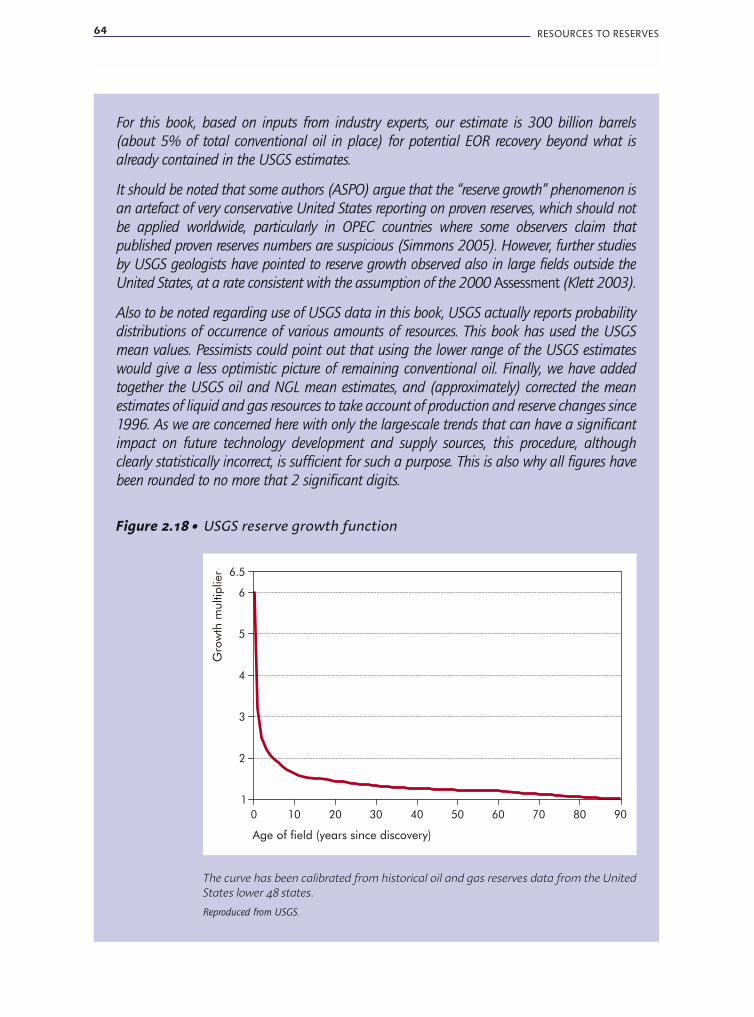
64 RESOURCES TO RESERVES
For this book, based on inputs from industry experts, our estimate is 300 billion barrels
(about 5% of total conventional oil in place) for potential EOR recovery beyond what is
already contained in the USGS estimates.
It should be noted that some authors (ASPO) argue that the “reserve growth” phenomenon is
an artefact of very conservative United States reporting on proven reserves, which should not
be applied worldwide, particularly in OPEC countries where some observers claim that
published proven reserves numbers are suspicious (Simmons 2005). However, further studies
by USGS geologists have pointed to reserve growth observed also in large fields outside the
United States, at a rate consistent with the assumption of the 2000 Assessment (Klett 2003).
Also to be noted regarding use of USGS data in this book, USGS actually reports probability
distributions of occurrence of various amounts of resources. This book has used the USGS
mean values. Pessimists could point out that using the lower range of the USGS estimates
would give a less optimistic picture of remaining conventional oil. Finally, we have added
together the USGS oil and NGL mean estimates, and (approximately) corrected the mean
estimates of liquid and gas resources to take account of production and reserve changes since
1996. As we are concerned here with only the large-scale trends that can have a significant
impact on future technology development and supply sources, this procedure, although
clearly statistically incorrect, is sufficient for such a purpose. This is also why all figures have
been rounded to no more that 2 significant digits.
Figure 2.18 • USGS reserve growth function
1
2
3
4
5
6
0 10 20 30 40 50 60 70 80 90
Age of field (years since discovery)
Gro
wth
mul
tiplie
r 6.5
The curve has been calibrated from historical oil and gas reserves data from the UnitedStates lower 48 states.
Reproduced from USGS.
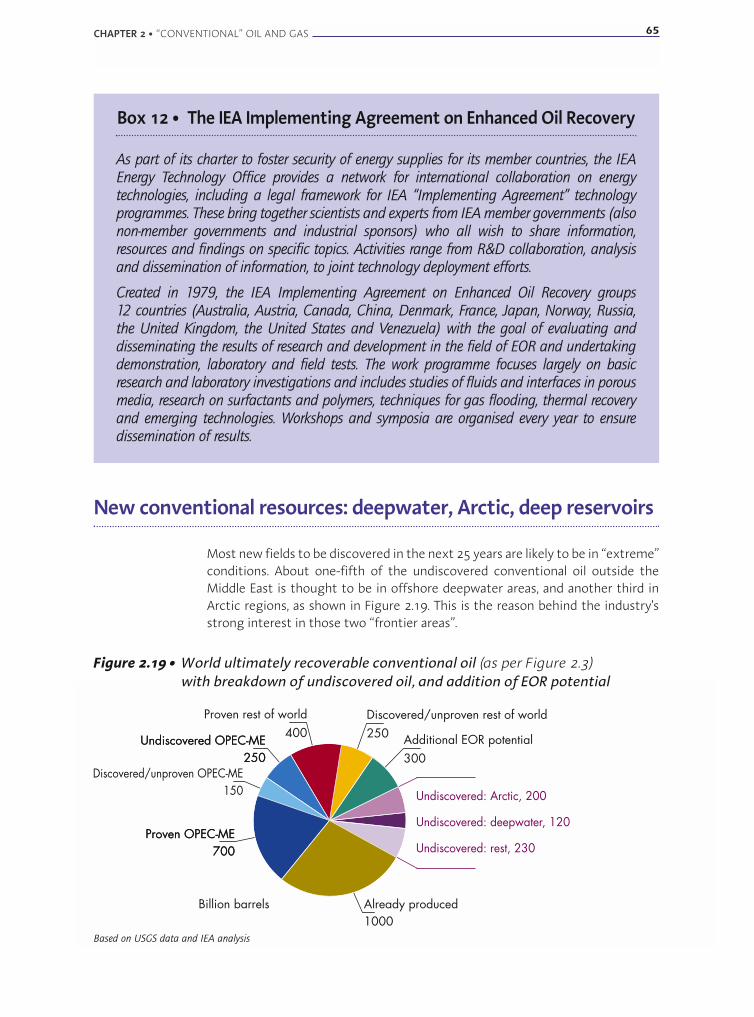
CHAPTER 2 • “CONVENTIONAL” OIL AND GAS 65
Box 12 • The IEA Implementing Agreement on Enhanced Oil Recovery
As part of its charter to foster security of energy supplies for its member countries, the IEAEnergy Technology Office provides a network for international collaboration on energytechnologies, including a legal framework for IEA “Implementing Agreement” technologyprogrammes. These bring together scientists and experts from IEA member governments (alsonon-member governments and industrial sponsors) who all wish to share information,resources and findings on specific topics. Activities range from R&D collaboration, analysisand dissemination of information, to joint technology deployment efforts.
Created in 1979, the IEA Implementing Agreement on Enhanced Oil Recovery groups12 countries (Australia, Austria, Canada, China, Denmark, France, Japan, Norway, Russia,the United Kingdom, the United States and Venezuela) with the goal of evaluating anddisseminating the results of research and development in the field of EOR and undertakingdemonstration, laboratory and field tests. The work programme focuses largely on basicresearch and laboratory investigations and includes studies of fluids and interfaces in porousmedia, research on surfactants and polymers, techniques for gas flooding, thermal recoveryand emerging technologies. Workshops and symposia are organised every year to ensuredissemination of results.
New conventional resources: deepwater, Arctic, deep reservoirs
Most new fields to be discovered in the next 25 years are likely to be in “extreme”conditions. About one-fifth of the undiscovered conventional oil outside theMiddle East is thought to be in offshore deepwater areas, and another third inArctic regions, as shown in Figure 2.19. This is the reason behind the industry'sstrong interest in those two “frontier areas”.
Proven OPEC-ME700
Proven OPEC-ME700
Discovered/unproven OPEC-ME150
Already produced1000
Discovered/unproven rest of world 250Undiscovered OPEC-ME
250Undiscovered OPEC-ME
250Additional EOR potential300
Billion barrels
Proven rest of world400
Undiscovered: Arctic, 200
Undiscovered: deepwater, 120
Undiscovered: rest, 230
Figure 2.19 • World ultimately recoverable conventional oil (as per Figure 2.3)with breakdown of undiscovered oil, and addition of EOR potential
Based on USGS data and IEA analysis
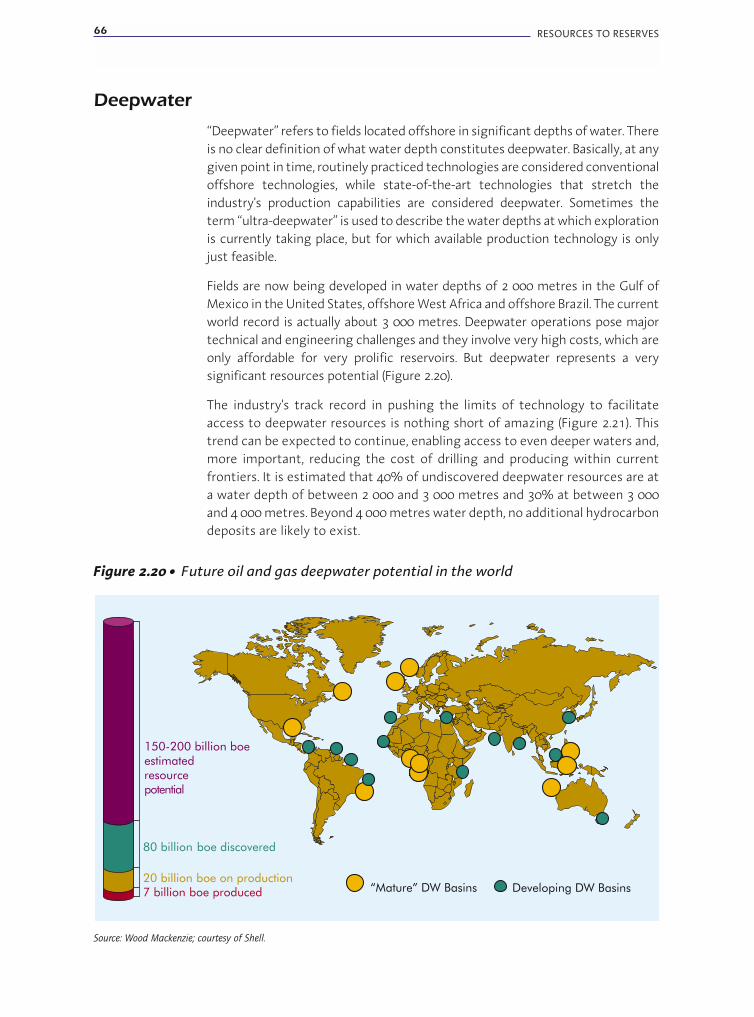
66 RESOURCES TO RESERVES
Deepwater
“Deepwater” refers to fields located offshore in significant depths of water. Thereis no clear definition of what water depth constitutes deepwater. Basically, at anygiven point in time, routinely practiced technologies are considered conventionaloffshore technologies, while state-of-the-art technologies that stretch theindustry's production capabilities are considered deepwater. Sometimes theterm “ultra-deepwater” is used to describe the water depths at which explorationis currently taking place, but for which available production technology is onlyjust feasible.
Fields are now being developed in water depths of 2 000 metres in the Gulf ofMexico in the United States, offshore West Africa and offshore Brazil. The currentworld record is actually about 3 000 metres. Deepwater operations pose majortechnical and engineering challenges and they involve very high costs, which areonly affordable for very prolific reservoirs. But deepwater represents a verysignificant resources potential (Figure 2.20).
The industry's track record in pushing the limits of technology to facilitateaccess to deepwater resources is nothing short of amazing (Figure 2.21). Thistrend can be expected to continue, enabling access to even deeper waters and,more important, reducing the cost of drilling and producing within currentfrontiers. It is estimated that 40% of undiscovered deepwater resources are ata water depth of between 2 000 and 3 000 metres and 30% at between 3 000and 4 000 metres. Beyond 4 000 metres water depth, no additional hydrocarbondeposits are likely to exist.
150-200 billion boeestimatedresourcepotential
“Mature” DW Basins Developing DW Basins
80 billion boe discovered
7 billion boe produced20 billion boe on production
Figure 2.20 • Future oil and gas deepwater potential in the world
Source: Wood Mackenzie; courtesy of Shell.
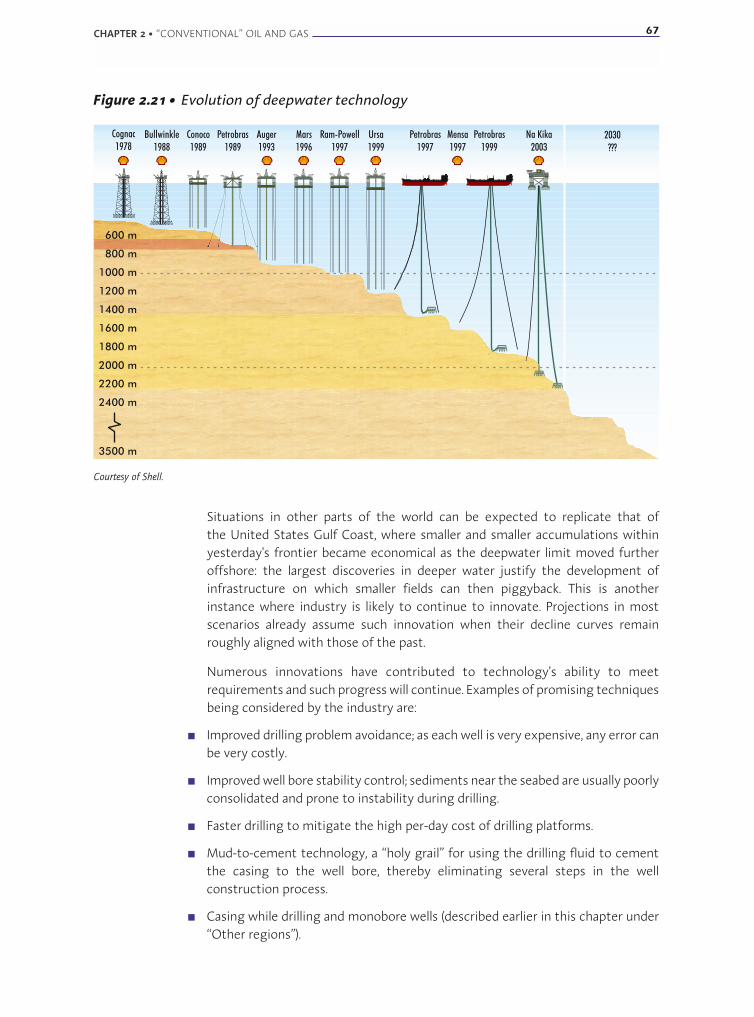
Situations in other parts of the world can be expected to replicate that ofthe United States Gulf Coast, where smaller and smaller accumulations withinyesterday's frontier became economical as the deepwater limit moved furtheroffshore: the largest discoveries in deeper water justify the development ofinfrastructure on which smaller fields can then piggyback. This is anotherinstance where industry is likely to continue to innovate. Projections in mostscenarios already assume such innovation when their decline curves remainroughly aligned with those of the past.
Numerous innovations have contributed to technology's ability to meetrequirements and such progress will continue. Examples of promising techniquesbeing considered by the industry are:
■ Improved drilling problem avoidance; as each well is very expensive, any error canbe very costly.
■ Improved well bore stability control; sediments near the seabed are usually poorlyconsolidated and prone to instability during drilling.
■ Faster drilling to mitigate the high per-day cost of drilling platforms.
■ Mud-to-cement technology, a “holy grail” for using the drilling fluid to cementthe casing to the well bore, thereby eliminating several steps in the wellconstruction process.
■ Casing while drilling and monobore wells (described earlier in this chapter under“Other regions”).
CHAPTER 2 • “CONVENTIONAL” OIL AND GAS 67
Na Kika
2003
Mars
1996
Cognac
1978
Bullwinkle
1988
Conoco
1989
Petrobras
1989
Petrobras
1999
Mensa
1997
Petrobras
1997
Ursa
1999
Ram-Powell
1997
Auger
1993
2030
???
600 m
800 m
2200 m
2400 m
3500 m
1000 m
1200 m
1400 m
1800 m
2000 m
1600 m
Figure 2.21 • Evolution of deepwater technology
Courtesy of Shell.
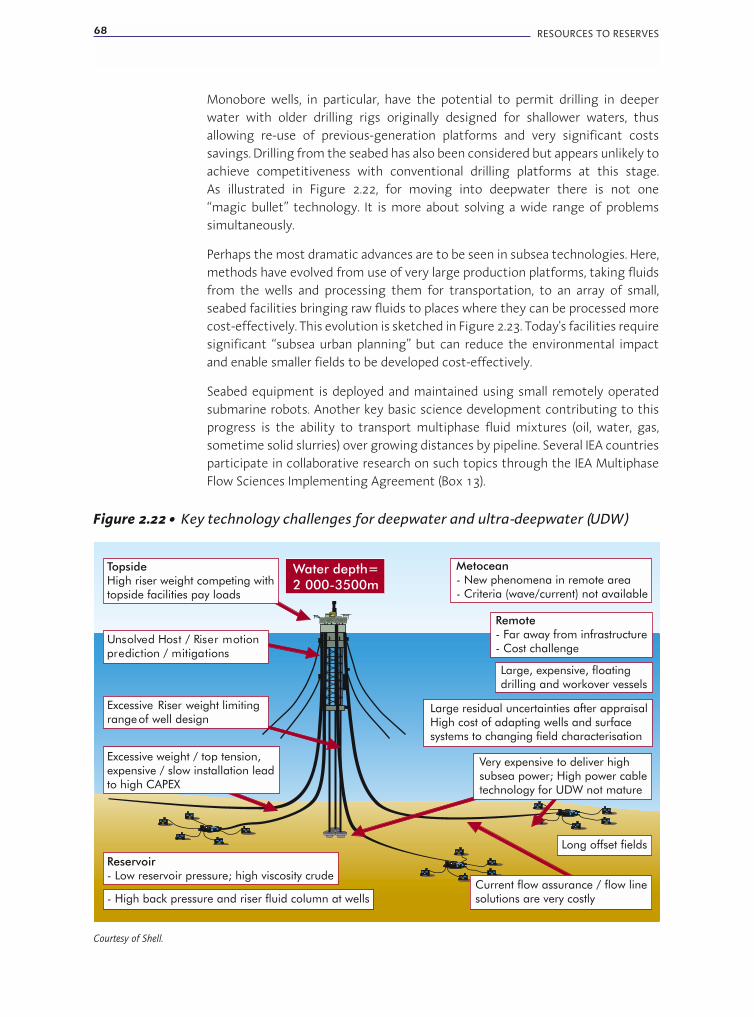
68 RESOURCES TO RESERVES
Monobore wells, in particular, have the potential to permit drilling in deeperwater with older drilling rigs originally designed for shallower waters, thusallowing re-use of previous-generation platforms and very significant costssavings. Drilling from the seabed has also been considered but appears unlikely toachieve competitiveness with conventional drilling platforms at this stage.As illustrated in Figure 2.22, for moving into deepwater there is not one“magic bullet” technology. It is more about solving a wide range of problemssimultaneously.
Perhaps the most dramatic advances are to be seen in subsea technologies. Here,methods have evolved from use of very large production platforms, taking fluidsfrom the wells and processing them for transportation, to an array of small,seabed facilities bringing raw fluids to places where they can be processed morecost-effectively. This evolution is sketched in Figure 2.23. Today's facilities requiresignificant “subsea urban planning” but can reduce the environmental impactand enable smaller fields to be developed cost-effectively.
Seabed equipment is deployed and maintained using small remotely operatedsubmarine robots. Another key basic science development contributing to thisprogress is the ability to transport multiphase fluid mixtures (oil, water, gas,sometime solid slurries) over growing distances by pipeline. Several IEA countriesparticipate in collaborative research on such topics through the IEA MultiphaseFlow Sciences Implementing Agreement (Box 13).
TopsideHigh riser weight competing withtopside facilities pay loads
Excessive weight / top tension,expensive / slow installation leadto high CAPEX
Reservoir- Low reservoir pressure; high viscosity crude
- High back pressure and riser fluid column at wells
Excessive Riser limitingrangeof well design
Metocean- New phenomena in remote area- Criteria (wave/current) not available
Remote- Far away from infrastructure- Cost challenge
Large, expensive, floatingdrilling and workover vessels
Large residual uncertainties after appraisalHigh cost of adapting wells and surfacesystems to changing field characterisation
Long offset fields
Current flow assurance / flow linesolutions are very costly
Unsolved Host / Riser motionprediction / mitigations
Very expensive to deliver highsubsea power; High power cabletechnology for UDW not mature
Water depth=2 000-3500m
weight
Figure 2.22 • Key technology challenges for deepwater and ultra-deepwater (UDW)
Courtesy of Shell.

CHAPTER 2 • “CONVENTIONAL” OIL AND GAS 69
Today
Floating production
Tomorrow
Subsea separationand transport to shore
Yesterday
Fixed platforms
Figure 2.23 • Evolving deepwater operations,from large surface facilities to subsea technologies
Court
esy
of
Norw
egia
n M
inis
try
of
Pet
role
um
and E
ner
gy.
Box 13 • The IEA Implementing Agreementon Multiphase Flow Sciences
The output from an oil or gas well is typically a “multiphase” mixture containing liquid oil,hydrocarbon gas, water and sometimes solids. Traditionally, the various elements areseparated near the well site and the streams of each “phase” transported separately totheir next destination (further processing, disposal).
In subsea technologies, this traditional approach is often uneconomical as it would meanlocating the separating equipment and several transport lines on the sea floor, anexpensive endeavour. It is much more attractive to be able to transport the multiphasestream directly over long distances in a single line, for processing onshore or on a distantproduction platform. This is difficult, however, because the pressure drops in multiphaseflows are very large and traditional pumps do not work efficiently on such flows.
Yet another trend is towards “downhole separation and re-injection”, which involvesattempting to separate the various phases at the bottom of the well itself, then to disposeof such unwanted substances as produced water by injecting them in deep geologicalformations, without bringing them to the surface.
All these technologies require better understanding of the complex physics of multiphaseflows. In fact, multiphase flows occur in a large number of processes throughout the energysector, notably in transportation of solid or pulverised coal, in combustion in boilers orengines and in water/steam cooling in boilers. Interest in all these questions prompted theestablishment, in 1987, of the IEA Implementing Agreement on Multiphase Flow Sciences,in which six countries (Australia, Canada, Mexico, Norway, the United Kingdom and theUnited States) pool their resources and share knowledge on upcoming technologies.

70 RESOURCES TO RESERVES
Distance - km
Brea
kev
enre
serv
es(m
illio
nba
rrel
s) 500
400
300
200
100
00 5 10 15 20 25 30 35 40
Conventionalsubsea
Subsea processing
Subsea processing+ MLW
Figure 2.25 • Impact of technology in making smaller hydrocarbon accumulationseconomical further away from existing platforms
The example here in deepwater offshore Angola shows that, for a given technology, as thenew field gets farther from existing installations, larger reserves are required to justify theinvestment in connecting to installations (e.g. conventional subsea curve). Successive newgenerations of technologies (e.g. subsea processing, then subsea processing + multilateralwells) lower the curve, enabling smaller fields to be developed economically.
Courtesy of Norsk Hydro.
0
20
40
60
80
100
120
140Fixed platforms Floating production solutions
SubseaNext Step
10
00
NO
Kin
vest
ed
per
daily
barr
elpro
duct
ion
Dra
ugen
Statfjo
rdB
Gullfa
ksA
Statfjo
rdC
Åsga
rdA
Njord
Åsga
rdB
Nor
ne
Figure 2.24 • Cost impact of evolving offshore technologyin the Norwegian sector of the North Sea
Note: 1 NOK = USD 0.16. The fields developed earlier are on the left, those developed later areon the right. They cover the period from 1980 to 2000.
Courtesy of Norwegian Ministry of Petroleum and Energy.
But further technology is needed to make deepwater projects economical. Currently,out of the 80 billion barrels of oil equivalent (both oil and gas) discovered in deepwaters, 30 billion barrels are not yet considered economic (at long-term oil prices ofUSD 25). The role of technology is crucial, as illustrated in Figures 2.24 and 2.25. Withcontinued progress over the next 25 years, essentially all deepwater resourcesshould become economical at long-term oil prices of between USD 20 and USD 35.
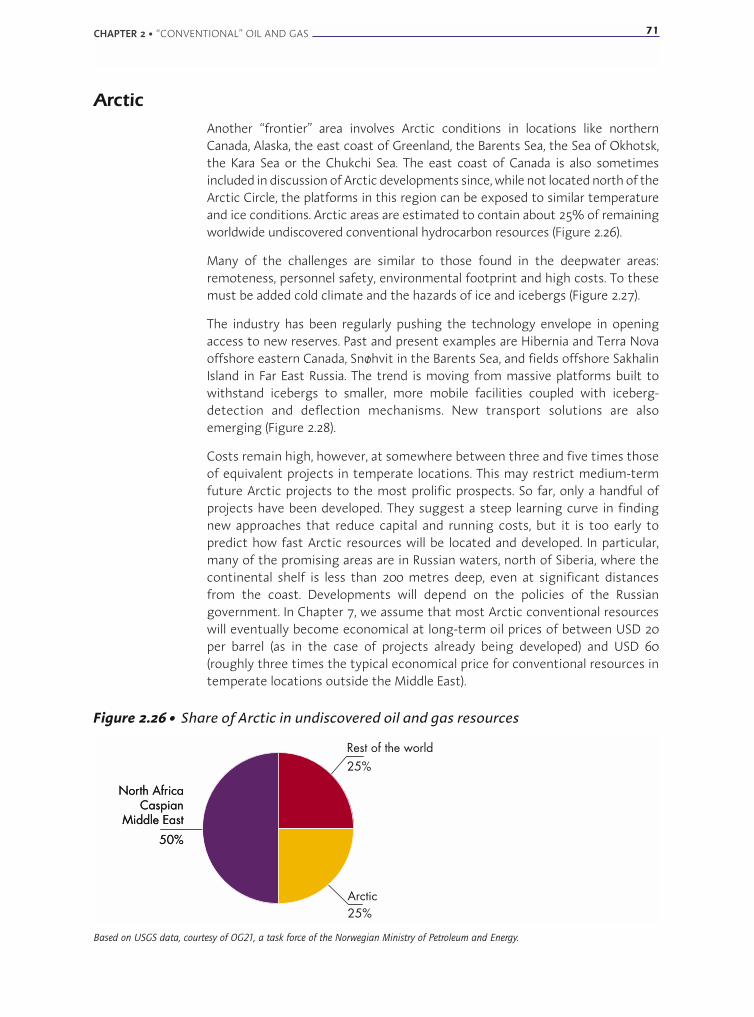
Arctic Another “frontier” area involves Arctic conditions in locations like northernCanada, Alaska, the east coast of Greenland, the Barents Sea, the Sea of Okhotsk,the Kara Sea or the Chukchi Sea. The east coast of Canada is also sometimesincluded in discussion of Arctic developments since, while not located north of theArctic Circle, the platforms in this region can be exposed to similar temperatureand ice conditions. Arctic areas are estimated to contain about 25% of remainingworldwide undiscovered conventional hydrocarbon resources (Figure 2.26).
Many of the challenges are similar to those found in the deepwater areas:remoteness, personnel safety, environmental footprint and high costs. To thesemust be added cold climate and the hazards of ice and icebergs (Figure 2.27).
The industry has been regularly pushing the technology envelope in openingaccess to new reserves. Past and present examples are Hibernia and Terra Novaoffshore eastern Canada, Snøhvit in the Barents Sea, and fields offshore SakhalinIsland in Far East Russia. The trend is moving from massive platforms built towithstand icebergs to smaller, more mobile facilities coupled with iceberg-detection and deflection mechanisms. New transport solutions are alsoemerging (Figure 2.28).
Costs remain high, however, at somewhere between three and five times thoseof equivalent projects in temperate locations. This may restrict medium-termfuture Arctic projects to the most prolific prospects. So far, only a handful ofprojects have been developed. They suggest a steep learning curve in findingnew approaches that reduce capital and running costs, but it is too early topredict how fast Arctic resources will be located and developed. In particular,many of the promising areas are in Russian waters, north of Siberia, where thecontinental shelf is less than 200 metres deep, even at significant distancesfrom the coast. Developments will depend on the policies of the Russiangovernment. In Chapter 7, we assume that most Arctic conventional resourceswill eventually become economical at long-term oil prices of between USD 20per barrel (as in the case of projects already being developed) and USD 60(roughly three times the typical economical price for conventional resources intemperate locations outside the Middle East).
CHAPTER 2 • “CONVENTIONAL” OIL AND GAS 71
North AfricaCaspian
Middle East
50%
North AfricaCaspian
Middle East
50%
Arctic25%
Rest of the world25%
Figure 2.26 • Share of Arctic in undiscovered oil and gas resources
Based on USGS data, courtesy of OG21, a task force of the Norwegian Ministry of Petroleum and Energy.
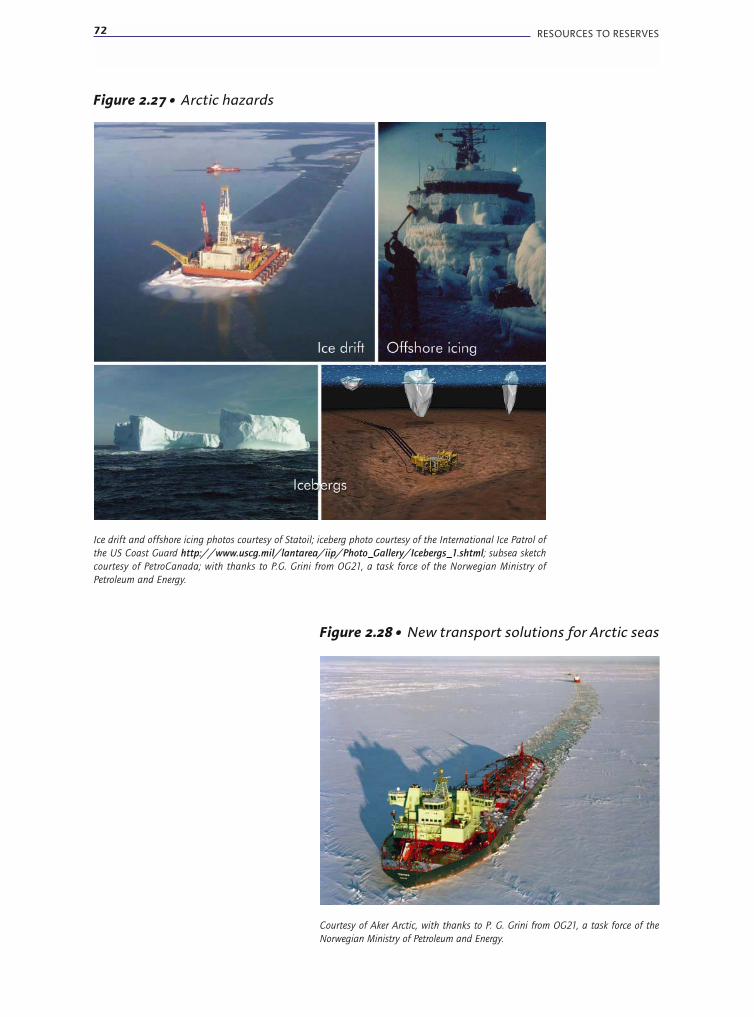
72 RESOURCES TO RESERVES
Figure 2.27 • Arctic hazards
Ice drift and offshore icing photos courtesy of Statoil; iceberg photo courtesy of the International Ice Patrol of
the US Coast Guard http://www.uscg.mil/lantarea/iip/Photo_Gallery/Icebergs_1.shtml; subsea sketch
courtesy of PetroCanada; with thanks to P.G. Grini from OG21, a task force of the Norwegian Ministry of
Petroleum and Energy.
Figure 2.28 • New transport solutions for Arctic seas
Courtesy of Aker Arctic, with thanks to P. G. Grini from OG21, a task force of the
Norwegian Ministry of Petroleum and Energy.

CHAPTER 2 • “CONVENTIONAL” OIL AND GAS 73
Super-deep reservoirsAs shown in the Figure 2.29, current resource estimates show very scarceresources below 4 000 metres sediment depth (whether onshore or offshore).However, this could result more from the absence of deeper exploration thanfrom any fundamental reason. In fact, a survey of sedimentary basins around theworld shows that many have sediment thicknesses reaching 10 km (Gulf ofMexico, Congo Basin, Western Siberia - see Figure 2.30). There is no reason whysuch deep sediments should not be hydrocarbon-bearing sediments.
Historically, the technology to drill super-deep wells has been pioneered by publicscientific projects. For instance, the KTB super-deep drilling project in Germanyreached 9 000 metres and the Kola Peninsula super-deep well in Russia reached12 000 metres. An extension of such efforts to industrial applications is currentlybeing supported by the United States Department of Energy as part of the DeepTrek program. New electronic technologies, new materials, new drillingtechniques (notably cable-based) and new well completion techniques likemonobore techniques are likely to be relevant.
Potential resources, beyond those currently included in published worldwideestimates, could easily reach 300 billion boe, 25% being liquid (oil) and the restgas. The resources that could be found there would, at least in part, come on topof current USGS estimates, thus adding to the estimated total amount ofhydrocarbons in place in the world. In spite of the technical challenges, super-deep reservoirs could be attractive when located near existing infrastructure, forexample underneath mature producing areas. Prices that would make suchresources economical are difficult to estimate at this early stage. That being said,some deep reservoirs are already successfully exploited, as in the case of theNorth Sea's Elgin-Franklin, at 6 000 metres below the seabed. Also, wells reachingdepths of 9 000 metres are in the planning stages for the United States Gulf ofMexico (Hart's 2005).
600 400 200Bboe
0 5% 10% 15% 20%
1 250
2 250
250
3 250
4 250
5 250
6 250
Buri
aldepth
(m)
25%
4 000 m of burial
Figure 2.29 • Estimates of hydrocarbon resources as a function of burial depth
Left: amounts in billion barrels of oil equivalent; right: as percentage of total.
Courtesy of Total.

74 RESOURCES TO RESERVES
90
-180 -150 -120 -90 -60 -30 30 60 90 120 150 1800
60
30
0
-30
-60
-90
15
10
7
5
3210.50.05
Figure 2.30 • Map of sediment thickness in kilometres
Reproduced from Scripps Oceanographic Institute; http://mahi.ucsd.edu/Gabi/sediment.html, Laske 1997.
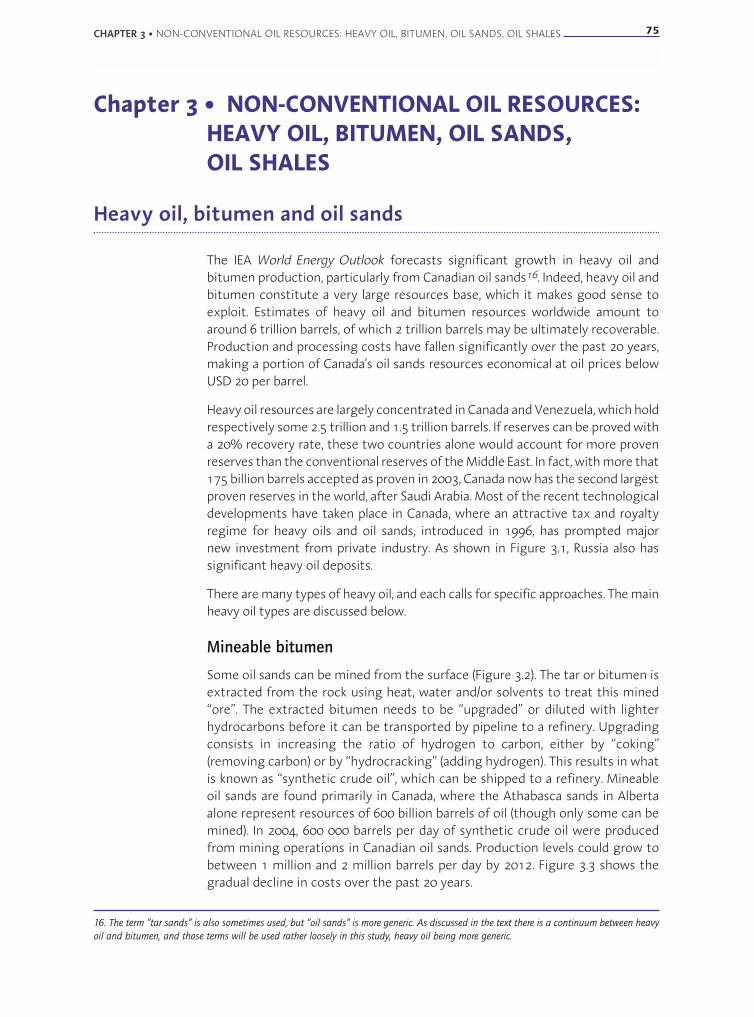
Chapter 3 • NON-CONVENTIONAL OIL RESOURCES: HEAVY OIL, BITUMEN, OIL SANDS,OIL SHALES
Heavy oil, bitumen and oil sands
The IEA World Energy Outlook forecasts significant growth in heavy oil andbitumen production, particularly from Canadian oil sands16. Indeed, heavy oil andbitumen constitute a very large resources base, which it makes good sense toexploit. Estimates of heavy oil and bitumen resources worldwide amount toaround 6 trillion barrels, of which 2 trillion barrels may be ultimately recoverable.Production and processing costs have fallen significantly over the past 20 years,making a portion of Canada's oil sands resources economical at oil prices belowUSD 20 per barrel.
Heavy oil resources are largely concentrated in Canada and Venezuela, which holdrespectively some 2.5 trillion and 1.5 trillion barrels. If reserves can be proved witha 20% recovery rate, these two countries alone would account for more provenreserves than the conventional reserves of the Middle East. In fact, with more that175 billion barrels accepted as proven in 2003, Canada now has the second largestproven reserves in the world, after Saudi Arabia. Most of the recent technologicaldevelopments have taken place in Canada, where an attractive tax and royaltyregime for heavy oils and oil sands, introduced in 1996, has prompted majornew investment from private industry. As shown in Figure 3.1, Russia also hassignificant heavy oil deposits.
There are many types of heavy oil, and each calls for specific approaches. The mainheavy oil types are discussed below.
Mineable bitumen
Some oil sands can be mined from the surface (Figure 3.2). The tar or bitumen isextracted from the rock using heat, water and/or solvents to treat this mined“ore”. The extracted bitumen needs to be “upgraded” or diluted with lighterhydrocarbons before it can be transported by pipeline to a refinery. Upgradingconsists in increasing the ratio of hydrogen to carbon, either by “coking”(removing carbon) or by “hydrocracking” (adding hydrogen). This results in whatis known as “synthetic crude oil”, which can be shipped to a refinery. Mineableoil sands are found primarily in Canada, where the Athabasca sands in Albertaalone represent resources of 600 billion barrels of oil (though only some can bemined). In 2004, 600 000 barrels per day of synthetic crude oil were producedfrom mining operations in Canadian oil sands. Production levels could grow tobetween 1 million and 2 million barrels per day by 2012. Figure 3.3 shows thegradual decline in costs over the past 20 years.
CHAPTER 3 • NON-CONVENTIONAL OIL RESOURCES: HEAVY OIL, BITUMEN, OIL SANDS, OIL SHALES 75
16. The term “tar sands” is also sometimes used, but “oil sands” is more generic. As discussed in the text there is a continuum between heavy
oil and bitumen, and those terms will be used rather loosely in this study, heavy oil being more generic.
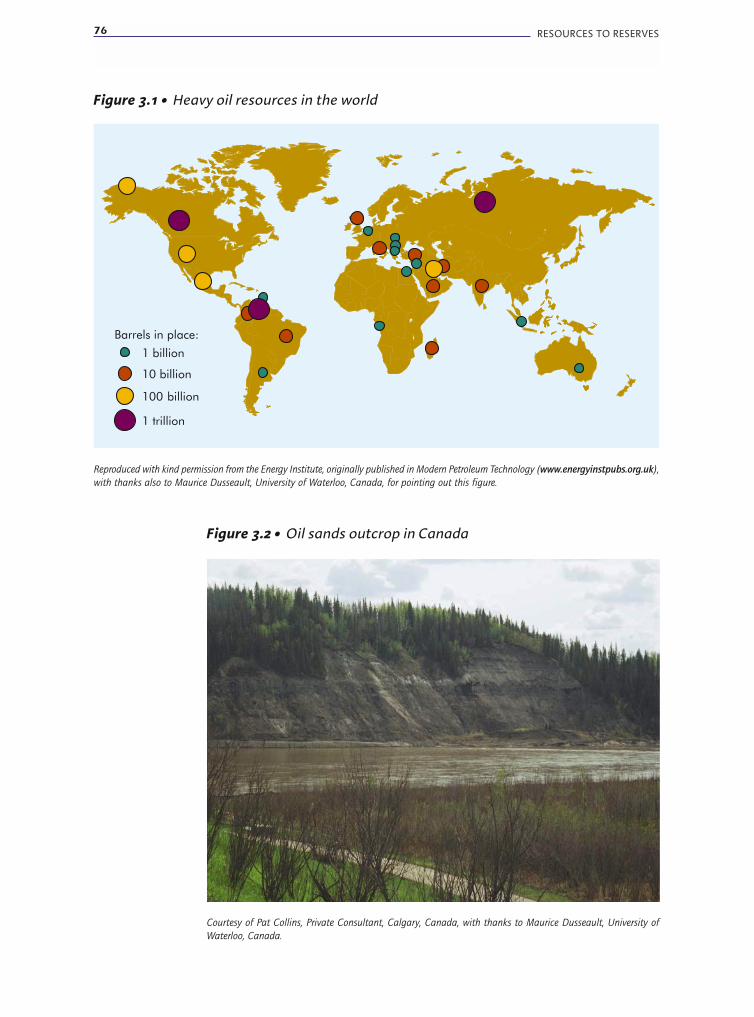
76 RESOURCES TO RESERVES
Figure 3.2 • Oil sands outcrop in Canada
Courtesy of Pat Collins, Private Consultant, Calgary, Canada, with thanks to Maurice Dusseault, University of
Waterloo, Canada.
1 billion
10 billion
100 billion
1 trillion
Barrels in place:
Reproduced with kind permission from the Energy Institute, originally published in Modern Petroleum Technology (www.energyinstpubs.org.uk),
with thanks also to Maurice Dusseault, University of Waterloo, Canada, for pointing out this figure.
Figure 3.1 • Heavy oil resources in the world

CHAPTER 3 • NON-CONVENTIONAL OIL RESOURCES: HEAVY OIL, BITUMEN, OIL SANDS, OIL SHALES 77
Mining andupgrading
In-situ
0
5
10
15
20
25
30
1985 1987 1989 1991 1993 1995 1997 1999 2001 2003
Dolla
rs (2
000)
per
bar
rel
Figure 3.3 • Oil production costs from Canadian oil sands
Source: WEO-2004, IEA.
High-viscosity heavy oils
Some heavy oils and bitumen are too viscous to flow at reservoir conditions. Theyare usually found at relatively shallow depths that are nevertheless too deep tobe mined. At such depths, temperatures are low, so that viscosity is high. Theyneed special production technologies to facilitate their flow from reservoir towell head. Traditionally, these have been “steam flooding” techniques, whichinvolve injecting hot steam to heat the oil in situ, thereby reducing its viscosityand allowing it to flow. But the last ten years have seen the advent of manynew approaches such as steam-assisted gravity drainage (SAGD) or cold heavy oilproduction with sand (CHOPS). While large-scale implementation of these is onlyjust starting, they can be expected to significantly boost production over thenext few years. Indeed, they improve the economics to the point where Canadianheavy oil and bitumen deposits can be produced through the above in-situtechniques at oil prices below USD 20/barrel (Figure 3.3). Current production ofheavy oil and bitumen in Canada, for example, is close to 1 million barrels per dayand could double by 2012.
More easily flowing heavy oils
Yet another category of heavy oils are able to flow at reservoir temperature. Theycan therefore be produced economically, without additional viscosity-reductiontechniques, through variants of conventional processes such as long horizontalwells, or multilaterals17. This is the case, for instance, in Venezuela's Orinoco belt,or in Brazil's offshore reservoirs. But such oils are too viscous at surface to betransported through conventional pipelines. They need heated pipelines, whichmake sense only over short distances. Or they must be either upgraded beforetransportation or diluted with light hydrocarbons to create a mix closer toconventional crude oil.
17. Multilaterals technology is an emerging technology in which several “branches” are drilled in the reservoir from the same “trunk” well
drilled from the surface. This allows the producing length to be increased without a corresponding increase in cost. A brief description can be
found in Box 8 in Chapter 2.

78 RESOURCES TO RESERVES
However, these traditional processes provide only a fairly low recovery factor.Venezuela estimates the amount of heavy oil recoverable through suchprocesses in the Orinoco belt at some 250 billion barrels, against in-placeresources of 1 700 billion barrels. Implementation of in situ viscosity reductiontechniques would probably double the recovery rate.
Box 14 describes one of the recent new technologies, SAGD. Although thistechnique permits cost-effective production of heavy oils with excellentrecovery, it is, like all heavy-oil extraction techniques, very energy-intensive.Energy is required to heat the oil and rock. In SAGD or in conventional steamtechniques, this is achieved through steam injection. This steam, in turn, iscurrently provided by burning natural gas. Then the heavy oil or bitumen needsto be upgraded before it is used by a refinery, and this calls for hydrogen, whichagain comes from natural gas. In Canada, every barrel of heavy oil producedrequires about 30 cubic metres of gas for heat production and 15 cubic metresfor upgrading. As a result, heavy oil production can quickly become constrainedby availability of natural gas. In Canada more particularly, this is expected tohamper heavy oil production as early as 201518.
Also, in a world where limiting carbon emissions is becoming important, onecan question the logic of burning gas (a hydrogen-rich fuel) to extract heavy oil(a carbon-rich fuel). Heavy oil production requires much more energy thanconventional oil production. In fact, the production process in the upstream oiland gas industry currently consumes the equivalent of some 6% of the energycontent of the hydrocarbons produced. With heavy oil, this ratio can rise to 20%or 25%. In Canada, the CO2 emissions linked to such increased energy usage arelikely to compromise meeting the country's Kyoto Protocol emissions targets,thus curbing the increase in heavy oil production.
It is important, therefore, to develop other techniques that would be moreenergy and/or carbon efficient. A brute force approach being discussed in Canadais to install a nuclear power plant near the heavy oil fields to supply the requiredenergy. An industry consortium is also investigating the use of geothermalenergy from deep rocks underneath the heavy oil reservoirs. Another possibilityis to capture the CO2 produced by the heating and reforming plants and to storeit in geological formations. Technologies for the latter exist but would increaseproduction costs by some USD 5 to USD 7 per barrel, assuming a standard costfor carbon capture and storage (CCS) of USD 50 per tonne (IEA CCS-2004),although some of the processes, where they involve high-purity CO2 streams,would have lower capture costs.
Other improvements in production technologies, however, could alsocontribute. A detailed Oil Sands Technology Roadmap has been developed by theAlberta Chamber of Resources (ACR 2004). Studies performed for this roadmap(Flint 2005) indicate that a range of technologies can reduce the amount ofCO2 generated during the various steps in the process. Different technologiesapply to the different production options (like SAGD fuelled by natural gas,SAGD fuelled by heavy end residues or extraction through surface mining).
18. Water supply also creates constraints, particularly for mining operations; more details can be found in ACR-2004.

CHAPTER 3 • NON-CONVENTIONAL OIL RESOURCES: HEAVY OIL, BITUMEN, OIL SANDS, OIL SHALES 79
While each option offers different potential gains, the reduction in CO2generated could average 25%. CO2 produced by upgrading plants constitutes afairly pure CO2 stream that could be captured at relatively low cost. This wouldapply also to steam plants if these were powered by gasification of heavy endresidues. Finally, both Canada and Venezuela have good opportunities to re-cyclethe captured CO2 for use in enhanced oil recovery programmes in conventionaloil fields. It is therefore reasonable to expect that both gas and CO2 constraintsaffecting future heavy oil production will be eliminated over time, with only smallincreases in costs.
A number of alternative production techniques are in research or earlydevelopment.
■ In-situ combustion can provide the energy to heat the oil and facilitate its flow.This technology has been around for many years, but difficulties in controllingthe process have been a hurdle to widespread use. New variants, involving recentprogress in accurate placement of horizontal wells, are being investigated. Toe-to-heel-air-injection (THAI) is an example.
■ Microbial techniques, already discussed in the previous chapter, consist ininjecting microbes into the reservoir, where they exert their ability todecompose the heavy hydrocarbon molecules into lighter ones. But much morebasic research is required.
■ Use of light hydrocarbons as solvents has been tried to replace or work alongsidesteam to reduce the viscosity of the oil. This process, known as VAPEX, has not yetproved economical. In principle, another option might be to separate some of theproduced oil into light and heavy components, to re-inject the light componentsas a solvent to assist production, and to use the heavy components to provideenergy for the production and up-grading processes. A project going some wayin this direction is already being developed. This Nexen/OPTI Long Lake project(www.longlake.ca) will use the heavy components as fuel to power a standardSAGD process, therefore eliminating the need for gas. It is due to be operationalin 2006 with a production level of 70 000 barrels per day and economic feasibilityat an oil price of around USD 20 per barrel. Other companies are at the planningstages of variants of such an approach.
With the incentive of an appropriate tax and royalty framework, the track recordof private industry in developing the required technologies has been excellent.In principle, it can be expected that demand for heavy oil will be large enoughto sustain this record. It is worth noting that heavy oil carries essentially noexploration risk. The large deposits in Canada and Venezuela are well identified,and delineation of the most promising zones is possible at low cost becausedepths are shallow. So all the effort can be focused on optimisation of productioncosts, both capital and operating. However, competing approaches are nowemerging for producing alternative liquid fuels for transportation in anticipationof a decline in conventional oil. Examples are gas-to-liquids (GTL) technology forconverting natural gas into liquid fuel, or synfuel derived from coal (coal-to-liquids — CTL). As a result of this, the investment risk in production of heavy oilcould deteriorate, creating an investment shortfall.
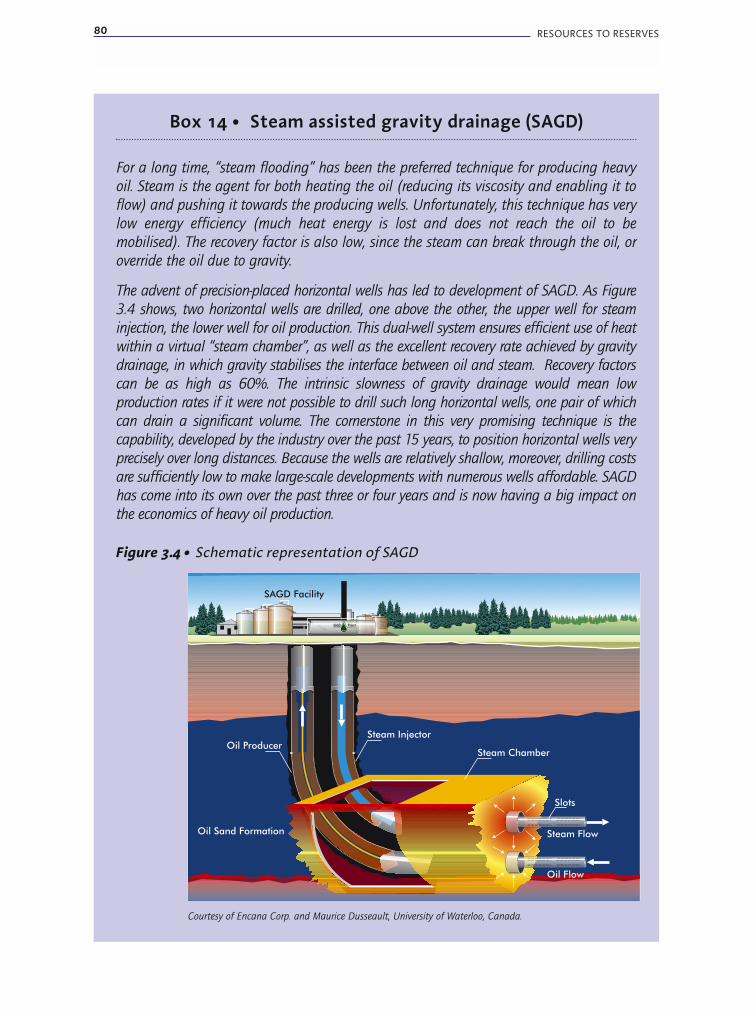
80 RESOURCES TO RESERVES
Box 14 • Steam assisted gravity drainage (SAGD)
For a long time, “steam flooding” has been the preferred technique for producing heavy
oil. Steam is the agent for both heating the oil (reducing its viscosity and enabling it to
flow) and pushing it towards the producing wells. Unfortunately, this technique has very
low energy efficiency (much heat energy is lost and does not reach the oil to be
mobilised). The recovery factor is also low, since the steam can break through the oil, or
override the oil due to gravity.
The advent of precision-placed horizontal wells has led to development of SAGD. As Figure
3.4 shows, two horizontal wells are drilled, one above the other, the upper well for steam
injection, the lower well for oil production. This dual-well system ensures efficient use of heat
within a virtual “steam chamber”, as well as the excellent recovery rate achieved by gravity
drainage, in which gravity stabilises the interface between oil and steam. Recovery factors
can be as high as 60%. The intrinsic slowness of gravity drainage would mean low
production rates if it were not possible to drill such long horizontal wells, one pair of which
can drain a significant volume. The cornerstone in this very promising technique is the
capability, developed by the industry over the past 15 years, to position horizontal wells very
precisely over long distances. Because the wells are relatively shallow, moreover, drilling costs
are sufficiently low to make large-scale developments with numerous wells affordable. SAGD
has come into its own over the past three or four years and is now having a big impact on
the economics of heavy oil production.
Figure 3.4 • Schematic representation of SAGD
Steam Chamber
Steam Injector
SAGD Facility
Oil Sand Formation
Oil Producer
Steam Flow
Oil Flow
SAGD Project
EASTAEG
Slots
Courtesy of Encana Corp. and Maurice Dusseault, University of Waterloo, Canada.
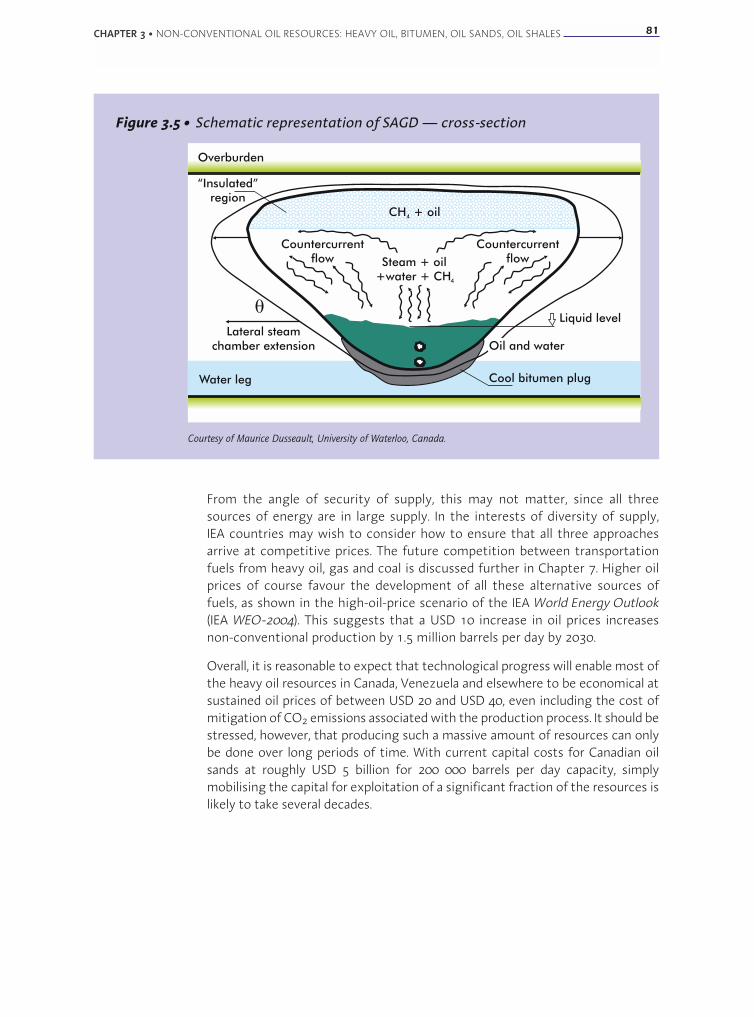
From the angle of security of supply, this may not matter, since all threesources of energy are in large supply. In the interests of diversity of supply,IEA countries may wish to consider how to ensure that all three approachesarrive at competitive prices. The future competition between transportationfuels from heavy oil, gas and coal is discussed further in Chapter 7. Higher oilprices of course favour the development of all these alternative sources offuels, as shown in the high-oil-price scenario of the IEA World Energy Outlook(IEA WEO-2004). This suggests that a USD 10 increase in oil prices increasesnon-conventional production by 1.5 million barrels per day by 2030.
Overall, it is reasonable to expect that technological progress will enable most ofthe heavy oil resources in Canada, Venezuela and elsewhere to be economical atsustained oil prices of between USD 20 and USD 40, even including the cost ofmitigation of CO2 emissions associated with the production process. It should bestressed, however, that producing such a massive amount of resources can onlybe done over long periods of time. With current capital costs for Canadian oilsands at roughly USD 5 billion for 200 000 barrels per day capacity, simplymobilising the capital for exploitation of a significant fraction of the resources islikely to take several decades.
CHAPTER 3 • NON-CONVENTIONAL OIL RESOURCES: HEAVY OIL, BITUMEN, OIL SANDS, OIL SHALES 81
Figure 3.5 • Schematic representation of SAGD — cross-section
Steam + oil+water + CH4
Liquid level
Oil and waterLateral steam
chamber extension
“Insulated”region
Countercurrentflow
CH + oil4
Countercurrentflow
Overburden
Water leg Cool bitumen plug
Courtesy of Maurice Dusseault, University of Waterloo, Canada.
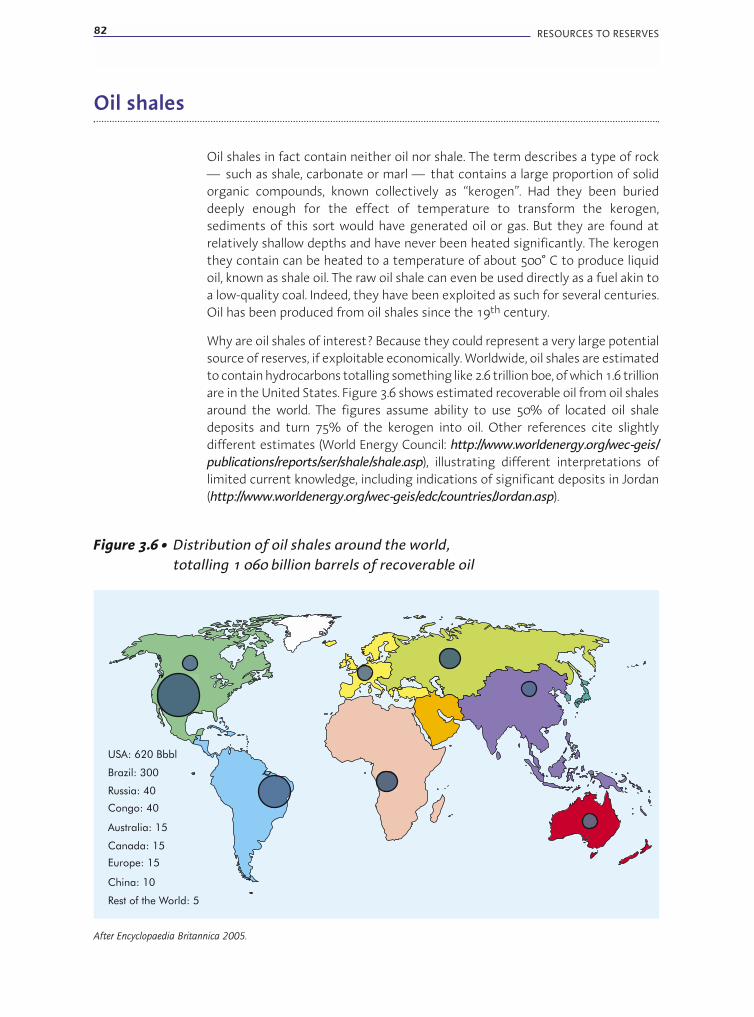
82 RESOURCES TO RESERVES
Oil shales
Oil shales in fact contain neither oil nor shale. The term describes a type of rock— such as shale, carbonate or marl — that contains a large proportion of solidorganic compounds, known collectively as “kerogen”. Had they been burieddeeply enough for the effect of temperature to transform the kerogen,sediments of this sort would have generated oil or gas. But they are found atrelatively shallow depths and have never been heated significantly. The kerogenthey contain can be heated to a temperature of about 500° C to produce liquidoil, known as shale oil. The raw oil shale can even be used directly as a fuel akin toa low-quality coal. Indeed, they have been exploited as such for several centuries.Oil has been produced from oil shales since the 19th century.
Why are oil shales of interest? Because they could represent a very large potentialsource of reserves, if exploitable economically. Worldwide, oil shales are estimatedto contain hydrocarbons totalling something like 2.6 trillion boe, of which 1.6 trillionare in the United States. Figure 3.6 shows estimated recoverable oil from oil shalesaround the world. The figures assume ability to use 50% of located oil shaledeposits and turn 75% of the kerogen into oil. Other references cite slightlydifferent estimates (World Energy Council: http://www.worldenergy.org/wec-geis/publications/reports/ser/shale/shale.asp), illustrating different interpretations oflimited current knowledge, including indications of significant deposits in Jordan(http://www.worldenergy.org/wec-geis/edc/countries/Jordan.asp).
Congo: 40
USA: 620 Bbbl
Brazil: 300
Russia: 40
Australia: 15
Canada: 15
Europe: 15
China: 10
Rest of the World: 5
After Encyclopaedia Britannica 2005.
Figure 3.6 • Distribution of oil shales around the world,totalling 1 060 billion barrels of recoverable oil
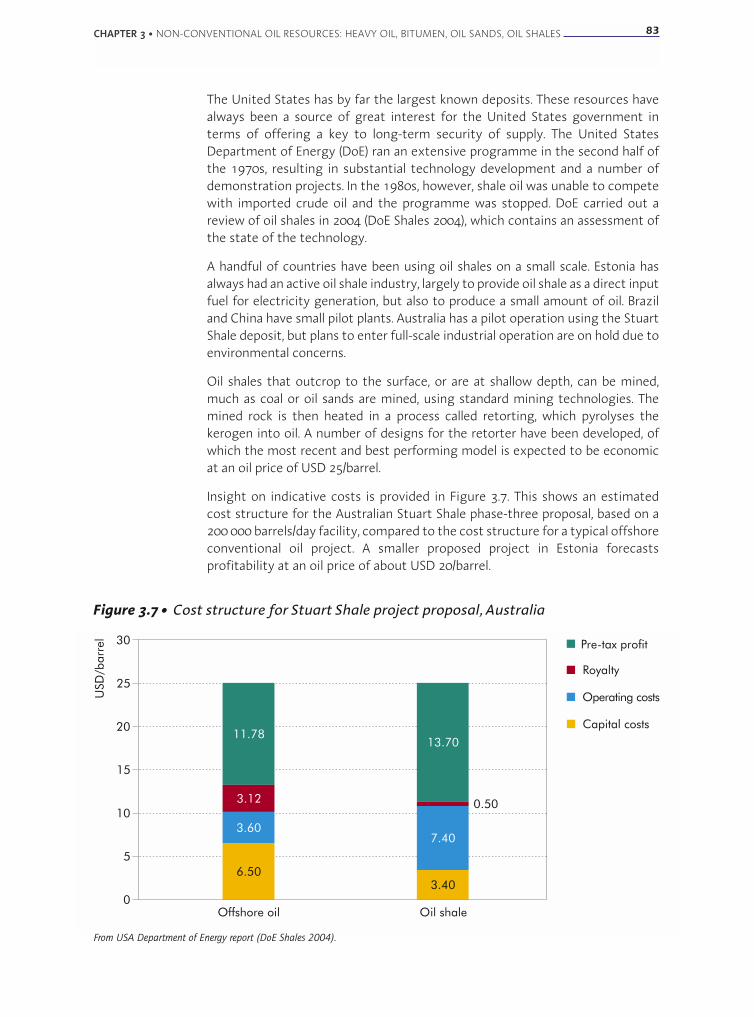
The United States has by far the largest known deposits. These resources havealways been a source of great interest for the United States government interms of offering a key to long-term security of supply. The United StatesDepartment of Energy (DoE) ran an extensive programme in the second half ofthe 1970s, resulting in substantial technology development and a number ofdemonstration projects. In the 1980s, however, shale oil was unable to competewith imported crude oil and the programme was stopped. DoE carried out areview of oil shales in 2004 (DoE Shales 2004), which contains an assessment ofthe state of the technology.
A handful of countries have been using oil shales on a small scale. Estonia hasalways had an active oil shale industry, largely to provide oil shale as a direct inputfuel for electricity generation, but also to produce a small amount of oil. Braziland China have small pilot plants. Australia has a pilot operation using the StuartShale deposit, but plans to enter full-scale industrial operation are on hold due toenvironmental concerns.
Oil shales that outcrop to the surface, or are at shallow depth, can be mined,much as coal or oil sands are mined, using standard mining technologies. Themined rock is then heated in a process called retorting, which pyrolyses thekerogen into oil. A number of designs for the retorter have been developed, ofwhich the most recent and best performing model is expected to be economicat an oil price of USD 25/barrel.
Insight on indicative costs is provided in Figure 3.7. This shows an estimatedcost structure for the Australian Stuart Shale phase-three proposal, based on a200 000 barrels/day facility, compared to the cost structure for a typical offshoreconventional oil project. A smaller proposed project in Estonia forecastsprofitability at an oil price of about USD 20/barrel.
CHAPTER 3 • NON-CONVENTIONAL OIL RESOURCES: HEAVY OIL, BITUMEN, OIL SANDS, OIL SHALES 83
0
5
10
15
20
25
30
USD
/bar
rel
0.50
11.78
3.12
3.60
6.50
13.70
7.40
3.40
Offshore oil Oil shale
Capital costs
Operating costs
Royalty
Pre-tax profit
Figure 3.7 • Cost structure for Stuart Shale project proposal, Australia
From USA Department of Energy report (DoE Shales 2004).
84 RESOURCES TO RESERVES
As with any mining operation, however, extracting oil shales involves anenvironmental impact that can be significant. Tailings need to be disposed of,land must be properly reclaimed and the footprint must be minimised.
Most deposits are too deep, however, to be mined and they call for some form ofin-situ retorting. In one variant, explosives or hydraulic fracturing are first used torubblise the rock. This is necessary because oil shales generally have very lowpermeabilities. For that reason, paths must be created to ensure that the oil thatwill be formed under temperature can be drained towards producing wells. Therock must then be heated to about 500° C to produce the required liquidhydrocarbons from the kerogen. Heat can be supplied through wells usingvarious techniques, or created by an in-situ combustion process. The latter(similar to in-situ combustion for heavy oil, or to in-situ coal gasification) isdifficult to control and pilot projects have resulted in very variable recovery rates.The former, while easier to control, is a relatively inefficient process. The in-situtechniques not only offer access to deeper deposits, but they also side-step manyof mining's environmental issues associated with land use. On the basis ofdemonstrations carried out in the late 1970s and early 1980s, these processes areexpected to be economical with oil prices at USD 25/barrel. For example,according to the Oil and Gas Journal (25 April, 2005), Shell is working on a pilot in-situ retorting project using electrical heating, which is expected to beeconomical at an oil price of USD 20/barrel.
Nevertheless, exactly as with heavy oils, producing oil shales is a more energy-intensive process (and therefore CO2-intensive) than producing conventional oil.Retorting, whether done at the surface or in-situ, makes the largest claim onenergy input, possibly as much as 30% of the energy value of the oil produced.If this energy is produced from fossil fuels, the corresponding potential CO2emissions may need to be avoided through CO2 capture and its storage ingeological formations. For example, compared with conventional oil production,the Australian Stuart Shale project was estimated to generate an additional 180 kgof CO2 per barrel of oil produced (www.iea.org/textbase/work/2002/calgary/Smithdoc.pdf). Assuming standard CO2 capture and storage costs of USD 50 pertonne, as well as some modest efficiency improvements in future projects, theadditional cost would be close to USD 8 per barrel. It should be noted that theeconomic analysis in Figure 3.7 already incorporates some CO2 mitigation costs.
As already indicated, Canada's recent experience with oil sands and heavy oilbears witness to the powerful force of a stable and attractive tax and royaltyregime to catalyse fresh investment. Could the same approach work for oil-shaledevelopment? The United States DoE reckons that it would be possible for theUnited States to produce 2 million barrels of oil per day from domestic oil shalesby 2020. The early projects discussed above appear economical at sustained oilprices of around USD 25/barrel, even assuming CO2 mitigation costs. But theseprojects obviously focus on locations where the kerogen concentration in theshale is highest, whereas costs depend primarily on the volume of rock to beheated, and not on the kerogen content in that rock. In fact, most of the locatedmassive oil shale resources are probably at kerogen concentrations two to fourtimes lower than those in the pilot projects. This is why we have placedeconomical production at a level of between USD 25 and USD 70 per barrel forfuture viable exploitation.
Chapter 4 • NON-CONVENTIONAL GAS RESOURCESAND METHANE HYDRATES
Non-conventional gas
As discussed in Chapter 1, there is no unique definition for “non-conventionalgas”. The term is usually used in reference to types of gas reservoir that have beendeveloped only recently, and so far almost exclusively in the United States. Theyare primarily of two sorts: “coal bed methane” and “tight gas”. They representvery large resources, amounting to at least 250 trillion cubic metres (1.5 trillionboe), roughly of the same order of magnitude as conventional gas. Theseresources are currently exploited primarily in the United States, where theysupply some 25 % of gas production.
Coal bed methaneIt is well known that most coal deposits contain methane which has beenadsorbed into the coal. The release of such methane has always been a majorsource of accidents in coal mines, where this danger is mitigated by circulatingair to move the gas out into the atmosphere. Until recently, this “coal minemethane” was just vented to the atmosphere. But there is now concern aboutmethane as a powerful greenhouse gas, with a contribution to global warming21 times as great as CO2, per unit mass. This concern has recently promptedseveral countries to start recovering this coal-mine methane for use ingenerating energy. In this process, it is turned into CO2, reducing its impact onglobal warming by a factor of roughly seven (as well as substituting for otherfuels and their emissions).
Coal deposits are widespread around the world and commonly mined. Less wellknown is the fact that a much larger quantity of coal is buried in deposits atdepths where it cannot be mined. Studies and pilot projects have focused on in-situ gasification of such deep coal beds, but the technology is not yet widely usedand, in any event, it would be cost-effective only for relatively shallow coaldeposits.
This leaves a vast amount of more deeply buried coal that cannot be exploited.However, just like coal in ordinary mines, these deeper coal beds also containadsorbed methane. “Coal bed methane” (CBM) is the methane (along with otherlight hydrocarbon gases) contained in such coal beds where the deposit's depthor the coal's poor quality rule out economical extraction of the coal. The methanefound in such coal beds can be extracted. The technology is very similar toproduction technology for conventional gas reservoirs: wells are drilled into thecoal bed, the pressure is reduced and the gas moves to the surface through thewells. The main difficulties are as follows.
■ Coal beds tend to have low permeabilities, so that fluids do not flow easilythrough them unless the reservoirs are stimulated, for example, with hydraulicfracturing.
CHAPTER 4 • NON-CONVENTIONAL GAS RESOURCES AND METHANE HYDRATES 85

86 RESOURCES TO RESERVES
■ The coal can contain large amounts of water in its pore spaces, whereas the gasis adsorbed on the coal surfaces. This means that large amounts of water oftenhave to be produced before any gas reaches the surface, which delays production,and therefore the net present value of the investment in wells and productionfacilities. It also add to costs, since this water may have to be disposed of ortreated before use.
■ Since no entirely reliable technology yet exists to assess how much gas aparticular coal bed can yield, the methane gas extraction process is often one oftrial and error.
The technologies to produce gas resources economically from coal beds havenevertheless been developed in the United States, primarily throughprogrammes led by the Department of Energy (DoE) in the 1980s, includingattractive tax regimes. Today, CBM represents around 10 % of gas production inthe United States.
The map in Figure 4.2 shows the major CBM basins in the United States. Newbasins are currently being developed rapidly, as shown in Figure 4.1. The key toeconomic development of these fields is drilling a large number of low-cost wells(see Chapter 2), including horizontal wells.
Coal bed methane is probably widely spread around the globe. Large amounts areknown to exist, notably in Australia, Canada, China, Germany, India, Indonesia,Poland, Russia and South Africa (see, for example, Table 3 in White 2005). Theseresources are to be found in settings similar to those in the United States, atdepths too deep to be mined but relatively shallow. Outside those countries,comparatively little is known, but coal beds are certainly present at variousdepths in most sedimentary basins, which would suggest that worldwideundiscovered resources are quite extensive.
0
200
400
600
800
1000
1200
1400
1600
1800 Arkoma Basin
Warrior Basin
San Juan Basin
CBM
prod
uctio
n-
Bcf
1983 1985 1987 1989 1991 1993 1995 1997 1999 2001
Appalachian Basin
Emerging Basins
Note: 1 billion cubic feet is approximately 28 million cubic metres or 180 000 boe.Courtesy of Gas Technology Institute, United States.
Figure 4.1 • Coal bed methane gas production in the United States, by basin

CHAPTER 4 • NON-CONVENTIONAL GAS RESOURCES AND METHANE HYDRATES 87
GreaterGreen River
314 Tcf
Western Washington 24 Tcf
Wind River 6 TcfPowder River 39 Tcf
Forest City 1 Tcf
Illinois 21 Tcf
NorthernAppalachian
61 Tcf
CentralAppalachian
5 TcfUinta 10 Tcf
Piceance 99 Tcf
San Juan 84 TcfRaton 10 Tcf
Cherokee 6 Tcf
Arkoma 4 Tcf Warrior 20 Tcf
Figure 4.2 • United States coal bed methane resources - 20 trillion cubic metres
Courtesy of Gas Technology Institute, United States.
The example of the United States has shown, however, that the key to economicrecovery is a large enough concentration of activity to create economies ofscale in drilling low-cost wells. To date, the relative abundance of more prolificconventional gas reservoirs in many parts of the world has inhibited the large-scale exploitation of CBM outside the United States. Pilot projects have beendeveloped in some other regions (Canada, China, Russia). As the basic technologyis for the most part available, local markets can be expected to drive furtherdevelopment in the field. The principal missing piece in the technology picture isprobably improved characterisation of coal bed reservoirs. This is a difficultproblem, with which progress is likely to be slow; the United States DoE hasalready focused significant effort on this area in the 1980s. It should be noted,however, that some environmental concerns revolving around land use and waterdisposal have arisen over the reservoir development technology based on a largenumber of wells, which is used in the United States.
An interesting possible development might be use of CO2 injection to enhancemethane production from coal beds. Indeed, CO2 in principle adsorbs morestrongly on coal surfaces than does methane. So injecting CO2 could bothproduce the coal bed methane and sequester the CO2 through adsorption ontothe coal (White 2005). If the CO2 is captured from power plants, for example, theresult is reduced greenhouse gas emissions. This technology is nevertheless stillin its infancy and pilot projects have given mixed results.
88 RESOURCES TO RESERVES
Tight gas“Tight gas” refers to gas found in rocks with extremely low permeabilities. Whilenot formally defined, the permeability level characterising tight gas would bebelow 0.1 millidarcy (the customary unit of measurement of permeability). Theserocks can be conventional reservoir rocks (carbonates, sands) with very lowpermeability, or shales (clay-rich rocks normally considered impermeable). Inthe latter case, the rocks are known as “gas shales”, by analogy with oil shales,discussed in Chapter 3. Both are “source rocks”, that is, rocks which were buriedtogether with organic material. Gas shales have been buried long enough for theorganic material to “mature” into gas and oil, whereas oil shales have not beenburied long enough for this maturing process to take place.
Such reservoirs are considered non-conventional because gas would not flowat economic rates without the use of special technologies. Two commonapproaches, among others, can provide the solution. One is to create longartificial fractures in the rock by pumping up the wells at high pressure until therock fractures, a process called hydraulic fracturing. Another approach involvesdrilling long horizontal wells that intersect natural fractures. Fractures, whethernatural or artificial, are needed to provide a path for the gas to flow to the wells.Such approaches are currently used economically only in the United States,where volume effects have brought the cost of drilling and hydraulic fracturingoperations down to a level where development is viable. In the United States,tight gas resources represent about 15 trillion cubic metres (100 billion boe), andthey currently supply about 15% of the nation's gas production.
Very little is known about the presence of such tight gas formations elsewherein the world. Most other countries with abundant conventional gas have notembarked on exploration to detect tight gas. Many geologists expect othersedimentary basins to contain formations similar to the Barnett Shale in Texas(possibly the largest gas reservoir in the United States) and these formationselsewhere could hold significant resources. Certainly, the effect of volume ondrilling and fracturing costs observed in the United States is having an impact inother regions of the world, notably Russia, where introduction of USA-stylehydraulic fracturing technology is one of the factors behind the revival of Russianoil production over the past five years.
Here again, since the technology is largely available, local markets are likely todrive further development of this type of resources. Alongside ampleconventional gas resources, the potential of those non-conventional gasreservoirs underlines the fact that adequate investment in transportationinfrastructure is likely to be the only requirement to mobilise sufficient futuresupplies of gas.
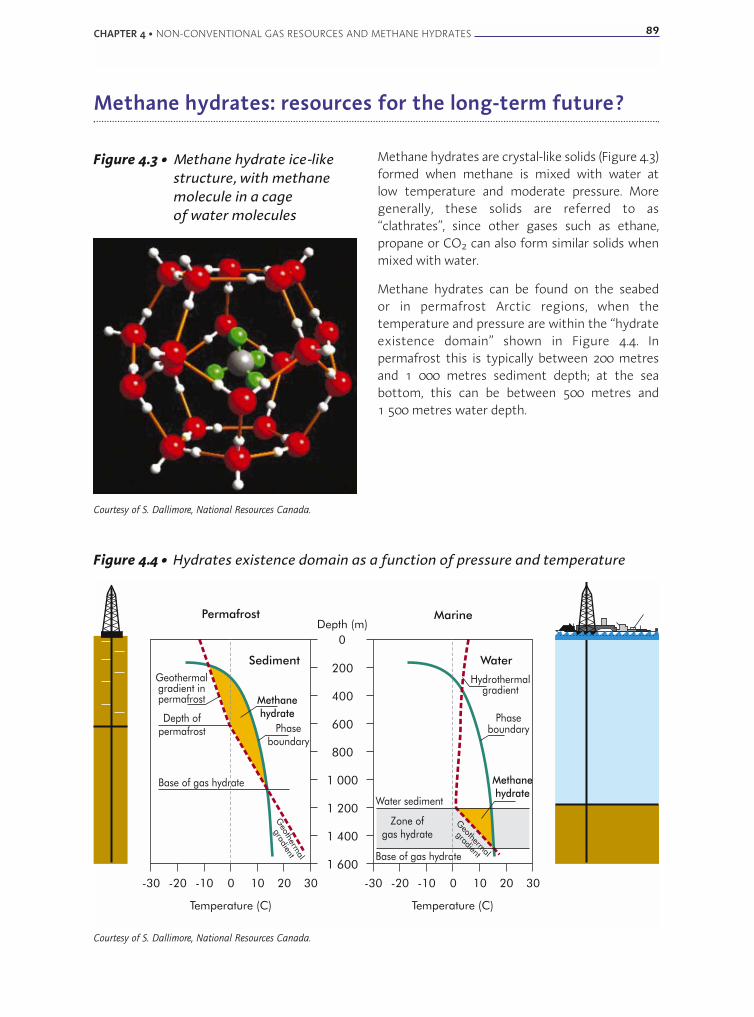
Methane hydrates: resources for the long-term future?
Methane hydrates are crystal-like solids (Figure 4.3)formed when methane is mixed with water atlow temperature and moderate pressure. Moregenerally, these solids are referred to as“clathrates”, since other gases such as ethane,propane or CO2 can also form similar solids whenmixed with water.
Methane hydrates can be found on the seabedor in permafrost Arctic regions, when thetemperature and pressure are within the “hydrateexistence domain” shown in Figure 4.4. Inpermafrost this is typically between 200 metresand 1 000 metres sediment depth; at the seabottom, this can be between 500 metres and1 500 metres water depth.
CHAPTER 4 • NON-CONVENTIONAL GAS RESOURCES AND METHANE HYDRATES 89
Figure 4.3 • Methane hydrate ice-likestructure, with methanemolecule in a cageof water molecules
Courtesy of S. Dallimore, National Resources Canada.
Permafrost Marine
Temperature (C)
Sediment
-20 -10 0 10 20 30-30
Base of gas hydrate
Depth ofpermafrost
Methanehydrate
Phaseboundary
Geothermalgradient inpermafrost
Geotherm
al
gradient
0
200
400
600
800
1 000
1 200
1 400
1 600
Depth (m)
Water
-20 -10 0 10 20 30-30
Base of gas hydrate
Water sediment
Methanehydrate
Phaseboundary
Hydrothermalgradient
Geothermal
gradient
Zone ofgas hydrate
Temperature (C)
Figure 4.4 • Hydrates existence domain as a function of pressure and temperature
Courtesy of S. Dallimore, National Resources Canada.
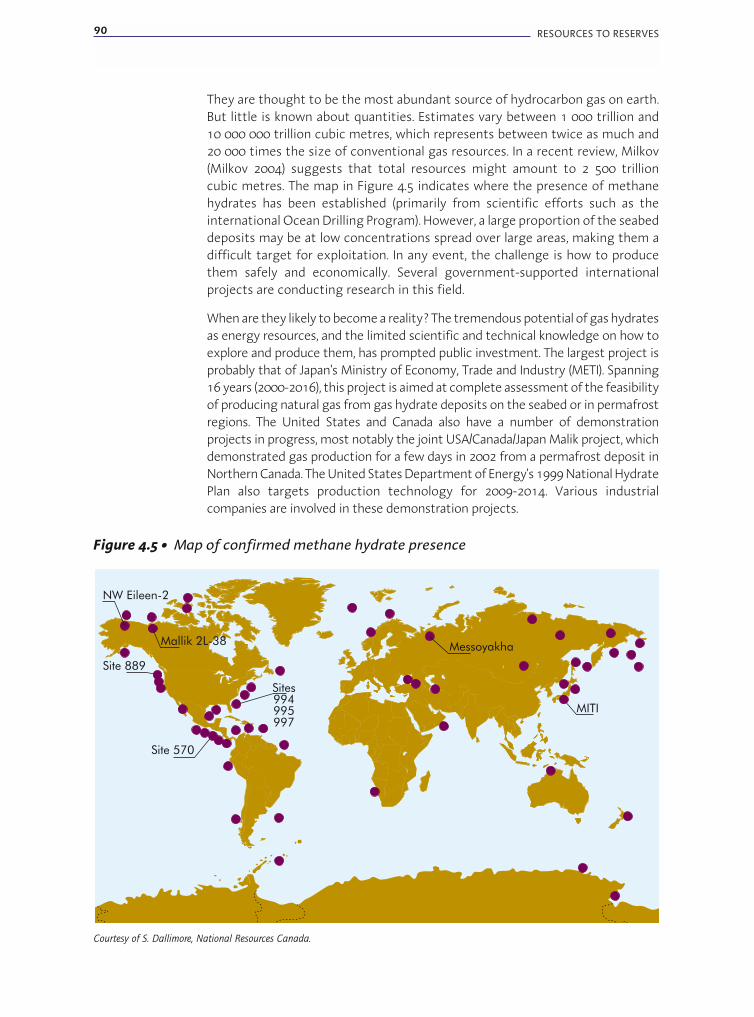
90 RESOURCES TO RESERVES
They are thought to be the most abundant source of hydrocarbon gas on earth.But little is known about quantities. Estimates vary between 1 000 trillion and10 000 000 trillion cubic metres, which represents between twice as much and20 000 times the size of conventional gas resources. In a recent review, Milkov(Milkov 2004) suggests that total resources might amount to 2 500 trillioncubic metres. The map in Figure 4.5 indicates where the presence of methanehydrates has been established (primarily from scientific efforts such as theinternational Ocean Drilling Program). However, a large proportion of the seabeddeposits may be at low concentrations spread over large areas, making them adifficult target for exploitation. In any event, the challenge is how to producethem safely and economically. Several government-supported internationalprojects are conducting research in this field.
When are they likely to become a reality? The tremendous potential of gas hydratesas energy resources, and the limited scientific and technical knowledge on how toexplore and produce them, has prompted public investment. The largest project isprobably that of Japan's Ministry of Economy, Trade and Industry (METI). Spanning16 years (2000-2016), this project is aimed at complete assessment of the feasibilityof producing natural gas from gas hydrate deposits on the seabed or in permafrostregions. The United States and Canada also have a number of demonstrationprojects in progress, most notably the joint USA/Canada/Japan Malik project, whichdemonstrated gas production for a few days in 2002 from a permafrost deposit inNorthern Canada. The United States Department of Energy's 1999 National HydratePlan also targets production technology for 2009-2014. Various industrialcompanies are involved in these demonstration projects.
MITI
Site 570
Site 889
NW Eileen-2
Mallik 2L-38
Sites994995997
Messoyakha
Figure 4.5 • Map of confirmed methane hydrate presence
Courtesy of S. Dallimore, National Resources Canada.

Taking an optimistic view, technology to exploit gas hydrates commerciallycould be available as soon as 2020. This would make a huge difference toforecasts of future gas supply. It would have a considerable effect on the twomain drivers of the liquefied natural gas (LNG) expansion effort, Japan (in the past)and the United States (in future); they would suddenly find themselves withlarge-scale local supplies. The impact is unlikely to be felt greatly before 2030, butit could start affecting the investment climate for LNG projects and Middle Eastgas as early as 2020.
A more pessimistic view would bear in mind that the Malik experience (AAPG2004) so far indicates that the only deposits anywhere near economic viability arethose containing free gas below the hydrates, and that innovation is still requiredif deposits without free gas are to be developed economically. Certainly, muchmore publicly funded research is needed. The Malik project, for instance, isproposing to carry out a longer-term production test in 2006. Further work of thissort will provide more insight into the role that methane hydrates can play intomorrow's energy systems.
CHAPTER 4 • NON-CONVENTIONAL GAS RESOURCES AND METHANE HYDRATES 91

Chapter 5 • TRANSPORTATION
Transportation of hydrocarbons around the world is set to increase enormously.The IEA World Energy Outlook Reference Scenario projects that a large shareof increased demand for oil over coming decades will be met by supplies fromthe Middle East, delivered to IEA countries, China, India and other emergingeconomies. This will mean moving much greater volumes of oil over largedistances. Inter-regional trade in oil will double from 31 million barrels per day in2002 to 65 million barrels in 2030 (IEA WEO-2004, Reference Scenario).
The same will apply in the case of gas. Increased gas demand in many countries,fuelled in part by its relatively lower CO2 impact, and coupled with liberalisationof gas markets and development of the liquefied natural gas (LNG) trade, will alsohugely expand the amount of gas transported over long distances. Inter-regionaltrade will triple, rising from its 2002 level of 417 billion cubic metres to 1 260 billioncubic metres in 2030 (IEA WEO-2004 Reference Scenario)
This picture of the future raises a number of issues linked to bottlenecks inshipping lanes, to safety and environmental concerns, and to capacity andcost efficiency. In all these areas, technological innovation and internationalco-operation will be needed.
Gas transportation
Traditional transport chains: pipelines and liquefied natural gas
Both modes of transport have been used for many years. They will continue todominate the market.
The three main challenges for these chains are:
■ Reducing costs.
■ Reducing environmental impact.
■ Safety and public acceptance.
In the case of LNG, cost reductions will continue to stem in large part fromeconomies of scale in liquefaction plants and in LNG carrier ships. Capital costs ofLNG liquefaction plants have decreased from USD 500 per tonne/year capacity in1990 to some USD 250 in 2004. And they could fall by another factor of two overthe coming 20 years. Improvements in energy efficiency will have a positiveimpact on both costs and environmental performance. A number of technologiesare under study, notably bringing electrically driven liquefaction trains, open rackvaporisers, enhanced boil-off control and improved energy recovery. For example,use of “membrane technology” in LNG tankers (an Invar/polyurethane tank-wallmaterial) has significantly reduced energy losses in LNG tankers over the past fiveyears. Moreover, this has not in any way slowed the decline in capital costs of LNGtankers, which have fallen at least 25% since 1985 and are expected to shrink byanother 25% over the coming 20 years. This favourable cost development will owemuch to the advent of larger ships with capacities of more than 200 000 cubicmetres, compared with the current generation of 138 000 cubic metre vessels.
CHAPTER 5 • TRANSPORTATION 93
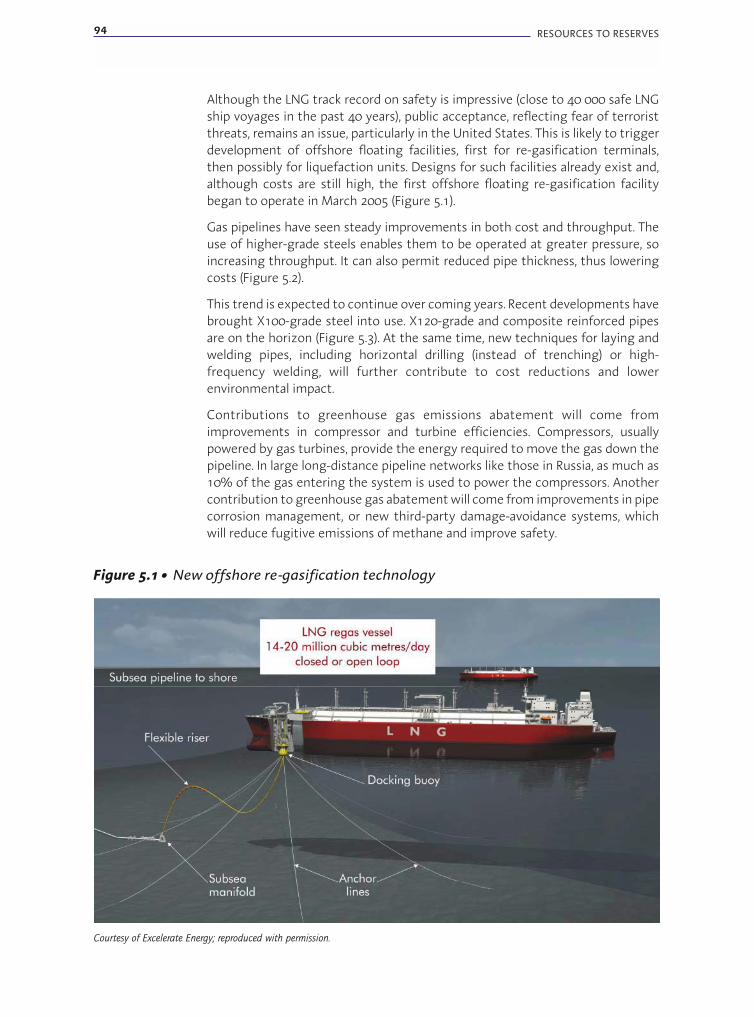
94 RESOURCES TO RESERVES
Although the LNG track record on safety is impressive (close to 40 000 safe LNGship voyages in the past 40 years), public acceptance, reflecting fear of terroristthreats, remains an issue, particularly in the United States. This is likely to triggerdevelopment of offshore floating facilities, first for re-gasification terminals,then possibly for liquefaction units. Designs for such facilities already exist and,although costs are still high, the first offshore floating re-gasification facilitybegan to operate in March 2005 (Figure 5.1).
Gas pipelines have seen steady improvements in both cost and throughput. Theuse of higher-grade steels enables them to be operated at greater pressure, soincreasing throughput. It can also permit reduced pipe thickness, thus loweringcosts (Figure 5.2).
This trend is expected to continue over coming years. Recent developments havebrought X100-grade steel into use. X120-grade and composite reinforced pipesare on the horizon (Figure 5.3). At the same time, new techniques for laying andwelding pipes, including horizontal drilling (instead of trenching) or high-frequency welding, will further contribute to cost reductions and lowerenvironmental impact.
Contributions to greenhouse gas emissions abatement will come fromimprovements in compressor and turbine efficiencies. Compressors, usuallypowered by gas turbines, provide the energy required to move the gas down thepipeline. In large long-distance pipeline networks like those in Russia, as much as10% of the gas entering the system is used to power the compressors. Anothercontribution to greenhouse gas abatement will come from improvements in pipecorrosion management, or new third-party damage-avoidance systems, whichwill reduce fugitive emissions of methane and improve safety.
Figure 5.1 • New offshore re-gasification technology
Courtesy of Excelerate Energy; reproduced with permission.
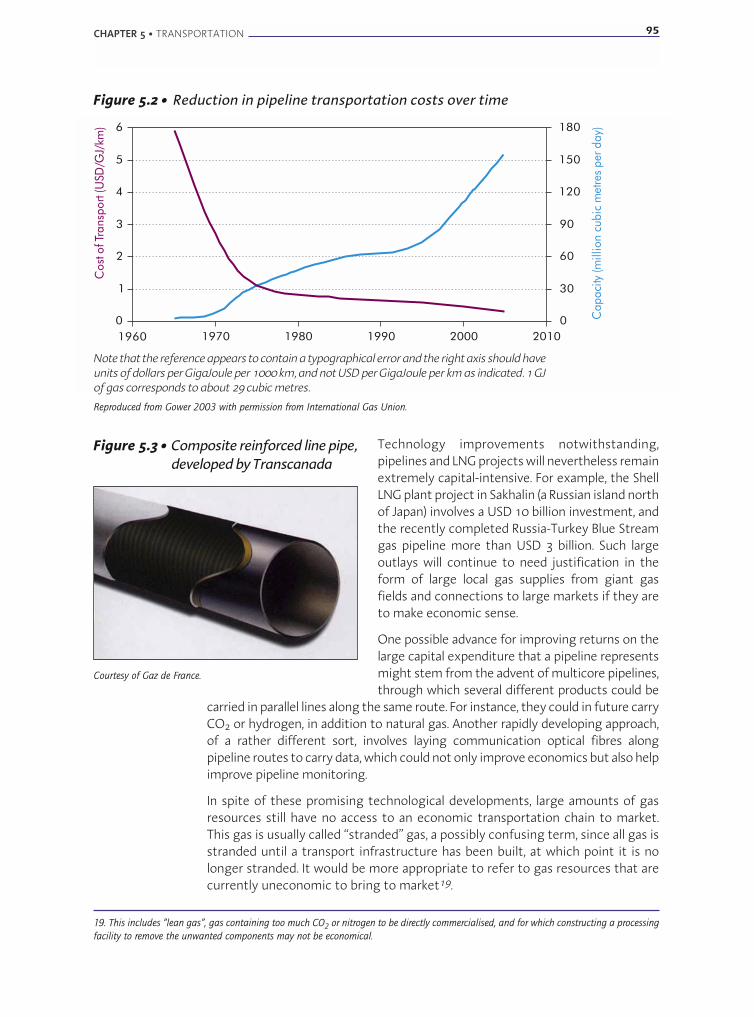
CHAPTER 5 • TRANSPORTATION 95
0
1
2
3
4
5
6
1960
Cos
tofT
rans
port
(USD
/GJ/
km)
0
30
60
90
120
150
180
Cap
acity
(mill
ion
cubi
cm
etre
spe
r day
)
1970 1980 1990 2000 2010
Note that the reference appears to contain a typographical error and the right axis should haveunits of dollars per GigaJoule per 1000 km, and not USD per GigaJoule per km as indicated. 1 GJof gas corresponds to about 29 cubic metres.
Reproduced from Gower 2003 with permission from International Gas Union.
Figure 5.2 • Reduction in pipeline transportation costs over time
Technology improvements notwithstanding,pipelines and LNG projects will nevertheless remainextremely capital-intensive. For example, the ShellLNG plant project in Sakhalin (a Russian island northof Japan) involves a USD 10 billion investment, andthe recently completed Russia-Turkey Blue Streamgas pipeline more than USD 3 billion. Such largeoutlays will continue to need justification in theform of large local gas supplies from giant gasfields and connections to large markets if they areto make economic sense.
One possible advance for improving returns on thelarge capital expenditure that a pipeline representsmight stem from the advent of multicore pipelines,through which several different products could be
carried in parallel lines along the same route. For instance, they could in future carryCO2 or hydrogen, in addition to natural gas. Another rapidly developing approach,of a rather different sort, involves laying communication optical fibres alongpipeline routes to carry data, which could not only improve economics but also helpimprove pipeline monitoring.
In spite of these promising technological developments, large amounts of gasresources still have no access to an economic transportation chain to market.This gas is usually called “stranded” gas, a possibly confusing term, since all gas isstranded until a transport infrastructure has been built, at which point it is nolonger stranded. It would be more appropriate to refer to gas resources that arecurrently uneconomic to bring to market19.
19. This includes “lean gas”, gas containing too much CO2 or nitrogen to be directly commercialised, and for which constructing a processing
facility to remove the unwanted components may not be economical.
Figure 5.3 • Composite reinforced line pipe,developed by Transcanada
Courtesy of Gaz de France.
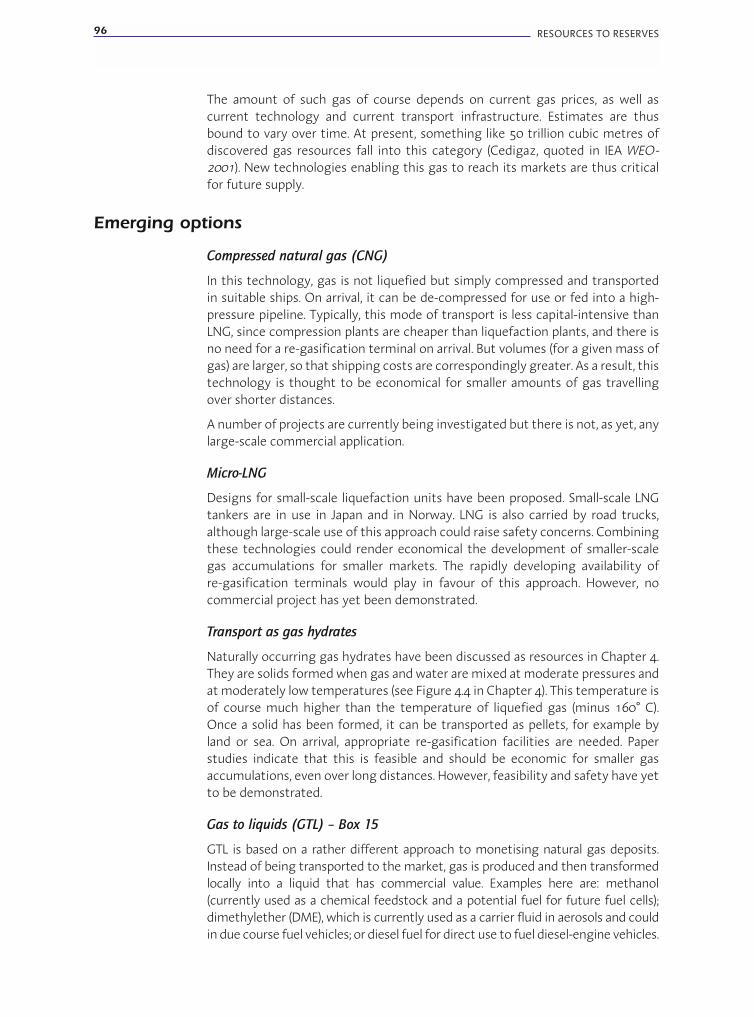
96 RESOURCES TO RESERVES
The amount of such gas of course depends on current gas prices, as well ascurrent technology and current transport infrastructure. Estimates are thusbound to vary over time. At present, something like 50 trillion cubic metres ofdiscovered gas resources fall into this category (Cedigaz, quoted in IEA WEO-2001). New technologies enabling this gas to reach its markets are thus criticalfor future supply.
Emerging options
Compressed natural gas (CNG)
In this technology, gas is not liquefied but simply compressed and transportedin suitable ships. On arrival, it can be de-compressed for use or fed into a high-pressure pipeline. Typically, this mode of transport is less capital-intensive thanLNG, since compression plants are cheaper than liquefaction plants, and there isno need for a re-gasification terminal on arrival. But volumes (for a given mass ofgas) are larger, so that shipping costs are correspondingly greater. As a result, thistechnology is thought to be economical for smaller amounts of gas travellingover shorter distances.
A number of projects are currently being investigated but there is not, as yet, anylarge-scale commercial application.
Micro-LNG
Designs for small-scale liquefaction units have been proposed. Small-scale LNGtankers are in use in Japan and in Norway. LNG is also carried by road trucks,although large-scale use of this approach could raise safety concerns. Combiningthese technologies could render economical the development of smaller-scalegas accumulations for smaller markets. The rapidly developing availability ofre-gasification terminals would play in favour of this approach. However, nocommercial project has yet been demonstrated.
Transport as gas hydrates
Naturally occurring gas hydrates have been discussed as resources in Chapter 4.They are solids formed when gas and water are mixed at moderate pressures andat moderately low temperatures (see Figure 4.4 in Chapter 4). This temperature isof course much higher than the temperature of liquefied gas (minus 160° C).Once a solid has been formed, it can be transported as pellets, for example byland or sea. On arrival, appropriate re-gasification facilities are needed. Paperstudies indicate that this is feasible and should be economic for smaller gasaccumulations, even over long distances. However, feasibility and safety have yetto be demonstrated.
Gas to liquids (GTL) – Box 15
GTL is based on a rather different approach to monetising natural gas deposits.Instead of being transported to the market, gas is produced and then transformedlocally into a liquid that has commercial value. Examples here are: methanol(currently used as a chemical feedstock and a potential fuel for future fuel cells);dimethylether (DME), which is currently used as a carrier fluid in aerosols and couldin due course fuel vehicles; or diesel fuel for direct use to fuel diesel-engine vehicles.

GTL has potential in three different roles.
■ An alternative to LNG for monetisation of extensive gas resources located far fromlarge markets. A number of big GTL plants are planned or being built in Qatar, withthe prospect of initiating production of 30 000 barrels per day of diesel in 2006 andreaching several hundred thousand barrels per day by 2010. Conversion rates arearound 300 cubic metres of gas per barrel of liquid produced. Experience with pilotplant projects around the world shows that economies of scale have made largeGTL plants roughly competitive with LNG plants in terms of the economics. Butfluctuations in relative prices of gas and diesel, or supply contract conditions, maycreate a preference for one over the other: gas tends to be traded through long-term supply contracts, whereas a well developed spot market exists for diesel. Aswith LNG, GTL is a capital-intensive technology, with initial plant costs amountingto some USD 30 000 per barrel per day of capacity (Figure 5.4).
CHAPTER 5 • TRANSPORTATION 97
Box 15 • Gas-to-liquids basics
Current GTL technology uses variants of the Fischer-Tropsch (FT) process, originally developedin Germany and used extensively in South Africa to produce gasoline from coal.
In a first step, natural gas is transformed into “syngas”, a mixture of carbon monoxide andhydrogen. This can be done either by steam reforming of methane (through the reactionCH4 + H2O!CO + 3 H2), or by partial oxidation (through the reaction CH4 + 1/2 O2!CO + 2 H2).
The first path is a highly endothermic reaction, requiring an input of energy, and it producesexcess hydrogen over what is needed for the second step, below. The second path requires anexpensive oxygen separation unit. In some processes, a combination of both paths is used.
In the second step, the syngas is converted into longer-chain hydrocarbons similar to dieselfuels, using a catalytic conversion: CO + 2 H2 ! - CH2- + H2O.
Various catalysers can be used, and this is in fact where most of the technology improvementsare taking place. Currently, the trend is from iron to cobalt, and others will emerge in thefuture. This is a highly exothermic reaction, producing a lot of heat. Depending on plantdesign, some of this heat can be used in the steam reforming process or to provide energy forother applications.
In large-scale plants, typical yields are 3 500 barrels per million cubic metres of gas. Energyefficiency is roughly 70%, so the process releases large quantities of CO2 per unit of output.A large GTL plant would be a prime target for capture and storage of CO2.
A number of research groups are working on single-step reactions (as opposed to the two-stepsyngas plus FT process), which could be more efficient. They usually involve some sort ofplasma discharge. Industrial applications appear to remain a long way off.
An alternative pathway is to produce methanol from methane (a well established industrialprocess), and DME from methanol (a recent but well developed process). DME can be usedas an alternative to liquid petroleum gas (LPG, i.e. butane and propane), or even as analternative to diesel (www.aboutdme.org).
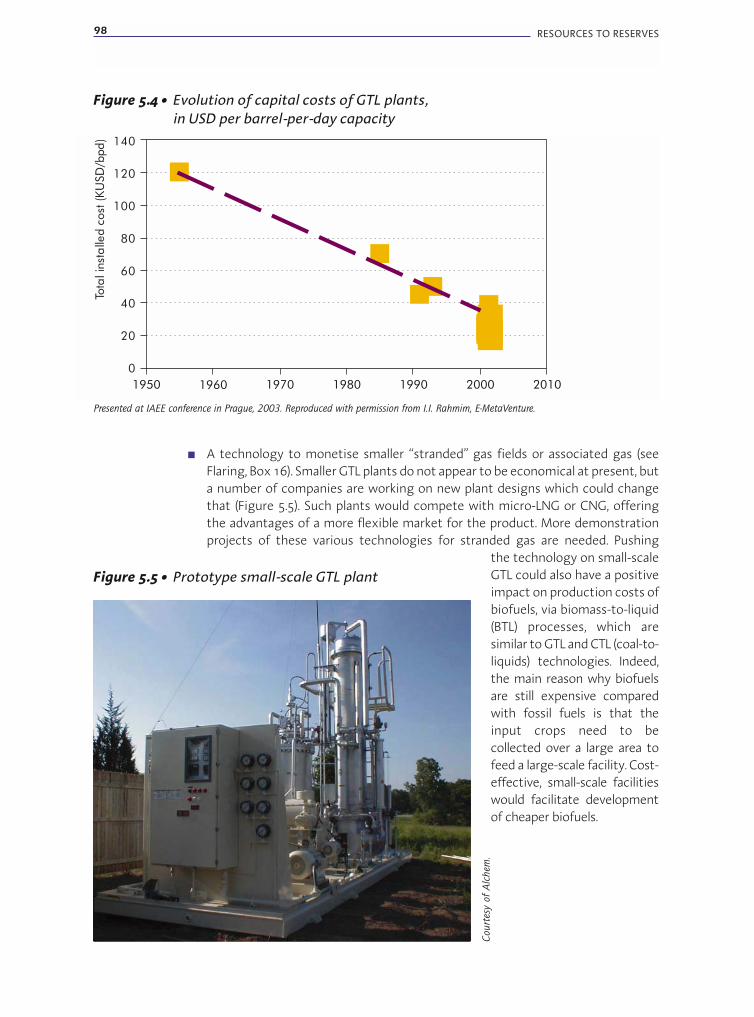
98 RESOURCES TO RESERVES
■ A technology to monetise smaller “stranded” gas fields or associated gas (seeFlaring, Box 16). Smaller GTL plants do not appear to be economical at present, buta number of companies are working on new plant designs which could changethat (Figure 5.5). Such plants would compete with micro-LNG or CNG, offeringthe advantages of a more flexible market for the product. More demonstrationprojects of these various technologies for stranded gas are needed. Pushing
the technology on small-scaleGTL could also have a positiveimpact on production costs ofbiofuels, via biomass-to-liquid(BTL) processes, which aresimilar to GTL and CTL (coal-to-liquids) technologies. Indeed,the main reason why biofuelsare still expensive comparedwith fossil fuels is that theinput crops need to becollected over a large area tofeed a large-scale facility. Cost-effective, small-scale facilitieswould facilitate developmentof cheaper biofuels.
Figure 5.5 • Prototype small-scale GTL plant
Cou
rtes
y of
Alc
hem
.
140
120
100
80
60
40
20
0
Tota
lins
talle
dco
st(K
USD
/bpd
)
1950 1960 1970 1980 1990 2000 2010
Figure 5.4 • Evolution of capital costs of GTL plants,in USD per barrel-per-day capacity
Presented at IAEE conference in Prague, 2003. Reproduced with permission from I.I. Rahmim, E-MetaVenture.
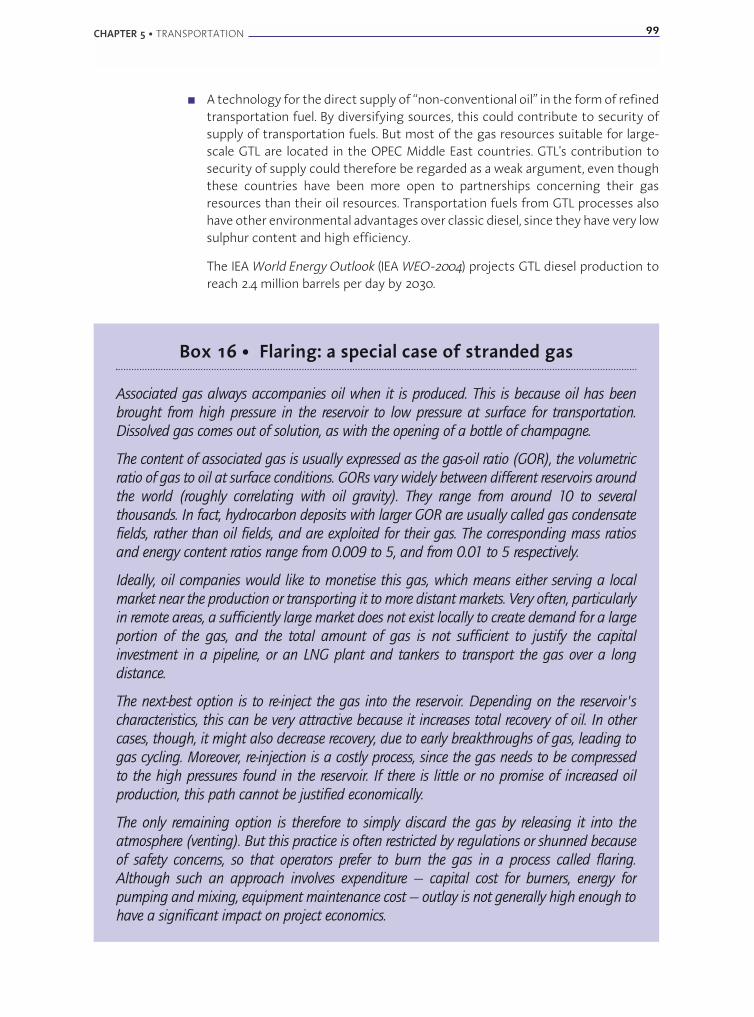
CHAPTER 5 • TRANSPORTATION 99
■ A technology for the direct supply of “non-conventional oil” in the form of refinedtransportation fuel. By diversifying sources, this could contribute to security ofsupply of transportation fuels. But most of the gas resources suitable for large-scale GTL are located in the OPEC Middle East countries. GTL's contribution tosecurity of supply could therefore be regarded as a weak argument, even thoughthese countries have been more open to partnerships concerning their gasresources than their oil resources. Transportation fuels from GTL processes alsohave other environmental advantages over classic diesel, since they have very lowsulphur content and high efficiency.
The IEA World Energy Outlook (IEA WEO-2004) projects GTL diesel production toreach 2.4 million barrels per day by 2030.
Box 16 • Flaring: a special case of stranded gas
Associated gas always accompanies oil when it is produced. This is because oil has been
brought from high pressure in the reservoir to low pressure at surface for transportation.
Dissolved gas comes out of solution, as with the opening of a bottle of champagne.
The content of associated gas is usually expressed as the gas-oil ratio (GOR), the volumetric
ratio of gas to oil at surface conditions. GORs vary widely between different reservoirs around
the world (roughly correlating with oil gravity). They range from around 10 to several
thousands. In fact, hydrocarbon deposits with larger GOR are usually called gas condensate
fields, rather than oil fields, and are exploited for their gas. The corresponding mass ratios
and energy content ratios range from 0.009 to 5, and from 0.01 to 5 respectively.
Ideally, oil companies would like to monetise this gas, which means either serving a local
market near the production or transporting it to more distant markets. Very often, particularly
in remote areas, a sufficiently large market does not exist locally to create demand for a large
portion of the gas, and the total amount of gas is not sufficient to justify the capital
investment in a pipeline, or an LNG plant and tankers to transport the gas over a long
distance.
The next-best option is to re-inject the gas into the reservoir. Depending on the reservoir's
characteristics, this can be very attractive because it increases total recovery of oil. In other
cases, though, it might also decrease recovery, due to early breakthroughs of gas, leading to
gas cycling. Moreover, re-injection is a costly process, since the gas needs to be compressed
to the high pressures found in the reservoir. If there is little or no promise of increased oil
production, this path cannot be justified economically.
The only remaining option is therefore to simply discard the gas by releasing it into the
atmosphere (venting). But this practice is often restricted by regulations or shunned because
of safety concerns, so that operators prefer to burn the gas in a process called flaring.
Although such an approach involves expenditure — capital cost for burners, energy for
pumping and mixing, equipment maintenance cost — outlay is not generally high enough to
have a significant impact on project economics.

100 RESOURCES TO RESERVES
For every oil production project, a company will typically examine these options and select
the most economic, bearing in mind local laws and regulations. Not surprisingly, flaring is
prevalent in places like Western Siberia or Nigeria, where the local market is not large enough
to absorb the gas, and likely capital expenditure is too large to justify building the transport
infrastructure.
The amount of gas being flared worldwide is not known accurately, but estimates have
been made by bodies like the World Bank's flaring reduction project, as shown in Figure
5.6. In addition to being a waste of potentially useful fuel, flaring also releases CO2 into
the atmosphere. Roughly 1% of anthropogenic CO2 emissions come from flaring, which is
why many companies and countries have undertaken efforts to reduce flaring. For
example, Saudi Arabia has essentially eliminated flaring, harnessing the gas for local
energy supply instead. BP reports that the group has eliminated continuous flaring in all
but one of its large fields. But further progress will depend on emergence of some of the
technologies described above: CNG, micro-LNG and GTL. In Russia, for example, where gas
transportation is a monopoly and internal gas prices are low, technologies such as GTL
should be attractive for the oil companies, since they already have an established market
for the produced liquids.
A recent intergovernmental initiative “Methane to Markets” has been set up precisely to
promote use of suitable technologies (http://www.methanetomarkets.org/).
North America 12
North America 12
Middle East16
Middle East16
Central and South America10
FSU19
Asia-Oceania, 11
Africa37
Europe, 3
Figure 5.6 • Estimates of amounts of flared gas in billion cubic metres per year
World total is in the order of 110 billion cubic metres (700 million boe).
World Bank and Cedigaz data.

Oil and gas shipping bottlenecks
As illustrated in Figure 1.12 in Chapter 1, a great deal of the oil transported aroundthe world today has to pass through a small number of chokepoints like theBosphorus, Straights of Hormuz, Straights of Malacca, Golf of Suez, Straights ofDenmark. With forecast increased dependency on oil from the Middle East, thiswill be increasingly the case. A significant part of the growing LNG trade will alsooriginate in the Middle East, thus adding to the bottlenecks. Some of thesewaterways, notably the Bosphorus, are already saturated and often involve longdelays. Compounding this, concern is growing over these bottlenecks' exposureto terrorist threats and major supply disruptions20. Environmental risks are alsogrowing with the expanding traffic.
Technology developments will definitely be needed to alleviate these risks.Possible developments could involve bypassing such chokepoints with short-distance pipelines. An example is the project for the Russia-Bulgaria-Greece oilpipeline, bypassing the Bosphorus. Foreseeable developments in rapid loadingand unloading, with corresponding port infrastructure, could also play a key role.Floating loading and unloading facilities can facilitate access by larger ships toexisting ports, thus reducing the total number of circulating ships.
CHAPTER 5 • TRANSPORTATION 101
5
1
10
25Mill
ion
m/d
ay
3
0
PIPELINELNG
UNECONOMIC
GTL/Methanol
ELECTRICITY(HVDC)
Floating LNG
CNG
SMALLscaleLNG
0 1000 2000 3000 4000 5000
Distance to market - km
Figure 5.7 • Applicability of various gas transport technologies
Reproduced with permission from SINTEF.
Figure 5.7 summarises the possible role of these new technologies in the futureeconomics of gas transportation. It emphasises the need for more progress ontechnologies to monetise small, isolated, gas reservoirs.
20. Reference OECD 2003 provides a useful overview of terrorists' threats to the overall maritime transport system.
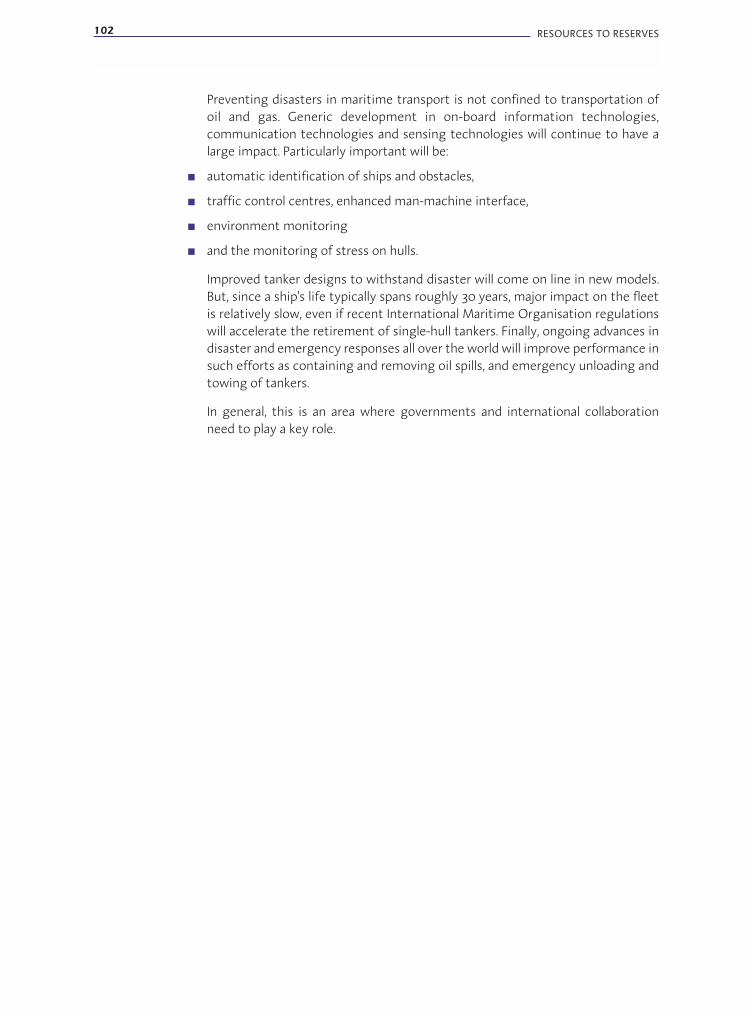
102 RESOURCES TO RESERVES
Preventing disasters in maritime transport is not confined to transportation ofoil and gas. Generic development in on-board information technologies,communication technologies and sensing technologies will continue to have alarge impact. Particularly important will be:
■ automatic identification of ships and obstacles,
■ traffic control centres, enhanced man-machine interface,
■ environment monitoring
■ and the monitoring of stress on hulls.
Improved tanker designs to withstand disaster will come on line in new models.But, since a ship's life typically spans roughly 30 years, major impact on the fleetis relatively slow, even if recent International Maritime Organisation regulationswill accelerate the retirement of single-hull tankers. Finally, ongoing advances indisaster and emergency responses all over the world will improve performance insuch efforts as containing and removing oil spills, and emergency unloading andtowing of tankers.
In general, this is an area where governments and international collaborationneed to play a key role.
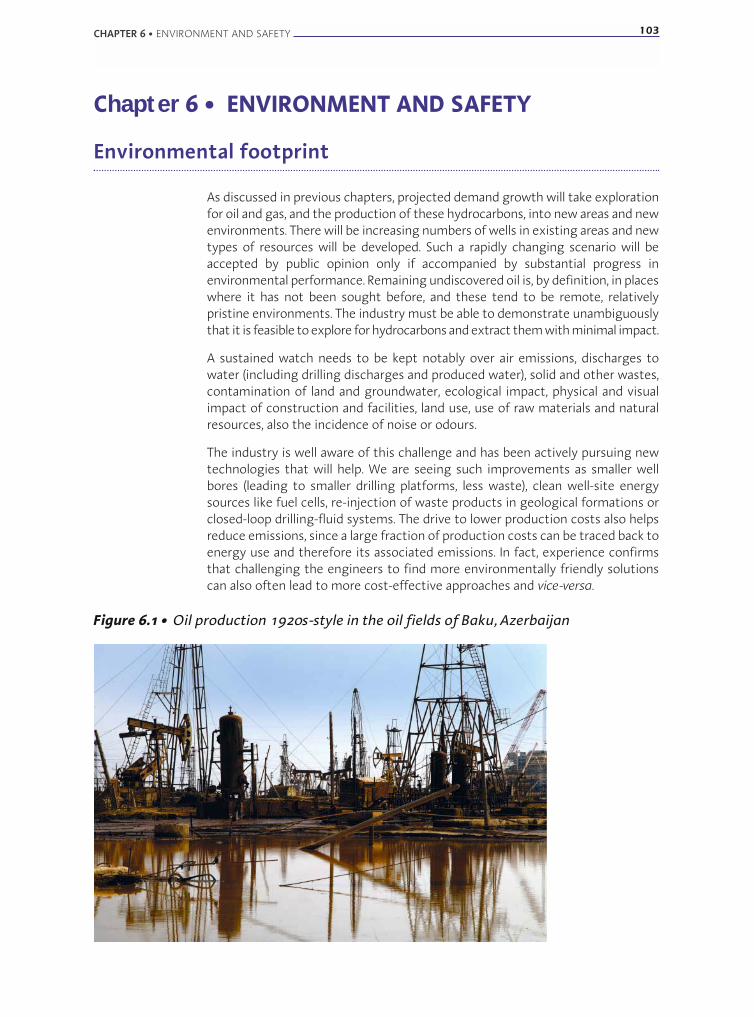
Chapter 6 • ENVIRONMENT AND SAFETY
Environmental footprint
As discussed in previous chapters, projected demand growth will take explorationfor oil and gas, and the production of these hydrocarbons, into new areas and newenvironments. There will be increasing numbers of wells in existing areas and newtypes of resources will be developed. Such a rapidly changing scenario will beaccepted by public opinion only if accompanied by substantial progress inenvironmental performance. Remaining undiscovered oil is, by definition, in placeswhere it has not been sought before, and these tend to be remote, relativelypristine environments. The industry must be able to demonstrate unambiguouslythat it is feasible to explore for hydrocarbons and extract them with minimal impact.
A sustained watch needs to be kept notably over air emissions, discharges towater (including drilling discharges and produced water), solid and other wastes,contamination of land and groundwater, ecological impact, physical and visualimpact of construction and facilities, land use, use of raw materials and naturalresources, also the incidence of noise or odours.
The industry is well aware of this challenge and has been actively pursuing newtechnologies that will help. We are seeing such improvements as smaller wellbores (leading to smaller drilling platforms, less waste), clean well-site energysources like fuel cells, re-injection of waste products in geological formations orclosed-loop drilling-fluid systems. The drive to lower production costs also helpsreduce emissions, since a large fraction of production costs can be traced back toenergy use and therefore its associated emissions. In fact, experience confirmsthat challenging the engineers to find more environmentally friendly solutionscan also often lead to more cost-effective approaches and vice-versa.
CHAPTER 6 • ENVIRONMENT AND SAFETY 103
Figure 6.1 • Oil production 1920s-style in the oil fields of Baku, Azerbaijan
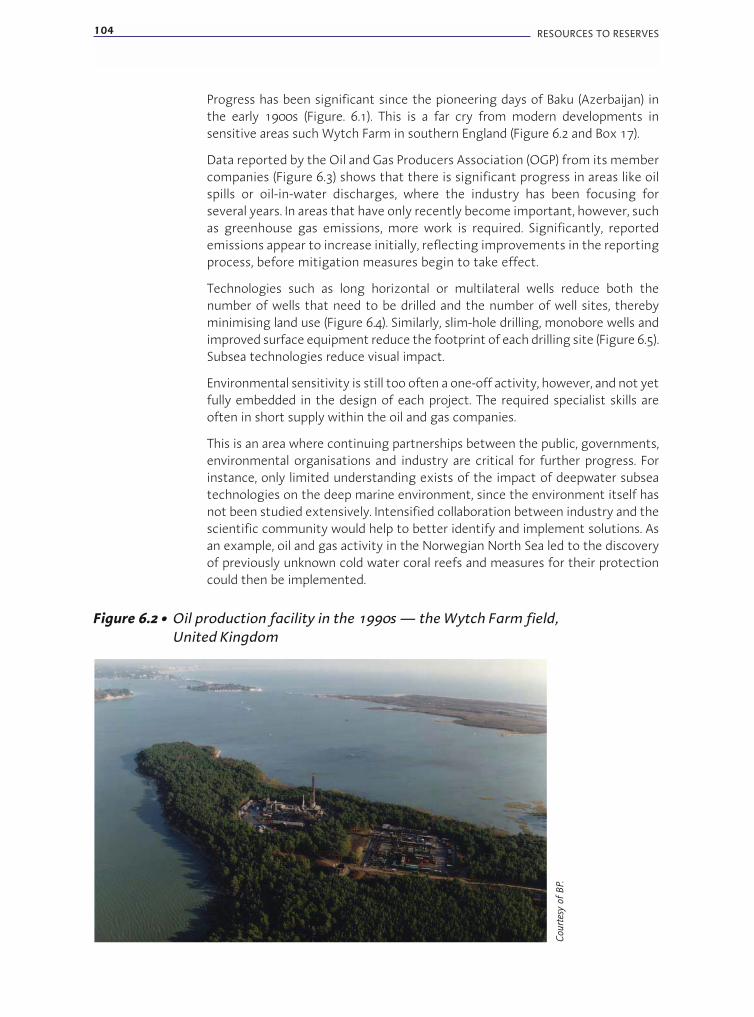
104 RESOURCES TO RESERVES
Progress has been significant since the pioneering days of Baku (Azerbaijan) inthe early 1900s (Figure. 6.1). This is a far cry from modern developments insensitive areas such Wytch Farm in southern England (Figure 6.2 and Box 17).
Data reported by the Oil and Gas Producers Association (OGP) from its membercompanies (Figure 6.3) shows that there is significant progress in areas like oilspills or oil-in-water discharges, where the industry has been focusing forseveral years. In areas that have only recently become important, however, suchas greenhouse gas emissions, more work is required. Significantly, reportedemissions appear to increase initially, reflecting improvements in the reportingprocess, before mitigation measures begin to take effect.
Technologies such as long horizontal or multilateral wells reduce both thenumber of wells that need to be drilled and the number of well sites, therebyminimising land use (Figure 6.4). Similarly, slim-hole drilling, monobore wells andimproved surface equipment reduce the footprint of each drilling site (Figure 6.5).Subsea technologies reduce visual impact.
Environmental sensitivity is still too often a one-off activity, however, and not yetfully embedded in the design of each project. The required specialist skills areoften in short supply within the oil and gas companies.
This is an area where continuing partnerships between the public, governments,environmental organisations and industry are critical for further progress. Forinstance, only limited understanding exists of the impact of deepwater subseatechnologies on the deep marine environment, since the environment itself hasnot been studied extensively. Intensified collaboration between industry and thescientific community would help to better identify and implement solutions. Asan example, oil and gas activity in the Norwegian North Sea led to the discoveryof previously unknown cold water coral reefs and measures for their protectioncould then be implemented.
Figure 6.2 • Oil production facility in the 1990s — the Wytch Farm field,United Kingdom
Court
esy
of
BP.

CHAPTER 6 • ENVIRONMENT AND SAFETY 105
Figure 6.3 • Trends in key environmental impact indicatorsM
illig
ram
s oi
l per
litre
of p
rodu
ced
wat
er d
isch
arge
d
2003
2002
2001
OverallOffshoreOnshore
Oil discharged per unit of produced water discharged
Tonn
es p
er m
illio
n to
nnes
0
5
10
15
20
25
30
35
2003
2002
2001
OverallOffshoreOnshore
7.5
1.84.5
Oil spilt per unit of hydrocarbon production
Tonn
es p
er th
ousa
nd to
nnes
2003
2002
2001
Emissions per thousand tonnes production
0
5
10
15
20
25
30
9.6
20.7 20.0
0.0
0.3
0.6
0.9
1.2
1.5
GHGNOXSO2NMVOCCH4CO2
127
1.3
0.8
0.20.3
132
125
153
159
152
GHG: TotalGreenhouse gases(CO2 + CH4 expressedin CO2 equivalent)
Note: NMVOC stands for non-methane volatile organic compounds.
These three pictures are taken from OGP Report 359: Environmental Performance in the E&P Industry; reproduced
with permission from, and thanks to, OGP — available at http://www.ogp.org.uk

106 RESOURCES TO RESERVES
1970Drillsite 165 acres
1980Kuparuk drillsite 1
24 acres
1985Kuparuk drillsite 3H
11 acres
1999Alpine pad #2
13 acres
Area=3.14sq. miles
Area=7.065sq. miles
Area=19.625sq. miles
Area=50.24sq. miles
2 miles 3 miles 5 miles 8 miles
Figure 6.4 • Tapping larger volumes of reservoir with a smaller surface footprint in Alaska
Courtesy of ConocoPhilips © ConocoPhillips Alaska, Inc. This picture is copyright ConocoPhillips Alaska and
cannot be released or published without the express written consent of ConocoPhillips Alaska, Inc.
Box 17 • An example of modern development: Wytch Farm
The Wytch Farm reservoirs are located at a depth of some 1 600 metres under Poole Harbouron the southern coast of England. The Poole Harbour area has an extremely sensitiveecological environment, protected by the Ramsar intergovernmental convention on wetlands,and by European Union legislation. It is also an area of great natural scenic beauty, with animportant tourism industry. BP's Wytch Farm facility comprises a number of well sites and acentral gathering station. Wells are drilled from shore, using the latest horizontal well drillingtechnology and reach the reservoir up to 10 km under the sea with absolutely no impact onthe marine environment.
The BP Wytch Farm facilities were developed following extensive environmental assessments.Ecological and archaeological surveys, as well as visual impact assessments were undertaken, toidentify how environmental impact could be mitigated. Mitigation measures were incorporatedfrom the start in the construction and operation of the facility. For example, to minimise visualimpact, height restrictions and colour specifications have been imposed for plant and equipment.Lighting is carefully shrouded and positioned. BP has an ongoing landscape management planto maintain a vegetation screen around the sites. Noise limits have been set extremely low, sothat low-noise technology and acoustic screening are routinely used.
The sites are designed to prevent ground and groundwater pollution. Well-sites are hard-surfaced and lined with a sealant liner. Releases to water are minimised since all waterproduced and any potentially contaminated rainwater are re-injected back into the reservoir.
Beyond the original planning and design of the site, ongoing operations are constantlyscrutinised to ensure compliance with stringent requirements and total environmentalcommitment on the part of everybody who works at Wytch Farm.
Edited from inputs from BP.

CHAPTER 6 • ENVIRONMENT AND SAFETY 107
4
0
8
12
16
20
24
28
Hec
tare 26.3 hectare
9.7 hectare
70
60
50
40
30
20
10
0
Kuparukdrillsite 2B
Kuparukdrillsite 3H Kuparuk
drillsite 2M Tarndrillsite 2N
11 acres 8.7 acres 6.7 acres
24 acres
65 acres
*160’
*60’
*25’
Prudhoedrillsite 1
Acr
es
*25’*15’
1970 1980 1985 1991 1998
Figure 6.5 • Decreasing drill-site footprints in Alaska
Courtesy of ConocoPhilips © ConocoPhillips Alaska, Inc. This picture is copyright ConocoPhillips Alaska and
cannot be released or published without the express written consent of ConocoPhillips Alaska, Inc.
Box 18 • An example of modern development:the Europipe gas pipeline landing
Norway's gas is meeting a major share of Western Europe's needs. Gas is transported fromthe Norwegian North Sea terminals through an under-sea pipeline. Design started in 1985and the pipeline route called for a landing on Germany's Lower Saxony coastline.
But the area pinpointed is an ecologically sensitive environment, designated a national park.The area is also protected as a wetland of international importance under the RamsarConvention on conservation and wise use of wetlands and their resources. It is a SpecialProtection Area under the European Commission Birds Directive and a World Heritage Site.
After extensive assessment of environmental impact, Statoil proposed routing through theAccumer Ee tidal inlet between the islands of Langeoog and Baltrum. A solution including a2.6 km-long tunnel under the tidal flats was chosen for crossing the national park. Builtin 1994, this was then the longest tunnel ever constructed in that sort of sand and claysubstrate. The construction under the tidal flats was a particularly testing operationtechnically, as well as a safety and environmental challenge. To minimise future additionalenvironmental impacts, a second pipeline was immediately placed inside the tunnel toanticipate future demand growth.
A comprehensive ecological monitoring programme documented rapid recovery within theconstruction area, most of the reported impacts in the landfall area being within naturalvariations. To compensate for any potential negative ecological impact, a 17-hectare biotopewith ponds and sand dunes was constructed near Emden. This area has developed into ahabitat for a number of rare and threatened species of plants, insects, amphibians and birds.The creation of this habitat was welcomed by the local nature conservation authorities andenvironmental organisations and it now enjoys its own protection status.
Edited from inputs from Statoil.

108 RESOURCES TO RESERVES
CO2 and climate change
Reductions in greenhouse gas emissions from exploration, production andtransport of hydrocarbons is necessarily a major component in any greenhousegas reduction programme. In fact, at least 6% of the fossil fuel energy producedis used in the production process itself (IEA, CCS-2004, Table 3.1). Efficiency gainscan therefore considerably reduce global emissions. This will certainly weigh heavilyin the balance when technology options are being developed and deployed.
CO2 emissions are also a factor to consider in the choice of new resources to bedeveloped. As we have seen in previous chapters, heavy oils and bitumen areintrinsically more carbon-rich than conventional oil. But their extraction also calls formuch heavier use of energy – as do oil shales – and this results in correspondinglyhigher CO2 emissions if that energy is fossil-fuel sourced. Using current technologies,the GTL process also has a limited energy efficiency rating and sizeable CO2 emissions.
As with many challenges, there are nevertheless opportunities to be exploited. Inaddition to being part of the problem, the upstream oil and gas industry can alsobe very much part of the solution. CO2 can be used for enhanced oil recovery orfor gas recovery in coal beds. Depleted oil and gas reservoirs can be used for long-term storage of CO2. In general, well established oil and gas technologies areprecisely those that need to be applied for CO2 storage in geological formations.The required technologies are for the most part already available within privateindustry's portfolio. But a fundamental issue that must be addressed concernsthe monitoring of CO2 storage sites over the very long term. Partnerships withpublic institutions will be needed if monitoring is to be durable and robust.
Security and safety
Because they are often located in remote places, unmanned or operated remotely,many oil and gas assets are vulnerable to potential terrorist attacks. Traditionalaccess control and security measures much like those used in other types ofinstallation are being implemented on more and more sites. Innovation, however,is needed to incorporate better protection of the assets in the design of thefacilities themselves. Given the concerns for safety of LNG installations, forinstance, particularly in the United States (Sandia 2004), technologies to containnatural-gas fires rapidly could be researched, developed and implemented. This isan area where government support is critical; first, because the threats aregenerally beyond the control of private organisations and, second, because therequired skills and expertise are often to be found within government institutions.
Another aspect of safety requiring technological development is resistance tonatural hazards. Installation safety margins are usually based on historicalhazards and thus designed for the storm or landslide that has been seen to occuronce in a hundred years. Climate change, however, could bring natural hazardsthat are increasingly outside those established norms. This is not, of course, anissue affecting oil and gas installations alone. But it clearly requires jointconsideration by industry and regulatory authorities.
Chapter 7 • GETTING ON TRACK
The previous chapters have discussed where the world's supplies of oil and gascould come from in the next 25 years and beyond. We have looked at thetechnologies which will be needed to secure those supplies, and at the sort ofprice context in which they are likely to be applicable. Many of thosetechnologies are being pioneered by private industry. A few are driven bygovernment programmes. Industry has a solid track record as the driver behindnew technologies that have provided low-cost, uninterrupted supplies of oil andgas up till today. Given that track record, coupled with the long list of promisingtechnologies discussed in this book, there is every reason to be optimistic thatthe development process can continue with minimal intervention by publicauthorities.
The previous chapters have also indicated that there is no shortage ofhydrocarbons in the ground. The key issue is at what oil prices the variousresources will become available. This is a difficult question to answer because itmeans predicting the impact to be expected from future technologies.
Finally, oil and gas will compete with alternative sources of energy, whether theseare fossil (coal) or renewable. It is important to try to understand how the variousalternatives will contribute to future energy supply. In the case of hydrocarbons,an idea of which of the possible resources are likely to play a big role is crucial inorder to prioritise investments and R&D. In particular, as discussed in Chapter 3,non-conventional heavy oil will be competing in the liquid transportation fuelmarkets with gas-to-liquids (GTL) and coal-to-liquids (CTL) technologies21.In turn, in a CO2 emissions-constrained world, those alternative fossil fuels willthemselves be competing with emerging fuel technologies such as biofuels orhydrogen (generated from CO2-free primary energies), as well as withtechnologies for improved energy efficiency.
Modelling future technology trends
The IEA has recently started a study analysing these questions as they relate totransportation fuels. Since transportation represents a large share of future oildemand, this is an important step ahead. This work is part of the IEA EnergyTechnology Perspectives project. Based on the MARKAL modelling methodology,this project is developing and using a global energy technology model, the ETPmodel (IEA CCS-2004), to investigate how different technologies may affect theworld energy system in the long term. The model includes several hundredtechnologies covering energy supply, electricity generation and all end-usesectors, in each of the 15 regions represented. The calculations identify the mixof technologies and fuels that minimises the cost of the world energy system ina given scenario.
CHAPTER 7 • GETTING ON TRACK 109
21. It is beyond the scope of this book to discuss CTL technology and its possible evolution. See, for example, Steynberg 2004.
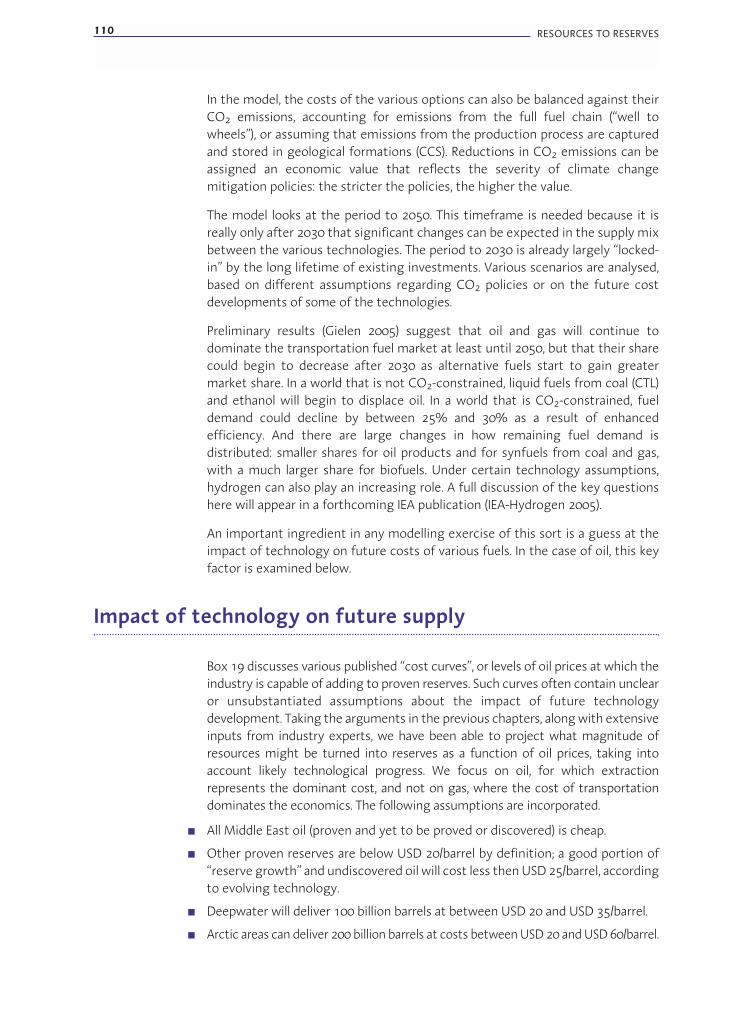
110 RESOURCES TO RESERVES
In the model, the costs of the various options can also be balanced against theirCO2 emissions, accounting for emissions from the full fuel chain (“well towheels”), or assuming that emissions from the production process are capturedand stored in geological formations (CCS). Reductions in CO2 emissions can beassigned an economic value that reflects the severity of climate changemitigation policies: the stricter the policies, the higher the value.
The model looks at the period to 2050. This timeframe is needed because it isreally only after 2030 that significant changes can be expected in the supply mixbetween the various technologies. The period to 2030 is already largely “locked-in” by the long lifetime of existing investments. Various scenarios are analysed,based on different assumptions regarding CO2 policies or on the future costdevelopments of some of the technologies.
Preliminary results (Gielen 2005) suggest that oil and gas will continue todominate the transportation fuel market at least until 2050, but that their sharecould begin to decrease after 2030 as alternative fuels start to gain greatermarket share. In a world that is not CO2-constrained, liquid fuels from coal (CTL)and ethanol will begin to displace oil. In a world that is CO2-constrained, fueldemand could decline by between 25% and 30% as a result of enhancedefficiency. And there are large changes in how remaining fuel demand isdistributed: smaller shares for oil products and for synfuels from coal and gas,with a much larger share for biofuels. Under certain technology assumptions,hydrogen can also play an increasing role. A full discussion of the key questionshere will appear in a forthcoming IEA publication (IEA-Hydrogen 2005).
An important ingredient in any modelling exercise of this sort is a guess at theimpact of technology on future costs of various fuels. In the case of oil, this keyfactor is examined below.
Impact of technology on future supply
Box 19 discusses various published “cost curves”, or levels of oil prices at which theindustry is capable of adding to proven reserves. Such curves often contain unclearor unsubstantiated assumptions about the impact of future technologydevelopment. Taking the arguments in the previous chapters, along with extensiveinputs from industry experts, we have been able to project what magnitude ofresources might be turned into reserves as a function of oil prices, taking intoaccount likely technological progress. We focus on oil, for which extractionrepresents the dominant cost, and not on gas, where the cost of transportationdominates the economics. The following assumptions are incorporated.
■ All Middle East oil (proven and yet to be proved or discovered) is cheap.
■ Other proven reserves are below USD 20/barrel by definition; a good portion of“reserve growth” and undiscovered oil will cost less then USD 25/barrel, accordingto evolving technology.
■ Deepwater will deliver 100 billion barrels at between USD 20 and USD 35/barrel.
■ Arctic areas can deliver 200 billion barrels at costs between USD 20 and USD 60/barrel.
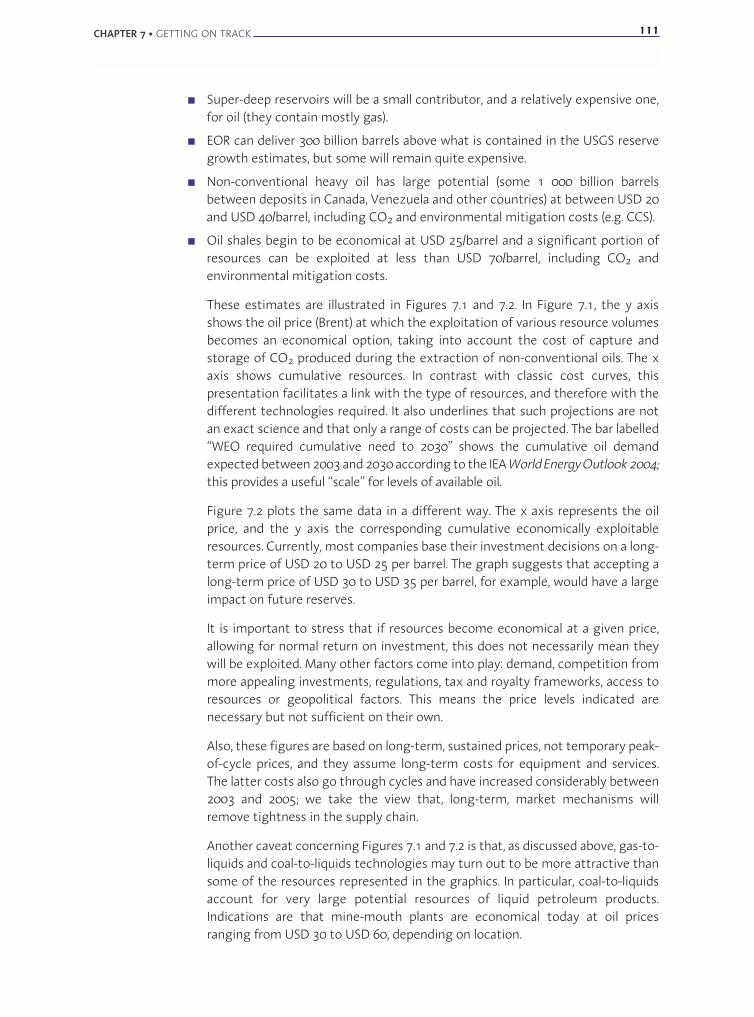
CHAPTER 7 • GETTING ON TRACK 111
■ Super-deep reservoirs will be a small contributor, and a relatively expensive one,for oil (they contain mostly gas).
■ EOR can deliver 300 billion barrels above what is contained in the USGS reservegrowth estimates, but some will remain quite expensive.
■ Non-conventional heavy oil has large potential (some 1 000 billion barrelsbetween deposits in Canada, Venezuela and other countries) at between USD 20and USD 40/barrel, including CO2 and environmental mitigation costs (e.g. CCS).
■ Oil shales begin to be economical at USD 25/barrel and a significant portion ofresources can be exploited at less than USD 70/barrel, including CO2 andenvironmental mitigation costs.
These estimates are illustrated in Figures 7.1 and 7.2. In Figure 7.1, the y axisshows the oil price (Brent) at which the exploitation of various resource volumesbecomes an economical option, taking into account the cost of capture andstorage of CO2 produced during the extraction of non-conventional oils. The xaxis shows cumulative resources. In contrast with classic cost curves, thispresentation facilitates a link with the type of resources, and therefore with thedifferent technologies required. It also underlines that such projections are notan exact science and that only a range of costs can be projected. The bar labelled“WEO required cumulative need to 2030” shows the cumulative oil demandexpected between 2003 and 2030 according to the IEA World Energy Outlook 2004;this provides a useful “scale” for levels of available oil.
Figure 7.2 plots the same data in a different way. The x axis represents the oilprice, and the y axis the corresponding cumulative economically exploitableresources. Currently, most companies base their investment decisions on a long-term price of USD 20 to USD 25 per barrel. The graph suggests that accepting along-term price of USD 30 to USD 35 per barrel, for example, would have a largeimpact on future reserves.
It is important to stress that if resources become economical at a given price,allowing for normal return on investment, this does not necessarily mean theywill be exploited. Many other factors come into play: demand, competition frommore appealing investments, regulations, tax and royalty frameworks, access toresources or geopolitical factors. This means the price levels indicated arenecessary but not sufficient on their own.
Also, these figures are based on long-term, sustained prices, not temporary peak-of-cycle prices, and they assume long-term costs for equipment and services.The latter costs also go through cycles and have increased considerably between2003 and 2005; we take the view that, long-term, market mechanisms willremove tightness in the supply chain.
Another caveat concerning Figures 7.1 and 7.2 is that, as discussed above, gas-to-liquids and coal-to-liquids technologies may turn out to be more attractive thansome of the resources represented in the graphics. In particular, coal-to-liquidsaccount for very large potential resources of liquid petroleum products.Indications are that mine-mouth plants are economical today at oil pricesranging from USD 30 to USD 60, depending on location.
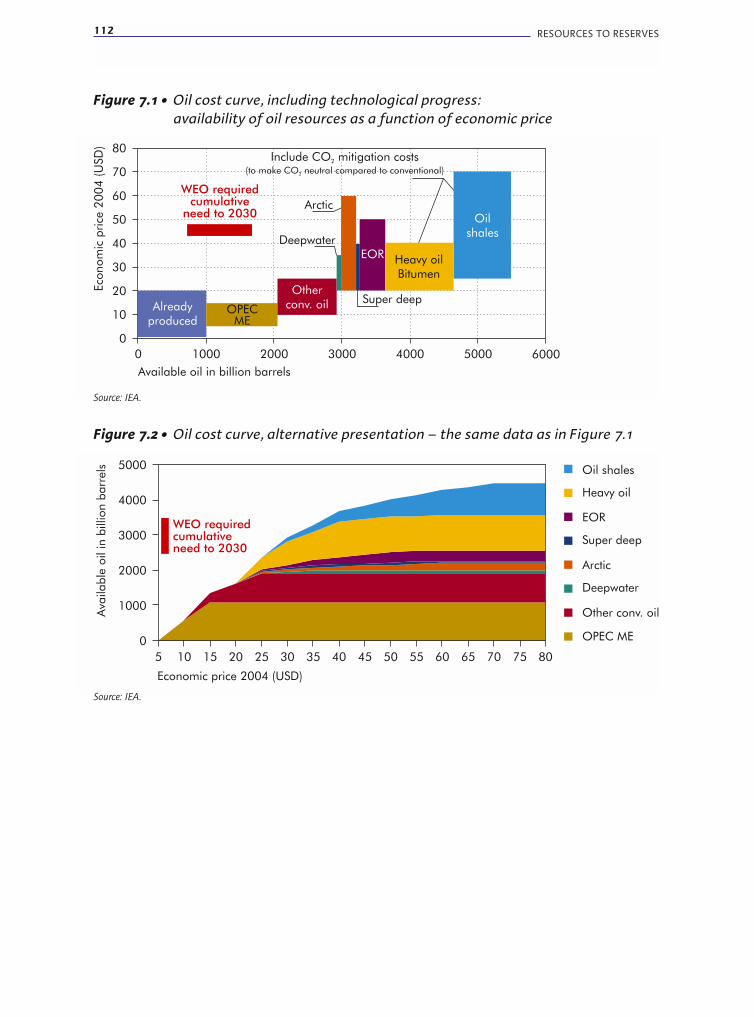
112 RESOURCES TO RESERVES
0
1000
2000
3000
4000
5000
5 10 15 20 25 30 35 40 45 50 55 60 65 70 75 80
Economic price 2004 (USD)
Ava
ilable
oil
inbill
ion
barr
els Oil shales
Heavy oil
EOR
Super deep
Arctic
Deepwater
Other conv. oil
OPEC ME
WEO requiredcumulativeneed to 2030
Figure 7.2 • Oil cost curve, alternative presentation – the same data as in Figure 7.1
Source: IEA.
0
10
20
30
40
50
60
70
80
0 1000 2000 3000 4000 5000 6000
Available oil in billion barrels
Include CO mitigation costs2
(to make CO neutral compared to conventional)2
Eco
nom
icpri
ce2
00
4(U
SD
)
Alreadyproduced
WEO requiredcumulative
need to 2030Arctic
Deepwater
Super deep
EOR
Otherconv. oilOPEC
ME
Oilshales
Heavy oilBitumen
Figure 7.1 • Oil cost curve, including technological progress:availability of oil resources as a function of economic price
Source: IEA.

CHAPTER 7 • GETTING ON TRACK 113
Box 19 • Cost curves and learning curves
If there is no shortage of hydrocarbons in the ground, and if the key question concerns the
oil prices at which the various resources will become available, how can we answer that
question? How can we foresee the impact of future technologies? All economic models that
are used to make projections – notably the ETP model mentioned earlier in this chapter – need
to make assumptions about the costs and performance of future technologies. This box takes
a brief look at relevant published work. A number of approaches have been discussed in the
literature, usually based on cost curves and/or learning curves.
For example, in the 1995 United States Geological Survey assessment of United States oil and
gas resources (USGS 1995), E. D. Attanasi shows “incremental cost functions”, estimates of “the
resources the industry is capable of adding to proved reserves” as a function of marginal costs.
0
10
20
30
40
50
USD
per
barr
el
0 5 10 15 20 25
Billions of barrels of oil
0
1
2
3
4
5
6
USD
per
thou
sand
cubi
cfe
et
0 50 100 150 200 250
Trillions of cubic feet of gas
Figure 7.3 • Incremental costs of finding, developing, and producing new oil andgas resources in the United States
Solid lines are for conventional resources, dashed for the total of conventional and non-conventional. Although not specified in the publication, the units are probably in 1994 USD .1 000 cubic feet is approximately 28 cubic metres.
Reproduced from USGS-1995.

114 RESOURCES TO RESERVES
These curves (Figure 7.3) are obtained from the probability distribution of resources in various
locations, as a function of depth, coupled with various experts' estimates of the current costs
of finding, developing and producing those resources. So these curves are a snapshot at
one point in time, assuming 1994 technology with no cost reductions through subsequent
technology learning.
In its National Energy System Model, the United States Energy Information Agency (EIA)
breaks up conventional oil and gas exploration and production into sub-activities (e.g.
drilling) and applies a yearly “learning” cost reduction to each activity separately, ranging
from about 0.5% to 1.5 % per year. For non-conventional gas, EIA identifies future key
technological steps and makes assumptions about their timing and their impact on costs.
H. H. Rogner produces a similar curve at world level (Figure 7.4) in his 1997 “Assessment of
World Hydrocarbon Resources” (Rogner 1997). This is obtained by taking experts' estimates
of current (1997) costs and applying a cost reduction of 1% per year from learning. So his
curve is not a snapshot in time. It is supposed to represent future costs, assuming that the
starting point will always be production of the lowest-cost resources (which is not the case in
a world where OPEC can exercise partial monopoly power). A similar approach was used in
the European Commission funded SAUNER project (SAUNER 2000). Interestingly, Rogner
underestimated learning effects: his estimates (Table 10 in Rogner 1997) of the costs of
various resources were not confirmed by what happened after 1997. Indeed, current costs of
non-conventional oil in Canada are significantly below his figures (USD 20 to USD 25 in
2004 USD, as opposed to his USD 35 to USD 38 in 1990 USD). This indicates that learning
can be significantly faster than in his hypothesis.
David Greene (Greene 2003) uses very similar methodology to Rogner's. His curves for non-
conventional oil are reproduced in Figure 7.5. His assumptions for oil shales in particular
appear very pessimistic compared to current cost estimates published by other authors (see
Chapter 3) and his learning curves also appear very modest.
Learning curves have long been used to model the impact of technological progress (see, for
example, McDonald-2001 and references therein). In the learning curve approach, costs are
assumed to decrease exponentially as a function of cumulative output (for example, with a
learning rate of 20%, the 200th item produced is 20% cheaper than the 100th item
produced, and the 2000th item produced is 20% cheaper than the 1000th item produced).
C. O. Wene (Wene 2004) argues that, since roughly 1988, a typical learning rate in oil and
gas exploration and development costs has been around 20% (as a function of cumulative
reserves additions, meaning that costs are reduced 20% every time cumulative additions are
doubled). However, these results are heavily dependant on the assumption that 1988
represents a significant technology break and a suitable starting point for the learning curve.
Extrapolation to the future assumes that there will not be another similar technology break.
In addition, it can be argued that standard technology learning curve models do not apply
very well to extractive industries such as oil and gas, as it is not a question of repeatedly
making the same “product” but one of tackling more and more difficult geological settings,
or different types of resource.
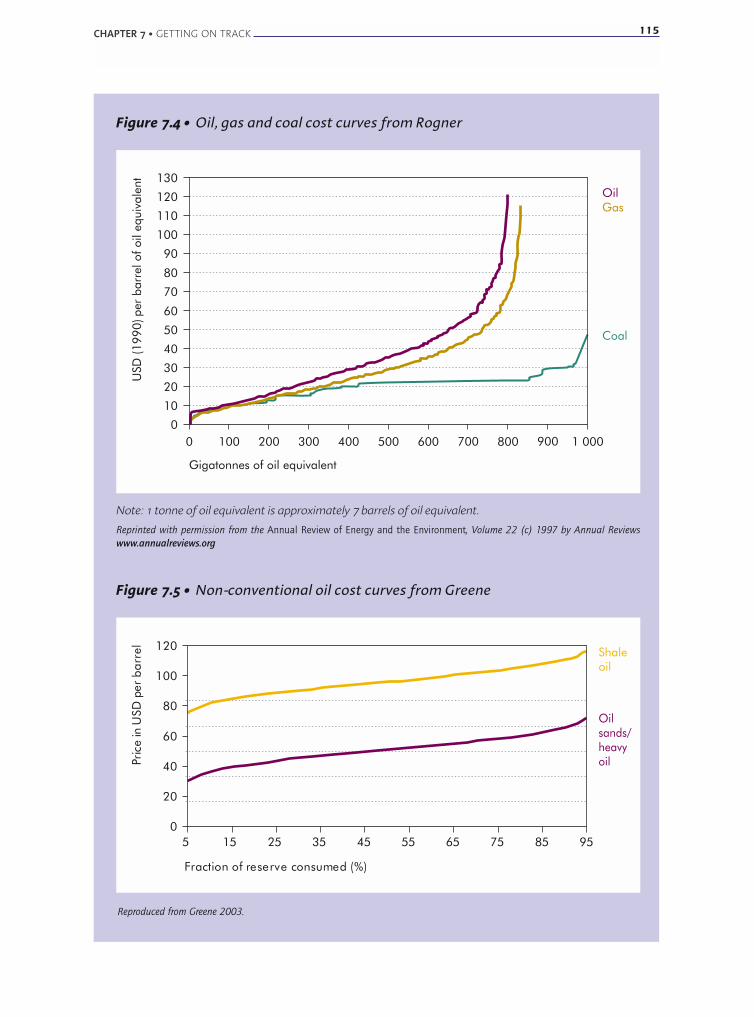
CHAPTER 7 • GETTING ON TRACK 115
USD
(199
0)pe
rba
rrel
ofoi
l equ
ival
ent
Gigatonnes of oil equivalent
0
10
20
30
40
50
60
70
80
90
100
110
120
130
0 100 200 300 400 500 600 700 800 900 1 000
OilGas
Coal
Figure 7.4 • Oil, gas and coal cost curves from Rogner
Note: 1 tonne of oil equivalent is approximately 7 barrels of oil equivalent.
Reprinted with permission from the Annual Review of Energy and the Environment, Volume 22 (c) 1997 by Annual Reviews
www.annualreviews.org
0
20
40
60
80
100
120
5 15 25 35 45 55 65 75 85 95
Fraction of reserve consumed (%)
Pric
ein
USD
per
barr
el
Oilsands/heavyoil
Shaleoil
Figure 7.5 • Non-conventional oil cost curves from Greene
Reproduced from Greene 2003.
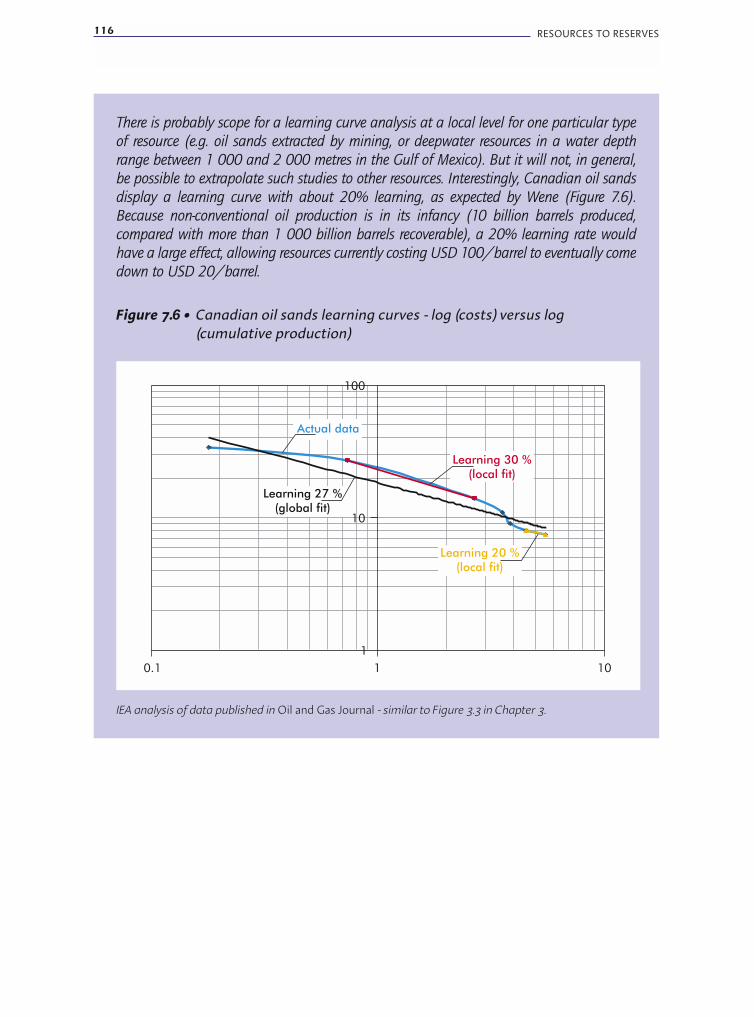
116 RESOURCES TO RESERVES
There is probably scope for a learning curve analysis at a local level for one particular type
of resource (e.g. oil sands extracted by mining, or deepwater resources in a water depth
range between 1 000 and 2 000 metres in the Gulf of Mexico). But it will not, in general,
be possible to extrapolate such studies to other resources. Interestingly, Canadian oil sands
display a learning curve with about 20% learning, as expected by Wene (Figure 7.6).
Because non-conventional oil production is in its infancy (10 billion barrels produced,
compared with more than 1 000 billion barrels recoverable), a 20% learning rate would
have a large effect, allowing resources currently costing USD 100/barrel to eventually come
down to USD 20/barrel.
0.1 1 10
10
1
100
Learning 20 %(local fit)
Actual data
Learning 30 %(local fit)
Learning 27 %(global fit)
Figure 7.6 • Canadian oil sands learning curves - log (costs) versus log(cumulative production)
IEA analysis of data published in Oil and Gas Journal - similar to Figure 3.3 in Chapter 3.

The role of governments
It should be noted, however, that neither private enterprises nor nationalcompanies necessarily have the incentive to assume the risk of tackling newtypes of resources such as oil sands or oil shales. Such players might choose, forexample, to focus instead on maximising returns from their investments indeepwater in a high oil-price environment. Diversifying energy sources to ensuresecurity of supply in a relatively mild price environment is a public-good objectivethat may not necessarily be met by the play of free markets. A case in point isthe recent boom in Canadian heavy oil and oil sands, in large part the result of aroyalty regime more favourable than that for conventional oil. This regime wasrequired to trigger the iterative investments in new technologies that have nowmade such resources economical. Similarly, the boom in coal bed methane in theUnited States was initiated by public investment in the early 1980s (along with afavourable tax regime) to provide for demonstration of the technologies thatwere required for this type of gas reservoir, which was unusual at the time.Helping to mitigate risk at the early stage of investment in new types ofresources is therefore an approach that certainly merits consideration.
It should be noted, too, that there does not tend to be great interest in new typesof resources among service and supply-sector players, who are now responsible fora large chunk of the industry R&D. They need to have ready customers for theirnew products and cannot easily justify developing products for a market that doesnot yet exist. Partnerships between suppliers and operators ready to take on therisks associated with new resources are crucial to technological progress.
Furthermore, private industry cannot be relied upon to invest in research ontechnologies that are too far from being economical. For example, EORtechnologies have seen only limited progress since their boom in the early 1980s.This is because they were just off the industry's radar screen during the period oflow oil prices in the 1990s. Persistently higher oil price over a period will of courserevive interest, but only after oil prices have been high for some time. Continuingactive research when oil prices are low would contribute to containing futureprice increases before they appear.
Historically, governments from IEA countries with oil and gas resources on theirterritories have been the most active in supporting technology development inthe oil and gas industry (for example, Canada, Norway, United States). The mostnotable exceptions are Japan and, to some extent, France. However, most ofthe remaining conventional resources and future production are in non-IEAcountries. All IEA countries will become more and more dependant on OPECMiddle East. Also, all IEA countries already play a key role in technologydevelopment, or have the potential to do so. The IEA countries thus share a similarincentive to contribute to worldwide technology development that can ensure areliable supply of reasonably priced oil and gas during the coming decades, whenoil and gas will remain the primary sources of energy in the world.
Throughout the previous chapters, we have noted some areas where governmentpolicies could have an impact on technology development. They will besummarised in the following key conclusions.
CHAPTER 7 • GETTING ON TRACK 117
118 RESOURCES TO RESERVES
Key conclusions
A number of evaluations and pointers emerge from the previous chapters andfrom extensive consultations with industry experts during preparation ofthis study.
■ Resources are abundant enough to fuel the world's energy systems at reasonableprices for the foreseeable future, as shown in Figures 7.1 and 7.2.
■ A determined effort will be needed in research and development to make thenecessary technologies available to develop these resources cost-effectively. Thepotential for new and more effective technologies is high.
■ Industry clearly has the means, capability and incentives to undertake therequired R&D. Measures to encourage R&D efforts would be beneficial.
■ Public policy can play a key role in numerous ways, notably by focusing on thefollowing:
● Providing a framework favourable to investment in new resources, includingappropriate licensing, taxation, royalties and support for demonstrationprojects. Experience has shown that these can be instrumental in catalysingthe technology learning required to make non-conventional resourcescompetitive.
● Providing a policy climate that ensures continued active co-operationbetween technology developers in IEA countries and hydrocarbon resourcesholders in OPEC countries.
● Taking the lead in promoting technology development and facilitatinginvestments that can reduce shipping bottlenecks.
● Actively participating in developing and facilitating the implementation oftechnologies that improve the safety of installations.
● Ensuring that CO2 emissions reduction is given sufficient value to foster morewidespread CO2 enhanced oil recovery (EOR) and thus higher recovery rates.
● Supporting basic science in the biology and ecology of subsurface bacterialsystems, since this can trigger breakthroughs in use of biotechnologies toenhance recovery or to transform heavy hydrocarbons.
● Vigilantly supporting industry's efforts to reduce its environmental footprintand thus to access resources in new areas.
● Continuing to spearhead science and technology advances linked to futureexploitation of methane hydrate deposits, while ensuring strong industryparticipation. These resources are potentially very important to long-termsupply but currently too far off for sole reliance on industry contributions.

Policy approaches drawing on these observations can help build the partnershipsbetween industry and government that are needed to protect the interests ofall stakeholders. Along with continued international collaboration on advancingtechnological development in the upstream oil and gas industry, suchapproaches will be needed if the hydrocarbon markets of tomorrow are to deliveron their promises.
CHAPTER 7 • GETTING ON TRACK 119

REFERENCES
AAPG (2004): S. Hancock, B. Weatherill, T. Collett, M. Pooladi-Darvish, G. Moridis,T. Okazawa, K. Osadetz and S. Dallimore, A Preliminary Investigation on theEconomics of Onshore Gas Hydrate Production Based on the Mallik Field Discovery,paper presented at the AAPG Hedberg Conference, Vancouver, BC, Canada,September 2004, http://www.aapg.org/education/hedberg/past/index.cfm.
ACR (2004): Alberta Chamber of Resources, Oil Sands Technology Roadmap:Unlocking the Potential, Edmonton, January 2004, http://www.acr-alberta.com/Projects/Oil_Sands_Technology_Roadmap/OSTR_report.pdf.
ASPO: Association for the Study of Peak Oil&Gas, whose Web site containsextensive references to literature arguing for more conservative estimates ofworld oil and gas resources, http://www.peakoil.net/.
DoE (2004): United States Department of Energy, “Coiled Tubing and DOE/NETL'sTechnology Program”, presentation at International Coiled Tubing Associationlunch, 15 January 2004, http://www.icota.com/publications/Lunch%20Learn/NETL-ICOTA%20Luncheon%201-15-04%20Final.pdf.
DoE Shales (2004): United States Department of Energy, “Strategic Significanceof America's Oil Shale Resource”, Vol. 2, Oil Shale Resources, Technology andEconomics, March 2004, http://www.fe.doe.gov/programs/reserves/publications/Pubs-NPR/npr_strategic_significancev2.pdf , also at http://www.shaleoilinfo.org/library/government/doe_vol2final.pdf.
DoE CO2 (2005): United States Department of Energy, “Six Basin-Oriented CO2-EOR Assessments Examine Strategies for Increasing Domestic Oil Production”,DoE Office of Fossil Energy, http://www.fossil.energy.gov/programs/oilgas/eor/Six__Basin-Oriented_CO2-EOR_Assessments_.html.
Encyclopaedia Britannica (2005): Oil shales, Encyclopaedia Britannica Online,http://search.eb.com/eb/Article?tocld=50648.
Flint (2005): Flint, L., Bitumen Recovery Technology: A Review of Long TermR&DOpportunities, report prepared for Natural Resources Canada, April 2005,http://www.ptac.org/links/dl/BitumenRecoveryTechnology.pdf.
Gielen (2005): Gielen, D and F. Unander (IEA), Alternative Fuels: An EnergyTechnology Perspective, March 2005, http://www.iea.org/textbase/papers/2005/ETOAltFuels05.pdf.
Gower (2003): Gower, S. and M. Howard, Changing Economics of GasTransportation, paper presented at the 22nd World Gas Conference Tokyo, 2003,http://www.igu.org/WGC2003/WGC_pdffiles/10175_1046659520_1393_1.pdf.
REFERENCES 121

122 RESOURCES TO RESERVES
Greene (2003): Greene, David L, Janet L Hopson and Li Jia (2003), Running out ofand into oil: analyzing global oil depletion and transition through 2050, ORNL/TM-2003/259, http://cta.ornl.gov/cta/Publications/pdf/ORNL_TM_2003_259.pdf.
Hart's (2005): Rhonda Duey, “Journey to the center of the Earth”, in Hart'sE & P Net, February 2005, http://www.eandpnet.com/ep/previous/0205/0205exploration_tech.htm.
IEA WEO (2001): IEA (International Energy Agency), World Energy Outlook: 2001Insights, OECD/IEA, Paris.
IEA WEO (2003): World Energy Investment Outlook: 2003 Insights, OECD/IEA, Paris.
IEA WEO (2004): World Energy Outlook 2004, OECD/IEA, Paris.
IEA WEO (2005): World Energy Outlook 2005; to be published.
IEA CCS (2004): IEA (International Energy Agency), Prospects for CO2 Capture andStorage, OECD/IEA, Paris, 2004.
IEA Hydrogen (2005): IEA (International Energy Agency), Prospects for Hydrogenand Fuel Cells; to be published.
IFP (2005): Bret-Rouzaut, N. and M. Thom, “Technology Strategy in the UpstreamPetroleum Supply Chain”, Les Cahiers de l'Économie No. 57 (March), InstitutFrançais du Pétrole (2005).
Klett (2003): Klett, T. R. and J. W. Schmoker , “Reserve Growth of the World's GiantOil Fields”, AAPG Memoir, No. 78, Giant Oil and Gas Fields of the Decade, p 107,American Association of Petroleum Geologists, 2003.
Laherrere (2003): Laherrere, J., “Future of Oil Supplies”, paper presented at theSeminar Center of Energy Conversion, Zurich, May 2003, http://www.oilcrisis.com/laherrere/zurich.pdf.
Laske (1997): Laske, G and G. Masters, A Global Digital Map of Sediment Thickness,EOS Trans. AGO, 78, F483, 1997.
Marquette (2004): Marquette, G, “Oil and Gas Industries Technology Master Plan”,presentation at the SPE meeting on Management and Information, Milan (Italy),20 April 2004, http://www.assomineraria.org/news/attach/g.marquette.pdf.
McDonald (2001): McDonald, A. and L. Schattenholzer, “Learning Rates for EnergyTechnologies”, Energy Policy, Vol. 29, Issue 4, March 2001, pp 255-261.
Mijnssen (2003): Mijnssen, F.C. J. et al., “Maximizing Yibal's Remaining Value”, SPEReservoir Evaluation and Engineering, Vol. 6, Number 4, August 2003, p 255.
Milkov (2004): Milkov, Alexei V., “Global estimates of hydrate-bound gas in marinesediments: how much is really out there?”, Earth-Science Reviews, Vol. 66, Issue 3-4,pp 183-197.
Norway CO2 (2005): Norwegian Petroleum Directorate, Report on feasibilitystudy of projects entailing CO2 injection for increased oil recovery on theNorwegian continental shelf, 2005 http://www.npd.no/English/Emner/Ytre+miljo/co2rapport_pm_260405.htm.
OECD (2003): “Security in Maritime Transport: Risk Factors and Economic Impact”,Directorate of Science, Technology and Industry, DSTI/DOT/MTC(2003)47/Final, 4September, 2003, OECD, Paris.
Rogner (1997): Rogner, H. H., “An Assessment of World Hydrocarbon Resources”,Annual Reviews of Energy and Environment, Vol. 22, pp 217-262, Annual Reviews Inc.
Rogner (2000): Rogner, H.H., World Energy Assessment, Chapter 5,http://www.undp.org/seed/eap/activities/wea/drafts-frame.html.
Saleri (2004): Saleri, N.G. et al., “Shaybah-220: A Maximum Reservoir Contact Well”,SPE Reservoir Evaluation and Engineering, Vol. 7, No. 7, August 2004, pp 316-320.
Sandia (2004): M. Hightower et al., Guidance on Risk Analysis and SafetyImplications of a Large Liquefied Natural Gas (LNG) Spill Over Water, Sandia reportSAND2004-6258, December 2004, http://www.fossil.energy.gov/programs/oilgas/storage/lng/sandia_lng_1204.pdf.
SAUNER (2000): SAUNER (Sustainability And the Use of Non-rEnewable Resources),Summary Final Report, ENV4-CT97-0692, November 2000, http://www.bath.ac.uk/~hssam/sauner/.
Schlumberger (1992): “A Niche for Enhanced Oil Recovery in the 1990s”, article inOilfield Review, Vol. 4, No. 1, January 1992, available at http://www.oilfield.slb.com/media/services/resources/oilfieldreview/ors92/0192/p55_61.pdf.
Simmons (2005): Simmons, M. R., Twilight in the Desert, John Wiley & Sons Inc.Hoboken, New Jersey, 2005.
SPE/WPC/AAPG (2000): Society of Petroleum Engineers, World PetroleumCongress and American Association of Petroleum Geologists (2000) - “PetroleumResources Classification and Definitions”, SPE, Richardson.
Steynberg (2004): Steynberg, A. P. and H. G. Nel, “Clean Coal Conversion OptionsUsing Fischer-Tropsch Technology”, Fuel Vol. 83, Issue 6, p 765.
USGS (2000): United States Geological Survey, World Petroleum Assessment 2000,USGS, Washington, http://pubs.usgs.gov/dds/dds-060/.
USGS (1995): Attanasi, E.D., Economics and the 1995 National Assessment ofUnited States Oil and Gas Resources, United States Geological Survey Circular1145, Washington 1998, http://pubs.usgs.gov/circ/1998/c1145/c1145.pdf.
Wene (2004): Wene, C. O., presentation at Forum for Energy Modelling, Bonn,October 2004.
REFERENCES 123

124 RESOURCES TO RESERVES
White (2005): C.M. White et al, “Sequestration of Carbon Dioxide in Coal withEnhanced Coalbed Methane Recovery - A Review”, Energy and Fuels Vol. 19, Issue 3,p 659, 2005.
Yeten (2002): Yeten, B, L. Durlofsky and K. Aziz, “Optimum Deployment of Non-Conventional Wells”, presentation at SUPRI-HW 2002 Annual Meeting, Stanford,California (United States).


All IEA publications can be bought
online on the IEA Web site:
You can also obtain PDF files of
all IEA books at 20% discount.
Books published before January 2004
- with the exception of the statistics publications -
can be downloaded in PDF, free of charge,
on the IEA Web site.
You can also send
your order
to your nearest
OECD sales point
or through
the OECD online
services:
www.oecdbookshop.org
CUSTOMERS INNORTH AMERICA
Turpin Distribution
The Bleachery
143 West Street, New Milford
Connecticut 06776, USA
Toll free: +1 (800) 456 6323
Fax: +1 (860) 350 0039
www.turpin-distribution.com
International Energy Agency
9, rue de la Fédération
75739 Paris Cedex 15, France
www.iea.org/books
!"#$%&'(&#$)**+,"*-International Energy Agency
CUSTOMERS INTHE REST OF THE WORLD
Turpin Distribution Services Ltd
Stratton Business Park,
Pegasus Drive, Biggleswade,
Bedfordshire SG18 8QB, UK
Tel.: +44 (0) 1767 604960
Fax: +44 (0) 1767 604640
www.turpin-distribution.com
IEA BOOKS
Tel: +33 (0)1 40 57 66 90
Fax: +33 (0)1 40 57 67 75
E-mail: [email protected]

IEA Publications, 9, rue de la Fédération, 75739 Paris Cedex 15
Printed in France by JOUVE
(61 2005 25 1 P1) ISBN : 92-64-109-471 – 2005
Related Documents


