3 International Capital Flows and Economic Growth A FTER A CELEBRATED BOOM IN CAPITAL flows to developing countries between 1990 and 1997, a series of international financial crises increased doubts about the bene- fits of such flows. Underlining this new skepticism were studies that implied only a weak relationship between capital flow liberalization and long-run growth. The concerns tempered the enthusiasm for capital inflows and have led to a reassessment of the policy approaches to attracting and managing them. This chapter presents a broad assessment of the relationship between capital inflows and the performance of developing economies. Specifi- cally, it examines the association between interna- tional capital flows and domestic investment and productivity growth, and the costs that arise from capital flow volatility. Highlighted throughout is the diversity of developing countries’ experiences, reflecting the heterogeneity of capital flows and differences in countries’ absorptive capacity. The main conclusions are the following: • Over the past three decades, private capital flows into developing countries have been as- sociated with about an equal increase in do- mestic investment, although this relationship has weakened over time as the extent of finan- cial integration across borders has increased. The relationship is strongest where, as in Africa, countries are least integrated with interna- tional financial markets and where, therefore, flows in the form of foreign direct investment (FDI) add to domestic saving and serve to identify and finance new investment opportu- nities. Elsewhere, as mergers and acquisitions (M&A) have increased relative to greenfield 59 . investments and as portfolio flows have risen, domestic investment and foreign inflows have become less tightly linked. However, the asso- ciation remains relatively high where the con- ditions are favorable for domestic investment (high education levels, political stability, and well-developed financial systems). • The relationship between productivity growth and private capital flows appears to have strengthened over time. The productivity bene- fits of capital flows—through the transfer of technology and management techniques and the stimulation of financial sector develop- ment—are significant in countries where a de- veloped physical infrastructure, a strong busi- ness environment, and open trade regimes have facilitated the absorption of those flows, but not otherwise. • Capital flow volatility significantly dampens economic growth. Indeed, the crisis-ridden later years of the 1990s were associated with enor- mous shocks to output and consumption in some countries. Even so, many countries appear increasingly able to manage volatility—and in the aftermath of the crises, growth rates have re- bounded quickly in many affected countries. Ad- justment was promoted by greater exchange rate flexibility, more diversified production struc- tures, and better risk-management techniques. Taken altogether, the evidence suggests that capital flows reinforce a positive growth dynamic. They tend to go more to countries with strong in- vestment climates, and their long-run benefits are most pronounced in such environments. As many of the countries with strong investment climates are middle- rather than low-income economies,

Welcome message from author
This document is posted to help you gain knowledge. Please leave a comment to let me know what you think about it! Share it to your friends and learn new things together.
Transcript
3International Capital Flows and Economic Growth
AFTER A CELEBRATED BOOM IN CAPITAL
flows to developing countries between1990 and 1997, a series of international
financial crises increased doubts about the bene-fits of such flows. Underlining this new skepticismwere studies that implied only a weak relationshipbetween capital flow liberalization and long-rungrowth. The concerns tempered the enthusiasm forcapital inflows and have led to a reassessment ofthe policy approaches to attracting and managingthem.
This chapter presents a broad assessment ofthe relationship between capital inflows and theperformance of developing economies. Specifi-cally, it examines the association between interna-tional capital flows and domestic investment andproductivity growth, and the costs that arise fromcapital flow volatility. Highlighted throughout isthe diversity of developing countries’ experiences,reflecting the heterogeneity of capital flows anddifferences in countries’ absorptive capacity. Themain conclusions are the following:
• Over the past three decades, private capitalflows into developing countries have been as-sociated with about an equal increase in do-mestic investment, although this relationshiphas weakened over time as the extent of finan-cial integration across borders has increased.The relationship is strongest where, as in Africa,countries are least integrated with interna-tional financial markets and where, therefore,flows in the form of foreign direct investment(FDI) add to domestic saving and serve toidentify and finance new investment opportu-nities. Elsewhere, as mergers and acquisitions(M&A) have increased relative to greenfield
59
.
investments and as portfolio flows have risen,domestic investment and foreign inflows havebecome less tightly linked. However, the asso-ciation remains relatively high where the con-ditions are favorable for domestic investment(high education levels, political stability, andwell-developed financial systems).
• The relationship between productivity growthand private capital flows appears to havestrengthened over time. The productivity bene-fits of capital flows—through the transfer oftechnology and management techniques andthe stimulation of financial sector develop-ment—are significant in countries where a de-veloped physical infrastructure, a strong busi-ness environment, and open trade regimes havefacilitated the absorption of those flows, butnot otherwise.
• Capital flow volatility significantly dampenseconomic growth. Indeed, the crisis-ridden lateryears of the 1990s were associated with enor-mous shocks to output and consumption insome countries. Even so, many countries appearincreasingly able to manage volatility—and inthe aftermath of the crises, growth rates have re-bounded quickly in many affected countries. Ad-justment was promoted by greater exchange rateflexibility, more diversified production struc-tures, and better risk-management techniques.
Taken altogether, the evidence suggests thatcapital flows reinforce a positive growth dynamic.They tend to go more to countries with strong in-vestment climates, and their long-run benefits aremost pronounced in such environments. As manyof the countries with strong investment climatesare middle- rather than low-income economies,

G L O B A L D E V E L O P M E N T F I N A N C E
international capital flows in recent decades mayhave contributed to a widening of income differen-tials between the developing countries, just as theydid a century ago (Taylor 1996; O’Rourke andWilliamson 1999).
For policymakers, the analysis in this chaptershows that both the celebration of capital flows inthe early 1990s and the subsequent skepticismwere both excessive. The reality is more compli-cated and therefore requires a more nuanced policyresponse. At issue is not whether international cap-ital flows have long-term value or whether interna-tional financial integration offers real benefits. Inthe inevitable process of integration with interna-tional markets, capital flows can deliver enormousbenefits. However, that transition also impliescosts, some of which are important and others lessso. The challenge for policymakers is to preparetheir economies to best absorb the potential bene-fits of capital inflows while reducing the risks ofsudden capital outflows. This implies a multiplicityof measures that not only foster absorption of in-ternational capital flows but also generate long-term domestic benefits.
Capital inflows and domesticinvestment
Summers (2000) maintains that “enormous socialbenefits” are made possible by the efficiency
gains from the reallocation of capital from industrialto developing countries. The reallocation can im-prove living standards by mobilizing global savingsto finance investments in countries where the mar-ginal productivity of investment is relatively high.
Private capital flows have been associatedwith a rise in domestic investment in many devel-oping countries, although whether such flows havean independent role in raising investment, or sim-ply finance investment that would have occurredin any event, is frequently unclear. The relation-ship between capital flows and investment is com-plex, and depends on the extent of integration ofdomestic economies into global capital markets,on the nature of the capital flows, and on the do-mestic investment climate:
• Long-term capital flows are strongly and posi-tively related to domestic investment; short-term flows have little or no relationship with
investment. Further, whereas certain types oflong-term flows, such as FDI and bank lending,are clearly associated with increases in invest-ment, the relationship between portfolio flowsand investment, although typically positive, hasbeen less robust. The evidence also suggeststhat the relationship between private capitalflows and investment is strong in those regions,such as Africa, where foreign investment is ableto supplement domestic saving and to identifyand realize investment opportunities.
• The relationship between private capital flowsand domestic investment weakened in the1990s, a period in which countries liberalizedtheir capital accounts. The evidence is consis-tent with two possibilities. Either, as countriesbecome more integrated into internationalmarkets, domestic saving and investment deci-sions are less correlated, and hence the rela-tionship between capital flows and investmentweakens. The evidence is also consistent withthe increasing importance of portfolio flowsas a part of total capital flows, and of M&Aas a part of FDI, both of which have less of a relationship with domestic investment thanother flows.
• A variety of domestic factors, such as the levelof human capital, political stability, and thedepth of domestic financial markets, define acountry’s ability to translate foreign capitalinto domestic investment.
Capital inflows and investment: differencesacross types of flows and regionsAs a matter of theory, the impact of foreign capitalinflows on domestic investment is ambiguous(Feldstein 1994). Inbound capital may raise domes-tic investment, but it may also increase imports andhence can dampen domestic production and invest-ment. Moreover, even if access to foreign capitalallows one firm to increase investment, that firm’sexpansion may induce another to reduce invest-ment. From a more general perspective, under-standing the impact of foreign capital on domesticinvestment requires considering the possibility thatcapital outflows may be induced. In a world of per-fect capital mobility, an increase in inflows mayhave no impact on the level of domestic invest-ment, since funds would move only to finance in-vestment demand without actually increasing thatdemand.
60
I N T E R N A T I O N A L C A P I T A L F L O W S A N D E C O N O M I C G R O W T H
However, Feldstein (1994) notes that, despitethe large volume of global financial transactions, acountry’s saving tends to be largely invested withinits borders. The close association between foreigninflows and domestic investment suggests a lack ofdeep integration in the financing of invesments. Inother words, when almost all domestic saving isinvested domestically, international capital inflowswill not be significantly offset by international out-flows, and aggregate domestic investment will re-flect close to the full amount of the inflow. But asglobal financial integration increases, the link be-tween foreign flows and domestic investment willweaken.
However, along another dimension, the rela-tionship between foreign capital and investmentmay also depend on several structural factors,such as the depth of financial markets or the levelof human capital. This suggests that even a coun-try with a high level of integration may better em-ploy a dollar of foreign capital than a less closelyintegrated country, if structural deficiencies aremore pronounced in the second country than inthe first.
The aggregate relationship between foreigncapital and domestic investment. A number of stud-ies have analyzed the impact of foreign capital ondomestic investment. Feldstein (1994) found that adollar of capital inflows or outflows tends to be as-sociated, respectively, with a one-dollar rise or fallin domestic investment. Borensztein, De Gregorio,and Lee (1998) find, in fact, that a dollar of FDImay be linked to an increase in domestic investmentof more than a dollar, although their findings aresensitive to the choice of variables used to explaininvestment. In a recent study, Bosworth and Collins(1999) carefully analyze the relationship betweenvarious types of private capital flows and both in-vestment and saving, focusing on the variation overtime within countries rather than the variationacross countries. They find that capital flows have astrong impact on domestic investment. This is espe-cially so for FDI and bank lending; in contrast,portfolio flows have a positive but statistically in-significant impact on domestic investment.
Investment and different types of capital in-flows. For the purpose of this report, the Bosworthand Collins study was replicated using a data setwith broader country coverage and a longer timeperiod (1972–98 instead of 1979–95). The techni-cal details of the estimation procedure and the data
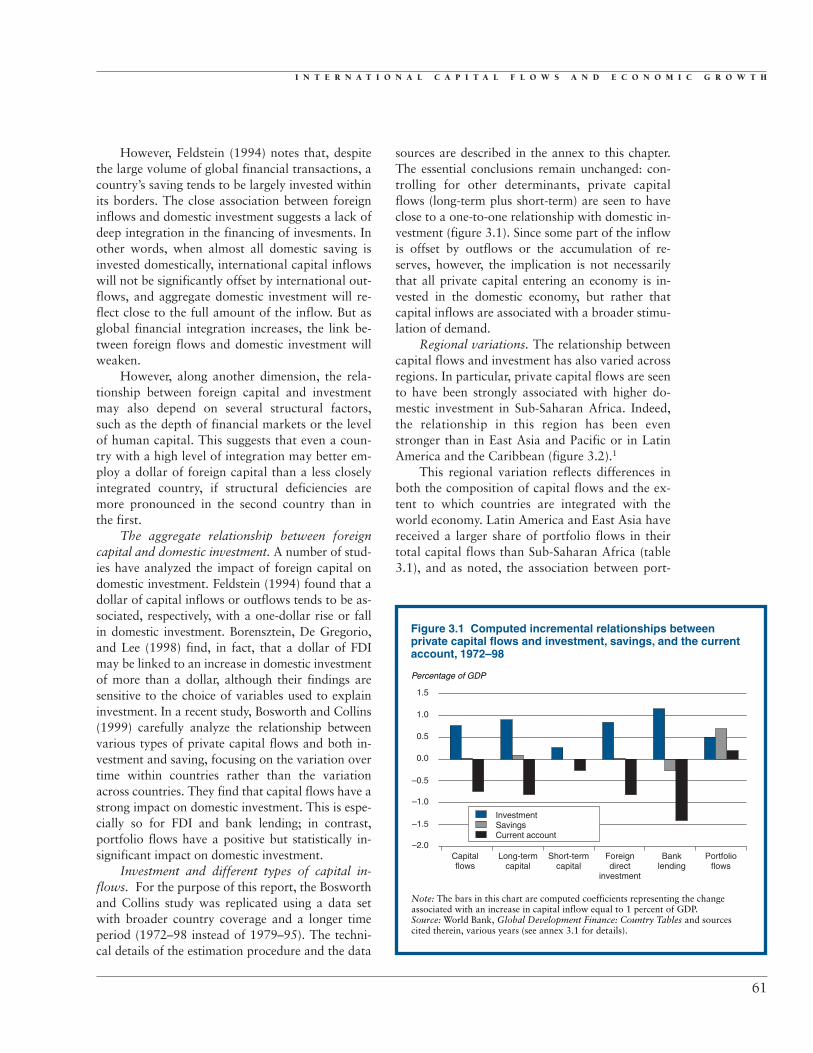
sources are described in the annex to this chapter.The essential conclusions remain unchanged: con-trolling for other determinants, private capitalflows (long-term plus short-term) are seen to haveclose to a one-to-one relationship with domestic in-vestment (figure 3.1). Since some part of the inflowis offset by outflows or the accumulation of re-serves, however, the implication is not necessarilythat all private capital entering an economy is in-vested in the domestic economy, but rather thatcapital inflows are associated with a broader stimu-lation of demand.
Regional variations. The relationship betweencapital flows and investment has also varied acrossregions. In particular, private capital flows are seento have been strongly associated with higher do-mestic investment in Sub-Saharan Africa. Indeed,the relationship in this region has been evenstronger than in East Asia and Pacific or in LatinAmerica and the Caribbean (figure 3.2).1
This regional variation reflects differences inboth the composition of capital flows and the ex-tent to which countries are integrated with theworld economy. Latin America and East Asia havereceived a larger share of portfolio flows in theirtotal capital flows than Sub-Saharan Africa (table3.1), and as noted, the association between port-
61
Percentage of GDP
Figure 3.1 Computed incremental relationships between private capital flows and investment, savings, and the currentaccount, 1972–98
Note: The bars in this chart are computed coefficients representing the changeassociated with an increase in capital inflow equal to 1 percent of GDP.Source: World Bank, Global Development Finance: Country Tables and sourcescited therein, various years (see annex 3.1 for details).
–2.0Capitalflows
Long-termcapital
Short-termcapital
Foreigndirect
investment
Banklending
Portfolioflows
–1.0
–1.5
0.0
–0.5
0.5
1.0
1.5
InvestmentSavingsCurrent account

G L O B A L D E V E L O P M E N T F I N A N C E
folio flows and domestic investment is relativelyweak. East Asia and Latin America are more inte-grated into the global economy than other regionsand thus enjoy expanded opportunities for holdingforeign assets while also relying more on foreignexchange reserves and foreign assets to cope withthe volatility of capital flows. Finally, in contrastto East Asia, capital flows into Latin America areassociated with increased consumption, reflectingLatin America’s generally low propensity to save.
Capital flows and investment in the 1990sThe relationship between capital flows and invest-ment weakened in the 1990s (figure 3.3). This trendmay, in part, result from the growing importance of offsetting transactions on the capital account,reflecting increased integration of some countriesand capital flight from some others (see chapter 2).Countries have typically also begun to divert alarger share of their capital inflows to reserve accu-mulation in order to safeguard against sudden capi-tal outflows. The consequence of these changes hasbeen that a smaller fraction of capital inflows isbeing channeled into domestic investment. More-over, during the 1990s cross-border M&A activityaccounted for an increasing fraction of FDI (United
Nations Conference on Trade and Development2000 and chapter 2). Although M&A may have apositive impact on productivity, FDI of the green-field variety implies an immediate increase in pro-ductive capacity, whereas M&A do not. As a conse-quence, the association between FDI and domesticinvestment became noticeably weaker in the 1990s.
Absorptive capacity: policy and institutionsThe positive relationship between private capitalflows and investment, which holds to varying de-grees across various regions and over time, alsodepends crucially on a country’s absorptive capac-ity. The capacity to absorb capital inflows is a multi-faceted phenomenon. It encompasses not just themacroeconomic policy framework but also politi-cal stability, the health of the financial system, theeducational attainment of the work force, thequality of physical infrastructure, the efficiency ofgovernment services, and the degree of corruption.Different types of capital flows are affected differ-ently by these various aspects of a country’s ab-sorptive capacity.
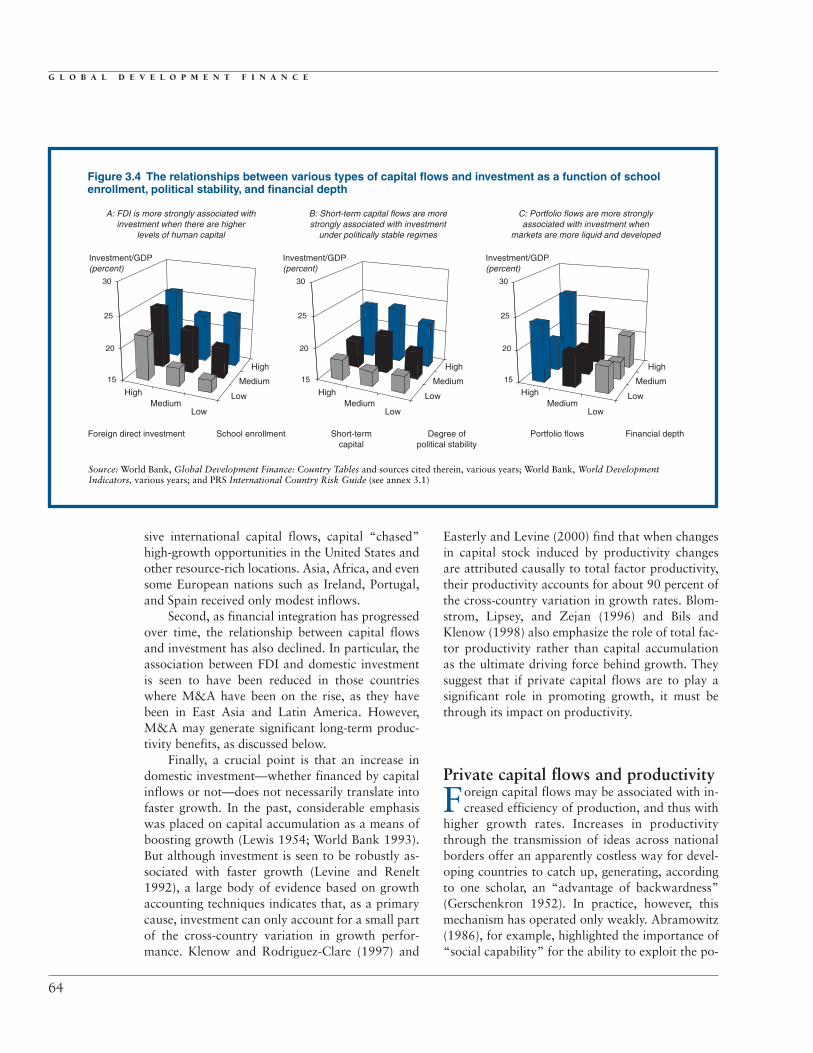
For instance, in a cross-country analysisBorensztein, De Gregorio, and Lee (1998) find thatFDI is positively associated with investment, butonly in a setting with sufficiently high levels ofhuman capital. An extension of their analysis wasdone for this report across a different sample ofcountries and over a longer period. It was againfound that FDI is positively associated with invest-ment, and that this effect increases with the stockof human capital.2 The left-hand panel of figure3.4 plots average investment ratios against averageschool enrollment ratios and average FDI flows for the extended sample. Domestic investment ishigher when FDI is greater and when domestic edu-cational levels are higher; the synergy between FDIand schooling is seen to operate in this representa-tion when human capital reaches medium to highlevels.
The absorptive capacity of a country also de-pends on the political climate. Short-term capitalflows are more highly correlated with domesticinvestment under stable political regimes (middlepanel of figure 3.4). Thus short-term flows, whichcan have a destabilizing impact (as discussed inGlobal Development Finance 2000), tend to per-form their role of trade and bridging finance betterin more stable situations. Portfolio flows and banklending are likewise more strongly associated with
62
Percentage of GDP
Figure 3.2 Computed incrementalrelationships between private capital flowsand investment, consumption, and thecurrent account, by region, 1972–98
Note: The bars in this chart are computed coefficients representing the change associated with an increase in capital inflow equal to 1 percent of GDP.Source: World Bank, Global Development Finance:Country Tables and sources cited therein, various years (see annex 3.1 for details).
1.5
1.0
2.0
0.0
–0.5
0.5
–1.5
–2.0East Asia
and PacificLatin America
and the CaribbeanSub-Saharan
Africa
–1.0
InvestmentConsumptionCurrent account
I N T E R N A T I O N A L C A P I T A L F L O W S A N D E C O N O M I C G R O W T H
domestic investment in countries where financialmarkets are deeper (right-hand panel of figure 3.4).
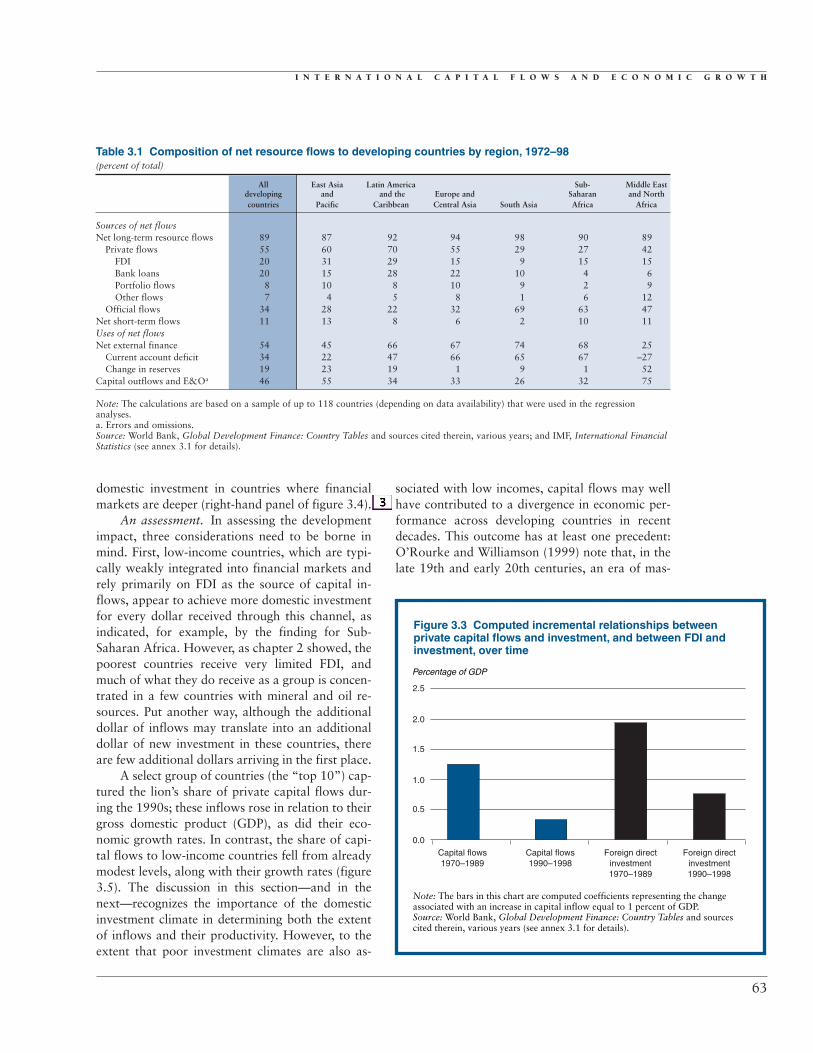
An assessment. In assessing the developmentimpact, three considerations need to be borne inmind. First, low-income countries, which are typi-cally weakly integrated into financial markets andrely primarily on FDI as the source of capital in-flows, appear to achieve more domestic investmentfor every dollar received through this channel, asindicated, for example, by the finding for Sub-Saharan Africa. However, as chapter 2 showed, thepoorest countries receive very limited FDI, andmuch of what they do receive as a group is concen-trated in a few countries with mineral and oil re-sources. Put another way, although the additionaldollar of inflows may translate into an additionaldollar of new investment in these countries, thereare few additional dollars arriving in the first place.
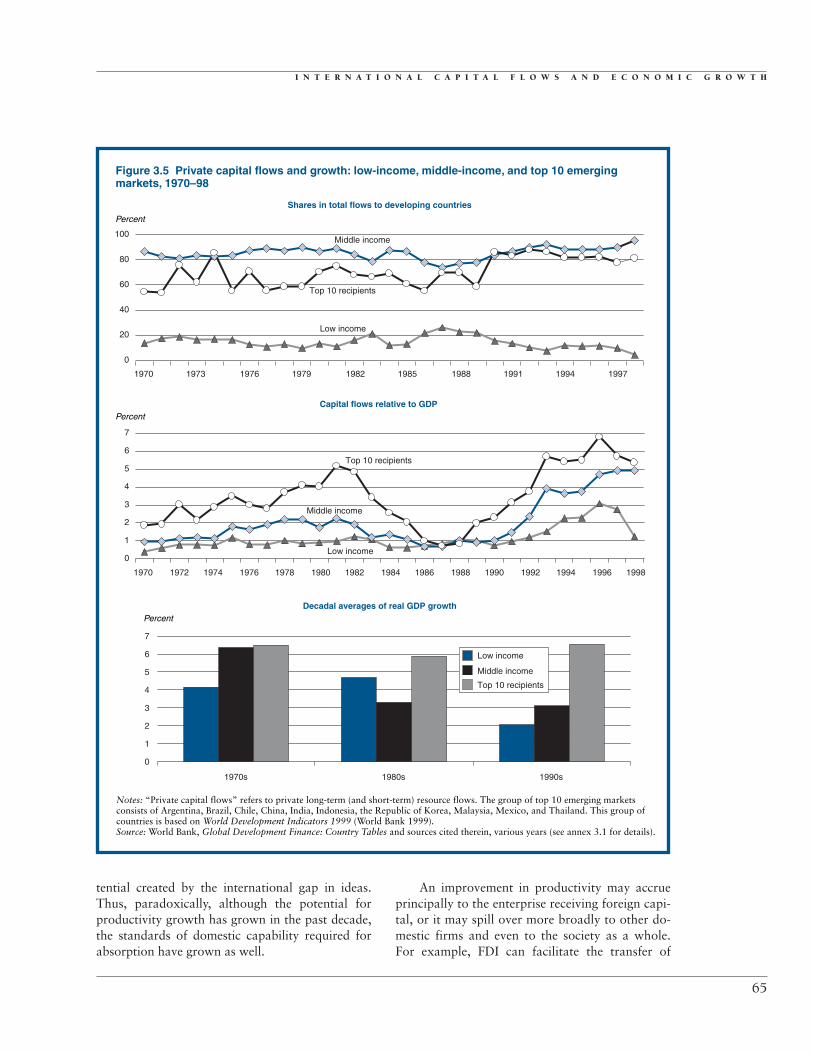
A select group of countries (the “top 10”) cap-tured the lion’s share of private capital flows dur-ing the 1990s; these inflows rose in relation to theirgross domestic product (GDP), as did their eco-nomic growth rates. In contrast, the share of capi-tal flows to low-income countries fell from alreadymodest levels, along with their growth rates (figure3.5). The discussion in this section—and in thenext—recognizes the importance of the domesticinvestment climate in determining both the extentof inflows and their productivity. However, to theextent that poor investment climates are also as-
sociated with low incomes, capital flows may wellhave contributed to a divergence in economic per-formance across developing countries in recentdecades. This outcome has at least one precedent:O’Rourke and Williamson (1999) note that, in thelate 19th and early 20th centuries, an era of mas-
63
Table 3.1 Composition of net resource flows to developing countries by region, 1972–98 (percent of total)
All East Asia Latin America Sub- Middle Eastdeveloping and and the Europe and Saharan and Northcountries Pacific Caribbean Central Asia South Asia Africa Africa
Sources of net flowsNet long-term resource flows 89 87 92 94 98 90 89
Private flows 55 60 70 55 29 27 42FDI 20 31 29 15 9 15 15Bank loans 20 15 28 22 10 4 6Portfolio flows 8 10 8 10 9 2 9Other flows 7 4 5 8 1 6 12
Official flows 34 28 22 32 69 63 47Net short-term flows 11 13 8 6 2 10 11Uses of net flowsNet external finance 54 45 66 67 74 68 25
Current account deficit 34 22 47 66 65 67 –27Change in reserves 19 23 19 1 9 1 52
Capital outflows and E&Oa 46 55 34 33 26 32 75
Note: The calculations are based on a sample of up to 118 countries (depending on data availability) that were used in the regressionanalyses.a. Errors and omissions.Source: World Bank, Global Development Finance: Country Tables and sources cited therein, various years; and IMF, International FinancialStatistics (see annex 3.1 for details).
Percentage of GDP
Figure 3.3 Computed incremental relationships betweenprivate capital flows and investment, and between FDI andinvestment, over time
2.5
2.0
1.5
1.0
0.5
0.0Capital flows1970–1989
Capital flows1990–1998
Foreign directinvestment1970–1989
Foreign directinvestment1990–1998
Note: The bars in this chart are computed coefficients representing the changeassociated with an increase in capital inflow equal to 1 percent of GDP.Source: World Bank, Global Development Finance: Country Tables and sources cited therein, various years (see annex 3.1 for details).
G L O B A L D E V E L O P M E N T F I N A N C E
sive international capital flows, capital “chased”high-growth opportunities in the United States andother resource-rich locations. Asia, Africa, and evensome European nations such as Ireland, Portugal,and Spain received only modest inflows.
Second, as financial integration has progressedover time, the relationship between capital flowsand investment has also declined. In particular, theassociation between FDI and domestic investmentis seen to have been reduced in those countrieswhere M&A have been on the rise, as they havebeen in East Asia and Latin America. However,M&A may generate significant long-term produc-tivity benefits, as discussed below.
Finally, a crucial point is that an increase indomestic investment—whether financed by capitalinflows or not—does not necessarily translate intofaster growth. In the past, considerable emphasiswas placed on capital accumulation as a means ofboosting growth (Lewis 1954; World Bank 1993).But although investment is seen to be robustly as-sociated with faster growth (Levine and Renelt1992), a large body of evidence based on growthaccounting techniques indicates that, as a primarycause, investment can only account for a small partof the cross-country variation in growth perfor-mance. Klenow and Rodriguez-Clare (1997) and
Easterly and Levine (2000) find that when changesin capital stock induced by productivity changesare attributed causally to total factor productivity,their productivity accounts for about 90 percent ofthe cross-country variation in growth rates. Blom-strom, Lipsey, and Zejan (1996) and Bils andKlenow (1998) also emphasize the role of total fac-tor productivity rather than capital accumulationas the ultimate driving force behind growth. Theysuggest that if private capital flows are to play asignificant role in promoting growth, it must bethrough its impact on productivity.
Private capital flows and productivity
Foreign capital flows may be associated with in-creased efficiency of production, and thus with
higher growth rates. Increases in productivitythrough the transmission of ideas across nationalborders offer an apparently costless way for devel-oping countries to catch up, generating, accordingto one scholar, an “advantage of backwardness”(Gerschenkron 1952). In practice, however, thismechanism has operated only weakly. Abramowitz(1986), for example, highlighted the importance of“social capability” for the ability to exploit the po-
64
Figure 3.4 The relationships between various types of capital flows and investment as a function of schoolenrollment, political stability, and financial depth
Source: World Bank, Global Development Finance: Country Tables and sources cited therein, various years; World Bank, World Development Indicators, various years; and PRS International Country Risk Guide (see annex 3.1)
15
HighMedium
Low
Foreign direct investment School enrollment
A: FDI is more strongly associated withinvestment when there are higher
levels of human capital
B: Short-term capital flows are morestrongly associated with investment
under politically stable regimes
C: Portfolio flows are more stronglyassociated with investment when
markets are more liquid and developed
Short-termcapital
Degree ofpolitical stability
Portfolio flows Financial depth
High
Medium
Low
20
25
30
Investment/GDP(percent)
15
HighMedium
Low
High
Medium
Low
20
25
30
Investment/GDP(percent)
15
HighMedium
Low
High
Medium
Low
20
25
30
Investment/GDP(percent)
I N T E R N A T I O N A L C A P I T A L F L O W S A N D E C O N O M I C G R O W T H
tential created by the international gap in ideas.Thus, paradoxically, although the potential forproductivity growth has grown in the past decade,the standards of domestic capability required forabsorption have grown as well.
An improvement in productivity may accrueprincipally to the enterprise receiving foreign capi-tal, or it may spill over more broadly to other do-mestic firms and even to the society as a whole.For example, FDI can facilitate the transfer of
65
Percent
Percent
Figure 3.5 Private capital flows and growth: low-income, middle-income, and top 10 emergingmarkets, 1970–98
Notes: “Private capital flows” refers to private long-term (and short-term) resource flows. The group of top 10 emerging markets consists of Argentina, Brazil, Chile, China, India, Indonesia, the Republic of Korea, Malaysia, Mexico, and Thailand. This group ofcountries is based on World Development Indicators 1999 (World Bank 1999).Source: World Bank, Global Development Finance: Country Tables and sources cited therein, various years (see annex 3.1 for details).
Shares in total flows to developing countries
Capital flows relative to GDP
PercentDecadal averages of real GDP growth
0
1970 1973
Top 10 recipients
Top 10 recipients
Low income
Middle income
1976 1979 1982 1985 1988 1991 1994 1997
20
40
60
80
100
1970 1972 1974 1976 1978 1980 1982 1984 1986 1988 1990 1992 1994 1996 1998
Low income
Middle income
0
1
2
3
4
5
6
7
0
1
2
3
4
5
6
7
1970s 1980s 1990s
Low income
Middle income
Top 10 recipients
G L O B A L D E V E L O P M E N T F I N A N C E
technologies and skills to the firm receiving it, asits workers become trained in the best techniquesavailable from abroad. But those workers maythen move to other domestic firms, transferringtheir skills to their new employers. In addition,portfolio flows and bank lending can increase fi-nancial sector development, and this can increasethe efficiency of capital allocation.
The evidence strongly suggests that certain do-mestic conditions are critical if a country is toenjoy the spreading of the productivity benefitsfrom capital flows. Countries where the work forceis well educated and trained, where infrastructureservices are efficient, and where the business cli-mate is positive are more likely to experience an in-crease in overall productivity with capital inflows.Theoretical considerations, cross-country regres-sions, and country case studies all support theseconclusions. Box 3.1 presents some evidence basedon cross-country regressions, and the rest of thissection focuses on more detailed country evidence,first on FDI and then on capital market flows.
Foreign direct investment and productivity:evidence from selected countriesFDI has considerable potential to transfer ideasfrom industrial to developing countries (Romer1993) and hence to increase productivity in thelatter. However, FDI does not always play this roleeffectively. The evidence suggests that those coun-tries with the greatest absorptive capacity arelikely to benefit the most from the presence of for-eign capital (Caves 1999). In such settings, notonly greenfield investment but also M&A by for-eigners, which are not associated with new invest-ments, can increase productivity, for both the firmin question and society as a whole.3 By contrast,where absorptive capacity is low, the benefits ofFDI are muted or nonexistent. Although such aneconomy may experience some benefit if foreignfirms are more productive than domestic firms,spillover effects to other firms do not occur. In-deed, in the short term, the productivity of domes-tically owned firms may actually decline.
The rest of this section focuses on the experi-ence in five economies: Malaysia, Morocco, Tai-wan (China), Uruguay, and the República Boli-variana de Venezuela. Table 3.2 shows, for theseeconomies, a set of widely used indicators thatproxy for absorptive capacity (see World Bank,Global Economic Prospects 1997). These include
macroeconomic management, openness to trade,the amount and quality of infrastructure, and theamount of human capital. Although extensive com-mentary on these indicators is not necessary, it isworth noting that a stronger orientation towardengaging in international trade has been found tofacilitate the absorption of FDI (see Balasubra-manyam, Salisu, and Sapsford 1991; World Bank,Global Economic Prospects 1997). In terms ofthese indicators, three of the countries (Morocco,Uruguay, and the República Bolivariana de Vene-zuela) have relatively low absorptive capacity, andthe other two (Malaysia and Taiwan, China) havehigh absorptive capacity.
Low absorptive capacity and productivity.Haddad and Harrison (1993) find that foreign-owned firms in Morocco (from 1985 to 1989)achieved a higher level of productivity than their do-mestic counterparts. Domestic firms did not exhibitfaster-than-average productivity growth even in sec-tors with a larger foreign presence. This could re-flect the fact that some foreign firms invest in highlyprotected sectors, so that the incentives for domesticcompetitors to improve productivity are weak.
In an influential study of Venezuelan manufac-turing firms during 1976–89, Aitken and Harrison(1999) also find that foreign equity participation isassociated with superior plant performance. How-ever, this positive effect appears robust only forplants with fewer than 50 employees. Importantly,productivity in domestically owned plants wasfound to decline as domestic firms contract in theface of foreign competition. These findings areechoed in a study of the Czech Republic (Djankovand Hoekman 2000), which finds that productiv-ity growth is higher in firms with foreign partner-ship. However, the study also finds a significantnegative spillover effect of foreign investment ondomestically owned firms. Using survey data ontraining and investment, they argue that many do-mestically owned firms have relatively weak capac-ity to absorb the know-how spillovers from foreignfirms. Hence they find their market share decliningafter the entry of foreign firms, and the reducedscale of production results in lower profitability.4
Finally, using plant-level survey data, Kokko,Tansini, and Zejan (1996) examined the intra-industry spillovers from FDI in the Uruguayan manu-facturing sector in 1988. Their analysis shows nosigns of spillovers in statistical tests covering theentire sample of 159 locally owned manufacturing
66
I N T E R N A T I O N A L C A P I T A L F L O W S A N D E C O N O M I C G R O W T H
67
There has been considerable debate in the academic lit-erature as to whether capital flows promote economic
growth. The average growth rate among developing coun-tries remained stable at a relatively low level during thecapital flows boom of the 1990s (Easterly 2000), althoughthe more advanced middle-income countries that receivedthe bulk of private capital flows did achieve faster growth.Rodrik (1998), echoing an earlier study by Grilli andMilesi-Ferretti (1995), finds in a cross-country analysisthat capital account liberalization is not associated withgrowth. Carkovic and Levine (2000) reach a similarconclusion on the effect of foreign direct investment (FDI)on growth.
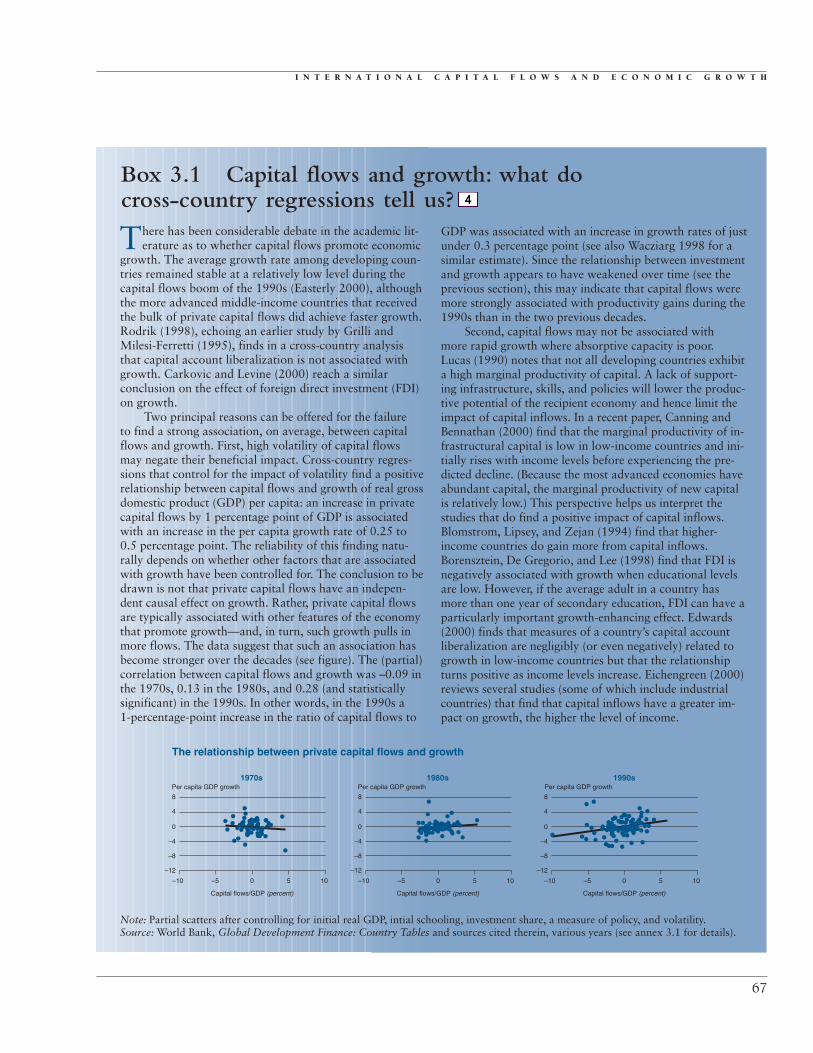
Two principal reasons can be offered for the failure to find a strong association, on average, between capitalflows and growth. First, high volatility of capital flowsmay negate their beneficial impact. Cross-country regres-sions that control for the impact of volatility find a positiverelationship between capital flows and growth of real grossdomestic product (GDP) per capita: an increase in privatecapital flows by 1 percentage point of GDP is associatedwith an increase in the per capita growth rate of 0.25 to0.5 percentage point. The reliability of this finding natu-rally depends on whether other factors that are associatedwith growth have been controlled for. The conclusion to bedrawn is not that private capital flows have an indepen-dent causal effect on growth. Rather, private capital flowsare typically associated with other features of the economythat promote growth—and, in turn, such growth pulls inmore flows. The data suggest that such an association hasbecome stronger over the decades (see figure). The (partial)correlation between capital flows and growth was –0.09 inthe 1970s, 0.13 in the 1980s, and 0.28 (and statisticallysignificant) in the 1990s. In other words, in the 1990s a 1-percentage-point increase in the ratio of capital flows to
GDP was associated with an increase in growth rates of justunder 0.3 percentage point (see also Wacziarg 1998 for asimilar estimate). Since the relationship between investmentand growth appears to have weakened over time (see theprevious section), this may indicate that capital flows weremore strongly associated with productivity gains during the1990s than in the two previous decades.
Second, capital flows may not be associated with more rapid growth where absorptive capacity is poor. Lucas (1990) notes that not all developing countries exhibita high marginal productivity of capital. A lack of support-ing infrastructure, skills, and policies will lower the produc-tive potential of the recipient economy and hence limit theimpact of capital inflows. In a recent paper, Canning andBennathan (2000) find that the marginal productivity of in-frastructural capital is low in low-income countries and ini-tially rises with income levels before experiencing the pre-dicted decline. (Because the most advanced economies haveabundant capital, the marginal productivity of new capitalis relatively low.) This perspective helps us interpret thestudies that do find a positive impact of capital inflows.Blomstrom, Lipsey, and Zejan (1994) find that higher-income countries do gain more from capital inflows.Borensztein, De Gregorio, and Lee (1998) find that FDI isnegatively associated with growth when educational levelsare low. However, if the average adult in a country hasmore than one year of secondary education, FDI can have aparticularly important growth-enhancing effect. Edwards(2000) finds that measures of a country’s capital accountliberalization are negligibly (or even negatively) related togrowth in low-income countries but that the relationshipturns positive as income levels increase. Eichengreen (2000)reviews several studies (some of which include industrialcountries) that find that capital inflows have a greater im-pact on growth, the higher the level of income.
Box 3.1 Capital flows and growth: what docross-country regressions tell us?
Note: Partial scatters after controlling for initial real GDP, intial schooling, investment share, a measure of policy, and volatility.Source: World Bank, Global Development Finance: Country Tables and sources cited therein, various years (see annex 3.1 for details).
The relationship between private capital flows and growth
4
8
–4
0
–12
–10 –5
Per capita GDP growth
Capital flows/GDP (percent)
0
1970s
5 10
–8
Per capita GDP growth
Capital flows/GDP (percent)
1990s
4
8
–4
0
–12
–10 –5 0 5 10
–8
4
8
–4
0
–12
–10 –5
Per capita GDP growth
Capital flows/GDP (percent)
0
1980s
5 10
–8

Table 3.2 Indicators of absorptive capacity in selected developing countries, 1980–98
República Bolivariana TaiwanMorocco Uruguay de Venezuela Malaysia (China)
Macroeconomic managementInflation (percent per year) 6.0 53.2 35.2 3.8 3.8Openness (trade as a percentage of GDP) 47.4 42.6 48.1 147.8 94.2
InfrastructureWaiting time for a telephone mainline (years) 0.2 0.0 2.5 0.4 0.0Share of all roads paved (percent) 50.3 82.0 35.8 74.0 87.1
Human capitalShare of labor force with secondary education (percent) n.a. 14.3 14.5 20.5 28.9Share of population with access to sanitation (percent) 45.0 60.6 51.5 86.7 n.a.
n.a. Not available.Note: Data are period averages.Source: World Bank, Global Development Finance: Country Tables and sources cited therein, various years; and World Bank, WorldDevelopment Indicators, various years (see annex 3.1 for details).
G L O B A L D E V E L O P M E N T F I N A N C E
plants. However, spillovers appear to be positiveand statistically significant in the subsample ofplants with moderate technology gaps betweenthemselves and their foreign counterparts, but notin the group of locally owned plants facing largetechnology gaps. The authors argue that selectivesupport to local firms to improve their capacity toidentify and employ modern technologies is a nec-essary ingredient in any policy package to maxi-mize the technological spillovers from FDI.
High absorptive capacity and productivity.When absorptive capacity is high, FDI does have theexpected positive relationship with productivity (forthe East Asian and, especially, the Malaysian experi-ence, see the summary of studies in World Bank1993 and World Bank, Global Development Fi-nance 1997). For Taiwan, China, Chuang and Lin(1999) find that FDI has been associated withhigher productivity in foreign-owned firms and withpositive spillovers to domestically owned firms. A 1percent increase in FDI in an industrial sector is as-sociated with an increase in the productivity of do-mestic firms in that sector of 1.40 to 1.88 percent.Schive and Majumder (1990) describe the extensiveproductivity benefits achieved through foreign in-vestment in the Taiwanese sewing machine industry.Examining the growth performance of the Chinesecoastal provinces, Mody and Wang (1997) find thatthe benefits of FDI are amplified under conditionsof good infrastructure and superior human capital.They find, moreover, that FDI and the supportingphysical and human infrastructure grow in tandem,creating a self-reinforcing growth process.
Barrell and Pain (1997), using disaggegatedsectoral data for Germany and the United King-
dom, show that FDI is associated with higher pro-ductivity also when it flows between industrialeconomies. They estimate that each 1 percent risein the FDI stock raises technological progress by anestimated 0.27 percent in Germany and 0.26 per-cent in the U.K. manufacturing sector. They also es-timate that around 30 percent of the growth inU.K. manufacturing productivity since 1985 can beattributed to the impact of inward direct invest-ment. For smaller European economies such as Ire-land and Belgium, studies have shown that highFDI and the associated spillover effects have playedan important role in economic development (seeCassiers, De Ville, and Solar 1996). Since a rela-tively large proportion of FDI flowing into indus-trial countries consists of M&A rather than invest-ment in greenfield sites, these studies support thehypothesis that much of the benefit of foreign in-vestment comes from spillover effects rather thanfrom capital accumulation effects.
Financial spillovers: capital marketintegration and growthIn similar fashion, international bank lending andportfolio flows are more productive in a more de-veloped financial environment. International capitalmarket flows and the financial environment can re-inforce each other over the long run. Greater finan-cial sector development is expected to be associatedwith faster economic growth, and larger interna-tional capital flows are associated with improve-ments in financial sector depth and liquidity. How-ever, an inflow of foreign capital does not in itselfguarantee improvements in the financial sector. Theshort-term consequences may well be unfavorable,
68
I N T E R N A T I O N A L C A P I T A L F L O W S A N D E C O N O M I C G R O W T H
given the volatility of capital flows, which can havenegative implications for output and employment.
The role of financial intermediaries. By spe-cializing in the production of financial services,banks economize on the costs of acquiring infor-mation (Diamond 1984), increase liquidity and fa-cilitate investment in long-term projects, and di-versify risks by pooling the funds of depositors.Stock markets can also contribute to the efficientallocation of capital by improving information, in-creasing liquidity, allowing savers to better diver-sify risks by adjusting their portfolios, and enablingfirm owners to exercise greater control over man-agers (Diamond and Verrecchia 1982).
It follows that developing countries with thin,illiquid financial markets are likely to lack the abil-ity to allocate existing capital efficiently. Improvingthe ability of financial systems in developing coun-tries to provide the full range of financial services,supported by the establishment of sound legal andregulatory frameworks, will boost growth (WorldBank 2001). Studies at the level of the firm(Demirgüç-Kunt and Maksimovic 1998), at thelevel of the industry (Rajan and Zingales 1998),and across countries (Haber 1991; King and Levine1993; Beck, Levine, and Loayza 2000) have typi-cally found that financial sector development is sig-nificantly associated with faster growth.5 Denizer,Iyigun, and Owen (2000) also find that develop-
ment of the financial sector helps reduce economicvolatility by improving the information-processingcapacity of the domestic economy and by acting di-rectly to smooth consumption.
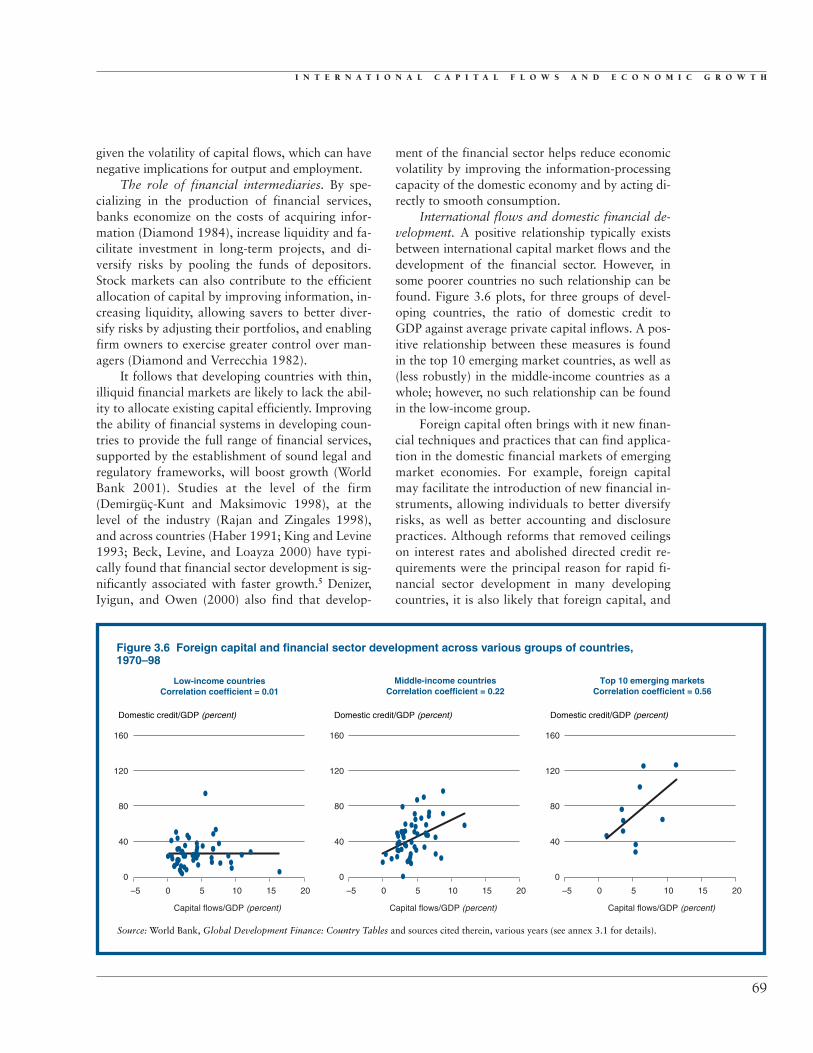
International flows and domestic financial de-velopment. A positive relationship typically existsbetween international capital market flows and thedevelopment of the financial sector. However, insome poorer countries no such relationship can befound. Figure 3.6 plots, for three groups of devel-oping countries, the ratio of domestic credit toGDP against average private capital inflows. A pos-itive relationship between these measures is foundin the top 10 emerging market countries, as well as(less robustly) in the middle-income countries as awhole; however, no such relationship can be foundin the low-income group.
Foreign capital often brings with it new finan-cial techniques and practices that can find applica-tion in the domestic financial markets of emergingmarket economies. For example, foreign capitalmay facilitate the introduction of new financial in-struments, allowing individuals to better diversifyrisks, as well as better accounting and disclosurepractices. Although reforms that removed ceilingson interest rates and abolished directed credit re-quirements were the principal reason for rapid fi-nancial sector development in many developingcountries, it is also likely that foreign capital, and
69
Figure 3.6 Foreign capital and financial sector development across various groups of countries,1970–98
Source: World Bank, Global Development Finance: Country Tables and sources cited therein, various years (see annex 3.1 for details).
Low-income countriesCorrelation coefficient = 0.01
Middle-income countriesCorrelation coefficient = 0.22
Top 10 emerging marketsCorrelation coefficient = 0.56
0
40
80
120
160
–5 0
Capital flows/GDP (percent)
5 10 15 20
Domestic credit/GDP (percent)
0
40
80
120
160
–5 0
Capital flows/GDP (percent)
5 10 15 20
Domestic credit/GDP (percent)
0
40
80
120
160
–5 0
Capital flows/GDP (percent)
5 10 15 20
Domestic credit/GDP (percent)
G L O B A L D E V E L O P M E N T F I N A N C E
consequently foreign ownership, have contributedsignificantly.
Often deregulation in the financial sector hasinvolved a relaxation of controls on foreign owner-ship. In conjunction with a liberalization of capitalcontrols, this has led to a wave of foreign capitalinflows and a massive transfer of ownership in thefinancial sectors in many emerging market econ-omies. For instance, in Central Europe between1994 and 1999, the share of bank assets controlledby foreign banks increased from 10 percent to morethan 50 percent (see box 2.4 in chapter 2). Foreigninvolvement in the Latin American banking sectoralso increased dramatically in the 1990s, contribut-ing to greater efficiency of domestic banks. Typi-cally, foreign-owned banks are more efficient thantheir domestically owned counterparts. For instance,Clarke and others (2000) find that foreign-ownedbanks in Argentina typically have better-qualityloan portfolios, higher net worth, and a higher ratioof income to costs than domestic banks. These bet-ter practices can place pressure on domestic finan-cial intermediaries to raise their own efficiency. ThusClaessens, Demirgüç-Kunt, and Huzinga (2000) findthat foreign entry significantly reduces the overheadand profitability of domestic banks (see the discus-sion of foreign investment in the banking sector inchapter 2).
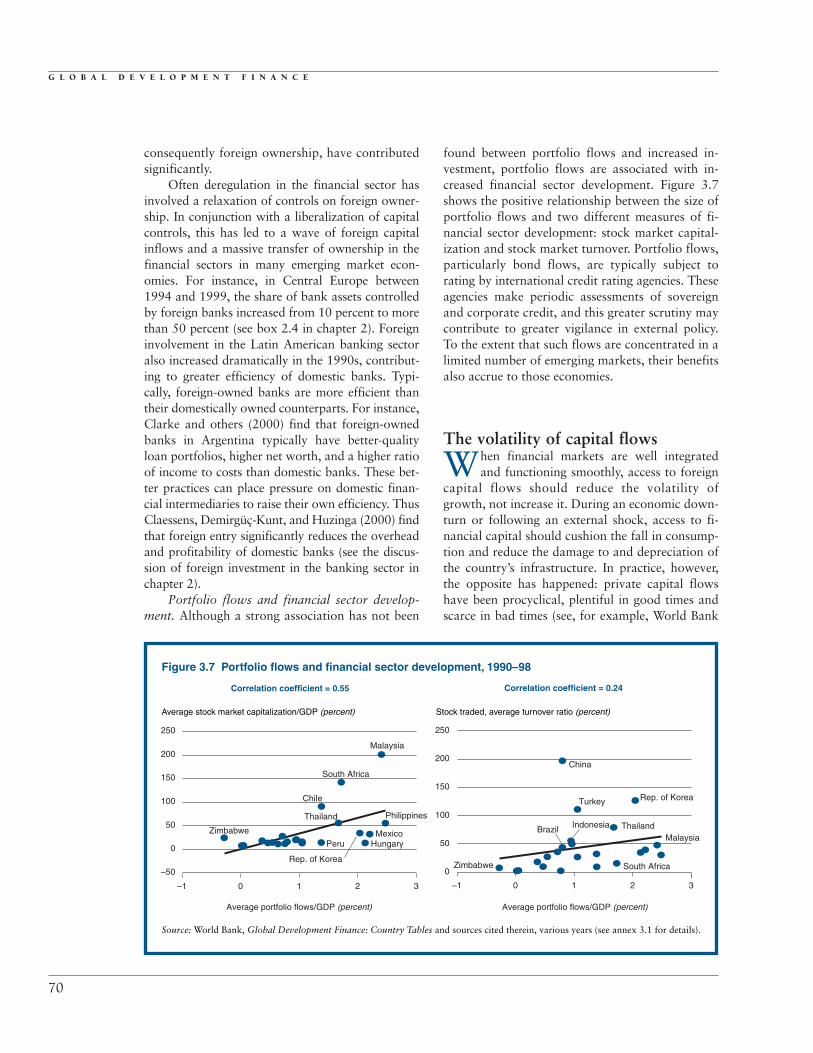
Portfolio flows and financial sector develop-ment. Although a strong association has not been
found between portfolio flows and increased in-vestment, portfolio flows are associated with in-creased financial sector development. Figure 3.7shows the positive relationship between the size ofportfolio flows and two different measures of fi-nancial sector development: stock market capital-ization and stock market turnover. Portfolio flows,particularly bond flows, are typically subject torating by international credit rating agencies. Theseagencies make periodic assessments of sovereignand corporate credit, and this greater scrutiny maycontribute to greater vigilance in external policy.To the extent that such flows are concentrated in alimited number of emerging markets, their benefitsalso accrue to those economies.
The volatility of capital flows
When financial markets are well integratedand functioning smoothly, access to foreign
capital flows should reduce the volatility ofgrowth, not increase it. During an economic down-turn or following an external shock, access to fi-nancial capital should cushion the fall in consump-tion and reduce the damage to and depreciation ofthe country’s infrastructure. In practice, however,the opposite has happened: private capital flowshave been procyclical, plentiful in good times andscarce in bad times (see, for example, World Bank
70
Figure 3.7 Portfolio flows and financial sector development, 1990–98
Source: World Bank, Global Development Finance: Country Tables and sources cited therein, various years (see annex 3.1 for details).
Correlation coefficient = 0.55 Correlation coefficient = 0.24
Average stock market capitalization/GDP (percent) Stock traded, average turnover ratio (percent)
–50
–1
0
50
100
150
200
250
0
Malaysia
Philippines
MexicoHungary
South Africa
Chile
Thailand
Zimbabwe
Rep. of Korea
Peru
1
Average portfolio flows/GDP (percent) Average portfolio flows/GDP (percent)
2 3 –1 0 1 2 3
Malaysia
Indonesia
Turkey
South Africa
China
Thailand
Zimbabwe
Rep. of Korea
Brazil
0
50
100
150
200
250
I N T E R N A T I O N A L C A P I T A L F L O W S A N D E C O N O M I C G R O W T H
2000). Such volatility can impose significant costs,not only in the form of periodic crises but also, theevidence suggests, through a reduction in long-rungrowth. This outcome reflects, in part, the imper-fect integration of developing economies intoworld financial markets and informational asym-metries—hence the sometimes herdlike behavior offoreign investors (Calvo and Mendoza 1999).However, the procyclical nature of capital flowsalso reflects volatility induced by a country’s ownactions—and inactions—through uncertain gov-ernment policies and, especially, the underdevel-oped state of its own financial markets.
Thus, although opening up domestic financialmarkets to international competition has attractedmore capital to developing countries and has bol-stered growth in some, the larger volume of capitalmarket transactions has also contributed to a morevolatile climate. Where capital flows are large, anysudden effort by investors to withdraw from a coun-try can precipitate or deepen a crisis. As the abun-dant literature on the Asian crisis has also shown,rapid reforms to liberalize the financial sector and toremove barriers to the entry of foreign capital oftenproceeded without the development of the institu-tions or practices that characterize a mature finan-cial market. Particularly noticeable in their absencehave been effective accounting practices, appropri-ate supervisory rules, and strong oversight of thebanking system. Without these foundations, capitalflows have often powered overinvestment andspeculative booms. Eichengreen (1999) has de-scribed the mingling of foreign capital flows in afragile financial sector as an “explosive mix.”
This need not be so. Kaminsky and Schmukler(1999) find that, although the exposure of domes-tic financial markets to foreign capital tends to in-crease instability in the first year, foreign inflowsare ultimately (starting from about the third year)associated with greater, not less, stability. The evi-dence also suggests that volatility can be managed.Chile drew some important lessons from the se-vere financial crisis it suffered in the early 1980s,and that country’s subsequent experience withstrengthening the domestic financial sector whilegradually liberalizing capital flows serves as an ex-ample of how to achieve the benefits from both.Finally, some have also proposed that flexibility ofexchange rates has helped recently in containingthe length of crises (Cline 2000), although this evi-dence remains controversial.
This section considers the costs of financialvolatility, the sources from which it arises, and thetechniques and prospects for managing it. Whereasthe costs arising from volatility are real, other costsattributed to international capital flows have lessof a basis. For example, no evidence exists of envi-ronmental degradation from an investor “race tothe bottom” (box 3.2).
Volatility and growthEconomic theory offers strong reasons to think thatvolatility may be negatively associated with bothinvestment and growth. For instance, Bernanke(1983) and Pindyck (1991) point to irreversibilitiesin investment, which in a climate of greater uncer-tainty can lead to lower investment. Similarly, Scottand Uhlig (1999) argue that, where external in-vestors are fickle, the uncertainty about their be-havior is transmitted to domestic financial markets,and the incentives for entrepreneurial risk takingare reduced. Thus, as Easterly, Islam, and Stiglitz(1999) note, short-run investment and entrepre-neurial decisions come to determine long-run out-comes. Volatility is relevant for overall economicgrowth but perhaps even more relevant for the poorin developing countries, who suffer disproportion-ately in economic downturns (see World Bank,World Development Report 2000).
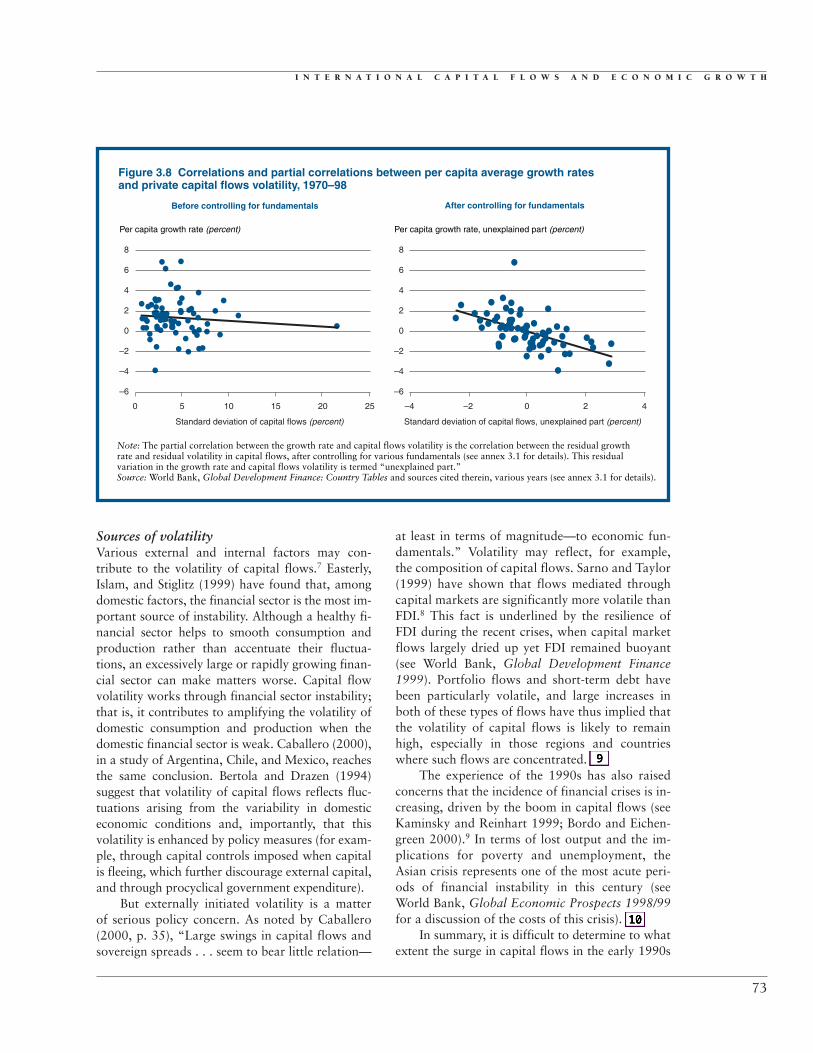
The empirical evidence suggests that these the-oretical relationships between capital flow volatil-ity and economic growth are important. In partic-ular, countries with growth rates that are lowerthan implied by their fundamentals (for example,by their investment rates and human capital) alsotend to have relatively high capital flow volatility,as measured by the standard deviation of flows(figure 3.8).
Of course, this association need not imply thatcapital flow volatility acts as an independent force.Volatility in different forms has been shown to beinimical to growth, and capital flow volatility isoften associated with those other sources of volatil-ity. Ramey and Ramey (1995) find that long-rungrowth is lowered by more volatile GDP growthrates (which, in turn, are positively correlated withcapital flow volatility, as documented by Easterly,Islam, and Stiglitz 1999). From a policy perspec-tive, then, it is important to identify the sources ofvolatility in the domestic economy that may be as-sociated with or may even amplify volatility that isexternally induced by private capital flows.
71
G L O B A L D E V E L O P M E N T F I N A N C E
72
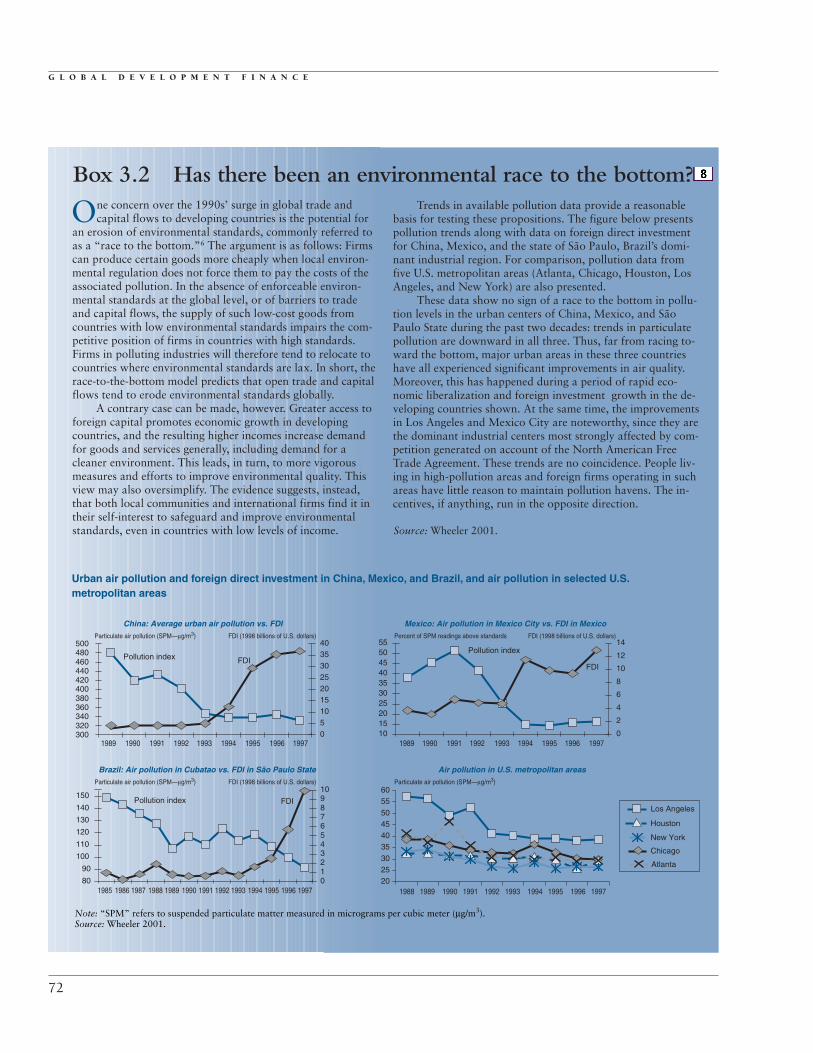
One concern over the 1990s’ surge in global trade andcapital flows to developing countries is the potential for
an erosion of environmental standards, commonly referred toas a “race to the bottom.”6 The argument is as follows: Firmscan produce certain goods more cheaply when local environ-mental regulation does not force them to pay the costs of theassociated pollution. In the absence of enforceable environ-mental standards at the global level, or of barriers to tradeand capital flows, the supply of such low-cost goods fromcountries with low environmental standards impairs the com-petitive position of firms in countries with high standards.Firms in polluting industries will therefore tend to relocate tocountries where environmental standards are lax. In short, therace-to-the-bottom model predicts that open trade and capitalflows tend to erode environmental standards globally.
A contrary case can be made, however. Greater access toforeign capital promotes economic growth in developingcountries, and the resulting higher incomes increase demandfor goods and services generally, including demand for acleaner environment. This leads, in turn, to more vigorousmeasures and efforts to improve environmental quality. Thisview may also oversimplify. The evidence suggests, instead,that both local communities and international firms find it intheir self-interest to safeguard and improve environmentalstandards, even in countries with low levels of income.
Trends in available pollution data provide a reasonablebasis for testing these propositions. The figure below presentspollution trends along with data on foreign direct investmentfor China, Mexico, and the state of São Paulo, Brazil’s domi-nant industrial region. For comparison, pollution data fromfive U.S. metropolitan areas (Atlanta, Chicago, Houston, LosAngeles, and New York) are also presented.
These data show no sign of a race to the bottom in pollu-tion levels in the urban centers of China, Mexico, and SãoPaulo State during the past two decades: trends in particulatepollution are downward in all three. Thus, far from racing to-ward the bottom, major urban areas in these three countrieshave all experienced significant improvements in air quality.Moreover, this has happened during a period of rapid eco-nomic liberalization and foreign investment growth in the de-veloping countries shown. At the same time, the improvementsin Los Angeles and Mexico City are noteworthy, since they arethe dominant industrial centers most strongly affected by com-petition generated on account of the North American FreeTrade Agreement. These trends are no coincidence. People liv-ing in high-pollution areas and foreign firms operating in suchareas have little reason to maintain pollution havens. The in-centives, if anything, run in the opposite direction.
Box 3.2 Has there been an environmental race to the bottom?
Source: Wheeler 2001.
Urban air pollution and foreign direct investment in China, Mexico, and Brazil, and air pollution in selected U.S.metropolitan areas
3001989 1990 1991 1992 1993 1994 1995 1996 1997 1989
1988 1989 1990 1991 1992 1993 1994 1995 1996 1997
1990 1991 1992 1993 1994 1995 1996 1997
320340360380400420440460480500
Pollution index
Pollution indexLos Angeles
New York
Atlanta
Particulate air pollution (SPM—µg/m3) FDI (1998 billions of U.S. dollars)
China: Average urban air pollution vs. FDI
FDIPollution index
FDI
FDI
0510152025303540
10152025303540455055
0
2
4
6
8
10
12
14
801985 1986 1987 1988 1989 1990 1991 1992 1993 1994 1995 1996 1997
90
100
110
120
130
140
150
012345678910
Chicago
Houston
202530
35404550
5560
Particulate air pollution (SPM—µg/m3) FDI (1998 billions of U.S. dollars)
Brazil: Air pollution in Cubatao vs. FDI in São Paulo State
Percent of SPM readings above standards FDI (1998 billions of U.S. dollars)
Mexico: Air pollution in Mexico City vs. FDI in Mexico
Particulate air pollution (SPM—µg/m3)
Air pollution in U.S. metropolitan areas
Note: “SPM” refers to suspended particulate matter measured in micrograms per cubic meter (µg/m3).Source: Wheeler 2001.
I N T E R N A T I O N A L C A P I T A L F L O W S A N D E C O N O M I C G R O W T H
Sources of volatilityVarious external and internal factors may con-tribute to the volatility of capital flows.7 Easterly,Islam, and Stiglitz (1999) have found that, amongdomestic factors, the financial sector is the most im-portant source of instability. Although a healthy fi-nancial sector helps to smooth consumption andproduction rather than accentuate their fluctua-tions, an excessively large or rapidly growing finan-cial sector can make matters worse. Capital flowvolatility works through financial sector instability;that is, it contributes to amplifying the volatility ofdomestic consumption and production when thedomestic financial sector is weak. Caballero (2000),in a study of Argentina, Chile, and Mexico, reachesthe same conclusion. Bertola and Drazen (1994)suggest that volatility of capital flows reflects fluc-tuations arising from the variability in domesticeconomic conditions and, importantly, that thisvolatility is enhanced by policy measures (for exam-ple, through capital controls imposed when capitalis fleeing, which further discourage external capital,and through procyclical government expenditure).
But externally initiated volatility is a matter of serious policy concern. As noted by Caballero(2000, p. 35), “Large swings in capital flows andsovereign spreads . . . seem to bear little relation—
at least in terms of magnitude—to economic fun-damentals.” Volatility may reflect, for example,the composition of capital flows. Sarno and Taylor(1999) have shown that flows mediated throughcapital markets are significantly more volatile thanFDI.8 This fact is underlined by the resilience ofFDI during the recent crises, when capital marketflows largely dried up yet FDI remained buoyant(see World Bank, Global Development Finance1999). Portfolio flows and short-term debt havebeen particularly volatile, and large increases inboth of these types of flows have thus implied thatthe volatility of capital flows is likely to remainhigh, especially in those regions and countrieswhere such flows are concentrated.
The experience of the 1990s has also raisedconcerns that the incidence of financial crises is in-creasing, driven by the boom in capital flows (seeKaminsky and Reinhart 1999; Bordo and Eichen-green 2000).9 In terms of lost output and the im-plications for poverty and unemployment, theAsian crisis represents one of the most acute peri-ods of financial instability in this century (seeWorld Bank, Global Economic Prospects 1998/99for a discussion of the costs of this crisis).
In summary, it is difficult to determine to whatextent the surge in capital flows in the early 1990s
73
Figure 3.8 Correlations and partial correlations between per capita average growth ratesand private capital flows volatility, 1970–98
Before controlling for fundamentals After controlling for fundamentals
Per capita growth rate (percent) Per capita growth rate, unexplained part (percent)
Standard deviation of capital flows (percent) Standard deviation of capital flows, unexplained part (percent)
–6
–4
–2
0
2
4
6
8
0 5 10 15 20 25
–6
–4
–2
0
2
4
6
8
–4 –2 0 2 4
Note: The partial correlation between the growth rate and capital flows volatility is the correlation between the residual growthrate and residual volatility in capital flows, after controlling for various fundamentals (see annex 3.1 for details). This residual variation in the growth rate and capital flows volatility is termed “unexplained part.”Source: World Bank, Global Development Finance: Country Tables and sources cited therein, various years (see annex 3.1 for details).
G L O B A L D E V E L O P M E N T F I N A N C E
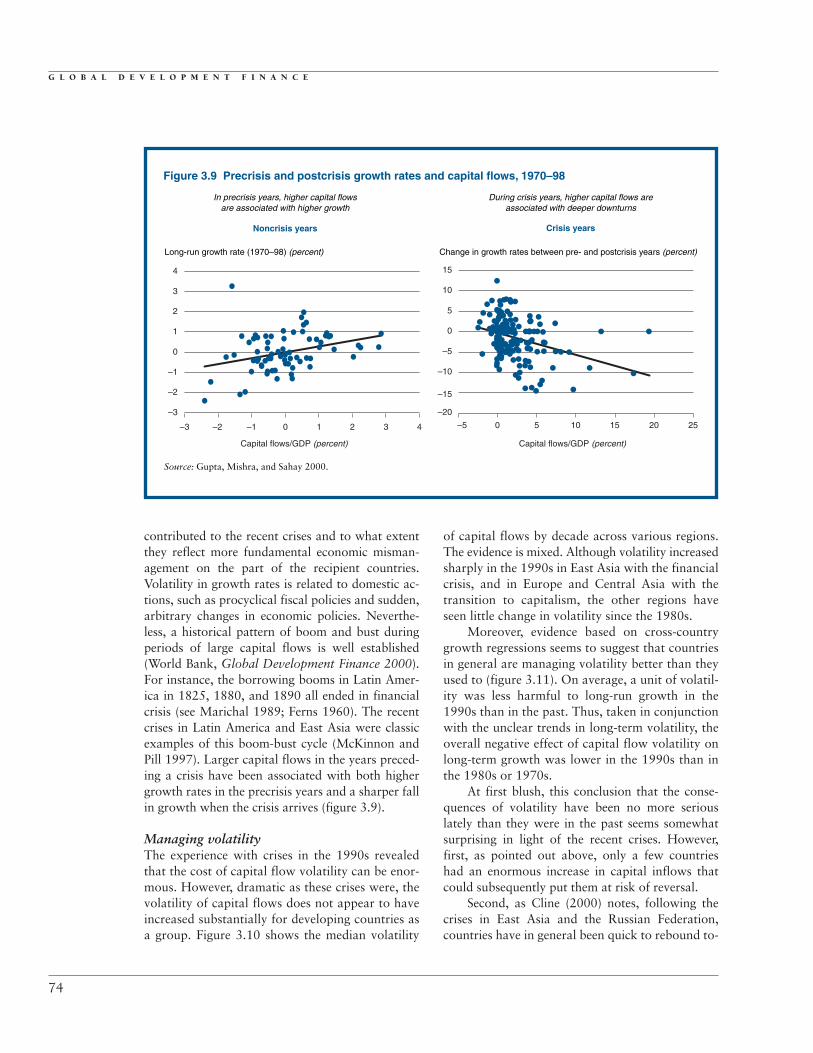
contributed to the recent crises and to what extentthey reflect more fundamental economic misman-agement on the part of the recipient countries.Volatility in growth rates is related to domestic ac-tions, such as procyclical fiscal policies and sudden,arbitrary changes in economic policies. Neverthe-less, a historical pattern of boom and bust duringperiods of large capital flows is well established(World Bank, Global Development Finance 2000).For instance, the borrowing booms in Latin Amer-ica in 1825, 1880, and 1890 all ended in financialcrisis (see Marichal 1989; Ferns 1960). The recentcrises in Latin America and East Asia were classicexamples of this boom-bust cycle (McKinnon andPill 1997). Larger capital flows in the years preced-ing a crisis have been associated with both highergrowth rates in the precrisis years and a sharper fallin growth when the crisis arrives (figure 3.9).
Managing volatilityThe experience with crises in the 1990s revealedthat the cost of capital flow volatility can be enor-mous. However, dramatic as these crises were, thevolatility of capital flows does not appear to haveincreased substantially for developing countries asa group. Figure 3.10 shows the median volatility
of capital flows by decade across various regions.The evidence is mixed. Although volatility increasedsharply in the 1990s in East Asia with the financialcrisis, and in Europe and Central Asia with thetransition to capitalism, the other regions haveseen little change in volatility since the 1980s.
Moreover, evidence based on cross-countrygrowth regressions seems to suggest that countriesin general are managing volatility better than theyused to (figure 3.11). On average, a unit of volatil-ity was less harmful to long-run growth in the1990s than in the past. Thus, taken in conjunctionwith the unclear trends in long-term volatility, theoverall negative effect of capital flow volatility onlong-term growth was lower in the 1990s than inthe 1980s or 1970s.
At first blush, this conclusion that the conse-quences of volatility have been no more seriouslately than they were in the past seems somewhatsurprising in light of the recent crises. However,first, as pointed out above, only a few countrieshad an enormous increase in capital inflows thatcould subsequently put them at risk of reversal.
Second, as Cline (2000) notes, following thecrises in East Asia and the Russian Federation,countries have in general been quick to rebound to-
74
Figure 3.9 Precrisis and postcrisis growth rates and capital flows, 1970–98
Source: Gupta, Mishra, and Sahay 2000.
Noncrisis years Crisis years
Long-run growth rate (1970–98) (percent)
In precrisis years, higher capital flowsare associated with higher growth
During crisis years, higher capital flows areassociated with deeper downturns
Change in growth rates between pre- and postcrisis years (percent)
–3
–2
–1
0
1
2
3
4
–3 –2 –1 0 1 2 3 4
Capital flows/GDP (percent) Capital flows/GDP (percent)
–20
–15
–10
–5
0
5
10
15
–5 0 5 10 15 20 25

I N T E R N A T I O N A L C A P I T A L F L O W S A N D E C O N O M I C G R O W T H
ward precrisis growth trends. Caballero (2000),while highlighting the importance of vigilanceagainst volatility induced by imperfections in theoperation of international capital markets, alsonotes the quick recovery from recent crises. Thiscontrasts with the pattern observed in the 1980s,where the initial impact of crises may have beensmaller but the effects were longer lasting. Cline ar-gues that this change is an outcome of greater ex-change rate flexibility and capital mobility. In the1980s, when exchange rates were relatively fixedand capital controls generally tight, adjustment toa crisis required rationing of foreign exchange. Inthe 1990s, in contrast, currencies were allowed todepreciate rapidly. Although the immediate effectmay have been to worsen the ensuing recession, thesubsequent recovery was also faster.
Third, in the 1990s more countries took stepsto ward off crises. For example, by the time thecrises of the late 1990s struck, Chile had strength-ened its defenses through a tax on capital inflowsthat lengthened the average maturity of its debt.Chile also undertook extensive reforms of its finan-cial markets. Argentina put in place contingentcredit lines and likewise strengthened its financialsector, and both China and its Hong Kong provincehad built substantial reserves to manage immediateliquidity needs. The large rescue packages put to-gether by the international financial communityalso stemmed a systemic slide in the 1990s. Finally,greater economic diversification, particularly in themore sophisticated developing economies, may alsohave helped limit their downturns by enabling themto shift production between sectors as internationaldemand conditions changed.
Continued efforts to safeguard against exter-nally generated volatility must be a priority forpolicymakers. The best safeguards are those aimedat the long run, such as stronger financial systems,that reduce economic vulnerability. However,short-term safeguards may also be needed to insu-late countries from speculative attack (Feldstein1998; Caballero 2000). This could involve increas-ing liquidity through a prudent amount of re-serves—one that provides a short-term buffer butdoes not impose large fiscal costs—or contingentcredit lines. It might also involve Chilean-styletaxes to limit the volatility of short-term capitalflows, although the effectiveness of this instrumentremains a matter of dispute (see World Bank,
Global Development Finance 2000; Kletzer andMody 2000). However, neither of these ap-proaches is perfect, and countries will need toadopt those measures that best meet their specificrequirements. The same is true for so-called early
75
Standard deviation of capital flows (percent of GDP)
Figure 3.10 Capital flows volatility by decade and by region
Source: World Bank, Global Development Finance: Country Tables and sourcescited therein, various years (see annex 3.1).
5
4
3
2
1
0East Asia
and Pacific
Europeand
CentralAsia
MiddleEast and
NorthAfrica
Sub-Saharan
Africa
LatinAmericaand the
Caribbean
SouthAsia
Allcountries
1970s
1980s
1990s
Percent
Figure 3.11 Volatility of capital flows andthe changing relationship with growth
–2Average volatilityof capital flowsfor the decade
Marginal effectfrom volatility
Contribution ofvolatility to
growth
–1
0
1
2
3
4
5
1970s
1980s
1990s
Note: The sample of countries for this figure is smallerthan that for figure 3.10. Hence the average volatilitiesare different, though their time pattern is the same.Source: World Bank, Global Development Finance:Country Tables and sources cited therein, various years (see annex 3.1).
G L O B A L D E V E L O P M E N T F I N A N C E
warning indicators (box 3.3). Each country has itsown vulnerabilities, which it will need to monitor.
The policy agenda
Many developing countries are making thetransition to greater integration with inter-
national financial markets. Both theory and prac-tice suggest that long-term gains are possible, butthe interim costs can also be significant. The policyagenda that emerges from this review is complexbecause the tradeoffs are often unclear and analystsdo not always agree on the right course of action.
Creating the link between capital flows andthe growth agenda is conceptually straightforwardbut is an operationally complex, long-term task.The benefits of private capital flows may be small
in a country with a poorly educated work force,macroeconomic instability, and substantial admin-istrative impediments to private economic activi-ties. Improvement of the business climate wouldbe good for such a country not just because itwould achieve greater effectiveness of interna-tional capital and not just because it would alsostimulate domestic saving and investment—butprimarily because investments would then be effec-tive in raising living standards.
Dealing with volatility poses greater chal-lenges. As this chapter has amply documented,countries with weak domestic financial institu-tions (and those highly dependent on portfolioflows and short-term bank lending) are most sub-ject to capital flow volatility and its ill effects.Such countries need to improve their policies per-taining to domestic financial institutions in order
76
The search for early warning indicators of financialcrises gained momentum during the turbulence of the
1990s. Edison (2000) reviews a variety of measures pro-posed as early warning indicators and their record of suc-cess, as measured by their ability to predict a currencycrisis within the next 24 months. These comparative indi-cators proved generally unsuccessful in predicting crises,which points to the importance of a country-specificapproach to monitoring vulnerability.
Possible early warning indicators include measures ofglobal economic conditions (such as output growth in the Group of Seven, U.S. interest rates, and oil prices) aswell as measures of domestic weaknesses. Domestic vul-nerability to currency crises can be expected to show upeither in a country’s balance of payments, in the real sec-tor, or in the financial sector. The choice of indicators ispartly determined by their intuitive appeal and partly bydata availability. Possible indicators for the balance ofpayments include, for the current account, real exchangerate overvaluation and trade performance, and for thecapital account, foreign exchange reserves, short-termdebt, and interest rate differentials. Indicators for the do-mestic financial sector include money balances, commer-cial bank deposits, and interest rates, and those for thereal sector include indexes of industrial production andequity prices.
One study of these indicators found that a few are of some use in predicting financial crises, but several pro-vided predictions that were no better than random
guesses. Three indicators that stand out as being particu-larly useful are real exchange rate overvaluation, the ratioof the money supply (M2) to reserves, and the ratio ofshort-term debt to reserves (Edison 2000, p. 60). Edisonfinds that an overall vulnerability index (constructed from19 indicators) was weakly informative after the fact butperformed poorly in forecasting crises. An out-of-sample“prediction” based on data available in December 1996,for instance, rated no country as having more than a 50percent probability of suffering a crisis. In fact, the highestpredicted crisis probability was for Bangladesh, which did not have a crisis. The probabilities for Malaysia, thePhilippines, and Thailand were a little over 30 percent,while that for the Republic of Korea was around 25 per-cent and Indonesia at 15 percent.
One problem shared by many potential indicators isthat they are not available in a sufficiently timely fashion.More critically, any early warning model faces a tradeoffbetween overpredicting crises and underpredicting them.For instance, the ratio of short-term debt to reserves had avery good record at signaling in advance crises that actu-ally occurred, but it also signaled many crises that did notoccur. The real exchange rate measure, in contrast, tendedto avoid giving false signals but missed a number of actualcrises. Thus users facing different types of exposure, orwho are active in countries with different characteristics,may be able to improve these results by including informa-tion that is more country-specific, rather than simply rely-ing on cross-country indicators of the likelihood of crisis.
Box 3.3 Early warning indicators

I N T E R N A T I O N A L C A P I T A L F L O W S A N D E C O N O M I C G R O W T H
to reap the benefits of private capital flows, andsuch measures will also contribute to growth. Arecent World Bank Policy Research Report (WorldBank 2001) reaches four conclusions:
• Governments are not good at providing finan-cial services—even when a crisis hits. Reduc-ing, even eliminating, state ownership shouldbe a high priority, but privatization should bedesigned carefully to limit systemic risks. Evenin a crisis, reliance should be placed, as far aspossible, on using the market to identify win-ners and losers.
• Well-functioning markets need legal and regula-tory underpinning. Regulatory and supervisoryarrangements should help ensure constructiveincentives for financial market participants.
• Diversity is good for stability. Banks, securi-ties markets, and a range of other types of in-termediary and ancillary firms are all neededfor balanced financial development.
• Open markets can spur development. Mostdeveloping countries are too small to be ableto afford to do without the benefits of accessto global finance, including services from for-eign financial firms.
What should be done beyond strengtheningdomestic financial markets? On that there is an ac-tive debate. Although the case has sometimes beenmade for Chilean-style taxes on short-term capitalinflows, their practicality in other settings remainscontroversial (see World Bank, Global DevelopmentFinance 2000). Financial sector stability and pru-dence, induced through measures such as those de-scribed above, can also provide important elementsof capital controls.
In parallel, governments may choose to takeprecautions to deal with potential capital flowvolatility by holding substantial foreign reserves or arranging access to contingent credit lines in case of a sudden withdrawal of flows from inter-national capital markets. These can provide safe-guards against crises where the long-term stabilityof the financial sector is not yet in place. But thepossible costs and, again, the practical implemen-tation of these measures remain subject to debate(World Bank, Global Development Finance 2000).
Finally, flexible exchange rates, as suggestedabove, can help dampen the volatility of capitalflows. However, the choice of the right exchange
rate regime continues to be keenly debated. Whereasproponents of a universal solution can be heard onall sides—fully floating, fixed, and intermediateregimes—others argue that a one-size-fits-all pre-scription is misleading (Frankel 1999). This remainsan area of significant intellectual ferment.
Annex 3.1
This annex provides the technical details anddata sources underlying some of the figures in
this chapter that are based on various panel andcross-country regressions.
In figures 3.1 to 3.3 the heights of the bars,which correspond to the incremental relationshipof capital flows with investment, saving, and thecurrent account, are obtained as a two-stage panelregression based on Bosworth and Collins (1999).By removing the country means from the data, thisapproach focuses on the within-country variationand permits a relatively simple specification inwhich investment (and saving) shares are regressedagainst capital flows (relative to GDP), the laggedgrowth rate, the change in the terms of trade, andthe lagged inflation rate. The marginal relation-ship of capital flows with the current account iscalculated as the sum of the coefficients on capitalflows in the investment and saving equations.
The instrumental variables estimator used byBosworth and Collins to allow for consistent esti-mation in the presence of two-way relationshipsbetween foreign capital and investment (and sav-ing) is also adopted here. The instrument for capi-tal flows is based on the aggregate flow of capitalto developing countries, which for any given coun-try should be largely exogenous. Specifically, theflow of capital (as a fraction of GDP) is regressedon itself lagged one period, the sum of flows to alldeveloping countries (as a fraction of total devel-oping-country GDP), the lagged growth rate, andthe change in the terms of trade, after removingcountry-specific means.10 An instrument was con-structed for each type of flow in similar fashion.For instance, an instrument for FDI was obtainedby regressing FDI on itself lagged one period, thetotal of foreign investment to developing countriesas a fraction of total developing-country GDP, aswell as lagged growth and a shock to the terms oftrade. As above, the country-specific fixed effectswere removed from the data. Good instruments
77
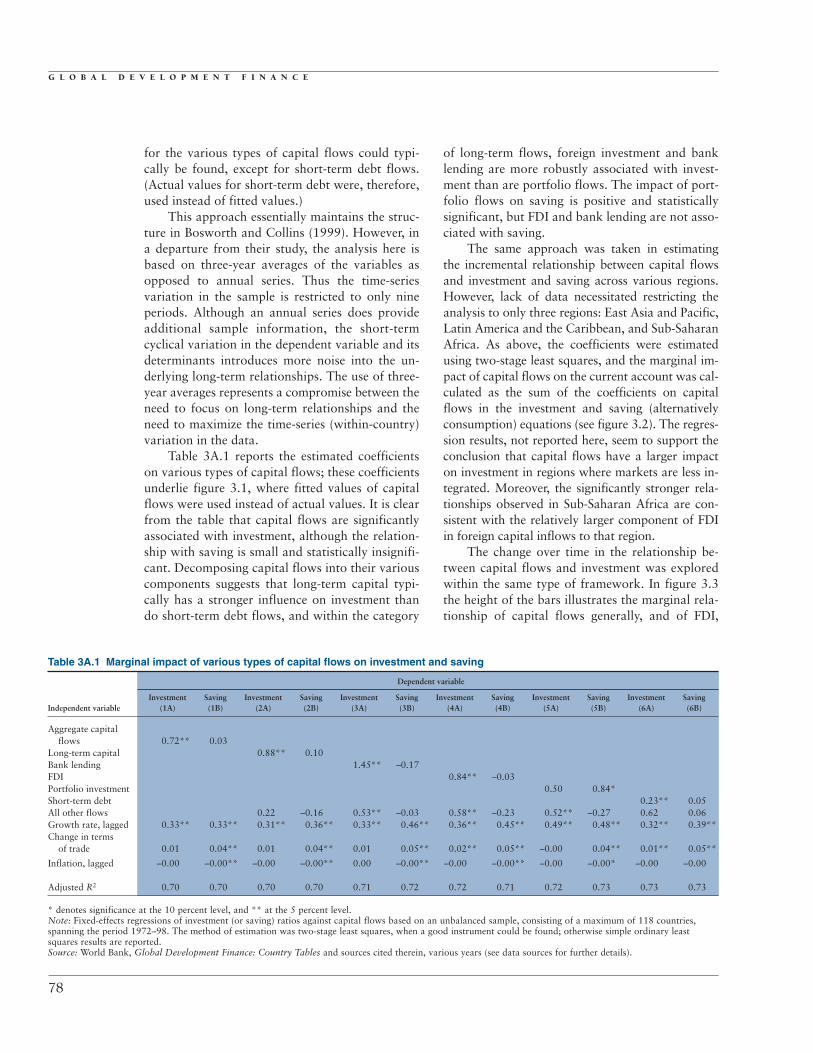
Table 3A.1 Marginal impact of various types of capital flows on investment and saving
Dependent variable
Investment Saving Investment Saving Investment Saving Investment Saving Investment Saving Investment SavingIndependent variable (1A) (1B) (2A) (2B) (3A) (3B) (4A) (4B) (5A) (5B) (6A) (6B)
Aggregate capital flows 0.72** 0.03
Long-term capital 0.88** 0.10Bank lending 1.45** –0.17FDI 0.84** –0.03Portfolio investment 0.50 0.84*Short-term debt 0.23** 0.05All other flows 0.22 –0.16 0.53** –0.03 0.58** –0.23 0.52** –0.27 0.62 0.06Growth rate, lagged 0.33** 0.33** 0.31** 0.36** 0.33** 0.46** 0.36** 0.45** 0.49** 0.48** 0.32** 0.39**Change in terms
of trade 0.01 0.04** 0.01 0.04** 0.01 0.05** 0.02** 0.05** –0.00 0.04** 0.01** 0.05**
Inflation, lagged –0.00 –0.00** –0.00 –0.00** 0.00 –0.00** –0.00 –0.00** –0.00 –0.00* –0.00 –0.00
Adjusted R2 0.70 0.70 0.70 0.70 0.71 0.72 0.72 0.71 0.72 0.73 0.73 0.73
* denotes significance at the 10 percent level, and ** at the 5 percent level.Note: Fixed-effects regressions of investment (or saving) ratios against capital flows based on an unbalanced sample, consisting of a maximum of 118 countries,spanning the period 1972–98. The method of estimation was two-stage least squares, when a good instrument could be found; otherwise simple ordinary leastsquares results are reported.Source: World Bank, Global Development Finance: Country Tables and sources cited therein, various years (see data sources for further details).
G L O B A L D E V E L O P M E N T F I N A N C E
for the various types of capital flows could typi-cally be found, except for short-term debt flows.(Actual values for short-term debt were, therefore,used instead of fitted values.)
This approach essentially maintains the struc-ture in Bosworth and Collins (1999). However, ina departure from their study, the analysis here isbased on three-year averages of the variables asopposed to annual series. Thus the time-seriesvariation in the sample is restricted to only nineperiods. Although an annual series does provideadditional sample information, the short-termcyclical variation in the dependent variable and itsdeterminants introduces more noise into the un-derlying long-term relationships. The use of three-year averages represents a compromise between theneed to focus on long-term relationships and theneed to maximize the time-series (within-country)variation in the data.
Table 3A.1 reports the estimated coefficientson various types of capital flows; these coefficientsunderlie figure 3.1, where fitted values of capitalflows were used instead of actual values. It is clearfrom the table that capital flows are significantlyassociated with investment, although the relation-ship with saving is small and statistically insignifi-cant. Decomposing capital flows into their variouscomponents suggests that long-term capital typi-cally has a stronger influence on investment thando short-term debt flows, and within the category
of long-term flows, foreign investment and banklending are more robustly associated with invest-ment than are portfolio flows. The impact of port-folio flows on saving is positive and statisticallysignificant, but FDI and bank lending are not asso-ciated with saving.
The same approach was taken in estimating the incremental relationship between capital flowsand investment and saving across various regions.However, lack of data necessitated restricting theanalysis to only three regions: East Asia and Pacific,Latin America and the Caribbean, and Sub-SaharanAfrica. As above, the coefficients were estimatedusing two-stage least squares, and the marginal im-pact of capital flows on the current account was cal-culated as the sum of the coefficients on capitalflows in the investment and saving (alternativelyconsumption) equations (see figure 3.2). The regres-sion results, not reported here, seem to support theconclusion that capital flows have a larger impacton investment in regions where markets are less in-tegrated. Moreover, the significantly stronger rela-tionships observed in Sub-Saharan Africa are con-sistent with the relatively larger component of FDIin foreign capital inflows to that region.
The change over time in the relationship be-tween capital flows and investment was exploredwithin the same type of framework. In figure 3.3the height of the bars illustrates the marginal rela-tionship of capital flows generally, and of FDI,
78
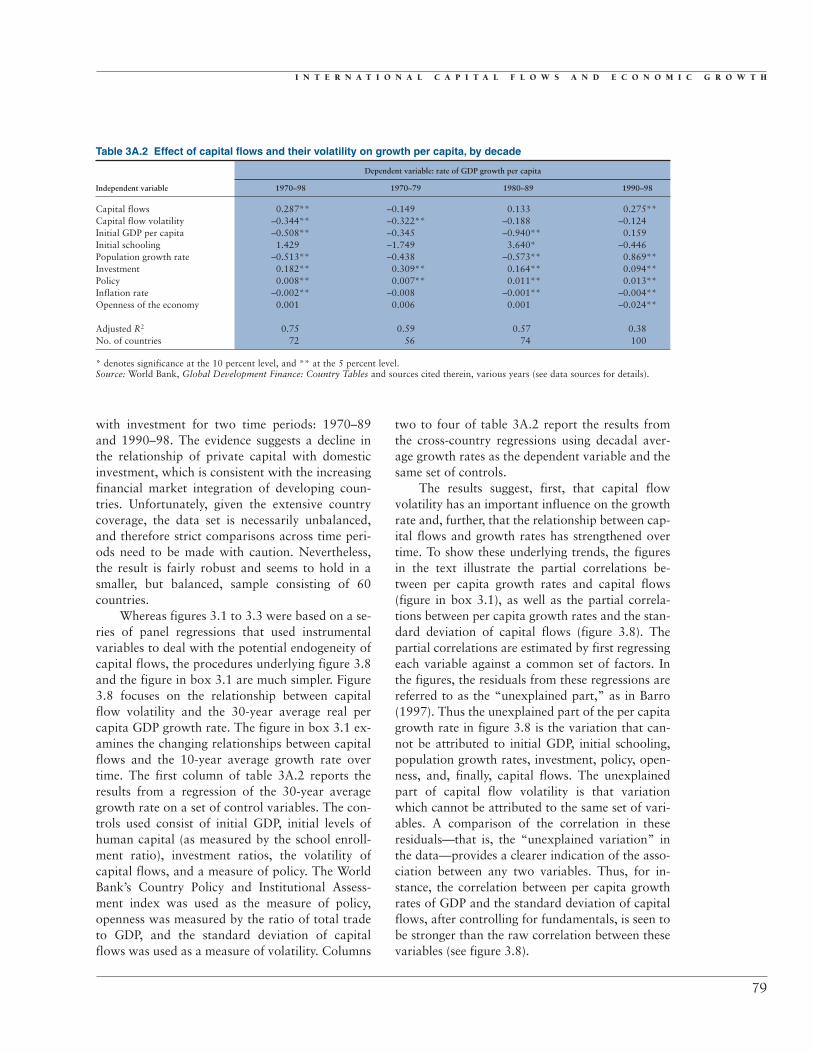
I N T E R N A T I O N A L C A P I T A L F L O W S A N D E C O N O M I C G R O W T H
with investment for two time periods: 1970–89and 1990–98. The evidence suggests a decline inthe relationship of private capital with domesticinvestment, which is consistent with the increasingfinancial market integration of developing coun-tries. Unfortunately, given the extensive countrycoverage, the data set is necessarily unbalanced,and therefore strict comparisons across time peri-ods need to be made with caution. Nevertheless,the result is fairly robust and seems to hold in asmaller, but balanced, sample consisting of 60countries.
Whereas figures 3.1 to 3.3 were based on a se-ries of panel regressions that used instrumentalvariables to deal with the potential endogeneity ofcapital flows, the procedures underlying figure 3.8and the figure in box 3.1 are much simpler. Figure3.8 focuses on the relationship between capitalflow volatility and the 30-year average real percapita GDP growth rate. The figure in box 3.1 ex-amines the changing relationships between capitalflows and the 10-year average growth rate overtime. The first column of table 3A.2 reports theresults from a regression of the 30-year averagegrowth rate on a set of control variables. The con-trols used consist of initial GDP, initial levels ofhuman capital (as measured by the school enroll-ment ratio), investment ratios, the volatility ofcapital flows, and a measure of policy. The WorldBank’s Country Policy and Institutional Assess-ment index was used as the measure of policy,openness was measured by the ratio of total tradeto GDP, and the standard deviation of capitalflows was used as a measure of volatility. Columns
two to four of table 3A.2 report the results fromthe cross-country regressions using decadal aver-age growth rates as the dependent variable and thesame set of controls.
The results suggest, first, that capital flowvolatility has an important influence on the growthrate and, further, that the relationship between cap-ital flows and growth rates has strengthened overtime. To show these underlying trends, the figuresin the text illustrate the partial correlations be-tween per capita growth rates and capital flows(figure in box 3.1), as well as the partial correla-tions between per capita growth rates and the stan-dard deviation of capital flows (figure 3.8). Thepartial correlations are estimated by first regressingeach variable against a common set of factors. Inthe figures, the residuals from these regressions arereferred to as the “unexplained part,” as in Barro(1997). Thus the unexplained part of the per capitagrowth rate in figure 3.8 is the variation that can-not be attributed to initial GDP, initial schooling,population growth rates, investment, policy, open-ness, and, finally, capital flows. The unexplainedpart of capital flow volatility is that variationwhich cannot be attributed to the same set of vari-ables. A comparison of the correlation in theseresiduals—that is, the “unexplained variation” inthe data—provides a clearer indication of the asso-ciation between any two variables. Thus, for in-stance, the correlation between per capita growthrates of GDP and the standard deviation of capitalflows, after controlling for fundamentals, is seen tobe stronger than the raw correlation between thesevariables (see figure 3.8).
79
Table 3A.2 Effect of capital flows and their volatility on growth per capita, by decade
Dependent variable: rate of GDP growth per capita
Independent variable 1970–98 1970–79 1980–89 1990–98
Capital flows 0.287** –0.149 0.133 0.275**Capital flow volatility –0.344** –0.322** –0.188 –0.124Initial GDP per capita –0.508** –0.345 –0.940** 0.159Initial schooling 1.429 –1.749 3.640* –0.446Population growth rate –0.513** –0.438 –0.573** 0.869**Investment 0.182** 0.309** 0.164** 0.094**Policy 0.008** 0.007** 0.011** 0.013**Inflation rate –0.002** –0.008 –0.001** –0.004**Openness of the economy 0.001 0.006 0.001 –0.024**
Adjusted R2 0.75 0.59 0.57 0.38No. of countries 72 56 74 100
* denotes significance at the 10 percent level, and ** at the 5 percent level.Source: World Bank, Global Development Finance: Country Tables and sources cited therein, various years (see data sources for details).

G L O B A L D E V E L O P M E N T F I N A N C E
Notes1. The effects for other regions are not described be-
cause data are available for fewer countries or a shortertime period, making the estimated effects imprecise.
2. Results based on fixed-effects regressions suggest thatforeign direct investment (FDI) is positively associated withinvestment but that threshold effects may be present: the ef-fectiveness of FDI at low levels of schooling may be close tozero (or even negative).
3. For a careful, annotated review of the literature onFDI and spillover effects, see Klein (2000).
4. In another study of the Czech Republic, Kinoshita(2000) finds no evidence of technology spillovers to localfirms from those with a foreign joint venture partner, exceptin the electrical machinery and consumer electronics indus-tries. In these industries domestic firm capabilities are high,reflecting their greater research and development efforts.
5. See Levine (2000) for a review of the literature andmore extensive references.
6. For forceful statements of the race-to-the-bottomargument, see Daly (2000) and Bonior (1999).
7. Volatility may be particularly pronounced in small,open economies, where capital flows may be large and par-ticularly lumpy in relation to gross domestic product (GDP).
For instance, countries such as Guyana, Panama, PapuaNew Guinea, and Trinidad and Tobago have all received siz-able and volatile capital flows relative to their GDP.
8. On the other hand, Claessens, Dooley, and Warner(1995) have argued that there is little difference in volatilityacross flows of various types.
9. Note, however, that in Latin America, a regiongreatly affected by capital flow volatility over the pastdecade, the volatility of growth did not increase in the 1990scompared with the 1980s (World Bank 2000).
10. The choice of instruments was motivated byBosworth and Collins (1999). They use a measure of globalcapital flows to developing countries, as well as lagged valuesof capital flows and growth rates, in addition to changes in theterms of trade and a dummy to capture whether capital con-trols are in place. Their choice of instruments was largely pre-served; however, the dummy for capital account restrictionswas dropped due to the paucity of data for selected years.
ReferencesThe word processed describes informally reproduced worksthat may not be commonly available through libraries.
80
Table 3A.3 Data sourcesData series Description Source
Capital flows data
Capital flows Sum of long-term flows and short-term debt, GDF: Country Tablesas a share of GDP
Long-term capital flows Measured as a share of GDP GDF: Country TablesBank lending Commercial bank lending, measured as a share of GDP GDF: Country TablesForeign direct investment Measured as a share of GDP GDF: Country TablesPortfolio flows Measured as a share of GDP GDF: Country TablesOther flows Estimated as the difference between long-term capital World Bank staff estimates
and the sum of FDI, bank lending, and portfolio flows,as a share of GDP
Short-term debt Measured as a share of GDP GDF: Country Tables
Other financial andmacroeconomic variables
Current account deficit Measured as a share of GDP GDF: Country TablesGrowth rate Real GDP growth rate GDF: Country TablesInflation Percentage change in consumer prices GDF: Country TablesInvestment Gross domestic fixed capital formation GDF: Country TablesOpenness of the economy Sum of exports and imports, as a share of GDP GDF: Country TablesReserves Change in reserves, as a share of GDP International Financial StatisticsSaving Estimated as the sum of investment and the current GDF: Country Tables
account deficitTerms of trade Change in net barter terms of trade GDF: Country Tables
Structural variablesFinancial depth Money supply (M2) as a share of GDP GDF: Country TablesHuman capital Secondary school enrollment ratio, percent World Development IndicatorsLabor force education Percentage of total labor force with secondary education World Development IndicatorsPolicy Country Policy and Institutional Assessment index World BankPolitical stability International Country Risk Guide political risk rating International Country Risk Guide,
produced by the PRS Group
InfrastructurePaved roads Percentage of all roads that are paved World Development IndicatorsSanitation Percentage of population with access to sanitation World Development IndicatorsTelephone mainlines Waiting times, in years World Development Indicators
I N T E R N A T I O N A L C A P I T A L F L O W S A N D E C O N O M I C G R O W T H
Abramowitz, Moses. 1986. “Catching Up, Forging Ahead,and Falling Behind.” Journal of Economic History56(2): 385–406.
Aitken, Brian J., and Ann E. Harrison. 1999. “Do DomesticFirms Benefit from Direct Foreign Investment? Evi-dence from Venezuela. ” American Economic Review89(3): 605–18.
Aitken, Brian J., Ann E. Harrison, and Robert E. Lipsey.1996. “Wages and Foreign Ownership: A ComparativeStudy of Mexico, Venezuela, and the United States.”Journal of International Economics 40: 345–71.
Balasubramanyam, V. N., M. Salisu, and David Sapsford.1991. “Export Promotion, Import Substitution andDirect Foreign Investment in Less Developed Coun-tries.” In A. Koekkok and L. B. M. Mennes, eds., In-ternational Trade and Global Development: Essays inHonour of Jagdish Bhagwati. London: Routledge.
Barrell, Ray, and Nigel Pain. 1997. “Foreign Direct Invest-ment, Technological Change, and Economic Growthwithin Europe.” Economic Journal 107: 1770–86.
Barro, Robert J. 1997. Determinants of Economic Growth:A Cross-Country Empirical Study. Cambridge andLondon: MIT Press.
Beck, Thorsten, Ross Levine, and Norman Loayza. 2000.“Finance and the Sources of Growth.” World Bank,Washington, D.C. Processed.
Bernanke, Ben. 1983. “Irreversibility, Uncertainty and Cy-clical Investment.” Quarterly Journal of Economics98(1): 85–106.
Bertola, Giuseppe, and Allan Drazen. 1994. “Will Govern-ment Policy Magnify Capital Flow Volatility?” InLeonardo Leiderman and Asaf Razin, eds., CapitalMobility: The Impact of Consumption, Investmentand Growth. New York and Melbourne: CambridgeUniversity Press.
Bils, Mark, and Peter Klenow. 1998. “Does SchoolingCause Growth or the Other Way Around?” NBERWorking Paper 6393. National Bureau of EconomicResearch, Cambridge, Mass.
Blomstrom, Magnus, Robert Lipsey, and Mario Zejan.1994. “What Explains the Growth of DevelopingCountries?” In William J. Baumol, Richard R. Nelson,and Edward N. Wolff, eds., Convergence of Productiv-ity: Cross National Studies and Historical Evidence.Oxford and New York: Oxford University Press.
_______. 1996. “Is Fixed Investment the Key to EconomicGrowth?” Quarterly Journal of Economics 111(1):269–76.
Bonior, D. 1999. “Defending Democracy in the New GlobalEconomy,” statement to an AFL-CIO conference onworkers’ rights, trade development, and the WTO,Seattle, Washington, December.
Bordo, Michael, and Barry Eichengreen. 2000. “Is the CrisisProblem Becoming More Severe?” Processed.
Borensztein, E., J. De Gregorio, and J-W Lee. 1998. “HowDoes Foreign Direct Investment Affect Growth?” Jour-nal of International Economics 45(1): 115–35.
Bosworth, Barry, and Susan M. Collins. 1999. “CapitalFlows to Developing Economies: Implications for Sav-ing and Investment.” Brookings Papers on EconomicActivity 1: 143–69.
Caballero, Ricardo. 2000. “Macroeconomic Volatility inLatin America: A View and Three Case Studies.” Paperprepared for the first panel meeting of Economia, May2000.
Calvo, Guillermo A., and Enrique G. Mendoza. 1999. “Ra-tional Contagion and the Globalization of SecuritiesMarkets.” NBER Working Paper 7153. National Bu-reau of Economic Research, Cambridge, Mass.
Canning, David, and Esra Bennathan. 2000. “The SocialRate of Return to Infrastructure Investment.” QueensUniversity of Belfast. Processed.
Carkovic, Maria, and Ross Levine. 2000. “Does Foreign Di-rect Investment Accelerate Economic Growth?” Uni-versity of Minnesota. Processed.
Cassiers, I., P. De Ville, and P. M. Solar. 1996. “EconomicGrowth in Post-war Belgium.” In Nicholas Crafts andGianni Toniolo, eds., Economic Growth in EuropeSince 1945. Cambridge, England: Cambridge Univer-sity Press.
Caves, Richard. 1999. “Spillovers from Multinationals inDeveloping Countries: The Mechanisms at Work.”William Davidson Institute Working Paper 247. AnnArbor, Mich.
Chuang, Yih-Chyi, and Chi-Mei Lin. 1999. “Foreign DirectInvestment, R&D and Spillover Efficiency: Evidencefrom Taiwan’s Manufacturing Firms.” Journal of De-velopment Studies 35(4): 117–37.
Claessens, Stijn, Asli Demirgüç-Kunt, and Harry Huzinga.2000. “How Does Foreign Entry Affect the DomesticBanking Market?” In Stijn Claessens and MarionJansen, eds., The Internationalization of Financial Ser-vices: Issues and Lessons for Developing Countries.Forthcoming. Kluwer Academic Publishers, New York.
Claessens, Stijn, Michael Dooley, and Andrew Warner.1995. “Portfolio Capital Flows: Hot or Cold?” WorldBank Economic Review 9(1):153–74.
Clarke, George, Robert Cull, Laura D’Amato, and AndreaMolinari. 2000. “On the Kindness of Strangers? TheImpact of Foreign Entry on Domestic Banks in Ar-gentina.” In Stijn Claessens and Marion Jansen, eds.,The Internationalization of Financial Services: Issuesand Lessons for Developing Countries. Forthcoming.Kluwer Academic Publishers, New York.
Cline, William R. 2000. “The Management of FinancialCrises,” paper prepared for Kiel Week Conference 2000,“The Role of the Private Sector in Resolving FinancialCrises in Emerging Markets,” Woodstock, Vermont, Na-tional Bureau of Economic Research, October 19–21.
Daly, H. 2000. “Globalization,” presented at the 50th An-niversary Conference of the Aspen Institute, Aspen,Colorado, August.
Demirgüç-Kunt, Asli, and Vojislav Maksimovic. 1998.“Law, Finance and Firm Growth.” Journal of Finance53(6): 2107–37.
Denizer, Cevdet, Murat F. Iyigun, and Ann L. Owen. 2000.“Finance and Macroeconomic Volatility.” DiscussionPaper. Board of Governors of the Federal Reserve Sys-tem, Washington, D.C.
Diamond, Douglas. 1984. “Financial Intermediation andDeregulated Monitoring.” Review of Economic Stud-ies 51(3): 393–414.
81

G L O B A L D E V E L O P M E N T F I N A N C E
Diamond, Douglas W., and Robert E. Verrecchia. 1982.“Optimal Managerial Contracts and Equilibrium Se-curity Prices.” Journal of Finance 37(2): 275–87.
Djankov, Simeon, and Bernard Hoekman. 2000. “ForeignInvestment and Productivity Growth in Czech Enter-prises.” World Bank Economic Review 14(1): 49–64.
Easterly, William. 2000. “The Lost Decades . . . and theComing Boom? Policies, Shocks, and DevelopingCountries’ Stagnation 1980–1998.” World Bank,Washington, D.C. Processed.
Easterly, William, and Ross Levine. 2000. “It’s Not FactorAccumulation: Stylized Facts and Growth Models.”World Bank, Washington, D.C. Processed.
Easterly, William, Roumeen Islam, and Joseph Stiglitz. 1999.“Shaken and Stirred: Explaining Growth Volatility.”World Bank, Washington, D.C. Processed.
Edison, H. 2000. “Do Indicators of Financial Crises Work?An Evaluation of an Early Warning System.” Interna-tional Finance Discussion Paper 675. Board of Gover-nors of the Federal Reserve System, Washington, D.C.
Edwards, Sebastian. 2000. “Capital Flows and EconomicPerformance: Are Emerging Economies Different?”University of California at Los Angeles. Processed.
Eichengreen, Barry. 1999. Toward a New International Fi-nancial Architecture: A Practical Post-Asia Agenda.Washington, D.C.: Institute for International Economics.
_______. 2000. “Capital Account Liberalization: What DoCross-Country Studies Tell Us?” University of Califor-nia, Berkeley. Processed.
Feldstein, Martin. 1994. “The Effects of Outbound ForeignDirect Investment on the Capital Stock.” NBER Work-ing Paper 4668. National Bureau of Economic Re-search, Cambridge, Mass.
_______. 1998. “Self Protection for Emerging MarketEconomies.” NBER Working Paper 6907. NationalBureau of Economic Research, Cambridge, Mass.
Feldstein, Martin, and Charles Horioka. 1980. “DomesticSavings and International Capital Flows.” EconomicJournal 90(358): 314–29.
Ferns, Henry S. 1960. Britain and Argentina in the Nine-teenth Century. Oxford: Clarendon Press.
Frankel, Jeffrey A. 1999. “No Single Currency Regime isRight for All Countries or At All Times.” NBER Work-ing Paper 7338. National Bureau of Economic Re-search, Cambridge, Mass.
Gerschenkron, A. 1952. “Economic Backwardness in His-torical Perspective.” In B. F. Hoselitz, ed., The Progressof Underdeveloped Areas. Chicago: University ofChicago Press.
Grilli, Vittorio, and Gian Maria Milesi-Ferretti. 1995. “Eco-nomic Effects and Structural Determinants of CapitalControls.” Staff Papers 42: 517–51. InternationalMonetary Fund, Washington.
Gupta, Poonam, Deepak Mishra, and Ratna Sahay. 2000.“Output Response During Currency Crises.” WorldBank, Washington, D.C. Processed.
Haber, Steven H. 1991. “Industrial Concentration and theCapital Markets: A Comparative Study of Brazil, Mex-ico and the United States, 1830–1930.” Journal of Eco-nomic History 51: 559–80.
Haddad, Mona, and Ann Harrison. 1993. “Are There Posi-tive Spillovers from Direct Foreign Investment?” Jour-nal of Development Economics 42: 51–74.
International Monetary Fund. Various years. InternationalFinancial Statistics. Washington, D.C.
_______. 2000. International Capital Markets. Washington,D.C.
Kaminsky, Graciela L., and Carmen L. Reinhart. 1999. “TheTwin Crises: The Causes of Banking and Balance-of-Payments Problems.” American Economic Review89(3): 473–500.
Kaminsky, Graciela L., and Sergio L. Schmukler. 1999.“What Triggers Market Jitters? A Chronicle of theAsian Crisis.” Journal of International Money and Fi-nance 18(4): 537–60.
King, Robert G., and Ross Levine. 1993. “Finance andGrowth: Schumpeter Might Be Right.” QuarterlyJournal of Economics 108: 717–37.
Kinoshita, Yuko. 1998. “Technology Spillovers throughForeign Investment.” CERGE-EI. Working Paper Se-ries. No. 139, 1–37. December.
Klein, Michael. 2000. “Foreign Direct Investment andPoverty Reduction.” Foreign Investment Advisory Ser-vice, World Bank, Washington, D.C. Processed.
Klenow, Peter J., and Andres Rodriguez-Clare. 1997. “TheNeoclassical Revival in Growth Economics: Has ItGone Too Far?” In NBER Macroeconomics Annual.Cambridge, Mass.: MIT Press.
Kletzer, Kenneth, and Ashoka Mody. 2000. “Will Self-Protection Policies Safeguard Emerging Markets fromCrises?” In Charles Adams, Robert E. Litan, andMichael Pomerleano, eds., Managing Financial andCorporate Distress: Lessons from Asia, WashingtonD.C.: Brookings Institution Press.
Kokko, Ari, Ruben Tansini, and Mario C. Zejan. 1996.“Local Technological Capability and ProductivitySpillovers from FDI in the Uruguayan ManufacturingSector.” Journal of Development Studies 32(April):602–11.
Levine, Ross. 2000. “Financial Development and EconomicGrowth.” IMF Institute Economics Training ProgramSeminar. March.
Levine, Ross, and David Renelt. 1992. “A Sensitivity Analy-sis of Cross-Country Growth Regressions.” AmericanEconomic Review 82(4): 942–63.
Lewis, Arthur W. 1954. “Economic Development with Un-limited Supplies of Labor.” Manchester School of Eco-nomic and Social Studies 22(2): 139–91.
Lucas, Robert E., Jr. 1990. “Why Doesn’t Capital Flowfrom Rich to Poor Countries?” American EconomicReview Papers and Proceedings 80: 92–96.
Marichal, Carlos. 1989. A Century of Debt Crises in LatinAmerica: From Independence to the Great Depression,1820–1930. Princeton, N.J.: Princeton University Press.
McKinnon, Ronald I., and Huw Pill. 1997. “Credible Eco-nomic Liberalizations and Overborrowing.” Amer-ican Economic Association Papers and Proceedings.(January).
Mody, Ashoka, and Fang-Yi Wang. 1997. “ExplainingIndustrial Growth in Coastal China: Economic Re-
82
I N T E R N A T I O N A L C A P I T A L F L O W S A N D E C O N O M I C G R O W T H
forms . . . and What Else?” World Bank Economic Re-view 11(2): 293–325.
O’Rourke, Maurice, and Jeffrey Williamson. 1999. Global-ization and History: The Evolution of a Nineteenth Cen-tury Atlantic Economy. Cambridge, Mass.: MIT Press.
Pindyck, Robert S. 1991. “Irreversibility, Uncertainty andCyclical Investment.” Journal of Economic Literature29(3): 1110–48.
The PRS Group. Various years. International Country RiskGuide. East Syracuse, N.Y.
Rajan, Raghuram G., and Luigi Zingales. 1998. “FinancialDependence and Growth.” American Economic Re-view 88(3): 559–86.
Ramey, Gary, and Valerie Ramey. 1995. “Volatility andGrowth.” American Economic Review 85: 1138–51.
Rodrik, Dani. 1998. “Who Needs Capital-Account Con-vertibility?” In Stanley Fischer and others, eds., Shouldthe IMF Pursue Capital-Account Convertibility? Es-says in International Finance 207. Department of Eco-nomics, Princeton University, Princeton, N.J.
Romer, Paul. 1993. “Idea Gaps and Object Gaps in Eco-nomic Development.” Journal of Monetary Economics32(3): 543–73.
Sarno, Lucio, and Mark Taylor. 1999. “Hot Money, Ac-counting Labels and the Permanence of Capital Flowsto Developing Countries: An Empirical Investigation.”Journal of Development Economics 59(2): 337–64.
Schive, Chi, and Badiul A. Majumder. 1990. “Direct For-eign Investment and Linkage Effects: The Experienceof Taiwan.” Canadian Journal of Development Studies11(2): 325–42.
Scott, Andrew, and Harald Uhlig. 1999. “Fickle Investors:An Impediment to Growth?” CEPR Discussion Paper2071. Center for Economic Policy Research, London.
Summers, Lawrence. 2000. “International Financial Crises:Causes, Prevention, and Cures.” American EconomicReview Papers and Proceedings 90(2): 1–16.
Taylor, Alan. 1996. “Convergence and International FactorFlows in Theory and History.” NBER Working Paper5798. National Bureau of Economic Research, Cam-bridge, Mass.
United Nations Conference on Trade and Development2000. World Investment Report 2000: Cross-BorderMergers and Acquisitions and Development. NewYork and Geneva.
Wacziarg, Romain. 1998. “Measuring the Dynamic Benefitsfrom Trade.” Policy Research Working Paper 2001.World Bank, Washington, D.C.
Wheeler, David. 2001. “Racing to the Bottom? Foreign In-vestment and Air Pollution in Developing Countries.”World Bank Development Research Group WorkingPaper 2524, Washington, D.C.
World Bank. Various years. Global Development Finance:Country Tables. Washington, D.C.
_______. Various years. World Development Indicators.Washington, D.C.
_______. 1993. The East Asian Miracle: Economic Growthand Public Policy. New York: Oxford University Press.
_______. 1997. Global Economic Prospects. Washington,D.C.
_______. 1998/99. Global Economic Prospects. Washing-ton, D.C.
_______. 1999. Global Development Finance. Washington,D.C.
_______. 1999. World Development Indicators. Washing-ton, D.C.
_______. 2000. Global Development Finance. Washington,D.C.
_______. 2000. Securing Our Future in a Global Economy.World Bank Latin America and Caribbean Studies.
_______. 2001. Finance for Growth: Policy Choices in aVolatile World. World Bank Policy Research Report.
83
Related Documents