Interest Groups, County Characteristics, and Local Growth Management Policy Instruments Jeongho (John) Lee* Abstract: The primary intent of this study is to investigate what factors drive local governments to implement growth management policy instruments. To answer this research question, this study chose Colorado counties, where local governments voluntarily adopt and implement growth management policy instruments. That means that a wide variation in growth management policy instrument implementation appears among Colorado’s local governments. That is to say, some counties more actively implement growth management policy instruments while the rest of counties do not. Utilizing a statistical tool, this article tests seven hypotheses based on the interest group model and county characteristics to empirically explicate this uneven implementation phenomenon of growth management policy instruments across Colorado. The analyzed results prove that counties with many anti-growth management policy interest groups are less likely to implement growth management policy instruments. In addition, the analyzed results demonstrate both that counties earning more income from tourism and counties with highly educated residents are more likely to implement growth management policy instruments, while counties supporting the Democratic Party are less likely to implement growth management policy instruments. Keywords: interest groups, county characteristics, regulatory policy, smart growth INTRODUCTION Growth management policy has produced its diverse instruments that control urban sprawl and preserve green environments since the first generation of growth management policy had appeared in the United States of America (Feiock, 2004; Navarro & Carson, Manuscript received September 29, 2015; out for review October 30, 2015; review completed November 26, 2015; accepted December 10, 2015. The Korean Journal of Policy Studies, Vol. 30, No. 3 (2015), pp. 41-61. © 2015 by the GSPA, Seoul National University * Jeongho (John) Lee received his PhD in Public Affairs from the University of Colorado Denver. He is a lecturer in the Department of Public Administration at Kangwon National University, Konkuk University, and Kwangwoon University. E-mail: [email protected].

Welcome message from author
This document is posted to help you gain knowledge. Please leave a comment to let me know what you think about it! Share it to your friends and learn new things together.
Transcript
Interest Groups, County Characteristics, and Local Growth Management Policy Instruments
Jeongho (John) Lee*
Abstract: The primary intent of this study is to investigate what factors drivelocal governments to implement growth management policy instruments. Toanswer this research question, this study chose Colorado counties, where localgovernments voluntarily adopt and implement growth management policyinstruments. That means that a wide variation in growth management policyinstrument implementation appears among Colorado’s local governments. Thatis to say, some counties more actively implement growth management policyinstruments while the rest of counties do not. Utilizing a statistical tool, this article tests seven hypotheses based on the interest group model and countycharacteristics to empirically explicate this uneven implementation phenomenonof growth management policy instruments across Colorado. The analyzedresults prove that counties with many anti-growth management policy interestgroups are less likely to implement growth management policy instruments. Inaddition, the analyzed results demonstrate both that counties earning moreincome from tourism and counties with highly educated residents are more likelyto implement growth management policy instruments, while counties supportingthe Democratic Party are less likely to implement growth management policyinstruments.
Keywords: interest groups, county characteristics, regulatory policy, smartgrowth
INTRODUCTION
Growth management policy has produced its diverse instruments that control urbansprawl and preserve green environments since the first generation of growth managementpolicy had appeared in the United States of America (Feiock, 2004; Navarro & Carson,
Manuscript received September 29, 2015; out for review October 30, 2015; review completedNovember 26, 2015; accepted December 10, 2015.
The Korean Journal of Policy Studies, Vol. 30, No. 3 (2015), pp. 41-61.© 2015 by the GSPA, Seoul National University
* Jeongho (John) Lee received his PhD in Public Affairs from the University of Colorado Denver.He is a lecturer in the Department of Public Administration at Kangwon National University,Konkuk University, and Kwangwoon University. E-mail: [email protected].

1991; Steel & Lovrich, 2000). Influential growth management policy instruments—open space, zoning, and development impact fees, and so forth—attempt to protectenvironmentally sensitive lands, maintain the quality of agricultural lands, and developeco-friendly environments (DeGrove, 1984, 2005; Kelly, 1993).
Research relevant to growth management policy has been blossoming in policyprocess studies—formulation, implementation, and evaluation areas (Anthony, 2004;Hamin, Steere, & Sweetser, 2006; Lubell, Feiock, & Ramirez, 2005). This study focuseson examining mechanisms of a local growth management policy implementationstage. To concentrate on this research goal, this article centers on the case of Coloradocounties. The census delineates that Colorado has experienced a rapid populationincrease of one million since the 1990s. This mushroom growth has made Colorado’slocal governments consider resolving reduced green space issues, unaffordable housingissues, and traffic problems (Ingram, Carbonell, Hong, & Flint, 2009; Wallis, 2012). Agrowth management policy instrument is a pivotal strategy to resolve these socialissues across Colorado.
Colorado started the first trial to prevent environmental destruction from unplannedand rapid growth in the mid-1960s. However, the style of its growth management policyhas been differently developed compared to other states (White & Dahl, 2001). Coloradodoes not pursue a top-down growth management policy ordinance by not adopting thestate growth management law (Colorado Department of Local Affairs, 2010; Ingram,et al., 2009). In the case of implementation of growth management policy instruments,this situation allows local governments to make autonomous and voluntary environmentaldecisions in that local governments can choose and implement their own growth man-agement policy instruments without direct control and guidance of state governments.Colorado is a typical state pursuing a bottom-up style in conducting growth managementpolicy strategies (Wallis, 2012). Therefore, Colorado is a good case for studying themechanisms of local growth management policy instrument implementation.
For decades, environmental policy scholars have questioned under what factorslocal governments adopt or implement growth management policy instruments. Toseek answers to this research question, this study focuses on investigating the associa-tion between growth management policy instrument implementation and 1) interestgroups and 2) Colorado county characteristics. This article is composed of five partsexcluding the part of introduction. The first part describes the general content of growthmanagement policy across the USA and Colorado. The second part explains sevenhypotheses related to the interest group model and county characteristics. The thirdpart accounts for the content of methodology used in this study. The fourth part interpretsthe statistical results. The last part mentions conclusion and proposes some implicationsfor future studies.
42 Interest Groups, County Characteristics, and Local Growth Management Policy Instruments
The Korean Journal of Policy Studies
OVERVIEW AND EXAMPLE OF GROWTH MANAGEMENT POLICY
Regarding the general content of growth management policy, Hawaii is recognizedas the first state that adopted growth management policy by passing a land use law in1961 (Anthony, 2004; Kelly, 1993). Howell-Moroney (2007, 2008) delineates that thelaw gives its State Land Use commission the power to determine the location, use, andtiming of new development across the state. That is to say, the primary goal of growthmanagement policy is to prevent rapid growth and unplanned development of jurisdic-tions—counties and cities (Dierwechter, 2008). After Hawaii passed its growth man-agement law, 12 states enacted their own growth management legislations (Wallis,2012).
All growth management laws focus on decreasing environmental costs and negativeexternalities occurring from rapid growth and environmental destruction. For this,their instruments—population growth caps, residential building permit caps, anddevelopment moratoria—are designed for smart growth of jurisdictions that wouldprovide residents with more pleasant environments (Howelll-Moroney, 2007). Anthony(2004) and Navarro and Carson (1991) evaluate that growth management policyacross the USA has been successful in helping jurisdictions’ sustainable growth andproviding their residents with eco-friendly environments.
Scholars (Feicok, 2004; Navarro & Carson, 199; Steel & Lovrich, 2000) who havebeen dedicated to growth management policy studies categorize growth managementpolicy as two generations. The period of the first generation covered the 1970s. Itsmain goal was to control the rate of residential housing construction on the supplyside. Its instruments include restriction of apartments, control on floor area minimum,open space, urban growth boundary, and zoning. The period of the second generationcovered the 1980s and the 1990s. It was usually designed to charge new entrants suchas new residents and developers for using infrastructure and public facilities. Its maininstruments are development impact fees.
Colorado is the eighth state that has the largest land among 50 states (Ingram et al.,2009). Coloradans boast about spectacular scenes that almost 50 peaks over 14,000feet provide. Many tourists visit Colorado to look around these natural marvels andenjoy outdoor sports every year. Aguilera (2008) reported that there were approxi-mately 28 million tourists who took overnight travels to Colorado in 2007. However,Coloradans worry that Colorado’s growth has been very rapid since the 1980s. Colorado’s population was over five million in 2010. Since 1990, Colorado’ populationhas increased about one million (Wallis, 2012). The census indicates that Coloradowas the third fastest growing state in the nation at the end of the 20th century. This
Interest Groups, County Characteristics, and Local Growth Management Policy Instruments 43
The Korean Journal of Policy Studies

rapid growth has caused some negative issues such as a lack of affordable housing,traffic congestion, and a loss of green space. These negative results caused by rapidgrowth made Coloradans consider pursuing smart growth.
Colorado voters have generally supported regional environmental policies, whichprovide local governments with more discretion on environmental policy choices, ratherthan state-centered environmental policies by not signing the growth management lawat the state level unlike other states (Anderson, 1999; Ingram et al., 2009; Porter,1999). That means that the unique style of Colorado’s growth management policy is todelegate power to local governments first. This is commonly called an autonomousstyle enhancing voluntary regionalism (Ingram et al., 2009).
The voluntary tradition shown in the direction of Colorado’s environmental policieswas based on the so-called the Local Government Land Use Control Enabling Act of Colorado (C.R.S. 29-20-101), which was enacted in 1974. It has encouraged localgovernments to autonomously adopt and implement growth management policyinstruments by emphasizing that all local governments in Colorado are not mandatedby state laws when they adopt and implement growth management policy instrumentsrelated to land use (CDLA, 2010; Ingram et al., 2009). To give local governmentsmore authorities to control environmental policies, former governor Romer proposedthe Smart Growth Amendment (Amendment 24) in the mid-1990s. However, it was notpassed by the Colorado Senate in 2000 (Ingram et al., 2009; Wasserman, 2003). Afterthat, former Governor Owens, Romer’s successor, made a critical road map for growthmanagement policy that enables local governments to make and select proper instru-ments to manage growth in their territories voluntarily. To support local governments’voluntarism, he established the Office of Smart Growth in the Colorado Department ofLocal Affairs (Ingram et al., 2009). This political history of Colorado’s environmentalpolicies helps local governments adopt and implement their environmental policyinstruments by themselves.
Colorado’s growth management policy has been grown on the voluntarism. Thismeans that what local governments implement a growth management policy instrumentis affected by jurisdiction’s internal characteristics rather than state’s pressure. Mean-while, the voluntarism circumstance of Colorado leads a broad variation in the imple-mentation of growth management policy instruments among Colorado’s counties. Toanswer why this variation in the implementation of growth management policy instru-ments exists among Colorado counties, this article focuses on development impactfees, which are popular growth management policy instruments in Colorado.
As of 2013, the Colorado development impact fees have been broadly implementedat the county level. However, this does not mean that all of the Colorado countiesevenly implement development impact fees. Namely, some counties more actively
44 Interest Groups, County Characteristics, and Local Growth Management Policy Instruments
The Korean Journal of Policy Studies

implement development impact fee policy by using several development impact feeswhile other counties do not. This situation is translated to one research question as follows: under what circumstances the uneven growth management policy instrumentimplementation emerges among Colorado’s counties? The next section employs theinterest group model and county characteristics to answer this research question.
THEORETICAL APPROACHES TO GROWTH MANAGEMENT POLICY INSTRUMENTS
This study utilizes seven explanatory variables relevant to interest groups, Coloradocounty characteristics, and control variables. No one doubts that interest groups areprimary policy actors who affect mechanisms of the policy process (Chari, Hogan, &Murphy, 2010; Lee, 2014). Several scholars (Loomis & Cigler, 2006; Ramirez, 2009)demonstrate that a critical role of interest groups is usually shown in the growth management policy process as well. This study expects that counties with many anti-growth management policy interest groups are less likely to implement growth manage-ment policy instruments while counties with many pro-growth management policyinterest groups are more likely to implement growth management policy instruments.Meanwhile, county characteristics embrace both socioeconomic and demographic factors, which are essential factors when studying why jurisdictions—states, counties,cities, school districts, and towns—implement a specific policy instrument (Berry &Berry, 1990; Mintrom, 2000; Ostrom, 2007, 2011; Sabatier & Weible, 2007). Theseexplanatory variables are expected to provide this study with accurate answers to thisstudy’s research question: what factors affect Colorado counties to more activelyimplement growth management policy instruments?
Interest Groups
Many scholars (Fleischmann & Pierannunzi, 1990; Loomis & Cigler, 2006; Lubellet al., 2005; Nownes 2001; Ramirez, 2009) do not hesitate to argue that interest groupsare pivotal policy actors in the public policy process. In America, their proliferationhas begun in the 1960s and their activities have still been viable up until now (Nownes& Cigler, 2006). Interest groups’ roles have been getting more powerful, and theyactively lobby decision-makers to choose policies they prefer. It is possible due tointerest groups’ power and pressure, which are increased through media and protests.Mahood (2000) supports this view by arguing that policy outcomes are the products ofinterest groups’ activities at the main points of the public policy process.
Interest Groups, County Characteristics, and Local Growth Management Policy Instruments 45
The Korean Journal of Policy Studies

Especially, interest groups that strongly insist on their own property rights areinfluential policy actors in policy formulation and implementation (Lee, 2013; Lubell,et al., 2005). If homeowners’ and developers’ property is sincerely influenced byeither pro-development policies to foster economic development or pro-environmentalregulations to conserve environments, both homeowners and developers would notwant to formulate and implement any policies that depreciate the value of their ownproperty (Fleischmann & Pierannunzi, 1990). Moreover, when there are competinginterest groups that have opposite opinions on the same policy, their reflections on thatpolicy are shown in different actions to maximize their own benefits. For instance,developers and homeowners are recognized as anti-environmental and pro-environmentalinterest groups respectively. Strict environmental regulations toward developers caninterrupt increasing their property’s value. On the other hand, strong pro-developmentpolicies to homeowners decrease value of homeowners’ property by destroying residential eco-friendly ambience. Therefore, to understand mechanisms of the growthmanagement policy process completely, it is natural for us to consider the role of interestgroups that are involved in the growth management policy process.
Interest groups that want to keep and increase their property value are closely relatedto the adoption and implementation of local governments’ growth management policybecause growth management policy is a regulatory policy that is most employed bygovernment planning agencies to control where and how land is developed and whatresources are allocated for community services (Lubell et al., 2005). As previouslymentioned, two styles of interest groups—pro-environment (pro-growth managementpolicy) and pro-development (anti-growth management policy)—are involved in theimplementation of growth management policy instruments. In the case of Colorado,Cronin and Loevy (1993) mention that there are both development interest groups andenvironment interest groups relevant to growth management policy as follows: “thepeople of Colorado invariably divide into two groups. One group believes Colorado isobliged to use its resources to provide jobs and expand business opportunities. Theother believes that preservation and conservation, and regulations that limit developmentare both desirable and, in the long run, in the vital interest of the state” (p. 10). Giventheir observation, it is possible to classify the former people group as a pro-development(anti-growth management policy) interest group and sort the latter people group as apro-environment (pro-growth management policy) interest group.
Fischel (2001) identifies homeowners as pro-environmental interest groups. Home-owner interest groups can motivate residents who own houses to do greater politicalactivities by emphasizing better economic profit, which occurs due to their communities’housing supply limit, to residents. Therefore, it is natural that powerful pro-environment(pro-growth management policy) interest groups connect with local government decision
46 Interest Groups, County Characteristics, and Local Growth Management Policy Instruments
The Korean Journal of Policy Studies

makers to protect their residential circumstances and improve their property rights.According to Cox (1982), homeowners are positively associated with greater levels ofmobilization against growth in communities. Namely, they are main policy actors in theNot-In-My-Back-Yard (NIMBY) movement. This means that interest groups supportinga value of pro-environment direction in public policy have a positive relationship withthe implementation of growth management policy instruments.
Pro-development (anti-growth management policy) interest groups are regarded asbeing active and regular participants in local politics because business interests areconcerned with the specific location of growth (Logan & Molotch, 1987). Clingermayerand Feiock (2001) indicate pro-development groups as anti-environment groups.Developers, realtors, contractors, construction trade unions, and financial institutionsare examples of these groups (Lubell et al., 2005). Development interest groups arewell organized political organizations with active representatives that deliver theirpolitical opinions to decision-makers. This situation gives development interest groupsgood opportunities in translating their preferences into policies. Another advantage thatdevelopment interest groups possess is their perceived importance to local economies(Feiock & Kim, 2000). Several studies suggest a substantial degree of cooperationbetween business and policy regimes as an alliance between government officials andinterest groups from the development and real estate/finance industries. This alliancemight have more power in communities that desire more economic development.Development and growth interest groups would be particularly influenced by eco-friendly growth management policy instruments. Any changes that reduce developmentopportunities will disadvantage the development and growth interest groups. Therefore,it is expected that interest groups supporting a value of pro-development direction inpublic policy have a negative relationship with the implementation of growth manage-ment policy instruments.
County Characteristics
Several classic studies demonstrate that growth management policy is influencedby several jurisdiction characteristics such as the unemployment rate of jurisdictions, a rapid population growth rate of jurisdictions, and the residents’ educational level in jurisdictions. It is fundamental for researchers to test the impetus of jurisdiction characteristics in examining mechanisms of the policy process (Bushouse, 2011; Lee,2014; Ostrom, 2007). Mazmanian and Sabatier (1980) also propose that jurisdictions’socio-economic and demographic factors are a good set of explanatory factors thathelp examine mechanisms of local institutional choice and use. Thus, based on theseseveral scholars’ common suggestions, this article employs three independent variables
Interest Groups, County Characteristics, and Local Growth Management Policy Instruments 47
The Korean Journal of Policy Studies
including some socioeconomic and demographic factors in seeking answers to theresearch question.
Socioeconomic Factors
A residents’ educational level factor is included to explain why the variation in thegrowth management policy instrument implementation exists among Colorado counties.That is why some scholars (Gerber & Phillips, 2003; Lubell et al., 2005; Mohamed,2008) prove that highly educated residents are more likely to be interested in theircommunity problems and make discreet agreements with local land development topreserve their pleasant residential environments. Thus, it is predicted that jurisdictionswith many highly educated residents are more likely to welcome the implementationof growth management policy instruments.
Several scholars (Feiock & Kim, 2000; Steel & Lovrich, 2000; Zahariadis & Morgan,2005) find that jurisdictions with a poor economic situation are more likely to welcomepro-development policies to offer their residents more jobs and solve their fiscal stressresulting from weaker tax bases and the lack of revenue. Limiting growth means job loss and profit decrease and may hurt the poor more than anyone else. Inversely,Feiock (2004) and Howell-Moroney (2004) indicate that jurisdictions with a good economic situation do not want to develop their areas to preserve community characterand eco-friendly circumstances. Their studies support that residents living in jurisdic-tions with a good economic situation prefer eco-aesthetics. People who pursue eco-aesthetics do not like industrial development that causes noxious pollutants, bringsunexpected neighbors, and generates traffic problems to their community. Therefore,jurisdictions with a poor economic situation are less likely to welcome the implemen-tation of growth management policy instruments.
Demographic Factors
Many studies (Baldassare & Wilson, 1996; Diaz & Green, 2001; Dowall, 1980;Feiock, Tavares, & Lubell, 2008; Protash & Baldassare, 1983) have proved that popu-lation factors—density, size, and rate of increase—provide good explanatory reasonsabout why jurisdictions implement growth management policy instruments. Amongthem, Protash and Baldassare’s (1983) research demonstrates that residents that experi-enced unpleasant life circumstances—serious traffic jams and expensive infrastructurecosts—urge their local governments to control their jurisdictions’ rapid growth. Somescholars (Feiock et al., 2008; Protash & Baldassare, 1983) demonstrate that jurisdictions’population growth positively affects the use of growth management policy instruments.
48 Interest Groups, County Characteristics, and Local Growth Management Policy Instruments
The Korean Journal of Policy Studies
Thus, it is hypothesized that jurisdictions with large population growth are more likelyto welcome the implementation of growth management policy instruments.
Control Variables
Growth management policy leads local governments—counties and cities—to pursuesmart growth making a balance between environmental conservation and economicdevelopment. Generally speaking, local governments expect to control rapid growthand provide their residents with better eco-friendly circumstances in their own territorythrough using growth management policy instruments. Thus, the main goal of growthmanagement policy is closer to environment conservation rather than economic devel-opment in a jurisdiction (Pallagst, 2007). This means that growth management policyis useful for jurisdictions that earn much money from tourism because growth man-agement policy instruments help conserve a nature and provide residents and travelerswith eco-friendly facilities. Namely, jurisdictions whose economy strongly depends ontourism can make their economic situations better by implementing growth managementpolicy instruments. Therefore, it is predicted that jurisdictions that earn much moneyfrom tourism are more likely to welcome the implementation of growth managementpolicy instruments.
The political tendency of a jurisdiction plays a pivotal role in explaining policy for-mulation and implementation mechanisms (Mintrom, 2000; Teske, 1991). Mohamed(2008) also recommends that it is reasonable to test a jurisdiction’s political tendencyto more accurately know about mechanisms of growth management policy instruments.He declares that Democrats support environmental conservation through governmentregulations while Republicans advocate economic development policies that provideindividuals with economic profit. Therefore, it is predicted that jurisdictions support-ing the Democratic Party are more likely to welcome the implementation of growthmanagement policy instruments.
METHODOLOGY
This study targets to empirically investigate what factors drive Colorado countiesto implement growth management policy instruments. An overall equation model iscompleted by the seven hypotheses developed in the previous section. The final equationmodel is as follows:
Interest Groups, County Characteristics, and Local Growth Management Policy Instruments 49
The Korean Journal of Policy Studies
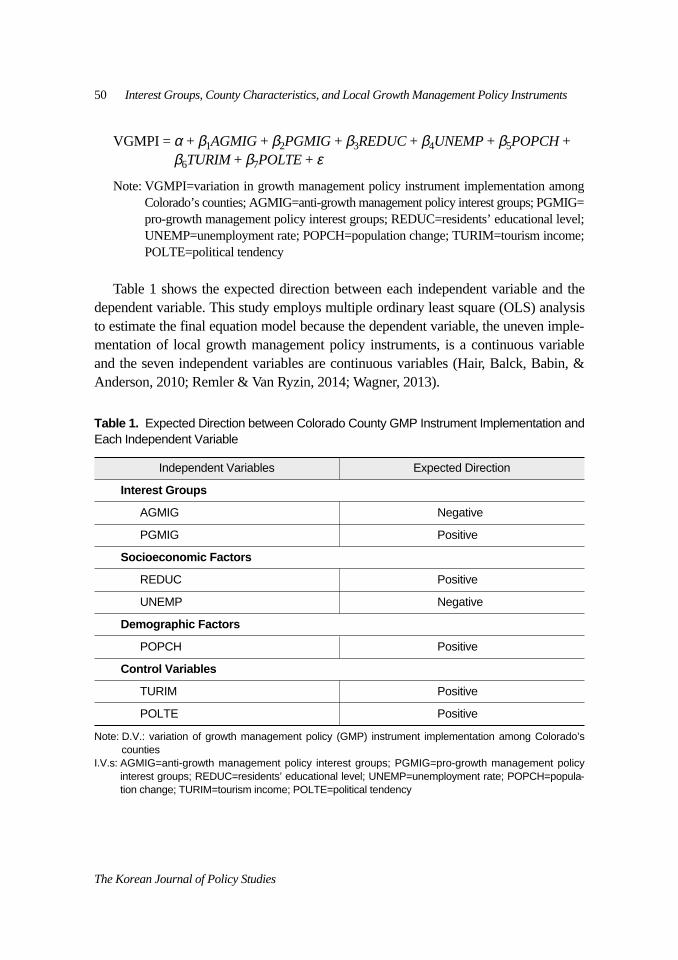
VGMPI = α + β1AGMIG + β2PGMIG + β3REDUC + β4UNEMP + β5POPCH +β6TURIM + β7POLTE + ε
Note: VGMPI=variation in growth management policy instrument implementation amongColorado’s counties; AGMIG=anti-growth management policy interest groups; PGMIG=pro-growth management policy interest groups; REDUC=residents’ educational level;UNEMP=unemployment rate; POPCH=population change; TURIM=tourism income;POLTE=political tendency
Table 1 shows the expected direction between each independent variable and thedependent variable. This study employs multiple ordinary least square (OLS) analysisto estimate the final equation model because the dependent variable, the uneven imple-mentation of local growth management policy instruments, is a continuous variableand the seven independent variables are continuous variables (Hair, Balck, Babin, &Anderson, 2010; Remler & Van Ryzin, 2014; Wagner, 2013).
50 Interest Groups, County Characteristics, and Local Growth Management Policy Instruments
The Korean Journal of Policy Studies
Table 1. Expected Direction between Colorado County GMP Instrument Implementation andEach Independent Variable
Independent Variables Expected Direction
Interest Groups
AGMIG Negative
PGMIG Positive
Socioeconomic Factors
REDUC Positive
UNEMP Negative
Demographic Factors
POPCH Positive
Control Variables
TURIM Positive
POLTE Positive
Note: D.V.: variation of growth management policy (GMP) instrument implementation among Colorado’scounties
I.V.s: AGMIG=anti-growth management policy interest groups; PGMIG=pro-growth management policyinterest groups; REDUC=residents’ educational level; UNEMP=unemployment rate; POPCH=popula-tion change; TURIM=tourism income; POLTE=political tendency
Data Collection
The author collected the main data of the county growth management policy throughan e-mail survey and the 2010 Colorado county land use survey, which was created bythe Colorado Department of Local Affairs (CDLA). The 2010 Colorado County LandUse survey was completed based on 45 counties that responded to the CDLA survey.The author conducted a survey to make up for the 2010 CDLA survey in 2013 and e-mailed 19 counties that did not answer the 2010 CDLA survey. The survey was e-mailed to a staff member in charge of growth management policy or land use policyin the 19 counties.1 Based on these two data sources, the author was able to collect thedata about the growth management policy information of 60 counties. The four countiesthat did not respond to the e-mail survey were treated as missing cases in the finaldataset. They were Baca, Kit Carson, Mineral, and Sedgwick counties, which aresmall counties having a population of below 9,000. The final dataset including all ofthe other variables was completed in December, 2013.
Dependent Variable
The dependent variable of this study is the variation of growth management policyinstrument implementation of Colorado counties. In order to measure the dependentvariable, this study utilizes development impact fees, which are a representative growthmanagement policy instrument among several growth management policy instrumentsthat Colorado’s local governments have used.2 The final dataset includes the informationabout the development impact fees of 60 Colorado counties.
Colorado supports that local governments autonomously and voluntarily choose
Interest Groups, County Characteristics, and Local Growth Management Policy Instruments 51
The Korean Journal of Policy Studies
1. The author conducted this e-mail survey in June, 2013. The e-mail survey questionnaire isas follows:
Please indicate where your county uses Development Impact Fees from the areas listedbelow.1) affordable housing 2) fire prevention 3) parks and recreation 4) public facilities 5) publicsafety 6) roads 7) schools 8) sewers 9) storm water management 10) transportation 11)trash 12) water 13) wind farms
or if your county uses Development Impact Fees in other areas, please tell me about thoseother areas.
2. Among several growth management policy instruments, Colorado’s local governments utilize an urban growth boundary (UGB) to control rapid growth of a big city in the metroareas (Wallis, 2012).

and operate development impact fees that charge new entrants—residents and devel-opers—for constructing infrastructure and using public facilities. In October, 2001, theColorado General Assembly passed Senate Bill 15, which was coded as Section 29-20-104.5 of the Colorado Revised Statutes (White & Dahl, 2001). The Coloradostatute defines development impact fees as “any fee, charge, or assessment relating toa capital expenditure which is imposed on land development as a condition of approvalof such land development, as a prerequisite to obtaining a permit or service” (SB 15).White and Dahl (2001) emphasize that its content explicitly draws that local govern-ments can impose development impact fees to new comers or developers with theirleeway. Since Colorado voters passed its development impact fee law, local govern-ments in Colorado voluntarily adopt and implement development impact fees in 13public services—transportation, parks and recreation, affordable housing, public safety,water, storm water management, sewers, schools, wind farms, trash, fire prevention,public facilities, and roads. The dependent variable of this study was measured bydividing the total number of development impact fees that each county uses by the 13development impact fees. Figure 1 describes what areas Colorado counties use develop-ment impact fees. Based on Figure 1, we can know that ten counties use developmentimpact fees for their transportation area and six counties use development impact feesto improve their parks and recreation areas.
52 Interest Groups, County Characteristics, and Local Growth Management Policy Instruments
The Korean Journal of Policy Studies
Figure 1. Development Impact Fees Used by Colorado Counties and Number of CountiesImplementing Development Impact Fees
Note: PR=parks and recreation; PS=public safety; TP=transportation; SW=storm water management; AH=affordable housing; WT=water; OD=other development impact fees.The other development impact fees implemented by Colorado counties are for sewers, schools, windfarms, trash, fire prevention, public facilities, and roads.
Independent Variables
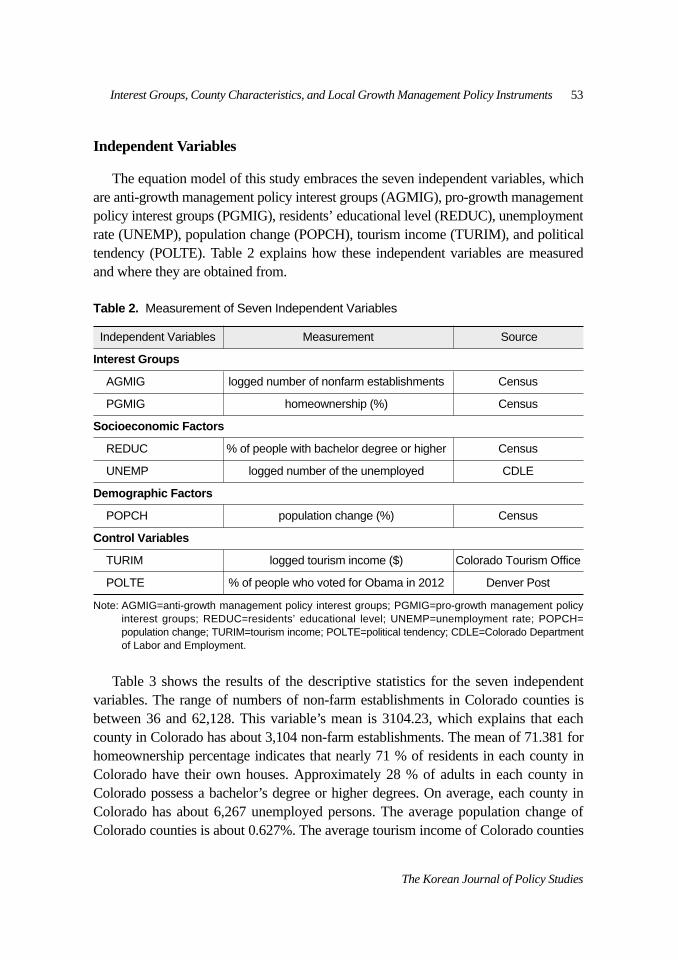
The equation model of this study embraces the seven independent variables, whichare anti-growth management policy interest groups (AGMIG), pro-growth managementpolicy interest groups (PGMIG), residents’ educational level (REDUC), unemploymentrate (UNEMP), population change (POPCH), tourism income (TURIM), and politicaltendency (POLTE). Table 2 explains how these independent variables are measuredand where they are obtained from.
Table 3 shows the results of the descriptive statistics for the seven independentvariables. The range of numbers of non-farm establishments in Colorado counties isbetween 36 and 62,128. This variable’s mean is 3104.23, which explains that eachcounty in Colorado has about 3,104 non-farm establishments. The mean of 71.381 forhomeownership percentage indicates that nearly 71 % of residents in each county inColorado have their own houses. Approximately 28 % of adults in each county in Colorado possess a bachelor’s degree or higher degrees. On average, each county inColorado has about 6,267 unemployed persons. The average population change ofColorado counties is about 0.627%. The average tourism income of Colorado counties
Interest Groups, County Characteristics, and Local Growth Management Policy Instruments 53
The Korean Journal of Policy Studies
Table 2. Measurement of Seven Independent Variables
Independent Variables Measurement Source
Interest Groups
AGMIG logged number of nonfarm establishments Census
PGMIG homeownership (%) Census
Socioeconomic Factors
REDUC % of people with bachelor degree or higher Census
UNEMP logged number of the unemployed CDLE
Demographic Factors
POPCH population change (%) Census
Control Variables
TURIM logged tourism income ($) Colorado Tourism Office
POLTE % of people who voted for Obama in 2012 Denver Post
Note: AGMIG=anti-growth management policy interest groups; PGMIG=pro-growth management policyinterest groups; REDUC=residents’ educational level; UNEMP=unemployment rate; POPCH=population change; TURIM=tourism income; POLTE=political tendency; CDLE=Colorado Departmentof Labor and Employment.
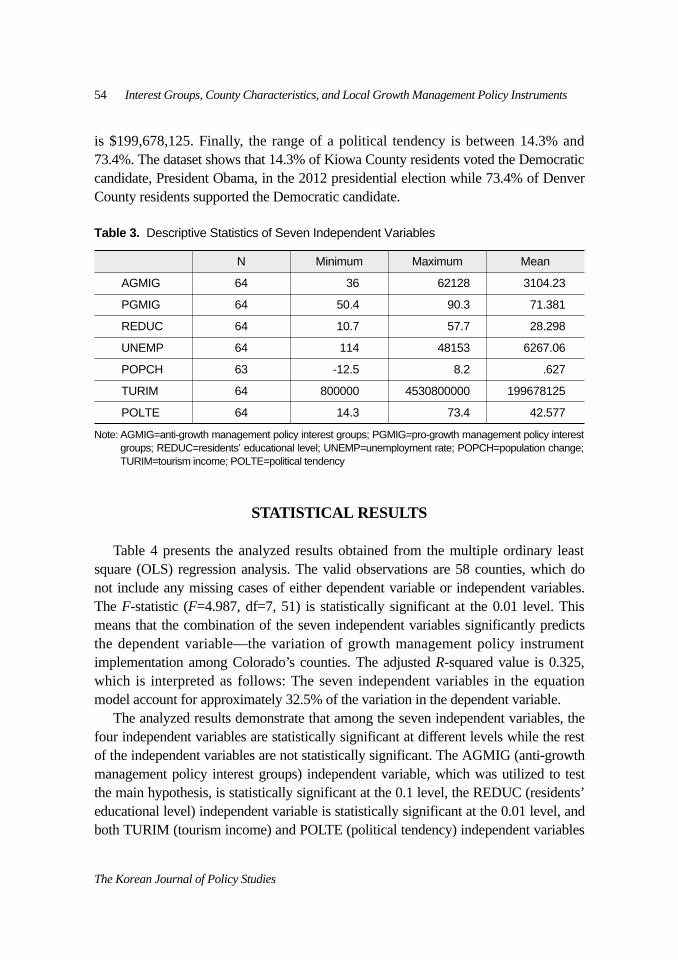
is $199,678,125. Finally, the range of a political tendency is between 14.3% and73.4%. The dataset shows that 14.3% of Kiowa County residents voted the Democraticcandidate, President Obama, in the 2012 presidential election while 73.4% of DenverCounty residents supported the Democratic candidate.
STATISTICAL RESULTS
Table 4 presents the analyzed results obtained from the multiple ordinary leastsquare (OLS) regression analysis. The valid observations are 58 counties, which donot include any missing cases of either dependent variable or independent variables.The F-statistic (F=4.987, df=7, 51) is statistically significant at the 0.01 level. Thismeans that the combination of the seven independent variables significantly predictsthe dependent variable—the variation of growth management policy instrumentimplementation among Colorado’s counties. The adjusted R-squared value is 0.325,which is interpreted as follows: The seven independent variables in the equationmodel account for approximately 32.5% of the variation in the dependent variable.
The analyzed results demonstrate that among the seven independent variables, thefour independent variables are statistically significant at different levels while the restof the independent variables are not statistically significant. The AGMIG (anti-growthmanagement policy interest groups) independent variable, which was utilized to testthe main hypothesis, is statistically significant at the 0.1 level, the REDUC (residents’educational level) independent variable is statistically significant at the 0.01 level, andboth TURIM (tourism income) and POLTE (political tendency) independent variables
54 Interest Groups, County Characteristics, and Local Growth Management Policy Instruments
The Korean Journal of Policy Studies
Table 3. Descriptive Statistics of Seven Independent Variables
N Minimum Maximum Mean
AGMIG 64 36 62128 3104.23
PGMIG 64 50.4 90.3 71.381
REDUC 64 10.7 57.7 28.298
UNEMP 64 114 48153 6267.06
POPCH 63 -12.5 8.2 .627
TURIM 64 800000 4530800000 199678125
POLTE 64 14.3 73.4 42.577
Note: AGMIG=anti-growth management policy interest groups; PGMIG=pro-growth management policy interestgroups; REDUC=residents’ educational level; UNEMP=unemployment rate; POPCH=population change;TURIM=tourism income; POLTE=political tendency
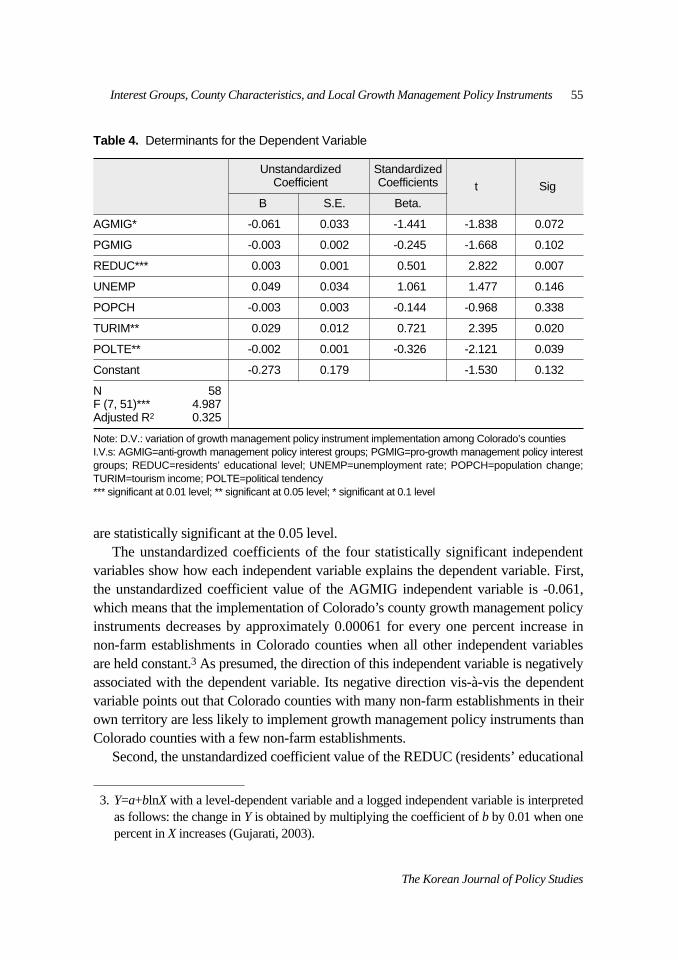
are statistically significant at the 0.05 level.The unstandardized coefficients of the four statistically significant independent
variables show how each independent variable explains the dependent variable. First,the unstandardized coefficient value of the AGMIG independent variable is -0.061,which means that the implementation of Colorado’s county growth management policyinstruments decreases by approximately 0.00061 for every one percent increase innon-farm establishments in Colorado counties when all other independent variablesare held constant.3 As presumed, the direction of this independent variable is negativelyassociated with the dependent variable. Its negative direction vis-à-vis the dependentvariable points out that Colorado counties with many non-farm establishments in theirown territory are less likely to implement growth management policy instruments thanColorado counties with a few non-farm establishments.
Second, the unstandardized coefficient value of the REDUC (residents’ educational
Interest Groups, County Characteristics, and Local Growth Management Policy Instruments 55
The Korean Journal of Policy Studies
3. Y=a+blnX with a level-dependent variable and a logged independent variable is interpretedas follows: the change in Y is obtained by multiplying the coefficient of b by 0.01 when onepercent in X increases (Gujarati, 2003).
Table 4. Determinants for the Dependent Variable
Unstandardized Standardized Coefficient Coefficients t Sig
B S.E. Beta.
AGMIG* -0.061 0.033 -1.441 -1.838 0.072
PGMIG -0.003 0.002 -0.245 -1.668 0.102
REDUC*** 0.003 0.001 0.501 2.822 0.007
UNEMP 0.049 0.034 1.061 1.477 0.146
POPCH -0.003 0.003 -0.144 -0.968 0.338
TURIM** 0.029 0.012 0.721 2.395 0.020
POLTE** -0.002 0.001 -0.326 -2.121 0.039
Constant -0.273 0.179 -1.530 0.132
N 58F (7, 51)*** 4.987Adjusted R2 0.325
Note: D.V.: variation of growth management policy instrument implementation among Colorado’s countiesI.V.s: AGMIG=anti-growth management policy interest groups; PGMIG=pro-growth management policy interestgroups; REDUC=residents’ educational level; UNEMP=unemployment rate; POPCH=population change;TURIM=tourism income; POLTE=political tendency*** significant at 0.01 level; ** significant at 0.05 level; * significant at 0.1 level

level) independent variable is 0.003, which means that the implementation of Colorado’scounty growth management policy instruments increases by 0.003 for every one per-centage increase of residents’ educational level when all other independent variablesare held constant. As assumed, the direction of the REDUC independent variable ispositively associated with the dependent variable. This positive direction suggests thatColorado counties with more highly educated residents are more likely to implementgrowth management policy instruments than Colorado counties with lower educatedresidents.
Third, the unstandardized coefficient value of the TURIM independent variable,0.029, indicates that the implementation of Colorado’s county growth managementpolicy instruments increases by approximately 0.00029 for every one percent increasein the tourism income of Colorado counties when all the other independent variablesare held constant. As hypothesized, the direction of the TURIM independent variableis positively associated with the dependent variable. This positive direction explainsthat Colorado counties with a higher level of tourism income are more likely to imple-ment growth management policy instruments than Colorado counties that earn lessfrom tourism.
Finally, the unstandardized coefficient value of the POLTE independent variable is-0.002, which points out that the implementation of Colorado’s county growth man-agement policy instruments decreases by 0.002 for every one percentage increase inresidents’ Democratic Party support when all the other independent variables are heldconstant. This negative direction with respect to the dependent variable reveals thatColorado counties with a stronger democratic tendency are less likely to implementgrowth management policy instruments than Colorado counties with a weaker democ-ratic tendency.
CONCLUSION
This study started to know about what factors lead local governments to more activelyimplement growth management policy instruments. The primary goal of this studywas completed through focusing on Colorado counties and empirically analyzing thevariation of their development impact fee implementation. Colorado counties are idealstudy cases to accomplish this study’s goal because Colorado allows local governmentsin its territory to voluntarily adopt and implement growth management policy instru-ments. This means that Colorado’s local governments basically adopt and implementgrowth management policy instruments based on a bottom-up style (Wallis, 2012).The main point of a bottom-up (voluntary) style is to provide local governments with
56 Interest Groups, County Characteristics, and Local Growth Management Policy Instruments
The Korean Journal of Policy Studies
legitimacy in choosing and using growth management policy instruments. Therefore,Colorado’s local governments are freer from state governments’ control in conductinggrowth management policy instruments, compared to other states. This situation helpsthis study find more accurate answers to the research question by concentrating onanalyzing internal characteristics of local governments excluding external factors.
The main theoretical approach of this study was the interest group model embracingboth anti-growth management policy and pro-growth management policy interestgroups. Not surprisingly, the findings declare that the counties with many anti-growthmanagement policy interest groups less actively implement growth management policyinstruments by demonstrating that there is a negative association between the AGMIGindependent variable and the dependent variable. This empirical evidence supports theidea that pro-economic development interest groups in Colorado do not prefer thatlocal governments implement growth management policy instruments. This is whyColorado’s growth management policy is closer to environmental policy, which wouldreduce or control economic profit of pro-development interest groups.
The analyzed results prove that counties with many highly educated residents moreactively implement growth management policy instruments. Based on this result, we canknow that highly educated residents prefer environmental conservation to economicdevelopment. This finding is consistent with the substantial amount of empirical evidencesuggesting that highly educated people support government interventions to receivebenefits obtained from environmental conservation.
This study demonstrates that there is a positive association between the tourismincome independent variable and the implementation of local growth management policyinstruments. The main goal of growth management policy instruments is to preventrapid growth or sprawl in jurisdictions and provide residents with better eco-friendlycircumstances. Eco-friendly circumstances that growth management policy pursuesplay a role in attracting more tourists to a jurisdiction by conserving natural environmentsand offering more convenient public facilities. This perspective would be relevant to theamenity effect of growth management policy. A pleasant environment and spectacularnatural surroundings are critical in facilitating local tourism. That is to say, this empiricalresult implies that growth management policy instruments can help local governmentsmake their jurisdictions more attractive to tourists. Therefore, growth managementpolicy might be a useful policy for Gangwon-do’s and Jeju-do’s local governments,which strongly depend on tourism for their revenue.
The final finding of this study presents that the hypothesis relevant to a politicaltendency of residents was proved with an unexpected result. Generally, we believe thatRepublicans advocate economic development while Democrats support environmentalconservation. However, this final result indicates that Colorado counties with a demo-
Interest Groups, County Characteristics, and Local Growth Management Policy Instruments 57
The Korean Journal of Policy Studies
cratic tendency are in fact less likely to implement growth management policy instru-ments. This result is not consistent with the results of similar studies investigating localgovernments’ political tendency of other states on the growth management policytopic. This unexpected result proposes that future studies are necessary to look at whyColorado counties with a democratic tendency are less likely to implement growthmanagement policy instruments. It is not easy to find an answer to this research ques-tion with quantitative methods. Thus, after finding some counties that have a democratictendency but do not prefer implementing growth management policy instruments,future studies need to consider using a qualitative method that conducts interviews withrepresentative decision makers or staff members in the growth management policyarena in those counties.
REFERENCES
Anderson, H. A. 1999. Use and implementation of urban growth boundaries: Ananalysis prepared by the center for regional and neighborhood action. Retrievedon September, 21, 2014, from www.colorado.edu/conflict/5010/CRNA-UGBReport.pdf.
Anthony, J. 2004. Do state growth management regulations reduce sprawl? UrbanAffairs Review, 39(3): 376-397.
Aguilera, E. 2008. Tourism grows in Colorado. The Denver Post. Retrieved on March, 7,2014, from www.denverpost.com/tourism/ci_9654384.
Baldassare, M., & Wilson, G. 1996. Changing sources of suburban support for localgrowth controls. Urban Studies, 33(3): 459-71.
Berry, F. S., & Berry, W. D. 1990. State lottery adoptions as policy innovations, AmericanPolitical Science Review, 84(2): 395-413.
Bushouse, B. K. 2011. Governance structures: Using IAD to understand variation inservice delivery for club goods with information asymmetry. Policy StudiesJournal, 39(1): 105-119.
Chari, R, Hogan, J., & Murphy, G. 2010. Regulating lobbying: A global comparison.Manchester, UK: Manchester University Press.
Clingermayer, J. C., & Feiock, R. C. 2001. Institutional constraints and policy choice.Albany, NY: State University of New York Press.
Colorado Department of Local Affairs. 2010. 2010 Colorado county land use surveyresults. Retrieved on March, 17, 2013, from www.hermes.cde.state.co.us/drupal/islandora/object/co%3A9686.
Cox, K. 1982. Housing tenure and neighborhood activism. Urban Affairs Quarterly,
58 Interest Groups, County Characteristics, and Local Growth Management Policy Instruments
The Korean Journal of Policy Studies
18: 107-129.Cronin, T. E., & Loevy, R. D. 1993. Colorado politics and government: Governing the
centennial state. Lincoln, NE : University of Nebraska Press.DeGrove, J. 1984. Land, growth and politics. Chicago, IL: Planners Press.DeGrove, J. 2005. Planning policy and politics: Smart growth and the states. Cambridge,
MA: Lincoln Institute of Land Policy.Diaz, D., & Green, G. P. 2001. Fiscal stress and growth management effort in Wisconsin
cities, villages, and towns. State and Local Government Review, 33(1): 7-22.Dierwechter, Y. 2008. Urban growth management and tis discontents: Promises practices,
and geopolitics in U.S. city-regions. New York, NY: Palgrave Macmillan.Dowall, D. 1980. An examination of population-growth-managing communities. Policy
Studies Journal, 9(3): 414-427.Feiock, R. C. 2004. Politics, institutions and local land-use regulation. Urban Studies,
41(2): 363-375.Feiock, R. C., & Kim, J. H. 2000. Form of government, administrative organization, and
local economic development policy. Journal of Public Administration Researchand Theory, 11(1): 29-49.
Feiock, R. C., Tavares, A. F., & Lubell, M. 2008. Policy instrument choices for growthmanagement and land use regulation. Policy Studies Journal, 36(3): 461-480.
Fischel, W. 2001. The homevoter hypothesis. Cambridge, MA: Harvard UniversityPress.
Fleischmann, A., & Pierannunzi, C. A. 1990. Citizens, development interests, and localland-Use Regulation. Journal of Politics, 52(3): 838-853.
Gerber, E. R., & Phillips, J. H. 2003. Land use policy, institutional design, and theresponsiveness of representative government. Paper presented at the 2003Annual Meeting of the Midwest Political Science Association.
Gujarati, D. N. 2003. Basic econometrics (4th ed.). New York, NY: McGraw-HillHigher Education.
Hamin, E. M., Steere, M. O., & Sweetser, W. 2006. Implementing growth management:The community preservation act. Journal of Planning Education and Research,26(1): 53-65.
Hair, J. F., Black, W. C., Babin, B. J., & Anderson, R. E. 2010. Multivariate dataanalysis (5th ed.). Upper Saddle River, NJ: Prentice Hall.
Howell-Moroney, M. 2004. What are the determinants of open-space ballot measures?An extension of the research. Social Science Quarterly, 85(1): 169-179.
Howell-Moroney, M. 2007. Studying the effects of the intensity of US state growthmanagement approaches on land development outcomes. Urban Studies, 44(11):2163-2178.
Interest Groups, County Characteristics, and Local Growth Management Policy Instruments 59
The Korean Journal of Policy Studies
Howell-Moroney, M. 2008. A mixed method look at state growth management policy.American Review of Public Administration, 38(3): 339-361.
Ingram, G. K., Carbonell, A., Hong, Y., & Flint, A. 2009. Smart growth policies: Anevaluation of programs and outcomes. Cambridge, MA: Lincoln Institute ofLand Policy.
Kelly, E. D. 1993. Managing community growth: Policies, techniques, and impacts.Westport, CT: Prager Press.
Lee, J. 2014. The mechanism of state charter school policy adoption: The case ofAmerican states. International Journal of Public Administration, 37(1): 20-34.
Lee, S. 2013. The effects of state smart growth management and local contexts onlocal open space preservation. Korean Journal of Policy Studies, 28(1): 17-41.
Logan, J. R., & Molotch, H. L. 1987. Urban fortunes: The political economy of place.Berkeley, CA: University of California Press.
Loomis, B. A., & Cigler, A. J. 2006. Introduction: The changing nature of interestgroup politics. In A. J. Cigler, & B. A. Loomis (eds.), Interest group politics(pp.1-36). Washington DC: Congressional Quarterly Press.
Lubell, M., Feiock, R. C., & Ramirez, E. 2005. Political institutions and conservationby local governments. Urban Affairs Review, 40(6): 706-729.
Mahood, H. R. 2000. Interest groups in American national politics: An overview.Upper Saddle River, NJ: Prentice Hall.
Mazmanian, D. A., & Sabatier, P. A. 1980. A multivariate model of public policy-making. American Journal of Political Science, 24(3): 439-468.
Mintrom, M. 2000. Policy entrepreneurs and school choice. Washington, DC: George-town University Press.
Mohamed, R. 2008. Who would pay for rural open space preservation and inner-cityredevelopment? Identifying support for policies that can contribute to regionalland use governance. Urban Studies, 45(13): 2783-2803.
Navarro, P., & Carson, R. 1991. Growth controls: Policy analysis for the second genera-tion. Policy Sciences, 24(2): 127-152.
Nownes, A. J. 2001. Pressure and power: Organized interests in American politics.Boston, MA: Houghton Mifflin.
Nownes, A. J., & Cigler, A. J. 2006. Big money donors to environmental groups: Whatthey give and what they get. In A. J. Cigler, & B. A. Loomis (eds.), Interestgroup politics (pp.108-129). Washington DC: Congressional Quarterly Press.
Ostrom, E. 2007. Institutional rational choice: An assessment of the institutionalanalysis and development framework. In P. A. Sabatier (2nd ed.), Theories ofthe policy process (pp. 21-64). Boulder, CO: Westview.
Ostrom, E. 2011. Background on the institutional analysis and development framework.
60 Interest Groups, County Characteristics, and Local Growth Management Policy Instruments
The Korean Journal of Policy Studies

Policy Studies Journal, 39(1): 7-27.Pallagst, K. 2007. Growth management in the US: Between theory and practice.
Burlington, VT: Ashgate.Porter, D. R. 1999. Reinventing growth management for the 21st century. William and
Mary Environmental Law and Policy Review, 23(3): 705-738.Protash, W., & Baldassare, M. 1983. Growth policies and community satisfaction: A
test and modification of logan’s theory. Urban Affairs Quarterly, 18: 397-412.Ramirez, E. E. 2009. Local political institutions and smart growth: An empirical study
of the politics of compact development. Urban Affairs Review, 45(2): 218-246.Remler, D. K., & Van Ryzin, G. G. 2014. Research methods in practice: Strategies for
description and causation (2nd ed.). Thousand Oaks, CA: Sage Publications,Inc.
Sabatier, P., & Weible, C. M. 2007. The advocacy coalition framework: Innovationsand clarifications. In P.A. Sabatier (2nd ed.), Theories of the policy process(pp.169-200). Boulder, CO: Westview.
Steel, B., & Lovrich, N. 2000. Growth management policy and county government:Correlates of policy adoption across the United States. State and Local Govern-ment Review, 32(1): 7-19.
Teske, P. 1991. Interests and institutions on state regulation. American Journal ofPolitical Science, 35(1): 139-154.
Wagner, W. E. 2013. Using IBM SPSS statistics for research methods and social sciencestatistics (4th ed.). Thousand Oaks, CA: Sage Publications, Inc.
Wallis, A. 2012. Pathways to managing regional growth: Lessons from Portland, Oregon,and Denver, Colorado. Borderlands: The Journal of Spatial Planning in Ireland,2 (January): 9-20.
Wasserman, A. 2003. What works, what doesn’t in smart growth policy: Lessons forMichigan from other states. Retrieved on July, 3, 2014, from www.mlui.org/growthmanagement/fullarticle.asp?fileid=16478.
White, C., & Dahl, G. P. 2001. Paying for growth: Impact fees under Senate Bill 15.Retrieved on May, 22, 2012, from www.lovelandpolitics.com/files/impactfees.pdf.
Zahariadis, N., & Morgan, L. 2005. Local government and the implementation ofAlabama’s economic development policy. Public Administration Quarterly,29(1): 7-32.
Interest Groups, County Characteristics, and Local Growth Management Policy Instruments 61
The Korean Journal of Policy Studies
Related Documents