Integration of Heavy Metal Pollution Indices and Health Risk Assessment of Groundwater in Semi- arid Coastal Aquifers, South Africa Philisiwe P Mthembu University of Zululand Vetrimurugan Elumalai ( [email protected] ) University of Zululand https://orcid.org/0000-0003-0780-8806 Peiyue Li Chang'an University Sivakumar Uthandi Tamil Nadu Agricultural University William P. Anderson Appalachian State University Research Article Keywords: heavy metal pollution, multivariate statistical analysis, pollution indices, water quality index, South Africa Posted Date: November 8th, 2021 DOI: https://doi.org/10.21203/rs.3.rs-1047297/v1 License: This work is licensed under a Creative Commons Attribution 4.0 International License. Read Full License

Welcome message from author
This document is posted to help you gain knowledge. Please leave a comment to let me know what you think about it! Share it to your friends and learn new things together.
Transcript

Integration of Heavy Metal Pollution Indices andHealth Risk Assessment of Groundwater in Semi-arid Coastal Aquifers, South AfricaPhilisiwe P Mthembu
University of ZululandVetrimurugan Elumalai ( [email protected] )
University of Zululand https://orcid.org/0000-0003-0780-8806Peiyue Li
Chang'an UniversitySivakumar Uthandi
Tamil Nadu Agricultural UniversityWilliam P. Anderson
Appalachian State University
Research Article
Keywords: heavy metal pollution, multivariate statistical analysis, pollution indices, water quality index,South Africa
Posted Date: November 8th, 2021
DOI: https://doi.org/10.21203/rs.3.rs-1047297/v1
License: This work is licensed under a Creative Commons Attribution 4.0 International License. Read Full License

1
Integration of heavy metal pollution indices and health risk assessment of groundwater 1
in semi-arid coastal aquifers, South Africa 2
Philisiwe P Mthembu1, Vetrimurugan Elumalai1*, Peiyue Li2, 3, Sivakumar Uthandi4, 3
William P. Anderson5 4
1Department of Hydrology, University of Zululand, Kwa-Dlangezwa, 3886, South Africa. 5
2School of Water and Environment, Chang’an University, No. 126 Yanta Road, Xi’an 6
710054, Shaanxi, China 7
3Key Laboratory of Subsurface Hydrology and Ecological Effects in Arid Region of the 8
Ministry of Education, Chang’an University, No. 126 Yanta Road, Xi’an 710054, Shaanxi, 9
China 10
4Biocatalysts Laboratory, Department of Agricultural Microbiology, Tamil Nadu Agricultural 11
University, Coimbatore, Tamil Nadu, India-641003 12
5Department of Geological and Environmental Sciences, Appalachian State University, 13
Boone, NC 28608, USA 14
15
*Corresponding author: 16
Prof. Vetrimurugan Elumalai 17
University of Zululand, 18
Kwadlangezwa-3886, 19
South Africa. 20
Phone: +27 35-902 6404 21
Email: [email protected]; [email protected] 22
23
24
25

2
Abstract 26
The metal contaminated groundwater results in serious health issues and hence this study 27
attempts to address metal contamination and its sources by using integrated techniques 28
including indexed and statistical methods and its related health hazards. Groundwater pH 29
varied from 5.3 to 8.3 indicating acidic to alkaline in nature. Heavy metal evaluation index 30
and degree of contamination reveal that all the groundwater samples fall under low pollution 31
and are appropriate for human consumption. According to the pollution index majority of the 32
samples fall in the insignificant pollution zone. Water quality index reveal that 19% and 2% 33
of the groundwater samples belong to the poor and very poor water quality category and are 34
spatially situated on the central, northern and southern parts of the study region. Correlation 35
matrix and principal component analysis reveal that weathering of aquifer matrix and 36
anthropogenic activities are accountable for the release of heavy metals into groundwater. 37
Furthermore, R-mode and Q-mode cluster analysis revealed two clusters which are linked to 38
mixed sources including weathering and anthropogenic activities. Based on the hazard 39
quotient the order of heavy metal impact is: Co>Pb>Cd>Zn>As>Mn>Cu>Cr>Fe>Ni for both 40
children and adult. The hazard index values varied from 0.06 to 8.16 for children and from 41
0.02 to 2.14 for adult. In this study, it is discovered that 43% and 26% of groundwater 42
samples pose non-carcinogenic health risk in children and adult, respectively. This study 43
highly recommends treatment of contaminated groundwater before consumption in order to 44
protect and maintain the public health. 45
46
Keywords: heavy metal pollution, multivariate statistical analysis, pollution indices, water 47
quality index, South Africa 48
49
1. Introduction 50
Groundwater serves as an important water resource supplying the demand for drinking, 51
domestic, agriculture sectors and industries especially in regions of arid and semi-arid 52
countries (Wang et al. 2020; Li et al. 2019a; Ezugwu et al. 2019; Çiner et al. 2020) and it is 53
usually perceived as safe compared with surface water resources due to its natural filtration of 54
contaminants by the soil as water moves into the groundwater (Sener et al. 2017; Wagh et. al 55
2018; Edokpayi et al. 2018). However, various researchers have reported several cases of 56

3
groundwater contamination due to various sources (Li et al. 2021; He and Wu 2019; He et al. 57
2019). Heavy metal pollution is among the most prominent threat to the quality of 58
groundwater resources owing to its extreme toxicity even at low concentrations (Abou 59
Zakhem and Hafez 2015; Singh and Kamal 2016; Tiwari et al. 2017; Rezaei et al. 2019; 60
Egbueri and Unigwe 2020; Brindha et al. 2020). Heavy metals enter groundwater through 61
natural processes such as weathering and dissolution of rocks and soils, ion exchange 62
processes, volcanism extruded products, decomposition of living matter and atmospheric 63
matter (Prasanna et al. 2012; Rezaei et al. 2019; Çiner et al. 2020; Wang et al. 2021). Mining, 64
industrial, agricultural and disposal of domestic refuse are some of the common 65
anthropogenic activities that influence the concentration of heavy metals in groundwater 66
resources (Rezaei et al. 2017; Wagh et al. 2018; Giri and Singh 2019; Ahamad et al. 2020). 67
However, the accumulation of heavy metals in ecosystem is exacerbated by anthropogenic 68
activities (Ukah et al. 2019) which are classified as essential (copper, chromium, cobalt, iron, 69
manganese and zinc) and non-essential (arsenic, cadmium and lead) (Çiner et al. 2020; 70
Brindha et al. 2020). Some heavy metals are required in small amounts for human body 71
building, however, excess consumption of such heavy metals can be detrimental to health and 72
environment (Haloi and Sarma 2012; Chanpiwat et al. 2014; Li et al. 2014; Boateng et al. 73
2015; Vetrimurugan et al. 2018; Xiao et al. 2019). 74
Several numerical and statistical models developed globally are successfully used in water 75
quality assessment. Such methods includes Heavy metal pollution index (HPI), Heavy metal 76
evaluation index (HEI), degree of contamination (Cd), Ecological risk index (ERI), Pollution 77
index of groundwater (PIG), Synthetic pollution index (SPI), and Overall index of pollution 78
(OIP), Correlation analysis (CA), Principal Component Analysis (PCA) and Hierarchical 79
cluster analysis (HCA) (Mohan et al. 1996; Prasad and Bose 2001; Edet and Offiong 2002; 80
Prasanna et al. 2012; Subba Rao 2012; Solangi et al. 2019; Egbueri 2020; Wu et al. 2014, 81
2020; Li et al. 2015, 2016, 2019b; Ren et al. 2021). About 40% of the groundwater samples 82
in Nigeria ispolluted by heavy metals rendering it inappropriate for human consumption 83
(Egbueri and Unigwe 2020). Another study conducted in southeast Nigeria using HPI, HEI 84
and CI (contamination index) inferred that all of the groundwater samples were excellent for 85
drinking purposes (Ezugwu et al. (2019). A study in Onitsha, Nigeria using the SPI revealed 86
that approximately 91.67% of groundwater samples were not palatable for human 87
consumption (Egbueri 2020). Different techniques such as PIG, ERI and HCA to assess the 88
drinking water quality of groundwater in Ojoto, Nigeria was utilised. According to the PIG 89

4
classification, 20% of the groundwater samples were found to be very highly polluted and 90
were found unsuitable for human consumption (Egbueri 2020). The HPI, HEI and Cd results 91
revealed that majority of groundwater samples in central Bangladesh fall under low level of 92
pollution and the Cd provided better insight when compared to the other indices (Bodrud-93
Doza et al. 2016). The extent of heavy metal contamination on ecology and human health 94
risks in groundwater of Lagos, Nigeria were largely owed to anthropogenic activities (Ukah 95
et al.2019). 96
Population growth, expansion of agricultural lands, rapid urbanization, industrialization, and 97
climate change are among the factors that lead to water quality problems in South Africa 98
(Vhonani et al. 2019). In Southern Africa approximately, two-thirds of the country’s 99
population depend groundwater for their domestic purposes (Nel et al. 2009; Vetrimurugan et 100
al. 2017). According to DWAF (2000), 65% of total water supply in rural areas is derived 101
from groundwater. Direct consumption of groundwater without any form of treatment 102
exposes local residents to various contaminants that may have adverse impact on human 103
health. About 3.6% of deaths per year are linked to water contamination in South Africa (Nel 104
et al. 2009). Arsenic and lead are the major contaminant sources of groundwater in South 105
Africa (Verlicchi and Grillini 2020), 106
The present study is focused in Maputaland coastal aquifer, South Africa. Rural communities 107
within the area are still without adequate supply of water resources, as a result they solely 108
rely on groundwater resources for their domestic water needs. Previous studies conducted in 109
this area revealed that groundwater is highly contaminated with iron, rendering it unfit for 110
various uses (Demlie et al. 2014). The ecological impact of metals in beach sediments in 111
marine protected areas shows enrichment of metals which are due to the heavy mineral rich 112
coastal dunes and past mining activities (Vetrimurugan et al. 2018). The concentrations of 113
cadmium, zinc, lead, manganese, aluminium and iron exceeded the limits of World Health 114
Organization (WHO) standards for drinking water quality of the Maputaland coastal aquifer 115
(Mthembu et al. 2020). The main objectives of this study is (1) evaluate the extent of heavy 116
metal pollution in groundwater using HPI, HEI and Cd, (2) assess groundwater quality for 117
drinking purposes by adopting PIG, SPI and OIP indices and (3) evaluate potential heavy 118
metal sources in groundwater using multivariate statistical tools such as PCA and HCA. This 119
study will provide knowledge on major pollution sources and assist water management of 120
South Africa in combating further contamination of groundwater resources. 121

5
2. Methodology 122
2.1 Description of study area 123
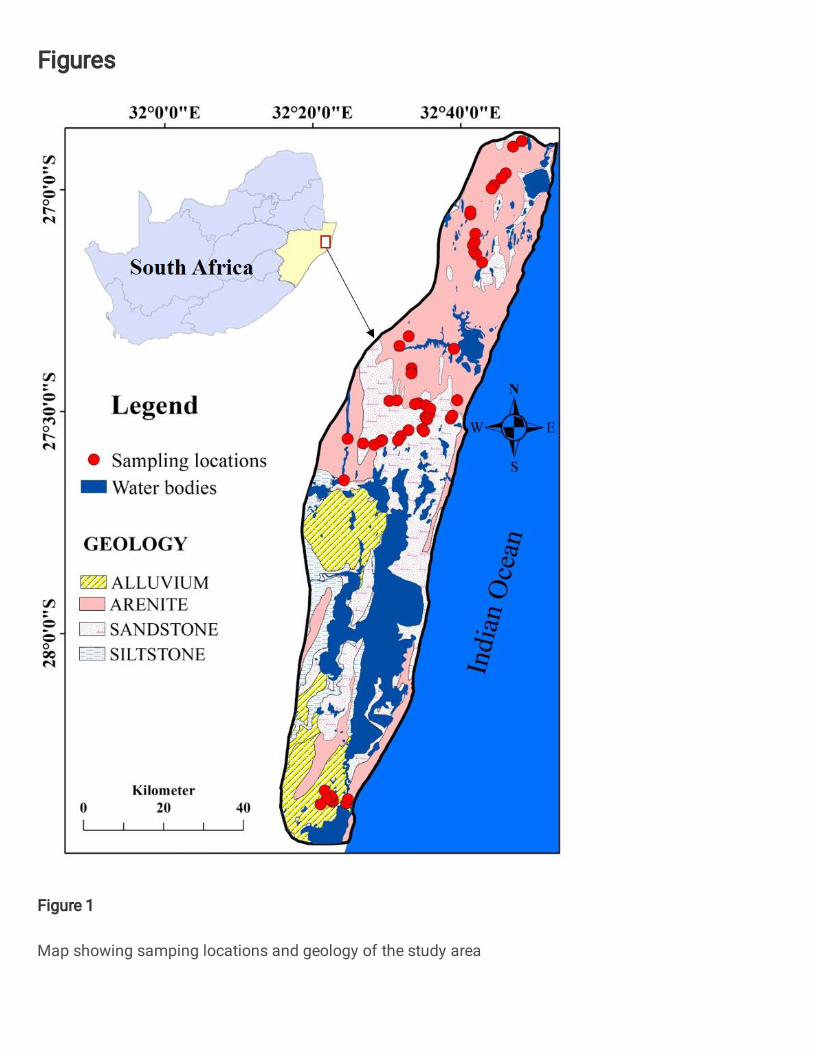
The Maputaland coastal plain of northern KwaZulu Natal extends southerly from Mtunzini to 124
the Mozambique border in the North (Fig. 1). It belongs to the uMkhanyakude district 125
municipality with the geographical area covering approximately 4 400km2. The climate of the 126
study area is humid subtropical with warm summers. The annual rainfall ranges from less 127
than 600mm inland to about 1000mm along the coast (Porat and Botha 2008; Ramsay 1996; 128
Watkeys et al. 1993). Highest rainfall befalls during the summer months (November-March) 129
with the eastern side receiving most of the precipitation. Rainfall received in this area are 130
from tropical and middle latitude weather systems (Weitz and Demlie 2014). Land use 131
activities in the area consists of subsistence agriculture, commercial forestry plantations and 132
eco-tourism. The foremost water supply for drinking, domestic and agricultural activities are 133
from groundwater. 134
the geology of the Maputaland coastal plain reveal that underlain by unconsolidated to semi-135
consolidated sediments of Cretaceous to Quaternary age. Alluvial deposits, arenite, 136
sandstone, and siltstone cover the study area (Fig. 1). Deposits of the Zululand Group 137
consists of Makatini, Mzinene and St. Lucia formations. These sediments are overlain by 138
Miocene aged Uloa formation which is in turn overlain by the cross-bedded calcarenites of 139
the Umkhwelane formation (Meyer et al. 2001). Pleistocene aged Port Durnford and Kosi 140
Bay formations are characterised by loosely consolidated sands, silts, clays and lignite beds 141
(Meyer et al. 2001; Demlie et al. 2014; Ndlovu 2015; Ndlovu and Demlie 2016). Overlying 142
the Kosi Bay formation are the redistributed sands of the KwaMbonambi formation. The 143
Holocene aged Sibayi formation is characterised by high coastal dune cordons (Watkeys et al. 144
1993). The area is covered by sediments that are highly permeable and indorse swift recharge 145
to the aquifers and strongly interact with the wetlands in the region (Mkhwanazi 2010; Weitz 146
and Demlie 2014). Groundwater in this area is encountered within the shallow unconfined 147
aquifer that yields approximately 0.5 to 5.0l/s (Ndlovu and Demlie 2016). The St. Lucia 148
formation is characterised by low permeability and behaves as an aquiclude. Overlying the 149
Uloa formation are sedimentary units characterised by fine grained, less permeable sediments 150
resulting in a leaky aquifer type (Ndlovu and Demlie 2016). The uppermost, youngest 151
sediment of the KwaMbonambi and Sibaya formations are characterised by unconsolidated 152
aeolian and fluvial sands and have high hydraulic conductivity (Kelbe et al. 2016, Ndlovu 153

6
and Demlie 2018). Generally, groundwater flows from the west to the Indian Ocean. Highest 154
groundwater level is approximately 25m below ground level. 155
156
2.2 Sampling and analysis of groundwater 157
53 number of groundwater samples were collected from the selected bore wells of the 158
Maputaland coastal aquifer during 2018 (Fig. 1). The wells were purged for approximately 5 159
minutes to remove stagnant water prior to sample collection. The groundwater samples were 160
collected and stored using a high-density polyethylene (HDPE) bottles after filtering with a 161
membrane filter. membrane filter. The 0.5ml of nitric acid was added to the samples to 162
prevent metal precipitation. The samples were labelled accordingly and stored in the 163
refrigerator at a temperature of 4℃. Groundwater samples were analysed for pH, As, Fe, Mn, 164
Zn, Pb, Ni, Cr, Cu, Cd and Co. 165
The pH of the groundwater samples were determined with multiprobe meter instrument 166
(Aqua Probe A-700). Heavy metals present in water samples were determined by inductively 167
coupled plasma-mass spectrometry (NexION 2000 ICP-MS) instrument using calibration 168
standards (MERCK) at the University of Zululand hydrogeochemistry laboratory. 169
Throughout the analytical procedures the standards of American Public Health Association 170
(APHA 2005) were followed. Standards and blanks were run to assess the accuracy of the 171
analysis. ArcGIS software v10.5 was employed to plot spatial maps using the IDW (inverse 172
distance weighted) interpolation technique. 173
174
2.3 Heavy metal pollution assessment 175
2.3.1 Heavy metal evaluation index (HEI) 176
The HEI yields the overall quality and presence of heavy metal in water (Edet and Offiong 177
2002). It is computed as follows; 178
179
c
MAC
n
i=1
HEI=H
H Eq.1 180

7
where HC is the monitored value and HMAC is the maximum admissible concentration (MAC) 181
of the ith parameter taken from SANS (2015). 182
183
2.3.2 Degree of contamination Cd 184
The degree of contamination (Cd) is useful in summarizing the combined effects of various 185
quality parameters regarded as harmful to domestic water (Backman et al. 1997; Edet and 186
Offiong 2002; Prasanna et al. 2012). It is computed by the following equation; 187
188
d fi
n
i=1
C=C Eq.2 189
190
where 191
Ai
i
Ni
C Cf
C = -1 Eq.3 192
193
where Cfi is the contamination factor for the ith parameter, CAi is the monitored value and CNi 194
is the upper permissible concentration of the ith parameter. According to Edet and Offiong 195
(2002), the Cd can be classified into low (Cd<1), medium (Cd=1-3) and high (Cd>3) in order 196
to identify the contaminated areas. 197
2.4 Assessment of drinking water quality 198
2.4.1 Pollution index of groundwater (PIG) 199
PIG was proposed in 2012 by Subba Rao, it is an important tool for monitoring and 200
assessment of drinking water quality. In PIG assessment, five steps are taken into 201
consideration. Firstly, it includes estimating the relative weight (Rw) of all analysed 202
parameters (Table 1) on a scale of 1 to 5, depending on parameters of human health impact. 203
Secondly, it involves computation of the weight parameter (Wp) of each water quality 204
variable to evaluate their relative contributions to overall water quality (Eq.4). Thirdly, it 205
involves estimation of the status of concentration (Sc) which is computed by diving the 206

8
concentration (C) of each water quality variable of every sample by its respective water 207
quality standard limit (Ds) as described by SANS (2015) (Eq.5). In the fourth step, the overall 208
quality of groundwater (Ow) is computed by multiplying the Wp by Sc (Eq.6). Finally, the 209
pollution index of groundwater is computed by summing all values of Ow contributed by 210
every water quality variable in each groundwater sample (Eq.7). 211
212
wp
w
W =R
R Eq.4 213
c
s
SC
=D
Eq.5 214
w p cO =W *S Eq.6 215
wPIG= O Eq.7 216
217
2.4.4 Water quality index (WQI) 218
The WQI was developed by Horton (1965). It is widely used by various researcher scholars 219
to evaluate drinking water quality. Computing the WQI involves five steps; (i) assignment of 220
weights (wi) to each water quality parameter being analysed, (ii) calculation of relative 221
weights (Wi) of parameters using equation 8, (iii) quality rating calculation (qi) based on 222
equation 9, (iv) determining the sub-index value (SIi) of the analysed parameters based on 223
equation 10, (v) calculation of the WQI based on equation 11. 224
1
ii
i
n
i
wW
w
225
Eq.8 226
100i
i
i
Cq
S 227
Eq.9 228
i i iSI W q Eq.10 229

9
1
i
n
i
SIWQI
Eq.11 230
where, qi represents the parameter quality rating, Ci represents the chemical parameter 231
concentration (mg/L), and Si represents the drinking water standard prescribed by 232
SANS/WHO. Weight values (wi) ranging from 1 to 5 were ascribed for each parameter 233
according to their relative significance in the overall quality of drinking water and their 234
indebted effects on human health. A maximum weight of 5 was allocated to the most 235
significant parameters while a weight of 1 was assigned to the least significant parameters. 236
Table 2 shows the weights and relative weights assigned while computing WQI. 237
Health Risk Assessment 238
Intake of contaminated groundwater by elevated trace metal content is known to pose threat 239
in human health. Evaluation of non-carcinogenic health risks due to trace metal 240
contaminated groundwater particularly in children is crucial. According to guidelines 241
provided by the Unites States Environmental Protection Agency (US EPA (1989), the chronic 242
daily intake (CDI) risks caused by ingestion of a single trace element is computed for adults 243
and children using the equation; 244
245
C IR EF EDCDI
BW AT
Eq. 12 246
where CDI represents chronic daily intake via ingestion pathway (µg/kg/day), C is the 247
concentration of the contaminant in drinking water (µg/L). IR represents the ingestion rate (L/day: 2.2 248
for adults and 1.8 for children). ED signifies the exposure duration (years: 70 and 6 years for adults 249
and children). EF represents the exposure frequency (days/years: 365 for adults and children). BW is 250
the body weight (kg: 70 for adults while 15 kg is for children). AT signifies the average time (days: 251
25 550 and 2 190 days for adults and children) Duggal et al. 2017; Barzegar et al. 2018; Mgbenu and 252
Egbueri 2019; Egbueri et al. 2020; Mthembu et al. 2020). The non-carcinogenic risk of a single trace 253
element is then calculated as the hazard quotient (HQ) using the equation; 254
CDIHQ
RfD Eq. 13 255
256

10
where RfD signifies the reference dose of each trace element (µg/kg/day). In this study, the 257
RfD for the different trace metals are given as 0.3 (As), 0.5 (Cd), 40 (Cu), 700 (Fe), 24 (Mn), 258
1.4 (Pb), 300 (Zn), 0.3 (Co), 3 (Cr), and 20 (Ni) (Duggal et al. 2017; Barzegar et al. 2018; 259
Zhang et al. 2018; Mgbenu and Egbueri 2019; Egbueri et al. 2020; Mthembu et al. 2020). The 260
hazard index (HI) e representing the non-carcinogenic risk of the heavy metal is computed 261
and is obtained by adding the HQs values of each groundwater sample as shown by the 262
following equation; 263
HI HQ Eq. 14 264
HI values less than unity indicates that the non-carcinogenic health risk is within the 265
acceptable limit whereas when the HI values is greater than unity it indicates that they are 266
above the acceptable limit (Egbueri and Mgbenu 2020). 267
268
3. RESULTS AND DISCUSSION 269
3.1 Heavy metal contamination 270
Table 3 shows the summary of statistical results of physicochemical parameters and its 271
comparative to drinking water standards (WHO 2011; SANS 2015). The groundwater pH 272
varied from 5.3 to 8.3 with an average value of 7.1 resulting the nature of water from acidic 273
to alkaline. The pH of the samples indicated that all the samples were within the standard 274
limits of SANS (2015) but 30% of the samples were found below 6.5 as prescribed by WHO 275
(2011). Groundwater arsenic varied from below detection limit to 3.6 µg/L (mean 0.5 µg/L). 276
Concentrations of cadmium is below the detection limit of 4.6 µg/L (mean 0.9 µg/L) and 277
approximately 23% of the samples exceeds the SANS (2015) and WHO (2011) standard 278
limits. Zinc ranged from 1.9 to 19 964.5 µg/L (mean 499.9 µg/L). 2% of the samples 279
exceeded the SANS (2015) and WHO (2011) standard limits in 2% of the samples. Iron 280
concentrations in groundwater ranged from 2.7 to 1 848.6 µg/L with an average range of 140 281
µg/L. About 11% of the samples has iron concentrations higher than SANS (2015) and WHO 282
(2011) drinking water standard limits. The high iron concentrations may be owed to the 283
leaching process of iron-rich sediments (Demlie et al. 2014). In this study, lead contents 284
varied from below detection limit to 26 µg/L (mean 6.6 µg/L). Approximately,25% of the 285
samples have lead concentrations exceeding the SANS (2015) and WHO (2011) standard 286

11
limits. Hence, the samples were classified as unfit for human consumption. Manganese 287
concentrations ranges from 0.4 to 116 µg/L (mean 19.1). About 2% of the samples has 288
manganese concentrations above the SANS (2015) standard limit. Nickel content in 289
groundwater varied from below detection limit to 9.3 µg/L (mean 2.1 µg/L). Chromium 290
concentrations ranges from below detection limit to 8.4 µg/L with an average value of 3.4 291
µg/L, respectively. Copper contents ranged from below detection limit to 279.5 µg/L (mean 292
22.7 µg/L), respectively. Cobalt contents in groundwater varies from below detection limit to 293
8.4 µg/L with an average value of 1.8 µg/L. It was also observed that arsenic, chromium, 294
copper, cobalt and nickel concentrations are low in groundwater samples and are within the 295
prescribed standard limits of drinking water as prescribed by SANS (2015) and WHO (2011). 296
Furthermore, iron, lead and cadmium were recognised to be dominant heavy metal 297
contaminants in this area. Fig. 2a-d shows the spatial distribution of selected heavy metals in 298
the study area. In this study, high iron concentrations are observed on the north western and 299
south eastern part of the area (Fig. 2a). High manganese are observed in eastern, northern, 300
and south eastern part (Fig. 2b). High lead concentrations are recorded on the south eastern, 301
northern, central and south western part of the area (Fig. 2c). The spatial distribution of 302
cadmium illustrates that high concentrations are recorded on the central, northern and south 303
western part of the area (Fig. 2d). The relationship between groundwater pH and metal load 304
was computed to classify the water samples (Ficklin et al 1992; Caboi et al 1999). Fig. 3 305
shows that 43% and 57% of the samples are classified as near-neutral high metal and near-306
neutral extreme metal. 307
3.2 Heavy metal pollution assessment 308
3.2.2 Heavy metal evaluation index (HEI) 309
The values of HEI varied from 0.08 to 10.25 with an average value of 1.83 (Table 4), 310
respectively. The HEI can be classified as low (< 400), medium (400-800) and high pollution 311
(> 800) (Edet and Offiong 2002). In this study, all the groundwater samples were found 312
below the 400 (Table 5; Fig. 4a), respectively. This suggests that the groundwater has low 313
pollution with regards to heavy metals and is safe for human consumption. 314
3.2.3 Degree of contamination (Cd) 315
The calculated Cd values varied from -9.92 to 0.25 with an average value of -8.18 (Table 4), 316
respectively. Cd values may further be categorised into (Backman et al. 1997; Edet and 317
Offiong 2002): low (< 1), medium (1-3) and high (> 3). Groundwater samples have Cd values 318

12
below one suggesting low contamination by heavy metals (Table 5; Fig. 4a). A similar trend 319
at various sampling locations was observed between the two indices (HEI and Cd) (Fig. 5). 320
Furthermore, the indices were compared with each other and it show strong correlation of 321
HEI and Cd (Paul et al. 2019); Jahanshahi and Zare (2015). 322
3.3 Drinking water quality assessment 323
3.3.1 Pollution index of groundwater (PIG) 324
Computed PIG values are presented in Table 4. In PIG assessment, the relative influence of 325
chemical parameters was considered. When the overall chemical quality of water (Ow) is 326
above 0.1, it contributes 10% of the value of 1.0 of PIG (Subba Rao 2012) confirming the 327
influence of groundwater pollution. PIG values can be classified into five categories as 328
follows; PIG < 1.0 (insignificant pollution), 1.0-1.5 (low pollution), 1.5-2.0 (moderate 329
pollution), 2.0-2.5 (high pollution) and PIG > 2.5 (very high pollution) (Subba Rao 2012; 330
Subba Rao et al. 2018; Egbueri and Unigwe 2019). The PIG values ranged from 0.07 to 1.03 331
with an average value of 0.25, respectively (Table 3). About98% of the samples has PIG 332
values less than 1.0 (0.23) falling under insignificant pollution zone while 2% of the samples 333
have PIG between 1.0 and 1.5 (1.03) which comes under low pollution zone (Table 6). The 334
spatial distribution of PIG shows that insignificant pollution zone is spread throughout the 335
study area (Fig. 4b). The low pollution zone is predominant observed mainly in the central 336
part (Fig. 4b). 337
The pH (0.07), As (0.01), Fe (0.03), Mn (0.02), Zn (0.01), Pb (0.07), Ni (0.00), Cr (0.00), Cu 338
(0.00), Cd (0.03) and Co (0.00) show values Ow less than 0.1 in the insignificant pollution 339
zone. These values are therefore regarded as natural contributors of groundwater quality. In 340
the low pollution zone, the Cd (0.16), Fe (0.52), and Pb (0.23) have the Ow values higher than 341
0.1 (Table 6). Thus, high values in the low pollution zone indicates the influence of 342
anthropogenic sources. 343
3.3.4 Water quality index (WQI) 344
The water quality results are shown in Table 2. In the present study, the WQI varied from 345
7.27 to 89.44 with an average of 25.91 (Table 4). the WQI can be classified into five 346
categories such as; WQI< 25 indicate excellent water quality; 25-50 indicate good water 347
quality; 50-75 indicate poor water quality; 75-100 indicate very poor water quality; and 348
WQI> 100 indicate unsuitable water quality (Rostami et al 2019). In this study region, 70% 349

13
of the groundwater samples fall in the excellent water category, 9% of the samples belong to 350
good water, 19% of the samples belong to poor water quality, and 2% of the samples are 351
unsuitable for drinking purposes. Fig. 4b shows the spatial distribution of WQI. It is shown 352
that groundwater samples that fall in the poor and very poor water category are situated in the 353
central, northern and southern part of the study region. 354
355
3.4 Multivariate statistical analysis for identification of pollution source 356
3.4.1 Correlation matrix (CM) 357
Correlation matrix identifies interrelationship among parameters and their possible sources in 358
groundwater (Table 7). Correlation coefficients r>0.7 is considered as strong, 0.7>r>0.5 as 359
moderate and <0.5 were considered as weak (Egbueri and Mgbenu 2020). The groundwater 360
pH showed a moderate correlation with cadmium (r= 0.57) and cobalt (r= 0.55) (Table 6). 361
Iron showed a strong relationship with HEI and Cd, this suggests that iron has a key role in 362
determining groundwater quality. Lead showed significant correlation with chromium (r= 363
0.90), cadmium (r= 0.92), cobalt (r= 0.94), HEI (r= 0.84) and Cd (r= 0.84). High 364
concentration of lead and cadmium may be indicative of anthropogenic sources such as 365
agrochemicals (Arslan and Ayyildiz Turan 2015). Chromium has shown strong correlation 366
with cadmium (r= 0.89), cobalt (r= 0.94), HEI (r= 0.71) and Cd (r= 0.71). Furthermore, 367
cadmium show a strong positive correlation with cobalt (r= 0.97HEI (r= 0.86) and Cd 368
(r=0.86). Lead, chromium, cadmium and cobalt shows a significant strong correlation with 369
HEI and Cd. The correlation among heavy metal pollution indices reflected good relation 370
between HEI (r= 0.87) and Cd (r= 0.87). Similarly, HEI is strong correlated with Cd (r=1). 371
This indicates that HEI and Cd can be used to evaluate the risk and contamination of heavy 372
metals in groundwater of this area. 373
3.4.2 Principal Component Analysis (PCA) 374
Principal component analysis identifies sources of heavy metals in groundwater. Varimax 375
rotation was used with Kaiser normalization. Component loadings, Eigen values, percentage 376
of variance and cumulative percentages of the identified principal components (PCs) are 377
shown in Table 8. Fig. 6a-c shows the spatial distribution maps of the principal components 378
that were extracted. PCA revealed three principal components that accounted for 70.18% of 379
the total variance. PC1 which explains 37.59% of the total variance has significant positive 380

14
loadings of lead, chromium, cadmium and cobalt. The presence of these heavy metals in PC1 381
revealed the contribution of anthropogenic sources such as the application of agricultural 382
fertilizers and pesticides, leaching or infiltration of domestic wastes and garden refuse from 383
the Mbazwana landfill site (Mthembu et al. 2020). Highest values of PC1 are situated in the 384
northern, central and southern part of the study area, especially in sample BH12, BH15-16, 385
BH26, BH47-53 (Fig. 6a). PC2 accounted for 19.65% of total variance with significant 386
loadings of pH and cobalt, and moderate loading of zinc. This suggests that the groundwater 387
pH is responsible for the release of cobalt and zinc into groundwater. Moderate PC2 values 388
are distributed throughout the study area with highest values seen at the central part of the 389
study area at sample BH21 (Fig. 6b) The presence of zinc is owed to the use of agricultural 390
fertilizers (Razei et al. 2019). PC3 explains 12.9% of the total variance with a negative 391
moderate loading of arsenic, strong positive loading of manganese and moderate loading of 392
nickel. The negative loading of arsenic suggests a different source of origin. The strong and 393
moderate loadings of manganese and nickel may be due to the weathering of manganese and 394
nickel bearing minerals. Landfill leachate may also contribute to the occurrence of 395
manganese in groundwater of this area. For PC3, the distributed loadings were high on the 396
eastern and north western part of the study area for samples BH27-28, BH51-52 (Fig. 6c). For 397
better understanding, three principal components were overlaid into a single map using fuzzy 398
overlay (Fig. 6d). Highest loadings are observed in the northern and central part of the study 399
area with moderate values spread throughout the study area. This indicates that the samples in 400
the northern and central part of the study area are highly influenced with anthropogenic and 401
weathering processes. This also corresponds with the high values of heavy metals observed in 402
these locations (Fig. 2a-d). 403
404
3.4.3 Hierarchical cluster analysis (HCA) 405
The potential sources of pollutants in groundwater of this area was further investigated by 406
carrying out cluster analysis. R-mode cluster analysis was carried out to evaluate the sources 407
of heavy metals in groundwater of this area. R-mode cluster analysis revealed two groups of 408
clusters (Fig. 7). Cluster 1 consists of pH, chromium, cadmium, cobalt, arsenic, nickel and 409
lead. This cluster indicates the influence of both geogenic (weathering of rock minerals) and 410
anthropogenic sources (domestic wastes and agricultural fertilisers) in the study area. Cluster 411
2 comprises of manganese, copper, iron and zinc and is due to the influences of geogenic and 412
15
anthropogenic sources. Q-mode cluster analysis was also used to determine the similarities 413
that exists between sampling points. Two groups of clusters were identified by Q-mode 414
cluster analysis (Fig. 8) Cluster 1 consisted of 46 sampling locations. These sampling 415
locations are BH1-BH14, BH17-BH23, BH25-BH33, BH35-BH41, BH43, BH44, BH46, 416
BH48-BH53. The samples of this cluster are mainly located throughout the entire study area 417
and its characteristics may be linked to the rocks found in this area such as arenite, sandstone, 418
siltstone and alluvium. Furthermore, these sample locations are characterised by elevated 419
average concentrations of iron, zinc, copper and manganese (Fig. 8). These high levels are 420
associated with PC2 and PC3, respectively. This cluster is associated with pollution by mixed 421
sources i.e weathering of soil or rock minerals and anthropogenic sources (agrochemicals). 422
Based on average concentrations, pH, arsenic, nickel and copper were elevated in cluster 1 423
than in cluster 2. Cluster 2 included 7 sampling locations BH15, BH16, BH24, BH34, BH42, 424
BH45 and BH47. Cluster 2 samples are spatially situated in the southern, central and north 425
western part of the study area. This cluster is characterised by rocks such as arenite, 426
sandstone and alluvium These sampling locations have highest concentrations of zinc, iron, 427
manganese, and lead. These high levels correspond to PC1, PC2, and PC3, respectively. This 428
cluster is also linked to mixed sources i.e. weathering of soil or rock minerals and 429
anthropogenic sources. According to average values, iron, manganese, zinc, lead, chromium, 430
cadmium and cobalt were greater in cluster 2 than those in cluster 1. 431
3.5 Health risk assessment 432
Health risk assessment evaluated the potential health risks of ingestion of trace metal 433
contaminated groundwater in children and adult of the study region. Table 9 outlines the 434
statistical summary of for the HQ of the selected heavy metals. The spatial variation of HQ 435
and HI of infants, children, and adults is shown in Fig. 9a, b. The mean values of HQ 436
followed the following decreasing trend: Co>Pb>Cd>Zn>As>Mn>Cu>Cr>Fe>Ni for both 437
children and adult (Table 9; Fig. 9a, b). The average HQ values suggests that Co has shown 438
highest of the total non-carcinogenic health risk in the study region. The HI values for 439
groundwater samples varied from 0.06 to 8.16 for children and from 0.02 to 2.14 for adult, 440
respectively (Fig. 9a, b). HI value for certain elements are is greater suggesting non-441
carcinogenic health risk for ingestion. Likewise, an HI value below one implies that it is 442
within the acceptable limit. In this study, it was discovered that 43% and 26% of groundwater 443
samples pose non-carcinogenic health risk in children and adult, respectively. 444

16
4. Conclusions 445
The present study address on evaluating extent of heavy metal contamination and their source 446
of origin in groundwater of Maputaland coastal aquifer using indexed and statistical analysis. 447
The following conclusions were made: 448
Groundwater is acidic to alkaline in nature. The dominance of heavy metals is in the 449
order; Zn>Fe>Cu>Mn>Pb>Cr>Ni>Co>Cd>As. Of all the heavy metals, lead, 450
cadmium and iron exceeded the WHO and SANS standard limits for drinking water 451
in 25%, 23% and 11% of the samples. 452
HEI values of all the groundwater samples fall under low pollution with regards to 453
heavy metals. Similarly, the Cd results revealed all the groundwater samples have low 454
contamination with respect to heavy metals and are suitable for human consumption. 455
The PIG and WQI were used to evaluate the drinking water suitability. Based on PIG 456
results, 98% of the samples fall in the insignificant pollution zone and 2% of the 457
samples fall in the low pollution zone. Moreover, metals such as cadmium, iron and 458
lead had Ow values greater than 0.1 in the low pollution zone suggesting the influence 459
of anthropogenic sources. The WQI revealed that 19% and 2% of the groundwater 460
samples belong to the poor and very poor water quality category and are spatially 461
situated on the central, northern and southern part of the study region. 462
Multivariate statistical analysis including that CM and PCA confirms the release of 463
heavy metals into groundwater which is controlled by geogenic (weathering of rocks 464
and minerals) and anthropogenic sources (domestic wastes and agricultural 465
fertilizers). 466
From HCA, R-mode cluster analysis showed two clusters. Cluster 1 consisted of pH, 467
chromium, cadmium, cobalt, arsenic, nickel and lead which indicate the influence of 468
geogenic and anthropogenic sources. Cluster 2 comprised of manganese, copper, iron 469
and zinc which is due to geogenic and anthropogenic sources in the study area. Q-470
mode cluster analysis grouped groundwater samples into two clusters. Samples in 471
cluster 1 have high levels of iron, zinc and copper and correspond to PC2 and PC3. 472
Similarly, samples in cluster 2 have high levels of zinc, iron, and manganese. These 473
samples correspond to PC, PC2 and PC3. Both samples in cluster 1 and cluster 2 are 474
linked to mixed sources including weathering of parent material and anthropogenic 475
sources. 476

17
HQ is in the order: Co>Pb>Cd>Zn>As>Mn>Cu>Cr>Fe>Ni both children and adult. 477
The HI values varied from 0.06 to 8.16 for children and from 0.02 to 2.14 for adult. 478
In this study, it was discovered that 43% of groundwater samples pose non-479
carcinogenic health risk in children while and 26% of the samples posed health risk 480
in adults. 481
This study recommends regular monitoring and treatment of contaminated 482
groundwater prior to consumption by local residents to ensure the public health and 483
to prevent further contamination of the aquifer. 484
485
Acknowledgements 486
Authors from the University of Zululand express their gratitude to National Research 487
Foundation (NRF), South Africa (NRF/NSFC Reference: NSFC170331225349 Grant No: 488
110773) for providing grants and Department of Research and Innovation, the University of 489
Zululand for support in buying Ion Chromatography instrument for this research. Dr. Peiyue 490
Li is grateful for the financial support granted by the National Natural Science Foundation of 491
China (41761144059). 492
493
5. References 494
Abou Zakhem B., Hafez R( 2015) Heavy metal pollution index for groundwater quality 495
assessment in Damascus Oasis, Syria. Environ Earth Sci, 73(10), 6591–6600. 496
https://doi.org/10.1007/s12665-014-3882-5 497
Ahamad A, Raju NJ, Madhav,S (2020) Trace elements contamination in groundwater and 498
associated human health risk in the industrial region of southern Sonbhadra , Uttar 499
Pradesh , India. Environ Geochem Health, 42(10), 3373–3391. 500
https://doi.org/10.1007/s10653-020-00582-7 501
Adimalla N, Qian H, Wang H (2019) Assessment of heavy metal (HM) contamination in 502
agricultural soil lands in northern Telangana, India: an approach of spatial distribution 503
and multivariate statistical analysis. Environ Monit Assess 191:246. https 504
://doi.org/10.1007/s1066 1-019-7408-1 505
American Public Health Association (APHA) (2005) Standard methods for examination of 506

18
water and wastewater. 21st ed. Washington, DC: American Public Health Association. 507
Arslan H, Ayyildiz Turan N (2015) Estimation of spatial distribution of heavy metals in 508
groundwater using interpolation methods and multivariate statistical techniques; its 509
suitability for drinking and irrigation purposes in the Middle Black Sea Region of 510
Turkey. Environ Monit Assess, 187(8). https://doi.org/10.1007/s10661-015-4725-x 511
Backman B, Bodiš D, Lahermo P, Rapant S, Tarvainen T (1997) Application of a 512
groundwater contamination index in Finland and Slovakia. Environ Geol, 36(1–2), 55–513
64. https://doi.org/10.1007/s002540050320 514
Bhutiani R, Kulkarni DB, Khanna DR, Gautam A (2017) Geochemical distribution and 515
environmental risk assessment of heavy metals in groundwater of an industrial area and 516
its surroundings, Haridwar, India. Energ Ecol Environ, 2(2), 155–167. https 517
://doi.org/10.1007/s4097 4-016-0019-6. 518
Boateng TK, Opoku F, Acquaah SO, Akoto O (2015) Pollution evaluation , sources and risk 519
assessment of heavy metals in hand ‑ dug wells from Ejisu ‑ Juaben Municipality , 520
Ghana. Environ Syst Res. https://doi.org/10.1186/s40068-015-0045-y 521
Bodrud-Doza M, Islam ARMT, Ahmed F, Das S, Saha N, Rahman MS (2016) 522
Characterization of groundwater quality using water evaluation indices, multivariate 523
statistics and geostatistics in central Bangladesh. Water Science, 30(1), 19–40. 524
https://doi.org/10.1016/j.wsj.2016.05.001 525
Brindha K, Pavelic P, Sotoukee T, Douangsavanh S, Elango L (2017) Geochemical 526
characteristics and groundwater quality in the Vientiane plain, Laos. Expo Health, 9(2), 527
89–104. https://doi.org/10.1007/s12403-016-0224-8 528
Brindha K, Paul R, Walter J, Tan ML, Singh MK (2020) Trace metals contamination in 529
groundwater and implications on human health : comprehensive assessment using 530
hydrogeochemical and geostatistical methods. Environ Geochem Health, 9. 531
https://doi.org/10.1007/s10653-020-00637-9 532
Caboi R, Cidu R, Fanfani L, Lattanzi P, Zuddas P (1999) Environmental mineralogy and 533
geochemistry of the abandoned Pb–Zn Montevecchio-Ingurtosu mining district, 534
Sardinia, Italy. Chron Rech Min 534:21–28 535
Çiner F, Daanoba E, Burak S, Şenbaş A( 2020) Geochemical and Multivariate Statistical 536

19
Evaluation of Trace Elements in Groundwater of Niğde Municipality , South ‑ Central 537
Turkey : Implications for Arsenic Contamination and Human Health Risks Assessment. 538
Arch Environ Contam Toxicol, 2025(0123456789). https://doi.org/10.1007/s00244-020-539
00759-2 540
Chanpiwat P, Lee BT, Kim KW, Sthiannopkao S (2014) Human health risk assessment for 541
ingestion exposure to groundwater contaminated by naturally occurring mixtures of 542
toxic heavy metals in the Lao PDR. Environ Monit Assess, 186(8), 4905–4923. 543
https://doi.org/10.1007/s10661-014-3747-0 544
Demlie M, Hingston E, Mnisi Z (2014) A study of the sources, human health implications 545
and low cost treatment options of iron rich groundwater in the northeastern coastal areas 546
of KwaZulu-Natal, South Africa. J Geochem Explor 144:504-510. 547
https://doi.org/10.1016/j.gexplo.2014.05.011 548
Duggal V, Rani A, Mehra R, Balaram V (2017) Risk assessment of metals from groundwater 549
in northeast Rajasthan. J Geol Soc India 90(1):77–84 550
DWAF (2000) Policy and strategy for groundwater quality management in South Africa. 551
Water quality management series. Department of Water Affairs and Forestry, Pretoria 552
Edet AE, Offiong OE (2002) Evaluation of water quality pollution indices for heavy metal 553
contamination monitoring. A study case from Akpabuyo-Odukpani area, Lower Cross 554
River Basin (southeastern Nigeria). GeoJournal, 57(4), 295–304. 555
https://doi.org/10.1023/B:GEJO.0000007250.92458.de 556
Edokpayi JN, Enitan AM, Mutileni N, Odiyo JO (2018) Evaluation of water quality and 557
human risk assessment due to heavy metals in groundwater around Muledane area of 558
Vhembe District, Limpopo Province, South Africa. Chem Cent J, 12(1):1–16. 559
https://doi.org/10.1186/s13065-017-0369-y 560
Egbueri JC (2020) Groundwater quality assessment using pollution index of groundwater 561
(PIG), ecological risk index (ERI) and hierarchical cluster analysis (HCA): A case study. 562
Groundw Sustain Dev 10(October), 100292. https://doi.org/10.1016/j.gsd.2019.100292 563
Egbueri JC, Unigwe CO (2020) Understanding the Extent of Heavy Metal Pollution in 564
Drinking Water Supplies from Umunya, Nigeria: An Indexical and Statistical 565
Assessment. Analytical Letters, 0(0), 1–23. 566

20
https://doi.org/10.1080/00032719.2020.1731521 567
Ezugwu CK, Onwuka OS, Egbueri JC, Unigwe CO, Ayejoto DA (2019) Multi-criteria 568
approach to water quality and health risk assessments in a rural agricultural province, 569
southeast Nigeria. HydroResearch, 2, 40–48. 570
https://doi.org/10.1016/j.hydres.2019.11.005 571
Ficklin DJWH, Plumee GS, Smith KS, McHugh JB (1992) Geochemical classification of 572
mine drainages and natural drainages in mineralized areas. In: Kharaka YK, Maest AS 573
(eds) Water–rock interaction, vol 7. Balkema, Rotterdam, pp 381–384 574
Giri S, Singh AK (2019) Assessment of metal pollution in groundwater using a novel 575
multivariate metal pollution index in the mining areas of the Singhbhum copper belt. 576
Environ Earth Sci, 78(6), 1–11. https://doi.org/10.1007/s12665-019-8200-9 577
578
Haloi N, Sarma HP (2012) Heavy metal contaminations in the groundwater of Brahmaputra 579
flood plain: An assessment of water quality in Barpeta District, Assam (India). Environ 580
Monit Assess, 184(10), 6229–6237. https://doi.org/10.1007/s10661-011-2415-x 581
He S, Wu J (2019) Hydrogeochemical characteristics, groundwater quality and health risks 582
from hexavalent chromium and nitrate in groundwater of Huanhe Formation in Wuqi 583
County, northwest China. Expo Health 11(2):125-137. https://doi.org/10.1007/s12403-584
018-0289-7 585
He X, Wu J, He S (2019) Hydrochemical characteristics and quality evaluation of 586
groundwater in terms of health risks in Luohe aquifer in Wuqi County of the Chinese 587
Loess Plateau, northwest China. Hum Ecol Risk Assess 25(1-2):32-51. 588
https://doi.org/10.1080/10807039.2018.1531693 589
Jahanshahi R, Zare M (2015) Assessment of heavy metals pollution in groundwater of 590
Golgohar iron ore mine area, Iran. Environ Earth Sci, 74(1), 505–520. 591
https://doi.org/10.1007/s12665-015-4057-8 592
Kelbe BE, Grundling AT, Price JS (2016) Modelling water-table depth in a primary aquifer 593
to identify potential wetland hydrogeomorphic settings on the northern Maputaland 594
Coastal Plain, KwaZulu-Natal, South Africa. Hydrogeol J 24:249-265 595
Li P, Qian H, Wu J, Chen J, Zhang Y, Zhang H (2014) Occurrence and hydrogeochemistry of 596

21
fluoride in alluvial aquifer of Weihe River, China. Environ Earth Sci, 71(7), 3133–3145. 597
https://doi.org/10.1007/s12665-013-2691-6 598
Li P, Qian H, Howard KWF, Wu J (2015) Heavy metal contamination of Yellow River 599
alluvial sediments, northwest China. Environ Earth Sci 73(7):3403-3415. 600
https://doi.org/10.1007/s12665-014-3628-4 601
Li P, Wu J, Qian H, Zhou W (2016) Distribution, enrichment and sources of trace metals in 602
the topsoil in the vicinity of a steel wire plant along the Silk Road economic belt, 603
northwest China. Environ Earth Sci 75(10):909. https://doi.org/10.1007/s12665-016-604
5719-x 605
Li P, He X, Guo W (2019a) Spatial groundwater quality and potential health risks due to 606
nitrate ingestion through drinking water: a case study in Yan’an City on the Loess 607
Plateau of northwest China. Hum Ecol Risk Assess 25(1-2):11-31. 608
https://doi.org/10.1080/10807039.2018.1553612 609
Li P, Tian R, Liu R (2019b) Solute geochemistry and multivariate analysis of water quality in 610
the Guohua Phosphorite Mine, Guizhou Province, China. Expo Health 11(2):81-94. 611
https://doi.org/10.1007/s12403-018-0277-y 612
Li P, Karunanidhi D, Subramani T, Srinivasamoorthy K (2021) Sources and consequences of 613
groundwater contamination. Arch Environ Contam Toxicol 80(1):1-10. 614
https://doi.org/10.1007/s00244-020-00805-z 615
Meyer R, Talma AS, Duvenhage AWA, Eglington BM, Taljaard J, Botha JP, Verwey J, van 616
der Voort I (2001) Geohydrological Investigation and Evaluation of the Zululand 617
Coastal Aquifer. WRC Report No. 221/1/1.Pretoria. WRC 618
Mkhwanazi MN (2010) Establishment of the Relationship Between the Sediments Mineral 619
Composition and Groundwater Quality of the Primary Aquifers in the Maputaland 620
Coastal Plain. Dissertation, University of Zululand 621
Mohan SV, Nithila P, Reddy SJ (1996) Estimation of heavy metal in drinking water and 622
development of heavy metal pollution index. J Environ Sci Health A31:283–289 623
Mthembu PP, Elumalai V, Brindha K, Li P( 2020) Hydrogeochemical Processes and Trace 624
Metal Contamination in Groundwater: Impact on Human Health in the Maputaland 625
Coastal Aquifer, South Africa. Expo Health, 0123456789. 626

22
https://doi.org/10.1007/s12403-020-00369-2 627
Ndlovu M (2015) Hydrogeological conceptual modelling of the Kosi Bay lake system, North 628
eastern South Africa. Dissertation, University of KwaZuluNatal 629
Ndlovu M, Demlie M (2016) Hydrogeological characterization of the Kosi Bay Lakes 630
system, north-eastern South Africa. Environ Earth Sci 75(19):1–16. 631
https://doi.org/10.1007/s12665-016-6164-6 632
Ndlovu MS, Demlie M (2018) Statistical analysis of groundwater level variability across 633
KwaZulu-Natal Province, South Africa. Environ Earth Sci 77(21):1–15. 634
https://doi.org/10.1007/s12665-018-7929-x 635
Nel J, Xu Y, Batelaan O, Brendonck L (2009) Benefit and implementation of groundwater 636
protection zoning in South Africa. Water Resources Management, 23(14), 2895–2911. 637
https://doi.org/10.1007/s11269-009-9415-4 638
Paul R, Gowrisankar KBG, Leong M, Mahesh T, Singh K (2019) Identification of 639
hydrogeochemical processes controlling groundwater quality in Tripura , Northeast 640
India using evaluation indices , GIS , and multivariate statistical methods. Environ Earth 641
Sci, 78(15), 1–16. https://doi.org/10.1007/s12665-019-8479-6 642
Porat N, Botha G (2008) The luminescence chronology of dune development on the 643
Maputaland coastal plain, southeast Africa. Quaternary Science Reviews 27:1024-1046 644
Prasad B, Bose JM (2001) Evaluation of the heavy metal pollution index for surface and 645
spring water near a limestone mining area of the lower himalayas. Environ Geol, 41(1–646
2), 183–188. https://doi.org/10.1007/s002540100380 647
Prasanna MV, Praveena SM, Chidambaram S, Nagarajan R, Elayaraja A (2012) Evaluation 648
of water quality pollution indices for heavy metal contamination monitoring: A case 649
study from Curtin Lake, Miri City, East Malaysia. Environ Earth Sci, 67(7), 1987–2001. 650
https://doi.org/10.1007/s12665-012-1639-6 651
Ramsay PJ (1996) 9000 Years of sea-level change along the southern African coastline. 652
Quaternary International, 31(1989), 71–75. https://doi.org/10.1016/1040-653
6182(95)00040-P 654
Rezaei A, Hassani H, Jabbari N (2017) Evaluation of groundwater quality and assessment of 655
pollution indices for heavy metals in North of Isfahan Province, Iran. Sustain Water 656
23
Resour Manag, 0(0), 0. https://doi.org/10.1007/s40899-017-0209-1 657
Ren X, Li P, He X, Su F, Elumalai V (2021) Hydrogeochemical processes affecting 658
groundwater chemistry in the central part of the Guanzhong Basin, China. Arch Environ 659
Contam Toxicol 80(1):74-91. https://doi.org/10.1007/s00244-020-00772-5 660
Rezaei A, Hassani H, Hassani S, Jabbari N, Fard Mousavi SB, Rezaei S (2019) Evaluation of 661
groundwater quality and heavy metal pollution indices in Bazman basin, southeastern 662
Iran. GroundwSustain Dev, 9(April 2018), 100245. 663
https://doi.org/10.1016/j.gsd.2019.100245 664
Rostami AA, Isazadeh M, Shahabi M, Nozari H (2019) Evaluation of geostatistical 665
techniques and their hybrid in modelling of groundwater quality index in the Marand 666
Plain in Iran. Environ Sci Pollut Res. https ://doi.org/10.1007/s1135 6-019-06591 -z 667
SANS (2015) South African National Standard (SANS). Drinking Water for SANS, 241, 1–2. 668
https://vinlab.com/wp-content/uploads/2016/10/SANS-241-2015.pdf 669
Sargaonkar A, Deshpande V (2003). Development of an overall index of pollution for surface 670
water based on a general classification scheme in Indian context. Environ MonitAssess, 671
89(1), 43–67. https://doi.org/10.1023/A:1025886025137 672
Şener Ş, Şener E, Davraz A (2017a) Assessment of groundwater quality and health risk in 673
drinking water basin using GIS. J Water Health, 15(1), 112–132. 674
https://doi.org/10.2166/wh.2016.148 675
Şener Ş, Şener E, Davraz A (2017b) Evaluation of water quality using water quality index 676
(WQI) method and GIS in Aksu River (SW-Turkey). Sci Tot Environ, 584–585, 131–677
144. https://doi.org/10.1016/j.scitotenv.2017.01.102 678
Singh G, Kamal RK (2016) Heavy metal contamination and its indexing approach for 679
groundwater of Goa mining region, India. Appl Water Sci, 7(3), 1479–1485. 680
https://doi.org/10.1007/s13201-016-0430-3 681
Subba Rao N (2012) PIG: a numerical index for dissemination of groundwater contamination 682
zones. Hydrol Process, 26(22), 3344–3350. https://doi.org/10.1002/hyp.8456 683
Subba Rao N, Sunitha B, Rambabu R, Rao PVN, Rao PS, Spandana BD, Sravanthi M, 684
Marghade D (2018) Quality and degree of pollution of groundwater, using PIG from a 685
rural part of Telangana State, India. Appl Water Sci, 8(8), 1–13. 686
24
https://doi.org/10.1007/s13201-018-0864-x 687
688
Solangi GS, Siyal AA, Babar MM, Siyal P( 2019) Groundwater quality evaluation using the 689
water quality index (WQI), the synthetic pollution index (SPI), and geospatial tools: a 690
case study of Sujawal district, Pakistan. Hum Ecol Risk Assess, 0(0), 1–21. 691
https://doi.org/10.1080/10807039.2019.1588099 692
Taiwo AM, Michael JO, Gbadebo AM, Oladoyinbo FO (2019) Pollution and health risk 693
assessment of road dust from Osogbo metropolis, Osun state, Southwestern Nigeria. 694
Hum Ecol Risk Assess:1–16. doi:10.1080/10807039. 2018.1563478. 695
Tiwari AK, De Maio M, Amanzio G (2017) Evaluation of Metal Contamination in the 696
Groundwater of the Aosta Valley Region, Italy. Int J Environ Res, 11(3), 291–300. 697
https://doi.org/10.1007/s41742-017-0027-1 698
Ukah BU, Egbueri JC, Unigwe CO, Ubido OE (2019) Extent of heavy metals pollution and 699
health risk assessment of groundwater in a densely populated industrial area, Lagos, 700
Nigeria. International Journal of Energy and Water Resources, 3(4), 291–303. 701
https://doi.org/10.1007/s42108-019-00039-3 702
Verlicchi P, Grillini V (2020) Surfacewater and groundwater quality in South Africa and 703
Mozambique-analysis of the most critical pollutants for drinking purposes and 704
challenges in water treatment selection. Water (Switzerland), 12(1). 705
https://doi.org/10.3390/w12010305 706
Vetrimurugan E, Brindha K, Elango L (2017) Human exposure risk assessment due to heavy 707
metals in groundwater by pollution index and multivariate statistical methods: an 708
application from South Africa. Water 9, 234. 709
Vetrimurugan E, Shruti VC, Jonathan MP, Roy PD, Rawlins BK, Rivera-Rivera DM (2018) 710
Metals and their ecological impact on beach sediments near the marine protected sites of 711
Sodwana Bay and St. Lucia, South Africa. Mar Pollut Bull 127(December 2017), 568–712
575. https://doi.org/10.1016/j.marpolbul.2017.12.044 713
Vhonani GN, Vetrimurugan E, Rajmohan N (2018) Irrigation return flow induced mineral 714
weathering and ion exchange reactions in the aquifer, Luvuvhu catchment, South Africa. 715
J Afr Earth Sci, 149, 517–528. doi.org/10.1016/j.jafrearsci.2018.09.001 716

25
Wagh VM, Panaskar DB, Mukate SV, Gaikwad SK, Muley AA, Varade AM (2018) Health 717
risk assessment of heavy metal contamination in groundwater of Kadava River Basin, 718
Nashik, India. Model Earth Syst Environ 4:969-980 719
Wang D, Wu J, Wang Y, Ji Y (2020) Finding high-quality groundwater resources to reduce 720
the hydatidosis incidence in the Shiqu County of Sichuan Province, China: analysis, 721
assessment, and management. Expo Health12(2):307-322. 722
https://doi.org/10.1007/s12403-019-00314-y 723
Wang L, Li P, Duan R, He X (2021) Occurrence, controlling factors and health risks of Cr6+ 724
in groundwater in the Guanzhong Basin of China. Expo Health. 725
https://doi.org/10.1007/s12403-021-00410-y 726
Watkeys MK, Mason TR, Goodman PS (1993) The rôle of geology in the development of 727
Maputaland, South Africa. J Afr Earth Sci 16:205-221 728
Weitz J, Demlie M (2014) Conceptual modelling of groundwater-surface water interactions 729
in the Lake Sibayi Catchment, Eastern South Africa. J Afr Earth Sci, 99(PA2), 613–624. 730
https://doi.org/10.1016/j.jafrearsci.2013.11.018 731
Wu J, Li P, Qian H, Duan Z, Zhang X (2014) Using correlation and multivariate statistical 732
analysis to identify hydrogeochemical processes affecting the major ion chemistry of 733
waters: Case study in Laoheba phosphorite mine in Sichuan, China. Arab J Geosci 734
7(10):3973-3982. https://doi.org/10.1007/s12517-013-1057-4 735
Wu J, Li P, Wang D, Ren X, Wei M (2020) Statistical and multivariate statistical techniques 736
to trace the sources and affecting factors of groundwater pollution in a rapidly growing 737
city on the Chinese Loess Plateau. Hum Ecol Risk Assess 26(6):1603-1621. 738
https://doi.org/10.1080/10807039.2019.1594156 739
Xiao J, Wang L, Deng L, Jin Z (2019) Characteristics, sources, water quality and health risk 740
assessment of trace elements in river water and well water in the Chinese Loess Plateau. 741
Sci Tot Environ, 650, 2004–2012. https://doi.org/10.1016/j.scitotenv.2018.09.322 742
WHO (2011) Guidelines for drinking water quality, Fourth edition. World Health 743
Organization, Geneva, Swizerland 744
Figures
Figure 1
Map showing samping locations and geology of the study area
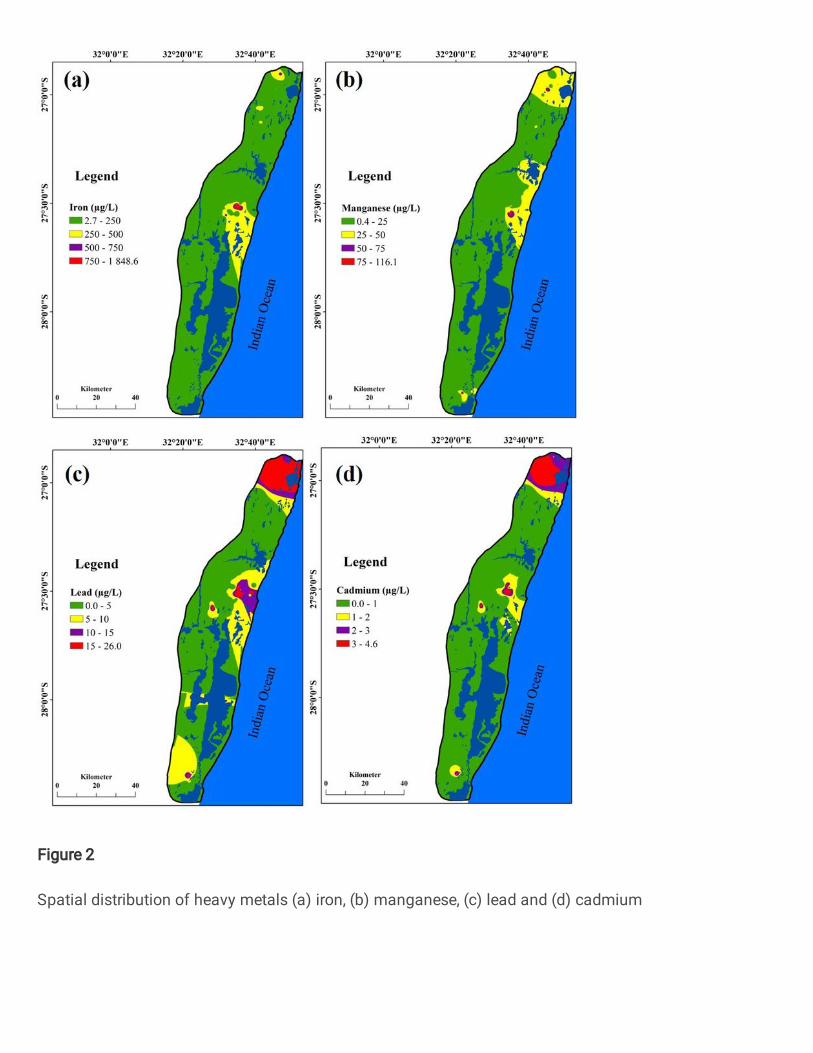
Figure 2
Spatial distribution of heavy metals (a) iron, (b) manganese, (c) lead and (d) cadmium

Figure 3
Classi�cation of groundwater samples (pH versus metal load)

Figure 4
Spatial distribution of (a) heavy metal pollution indices and (b) drinking water quality indices

Figure 5
Comparison between pollution evaluation indices

Figure 6
Spatial distribution of principal components in the study area (a) PC1, (b) PC2, (c) PC3, (d) �nal overlaymap of principal components

Figure 7
Dendogram grouping of analysed parameters

Figure 8
Dendogram grouping groundwater samples with respect to their heavy metal concentrations

Figure 9
Spatial variation of HQ and HI values in (a) children and (b) adult.
Related Documents