1 Integration of Direct Methods With Macromolecular Crystallographic Techniques C. Giacovazzo Dipartimento Geomineralogico, Universita’ di Bari, Campus Universitario, Via Orabona 4, 70125 Bari, Italy. [email protected] D. Siliqi Dipartimento Geomineralogico, Universita’ di Bari, Campus Universitario, Via Orabona 4, 70125 Bari, Italy Department of Inorganic Chemistry, Tirana University, Tirana, Albania [email protected] http://www.ba.cnr.it/~crisds06/ J. Gonzalez-Platas Departamento de Fisica Fundamental y Experimental, Universidad de La Laguna, E-38203 La Laguna, Tenerife. Spain. [email protected] Abstract The role of direct methods in macromolecular crystallography is discussed. The common belief that such methods will still remain marginal is rejected. Different sectors are analyzed. A direct procedure for phasing reflections when diffraction data of one isomorphous derivative are available is briefly described. The applications to experimental data of some test structures succeeded, and suggest that direct methods are competitive with traditional SIR techniques. Attention is also devoted to a formula which is able to recover the total from a partial structure. Direct methods can play a central role also for expanding (and refining) phases from derivative to native resolution, and can constitute an alternative to traditional molecular replacement techniques. 1 Introduction The use of traditional direct methods for solving macromolecular crystal structures or for refining phases was initiated several years ago. It was soon realized that Sayre equation, tangent formula, Karle-Hauptman determinants, etc., even if useful in favorable conditions, were, in general, not competitive with the highly efficient techniques specifically devoted to macromolecular crystallography. The role of direct methods in this area seemed to remain quite marginal until, about two decades ago, a more fruitful integration with macromolecular crystallographic techniques involving isomorphous derivative data started [1]. However, in spite of the extensive theoretical efforts, the practical results were unsatisfactory: while theoretical phase distributions worked fine with calculated (error-free) data, they failed when applied to experimental data. It was claimed that direct methods are too sensitive to experimental errors: indeed they estimate single-phase relationships which, if incorrectly evaluated because of lack of isomorphism or errors in measurements, etc., can disturb in a destructive way the phasing process. This belief has been recently proved wrong: in a series of papers [2], [3], [4], [5], [6] a direct procedure has been described which is able to satisfactorily phase protein reflections provided diffraction data of one isomorphous derivative are available. We will synthesize in this paper the principia of the above series of papers and the main results achieved. Direct methods can do much more for macromolecular crystallography. Triplet phase distributions in the presence of anomalous dispersion effects have been independently derived by Hauptman [7] and by Giacovazzo [8]: they should constitute a useful tool for the efficient phasing of proteins even if a robust procedure is not yet available. For brevity this topic will not be treated in this paper. We will devote the last part of this article to two important sectors of the phasing process: 1) phase refinement and extension. We will shortly describe: a) the results of an innovative solvent flattening program which has been coupled with our direct methods program; b) the use of a formula proposed by Giacovazzo [9] which takes into account the prior information on a partial structure; 2) The use of direct methods for the translation of a model molecule as an alternative to traditional molecular replacement techniques.

Welcome message from author
This document is posted to help you gain knowledge. Please leave a comment to let me know what you think about it! Share it to your friends and learn new things together.
Transcript
1
Integration of Direct Methods With Macromolecular CrystallographicTechniquesC. Giacovazzo
Dipartimento Geomineralogico, Universita’ di Bari, Campus Universitario, Via Orabona 4, 70125 Bari, [email protected]
D. SiliqiDipartimento Geomineralogico, Universita’ di Bari, Campus Universitario, Via Orabona 4, 70125 Bari, Italy
Department of Inorganic Chemistry, Tirana University, Tirana, [email protected]
http://www.ba.cnr.it/~crisds06/
J. Gonzalez-PlatasDepartamento de Fisica Fundamental y Experimental, Universidad de La Laguna,
E-38203 La Laguna, Tenerife. [email protected]
Abstract
The role of direct methods in macromolecularcrystallography is discussed. The common belief that suchmethods will still remain marginal is rejected. Differentsectors are analyzed. A direct procedure for phasingreflections when diffraction data of one isomorphousderivative are available is briefly described. Theapplications to experimental data of some test structuressucceeded, and suggest that direct methods arecompetitive with traditional SIR techniques. Attention isalso devoted to a formula which is able to recover thetotal from a partial structure.Direct methods can play a central role also for expanding(and refining) phases from derivative to native resolution,and can constitute an alternative to traditional molecularreplacement techniques.
1 Introduction
The use of traditional direct methods for solvingmacromolecular crystal structures or for refining phaseswas initiated several years ago. It was soon realized thatSayre equation, tangent formula, Karle-Hauptmandeterminants, etc., even if useful in favorable conditions,were, in general, not competitive with the highly efficienttechniques specifically devoted to macromolecularcrystallography. The role of direct methods in this areaseemed to remain quite marginal until, about two decadesago, a more fruitful integration with macromolecularcrystallographic techniques involving isomorphousderivative data started [1]. However, in spite of theextensive theoretical efforts, the practical results wereunsatisfactory: while theoretical phase distributions
worked fine with calculated (error-free) data, they failedwhen applied to experimental data. It was claimed thatdirect methods are too sensitive to experimental errors:indeed they estimate single-phase relationships which, ifincorrectly evaluated because of lack of isomorphism orerrors in measurements, etc., can disturb in a destructiveway the phasing process. This belief has been recentlyproved wrong: in a series of papers [2], [3], [4], [5], [6] adirect procedure has been described which is able tosatisfactorily phase protein reflections provided diffractiondata of one isomorphous derivative are available. We willsynthesize in this paper the principia of the above series ofpapers and the main results achieved.Direct methods can do much more for macromolecularcrystallography. Triplet phase distributions in the presenceof anomalous dispersion effects have been independentlyderived by Hauptman [7] and by Giacovazzo [8]: theyshould constitute a useful tool for the efficient phasing ofproteins even if a robust procedure is not yet available.For brevity this topic will not be treated in this paper. Wewill devote the last part of this article to two importantsectors of the phasing process:1) phase refinement and extension. We will shortlydescribe: a) the results of an innovative solvent flatteningprogram which has been coupled with our direct methodsprogram; b) the use of a formula proposed by Giacovazzo[9] which takes into account the prior information on apartial structure;2) The use of direct methods for the translation of a modelmolecule as an alternative to traditional molecularreplacement techniques.
2
2 Symbols and abbreviations
Symbols and notations are basically the same as in arecent series of papers [2], [3], [4], [10], [5], [6] (quotedhere as papers I-VI). For the readers convenience they arelisted below.Fp = |Fp|exp(iϕ) Structure factor of the proteinFd = |Fd|exp(iψ) Structure factor of the isomor-
phous derivativeFH = Fd-Fp Structure factor of the heavy-
atom structure (i.e. the atomsadded to the native protein)
Φ = − − −ϕ ϕ ϕh k h k
Ep = R exp(iϕ) Normalized structure factor ofthe protein
Ed = S exp(iψ) Normalized structure factor ofthe isomorphous derivative
Np Number of non-H atoms in theprimitive unit cell for the nativeprotein
NH Number of heavy-atoms in theprimitive unit cell for thederivative
σ i ji
jN Z= ∑ =1 Zj = atomic number of the jth
atom
N eq = σ σ23
32/ (Statistically equivalent) num-
ber of atoms in the primitiveunit cell
[ ]σ σ23
32/
pValue of Neq for the native
protein
[ ]σ σ23
32/
HValue of Neq for the heavy atom
structurefj Atomic scattering factor of the
jth atom
p jp f∑ = ∑ 2 The sum is extended to the
native protein atoms
H jH f∑ = ∑ 2 The sum is extended to the
heavy atom structure
d jd f∑ = ∑ 2 The sum is extended to the
derivative atoms
( ) ( ) ( )D x I x I xi i= / 0 Ii = modified Bessel function of
order i
E Fd d H’ /= Σ1/2 Derivative pseudonormalized
( )= S i’exp ψ structure factor
E Fp p H’ /= Σ1/2 Native pseudonormalized stru-
( )= R i’exp ϕ cture factor
∆ = −S R’ ’ , ∆’ ’ ’= −S T R
( )T D R S= 1 2 ’ ’
F |F |π π πφ= exp(i ) Structure factor of a partial
structure
[ ]σ σπ2
332/ (Statistically equivalent) num-
ber of atoms of the partialstructure for the primitive unitcell.
[ ]σ σ23
32/
q(Statistically equivalent) num-
ber of atoms of the differencestructure obtained bysubtracting the partial from theprotein structure.
Eh’’ Structure factor of the protein
structure pseudo-normalizedwith respect to the differencestructure.
Eπh’’ Structure factor of the partial
structure pseudo-normalizedwith respect to the differencestructure.
APP Avian pancreatic polypeptide[11].
BPO Bacterial haloproxidase fromStreptomyces aurefaciens [12].
E2 Catalitic domain of Azoto-bacter vinlandii dihydrolipoyltransacetylase [13].
M-FABP Recombinant human musclefatty-acid-binding protein [14].
NOX NADH oxidase from Thermusthermophilus [15].
The relevant parameters characterizing the diffraction dataof our test structures are given in Table 1.
3 Direct methods and isomorphousreplacement techniques
The integration of direct methods with isomorphousreplacement techniques (SIR case) was first accomplishedby Hauptman [1]. His main result was the following: thetriplet phase invariant Φ was estimated via a von Misesdistribution whose concentration parameter is acomplicated expression involving the six moduli Rh, Rk,,Rh-k, Sh, Sk, Sh-k. The first application of the method toerror-free data was successful [16] but subsequent tests on
3
real diffraction data were unsatisfactory. The weakness(and the strength) of the method was clearly outlined byFortier, Weeks & Hauptman [17]: the accuracy of thedistribution depends on the scattering difference between
the native protein and the derivative. Heavy errors in theestimate of such differences heavily reduce the efficiencyof the phasing process. The problem was reconsidered by
Table 1 Relevant parameters for the diffraction data of our test structures. NREFL is the number ofmeasured reflections up to the resolution RES for the native and derivative structures.
Native Derivative
Structure code RES(Å) NREFL Heavy atom [σ2]H/[σ2]p RES(Å) NREFL
APP 0.99 17058 Hg 0.055 2.00 2086BPO 2.35 23956 Au 0.028 2.78 15741E2 2.65 10391 Hg 0.021 3.00 9179M-FABP 2.14 7595 Hg 0.015 3.00 7125NOX 3.00 4295 Pt 0.041 3.00 4295
Giacovazzo, Cascarano & Zheng [18]: the distribution
P( )Φ |R , R , R ,S ,S ,Sh k h k h k h k− −
[ ]≅ −2
1π I A Ao ( ) exp( cos )Φ (1)
was obtained for the case “native heavy-atom derivative”,where
[ ]A / R R R/
p= −2 3 2
3 2σ σ h k h k
[ ]+ −2 3 23 2σ σ/ /
H∆ ∆ ∆h k h k (2)
and ( )∆ = − ∑F F /d p H/1 2 is the pseudo-normalized
difference (with respect to the heavy-atom structure).
Since [ ] [ ]σ σ σ σ3 23 2
3 23 2/ //
H
/
p>> , the Cochran
parameter is often negligible with respect to the termincluding pseudonormalized differences: this last mayattain large values even for large proteins. Since∆ ∆ ∆h k h k− may be positive or negative, positive as well
as negative triplets can be identified via (2).Papers I-VI were devoted to describing a procedure forphasing, via distribution (1), all the reflections up toderivative resolution. The procedure succeeded withexperimental data and may be described in a few steps.
3.1 Normalization step
The standard Wilson method is applied to native proteindata (up to native resolution) to obtain the scale factor Kp
and the overall thermal factor Bp. Estimates of thecorresponding factors for the derivative are obtained by adifferential Wilson plot [19] through the equation
( ) ( )ln /Σ Σ Σp H p p dF F+
2 2
( ) ( )= + −ln / /K K B B sinp d d p2 2 2θ λ (3)
Actually from (3) the ratio Rk=Kd/Kp and the difference∆B=Bd-Bp are obtained. Then Bd and Kd are set toBd=Bp+∆B and Kd=KpRk. Equation (3) is not sufficient fora correct rescaling of derivative data on protein data: somesupplementary steps are needed. Since
( )E E E E Ed p p d d p H’ ’ ’ ’ cos
2 2 22+ − − =φ φ
one should expect that
E E E E Td p p d’ ’ ’ ’2 2
12 1+ − = .
Therefore the ∆ values are rescaled by the factor
S E E E E Td p p d= + −
−’ ’ ’ ’
/2 2
1
1 2
2 (4)
to make the experimental distribution of ∆’ closer to the
expected one.The application of (4) does not guarantee a good rescalingmostly when the derivative resolution is equal to or lowerthan 4 �. A big improvement was obtained when thescaling was performed by exploiting the P(∆) distribution(see papers III and V). From the joint probabilitydistribution
( ) ( ) ( )P R R RH p’ ’ ’, ∆ Σ Σ ∆= +4
( )[ ]x R R RH pexp ’ ’ ’− + + +
2 22 2 2Σ Σ ∆ ∆
( )[ ]x I R R0 2 ’ ’ + ∆
one obtains
4
( ) ( )P P R dR∆ ∆= ∫∞
’ ’,0
(5a)
for positive values of ∆ and
( ) ( )P P R dR∆ ∆∆
= ∫−
∞’ ’, (5b)
for negative value of ∆ (the limits of integration are
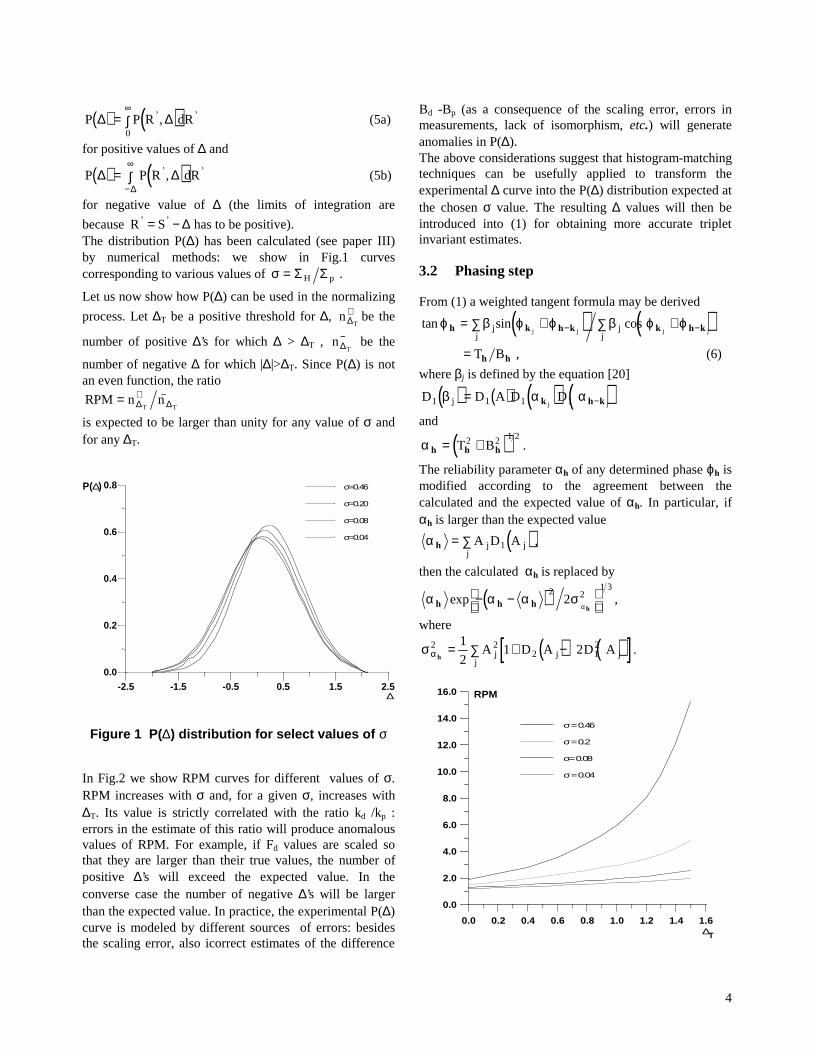
because R S’ ’= − ∆ has to be positive).The distribution P(∆) has been calculated (see paper III)by numerical methods: we show in Fig.1 curvescorresponding to various values of σ = Σ ΣH p .
Let us now show how P(∆) can be used in the normalizing
process. Let ∆T be a positive threshold for ∆, nT∆
+ be the
number of positive ∆’s for which ∆ > ∆T , nT∆
− be the
number of negative ∆ for which |∆|>∆T. Since P(∆) is notan even function, the ratio
RPM n nT T
= + −∆ ∆
is expected to be larger than unity for any value of σ andfor any ∆T.
-2.5 -1.5 -0.5 0.5 1.5 2.5∆
0.0
0.2
0.4
0.6
0.8P(∆) σ=0.46
σ=0.20
σ=0.08
σ=0.04
Figure 1 P(∆) distribution for select values of σ
In Fig.2 we show RPM curves for different values of σ.RPM increases with σ and, for a given σ, increases with∆T. Its value is strictly correlated with the ratio kd /kp :errors in the estimate of this ratio will produce anomalousvalues of RPM. For example, if Fd values are scaled sothat they are larger than their true values, the number ofpositive ∆’s will exceed the expected value. In theconverse case the number of negative ∆’s will be largerthan the expected value. In practice, the experimental P(∆)curve is modeled by different sources of errors: besidesthe scaling error, also icorrect estimates of the difference
Bd -Bp (as a consequence of the scaling error, errors inmeasurements, lack of isomorphism, etc.) will generateanomalies in P(∆).The above considerations suggest that histogram-matchingtechniques can be usefully applied to transform theexperimental ∆ curve into the P(∆) distribution expected atthe chosen σ value. The resulting ∆ values will then beintroduced into (1) for obtaining more accurate tripletinvariant estimates.
3.2 Phasing step
From (1) a weighted tangent formula may be derived
( ) ( )tan cosϕ β ϕ ϕ β ϕ ϕh k h k k h k= +∑ +∑− −jj
jj
sinj j j j
= T Bh h , (6)
where βj is defined by the equation [20]
( ) ( ) ( ) ( )D D A D Dj j j1 1 1 1β α α= −k h k
and
( )α h h h= +T B2 2 1 2.
The reliability parameter αh of any determined phase ϕh ismodified according to the agreement between thecalculated and the expected value of αh. In particular, ifαh is larger than the expected value
( )α h = ∑ A D Aj jj
1 ,
then the calculated αh is replaced by
( )α α α σαh h h
hexp − −
2 21 3
2 ,
where
( ) ( )[ ]σαh
2 22 1
21
21 2= + −∑ A D A D Aj j j
j.
0.0 0.2 0.4 0.6 0.8 1.0 1.2 1.4 1.6∆T
0.0
2.0
4.0
6.0
8.0
10.0
12.0
14.0
16.0 RPM
σ = 0.46
σ = 0.2
σ= 0.08
σ = 0.04
5
Figure 2 RPM curves for some representativevalues of σ against the threshold ∆T.
The weighting scheme is designed to drive phases towardsvalues that mimize the difference between α and α by
reducing in the tangent refinement the importance of thephases with too large values of α.In one possible strategy for the phase determination onecould simultaneously apply the tangent formula (6) to allthe reflections up to derivative resolution. Such a strategywould require the calculation of several tens of millions oftriplets, their cumbersome management by the tangentformula and large storage and computing time.We have chosen a different strategy: first we phase a smallset of reflections with large ∆ and R values ( i.e., batch
1, with NLAR reflections). The strategy is a multisolutionone: a starting set of phases are generated by a randomprocess [21]. Random phases are given to NLAR/2reflections [22] with unit weights for the origin andenantiomorph-fixing reflections, and with weights equal to0.8 for the others. Cycles of weighted tangent refinementare first applied to the NLAR/2 reflections and, afterconvergence, the phasing process is extended to all theNLAR reflections.Among the various trials provided by the multisolutionapproach, the most probable one (on the basis of thefigures of merit: see below) is used as a seed for phasingthe remaining reflections. Batches of about 200reflections, chosen in decreasing order of |∆|, areprogressively phased via a phase extension procedurefrom batch number one.
3.3 The last step: picking up the correctsolution
Figures of merit (FOMs) used in our procedure for pickingthe correct solution from the trial solutions are based onthe theory described in two recent papers [23], [24].Substantial modifications are, however, necessary to facethe large complexity of the problem and to take advantageof the information contained in derivative data.The first FOM is MABS = ∑ ∑α αhh hh , where
( )α ϕ ϕh k h k= +∑
−A sinj
jj j
2
( )+ +∑
−A j
jj j
cos
/
ϕ ϕk h k
2 1 2
and
[ ][ ]
A R R Rj p
H
j j
j j
=
+
−
−
2
2
3 23 2
3 23 2
σ σ
σ σ
/
/ .
h k h k
h k h k∆ ∆ ∆
MABS gives a measure of the consistency of the tripletestimates, but it is not used as an active FOM for picking(in combination with others) the correct solution.The second FOM (i.e., ALFCOMB) depends on the ratio
( )α α σ αh h h− , where σ αh
is given in §3.2. This
expression for the variance holds in the absence of errorsin measurements and in their mathematical treatment aswell as in the presence of perfect isomorphism betweennative and derivative structures. If this is not the case, aswith real data, the variance cannot be perfectly calculatedand is probably underestimated by σ αh
. Accordingly, we
used 2σαh instead of σ αh
in ALFCOMB.
The third FOM (PSICOMB) relies on the expectation thatthe distribution of the psi-zero triplets should be asrandom as possible. PSICOMB depends on the ratios
α σαhh
’’ , where
( )α ϕ ϕh k h k’ ’= +∑
−A sinj
jj j
2
( )+ +∑
−A j
jj j
’
/
cos ϕ ϕk h k
2 1 2
[ ]A j H j j
’ /= −2 3 23 2σ σ ∆ ∆k h k
σαh’
’/
= ∑
A j
j
21 2
.
The weak reflections that constitute psi-zero triplets withthe NLAR reflections are characterized by small values of
both R and ∆’ . Here, there is no room for a FOM based
on classical negative quartet estimates based on nativedata only, which is unreliable for macromolecularstructures of usual size.In our procedure negative and positive triplets play asimilar role: they are nearly equal in number andreliability, and are both actively used in the phasingprocess. We decided to use the ratio
A Aj jj
j jj
cos cosΦ Φ∑ ∑ as a FOM (CPHASE)
involving both positive and negative estimated tripletphases Φ j .
A combined figure of merit (CFOM) integrates theindications arising from ALFCOMB, PSICOMB and
6
CPHASE. The combination of the various FOMs involvessuitable weights which indicate our confidence in them.CFOM allows a satisfactory discrimination of correctversus wrong solutions (see Table 2 for some results). Forall the test structures the highest CFOM solutions are thecorrect ones: in the Table 2 they are marked by boldcharacters. We note: i) figures in Table 2 refer to batch 1,as explained in §3.2. ii) in the last column the averagephase error (ERR) is shown. It is sufficiently small for all
the test structures but NOX. iii) The solution is found infew trials. For all the test structures the maximum numberof trials we explored was 100. We don’t claim that correctsolutions always correspond to the highest CFOM values.Severe lack of isomorphism, errors in measurementsand/or in the treatment of the experimental data willreduce the efficiency of the procedure.
Table 2 FOM values for the ‘best’ trial solutions as ranked by CFOM for the various test structures
APP
Trial MABS ALFCOMB PSICOMB CPHASE CFOM ERR
14 1.10 0.23 0.54 0.91 0.49 3028 1.10 0.23 0.53 0.91 0.49 307 1.10 0.22 0.47 0.91 0.47 82
29 1.09 0.20 0.46 0.91 0.46 8324 0.75 0.00 0.68 0.68 0.43 84
BPO18 0.84 0.40 0.96 0.75 0.63 296 0.58 0.15 0.80 0.57 0.48 84
19 0.58 0.14 0.79 0.57 0.48 83
E224 1.14 0.75 1.0 0.89 0.76 271 1.14 0.75 1.0 0.89 0.76 27
22 1.14 0.75 1.0 0.89 0.76 279 2.05 1.0 0.67 1.0 0.74 86
16 2.05 1.0 0.66 1.0 0.73 8631 0.56 0.14 0.76 0.53 0.46 78
M-FABP24 0.85 0.10 0.57 0.77 0.44 3912 0.72 0.02 0.55 0.69 0.39 636 0.64 0.01 0.54 0.64 0.38 83
NOX61 0.75 0.01 0.78 0.64 0.45 5265 0.75 0.01 0.78 0.64 0.44 5293 0.75 0.01 0.74 0.64 0.43 5366 0.65 0.00 0.74 0.58 0.42 63
The solution may then not be recognizable by the figuresof merit, and may be characterized by a high value ofERR. In extremely unfavourable cases the correct solutioncould not be obttained at all.When the solution is not clearly recognizable, a furthercheck can be used:a) Difference Fourier synthesis with coefficients
( ) ( )F F id p p− exp ϕ are calculated for the solutions with
the highest values of CFOM. The maxima of the mapshould provide heavy-atom positions.b) Such parameters are refined according to the phaserefinement process [25].c) If the refined positional parameters coincide with anallowed origin of the protein space group, then the trialsolution is discarded from the set of reliable ones.
7
Steps a), b) and c) are executed in sequence without userintervention.Why should such a process work? Readers accustomed todirect phasing of small molecules know that insymmorphic space groups the so-called ‘uranium solution’occurs quite frequently. It is marked by a high consistencyof triplets phases, which are all close to zero. An observedFourier synthesis would produce a huge maximum at anallowed origin. This type of false solution may berecognized and therefore discarded by special FOMs likethe psi-zero and negative-quartet criteria. Since the psi-zero FOM described in paper II is not highlydiscriminating for macromolecules and the negative-quartet criterion is not among the used FOMs, thecalculation of the difference Fourier synthesis for proteinsis an efficient substitute for the specific FOMs. It isworthwhile emphasizing that a difference Fourier synthesisshould not provide huge maxima at the allowed origins asfor small molecules: since our phasing procedure uses anearly equivalent number of positive and negative triplets,peak intensities in the maps corresponding to the ‘uraniumsolutions’ are similar to peak intensities corresponding totrue heavy-atom positions.In Table 3, we show, for each test structure and for trialsolutions highly ranked by CFOM, but corresponding totrue or “uranium” solutions, the heavy-atom positions asobtained after some cycles of Fourier-least-squarescalculations. Trials 7 and 29 for APP, 9 and 16 for E2,show maxima at allowed origins and could therefore bediscarded. This increases the discriminating power ofCFOM. It may be concluded that in general, if use is madeof the above considerations, the correct solution can befound with higher reliability among the different trials.
Table 3 Heavy-atom positions for each teststructure and for trial solutions highly ranked by
CFOM (compare with Table 2). The correctsolutions are in bold characters.
Structure Name Trial Heavy-atom position
APP 1428729
0.246 0.009 0.2270.244 0.010 0.2260.000 0.390 0.5000.000 .0396 0.500
BPO 18 0.591 0.026 0.2790.221 0.112 0.311
E2 241
22916
0.203 0.070 0.2140.203 0.069 0.2130.203 0.070 0.2150.000 0.000 0.5000.000 0.000 0.500
M-FABP 24 0.609 0.441 0.742
NOX 616593
0.393 0.242 0.5240.393 0.242 0.5240.893 0.242 0.225
4 Intermediate results
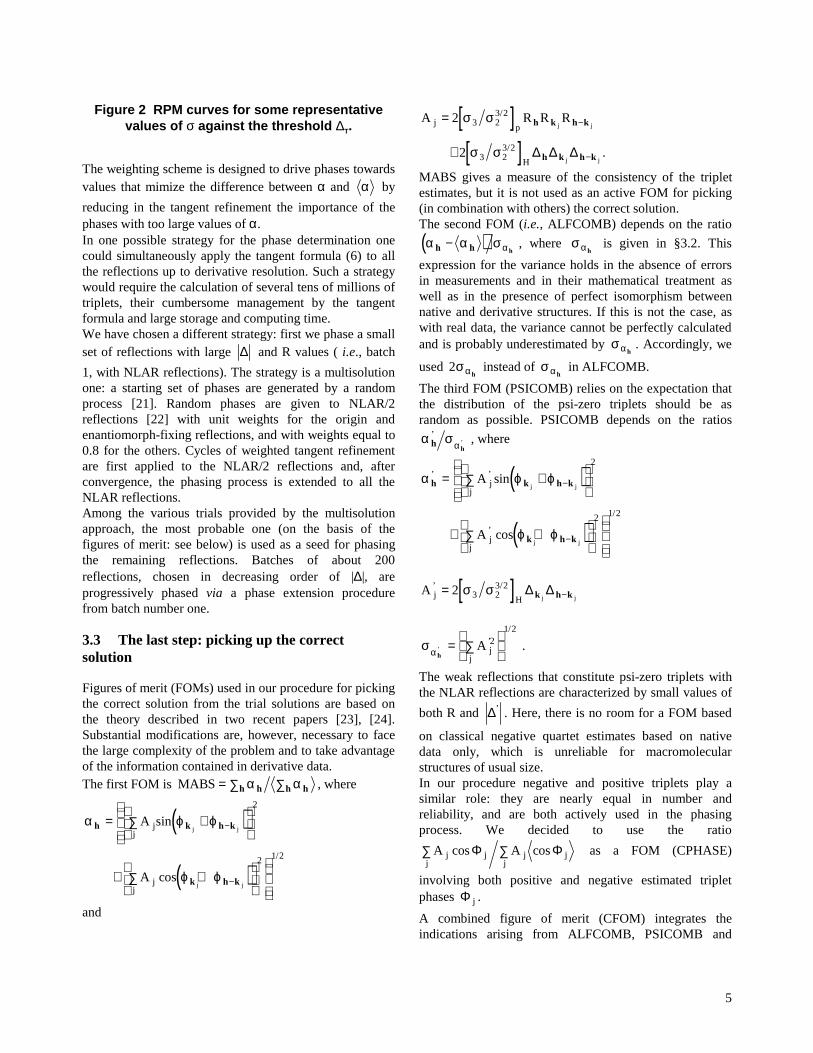
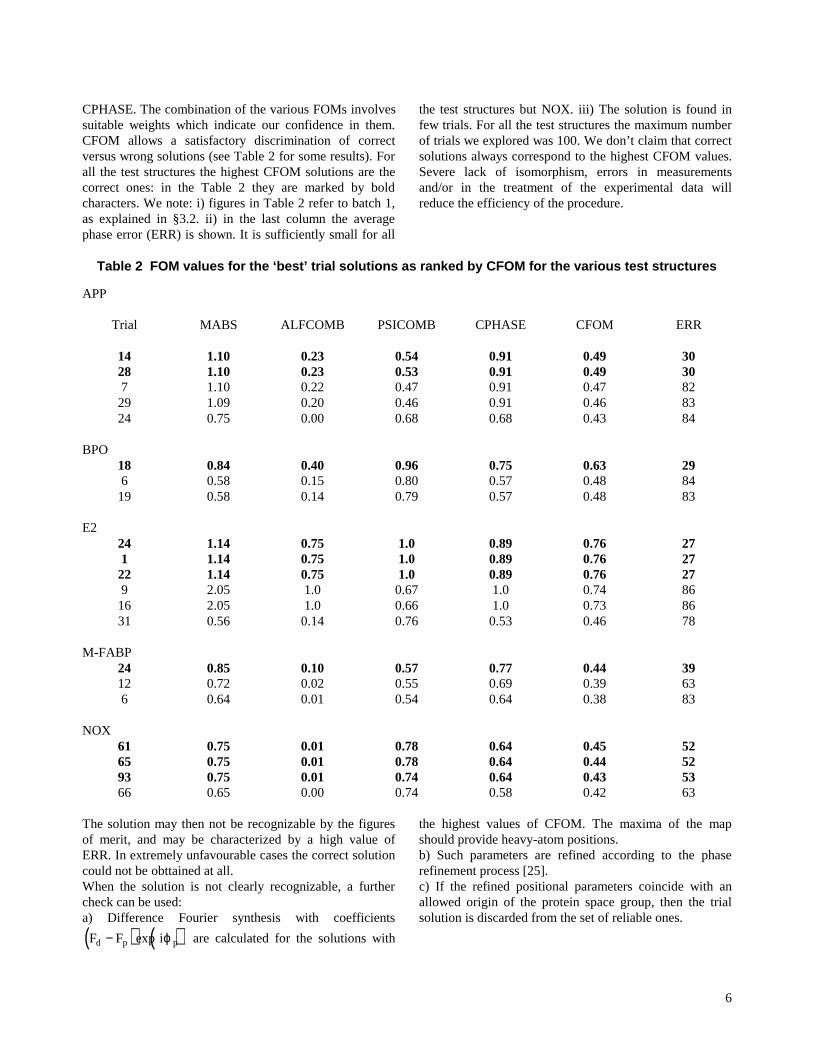
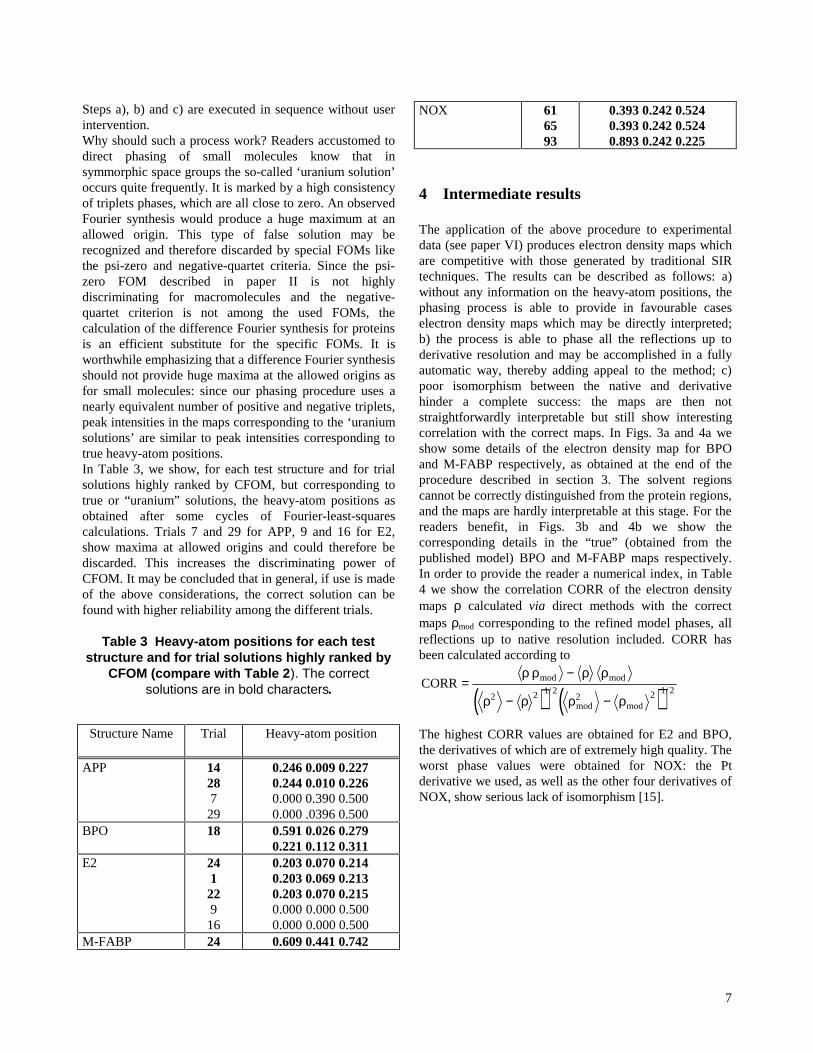
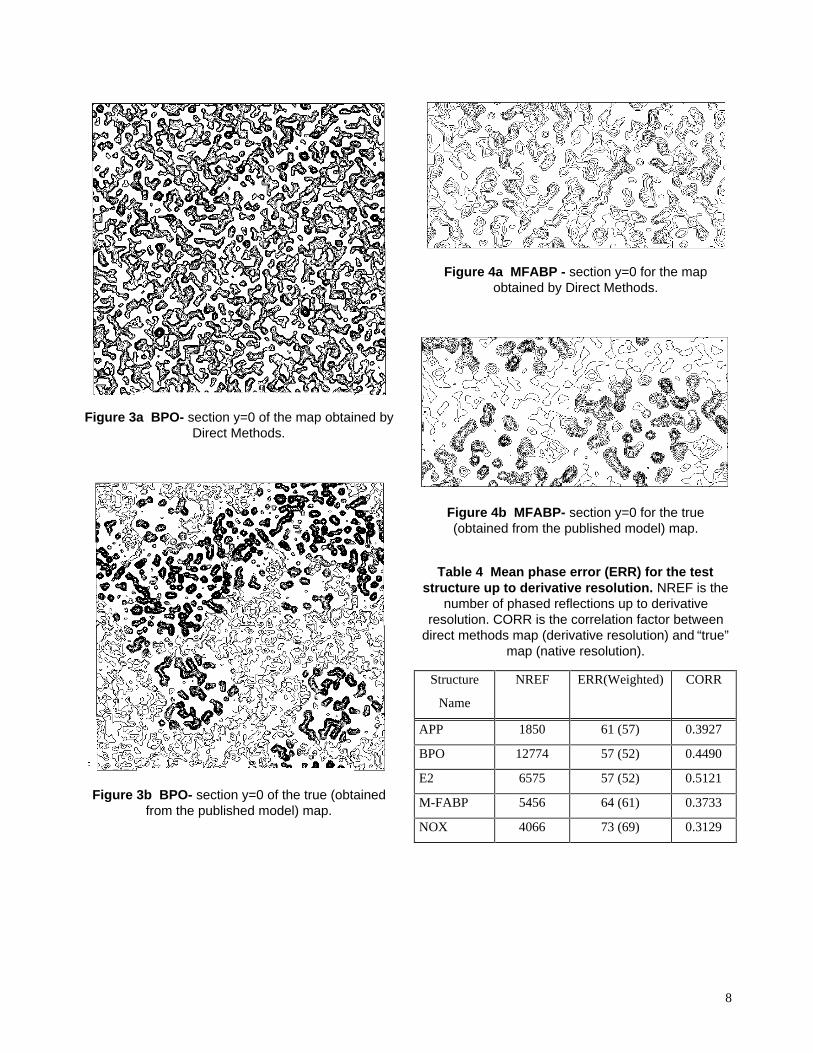
The application of the above procedure to experimentaldata (see paper VI) produces electron density maps whichare competitive with those generated by traditional SIRtechniques. The results can be described as follows: a)without any information on the heavy-atom positions, thephasing process is able to provide in favourable caseselectron density maps which may be directly interpreted;b) the process is able to phase all the reflections up toderivative resolution and may be accomplished in a fullyautomatic way, thereby adding appeal to the method; c)poor isomorphism between the native and derivativehinder a complete success: the maps are then notstraightforwardly interpretable but still show interestingcorrelation with the correct maps. In Figs. 3a and 4a weshow some details of the electron density map for BPOand M-FABP respectively, as obtained at the end of theprocedure described in section 3. The solvent regionscannot be correctly distinguished from the protein regions,and the maps are hardly interpretable at this stage. For thereaders benefit, in Figs. 3b and 4b we show thecorresponding details in the “true” (obtained from thepublished model) BPO and M-FABP maps respectively.In order to provide the reader a numerical index, in Table4 we show the correlation CORR of the electron densitymaps ρ calculated via direct methods with the correctmaps ρmod corresponding to the refined model phases, allreflections up to native resolution included. CORR hasbeen calculated according to
( ) ( )CORR =
−
− −
ρ ρ ρ ρ
ρ ρ ρ ρ
mod mod/
mod mod
/2 2 1 2
2 2 1 2
The highest CORR values are obtained for E2 and BPO,the derivatives of which are of extremely high quality. Theworst phase values were obtained for NOX: the Ptderivative we used, as well as the other four derivatives ofNOX, show serious lack of isomorphism [15].
8
Figure 3a BPO- section y=0 of the map obtained byDirect Methods.
Figure 3b BPO- section y=0 of the true (obtainedfrom the published model) map.
Figure 4a MFABP - section y=0 for the mapobtained by Direct Methods.
Figure 4b MFABP- section y=0 for the true(obtained from the published model) map.
Table 4 Mean phase error (ERR) for the teststructure up to derivative resolution. NREF is the
number of phased reflections up to derivativeresolution. CORR is the correlation factor between
direct methods map (derivative resolution) and “true”map (native resolution).
Structure
Name
NREF ERR(Weighted) CORR
APP 1850 61 (57) 0.3927
BPO 12774 57 (52) 0.4490
E2 6575 57 (52) 0.5121
M-FABP 5456 64 (61) 0.3733
NOX 4066 73 (69) 0.3129

9
5 Phase refinement and extension up tonative resolution
Refinement of the phases determined up to derivativeresolution can be made as soon as a model of the heavy-atom structure is available. As specified in section 3heavy-atoms are straightforwardly found by differenceFourier: their parameters (occupancy, coordinates andthermal factor) are then automatically refined.Several techniques for improving direct-method phases byincorporating the heavy-atom structure have beenproposed: particularly notable are those proposed byFortier, Moore & Fraser [26] and by Klop, Krabbendam &Kroon [27]. None of these methods were useful at thisstage: the above techniques seem to work well whencareful phase estimates are available, and at this stage thisis not the case. However in a paper in preparation(Giacovazzo & Siliqi) it is shown that heavy-atomsubstructure can in favourable cases lead to a notableimprovement of the phases determined as in section 4.We show in Table 5 the mean-phase errors and the CORRvalues obtained when the heavy-atom substructure isavailable (to be compared with Table 4).In terms of CORR only APP and M-FABP showremarkable improvement of the electron density map. Inthe other cases, the information of the heavy atomstructure does not produce any improvement in term ofCORR index, but reduces the heavy-atom residual in theelectron density map. Accordingly, the new phases provedto be a better starting point for the application oftechniques devoted to extending phases up to nativeresolution: we refer mostly to solvent flattening [28], [29]and histogram matching techniques [30], [31].
Table 5 Mean phase error (ERR) when theinformation on the heavy-atom structure has
been exploited (data up to derivative resolution).NREF is the number of phased reflections up to
derivative resolution. CORR is the correlation factorbetween direct methods map (derivative resolution)
and “true” map (native resolution)
Structure
Name
NREF ERR(Weighted) CORR
APP 1854 58 (53) 0.4667
BPO 12613 57 (48) 0.4525
E2 6408 56 (47) 0.5026
M-FABP 5616 64 (59) 0.3992
NOX 4006 74 (67) 0.2939
In the same paper by Giacovazzo & Siliqi, an innovatesolvent-flattening procedure has been settled, whichcarefully extends and refines phases up to the nativeresolution. For our test structures, we show in Table 6 thefinal correlation values between our final electron densitymaps and the “true” maps. All the maps but NOX areeasily interpretable, as is suggested by the high values ofCORR. The serious lack of isomorphism of the Ptderivative of NOX did not allow the method to producebatch one phases sufficiently good to be used as a seed forsubsequent expansion. NOX will be a useful test when twoor more derivatives will be used by our direct methodsprocedure.
Table 6 Mean phase error (ERR) after theapplication of our solvent-flattening procedure:
phase has been extended to the set of data up tonative resolution. NREF is the number of phased
reflections up to native resolution. CORR is thecorrelation factor between our final map and the
“true” map.
Structure
Name
NREF ERR(Weighted) CORR
APP 17058 51 (44) 0.8150
BPO 23956 52 (46) 0.7391
E2 10391 41 (38) 0.8761
M-FABP 7589 53 (46) 0.7093
NOX 4619 77 (74) 0.2743
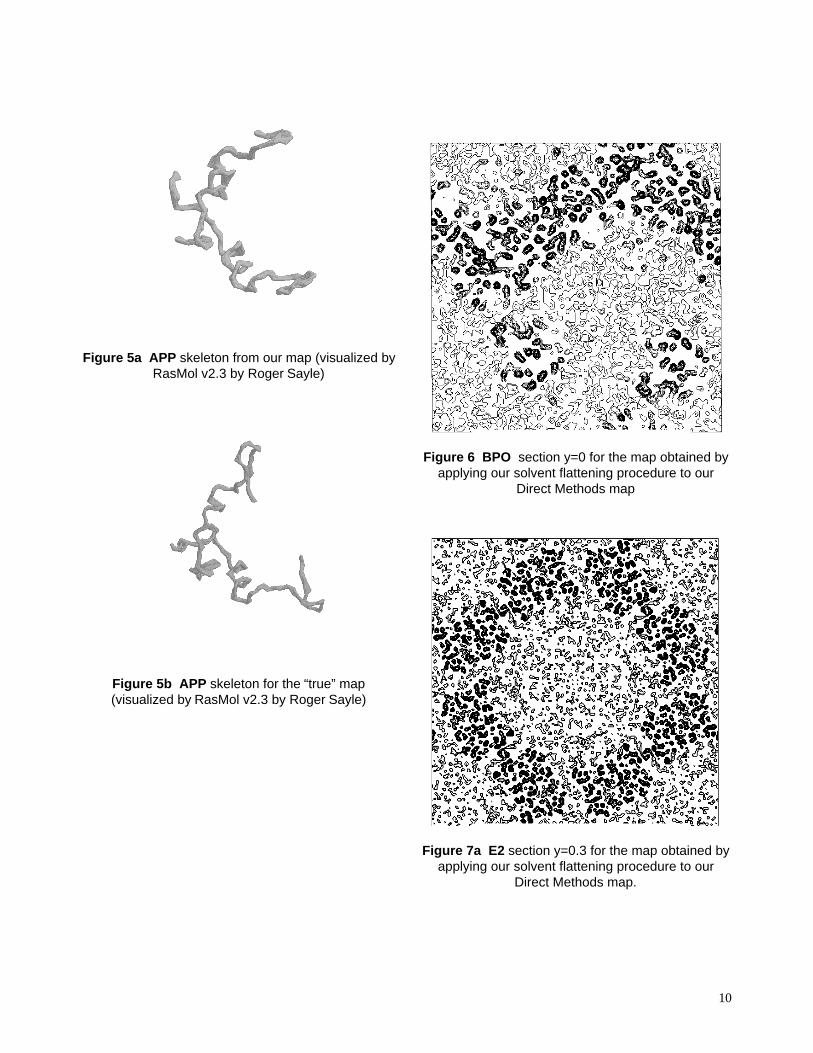
To allow the reader to check the quality of the new mapswe show: a) in Figs. 5a and 5b the APP skeleton obtainedfrom our map and from the “true” map respectively; b) InFigs. 6, 7a and 8 some sections of our electron densitymaps for BPO, E2 and M-FABP (to be compared withtrue electron density map sections shown in Figs. 3b, 7band 4b respectively).
10
Figure 5a APP skeleton from our map (visualized byRasMol v2.3 by Roger Sayle)
Figure 5b APP skeleton for the “true” map(visualized by RasMol v2.3 by Roger Sayle)
Figure 6 BPO section y=0 for the map obtained byapplying our solvent flattening procedure to our
Direct Methods map
Figure 7a E2 section y=0.3 for the map obtained byapplying our solvent flattening procedure to our
Direct Methods map.
11
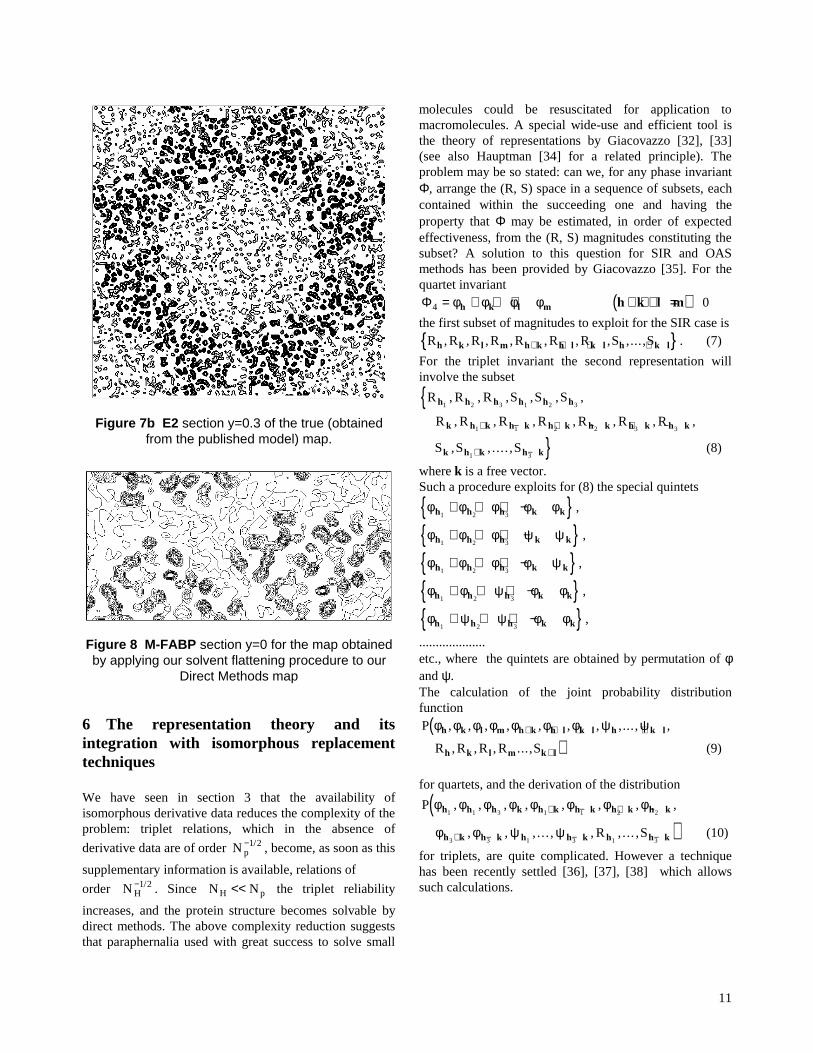
Figure 7b E2 section y=0.3 of the true (obtainedfrom the published model) map.
Figure 8 M-FABP section y=0 for the map obtainedby applying our solvent flattening procedure to our
Direct Methods map
6 The representation theory and itsintegration with isomorphous replacementtechniques
We have seen in section 3 that the availability ofisomorphous derivative data reduces the complexity of theproblem: triplet relations, which in the absence of
derivative data are of order N p−1 2/ , become, as soon as this
supplementary information is available, relations of
order N H−1 2/ . Since N NH p<< the triplet reliability
increases, and the protein structure becomes solvable bydirect methods. The above complexity reduction suggeststhat paraphernalia used with great success to solve small
molecules could be resuscitated for application tomacromolecules. A special wide-use and efficient tool isthe theory of representations by Giacovazzo [32], [33](see also Hauptman [34] for a related principle). Theproblem may be so stated: can we, for any phase invariantΦ, arrange the (R, S) space in a sequence of subsets, eachcontained within the succeeding one and having theproperty that Φ may be estimated, in order of expectedeffectiveness, from the (R, S) magnitudes constituting thesubset? A solution to this question for SIR and OASmethods has been provided by Giacovazzo [35]. For thequartet invariantΦ4 = + + +φ φ φ φh k l m ( )h k l m+ + + = 0
the first subset of magnitudes to exploit for the SIR case is
{ }R R R R R R R S Sh k l m h k h l k l h k l, , , , , , , ,...,+ + + + . (7)
For the triplet invariant the second representation willinvolve the subset
{R R R S S Sh h h h h h1 2 3 1 2 3, , , , , ,
R R R R R R Rk h k h k h k h k h k h k, , , , , , ,1 1 2 2 3 3+ − + − + −
}S S Sk h k h k, , .... ,1 3+ − (8)
where k is a free vector.Such a procedure exploits for (8) the special quintets
{ }φ φ φ φ φh h h k k1 2 3+ + + − ,
{ }φ φ φ ψ ψh h h k k1 2 3+ + + − ,
{ }φ φ φ φ ψh h h k k1 2 3+ + + − ,
{ }φ φ ψ φ φh h h k k1 2 3+ + + − ,
{ }φ ψ ψ φ φh h h k k1 2 3+ + + − ,
....................etc., where the quintets are obtained by permutation of φand ψ.The calculation of the joint probability distributionfunction
(P φ φ φ φ φ φ φ ψ ψh k l m h k h l k l h k l, , , , , , , ,..., ,+ + + +
)R R R R Sh k l m k l, , , ..., + (9)
for quartets, and the derivation of the distribution
(P φ φ φ φ φ φ φ φh h h k h k h k h k h k1 1 3 1 1 2 2, , , , , , , ,+ − + −
)φ φ ψ ψh k h k h h k h h k3 3 1 3 1 3+ − − −, , , ... , , , ... ,R S (10)
for triplets, are quite complicated. However a techniquehas been recently settled [36], [37], [38] which allowssuch calculations.
12
6.1 The quartet invariant estimate
The joint probability distribution function (9) has beenderived [36], [37] (see also [39] for a related method) viathe Gram-Charlier expansion of the characteristic function.Let us denote
( ) ( )R i i1 1exp expφ φ= R h h ,
( ) ( )R i i2 2exp expφ φ= R k k ,
( ) ( )R i i3 3exp expφ φ= R l l ,
( ) ( )R i i4 4exp expφ φ= R m m ,
( ) ( )R i i5 5exp expφ φ= + +R h k h k ,
( ) ( )R i i6 6exp expφ φ= + +R lh l h ,
( ) ( )R i i7 7exp expφ φ= + +R k l k l ,
( ) ( )S i S i1 1exp expψ ψ= h h ,
( ) ( )S i S i2 2exp expψ ψ= k k ,
( ) ( )S i S i3 3exp expψ ψ= l l ,
( ) ( )S i S i4 4exp expψ ψ= m m ,
( ) ( )S i S i5 5exp expψ ψ= + +h k h k ,
( ) ( )S i S i6 6exp expψ ψ= + −h l h l ,
( ) ( )S i S i7 7exp expψ ψ= + +k l k l
The conclusive conditional formula is
( )P R R S SΦ4 1 7 1 7| ,..., , ,...,
( )[ ] { }≅ −2 0 4
1
4 4πI A Aexp cosΦ (11)
where
{ }AN B
L L LH
41 2 3 4
5 6 72
11≅
++ + +
∆ ∆ ∆ ∆ ’ ’ ’
[
]
BN
L L L L L L
L L L L L L
L L L L L L
H
= +
+ +
+ +
1
2 1 2 5 3 4 5
1 3 6 2 4 6
1 4 7 2 3 7
’ ’ ’ ’ ’ ’
’ ’ ’ ’ ’ ’
’ ’ ’ ’ ’ ’
( )L S R R S Di i i i i i’ ’ ’ ’ ’= + − −2 2
12 1 (12)
The main features of the formula may be so described:
a) the relation is of the order N H−1 . Since N H is usually
small, quartets are expected to be reliable (at least inprinciple).b) the sign of A4 is determined by the product of twofactors: the first is ∆ ∆ ∆ ∆1 2 3 4 , which may be positive or
negative, the second is the term [ ]1 5 6 7+ + +L L L’ ’ ’
which again may be positive or negative.
c) Li’ is the expected value of ε H Hi i
E= −2
1 . In
absence of prior information on the heavy-atom structure
Li’ may only be estimated by probabilistic
considerations [that is, by the formula (12)]. Errors in
measurements, lack of isomorphism, etc., can make Li’
remarkably different from ε Hi. In these cases quartet
estimates are expected to be wrong. Once the heavy-atomstructure becomes available, A4 may be replaced by
[ ]{ }AN B
cH c
H H H=+
+ + +2
111 2 3 4
5 6 7∆ ∆ ∆ ∆
ε ε ε (13)
where
( )BNc
HH H H H H H H H H= + + +
1
2 1 2 5 3 4 5 2 3 7ε ε ε ε ε ε ε ε ε... .
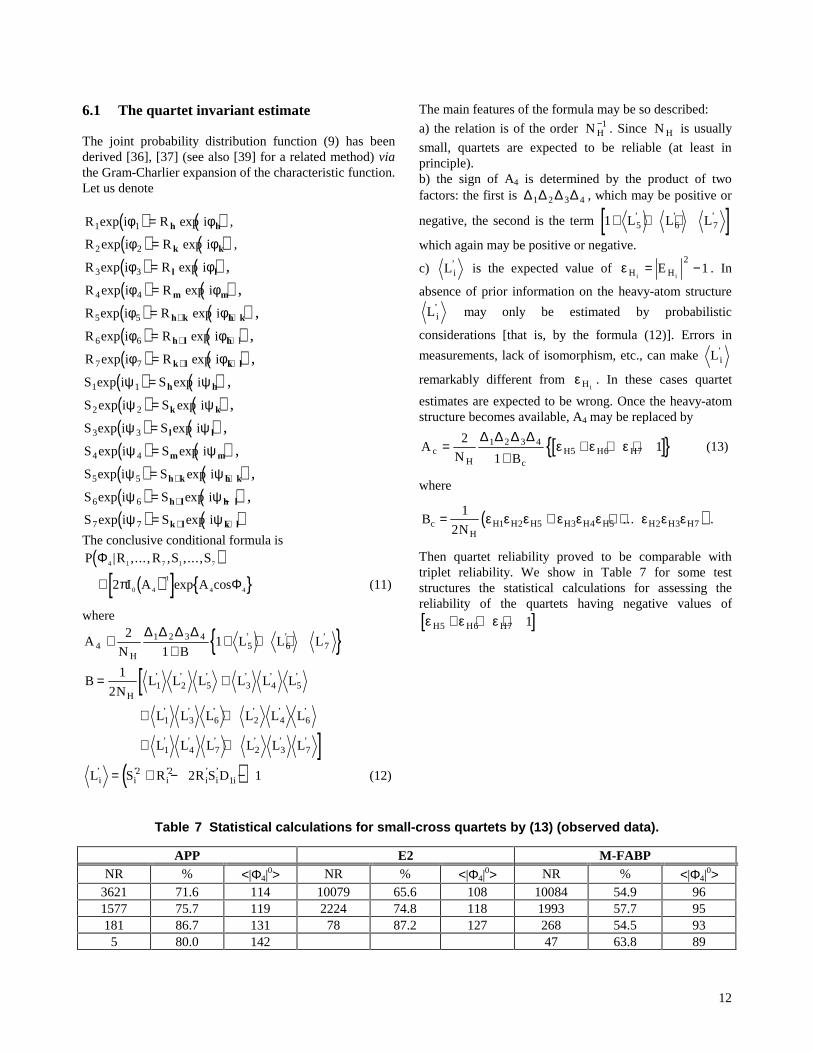
Then quartet reliability proved to be comparable withtriplet reliability. We show in Table 7 for some teststructures the statistical calculations for assessing thereliability of the quartets having negative values of
[ ]ε ε εH H H5 6 7 1+ + +
Table 7 Statistical calculations for small-cross quartets by (13) (observed data).
APP E2 M-FABPNR % <|Φ4|
0> NR % <|Φ4|0> NR % <|Φ4|
0>3621 71.6 114 10079 65.6 108 10084 54.9 961577 75.7 119 2224 74.8 118 1993 57.7 95181 86.7 131 78 87.2 127 268 54.5 93
5 80.0 142 47 63.8 89
13
13 69.2 85
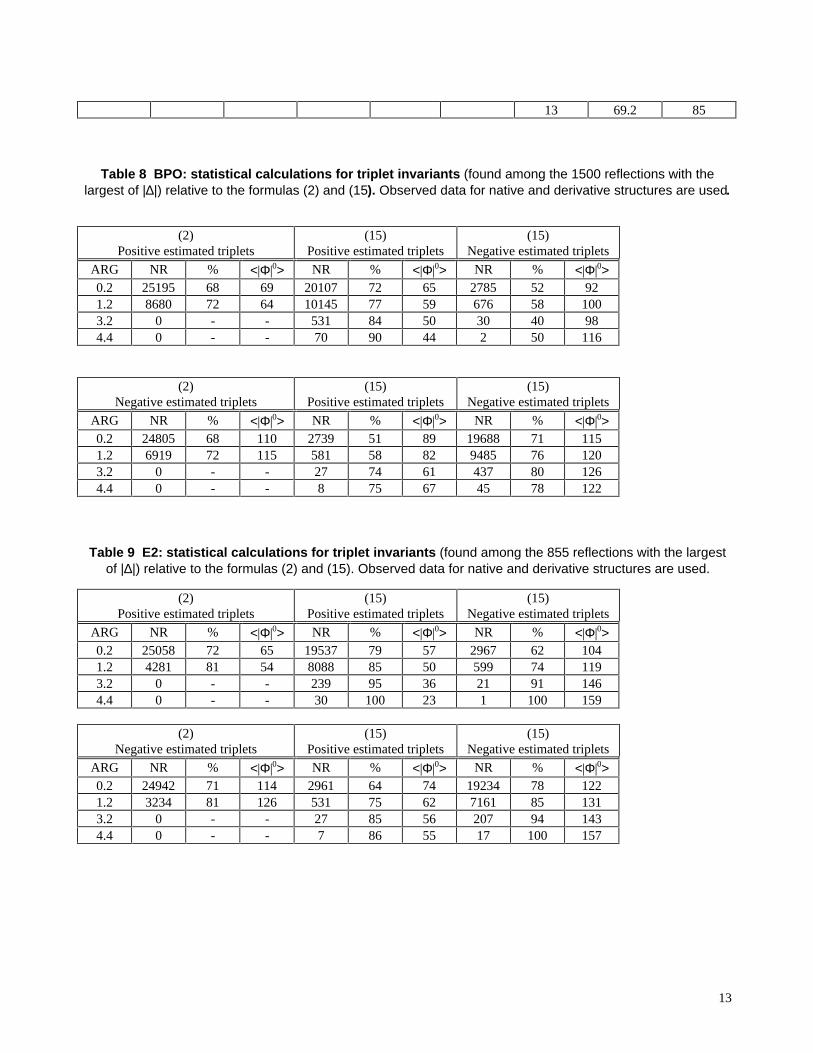
Table 8 BPO: statistical calculations for triplet invariants (found among the 1500 reflections with thelargest of |∆|) relative to the formulas (2) and (15). Observed data for native and derivative structures are used.
(2)Positive estimated triplets
(15)Positive estimated triplets
(15)Negative estimated triplets
ARG NR % <|Φ|0> NR % <|Φ|0> NR % <|Φ|0>0.2 25195 68 69 20107 72 65 2785 52 921.2 8680 72 64 10145 77 59 676 58 1003.2 0 - - 531 84 50 30 40 984.4 0 - - 70 90 44 2 50 116
(2)Negative estimated triplets
(15)Positive estimated triplets
(15)Negative estimated triplets
ARG NR % <|Φ|0> NR % <|Φ|0> NR % <|Φ|0>0.2 24805 68 110 2739 51 89 19688 71 1151.2 6919 72 115 581 58 82 9485 76 1203.2 0 - - 27 74 61 437 80 1264.4 0 - - 8 75 67 45 78 122
Table 9 E2: statistical calculations for triplet invariants (found among the 855 reflections with the largestof |∆|) relative to the formulas (2) and (15). Observed data for native and derivative structures are used.
(2)Positive estimated triplets
(15)Positive estimated triplets
(15)Negative estimated triplets
ARG NR % <|Φ|0> NR % <|Φ|0> NR % <|Φ|0>0.2 25058 72 65 19537 79 57 2967 62 1041.2 4281 81 54 8088 85 50 599 74 1193.2 0 - - 239 95 36 21 91 1464.4 0 - - 30 100 23 1 100 159
(2)Negative estimated triplets
(15)Positive estimated triplets
(15)Negative estimated triplets
ARG NR % <|Φ|0> NR % <|Φ|0> NR % <|Φ|0>0.2 24942 71 114 2961 64 74 19234 78 1221.2 3234 81 126 531 75 62 7161 85 1313.2 0 - - 27 85 56 207 94 1434.4 0 - - 7 86 55 17 100 157
14
6.2 The triplet invariant estimate via its secondrepresentation
The joint probability distribution (9) has been derived [38]via the Gram-Charlier expansion of the characteristicfunction. Let us denote
( ) ( )( ) ( )( ) ( )( ) ( )( ) ( )( ) ( )( ) ( )( ) ( )( ) ( )( ) ( )
R i R i
R i R i
R i R i
R i R i
R i R i
R i R i
R i R i
R i R i
R i R i
R i R i
1 1
2 2
3 3
4 4
5 5
1 6
7 7
8 8
9 9
10 10
1
2 2
3
4
1 1
1 1
2 2
2 2
3 3
3 3
exp exp
exp exp
exp exp
exp exp
exp exp
exp exp
exp exp
exp exp
exp exp
exp exp
φ φ
φ φ
φ φ
φ φ
φ φ
φ φ
φ φ
φ φ
φ φ
φ φ
=
=
=
=
=
=
=
=
=
=
+ +
− −
+ +
− −
+ +
− −
h h
h h
h h
h k
h k h k
h k h k
h k h k
h k h k
h k h k
h k h k
1
3
( ) ( )( ) ( )
( ) ( )
S i S i
S i S i
S i S i
1 1
2 2
10 10
1
2 2
3 3
exp exp
exp exp
.......
exp exp
φ ψ
φ ψ
φ ψ
=
=
= − −
h h
h h
h k h k
1
The conclusive formula estimating the triplet invariant Φmay be written as
( )[ ] ( )P I A A10 0 101
102=−
π exp cos Φ (14)
where
[ ]A R R Rp
10 3 23 2
1 2 32= σ σ/ /
+ + ∑
2 11 2 3∆ ∆ ∆’
NCORR
Hk
k(15)
( )CORRT
L L L Bk
k
k
=+ +1 1 2 3
’ ’ ’
[]
T N L L L L L L L
L L L L L L
Hk = + +
+ + +
−14 5 8 6 7 7 10
8 9 5 10 6 9
’ ’ ’ ’ ’ ’ ’
’ ’ ’ ’ ’ ’ ,
( ) [
]
B N L L L L L L
L L L L L L
L L L L L L
L L L L L L
L L L L L L
L L L L L L
L L L
Hk = +
+ +
+ +
+ +
+ +
+ +
+
−2
11 2 3 1 4 5
1 4 6 1 7 10
1 8 9 2 4 7
2 4 8 2 5 10
2 6 9 3 4 9
3 4 10 3 5 8
3 6 7
’ ’ ’ ’ ’ ’
’ ’ ’ ’ ’ ’
’ ’ ’ ’ ’ ’
’ ’ ’ ’ ’ ’
’ ’ ’ ’ ’ ’
’ ’ ’ ’ ’ ’
’ ’ ’
We observe:a) the distribution (14) is a von Mises-type function: it isunimodal, and the expected value of Φ is 0 or π accordingto whether A is positive or negative.
b) for proteins the term [ ]2 3 23 2
1 2 3σ σ/ /
pR R R is quite
often negligible with respect to the second term in (15). Itcan be neglected.c) the contribution from the second phasing shell canchange the value of the expected phase. According to thefirst representation formula, Φ is expected to be zero if
( )∆ ∆ ∆1 2 3 is positive, is expected to be π if ( )∆ ∆ ∆1 2 3
is negative. In the second representation formula the term
( )CORRT
L L L Bk
k
k
=+ +1 1 2 3
’ ’ ’ may be considered
a correction term which modulates the first representationestimate. If CORR k
k∑ < −1the second representation
estimate is different by π from the first representationestimate.
As in the quartet case Li’ is an estimate of ε Hi , which
may fail when lack of isomorphism and/or errors in theexperimental data occur. If the heavy-atom structure is
available then ε Hi may be used instead of Li’ . We
show in Tables 8 and 9 the applications of (15) to E2 andBPO experimental data. The data should be read asfollows: triplet estimated positive by (2) are split by (15)in positive and negative estimated triplets. Analogously,triplets estimated negative by (2) are splitted by (15) inpositive and negative subsets. It is evident that (15) ismore efficient than (2) in ranking triplet reliability and inestimating their cosine sign. A useful practical detail isthat the results in Tables 8 and 9 are obtained byexploiting only (about) 20 quintets per triplet.
15
7 The partial structure as a source of priorinformation
A probabilistic formula by Giacovazzo [9] originallydesigned for small molecules, allows the recover of thecomplete from a partial structure. The formula may bewritten as
E E",
"h h≅ π
[ ]+ −∑ −− −σ σ π π3 23 2/ "
," "
,"E E
q( E )( E )k k
kh k h k (16)
If the known partial structure is negligible (in terms ofnumber of electrons) with respect to the complete structurethen
[ ] [ ]σ σ σ σ π π π3 23 2
3 23 2 0/ /
,’’
,’’
,’’,
q NE E E≅ ≅ ≅ ≅−h k h k
and (16) reduces to Sayre’s equation.In terms of phases (16) is equivalent totan θ π πh = T B (17)
where
{ [ ]( )[
( )( )( )]}
T R R sin
R R sin
R R sin
R R sin
R R sin
qπ π π
π π
π π
π π π π
ϕ σ σ
ϕ ϕ
ϕ ϕ
ϕ ϕ
ϕ ϕ
= +
× +∑
− +
− +
+ +
− −
− −
− −
− −
2 3 23 2
h h h
k h k k h kk
k h k k h k
k h k k h k
k h k k h k
’’,
’’,
/
’’ ’’
,’’ ’’
,
’’,
’’,
,’’
,’’
, ,
[ ]( )[
( )( )
( )]}
B R R /
R R
R R
R R
R R
",
",
/
q
" "
," "
,
",
",
,"
,"
, ,
π π π
π π
π π
π π π π
φ σ σ
φ φ
φ φ
φ φ
φ φ
= +
× +∑
− +
− +
+ +
− −
− −
− −
− −
2 3 23 2
h h
k
k
h
k h k k h k
k h k k h k
h k k h k
k h k k h k
cos
cos
cos
cos
cos
θh is the most probable value of φh and
( )α π π π,
/T Bh = +2 2 1 2
(18)
is its reliability parameter.Equation (16) has been recently reconsidered with respectto its possible use in macromolecular crystallography. In afeasibility study by Giacovazzo & Gonzalez-Platas [10],experimental tests on protein data show that the formula ispotentially able to estimate phases accurately, provided30-40% of the electron density is correctly located. Realcases were not examined. In the future, eq. (16) will beapplied to a situation frequently occurring in practice:phase extension from derivative to native resolution, and
phase refinement. The use of (16) is the reciprocalcounterpart of electron density modification techniques.Indeed a basic step of these techniques is to fix criteria todefine the structure part, say ρπ ; by Fourier inversion φπ is
calculated. Once this has been made φπ is used, incombination with the old values, as better approximationof the true phase value.On the other hand (16) comes from the electron densitysquaring under the prior condition that ρπ is known. The
supplemental contribution of order [ ]σ σ3 23 2/
q comes
from the squaring of the unknown part of the structureunder the restraint that ρπ is known. To devise the
optimal use of (9) for practical cases is notstraightforward, because it involves good approximationsof the phases φk and φh k− (which are not always
available). Presently we are exploring differentapproaches.
8 Molecular replacement techniques anddirect methods
The role of direct methods in the molecular replacementarea has so far been quite marginal. Main [40] considered,among other kinds of prior information, the followingones: a) randomly positioned and randomly orientedatomic groups; b) randomly positioned but correctlyoriented atomic groups. Such categories of informationgive rise to a von Mises distribution for triplet invariantphases such as
( ) ( ){ }P K Q E E EΦ Φ Φ= −exp cos22 3h h h1
(19)
where Q and Φ can be defined in terms of the prior
information, and the E’s are the structure factorsnormalized by taking the prior into account.In case a) the Main formula encompasses a previousHauptman [41] formula [called B(z,t)] which is devoted tocalculating the average of an exponential term which goesover all orientations of the triangle formed by three atoms:
( ) ( )[ ]B z t i, exp ’ ’= ⋅ + ⋅2π h r h r
In case b), Φ is expected to lie between 0 and 2π: the
use of such values and of the corresponding reliabilityparameter should automatically translate the modelstructure in the correct position.Additional phase relationships (which are not structureinvariants or seminvariants) devoted to the translationproblem were obtained by Giacovazzo [42] for polarspace groups. In such cases the shift τ which brings amolecular fragment from a trial to the correct position maybe restricted to a region which is smaller than the unit cell.
16
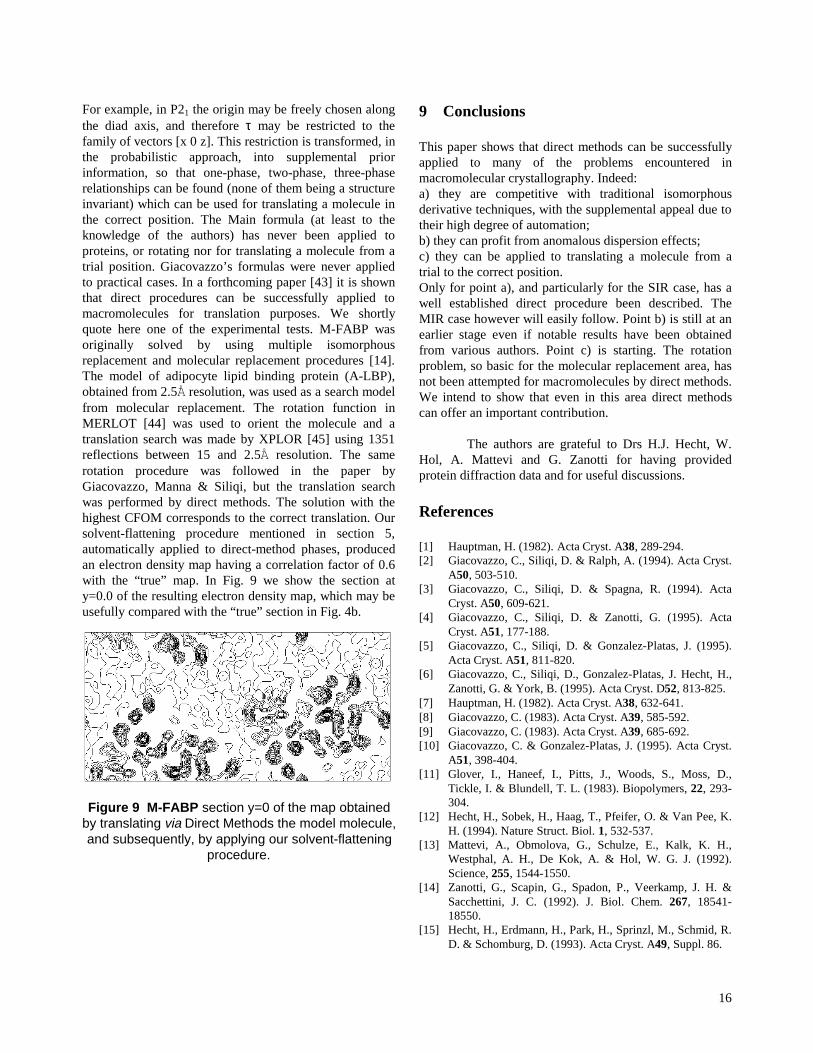
For example, in P21 the origin may be freely chosen alongthe diad axis, and therefore τ may be restricted to thefamily of vectors [x 0 z]. This restriction is transformed, inthe probabilistic approach, into supplemental priorinformation, so that one-phase, two-phase, three-phaserelationships can be found (none of them being a structureinvariant) which can be used for translating a molecule inthe correct position. The Main formula (at least to theknowledge of the authors) has never been applied toproteins, or rotating nor for translating a molecule from atrial position. Giacovazzo’s formulas were never appliedto practical cases. In a forthcoming paper [43] it is shownthat direct procedures can be successfully applied tomacromolecules for translation purposes. We shortlyquote here one of the experimental tests. M-FABP wasoriginally solved by using multiple isomorphousreplacement and molecular replacement procedures [14].The model of adipocyte lipid binding protein (A-LBP),obtained from 2.5� resolution, was used as a search modelfrom molecular replacement. The rotation function inMERLOT [44] was used to orient the molecule and atranslation search was made by XPLOR [45] using 1351reflections between 15 and 2.5� resolution. The samerotation procedure was followed in the paper byGiacovazzo, Manna & Siliqi, but the translation searchwas performed by direct methods. The solution with thehighest CFOM corresponds to the correct translation. Oursolvent-flattening procedure mentioned in section 5,automatically applied to direct-method phases, producedan electron density map having a correlation factor of 0.6with the “true” map. In Fig. 9 we show the section aty=0.0 of the resulting electron density map, which may beusefully compared with the “true” section in Fig. 4b.
Figure 9 M-FABP section y=0 of the map obtainedby translating via Direct Methods the model molecule,and subsequently, by applying our solvent-flattening
procedure.
9 Conclusions
This paper shows that direct methods can be successfullyapplied to many of the problems encountered inmacromolecular crystallography. Indeed:a) they are competitive with traditional isomorphousderivative techniques, with the supplemental appeal due totheir high degree of automation;b) they can profit from anomalous dispersion effects;c) they can be applied to translating a molecule from atrial to the correct position.Only for point a), and particularly for the SIR case, has awell established direct procedure been described. TheMIR case however will easily follow. Point b) is still at anearlier stage even if notable results have been obtainedfrom various authors. Point c) is starting. The rotationproblem, so basic for the molecular replacement area, hasnot been attempted for macromolecules by direct methods.We intend to show that even in this area direct methodscan offer an important contribution.
The authors are grateful to Drs H.J. Hecht, W.Hol, A. Mattevi and G. Zanotti for having providedprotein diffraction data and for useful discussions.
References
[1] Hauptman, H. (1982). Acta Cryst. A38, 289-294.[2] Giacovazzo, C., Siliqi, D. & Ralph, A. (1994). Acta Cryst.
A50, 503-510.[3] Giacovazzo, C., Siliqi, D. & Spagna, R. (1994). Acta
Cryst. A50, 609-621.[4] Giacovazzo, C., Siliqi, D. & Zanotti, G. (1995). Acta
Cryst. A51, 177-188.[5] Giacovazzo, C., Siliqi, D. & Gonzalez-Platas, J. (1995).
Acta Cryst. A51, 811-820.[6] Giacovazzo, C., Siliqi, D., Gonzalez-Platas, J. Hecht, H.,
Zanotti, G. & York, B. (1995). Acta Cryst. D52, 813-825.[7] Hauptman, H. (1982). Acta Cryst. A38, 632-641.[8] Giacovazzo, C. (1983). Acta Cryst. A39, 585-592.[9] Giacovazzo, C. (1983). Acta Cryst. A39, 685-692.[10] Giacovazzo, C. & Gonzalez-Platas, J. (1995). Acta Cryst.
A51, 398-404.[11] Glover, I., Haneef, I., Pitts, J., Woods, S., Moss, D.,
Tickle, I. & Blundell, T. L. (1983). Biopolymers, 22, 293-304.
[12] Hecht, H., Sobek, H., Haag, T., Pfeifer, O. & Van Pee, K.H. (1994). Nature Struct. Biol. 1, 532-537.
[13] Mattevi, A., Obmolova, G., Schulze, E., Kalk, K. H.,Westphal, A. H., De Kok, A. & Hol, W. G. J. (1992).Science, 255, 1544-1550.
[14] Zanotti, G., Scapin, G., Spadon, P., Veerkamp, J. H. &Sacchettini, J. C. (1992). J. Biol. Chem. 267, 18541-18550.
[15] Hecht, H., Erdmann, H., Park, H., Sprinzl, M., Schmid, R.D. & Schomburg, D. (1993). Acta Cryst. A49, Suppl. 86.
17
[16] Hauptman, H., Potter, S. & Weeks, C. M. (1982). ActaCryst. A38, 294-300
[17] Fortier, S., Weeks, C. M., Hauptman, H. (1984). ActaCryst. A40, 544-548
[18] Giacovazzo, C., Cascarano, G. & Zheng, C.-D. (1988).Acta Cryst. A44, 45-51.
[19] Blundell, T.L. & Johnson, L.N. (1976). ProteinCrystallography, p. 336, London: Academic Press.
[20] Altomare, A., Cascarano, C., Giacovazzo, C., Guagliardi,A., Burla, M.C., Polidori, G. & Camalli, M. (1994). J.Appl. Cryst. 27, 435.
[21] Baggio, R., Woolfson, M.M., Declercq, J-P. & Germain,G. (1978). Acta Cryst. A34, 883-892
[22] Burla, M.C., Cascarano, G. & Giacovazzo, C. (1992). ActaCryst. A48, 906-912.
[23] Cascarano, G., Giacovazzo, C. & Viterbo, D. (1987). ActaCryst. A4843, 22-29.
[24] Cascarano, G., Giacovazzo, C. & Guagliardi, A. (1992b).Acta Cryst. A48, 859-865.
[25] Dickerson, R.E., Kendrew, J.C & Strandberg, B.E. (1961).Acta Cryst. 14, 1188-1195.
[26] Fortier, S., Moore, N. J. & Fraser, M. E. (1985). ActaCryst. A41, 571-577.
[27] Klop, E. A., Krabbendam, H. & Kroon, J. (1987). ActaCryst. A43, 810-820.
[28] Wang, B.C. (1985). In “Methods in Enzymology”,Vol.115 (Wyckoff, H.W., Hirs, C.H.W. and Timasheff,S.N., ed.), p.90-112.
[29] Leslie, A.G.W (1987). Acta Cryst. A43, 41-46[30] Lunin, V. Y (1993). Acta Cryst. D49, 90-99.[31] Zhang, K.Y.J. & Main, P. (1990). Acta Cryst. A46, 41-46[32] Giacovazzo, C. (1977) Acta Cryst. A33, 934-944[33] Giacovazzo, C. (1980) Acta Cryst. A36, 362-373[34] Hauptman, H. (1976). Acta Cryst. A32, 934-940[35] Giacovazzo, C. (1984) International School of
Crystallography, lecture notes, in Direct Methods ofSolving Crystal Structures, Erice, Italy
[36] Giacovazzo, C. & Siliqi, D. (1996). Acta Cryst. A52, 133-142
[37] Giacovazzo, C. & Siliqi, D. (1996). Acta Cryst. A52, 143-151
[38] Giacovazzo, C. & Siliqi, D. (1996). Acta Cryst. A53, 000-000 (submitted)
[39] Kiriakidis, C.E., Peschar, R. & Shenk, H. (1996) ActaCryst. A52, 77-87
[40] Main, P. (1976) Crystallographic Computing Techniques,edited by F. Ahmed, p 99-105, Copenhagen; Munskgaard
[41] Hauptman, H. (1965). Z. Krist. 121, 1-8[42] Giacovazzo, C. (1988). Acta Cryst. A44, 294-300.[43] Giacovazzo, C., Manna, L. & Siliqi, D. (1997) in
preparation[44] Fitzgerald, P.M.D. (1988). J. Appl. Cryst. 21, 273-278.[45] Br�nger, A.T. (1990) XPLOR version 2.1, manual. A
system for crystallography and NMR.
Related Documents