Journal of Membrane Science 365 (2010) 294–301 Contents lists available at ScienceDirect J ournal of Membrane Science journal homepage: www.elsevier.com/locate/memsci Integration of conventional electrodialysis and electrodialysis with bipolar membranes for production of organic acids Yaoming Wang, Xu Zhang, Tongwen Xu ∗ Laboratory of Functional Membranes, School of Chemistry and Materials Science, University of Science and Technology of China, Hefei, Anhui 230026, People’s Republic of China a r t i c l e i n f o Article history: Received 22 July 2010 Received in revised form 6 September 2010 Accepted 11 September 2010 Available online 17 September 2010 Keywords: Conventional electrodialysis Electrodialysis with bipolar membranes Organic acids Gluconic acid Ion exchange membrane a b s t r a c t To reduce the cost of electrodialysis with bipolar membranes (EDBM) for production of organic acids, conventional electrodialysis (CED) was integrated with EDBM, i.e., CED supplied concentrated organic salts as the feed to EDBM. To assess the adaptability of this integration, sodium gluconate was chosen as a model agent for production of gluconic acid. Results indicated that this integration could achieve an app arent cur ren t effi ciencyhighe r tha n 100 % andlow ene rgyconsumpt iondue to theinward concentra- tion of gluconate and electrode reactions in CED. Besides, the process cost of CED–EDBM was estimated to be $0. 31kg −1 , which was less than that of EDBM ($0.39kg −1 ). This integration not only made the production cost-effective but also kept the operation of EDBM stable. © 2010 Elsevier B.V. All rights reserved. 1. Intro ducti on To date, electrodialysis with bipolar membranes (EDBM) has been accepted as an environmentally benign acidifying technique for production of organic acids because it can split water into H + and OH − inside bipolar membranes and supply H + and OH − in situ without introduction of other salts [1–4]. Though EDBM is of the envi ronmen tal benign ity , it hasnot been industrialized wid ely due to the high process cost. On one hand, the bipolar membrane is costl y ($1350 m −2 in China). On the other, a decrease in current efficiency and a sharp increase in energy consumption often occur ata hi gh conver si on rate of organi c salt s in EDBM due to the depl e- tion of salts in the feed compartment and the diffusion of organic acids. When it comes to this shortcoming, it can be overcome to a great extent by keeping the salt above a certain concentration in the feed compartment. For this purpose, conventional electrodial- ysis (CED) can be employed to concentrate organic salts and feed theconcentratetoEDBM.Such concept hasbeen app lied to pro cess dairy products [5,6] and organic salts [2,7], and acquired positive effects. Note that these integrations had CED and EDBM operate separately, i.e., the dilute solution of salt was first concentrated to a high level in CED and then fed into EDBM. Different from the reports above, this research integrates CED and EDBM for production of organic acids, and the synergy of CED ∗ Correspondin g author. Tel.: +86 551 360 1587; fax: +86 551 360 1592. E-mail address: [email protected] (T. Xu). and EDBM will be the focus of this research. For experiments, sod iumgluco nat e (Na Glu ) is cho senas a mod el organi c sal t, andthe effects of some par ame ter s, suc h as thecurrentdensit y of CED, elec- trolyte concentration, and stack configurations, on the production of gluconic acid (HGlu) will be investigated. 2. Exper iment al 2.1. Materi als A cat ion-exchange membrane (Ne osepta CMX, Tok uya ma Soda Inc., Japan), an anion-exchange membrane (Neosepta AMX, Tokuya ma Soda Inc ., Jap an) , anda bip ola r membrane (Neose ptaBP- 1, Tok uya ma Soda Inc., Jap an) were used forexperi ments,and the ir prope rties are liste d in Table 1. The chemi cals were of analy tical grade. Distilled water was used throughout. 2.2. Experi menta l set-up As shown in Fig. 1, a laboratory-scale setup was used for exper- iments. The CED and EDBM stacks were composed of one anode and one cat hode as wel l as membra nes (BP, bip ola r exc hange membrane; A, anion exchange membra ne; C, catio n exchan ge membrane). For integration, CED is combined with an EDBM stack of BP–C configuration (Fig. 1a CED–EDBM (BP–C)) and an EDBM stack of BP–A configuration (Fig. 1b CED–EDBM (BP–A)), respec- tively. For comparison with the CED–EDBM setup, an EDBM stack of BP– C con figu rat ion( Fi g. 1c EDBM (BP–C) ) waschosensinceBP–C 0376-7388/$ – see front matter © 2010 Elsevier B.V. All rights reserved. doi:10.1016/j.memsci.2010.09.018

Welcome message from author
This document is posted to help you gain knowledge. Please leave a comment to let me know what you think about it! Share it to your friends and learn new things together.
Transcript

8/4/2019 Integration of Conventional Electrodialysis and Electrodialysis With Bipolar
http://slidepdf.com/reader/full/integration-of-conventional-electrodialysis-and-electrodialysis-with-bipolar 1/8
Journal of Membrane Science 365 (2010) 294–301
Contents lists available at ScienceDirect
Journal of Membrane Science
j o u r n a l h o m e p a g e : w w w . e l s e v i e r . c o m / l o c a t e / m e m s c i
Integration of conventional electrodialysis and electrodialysis with bipolar
membranes for production of organic acids
Yaoming Wang, Xu Zhang, Tongwen Xu ∗
Laboratory of Functional Membranes, School of Chemistry and Materials Science, University of Science and Technology of China,
Hefei, Anhui 230026, People’s Republic of China
a r t i c l e i n f o
Article history:
Received 22 July 2010Received in revised form 6 September 2010
Accepted 11 September 2010
Available online 17 September 2010
Keywords:
Conventional electrodialysis
Electrodialysis with bipolar membranes
Organic acids
Gluconic acid
Ion exchange membrane
a b s t r a c t
To reduce the cost of electrodialysis with bipolar membranes (EDBM) for production of organic acids,
conventional electrodialysis (CED) was integrated with EDBM, i.e., CED supplied concentrated organic
salts as the feed to EDBM. To assess the adaptability of this integration, sodium gluconate was chosen as
a model agent for production of gluconic acid. Results indicated that this integration could achieve an
apparent current efficiencyhigher than 100% andlow energyconsumptiondue to theinward concentra-
tion of gluconate and electrode reactions in CED. Besides, the process cost of CED–EDBM was estimated
to be $0.31kg−1, which was less than that of EDBM ($0.39kg−1). This integration not only made the
production cost-effective but also kept the operation of EDBM stable.
© 2010 Elsevier B.V. All rights reserved.
1. Introduction
To date, electrodialysis with bipolar membranes (EDBM) hasbeen accepted as an environmentally benign acidifying technique
for production of organic acids because it can split water into H+
and OH− inside bipolar membranes and supply H+ and OH− in situ
without introduction of other salts [1–4]. Though EDBM is of the
environmental benignity, it has not been industrialized widely due
to the high process cost. On one hand, the bipolar membrane is
costly ($1350 m−2 in China). On the other, a decrease in current
efficiency and a sharp increase in energy consumption often occur
at a high conversion rate of organic salts in EDBM due to the deple-
tion of salts in the feed compartment and the diffusion of organic
acids. When it comes to this shortcoming, it can be overcome to a
great extent by keeping the salt above a certain concentration in
the feed compartment. For this purpose, conventional electrodial-
ysis (CED) can be employed to concentrate organic salts and feedthe concentrate to EDBM. Such concept hasbeen applied to process
dairy products [5,6] and organic salts [2,7], and acquired positive
effects. Note that these integrations had CED and EDBM operate
separately, i.e., the dilute solution of salt was first concentrated to
a high level in CED and then fed into EDBM.
Different from the reports above, this research integrates CED
and EDBM for production of organic acids, and the synergy of CED
∗ Corresponding author. Tel.: +86 551 360 1587; fax: +86 551 360 1592.
E-mail address: [email protected] (T. Xu).
and EDBM will be the focus of this research. For experiments,
sodiumgluconate (NaGlu) is chosenas a model organic salt, andthe
effects of some parameters, such as thecurrent density of CED, elec-trolyte concentration, and stack configurations, on the production
of gluconic acid (HGlu) will be investigated.
2. Experimental
2.1. Materials
A cation-exchange membrane (Neosepta CMX, Tokuyama
Soda Inc., Japan), an anion-exchange membrane (Neosepta AMX,
Tokuyama Soda Inc., Japan), anda bipolar membrane (NeoseptaBP-
1, Tokuyama Soda Inc., Japan) were used forexperiments,and their
properties are listed in Table 1. The chemicals were of analytical
grade. Distilled water was used throughout.
2.2. Experimental set-up
As shown in Fig. 1, a laboratory-scale setup was used for exper-
iments. The CED and EDBM stacks were composed of one anode
and one cathode as well as membranes (BP, bipolar exchange
membrane; A, anion exchange membrane; C, cation exchange
membrane). For integration, CED is combined with an EDBM stack
of BP–C configuration (Fig. 1a CED–EDBM (BP–C)) and an EDBM
stack of BP–A configuration (Fig. 1b CED–EDBM (BP–A)), respec-
tively. For comparison with the CED–EDBM setup, an EDBM stack
of BP–C configuration(Fig. 1c EDBM (BP–C)) waschosensince BP–C
0376-7388/$ – see front matter © 2010 Elsevier B.V. All rights reserved.
doi:10.1016/j.memsci.2010.09.018

8/4/2019 Integration of Conventional Electrodialysis and Electrodialysis With Bipolar
http://slidepdf.com/reader/full/integration-of-conventional-electrodialysis-and-electrodialysis-with-bipolar 2/8
Y. Wang et al. / Journal of Membrane Science 365 (2010) 294–301 295
Table 1
Properties of the membranes used in CED and EDBM stack.
Membrane type Thickness (m) IEC (meq g−1) Area resistance (cm2 ) Voltage drop (V) Efficiency (%)
Neosepta BP-1 200–350 – – 1.2-2.2 >98
Neosepta AMX 120–180 1.4–1.7 2.0–3.5 – –
Neosepta CMX 220–260 1.5–1.8 2.0–3.5 – –
The data are collected from the product brochure provided by the company.
configuration is the mostfavorable stackconfiguration for econom-ical consideration [8]. Take the CED–EDBM (BP–C) setup (Fig. 1a)
for an example, there are 3 loops: the concentrate compartment
of CED and the acid compartment of EDBM were connected as
a loop; the other two loops were established between the dilute
compartments of CED and the electrode compartments of EDBM,
respectively. Each loop was equipped with an external 1000 cm3
beaker, allowing for continuous circulation by a submersible pump
(AP1000, Zhongshan Zhenghua Electronics Co. Ltd., China). The
effective membrane area was 7.07 cm2. The electrodes were made
of titanium coated with ruthenium. The electrodes were con-
nectedwith a directcurrent power supply(WYL1703×2, Hangzhou
Yuhang Siling Electronics Co. Ltd., China). Before the current was
applied, the solution of each compartment was circulated for half
an hour, and all the visible gas bubbles were eliminated. Na 2SO4
was added as electrode rinse in the EDBM stack.
Note that the feed in this study is not with pure gluconate ion,
but with electrolyte (Na2SO4) as well. The reason for this is the
low conductivity of gluconate ion and small effective membrane
area of the stack. As the membrane area is directly correlated to
the feed concentration. It is uneconomical to perform this small
scale (membrane area of 7.07cm2) CED–EDBM process with high
feed concentration (higher than 0.5 mol dm−3). If the CED–EDBM
stack in this study is conducted under pure condition (only with
gluconate ion in the feed), the voltage drop of the stack is too much
high (higher than 100 V) and the energy consumption is too much
high correspondingly. Moreover, a large amount of heat is gen-
erated under high voltage condition, which is detrimental to the
Fig. 1. Configurations of CED–EDBM stacks and a single EDBM stack: (a) CED–EDBM (BP–C); (b) CED–EDBM (BP–A); (C) EDBM (BP–C). BP, bipolar membrane; C, cation-
exchange membrane; A, anion-exchange membrane.
8/4/2019 Integration of Conventional Electrodialysis and Electrodialysis With Bipolar
http://slidepdf.com/reader/full/integration-of-conventional-electrodialysis-and-electrodialysis-with-bipolar 3/8
296 Y. Wang et al. / Journal of Membrane Science 365 (2010) 294–301
0 20 40 60 80 100 120
0.00
0.02
0.04
0.06
0.08
0 20 40 60 80 100 120
8
10
12
14
16
18
20
22
20mA·cm-2
30mA·cm-2
40mA·cm-2
50mA·cm-2
60mA·cm-2
V o
l t a g e
d r o p o
f C E D
( V )
Time (min)
a
0 20 40 60 80 100 120
12
13
14
15
16
17
18
V o
l t a g e d r o p of E DBM ( V )
b
A c i d c o n c e n t r a
t i o n
(
m o
l · d m
- 3)
Time ( min)
20mA·cm-2
30mA·cm-2
40mA·cm-2
50mA·cm-2
60mA·cm-2
20 30 40 50 60
1.5
2.0
2.5
3.0
3.5
4.0
apparent energy consumption
total energy consumption
c
Current density( mA·cm-2)
E n e r g y c o n s u m p t i o n
(
k W h · k g
- 1)
60
80
100
120
140
apparent current efficiency
absolute current efficiency
C ur r e n
t e f f i c i e n c y ( % )
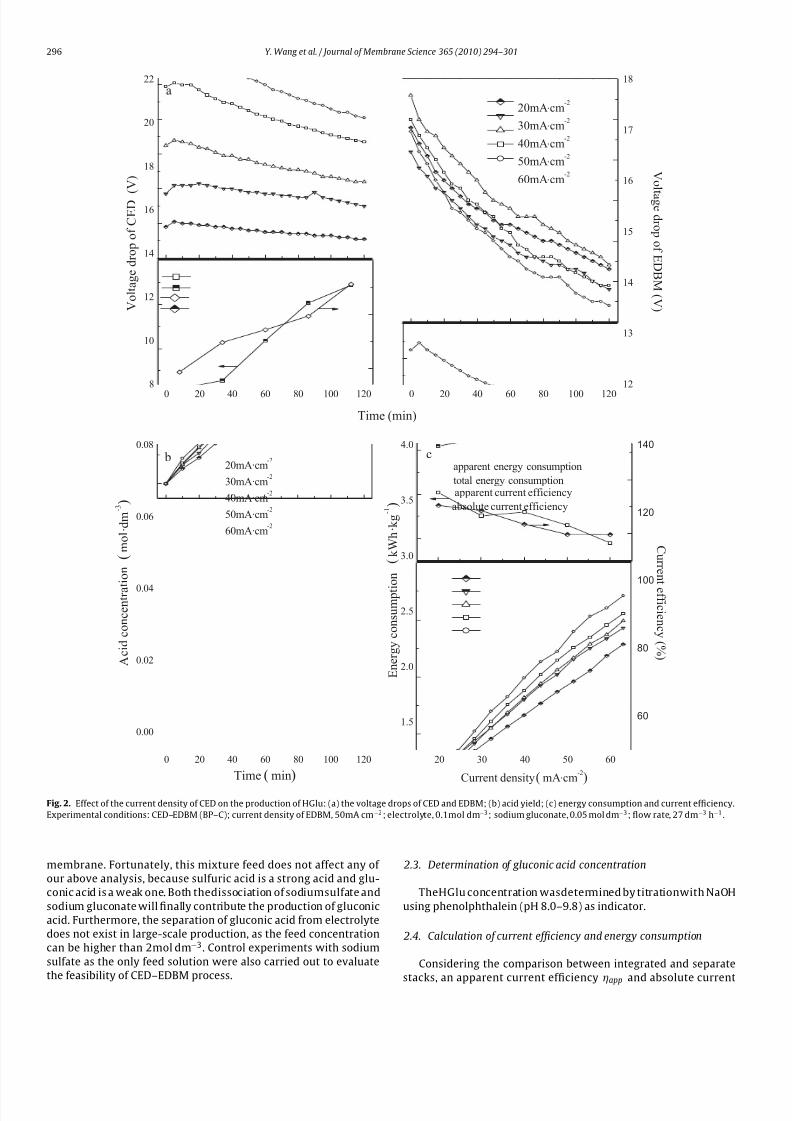
Fig. 2. Effect of the current density of CED on the production of HGlu: (a) the voltage drops of CED and EDBM; (b) acid yield; (c) energy consumption and current efficiency.
Experimental conditions: CED–EDBM (BP–C); current density of EDBM, 50mA cm−2; electrolyte, 0.1mol dm−3; sodium gluconate, 0.05 mol dm−3; flow rate, 27 dm−3 h−1 .
membrane. Fortunately, this mixture feed does not affect any of
our above analysis, because sulfuric acid is a strong acid and glu-
conic acid is a weak one. Both thedissociation of sodiumsulfate and
sodium gluconate will finally contribute the production of gluconic
acid. Furthermore, the separation of gluconic acid from electrolyte
does not exist in large-scale production, as the feed concentration
can be higher than 2mol dm−3. Control experiments with sodium
sulfate as the only feed solution were also carried out to evaluate
the feasibility of CED–EDBM process.
2.3. Determination of gluconic acid concentration
TheHGlu concentration wasdetermined by titrationwith NaOH
using phenolphthalein (pH 8.0–9.8) as indicator.
2.4. Calculation of current efficiency and energy consumption
Considering the comparison between integrated and separate
stacks, an apparent current efficiency Áapp and absolute current

8/4/2019 Integration of Conventional Electrodialysis and Electrodialysis With Bipolar
http://slidepdf.com/reader/full/integration-of-conventional-electrodialysis-and-electrodialysis-with-bipolar 4/8
Y. Wang et al. / Journal of Membrane Science 365 (2010) 294–301 297
0 20 40 60 80 100 120
0.00
0.02
0.04
0.06
0.08
0 20 40 60 80 100 1205
10
15
20
25
30
0.05mol·dm-3
0.1mol·dm-3
0.2mol·dm-3
0.3mol·dm-3
0.4mol·dm-3
V o
l t a g e
d r o p o
f C E D s t a c k ( V )
Time (min)
a
0 20 40 60 80 100 1205
10
15
20
25
30
V ol
t a g e d r o p of E DBM s t a c k ( V )
Time (min)
b c
A c i d c o n c e n
t r a t i o n
(
m o
l · d m
- 3)
Time (min)
0.05mol·dm-3
0.10mol·dm-3
0.20mol·dm-3
0.30mol·dm-3
0.40mol·dm-3
0.0 0.1 0.2 0.3 0.4
1
2
3
4
5
6
apparent energy consumption
total energy consumption
Electrolyte concentration ( mol·dm-3
)
E n e r g y c o n s u m p t i o n
(
k W h · k g
- 1)
60
80
100
120
140
apparent current efficiency
absolute current efficiency
C ur r e n t e f f i c i e n c y ( % )
Fig. 3. Effect of electrolyte concentration on the integration stack performance: (a) the voltage drop across the CED and EDBM stack; (b) acid yield; (c) energy consumption
andcurrent efficiency. Experiment conditions: stack configuration,CED–EDBM (BP–C);currentdensity of CEDand EDBMstack,50 mAcm−2; sodium gluconate concentration
0.05moldm−3; flow rate, 27 dm−3 h−1.
efficiency Áabs was defined as Eq. (1), which is similar to that of
a common EDBM process [9]:
Áapp =(C t −C 0) zBF NI EDBM t
Áabs =(C t −C 0) zBF
N (I CED
+I EDBM
)t
(1)
where C t and C 0 (mol dm−3) arethe HGlu concentrations at time
t and 0, respectively; z isthe absolutevalence ( z = 1 forgluconicion);
B (dm3) isthe volumeof solutionin each loop; I CED and I EDBM (A)are
the currents of CED and EDBM, respectively; F is the Faraday con-
stant (96,485C mol−1); N is the number of repeating units (N =1).
In this work, t (s) is equal to 7200 s, and the change of fluid volume
in each loop was negligible, that is, B =0.5dm3.

8/4/2019 Integration of Conventional Electrodialysis and Electrodialysis With Bipolar
http://slidepdf.com/reader/full/integration-of-conventional-electrodialysis-and-electrodialysis-with-bipolar 5/8
298 Y. Wang et al. / Journal of Membrane Science 365 (2010) 294–301
20 30 40 50 602
3
4
5
6a
apparent energy consumption
total energy consumption
apparent current efficiency
absolute current efficiency
Current density ( mA·cm-2)
E n e r g y c o n s u
m p
t i o n
(
k W h ·
k g
- 1)
40
60
80
100
C ur r e n t e f f i c i e n c y ( % )
0.1 0.2 0.3 0.4 0.52
4
6
8
10
12
apparent energy consumption
total energy consumption
apparent current efficiency
absolute current efficiency
Sodium sulfate concentration ( mol·dm-3)
E n e r g y c o n s u m p
t i o n
(
k W h ·
k g
- 1)
b
20
40
60
80
100
C ur r e n
t e f f i c i e n c y ( % )
Fig. 4. Performance of pure feed salt (sodium sulfate) in CED–EDBM (BP–C) stack:
(a) Effect of current density on energy consumption and current efficiency; (b)
effect of feed concentration on energy consumption and current efficiency. Experi-
ment conditions: stack configuration, CED–EDBM (BP–C); current density of EDBM
stack, 50mAcm−2; flow rate, 27dm−3 h−1; sodium sulfate concentration in (a),
0.5moldm−3; current density of CED stack in (b), 50mA cm−2 .
The apparent energy consumption Eapp (kWhkg−1) and total
energy consumptionEtot wascalculatedbyextrapolatingtheresults
for the production of 1 kg of acid based on Eq. (2):
Eapp =
U EDBM I EDBMdt
C t BM
Etot =
(U CEDI CED+U EDBM I EDBM )dt
C t BM
(2)
where U CED and U EDBM (V) are the voltage drops across the CED and
EDBMstacks, respectively; I CED and I EDBM (A)arethecurrentsofCED
and EDBM, respectively; C t (mol dm−3) is the acid concentration at
time t (s); B (dm3) is the volume of acid loop; M is the molecular
weight of HGlu (196.14 g mol−1).
3. Results and discussions
3.1. Effect of the current density of CED on the production of
gluconic acid
Fig. 2 shows the effect of current density of CED on the produc-
tion of gluconic acid by using the CED–EDBM (BP–C) setup. As a
tradeoff between the efficiency of water splitting [10] and the life-
time of bipolar membranes [11], a current density of 50 mA cm−2
was chosen for the operation of EDBM. The concentrations of
Na2SO4 and NaGlu were 0.10 and 0.05 mol dm−3
, respectively.
Fig. 2a shows the effect of current density of CED on the voltage
drop of CED and EDBM stack. The results indicate that the volt-
age drops of both CED and EDBM stack decrease with the elapse of
time. Meantime, the higher the current density is, the higher the
voltage drop of CED stack will be. Normally, the voltage drop of
CED stack should increase with time, which is due to the depleting
of salt in the dilute compartment. The decrease of voltage drop
in the CED stack is attributed to the particular configuration of
CED–EDBM (BP–C) stack. For one thing, H+ generated from the
water dissociation of bipolar membrane is introducing to the CED
stack. The conductivity of gluconic acid is much higher than that of
sodium gluconate (the equivalent conductance of HGlu and NaGlu
is 380×10−4 and 80.5×10⁻⁴ s cm2 equiv−1, respectively [12]), the
electrical resistance of CED will decrease with an increase in the
concentration of HGlu. For another, H+ and OH− which is ascribe
to the electrode reactions are also introducing to the CED stack. In
theory, H+ and OH− can be neutralized with each other because the
anode and cathode compartments are circulated in a loop in the
CED stack. However, the mobility of H+ through cation exchange
membrane is much higher than OH− through the anion exchange
membrane, so the electrode reaction generated H+ and OH− can
be distributed in the acid and salt compartment separately. This
assumption has been confirmed from the high apparent current
efficiency of the EDBM stack in the following discussion. To sumup, H+ and OH− comes from water dissociation of bipolar mem-
brane and electrode reactions account for the decreasing of voltage
drop in the CED stack. In the case of EDBM stack, the concentrat-
ing of sodium gluconate in CED and water dissociation of bipolar
membrane leads to a sharply decrease of electrical resistance. The
voltage drops of EDBM among different CED current densities are
not pronounced, which indicates that the contribution of water
dissociation of bipolar membrane to the voltage drop is more sig-
nificant than that of concentrating of gluconate salt.
As shown in Fig. 2b, the acid concentration increases nearly
proportion to time elapses. In addition, the acid concentration
increases with the increase of current density of CED stack. Nor-
mally,theyieldof acid is stem from thewater dissociationof bipolar
membrane orthe water splittingof cationexchangemembrane dueto concentration polarization, both of which are directly related to
thecurrent density ofthe EDBM stack.But thecurrent density ofthe
EDBM stack have been fixed at 50mA cm−2, so the increase of acid
concentration must come from theCED stack.In theCED stack,both
electrode reactions and water splitting of mono-polar membranes
can possibly lead to the yield of acid. However, water splitting of
mono-polar membranes has low efficiency and the generated H+
and OH− recombines [13], so this effect is insignificant. Therefore,
theelectrodes reactionsof CEDstack arecontributeto theenhanced
increase of acid concentration as discussed in the above section.
Fig. 2c shows the effect of current density of CED on the current
efficiency and energy consumption of EDBM stack. The apparent
current efficiencies of EDBM stack increase from 98%to 131% when
current densitiesof CEDincreasefrom 20to 50mA cm−2
, indicatingextra H+ besides bipolar membrane dissociation is also introduced
to the EDBM stack.While the absolute current efficiencies decrease
from 70% to 59% in this time. The compete migration of H +/Na+
through cation exchange membrane and the molecular diffusion of
gluconic acid through the bipolar and cation exchange membrane
determinethat thecurrent efficiencyis lower than 100% at lowCED
current density. As current density increase, electrode generated
H+ increase correspondingly, and then the induction of H+ over-
whelm than that of migration out of the acid compartment. When
the current density of CED stack is in the range of 20–50mA cm−2,
the apparent energy consumption of EDBM stack is between 1.45
and2.00kWhkg−1. Even theenergy consumption ofCED andEDBM
stack are both considered, the total energy consumption is about
2.55–3.70 kWh kg−1
, which is similar to our experimental result of

8/4/2019 Integration of Conventional Electrodialysis and Electrodialysis With Bipolar
http://slidepdf.com/reader/full/integration-of-conventional-electrodialysis-and-electrodialysis-with-bipolar 6/8
Y. Wang et al. / Journal of Membrane Science 365 (2010) 294–301 299
a single EDBM process (1.55–4.72 kWh kg−1) [14]. But we should
take attention that not only gluconic acid but also concentrated
gluconate salt can be obtained with the similar energy consump-
tion in one step. Furthermore, the total energy consumption of the
CED–EDBM stack increases with the increase of current density of
CED stack, indicating a great part of electrical energy is consumed
to overcome theelectrical resistance of theCED stack as thecurrent
density increases. From the discussion above, an accompanying
CED stack is conducive to the performance of EDBM process, espe-
cially when CED and EDBM are both need to be carried out in some
circumstances.
3.2. Effect of electrolyte concentration on the production of
gluconic acid
Fig. 3a shows the effect of electrolyte concentration on the volt-
age drop of CED and EDBM stack when the current density of CED
and EDBM is 50mA cm−2 and sodium gluconate concentration is
0.05 moldm−3. Results indicate that the voltage drop of both CED
and EDBM stack decreases with an increase of electrolyte concen-
tration. The reason can be ascribed to common sense: the higher
the concentration of electrolyte, the lower the electrical resistance
of the membrane and solution. At the same time, the voltage dropsof CED stack increase in the first 10 min and then decrease with
time elapses in lowelectrolyte concentration. There aremainly two
counteracting effects that account forthis result. On onehand,after
the depletion of ions in the intermediate layer of bipolar mem-
brane, water dissociation takes place, and H+ and OH− begin to fill
the bipolar membrane and decrease the voltage drop across bipo-
lar membrane gradually. On the other hand, the concentration of
gluconate in the acid compartment is higher than that in the dilute
compartment of CED, which is due to the concentrating effect of
CED stack. In CED stack, Na+ and Glu− can migrate through cation
andanion exchange membrane,respectively,and accumulate in the
acid compartment. Meantime, Na+ in the acid compartment trans-
ports through the cation exchange membrane andinto the cathode
compartment of EDBM stack. The amount of Na+ migration out of the acid compartment is more than that of into the compartment,
which is the dominant effect at the beginning of experiment. In
contrast, the generated H+ of bipolar membrane accumulates with
time,the overwhelmingof thefirsteffect leadsto a sharply decrease
of voltage drop. While in the case of high electrolyte concentration,
the change of conductivity due to diluting effect of CED is not pro-
nounced, so an extreme point is not appeared in the voltage drop
of CED stack.
Fig. 3b shows the effect of electrolyte concentration on acid
concentration when the current density of CED and EDBM is
50mAcm−2 andsodium gluconateconcentration is 0.05 mol dm−3.
Similarly to effect of current density of CED stack in Fig. 2b, the
yield of acid increases as time elapses. There is a slightly increase
of acidconcentrationwith the increase of electrolyte concentration.Although the mobility of H+ is higher than Na+, Na+ will have more
predominance in quantity as Na2SO4 concentration increases, so
there is less loss ofH+ for gluconic production and thus an increase
in acid concentration. There have been confirmed from the signifi-
cant increase of current efficiencywith theincreasing of electrolyte
concentration.
Fig. 3c shows the effect of electrolyte concentration on the
current efficiency and energy consumption of EDBM stack when
the current density of CED and EDBM is 50 mA cm−2 and sodium
gluconate concentration is 0.05 moldm−3. The apparent and
total current efficiency of EDBM stack is respective between
110.3–140.3% and 55.2–71.2% when electrolyte concentration is in
the range of 0.05–0.4mol dm−3. The higher concentration of Na+,
the less lose ofH+
through cationexchange membrane of theEDBM
stack, which could be used to explain for the high apparent cur-
rent efficiency. The apparent and total energy consumption for the
production of gluconic acid decrease with the increase of elec-
trolyte concentration, which is in the range of 0.90-2.48 Wh kg−1
and 1.82–5.56 Wh kg−1, respectively. The low energy consumption
of EDBM stack, such as 0.90 Wh kg−1 when electrolyte concentra-
tion is 0.4moldm−3, suggesting a synergistic effect of the inward
integration of CED and EDBM is achieved.
3.3. Performances of pure feed salt (sodium sulfate) in
CED–EDBM (BP–C) stack
To test the feasibility of the combined CED–EDBM under pure
salt conditions, control experiments with sodium sulfate as the
only feed solution are also conducted. Trends similar to the mixed
feed salt process have also been observed in these pure feed salts
(Fig. 4). Energy consumptions and current efficiencies decrease
and increase with the increasing of feed concentration, respec-
tively, which are well consistent with the results of mixed feed
salts (Fig. 3b). Moreover, the performances of CED–EDBM (BP–C)
under pure salt conditions are lower than that of the mixed feed
salts, indicating the significant contribution of the dissociation of
sodium gluconate in mixed feed salts.
3.4. Comparison with CED–EDBM (BP–A) configuration and
process economics
For comparison, another integration configuration CED–EDBM
(BP–A) (Fig. 1b), was also tested for gluconic acid production com-
parison. Fig.5 showsthe energyconsumptionand current efficiency
of the different stack configurations. Among them, CED–EDBM
(BP–C) and CED–EDBM (BP–A) were the integration stacks, while
the EDBM (BP–C) was a single EDBM stack (cf. Figs. 1a–c). The
current density of the all the stacks is 50 mAcm−2; electrolyte
concentration is 0.30 moldm−3; and the sodium gluconate con-
centration is 0.05 moldm−3. The apparent energy consumption
of EDBM stack in both combined cases (CED–EDBM (BP–C) or
CED–EDBM (BP–A)) is less than that the single EDBM (BP–C) pro-
cess. However, when the energy consumption of CED stack is
also considered in the integration process, the CED–EDBM (BP–A)
integration process does not indicate much advantages than a
E D B M
( B P -
C )
C E D - E D
B M ( B P -
C )
C E D - E D
B M ( B P -
A )0
1
2
3
4
apparent energy consumption
total energy consumption
C ur r e n t e f f i c i e n c y ( % )
E n e r g y c o n s u m p t i o n
(
k W h ·
k g
- 1)
Different cell configuration
E D B M
( B P -
C )
C E D - E D
B M ( B P -
C )
C E D - E D
B M ( B P -
A )40
60
80
100
120
140
apparent current efficiency
absolute current efficiency
Fig. 5. Energy consumption and current efficiency for different cell configurations:
CED–EDBM (BP–C); CED–EDBM (BP–A); EDBM (BP–C). Experiment conditions:
current density of CED and EDBM stack, 50 mAcm−2; electrolyte concentra-
tion, 0.3moldm−3; sodium gluconate concentration 0.05 moldm−3; flow rate,
27dm−3
h−1
.
8/4/2019 Integration of Conventional Electrodialysis and Electrodialysis With Bipolar
http://slidepdf.com/reader/full/integration-of-conventional-electrodialysis-and-electrodialysis-with-bipolar 7/8
300 Y. Wang et al. / Journal of Membrane Science 365 (2010) 294–301
Table 2
Estimation of process cost.
EDBM (BP–C) CED–EDBM (BP–A) CED–EDBM (BP–C)
Repeating units 1 1 1
Current density (mA cm−2) 50 50 50
Experiment time (min) 120 120 120
Effective membrane area (cm2) 7.07 7.07 7.07
Na2SO4 concentration (mol dm−3) 0.3 0.3 0.3
Fluid flow speed (dm3 h−1) 27 27 27
NaGlu concentration (mol dm−3
) 0.05 0.05 0.05HGlu concentration (mol dm−3 ) 0.040 0.048 0.068
Current efficiency (%) 94.85 91.80 131.04
Energy consumption (kWh kg−1) 2.58 2.88 2.15
Process capacity (kgyear−1) 16.79 20.34 28.98
Electricity charge ($ kg−1) 0.1 0.1 0.1
Energy cost for HGlu ($ kg−1) 0.26 0.29 0.22
Energy cost for the peripheral equipment ($kg−1) 0.01 0.01 0.01
Total energy cost ($ kg−1) 0.27 0.30 0.23
Membrane life and amortization of the peripheral equipment (year) 3 3 3
Monopolar membrane price ($ m−2) 135 135 135
Bipolar membrane price ($ m−2) 1350 1350 1350
Membrane cost ($) 1.05 1.24 1.24
Stack cost ($) 1.57 1.86 1.86
Peripheral equipment cost ($) 2.36 2.79 2.79
Total investment cost ($) 3.94 4.65 4.65
Amortization ($ year−1) 1.31 1.55 1.55
Interest ($ year−1) 0.31 0.37 0.37
Maintenance ($ year−1) 0.39 0.47 0.47
Total fixed cost ($year−1) 2.02 2.39 2.39
Total fixed cost ($ kg−1) 0.12 0.12 0.08
Total process cost ($ kg−1 ) 0.39 0 .42 0.31
single EDBM (BP–C) process, as the total energy consumption is
much higher. Besides, the current efficiency of CED–EDBM (BP–A)
integration process is even lower than the single EDBM (BP–C)
process. The low efficiency of CED–EDBM (BP–A) process can be
explained by its particular stack configuration. In the CED–EDBM
(BP–A) integration process, the migration of Glu− through anion
exchange membrane is much more difficult than Na+ through
cation exchange membrane because the hydrate radii of gluconateion is much larger than that of sodium ion. In addition, the cath-
ode reactions in the EDBM stack generated OH-, which not only
competes with Glu− to go through anion exchange membrane but
also neutralize the H+ generated from BP membrane. These neg-
ative effects account for the high energy consumption and low
current efficiency of the CED–EDBM (BP–A) integration process.
While in the case of CED–EDBM (BP–C) integration process, the
apparent current efficiency is higher than the BP–C configuration
with less energy consumption as well as with concentrated glu-
conate besides.
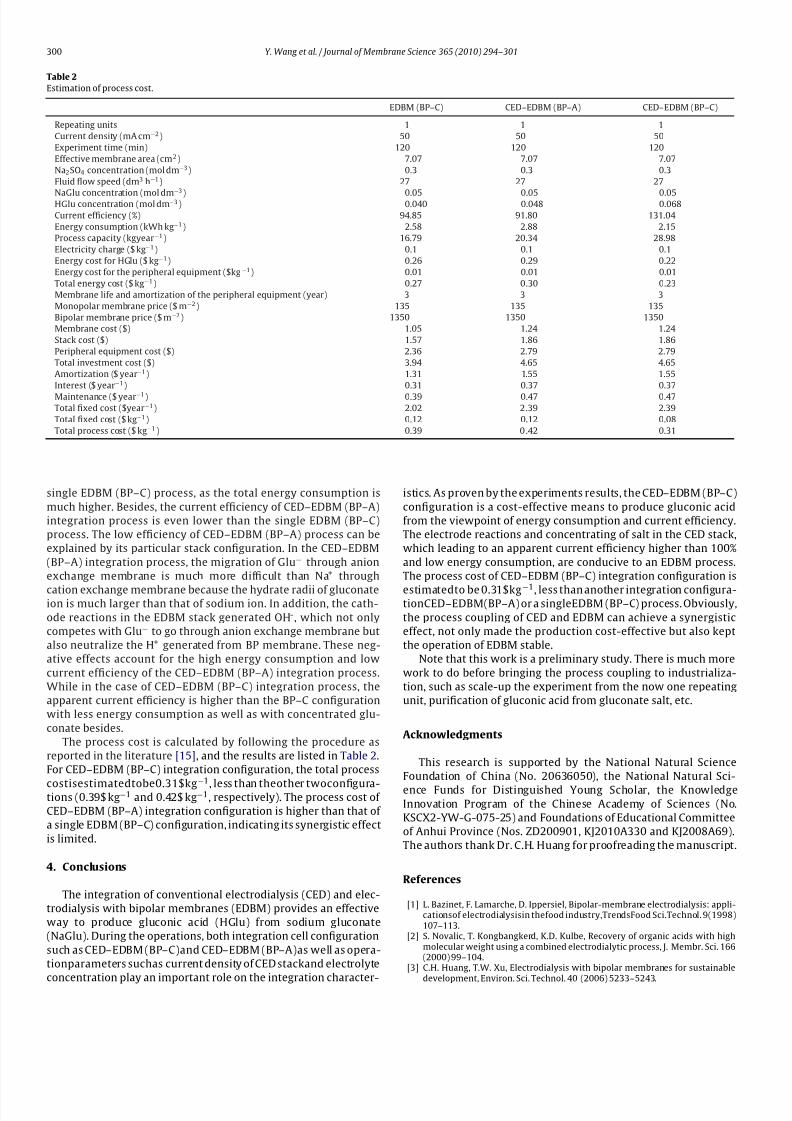
The process cost is calculated by following the procedure as
reported in the literature [15], and the results are listed in Table 2.
For CED–EDBM (BP–C) integration configuration, the total process
costisestimatedtobe0.31$kg−1
, less than theother twoconfigura-tions (0.39$ kg−1 and 0.42$ kg−1, respectively). The process cost of
CED–EDBM (BP–A) integration configuration is higher than that of
a single EDBM (BP–C) configuration, indicating its synergistic effect
is limited.
4. Conclusions
The integration of conventional electrodialysis (CED) and elec-
trodialysis with bipolar membranes (EDBM) provides an effective
way to produce gluconic acid (HGlu) from sodium gluconate
(NaGlu). During the operations, both integration cell configuration
such as CED–EDBM (BP–C)and CED–EDBM (BP–A)as well as opera-
tionparameters suchas current density of CED stackand electrolyte
concentration play an important role on the integration character-
istics. As proven by the experiments results, the CED–EDBM (BP–C)
configuration is a cost-effective means to produce gluconic acid
from the viewpoint of energy consumption and current efficiency.
The electrode reactions and concentrating of salt in the CED stack,
which leading to an apparent current efficiency higher than 100%
and low energy consumption, are conducive to an EDBM process.
The process cost of CED–EDBM (BP–C) integration configuration is
estimatedto be 0.31$kg−1, less than another integration configura-tionCED–EDBM(BP–A) or a singleEDBM (BP–C) process. Obviously,
the process coupling of CED and EDBM can achieve a synergistic
effect, not only made the production cost-effective but also kept
the operation of EDBM stable.
Note that this work is a preliminary study. There is much more
work to do before bringing the process coupling to industrializa-
tion, such as scale-up the experiment from the now one repeating
unit, purification of gluconic acid from gluconate salt, etc.
Acknowledgments
This research is supported by the National Natural Science
Foundation of China (No. 20636050), the National Natural Sci-
ence Funds for Distinguished Young Scholar, the KnowledgeInnovation Program of the Chinese Academy of Sciences (No.
KSCX2-YW-G-075-25) and Foundations of Educational Committee
of Anhui Province (Nos. ZD200901, KJ2010A330 and KJ2008A69).
The authors thank Dr. C.H. Huang for proofreading the manuscript.
References
[1] L. Bazinet, F. Lamarche, D. Ippersiel, Bipolar-membrane electrodialysis: appli-cationsof electrodialysisin thefood industry,TrendsFood Sci.Technol. 9(1998)107–113.
[2] S. Novalic, T. Kongbangkerd, K.D. Kulbe, Recovery of organic acids with highmolecular weight using a combined electrodialytic process, J. Membr. Sci. 166(2000) 99–104.
[3] C.H. Huang, T.W. Xu, Electrodialysis with bipolar membranes for sustainable
development, Environ. Sci. Technol. 40 (2006) 5233–5243.

8/4/2019 Integration of Conventional Electrodialysis and Electrodialysis With Bipolar
http://slidepdf.com/reader/full/integration-of-conventional-electrodialysis-and-electrodialysis-with-bipolar 8/8
Y. Wang et al. / Journal of Membrane Science 365 (2010) 294–301 301
[4] T.W. Xu, C.H. Huang, Electrodialysis-based separation technologies: a criticalreview, AIChE J. 54 (2008) 3147–3159.
[5] F.L.T. Shee, P. Angers, L. Bazinet, Precipitationof cheddar cheese wheylipids byelectrochemical acidification, J. Agric. Food Chem. 53 (2005) 5635–5639.
[6] L. Bazinet, D. Ippersiel, F. Lamarche, Recovery of magnesium and protein fromsoy tofu whey by electrodialytic configurations, J. Chem. Technol. Biotechnol.74 (1999) 663–668.
[7] J.S.J. Ferrer, S. Laborie, G. Durand, M. Rakib, Formic acid regeneration by elec-tromembrane processes, J. Membr. Sci. 280 (2006) 509–516.
[8] T.W. Xu, W.H. Yang, Effect of cell configurations on the performance of cit-ric acid production by a bipolar membrane electrodialysis, J. Membr. Sci. 203
(2002) 145–153.[9] T.W. Xu,W.H. Yang, Citric acidproductionby electrodialysiswith bipolarmem-
branes, Chem. Eng. Process. 41 (2002) 519–524.[10] H. Strathmann, J.J. Krol, H.J. Rapp, G. Eigenberger, Limiting current density and
water dissociation in bipolar membranes, J. Membr. Sci. 125 (1997) 123–142.
[11] J.J. Krol, M. Jansink, M. Wessling, H. Strathmann, Behaviour of bipolar mem-branes at high current density water diffusion limitation, Sep. Purif. Technol.14 (1998) 41–52.
[12] D. Lide, Handbook of Chemistry and Physics, CRC Press Inc., Boca Raton, 1993.[13] V.I. Zabolotskii, N.V. Sheldeshov, N.P. Gnusin, Dissociation of water molecules
in systems with ion-exchange membranes, Russ. Chem. Rev. 57 (1988) 801–808.
[14] Y.M. Wang, C.H. Huang, T.W. Xu, Optimization of electrodialysis with bipo-lar membranes by using response surface methodology, J. Membr. Sci. (2010),doi:10.1016/j.memsci.2010.06.049.
[15] H.Strathmann,G.H. Koops,Processeconomicsof electrodialyticwaterdissocia-
tion for the production of acid and base, in: A.J.B. Kemperman (Ed.), Handbookon Bipolar Membrane Technology, Twente University Press, Enschede, 2000,pp. 191–220.
Related Documents


