Optimizing electrodialysis processes for concentrating ammonium rich streams R.W.J. Deckers

Welcome message from author
This document is posted to help you gain knowledge. Please leave a comment to let me know what you think about it! Share it to your friends and learn new things together.
Transcript

Optimizing electrodialysis processes for concentrating ammonium rich streams
R.W.J. Deckers

ii

iii
Optimizing electrodialysis processes for concentrating ammonium rich streams
By
R.W.J. Deckers
in partial fulfilment of the requirements for the degree of
Master of Science
in Civil Engineering
at the Delft University of Technology,
to be defended publicly on Tuesday November 7, 2017 at 12:00 M.
Supervisors: dr. ir. H. Spanjers TU Delft
ir. N. van Linden TU Delft
Thesis committee: prof. dr. ir. J. Van Lier TU Delft
prof. dr. G.J. Witkamp TU Delft
prof. dr. ir. R. Dewil KU Leuven
dr. ir. R. Lindeboom TU Delft
This thesis is confidential and cannot be made public until November 7, 2018.
An electronic version of this thesis is available at http://repository.tudelft.nl/.

iv

v
Acknowledgement
Duringmybachelor inbuiltenvironment, Idevelopedapassionforcivilengineeringandmorespecificwatermanagement.AstudyatthetechnicaluniversityofDelft,TUDelft,seemedthemostlogicandmostchallengingchoice.Beforestartingmymasters,atransitionyearhadtobesuccessfullycompleted.Duringthisyear,myinterestinthetreatmentofwateranditsapplicationsgrewtobigproportions.
Thefirstoneandahalfyearofthemasterconsistedmainlyoffollowingcourses,withaveryinstructiveperiodinBandung,Indonesia.Theonlyremainingcriteriaforachievingmymastertitlewasthegraduation.Anexperimentalstudyonaninnovativeproject,withtheopportunitytochangethewaywetreatwateratthismoment,attractedmemost.
OverthecourseofthelastyearIhadthechancetoextendmyknowledgeontheelectrochemicalprocessofelectrodialysis,withintheboundariesofthe“frompollutanttopower”project.NielsandHenri,Iamverythankfulforgivingmetheopportunitytoworkinthisprojectgroup,thesupportyougavemetogetthroughthegraduationprocedureonadaytodaybasisandfortheknowledgeandinsightsyouelucidatedmanychallengesencounteredduringthisthesis.
IalsowanttoexpressmygratitudetoRalph,forhelpingmeallthequestionIhadabouttheoperationofthe electrodialysis set-up and other chemistry related questions. Mohammed and Armand, I’m verygrateful for your help in the laboratory, your patience and explanation on how to operate the ionchromatography.
A special thanks to my graduation committee for their time and feedback during our intermediatemeetings,forchallengingmetoexploreliteraturefurtherandhelpingmewithproblemsandquestionsIencounteredduringexperiments.
IsincerelyappreciatethehelpoffellowstudentsIreceivedduringthisperiod,andforkeepingmecompanyinthelaboratoryoutsideofworkinghours.
To my family, and especially my parents, thank you for always believing in me and giving me theopportunitytopursuemydreams.Tomygirlfriend,thankyouforyourmotivationoverthelastseveralmonths,yourhelp,yourlove,andprovidingcalmnessandsilencewhenIneededitmost.
RobDeckers,November2017

vi
vii
Abstract
Thereuseofresidualwaterishighlybeneficialfortheenvironmentandalsohasafinancialbenefit.The“fromPollutanttoPower”projectfocussesontherecoveryofammoniafromresidualstreams,inordertoproduceelectricalandthermalenergywhenelectrochemicallycombustedinaSOFC.Inthiscontext,ammonium from digested sludge reject water will be concentrated with electrodialysis, in order tominimalizechemicalorthermaladditions.
Electrodialysisisoftenresearchedasdesalinationtechnique,neglectingtheconcentratedwastestream.Moreover,limitedamountofdatacanbefoundontheutilizationofenergy,ascurrentefficienciesisanoften used parameter in the operation efficiency of electrochemical processes. Therefore, no clearoverviewisavailablefortheenergyrequirementfortheconcentrationofammoniumwithelectrodialysis.
“Howcanthemaximumammoniumconcentrationfromresidualstreambeoptimized,utilizingenergyasefficientaspossiblefortheconcentrationofammoniuminanelectrodialysissetup?”willberesearchedinthisthesis.
Withintheelectrodialysisprocessfourmainprocessesoccur,namely,migrationofsalts,backdiffusionofsalts,osmosisandelectro-osmosis.Asonlythemigrationofsaltisdesirable,allotherprocessesshouldbeminimizedinordertoreachaneffectiveutilizationofenergyforconcentratingammoniumrichstreams.Duringregularelectrodialysisoperations,amaximumammoniumconcentrationof7.3g/Lisachieved.Theenergy used to reach this concentration is equal to 32.10Wh. During this experiment it was noticedammoniumionsaccumulateintheelectroderinsesolution.
Two optimization steps have been experimentally researched in order to minimize the energyconsumption. As these undesirable processes are driven by the ion concentration gradient betweenconcentrateanddiluatestream,astagedexperimentwasperformed.Forachievingthesamemaximumammoniumconcentrationasduring regularoperation,only4.43Wh isneeded.However, it shouldbementioned the obtained volumes are less compared to the regular operation of electrodialysis.Theotheroptimizationstepfocusesonthetimetoperformanexperiment,asthis influencesthetotaltransported volume (due to osmosis). Volume ratios between concentrate and diluate are applied toachievehigherconcentrationsintheconcentratemorequickly.Experimentswith2.0Ldiluateand0.1Lconcentrateneeded0.46Whtoreachanammoniumconcentrationof7.3g/L.
Lastly, all experiments discussed above are performed in an idealistic situationwere only ammoniumbicarbonate ions are present in the feed water. However, real anaerobic digested reject water alsocontainsotherions.Monovalentsaltsinfluencetheconcentrationofammoniumnegatively,whilenoclearrelationcanbefoundbetweentheenergyefficiencyandmultivalentsalts. Itcanalsobeconcludedallbeneficialeffectsexpectedfromtheadditionofbivalentsaltsaremadeundonebythenon-selectivityofthecationexchangeendmembranes.

viii
ix
Table of content
1 INTRODUCTION 2
1.1 BACKGROUND INFORMATION 2 1.1.1 NITROGEN IN THE ENVIRONMENT 2 1.1.2 ALTERNATIVE REMOVAL TECHNOLOGIES 2 1.1.3 THE N2KWH PROJECT 2 1.2 CONCENTRATING OF AMMONIUM-NITROGEN 3 1.2.1 CONCENTRATING IONS FROM RESIDUAL STREAMS 3 1.2.2 FEED WATER COMPOSITION 3 1.2.3 AVAILABLE TECHNIQUES 3 1.3 SCOPE OF THIS PROJECT 4 1.3.1 KNOWLEDGE GAP 4 1.3.2 RESEARCH GOAL 4 1.3.3 SUB-QUESTIONS 5 1.3.4 APPROACH 5
2 THEORETICAL BACKGROUND 6
2.1 ELECTRODIALYSIS 6 2.1.1 TECHNOLOGY REVIEW 6 2.1.2 ELECTROCHEMICAL POTENTIAL DIFFERENCE 7 2.2 OPERATION PARAMETERS 8 2.2.1 CURRENT EFFICIENCY (CE) 8 2.2.2 LIMITING CURRENT DENSITY (LCD) 8 2.2.3 ENERGY EFFICIENCY (EE) 11 2.3 PROCESSES IN ELECTRODIALYSIS 13 2.3.1 MIGRATION OF SALTS 13 2.3.2 BACK DIFFUSION OF IONS 14 2.3.3 (ELECTRO-) OSMOSIS 14 2.3.4 INFLUENCE OF OTHER SALTS 18 2.3.5 OVERVIEW 19 2.4 OPTIMIZATION 20 2.4.1 VOLUME RATIO 20
3 MATERIALS AND METHODS 23
3.1 EXPERIMENTAL SETUP 23 3.1.1 OBJECTIVE 23 3.1.2 EXPERIMENTAL SET-UP 23 3.1.3 SCHEMATIC PRESENTATION 24 3.2 EXPERIMENTAL PROCEDURE 27 3.2.1 LCD PROCEDURE 27 3.2.2 EXPERIMENTAL ED PROCEDURE 27 3.2.3 CLEANING PROCEDURE ED 29
x
4 RESULTS AND DISCUSSION 30
4.1 EFFICIENCIES 30 4.1.1 CURRENT- AND ENERGY EFFICIENCY 30 4.1.2 PUMP ENERGY 31 4.1.3 EFFECT OF CROSS-FLOW SPEED ON ENERGY CONSUMPTION 33 4.2 MAXIMUM AMMONIUM CONCENTRATION 35 4.2.1 MASS IMBALANCE 35 4.2.2 MAXIMUM AMMONIUM CONCENTRATION 35 4.2.3 MASS BALANCE 36 4.2.4 ELECTROCHEMICAL POTENTIAL 37 4.2.5 VOLUME DISPLACEMENT 38 4.2.6 RELATIONCONCENTRATION, MASS AND ENERGY CONSUMPTION 39 4.2.7 RELATION MAXIMUM CONCENTRATION AND EC 41 4.3 ED PROCESSES 42 4.3.1 MIGRATION OF SALTS 42 4.3.2 ELECTRO-OSMOSIS 44 4.3.3 OSMOSIS 45 4.3.4 BACK MIGRATION OF SALTS 48 4.4 INFLUENCE OF OTHER SALTS 50 4.4.1 MONOVALENT IONS 50 4.4.2 BIVALENT IONS 51 4.4.3 SELECTIVITY OF MONOVALENT ION EXCHANGE MEMBRANES 51 4.5 OPTIMIZATION ELECTRODIALYSIS PROCESS 53 4.5.1 STAGING 53 4.5.2 EXPERIMENTAL PROCEDURE 53 4.5.3 PRELIMINARY RESULTS 54 4.5.4 VOLUME RATIOS 56 4.5.5 PRELIMINARY RESULTS 56
5 CONCLUSIONS 59
6 RECOMMENDATIONS 63
6.1 ELECTRODE RINSE COMPOSITION 63 6.1.1 POSSIBLE ALTERNATIVES 63 6.2 SCALING TO FULL PLANT LEVEL 64 6.3 DISCHARGING THE DILUATE 65 6.4 BIPOLAR MEMBRANES 66 6.4.1 PRELIMINARY RESULTS 66 6.5 FOULING 68
BIBLOGRAPHY 69
7 APPENDICES 72
7.1 N2KWH BACKGROUND 72
xi
7.1.1 FROM POLLUTANT TO POWER 72 7.1.2 SOLID OXIDE FUEL CELL 73 7.1.3 RESEARCH PLAN 74 7.2 TECHNOLOGY REVIEW 75 7.2.1 REVERSE OSMOSIS 75 7.2.2 ION EXCHANGE 76 7.2.3 ELECTRODIALYSIS 77 7.2.4 TECHNIQUE CONSIDERATION 77 7.2.5 PH SENSITIVITY OF AMMONIUM BICARBONATE 78 7.3 PROCESS PARAMETERS 79 7.3.1 PUMP 79 7.3.2 ELECTRICAL CONDUCTIVITY AND TOTAL DISSOLVED SALTS 79 7.3.3 LIMITING CURRENT DENSITY 80 7.3.4 RELATION MAXIMUM CONCENTRATION AND ELECTRICAL CONDUCTIVITY 82 7.4 DATA 83 7.4.1 WATER TRANSPORT 83 7.4.2 VOLUME RATIO TESTS 84

xii
List of figures FIGURE 1- ELECTRODIALYSIS LAYOUT ............................................................................................................................ 6 FIGURE 2 - DETERMINATION OF CONSTANTS A AND B FOR DETERMINING THE LCD ON DOUBLE LOGARITHMIC
PAPER SCALE ....................................................................................................................................................... 10 FIGURE 3 – RELATION BETWEEN (RECIPROCAL) CURRENT AND RESISTANCE/PH FOR A SODIUM SULFATE
SOLUTION(COWAN & BROWN, 1959) ................................................................................................................. 11 FIGURE 4–TRANSFER OF NACL OVER TIME FOR DIFFERENT ELECTRICAL CURRENTS(HAN ET AL., 2015) .................... 13 FIGURE 5 – DISSOLVING OF AMMONIUM BICARBONATE IN WATER, INCLUDING THE ARRANGEMENT OF WATER
MOLECULES ......................................................................................................................................................... 15 FIGURE 6 – WATER TRANSFER FOR THE DILUTION OF NACL OVER TIME FOR DIFFERENT ELECTRICAL CURRENTS(HAN
ET AL., 2015) ........................................................................................................................................................ 16 FIGURE 7 - WATER TRANSPORT PROFILE FOR DIFFERENT CURRENT DENSITIES AS A FUNCTION OF TIME (LING ET AL.,
2002) ................................................................................................................................................................... 17 FIGURE 8- RELATION BETWEEN WATER TRANSPORT AND CURRENT DENSITIES (L.-P. LING, ET AL.) .......................... 18 FIGURE 9 – PROCESSES IN ELECTRODIALYSIS ............................................................................................................... 19 FIGURE 10 – EFFECTS OF CHANGING THE VOLUME RATIO (VR) ON ENERGY CONSUMPTION (E), WATER TRANSPORT
( WT) AND CONCENTRATION RATIO (CR) (YAN ET AL., 2016)) ............................................................................ 20 FIGURE 11 – LAY-OUT OF AN ELECTRODIALYSIS MEMBRANE STACK .......................................................................... 24 FIGURE 12 – SCHEMATIC REPRESENTATION EXPERIMENTAL ED SET-UP .................................................................... 25 FIGURE 13 – CURRENT- AND ENERGY EFFICIENCY FOR DIFFERENT FLOW CROSS SPEEDS AND APPLIED CURRENTS . 30 FIGURE 14 – ED CELL PRESSURE LOSSES FOR DIFFERENT CROSS-FLOW VELOCITIES ................................................... 32 FIGURE 15 - ENERGY EFFICIENCY FOR DIFFERENT FLOW CROSS SPEEDS AND APPLIED CURRENTS INCLUDING AND
EXCLUDING PUMP ENERGY ................................................................................................................................. 33 FIGURE 16 – AMMONIUM MEASUREMENTS MULTIPLE DILUATE DEPLETION EXPERIMENT ...................................... 36 FIGURE 17 - ELECTRICAL AND ELECTROCHEMICAL POTENTIAL FOR MULTIPLE RUNS ................................................. 37 FIGURE 18 – WATER TRANSFER OVER TIME ................................................................................................................ 38 FIGURE 19 – WATER TRANSFER OVER THE DIFFERENCE IN ELECTRICAL CONDUCTIVITY FOR MULTIPLE JARS ........... 39 FIGURE 20 – RELATION BETWEEN CONCENTRATION FACTOR, MASS FACTOR AND ENERGY CONSUMPTION IN THE
CONCENTRATE STREAM ...................................................................................................................................... 40 FIGURE 21 – MASS TRANSFER FACTOR VERSUS CONSUMED ENERGY FOR THE FIRST EXPERIMENT .......................... 42 FIGURE 22 – OSMOSIS EXPERIMENT WITH LARGE INITIAL ELECTRICAL CONDUCTIVITY DIFFERENCE BETWEEN
CONCENTRATE AND DILUATE CELLS.................................................................................................................... 45 FIGURE 23 – RELATION BETWEEN THE OSMOTIC PRESSURE AND WATER FLUXES FOR THE CONCENTRATE CELL,
WITH A CROSS-FLOW SPEED OF 11.6 MM/S ....................................................................................................... 46 FIGURE 24 – ENERGY COMPARISON BETWEEN EXPERIMENT 1 AND RUN 20 ............................................................. 49 FIGURE 25 – BACK MIGRATION RATIO OF AMMONIUM OVER MULTIPLE RUNS ........................................................ 49 FIGURE 26 – THE FIRST THREE STEPS OF A STAGED ED OPERATION ........................................................................... 53 FIGURE 27 – ENERGY REQUIREMENTS FOR STAGED CONCENTRATION OF AMMONIUM ........................................... 55 FIGURE 28 -ELECTRICAL CONDUCTIVITY PROGRESSION VERSUS THE USED AMOUNT OF ENERGY FOR DIFFERENT
VOLUME RATIOS, WITH A DILUATE VOLUME OF 2 LITER AND STA-STK MEMBRANES ....................................... 56 FIGURE 29 - ENERGY EFFICIENCIES FOR MULTIPLE VOLUME RATIOS, WITH A TOTAL DILUATE VOLUME OF 1 LITER . 57 FIGURE 30 – AMMONIUM MASS TRANSFER OVER ENERGY CONSUMPTION FOR MULTIPLE VOLUME RATIOS, WITH A
TOTAL DILUATE VOLUME OF 2 LITER AND STA – STK MEMBRANES ................................................................... 58 FIGURE 31– ENERGY EFFICIENCIES FOR MULTI DILUATE EXPERIMENTS AND STAGING EXPERIMENTS ...................... 61 FIGURE 32 – PROCESSES IN A ED STACK WITH ANION EXCHANGE END MEMBRANES (AEEM) ................................... 63 FIGURE 33 – RELATION EC VERSUS ENERGY FOR PRODUCING DISCHARGEABLE DILUATE ......................................... 65 FIGURE 34 – POSITIONING OF MEMBRANES AND OCCURRING TRANSFERS IN AN ED STACK WITH BIPOLAR
MEMBRANES (BPM) ............................................................................................................................................ 66
xiii
FIGURE 35 – EVOLUTION OF PH OVER ENERGY FOR ED OPERATIONS WITH BPMS .................................................... 67 FIGURE 36 – EVOLUTION OF AMMONIUM CONCENTRATION OVER ENERGY FOR ED OPERATIONS WITH BPMS ...... 68 FIGURE 37 – PARADIGM SHIFT FOR AMMONIA: FROM POLLUTANT TO POWER ........................................................ 72 FIGURE 38 – SCHEMATIC REPRESENTATION OF THE SOFC MAIN PARTS ..................................................................... 73 FIGURE 39- SCHEMATIZATION RESEARCH PLAN N2KWH ............................................................................................ 74 FIGURE 40 – REVERSE OSMOSIS PRINCIPLE. FROM LEFT TO RIGHT: START CONDITIONS, EQUILIBRIUM STATE AND
FRESH WATER PRODUCTION AFTER APPLYING AN EXTERNAL FORCE. ............................................................... 75 FIGURE 41- ION EXCHANGE PRINCIPLE. FROM LEFT TO RIGHT: START CONDITIONS, LOADING PHASE AND
REGENERATION PHASE. ....................................................................................................................................... 76 FIGURE 42 - EQUILIBRIA OF BICARBONATE (LEFT) AND AMMONIUM (RIGHT) ........................................................... 78 FIGURE 43 - RELATION EC AND NH4
+ ............................................................................................................................ 79 FIGURE 44 – DETERMINATION OF THE LCD FOR 0.659 G/L AMMONIUM BICARBONATE AND 11.6 MM/S ................ 80 FIGURE 45 – RELATION BETWEEN LCD AND EC FOR CONSTANT CROSS-FLOW VELOCITIES ........................................ 81 FIGURE 46 - SODIUM CHLORIDE TIME VERSUS EC ....................................................................................................... 82
List of tables TABLE 1 – DIGESTED SLUDGE REJECT WATER CHARACTERISTICS ((STOWA, 2016); (SUSCHKA & POPŁAWSKI, 2003)) . 3 TABLE 2–MEMBRANE CHARACTERISTICS (PCCELL, 2016) ............................................................................................ 23 TABLE 3 - VARIABLE VOLUME EXPERIMENTS INPUT PARAMETERS ............................................................................ 28 TABLE 4 – EFFECT OF CROSS-FLOW SPEED ON ENERGY CONSUMPTION .................................................................... 34 TABLE 5 – RESULTS OSMOSIS EXPERIMENT WITH 2 G/L NACL DILUATE AND 15 G/L NH4HCO3 CONCENTRATE ......... 48 TABLE 6– RELATION ENERGY CONSUMPTION AND CONCENTRATION FACTOR FOR ADDITIONAL MONOVALENT
SALTS ................................................................................................................................................................... 50 TABLE 7 – RELATION ENERGY CONSUMPTION AND CONCENTRATION FACTOR FOR ADDITIONAL MULTIVALENT
SALTS ................................................................................................................................................................... 51 TABLE 8– ELECTRODIALYSIS PROCESSES AND ITS INFLUENCE ON THE ENERGY EFFICIENCY ....................................... 62 TABLE 9 – TEST RESULTS FOR DIFFERENT VOLUME RATIO, ONE LITER DILUATE AND STM......................................... 84 TABLE 10 – TEST RESULTS FOR DIFFERENT VOLUME RATIOS, TWO LITER DILUATE AND STM .................................... 84 TABLE 11 – TEST RESULTS FOR DIFFERENT VOLUME RATIOS, TWO LITER DILUATE AND MVM .................................. 84

1

2
1 IntroductionThischapterwillserveasintroductiontothismasterthesisandwillgiveinformationaboutthenecessityofthisresearch.
1.1 Backgroundinformation
1.1.1 Nitrogenintheenvironment
Nitrogenisthefifthmostabundantelementinoursolarsystemandisessentialforthesynthesisofacidsand proteins (Canfield et al., 2010). It is essential for all living organisms and is also present in food,fertilizer,poison,explosivesandmanymore.However,nitrogengasby itselfcanoftennotbeusedforhumanorplantconsumptionduetoitsstrongtriplebonds.TheHaber-Boschprocessconvertsnitrogen,present in the air, togetherwith hydrogen, under high temperature and pressure to ammonia (NH3).Humanactivityresultedinadoublingofthetotalamountnitrogenfixatedcomparedtotheprimaryusebyplants(Galloway,1998).Afterorganicproteindegradationammoniawillendupinwastestreamsandwillbeconsideredaspollutant.
Ammonia in aqueous environments leads to eutrophication and toxicity of the receiving water body(Metcalf&Eddy,2003).Inordertopreventenvironmentalpollution,ammonianeedstoberemovedfromresidualwater streams,before thewater canbedischarged to theaqueousenvironment (Songet al.,2012).Wastewatertreatmentplants(WWTPs)reducetheammonia-nitrogenconcentrationbyapplyingbiologicaltreatmenttechnologies.However,theoxidationofammoniabybacteriarequireshighamountsof oxygen and consequently has a high energy consumption. The nitrification and denitrification ofwastewater requires 15.83 kWh per kg-N (Magrí et al., 2013). Moreover, the reject water from thedigestedsludgecontainshighamountsofnitrogen,whichisfedbacktothebiologicaltreatment,andcancontribute15-20%ofthenitrogenload(Fuxetal.,2002).
1.1.2 AlternativeremovaltechnologiesManystudieshavebeenperformedontheoptimizationofexistingtreatmentsteps,inordertoreducetheammoniaconcentrationintheeffluent.Thisresultedindifferentremovaltechniques,includingAnammox(anaerobicammoniumoxidation),whichrequiresless,5.3kWhperkg-N,energycomparedtothestandardnitrification-denitrificationprocess(Magríetal.,2013).Moreover,approachestorecoverammoniafromresidual streams are conducted with chemical precipitation, either struvite or ammonium sulfateproduction,orbygasstripping(Lutheretal.,2015).Thesealternativesoftenneedadditionofchemicals,while the returnon investment is lowdue to their lowmarket value. Therefore, alternative strategiesshouldbeconsidered.
1.1.3 TheN2kWhproject
ThepotentialofammoniaasanenergycarrierinresidualwaterstreamsisthemainfocusoftheN2kWhproject.Thismasterthesisispartofthisproject,executedbytheTUDelftandKULeuven,andfocussesontherecoveryofammoniafromresidualstreamsandsubsequentprocessingofNH3fuelinasolidoxidefuelcell(SOFC).MoreinformationabouttheN2kWhprojectandtheSOFCcanbefoundinchapter7.1.
3
1.2 Concentratingofammonium-nitrogen
1.2.1 ConcentratingionsfromresidualstreamsConcentratingionsautomaticallyresultsinthedecreaseofionsinanotherflow.Often,thisflowissubjectofresearch.However,thereuseofwastewaters,forexamplereverseosmosisbrine,ishighlybeneficialfor theenvironment.Reductionofwaste streams,withasoptimuma zero-liquid-discharge,alsohasafinancialbenefit.Inthiscase,dissolvedsolidswillleavethetreatmentfacilityasdrysalts.
WithintheboundariesoftheN2kWhproject,thegoalistoextractammoniumfromresidualstreamsasammonia gas. The extraction of this gas is highly influenced by the pH, temperature and ammoniumconcentrationinthefluid.Besidesthebenefitofhigherinitialammoniumconcentrations,alsorelativelesschemicalsorthermalenergyneedtobeadded.
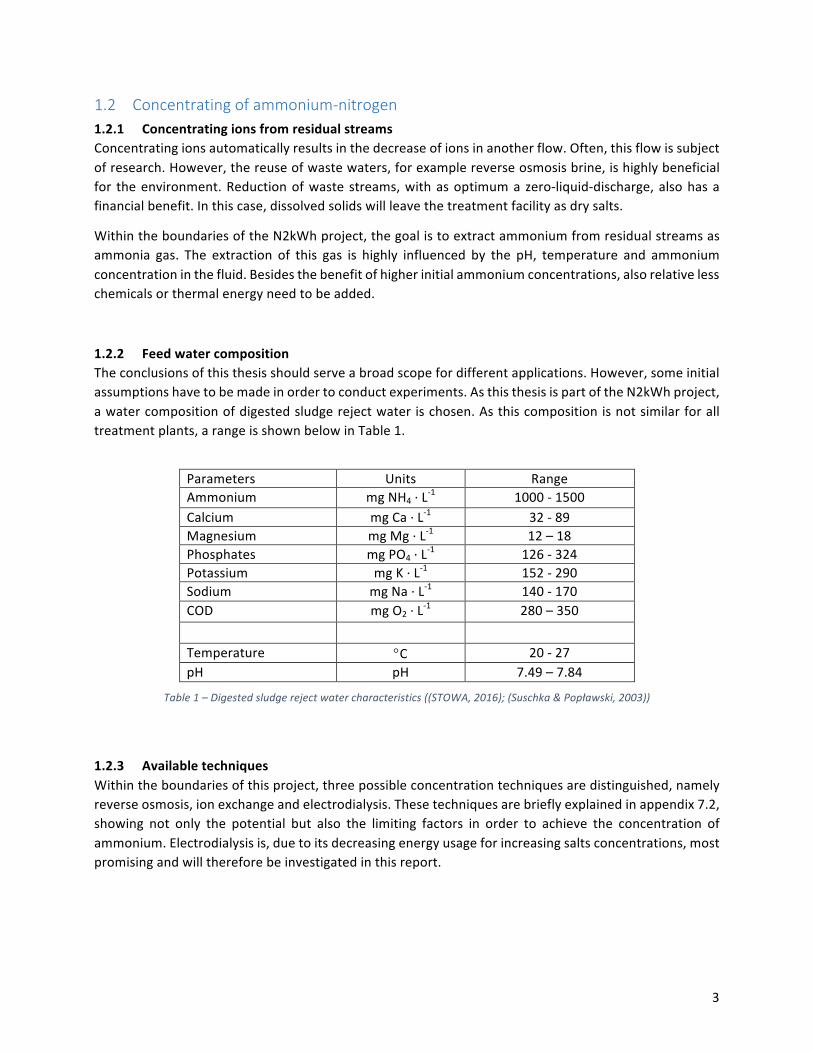
1.2.2 FeedwatercompositionTheconclusionsofthisthesisshouldserveabroadscopefordifferentapplications.However,someinitialassumptionshavetobemadeinordertoconductexperiments.AsthisthesisispartoftheN2kWhproject,awatercompositionofdigestedsludgerejectwaterischosen.Asthiscompositionisnotsimilarforalltreatmentplants,arangeisshownbelowinTable1.
Parameters Units RangeAmmonium mgNH4·L-1 1000-1500Calcium mgCa·L-1 32-89Magnesium mgMg·L-1 12–18Phosphates mgPO4·L-1 126-324Potassium mgK·L-1 152-290Sodium mgNa·L-1 140-170COD mgO2·L-1 280–350 Temperature °C 20-27pH pH 7.49–7.84
Table1–Digestedsludgerejectwatercharacteristics((STOWA,2016);(Suschka&Popławski,2003))
1.2.3 Availabletechniques
Withintheboundariesofthisproject,threepossibleconcentrationtechniquesaredistinguished,namelyreverseosmosis,ionexchangeandelectrodialysis.Thesetechniquesarebrieflyexplainedinappendix7.2,showing not only the potential but also the limiting factors in order to achieve the concentration ofammonium.Electrodialysisis,duetoitsdecreasingenergyusageforincreasingsaltsconcentrations,mostpromisingandwillthereforebeinvestigatedinthisreport.
4
1.3 Scopeofthisproject
1.3.1 KnowledgegapElectrodialysisisalreadycommerciallyavailablesince1950,andcanthereforenotbeconsideredasanewtechnology.However,duetothefastimprovementoftheionexchangemembranes,betterconstructingmaterialandadvancesintechnology,thistechnologyisstillverypromising(Valeroetal.,2011).
Availableliteratureonelectrodialysismainlyconcernsits internalprocessesandthecomparisonofthistechnologywiththewidelyusedreverseosmosis.Moreover,alsomanyresearchesfocusoncreatingacleandiluatestream,andomitdataontheconcentratestream.
From this perspective electrodialysis is an alternative desalination technology,which is only preferredwhen initialand final saltconcentrationsarewithincertain limitations (Walhaetal.,2007).This thesisfocusses on concentrating the salt streams,where the diluted stream is submissive to themain goal.However,onlylittleresearchisconductedonelectrodialysisforconcentratingions.Mondoretal.(2008)focussesonconcentratingammoniumfromswinemanure.Thisresearchshowsamaximumachievableammoniumconcentrationof13g/Lwithaninitialconcentrationof4g/L.Theshareofvolatizedammoniaamountsanother3g/Landcan,iftrappedinthesolution,contributetoamaximumachievableammoniumconcentration of 16 g/L. This hindrance of water transports limits the operation of electrodialysis,however,nosolutionsforthisproblemareproposed.
Moreover,noclearoverviewcanbemadefromtheavailableknowledgeasdifferentsaltsappeartohavedifferenteffectsontheefficiencyofelectrodialysis.Lastly,noliteraturecanbefoundontheenergyusageofanEDsetup.1.3.2 Researchgoal
Theobjectiveofthisresearch is toqualitativelyandquantitativelydescribetheeffectoftheprocesseswithin electrodialysis, and how these processes influence the energy consumption for concentratingammonium.Itshouldbeconsideredthataselectrodialysisisusedforconcentratingammoniumstreams,amaximumconcentrationisfavorable.Thisisattemptedbyperformingaliteraturestudy,supplementedwithexperimentaltestsinordertoanswertheresearchquestion.Theresearchquestionofthisthesiscanbedescribedas:
Howcanthemaximumammoniumconcentrationfromresidualstreambeoptimized,utilizingenergyasefficientaspossiblefortheconcentrationofammoniuminanelectrodialysissetup?

5
1.3.3 Sub-questions
Thefollowingsubquestionsareconsidered:
1. Isthereaconceptualdifferencebetweencurrent-andenergyefficiency?2. Whatisthemaximumachievableammoniumconcentration,usingdigestedsludgerejectwater
withanammoniuminfluentconcentrationof1.5g/l?3. Towhichextentistheenergyefficiencyinfluencedbybackdiffusionofions?4. Towhichextentistheenergyefficiencyinfluencedby(electro-)osmosis?5. Doresidualstreamswithmono-andbivalentsaltshaveapositiveornegativeinfluenceonthe
energyefficiency?6. Cantheperformanceofelectrodialysisbeincreasedbystagingorapplyingdifferentvolume
ratios?
1.3.4 Approach
Inorder toanswer thesub-questionsand researchgoalof this thesis, firsta literaturestudyhasbeenperformed.Knowledgefromthisstudycanbefoundinchapter2.Hypothesesdrawnfromthisliteraturestudy are validated by experiments. The experimental goal, setup, usedmaterials andmethods of allexperimentscanbefoundinchapter3.Theresultsoftheseexperimentsareelaboratedinchapter4,givingessentialinformationaboutthesub-questions.Lastly,chapter5and6willbeusedtodiscussfoundresultsandprocesses,whilealsoadvantageousadaptionstotheset-upwillbeproposed.Additionalinformationanddatacanbefoundbackintheappendices.

6
2 Theoreticalbackground
2.1 Electrodialysis
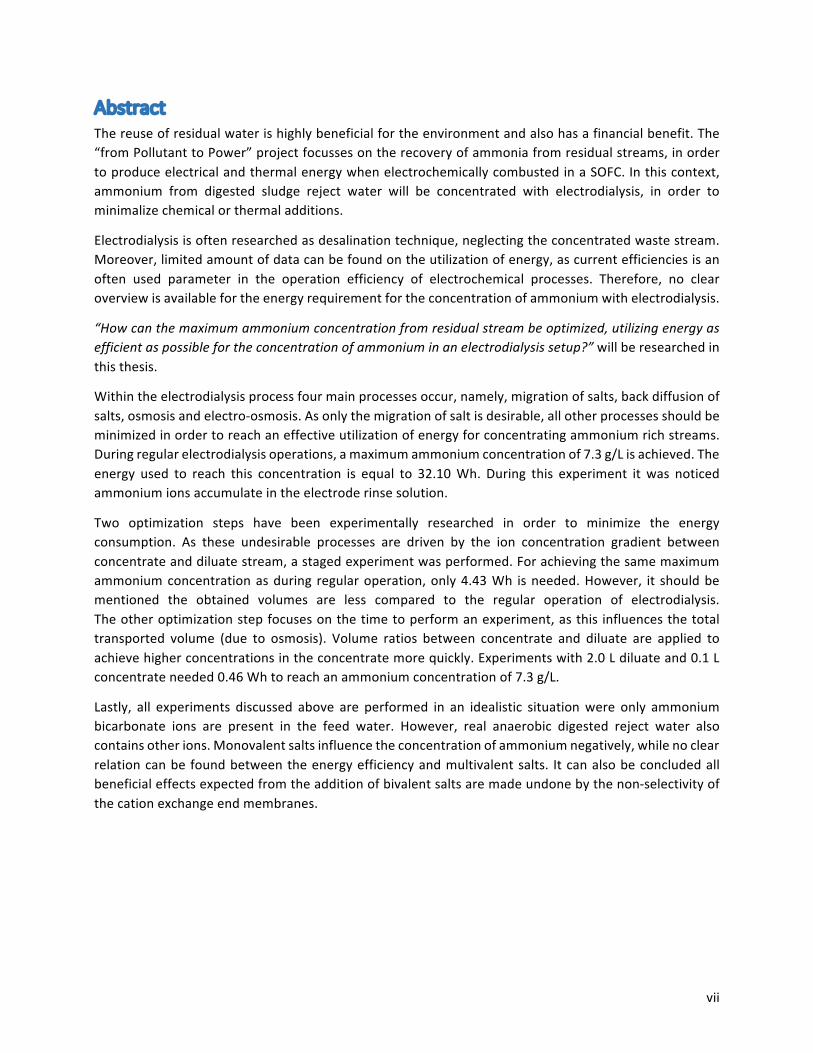
2.1.1 TechnologyreviewElectrodialysis is amembrane separation techniqueutilizinganelectricalpotentialdifferencebetweenbothendsofthecelltomovechargedionsthroughionexchangemembranes.Thesemembranesobtainedtheirnamefromtheionexchangeresintheyaremadefrom,whilenoionsonthemembranesurfaceareexchangedwithionsinsolutions,asisthecaseinionexchange(Strathmann,2010).Inanelectrodialysiscell altering anion (AEM) and cation (CEM) exchangemembranes are placed, dividedby flow spacers,betweentwoelectrodes.Thesemembranesonlyallowrespectivelynegativelyorpositivelychargedionstopassthroughthemembrane.Duetothepositioningofthemembranes,ionsaretransferredfromonesolutiontotheother,leadingtoaconcentrationofonestreamandthedilutionofanother.ThisprincipleisshowninFigure1.
Besidesmembraneswhoallowallanionsandcations(AEMandCEM)topassthrough,alsomonovalentselectivemembranescanbeapplied.Duetothefunctionalgrouponthesemembranes,onlymonovalentchargedionsareallowedtopassthroughthesemembranes(MVM).
Figure1-Electrodialysislayout
7
At both electrodes a concentrated electrode rinse solution allows the transfer of electrical potentialthroughthecell.Thissolution isseparatedfromtheothercellpairs,consistingofonediluateandoneconcentratestream,bycationendmembranes(CEEM).Byrecirculatingtheelectroderinsesolution,ionsthataretransferredthroughtheCEEMintothiselectrolytewillbetransferredbackintoaconcentratecellafterrecirculation.
Electrodialysisisalreadywidelyusedfordesalinationofbrackishwater,treatmentofindustrialprocesswatersandtherecoveringof reverseosmosisreject (Korngoldetal.,2009;Reahl,1990).Treatmentofbrackishwater,inordertoproducefreshwaterstreams,reverseosmosisisoftenpreferredasthisoffersamorecost-effectiveapproachandalsoformsabarrieragainstbiologicalcontamination(F.Valero,etal.2011).However,thisthesisfocusesontheproductionofahighlyconcentratedammoniumvolume,ratherthanproducingcleanwater.Comparedtothetreatmentofreverseosmosisreject,electrodialysisyieldsthebesthydraulicrecoveryandisthemostcost-effectivemembranetechnique(Xu&Huang,2008).
Inmostmembranestechniques,anexternalforceisusedtoforcewaterthroughthemembranes,whileinelectrodialysisonlyionsaretransferredthroughtheionexchangemembranes.Theresistanceinsuchasetupwillbedeterminedbythestreamthathasthe lowestelectricalconductivity, thediluatestream.Higherconcentrationsthereforeleadtolowerresistanceandabetterutilizationoftheenergy.However,electrodialysisislimitedbythepropertiesoftheionexchangemembranesandthehighcostsofelectrodesandionexchangemembranes(Xu&Huang,2008).
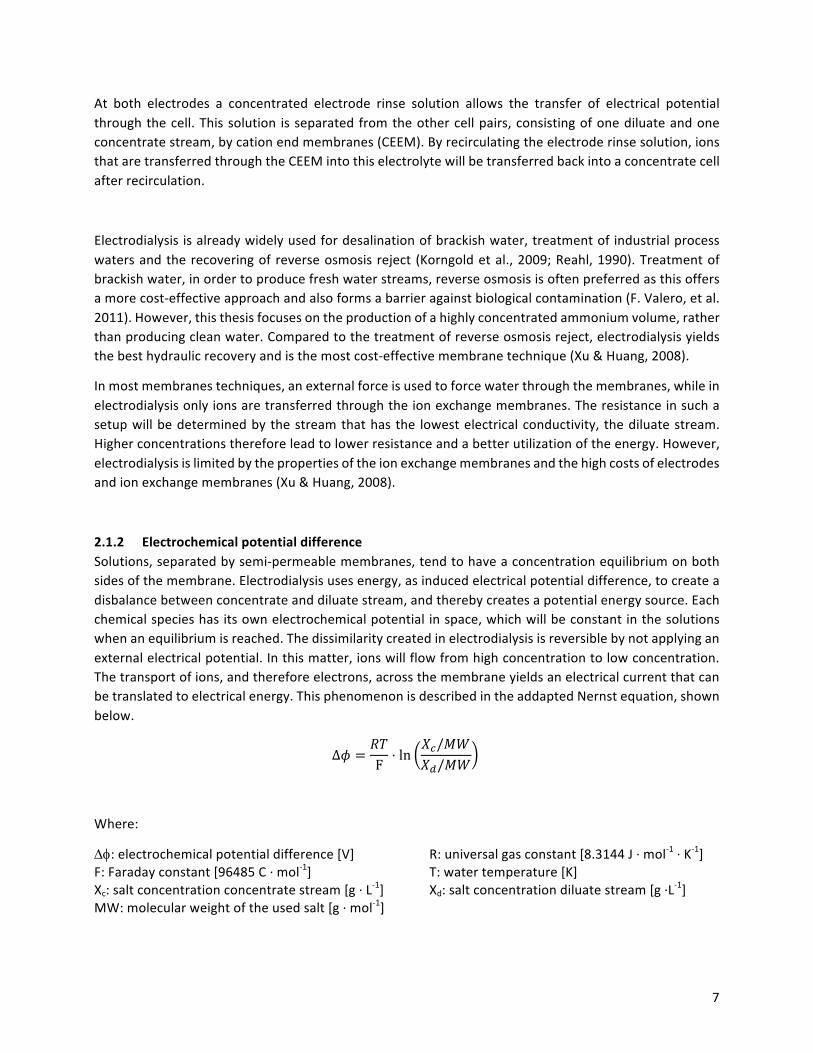
2.1.2 Electrochemicalpotentialdifference
Solutions,separatedbysemi-permeablemembranes,tendtohaveaconcentrationequilibriumonbothsidesofthemembrane.Electrodialysisusesenergy,asinducedelectricalpotentialdifference,tocreateadisbalancebetweenconcentrateanddiluatestream,andtherebycreatesapotentialenergysource.Eachchemicalspecieshasitsownelectrochemicalpotential inspace,whichwillbeconstantinthesolutionswhenanequilibriumisreached.Thedissimilaritycreatedinelectrodialysisisreversiblebynotapplyinganexternalelectricalpotential.Inthismatter,ionswillflowfromhighconcentrationtolowconcentration.Thetransportofions,andthereforeelectrons,acrossthemembraneyieldsanelectricalcurrentthatcanbetranslatedtoelectricalenergy.ThisphenomenonisdescribedintheaddaptedNernstequation,shownbelow.
∆" =$%F· ln
*+/-.*//-.
Where:
Df:electrochemicalpotentialdifference[V] R:universalgasconstant[8.3144J·mol-1·K-1]F:Faradayconstant[96485C·mol-1] T:watertemperature[K]Xc:saltconcentrationconcentratestream[g·L-1] Xd:saltconcentrationdiluatestream[g·L-1]MW:molecularweightoftheusedsalt[g·mol-1]
8
Thistheoreticalpotentialdifferenceistemporalandchangeswhenionconcentrationdifferencesbetweenconcentrateanddiluate flowchange.Thetime it takes for thesolutions toreachanequilibriumstate,combinedwiththeelectrochemicalpotentialandthecurrentitgenerates,canbetranslatedtotheamountofenergymoved.However,theenergydemandcanonlybedeterminedbyexperimentalstudies.
2.2 Operationparameters
2.2.1 Currentefficiency(CE)
The current efficiency is one of the key parameters determining the operation efficiency of anelectrochemicalprocess.Thedefinitionofcurrentefficiency,alsoknownastheFaradayefficiency,istheratiobetweenactualmasstransferredbythepassageofcurrentfromanelectrolytetothetheoreticalmasstransferredaccordingtoFaraday’slaw.Simplified,itdeterminesthepercentageofcurrentthatisused for the transfer of ions through the charged membranes. Monitoring the CE gives insight onundesirablephenomenalikethenon-perfectperm-selectivity,orimpuritiesinthemembranes(Sadrzadeh&Mohammadi,2009).Itcanbecalculatedusingthefollowingequation:
12 =3 · 4 · 56 · (18 − 1:)/-.
< · =
Where:CE:currentefficiency[%] z:chargeoftheion[-] F:Faradayconstant[96.485As·mol-1] Qf:diluateflowrate[L1·s-1] Ci:feedconcentration[g·L-1] C0:diluateconcentration[g·L-1]N:thenumberofcellpairs[-] I:appliedcurrent[A]MW:molecularweightoftheusedsalt[g·mol-1] Currentefficienciesbetween61.3and67percentcanbereachedforrespectivelysyntheticandnaturalurine, containingamixtureof ions,withmaincomponentsasammoniumcarbonate, sodiumchloride,potassiumchlorideandsodiumsulfate(Lutheretal.,2015).Thecompositionofthefeedsolutionhasabiginfluenceonthecurrentefficiencyasintertwinedinthefactorz.Understandingthebasicmechanismsinessential for optimizing the electrodialysis process. Therefore, only the transport of ammoniumbicarbonate through the charged ionexchangemembranes is consideredbefore synthetic ammoniumstreamsaretested.
2.2.2 Limitingcurrentdensity(LCD)The driving force for ion transfer over chargedmembranes, as in electrodialysis, is known to be theelectricalpotentialdifferencebetweentheanodeandcathode.Animportantparameterinitsoperationisdeterminedtobethecurrentdensity.Thisparameter,equaltotheelectricalcurrentoverthemembranearea,hasa strong relationwith the resistanceand theutilizationof the current, and thus the currentefficiency(Sadrzadeh&Mohammadi,2009).Theseparametersare,asbasicphysicsshowus,relatedasshownbelow.
2 = = · $

9
Where:E:Electricalpotential[V] I:current[A]R:resistance[Omh]
Aminimumresistancecanbeobtainedbyoperatingelectrodialysisonlimitingcurrentdensity(LCD).TheLCDisthecurrentdensitywheretheionconcentrationofthedepletedsolution,thediluatestream,attheionexchangemembranessurfacebecomeszero(Ho&Sirkar,2012).OperatingelectrodialysiscellsabovetheLCDdoesnotonlyresultinalowercurrentefficiency,introducinganadditionalcostelement,butalsoleads to thedissociationofwaterandpermanentdamage to themembranes.Moreover,pHchanges,consequentialtothedissociationofwaterinhydrogenandhydroxylcanbeharmfulforthemembranes.Permanentdamageofthemembranes,chargingthemembraneitssurface,willoccurwhenoperationalsettingsarefarabovetheLCD(Cowan&Brown,1959).
TheinfluenceofseveralparametersontheLCD,inanelectrodialysisset-up,hasintensivelybeenstudiedonexperimental scale.Designparameters, suchas the flowvelocity, stackdesign, feedconcentration,membranepropertiesandhydrodynamicconditionsaretestedtohaveacorrelationwiththeLCD(Leeetal.,2002).Empiricaldeterminationofthelimitingcurrentdensityhasledtoanequation,whichisacceptedwidelyandshownbelow.
>?8@,B@C = D ·1 · z-.
· FG
ln>?8@,B@C
1= ln D + IJK(F)
Where:ilim,emp:empiricallimitingcurrentdensity[A] C:concentrationofsolute[keq·l-1]u:linearflowvelocity[m·s-1] z:equivalentweight[eq·mol-1]MW:molecularweightoftheusedsalt[g·mol-1]
Figure2-DeterminationofconstantsaandbfordeterminingtheLCDondoublelogarithmicpaperscale

10
It can be concluded that the LCD is proportional to the ion concentration in the diluate stream andquadratictothelinearvelocityalongthemembrane.Moreover,constantsbandaarerespectivelyrelatedtothehydrodynamicconditionsintheEDcellandtheconcentrationinthesolution,cellconfigurationandpropertiesoftheionexchangemembranes.Theseconstantscanbecalculatedbyplottingequation1ondoublelogarithmicpaper,asshowninFigure2.
Asdifferentchemicalelementshavedifferentquantitativeinfluencesonthelimitingcurrentdensity,theempiricalformulacanonlybeappliedonstablesolutions.Therefore,inthisthesistheLCDisdeterminedbyplottingthereciprocalcurrentagainsttheresistance(Cowan&Brown,1959).ThismethodisshowninFigure3,wherealsothepHisshown.TheexampleshowninthisfigurehasaLCDvalueof3.85A,orareciprocal current of 0.26. Operating electrodialysis above this value leads to water dissociation andthereforepHchanges.
Figure3–Relationbetween(reciprocal)currentandresistance/pHforasodiumsulfatesolution(Cowan&Brown,1959)
11
2.2.3 Energyefficiency(EE)Asmentionedabove,currentefficiencyisoneofthemostimportantparameterstomeasuretheefficiencyofelectrochemicalprocesses.However,currentefficiencyneglectstheelectricalpotentialrequiredfortheelectrodialysisprocess.Withinthefocusofthisthesis,notonlytheutilizationofcurrentisimportant,butalsotheusageoftheavailableelectricalenergy.Noinformationcanbefoundintheacquiredliteratureabouttherelationbetweenthecurrentefficiencyandtheenergyefficiency.Moreover,energyefficiencyisatermusuallyusedinthecombustionofenergycarriersandcanbestbedescribedasthepercentageofenergyinputwhichisconsumedusefully(Patterson,1996).
Asitisnotpossibletodeterminetheamountofenergywhichisconsumedusefully,andtheelectrodialysisprocessdoesnotgenerateenergyfromanelectricalpotentialsource,itisnotpossibletodeterminetheenergyefficiencyisthisway.Concentratingionsisthemainobjectiveofelectrodialysisandcouldthereforebecomparedtotheusedamountofenergy.Withinthisthesis,thefollowingdefinitionofenergyefficiencywillbeused.
22 =142=1+L/1M:
2
Where:
CF:concentrationfactor[-] EE:energyefficiency[Wh-1]Cct:saltconcentrationconcentratecellattimet[g·m-3] E:consumedenergy[Wh] Cco:initialsaltconcentrationconcentratecell[g·m-3]
12
2.3 Processesinelectrodialysis
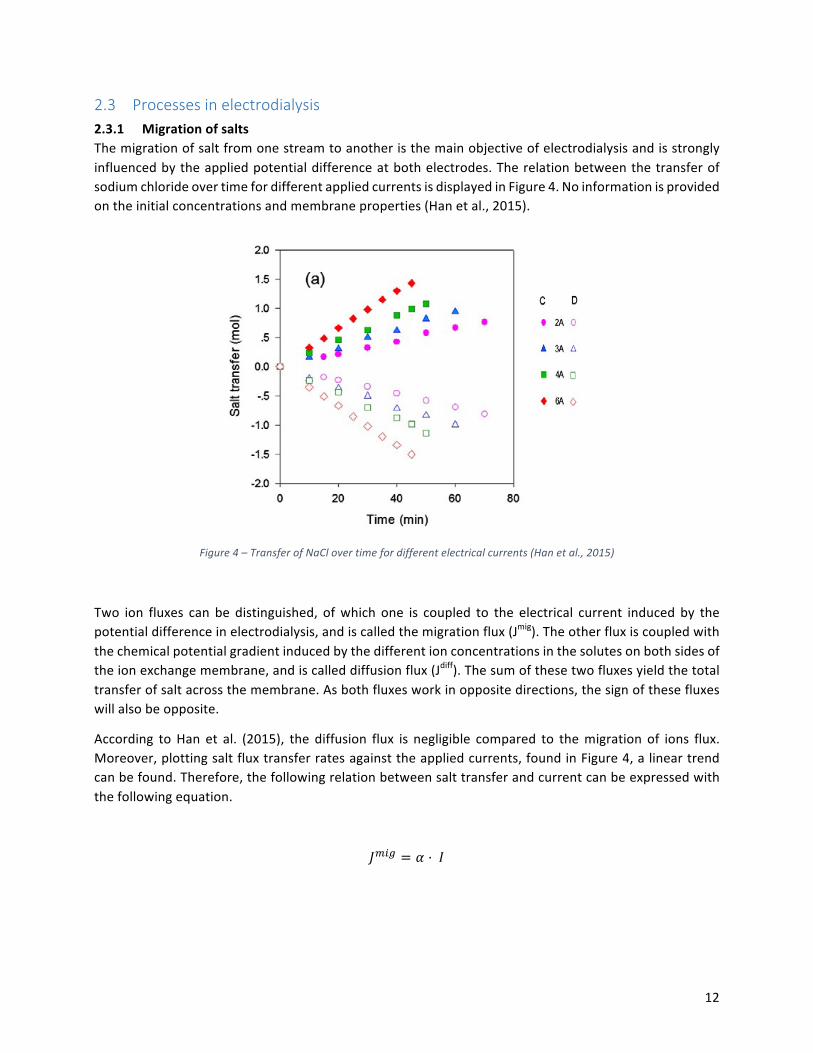
2.3.1 MigrationofsaltsThemigrationofsaltfromonestreamtoanotheristhemainobjectiveofelectrodialysisandisstronglyinfluencedbytheappliedpotentialdifferenceatbothelectrodes.TherelationbetweenthetransferofsodiumchlorideovertimefordifferentappliedcurrentsisdisplayedinFigure4.Noinformationisprovidedontheinitialconcentrationsandmembraneproperties(Hanetal.,2015).
Figure4–TransferofNaClovertimefordifferentelectricalcurrents(Hanetal.,2015)
Two ion fluxes can be distinguished, ofwhich one is coupled to the electrical current induced by thepotentialdifferenceinelectrodialysis,andiscalledthemigrationflux(Jmig).Theotherfluxiscoupledwiththechemicalpotentialgradientinducedbythedifferentionconcentrationsinthesolutesonbothsidesoftheionexchangemembrane,andiscalleddiffusionflux(Jdiff).Thesumofthesetwofluxesyieldthetotaltransferofsaltacrossthemembrane.Asbothfluxesworkinoppositedirections,thesignofthesefluxeswillalsobeopposite.
According toHan et al. (2015), the diffusion flux is negligible compared to themigration of ions flux.Moreover,plottingsaltfluxtransferratesagainsttheappliedcurrents,foundinFigure4,alineartrendcanbefound.Therefore,thefollowingrelationbetweensalttransferandcurrentcanbeexpressedwiththefollowingequation.
N@8O = P · =
13
Where:
Jmig:migrationsaltflux[mol·m−2·s−1] C:current[A]a:currentcoefficient[mol·m−2·s−1·A−1]
Thecurrentcoefficient(a)considerstheutilizationofcurrentforthetransferofsalt,comparabletothecurrentefficiency.Thecurrentcoefficientwillstronglydecreaseifelectrodialysisisoperatedabovelimitingcurrentdensity,asinthisscenarioenergyisalsousedforthedissociationofwater.Moreover,resistancesinducedbycurrenttransferandionexchangemembranesalsoinfluencethiscoefficient.
2.3.2 Backdiffusionofions
Inthelatterparagraphtheinfluenceofthediffusionfluxisneglected.However,itsrelativeinfluenceandtherelationtotheconcentrationdifferencebetweentwoadjacentcellsarenotdescribed.Moreover,theiontransportnumberisoftencompletelyassignedtothemigrationflux,whileitsdeterminationshowsacombinationofmigrationanddiffusionflux(Barragán&Ruız-Bauzá,1999).
However,thetransportofsaltacrossmembranes,whenonbothsidestwoelectrolytesolutionsareplacedwithadifferentconcentration,canbeobserved.Thisphenomenonisfoundinliteratureasback-diffusionofions,back-migrationofionsandelectrolytepermeation,andiswidelystudiedbymembraneresearchers(Izquierdo-Gil et al., 2012; Rottiers et al., 2014). In electrodialysis operations, back diffusion of ions isalwayspresentandhindersthepurposeofitsapplication.Literatureshowsthediffusionrateof ionsisproportionaltotheconcentrationgradient.However,thesediffusionconstantsshowdifferentvaluesfordifferent ions and different usedmembranes.Determining the diffusion constant for the transport ofammonium bicarbonate for the used membranes in this thesis, can be determined by conductingexperiments.
2.3.3 (Electro-)OsmosisThecationandanionexchangemembranesareespeciallydesignedasionexchangemembranes,rejectingallnon-chargedmoleculeslikewater.However,multiplepapersrecallnotonlysolutetransport,butalsothetransportofitssolventduringtheoperationoftheED-cell(Gainetal.,2002;Hanetal.,2015;Leeetal.,2002;Lingetal.,2002).Thisflowcanbedividedintothecommontransferofwater,togetherwiththesaltions,andthetransferofwaterduetoosmoticpressuredifferenceinadjacentconcentrateanddiluatecells.
14
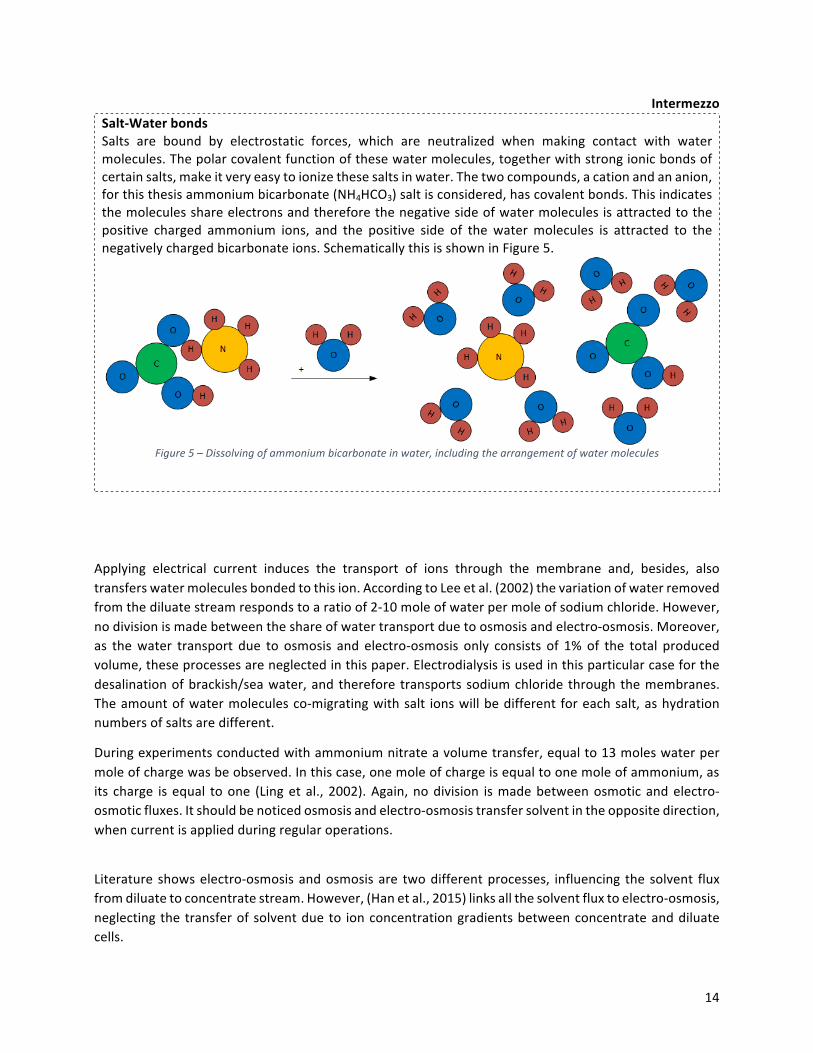
Intermezzo
Salt-WaterbondsSalts are bound by electrostatic forces, which are neutralized when making contact with watermolecules.Thepolarcovalentfunctionofthesewatermolecules,togetherwithstrongionicbondsofcertainsalts,makeitveryeasytoionizethesesaltsinwater.Thetwocompounds,acationandananion,forthisthesisammoniumbicarbonate(NH4HCO3)saltisconsidered,hascovalentbonds.Thisindicatesthemoleculesshareelectronsandthereforethenegativesideofwatermoleculesisattractedtothepositive charged ammonium ions, and the positive side of thewatermolecules is attracted to thenegativelychargedbicarbonateions.SchematicallythisisshowninFigure5.
Figure5–Dissolvingofammoniumbicarbonateinwater,includingthearrangementofwatermolecules
Applying electrical current induces the transport of ions through the membrane and, besides, alsotransferswatermoleculesbondedtothision.AccordingtoLeeetal.(2002)thevariationofwaterremovedfromthediluatestreamrespondstoaratioof2-10moleofwaterpermoleofsodiumchloride.However,nodivisionismadebetweentheshareofwatertransportduetoosmosisandelectro-osmosis.Moreover,as thewater transport due to osmosis and electro-osmosis only consists of 1% of the total producedvolume,theseprocessesareneglectedinthispaper.Electrodialysisisusedinthisparticularcaseforthedesalinationofbrackish/seawater,andtherefore transportssodiumchloride throughthemembranes.Theamountofwatermoleculesco-migratingwithsalt ionswillbedifferent foreachsalt,ashydrationnumbersofsaltsaredifferent.
Duringexperimentsconductedwithammoniumnitrateavolumetransfer,equalto13moleswaterpermoleofchargewasbeobserved.Inthiscase,onemoleofchargeisequaltoonemoleofammonium,asits charge isequal toone (Lingetal., 2002).Again,nodivision ismadebetweenosmoticandelectro-osmoticfluxes.Itshouldbenoticedosmosisandelectro-osmosistransfersolventintheoppositedirection,whencurrentisappliedduringregularoperations.
Literature showselectro-osmosisandosmosisare twodifferentprocesses, influencing the solvent fluxfromdiluatetoconcentratestream.However,(Hanetal.,2015)linksallthesolventfluxtoelectro-osmosis,neglectingthetransferofsolventdueto ionconcentrationgradientsbetweenconcentrateanddiluatecells.

15
Therefore,provingtheexistenceofosmosisandelectro-osmosisshouldbedemonstrated,whilealsotherelationbetweensolventfluxesanditsdrivingforcesshouldbeinvestigated.
Thedrivingforceforelectro-osmosisisknowntobeelectricalcurrent,asthistransfersionsthroughionexchangemembranes. Han et al. (2015) describes the transfer of salt, as shown in Figure 4, and thecorrespondingtransferofsolvent,whichisshowninFigure6.Aclearrelationbetweencurrentdensityandwatertransportratescanbeobserved.However,thisrelationisproportionaltotheratioofNaCltransferovertime,fordifferentelectricalcurrents.Therefore,(Hanetal.,2015)statesthetransferofsolventisonlyinfluencedbythetransferofions,andthereforeelectro-osmosis.
Figure6–WatertransferforthedilutionofNaClovertimefordifferentelectricalcurrents(Hanetal.,2015)
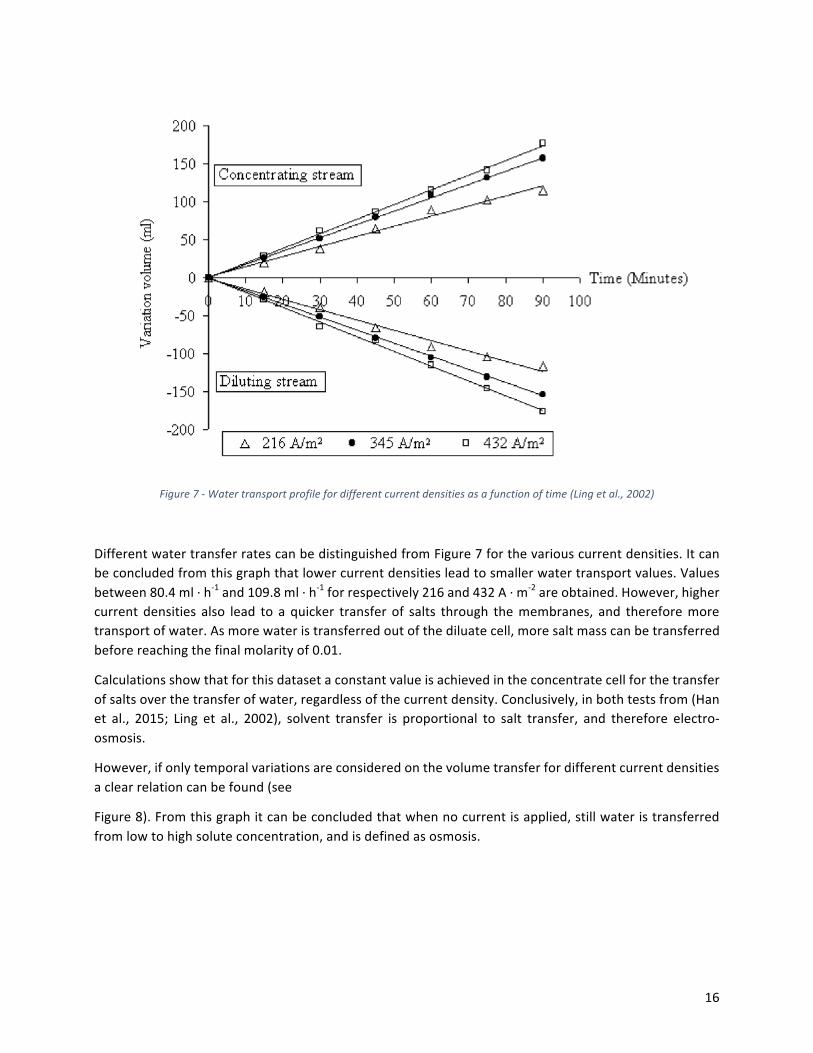
ThissamerelationbetweencurrentdensityandwatertransportratescanbeseeninFigure7(Lingetal.,2002). Within the boundaries of this experiment, 1500 ml concentrate and diluate batches withammoniumnitratearetreatedfromaninitialmolarityof0.11,untilaconcentrationof0.01Misreached.Thispointisdefinedasthepointwheretheconcentrationintheconcentrateisnotincreasingfurtherduetothetransportationofwatermolecules.Threeexperiments,doneintriplets,withcorrespondingcurrentdensitiesof216,345and432A·m-2yielda linearrelationwiththevariationinwatertransport intheconcentratecell.
16
Figure7-Watertransportprofilefordifferentcurrentdensitiesasafunctionoftime(Lingetal.,2002)
DifferentwatertransferratescanbedistinguishedfromFigure7forthevariouscurrentdensities.Itcanbeconcludedfromthisgraphthatlowercurrentdensitiesleadtosmallerwatertransportvalues.Valuesbetween80.4ml·h-1and109.8ml·h-1forrespectively216and432A·m-2areobtained.However,highercurrent densities also lead to a quicker transfer of salts through themembranes, and thereforemoretransportofwater.Asmorewateristransferredoutofthediluatecell,moresaltmasscanbetransferredbeforereachingthefinalmolarityof0.01.
Calculationsshowthatforthisdatasetaconstantvalueisachievedintheconcentratecellforthetransferofsaltsoverthetransferofwater,regardlessofthecurrentdensity.Conclusively,inbothtestsfrom(Hanet al., 2015; Ling et al., 2002), solvent transfer is proportional to salt transfer, and therefore electro-osmosis.
However,ifonlytemporalvariationsareconsideredonthevolumetransferfordifferentcurrentdensitiesaclearrelationcanbefound(see
Figure8).Fromthisgraphitcanbeconcludedthatwhennocurrentisapplied,stillwateristransferredfromlowtohighsoluteconcentration,andisdefinedasosmosis.

17
Figure8-Relationbetweenwatertransportandcurrentdensities(L.-P.Ling,etal.)
Osmosis is a natural occurring process and is driven by the ion concentration gradient between twoadjacentconcentrateanddiluatecells.Noliteratureisfounddefiningtheshareofosmosistothetotalsolvent flux. However, reverse osmosis theory shows the relation between water flux and externallyappliedpressure(TMP).Inelectrodialysisthispressureisnotpresentandwillthereforebeequaltozero,leadingtoanaturalflowofsolventfromlowtohighionconcentrationstreams.
N =1
R · $· (%-S −∆T)
Where:J:volumetricflux[m·s-1] µ:dynamicviscosityofwater[pa·s-1]R:membraneresistance[m-1] TMP:transmembranepressure[pa]Dp:Osmoticpressuredifference[pa]
2.3.4 InfluenceofothersaltsNodirectliteratureisfoundontheinfluenceofothersaltsontheenergyefficiencyfortheconcentrationofone“goal”salt.However,withtheknowledgegatheredfromliteratureitcanbestatedthetransferofionsislineartotheappliedelectricalcurrent.Thepresenceofothersaltswillhaveanegativeinfluenceontheconcentrationofammoniumbicarbonate,astheseionswillalsotransferfromdiluatetoconcentrateflux,anduseelectricalcurrentforthisprocess.Ontheotherhand,thepresenceofotherionsinsolutionwillleadtohigherelectricconductivitiesandthereforelowerresistances.Asoneprocesshasapositiveinfluenceonthecurrentusage,whiletheotherprocesshasanegativeinfluence,itcannotbestatedifthepresenceofothersaltshasabeneficialeffectontheenergyefficiency.Inthecaseofmultiple-valentions,retainingtheminthediluatestreambyapplyingmonovalentselectivemembranes,willonlytoanincreaseinconductivityandthereforeyieldsapositiveeffect.

18
2.3.5 Overview
Fourmainprocessescanbedefinedwhentakingelectrodialysisintoaccount,namelythetransferofions,backdiffusionofionsandthesolventofflux.Thisfluxcanbesubdividedinelectro-osmosisandosmosis.In Figure9below, theseprocesses are shown. It shouldbenoted that the transport of ions is alwaysaccompaniedbythetransportofsolvent.
Figure9–Processesinelectrodialysis
Migrationofions
Backdiffusionofions
Osmosis
19
2.4 Optimization
Thetwoobstaclesdeterminedinthelatterparagrapharemainlydrivenbytheionconcentrationgradientbetweenconcentrateanddiluatestreams.Electro-osmosiscannotbepreventedandthereforewillgiveaminimalvolumeflux.Therefore,minimizingosmoticfluxesandbackdiffusionofionscanbepreventedbylimitingconcentrationdifferences.
Moreover,iontransferislinearrelatedtotheappliedelectricalcurrent,asshowninparagraph2.3.1.Themaingoalofthisresearchisachievingamaximumammoniumconcentration,utilizingenergyasefficientaspossible. Theaccumulationof ammonium in the concentrate cell leads to increased concentrationswhenconcentratevolumesaredecreased.Literatureonthesetwooptimizationpossibilitiesaregatheredbelow.
2.4.1 VolumeratioOptimizingelectrodialysisforanenergyefficienttransferofammoniumthroughthemembranesisoftenaccommodatedbychanginginputparametersasappliedvoltage,flowspeedandinitialconcentrations.However, theeffectofvolume isoftenneglected,while itsnaturaloccurrence inosmosisandelectro-osmosisisalwayspresent.
TheeffectofchangingseveraloperationparametersinelectrodialysisinordertoproducecoarsesaltandfreshwaterfromaconcentratedreverseosmosisbrineisinvestigatedbyJiangetal.(2014).Thisresearchconsiderstheeffectofavolumetricincreaseintheconcentratestream.Experimentsshowforahigherconcentrate to diluate ratio (1:3), a quicker transport of salts from the diluate to the concentrate.Considering the processes mentioned above, higher ratios lead to lower ion concentration gradientsbetweenconcentrateanddiluatestream.Therefore,lessbackmigrationofionswilloccur.Novolumetric,currentorelectricalpotentialdataisgivenforthisratioincrease.
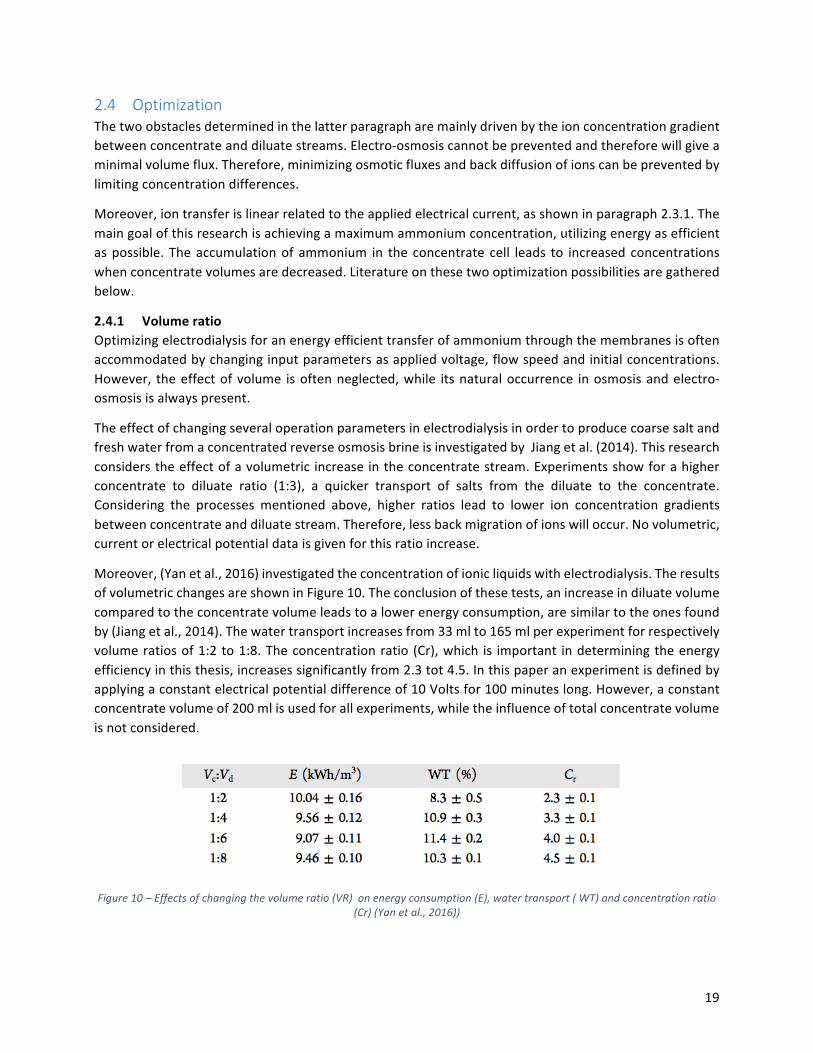
Moreover,(Yanetal.,2016)investigatedtheconcentrationofionicliquidswithelectrodialysis.TheresultsofvolumetricchangesareshowninFigure10.Theconclusionofthesetests,anincreaseindiluatevolumecomparedtotheconcentratevolumeleadstoalowerenergyconsumption,aresimilartotheonesfoundby(Jiangetal.,2014).Thewatertransportincreasesfrom33mlto165mlperexperimentforrespectivelyvolumeratiosof1:2to1:8.Theconcentrationratio(Cr),which is important indeterminingtheenergyefficiencyinthisthesis,increasessignificantlyfrom2.3tot4.5.Inthispaperanexperimentisdefinedbyapplyingaconstantelectricalpotentialdifferenceof10Voltsfor100minuteslong.However,aconstantconcentratevolumeof200mlisusedforallexperiments,whiletheinfluenceoftotalconcentratevolumeisnotconsidered.
Figure10–Effectsofchangingthevolumeratio(VR)onenergyconsumption(E),watertransport(WT)andconcentrationratio
(Cr)(Yanetal.,2016))
20
It can therefore be concluded that larger diluate volumes, compared to concentrate volumes, lead toseveral desirable effects.Within the researched volume ratios an increasing energy efficiency can benoticed,withvaluesrespectivelyequalto0.23,0.35,0.44and0.48Wh-1.Itcanbeassumedthatsmallervolumeratiosyieldanevenhigherenergyefficiency.

21

22
3 Materialsandmethods
3.1 Experimentalsetup
3.1.1 ObjectiveInordertovalidatehypothesesdrawnfromliteraturestudy,andinordertoanswerthesubquestionsandsubsequent the research question of this thesis, experiments are conducted. The objective of theexperimental unit is to study the influence of operational parameters on the ammonium (NH4+ (aq))concentrationperformanceofelectrodialysis.Inthisstudy,thecross-flowrate,currentdensity,volumeratiosandconcentrationratioswereresearched.Additionally,multipletypesofmembranesweresubjectof research (standard and monovalent selective), in order to determine selectivity performance ofconcentrationinmixtures.
3.1.2 Experimentalset-up
Theexperimentalset-upconsistsoftwoPCCellunits,respectively64002and64004,asthecasingfortheEDstack.ThemaindifferencebetweenthesetwoPCCellEDunitsistheamountofstreamstheyallowtoentertheEDstack,whichisrespectivelythreeandfivestreams.Asonlyconcentrate,diluateandelectroderinsestreamswereusedduringtheexperimentsperformedinthisthesis,alsotwoPCCell64002EDcellunits could be used. The set-up consists of an ED stack enclosed by an anode (made of Pt/Ir- coatedTitanium)andacathode(madeofV4ASteel)(PCCell,2016).FortheEDexperiments,astandardmembranestack(STM)andamonovalentmembranestack(MVM)wereused,whichwerebothsuppliedbyPCCell.Eachstackconsistsofthefollowingelements:
- n-1 Cationexchangemembranes (CEM)- 2 Cationexchangeendmembranes (CEEM)- n Anionexchangemembranes (AEM)- 2n Associatingspacers
StandardCEM
StandardAEM
MonovalentCEM
MonovalentAEM
StandardCEEM
Functionalgroupandionicform
Sulphonicacid–Na+
Ammonium –Cl-
Sulphonicacid–Na+
Ammonium –Cl-
Sulphonicacid–Na+
Membranedim.[m]LengthxHeight
0.11x0.11 0.11x0.11 0.11x0.11 0.11x0.11 0.11x0.11
Eff.Mem.dim.[m]LengthxHeight
0.08x0.08 0.08x0.08 0.08x0.08 0.08x0.08 0.08x0.08
Thickness[m] 160·10-6 -200·10-6
180·10-6 -220·10-6
100·10-6 110·10-6 400·10-6
Resistance[Ω/m2] ~2.5·104 ~1.8·104 ~20·104 ~9·104
Table2–Membranecharacteristics(PCCell,2016)

23
Thecationexchangemembranes,anditsassociatedspacers,aresituatednexttotheelectrodes.BetweenthesetwoCEEM,alternatingcationandanionexchangemembranesaresituated,asshowninFigure11.MembranecharacteristicsfortheusedmembranesareshowninTable2.Themembranestacksusedinthisresearchconsistsoftencellpairs(n=10),consistingofacation-exchangemembrane,aconcentratecontainingcell,ananion-exchangemembraneandadiluatecontainingcell.Thetotaleffectivemembraneareaoftencellpairsisequalto0.128m2.Thespacergaskets,allowingthewatertoflowbetweenCEMandAEMmembraneshaveathicknessof0.5·10-3m.
Figure11–Lay-outofanelectrodialysismembranestack
3.1.3 Schematicpresentation
InFigure12aschematicrepresentationoftheexperimentalEDset-upisshown,includingallstreamsandcomponents.
Amixingtableandmagneticstirrersareusedfortheconstantmixingoftheconcentrate-,diluate-andelectrolyte volumes to ensure the uniform distribution of ions in solution. From these volumes theelectrolytes are pumped, throughWatsonMalowMarprene tubeswith a bore of 6.4mm and awallthicknessof1.6mm,totheEDstackbyaWatsonMarlow520Spumpandthree323pumpheads.ThecurrentandelectricalpotentialisprovidedtotheelectrodialysiscellbyaTENMA72-2535directcurrentpowersupply,withacurrentrangeof0.0–3.0Aandanelectricalpotentialrangeof0.0–30.0V.

24
Theinitialdiluateandconcentratestreamsbothconsistofoneliterdemineralizedwaterwithanadditionof a 6.58 g/L ammonium bicarbonate solution (NH4HCO3), which is equivalent to 1.5 g/L ammonium.Hence, this results in equal TDS concentrations and therefore an equal electrical conductivity in bothstreams.Duetohighelectricalpotentialdifferencesattheelectrodes,forminghydrogenandhydroxylatrespectivelytheanodeandcathode,electrochemicalreactionswilloccurintheelectrolytesolutioncloseto the electrodes. A highly concentrated electrode rinse solution limits the resistance of transferringelectricalpotentialfromtheelectrodestothefluid,consistingof1molar(85g/L)sodiumnitrate(NaNO3).
Figure12–SchematicrepresentationexperimentalEDset-up
During standardexperiments,electrical conductivity sensorsareplaced in thediluateandconcentratestreams for continuousmeasurementseveryminute.Whenconsidering the influenceof theelectroderinsesolutionintheEDperformance,alsotheECofthisstreamwillbemeasured.Electricalconductivity,orpH,ismeasuredwithaWTWMulti3630IDSmulti-meter.Inaddition,ammoniumsamplesweretakenwithMachery-NagelNANOCOLORAmmonium200(fortherangeof0.04–0.2g/LNH4
+)and2000(fortherangeof0.4–2.0g/LNH4
+)testtubes.
Thecurrentandelectricalpotentialareautomaticallyloggedeverysecondbythedirectcurrentsupplyonalaptop.
TheamountofenergyneededtocirculatethestreamsisdeterminedbyusingaFESTOSpanpressuresensor,witharangeof0to2barsandanintervalof0.01bar.
25
3.2 Experimentalprocedure
3.2.1 LCDprocedureOperatingtheEDcellabovethelimitingcurrentdensityresultsinmultipledisadvantages,asmentionedinparagraph2.2.2.TheLCDwasdeterminedbytheempiricalmethodof(Cowan&Brown,1959).
Tenvolumeswithanammoniumconcentrationratioof1.0,0.9,0.8,0.75,0.6,0.5,0.25,0.10,0.05and0.01,comparedtotheinitialammoniumconcentration,arepreparedforthedeterminationoftheLCD.InordertoinvestigatetheeffectofconcentrationontheLCD,theconcentrationduringonerunneedstobekept constant. This is facilitated by recirculating the concentrate and diluate stream from the samevolume,whichwillbeconstantlymixedonamixingtable.Toensureconcentrationdifferenceswerenotoccurring,theelectricalconductivityofthesaltsolutionismeasured.Thecurrentisgraduallyincreasedeveryfivesecondwitha0.01A.
Theusedcellconsistsoftencellpairs,withrespectivelytwentymembranes,whiletheelectrochemicalsplittingofwateroccursaround1.23V.Therefore,thetestwillbestoppedwhenacurrentof25voltsisexceeded,astohighcurrentscancauseseveredamagetotheionexchangemembranes.
Thistestwillbeconductedforconstantcross-flowspeedsof11.6mm/sand3.9mm/s.
3.2.2 ExperimentalEDprocedureDifferentexperimentswereexecutedwithinthisthesis,andarediscussedbelow.
Singlediluateexperiments
Allexperimentswillstartwiththeconcentrationconditionsasdiscussedinparagraph3.1.3,andwillbeendedwhentheelectricalconductivityofthediluatewillreachapproximately1mS/cm.Thesinglerunexperiments are executed in order to determine the best condition for cross-flow speed and appliedcurrentdensity.Experimentsareperformedwith15.63A/m2,halfLCDandfullLCDforconstantcross-flowspeedsof11.6mm/sand3.9mm/s.Theammoniumconcentrationsoftheconcentrateanddiluatewillbemeasuredatthestartandendoftherun.
Multiplediluateexperiments
Data concerning hindering factors and osmosis will be gathered by performing multiple diluateexperimentsinafeedandbleedsystem.Inessencetheseexperimentsarethesameasthesinglediluateexperiment.Whenthediluatevolumeitsionsaredepleted(~1mS/cm),theperistalticpumpandpowersupply will be turned off. The volume and ammonium concentration of the concentrate, diluate andelectroderinsevolumeswillbemeasured.ThevolumeintheEDstackandtubingsystemwillbebroughtback to the corresponding volume before measuring. A new diluate volume will be prepared andexchangedforthedepleteddiluatevolume,asthisisnotcontainingenoughsaltsforaneffectiveprocess.Thisprocesswillberepeatedfortwentydiluatevolumes.
26
Osmosisexperiments
Asadditiontothemultiplediluateexperimenttwoosmosistestswereperformedtogatherinformationaboutwater transfer through the ion exchangemembranes. An initial dissimilarity in concentration iscreated between the diluate and concentrate volume by adding respectively 13 and 0.2 grams ofammoniumbicarbonatetohalfaliterofdemineralizedwater.Thetestwillbedoneforcross-flowspeedsof11.6mm/sand3.9mm/sandwillendafter18hours.
Thesameexperimentisrepeatedwithdifferentsaltsolutions,1gramofsodiumchlorideand9gramsofammoniumbicarbonateinhalfaliterofwaterforrespectivelytheconcentrateanddiluateisprepared.Thisexperimentwillonlybeconductedforacross-flowspeedof11.6mm/sandwillendafter18hours.
Variablevolumeexperiments
Theeffectofvolumeontheperformanceoftheelectrodialysisprocessistestedbyusingdifferentvolumeratiosanddifferenttotaldiluatevolumes.Theusedvolumesandmembranes(STM,standardexchangemembranesandMVM,monovalentselectivemembranes)areshownbelowinTable3.
Volumeratio Totaldiluatevolume Membranes[-] [L] STM/MVM1.0 1,2,2 STM,STM,MVM0.65 1 STM0.5 1,2,2 STM,STM,MVM0.33 2 STM0.25 1,2 STM,MVM0.20 1 STM0.10 2 STM0.05 2 MVM
Table3-Variablevolumeexperimentsinputparameters
Monovalentselectivemembraneexperiments
Theseexperimentsareconducted inorder todeterminethe influenceofothermono-andmultivalentions,besidesammoniumbicarbonate,insolutionontheenergyefficiencyoftheEDcell.
Inordertoinvestigatetheinfluenceofmonovalentions,asolutionofoneliterdemineralizedwaterwithammoniumbicarbonateandsodiumbicarbonate isprepared.To research the influenceon theenergyconsumptionofthemonovalentsaltquantity,alowandhighconcentrationsodiumbicarbonate(0.5–2.0g/Lisaddedinthedifferentexperiments.
Concerningbivalentions,thewatermatrixofrejectwatershowscalciumandphosphatesionshavethehighest concentrationsof themultivalent cat- andanions.However, additionof tri-calciumphosphate(Ca3(PO4)2)isnotpossible,asitssolubilityproductisequalto0.02g/L.Moreover,theadditionofalmostallbivalentcationsincombinationwiththestandardsolutioncontainingammoniumbicarbonateformsprecipitates directly after dosing (calcium- or magnesium carbonate). Determining the effect of
27
multivalentsaltsontheenergyconsumptionofconcentrationammoniumisthereforeonlypossiblewhennotammoniumbicarbonate(NH4HCO3)butanotherammoniumsaltisused.Hence,ammoniumchloride(NH4Cl),isagooddissolvableinwateranddoesnotconflictwithbivalentsalts.Moreover,thesolubilityproductofmagnesiumandsulfatesishigherthancalciumandphosphates.Therefore,theeffectofarangebetween0.3–0.5g/Lmagnesiumsulfate(MgSO4)istestedontheconcentrationofammoniumchloride(NH4Cl).
Theexperimentsconductedwiththebivalentionsarealsousedtodeterminetheselectivityperformanceofthemonovalentselectiveionexchangemembranes.
3.2.3 CleaningprocedureEDAftertheexperiments,boththeSTMandMVMmembraneswerecleanedbyrecirculationofbotha0.1mol/LHClanda0.1mol/LNaOHsolutionfor1.0h,inordertoremovepotentialinorganic(scalingproducts)andorganicfouling,respectively.
28
4 Resultsanddiscussion
4.1 Efficiencies
The utilization of current and energy is determined in respectively the current and energy efficiencycoefficients. As there is no theoretical background on determining energy efficiencies for operatingelectrochemicalprocesses,onlyparametersinfluencingthecurrentdensityareexamined.Inthismatter,cross-flowspeedandcurrentdensityareconsidered.Boundaries forapplyingcurrentaresetbetween15.63A/m2andLCD.ThedeterminationoftheLCDcanbefoundin7.3.3.
4.1.1 Current-andenergyefficiencyWith the formulas shown in paragraphs 2.2.1 and 2.2.3 both current and energy efficiency can bedeterminedfordifferentinputparameters.Sixtestsareperformedinordertocalculatethetrendintheseefficiencies,namelywithcross-flowspeedsof11.6mm/s(HighCross-flow)and3.9mm/s(LowCross-flow)andfor15.63A/m2(LowCurrent),halftheLCD(Intermediatecurrent)andonLCD(Highcurrent).Forsingleruns,theresultsareshownbelowinFigure13.
It should be noted that the tests with intermediate- and high currents are always operated belowrespectivelyhalfLCDorLCD.Thismeansthatforacertaindiluateelectricalconductivityvalue,thecurrentdensityisdecreased,inordertopreventundesirableeffects.
Figure13–Current-andenergyefficiencyfordifferentflowcrossspeedsandappliedcurrents
0
0.5
1
1.5
2
2.5
0.00
5.00
10.00
15.00
20.00
25.00
Lowcu
rren
t
Interm
ediatecu
rren
t
Highcu
rren
t
Lowcu
rren
t
Interm
ediatecu
rren
t
Highcu
rren
t
Lowcrossflow Highcrossflow
Energyefficien
cy[W
h-1 ]
Curren
tefficien
cy[%
]
Currentefficiency Energyefficiency
29
Amaximum deviation of 2.81 can be observed in the current efficiency between the different inputparameters.AstheoperationoftheEDisstoppedatthesameECvalue,namely1mS/cm,andthestartconcentrationisalsoequalforallruns, itcanbeassumedthattheconcentrationattheendminustheinitialconcentrationisequalforallexperiments.Moreover,thechargeoftheion,FaradayconstantandnumberofcellpairsintheEDsetupalsostaysequal.Itcanthereforebeconcludedthatthetimespendtomoveacertainamountofsaltsthroughthemembraneislinearrelatedtotheamountofappliedcurrent.
Current efficiencies between 19.5% and 22.3% are foundwhen conducting these experiments. Thesevaluesseemverylowcomparedtotherangeof61.3%and67%,whichwerefoundinliterature(Lutheretal.,2015).However,theappliedcurrentdoesnotonlyinducethetransferofammoniumthroughcationexchangemembranes,butalsothetransportofbicarbonatethroughanionexchangemembranes.Ifthetransferofbicarbonateisalsotakenintoaccount,efficienciesbetween85%and96%canbefound.Thesehigh values can be reached due to a very idealistic solution, with only containing one salt, and theoperationwherethecurrentneverexceedstheLCDvalues.
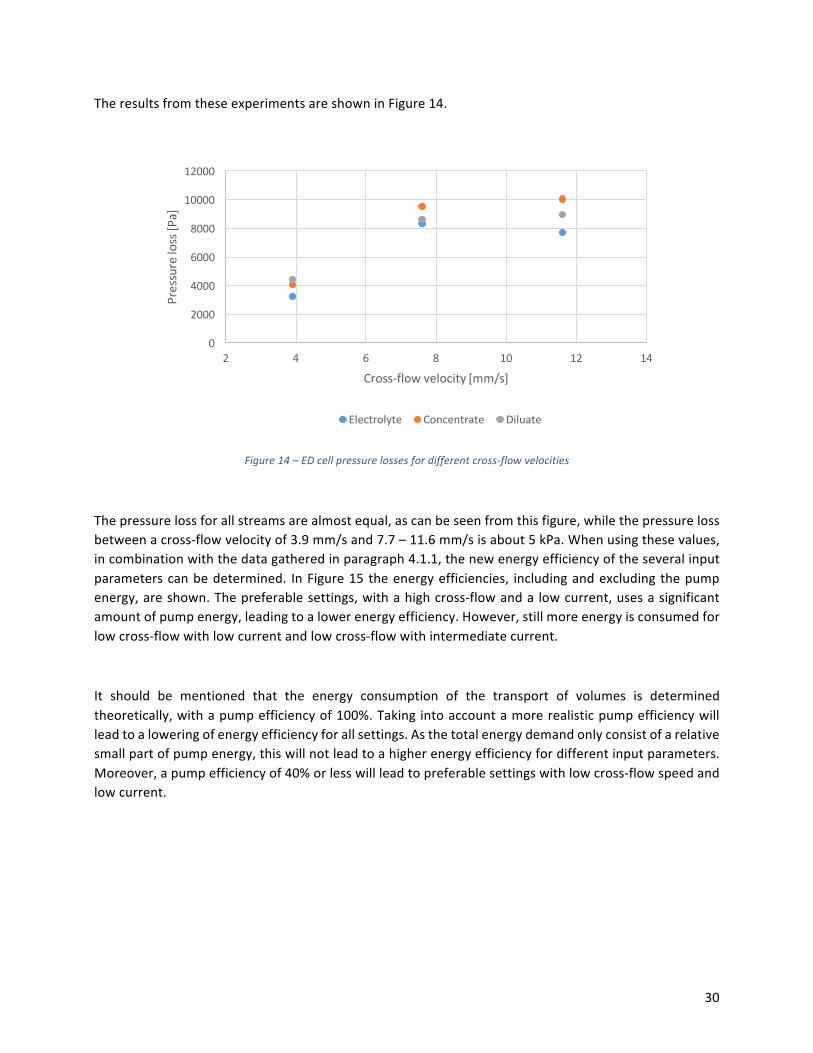
Asmentionedbefore,thisthesisfocussesontheutilizationofenergybyelectrodialysis,andnotonlytheused current. Compared to the current efficiency values, largedeviationsbetween thedifferent inputparameters can be observed for energy efficiency. Energy efficiencies between 0.7 and 2.1Wh-1 areobserved, for theconcentrationof thesameammoniummass.Generally, itcanbeconcludedthattheincreaseofcurrentdecreasestheenergyefficiency.Moreover,thereisnoclearrelationbetweenthehighand low cross-flow tests. According to Figure 13 a high cross-flow (HCF) with a low current (LC) ofrespectively 11.6mm/s and 15.63 A/m2 uses energy as efficient as possible for the concentration ofammonium.
4.1.2 PumpenergyHowever,besidestheelectricalenergyusedfortheoperationofelectrodialysis,alsoenergyisneededtotransporttheelectrolytesthroughthisstack.Theenergyconsumptionofthepumpisneglected inthisgraph,butcouldinfluencetheoutcomesignificantly.Operationtimesvarygreatlyfrom32to178minutes.
ThepressurelossovertheEDcelliscalculatedbyassessingthepressureafterthepump,butbeforetheEDcell,whilethepressureaftertheEDcell isequaltozero(adjustedforatmosphericpressure).Theseexperimentsareconductedforcross-flowspeedsof11.6,7.7and3.9mm/s.Fromhydraulics,therelationbetweenpressuredropcanberelatedtotheflowandthepowerdemand.
S = 5 · ∆U
Where:
P:power[W] Q:Flow[m3·s-1]Dp:pressureloss[Pa]
30
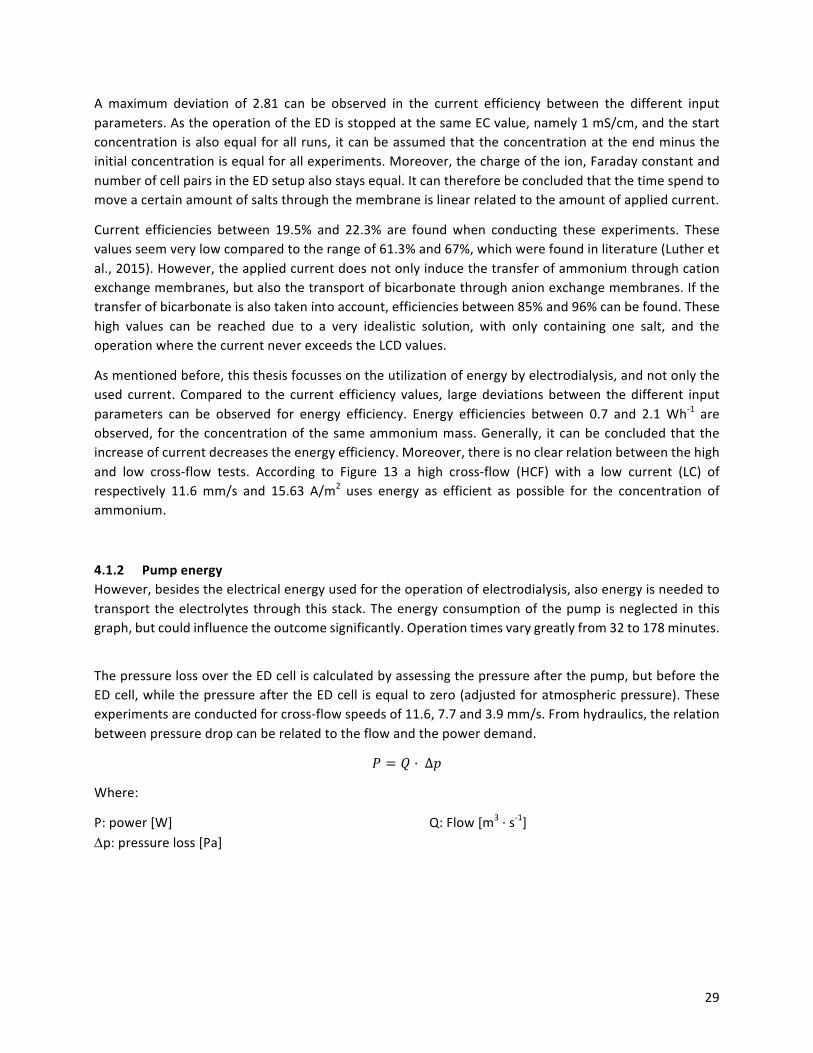
TheresultsfromtheseexperimentsareshowninFigure14.
Figure14–EDcellpressurelossesfordifferentcross-flowvelocities
Thepressurelossforallstreamsarealmostequal,ascanbeseenfromthisfigure,whilethepressurelossbetweenacross-flowvelocityof3.9mm/sand7.7–11.6mm/sisabout5kPa.Whenusingthesevalues,incombinationwiththedatagatheredinparagraph4.1.1,thenewenergyefficiencyoftheseveralinputparameterscanbedetermined. InFigure15theenergyefficiencies, includingandexcludingthepumpenergy,areshown.Thepreferablesettings,withahighcross-flowanda lowcurrent,usesasignificantamountofpumpenergy,leadingtoalowerenergyefficiency.However,stillmoreenergyisconsumedforlowcross-flowwithlowcurrentandlowcross-flowwithintermediatecurrent.
It should be mentioned that the energy consumption of the transport of volumes is determinedtheoretically,withapumpefficiencyof100%.Takingintoaccountamorerealisticpumpefficiencywillleadtoaloweringofenergyefficiencyforallsettings.Asthetotalenergydemandonlyconsistofarelativesmallpartofpumpenergy,thiswillnotleadtoahigherenergyefficiencyfordifferentinputparameters.Moreover,apumpefficiencyof40%orlesswillleadtopreferablesettingswithlowcross-flowspeedandlowcurrent.
0
2000
4000
6000
8000
10000
12000
2 4 6 8 10 12 14
Pressureloss[P
a]
Cross-flowvelocity[mm/s]
Electrolyte Concentrate Diluate
31
Figure15-Energyefficiencyfordifferentflowcrossspeedsandappliedcurrentsincludingandexcludingpumpenergy
4.1.3 Effectofcross-flowspeedonenergyconsumptionInthelatterparagraph,theinfluenceofcross-flowspeedontheenergyefficiencyisstressedbyincludingtheenergydemandforthetransportofvolumesthroughtheEDstack.Asthetransferofcurrentislimitedby the flow with the lowest electrical conductivity, the diluate stream, this flow needs the highestrecirculationofvolumetoincrementthenumberofionsinthesolution.Hence,theelectroderinseandconcentratevolumecouldbepumpedthroughthesystemwithalowercross-flowvelocity.
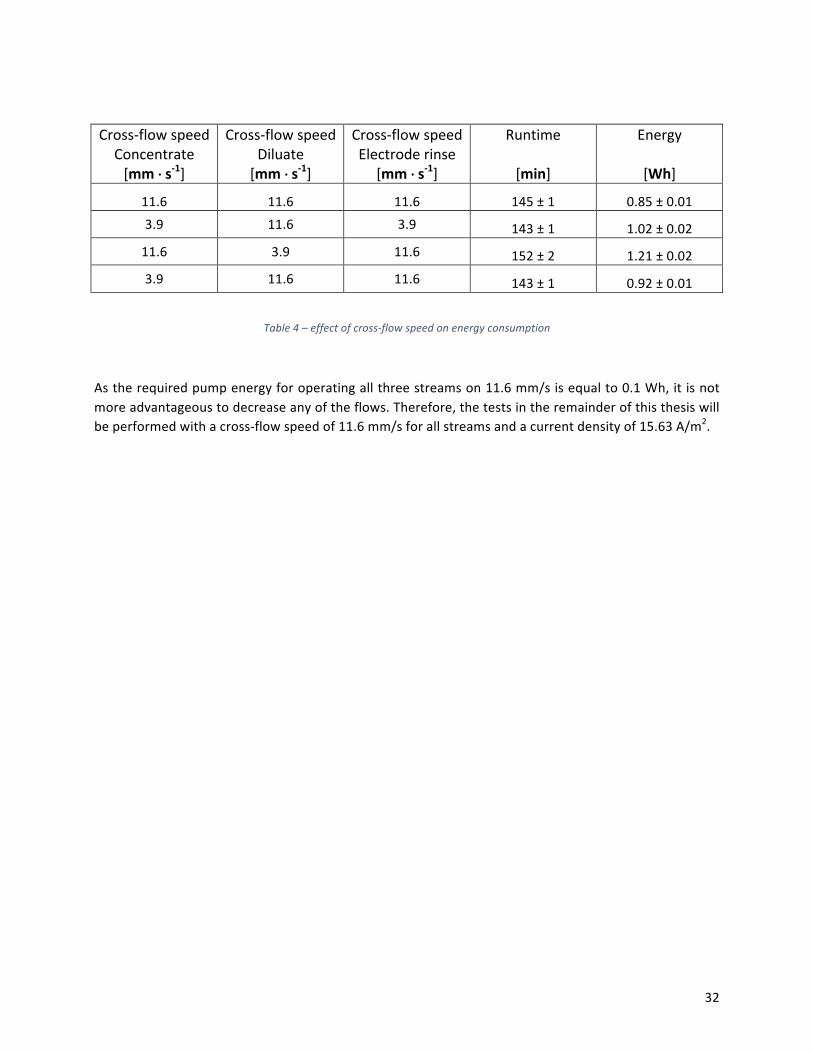
ThisprincipleistestedbydecreasingindividualstreamswhileloggingtheenergyconsumptionoftheEDstack.TheresultsofthesetestsareshowninTable4. Itcanbeconcludedthat loweringany individualstreamleadstoanincreaseinenergyneeded.However,decreasingthediluatecross-flowspeedhastwiceasmuchinfluenceontheenergyconsumptioncomparedtotheconcentrateandelectroderinsespeeds.Onaverage,asthesetestswereperformedinduplicate,theenergyconsumptionincreaseswith0.07Whwhentheconcentratespeedis lowered,0.1Whwhentheelectroderinsespeedis lowered,andfinally0.19Whwhenthediluatespeedisloweredfrom11.6mm/sto3.9mm/s.
0.00
0.50
1.00
1.50
2.00
2.50
Lowcu
rren
t
Interm
ediatecu
rren
t
Highcu
rren
t
Lowcu
rren
t
Interm
ediatecu
rren
t
Highcu
rren
t
Lowcrossflow Highcrossflow
Energyefficien
cy[W
h-1 ]
Energyefficiencyexcludingpump Energyefficiencyincludingpump
32
Cross-flowspeedConcentrate[mm·s-1]
Cross-flowspeedDiluate[mm·s-1]
Cross-flowspeedElectroderinse
[mm·s-1]
Runtime
[min]
Energy
[Wh]
11.6 11.6 11.6 145±1 0.85±0.013.9 11.6 3.9 143±1 1.02±0.0211.6 3.9 11.6 152±2 1.21±0.023.9 11.6 11.6 143±1 0.92±0.01
Table4–effectofcross-flowspeedonenergyconsumption
Astherequiredpumpenergyforoperatingallthreestreamson11.6mm/sisequalto0.1Wh,itisnotmoreadvantageoustodecreaseanyoftheflows.Therefore,thetestsintheremainderofthisthesiswillbeperformedwithacross-flowspeedof11.6mm/sforallstreamsandacurrentdensityof15.63A/m2.
33
4.2 Maximumammoniumconcentration
Inthisparagraphthemaximumconcentrationofammoniumwillbeassessed,whilealsothemainrelationsbetweenoutputparametersintheelectrodialysisoperationwillbediscussed.Thesetestsareperformedinafeedandbleedset-upasshowninFigure12,elucidated inparagraph3.2.2andoperatedwiththeinputparametersfoundinparagraph4.1. It is importanttoemphasizeelectrodialysisoperationwillbestoppedwhenaconductivityof1mS/cm,whichisequalto140mgNH4/L,isreached.Operationswillberesumedafterthepreparationofanewdiluatevolume,containinganinitialammoniumconcentrationof1.5g/L.Thesestepswererepeateduntilnofurtherincreaseinconcentrateammoniumconcentrationisobserved.
4.2.1 MassimbalanceAccordingtothetheoryofelectrodialysis,saltstransferfromdiluatecelltoconcentrate, isrecirculatedthroughthesystembymeansoftheelectroderinsesolution.Previousmulti-diluatetesthaveshownamassbalance that couldnotbecloseddue to thegenesisofgaseousammonia (Mondoretal., 2008).However,concentrationsofammoniumintheelectroderinsesolutionortheformationofcrystalsduetohighconcentrationsintheconcentrationarenotreported.
Inthetestsperformedinthisthesistheammoniumbicarbonateconcentrationwillnotexceed150g/L,while its solubilitycanbeup to300g/L.Moreover, thepHatwhich the testsareoperated,almostallammonium bicarbonate is ionized into ammonium and bicarbonate (see paragraph 7.2.5). Thevaporizationofhighammoniagasconcentrationsisthereforenotlikelyandgivesreasontomeasuretheammoniumconcentrationintheelectroderinsesolution.
4.2.2 Maximumammoniumconcentration
Withthisconsideration,themaximumammoniumconcentrationintheconcentrate,takingammoniumconcentrationsinthediluateandelectroderinsesolutionsanditsvolumesintoaccount,wasdetermined.TheammoniummeasurementsareshowninFigure16below.
This graph shows essential information about the ammonium concentration in the concentrate andelectrode rinse stream within electrodialysis. Considering the concentrate flow, a steep increase inammoniumconcentration canbeobserved for the first couplediluate volumes.However, a flatteningoccursatanammoniumconcentrationof7.3-gramammoniumperliter.Ammoniumionscanberemovedfrommorediluatevolumes,butdonotcontributetothefurtherincreaseoftheammoniumconcentrationintheconcentrate.However,asalreadyindicateabove,theaccumulationofammoniumintheelectroderinsesolutionhasaseriouscontributiononthetotalmassbalanceofthesystem.Moreover,ammoniumionsarestilltransferredtroughtheionexchangemembranesfromthediluate-totheconcentratestream.Acorrespondingamountofwatertransfersalongwiththeseions,leadingtoanequilibriuminammoniumconcentration.

34
Figure16–Ammoniummeasurementsmultiplediluatedepletionexperiment
4.2.3 Massbalance
Asimplemassbalancecanbeperformedoverthissystem.
VLWLX? · 1LWLX? = V+WY+BYLZXLB · 1+WY+BYLZXLB + V/8?[XLB · 1/8?[XLB + VB?B+LZW/BZ8Y\B · 1B?B+LZW/BZ8Y\B + 2
Where:
V:volume[l] C:ammoniumconcentration[g·L-1]E:evaporationofammonia[g·L-1]
Deviations range from 37 mg NH4+ in the low concentration ranges to 3077 mg NH4
+ in the highersegments. These deviations could be a result of measuring errors in the ammonium kit photo-spectrometer,orthepreparationofthesesamples,thevolumemeasurementsandthe initialweighingprocessoftheammoniumbicarbonatesalt.Itcanthereforenotbestatedthatthisdeviationinammoniaisevaporated.Therelativeaveragedeviationisequalto3.98%respectivelytothetotalmassinthesystempermeasuringstep.
0
1
2
3
4
5
6
7
8
9
0 5 10 15 20 25 30 35
NH4+concen
tration[g/L]
Energy[Wh]
Concentrate Diluate Electroderinse

35
4.2.4 Electrochemicalpotential
The minutely logged electric conductivity values are used as indicator for the concentrations in theconcentrate and diluate stream, which are needed to calculate the electrochemical potential.Furthermore,thepowersupplylogfile,containingminutelycurrentandpotentialmeasurements,isusedtodeterminetheelectricalpotential.BothpotentialsareshowninFigure17.
Figure17-Electricalandelectrochemicalpotentialformultipleruns
Thisplotshowsbothpotentialsforthemultiplediluateexperiment,andthereforeconsistoutoftwentyelectrical potential lines and twenty electrochemical potential lines. The total potentials showa smalldecrease in the beginning of the experiment, where after an increase in cell resistance (due to thedepletionofionsinthediluateflux)isaccompaniedbytheincreaseinpotential.Asthelimitingflow,theconcentrationofionsinthediluateflow,isequalforallexperiments,nodifferencesareobservedfortheelectricalpotential.Astheexperimentscontinues,thedifference inconcentrationbetweenthediluateandconcentratestreamincreases,leadingtohigherelectrochemicalpotentials.Moreover,thestartpointof the electrochemical potential lines starts higher for every run, due to this bigger concentrationdifference.
Betweentheelectricalpotentiallinesaninitialhorizontaltrendcanbeobserved.Astheseinitialelectricalcurrentsvaluesarenotincreasing,itcanbeconcludednofoulingofthemembranesoccurs.
The electrochemical potential amounts fifteen percent of the electrical potential used during anelectrodialysis experiment. The theoretical electrochemical potential is lower as it does not take theresistanceoftheionexchangemembranes,thetransferofelectronsfromelectrodestosolutionandtheresistanceduetodepletionofionsinthediluatestream,intoaccount.
0.00
1.00
2.00
3.00
4.00
5.00
6.00
7.00
0 500 1000 1500 2000 2500 3000 3500 4000 4500 5000
Potential[V]
Time[m]
Electricalpotential Electrochemicalpotential

36
4.2.5 Volumedisplacement
Besidesthetransferofsaltsfromdiluate-toconcentratestream,alsothetransferofwateroccurs.Thisfluxcanbesubdividedintothefluxofwaterduetoco-migrationofwatermoleculeswithsaltions,andnaturallyoccurringosmosis.Theseprocessesarefurtherelaboratedinparagraphs4.3.2and4.3.3.
Inappendix7.4atablewiththemeasuredwatervolumesoftheconcentrate,diluateandelectroderinsestreamscanbefound,fortheoperationofthemultidiluateexperiment.Thisdataisusedtoinvestigatetherelationbetweenelectricalconductivityandwatertransfer.FromFigure18itcanbeconcludedthattheamountofwaterflowingoutofthediluatestreamincreaseswitheveryexperiment,asthedissimilarityinammoniumconcentrationbetweenconcentrateanddiluatestreamsincreases.
Figure18–Watertransferovertime
Asosmosisismainlydrivenbythedifferenceinsaltconcentration,thewatertransportiscomparedtothisdifference.TheseresultsareshowninFigure19.AnexponentialrelationbetweenthedeltaECanddiluatewater transfer can be observed.Membrane theory, as discussed in paragraph 2.3.3, shows the linearrelation between flux through amembrane and the osmotic pressure difference and is shown in theequationbelow.
N =1
µ · R· Δπ
0
0.02
0.04
0.06
0.08
0.1
0.12
0.14
0 500 1000 1500 2000 2500 3000 3500 4000 4500 5000
Diluatewatertransfer[L]
Time[m]
37
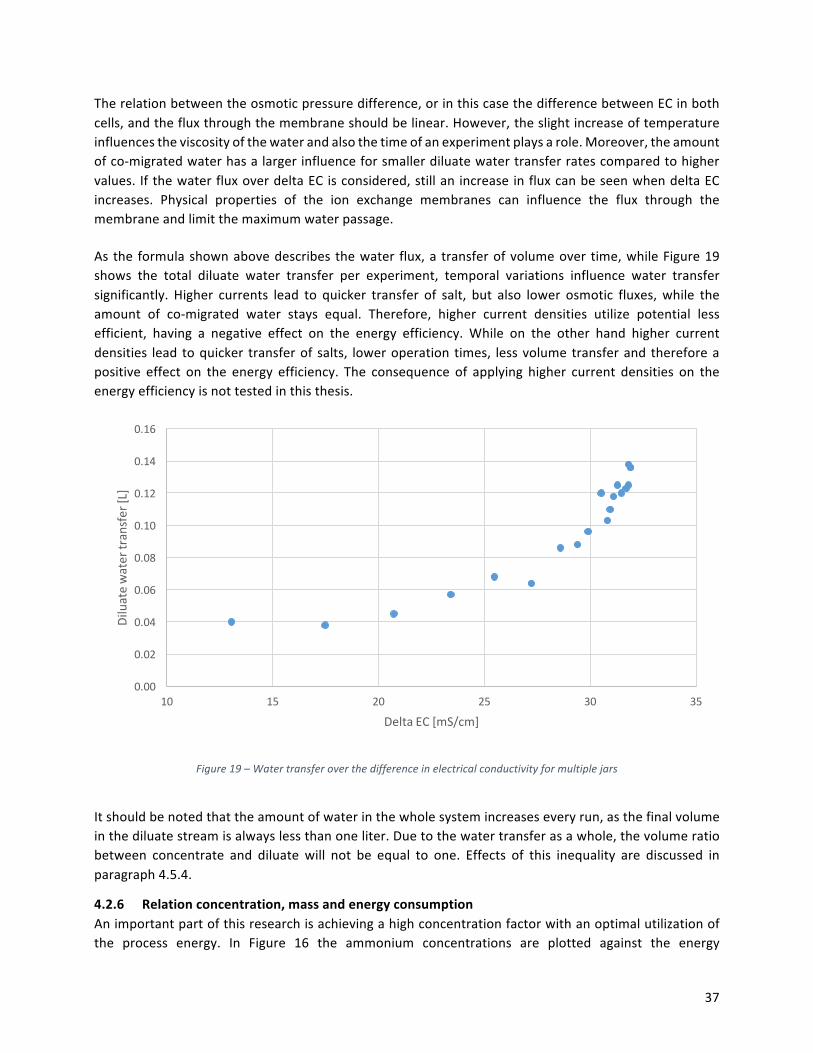
Therelationbetweentheosmoticpressuredifference,orinthiscasethedifferencebetweenECinbothcells,andthefluxthroughthemembraneshouldbelinear.However,theslightincreaseoftemperatureinfluencestheviscosityofthewaterandalsothetimeofanexperimentplaysarole.Moreover,theamountofco-migratedwaterhasalargerinfluenceforsmallerdiluatewatertransferratescomparedtohighervalues. IfthewaterfluxoverdeltaECisconsidered,stillan increaseinfluxcanbeseenwhendeltaECincreases. Physical properties of the ion exchange membranes can influence the flux through themembraneandlimitthemaximumwaterpassage.As the formulashownabovedescribes thewater flux,a transferofvolumeover time,whileFigure19shows the total diluate water transfer per experiment, temporal variations influence water transfersignificantly. Higher currents lead to quicker transfer of salt, but also lower osmotic fluxes,while theamount of co-migrated water stays equal. Therefore, higher current densities utilize potential lessefficient, having a negative effect on the energy efficiency. While on the other hand higher currentdensities lead toquicker transferof salts, loweroperation times, lessvolumetransferand thereforeapositive effect on the energy efficiency. The consequence of applying higher current densities on theenergyefficiencyisnottestedinthisthesis.
Figure19–Watertransferoverthedifferenceinelectricalconductivityformultiplejars
Itshouldbenotedthattheamountofwaterinthewholesystemincreaseseveryrun,asthefinalvolumeinthediluatestreamisalwayslessthanoneliter.Duetothewatertransferasawhole,thevolumeratiobetween concentrate and diluate will not be equal to one. Effects of this inequality are discussed inparagraph4.5.4.
4.2.6 Relationconcentration,massandenergyconsumption
Animportantpartofthisresearchisachievingahighconcentrationfactorwithanoptimalutilizationofthe process energy. In Figure 16 the ammonium concentrations are plotted against the energy
0.00
0.02
0.04
0.06
0.08
0.10
0.12
0.14
0.16
10 15 20 25 30 35
Diluatewatertransfer[L]
DeltaEC[mS/cm]
38
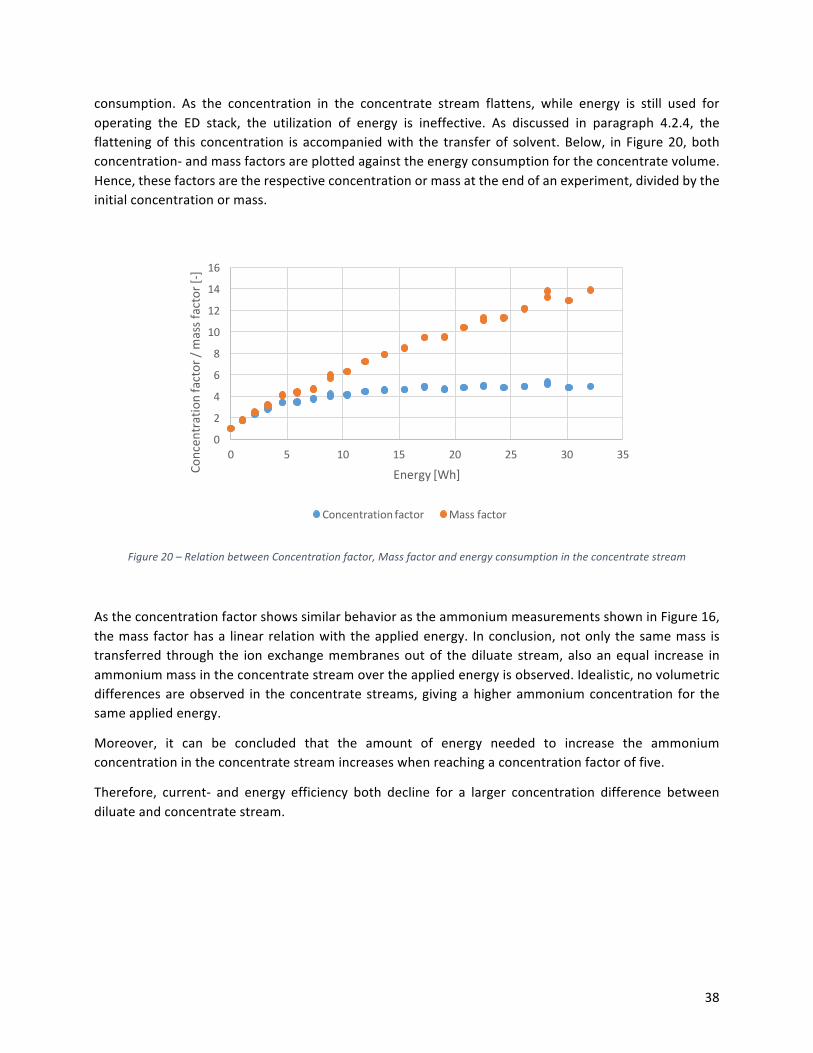
consumption. As the concentration in the concentrate stream flattens, while energy is still used foroperating the ED stack, the utilization of energy is ineffective. As discussed in paragraph 4.2.4, theflatteningof this concentration is accompaniedwith the transferof solvent.Below, in Figure20,bothconcentration-andmassfactorsareplottedagainsttheenergyconsumptionfortheconcentratevolume.Hence,thesefactorsaretherespectiveconcentrationormassattheendofanexperiment,dividedbytheinitialconcentrationormass.
Figure20–RelationbetweenConcentrationfactor,Massfactorandenergyconsumptionintheconcentratestream
AstheconcentrationfactorshowssimilarbehaviorastheammoniummeasurementsshowninFigure16,themassfactorhasa linearrelationwiththeappliedenergy. Inconclusion,notonlythesamemass istransferred through the ionexchangemembranesoutof thediluate stream,alsoanequal increase inammoniummassintheconcentratestreamovertheappliedenergyisobserved.Idealistic,novolumetricdifferencesareobserved in theconcentratestreams,givingahigherammoniumconcentration for thesameappliedenergy.
Moreover, it can be concluded that the amount of energy needed to increase the ammoniumconcentrationintheconcentratestreamincreaseswhenreachingaconcentrationfactoroffive.
Therefore, current- and energy efficiency both decline for a larger concentration difference betweendiluateandconcentratestream.
0
2
4
6
8
10
12
14
16
0 5 10 15 20 25 30 35
Concen
trationfactor/massfactor[-]
Energy[Wh]
Concentrationfactor Massfactor

39
4.2.7 RelationmaximumconcentrationandEC
Amoreinterestingrelationcanbefoundwhennotconsideringtheconcentrationratio,buttheratioinelectrical conductivity. As the maximum electrical conductivity in the experiments conducted in thisparagraphisequalto33mS/cmwhiletheinitialconductivityis8mS/cm,afactorfourcanbedistinguished.
FoundliteratureshowsthesamefactorfourbetweentheinitialandfinalECintheconcentratestream(Mondoretal.,2008).Inthispaper,aswinemanure,consistingmainlyofwithammonium,phosphorusandpotassium, is treatedwithelectrodialysis.Alsootherexperimentsshowthisrelation,seeappendix7.3.4.
Inconclusion,thefinalconcentration,andthusthefinalelectricalconductivity,ishighlydependedontheinitialconductivity inthediluatestream.Asdiscussedinparagraph4.2.4,thedifferenceinECbetweenconcentrateanddiluatestreamonanytimeinelectrodialysisinducesanosmoticpressureovertheionexchangemembranes, leading to higher volumetric flows. This transfer of water from one stream toanother reaches a certain limit, with respect to the transfer of ions, leading to a stabilization of itsconcentration.

40
4.3 EDprocesses
Inthisparagraphthemainprocessesoccurringduringtheelectrodialysiswillbediscussed,usingthedatagatheredinthemultiple-diluaterunshowninparagraph4.2.Quantifyingfluxesisnotthemaingoalofthisthesisandisthereforeonlyaddressedshortly.However,proving,dividingandlinkingcertainparametertothesefluxesisofcrucialimportancefortheunderstandingoftheprocessesintheEDstack.Moreover,theirinfluenceontheenergyefficiencycanbeusedinordertooptimizetheprocessandreducetheenergyconsumption.
4.3.1 MigrationofsaltsThemainreasonforusingelectrodialysisisthetransferofionsfromadiluatestream,andconcentratingthismassinaconcentratestream.Conductedtestsshowsalinearrelationbetweenthetransferofmassandtheappliedcurrent. InFigure20 this relation isalreadyshownfor theconcentrate,while it isnotpossibletoproducethistrendformultiplediluatevolumes.Anaveragemassfactortransferrateof0.44Wh-1isfoundfromthetrendinthisfigure.However,ifthefirstexperimentisconsidered,seeFigure21,highertransferratesperenergyconsumedcanbefound.
Figure21–Masstransferfactorversusconsumedenergyforthefirstexperiment
Remarkable is the difference in slope between the diluate and concentrate trend line. However, theaccumulation of ammonium ions in the electrode rinse solution explains the lower increase in masscomparedtothedecreaseofthemassinthediluatestream.ThevaluesfoundinFigure20forconcentrateanddiluatestreamsarecorrespondinglyequaltotransferratesof1.06and1.26mgNH4/Wh.Thisis,fornow,consideredastheidealisticoperationofconcentratingammoniumwithelectrodialysis.
Theslowdeclineinmasstransferperenergyusage,whenconcentrationdifferencesbetweenconcentrateanddiluateincreases,isduetobackmigrationofions,andisdiscussedinparagraph4.3.4.
y=-0.8651x+1
y=0.7146x+1
0.00.20.40.60.81.01.21.41.61.82.0
0 0.2 0.4 0.6 0.8 1 1.2
Massfactor[-]
Energy[Wh]
Diluate Concentrate
41
4.3.2 Electro-osmosis
Co-migration of water molecules with ammonium and bicarbonate ions is a process that cannot bepreventedandhighlydependedontheionexchangemembranesusedintheEDstack(Gainetal.,2002).Limitingwaterfluxesfromdiluatetoconcentratecellswillleadtohigherammoniumconcentrationsintheconcentratevolume.Thepreferableminimumflowexistsonlyoftheco-migrationofwatermoleculeswithsaltions.
However,detailedinformationfromthemembranesuppliershouldbemadeavailableandeventhenitwouldbehard toquantify thepercentageof the totalwater flux through themembranebelonging toelectro-osmotic processes.During EDoperations, ammoniumbicarbonate is transferred togetherwithwater molecules, but also directly creates a discontinuity between the conductivity in both cells. Inparagraph4.3.1thetransferrateofammoniumisdeterminedperamountofenergyconsumed.Itisalsopossibletocalculatetherelationofammoniumtransferovertime. Inthiscase,anaccurateamountofammoniumbicarbonateneedstobeaddedinaverysmalltemporalgrid,keepingelectricalconductivitiesequalinbothstreams.Twoassumptionshavetobemadeinordertoquantifyelectroosmosiswiththisexperiment:
- theco-migrationfluxisrelativelysmallcomparedtothetotalvolume,soitdoesnothaveabiginfluenceonthevolumeandthereforetheconcentrationoftheconcentratevolume;
- theincreaseinelectricalconductivityisrelativelysmall,sotheelectricalresistanceinthecellstaysequal,leadingtoanequalammoniumtransferrateovertime.
Asexampleavalueof10moleswaterpermoleammoniumbicarbonate,asfoundinliterature,ischosenasexample.Itshouldbenotedtherangefoundinliteraturedeviatesbetween2and13moleswaterpermoleammoniumbicarbonate(Leeetal.,2002;Lingetal.,2002).
Asmentionedinthematerialsandmethodschapter,theinitialconcentrationofthediluatevolumeequals1.5 g NH4/L and end when the diluate stream reaches an electrical conductivity of 1 mS/cm. Thiscorrespondswithanammoniumconcentrationof0.14gNH4/Landthereforeatransferoutofthediluatevolumeof 1.36 gNH4per run. The transferred amountof ammoniumbicarbonate ismeasured in thediluatestream,asthisisthesteadieststreamformeasuringstartandendconcentrationsovermultipleruns.
Inordertocalculatethemassofwatertransferred,themolecularweightofammoniumandwaterandthedensityofwaterneedtobeknown.Asthemolecularweightofwaterisequaltoammonium,andtheratiowatertransferoverammoniumtransferis10,theweightofwatertransferredisequalto13.6gramsperexperiment.Assumingawaterdensityof1000kg/m3foratemperatureof20degreesandlowsaltconcentrations,awaterfluxof13.6mlperruncanbecalculated.Smalldiscrepanciesduetothechangeinsalttransferredandthedecreasingamountoffinaldiluatevolumeareneglected.
Electro-osmosis influences the concentration factor, and therefore also the energy efficiency. If thisprocesswouldnotoccur,whichisnotveryrealistictoassume,theenergyefficiencywouldbeincreasewithrespectively0.02and0.06Wh-1forthefirstandlastexperiment.
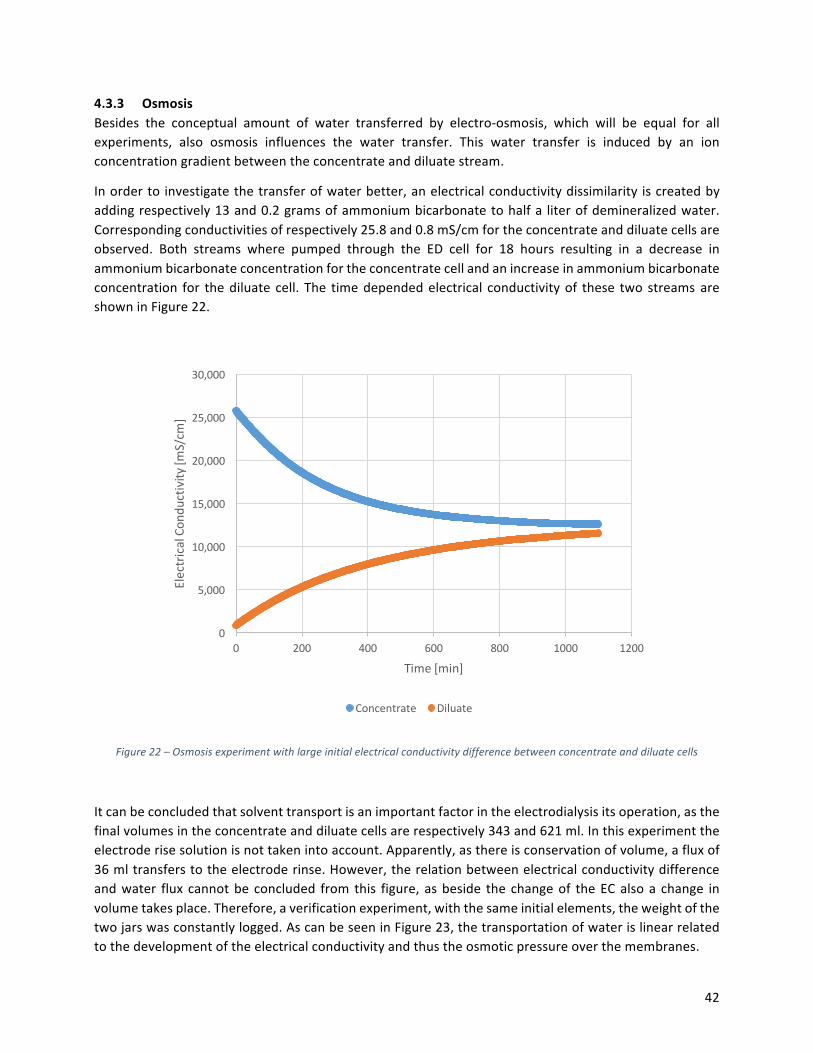
42
4.3.3 Osmosis
Besides the conceptual amount of water transferred by electro-osmosis, which will be equal for allexperiments, also osmosis influences the water transfer. This water transfer is induced by an ionconcentrationgradientbetweentheconcentrateanddiluatestream.
Inorderto investigatethetransferofwaterbetter,anelectricalconductivitydissimilarity iscreatedbyaddingrespectively13and0.2gramsofammoniumbicarbonatetohalfa literofdemineralizedwater.Correspondingconductivitiesofrespectively25.8and0.8mS/cmfortheconcentrateanddiluatecellsareobserved. Both streams where pumped through the ED cell for 18 hours resulting in a decrease inammoniumbicarbonateconcentrationfortheconcentratecellandanincreaseinammoniumbicarbonateconcentration for thediluate cell. The timedependedelectrical conductivityof these twostreams areshowninFigure22.
Figure22–Osmosisexperimentwithlargeinitialelectricalconductivitydifferencebetweenconcentrateanddiluatecells
Itcanbeconcludedthatsolventtransportisanimportantfactorintheelectrodialysisitsoperation,asthefinalvolumesintheconcentrateanddiluatecellsarerespectively343and621ml.Inthisexperimenttheelectroderisesolutionisnottakenintoaccount.Apparently,asthereisconservationofvolume,afluxof36mltransferstotheelectroderinse.However,therelationbetweenelectricalconductivitydifferenceandwater flux cannotbe concluded from this figure, asbeside the changeof theECalsoa change involumetakesplace.Therefore,averificationexperiment,withthesameinitialelements,theweightofthetwojarswasconstantlylogged.AscanbeseeninFigure23,thetransportationofwaterislinearrelatedtothedevelopmentoftheelectricalconductivityandthustheosmoticpressureoverthemembranes.
0
5,000
10,000
15,000
20,000
25,000
30,000
0 200 400 600 800 1000 1200
ElectricalCon
ductivity[m
S/cm
]
Time[min]
Concentrate Diluate
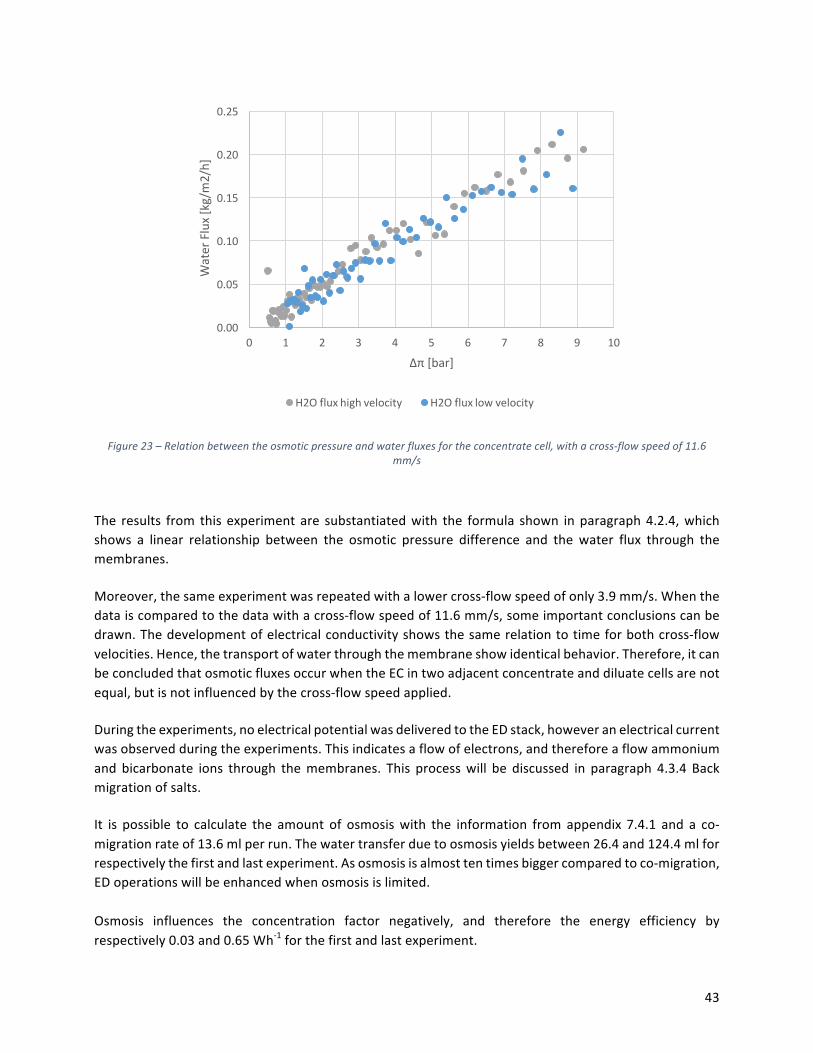
43
Figure23–Relationbetweentheosmoticpressureandwaterfluxesfortheconcentratecell,withacross-flowspeedof11.6mm/s
The results from this experiment are substantiatedwith the formula shown inparagraph4.2.4,whichshows a linear relationship between the osmotic pressure difference and the water flux through themembranes.Moreover,thesameexperimentwasrepeatedwithalowercross-flowspeedofonly3.9mm/s.Whenthedataiscomparedtothedatawithacross-flowspeedof11.6mm/s,someimportantconclusionscanbedrawn.Thedevelopmentofelectricalconductivityshowsthesamerelationtotimeforbothcross-flowvelocities.Hence,thetransportofwaterthroughthemembraneshowidenticalbehavior.Therefore,itcanbeconcludedthatosmoticfluxesoccurwhentheECintwoadjacentconcentrateanddiluatecellsarenotequal,butisnotinfluencedbythecross-flowspeedapplied.Duringtheexperiments,noelectricalpotentialwasdeliveredtotheEDstack,howeveranelectricalcurrentwasobservedduringtheexperiments.Thisindicatesaflowofelectrons,andthereforeaflowammoniumand bicarbonate ions through themembranes. This processwill be discussed in paragraph 4.3.4 Backmigrationofsalts.It is possible to calculate the amount of osmosiswith the information from appendix 7.4.1 and a co-migrationrateof13.6mlperrun.Thewatertransferduetoosmosisyieldsbetween26.4and124.4mlforrespectivelythefirstandlastexperiment.Asosmosisisalmosttentimesbiggercomparedtoco-migration,EDoperationswillbeenhancedwhenosmosisislimited.Osmosis influences the concentration factor negatively, and therefore the energy efficiency byrespectively0.03and0.65Wh-1forthefirstandlastexperiment.
0.00
0.05
0.10
0.15
0.20
0.25
0 1 2 3 4 5 6 7 8 9 10
WaterFlux[kg/m
2/h]
Δπ [bar]
H2Ofluxhighvelocity H2Ofluxlowvelocity

44
4.3.4 Backmigrationofsalts
The last identified process is the backmigration of salts from high concentration concentrate to lowconcentrationdiluate.(Leeetal.,2002)mentionsthebackdiffusionofsaltsisneglectedasitscontributionis small compared to salt transfer. Quantifying the amount of back migrated salts, literature showsdifferentmass transfer coefficients fordifferent salts andusedmembranes (Izquierdo-Gil et al., 2012;Rottiersetal.,2014).
During the osmosis experiment described above, not only the transfer of water but also transfer ofammoniumbicarbonate,fromthehighconcentrationtothelowconcentrationcell,wasnoticed.Inordertogetabetterunderstandingofthisprocess,theosmosisexperimentwasrepeatedwithdifferentsaltsstocks.Twohalflitervolumeswerepreparedasconcentrateanddiluatevolumes,withrespectively1gramofsodiumchlorideand9gramsofammoniumbicarbonate.Peristalticpumpshavepumpedthesestocksolutionsfor25hoursthroughtheEDcell.
Below, inTable5theresultsofthisexperimentareshown.Also208mlofwaterhasbeentransferredoutofthediluatecell,whiletheconcentratevolumeonlyincreasedwith94ml.Asthefinalvolumeoftheelectroderinsesolutionisnotmeasured,itishardtoconcludethisvolumeistransferredtothisstream.
Time[h]
NH4concentrationconcentrate[mg/L]
NH4concentrationdilute[mg/L]
0 3522 2232.25 2478 3575.5 1911 506
25.25 1100 1001
Table5–resultsosmosisexperimentwith2g/LNaCldiluateand15g/LNH4HCO3concentrate
Theresultsshowasteadyincreaseofammoniuminthediluate,whiletheconcentrationintheconcentratedecreases.Correctingthefinalammoniumconcentrationforthewatertransfer,535mg/LNH4
+isalreadypresent from the start. However, this still proves ions transfer from a high concentration to a lowconcentrationcell.
Thiseffectcanbequantifiedbyconsideringthedataacquiredduringthemultiplediluateexperiment.Inparagraph4.3.1itisconcludedthatthemigrationofammoniumhasalinearrelationtoamountofappliedcurrent. Inthiscontext,correctingforthedecreaseofthediluatevolume,thetimeofoneexperimentshould be equal for all diluate volumes. However, during the experiment the time to transfer theammoniumfromtheconcentratetothediluateincreases.Therefore,theamountofenergyrequiredtoperishtheammoniumbicarbonateconcentrationinthediluatestreamwillincrease,asthecurrentisequalduringoneexperiment.
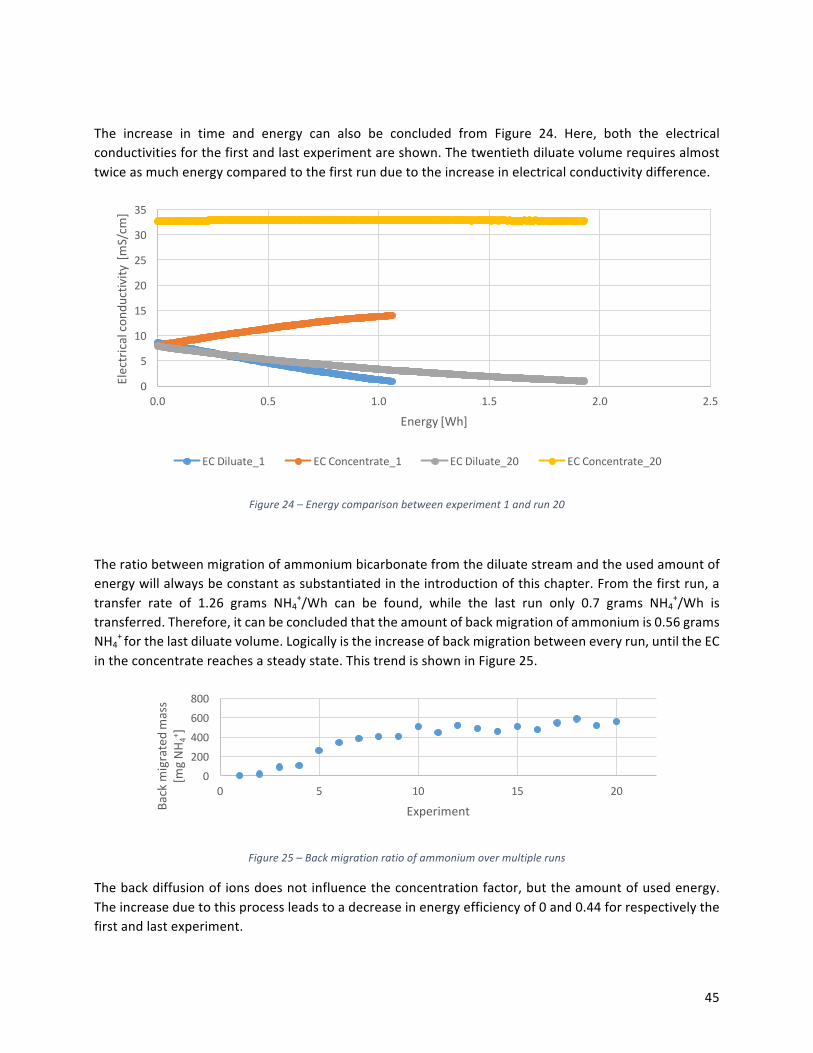
45
The increase in time and energy can also be concluded from Figure 24. Here, both the electricalconductivitiesforthefirstandlastexperimentareshown.Thetwentiethdiluatevolumerequiresalmosttwiceasmuchenergycomparedtothefirstrunduetotheincreaseinelectricalconductivitydifference.
Figure24–Energycomparisonbetweenexperiment1andrun20
Theratiobetweenmigrationofammoniumbicarbonatefromthediluatestreamandtheusedamountofenergywillalwaysbeconstantassubstantiatedintheintroductionofthischapter.Fromthefirstrun,atransfer rate of 1.26 grams NH4
+/Wh can be found, while the last run only 0.7 grams NH4+/Wh is
transferred.Therefore,itcanbeconcludedthattheamountofbackmigrationofammoniumis0.56gramsNH4
+forthelastdiluatevolume.Logicallyistheincreaseofbackmigrationbetweeneveryrun,untiltheECintheconcentratereachesasteadystate.ThistrendisshowninFigure25.
Figure25–Backmigrationratioofammoniumovermultipleruns
Thebackdiffusionofionsdoesnotinfluencetheconcentrationfactor,buttheamountofusedenergy.Theincreaseduetothisprocessleadstoadecreaseinenergyefficiencyof0and0.44forrespectivelythefirstandlastexperiment.
0
5
10
15
20
25
30
35
0.0 0.5 1.0 1.5 2.0 2.5
Electricalco
nductivity
[mS/cm
]
Energy[Wh]
ECDiluate_1 ECConcentrate_1 ECDiluate_20 ECConcentrate_20
0200400600800
0 5 10 15 20
Backm
igratedmass
[mgNH
4+ ]
Experiment

46
4.4 Influenceofothersalts
Allexperimentsconductedsofarhadidealisticinitialparameters,asthevolumestreatedonlyconsistedofdemineralizedwaterandammoniumbicarbonate.Thetreatmentof real rejectwater fromdigestedsludgealsocontainsotherions,asshowninTable1.Adistinctioncanbemadebetweenmonovalentandmultivalentions.
Fortheseexperimentsmonovalentselectiveexchangemembranesareused.Asthesemembraneshavedifferent electrical resistances, as shown in Table 2, it is not possible to compare results from thisparagraphwithdatagatheredduringexperimentswithnormalionexchangemembranes.
4.4.1 MonovalentionsIn thecompositionof rejectwater,ammonium is themost important (monovalent-) ion.Hence, rejectwaterisfresh,andthereforecontainsalowamountofions.InTable6theresultsoftheseexperimentsareshown.
Experiment Energyused[Wh] CF[-] EnergyEfficiency[Wh-1]Blanco 0.85±0.01 1.63±0.01 1.92±0.01Lowconcentration 0.85±0.01 1.52±0.00 1.77±0.01Highconcentration 1.00±0.00 1.57±0.01 1.57±0.01
Table6–relationenergyconsumptionandconcentrationfactorforadditionalmonovalentsalts
ItshouldbenotedthatthevaluesshowninTable6areaveragesfromthreeidenticalexperiments,andasmall difference in concentration factors between multiple experiments occurs. The experiments areendedwhenthediluatevolumereachesanelectricalconductivityof1mS/cm,however,theECisnotonlydeterminedbytheconcentrationofammoniumbicarbonate,butalsosodiumbicarbonate.Therefore,thechanceoftransferringasodiumionthroughthemembraneincreaseswhenitsconcentrationincreases.Thisleadstolowertransportofammoniumandthereforealowerconcentrationfactor.
However, comparing the concentration factor of the high concentration and the low concentrationexperiment, this doesnot occur. The concentration factor of ammonium in the concentrate stream isbiggerforhigherconcentrationsofsodium.However,theadditionofhigherconcentrationssodiumalsoleadstoahigherECinthediluatevolume,andthereforealowerelectricalresistanceinthepassageofcurrentintheEDstack.Summarized,theoperationofelectrodialysistakeslongerastheinitialelectricalconductivityvalueishigher.Comparingallexperimentsoverafixedintervalshowsanequalconsumptionofenergy(0.85–0.65Wh).
However,itcanbeconcludedfromthisdatathattheinfluenceofothermonovalentsaltsisnegativeontheperformanceofelectrodialysisforconcentratingammoniumions.Presumablyduetothecurrentthatis used to transfer sodium through the membranes. Higher concentrations of sodium lead to lowerconcentrationfactorsperenergyconsumed.Finally,alinearincreaseinconcentrationfactoroverenergyconsumptionisexpected,asshowninFigure20.
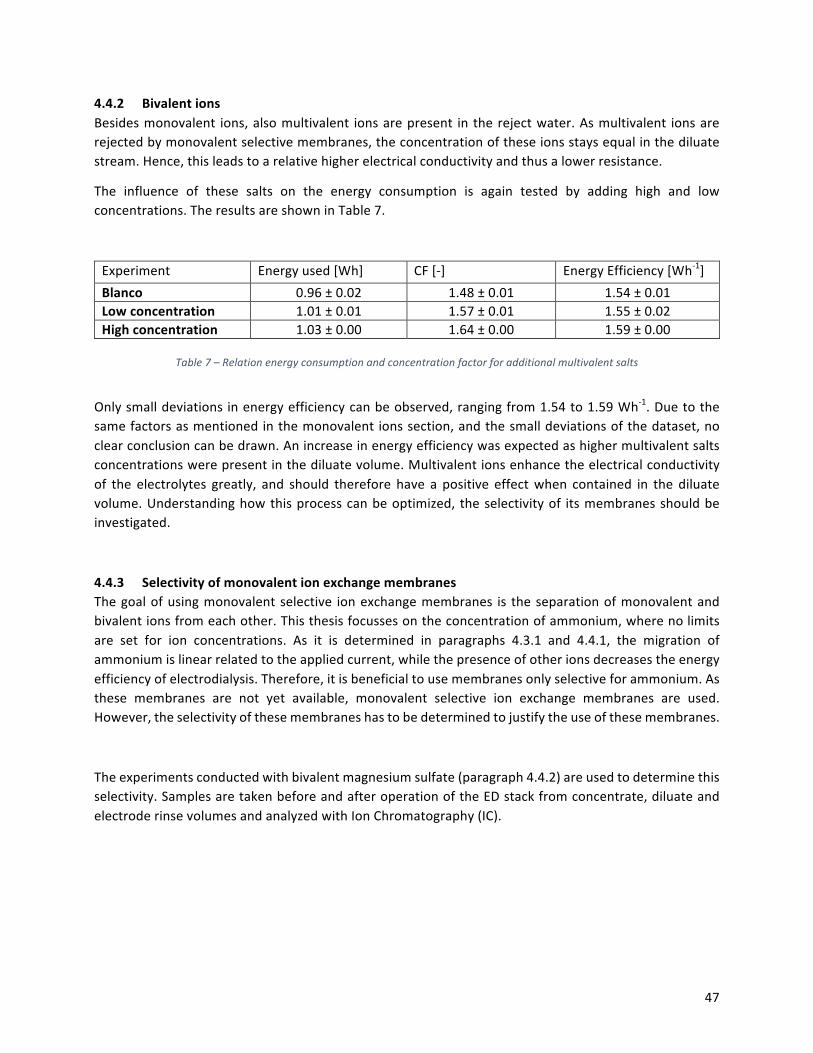
47
4.4.2 Bivalentions
Besidesmonovalent ions,alsomultivalent ionsarepresent in therejectwater.Asmultivalent ionsarerejectedbymonovalentselectivemembranes,theconcentrationoftheseionsstaysequalinthediluatestream.Hence,thisleadstoarelativehigherelectricalconductivityandthusalowerresistance.
The influence of these salts on the energy consumption is again tested by adding high and lowconcentrations.TheresultsareshowninTable7.
Experiment Energyused[Wh] CF[-] EnergyEfficiency[Wh-1]Blanco 0.96±0.02 1.48±0.01 1.54±0.01Lowconcentration 1.01±0.01 1.57±0.01 1.55±0.02Highconcentration 1.03±0.00 1.64±0.00 1.59±0.00
Table7–Relationenergyconsumptionandconcentrationfactorforadditionalmultivalentsalts
Onlysmalldeviations inenergyefficiencycanbeobserved,rangingfrom1.54to1.59Wh-1.Duetothesamefactorsasmentionedinthemonovalent ionssection,andthesmalldeviationsofthedataset,noclearconclusioncanbedrawn.Anincreaseinenergyefficiencywasexpectedashighermultivalentsaltsconcentrationswerepresentinthediluatevolume.Multivalentionsenhancetheelectricalconductivityof the electrolytes greatly, and should therefore have a positive effectwhen contained in the diluatevolume.Understandinghowthisprocesscanbeoptimized, theselectivityof itsmembranesshouldbeinvestigated.
4.4.3 SelectivityofmonovalentionexchangemembranesThegoalofusingmonovalentselective ionexchangemembranes is theseparationofmonovalentandbivalentionsfromeachother.Thisthesisfocussesontheconcentrationofammonium,wherenolimitsare set for ion concentrations. As it is determined in paragraphs 4.3.1 and 4.4.1, the migration ofammoniumislinearrelatedtotheappliedcurrent,whilethepresenceofotherionsdecreasestheenergyefficiencyofelectrodialysis.Therefore,itisbeneficialtousemembranesonlyselectiveforammonium.Asthese membranes are not yet available, monovalent selective ion exchange membranes are used.However,theselectivityofthesemembraneshastobedeterminedtojustifytheuseofthesemembranes.
Theexperimentsconductedwithbivalentmagnesiumsulfate(paragraph4.4.2)areusedtodeterminethisselectivity.SamplesaretakenbeforeandafteroperationoftheEDstackfromconcentrate,diluateandelectroderinsevolumesandanalyzedwithIonChromatography(IC).
48
Thefollowingconclusionscanbedrawnifconsideringonlycalciumions.
i. Therearebigdeviationsinthemassbalanceforcalcium.However,preservationofammoniumandotherionsoccurs.
ii. Thedecreaseofcalciumconcentrationinthediluatecellrangesbetween57%and75%comparedtoinitialconcentrations.
iii. Theincreaseofcalciumintheconcentratevolumerangesbetween5%and10%comparedtoinitialconcentrations.
iv. Theamountofcalciumionsintheelectrolyteisincreasedsignificantly.However,notrendcanbefoundintheamountoftransferredcalcium.Concentrationincreaseswitharangeof20and50mg/L.
Thetransferofcalciumthroughthenon-monovalentselectivecationendexchangemembranes(CEEM)totheelectroderinsevolumeremovesallbenefitsassumedabove.Thisisprobablythereasontheenergyefficiencydidnotincreasemoreforhighercalciumsulfateconcentrations.Moreover,theincontinuityofmasspreservationisratherparticular,andcannotbeexplainedeasily.Itcouldbeassumedthecalciumprecipitateswith bicarbonates left on the exchangemembranes of former experiments. However, novisualproofofthatwasfoundonthemembranes.

49
4.5 Optimizationelectrodialysisprocess
The tests performed during this thesis shown three factors influencing the energy efficiency ofelectrodialysis negatively. The transport of water through the membranes between concentrate anddiluatestreamleadstolowerconcentrationsintheconcentratestream.Thistransportofsolventcanbedivided into co-migration of water and osmosis. The latter is induced by concentration differencesbetween the two streams.Moreover, this difference also leads to an electrical potential gradient andtherefore the back diffusion of ions from high to low concentrate solution. Lastly, ammonium ionsaccumulate in the electrode rinse stream, retain them from entering the concentrate stream. Thisparagraphwilldiscusstheseproblemsandtwopossiblesolutions.
4.5.1 StagingConcentration differences between two adjacent cells, concentrate and diluate flow, leads to severalnegativeeffectsconsideringtheenergyefficiencyofelectrodialysis.Thisdifferenceincreasesduetoanincrease in concentrate concentration while the initial diluate concentration stays equal. In a stagedoperationalscheme,concentrationdifferencesareminimized.
4.5.2 ExperimentalprocedureThisschemeisshownbelowinFigure26.Inthisfigureonlythefirstthreestepsofthestagedlayoutareshown,whiletheexperimentisconductedwith7stages.
Figure26–ThefirstthreestepsofastagedEDoperation

50
The initial condition of the diluate and concentrate volumes of the first step are equal to all otherperformed experiments, as discussed in paragraph 3.2.2. In order to investigate the operationalparametersofelectrodialysis,finalconditionsaresettoalwaystransportthesameamountofammoniummassfromthediluatetoconcentrateandelectroderinsevolumes.
Itwouldbebeneficial if theammoniumconcentration in thediluateof thesecondstephad thesameconcentrationasthe initialconcentrate/diluateconcentrationofthefirststep. Inthisway, itwouldbeeasiertocomparethissystemtothemultiplediluateexperiment,asafixedamountofconcentrateanddiluatewouldbeproduced.However,duetothetransferofammoniumbicarbonatetotheelectroderinse,andacontraryfluxofsodiumnitratetotheconcentrateflow,theincreaseoftheammoniumconcentrationintheconcentratereduces.Therefore,alowertotalamountofammoniumistransferredoutthediluatevolume.Asafluxofwater,duetoco-migrationofwatermoleculeswiththeammoniumbicarbonate,isexpectedfromlowtohighconcentrationcells,italsonotpossibletostopatafixedECvalue.Inthismatter,moremasswillbetransferredwhenthesolutionconsistsofmorevolume.
Thefinalammoniumconcentrationcanbedeterminedusingthedatagatheredinparagraph4.3.1.Astheammoniumconcentrationcannotbeknownateverytime,thisvalueisconvertedtoanECvalue,usingtherelation shown inparagraph7.3.2. Itmustbenoted thatdue to (electro-)osmosisalsowater isbeingtransferred,influencingtheECandtotalmassintheconcentratevolume.Asubstantiatedassumptionofthewatertransport,accordingtopreviousexperiments,ismadetobe25ml.Inthisway,thefinalelectricalconductivity canbeapproximated. Small deviations in ammoniummass transfer canoccurdue to thepresenceofsodiumionsintheconcentrateflow,whichhaveadifferentinfluenceontheECasammoniumions.
Ammoniumconcentrationsinallstreamsaremeasuredbeforeandaftertheexperimentisoperated.Thediluatevolumeiscorrectedforthewatertransportinthepreviousexperiment,ensuringavolumeratiobetweenconcentrateanddiluateofone.
4.5.3 Preliminaryresults
TheenergyrequirementforthestagedconcentrationofammoniumisshowninFigure27.Astraightlinecan be observed for the ammonium concentration in the concentrate, while Figure 16 shows a clearsmoothing. Ifthedata isstudied,acleardecreaseinelectricalpotentialcanbeobservedovermultipleexperiments, ranging from 3.61 W for the first experiment to 2.53 W for the last experiment. Also,operationtimesoftheexperimentsshowadecreaseforhigherammoniumconcentrations.Themigrationrate,asdeterminedinparagraph4.3.1arethereforeunderestimatedandhavemaximumvaluesfortheseexperiments equal to 1.32 and 2.31mg NH4
+/W for respectively concentrate and diluate ammoniummigration.Themigrationofammoniumtotheelectroderinseflowhasthesamelineartrendtotimeandenergycomparedtothemultiplediluateexperiment.However,theaccumulationrateofammoniuminthisstreamisforthisexperiment2.5timesashigh.
Allparametersindicateahigherenergyefficiencycomparedtothemultiplediluateexperiments.Energyefficienciesof0.15and1.21Wh-1canbedeterminedforrespectivelythemultiplediluateexperimentandthestagedexperiment.However,onlytheconcentrationfactoristakenintoaccountinthisefficiency,theproduceddiluateandconcentratevolumesareneglected.
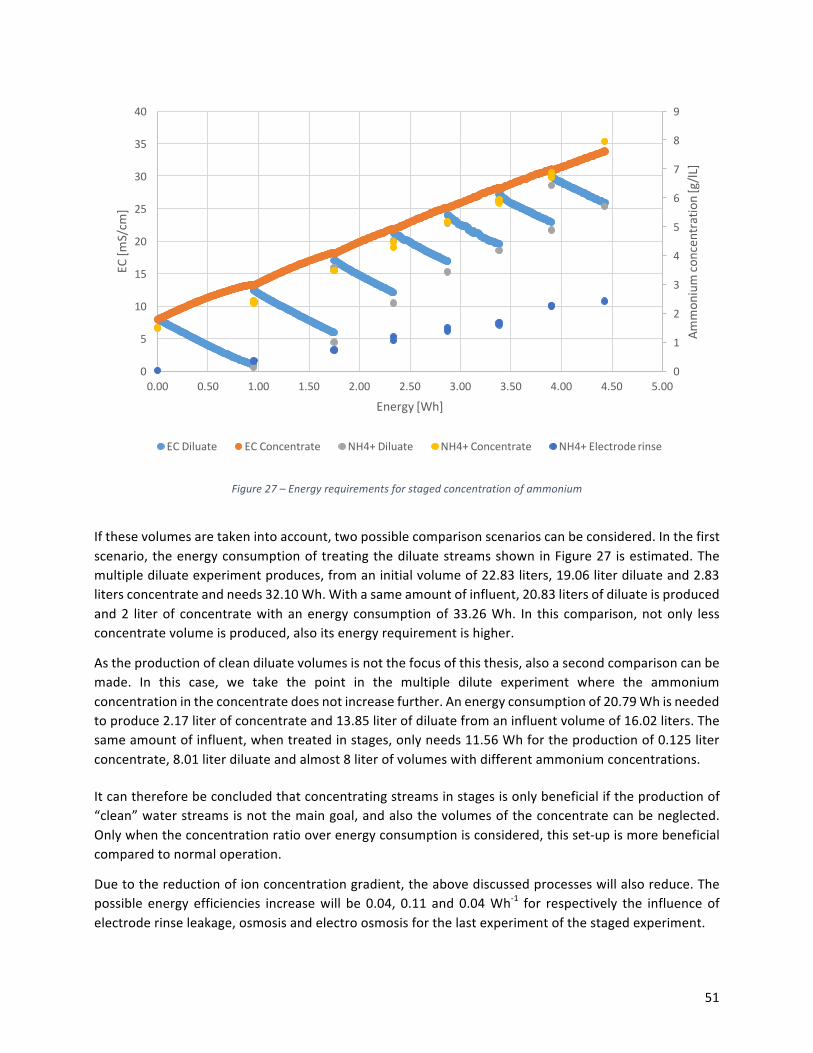
51
Figure27–Energyrequirementsforstagedconcentrationofammonium
Ifthesevolumesaretakenintoaccount,twopossiblecomparisonscenarioscanbeconsidered.Inthefirstscenario,theenergyconsumptionoftreatingthediluatestreamsshowninFigure27 isestimated.Themultiplediluateexperimentproduces,fromaninitialvolumeof22.83liters,19.06literdiluateand2.83litersconcentrateandneeds32.10Wh.Withasameamountofinfluent,20.83litersofdiluateisproducedand2 literof concentratewithanenergy consumptionof33.26Wh. In this comparison,notonly lessconcentratevolumeisproduced,alsoitsenergyrequirementishigher.
Astheproductionofcleandiluatevolumesisnotthefocusofthisthesis,alsoasecondcomparisoncanbemade. In this case, we take the point in the multiple dilute experiment where the ammoniumconcentrationintheconcentratedoesnotincreasefurther.Anenergyconsumptionof20.79Whisneededtoproduce2.17literofconcentrateand13.85literofdiluatefromaninfluentvolumeof16.02liters.Thesameamountofinfluent,whentreatedinstages,onlyneeds11.56Whfortheproductionof0.125literconcentrate,8.01literdiluateandalmost8literofvolumeswithdifferentammoniumconcentrations.Itcanthereforebeconcludedthatconcentratingstreamsinstagesisonlybeneficialiftheproductionof“clean”waterstreamsisnotthemaingoal,andalsothevolumesoftheconcentratecanbeneglected.Onlywhentheconcentrationratiooverenergyconsumptionisconsidered,thisset-upismorebeneficialcomparedtonormaloperation.
Duetothereductionofionconcentrationgradient,theabovediscussedprocesseswillalsoreduce.Thepossible energy efficiencies increasewill be 0.04, 0.11 and0.04Wh-1 for respectively the influenceofelectroderinseleakage,osmosisandelectroosmosisforthelastexperimentofthestagedexperiment.
0
1
2
3
4
5
6
7
8
9
0
5
10
15
20
25
30
35
40
0.00 0.50 1.00 1.50 2.00 2.50 3.00 3.50 4.00 4.50 5.00
Ammon
iumco
ncen
tration[g/lL
]
EC[m
S/cm
]
Energy[Wh]
ECDiluate ECConcentrate NH4+Diluate NH4+Concentrate NH4+Electroderinse

52
4.5.4 volumeratios
Inparagraph4.2.5thevolumedisplacementsinthediluatestreamareexamined.Animportantconclusionfromthissectionsuggests the temporal influenceofosmotic fluxesontheenergyefficiency.LoweringoperationtimesbyIncreasingthecurrentdensityisnotinvestigatedasthiswillalsoleadtoadecreaseinenergyefficiencyduetothelowerutilizationofthepotential.Decreasingtheoperationtimecanalsobeachievedbyapplyingvolumeratios.4.5.5 Preliminaryresults
Literature showed a decrease of used energy, for an increase for relative diluate volume versusconcentratevolume.Asalreadyencountered,ahigherdiluatevolumeleadstomoreionsinthelimitingsolution,aslowerdecreaseoftheelectricalconductivity inthisstreamandthereforealowerelectricalresistance.However,ontheotherhand,asmallerconcentratevolumeleadstoaquickerincreaseofionconcentration, electrical conductivity and concentration gradient between concentrate and diluatestreams.Thisresultsinabiggerfluxofsolventfromlowtohighconcentrationcells.
Experimentshavebeenconductedwithdifferentvolumeratiosfordifferentmembranetypes.Inordertocompare the test results with the multiple diluate experiment, only the standard anion – cationmembranesaredescribedhere.Duetopracticallimitations,concentratevolumescannotbesmallerthan0.10liter.Astwentydiluatevolumesareusedinthemultiplediluateexperiment,thevolumeratioof20wouldbeinteresting.Therefore,thetotaldiluatevolumefortheexperimentsdiscussedinthisparagraphwillconsistsof2liter.InFigure28therelationbetweenelectricalconductivityovertheconsumedenergyisshownformultiplevolumeratios.
Figure28-Electricalconductivityprogressionversustheusedamountofenergyfordifferentvolumeratios,withadiluate
volumeof2literandSTA-STKmembranes
0
10,000
20,000
30,000
40,000
50,000
0.00 0.50 1.00 1.50 2.00 2.50
EC[µ
S/cm
]
Energy[Wh]
VR=0.10 VR=0.33 VR=0.50 VR=1.00
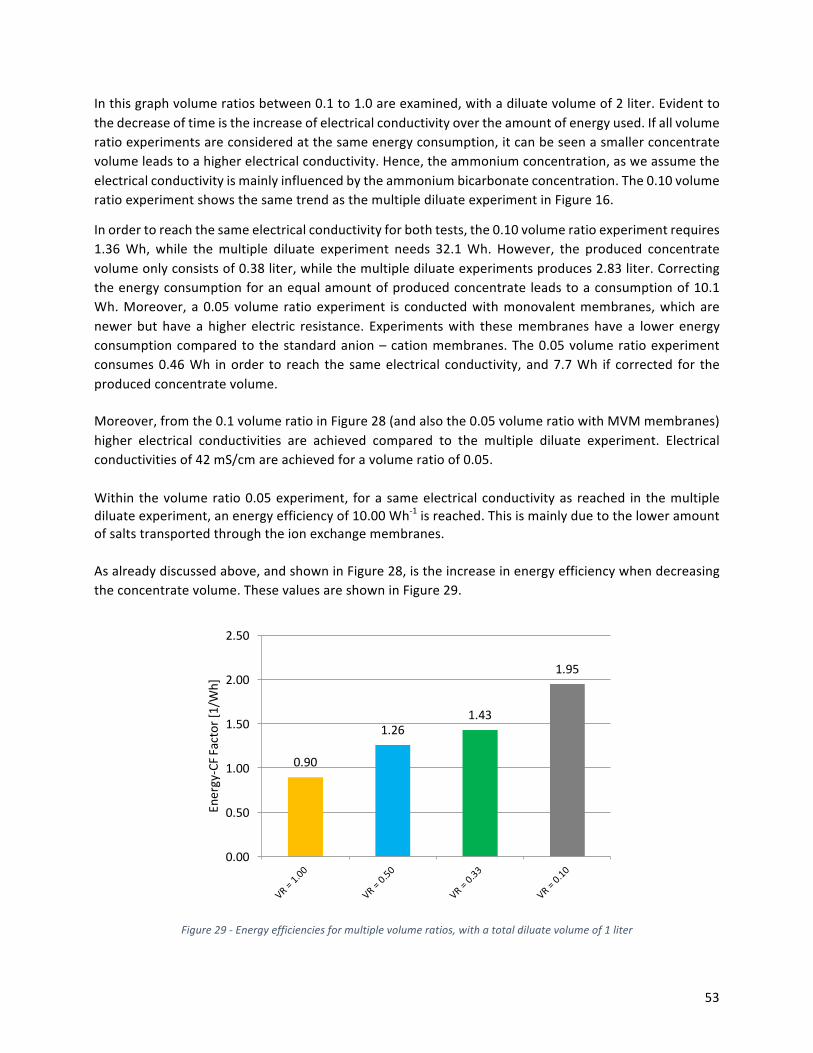
53
Inthisgraphvolumeratiosbetween0.1to1.0areexamined,withadiluatevolumeof2liter.Evidenttothedecreaseoftimeistheincreaseofelectricalconductivityovertheamountofenergyused.Ifallvolumeratioexperimentsareconsideredatthesameenergyconsumption,itcanbeseenasmallerconcentratevolumeleadstoahigherelectricalconductivity.Hence,theammoniumconcentration,asweassumetheelectricalconductivityismainlyinfluencedbytheammoniumbicarbonateconcentration.The0.10volumeratioexperimentshowsthesametrendasthemultiplediluateexperimentinFigure16.
Inordertoreachthesameelectricalconductivityforbothtests,the0.10volumeratioexperimentrequires1.36Wh, while themultiple diluate experiment needs 32.1Wh. However, the produced concentratevolumeonlyconsistsof0.38liter,whilethemultiplediluateexperimentsproduces2.83liter.Correctingtheenergyconsumptionforanequalamountofproducedconcentrate leadstoaconsumptionof10.1Wh.Moreover, a0.05volume ratioexperiment is conductedwithmonovalentmembranes,whicharenewerbut have a higher electric resistance. Experimentswith thesemembranes have a lower energyconsumptioncomparedtothestandardanion–cationmembranes.The0.05volumeratioexperimentconsumes0.46Wh inorder to reach the sameelectrical conductivity, and7.7Wh if corrected for theproducedconcentratevolume.Moreover,fromthe0.1volumeratioinFigure28(andalsothe0.05volumeratiowithMVMmembranes)higher electrical conductivities are achieved compared to the multiple diluate experiment. Electricalconductivitiesof42mS/cmareachievedforavolumeratioof0.05.Within thevolumeratio0.05experiment, forasameelectricalconductivityas reached in themultiplediluateexperiment,anenergyefficiencyof10.00Wh-1isreached.Thisismainlyduetotheloweramountofsaltstransportedthroughtheionexchangemembranes.Asalreadydiscussedabove,andshowninFigure28,istheincreaseinenergyefficiencywhendecreasingtheconcentratevolume.ThesevaluesareshowninFigure29.
Figure29-Energyefficienciesformultiplevolumeratios,withatotaldiluatevolumeof1liter
0.90
1.261.43
1.95
0.00
0.50
1.00
1.50
2.00
2.50
Energy-CFF
actor[1/Wh]

54
However, themigrationof ammoniummassper consumedenergyover the ionexchangemembranesdecreasesfordecreasingvolumeratios.TheseresultsareshowninFigure30.Comparabletothemultiplediluateexperiment,amaximumelectricalconductivityisexpected,leadingtoanoptimumutilizationofenergyfortheconcentrationofammonium.Decreasingconcentratevolumesfurtherwill leadtomoreosmosis,noincreaseinmaximumammoniumconcentrationsandthereforelowerenergyefficiencies.Thisoptimumisnotyetreachedforthevolumeratiosbetween1.0and0.05.
Figure30–Ammoniummasstransferoverenergyconsumptionformultiplevolumeratios,withatotaldiluatevolumeof2literandSTA–STKmembranes
Lastly,experimentswiththesamevolumeratiobutadifferentdiluatevolume,respectively1.0and2.0liter,arecompared.Thefollowingconclusioncanbedrawn:
i. Lowervaluesfortheenergyefficiencycanbefoundfortestsperformedwith2literdiluatevolume.Correctingthesevaluesforadoubleammoniumtransportleadstosmallerdecreasesinenergyefficiency.
ii. Thereismoreammoniumtransportperamountofconsumedenergyfortestperformedwiththe2literdiluatevolume.
Itismoreefficienttousesmallvolumeratioswhilekeepingthetotalfeedvolume,andthustheelectricalconductivity,highwhenoperatingelectrodialysisfortheconcentratingofstreams.
1.56 1.631.55
1.29
0.00
0.50
1.00
1.50
2.00
Energy-NH 4
+Mig.[g/Wh]
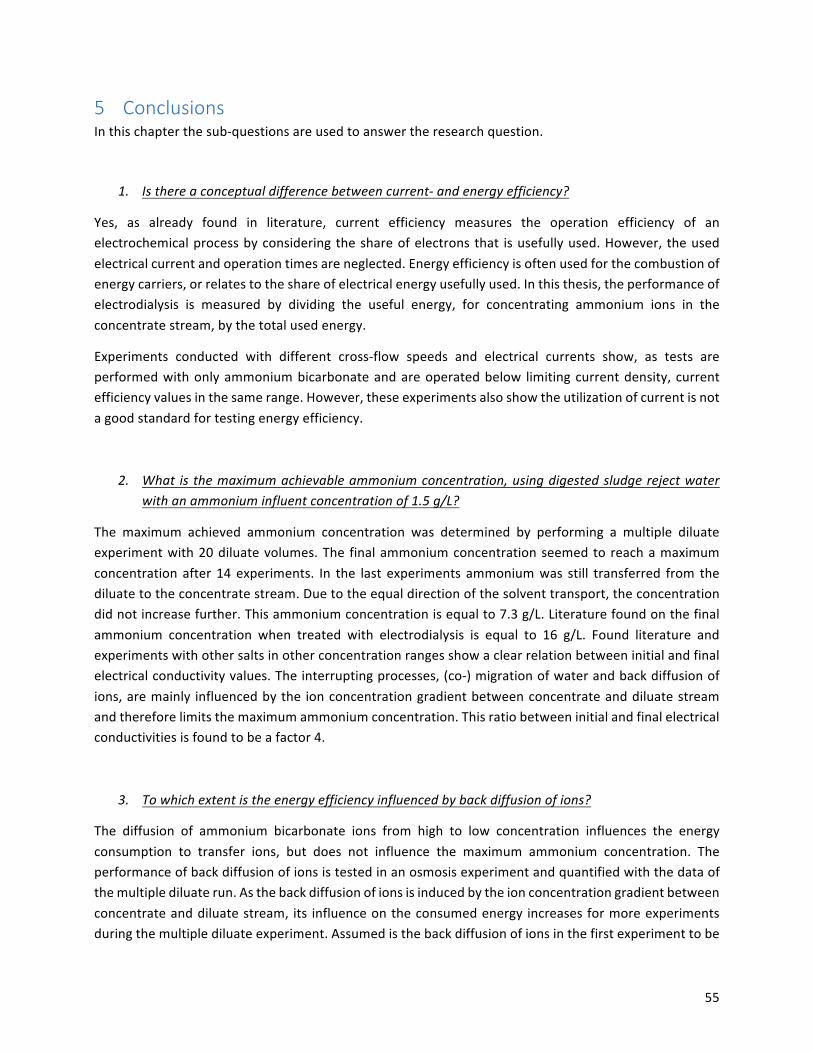
55
5 ConclusionsInthischapterthesub-questionsareusedtoanswertheresearchquestion.
1. Isthereaconceptualdifferencebetweencurrent-andenergyefficiency?
Yes, as already found in literature, current efficiency measures the operation efficiency of anelectrochemicalprocessbyconsideringtheshareofelectronsthat isusefullyused.However, theusedelectricalcurrentandoperationtimesareneglected.Energyefficiencyisoftenusedforthecombustionofenergycarriers,orrelatestotheshareofelectricalenergyusefullyused.Inthisthesis,theperformanceofelectrodialysis is measured by dividing the useful energy, for concentrating ammonium ions in theconcentratestream,bythetotalusedenergy.
Experiments conducted with different cross-flow speeds and electrical currents show, as tests areperformedwithonlyammoniumbicarbonateandareoperatedbelow limitingcurrentdensity, currentefficiencyvaluesinthesamerange.However,theseexperimentsalsoshowtheutilizationofcurrentisnotagoodstandardfortestingenergyefficiency.
2. What isthemaximumachievableammoniumconcentration,usingdigestedsludgerejectwaterwithanammoniuminfluentconcentrationof1.5g/L?
The maximum achieved ammonium concentration was determined by performing a multiple diluateexperimentwith20diluatevolumes.The finalammoniumconcentrationseemedto reachamaximumconcentration after 14experiments. In the last experiments ammoniumwas still transferred from thediluatetotheconcentratestream.Duetotheequaldirectionofthesolventtransport,theconcentrationdidnotincreasefurther.Thisammoniumconcentrationisequalto7.3g/L.Literaturefoundonthefinalammonium concentration when treated with electrodialysis is equal to 16 g/L. Found literature andexperimentswithothersaltsinotherconcentrationrangesshowaclearrelationbetweeninitialandfinalelectricalconductivityvalues.Theinterruptingprocesses,(co-)migrationofwaterandbackdiffusionofions,aremainly influencedbythe ionconcentrationgradientbetweenconcentrateanddiluatestreamandthereforelimitsthemaximumammoniumconcentration.Thisratiobetweeninitialandfinalelectricalconductivitiesisfoundtobeafactor4.
3. Towhichextentistheenergyefficiencyinfluencedbybackdiffusionofions?
The diffusion of ammonium bicarbonate ions from high to low concentration influences the energyconsumption to transfer ions, but does not influence the maximum ammonium concentration. Theperformanceofbackdiffusionofionsistestedinanosmosisexperimentandquantifiedwiththedataofthemultiplediluaterun.Asthebackdiffusionofionsisinducedbytheionconcentrationgradientbetweenconcentrateanddiluatestream, its influenceontheconsumedenergy increasesformoreexperimentsduringthemultiplediluateexperiment.Assumedisthebackdiffusionofionsinthefirstexperimenttobe
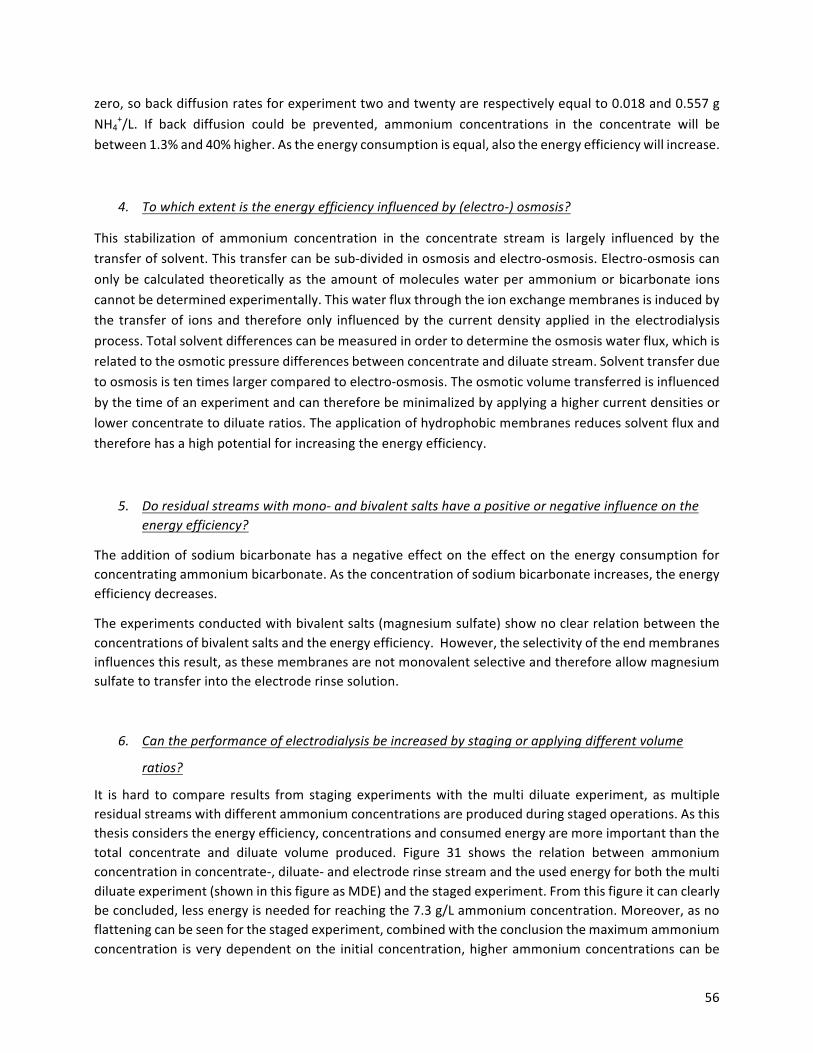
56
zero,sobackdiffusionratesforexperimenttwoandtwentyarerespectivelyequalto0.018and0.557gNH4
+/L. If back diffusion could be prevented, ammonium concentrations in the concentrate will bebetween1.3%and40%higher.Astheenergyconsumptionisequal,alsotheenergyefficiencywillincrease.
4. Towhichextentistheenergyefficiencyinfluencedby(electro-)osmosis?
This stabilization of ammonium concentration in the concentrate stream is largely influenced by thetransferofsolvent.Thistransfercanbesub-dividedinosmosisandelectro-osmosis.Electro-osmosiscanonlybecalculatedtheoreticallyas theamountofmoleculeswaterperammoniumorbicarbonate ionscannotbedeterminedexperimentally.Thiswaterfluxthroughtheionexchangemembranesisinducedbythe transferof ionsand thereforeonly influencedby thecurrentdensityapplied in theelectrodialysisprocess.Totalsolventdifferencescanbemeasuredinordertodeterminetheosmosiswaterflux,whichisrelatedtotheosmoticpressuredifferencesbetweenconcentrateanddiluatestream.Solventtransferduetoosmosisistentimeslargercomparedtoelectro-osmosis.Theosmoticvolumetransferredisinfluencedbythetimeofanexperimentandcanthereforebeminimalizedbyapplyingahighercurrentdensitiesorlowerconcentratetodiluateratios.Theapplicationofhydrophobicmembranesreducessolventfluxandthereforehasahighpotentialforincreasingtheenergyefficiency.
5. Doresidualstreamswithmono-andbivalentsaltshaveapositiveornegativeinfluenceontheenergyefficiency?
Theadditionofsodiumbicarbonatehasanegativeeffectontheeffectontheenergyconsumptionforconcentratingammoniumbicarbonate.Astheconcentrationofsodiumbicarbonateincreases,theenergyefficiencydecreases.
Theexperimentsconductedwithbivalentsalts(magnesiumsulfate)shownoclearrelationbetweentheconcentrationsofbivalentsaltsandtheenergyefficiency.However,theselectivityoftheendmembranesinfluencesthisresult,asthesemembranesarenotmonovalentselectiveandthereforeallowmagnesiumsulfatetotransferintotheelectroderinsesolution.
6. Cantheperformanceofelectrodialysisbeincreasedbystagingorapplyingdifferentvolume
ratios?
It is hard to compare results from staging experimentswith themulti diluate experiment, asmultipleresidualstreamswithdifferentammoniumconcentrationsareproducedduringstagedoperations.Asthisthesisconsiderstheenergyefficiency,concentrationsandconsumedenergyaremoreimportantthanthetotal concentrate and diluate volume produced. Figure 31 shows the relation between ammoniumconcentrationinconcentrate-,diluate-andelectroderinsestreamandtheusedenergyforboththemultidiluateexperiment(showninthisfigureasMDE)andthestagedexperiment.Fromthisfigureitcanclearlybeconcluded,lessenergyisneededforreachingthe7.3g/Lammoniumconcentration.Moreover,asnoflatteningcanbeseenforthestagedexperiment,combinedwiththeconclusionthemaximumammoniumconcentration isverydependentonthe initialconcentration,higherammoniumconcentrationscanbe
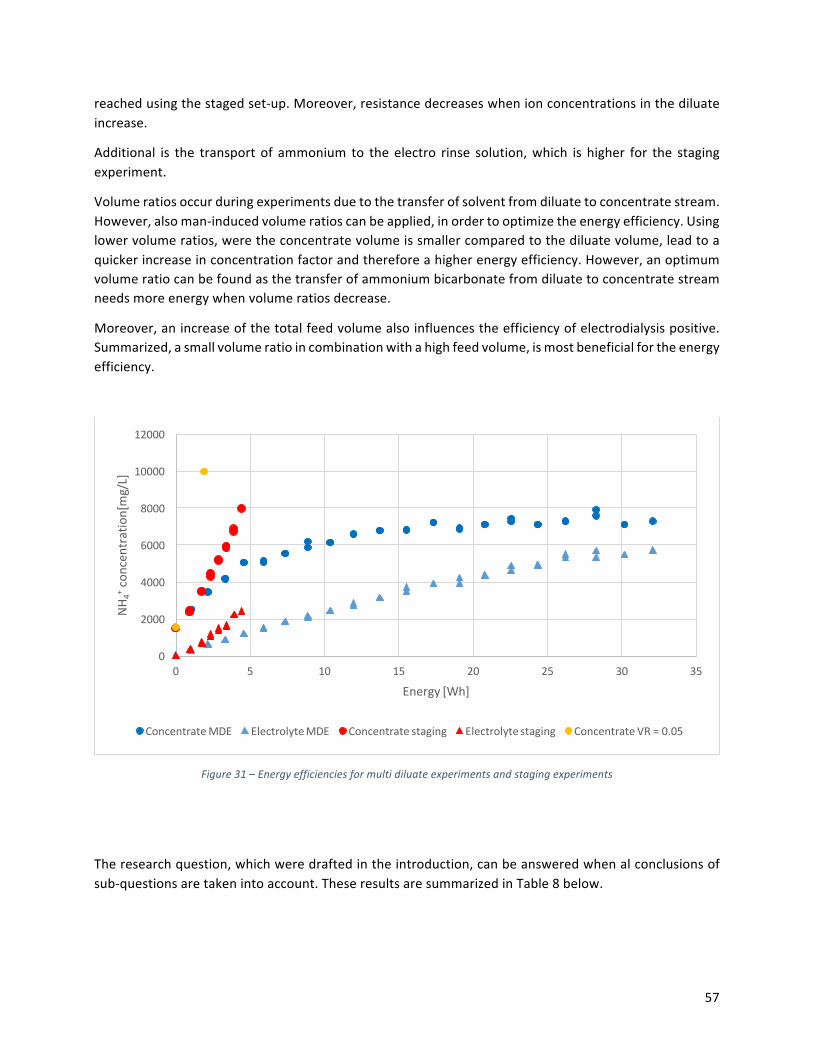
57
reachedusingthestagedset-up.Moreover,resistancedecreaseswhenionconcentrationsinthediluateincrease.
Additional is the transport of ammonium to the electro rinse solution,which is higher for the stagingexperiment.
Volumeratiosoccurduringexperimentsduetothetransferofsolventfromdiluatetoconcentratestream.However,alsoman-inducedvolumeratioscanbeapplied,inordertooptimizetheenergyefficiency.Usinglowervolumeratios,weretheconcentratevolumeissmallercomparedtothediluatevolume,leadtoaquickerincreaseinconcentrationfactorandthereforeahigherenergyefficiency.However,anoptimumvolumeratiocanbefoundasthetransferofammoniumbicarbonatefromdiluatetoconcentratestreamneedsmoreenergywhenvolumeratiosdecrease.
Moreover,anincreaseofthetotalfeedvolumealsoinfluencestheefficiencyofelectrodialysispositive.Summarized,asmallvolumeratioincombinationwithahighfeedvolume,ismostbeneficialfortheenergyefficiency.
Figure31–Energyefficienciesformultidiluateexperimentsandstagingexperiments
Theresearchquestion,whichweredraftedintheintroduction,canbeansweredwhenalconclusionsofsub-questionsaretakenintoaccount.TheseresultsaresummarizedinTable8below.
0
2000
4000
6000
8000
10000
12000
0 5 10 15 20 25 30 35
NH4+concen
tration[mg/L]
Energy[Wh]
ConcentrateMDE ElectrolyteMDE Concentratestaging Electrolytestaging ConcentrateVR=0.05
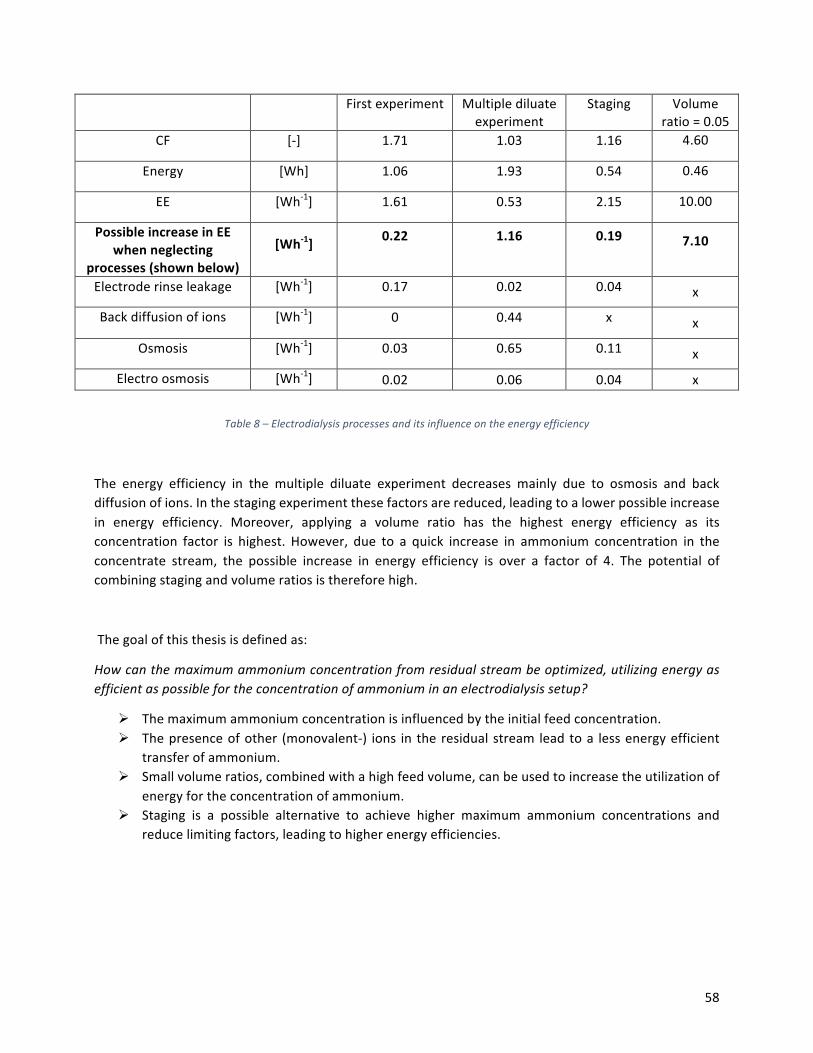
58
Firstexperiment Multiplediluateexperiment
Staging Volumeratio=0.05
CF [-] 1.71 1.03 1.16 4.60
Energy [Wh] 1.06 1.93 0.54 0.46
EE [Wh-1] 1.61 0.53 2.15 10.00
PossibleincreaseinEEwhenneglecting
processes(shownbelow)
[Wh-1]0.22 1.16 0.19 7.10
Electroderinseleakage [Wh-1] 0.17 0.02 0.04 x
Backdiffusionofions [Wh-1] 0 0.44 x x
Osmosis [Wh-1] 0.03 0.65 0.11 x
Electroosmosis [Wh-1] 0.02 0.06 0.04 x
Table8–Electrodialysisprocessesanditsinfluenceontheenergyefficiency
The energy efficiency in the multiple diluate experiment decreases mainly due to osmosis and backdiffusionofions.Inthestagingexperimentthesefactorsarereduced,leadingtoalowerpossibleincreasein energy efficiency. Moreover, applying a volume ratio has the highest energy efficiency as itsconcentration factor is highest. However, due to a quick increase in ammonium concentration in theconcentrate stream, the possible increase in energy efficiency is over a factor of 4. The potential ofcombiningstagingandvolumeratiosisthereforehigh.
Thegoalofthisthesisisdefinedas:
Howcanthemaximumammoniumconcentrationfromresidualstreambeoptimized,utilizingenergyasefficientaspossiblefortheconcentrationofammoniuminanelectrodialysissetup?
Ø Themaximumammoniumconcentrationisinfluencedbytheinitialfeedconcentration.Ø Thepresenceofother (monovalent-) ions in theresidualstream leadtoa lessenergyefficient
transferofammonium.Ø Smallvolumeratios,combinedwithahighfeedvolume,canbeusedtoincreasetheutilizationof
energyfortheconcentrationofammonium.Ø Staging is a possible alternative to achieve higher maximum ammonium concentrations and
reducelimitingfactors,leadingtohigherenergyefficiencies.
59
6 Recommendations
6.1 Electroderinsecomposition
Duringallexperimentsanaccumulationofammoniumionswasnoticedinthesodiumnitrateelectroderinse solution.Ammonium is transferred fromadiluatecell through theCEEMand recirculated to theothersideoftheEDstack,whereitisonceagaintransferredthroughaCEEMintotheconcentrateflow.Astheconcentrationofsodiumionsishigherintheelectroderinsesolutioncomparedtotheammoniumions,whilethechargeandmassesofthesemoleculesarenearlyequal,thechanceishigherasodiumionistransferredthroughtheCEEM.Inthiscontext,asaltwithammoniumascationwouldbemoresuitableforthisapplication.
6.1.1 PossiblealternativesIfthesodiumnitratesolutionwastobereplacedbyanammoniumholdingsolution,anapplicablecounteranionshouldbechosen.Besidesahighsolubilityof this salt inwater,alsoother factors likeexplosiondanger(NH4NO3)andgasforming(NH4Cl)shouldbeprevented.Moreover,asitispossibleformono-andbivalent ions tomove to the electrode rinse solution, also precipitate products should be taken intoaccount.Concentrateanddiluatefeedsolutionscontaincalciumandmagnesiumions,whichcaneasilyexceedthesolubilityproductifsulfate((NH4)2SO4)orphosphates((NH4)3PO4)arepresent.Astheinfluentmostlyconsistsofammoniumbicarbonate,thiswouldbeanobvioussuitablereplacementforthecurrentelectroderinsesolution.Othersalts,whicharepresentinthediluate/concentrateflowandthereforealsointheelectroderinsesolution,havearelativelowconcentrationcomparedtotheammoniumbicarbonate.Therefore,thechanceisveryhighanammoniumionistransferredfromtheelectroderinse,backintotheconcentrate flow. Over time, concentrations of potassium and sodium will increase, requiring areplacementoftheelectroderinsevolume.
Figure32–ProcessesinaEDstackwithanionexchangeendmembranes(AEEM)
60
Anotherpossiblealternativeisnotfocusedonthechangeofelectroderinsesolution,buttothesequenceof membranes in the stack. For the experiments conducted above, cation exchange endmembranes(CEEM) are used, making it possible for cations to pass into the electrode rinse solution. If thesemembranes were to be replaced with anion exchange endmembranes (AEEM), all cations would beretainedinthesolution.Thiscanbecomparedtotheexchangeofnitratefromtheelectroderinsestocksolutiontotheconcentratecell,forthemultiplediluateexperiment.Afteranoperationtimeof78hours,0.62gramsofnitratearefoundintheconcentrateflow.Theinitialconcentrationofnitrateintheelectroderinseflowequals62gramsofnitrate.
Moreover,theaccumulationofionsintheelectroderinsesolutionisneverpreferred,asthistowashingout theelectroderinsesolutionandtherefore leads tohigherchemicalcosts. Incombinationwith theAEEMs, sulfonate groups canbe applied as they have amolecular composition thatmakes themveryunlikelytobetransferredthroughtheexchangemembranes.Thebigdisadvantageofthesegroupsisthehighinvestmentcostsforthepurchaseofthechemical.
6.2 Scalingtofullplantlevel
Whenscalingalaboratoryexperimenttoafullplantlevel,alsooperationparametersshouldbetakenintoaccount.Withinthiscontext,mainlythemembranesareapointofinterest.
Intheintroductionitwasalreadystated,thisthesisonlyfocussesontheelectricalenergyutilization,andnotonfinancialaspects.However,literatureshowsthebiggestdisadvantageofusingelectrodialysis,isthepriceof themembranes.Asmembraneprices aredecreasing last years, ED starts tobecomeabettertreatmenttechniquethan,forexamplereverseosmosis.
With the used current density in this thesis the energy efficiency is high, while operation times arerelativelylong.Increasingthecurrentdensityalsoincreasesthemasstransferofammoniumionsthroughtheionexchangemembranespertime,andthereforeshortenstheoperationtime.Inconclusion,highercurrent densities require less membrane surface. A consideration between investment costs for themembrane, lifespan of these membranes and electrical requirement by induced electrical potentialdifferenceshouldbefurtherresearched.
Moreover,duringlaboratorialexperimentsmembraneswithaneffectivesurfaceof0.08by0.08m2areused. Ina full-scale setup, the cross-flowdistancewill be larger, leading toa significant concentrationdifference between in- and outlet of the concentrate and diluate stream. In co-current flow, bothconcentrateanddiluateflowinthesamedirectionalongthemembranes,theconcentrationdifferencebetweenbothstreamsincreaseslinearwiththetraveleddistance.Thepotentialofusingcounter-currentflow,concentrateanddiluateflowinoppositedirectionalongthemembranes,shouldbeinvestigated.Itis likely counter-current operations lead to smaller water fluxes, as concentration differences areoppressed.

61
6.3 Dischargingthediluate
Dependedontheusedstack,ammoniumconcentrationsinthediluateeffluentrangebetween80and140mg/L.However,theseflowscannotbedischargedinnaturalwaterbodiesduetoanammoniumdischargeregulationsetbytheEuropeanframeworkdirective(EFD)of2.2mgN/l(correspondingto2.83mgNH4
+/l).As the relation between electrical conductivity and ammonium concentration is inaccurate for lowammoniumconcentrations,astheinfluenceofothersaltspresentinthesolutionhaveahighinfluenceontheconductivity,itishardtoconverttheconcentrationtoacorrespondingEC.Iftheregularrelationisused,asshownin7.3.2,anECvalueof20µS/cmcanbecalculated.
Electrodialysisisknownnottobethemostsuitabletechniquefortreatinglowconductivityflows,duetohighelectricalresistanceintheEDstack.ThiscanalsobeseenfromFigure33,wheretheslopeoftheECversusenergyrelationdeclinesgreatly.Theenergyneededtodecreasetheammoniumconcentrationinthediluatefrom1500g/Lto140g/Lisapproximately0.96Wh,whileafurtherdecreaseto3mg/Lrequiresanother0.64Wh.Itshouldbenotedthatthisprocesscanbeoptimizedbyusingstages,whichwillalsoleadtoahighervolumeofdiluateproduced.
However, the potential of treating these low conductive flows with other techniques should beinvestigated.Inthismatter,energyefficienciesofreverseosmosisorionexchangeshouldalsobetakenintoequation.
Figure33–RelationECversusenergyforproducingdischargeablediluate
0
2
4
6
8
10
12
14
16
18
0.0 0.5 1.0 1.5 2.0 2.5
EC[m
S/cm
]
Energy[Wh]
Diluate Concentrate
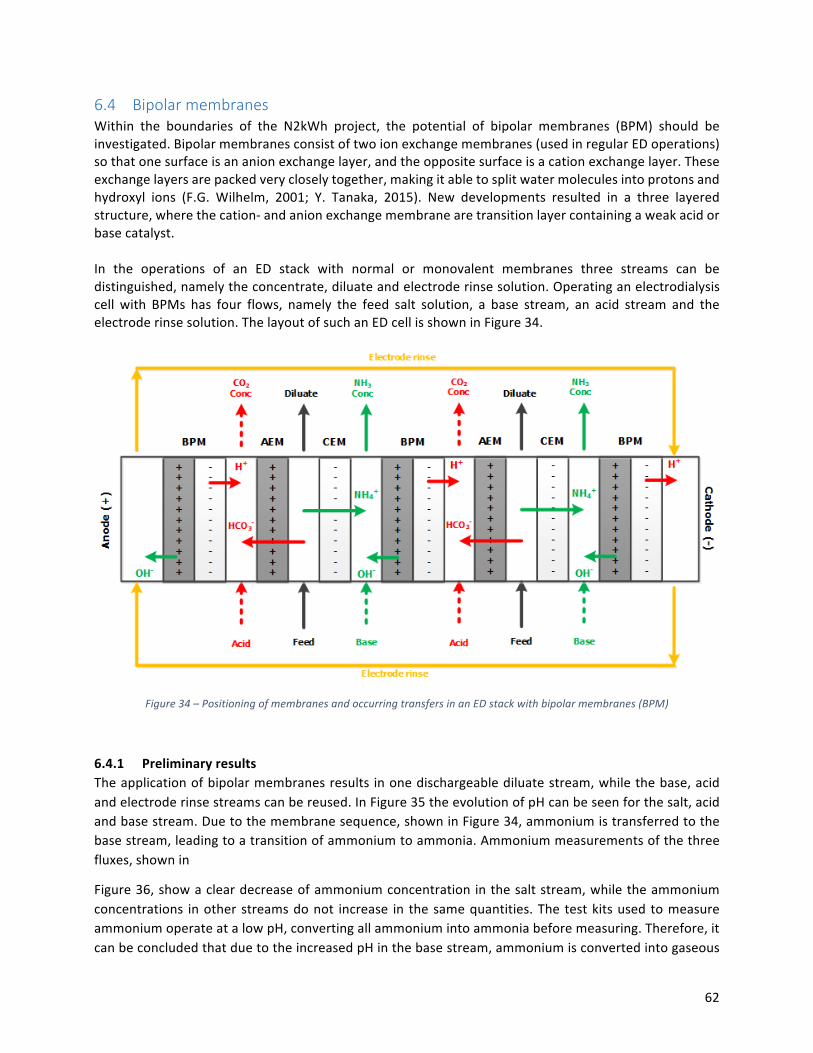
62
6.4 Bipolarmembranes
Within the boundaries of the N2kWh project, the potential of bipolar membranes (BPM) should beinvestigated.Bipolarmembranesconsistoftwoionexchangemembranes(usedinregularEDoperations)sothatonesurfaceisananionexchangelayer,andtheoppositesurfaceisacationexchangelayer.Theseexchangelayersarepackedverycloselytogether,makingitabletosplitwatermoleculesintoprotonsandhydroxyl ions (F.G. Wilhelm, 2001; Y. Tanaka, 2015). New developments resulted in a three layeredstructure,wherethecation-andanionexchangemembranearetransitionlayercontainingaweakacidorbasecatalyst.In the operations of an ED stack with normal or monovalent membranes three streams can bedistinguished,namelytheconcentrate,diluateandelectroderinsesolution.Operatinganelectrodialysiscell with BPMs has four flows, namely the feed salt solution, a base stream, an acid stream and theelectroderinsesolution.ThelayoutofsuchanEDcellisshowninFigure34.
Figure34–PositioningofmembranesandoccurringtransfersinanEDstackwithbipolarmembranes(BPM)
6.4.1 PreliminaryresultsTheapplicationofbipolarmembranesresults inonedischargeablediluatestream,whilethebase,acidandelectroderinsestreamscanbereused.InFigure35theevolutionofpHcanbeseenforthesalt,acidandbasestream.Duetothemembranesequence,showninFigure34,ammoniumistransferredtothebasestream,leadingtoatransitionofammoniumtoammonia.Ammoniummeasurementsofthethreefluxes,shownin
Figure36,showacleardecreaseofammoniumconcentrationinthesaltstream,whiletheammoniumconcentrations inother streamsdonot increase in thesamequantities.The testkitsusedtomeasureammoniumoperateatalowpH,convertingallammoniumintoammoniabeforemeasuring.Therefore,itcanbeconcludedthatduetotheincreasedpHinthebasestream,ammoniumisconvertedintogaseous

63
ammonia.Due to the transitionofammoniumtoammoniagas, theelectrical conductivityof thebasestreamwillonlyslightlyincrease.However,thedifferenceinECbetweenfeedandbasestreamislowercomparedtoanEDstackwithnormalormonovalentmembranes.Therefore,lowersolventfluxesthroughthemembranesareexpected.
With this application, the ammonium is concentrated but also converted to ammonia gas, making itunnecessary to use a gas production phase. However, the energy requirement to extract 1.6 gramammonium from the feed equals 2.29Wh,while regular operations use approximately 1.05Wh. Thedifferenceinenergyrequirementcanbeallocatedtothedissociationofwatermoleculesandtheextramembrane resistance. Further research should be conducted to see if this setup utilizes energymoreefficientthanthegasproductionstep.
Figure35–EvolutionofpHoverenergyforEDoperationswithBPMs
Besidesthetransferofammoniumthroughcationexchangemembranesintothebasestream,alsothetransferofbicarbonate(andotheranions)aretransferredthroughtheanionexchangemembranesintotheacidstream.DuetoalowpH,theequilibriumwillshifttocarbonicacid(H2CO3),whichisinequilibriumwithcarbondioxideandwater.TheapplicationofBPMthereforeproducesthegreenhousegascarbondioxide(CO2).
6
6.5
7
7.5
8
8.5
9
9.5
10
0.0 0.5 1.0 1.5 2.0 2.5 3.0
pH[-]
Energy[Wh]
pHSalt pHAcid pHBase

64
Figure36–EvolutionofammoniumconcentrationoverenergyforEDoperationswithBPMs
ThedirecttreatmentofrejectwaterwithanEDstackcontainingBPMmightnotbehighlyeffective,asthehydrogen and hydroxyl ions also react with other ions in solution. It would be beneficial to selectiveconcentrateammoniumwithMVMbeforeusingBPM.Theapplicationandpotentialofsuchlayoutshouldbefurtherresearched.
6.5 Fouling
In this thesis the influence of fouling components, as monovalent and bivalent salts, on the energyefficiencywere tested.However, another important component in the influentof digest sludge rejectwaterisneglected,organics.Inthemultiplediluaterunexperimentahorizontaltrendcouldbeseenwhenlooking at the driving force for electrodialysis.No fouling takes place in these experiments. However,biologicalandorganicfoulingwilloccurwhenusingrealdigestsludgerejectwater.Thisfoulingwillhavea negative effect on the energy efficiency and also on the operation of the processes, as duringelectrodialysisreversal(EDR)orcleaninginplace(CIP)theEDcellisnotoperational.Theinfluenceofthesepollutionsontheenergyefficiency,andtheconsequenceofpre-treatment,shouldbefurtherinvestigated.
0
400
800
1200
1600
2000
2400
2800
3200
3600
4000
0 0.5 1 1.5 2 2.5
Ammon
iumco
ncen
tration[m
g/L]
Energy[Wh]
TANSalt TANAcid TANBase
65
BiblographyBarragán,V.,&Ruız-Bauzá,C.(1999).Membranepotentialsandelectrolytepermeationinacation-exchangemembrane.Journalofmembranescience,154(2),261-272.
Canfield,D.E.,Glazer,A.N.,&Falkowski,P.G.(2010).TheevolutionandfutureofEarth’snitrogencycle.science,330(6001),192-196.
Cowan,D.A.,&Brown,J.H.(1959).Effectofturbulenceonlimitingcurrentinelectrodialysiscells.Industrial&EngineeringChemistry,51(12),1445-1448.
Dekker,N.,&Rietveld,G.(2006).Highlyefficientconversionofammoniainelectricitybysolidoxidefuelcells.Journaloffuelcellscienceandtechnology,3(4),499-502.
Fuerte,A.,Valenzuela,R.,Escudero,M.,&Daza,L.(2009).AmmoniaasefficientfuelforSOFC.JournalofPowerSources,192(1),170-174.
Fux,C.,Boehler,M.,Huber,P.,Brunner,I.,&Siegrist,H.(2002).Biologicaltreatmentofammonium-richwastewaterbypartialnitritationandsubsequentanaerobicammoniumoxidation(anammox)inapilotplant.Journalofbiotechnology,99(3),295-306.
Gain,E.,Laborie,S.,Viers,P.,Rakib,M.,Durand,G.,&Hartmann,D.(2002).Ammoniumnitratewastewatertreatmentbycoupledmembraneelectrolysisandelectrodialysis.JournalofAppliedElectrochemistry,32(9),969-975.
Galloway,J.N.(1998).Theglobalnitrogencycle:changesandconsequences.Environmentalpollution,102(1),15-24.
Han,L.,Galier,S.,&Roux-deBalmann,H.(2015).Ionhydrationnumberandelectro-osmosisduringelectrodialysisofmixedsaltsolution.Desalination,373,38-46.
Helfferich,F.G.(1962).Ionexchange:CourierCorporation.
Ho,W.,&Sirkar,K.(2012).Membranehandbook:SpringerScience&BusinessMedia.
Izquierdo-Gil,M.,Barragán,V.,Villaluenga,J.,&Godino,M.(2012).WateruptakeandsalttransportthroughNafioncation-exchangemembraneswithdifferentthicknesses.ChemicalEngineeringScience,72,1-9.
Jiang,C.,Wang,Y.,Zhang,Z.,&Xu,T.(2014).ElectrodialysisofconcentratedbrinefromROplanttoproducecoarsesaltandfreshwater.Journalofmembranescience,450,323-330.
Korngold,E.,Aronov,L.,&Daltrophe,N.(2009).ElectrodialysisofbrinesolutionsdischargedfromanROplant.Desalination,242(1-3),215-227.
Lee,H.-J.,Sarfert,F.,Strathmann,H.,&Moon,S.-H.(2002).Designingofanelectrodialysisdesalinationplant.Desalination,142(3),267-286.
Ling,L.-P.,Leow,H.-F.,&Sarmidi,M.R.(2002).Citricacidconcentrationbyelectrodialysis:ionandwatertransportmodelling.Journalofmembranescience,199(1),59-67.
66
Luther,A.K.,Desloover,J.,Fennell,D.E.,&Rabaey,K.(2015).Electrochemicallydrivenextractionandrecoveryofammoniafromhumanurine.Waterresearch,87,367-377.
Magrí,A.,Béline,F.,&Dabert,P.(2013).Feasibilityandinterestoftheanammoxprocessastreatmentalternativeforanaerobicdigestersupernatantsinmanureprocessing–Anoverview.Journalofenvironmentalmanagement,131,170-184.
Metcalf,E.E.,&Eddy,H.(2003).Wastewaterengineertreatmentdisposal,reuse.NewYork:McGRaw.
Mondor,M.,Masse,L.,Ippersiel,D.,Lamarche,F.,&Masse,D.(2008).Useofelectrodialysisandreverseosmosisfortherecoveryandconcentrationofammoniafromswinemanure.Bioresourcetechnology,99(15),7363-7368.
Ormerod,R.M.(2003).Solidoxidefuelcells.ChemicalSocietyReviews,32(1),17-28.
Patterson,M.G.(1996).Whatisenergyefficiency?:Concepts,indicatorsandmethodologicalissues.Energypolicy,24(5),377-390.
Reahl,E.R.(1990).Reclaimingreverseosmosisblowdownwithelectrodialysisreversal.Desalination,78(1),77-89.
Rottiers,T.,Ghyselbrecht,K.,Meesschaert,B.,VanderBruggen,B.,&Pinoy,L.(2014).InfluenceofthetypeofanionmembraneonsolventfluxandbackdiffusioninelectrodialysisofconcentratedNaClsolutions.ChemicalEngineeringScience,113,95-100.
Sadrzadeh,M.,&Mohammadi,T.(2009).Treatmentofseawaterusingelectrodialysis:Currentefficiencyevaluation.Desalination,249(1),279-285.
Singhal,S.C.(2000).Advancesinsolidoxidefuelcelltechnology.Solidstateionics,135(1-4),305-313.
Song,H.P.,Jiang,Y.Y.,&Cheng,F.Q.(2012).TreatmentofAmmonia-NitrogenWastewaterbyElectrodialysis.PaperpresentedattheAdvancedMaterialsResearch.
STOWA.(2016).Deinvloedvankationenenbeluchtingopslibontwatering.
Strathmann,H.(2010).Electrodialysis,amaturetechnologywithamultitudeofnewapplications.Desalination,264(3),268-288.
Suschka,J.,&Popławski,S.(2003).Ammoniaremovalfromdigestedsludgesupernatant.PaperpresentedattheProceedingsofPolish–SwedishSeminaronIntegrationandOptimisationofUrbanSanitationSystems,Wisla.
Valero,F.,Barceló,A.,&Arbós,R.(2011).Electrodialysistechnology-theoryandapplicationsDesalination,trendsandtechnologies:InTech.
VanLinden,N.,Spanjers,H.,&VanLier,J.(2016).N2KWH:frompollutanttopower.PostersessionpresentedatPhDEnergyEvent,Delft,Netherlands.
.

67
Walha,K.,Amar,R.B.,Firdaous,L.,Quéméneur,F.,&Jaouen,P.(2007).Brackishgroundwatertreatmentbynanofiltration,reverseosmosisandelectrodialysisinTunisia:performanceandcostcomparison.Desalination,207(1-3),95-106.
Xu,T.,&Huang,C.(2008).Electrodialysis-basedseparationtechnologies:acriticalreview.AIChEjournal,54(12),3147-3159.
Yan,H.,Xu,C.,Li,W.,&Xu,T.(2016).ElectrodialysistoConcentrateWasteIonicLiquids:OptimizationofOperatingParameters.Industrial&EngineeringChemistry,55(7),2144–2152.doi:10.1021

68
7 Appendices
7.1 N2kWhbackground
7.1.1 FrompollutanttopowerDuringtheclimateconferenceinParisin2015(COP21),allmembersagreedthatactionwasneededtolimitglobalwarmingbeforeclimatechangewouldreachdangerouslevels.Oneoftheadaptionsneededis the reduction of greenhouse gas, like carbon dioxide and methane, emissions. New establishedregulationsaimforthereductionofgreenhousegassesby40%,comparedtothelevelsintheyear1992,beforetheyear2030.Therefore,theneedforalternativeenergysourcesissubstantial.
TheN2kWhprojectaims for the introductionofanew,widelyavailable,energy source in the formofammonia(NH3).Besidesthepotentialenergyrecovery,alsoalternativetreatmenttechniquestoremovenitrogen concentrations from residual streams are required.Within the boundaries of this project, aparadigm shift is provided: “from pollutant to power”. Not only will ammonia be seen as a valuableresource, rather than a pollutant, also the discharge requirement of nitrogen will be addressed. Theparadigmshiftisshownbelowinfigure37asapartoftheammoniacycle.
Figure37–Paradigmshiftforammonia:frompollutanttopower
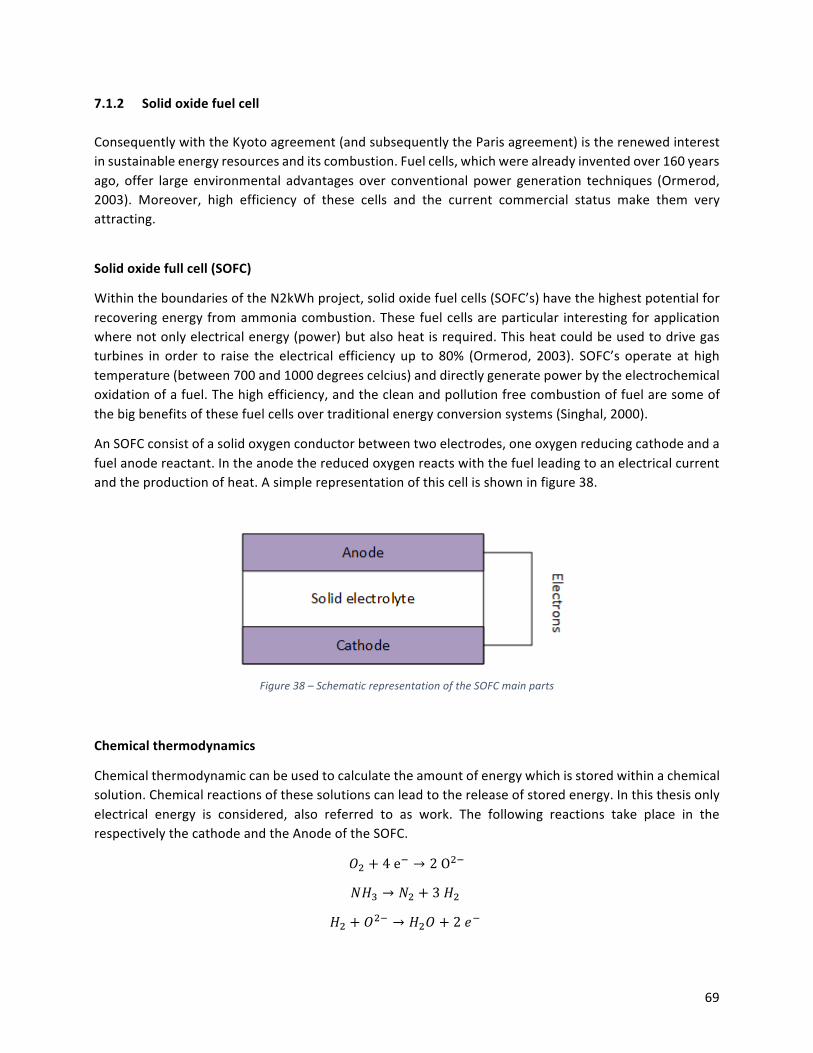
69
7.1.2 Solidoxidefuelcell
ConsequentlywiththeKyotoagreement(andsubsequentlytheParisagreement)istherenewedinterestinsustainableenergyresourcesanditscombustion.Fuelcells,whichwerealreadyinventedover160yearsago, offer large environmental advantages over conventional power generation techniques (Ormerod,2003). Moreover, high efficiency of these cells and the current commercial status make them veryattracting.
Solidoxidefullcell(SOFC)
WithintheboundariesoftheN2kWhproject,solidoxidefuelcells(SOFC’s)havethehighestpotentialforrecoveringenergyfromammoniacombustion.Thesefuelcellsareparticular interestingforapplicationwherenotonlyelectricalenergy(power)butalsoheatisrequired.Thisheatcouldbeusedtodrivegasturbines in order to raise the electrical efficiency up to 80% (Ormerod, 2003). SOFC’s operate at hightemperature(between700and1000degreescelcius)anddirectlygeneratepowerbytheelectrochemicaloxidationofafuel.Thehighefficiency,andthecleanandpollutionfreecombustionoffuelaresomeofthebigbenefitsofthesefuelcellsovertraditionalenergyconversionsystems(Singhal,2000).
AnSOFCconsistofasolidoxygenconductorbetweentwoelectrodes,oneoxygenreducingcathodeandafuelanodereactant.Intheanodethereducedoxygenreactswiththefuelleadingtoanelectricalcurrentandtheproductionofheat.Asimplerepresentationofthiscellisshowninfigure38.
Figure38–SchematicrepresentationoftheSOFCmainparts
Chemicalthermodynamics
Chemicalthermodynamiccanbeusedtocalculatetheamountofenergywhichisstoredwithinachemicalsolution.Chemicalreactionsofthesesolutionscanleadtothereleaseofstoredenergy.Inthisthesisonlyelectrical energy is considered, also referred to as work. The following reactions take place in therespectivelythecathodeandtheAnodeoftheSOFC.
ab + 4ee → 2Obe
<ij → <b + 3ib
ib + abe → iba + 2le
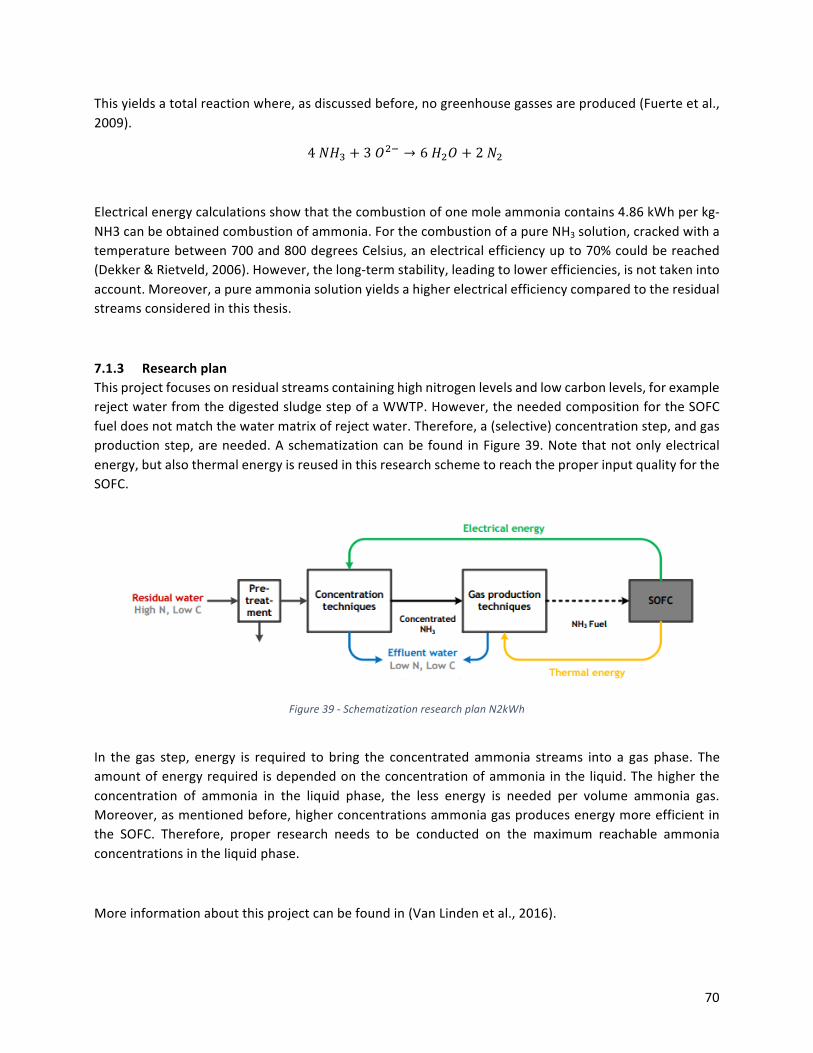
70
Thisyieldsatotalreactionwhere,asdiscussedbefore,nogreenhousegassesareproduced(Fuerteetal.,2009).
4<ij + 3abe → 6iba + 2<b
Electricalenergycalculationsshowthatthecombustionofonemoleammoniacontains4.86kWhperkg-NH3canbeobtainedcombustionofammonia.ForthecombustionofapureNH3solution,crackedwithatemperaturebetween700and800degreesCelsius,anelectricalefficiencyupto70%couldbereached(Dekker&Rietveld,2006).However,thelong-termstability,leadingtolowerefficiencies,isnottakenintoaccount.Moreover,apureammoniasolutionyieldsahigherelectricalefficiencycomparedtotheresidualstreamsconsideredinthisthesis.
7.1.3 ResearchplanThisprojectfocusesonresidualstreamscontaininghighnitrogenlevelsandlowcarbonlevels,forexamplerejectwaterfromthedigestedsludgestepofaWWTP.However,theneededcompositionfortheSOFCfueldoesnotmatchthewatermatrixofrejectwater.Therefore,a(selective)concentrationstep,andgasproductionstep,areneeded.AschematizationcanbefoundinFigure39.Notethatnotonlyelectricalenergy,butalsothermalenergyisreusedinthisresearchschemetoreachtheproperinputqualityfortheSOFC.
Figure39-SchematizationresearchplanN2kWh
In the gas step, energy is required to bring the concentrated ammonia streams into a gas phase. Theamountofenergyrequiredisdependedontheconcentrationofammoniaintheliquid.Thehighertheconcentration of ammonia in the liquid phase, the less energy is needed per volume ammonia gas.Moreover,asmentionedbefore,higherconcentrationsammoniagasproducesenergymoreefficientinthe SOFC. Therefore, proper research needs to be conducted on the maximum reachable ammoniaconcentrationsintheliquidphase.
Moreinformationaboutthisprojectcanbefoundin(VanLindenetal.,2016).

71
7.2 Technologyreview
7.2.1 ReverseosmosisOsmosis is a natural phenomenon where solvent, often water, moves through a semi-permeablemembranefromalowtoahighsoluteconcentration.Thissemi-permeablemembraneretainsions,whilewatermoleculescanfreelypass.Anequilibriumisreachedwhentheosmoticpressuredifferenceoverthemembraneiszero.Inreverseosmosisanexternalpressureisusedtoreversethewaterflowfromhightolowconcentrationsolutions.Duetothisprocessthereisnoequilibrium,leadingtoanosmoticpressuredifference.Inordertokeepthewaterflowinanaturalreversedway,theappliedexternalpressureshouldalwaysbehigherthantheosmoticpressure.Thisphenomenonareshownbelowinfigure40.
A
B
A=Osmoticpressuredifference B=externalappliedforce Figure40–Reverseosmosisprinciple.Fromlefttoright:startconditions,equilibriumstateandfreshwaterproductionafter
applyinganexternalforce.
Reverseosmosisisawidelyusedtechniquetoproducepurifiedwaterfromgroundorsurfacewater.Indrinkingwaterproductionthesemembranesareoftenusedfortheremovalofsalts,whendesalinatingseaorbrackishwater,ormicro-pollutants, likeorganicor inorganicmatter, fortheproductionoffreshwater. However, during these processes the fresh water production is important, while within theboundariesofthisproject,thefocusliesonproducingaconcentratestream.
Thedrivingforceforreverseosmosisisknownasthedifferencebetweenpressuresoverthemembranes,betterknownasthetransmembranepressure.Correspondingly,thefluxofwaterthroughamembranecanbecalculatedwiththeformulashownbelow.
N =1
R ∗ $∗ (%-S −∆T)
Where:J:volumetricflux[m/s] µ:dynamicviscosityofwater[pa*s]R:membraneresistance[m-1] TMP:transmembranepressure[pa]Dp:Osmoticpressuredifference[pa]

72
Ashighconcentrationdifferencesbetweentheconcentrateenpermeatesideareexpectedforcreatinghighlyconcentratedstreams,theosmoticpressuredifferencebetweenthesetwostreamswill increasesignificantly.Toinsureawaterflowfromconcentratetopermeate,theappliedpressuremustexceedtheosmoticpressure,leadingtohigherenergyconsumptionsforpumps.Moreover,cleaninginplace(CIP)isnecessarytoinsurethemembraneswillnotgetcloggedor(biologically)fouled.Bytakingoutonereverseosmosismodule,whichisusuallyexecutedasaspiralwoundmembrane,theproductionofcleanwaterwill decrease. However, the high retention of salts and relatively low energy consumption are bigadvantages.
7.2.2 Ionexchange
Ionexchangersareinsolublematerials,eithernaturaloccurringzeolitesormanmaderesins,whichcarryexchangeable cations or anions (Helfferich, 1962). Ion exchange is a reversible process which can bedividedintocationexchangeandanionexchange,whererespectivelypositivelyandnegativelychargedionsareexchanged.Thetargetioninthisresearchisammonium,needsthesamechargeasthefunctionalgroupoftheresin,whichiscalledthecounterion.Operatinganionexchangecolumnstartswithresinsfully loadedwithpositively charged ions.Whenelectrolytewith the target ion ispumped through thecolumn,andthetargetionhasahigherionicinteractionwiththematerialssurface,itwillexchangewiththecounterion.Whentherearenocounterionsontheresinssurfaceanymore,theflowwillbereversed,usingahighlyconcentrateelectrolytesolutioncontainingthecounterion.Thisprocesscanbeseenbelow.
Figure41-Ionexchangeprinciple.Fromlefttoright:startconditions,loadingphaseandregenerationphase.
Duringtheregenerationphaseastreamwithahightargetandcounterionconcentrationisproduced.Inthisway,almostnoenergyisneededtoconcentrateammoniumions.However,highconcentrationsoftarget ionsalsorequiredahighamountofcounter ions,andthereforeahighamountof ionexchangeresin.

73
7.2.3 Electrodialysis
Electrodialysisisalreadypresentedinparagraph2.1.1.
7.2.4 TechniqueconsiderationIn thisparagraph,elementary information isgivenon threepossibleconcentration techniques, for theconcentration of ammonium from reject water. As the goal of this thesis is to optimize the energyefficiency for one of these techniques, and not to compare them to each other, themost promisingtechnique is chosenaftera literature review.Electrodialysis in this casehas lowamountsof literatureavailable on the concentration of streams, while on the other hand has the highest potential as aconcentrationtechnique.
As explained in paragraph 7.1.3, a high concentration of ammonium is favorable for the operation ofsubsequentsteps.Thisfavorableconcentrationispresumablytohightohaveaneffectiveionexchangeprocess,astheresinsurfacewillbefullwithammoniumquickly.
Moreover,bothelectrodialysisandreverseosmosisseemgoodtechniquestoconcentrateionsintoonestream.Reverseosmosiscreateslowconcentratevolumes,hasmuchliteratureavailableonthetechniqueand isoftenpreferredoverED for treatingbrackishwater (Walhaetal.,2007).However,ahighersaltconcentration in the feed flow leads to higher osmotic pressures and therefore a higher energyconsumption. On the other hand, in an electrodialysis process the water is not forced through themembranes, which is the case for all other membrane techniques, but only transfers ions over themembrane.Theresistanceinsuchasetupwillbedeterminedbythestreamthathasthelowestelectricalconductivity,thediluatestream.Higherconcentrationstherefore leadto lowerresistanceandabetterutilization of the energy. However, electrodialysis is limited by the properties of the ion exchangemembranesandthehighcostsofelectrodesandionexchangemembranes(Xu&Huang,2008).
Asthisthesisonlyfocusesonaneffectiveutilizationofenergyfortheconcentrationofsalts,andnotontheeconomicaspectsasinvestmentcosts,electrodialysisisthemostpromisingtechnique.

74
7.2.5 pHsensitivityofammoniumbicarbonate
Ammoniumisaslightlypositivelychargedionandthereforedoesnotexistsonit’sown,butisalwayspartofasaltwithanegativelychargedion.Inthisthesisammoniumbicarbonateisused,asthisapproachestherealwatercompositionofbiologicallytreatedrejectwater(seeparagraph1.2.1).Bothionsarekepttogetherby ionic bonds,whichwill be interfered themoment they aredissolved inwater.Moreover,Ammoniumisalwaysinequilibriumwithammonia,suchastheequilibriumofbicarbonatewithcarbonicacidandcarbondioxide.Theseequilibriaaredependedonsoluteconcentration,pHand temperature.WithintheboundariesofthisprojectthepHofdigestedsludgerejectwaterrangesbetween7.4and7.8(STOWA,2016).Below,inFigure42bothequilibriagraphsareshown.ItcanbeconcludedthatatthispH,andatemperatureof25degreesCelsius,almosteverythingisionizedinammoniumandbicarbonate.
Figure42-Equilibriaofbicarbonate(left)andammonium(right)
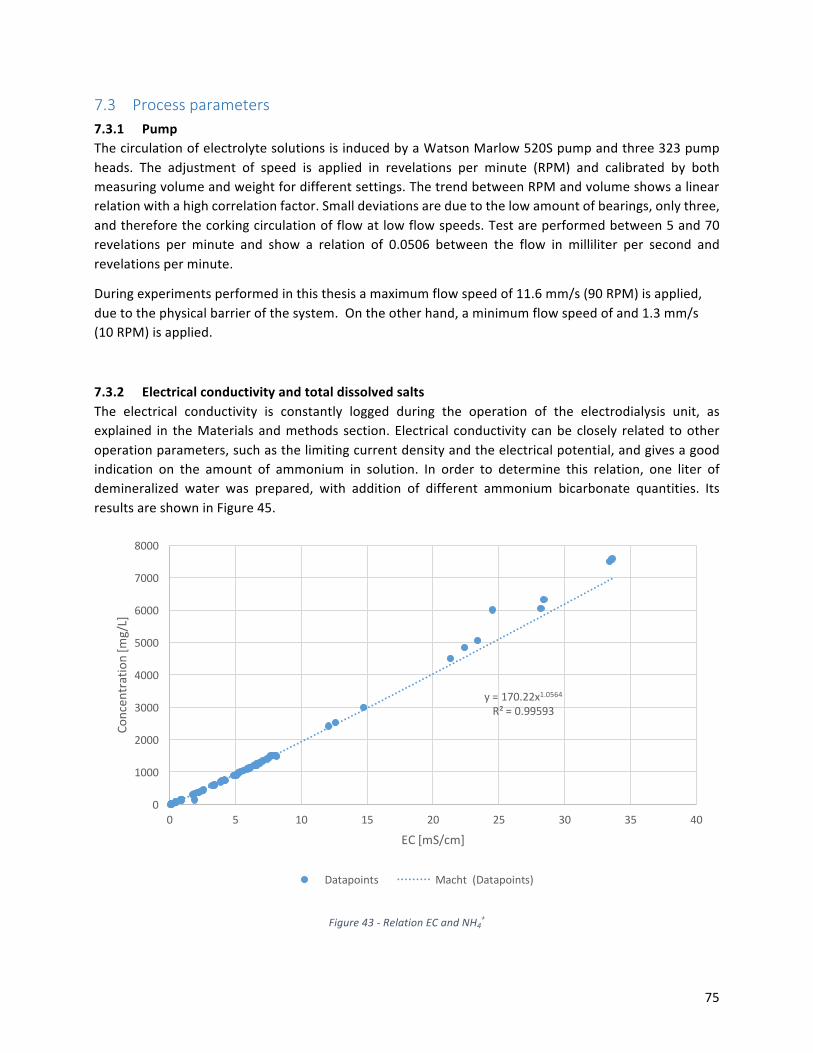
75
7.3 Processparameters
7.3.1 PumpThecirculationofelectrolytesolutionsisinducedbyaWatsonMarlow520Spumpandthree323pumpheads. The adjustment of speed is applied in revelations per minute (RPM) and calibrated by bothmeasuringvolumeandweightfordifferentsettings.ThetrendbetweenRPMandvolumeshowsalinearrelationwithahighcorrelationfactor.Smalldeviationsareduetothelowamountofbearings,onlythree,andthereforethecorkingcirculationofflowatlowflowspeeds.Testareperformedbetween5and70revelations per minute and show a relation of 0.0506 between the flow in milliliter per second andrevelationsperminute.
Duringexperimentsperformedinthisthesisamaximumflowspeedof11.6mm/s(90RPM)isapplied,duetothephysicalbarrierofthesystem.Ontheotherhand,aminimumflowspeedofand1.3mm/s(10RPM)isapplied.
7.3.2 Electricalconductivityandtotaldissolvedsalts
The electrical conductivity is constantly logged during the operation of the electrodialysis unit, asexplained in theMaterialsandmethods section.Electrical conductivity canbeclosely related tootheroperationparameters,suchasthelimitingcurrentdensityandtheelectricalpotential,andgivesagoodindication on the amount of ammonium in solution. In order to determine this relation, one liter ofdemineralized water was prepared, with addition of different ammonium bicarbonate quantities. ItsresultsareshowninFigure45.
Figure43-RelationECandNH4+
y=170.22x1.0564R²=0.99593
0
1000
2000
3000
4000
5000
6000
7000
8000
0 5 10 15 20 25 30 35 40
Concen
tration[m
g/L]
EC[mS/cm]
Datapoints Macht(Datapoints)
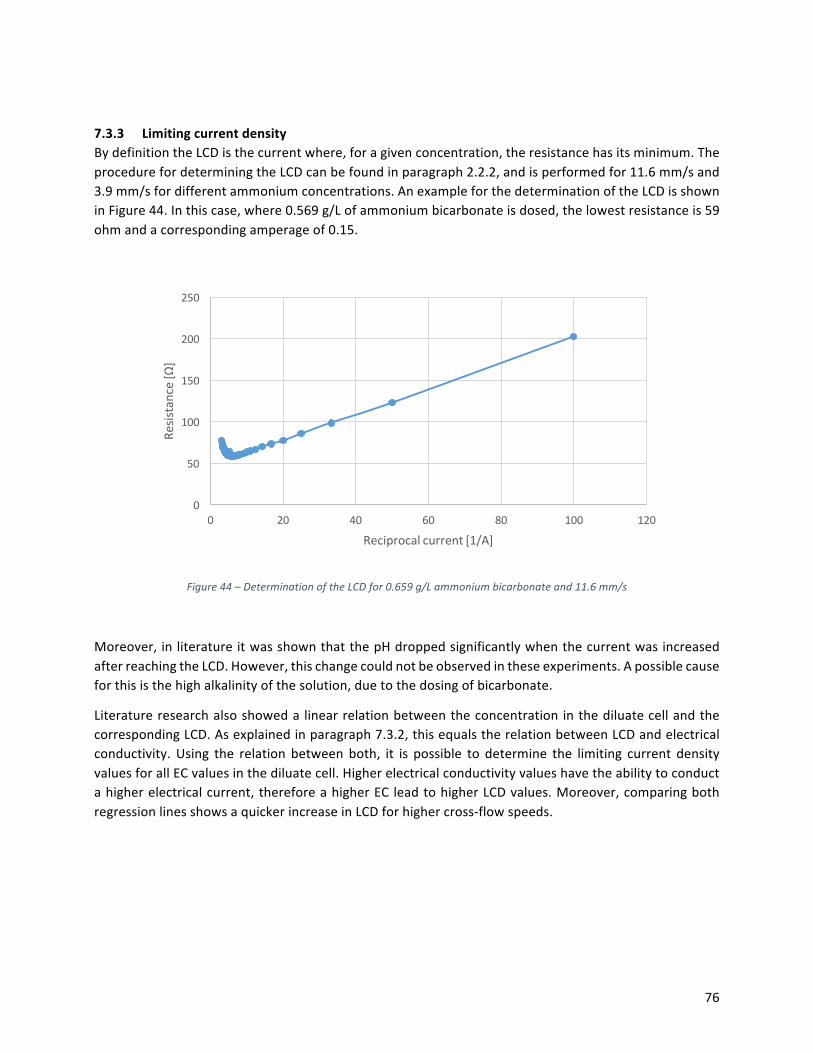
76
7.3.3 LimitingcurrentdensityBydefinitiontheLCDisthecurrentwhere,foragivenconcentration,theresistancehasitsminimum.TheprocedurefordeterminingtheLCDcanbefoundinparagraph2.2.2,andisperformedfor11.6mm/sand3.9mm/sfordifferentammoniumconcentrations.AnexampleforthedeterminationoftheLCDisshowninFigure44.Inthiscase,where0.569g/Lofammoniumbicarbonateisdosed,thelowestresistanceis59ohmandacorrespondingamperageof0.15.
Figure44–DeterminationoftheLCDfor0.659g/Lammoniumbicarbonateand11.6mm/s
Moreover,inliteratureitwasshownthatthepHdroppedsignificantlywhenthecurrentwasincreasedafterreachingtheLCD.However,thischangecouldnotbeobservedintheseexperiments.Apossiblecauseforthisisthehighalkalinityofthesolution,duetothedosingofbicarbonate.
Literatureresearchalsoshoweda linearrelationbetweentheconcentration inthediluatecellandthecorrespondingLCD.Asexplainedinparagraph7.3.2,thisequalstherelationbetweenLCDandelectricalconductivity. Using the relation between both, it is possible to determine the limiting current densityvaluesforallECvaluesinthediluatecell.Higherelectricalconductivityvalueshavetheabilitytoconductahigherelectricalcurrent,thereforeahigherEC leadtohigherLCDvalues.Moreover,comparingbothregressionlinesshowsaquickerincreaseinLCDforhighercross-flowspeeds.
0
50
100
150
200
250
0 20 40 60 80 100 120
Resistance[Ω]
Reciprocalcurrent[1/A]
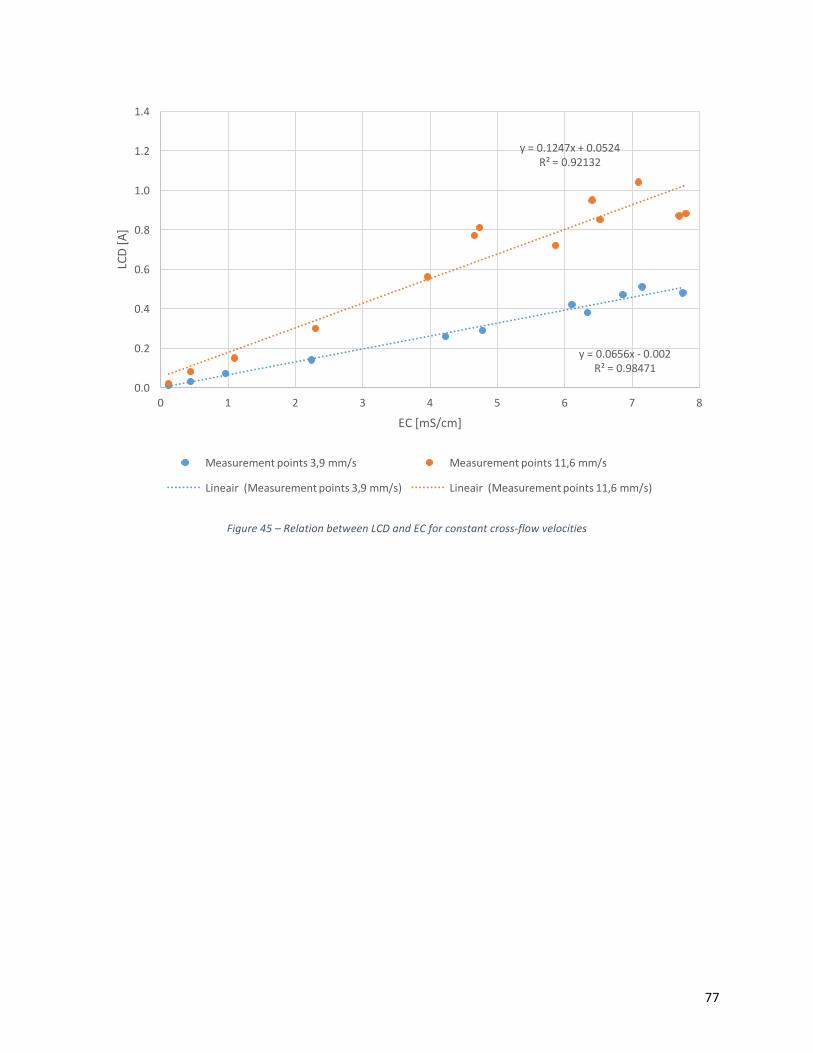
77
Figure45–RelationbetweenLCDandECforconstantcross-flowvelocities
y=0.0656x- 0.002R²=0.98471
y=0.1247x+0.0524R²=0.92132
0.0
0.2
0.4
0.6
0.8
1.0
1.2
1.4
0 1 2 3 4 5 6 7 8
LCD[A]
EC[mS/cm]
Measurementpoints3,9mm/s Measurementpoints11,6mm/s
Lineair(Measurementpoints3,9mm/s) Lineair(Measurementpoints11,6mm/s)
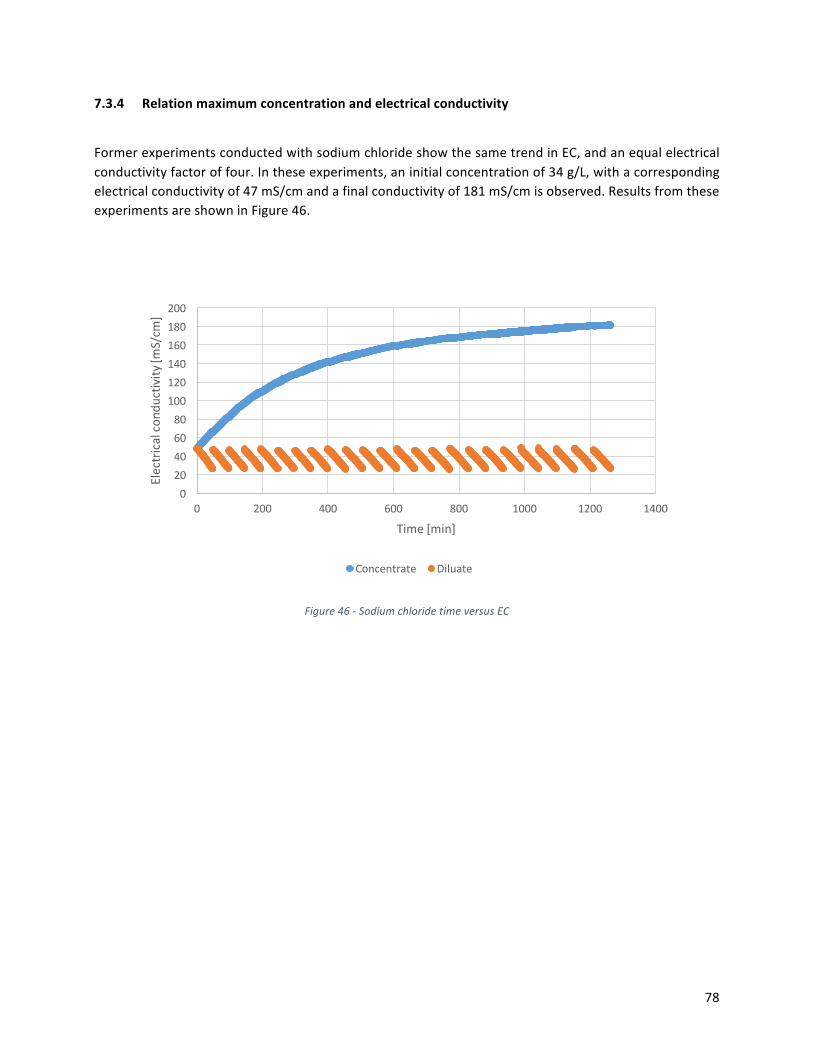
78
7.3.4 Relationmaximumconcentrationandelectricalconductivity
FormerexperimentsconductedwithsodiumchlorideshowthesametrendinEC,andanequalelectricalconductivityfactoroffour.Intheseexperiments,aninitialconcentrationof34g/L,withacorrespondingelectricalconductivityof47mS/cmandafinalconductivityof181mS/cmisobserved.ResultsfromtheseexperimentsareshowninFigure46.
Figure46-SodiumchloridetimeversusEC
020406080
100120140160180200
0 200 400 600 800 1000 1200 1400
Electricalco
nductivity
[mS/cm
]
Time[min]
Concentrate Diluate

79
7.4 Data
7.4.1 Watertransport
Run ECConc ECDil DeltaEC Watertransfer
[mS/cm] [mS/cm] [mS/cm] [L]
1 13.99 .93 13.06 .04
2 18.29 0.83 17.47 0.038
3 21.70 0.97 20.73 0.045
4 24.40 0.99 23.41 0.057
5 26.50 1.04 25.46 0.068
6 28.20 0.98 27.22 0.064
7 29.40 0.82 28.58 0.086
8 30.40 1.00 29.40 0.088
9 30.90 1.00 29.90 0.096
10 31.50 0.99 30.51 0.12
11 31.70 0.24 31.46 0.12
12 31.80 1.00 30.80 0.103
13 31.90 0.96 30.94 0.11
14 32.10 0.99 31.11 0.118
15 32.30 1.02 31.28 0.125
16 32.70 1.01 31.69 0.123
17 32.80 1.01 31.79 0.125
18 32.70 0.80 31.91 0.136
19 32.90 1.00 31.90 0.136
20 32.80 0.99 31.82 0.138

80
7.4.2 Volumeratiotests
VR 1 0.65 0.5 0.33 0.25 0.20Energyefficiency[Wh-1]
1.86 2.01 2.23 2.63 2.86 2.94
NH4+mig.Per
energy[mg/Wh]
1.48 1.27 1.33 1.36 1.24 1.20
Volumetreated/energy[L/Wh]
2.36 2.12 2.11 2.10 1.98 1.79
Table9–Testresultsfordifferentvolumeratio,oneliterdiluateandSTM
VR 1 0.5 0.33 0.1Energyefficiency[Wh-1]
0.90 1.26 1.43 1.95
NH4+mig.Per
energy[mg/Wh]
1.56 1.63 1.55 1.29
Volumetreated/energy[L/Wh]
2.23 1.63 1.37 0.95
Table10–Testresultsfordifferentvolumeratios,twoliterdiluateandSTM
VR 1 0.5 0.25 0.05Energyefficiency[Wh-1]
1.11 1.47 1.81 2.69
NH4+mig.Per
energy[mg/Wh]
1.92 2.00 1.78 1.50
Volumetreated/energy[L/Wh]
2.79 1.99 1.51 1.11
Table11–Testresultsfordifferentvolumeratios,twoliterdiluateandMVM
Related Documents