Integration of Combined Heat and Power Generators into Small Buildings A Transient Analysis Approach by Adrian Bryan DeBruyn A thesis presented to the University of Waterloo in fulfillment of the thesis requirement for the degree of Master of Applied Science in Mechanical Engineering Waterloo, Ontario, Canada, 2006 © Adrian Bryan DeBruyn 2006

Welcome message from author
This document is posted to help you gain knowledge. Please leave a comment to let me know what you think about it! Share it to your friends and learn new things together.
Transcript
Integration of Combined Heat and Power Generators into Small Buildings
A Transient Analysis Approach
by
Adrian Bryan DeBruyn
A thesis
presented to the University of Waterloo
in fulfillment of the
thesis requirement for the degree of
Master of Applied Science
in
Mechanical Engineering
Waterloo, Ontario, Canada, 2006
© Adrian Bryan DeBruyn 2006

ii
I hereby declare that I am the sole author of this thesis. This is a true copy of the thesis, including any
required final revisions, as accepted by my examiners.
I understand that my thesis may be made electronically available to the public.
iii
Abstract
Small combined heat and power generators have the potential to reduce energy consumption and greenhouse gas emissions of residential buildings. Recently, much attention has been given to these units. To date, the majority of studies in this field have concentrated on the steady operational performance of a specific generator type, and the available computer models have largely been theoretical in nature.
The main goal of this study was to evaluate the performance of the latest combined heat and power generators, when integrated into Canadian residential homes. A fair comparison of four 1 kW (electrical) units was made. The combined heat and power units studied were based on PEM fuel cell, solid oxide fuel cell, Stirling Engine, and internal combustion engine energy converters.
This study utilized recent test data in an attempt to evaluate the most efficient method of integrating the combined heat and power units into residential houses. Start-up, shut down, and load change transients were incorporated into the simulations. The impact of load variations due to building thermal envelope differences and varying building heating system equipment was evaluated. The simulations were evaluated using TRNSYS software. The building heat demands were determined with eQuest hourly building simulation software.
All of the combined heat and power units under study were capable of providing a net annual benefit with respect to global energy and greenhouse gas emissions. The fuel cells offer the highest integrated performance, followed closely by the internal combustion engine and lastly the Stirling engine. Annual global energy savings up to 20%, and greenhouse gas savings up to 5.5 tonnes per year can be achieved compared to the best conventional high efficiency appliances.
Heat demand influences performance greatly. As the thermal output of the generator unit approaches half of the average building thermal demand, the system design becomes critical. The system design is also critical when integrating with a forced air furnace. Only the PEM fuel cell unit produces clear global energy and emissions benefits when operating in the summertime.

iv
Acknowledgements
I would like to thank Dr. Xianguo Li for supporting me throughout this research and giving me the latitude to pursue this avenue of work. A special thanks to Jeff Baschuk and Jaewan Park for guidance and advice in the calculus and simulation world.
Lastly, but most importantly I would like to thank my wife Daniela for her encouragement, support, and for not abandoning me while I was in hiding during the production of this thesis.
v
Table of Contents
Abstract ............................................................................................................................................... iii
Acknowledgements .............................................................................................................................. iv
Table of Contents.................................................................................................................................. v
List of Figures ....................................................................................................................................viii
List of Tables......................................................................................................................................... x
Chapter 1 Introduction ....................................................................................................................... 1
1.1.1 Benefits of Combined Heat and Power................................................................................... 2
1.1.2 Disadvantages of Combined Heat and Power......................................................................... 2
1.1.3 Factors for Success of Micro-Combined Heat and Power in Small Buildings ....................... 3
1.1.4 Potential Issues with installed Micro-Combined Heat and Power.......................................... 3
1.1.5 Net Emissions ......................................................................................................................... 4
1.2 Purpose and Goal of Research ...................................................................................................... 5
1.3 Scope of Work............................................................................................................................... 6
1.4 Approach to Research ................................................................................................................... 7
Chapter 2 Literature Review.............................................................................................................. 8
2.1 Summary ....................................................................................................................................... 8
2.2 Building Integrated Micro-Combined Heat and Power Modelling............................................... 8
2.3 Field Trials .................................................................................................................................. 10
2.3.1 Solid Oxide Fuel Cell Micro-Combined Heat and Power Units .............................................. 10
2.3.2 Polymer Electrolyte Membrane Fuel Cell Micro-Combined Heat and Power Units ............... 11
2.3.3 Stirling Engine Micro-Combined Heat and Power Units......................................................... 11
2.3.4 Internal Combustion Engine Micro-Combined Heat and Power Units.................................... 11
Chapter 3 Building Load Simulation............................................................................................... 12
3.1 Building Model Descriptions ...................................................................................................... 12
3.1.1 Mid-Efficiency Residential Building .................................................................................... 13
3.1.2 High-Efficiency Residential Building................................................................................... 13
3.1.3 Low-Efficiency Residential Building ................................................................................... 14
3.2 Results for Building Simulation.................................................................................................. 15
vi
Chapter 4 Micro-Combined Heat and Power Models ................................................................... 16
4.1 MCHP Model – General Characteristics..................................................................................... 16
4.2 Solid Oxide Fuel Cell MCHP Model .......................................................................................... 19
4.2.1 Resulting SOFC Model Behaviour ....................................................................................... 21
4.3 Polymer Electrolyte Membrane Fuel Cell MCHP Model ........................................................... 24
4.3.1 Thermal Behaviour of PEMFC Model.................................................................................. 27
4.3.2 PEMFC Control strategy....................................................................................................... 28
4.3.3 Resulting PEMFC Model Behaviour .................................................................................... 28
4.4 Stirling Engine MCHP Model..................................................................................................... 32
4.4.1 Heat Recovery Behaviour of the Stirling Engine.................................................................. 34
4.4.2 Stirling Engine Control Strategy........................................................................................... 35
4.4.3 Resulting Stirling Engine Model Behaviour......................................................................... 35
4.5 Internal Combustion Engine MCHP Model................................................................................ 38
4.5.1 IC MCHP Engine Specifications: ......................................................................................... 40
4.5.2 Heat Recovery Behaviour of the IC Engine.......................................................................... 41
4.5.3 Control Strategy for IC Engine MCHP Units ....................................................................... 41
4.5.4 Resulting Internal Combustion Engine Model Behaviour .................................................... 42
Chapter 5 Conventional Heating Systems and Equipment ........................................................... 45
5.1 Forced Air Furnace ..................................................................................................................... 45
5.2 In-Floor Heating.......................................................................................................................... 46
5.3 Hydronic Radiator ....................................................................................................................... 49
5.4 Water Heater - On Demand Boiler Style .................................................................................... 51
5.5 Water Heater - Tank Style........................................................................................................... 53
5.6 Pumps.......................................................................................................................................... 54
5.7 General Notes and Requirements................................................................................................ 54
5.8 Simulation Results of Conventional HVAC Equipment............................................................. 55
Chapter 6 Integrating MCHP – Sizing and General Design Considerations............................... 57
6.1 MCHP Capacity and Building Demand ...................................................................................... 57
6.2 Effect of Run Time on MCHP Efficiency................................................................................... 58
6.3 Sizing of Thermal Storage Tank ................................................................................................. 60
vii
Chapter 7 Basic Integration of MCHP Units into Residential Buildings ..................................... 61
7.1 Solid Oxide Fuel Cell Basic Integration ..................................................................................... 61
7.1.1 SOFC / Forced Air Furnace .................................................................................................. 62
7.1.2 SOFC / Floor Heat and Hydronic Radiators Cases............................................................... 64
7.1.3 SOFC Basic Integration Results – Annual Analysis............................................................. 67
7.2 Polymer Electrolyte Membrane Fuel Cell Basic Integration ...................................................... 69
7.2.1 PEM Fuel Cell / Forced Air Basic Integration...................................................................... 69
7.2.2 In-Floor Heat & Hydronic Radiators .................................................................................... 71
7.2.3 PEMFC Basic Integration Results ........................................................................................ 73
7.3 Stirling Engine Basic Integration ................................................................................................ 75
7.3.1 Stirling Engine / Forced Air Furnace.................................................................................... 75
7.3.2 Stirling Engine / Floor Heat and Hydronic Radiators Cases................................................. 77
7.3.3 Stirling Engine Basic Integration Results – Annual Analysis .............................................. 79
7.4 Internal Combustion Engine Basic Integration ........................................................................... 81
7.4.1 Internal Combustion Engine Basic Integration Results ........................................................ 81
7.5 Summertime MCHP Performance – Basic Integration Case ...................................................... 83
Chapter 8 Advanced Integration of MCHP Units into Residential Buildings ............................. 84
8.1 PEM Fuel Cell MCHP Advanced Integration............................................................................. 84
8.2 Solid Oxide Fuel Cell MCHP Advanced Integration.................................................................. 88
8.3 Stirling Engine MCHP Advanced Integration ............................................................................ 90
8.4 Internal Combustion Engine MCHP Advanced Integration........................................................ 93
8.5 Results Summary ........................................................................................................................ 95
8.5.1 Summertime Operation......................................................................................................... 95
8.5.2 Comparison of MCHP units to Published Performance Information ................................... 96
8.5.3 Benefits Summary................................................................................................................. 97
8.5.4 Effect of Climate (Load) on MCHP Performance ................................................................ 98
Chapter 9 Conclusions ..................................................................................................................... 100
9.1 Recommendations for Further work............................................................................................. 101

viii
Appendix A Canadian Centre for Housing Technology Occupant Energy Usage Schedule ......... 102
Appendix B R2000 Building Report .............................................................................................. 105
Appendix C Error and Accuracy Discussion.................................................................................. 112
Appendix D Simulation Environment Overview ........................................................................... 114
ix
List of Figures
Figure 4-1 Generalized MCHP Model Energy Flowchart .............................................................. 16
Figure 4-2 Test Inputs to the Solid Oxide Fuel Cell Model – Cooling Water Outlet Temperature Maintained at 70ºC................................................................................... 22
Figure 4-3 Resulting Solid Oxide Fuel Cell Efficiencies - Cooling Water Outlet Temperature Maintained at 70ºC................................................................................... 22
Figure 4-4 Resulting Solid Oxide Fuel Cell Energy Flows - Cooling Water Outlet Temperature Maintained at 70ºC................................................................................... 23
Figure 4-5 Step Input to the PEM Fuel Cell Model - Cooling Water Outlet Temperature Maintained at 70ºC................................................................................... 29
Figure 4-6 Resulting PEMFC Transient Energy Flows - Cooling Water Outlet Temperature Maintained at 70ºC................................................................................... 30
Figure 4-7 Resulting PEMFC Efficiencies – Cooling Water Outlet Temperature Maintained at 70ºC................................................................................... 31
Figure 4-8 Resulting PEMFC Heat to Room and Cooling Water Flowrate – Cooling Water Outlet Temperature Maintained at 70ºC ............................................... 31
Figure 4-9 Step Input to the Stirling Engine Model – Cooling Water Flowrate at 20 Litres/min ................................................................................................................. 36
Figure 4-10 Resulting Stirling Engine Efficiencies........................................................................... 36
Figure 4-11 Resulting Stirling Engine Energy Flows ....................................................................... 37
Figure 4-12 Step Input to the Internal Combustion Model – Cooling Water Flowrate at 6 litres/min ................................................................................................................. 43
Figure 4-13 Resulting Internal Combustion Engine Efficiencies...................................................... 43
Figure 4-14 Resulting Internal Combustion Engine Energy Flows .................................................. 44
Figure 5-1 Conventional In-Floor Heating System......................................................................... 48
Figure 5-2 Conventional Hydronic Radiator Heating System ........................................................ 49
Figure 5-3 Baseboard Heat Output vs. Inlet Water Temperature (1m long radiator)...................... 50
Figure 5-4 Viessmann Vitodens 200 Boiler Efficiency .................................................................. 51
Figure 6-1 Cumulative Efficiency With Respect to Length of Run Time – Cooling Water Inlet 40ºC, Outlet 50ºC ......................................................................... 58
Figure 6-2 Total On/Off Efficiency vs. Run Time (Including Cool Down Heat Recovery) Cooling Water Inlet 40ºC, Outlet 50ºC ......................................................................... 59
x
Figure 7-1 SOFC / Forced Air Basic Integration Case “A” ............................................................ 63
Figure 7-2 SOFC / In-Floor and Hydronic Radiator Heating Case A............................................. 65
Figure 7-3 SOFC / In-Floor and Hydronic Radiator Heating Case B and C................................... 66
Figure 7-4 PEM Fuel Cell / Forced Air Basic Integration .............................................................. 70
Figure 7-5 In-Floor Heat & Hydronic Radiators / PEM Integration Case A .................................. 71
Figure 7-6 In-Floor Heat & Hydronic Radiators / PEM Integration Cases B and C....................... 72
Figure 7-7 Stirling and IC Engine Basic Forced Air Integration .................................................... 76
Figure 7-8 Stirling / IC Engine In-Floor and Hydronic Radiator Heating Cases ............................ 78
Figure 8-1 Case E – Dual Tank Design........................................................................................... 85
Figure 8-2 Case F – Advanced Dual Tank Design.......................................................................... 86
Figure 8-3 Typical MCHP Efficiency vs. Outdoor Temperature: Advanced Integration (Excluding Ambient Skin Loss) .................................................................................... 98
Figure 8-4 Typical MCHP Efficiency vs. Outdoor Temperature: Advanced Integration (Including Skin Loss) .................................................................................................... 99
xi
List of Tables
Table 3-1 Building Heating Requirements – Comparison of Hot2000 & eQuest Results ................ 15
Table 3-2 Maximum Building Heating Demand............................................................................... 15
Table 4-1 Test Results of PEMFC Combined Heat and Power Units by the JIA ............................. 25
Table 4-2 PEMFC MCHP Generalized Transient Behaviour ........................................................... 26
Table 4-3 MCHP Systems with Stirling Engines.............................................................................. 32
Table 4-4 Stirling Engine Transient Behaviour ................................................................................ 33
Table 4-5 Performance Data for Various Internal Combustion Engine MCHP Units ...................... 39
Table 4-6 IC MCHP Engine Performance Specifications................................................................. 40
Table 5-1 Performance of Armstrong Air Variable Output Furnace ................................................ 45
Table 5-2 Performance of LENNOX Merit 92 Series Single Speed Furnace ................................... 46
Table 5-3 Conventional HVAC Equipment Simulation Results ....................................................... 55
Table 6-1 Make up heat Demand - Dependant on Load Case........................................................... 57
Table 6-2 Thermal Energy Storage with respect to Cumulative Efficiency [HHV] ......................... 60
Table 7-1 SOFC MCHP unit Basic Integration Results.................................................................... 68
Table 7-2 Results PEMFC Basic Integration .................................................................................... 74
Table 7-3 Stirling Engine MCHP Basic Integration Results............................................................. 80
Table 7-4 IC Engine MCHP Basic Integration Results..................................................................... 82
Table 7-5 Summertime MCHP Performance – Basic Integration..................................................... 83
Table 8-1 PEM Fuel Cell Advanced Design Evolution Improvements ............................................ 87
Table 8-2 PEM Fuel Cell Advanced Integration Performance Results (Case F) .............................. 87
Table 8-3 SOFC Fuel Cell Advanced Design Evolution Improvements .......................................... 89
Table 8-4 Solid Oxide Fuel Cell Advanced Integration Performance Results (Case F) ................... 89
Table 8-5 Stirling Engine Advanced Design Evolution Improvements ............................................ 91
Table 8-6 Stirling Engine Advanced Integration Performance Results (Case F).............................. 92
Table 8-7 Internal Combustion Engine Advanced Design Evolution Improvements ....................... 94
Table 8-8 Stirling Engine Advanced Integration Performance Results (Case F).............................. 94
Table 8-9 Summertime MCHP Performance – Advanced Integration ............................................. 95
Table 8-10 Comparison of Manufacturers Specified Performance to Simulation Results.................. 96
Table 8-11 Comparison of MCHP Benefits ........................................................................................ 97

1
Chapter 1 Introduction
Increased demand, limited resources, and the negative environmental impacts of mankind’s exploitation of energy has emphasized the need for us to utilize our finite resources wisely.
While simple conservation is the best strategy to reduce energy use and emissions, ultimately our buildings need to be heated and cooled, and our vehicles and equipment powered. Achieving this task in the most efficient, cost effective, and least polluting manner is the common goal of government, industry, and end users.
Distributed electricity generation combined with by-product heat utilization is a fast growing strategy to increase efficiency and reduce overall emissions. This is typically referred to as combined heat and power (CHP). These CHP systems range in size from large units designed to electrify and heat an entire town, to small units that can service a single home.
In addition to the ability to utilize the by-product heat, distributed CHP generation also creates the advantage of lower transmission losses and increased energy security from natural disasters, over consumption, and even terrorist acts. Disadvantages include lower electrical generating efficiency, reliance on refined fuel, maintenance, and emissions concerns. These points are discussed in detail in the following sections.
The fastest growing application area is in the use of medium sized CHP units designed to provide electricity, heating, cooling, and process heat. Large industrial plants, universities, hospitals, and office buildings have successfully implemented these types of generators. This technology is maturing and typically utilizes natural gas microturbines integrated with adsorption / desiccant coolers to take advantage of by-product heat in warm seasons.
The new frontier of CHP is in the residential and small building sector. Many manufacturers are developing micro-CHP (MCHP) units or have initial product offerings. These small-scale power plants typically range in size from 1 to 10 kW electricity and 1 to 20 kW recovered heat. These generators utilize an internal combustion engine, Stirling cycle engine, or fuel cell as the energy conversion method. Combined heat and power units are taking hold in Europe and Japan where a number of pilot projects are being undertaken, and market ready products are being sold.
2
1.1.1 Benefits of Combined Heat and Power
When the electrical generation is moved from the large centralized plant close to the user, the ability to utilize the by-product heat becomes viable. In the case of energy distribution in the USA, the average electrical efficiency delivered to the user is 33.1% High Heating Value (HHV) depending on location[1] (9% of electricity produced is lost in transmission lines). Comparatively, natural gas is delivered to the user at 80.3% HHV [1] (3% lost in delivery). Therefore, a substantial energy savings is conceivable when electricity is generated on site, provided a substantial portion of the by-product heat could be utilized.
For example, Ebara-Ballard [2] reported the steady state electrical efficiency for an fuel cell CHP unit operating on natural gas to be 31% HHV. For this CHP unit, there would be a net increase in fuel usage (and carbon dioxide emissions) on a global scale if the generator only provided electricity to the user. However, 52% of the fuel energy was also collected in the form of heat, bringing the overall energy efficiency up to 83%. Once the delivery efficiency of natural gas was incorporated, the global efficiency became 67%.
Comparing 1kWh electricity usage and the corresponding 1.7 kWh thermal energy recovered by the CHP unit to the conventional practice of grid provided electricity and a natural gas furnace at 92% efficiency HHV, it can be determined that the CHP scheme requires 4.0 kWh of energy (67% HHV efficiency), and the conventional technology requires 5.2 kWh of energy (48% HHV efficiency) to provide the same service. Thus, a substantial overall global energy savings of 23% is conceivable.
An additional benefit of CHP is that energy security is increased since reliance on large generating facilities and vulnerable electricity transmission lines is reduced. This benefit means that events such as severe weather, over demand, and terrorism will have a reduced impact on society provided the fuel sources for the CHP generators remain intact.
1.1.2 Disadvantages of Combined Heat and Power
There are disadvantages to distributed generation with combined heat and power integration. Due to their relative small size, it is important to note that in general CHP units will operate at a lower electrical generating efficiency than large central power stations. However, if the by-product heat can be effectively used, then the overall efficiency or fuel utilization can be much higher than that of a central power plant designed to deliver only electricity. This implies that a portion of the by-product heat must be used to provide a net emissions advantage.

3
Another disadvantage is the reliance on availability of refined fuel. Large central generating facilities have the ability to convert raw unrefined fuel such as coal or garbage into usable power. Smaller generators require purified fuels such as natural gas or diesel in order to operate cleanly. Wide spread implementation of these smaller generators would increase the demand for these refined fuels, and could create distribution problems, fuel shortages and even fuel price inflation.
Lastly, installation of a MCHP unit into a residence or small building requires complex integration into the electricity and heating systems. A significant amount of additional equipment and cost would be required to substitute conventional HVAC equipment with a MCHP system.
1.1.3 Factors for Success of Micro-Combined Heat and Power in Small Buildings
The benefits of MCHP rely on the equipment to perform within a certain tolerance of the stated values for efficiency and emissions. One large danger is that wear, improper maintenance, and inefficient installation/control may cause the MCHP unit to use more net energy, and emit higher levels of pollution than if the system was not installed at all.
It is well known that HVAC maintenance is poorly performed or non-existent in a large proportion of residences and small business. Typically, a reactive approach to maintenance is taken, meaning that the equipment is only considered if the unit stops functioning. This approach will not work if the environmental benefits of MCHP are to be realized. A mechanism to ensure regular maintenance and periodical emissions tests needs to be in place, and enforced, similar to standards currently being required of automobiles in many regions.
1.1.4 Potential Issues with installed Micro-Combined Heat and Power
Fuel Storage - If the MCHP unit uses liquid fuels, there is a large risk for spillage, and environmental damage. As stated before, a large percentage of building owners historically do not perform regular maintenance or inspection. A reactive approach to fuel storage leaks cannot be acceptable. Proactive spill prevention and proper disposal mechanisms would be necessary for success.
Frequency of service interruptions - The electricity grid and current HVAC technology provide extremely reliable service. As far as the end user is concerned, CHP equipment is much more complex, and therefore could be prone to higher instances and duration of service interruptions. If a building designed with a MCHP generator is not connected to the electricity grid, the user relies completely on the fuel source. If the fuel source becomes unavailable due to construction, natural disasters, over-consumption, etc. the building will lose both heat and electricity. However, this risk is
4
not much different from current practices since most HVAC systems require both electricity and fuel to function.
Noise - If internal combustion engines are used for CHP, there is a potential for noise pollution to become a prevalent issue. Currently there are regional laws preventing the use of personal generators in some residential areas.
1.1.5 Net Emissions
The emissions from the MCHP unit should be less than the equivalent net emissions from the standard technology that is widely used. This requirement is complicated by the fact that different MCHP generators emit different types of pollution. A further complication is the varying amounts of energy and emissions required to produce the materials needed for the different MCHP generators. Basically a complete life-cycle analysis of the technology is required to make informed decisions on the emission savings potential of a specific MCHP system.
Many software packages and spreadsheets are available to help determine the life-cycle energy consumption, cost of ownership, and environmental impact of the product in question. This is an evolving field in which various methods and standards are developing.
One method of determining the path of least impact would be to adopt the “GREET” system developed by Argonne National Laboratories for assessing vehicle and fuel technology [3]. GREET tracks all the energy consumption and number of pollutants generated over the entire life of the product - from the raw material, through manufacturing, usage, and final recycling or disposal.
The European CHP community uses a slightly different strategy. Monetary values are attached to a number of key pollutants on a per mass basis. The cost to society is calculated and can be compared for new and old technologies, over the entire life of the products [4].
Overall, when making the decision on CHP usage from an environmental perspective, engineering judgment will have to be used to decide if a decrease in a certain emissions justifies increases in others. Like any technology shift, care must be taken to avoid solving one problem by creating new ones.
5
1.2 Purpose and Goal of Research
The purpose of this study was to evaluate the performance of current MCHP technology in the residential housing application. A fair comparison between the competing technologies under identical loading conditions needed to be made. The effects of on/off transients, type of home heating system, and varying building loads were determined.
The main objective of this work was to determine how to effectively integrate the various types of MCHP generators into a residential building. The goal was to maximize performance to ensure that the benefits of MCHP systems will be achieved in practice. Basically, this research was not trying to prove if CHP is viable. Instead, it was attempting to determine how MCHP should be integrated into the building if the decision was already made, and what the expected performance would be.
Why is this valuable? Economic and emissions models typically assume a percentage of recoverable heat will be used, or they perform a rudimentary model estimate of heat utilization with little or no compensation for transient behaviour. More in-depth knowledge of the heat utilization behaviour (and potential) will improve the accuracy of these decision-making models.
Assuming that interest in MCHP continues, researchers and contractors will need heat utilization behaviour information under varying loads and HVAC configurations. From this information it can be estimated which configurations yield the best cost versus benefit ratio. Ideally, the information in this thesis would act as a guide for designing and installing MCHP units into existing and new buildings.

6
1.3 Scope of Work
Four micro-combined heat and power generators were investigated.
Polymer Exchange Membrane Fuel Cell (PEMFC)
Solid Oxide Fuel Cell (SOFC)
Stirling Cycle Engine
Internal Combustion Engine
Models based on performance data were generated for each type of MCHP unit. For each unit, the electrical capacity was 1kW, and heat demand was the control strategy. It was assumed that the building was connected to the electrical grid, and that excess electricity can be sold back to the grid at 100% efficiency. It is also assumed that any electricity sold back to the grid will displace an equivalent amount of grid produced electricity.
Three Heating types were considered:
Forced air furnaces - This is the most common method of heating small buildings in Canada. The furnace creates warm air that is distributed throughout the building via a system of ducts.
Radiant floor heat – A fast growing, and efficient method of heating energy efficient buildings. In this heating scheme warm water is circulated through tubes installed in the floor of the building.
Hydronic (hot water) radiators – A classical approach to heating using hot water circulated to finned heat exchangers located throughout the building. This is a similar method to radiant floor heating, but is much less expensive and requires higher process water temperatures.
In order to determine the effect of load variance on the integrated MCHP system, representative heat and hot water demand profiles were generated for the following six load cases:
Old house, Typical House, and Efficient House with constant temperature set point
Old house, Typical House, and Efficient House with temperature setback
Hot water and electrical demand was based on occupancy of 2 adults and 2 children and was constant for each load profile.

7
1.4 Approach to Research
The approach taken to perform this study was as follows:
First the state of art knowledge of micro-combined heat and power was investigated in order to determine the deficiencies in the field.
Second, realistic performance and operational behaviour was determined from field tests. Models were generated based on this data to be incorporated into the simulations.
Third, the buildings were simulated to generate the heating demand load profiles required.
Fourth, using the simulation software, the conventional HVAC systems were simulated to act as a baseline.
Fifth, using the simulation software, the four MCHP systems were integrated into the building in a basic manner using the standard hot water tank and equipment.
Sixth, it was determined where the greatest heat loss and exergy destruction occurred, the balance of plant was redesigned for the highest efficiency.
Lastly, the results were presented in a logical manner and conclusions drawn.

8
Chapter 2 Literature Review
2.1 Summary
The published research to date on micro-combined heat and power (MCHP) contains 4 main aspects of study: economic feasibility, overall emissions estimation, detailed generator modelling, and field trial experiments. Historically these studies were examined on an individual basis, and the authors typically generated their own algorithms to perform simple simulations. Recent improvements in computers and simulation software have allowed the complete integration of these aspects into all encompassing programs such as TRNSYS [5]and ESP-r [6].
Even with the advancement in integrated simulation, the published studies of MCHP continue to include major simplifying assumptions such as constant efficiencies, and no start up transients. Also, the majority of the MCHP models used in the studies were based on theory, not on real product performance. A research opportunity exists since a number of new models based on actual MCHP engines including transient behaviour are currently being developed.
No study was found that compared the different types of MCHP generators when installed in the same application, or attempted to optimize the heat delivery system dependant on the type of HVAC system available.
2.2 Building Integrated Micro-Combined Heat and Power Modelling
There are two types of existing models. The first and most common type is designed to be a screening tool. These models allow the user to perform a simple analysis of the economic and environmental implications for the specific MCHP application. RETScreen [7] from the Canadian Housing and Mortgage Corporation (CHMC) is a good example this type of simulation software. Others include the Building Combined Heat and Power (BCHP) Screening Tool available from Oak Ridge National Laboratories [8], and CHP Sizer Tool available from Action Energy [9]. These are good tools to be used as intended, which is for evaluating whether or not CHP is viable. They are not sufficient to perform the detailed analysis required in this research.
9
The second group of models allows a complete integrated CHP system to be simulated in detail. Building models, weather data, heat exchangers and all manner of heating ventilation and cooling (HVAC) equipment are included as objects inside of these programs. Basically these models have been developed to simulate transient behaviour in order to perform optimization studies. TRNSYS from the University of Wisconsin Madison [5], ESP-r/Hot 3000 from the University of Strathclyde [6] and CANMET [10] respectively, and GateCycle from GE Energy [11] are examples of this type of software.
TRNSYS was used by Dash [12] to integrate an entire PEM CHP model into a residence. This simulation was done under electric demand and utilized electric resistance heat for make up energy. This paper was a moderately detailed feasibility study of the economics and energy consumption of a PEM CHP. Unfortunately, the model was based on fuel cell theory, and operation on electrical demand is not realistic for residential fuel cells, as will be discussed in further sections.
TRNSYS was also used by Dorer [13] to model both SOFC and PEM fuel cells combined with solar collectors that were integrated into multi-residence buildings. Thermal demand was the control strategy, and both hot water radiators and radiant floor heat were considered. For the fuel cell models, instantaneous power output change capability was assumed, and no dynamic effects were considered. This paper was primarily an emissions savings investigation. Results on the effect of tank size were discussed. However, no in-depth optimization of the heat delivery system was investigated.
A number of applicable papers are available from CANMET utilizing the ESP-r software for MCHP analysis:
Beausoleil-Morrison [14] simulates a SOFC CHP system in a residential building. The purpose of the paper was to describe the SOFC model. It was clearly stated that the integration of the CHP system with the building was not optimized, only demonstrated.
Kelly [15] also modelled a SOFC with a residence. The purpose of this study was to develop the control strategy for electrical / thermal loading of the fuel cell. Ferguson [16] compared two different fuel cell CHP systems (PEM and SOFC) and how they performed in the ESP-r model.
Ferguson [17] also developed a parametric PEMFC fuel cell model for ESP-r, and performed a basic integration with a building using a hot water tank and a water to air heat exchanger. The PEMFC was operated under electrical demand.
CANMET was contacted regarding the use of these published models, and advised not to use the models since they were out of date and not representative of current technology [18]. CANMET indicated that a new set of CHP models based on test data were being developed by an international effort coordinated by the International Energy Agency (IEA).
10
The IEA Energy Conservation in Buildings and Community Systems Program (ECBCS) Annex 42 is an international research project focusing on the modelling of cogeneration technologies in the building environment. At present, the project is not completed, however a number of models and papers were available:
Vetter [19] performed a detailed analysis of the control strategy for a natural gas PEM fuel cell integrated with a solar thermal collector, and a typical German house. This PEMFC model was based on a laboratory fuel cell set-up.
Ferguson [20] created a Stirling engine model for building integration based on test data. This model was a simplified lumped capacitance ESP-r model based on curve fits to a production Stirling engine. Unfortunately, this model was based on an obsolete Stirling engine. The work in this study was based on Ferguson’s model, updated to current performance and operational behaviour.
2.3 Field Trials
This study was primarily interested in the performance of production (or near to production) MCHP units. Therefore, data of actual field-tested MCHP generators was required. A number of micro-CHP field trials have been published for each type of MCHP generator.
A comprehensive report on the current state of MCHP technology, including all of the available products (except for the internal combustion group) was generated by Knight [21] as part of the IEA/ECBCA Annex 42 work. Steady state performance and emissions information is included for most products. However, no transient or operational details were given.
2.3.1 Solid Oxide Fuel Cell Micro-Combined Heat and Power Units
Jalalzadah [22] published a report on the first residential test in Canada of a solid oxide fuel cell MCHP unit. The cell was a 5kW second-generation solid oxide fuel cell manufactured by Fuel Cell Technologies Inc. in Kingston. Unfortunately, the AC power out from the unit was only at an efficiency of 22.4% HHV due to the partial load operation. The thermal output of the unit was also relatively constant at 2 kW at an efficiency of 25% HHV. No transient information was available since the cell must operate continuously.
van den Oosterkamp [23] published test data of the Hexis AG Galileo unit (formally Sulzer Hexis HXS 1000 Premiere) planar SOFC rated at 1kW. Available data (which is dated 2003) places the electrical efficiency at 23-29% HHV and thermal efficiency of 46-55% HHV at rated load. It was
11
noted in this report the cell performance deteriorated much faster if the load changed frequently. It was recommended that the cell operate at one constant level.
2.3.2 Polymer Electrolyte Membrane Fuel Cell Micro-Combined Heat and Power Units
Boettner [24] published paper outlining the problems encountered with the installation of a PEMFC CHP unit. This unit had very low performance – 4% HHV heat recovery.
Do Val [25] reported on the performance of a 4kW PEM fuel cell unit installed in Brazil. This study only outlined the steady state performance of the unit.
Inaka [26] published report a 1kW PEM CHP system operating on natural gas. This report gave excellent insight into the operation and control of the heat recovery system.
The Japan Gas Appliances Inspection Association (JIA) [27] published a report on the testing of 19 units made from 9 different manufacturers. This is a very detailed report including start up behaviour, heat recovery, and part load performance of each unit tested. The data from this report was used for the PEMFC CHP generator in this study.
2.3.3 Stirling Engine Micro-Combined Heat and Power Units
Bell [28] published report on the integration of an early model Stirling engine CHP system into the CMHC test house. This paper calls for more optimization of the heat recovery system.
Niesmart [29] Published annual performance data from field trials of two small Stirling engines installed in separate residences. The results indicated that on annual basis, the average electrical efficiency was reported at 9% HHV. The data from this report was used as part of the Stirling Engine model in this study. WhisperTech, the manufacturer of the Stirling engine discussed by Bell and Niesmart, was also contacted and provided current operational and performance data.
2.3.4 Internal Combustion Engine Micro-Combined Heat and Power Units
Voorspools [30] reported on an internal combustion MCHP installation. Detailed start-up transient behaviour of the electrical, fuel and heat recovery aspects were presented. This CHP system was integrated into a multi-family dwelling.
12
Chapter 3 Building Load Simulation
3.1 Building Model Descriptions
The building energy usage was characterized for three different residential type buildings: A mid-efficiency residential building typical of recent construction to minimum building code, a high-efficiency building exceeding the Canadian R2000 standard by 15%, and a low-efficiency building typical of a pre-1941 home. The simulated occupancy was for two adults plus two children, and the house temperature was to be kept constant at 21°C. Since this study was concerned with the integration of CHP and the building heating system, air conditioning was omitted.
An additional load profile was generated for each of these buildings by setting back the building temperature to a lower value at night and in the daytime during working hours. This is done in many Canadian homes as an energy savings strategy. It was deemed important to this study due to the high heat demand when the temperature is raised at the end of the setback period.
10pm – 6am set back to 17°C 8am – 4pm set back to 17°C
All other times the setpoint is 21°C
eQuest hourly building simulation software [31] was used to generate the building load profile. eQuest was chosen since it is based on the widely accepted and validated DOE-2 Building Simulation Engine.
In the results chapters, the performances of the heat delivery systems are summarized on a monthly basis. Therefore, the performance charts are in essence a function of external temperature (or heat demand) averaged over the period. This means that the regional climate chosen for the simulations is of no consequence, provided that it contains a wide range of temperature and environmental conditions over the year. Representative months can be chosen by the interested reader that best suit the climate of interest. The climate of Ottawa was chosen for the study since it experiences a wide range of temperatures, representative of much of Canada.
The hot water usage, occupant gains, and electricity usage was based on the CCHT Test house program, designed to mimic realistic usage [28]. See Appendix A for details.
13
3.1.1 Mid-Efficiency Residential Building
The average home over the past few decades was built to the building code minimum standards with respect to the thermal envelope [32]. A reasonable estimate is that 1.5 million detached homes (25% of the Canadian building stock) were built to the minimum standard over the past 20 years (extrapolated from Statistics Canada data) [32],[33]. The living space for a typical detached residential building built in this period is 160 m2, not including the basement and garage floor areas. Thus, the mid-efficiency building specifications used for this study based on the building code are as follows:
Two story 160 m2 building with full heated basement Ceiling Insulation RSI 5.1 m2 K/W {Nominal 5.4 RSI}† Wall Insulation RSI 2.4 m2 K/W {Nominal 3.0 RSI}[34] Windows(22 m2 ) RSI 0.3 m2 K/W Exterior Door RSI 0.7 m2 K/W Foundation Insulation RSI 1.41 m2 K/W (To depth of 0.6 m from top of foundation wall) Air Infiltration 4 ACH‡ @ 50 Pa Equivalent leakage area 773 cm2 @ 4 Pa Size of building 160 m2 {1720 ft2}
The air infiltration value for the medium efficiency house was based on measurements taken of over 400 Canadian houses [35].
3.1.2 High-Efficiency Residential Building
The high-efficiency home specifications were based on a residential building designed to exceed the Canadian R2000 building standard [36] by 15% solely by thermal envelope improvements. This was accomplished by using the building code standards for insulation levels as if the building was to be heated by electric resistance heating. Additionally, good windows were specified, and the air tightness requirements of the R2000 standards were met.
Hot 2000 building simulation software, available from the Canadian Ministry of Natural Resources, was used to evaluate the building performance with respect to the R2000 standard. See Appendix B for the R2000 report. The building was designed with typical wood frame construction and an insulated basement.
† Calculated using Hot2000 software ‡ ACH – Air changes per hour. The ratio of the volume of infiltration air to the conditioned space volume
14
The general specifications for the High Efficiency Home were as follows:
Two story 160 m2 building with full height heated basement Ceiling Insulation RSI 7.0 m2 K/W Wall Insulation RSI 4.2 m2 K/ W {Nominal 4.7 RSI}[34]
Windows 22 m2 RSI 0.58 m2 K/W Exterior Door RSI 1.14 m2 K/W Foundation Insulation RSI 3.25 m2 K/W (Full depth from top of foundation wall) Air Infiltration 1.0 ACH @ 50 Pa Equivalent leakage area 290 cm2 @ 4 Pa Size of building 160 m2 {1720 ft2}
Note: Due to the low air infiltration rate, this house required additional mechanical ventilation. A ventilation capacity of 60L per second is required to meet the air quality specifications of R2000. A heat recovery ventilator with an efficiency of 53% was added to the simulation to meet this requirement.
3.1.3 Low-Efficiency Residential Building
Approximately one million or 18% of detached homes in Canada were built prior to 1941 [32]. According to the 1993 Survey of Energy Use [33], most of these buildings have had upgrades to the ceiling insulation, doors and windows. However, the basement typically remains uninsulated, and 49% of the walls remain as built. Thus, the low-efficiency building specifications for this study were as follows:
Two story 160 m2 building with full basement Ceiling Insulation RSI 1.76 m2 K/W Wall Thermal Resistance RSI 0.7 m2 K/W Windows 22 m2 RSI 0.26 m2 K/W Exterior Door RSI 0.7 m2 K/W Foundation Insulation n/a Air Infiltration 9 ACH @ 50 Pa Equivalent leakage area 1739 cm2 @ 4 Pa Size of building 160 m2 {1720 ft2}
The air infiltration value for the low efficiency house was based on measurements taken of over 400 Canadian houses [35].
15
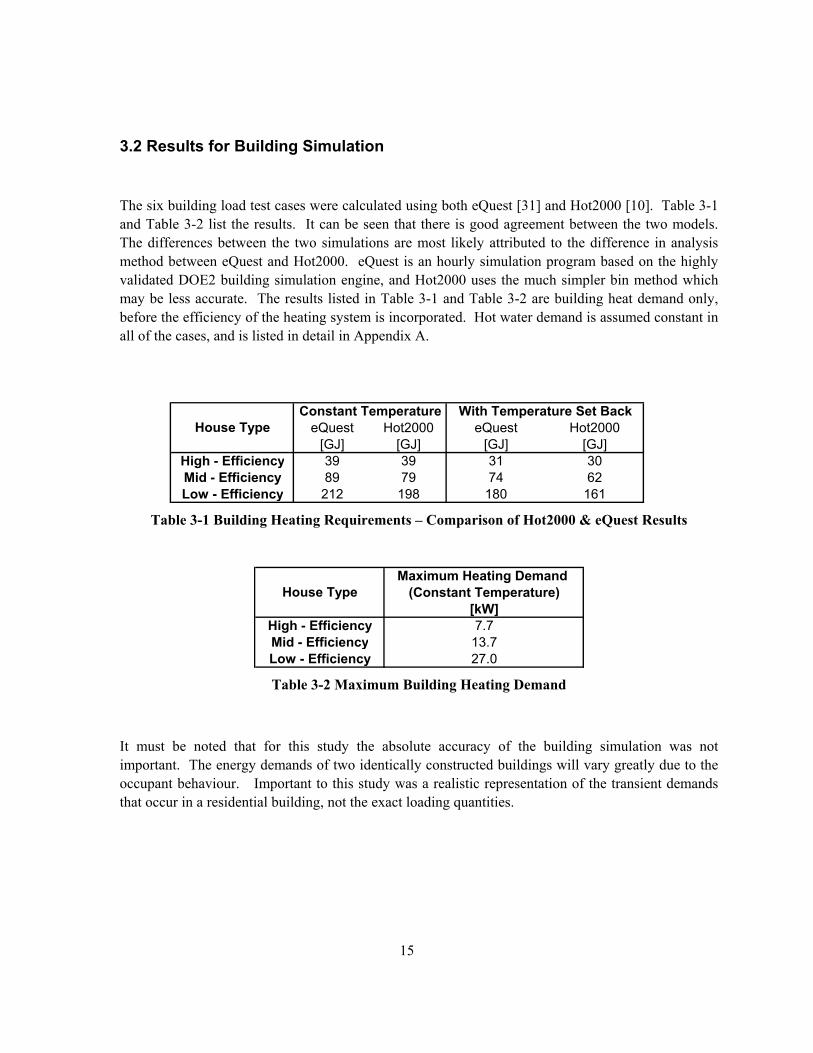
3.2 Results for Building Simulation
The six building load test cases were calculated using both eQuest [31] and Hot2000 [10]. Table 3-1 and Table 3-2 list the results. It can be seen that there is good agreement between the two models. The differences between the two simulations are most likely attributed to the difference in analysis method between eQuest and Hot2000. eQuest is an hourly simulation program based on the highly validated DOE2 building simulation engine, and Hot2000 uses the much simpler bin method which may be less accurate. The results listed in Table 3-1 and Table 3-2 are building heat demand only, before the efficiency of the heating system is incorporated. Hot water demand is assumed constant in all of the cases, and is listed in detail in Appendix A.
Table 3-1 Building Heating Requirements – Comparison of Hot2000 & eQuest Results
Table 3-2 Maximum Building Heating Demand
It must be noted that for this study the absolute accuracy of the building simulation was not important. The energy demands of two identically constructed buildings will vary greatly due to the occupant behaviour. Important to this study was a realistic representation of the transient demands that occur in a residential building, not the exact loading quantities.
eQuest Hot2000 eQuest Hot2000[GJ] [GJ] [GJ] [GJ]
High - Efficiency 39 39 31 30Mid - Efficiency 89 79 74 62Low - Efficiency 212 198 180 161
With Temperature Set BackConstant TemperatureHouse Type
Maximum Heating Demand (Constant Temperature)
[kW]High - Efficiency 7.7Mid - Efficiency 13.7Low - Efficiency 27.0
House Type
16
Chapter 4 Micro-Combined Heat and Power Models
4.1 MCHP Model – General Characteristics
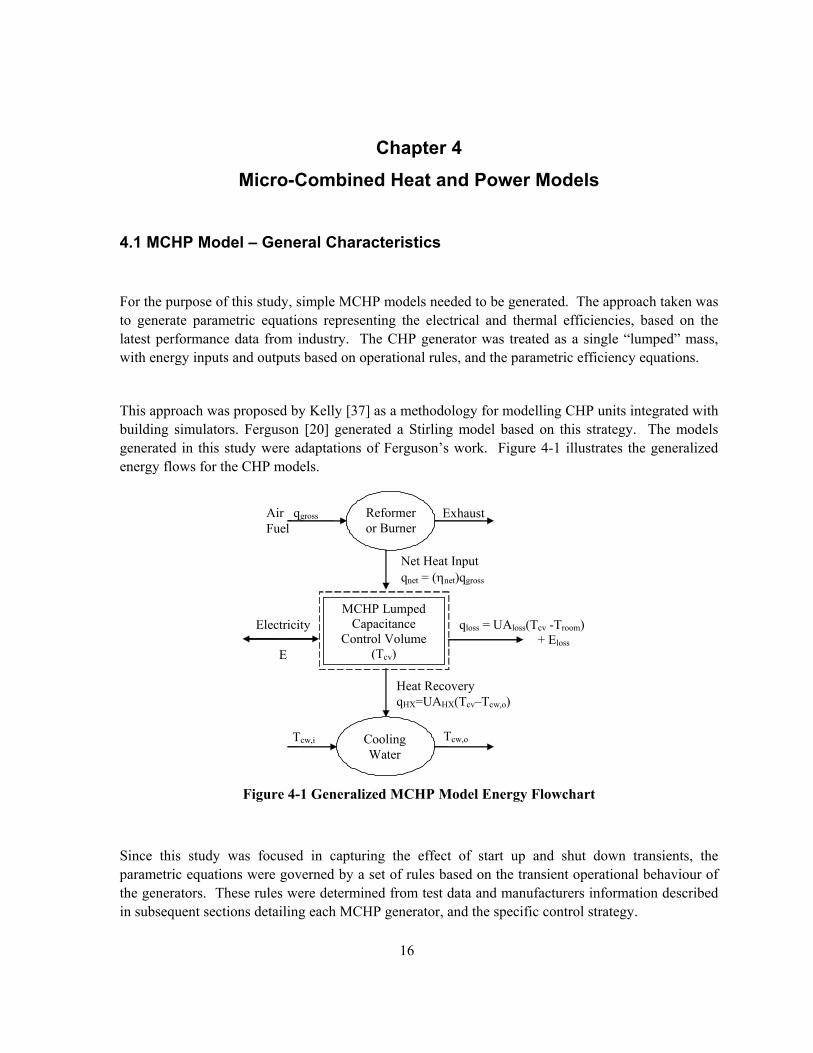
For the purpose of this study, simple MCHP models needed to be generated. The approach taken was to generate parametric equations representing the electrical and thermal efficiencies, based on the latest performance data from industry. The CHP generator was treated as a single “lumped” mass, with energy inputs and outputs based on operational rules, and the parametric efficiency equations.
This approach was proposed by Kelly [37] as a methodology for modelling CHP units integrated with building simulators. Ferguson [20] generated a Stirling model based on this strategy. The models generated in this study were adaptations of Ferguson’s work. Figure 4-1 illustrates the generalized energy flows for the CHP models.
Figure 4-1 Generalized MCHP Model Energy Flowchart
Since this study was focused in capturing the effect of start up and shut down transients, the parametric equations were governed by a set of rules based on the transient operational behaviour of the generators. These rules were determined from test data and manufacturers information described in subsequent sections detailing each MCHP generator, and the specific control strategy.
qloss = UAloss(Tcv -Troom) + Eloss
Reformer or Burner
Heat Recovery qHX=UAHX(Tcv–Tcw,o)
Air qgross Fuel
Cooling Water
Exhaust
MCHP Lumped Capacitance
Control Volume (Tcv)
Electricity
E
Tcw,i Tcw,o
Net Heat Input qnet = (ηnet)qgross
17
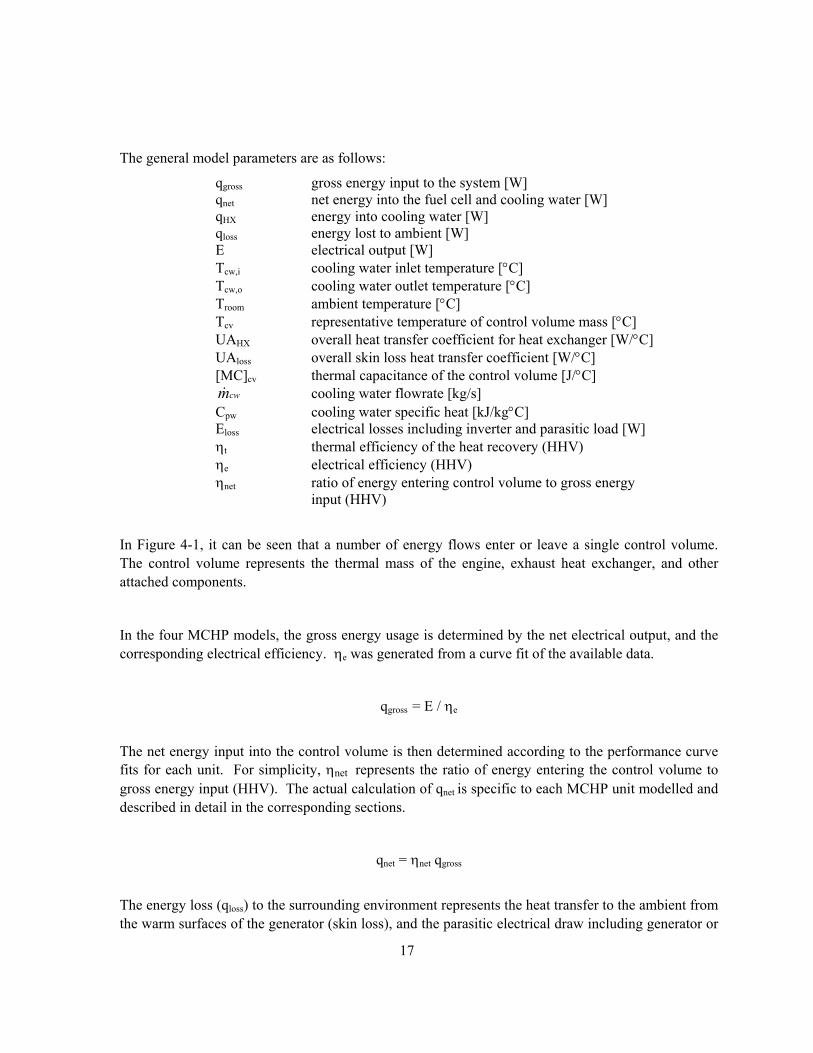
The general model parameters are as follows:
qgross gross energy input to the system [W] qnet net energy into the fuel cell and cooling water [W] qHX energy into cooling water [W] qloss energy lost to ambient [W] E electrical output [W] Tcw,i cooling water inlet temperature [°C] Tcw,o cooling water outlet temperature [°C] Troom ambient temperature [°C] Tcv representative temperature of control volume mass [°C] UAHX overall heat transfer coefficient for heat exchanger [W/°C] UAloss overall skin loss heat transfer coefficient [W/°C] [MC]cv thermal capacitance of the control volume [J/°C] cwm& cooling water flowrate [kg/s]
Cpw cooling water specific heat [kJ/kg°C]
Eloss electrical losses including inverter and parasitic load [W] ηt thermal efficiency of the heat recovery (HHV) ηe electrical efficiency (HHV) ηnet ratio of energy entering control volume to gross energy input (HHV)
In Figure 4-1, it can be seen that a number of energy flows enter or leave a single control volume. The control volume represents the thermal mass of the engine, exhaust heat exchanger, and other attached components.
In the four MCHP models, the gross energy usage is determined by the net electrical output, and the corresponding electrical efficiency. ηe was generated from a curve fit of the available data.
qgross = E / ηe
The net energy input into the control volume is then determined according to the performance curve fits for each unit. For simplicity, ηnet represents the ratio of energy entering the control volume to gross energy input (HHV). The actual calculation of qnet is specific to each MCHP unit modelled and described in detail in the corresponding sections.
qnet = ηnet qgross
The energy loss (qloss) to the surrounding environment represents the heat transfer to the ambient from the warm surfaces of the generator (skin loss), and the parasitic electrical draw including generator or
18
inverter inefficiencies. The skin losses are proportional to the difference in temperature between the control volume and the ambient air. The parasitic load is specific to each model, and is described in detail in the corresponding sections.
qloss = UAHX (Tcv – Troom) + Eloss
The heat transfer from the control volume to the cooling water is dependant on the cooling water inlet temperature and flowrate. Thus qHX can be governed by the temperature difference between the control volume and the cooling water outlet temperature.
qHX = UAHX (Tcv - Tcw,o)
With all of the energy flows accounted for, the control volume temperature is represented by the following differential equation:
[MC]cv dTcv /dt = qnet – E - qHX - qloss
Finally, the outlet temperature of the cooling water can be determined from the following expression:
qHX = [ cwm& Ccw] (Tcw,o - Tcw,i)
Natural gas was chosen as the fuel for each of these units, and grid connected operation was assumed. For calculation purposes, it was assumed that natural gas was composed of only methane, with a HHV of 55 528 kJ/kg, and a Low Heating Value (LHV) of 50 016 kJ/kg [38]. The reference state of 25°C and 1 atmosphere was used.
The general assumptions that were made are:
- Start-up always takes same amount of time
- Heat transfer coefficients are constant
It must be noted that in this model strategy, the heat transfer UAHX was adjusted so that the control volume temperature Tcv is roughly representative of the engine modelled. Tcv will not be the actual engine temperature since the exhaust heat exchanger is combined in the single control volume. The thermal capacitance [MC]cv determines the thermal transient response of the system. It was set so the model matched the test data.

19
The skin loss coefficient UAloss was given in Ferguson’s [20] work, and was assumed the same for the PEMFC, Stirling Engine and IC engine since the engine bulk of these units operate at approximately the same temperature. UAloss was lowered for the SOFC to yield a similar skin loss since the SOFC operating temperature is much higher.
4.2 Solid Oxide Fuel Cell MCHP Model
The solid oxide fuel cell (SOFC) has the potential to be the most efficient and versatile of all hydrocarbon generators. It is capable of transforming a wide variety of hydrocarbon fuels into electricity and very high quality heat. However, the technology has many obstacles to overcome. The high temperature nature of the cell promotes cell interconnect corrosion problems, and the delicate ceramic cells tend to degrade under thermal cycles, and even with load changes [23]. For the reasons stated, it is important to note that the efficiency of the SOFC generator will degrade over time, resulting in a required overhaul where the ceramic cells need to be changed. (Likely a period of years) Also, start up periods for solid oxide fuel cells are currently very lengthy, in the order of 1 to 3 days.
For these reasons, SOFCs need to run continuously, and it is best to operate them at a steady set point. Therefore, sizing becomes very important for efficient SOFC operation. Low residential summertime heat requirements of only 12 kW demanded per day for hot water [28] translates to a steady thermal demand of only 0.5 kW. This indicates that in practice a residentially installed SOFC may need to be shut down for the summer months.
For grid-connected operation, power can be sold back to the utility. However, in Ontario the maximum price the utility will pay for this is $0.11 / kWh provided biogas is used in the fuel cell. Considering biogas is not readily available at this time, the following simple cost analysis is based on current natural gas and electrical prices:
Natural Gas $0.039 / kWh (Waterloo Region) Electricity $0.080 / kWh (Waterloo Region)
Assuming the average electricity generation efficiency by the SOFC is at 36% HHV, (This is optimistic as described in following paragraphs.) the cost to generate one kWh of electricity by the SOFC is $0.11 / kWh. (not including capital and maintenance costs.) An owner will not wish to sell power back to the utility at a financial loss. Therefore, for financial neutrality, the building must utilize at least $0.03 or 0.77 kWh heat for every kWh of electricity produced.
20
From this basic analysis it is apparent that the SOFC set point should reflect the average thermal demand for the period in order to make financial sense. This logic does not apply to an off-grid application, which is beyond the scope of this study.
Recently, the first residential test in Canada of a solid oxide fuel cell MCHP unit took place at the Canadian Centre for Housing Technology (CCHT) [22]. The cell was a 5kW second-generation solid oxide fuel cell manufactured by Fuel Cell Technologies Inc. in Kingston. This cell was operated in the CCHT for 640 hours at an average output of 1.8 kW. The electrical efficiency of the cell stack was a reasonable 42.3% HHV. However, once the parasitic internal electrical load of 1590 W was subtracted, the AC power out from the unit was only at an efficiency of 22.4% HHV. The thermal output of the unit was also relatively constant at 2 kW at an efficiency of 25% HHV. The parasitic load was 600 W for the internal plant, and the inverter operated poorly at 65.5% efficiency (990W). The poor performance was likely due to the part load operation of the cell. From the numbers above, it is likely that an electrical efficiency of 36% HHV would be obtainable at full rated load, with an inverter efficiency of 95%. (Parasitic electrical draw is reduced to 6.2% HHV)
Hexis AG (formally Sulzer Hexis) is producing a planar SOFC rated at 1kW. The Galileo unit (formally HXS 1000 Premiere) has been tested in a number of facilities in Europe and Japan. Available data (which is dated 2003) places the electrical efficiency at 23-29% HHV and thermal efficiency of 46-55% HHV at rated load [23]. It is likely that improvements have been made over the last 3 years.
With consideration of the published data, the specifications for the SOFC model used in this study were as follows:
Constant electrical output of 1kW (No start up or shut down transients) Heat available for recovery is 1.6 kW Electrical efficiency 33% HHV Internal parasitic losses 6% HHV Thermal recovery – Dependant on cooling water temperature Cooling water flowrate – Varied to maintain desired outlet temperature
This model’s behaviour differs from all the other MCHP models in this study, and is much simpler since no start up and shut down transients exist.
The efficiency of the exhaust heat recovery unit will be related to the temperature and design of the SOFC exhaust heat exchanger. If the temperature is sufficiently cool, condensation of the exhaust stream will occur. This condensation greatly complicates any theoretical estimation of the heat exchanger performance. Therefore, test data was used to estimate the heat recovery efficiency.
21
Testing of the Sulzer Hexis SOFC unit indicated that the heat recovery ranges between 46-55% HHV[23]. For the SOFC model in this study it was assumed that the heat recovery efficiency varied with the cooling water inlet temperature and flowrate.
ηt = 0.625 – 0.003(Taverage) Taverage = 25°C, ηt = 0.55 Taverage = 75°C, ηt = 0.40
The net heat transfer into the control volume is then given by:
qnet = (ηe + ηt )qgross + UAloss(Tcv -Troom)+ Eloss
The model coefficients that yield representative thermal operation are:
UAHX 2.8 [W/°C] UAloss 0.24 [W/°C] [MC]cv 1 [kJ/°C]
4.2.1 Resulting SOFC Model Behaviour
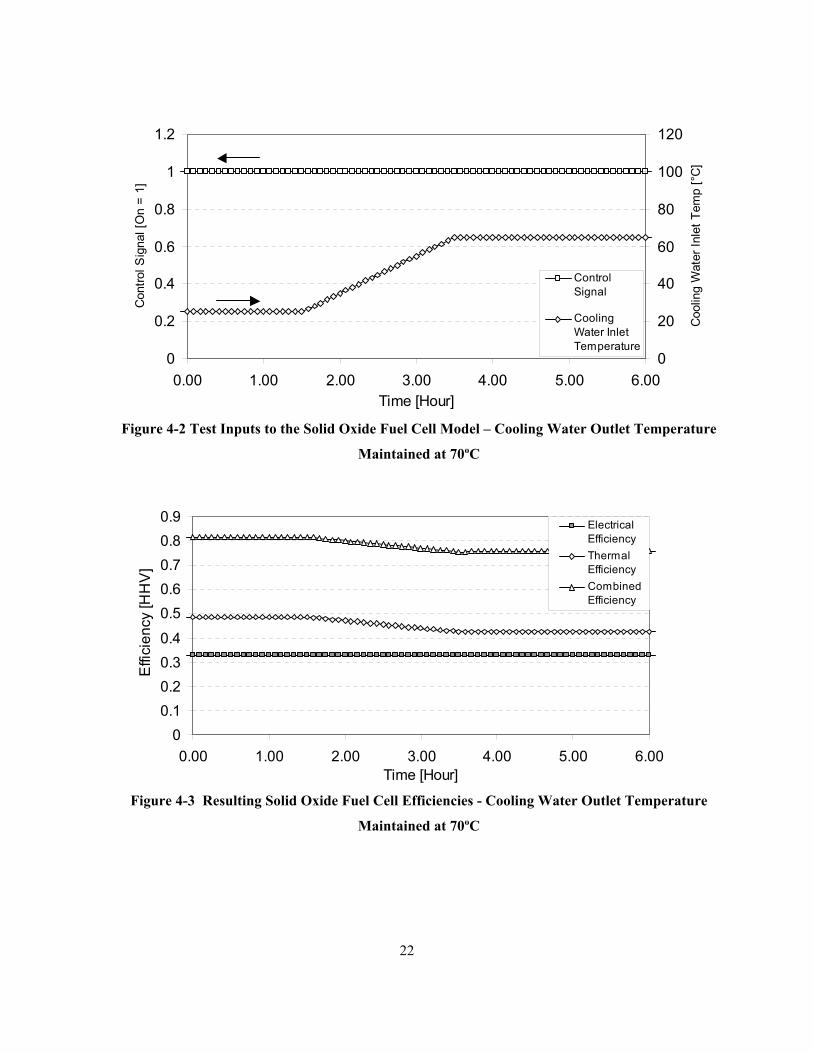
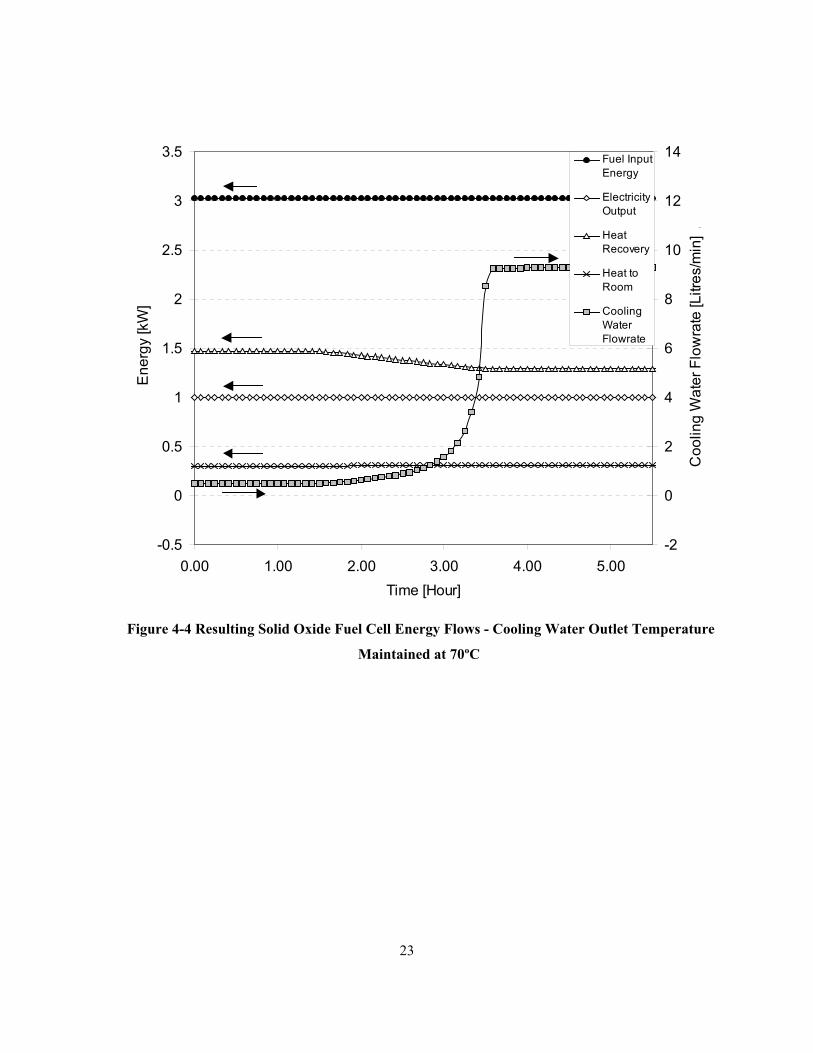
The model behaviour in response to varying cooling water inlet temperatures is shown in the following figures. Figure 4-2 illustrates the cooling water input temperature increase as a time varied input to the SOFC Model. Since the SOFC operates at a constant power output level, and is designed to maintain a desired water output temperature, the cooling water flowrate must increase as the inlet temperature increases. This response can be seen in Figure 4-4.
In this model, heat recovery efficiency varies with the average cooling water temperature. Figure 4-3 shows the reduction in thermal efficiency due to the cooling water inlet temperature increase. The heat loss to the room remains essentially constant.
22
Figure 4-2 Test Inputs to the Solid Oxide Fuel Cell Model – Cooling Water Outlet Temperature
Maintained at 70ºC
Figure 4-3 Resulting Solid Oxide Fuel Cell Efficiencies - Cooling Water Outlet Temperature
Maintained at 70ºC
0
0.2
0.4
0.6
0.8
1
1.2
0.00 1.00 2.00 3.00 4.00 5.00 6.00Time [Hour]
Con
trol S
igna
l [O
n =
1]
0
20
40
60
80
100
120
Coo
ling
Wat
er In
let T
emp
[°C
]
ControlSignal
CoolingWater InletTemperature
00.10.20.30.4
0.50.60.70.80.9
0.00 1.00 2.00 3.00 4.00 5.00 6.00Time [Hour]
Effi
cien
cy [H
HV
]
ElectricalEfficiencyThermalEfficiencyCombinedEfficiency
23
Figure 4-4 Resulting Solid Oxide Fuel Cell Energy Flows - Cooling Water Outlet Temperature
Maintained at 70ºC
-0.5
0
0.5
1
1.5
2
2.5
3
3.5
0.00 1.00 2.00 3.00 4.00 5.00Time [Hour]
Ene
rgy
[kW
]
-2
0
2
4
6
8
10
12
14
Coo
ling
Wat
er F
low
rate
[Litr
es/m
in]
.
Fuel InputEnergy
ElectricityOutput
HeatRecovery
Heat toRoom
CoolingWaterFlowrate

24
4.3 Polymer Electrolyte Membrane Fuel Cell MCHP Model
In order to operate PEMFCs on natural gas, a fuel reformer must be used. This reformer must operate at high temperatures similarly to the SOFC. In contrast to the SOFC, the reformer and PEMFC can be cycled on and off. However, since an inefficient start and stop transient will occur, it is desirable to run the PEMFC for long periods and only turn off the reformer and cell when load is not required for an extended period of time.
PEMFC combined heat and power units are being introduced on a limited scale by many different manufacturers at the time of this study. The Japan Gas Appliances Inspection Association (JIA) recently tested 19 units made from 9 different manufacturers [27] including:
Ishikawajima-Harima Heavy Industries Co., Ltd. Ebara Ballard Corp. Sanyo Electric Co., Ltd. Nippon Oil Corp. Toshiba International Fuel Cells Inc. Toyota Motor Corp. Nuvera Fuel Cells Matsushita Electric Industrial Co., Ltd. Mitsubishi Heavy Industries, Ltd.
Table 4-1 lists the performance extracted from the JIA test report. Note that the values listed are with respect to the high heating value of natural gas, and heat recovery is for room temperature water at the inlet of the unit. It is also important to note that in general the PEMFC MCHP comes complete with an integrated hot water tank that is typically 200L in size. Cooling water flowrate is varied to maintain the outlet temperature at the tank set point temperature.
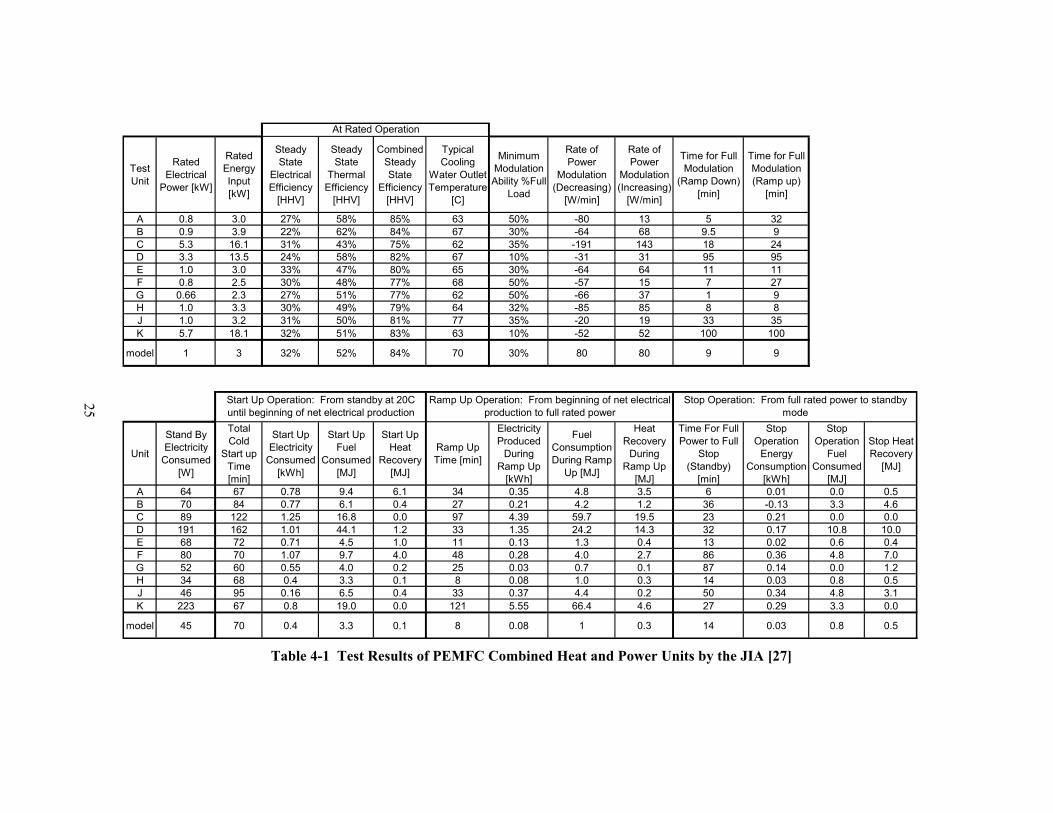
Table 4-1 Test Results of PEMFC Combined Heat and Power Units by the JIA [27]
Test Unit
Rated Electrical
Power [kW]
Rated Energy Input [kW]
Steady State
Electrical Efficiency
[HHV]
Steady State
Thermal Efficiency
[HHV]
Combined Steady State
Efficiency [HHV]
Typical Cooling
Water Outlet Temperature
[C]
Minimum Modulation Ability %Full
Load
Rate of Power
Modulation (Decreasing)
[W/min]
Rate of Power
Modulation (Increasing)
[W/min]
Time for Full Modulation
(Ramp Down) [min]
Time for Full Modulation (Ramp up)
[min]
A 0.8 3.0 27% 58% 85% 63 50% -80 13 5 32B 0.9 3.9 22% 62% 84% 67 30% -64 68 9.5 9C 5.3 16.1 31% 43% 75% 62 35% -191 143 18 24D 3.3 13.5 24% 58% 82% 67 10% -31 31 95 95E 1.0 3.0 33% 47% 80% 65 30% -64 64 11 11F 0.8 2.5 30% 48% 77% 68 50% -57 15 7 27G 0.66 2.3 27% 51% 77% 62 50% -66 37 1 9H 1.0 3.3 30% 49% 79% 64 32% -85 85 8 8J 1.0 3.2 31% 50% 81% 77 35% -20 19 33 35K 5.7 18.1 32% 51% 83% 63 10% -52 52 100 100
model 1 3 32% 52% 84% 70 30% 80 80 9 9
Unit
Stand By Electricity
Consumed [W]
Total Cold
Start up Time [min]
Start Up Electricity
Consumed [kWh]
Start Up Fuel
Consumed [MJ]
Start Up Heat
Recovery [MJ]
Ramp Up Time [min]
Electricity Produced
During Ramp Up
[kWh]
Fuel Consumption During Ramp
Up [MJ]
Heat Recovery
During Ramp Up
[MJ]
Time For Full Power to Full
Stop (Standby)
[min]
Stop Operation
Energy Consumption
[kWh]
Stop Operation
Fuel Consumed
[MJ]
Stop Heat Recovery
[MJ]
A 64 67 0.78 9.4 6.1 34 0.35 4.8 3.5 6 0.01 0.0 0.5B 70 84 0.77 6.1 0.4 27 0.21 4.2 1.2 36 -0.13 3.3 4.6C 89 122 1.25 16.8 0.0 97 4.39 59.7 19.5 23 0.21 0.0 0.0D 191 162 1.01 44.1 1.2 33 1.35 24.2 14.3 32 0.17 10.8 10.0E 68 72 0.71 4.5 1.0 11 0.13 1.3 0.4 13 0.02 0.6 0.4F 80 70 1.07 9.7 4.0 48 0.28 4.0 2.7 86 0.36 4.8 7.0G 52 60 0.55 4.0 0.2 25 0.03 0.7 0.1 87 0.14 0.0 1.2H 34 68 0.4 3.3 0.1 8 0.08 1.0 0.3 14 0.03 0.8 0.5J 46 95 0.16 6.5 0.4 33 0.37 4.4 0.2 50 0.34 4.8 3.1K 223 67 0.8 19.0 0.0 121 5.55 66.4 4.6 27 0.29 3.3 0.0
model 45 70 0.4 3.3 0.1 8 0.08 1 0.3 14 0.03 0.8 0.5
Start Up Operation: From standby at 20C until beginning of net electrical production
Ramp Up Operation: From beginning of net electrical production to full rated power
Stop Operation: From full rated power to standby mode
At Rated Operation
25
26
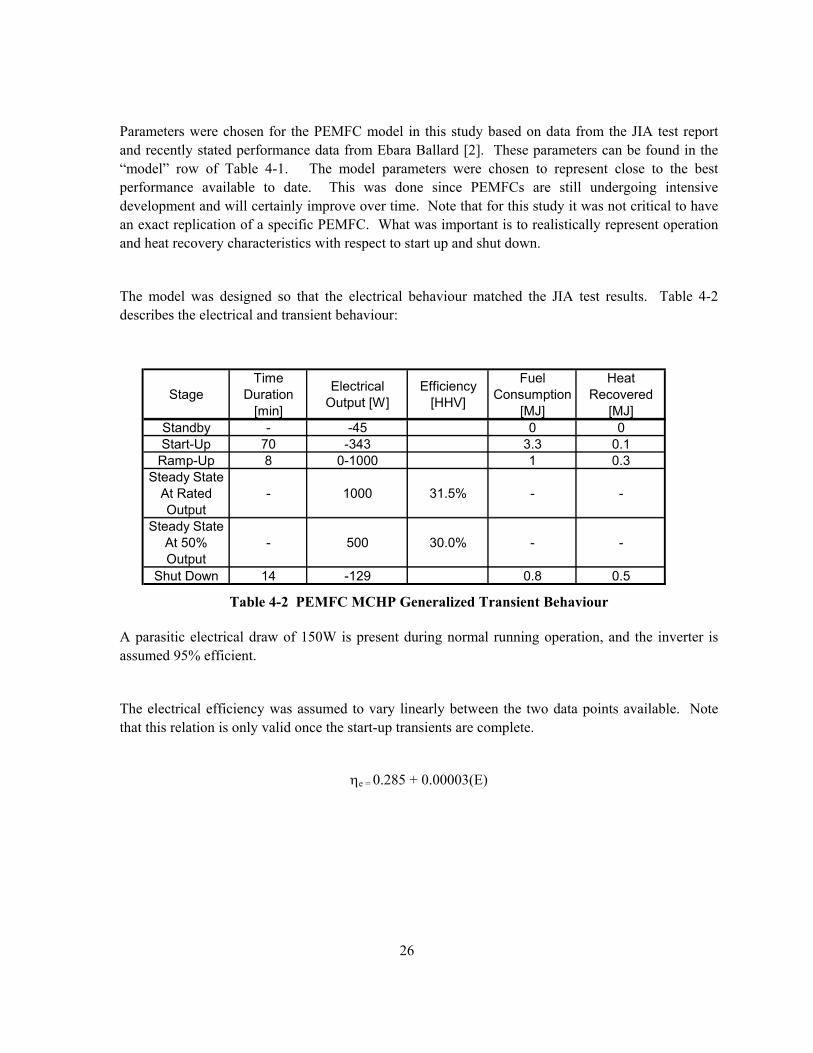
Parameters were chosen for the PEMFC model in this study based on data from the JIA test report and recently stated performance data from Ebara Ballard [2]. These parameters can be found in the “model” row of Table 4-1. The model parameters were chosen to represent close to the best performance available to date. This was done since PEMFCs are still undergoing intensive development and will certainly improve over time. Note that for this study it was not critical to have an exact replication of a specific PEMFC. What was important is to realistically represent operation and heat recovery characteristics with respect to start up and shut down.
The model was designed so that the electrical behaviour matched the JIA test results. Table 4-2 describes the electrical and transient behaviour:
Table 4-2 PEMFC MCHP Generalized Transient Behaviour
A parasitic electrical draw of 150W is present during normal running operation, and the inverter is assumed 95% efficient.
The electrical efficiency was assumed to vary linearly between the two data points available. Note that this relation is only valid once the start-up transients are complete.
ηe = 0.285 + 0.00003(E)
StageTime
Duration [min]
Electrical Output [W]
Efficiency [HHV]
Fuel Consumption
[MJ]
Heat Recovered
[MJ]Standby - -45 0 0Start-Up 70 -343 3.3 0.1
Ramp-Up 8 0-1000 1 0.3Steady State
At Rated Output
- 1000 31.5% - -
Steady State At 50% Output
- 500 30.0% - -
Shut Down 14 -129 0.8 0.5
27
4.3.1 Thermal Behaviour of PEMFC Model
PEMFCs heat recovery systems are very complex, and many different design options are possible. Heat can be recovered from the reformer, cell exhaust streams, and from the stack itself. Inaka [26] describes in detail two heat recovery strategies, dependant on the cell being water cooled, or cooled using a latent evaporation technique. Regardless of the cooling technique, the cell stack contributes the majority of the heat (75%) to the cooling water. The reformer contributes less since the reforming reaction is endothermic, and requires heat from burning of the unused fuel from the cell.
Due to the complex nature of heat recovery, a curve fit to the published performance was used. It was assumed the heat recovery efficiency varies linearly dependant on cooling water temperature. From a recent Ebara-Ballard news release [2] the heat recovery efficiency is stated to vary from a minimum of 40% HHV at minimum output to 58% HHV at rated load. It was apparent in the JIA test data that a thermal efficiency drop of approximately 11% occurred as the cooling water temperature increased from ambient to rated level. In order to account for the cooling water temperature and modulation, the thermal efficiency approximation relation becomes:
ηt = [0.649 – 0.00275(Taverage)]-(1000-E)/10000
At Full Load: Taverage = 25°C, ηt = 0.58 At Full Load: Taverage = 65°C, ηt = 0.47 At 30% Load: Taverage = 25°C, ηt = 0.51 At 30% Load: Taverage = 65°C, ηt = 0.4
The net heat transfer into the control volume is then given by:
qnet = (ηe + ηt )qgross + UAloss(Tcv -Troom)+ Eloss
The thermal efficiency correlates very well with the experimental data in Table 4-1. Note that the data in Table 4-1 was generated when the cooling water inlet temperature was approximately 21°C.
The qnet expression was only used once the start-up transient of the PEMFC was completed. During the transients, the input heat flux and electrical output were specified to match the test data listed in Table 4-1.
28
The model coefficients that yield representative thermal operation are:
UAHX 181 [W/°C] UAloss 5 [W/°C] [MC]cv 10 [kJ/°C]
4.3.2 PEMFC Control strategy
The PEMFC model in this study has a similar efficiency to the SOFC previously discussed. Therefore, PEMFCs are also dependent on heat utilization to make economic and environmental sense. Thus, the control strategy chosen was to maximize the run time of the PEMFC under heating demand control. If no heat demand existed for a period of time, the cell was shut down.
The cooling water flowrate was varied to maintain the desired cooling water outlet set point temperature. This strategy was apparent in the PEMFCs tested by the JIA.
4.3.3 Resulting PEMFC Model Behaviour
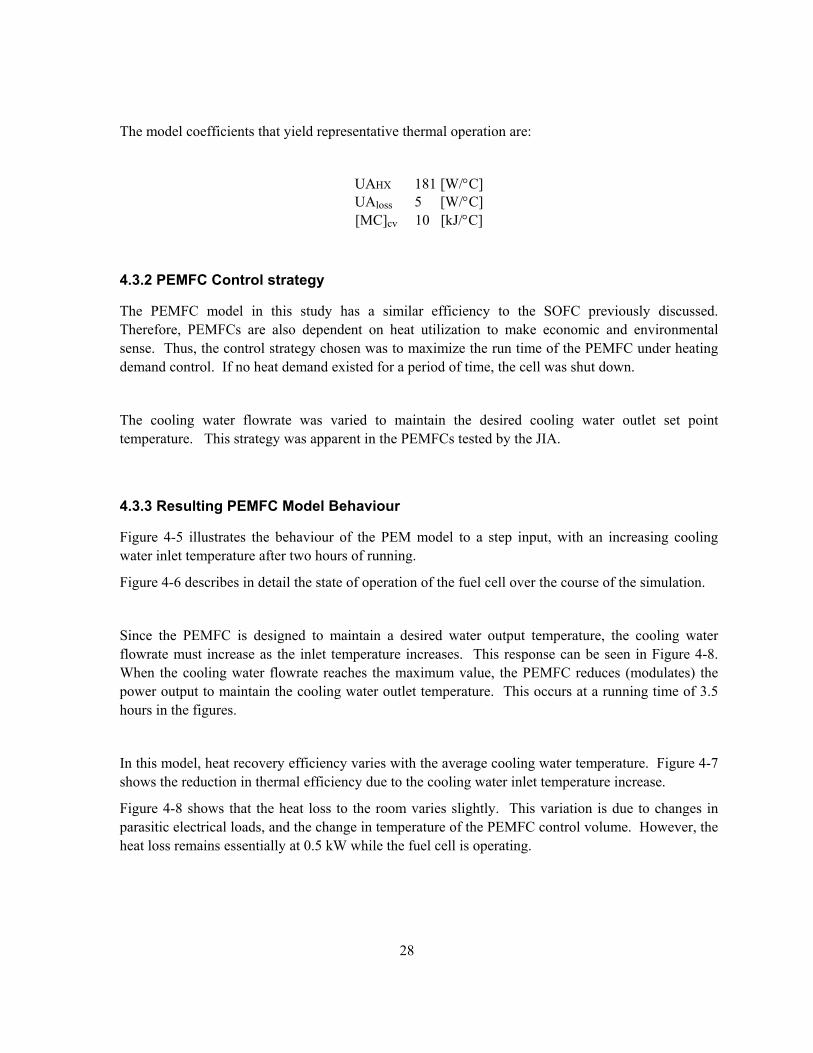
Figure 4-5 illustrates the behaviour of the PEM model to a step input, with an increasing cooling water inlet temperature after two hours of running.
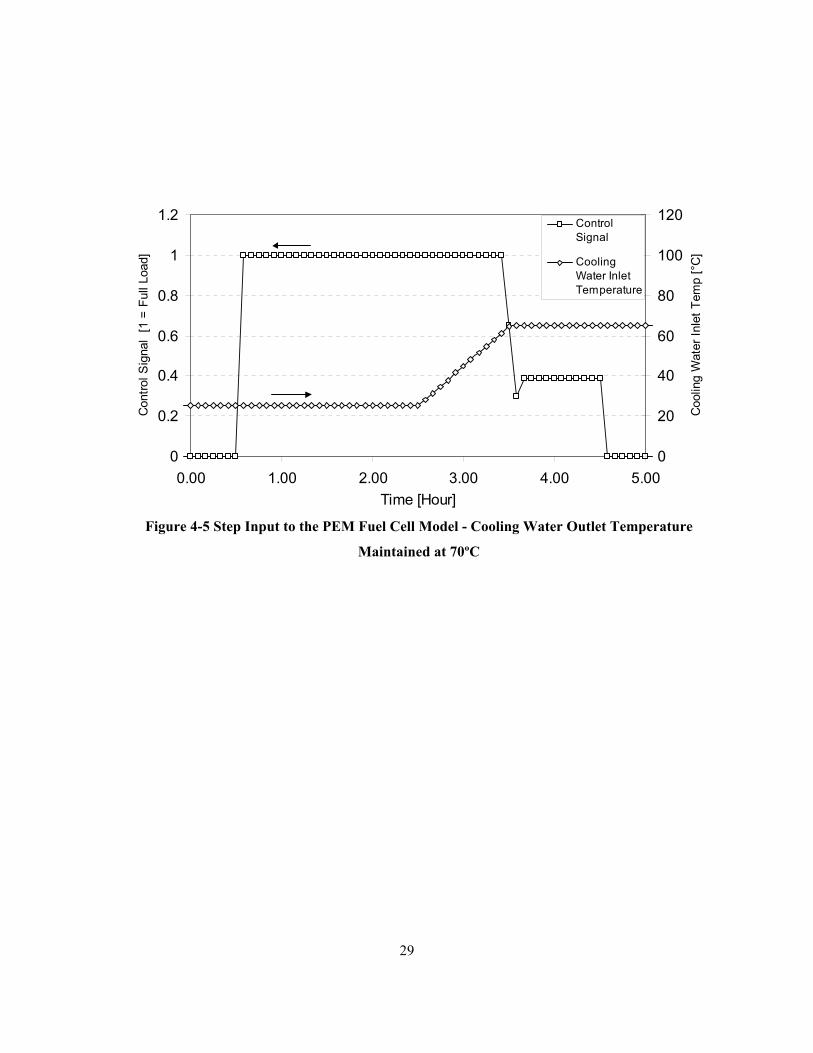
Figure 4-6 describes in detail the state of operation of the fuel cell over the course of the simulation.
Since the PEMFC is designed to maintain a desired water output temperature, the cooling water flowrate must increase as the inlet temperature increases. This response can be seen in Figure 4-8. When the cooling water flowrate reaches the maximum value, the PEMFC reduces (modulates) the power output to maintain the cooling water outlet temperature. This occurs at a running time of 3.5 hours in the figures.
In this model, heat recovery efficiency varies with the average cooling water temperature. Figure 4-7 shows the reduction in thermal efficiency due to the cooling water inlet temperature increase.
Figure 4-8 shows that the heat loss to the room varies slightly. This variation is due to changes in parasitic electrical loads, and the change in temperature of the PEMFC control volume. However, the heat loss remains essentially at 0.5 kW while the fuel cell is operating.
29
Figure 4-5 Step Input to the PEM Fuel Cell Model - Cooling Water Outlet Temperature
Maintained at 70ºC
0
0.2
0.4
0.6
0.8
1
1.2
0.00 1.00 2.00 3.00 4.00 5.00Time [Hour]
Con
trol S
igna
l [1
= F
ull L
oad]
0
20
40
60
80
100
120
Coo
ling
Wat
er In
let T
emp
[°C
]
ControlSignal
CoolingWater InletTemperature
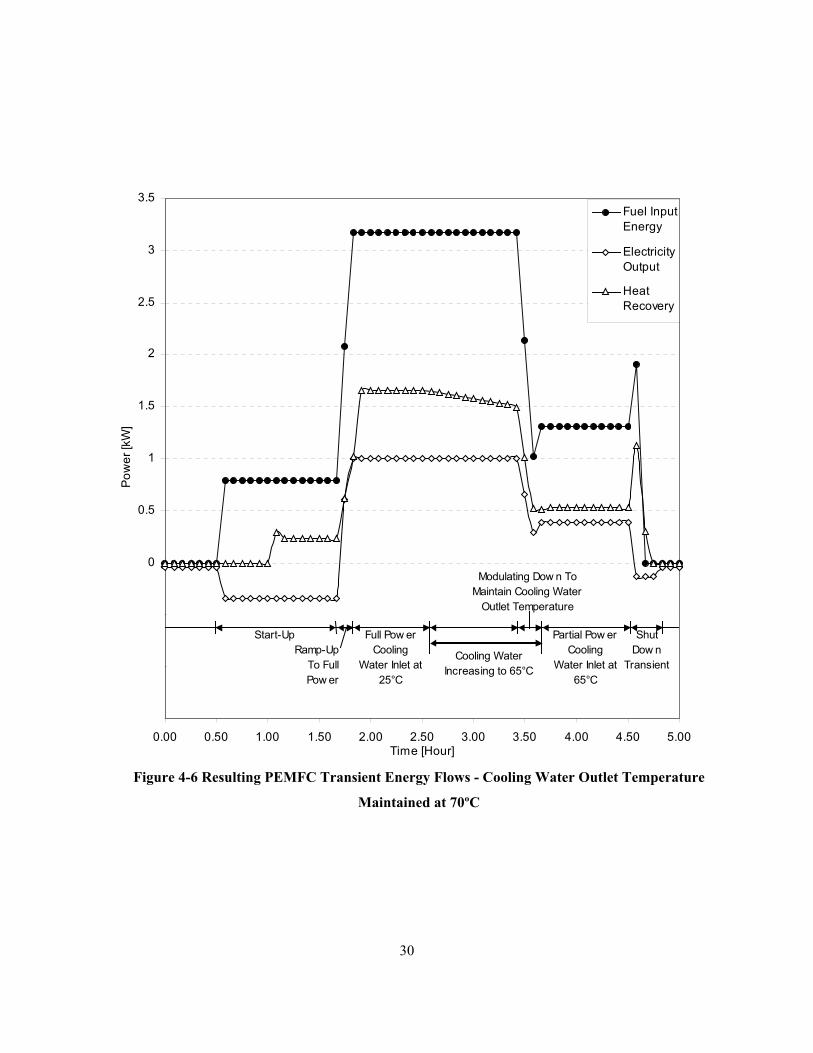
30
Figure 4-6 Resulting PEMFC Transient Energy Flows - Cooling Water Outlet Temperature
Maintained at 70ºC
-1.5
-1
-0.5
0
0.5
1
1.5
2
2.5
3
3.5
0.00 0.50 1.00 1.50 2.00 2.50 3.00 3.50 4.00 4.50 5.00Time [Hour]
Pow
er [k
W]
Fuel InputEnergy
ElectricityOutput
HeatRecovery
Start-UpRamp-Up
To Full Pow er
Full Pow er Cooling
Water Inlet at 25°C
Modulating Dow n To Maintain Cooling Water
Outlet Temperature
Shut Dow n
TransientCooling Water
Increasing to 65°C
Partial Pow er Cooling
Water Inlet at 65°C
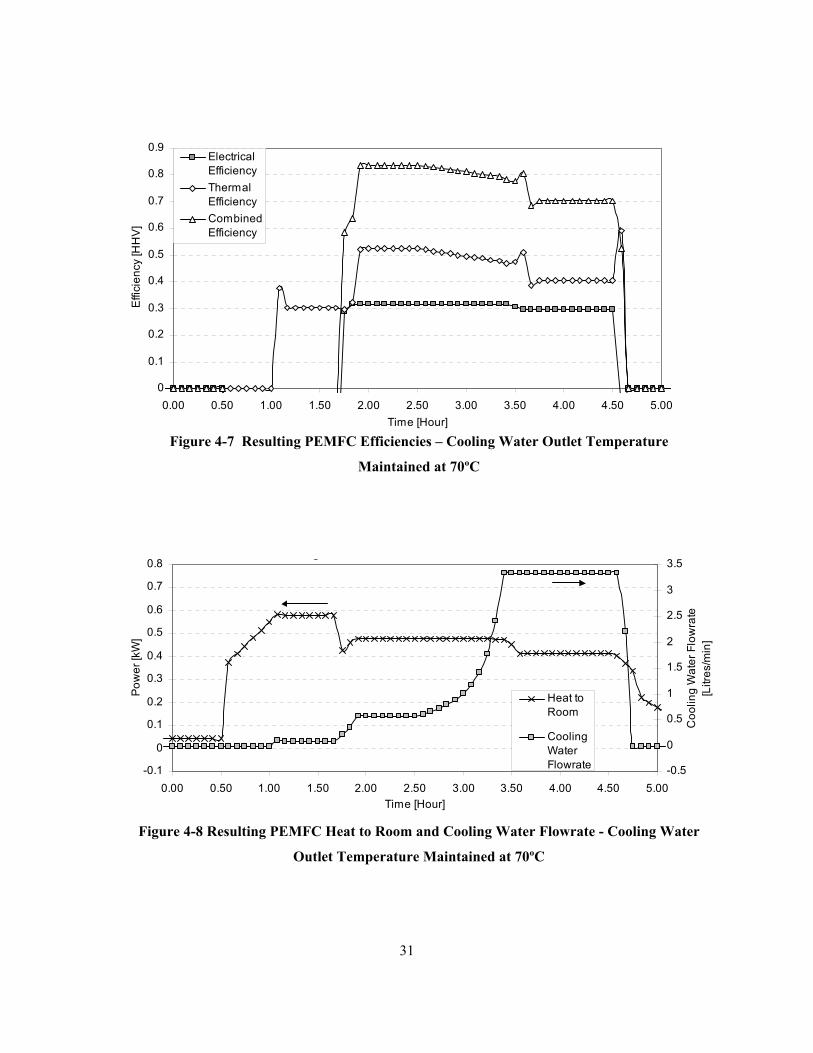
31
g
-0.1
0
0.1
0.2
0.3
0.4
0.5
0.6
0.7
0.8
0.00 0.50 1.00 1.50 2.00 2.50 3.00 3.50 4.00 4.50 5.00Time [Hour]
Pow
er [k
W]
-0.5
0
0.5
1
1.5
2
2.5
3
3.5
Coo
ling
Wat
er F
low
rate
[L
itres
/min
] Heat toRoom
CoolingWaterFlowrate
Figure 4-7 Resulting PEMFC Efficiencies – Cooling Water Outlet Temperature
Maintained at 70ºC
Figure 4-8 Resulting PEMFC Heat to Room and Cooling Water Flowrate - Cooling Water
Outlet Temperature Maintained at 70ºC
0
0.1
0.2
0.3
0.4
0.5
0.6
0.7
0.8
0.9
0.00 0.50 1.00 1.50 2.00 2.50 3.00 3.50 4.00 4.50 5.00Time [Hour]
Effi
cien
cy [H
HV
]
ElectricalEfficiencyThermalEfficiencyCombinedEfficiency

32
4.4 Stirling Engine MCHP Model
Stirling engines are perceived to be a viable MCHP generator. A number of manufacturers have product offerings on a moderate scale. Table 4-3 lists steady state performance for a number of Stirling engine MCHPs
Table 4-3 MCHP Systems with Stirling Engines [39]
For this study, the WhisperGen product made by WhisperTech was used due to its high efficiency, reasonable capacity for small Canadian buildings, and performance data availability. This unit is essentially an on/off boiler that acts on heat demand. Once operating, the latest WhisperGen unit operates at a constant electrical output, with negligible thermal output changes.
Performance curves were available from a CHMC study done in Ottawa [28]. A computer model of this unit was developed for building integration simulations by Ferguson [20]. However, the unit tested was determined to be very out of date and did not represent the behaviour of the current technology. The manufacturer (WhisperTech) was contacted, and up to date performance and operation data was provided. Additional steady state performance data from a field trial of two units was listed in the report by Niesmart [29]. The characteristics used for the model in this study reflect the latest data, and are listed below:
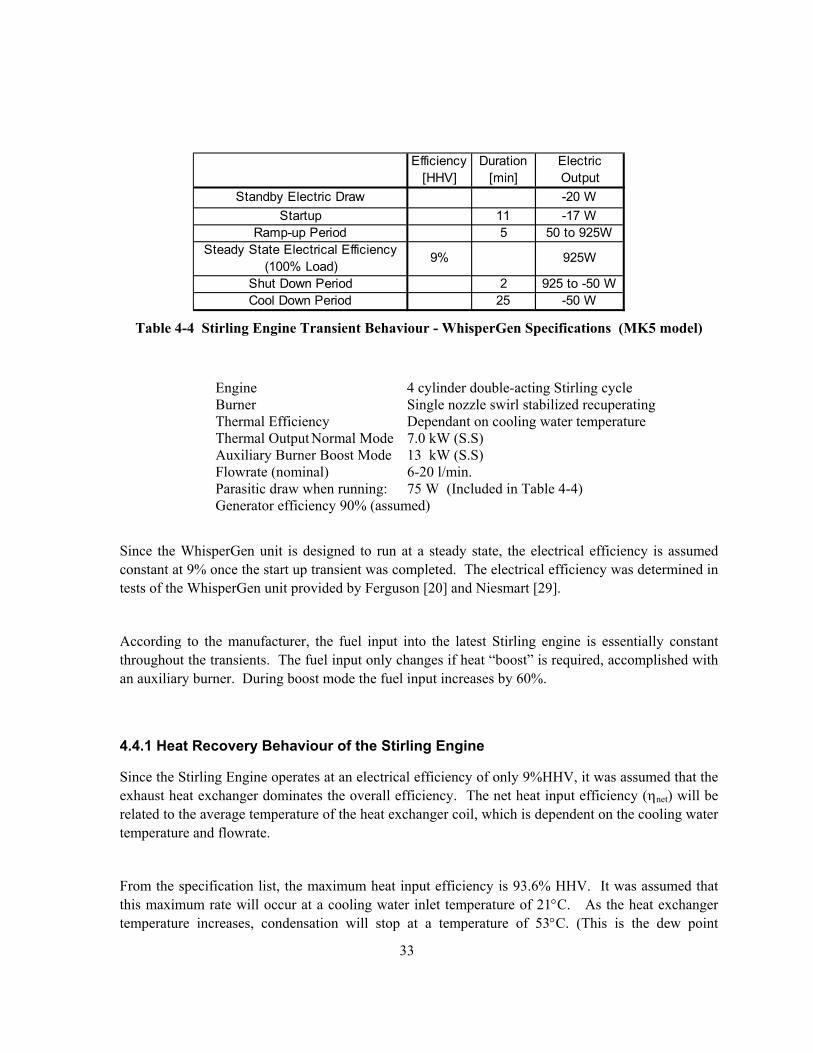
33
Table 4-4 Stirling Engine Transient Behaviour - WhisperGen Specifications (MK5 model)
Engine 4 cylinder double-acting Stirling cycle Burner Single nozzle swirl stabilized recuperating Thermal Efficiency Dependant on cooling water temperature Thermal Output Normal Mode 7.0 kW (S.S) Auxiliary Burner Boost Mode 13 kW (S.S) Flowrate (nominal) 6-20 l/min. Parasitic draw when running: 75 W (Included in Table 4-4) Generator efficiency 90% (assumed)
Since the WhisperGen unit is designed to run at a steady state, the electrical efficiency is assumed constant at 9% once the start up transient was completed. The electrical efficiency was determined in tests of the WhisperGen unit provided by Ferguson [20] and Niesmart [29].
According to the manufacturer, the fuel input into the latest Stirling engine is essentially constant throughout the transients. The fuel input only changes if heat “boost” is required, accomplished with an auxiliary burner. During boost mode the fuel input increases by 60%.
4.4.1 Heat Recovery Behaviour of the Stirling Engine
Since the Stirling Engine operates at an electrical efficiency of only 9%HHV, it was assumed that the exhaust heat exchanger dominates the overall efficiency. The net heat input efficiency (ηnet) will be related to the average temperature of the heat exchanger coil, which is dependent on the cooling water temperature and flowrate.
From the specification list, the maximum heat input efficiency is 93.6% HHV. It was assumed that this maximum rate will occur at a cooling water inlet temperature of 21°C. As the heat exchanger temperature increases, condensation will stop at a temperature of 53°C. (This is the dew point
Efficiency [HHV]
Duration [min]
Electric Output
Standby Electric Draw -20 W Startup 11 -17 W
Ramp-up Period 5 50 to 925WSteady State Electrical Efficiency
(100% Load) 9% 925W
Shut Down Period 2 925 to -50 WCool Down Period 25 -50 W
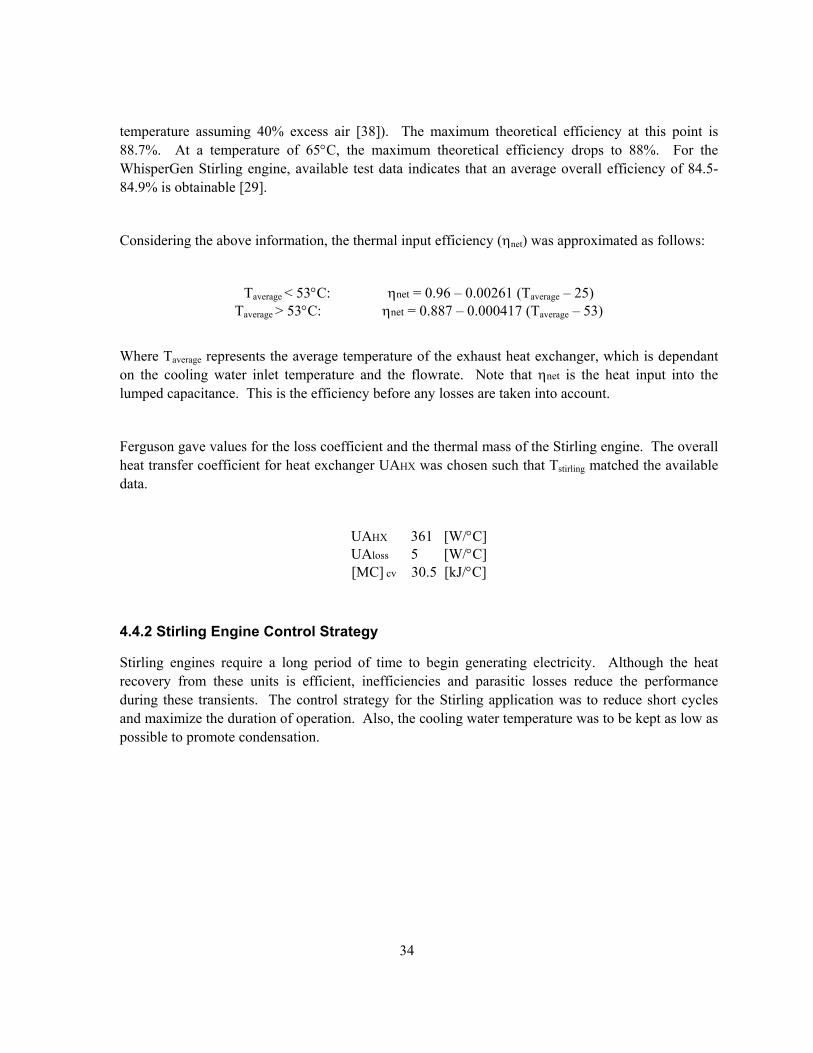
34
temperature assuming 40% excess air [38]). The maximum theoretical efficiency at this point is 88.7%. At a temperature of 65°C, the maximum theoretical efficiency drops to 88%. For the WhisperGen Stirling engine, available test data indicates that an average overall efficiency of 84.5-84.9% is obtainable [29].
Considering the above information, the thermal input efficiency (ηnet) was approximated as follows:
Taverage < 53°C: ηnet = 0.96 – 0.00261 (Taverage – 25) Taverage > 53°C: ηnet = 0.887 – 0.000417 (Taverage – 53)
Where Taverage represents the average temperature of the exhaust heat exchanger, which is dependant on the cooling water inlet temperature and the flowrate. Note that ηnet is the heat input into the lumped capacitance. This is the efficiency before any losses are taken into account.
Ferguson gave values for the loss coefficient and the thermal mass of the Stirling engine. The overall heat transfer coefficient for heat exchanger UAHX was chosen such that Tstirling matched the available data.
UAHX 361 [W/°C] UAloss 5 [W/°C] [MC] cv 30.5 [kJ/°C]
4.4.2 Stirling Engine Control Strategy
Stirling engines require a long period of time to begin generating electricity. Although the heat recovery from these units is efficient, inefficiencies and parasitic losses reduce the performance during these transients. The control strategy for the Stirling application was to reduce short cycles and maximize the duration of operation. Also, the cooling water temperature was to be kept as low as possible to promote condensation.

35
4.4.3 Resulting Stirling Engine Model Behaviour
Figure 4-9 illustrates the behaviour of the Stirling Engine model to a step input, with an increasing cooling water inlet temperature after one hour of running. The Stirling Engine model does not vary the cooling water outlet flowrate. The operation mode is to simply add heat until a controller shuts the unit down.
In this model, heat recovery efficiency varies with the average cooling water temperature. Figure 4-10 shows the reduction in thermal efficiency due to the cooling water inlet temperature increase. The thermal efficiency drops during the period while the cooling water inlet temperature is increasing. This efficiency drop is due to the thermal mass of the system since energy is being stored as the engine heats up. The stored energy is recovered when the engine is turned off, or when the cooling water temperature drops.
Figure 4-11 shows that the engine does not produce electricity until 13 minutes after start up. Also, it can be seen that the heat loss to the room varies with cooling water temperature. This variation is due the change in temperature of the Stirling Engine control volume.
After shut down there is a manufacturer specified 20 minute cool down period during which the cooling water is being circulated. Figure 4-11 illustrates a small heat loss from the cooling water to the environment over the majority of the cool down period since the cooling water temperature is at 65°C.
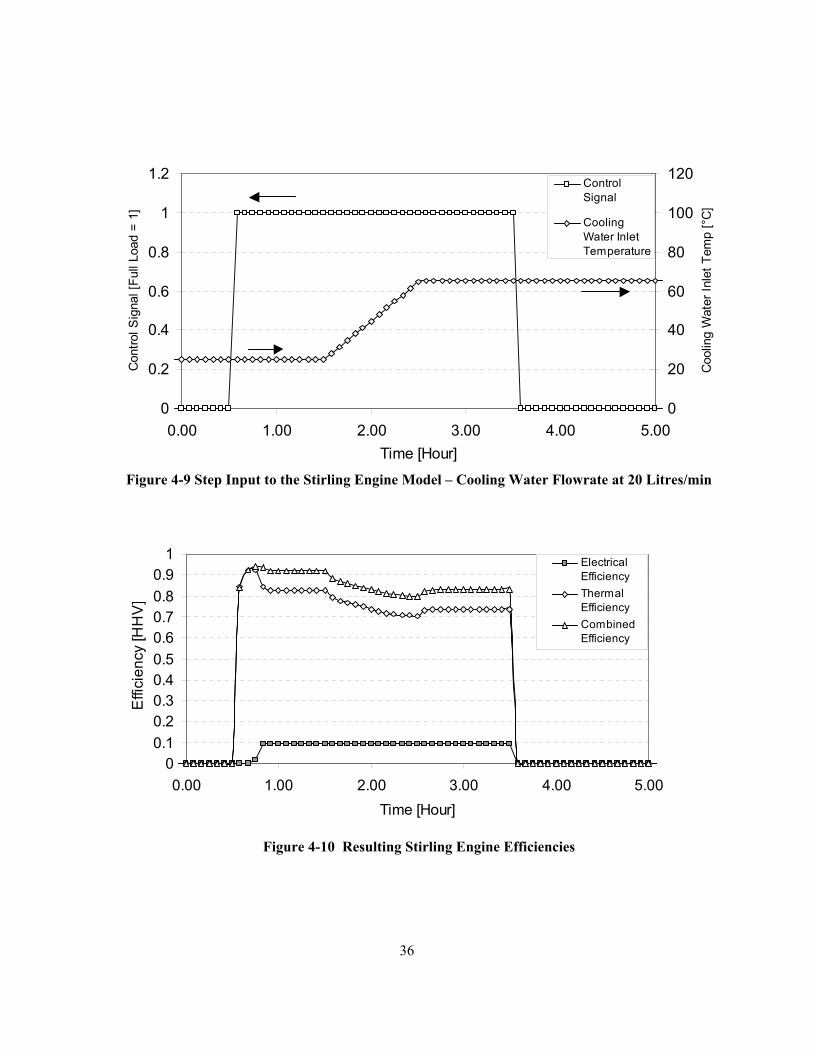
36
Figure 4-9 Step Input to the Stirling Engine Model – Cooling Water Flowrate at 20 Litres/min
Figure 4-10 Resulting Stirling Engine Efficiencies
0
0.2
0.4
0.6
0.8
1
1.2
0.00 1.00 2.00 3.00 4.00 5.00Time [Hour]
Con
trol S
igna
l [Fu
ll Lo
ad =
1]
0
20
40
60
80
100
120
Coo
ling
Wat
er In
let T
emp
[°C
]
ControlSignal
CoolingWater InletTemperature
00.10.20.30.40.50.60.70.80.9
1
0.00 1.00 2.00 3.00 4.00 5.00Time [Hour]
Effi
cien
cy [H
HV
]
ElectricalEfficiencyThermalEfficiencyCombinedEfficiency
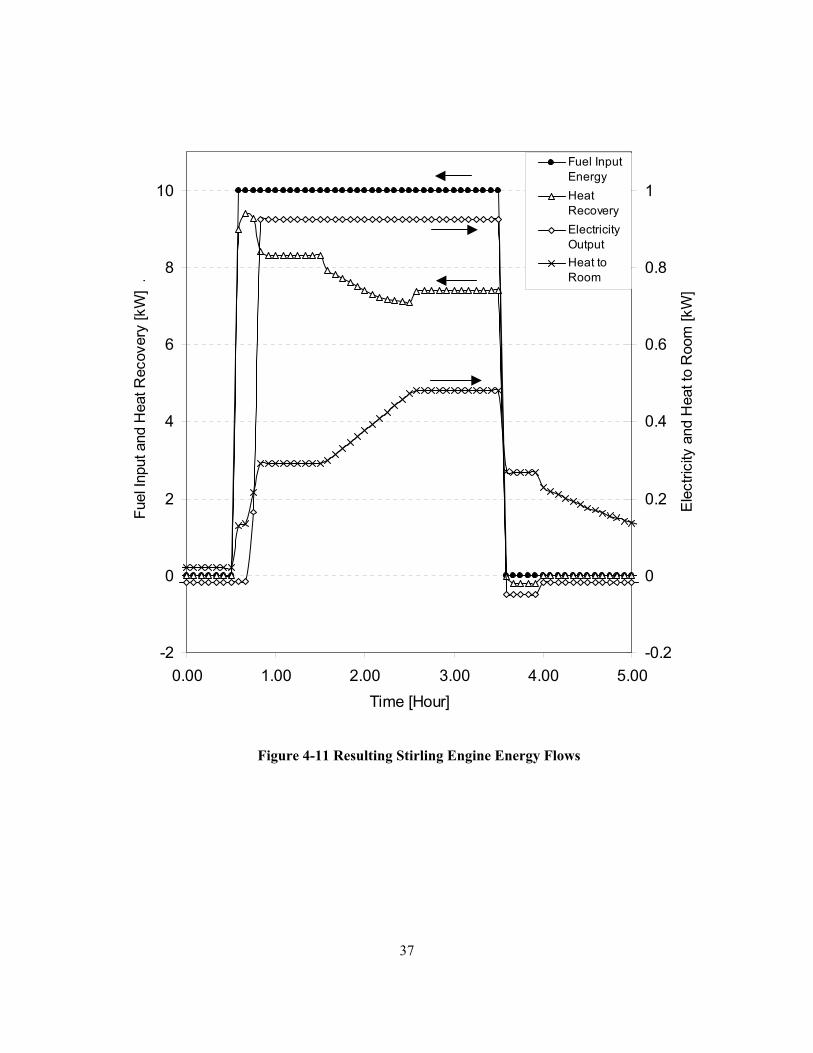
37
Figure 4-11 Resulting Stirling Engine Energy Flows
-2
0
2
4
6
8
10
0.00 1.00 2.00 3.00 4.00 5.00Time [Hour]
Fuel
Inpu
t and
Hea
t Rec
over
y [k
W]
.
-0.2
0
0.2
0.4
0.6
0.8
1
Ele
ctric
ity a
nd H
eat t
o R
oom
[kW
]
Fuel InputEnergyHeatRecoveryElectricityOutputHeat toRoom
38
4.5 Internal Combustion Engine MCHP Model
Information on internal combustion (IC) engine performance is widely available. Voorspools [30] reported on an internal combustion MCHP unit installation, and the transient behaviour of the system.
IC engines have limitations in the MCHP application for the following reasons. The emissions from small internal combustion engines can be very high depending on the fuel and quality of the engine[21]. Noise, maintenance intervals, and life of the engines are also a concern for small building applications. Lastly, greater heat losses will be incurred if the generator needs to be located outside of the building due to noise and air quality concerns.
The issues against internal combustion engines may seem problematic. However, there are a number of very good reasons to use internal combustion engines for MCHP. IC engines are very inexpensive and reliable. The technology is mature and well understood. The emissions and noise issues can be greatly reduced if the owner is willing to pay a premium for a quality engine or use a fuel such as natural gas. Also, many remote communities currently use these engines as their only source of electricity. Thus, it is likely that IC engines will be the first wide spread application of MCHP generators.
Table 4-5 lists the rated performance for a number of IC engine MCHP units.
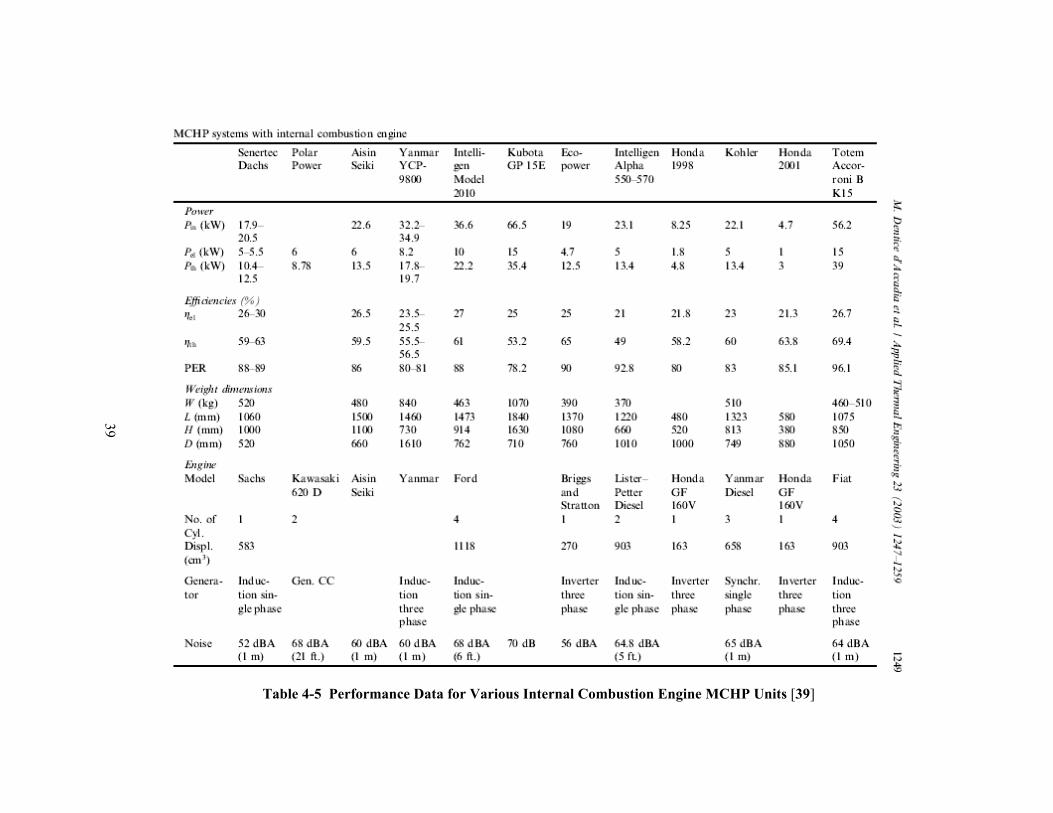
Table 4-5 Performance Data for Various Internal Combustion Engine MCHP Units [39]
39
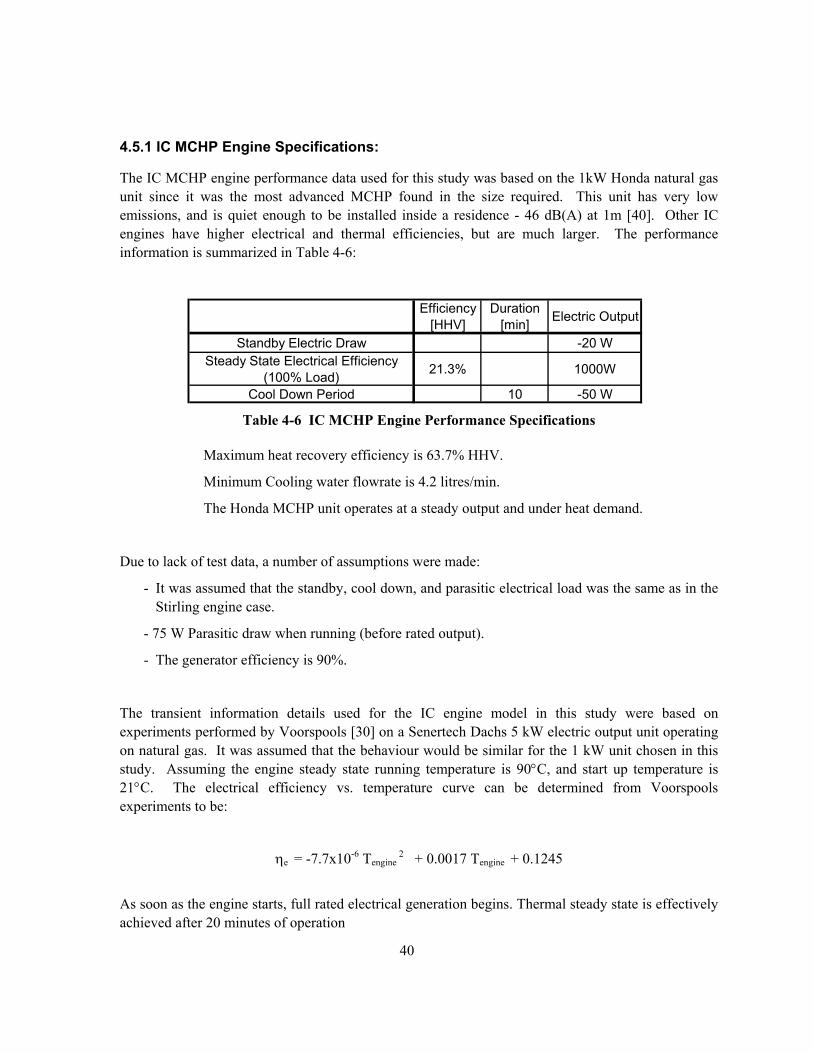
40
4.5.1 IC MCHP Engine Specifications:
The IC MCHP engine performance data used for this study was based on the 1kW Honda natural gas unit since it was the most advanced MCHP found in the size required. This unit has very low emissions, and is quiet enough to be installed inside a residence - 46 dB(A) at 1m [40]. Other IC engines have higher electrical and thermal efficiencies, but are much larger. The performance information is summarized in Table 4-6:
Table 4-6 IC MCHP Engine Performance Specifications
Maximum heat recovery efficiency is 63.7% HHV.
Minimum Cooling water flowrate is 4.2 litres/min.
The Honda MCHP unit operates at a steady output and under heat demand.
Due to lack of test data, a number of assumptions were made:
- It was assumed that the standby, cool down, and parasitic electrical load was the same as in the Stirling engine case.
- 75 W Parasitic draw when running (before rated output).
- The generator efficiency is 90%.
The transient information details used for the IC engine model in this study were based on experiments performed by Voorspools [30] on a Senertech Dachs 5 kW electric output unit operating on natural gas. It was assumed that the behaviour would be similar for the 1 kW unit chosen in this study. Assuming the engine steady state running temperature is 90°C, and start up temperature is 21°C. The electrical efficiency vs. temperature curve can be determined from Voorspools experiments to be:
ηe = -7.7x10⁻⁶ Tengine 2 + 0.0017 Tengine + 0.1245
As soon as the engine starts, full rated electrical generation begins. Thermal steady state is effectively achieved after 20 minutes of operation
Efficiency [HHV]
Duration [min] Electric Output
Standby Electric Draw -20 W Steady State Electrical Efficiency
(100% Load) 21.3% 1000W
Cool Down Period 10 -50 W
41
4.5.2 Heat Recovery Behaviour of the IC Engine
The net heat input efficiency (ηnet) will undoubtedly depend on the cooling water temperature and flowrate. Unfortunately, only the stated thermal efficiency (under ideal conditions) was available. It was assumed that the heat recovery from the IC engine would behave the same as in the Stirling engine case.
From the specification list, the maximum overall input efficiency is 85% HHV. It was assumed that this maximum rate would occur at a cooling water inlet temperature of 25°C. Major [41] indicated that this type of natural gas IC engine requires excess air at or above 140% to achieve low NOx emissions. Thus, the dew point temperature of the IC engine will be similar to that of the Stirling engine. The heat input efficiency curve fit becomes:
Taverage < 53°C: ηnet = 0.94 – 0.00189 (Taverage – 25) Taverage > 53°C: ηnet = 0.887 – 0.000417 (Taverage – 53)
Where Taverage represents the average temperature of the exhaust heat exchanger, which is dependant on the cooling water inlet temperature and the flowrate.
The model coefficients that yield representative operation are:
UAHX 125 [W/°C] UAloss 5 [W/°C] [MC]cv 30 [kJ/°C]
4.5.3 Control Strategy for IC Engine MCHP Units
The internal combustion CHP unit selected is designed to operate at a constant electrical output of 1kW. It will function when there is demand for heat only. This is a standard configuration for grid-connected units. Many generators are capable of electrical demand control, but are designed for grid independent operation, which is beyond the scope of this study.
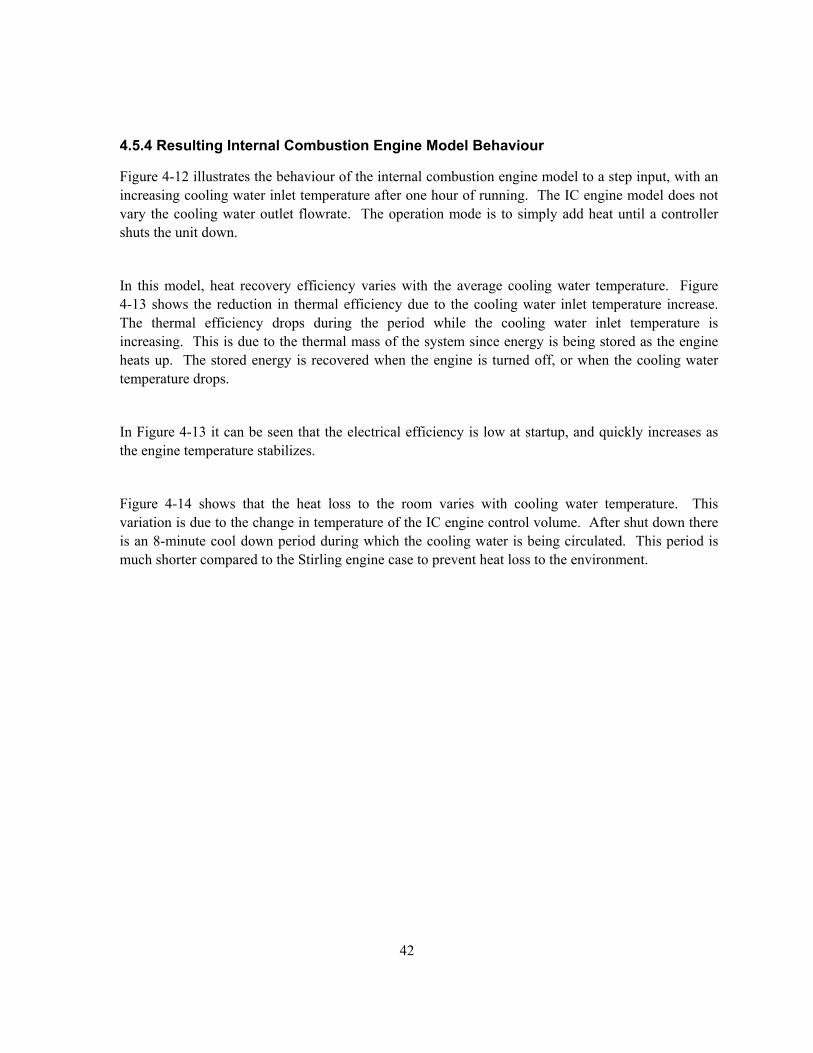
42
4.5.4 Resulting Internal Combustion Engine Model Behaviour
Figure 4-12 illustrates the behaviour of the internal combustion engine model to a step input, with an increasing cooling water inlet temperature after one hour of running. The IC engine model does not vary the cooling water outlet flowrate. The operation mode is to simply add heat until a controller shuts the unit down.
In this model, heat recovery efficiency varies with the average cooling water temperature. Figure 4-13 shows the reduction in thermal efficiency due to the cooling water inlet temperature increase. The thermal efficiency drops during the period while the cooling water inlet temperature is increasing. This is due to the thermal mass of the system since energy is being stored as the engine heats up. The stored energy is recovered when the engine is turned off, or when the cooling water temperature drops.
In Figure 4-13 it can be seen that the electrical efficiency is low at startup, and quickly increases as the engine temperature stabilizes.
Figure 4-14 shows that the heat loss to the room varies with cooling water temperature. This variation is due to the change in temperature of the IC engine control volume. After shut down there is an 8-minute cool down period during which the cooling water is being circulated. This period is much shorter compared to the Stirling engine case to prevent heat loss to the environment.
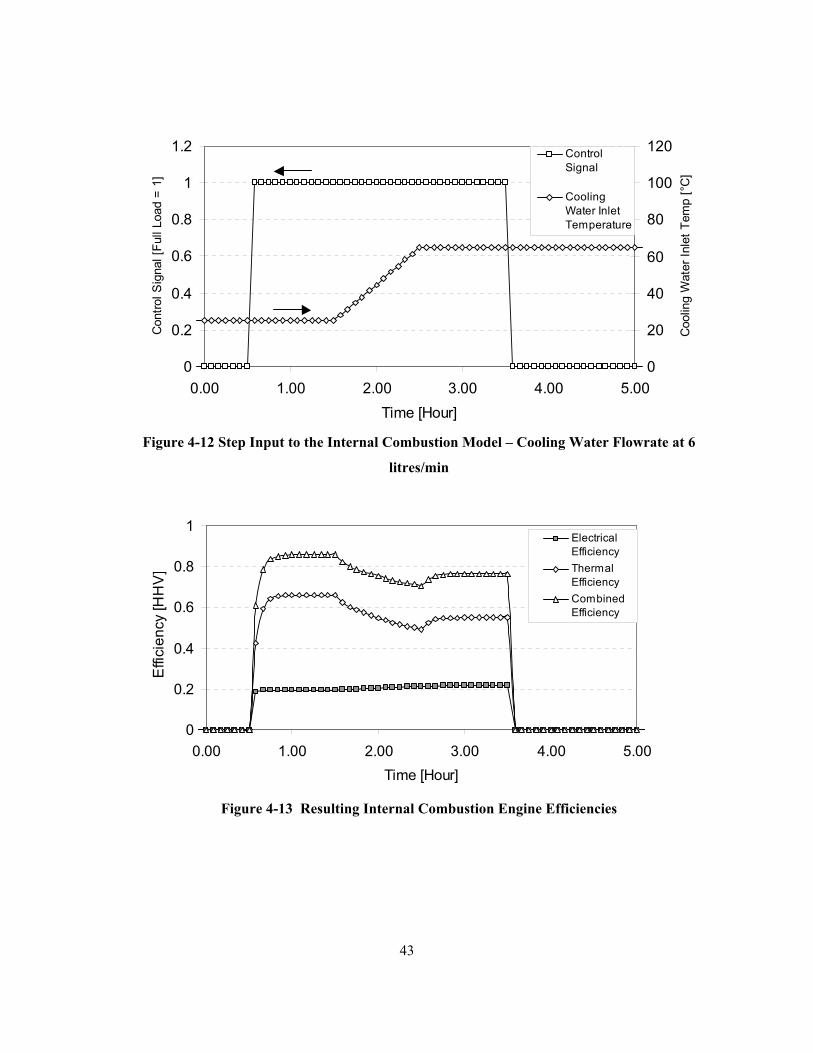
43
Figure 4-12 Step Input to the Internal Combustion Model – Cooling Water Flowrate at 6
litres/min
Figure 4-13 Resulting Internal Combustion Engine Efficiencies
0
0.2
0.4
0.6
0.8
1
1.2
0.00 1.00 2.00 3.00 4.00 5.00Time [Hour]
Con
trol S
igna
l [Fu
ll Lo
ad =
1]
0
20
40
60
80
100
120
Coo
ling
Wat
er In
let T
emp
[°C
]
ControlSignal
CoolingWater InletTemperature
0
0.2
0.4
0.6
0.8
1
0.00 1.00 2.00 3.00 4.00 5.00Time [Hour]
Effi
cien
cy [H
HV
]
ElectricalEfficiencyThermalEfficiencyCombinedEfficiency
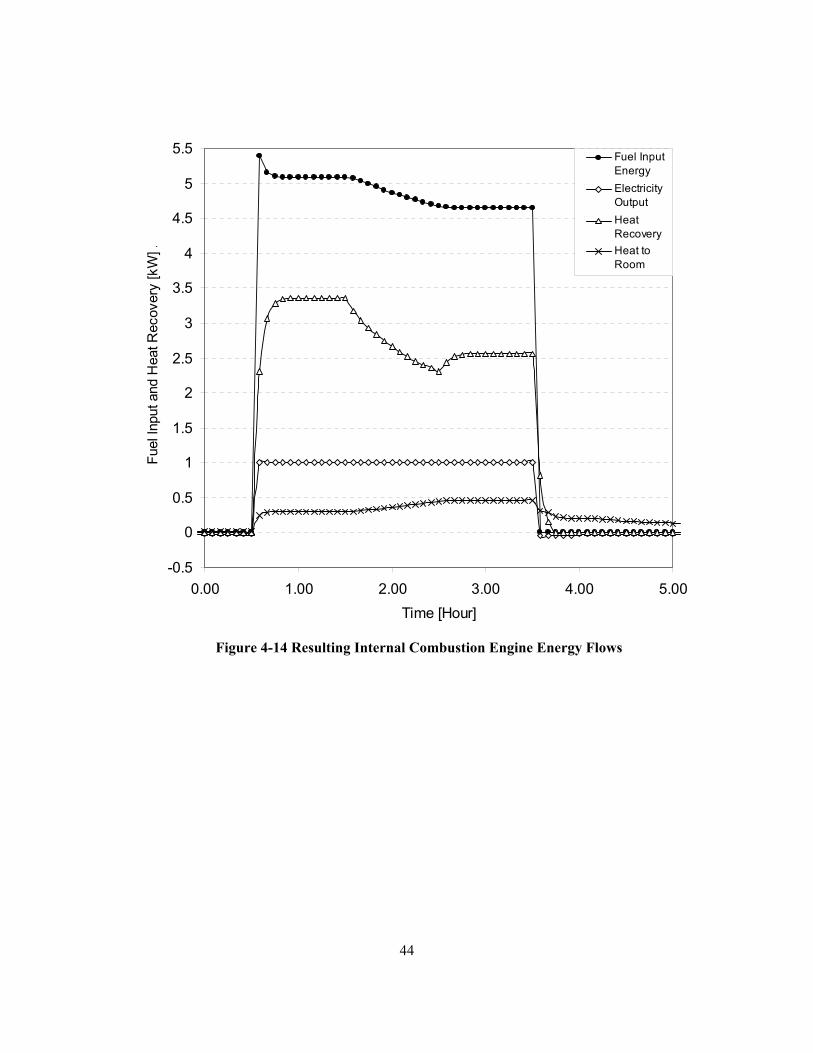
44
Figure 4-14 Resulting Internal Combustion Engine Energy Flows
-0.5
0
0.5
1
1.5
2
2.5
3
3.5
4
4.5
5
5.5
0.00 1.00 2.00 3.00 4.00 5.00Time [Hour]
Fuel
Inpu
t and
Hea
t Rec
over
y [k
W] .
Fuel InputEnergyElectricityOutputHeatRecoveryHeat toRoom
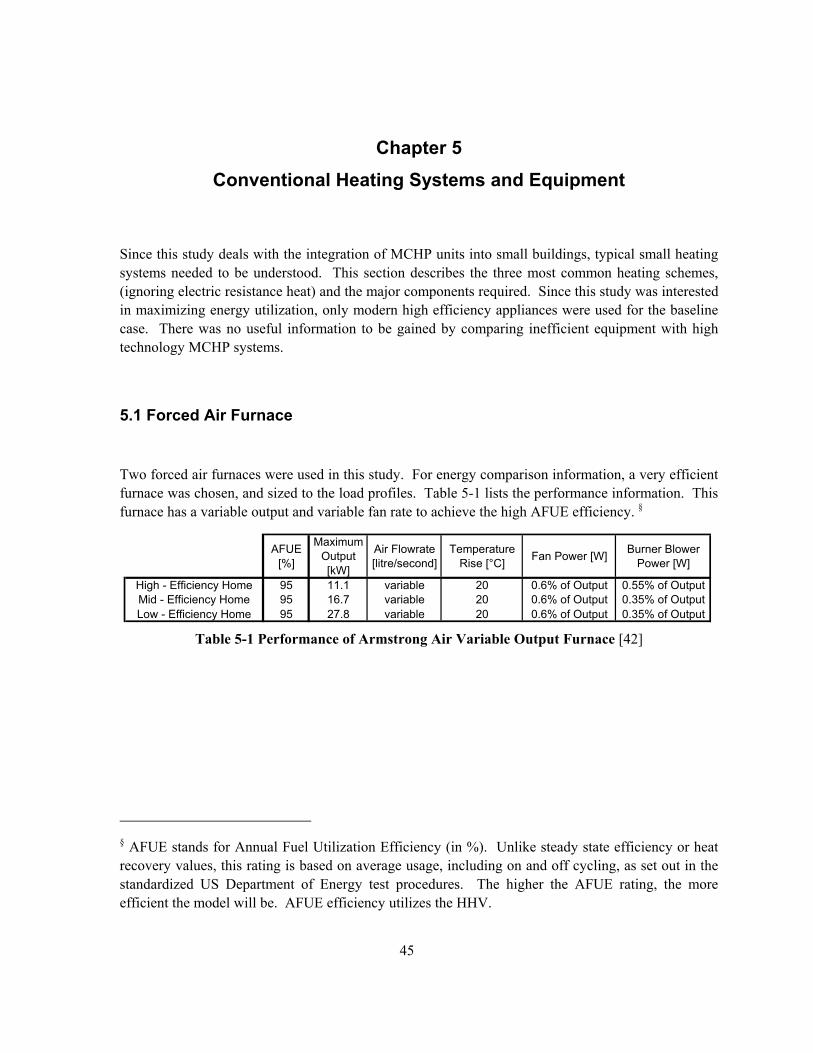
45
Chapter 5 Conventional Heating Systems and Equipment
Since this study deals with the integration of MCHP units into small buildings, typical small heating systems needed to be understood. This section describes the three most common heating schemes, (ignoring electric resistance heat) and the major components required. Since this study was interested in maximizing energy utilization, only modern high efficiency appliances were used for the baseline case. There was no useful information to be gained by comparing inefficient equipment with high technology MCHP systems.
5.1 Forced Air Furnace
Two forced air furnaces were used in this study. For energy comparison information, a very efficient furnace was chosen, and sized to the load profiles. Table 5-1 lists the performance information. This furnace has a variable output and variable fan rate to achieve the high AFUE efficiency. §
Table 5-1 Performance of Armstrong Air Variable Output Furnace [42]
§ AFUE stands for Annual Fuel Utilization Efficiency (in %). Unlike steady state efficiency or heat recovery values, this rating is based on average usage, including on and off cycling, as set out in the standardized US Department of Energy test procedures. The higher the AFUE rating, the more efficient the model will be. AFUE efficiency utilizes the HHV.
AFUE [%]
MaximumOutput [kW]
Air Flowrate [litre/second]
Temperature Rise [°C] Fan Power [W] Burner Blower
Power [W]
High - Efficiency Home 95 11.1 variable 20 0.6% of Output 0.55% of OutputMid - Efficiency Home 95 16.7 variable 20 0.6% of Output 0.35% of OutputLow - Efficiency Home 95 27.8 variable 20 0.6% of Output 0.35% of Output
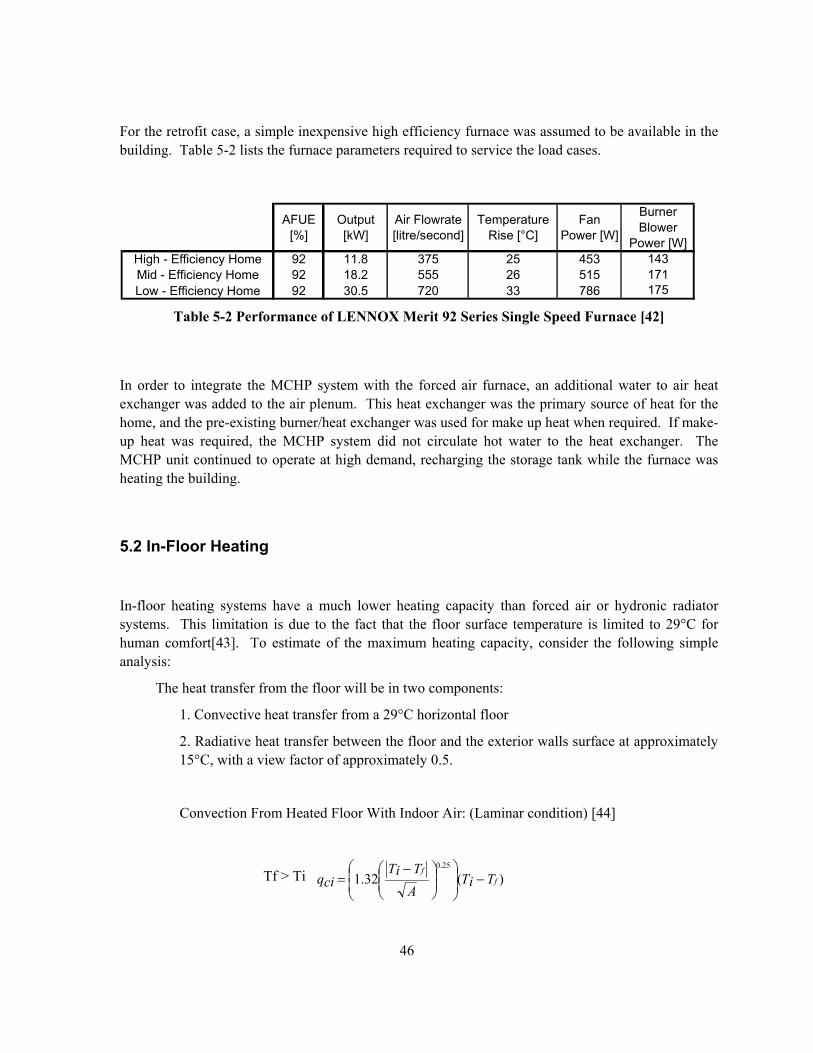
46
For the retrofit case, a simple inexpensive high efficiency furnace was assumed to be available in the building. Table 5-2 lists the furnace parameters required to service the load cases.
Table 5-2 Performance of LENNOX Merit 92 Series Single Speed Furnace [42]
In order to integrate the MCHP system with the forced air furnace, an additional water to air heat exchanger was added to the air plenum. This heat exchanger was the primary source of heat for the home, and the pre-existing burner/heat exchanger was used for make up heat when required. If make-up heat was required, the MCHP system did not circulate hot water to the heat exchanger. The MCHP unit continued to operate at high demand, recharging the storage tank while the furnace was heating the building.
5.2 In-Floor Heating
In-floor heating systems have a much lower heating capacity than forced air or hydronic radiator systems. This limitation is due to the fact that the floor surface temperature is limited to 29°C for human comfort[43]. To estimate of the maximum heating capacity, consider the following simple analysis:
The heat transfer from the floor will be in two components:
1. Convective heat transfer from a 29°C horizontal floor
2. Radiative heat transfer between the floor and the exterior walls surface at approximately 15°C, with a view factor of approximately 0.5.
Convection From Heated Floor With Indoor Air: (Laminar condition) [44]
Tf > Ti )(32.125.0
ff
TiTATiT
icq −
−=
AFUE [%]
Output [kW]
Air Flowrate [litre/second]
Temperature Rise [°C]
Fan Power [W]
Burner Blower
Power [W]High - Efficiency Home 92 11.8 375 25 453 143Mid - Efficiency Home 92 18.2 555 26 515 171Low - Efficiency Home 92 30.5 720 33 786 175
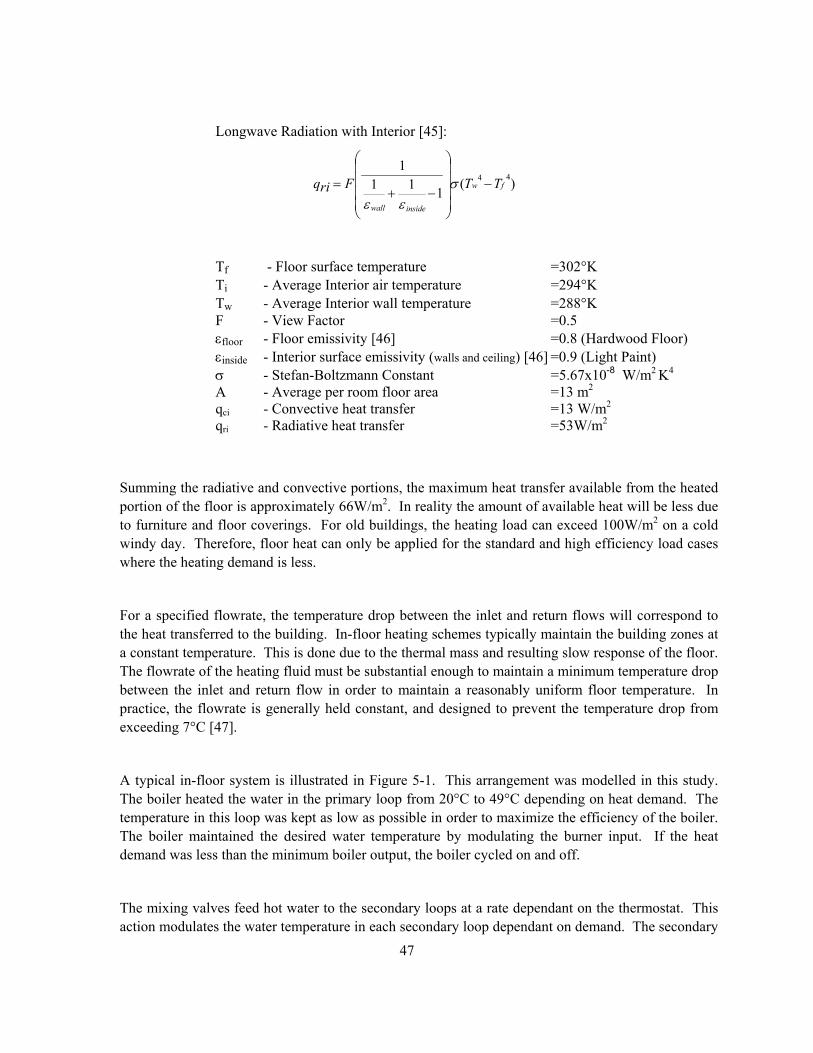
47
Longwave Radiation with Interior [45]:
)(111
144fw
insidewall
TTFirq −
−+= σ
εε
Tf - Floor surface temperature =302°K Ti - Average Interior air temperature =294°K Tw - Average Interior wall temperature =288°K F - View Factor =0.5 εfloor - Floor emissivity [46] =0.8 (Hardwood Floor) εinside - Interior surface emissivity (walls and ceiling) [46] =0.9 (Light Paint) σ - Stefan-Boltzmann Constant =5.67x10⁻⁸ W/m2
K4 A - Average per room floor area =13 m2 qci - Convective heat transfer =13 W/m2 qri - Radiative heat transfer =53W/m2
Summing the radiative and convective portions, the maximum heat transfer available from the heated portion of the floor is approximately 66W/m2. In reality the amount of available heat will be less due to furniture and floor coverings. For old buildings, the heating load can exceed 100W/m2 on a cold windy day. Therefore, floor heat can only be applied for the standard and high efficiency load cases where the heating demand is less.
For a specified flowrate, the temperature drop between the inlet and return flows will correspond to the heat transferred to the building. In-floor heating schemes typically maintain the building zones at a constant temperature. This is done due to the thermal mass and resulting slow response of the floor. The flowrate of the heating fluid must be substantial enough to maintain a minimum temperature drop between the inlet and return flow in order to maintain a reasonably uniform floor temperature. In practice, the flowrate is generally held constant, and designed to prevent the temperature drop from exceeding 7°C [47].
A typical in-floor system is illustrated in Figure 5-1. This arrangement was modelled in this study. The boiler heated the water in the primary loop from 20°C to 49°C depending on heat demand. The temperature in this loop was kept as low as possible in order to maximize the efficiency of the boiler. The boiler maintained the desired water temperature by modulating the burner input. If the heat demand was less than the minimum boiler output, the boiler cycled on and off.
The mixing valves feed hot water to the secondary loops at a rate dependant on the thermostat. This action modulates the water temperature in each secondary loop dependant on demand. The secondary
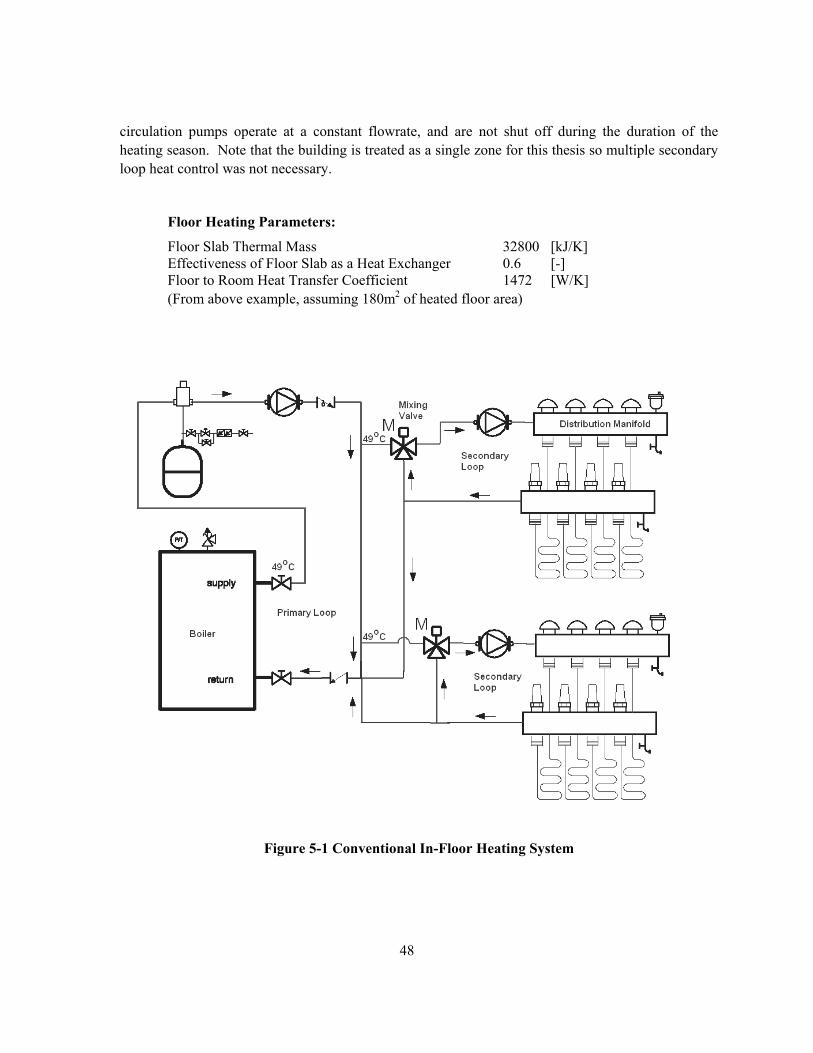
48
circulation pumps operate at a constant flowrate, and are not shut off during the duration of the heating season. Note that the building is treated as a single zone for this thesis so multiple secondary loop heat control was not necessary.
Floor Heating Parameters:
Floor Slab Thermal Mass 32800 [kJ/K] Effectiveness of Floor Slab as a Heat Exchanger 0.6 [-] Floor to Room Heat Transfer Coefficient 1472 [W/K]
(From above example, assuming 180m2 of heated floor area)
Figure 5-1 Conventional In-Floor Heating System
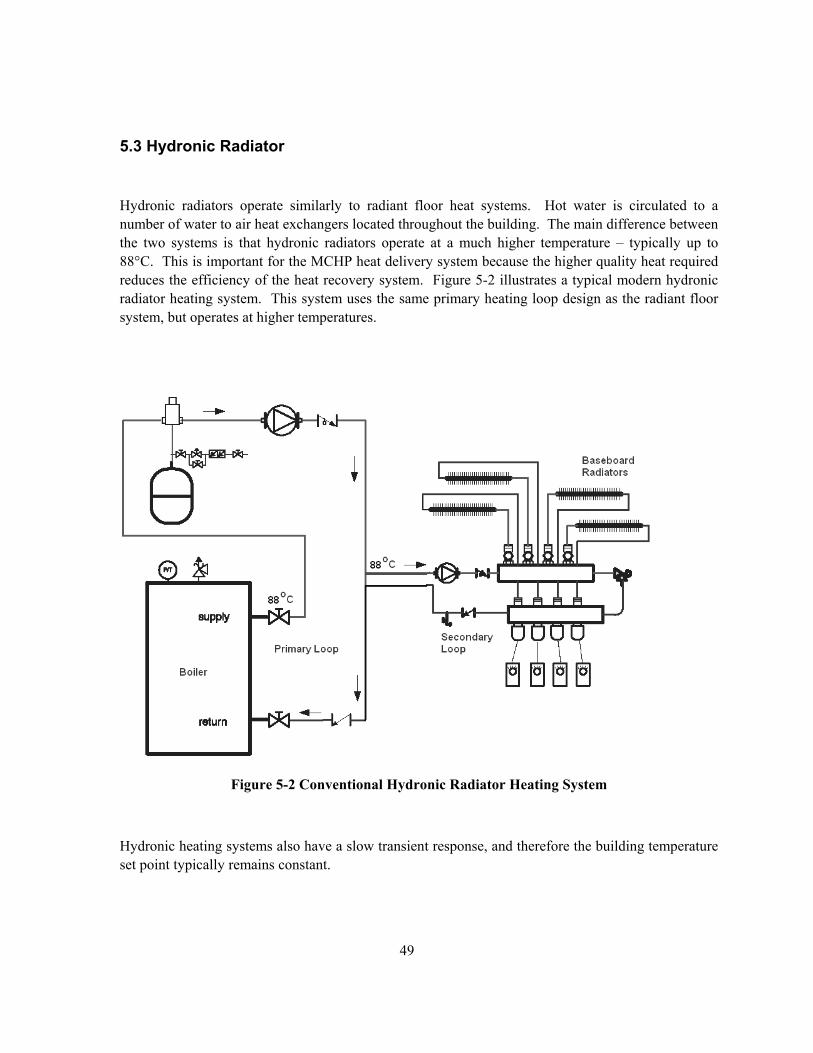
49
5.3 Hydronic Radiator
Hydronic radiators operate similarly to radiant floor heat systems. Hot water is circulated to a number of water to air heat exchangers located throughout the building. The main difference between the two systems is that hydronic radiators operate at a much higher temperature – typically up to 88°C. This is important for the MCHP heat delivery system because the higher quality heat required reduces the efficiency of the heat recovery system. Figure 5-2 illustrates a typical modern hydronic radiator heating system. This system uses the same primary heating loop design as the radiant floor system, but operates at higher temperatures.
Figure 5-2 Conventional Hydronic Radiator Heating System
Hydronic heating systems also have a slow transient response, and therefore the building temperature set point typically remains constant.
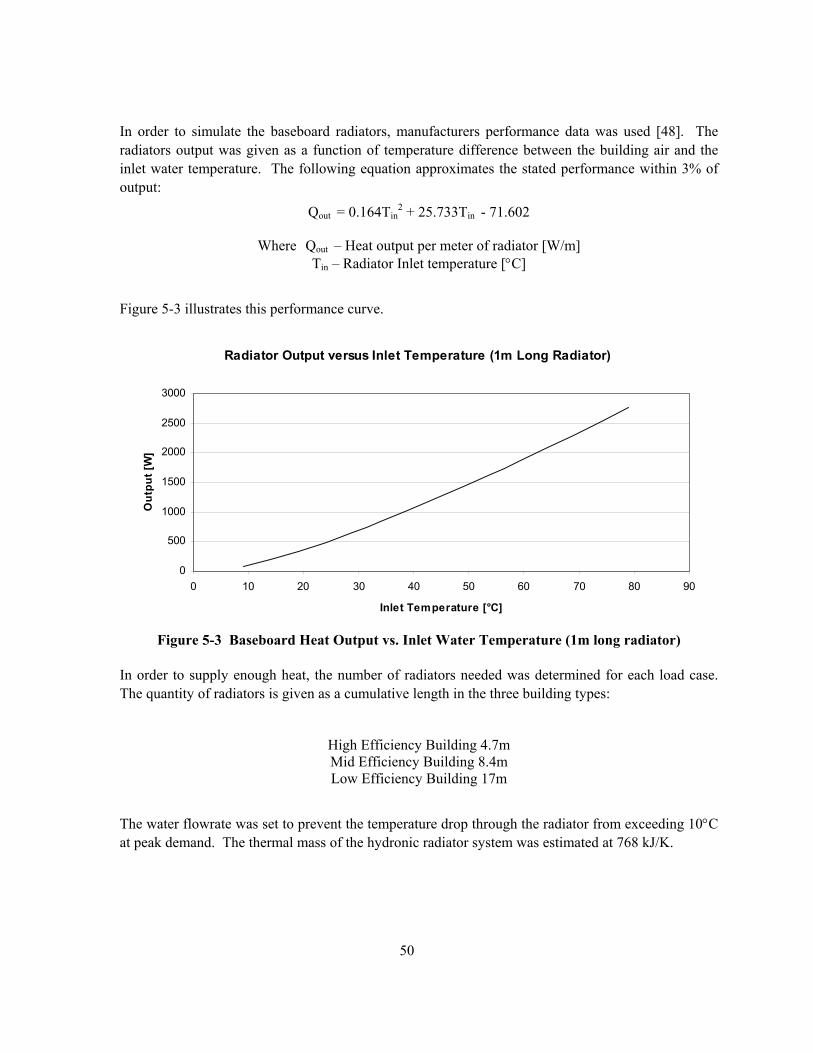
50
In order to simulate the baseboard radiators, manufacturers performance data was used [48]. The radiators output was given as a function of temperature difference between the building air and the inlet water temperature. The following equation approximates the stated performance within 3% of output:
Qout = 0.164Tin2 + 25.733Tin - 71.602
Where Qout – Heat output per meter of radiator [W/m]
Tin – Radiator Inlet temperature [°C]
Figure 5-3 illustrates this performance curve.
Figure 5-3 Baseboard Heat Output vs. Inlet Water Temperature (1m long radiator)
In order to supply enough heat, the number of radiators needed was determined for each load case. The quantity of radiators is given as a cumulative length in the three building types:
High Efficiency Building 4.7m Mid Efficiency Building 8.4m Low Efficiency Building 17m
The water flowrate was set to prevent the temperature drop through the radiator from exceeding 10°C at peak demand. The thermal mass of the hydronic radiator system was estimated at 768 kJ/K.
Radiator Output versus Inlet Temperature (1m Long Radiator)
0
500
1000
1500
2000
2500
3000
0 10 20 30 40 50 60 70 80 90
Inlet Temperature [°C]
Out
put [
W]
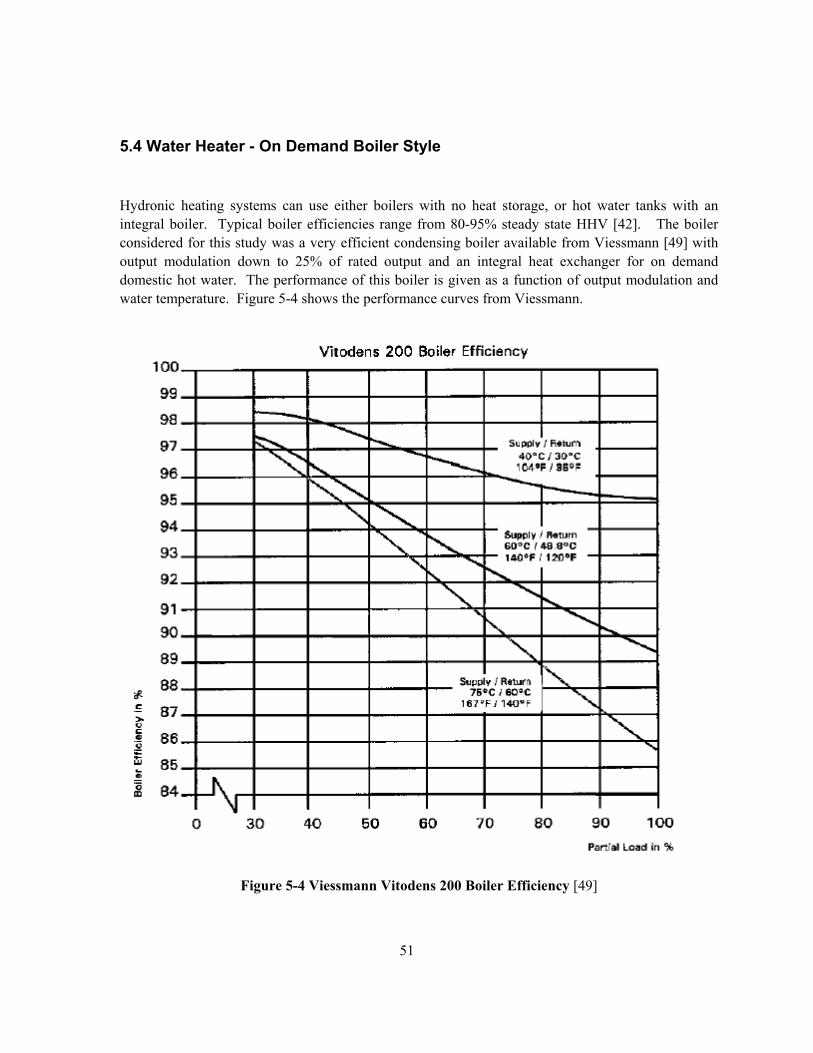
51
5.4 Water Heater - On Demand Boiler Style
Hydronic heating systems can use either boilers with no heat storage, or hot water tanks with an integral boiler. Typical boiler efficiencies range from 80-95% steady state HHV [42]. The boiler considered for this study was a very efficient condensing boiler available from Viessmann [49] with output modulation down to 25% of rated output and an integral heat exchanger for on demand domestic hot water. The performance of this boiler is given as a function of output modulation and water temperature. Figure 5-4 shows the performance curves from Viessmann.
Figure 5-4 Viessmann Vitodens 200 Boiler Efficiency [49]
52
The given boiler efficiency curves can be approximated within 0.5% using the following two dimensional relation:
Efficiency = (-8.1x10⁻⁶ Mod + 1.16x10⁻⁵)Tavg
2 - (0.0029 Mod + 0.00042)Tavg + (0.0649 Mod + 0.9987) Where:
Mod = ratio of output to rated output Tavg = average water temperature
The primary loop flowrate was given to be 17.5 litres per minute.
The domestic hot water flowrate was restricted to 8 litres per minute. The boiler modulated its output to maintain the hot water set point temperature.
No heat to the building was available when domestic hot water was demanded.
The integral counter-flow flat plate heat exchanger for domestic hot water heating was assumed to have an effectiveness of 0.8.
Due to the wide range of heat demand between the various load profiles, two boilers were needed:
For the High and Mid Efficiency buildings the Vitodens WB2 6-24C was required. This boiler had a thermal output of 6-24 kW.
For the Low Efficiency building, a larger capacity boiler was needed. The Vitodens WB2 8-32C with a thermal output of 8-32 kW was used.

53
5.5 Water Heater - Tank Style
Typical tank hot water heaters have dismal average performance due to stand by and stack losses. An Energy Factor (EF) rating is used when discussing the efficiency of a water heater. EF is a measure of the overall efficiency of a water heater. It is determined by comparing the energy supplied in heated water to the building to the total daily energy consumption of the water heater. Since stand by losses are included in the EF, the actual steady state heat recovery efficiency is much higher. Typically natural gas water heaters have an EF of 60% and an average heat recovery efficiency of 80% [42].
There are some hot water heaters with high performance. American Water Heaters Inc. manufactures the Polaris model with an EF of 83%, and an average heat recovery of 95%. This tank is specifically designed for space heating. When used for space heating, the AFUE rating is 89%.
Electric water heaters are generally much better insulated than standard natural gas water heaters, and operate at a heat recovery efficiency of 100%. Due to stand by losses, the EF of a good electric water heater is in the order of 93% [42].
In this study, the electric water heater was selected as the thermal storage vessel when little or no make up heat is required from this component. In the case where the storage tank provided make-up heat, the natural gas fired Polaris tank was specified. An insulating blanket (RSI 1.76) was added to each of these tanks bringing up the total insulation value to RSI 5.28 m2 K/W. This will increase the EF value of the Polaris tank to 85.3%, and the Electrical tank to 95.3%
Important note on water temperature:
In this study, domestic hot water was delivered at 49°C as outlined in the recent changes to the national plumbing code [50]. An anti-scald valve was included on the supply line for domestic hot water to ensure this temperature was not exceeded. In the recent plumbing code update, it was reaffirmed that storage of domestic hot water must be at a minimum of 60°C to prevent legionella bacteria from forming in the tank. Legionella bacteria cause Legionnaires disease, which is considered a significant health risk. Periodic cold cycles are permitted and circulating domestic hot water must be maintained at 55°C.
54
5.6 Pumps
Pump data is widely available for the hydronic and floor heating systems. However, in order to best simulate real systems, measurements were made of installed pumps.
For boiler primary, and to heating coil applications: 10-30 litre/minute Grundfos UP 15 42 F - Draws 67 W For short circulations, low pressure drop, 0-10 litre/minute Grundfos UP 10-16 - Draws 25 W
5.7 General Notes and Requirements
In this study, the hydronic heat delivery system was kept separate from the domestic hot water system. This was done since the building code in some regions does not allow the combination of the two as a precaution to prevent contamination. If the systems were combined, more expensive materials would need to be used for pumps, heat exchangers etc. to comply with the building code. Another reason for keeping the domestic water separate is to prevent mineral deposits from fouling up the components. It is worth noting that the minerals in domestic water usually come out of solution at high water temperatures, not at low water temperatures. This means that the water heating device would normally experience the majority of the mineral fouling, not the heat exchangers or radiant floor tubes [51].
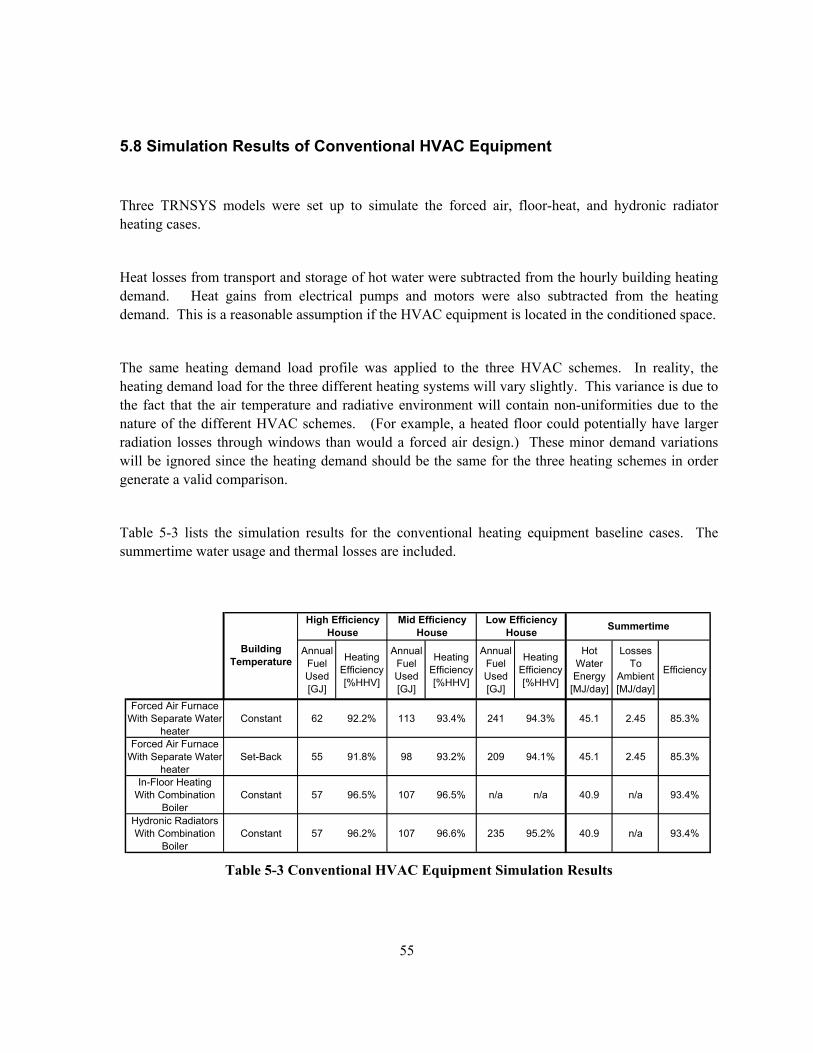
55
5.8 Simulation Results of Conventional HVAC Equipment
Three TRNSYS models were set up to simulate the forced air, floor-heat, and hydronic radiator heating cases.
Heat losses from transport and storage of hot water were subtracted from the hourly building heating demand. Heat gains from electrical pumps and motors were also subtracted from the heating demand. This is a reasonable assumption if the HVAC equipment is located in the conditioned space.
The same heating demand load profile was applied to the three HVAC schemes. In reality, the heating demand load for the three different heating systems will vary slightly. This variance is due to the fact that the air temperature and radiative environment will contain non-uniformities due to the nature of the different HVAC schemes. (For example, a heated floor could potentially have larger radiation losses through windows than would a forced air design.) These minor demand variations will be ignored since the heating demand should be the same for the three heating schemes in order generate a valid comparison.
Table 5-3 lists the simulation results for the conventional heating equipment baseline cases. The summertime water usage and thermal losses are included.
Table 5-3 Conventional HVAC Equipment Simulation Results
Annual Fuel Used [GJ]
Heating Efficiency [%HHV]
Annual Fuel Used [GJ]
Heating Efficiency [%HHV]
Annual Fuel Used [GJ]
Heating Efficiency [%HHV]
Hot Water Energy
[MJ/day]
Losses To
Ambient [MJ/day]
Efficiency
Forced Air Furnace With Separate Water
heaterConstant 62 92.2% 113 93.4% 241 94.3% 45.1 2.45 85.3%
Forced Air Furnace With Separate Water
heaterSet-Back 55 91.8% 98 93.2% 209 94.1% 45.1 2.45 85.3%
In-Floor Heating With Combination
BoilerConstant 57 96.5% 107 96.5% n/a n/a 40.9 n/a 93.4%
Hydronic Radiators With Combination
BoilerConstant 57 96.2% 107 96.6% 235 95.2% 40.9 n/a 93.4%
Summertime
Building Temperature
High Efficiency House
Mid Efficiency House
Low Efficiency House

56
In Table 5-3 the annual fuel used columns represent the sum of the fuel used to provide both heating and hot water. In the forced air case, the total efficiency drops as the heating load decreases. This is because as the heating load decreases, the hot water load becomes more dominant. Since hot water is generated at a lower efficiency, the total efficiency decreases.
The infloor-heating system was not used with the low efficiency house load case. As stated in Section 5.2 radiant flooring has a limited heating capacity since the floor temperature is not permitted to exceed 29°C.
The losses to ambient column in Table 5-3 represent the standby thermal losses of the storage tank. Since no storage tank was present when the combination boiler was used, there were no standby thermal losses.
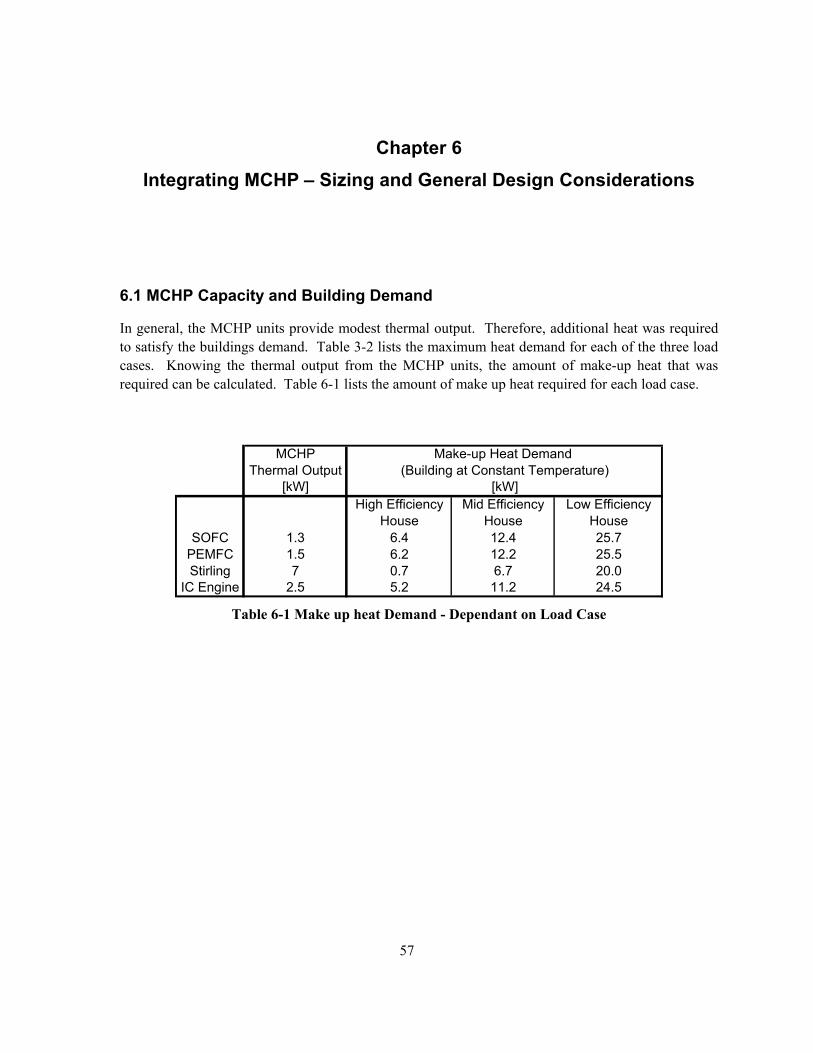
57
Chapter 6 Integrating MCHP – Sizing and General Design Considerations
6.1 MCHP Capacity and Building Demand
In general, the MCHP units provide modest thermal output. Therefore, additional heat was required to satisfy the buildings demand. Table 3-2 lists the maximum heat demand for each of the three load cases. Knowing the thermal output from the MCHP units, the amount of make-up heat that was required can be calculated. Table 6-1 lists the amount of make up heat required for each load case.
Table 6-1 Make up heat Demand - Dependant on Load Case
MCHPThermal Output
[kW]High Efficiency
HouseMid Efficiency
HouseLow Efficiency
HouseSOFC 1.3 6.4 12.4 25.7
PEMFC 1.5 6.2 12.2 25.5Stirling 7 0.7 6.7 20.0
IC Engine 2.5 5.2 11.2 24.5
Make-up Heat Demand (Building at Constant Temperature)
[kW]
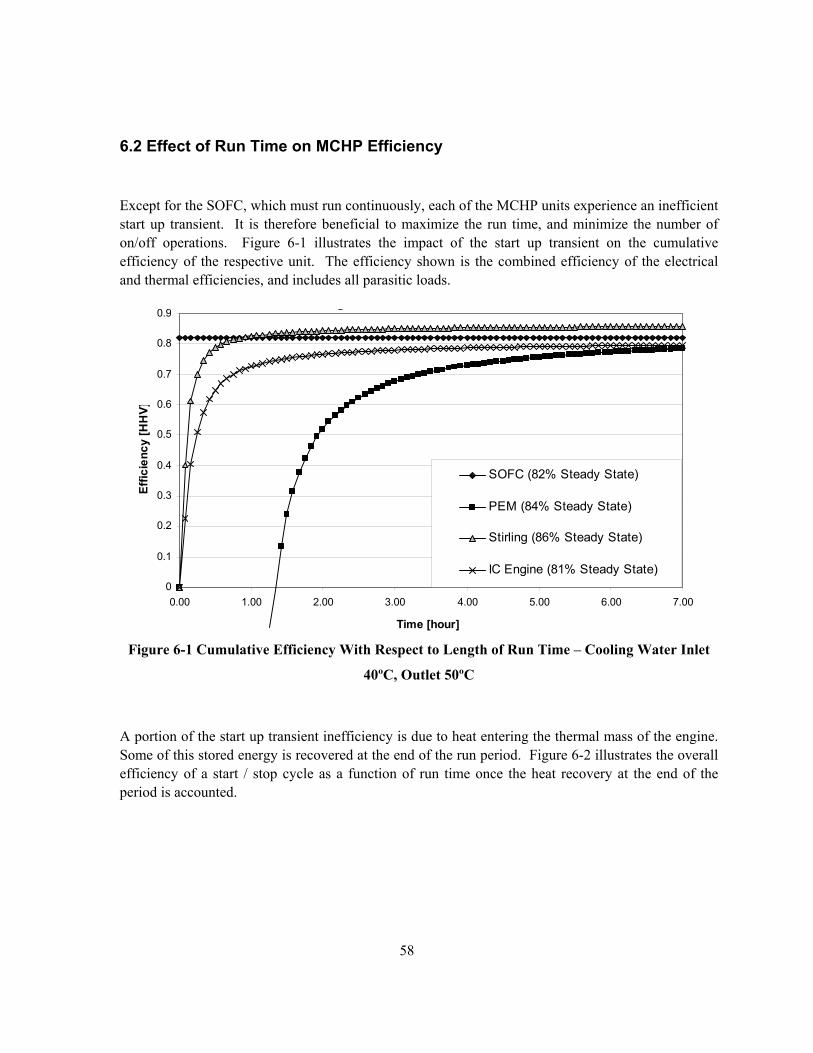
58
6.2 Effect of Run Time on MCHP Efficiency
Except for the SOFC, which must run continuously, each of the MCHP units experience an inefficient start up transient. It is therefore beneficial to maximize the run time, and minimize the number of on/off operations. Figure 6-1 illustrates the impact of the start up transient on the cumulative efficiency of the respective unit. The efficiency shown is the combined efficiency of the electrical and thermal efficiencies, and includes all parasitic loads.
Figure 6-1 Cumulative Efficiency With Respect to Length of Run Time – Cooling Water Inlet
40ºC, Outlet 50ºC
A portion of the start up transient inefficiency is due to heat entering the thermal mass of the engine. Some of this stored energy is recovered at the end of the run period. Figure 6-2 illustrates the overall efficiency of a start / stop cycle as a function of run time once the heat recovery at the end of the period is accounted.
g
0
0.1
0.2
0.3
0.4
0.5
0.6
0.7
0.8
0.9
0.00 1.00 2.00 3.00 4.00 5.00 6.00 7.00
Time [hour]
Effic
ienc
y [H
HV]
SOFC (82% Steady State)
PEM (84% Steady State)
Stirling (86% Steady State)
IC Engine (81% Steady State)
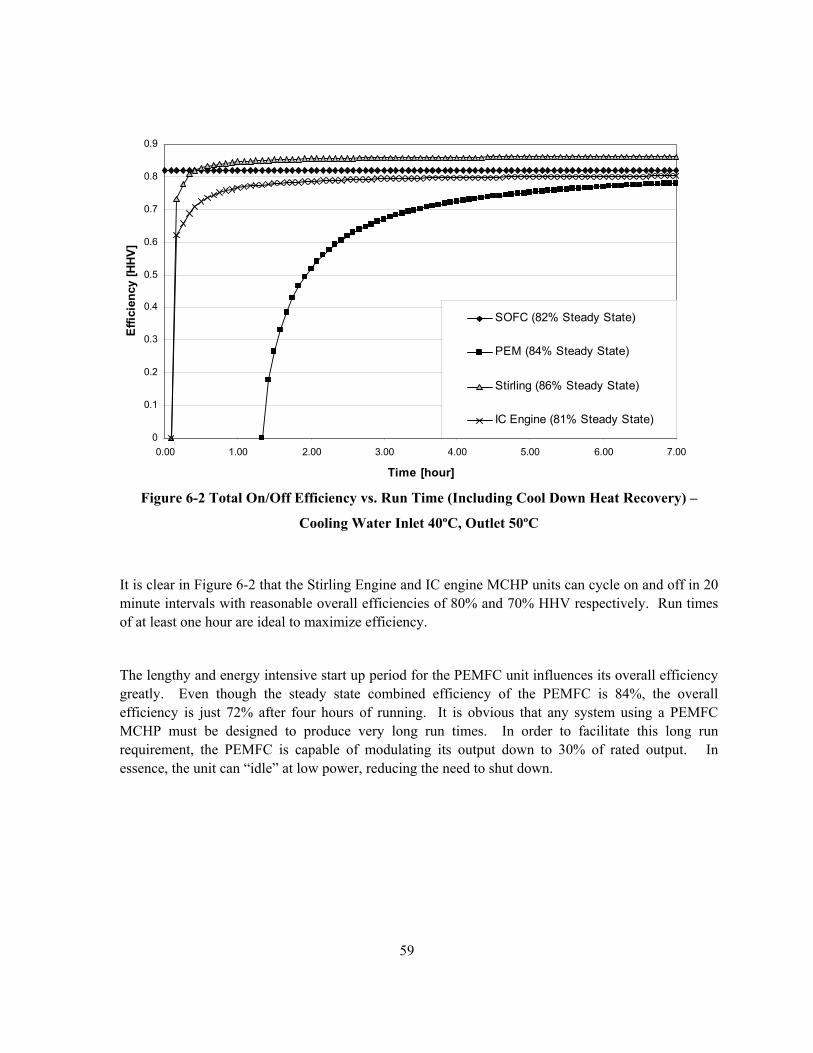
59
Figure 6-2 Total On/Off Efficiency vs. Run Time (Including Cool Down Heat Recovery) –
Cooling Water Inlet 40ºC, Outlet 50ºC
It is clear in Figure 6-2 that the Stirling Engine and IC engine MCHP units can cycle on and off in 20 minute intervals with reasonable overall efficiencies of 80% and 70% HHV respectively. Run times of at least one hour are ideal to maximize efficiency.
The lengthy and energy intensive start up period for the PEMFC unit influences its overall efficiency greatly. Even though the steady state combined efficiency of the PEMFC is 84%, the overall efficiency is just 72% after four hours of running. It is obvious that any system using a PEMFC MCHP must be designed to produce very long run times. In order to facilitate this long run requirement, the PEMFC is capable of modulating its output down to 30% of rated output. In essence, the unit can “idle” at low power, reducing the need to shut down.
0
0.1
0.2
0.3
0.4
0.5
0.6
0.7
0.8
0.9
0.00 1.00 2.00 3.00 4.00 5.00 6.00 7.00
Time [hour]
Effi
cien
cy [H
HV]
SOFC (82% Steady State)
PEM (84% Steady State)
Stirling (86% Steady State)
IC Engine (81% Steady State)
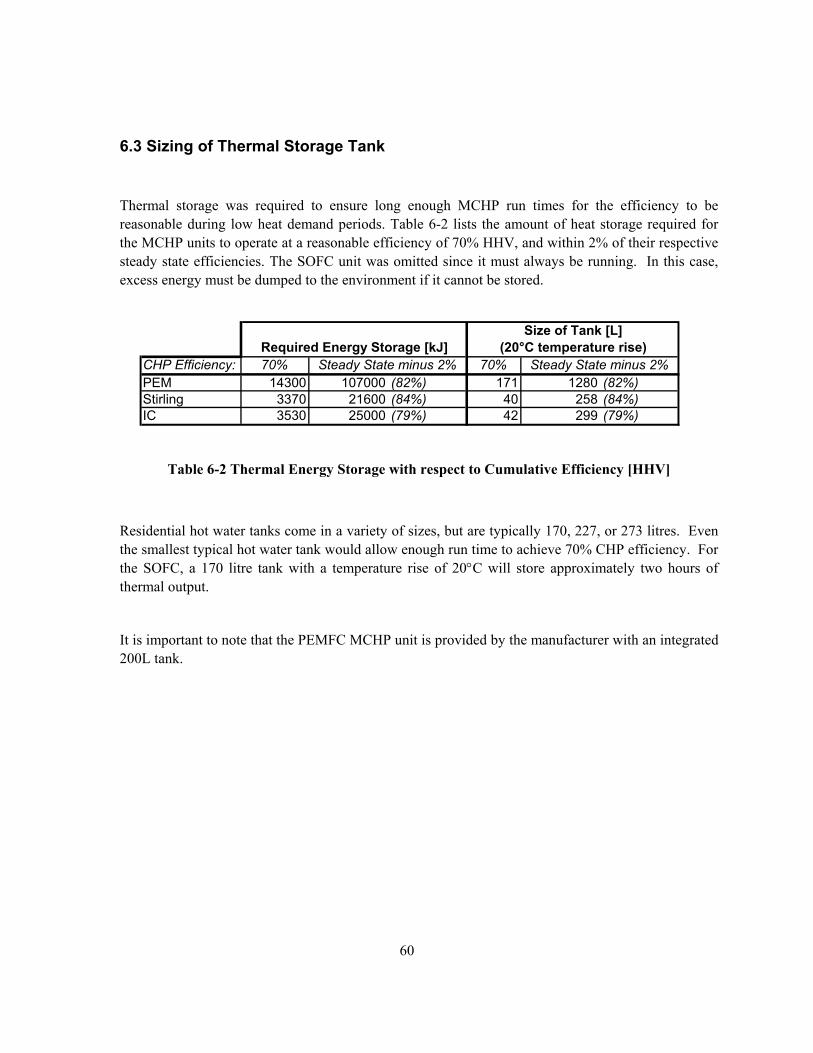
60
6.3 Sizing of Thermal Storage Tank
Thermal storage was required to ensure long enough MCHP run times for the efficiency to be reasonable during low heat demand periods. Table 6-2 lists the amount of heat storage required for the MCHP units to operate at a reasonable efficiency of 70% HHV, and within 2% of their respective steady state efficiencies. The SOFC unit was omitted since it must always be running. In this case, excess energy must be dumped to the environment if it cannot be stored.
Table 6-2 Thermal Energy Storage with respect to Cumulative Efficiency [HHV]
Residential hot water tanks come in a variety of sizes, but are typically 170, 227, or 273 litres. Even the smallest typical hot water tank would allow enough run time to achieve 70% CHP efficiency. For the SOFC, a 170 litre tank with a temperature rise of 20°C will store approximately two hours of thermal output.
It is important to note that the PEMFC MCHP unit is provided by the manufacturer with an integrated 200L tank.
CHP Efficiency: 70% 70%PEM 14300 107000 (82%) 171 1280 (82%)Stirling 3370 21600 (84%) 40 258 (84%)IC 3530 25000 (79%) 42 299 (79%)
Required Energy Storage [kJ]Steady State minus 2%
Size of Tank [L] (20°C temperature rise)
Steady State minus 2%
61
Chapter 7 Basic Integration of MCHP Units into Residential Buildings
This chapter lists the details and performance results of simple integration strategies for the MCHP units. The simple integration approach was to minimize cost and complexity of the system. Chapter 8 investigates improvements on these systems from an efficiency and exergy perspective.
The results listed in Chapters 7 and 8 include greenhouse gas (GHG) emissions and global energy savings estimates. The GHG and global energy values assume the electricity generated by the MCHP units will offset electricity generated at either a coal or natural gas facility. For coal electricity generation, 1 MWh is equivalent to 0.97 tonnes of CO2 [52]. For natural gas centralized electricity generation, 1 MWh is equivalent to 0.50 tonnes of CO2 [52]. The average efficiency of Canadian coal and natural gas centralized generating facilities is 33.3% and 35.9% respectively [52]. Factoring in an average of 9.6% transmission losses to the customer [53], the delivered efficiency is 30.2% for coal, and 32.5% for natural gas electrical generation. Similarly, the greenhouse gas emissions for electricity delivered to the customer is 1.07 tonne CO2/MWh for coal, and 0.55 tonnes CO2/MWh for natural gas.
When used, 1GJ of natural gas produces on average a GHG equivalent of 56.5 kg of CO2 [7]. However, natural gas is delivered to the customer at an efficiency of 80.3% [1], Therefore, the global GHG emissions for natural gas utilization becomes 70.3 kg CO2/GJ.
7.1 Solid Oxide Fuel Cell Basic Integration
The SOFC studied was designed to provide potable quality domestic hot water at a set outlet temperature. In order to achieve the outlet set point, the cooling water flowrate was varied internally to maintain the outlet temperature.
In the simple integration case, the SOFC was connected to a standard 200-litre storage tank. When no more heat could be stored, the fuel cell diverted the excess heat to an external heat exchanger. Figure 7-1 through Figure 7-3 illustrates the simplified plumbing arrangements. The domestic water was kept separate from the process water by a double walled heat exchanger. If energy transfer between the systems was required, hot water from the tank was circulated to the double walled heat exchanger. This heat exchanger was specified to have an effectiveness of 0.8 with 8 litres/minute circulating on the hot side.

62
7.1.1 SOFC / Forced Air Furnace
In order for the SOFC MCHP unit to provide space heating and domestic hot water in the forced air heating case, an additional water to air heat exchanger was placed in the warm air plenum of the furnace. Hot water at 8 litres/minute was circulated to this heat exchanger in a separate loop. The water to air heat exchanger was specified to have an effectiveness of 0.7 under the operating conditions experienced. Figure 7-1 illustrates this system.
In this case, the SOFC was required to provide all of the domestic hot water for the building. In order to ensure that enough domestic hot water was available, and to ensure prevention of Legionnaires disease, the system was designed to only circulate water to the space heat loop when the top third of the tank exceeded 60°C. The tank was allowed to reach a maximum of 80°C.
If the temperature of the room dropped more than 1°C below the set point, the forced air furnace would turn on to supplement the heating. Circulation to the air heat exchanger was stopped when the furnace is operating. During this period, the SOFC will “recharge” the storage tank.
Although simple, this system was not considered ideal from an efficiency standpoint since the fuel cell was constantly required to provide high temperature water. Also exergy destruction occurs when using the high temperature water to raise the space heating loop temperature to a much lower value. Similarly, mixing 80°C water with cold water in a tempering valve to provide the required 49°C domestic hot water causes exergy destruction, and reduces the efficiency of the system. Chapter 8 examined alternatives to minimize exergy destruction.
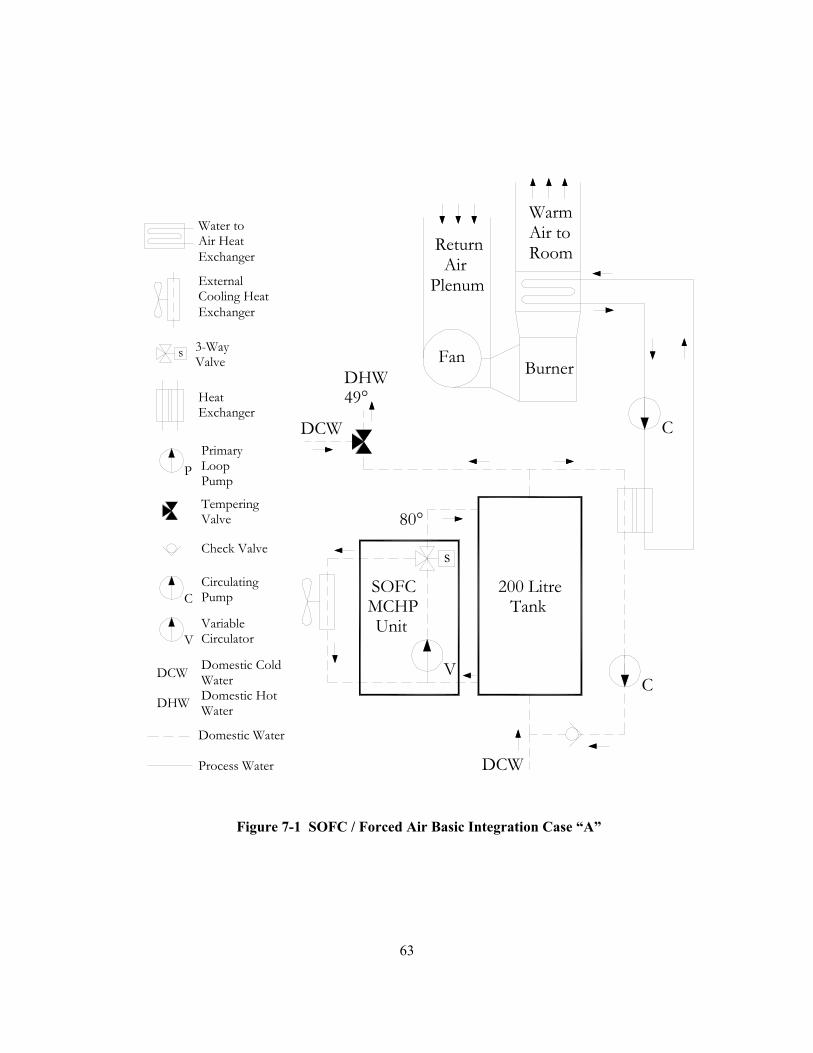
63
Exchanger
ExternalCooling Heat
s
VariableCirculatorV
VC
DCW
UnitMCHP Tank
200 LitreSOFC
Process Water
Domestic Water
49°DHW
DCW
WaterDomestic HotWaterDomestic Cold
DHW
DCW
C
P
PumpCirculating
Check Valve
s
PumpLoopPrimary
Valve3-Way
ValveTempering
ExchangerHeat
BurnerFan
WarmAir toRoom
PlenumAir
Return
C
Air HeatWater to
Exchanger
80°
Figure 7-1 SOFC / Forced Air Basic Integration Case “A”
64
7.1.2 SOFC / Floor Heat and Hydronic Radiators Cases
In the basic integration case, the heating systems for the in-floor heating and hydronic radiators cases were identical. The only difference was the operating temperature of the primary heating loop. (Hydronic radiators require higher water temperatures since they have a much smaller surface area than the in-floor heat system.) In this plumbing arrangement, the boiler was capable of adding heat to the hot water if the tank temperature was too low. The exit temperature from the SOFC was set to 80°C in order to maximize the heat utilization from the fuel cell.
Figure 7-2 illustrates the first iteration of the basic integration case, called “Case A”. This figure shows that domestic hot water is drawn directly from the tank. If the temperature is below 49°C the boiler adds heat to the stream. The tempering valve is required at the exit of the boiler as safety to prevent scalding.
If space heating was required, hot water from the tank was circulated to the double walled heat exchanger to inject energy into the separate primary heating loop. If the temperature of the building dropped more than 1°C below the set point, the boiler turned on to supplement the space heat. Both the SOFC and the boiler can simultaneously add heat to the primary loop. Note that water was not circulated to the primary loop heat exchanger if the loop-return temperature exceeded the tank temperature. Also, water was not circulated to the heat exchanger if the tank top temperature was less than 60°C. This requirement was needed to prevent the tank temperature from falling below the safe storage temperature to prevent Legionnaires disease.
The high exit and storage temperature (80° in this case) creates inefficiencies in heat recovery, but allows high heat utilization. An alternative configuration was analyzed to determine which parameter dominates the overall efficiency. In Case A the tank temperature was restricted from falling below 60°C. It was hypothesized that allowing the tank temperature to vary, as heat was demanded would increase the efficiency of the system, and increased the overall performance. If a great deal of space heating was required, the tank temperature would drop until no more heat could be extracted. Efficiency gains should occur since the cooling water inlet temperature to the fuel cell would be lower. Since the tank would be permitted to be below 60°C for an extended period of time, the domestic water system was separated from the storage system for health reasons. This design is considered “Case B” and is illustrated in Figure 7-3.
Since exergy destruction will occur when 80°C water is mixed with the cold tank temperature, an additional gain in efficiency will occur if the exit temperature of the fuel cell is also permitted to drop. “Case C” is identical to Case B except the SOFC water exit temperature set point is changed to 55°C when the tank is below 45°C. As the tank warms up above 40°C, the set point is changed back to 80°C. Table 7-1 lists the results for the three cases discussed, as well as the forced air configuration.
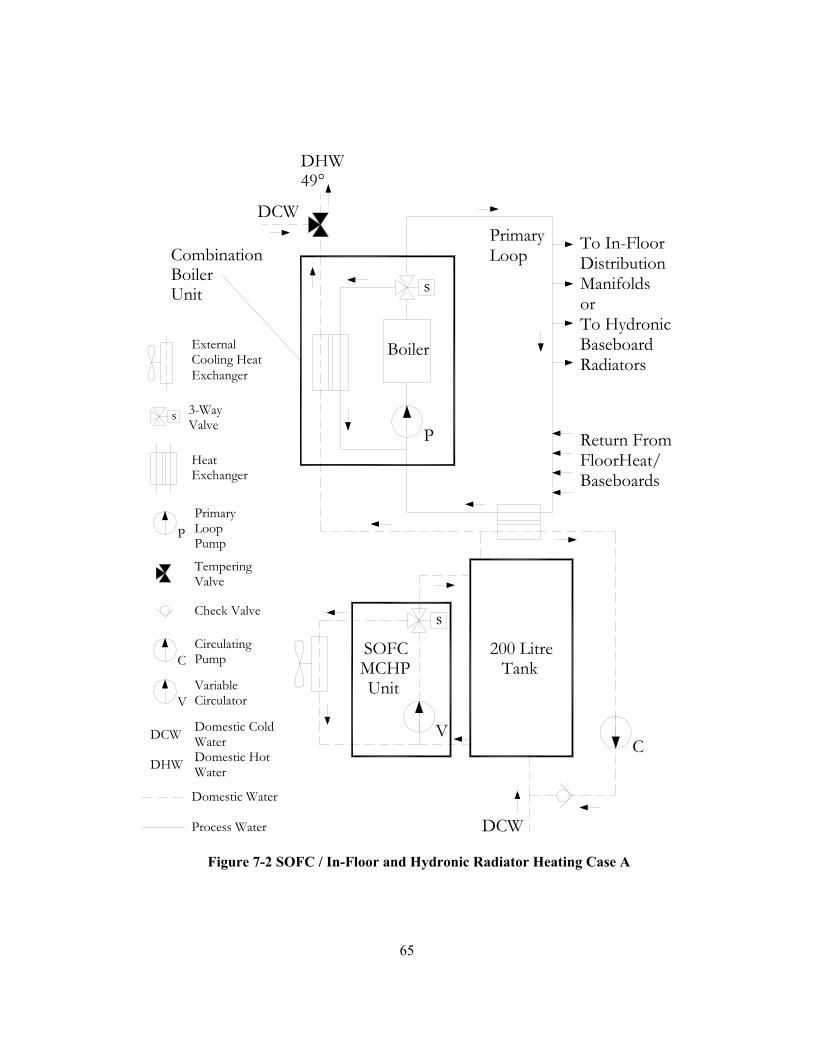
65
Figure 7-2 SOFC / In-Floor and Hydronic Radiator Heating Case A
Boiler
HeatExchanger
TemperingValve
3-WayValve
PrimaryLoopPump
s
s
Check Valve
CirculatingPump
P
P
C
DCW
DHW
Domestic ColdWaterDomestic HotWater
DCW
DHW49°
Domestic Water
Process Water
LoopPrimary
SOFC 200 LitreTankMCHP
Unit
DCW
CV
V CirculatorVariable
To In-FloorDistributionManifoldsorTo HydronicBaseboardRadiators
Return FromFloorHeat/Baseboards
BoilerCombination
Unit
s
Cooling HeatExternal
Exchanger
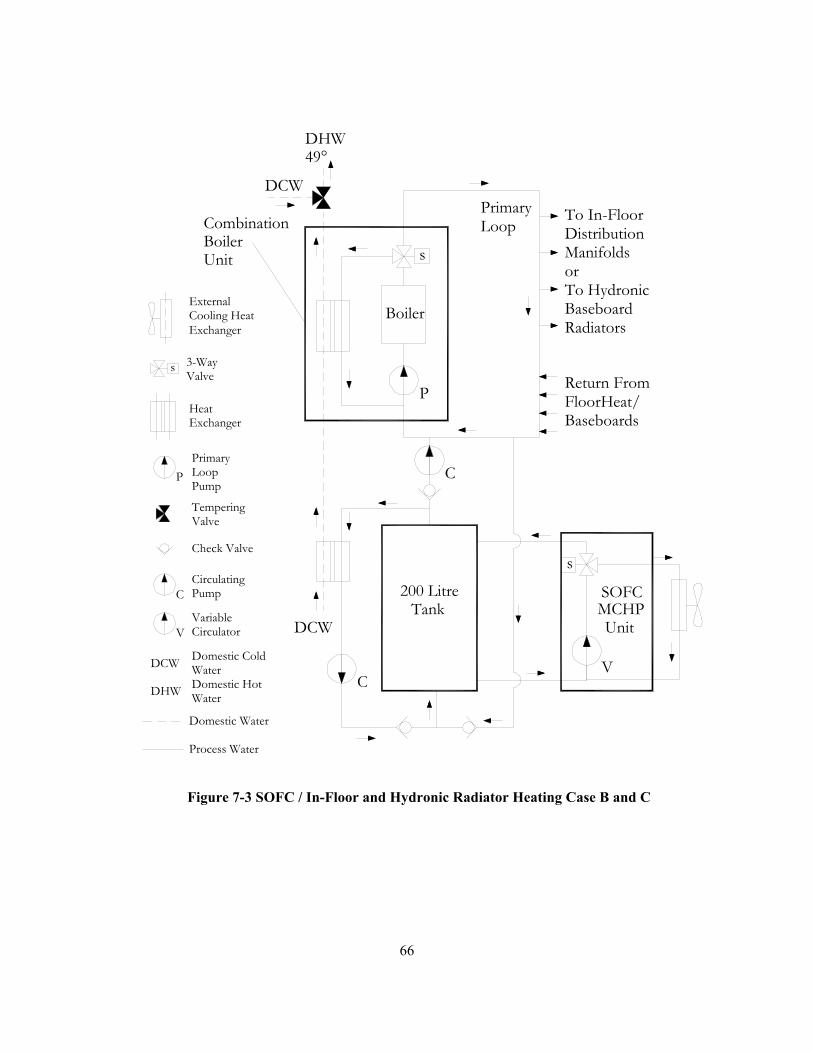
66
C
Unit
CombinationBoiler
BaseboardsFloorHeat/Return From
RadiatorsBaseboardTo HydronicorManifoldsDistributionTo In-Floor
VariableCirculatorV
C
DCW UnitMCHPTank
200 Litre SOFC
PrimaryLoop
Process Water
Domestic Water
49°DHW
DCW
WaterDomestic HotWaterDomestic Cold
DHW
DCW
C
P
P
PumpCirculating
Check Valve
s
s
PumpLoopPrimary
Valve3-Way
ValveTempering
ExchangerHeat
Boiler
V
s
Cooling HeatExternal
Exchanger
Figure 7-3 SOFC / In-Floor and Hydronic Radiator Heating Case B and C
67
7.1.3 SOFC Basic Integration Results – Annual Analysis
Table 7-1 lists the results for the SOFC MCHP Basic integration case, based on annual operation. In all cases, a substantial global energy and greenhouse gas emissions savings occurred. Since the SOFC operated continuously at a set output, the energy and GHG savings were very similar for all of the cases. The difference between the cases indicates the variance of heat utilization and recovery efficiency that occurred. For this MCHP generator, a substantial portion of recovered thermal energy was dumped to the environment. The amount varied from 3-17% of the input energy to the fuel cell. The old inefficient home utilized the highest percentage of the by-product heat, while the new efficient home utilized the least.
In the in-floor heating and hydronic radiator systems, the SOFC efficiency and heat recovery did improve as hypothesized for Case B and C. However, the net greenhouse gas and energy savings did not systemically improve. The in-floor heating system did experience the best performance with Case C. However, no improvement in GHG and energy savings occurred for the hydronic radiator case. Upon close examination, it was determined that the low tank temperature caused the boiler to provide much more of the domestic hot water. This was accomplished at a lower efficiency than if the boiler was providing space heat. The increase in efficiency of the SOFC heat recovery system was more than offset by the drop in efficiency of boiler operation. The problem was exacerbated as the load increased. Therefore, for the hydronic radiator system, it is best to prevent the tank temperature from dropping below 60°C to ensure that an abundance of domestic hot water (generated by the fuel cell) is always available.
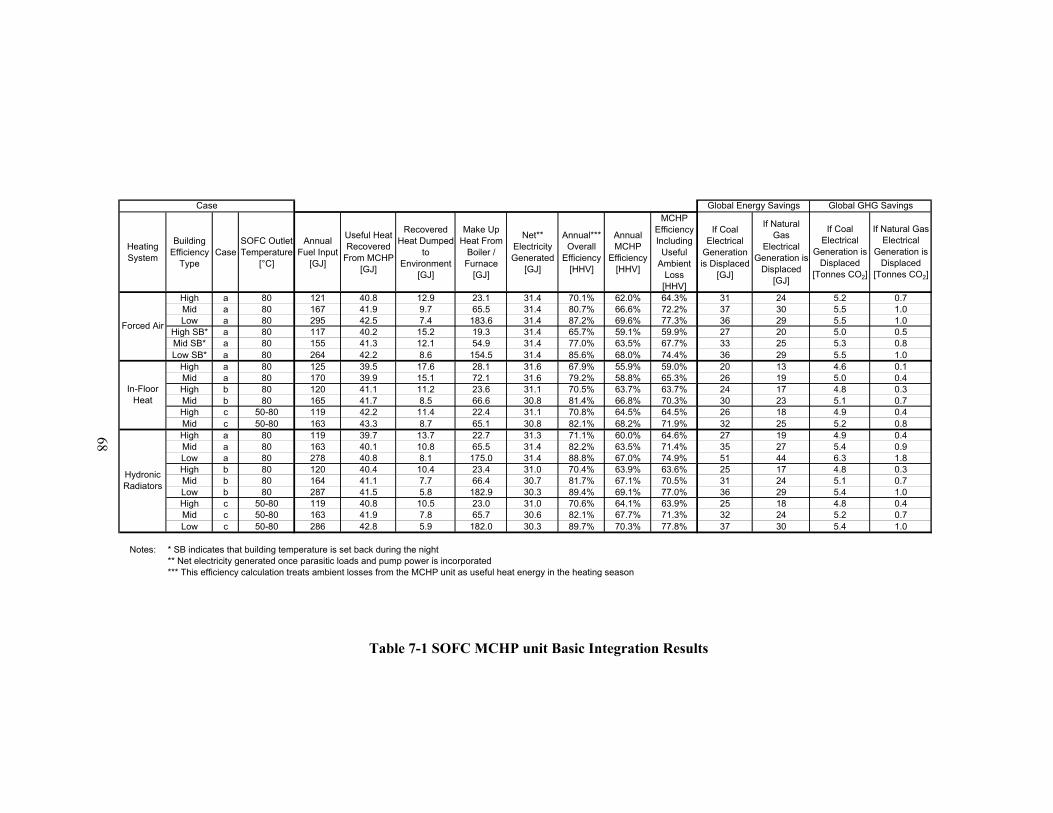
Table 7-1 SOFC MCHP unit Basic Integration Results
Heating System
Building Efficiency
TypeCase
SOFC Outlet Temperature
[°C]
Annual Fuel Input
[GJ]
Useful Heat Recovered
From MCHP [GJ]
Recovered Heat Dumped
to Environment
[GJ]
Make Up Heat From
Boiler / Furnace
[GJ]
Net** Electricity Generated
[GJ]
Annual*** Overall
Efficiency [HHV]
Annual MCHP
Efficiency [HHV]
MCHP Efficiency Including
Useful Ambient
Loss [HHV]
If Coal Electrical
Generation is Displaced
[GJ]
If Natural Gas
Electrical Generation is
Displaced [GJ]
If Coal Electrical
Generation is Displaced
[Tonnes CO2]
If Natural Gas Electrical
Generation is Displaced
[Tonnes CO2]
High a 80 121 40.8 12.9 23.1 31.4 70.1% 62.0% 64.3% 31 24 5.2 0.7Mid a 80 167 41.9 9.7 65.5 31.4 80.7% 66.6% 72.2% 37 30 5.5 1.0Low a 80 295 42.5 7.4 183.6 31.4 87.2% 69.6% 77.3% 36 29 5.5 1.0
High SB* a 80 117 40.2 15.2 19.3 31.4 65.7% 59.1% 59.9% 27 20 5.0 0.5Mid SB* a 80 155 41.3 12.1 54.9 31.4 77.0% 63.5% 67.7% 33 25 5.3 0.8Low SB* a 80 264 42.2 8.6 154.5 31.4 85.6% 68.0% 74.4% 36 29 5.5 1.0
High a 80 125 39.5 17.6 28.1 31.6 67.9% 55.9% 59.0% 20 13 4.6 0.1Mid a 80 170 39.9 15.1 72.1 31.6 79.2% 58.8% 65.3% 26 19 5.0 0.4High b 80 120 41.1 11.2 23.6 31.1 70.5% 63.7% 63.7% 24 17 4.8 0.3Mid b 80 165 41.7 8.5 66.6 30.8 81.4% 66.8% 70.3% 30 23 5.1 0.7High c 50-80 119 42.2 11.4 22.4 31.1 70.8% 64.5% 64.5% 26 18 4.9 0.4Mid c 50-80 163 43.3 8.7 65.1 30.8 82.1% 68.2% 71.9% 32 25 5.2 0.8High a 80 119 39.7 13.7 22.7 31.3 71.1% 60.0% 64.6% 27 19 4.9 0.4Mid a 80 163 40.1 10.8 65.5 31.4 82.2% 63.5% 71.4% 35 27 5.4 0.9Low a 80 278 40.8 8.1 175.0 31.4 88.8% 67.0% 74.9% 51 44 6.3 1.8High b 80 120 40.4 10.4 23.4 31.0 70.4% 63.9% 63.6% 25 17 4.8 0.3Mid b 80 164 41.1 7.7 66.4 30.7 81.7% 67.1% 70.5% 31 24 5.1 0.7Low b 80 287 41.5 5.8 182.9 30.3 89.4% 69.1% 77.0% 36 29 5.4 1.0High c 50-80 119 40.8 10.5 23.0 31.0 70.6% 64.1% 63.9% 25 18 4.8 0.4Mid c 50-80 163 41.9 7.8 65.7 30.6 82.1% 67.7% 71.3% 32 24 5.2 0.7Low c 50-80 286 42.8 5.9 182.0 30.3 89.7% 70.3% 77.8% 37 30 5.4 1.0
Notes: * SB indicates that building temperature is set back during the night** Net electricity generated once parasitic loads and pump power is incorporated*** This efficiency calculation treats ambient losses from the MCHP unit as useful heat energy in the heating season
Global Energy Savings Global GHG Savings
In-Floor Heat
Hydronic Radiators
Case
Forced Air
68

69
7.2 Polymer Electrolyte Membrane Fuel Cell Basic Integration
The PEMFC MCHP unit operates similarly to the SOFC unit. It maintains an outlet temperature by varying the cooling water flowrate. However, the PEMFC can also modulate down its output once the maximum flowrate is reached. If the outlet temperature cannot be maintained at maximum flow and maximum modulation, (30% of rated output) the fuel cell will shut down.
The PEMFC is also designed to provide domestic hot water directly to the home. The unit examined in this study comes complete with an integral 200L storage tank. This physical design constraint was not altered throughout this study. As in the SOFC case, when needed, hot water from the tank is pumped at 8 litres/minute to a double walled heat exchanger to transfer energy between the domestic water and the process water.
7.2.1 PEM Fuel Cell / Forced Air Basic Integration
The PEMFC MCHP unit was integrated into the forced air heating system identically to the SOFC. Figure 7-4 illustrates the system. The control logic was also identical, except that the tank could only reach 70°C due to the limitation of the PEMFC. This results in less energy storage available for the space heating system.

70
Figure 7-4 PEM Fuel Cell / Forced Air Basic Integration
HeatExchanger
TemperingValve
3-WayValve
PrimaryLoopPump
s
Check Valve
CirculatingPump
P
C
DCW
DHW
Domestic ColdWaterDomestic HotWater
Domestic Water
Process Water
PEMFC 200 LitreTankMCHP
Unit
DCW
CV
V CirculatorVariable
C
ReturnAir
Plenum
RoomAir toWarm
Fan Burner
Exchanger
Water toAir Heat
DCW
DHW49°
70°
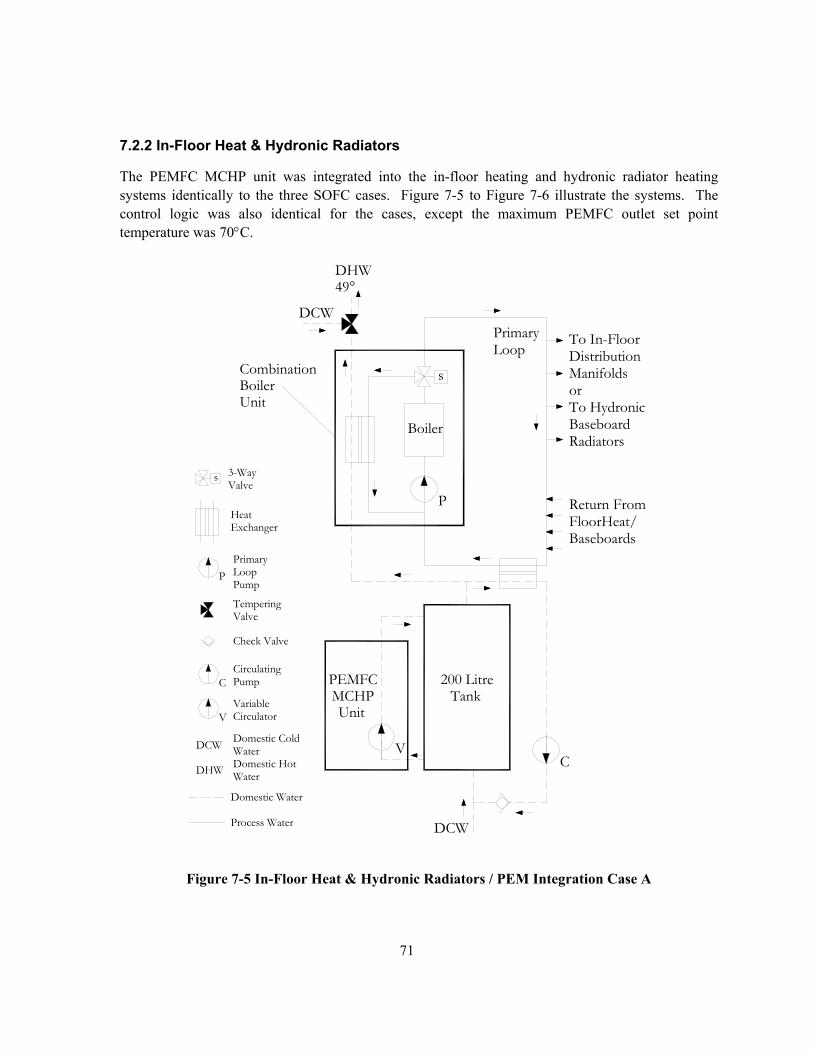
71
7.2.2 In-Floor Heat & Hydronic Radiators
The PEMFC MCHP unit was integrated into the in-floor heating and hydronic radiator heating systems identically to the three SOFC cases. Figure 7-5 to Figure 7-6 illustrate the systems. The control logic was also identical for the cases, except the maximum PEMFC outlet set point temperature was 70°C.
Figure 7-5 In-Floor Heat & Hydronic Radiators / PEM Integration Case A
Unit
CombinationBoiler
BaseboardsFloorHeat/Return From
RadiatorsBaseboardTo HydronicorManifoldsDistributionTo In-Floor
VariableCirculatorV
VC
DCW
UnitMCHP Tank
200 LitrePEMFC
PrimaryLoop
Process Water
Domestic Water
49°DHW
DCW
WaterDomestic HotWaterDomestic Cold
DHW
DCW
C
P
P
PumpCirculating
Check Valve
s
s
PumpLoopPrimary
Valve3-Way
ValveTempering
ExchangerHeat
Boiler
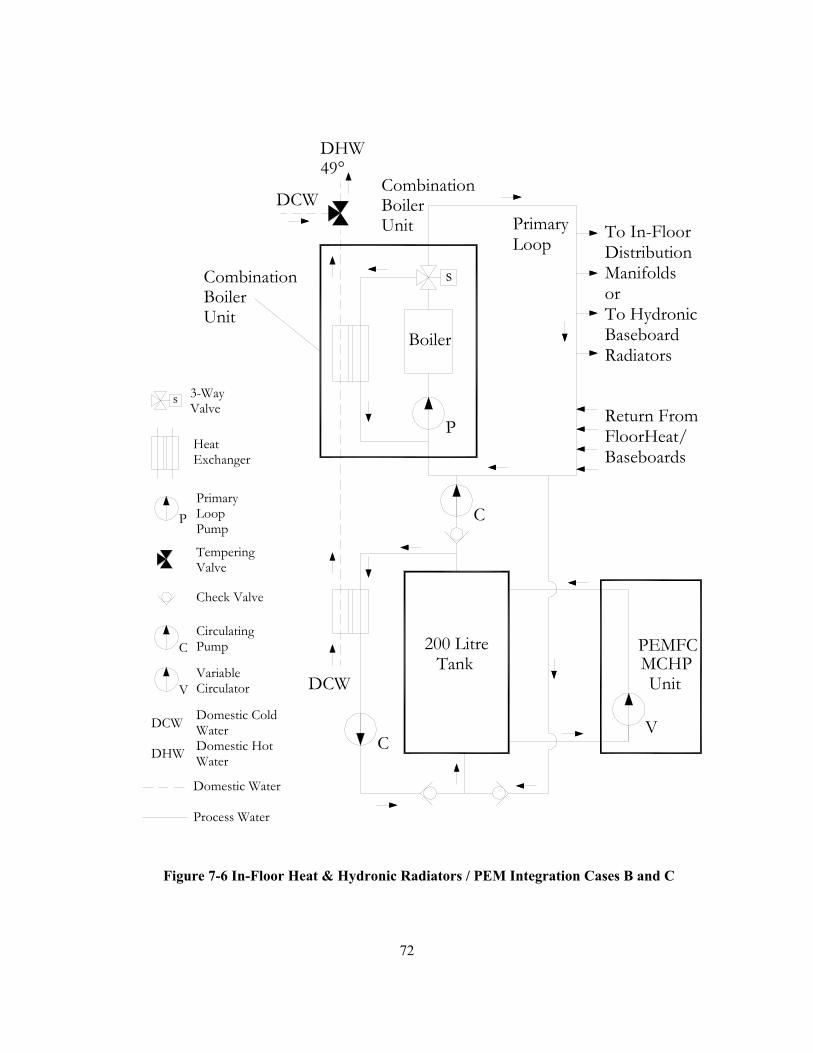
72
V
Boiler
HeatExchanger
TemperingValve
3-WayValve
PrimaryLoopPump
s
s
Check Valve
CirculatingPump
P
P
C
DCW
DHW
Domestic ColdWaterDomestic HotWater
DCW
DHW49°
Domestic Water
Process Water
LoopPrimary
PEMFC200 LitreTank MCHP
UnitDCW
C
V CirculatorVariable
To In-FloorDistributionManifoldsorTo HydronicBaseboardRadiators
Return FromFloorHeat/Baseboards
BoilerCombination
Unit
C
BoilerCombination
Unit
Figure 7-6 In-Floor Heat & Hydronic Radiators / PEM Integration Cases B and C

73
7.2.3 PEMFC Basic Integration Results
Table 7-2 lists the results for the PEMFC MCHP basic integration case based on annual operation. In all cases, a substantial global energy and greenhouse gas emissions savings occurred.
When the tank temperature was allowed to float below 60°C improvements in the PEMFC output and efficiency occurred since the PEMFC experienced longer run times. The increased electrical output greatly improved the global energy and GHG emissions savings. As in the SOFC cases, the low tank temperature caused the boiler to operate more inefficiently. However, the gains in PEMFC efficiency and electrical/thermal output more than offset the boiler losses. Therefore, for the PEMFC integration with both the hydronic radiator and in-floor heating case the basic integration strategy should be Case B: separating the domestic hot water form the storage tank, and allowing the tank temperature to float.
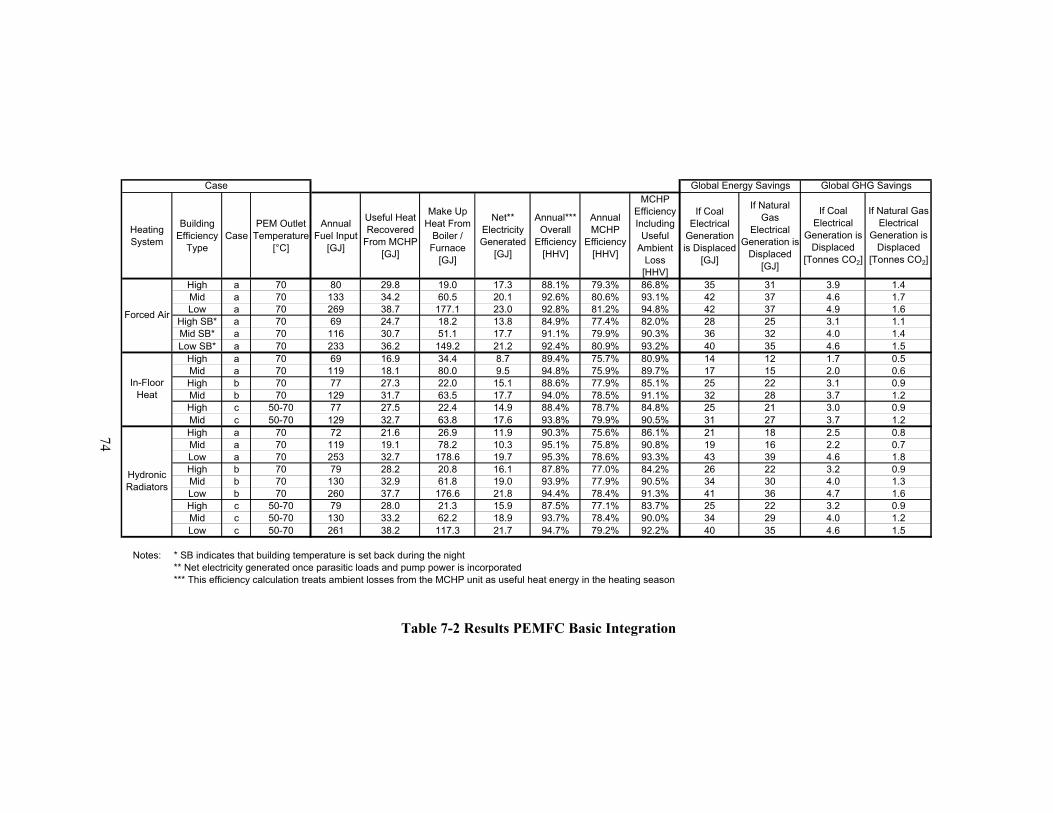
Table 7-2 Results PEMFC Basic Integration
Heating System
Building Efficiency
TypeCase
PEM Outlet Temperature
[°C]
Annual Fuel Input
[GJ]
Useful Heat Recovered
From MCHP [GJ]
Make Up Heat From
Boiler / Furnace
[GJ]
Net** Electricity Generated
[GJ]
Annual*** Overall
Efficiency [HHV]
Annual MCHP
Efficiency [HHV]
MCHP Efficiency Including
Useful Ambient
Loss [HHV]
If Coal Electrical
Generation is Displaced
[GJ]
If Natural Gas
Electrical Generation is
Displaced [GJ]
If Coal Electrical
Generation is Displaced
[Tonnes CO2]
If Natural Gas Electrical
Generation is Displaced
[Tonnes CO2]
High a 70 80 29.8 19.0 17.3 88.1% 79.3% 86.8% 35 31 3.9 1.4Mid a 70 133 34.2 60.5 20.1 92.6% 80.6% 93.1% 42 37 4.6 1.7Low a 70 269 38.7 177.1 23.0 92.8% 81.2% 94.8% 42 37 4.9 1.6
High SB* a 70 69 24.7 18.2 13.8 84.9% 77.4% 82.0% 28 25 3.1 1.1Mid SB* a 70 116 30.7 51.1 17.7 91.1% 79.9% 90.3% 36 32 4.0 1.4Low SB* a 70 233 36.2 149.2 21.2 92.4% 80.9% 93.2% 40 35 4.6 1.5
High a 70 69 16.9 34.4 8.7 89.4% 75.7% 80.9% 14 12 1.7 0.5Mid a 70 119 18.1 80.0 9.5 94.8% 75.9% 89.7% 17 15 2.0 0.6High b 70 77 27.3 22.0 15.1 88.6% 77.9% 85.1% 25 22 3.1 0.9Mid b 70 129 31.7 63.5 17.7 94.0% 78.5% 91.1% 32 28 3.7 1.2High c 50-70 77 27.5 22.4 14.9 88.4% 78.7% 84.8% 25 21 3.0 0.9Mid c 50-70 129 32.7 63.8 17.6 93.8% 79.9% 90.5% 31 27 3.7 1.2High a 70 72 21.6 26.9 11.9 90.3% 75.6% 86.1% 21 18 2.5 0.8Mid a 70 119 19.1 78.2 10.3 95.1% 75.8% 90.8% 19 16 2.2 0.7Low a 70 253 32.7 178.6 19.7 95.3% 78.6% 93.3% 43 39 4.6 1.8High b 70 79 28.2 20.8 16.1 87.8% 77.0% 84.2% 26 22 3.2 0.9Mid b 70 130 32.9 61.8 19.0 93.9% 77.9% 90.5% 34 30 4.0 1.3Low b 70 260 37.7 176.6 21.8 94.4% 78.4% 91.3% 41 36 4.7 1.6High c 50-70 79 28.0 21.3 15.9 87.5% 77.1% 83.7% 25 22 3.2 0.9Mid c 50-70 130 33.2 62.2 18.9 93.7% 78.4% 90.0% 34 29 4.0 1.2Low c 50-70 261 38.2 117.3 21.7 94.7% 79.2% 92.2% 40 35 4.6 1.5
Notes: * SB indicates that building temperature is set back during the night** Net electricity generated once parasitic loads and pump power is incorporated*** This efficiency calculation treats ambient losses from the MCHP unit as useful heat energy in the heating season
Global Energy Savings Global GHG Savings
In-Floor Heat
Hydronic Radiators
Case
Forced Air
74
75
7.3 Stirling Engine Basic Integration
The Stirling engine operates differently than the fuel cells. The engine is basically designed as a boiler. A constant flowrate pump provides the cooling water and the unit will shut down when the exit temperature reaches a maximum set point. In the basic integration case, the Stirling engine was connected to a standard 200-litre storage tank containing process water. This tank was part of the heating system, and kept separate from potable domestic hot water. The Stirling engine drew cold water from the bottom of the tank at 20 litres per minute and injected the heated water to the top of the tank. When the exit temperature exceeded the set point, the engine shut down. Figure 7-7 and Figure 7-8 illustrates the simplified plumbing arrangements. If energy for space heating was required, hot water was drawn directly from the tank. If domestic hot water was desired, process water was drawn from the tank and pumped to a double walled heat exchanger to transfer energy to the domestic water. This heat exchanger was specified to have an effectiveness of 0.8 with 8 litres/minute circulating on the hot side.
The boost mode of the Stirling engine (burning extra fuel to increase thermal output to 13 kW) was not used. This boost mode does not increase the electrical output, and increases the thermal output at a lower efficiency than what the make up heating devices can provide.
7.3.1 Stirling Engine / Forced Air Furnace
In order for the Stirling Engine to provide space heating and domestic hot water in the forced air heating case, an additional water to air heat exchanger was placed in the warm air plenum of the furnace. Hot water drawn from the tank at 8 litres/minute was circulated to this heat exchanger. The water to air heat exchanger was specified to have an effectiveness of 0.7 under the operating conditions experienced. Figure 7-7 illustrates this system.
Similar to the fuel cell / forced air cases, the Stirling engine was required to provide all of the domestic hot water for the building. In order to ensure that domestic hot water would be delivered at the desired temperature, the system was designed to only circulate water to the space heat loop when the top third of the tank exceeded 60°C. The shut down exit temperature from the Stirling engine was set to 80°C.
If the temperature of the room dropped more than 1°C below the set point, the forced air furnace would turn on to supplement the heating. Circulation to the air heat exchanger was stopped when the furnace is operating. During this period, the Stirling engine will “recharge” the storage tank.
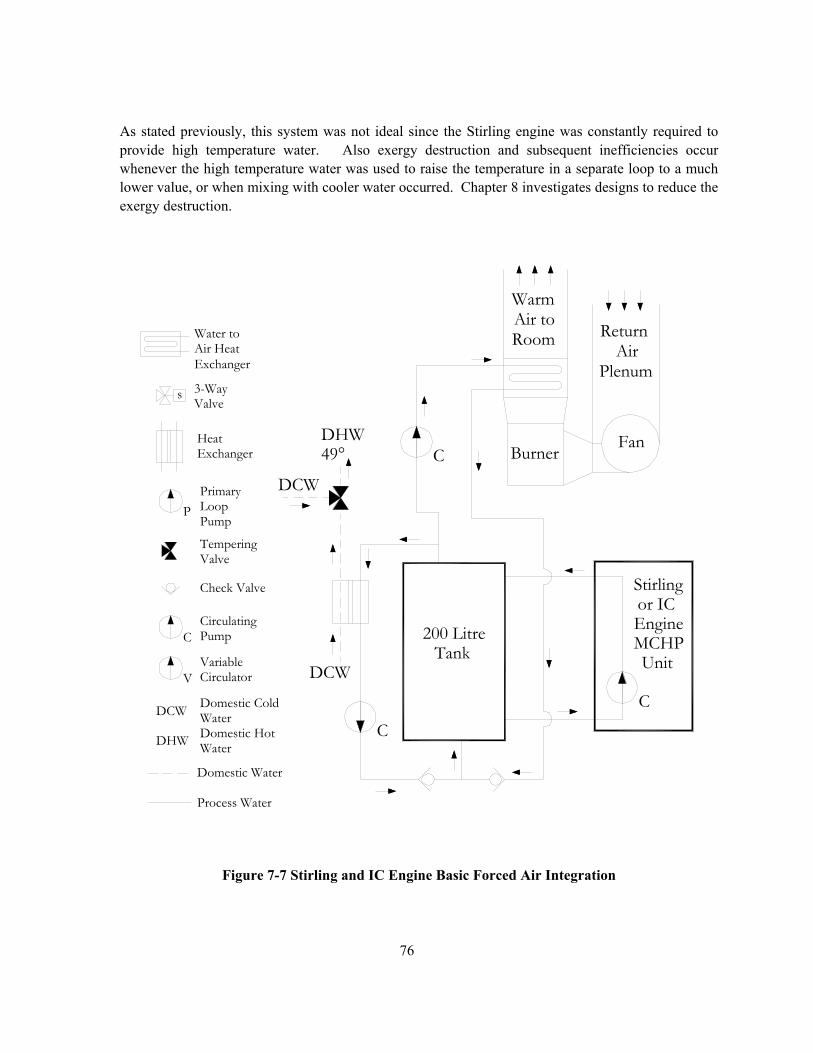
76
As stated previously, this system was not ideal since the Stirling engine was constantly required to provide high temperature water. Also exergy destruction and subsequent inefficiencies occur whenever the high temperature water was used to raise the temperature in a separate loop to a much lower value, or when mixing with cooler water occurred. Chapter 8 investigates designs to reduce the exergy destruction.
Stirling
C
or IC
VariableCirculatorV
C
C
DCW UnitMCHPTank
200 Litre Engine
Process Water
Domestic Water
WaterDomestic HotWaterDomestic Cold
DHW
DCW
C
P
PumpCirculating
Check Valve
s
PumpLoopPrimary
Valve3-Way
ValveTempering
ExchangerHeat
Air HeatWater to
Exchanger
Burner Fan
WarmAir toRoom
PlenumAir
Return
49°DHW
DCW
Figure 7-7 Stirling and IC Engine Basic Forced Air Integration
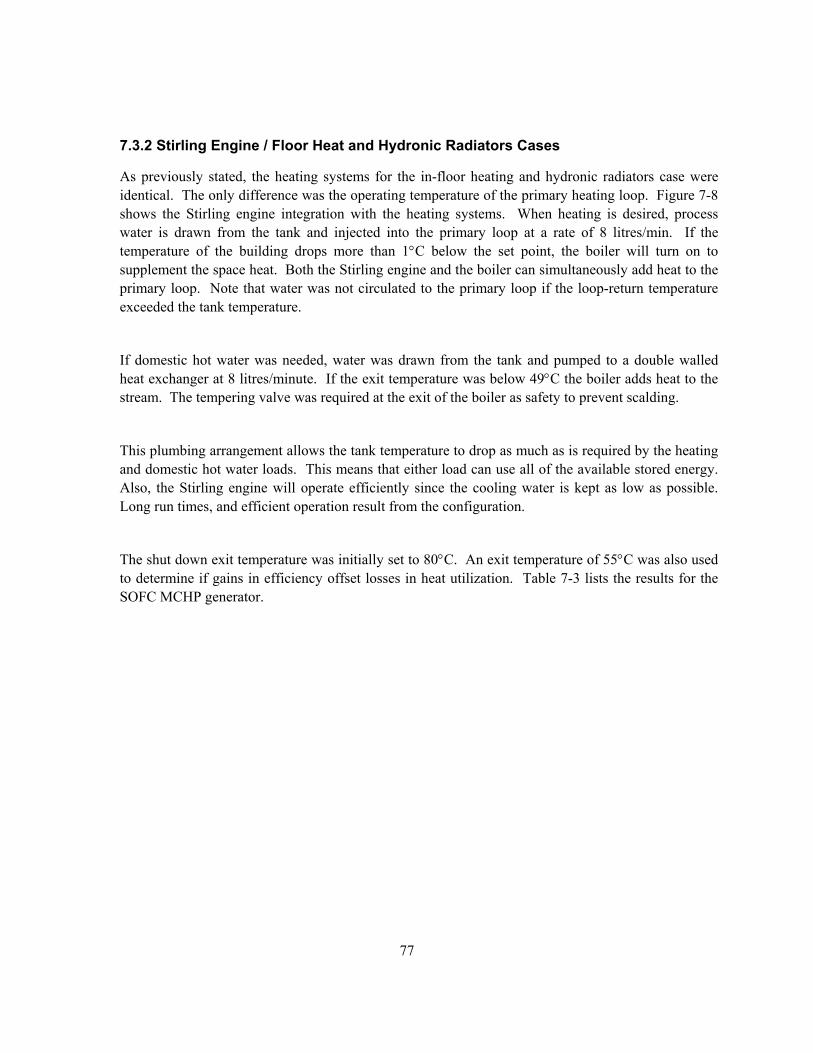
77
7.3.2 Stirling Engine / Floor Heat and Hydronic Radiators Cases
As previously stated, the heating systems for the in-floor heating and hydronic radiators case were identical. The only difference was the operating temperature of the primary heating loop. Figure 7-8 shows the Stirling engine integration with the heating systems. When heating is desired, process water is drawn from the tank and injected into the primary loop at a rate of 8 litres/min. If the temperature of the building drops more than 1°C below the set point, the boiler will turn on to supplement the space heat. Both the Stirling engine and the boiler can simultaneously add heat to the primary loop. Note that water was not circulated to the primary loop if the loop-return temperature exceeded the tank temperature.
If domestic hot water was needed, water was drawn from the tank and pumped to a double walled heat exchanger at 8 litres/minute. If the exit temperature was below 49°C the boiler adds heat to the stream. The tempering valve was required at the exit of the boiler as safety to prevent scalding.
This plumbing arrangement allows the tank temperature to drop as much as is required by the heating and domestic hot water loads. This means that either load can use all of the available stored energy. Also, the Stirling engine will operate efficiently since the cooling water is kept as low as possible. Long run times, and efficient operation result from the configuration.
The shut down exit temperature was initially set to 80°C. An exit temperature of 55°C was also used to determine if gains in efficiency offset losses in heat utilization. Table 7-3 lists the results for the SOFC MCHP generator.
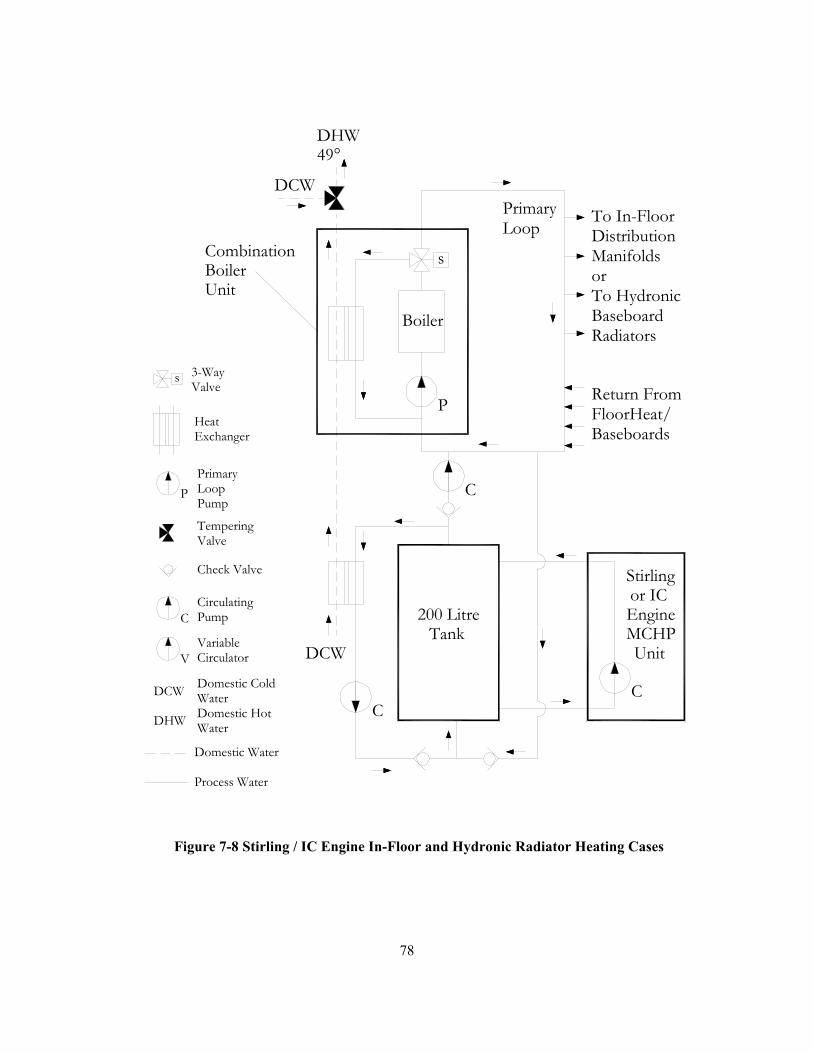
78
Figure 7-8 Stirling / IC Engine In-Floor and Hydronic Radiator Heating Cases
Boiler
HeatExchanger
TemperingValve
3-WayValve
PrimaryLoopPump
s
s
Check Valve
CirculatingPump
P
P
C
DCW
DHW
Domestic ColdWaterDomestic HotWater
DCW
DHW49°
Domestic Water
Process Water
LoopPrimary
Engine200 LitreTank MCHP
UnitDCW
C
C
V CirculatorVariable
To In-FloorDistributionManifoldsorTo HydronicBaseboardRadiators
Return FromFloorHeat/Baseboards
BoilerCombination
Unit
or IC
C
Stirling

79
7.3.3 Stirling Engine Basic Integration Results – Annual Analysis
Table 7-3 lists the results for the Stirling Engine MCHP Basic integration case, based on annual operation. In the basic forced air integration case, the Stirling engine MCHP unit was equal to or worse than the conventional equipment case. The hydronic radiator and in-floor heating cases also resulted in very poor or detrimental performance. Upon examination, the poor performance occurred because lack of adequate thermal storage caused short running times. The Stirling engine has a very high thermal output, and requires a great deal of storage (or utilization) before substantial electrical generation occurs. Also, the high flowrate through the Stirling engine prevents thermal stratification of the small tank. Chapter 8 addresses this issue. In summary, this integration configuration for the Stirling engine should not be used. A more elaborate and larger thermal system is required.
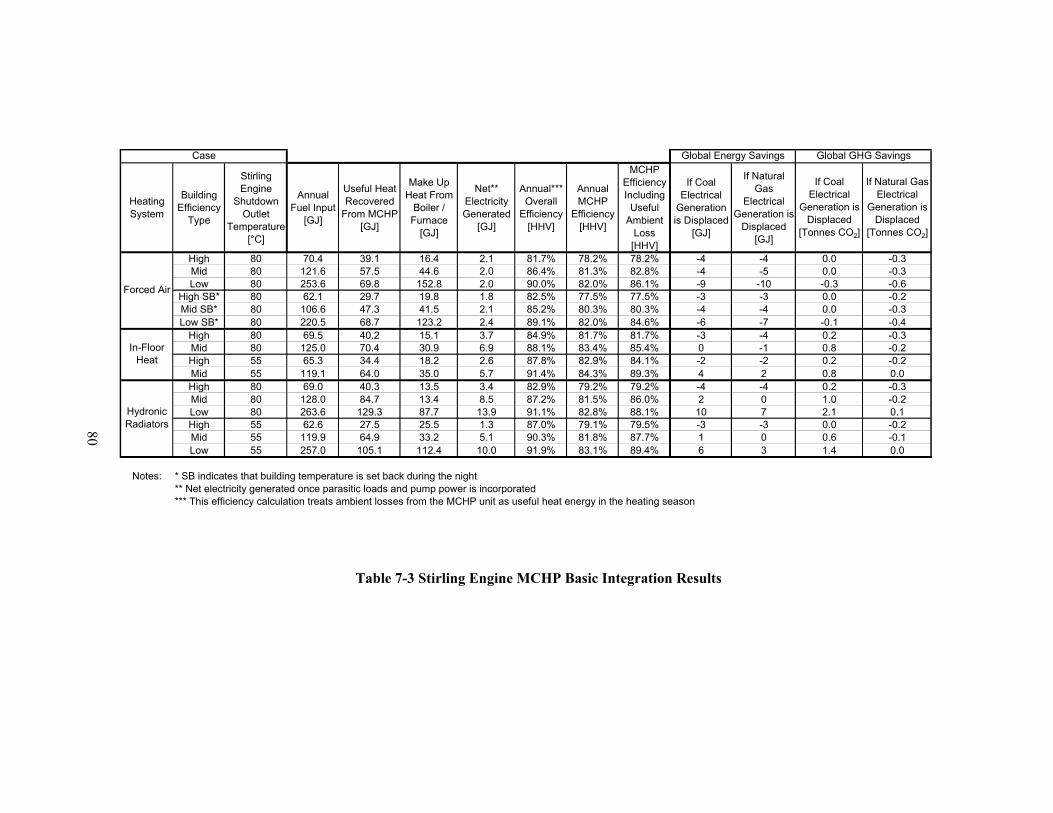
Table 7-3 Stirling Engine MCHP Basic Integration Results
Heating System
Building Efficiency
Type
Stirling Engine
Shutdown Outlet
Temperature [°C]
Annual Fuel Input
[GJ]
Useful Heat Recovered
From MCHP [GJ]
Make Up Heat From
Boiler / Furnace
[GJ]
Net** Electricity Generated
[GJ]
Annual*** Overall
Efficiency [HHV]
Annual MCHP
Efficiency [HHV]
MCHP Efficiency Including
Useful Ambient
Loss [HHV]
If Coal Electrical
Generation is Displaced
[GJ]
If Natural Gas
Electrical Generation is
Displaced [GJ]
If Coal Electrical
Generation is Displaced
[Tonnes CO2]
If Natural Gas Electrical
Generation is Displaced
[Tonnes CO2]
High 80 70.4 39.1 16.4 2.1 81.7% 78.2% 78.2% -4 -4 0.0 -0.3Mid 80 121.6 57.5 44.6 2.0 86.4% 81.3% 82.8% -4 -5 0.0 -0.3Low 80 253.6 69.8 152.8 2.0 90.0% 82.0% 86.1% -9 -10 -0.3 -0.6
High SB* 80 62.1 29.7 19.8 1.8 82.5% 77.5% 77.5% -3 -3 0.0 -0.2Mid SB* 80 106.6 47.3 41.5 2.1 85.2% 80.3% 80.3% -4 -4 0.0 -0.3Low SB* 80 220.5 68.7 123.2 2.4 89.1% 82.0% 84.6% -6 -7 -0.1 -0.4
High 80 69.5 40.2 15.1 3.7 84.9% 81.7% 81.7% -3 -4 0.2 -0.3Mid 80 125.0 70.4 30.9 6.9 88.1% 83.4% 85.4% 0 -1 0.8 -0.2High 55 65.3 34.4 18.2 2.6 87.8% 82.9% 84.1% -2 -2 0.2 -0.2Mid 55 119.1 64.0 35.0 5.7 91.4% 84.3% 89.3% 4 2 0.8 0.0High 80 69.0 40.3 13.5 3.4 82.9% 79.2% 79.2% -4 -4 0.2 -0.3Mid 80 128.0 84.7 13.4 8.5 87.2% 81.5% 86.0% 2 0 1.0 -0.2Low 80 263.6 129.3 87.7 13.9 91.1% 82.8% 88.1% 10 7 2.1 0.1High 55 62.6 27.5 25.5 1.3 87.0% 79.1% 79.5% -3 -3 0.0 -0.2Mid 55 119.9 64.9 33.2 5.1 90.3% 81.8% 87.7% 1 0 0.6 -0.1Low 55 257.0 105.1 112.4 10.0 91.9% 83.1% 89.4% 6 3 1.4 0.0
Notes: * SB indicates that building temperature is set back during the night** Net electricity generated once parasitic loads and pump power is incorporated*** This efficiency calculation treats ambient losses from the MCHP unit as useful heat energy in the heating season
Global Energy Savings Global GHG Savings
In-Floor Heat
Hydronic Radiators
Case
Forced Air
80
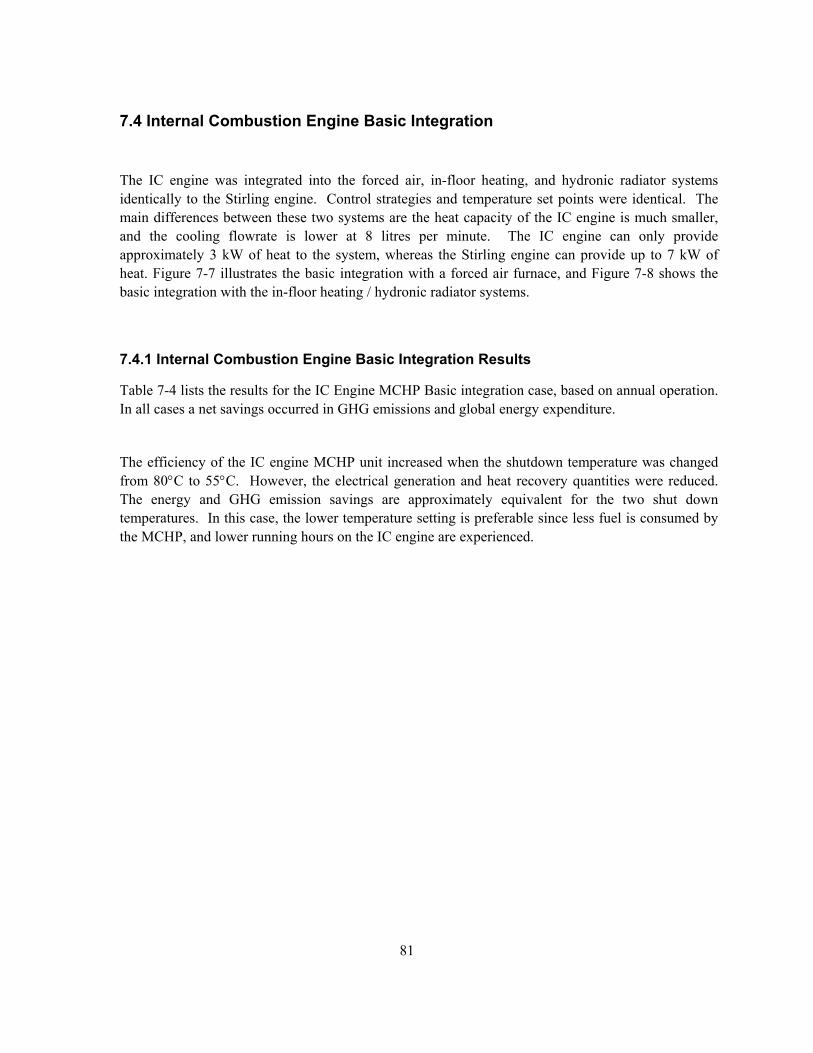
81
7.4 Internal Combustion Engine Basic Integration
The IC engine was integrated into the forced air, in-floor heating, and hydronic radiator systems identically to the Stirling engine. Control strategies and temperature set points were identical. The main differences between these two systems are the heat capacity of the IC engine is much smaller, and the cooling flowrate is lower at 8 litres per minute. The IC engine can only provide approximately 3 kW of heat to the system, whereas the Stirling engine can provide up to 7 kW of heat. Figure 7-7 illustrates the basic integration with a forced air furnace, and Figure 7-8 shows the basic integration with the in-floor heating / hydronic radiator systems.
7.4.1 Internal Combustion Engine Basic Integration Results
Table 7-4 lists the results for the IC Engine MCHP Basic integration case, based on annual operation. In all cases a net savings occurred in GHG emissions and global energy expenditure.
The efficiency of the IC engine MCHP unit increased when the shutdown temperature was changed from 80°C to 55°C. However, the electrical generation and heat recovery quantities were reduced. The energy and GHG emission savings are approximately equivalent for the two shut down temperatures. In this case, the lower temperature setting is preferable since less fuel is consumed by the MCHP, and lower running hours on the IC engine are experienced.
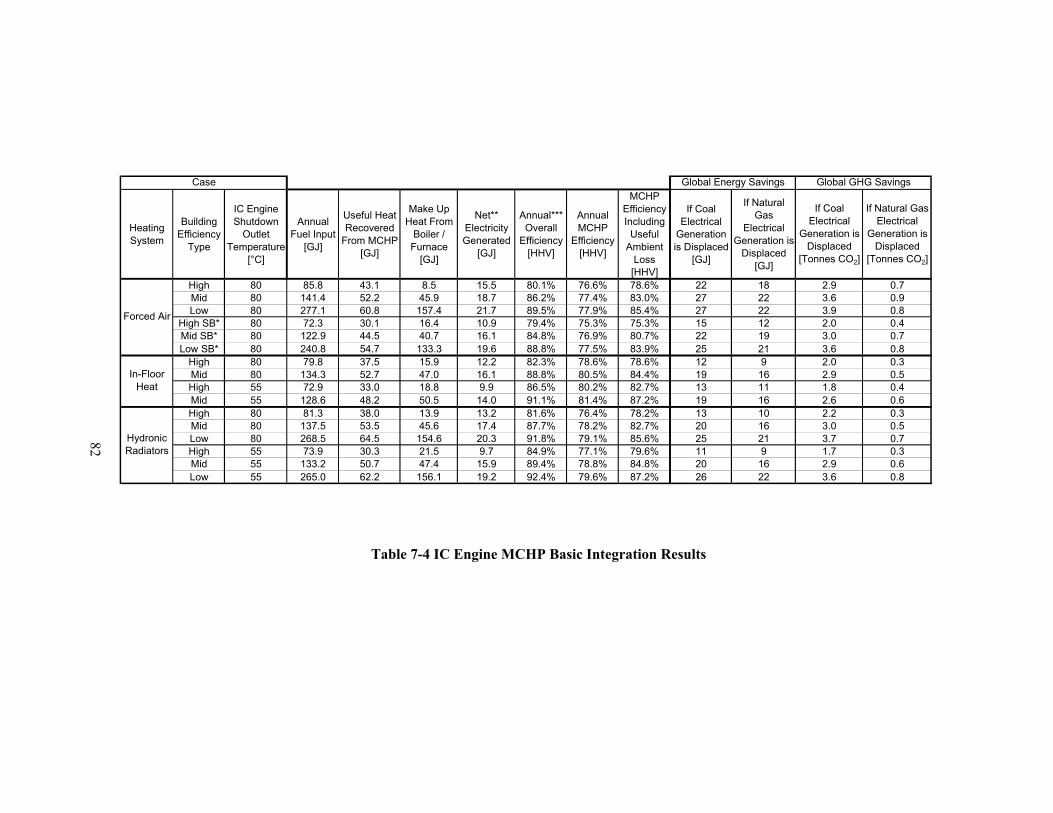
Table 7-4 IC Engine MCHP Basic Integration Results
Heating System
Building Efficiency
Type
IC Engine Shutdown
Outlet Temperature
[°C]
Annual Fuel Input
[GJ]
Useful Heat Recovered
From MCHP [GJ]
Make Up Heat From
Boiler / Furnace
[GJ]
Net** Electricity Generated
[GJ]
Annual*** Overall
Efficiency [HHV]
Annual MCHP
Efficiency [HHV]
MCHP Efficiency Including
Useful Ambient
Loss [HHV]
If Coal Electrical
Generation is Displaced
[GJ]
If Natural Gas
Electrical Generation is
Displaced [GJ]
If Coal Electrical
Generation is Displaced
[Tonnes CO2]
If Natural Gas Electrical
Generation is Displaced
[Tonnes CO2]
High 80 85.8 43.1 8.5 15.5 80.1% 76.6% 78.6% 22 18 2.9 0.7Mid 80 141.4 52.2 45.9 18.7 86.2% 77.4% 83.0% 27 22 3.6 0.9Low 80 277.1 60.8 157.4 21.7 89.5% 77.9% 85.4% 27 22 3.9 0.8
High SB* 80 72.3 30.1 16.4 10.9 79.4% 75.3% 75.3% 15 12 2.0 0.4Mid SB* 80 122.9 44.5 40.7 16.1 84.8% 76.9% 80.7% 22 19 3.0 0.7Low SB* 80 240.8 54.7 133.3 19.6 88.8% 77.5% 83.9% 25 21 3.6 0.8
High 80 79.8 37.5 15.9 12.2 82.3% 78.6% 78.6% 12 9 2.0 0.3Mid 80 134.3 52.7 47.0 16.1 88.8% 80.5% 84.4% 19 16 2.9 0.5High 55 72.9 33.0 18.8 9.9 86.5% 80.2% 82.7% 13 11 1.8 0.4Mid 55 128.6 48.2 50.5 14.0 91.1% 81.4% 87.2% 19 16 2.6 0.6High 80 81.3 38.0 13.9 13.2 81.6% 76.4% 78.2% 13 10 2.2 0.3Mid 80 137.5 53.5 45.6 17.4 87.7% 78.2% 82.7% 20 16 3.0 0.5Low 80 268.5 64.5 154.6 20.3 91.8% 79.1% 85.6% 25 21 3.7 0.7High 55 73.9 30.3 21.5 9.7 84.9% 77.1% 79.6% 11 9 1.7 0.3Mid 55 133.2 50.7 47.4 15.9 89.4% 78.8% 84.8% 20 16 2.9 0.6Low 55 265.0 62.2 156.1 19.2 92.4% 79.6% 87.2% 26 22 3.6 0.8
Global Energy Savings Global GHG Savings
In-Floor Heat
Hydronic Radiators
Case
Forced Air
82
83
7.5 Summertime MCHP Performance – Basic Integration Case
Table 7-5 details the performance of the MCHP units under summertime conditions for the basic integration case. The SOFC and IC engine only provide a net benefit if coal electrical generation is being displaced. The PEMFC can continue to operate throughout the summer providing a net energy and GHG emissions benefit. For the basic integration strategy, the Stirling engine does not produce any net benefits over the summer period for the basic integration cases.
It is important to note that the heat rejected to the ambient should be ventilated to the outside. Otherwise, this heat can substantially contribute to the air conditioning requirements of the home. The “1 ton air conditioner run time” column in Table 7-5 indicates how much the air conditioner would have to operate to eliminate the heat added by the MCHP units. The PEMFC represents the most significant load. (Emissions and GHG calculations assume the excess heat is ventilated to the outside, and do not factor in additional air conditioning loads.)
Table 7-5 Summertime MCHP Performance – Basic Integration
MCHP Unit Type
Heating TypeStorage
Temperature [°C]
Summertime MCHP
Efficiency [HHV]
Heat Regected to
Ambient [MJ/day]
1 ton Air Conditioner Run Time
[min]
Global Energy Savings (Coal)
[MJ/day]
GHG Savings (Coal)
[kg/day]
Global Energy Savings (Natural
Gas) [MJ/day]
GHG Savings (Natural
Gas) [kg/day]
Forced Air 80 48% 29.2 138 16.2 10.4 -4.0 -2.0In-Floor Heat / Radiators 80 48% 29.2 138 11.0 10.1 -9.2 -2.3
Forced Air 70 75% 18.8 89 21.5 3.3 17.1 0.6In-Floor Heat / Radiators 70 75% 18.8 89 16.1 3.1 11.3 0.2
Forced Air 80 77% 4.9 23 -19.5 -0.8 -20.2 -1.2In-Floor Heat / Radiators 80 79% 3.4 16 -17.2 -0.6 -17.9 -1.1
Forced Air 80 74% 6 28 6.6 2.1 2.9 -0.2In-Floor Heat / Radiators 55 78% 4.1 19 6.7 1.5 4.2 0.0
SOFC
PEMFC
Stirling Engine
IC Engine
84
Chapter 8 Advanced Integration of MCHP Units into Residential Buildings
In an attempt to improve heat recovery and utilization, the heat delivery and storage system was iteratively redesigned. The approach taken was to increase the run times of the MCHP units through storage capacity and control logic, and then to change the system configuration to reduce exergy destruction. The following sections describe the design process for each unit, and the results obtained.
8.1 PEM Fuel Cell MCHP Advanced Integration
Upon studying the behaviour of the PEMFC in the basic integration cases, it was apparent that short run times of only 4 hours occurred in the summer time and in the shoulder seasons. From Figure 6-2 it was clear that increasing the run times would improve performance significantly. Since the PEFC was provided with an integral 200 litre tank, no change in the primary tank size was possible.
Fortunately, the PEMFC was capable of modulating its output. The PEM set point was changed so that the output was at 30% (the minimum value) during the summer months and early shoulder seasons, “Case D”. This change allowed the PEM fuel cell to run continuously, and increased the performance (global energy savings) from the basic integration case by 7%. Table 8-1 lists the performance improvements as the design evolved.
To further improve performance during the heating season, a secondary tank was incorporated into the system “Case E” as shown in Figure 8-1. The logic behind the design was to have a “hot” primary tank to provide high temperature water for the domestic hot water requirements. This primary tank contains 60°C domestic hot water, as the plumbing code dictates. The second tank accepts heat through a heat exchanger when the primary tank is at the required temperature. The second tank provides energy directly to the building heating system. Its temperature is allowed to float, as demand requires. The larger this secondary tank is, the more capable it is of providing heat in intermittent loading. This feature is most pronounced when heat demand was intermittent. Heat demand was intermittent in the shoulder seasons, in the high efficiency building cases, and especially in the forced air cases with night time temperature setback.
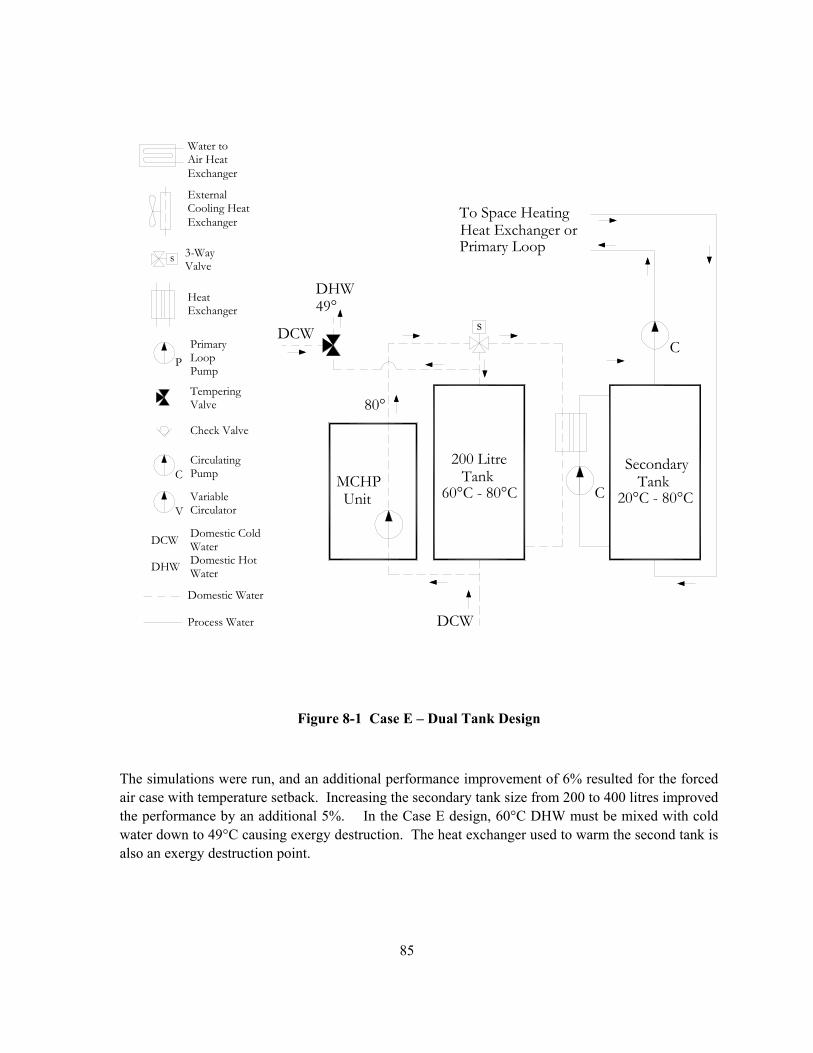
85
Cs
Exchanger
ExternalCooling Heat
VariableCirculatorV
C
DCW
UnitMCHP
Process Water
Domestic Water
49°DHW
DCW
WaterDomestic HotWaterDomestic Cold
DHW
DCW
C
P
PumpCirculating
Check Valve
s
PumpLoopPrimary
Valve3-Way
ValveTempering
ExchangerHeat
Air HeatWater to
Exchanger
80°
Primary LoopHeat Exchanger orTo Space Heating
200 LitreTank
60°C - 80°CTank
Secondary
20°C - 80°C
Figure 8-1 Case E – Dual Tank Design
The simulations were run, and an additional performance improvement of 6% resulted for the forced air case with temperature setback. Increasing the secondary tank size from 200 to 400 litres improved the performance by an additional 5%. In the Case E design, 60°C DHW must be mixed with cold water down to 49°C causing exergy destruction. The heat exchanger used to warm the second tank is also an exergy destruction point.
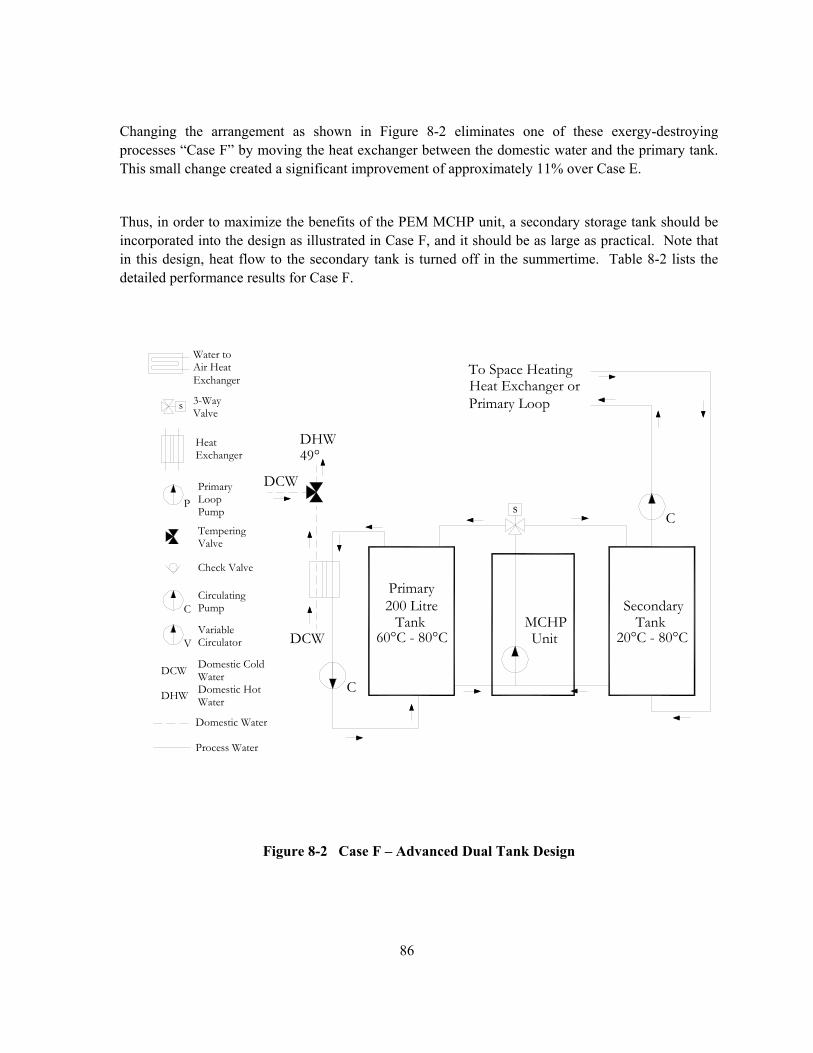
86
Changing the arrangement as shown in Figure 8-2 eliminates one of these exergy-destroying processes “Case F” by moving the heat exchanger between the domestic water and the primary tank. This small change created a significant improvement of approximately 11% over Case E.
Thus, in order to maximize the benefits of the PEM MCHP unit, a secondary storage tank should be incorporated into the design as illustrated in Case F, and it should be as large as practical. Note that in this design, heat flow to the secondary tank is turned off in the summertime. Table 8-2 lists the detailed performance results for Case F.
Cs
UnitMCHP
SecondaryTank
C
VariableCirculatorV DCW
Tank200 Litre
Process Water
Domestic Water
WaterDomestic HotWaterDomestic Cold
DHW
DCW
C
P
PumpCirculating
Check Valve
s
PumpLoopPrimary
Valve3-Way
ValveTempering
ExchangerHeat
Air HeatWater to
Exchanger
49°DHW
DCW
To Space HeatingHeat Exchanger orPrimary Loop
Primary
20°C - 80°C60°C - 80°C
Figure 8-2 Case F – Advanced Dual Tank Design
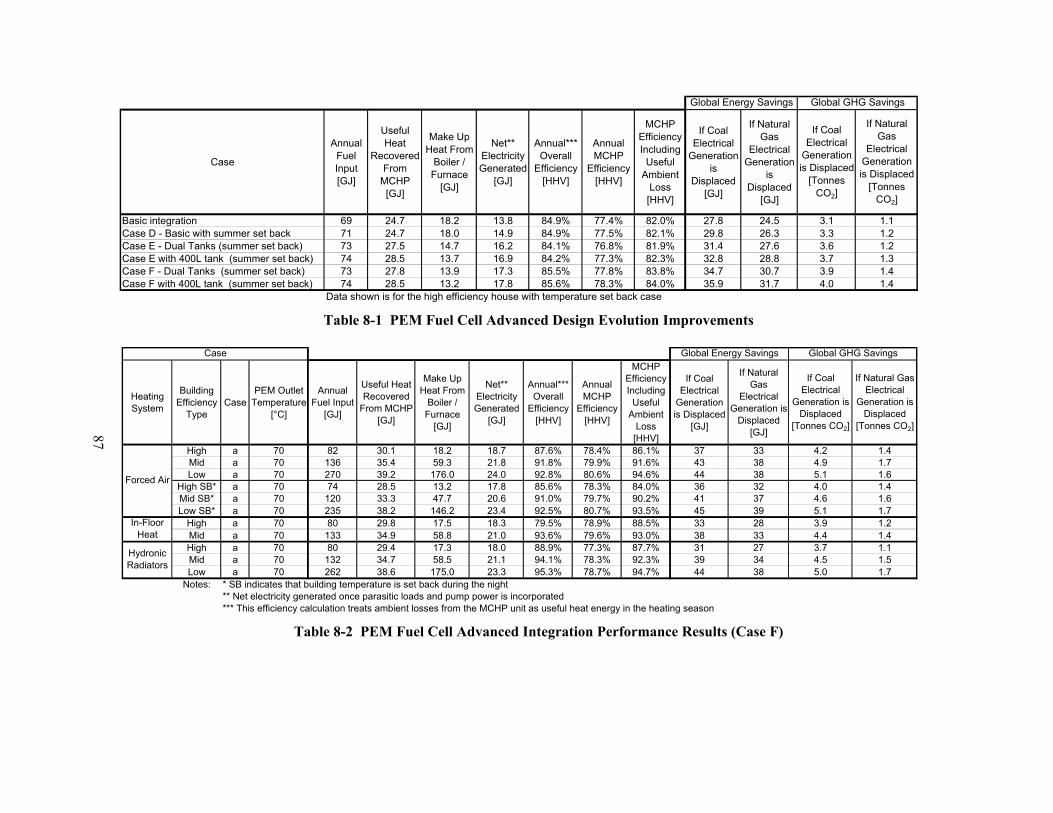
Table 8-1 PEM Fuel Cell Advanced Design Evolution Improvements
Table 8-2 PEM Fuel Cell Advanced Integration Performance Results (Case F)
Heating System
Building Efficiency
TypeCase
PEM Outlet Temperature
[°C]
Annual Fuel Input
[GJ]
Useful Heat Recovered
From MCHP [GJ]
Make Up Heat From
Boiler / Furnace
[GJ]
Net** Electricity Generated
[GJ]
Annual*** Overall
Efficiency [HHV]
Annual MCHP
Efficiency [HHV]
MCHP Efficiency Including
Useful Ambient
Loss [HHV]
If Coal Electrical
Generation is Displaced
[GJ]
If Natural Gas
Electrical Generation is
Displaced [GJ]
If Coal Electrical
Generation is Displaced
[Tonnes CO2]
If Natural Gas Electrical
Generation is Displaced
[Tonnes CO2]
High a 70 82 30.1 18.2 18.7 87.6% 78.4% 86.1% 37 33 4.2 1.4Mid a 70 136 35.4 59.3 21.8 91.8% 79.9% 91.6% 43 38 4.9 1.7Low a 70 270 39.2 176.0 24.0 92.8% 80.6% 94.6% 44 38 5.1 1.6
High SB* a 70 74 28.5 13.2 17.8 85.6% 78.3% 84.0% 36 32 4.0 1.4Mid SB* a 70 120 33.3 47.7 20.6 91.0% 79.7% 90.2% 41 37 4.6 1.6Low SB* a 70 235 38.2 146.2 23.4 92.5% 80.7% 93.5% 45 39 5.1 1.7
High a 70 80 29.8 17.5 18.3 79.5% 78.9% 88.5% 33 28 3.9 1.2Mid a 70 133 34.9 58.8 21.0 93.6% 79.6% 93.0% 38 33 4.4 1.4High a 70 80 29.4 17.3 18.0 88.9% 77.3% 87.7% 31 27 3.7 1.1Mid a 70 132 34.7 58.5 21.1 94.1% 78.3% 92.3% 39 34 4.5 1.5Low a 70 262 38.6 175.0 23.3 95.3% 78.7% 94.7% 44 38 5.0 1.7
Notes: * SB indicates that building temperature is set back during the night** Net electricity generated once parasitic loads and pump power is incorporated*** This efficiency calculation treats ambient losses from the MCHP unit as useful heat energy in the heating season
Global Energy Savings Global GHG Savings
In-Floor Heat
Hydronic Radiators
Case
Forced Air
Case
Annual Fuel Input [GJ]
Useful Heat
Recovered From
MCHP [GJ]
Make Up Heat From
Boiler / Furnace
[GJ]
Net** Electricity Generated
[GJ]
Annual*** Overall
Efficiency [HHV]
Annual MCHP
Efficiency [HHV]
MCHP Efficiency Including
Useful Ambient
Loss [HHV]
If Coal Electrical
Generation is
Displaced [GJ]
If Natural Gas
Electrical Generation
is Displaced
[GJ]
If Coal Electrical
Generation is Displaced
[Tonnes CO2]
If Natural Gas
Electrical Generation is Displaced
[Tonnes CO2]
Basic integration 69 24.7 18.2 13.8 84.9% 77.4% 82.0% 27.8 24.5 3.1 1.1Case D - Basic with summer set back 71 24.7 18.0 14.9 84.9% 77.5% 82.1% 29.8 26.3 3.3 1.2Case E - Dual Tanks (summer set back) 73 27.5 14.7 16.2 84.1% 76.8% 81.9% 31.4 27.6 3.6 1.2Case E with 400L tank (summer set back) 74 28.5 13.7 16.9 84.2% 77.3% 82.3% 32.8 28.8 3.7 1.3Case F - Dual Tanks (summer set back) 73 27.8 13.9 17.3 85.5% 77.8% 83.8% 34.7 30.7 3.9 1.4Case F with 400L tank (summer set back) 74 28.5 13.2 17.8 85.6% 78.3% 84.0% 35.9 31.7 4.0 1.4
Data shown is for the high efficiency house with temperature set back case
Global Energy Savings Global GHG Savings
87

88
8.2 Solid Oxide Fuel Cell MCHP Advanced Integration
As stated before, the SOFC needs to run continuously. Thus, designing to reduce on/off cycles was unnecessary. Improvements could only be made through maximizing heat storage and utilization, as well as reducing exergy-destroying processes. It was shown in Chapter 7 that summertime operation of the SOFC may or may not produce global emissions and energy benefits, depending on the type of grid electrical generation displaced. For consistency and ease of comparison with Chapter 7 results, the SOFC was permitted to run throughout the summer. In general, summertime electricity is scarce, and in eastern North America, a significant amount is generated at coal facilities. Thus a net benefit to society would likely occur by allowing the SOFC to run throughout the summer.
In an attempt to improve the system performance, the thermal storage tank size was initially increased to 400 litres, “Case D”. Improvements did occur in the forced air with set-back case, but were minimal. Table 8-3 lists the incremental improvements obtained as the design evolved.
The heat delivery system was then changed as outlined for the PEMFC integration. “Cases E” and “F” both with 200 and 400 Litre tanks were tried. Figure 8-1 and Figure 8-2 illustrate the simplified plumbing schematic for Case E and F respectively. Table 8-4 lists the performance results for Case F.
Unfortunately, only small performance improvements resulted for the forced air case with temperature setback. All other cases did not change significantly, or resulted in slight decreases in performance. No significant gains were achieved for the majority of the cases because of the low thermal output from the solid oxide fuel cell. Since the building thermal demand was consistently much higher than the SOFC output, the additional thermal storage had no effect in mid winter.
Therefore, for the 1 kW solid oxide fuel cell unit, the advanced heat delivery system is only necessary if the building heating load is very low and intermittent. It is interesting to note that the average thermal demand for the efficient house is approximately 2.4 kWh over the heating season. A CHP output / average heat demand ratio exceeding 0.4 appears to require the advanced heating system. If a larger SOFC MCHP unit is used, there is a high probability that the electrical generation will exceed annual consumption.
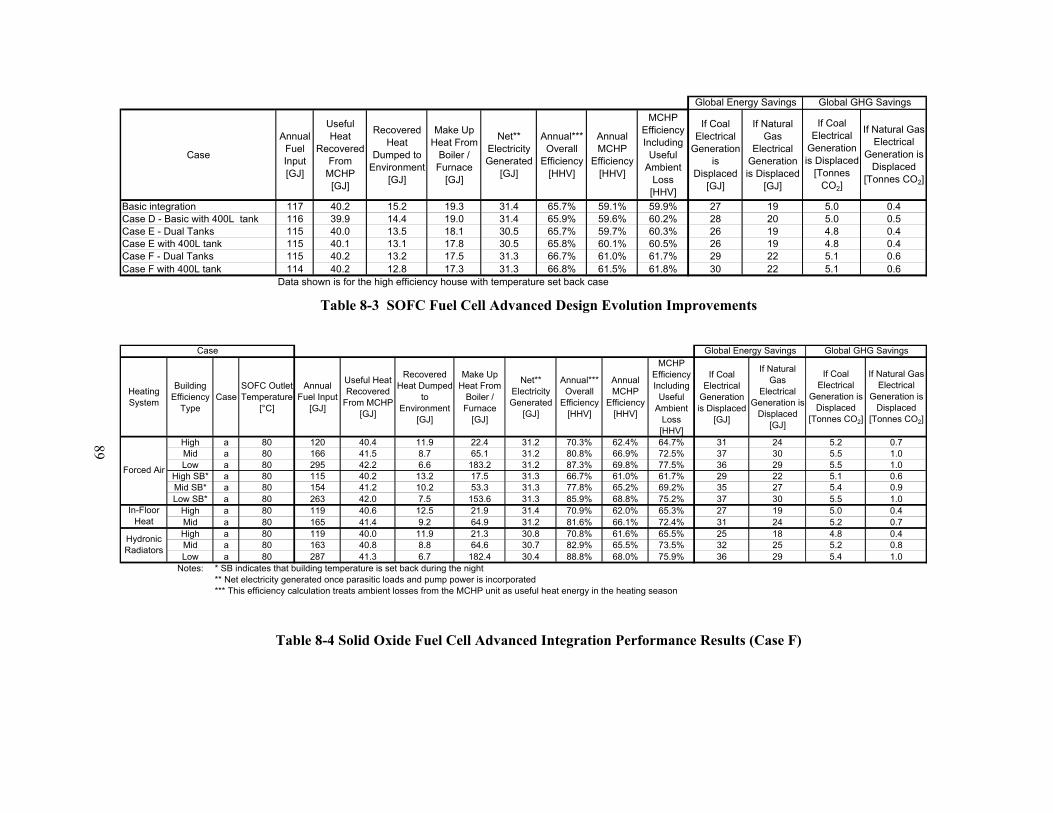
Table 8-3 SOFC Fuel Cell Advanced Design Evolution Improvements
Table 8-4 Solid Oxide Fuel Cell Advanced Integration Performance Results (Case F)
Case
Annual Fuel Input [GJ]
Useful Heat
Recovered From
MCHP [GJ]
Recovered Heat
Dumped to Environment
[GJ]
Make Up Heat From
Boiler / Furnace
[GJ]
Net** Electricity Generated
[GJ]
Annual*** Overall
Efficiency [HHV]
Annual MCHP
Efficiency [HHV]
MCHP Efficiency Including
Useful Ambient
Loss [HHV]
If Coal Electrical
Generation is
Displaced [GJ]
If Natural Gas
Electrical Generation is Displaced
[GJ]
If Coal Electrical
Generation is Displaced
[Tonnes CO2]
If Natural Gas Electrical
Generation is Displaced
[Tonnes CO2]
Basic integration 117 40.2 15.2 19.3 31.4 65.7% 59.1% 59.9% 27 19 5.0 0.4Case D - Basic with 400L tank 116 39.9 14.4 19.0 31.4 65.9% 59.6% 60.2% 28 20 5.0 0.5Case E - Dual Tanks 115 40.0 13.5 18.1 30.5 65.7% 59.7% 60.3% 26 19 4.8 0.4Case E with 400L tank 115 40.1 13.1 17.8 30.5 65.8% 60.1% 60.5% 26 19 4.8 0.4Case F - Dual Tanks 115 40.2 13.2 17.5 31.3 66.7% 61.0% 61.7% 29 22 5.1 0.6Case F with 400L tank 114 40.2 12.8 17.3 31.3 66.8% 61.5% 61.8% 30 22 5.1 0.6
Data shown is for the high efficiency house with temperature set back case
Global Energy Savings Global GHG Savings
Heating System
Building Efficiency
TypeCase
SOFC Outlet Temperature
[°C]
Annual Fuel Input
[GJ]
Useful Heat Recovered
From MCHP [GJ]
Recovered Heat Dumped
to Environment
[GJ]
Make Up Heat From
Boiler / Furnace
[GJ]
Net** Electricity Generated
[GJ]
Annual*** Overall
Efficiency [HHV]
Annual MCHP
Efficiency [HHV]
MCHP Efficiency Including
Useful Ambient
Loss [HHV]
If Coal Electrical
Generation is Displaced
[GJ]
If Natural Gas
Electrical Generation is
Displaced [GJ]
If Coal Electrical
Generation is Displaced
[Tonnes CO2]
If Natural Gas Electrical
Generation is Displaced
[Tonnes CO2]
High a 80 120 40.4 11.9 22.4 31.2 70.3% 62.4% 64.7% 31 24 5.2 0.7Mid a 80 166 41.5 8.7 65.1 31.2 80.8% 66.9% 72.5% 37 30 5.5 1.0Low a 80 295 42.2 6.6 183.2 31.2 87.3% 69.8% 77.5% 36 29 5.5 1.0
High SB* a 80 115 40.2 13.2 17.5 31.3 66.7% 61.0% 61.7% 29 22 5.1 0.6Mid SB* a 80 154 41.2 10.2 53.3 31.3 77.8% 65.2% 69.2% 35 27 5.4 0.9Low SB* a 80 263 42.0 7.5 153.6 31.3 85.9% 68.8% 75.2% 37 30 5.5 1.0
High a 80 119 40.6 12.5 21.9 31.4 70.9% 62.0% 65.3% 27 19 5.0 0.4Mid a 80 165 41.4 9.2 64.9 31.2 81.6% 66.1% 72.4% 31 24 5.2 0.7High a 80 119 40.0 11.9 21.3 30.8 70.8% 61.6% 65.5% 25 18 4.8 0.4Mid a 80 163 40.8 8.8 64.6 30.7 82.9% 65.5% 73.5% 32 25 5.2 0.8Low a 80 287 41.3 6.7 182.4 30.4 88.8% 68.0% 75.9% 36 29 5.4 1.0
Notes: * SB indicates that building temperature is set back during the night** Net electricity generated once parasitic loads and pump power is incorporated*** This efficiency calculation treats ambient losses from the MCHP unit as useful heat energy in the heating season
Global Energy Savings Global GHG Savings
In-Floor Heat
Hydronic Radiators
Case
Forced Air
89

90
8.3 Stirling Engine MCHP Advanced Integration
From the basic integration case, it was apparent that the Stirling engine required longer run times in order to provide a net benefit.
It was initially attempted to size the tank in the basic integration case so that a net benefit would occur during the summertime. A number of tank sizes were tried in order to increase the run time. However, for the small summer thermal demand no net benefit could be obtained. Under close examination, it was determined that the Stirling engine was not capable of generating enough electricity to offset the inefficiencies incurred, even when a very large storage tank was incorporated. Thus, it was determined that the Stirling engine should be disabled in the summertime, and a conventional hot water heater, or a solar hot water heater be used instead.
When the Stirling engine was disabled outside of the heating season, the performance increased significantly. Under this strategy, the Stirling engine operates at an equivalent performance compared to the conventional equipment.
Table 8-5 lists the incremental performance increases as the design of the advanced integration evolved.
The Stirling engine CHP unit was then integrated identically to Case F in the PEMFC application. Figure 8-2 illustrates the integration with the secondary storage tank. The simulations were run and a significant performance increase was obtained. Increasing the secondary tank size continued to improve the performance, but only marginally. Thus, a 200 Litre tank will be adequate for the Stirling engine integration. Table 8-6 lists the results for the Stirling engine integration. Under the recommended design and control, the Stirling engine provides a net benefit in the majority of the cases.
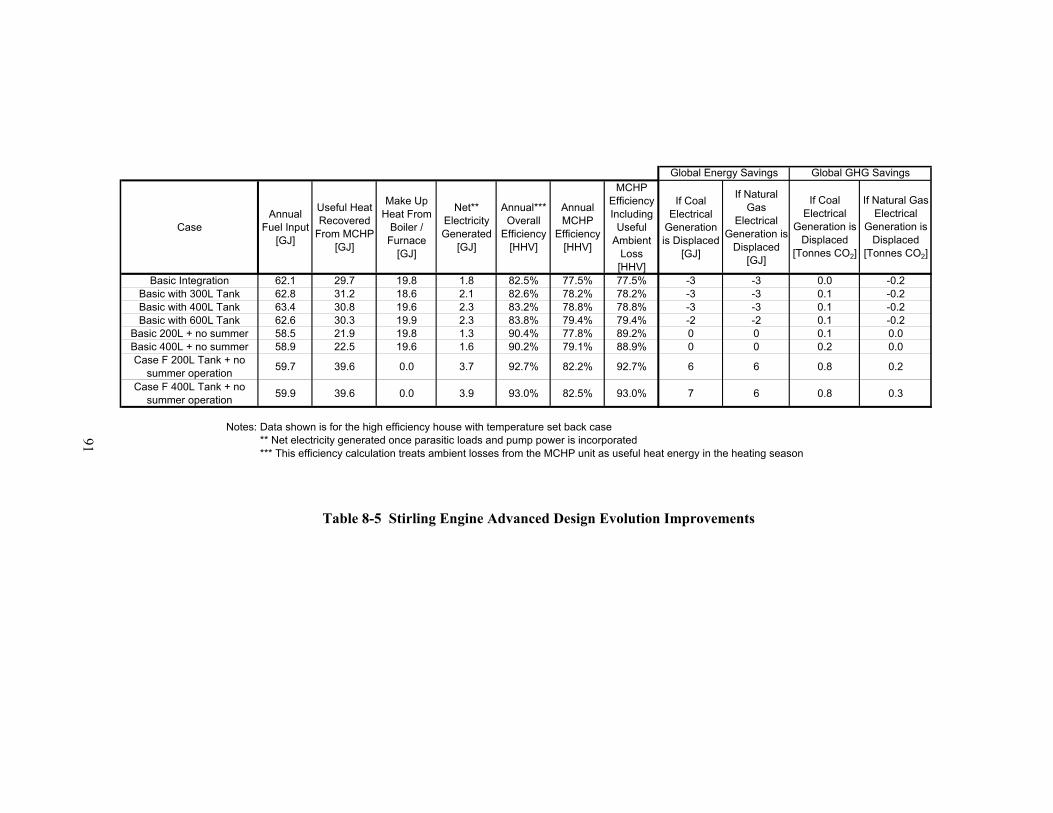
Table 8-5 Stirling Engine Advanced Design Evolution Improvements
CaseAnnual
Fuel Input [GJ]
Useful Heat Recovered
From MCHP [GJ]
Make Up Heat From
Boiler / Furnace
[GJ]
Net** Electricity Generated
[GJ]
Annual*** Overall
Efficiency [HHV]
Annual MCHP
Efficiency [HHV]
MCHP Efficiency Including
Useful Ambient
Loss [HHV]
If Coal Electrical
Generation is Displaced
[GJ]
If Natural Gas
Electrical Generation is
Displaced [GJ]
If Coal Electrical
Generation is Displaced
[Tonnes CO2]
If Natural Gas Electrical
Generation is Displaced
[Tonnes CO2]
Basic Integration 62.1 29.7 19.8 1.8 82.5% 77.5% 77.5% -3 -3 0.0 -0.2Basic with 300L Tank 62.8 31.2 18.6 2.1 82.6% 78.2% 78.2% -3 -3 0.1 -0.2Basic with 400L Tank 63.4 30.8 19.6 2.3 83.2% 78.8% 78.8% -3 -3 0.1 -0.2Basic with 600L Tank 62.6 30.3 19.9 2.3 83.8% 79.4% 79.4% -2 -2 0.1 -0.2
Basic 200L + no summer 58.5 21.9 19.8 1.3 90.4% 77.8% 89.2% 0 0 0.1 0.0Basic 400L + no summer 58.9 22.5 19.6 1.6 90.2% 79.1% 88.9% 0 0 0.2 0.0Case F 200L Tank + no
summer operation 59.7 39.6 0.0 3.7 92.7% 82.2% 92.7% 6 6 0.8 0.2
Case F 400L Tank + no summer operation 59.9 39.6 0.0 3.9 93.0% 82.5% 93.0% 7 6 0.8 0.3
Notes: Data shown is for the high efficiency house with temperature set back case** Net electricity generated once parasitic loads and pump power is incorporated*** This efficiency calculation treats ambient losses from the MCHP unit as useful heat energy in the heating season
Global Energy Savings Global GHG Savings
91
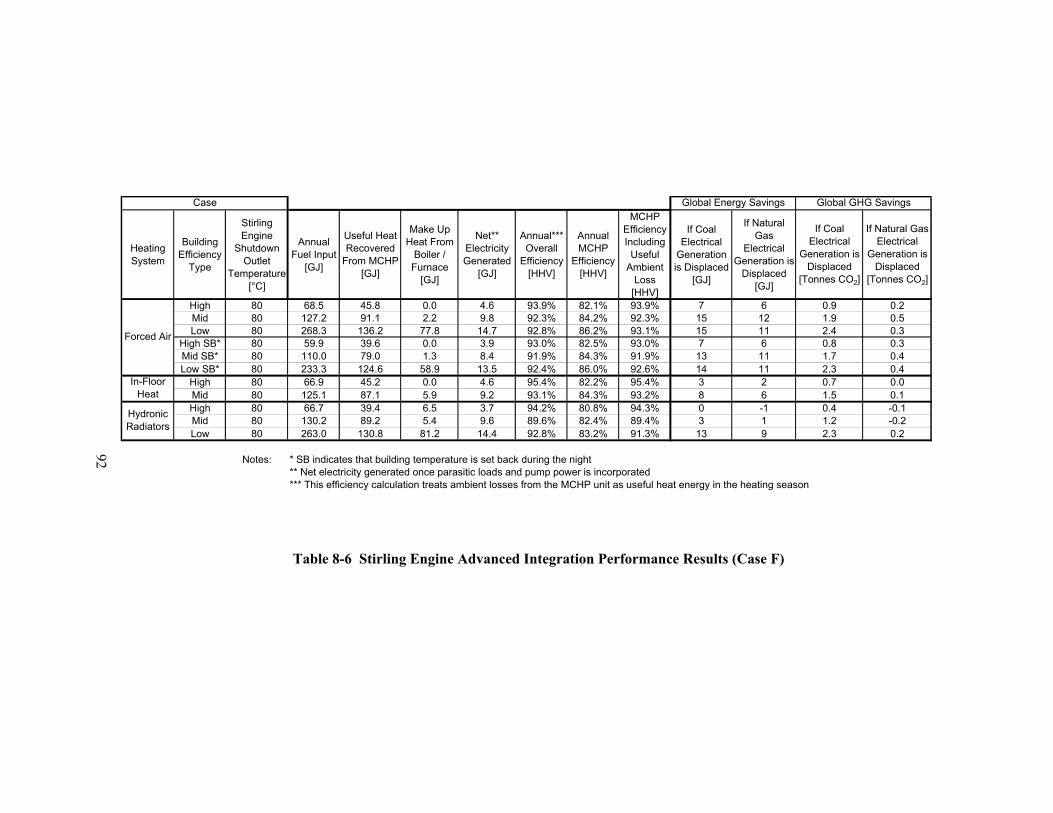
92
Table 8-6 Stirling Engine Advanced Integration Performance Results (Case F)
Heating System
Building Efficiency
Type
Stirling Engine
Shutdown Outlet
Temperature [°C]
Annual Fuel Input
[GJ]
Useful Heat Recovered
From MCHP [GJ]
Make Up Heat From
Boiler / Furnace
[GJ]
Net** Electricity Generated
[GJ]
Annual*** Overall
Efficiency [HHV]
Annual MCHP
Efficiency [HHV]
MCHP Efficiency Including
Useful Ambient
Loss [HHV]
If Coal Electrical
Generation is Displaced
[GJ]
If Natural Gas
Electrical Generation is
Displaced [GJ]
If Coal Electrical
Generation is Displaced
[Tonnes CO2]
If Natural Gas Electrical
Generation is Displaced
[Tonnes CO2]
High 80 68.5 45.8 0.0 4.6 93.9% 82.1% 93.9% 7 6 0.9 0.2Mid 80 127.2 91.1 2.2 9.8 92.3% 84.2% 92.3% 15 12 1.9 0.5Low 80 268.3 136.2 77.8 14.7 92.8% 86.2% 93.1% 15 11 2.4 0.3
High SB* 80 59.9 39.6 0.0 3.9 93.0% 82.5% 93.0% 7 6 0.8 0.3Mid SB* 80 110.0 79.0 1.3 8.4 91.9% 84.3% 91.9% 13 11 1.7 0.4Low SB* 80 233.3 124.6 58.9 13.5 92.4% 86.0% 92.6% 14 11 2.3 0.4
High 80 66.9 45.2 0.0 4.6 95.4% 82.2% 95.4% 3 2 0.7 0.0Mid 80 125.1 87.1 5.9 9.2 93.1% 84.3% 93.2% 8 6 1.5 0.1High 80 66.7 39.4 6.5 3.7 94.2% 80.8% 94.3% 0 -1 0.4 -0.1Mid 80 130.2 89.2 5.4 9.6 89.6% 82.4% 89.4% 3 1 1.2 -0.2Low 80 263.0 130.8 81.2 14.4 92.8% 83.2% 91.3% 13 9 2.3 0.2
Notes: * SB indicates that building temperature is set back during the night** Net electricity generated once parasitic loads and pump power is incorporated*** This efficiency calculation treats ambient losses from the MCHP unit as useful heat energy in the heating season
Global Energy Savings Global GHG Savings
In-Floor Heat
Hydronic Radiators
Case
Forced Air
92

93
8.4 Internal Combustion Engine MCHP Advanced Integration
The IC engine system was the most limited system for improvement. The typical 200L storage tank was sufficient for summertime heat storage, allowing the engine to run long enough to reach on/off efficiencies within 7% of steady state operation. An increase in the tank size was actually detrimental to the summertime performance. The small increase in efficiency gained through longer run times was more than offset by the increase in thermal losses due to the larger tank. Thus, the primary tank used for domestic hot water heating remained at 200 litres. No summertime improvement could be made for the IC engine integration.
The addition of the second tank improved performance significantly (Case F), especially for the mid and high efficiency building types and the cases with temperature setback. Increasing the size of the secondary tank to 400 litres resulted in a moderate additional performance increase. Figure 8-2 illustrates the simplified plumbing schematic.
Table 8-7 lists the performance improvements for the design steps discussed. Table 8-8 lists the final performance data for the IC engine when incorporated with Case F. The performance did not improve significantly for the high load cases because the thermal output from the IC engine was small compared to the building heat demand. During the heating season, any thermal energy recovered from the IC engine was used immediately. Thus the IC engine ran virtually continuously during the heating season, both in the basic integration and advanced integration cases.
Improvements to performance resulting from the balance of plant design could only occur when the load was intermittent, or when the average demand was close to the thermal output from the Internal Combustion MCHP unit. This is why the high efficiency case benefited the most from the heat storage and delivery system improvements.
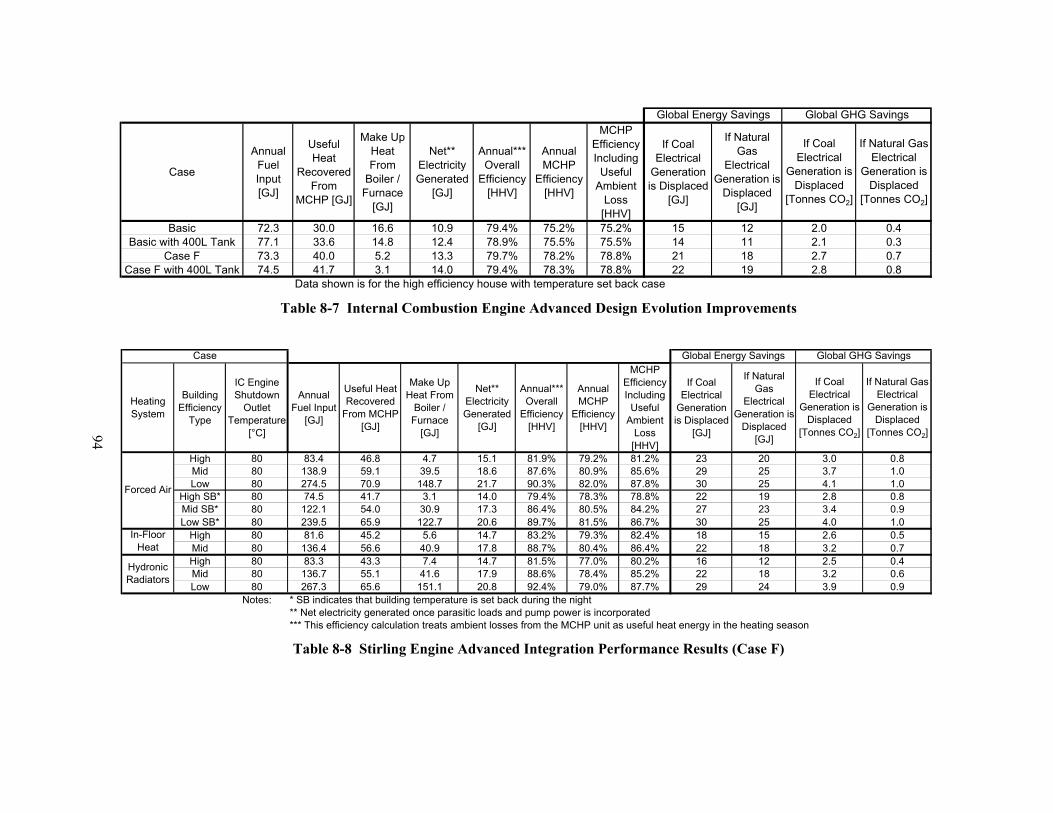
Table 8-7 Internal Combustion Engine Advanced Design Evolution Improvements
Table 8-8 Stirling Engine Advanced Integration Performance Results (Case F)
Case
Annual Fuel Input [GJ]
Useful Heat
Recovered From
MCHP [GJ]
Make Up Heat From
Boiler / Furnace
[GJ]
Net** Electricity Generated
[GJ]
Annual*** Overall
Efficiency [HHV]
Annual MCHP
Efficiency [HHV]
MCHP Efficiency Including
Useful Ambient
Loss [HHV]
If Coal Electrical
Generation is Displaced
[GJ]
If Natural Gas
Electrical Generation is
Displaced [GJ]
If Coal Electrical
Generation is Displaced
[Tonnes CO2]
If Natural Gas Electrical
Generation is Displaced
[Tonnes CO2]
Basic 72.3 30.0 16.6 10.9 79.4% 75.2% 75.2% 15 12 2.0 0.4Basic with 400L Tank 77.1 33.6 14.8 12.4 78.9% 75.5% 75.5% 14 11 2.1 0.3
Case F 73.3 40.0 5.2 13.3 79.7% 78.2% 78.8% 21 18 2.7 0.7Case F with 400L Tank 74.5 41.7 3.1 14.0 79.4% 78.3% 78.8% 22 19 2.8 0.8
Data shown is for the high efficiency house with temperature set back case
Global Energy Savings Global GHG Savings
Heating System
Building Efficiency
Type
IC Engine Shutdown
Outlet Temperature
[°C]
Annual Fuel Input
[GJ]
Useful Heat Recovered
From MCHP [GJ]
Make Up Heat From
Boiler / Furnace
[GJ]
Net** Electricity Generated
[GJ]
Annual*** Overall
Efficiency [HHV]
Annual MCHP
Efficiency [HHV]
MCHP Efficiency Including
Useful Ambient
Loss [HHV]
If Coal Electrical
Generation is Displaced
[GJ]
If Natural Gas
Electrical Generation is
Displaced [GJ]
If Coal Electrical
Generation is Displaced
[Tonnes CO2]
If Natural Gas Electrical
Generation is Displaced
[Tonnes CO2]
High 80 83.4 46.8 4.7 15.1 81.9% 79.2% 81.2% 23 20 3.0 0.8Mid 80 138.9 59.1 39.5 18.6 87.6% 80.9% 85.6% 29 25 3.7 1.0Low 80 274.5 70.9 148.7 21.7 90.3% 82.0% 87.8% 30 25 4.1 1.0
High SB* 80 74.5 41.7 3.1 14.0 79.4% 78.3% 78.8% 22 19 2.8 0.8Mid SB* 80 122.1 54.0 30.9 17.3 86.4% 80.5% 84.2% 27 23 3.4 0.9Low SB* 80 239.5 65.9 122.7 20.6 89.7% 81.5% 86.7% 30 25 4.0 1.0
High 80 81.6 45.2 5.6 14.7 83.2% 79.3% 82.4% 18 15 2.6 0.5Mid 80 136.4 56.6 40.9 17.8 88.7% 80.4% 86.4% 22 18 3.2 0.7High 80 83.3 43.3 7.4 14.7 81.5% 77.0% 80.2% 16 12 2.5 0.4Mid 80 136.7 55.1 41.6 17.9 88.6% 78.4% 85.2% 22 18 3.2 0.6Low 80 267.3 65.6 151.1 20.8 92.4% 79.0% 87.7% 29 24 3.9 0.9
Notes: * SB indicates that building temperature is set back during the night** Net electricity generated once parasitic loads and pump power is incorporated*** This efficiency calculation treats ambient losses from the MCHP unit as useful heat energy in the heating season
Global Energy Savings Global GHG Savings
In-Floor Heat
Hydronic Radiators
Case
Forced Air
94
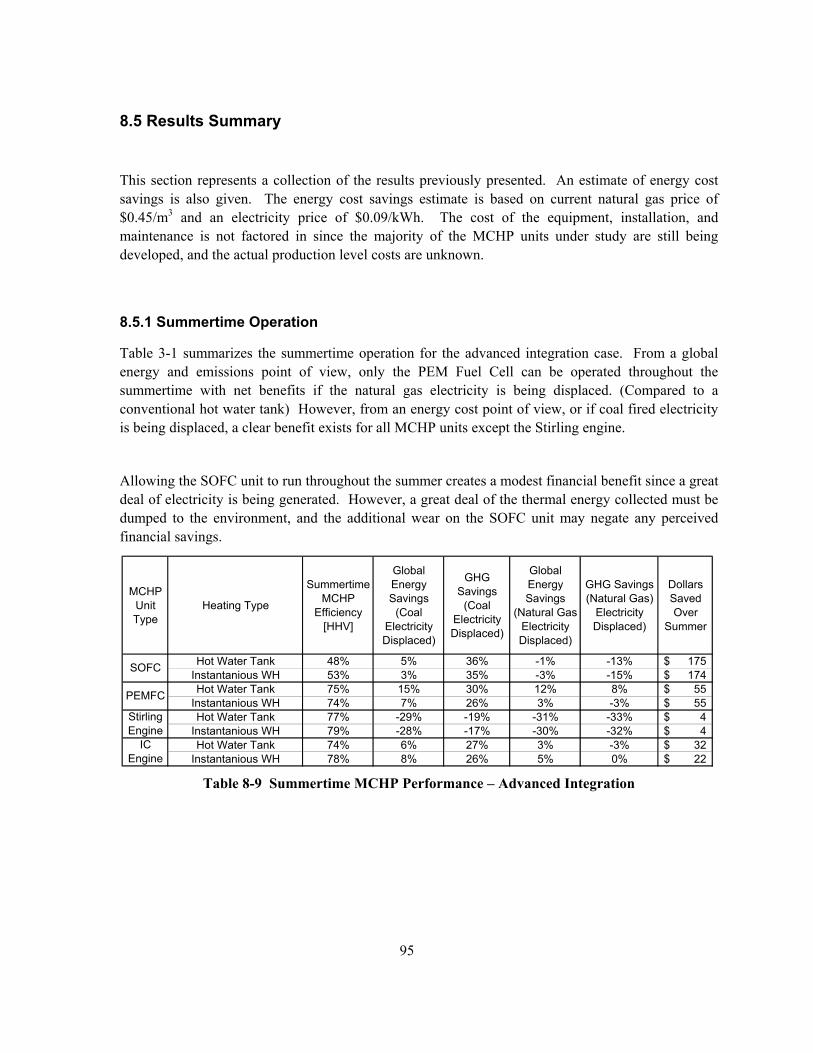
95
8.5 Results Summary
This section represents a collection of the results previously presented. An estimate of energy cost savings is also given. The energy cost savings estimate is based on current natural gas price of $0.45/m3 and an electricity price of $0.09/kWh. The cost of the equipment, installation, and maintenance is not factored in since the majority of the MCHP units under study are still being developed, and the actual production level costs are unknown.
8.5.1 Summertime Operation
Table 3-1 summarizes the summertime operation for the advanced integration case. From a global energy and emissions point of view, only the PEM Fuel Cell can be operated throughout the summertime with net benefits if the natural gas electricity is being displaced. (Compared to a conventional hot water tank) However, from an energy cost point of view, or if coal fired electricity is being displaced, a clear benefit exists for all MCHP units except the Stirling engine.
Allowing the SOFC unit to run throughout the summer creates a modest financial benefit since a great deal of electricity is being generated. However, a great deal of the thermal energy collected must be dumped to the environment, and the additional wear on the SOFC unit may negate any perceived financial savings.
Table 8-9 Summertime MCHP Performance – Advanced Integration
MCHP Unit Type
Heating Type
Summertime MCHP
Efficiency [HHV]
Global Energy Savings
(Coal Electricity Displaced)
GHG Savings
(Coal Electricity Displaced)
Global Energy Savings
(Natural Gas Electricity Displaced)
GHG Savings (Natural Gas)
Electricity Displaced)
Dollars Saved Over
Summer
Hot Water Tank 48% 5% 36% -1% -13% 175$ Instantanious WH 53% 3% 35% -3% -15% 174$ Hot Water Tank 75% 15% 30% 12% 8% 55$
Instantanious WH 74% 7% 26% 3% -3% 55$ Hot Water Tank 77% -29% -19% -31% -33% 4$
Instantanious WH 79% -28% -17% -30% -32% 4$ Hot Water Tank 74% 6% 27% 3% -3% 32$
Instantanious WH 78% 8% 26% 5% 0% 22$
SOFC
PEMFC
Stirling Engine
IC Engine
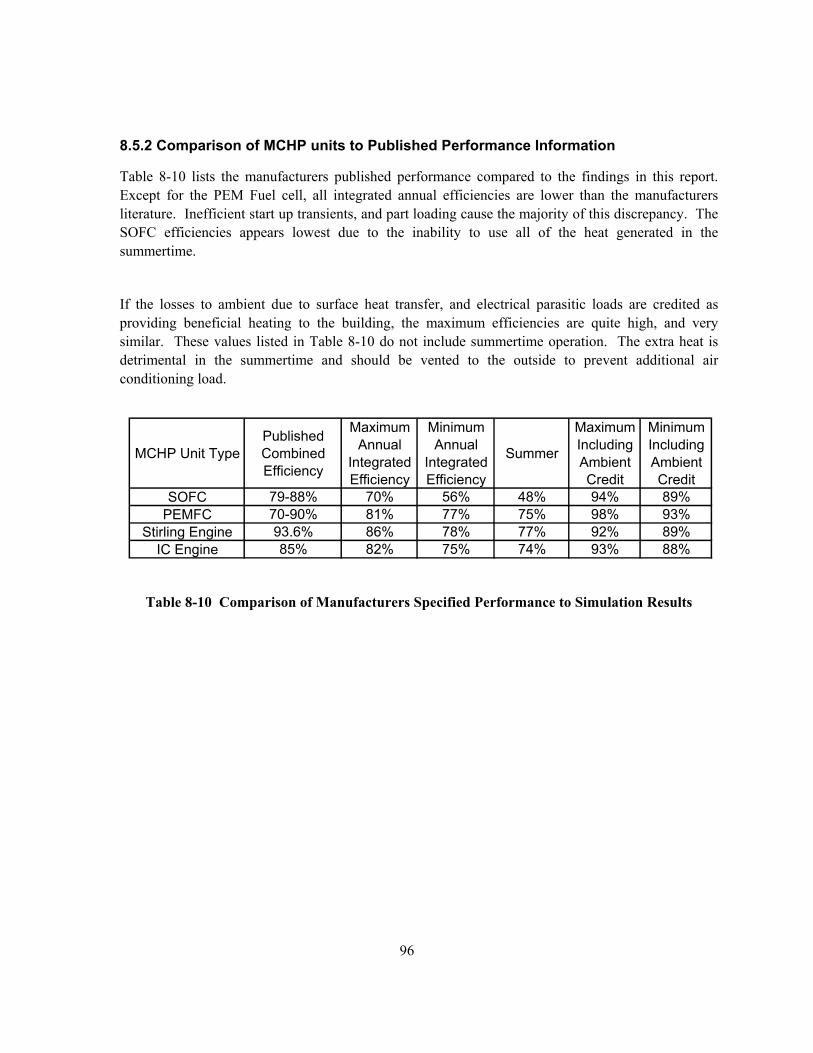
96
8.5.2 Comparison of MCHP units to Published Performance Information
Table 8-10 lists the manufacturers published performance compared to the findings in this report. Except for the PEM Fuel cell, all integrated annual efficiencies are lower than the manufacturers literature. Inefficient start up transients, and part loading cause the majority of this discrepancy. The SOFC efficiencies appears lowest due to the inability to use all of the heat generated in the summertime.
If the losses to ambient due to surface heat transfer, and electrical parasitic loads are credited as providing beneficial heating to the building, the maximum efficiencies are quite high, and very similar. These values listed in Table 8-10 do not include summertime operation. The extra heat is detrimental in the summertime and should be vented to the outside to prevent additional air conditioning load.
Table 8-10 Comparison of Manufacturers Specified Performance to Simulation Results
MCHP Unit TypePublished Combined Efficiency
Maximum Annual
Integrated Efficiency
Minimum Annual
Integrated Efficiency
Summer
Maximum Including Ambient Credit
Minimum Including Ambient Credit
SOFC 79-88% 70% 56% 48% 94% 89%PEMFC 70-90% 81% 77% 75% 98% 93%
Stirling Engine 93.6% 86% 78% 77% 92% 89%IC Engine 85% 82% 75% 74% 93% 88%
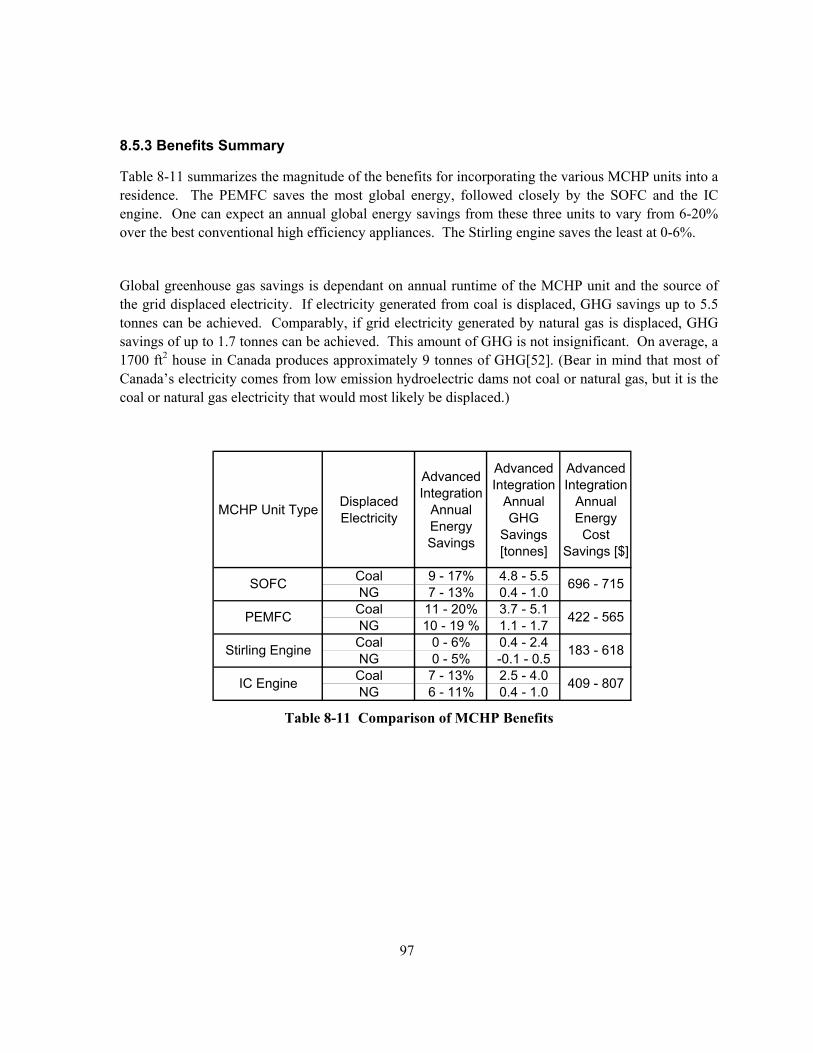
97
8.5.3 Benefits Summary
Table 8-11 summarizes the magnitude of the benefits for incorporating the various MCHP units into a residence. The PEMFC saves the most global energy, followed closely by the SOFC and the IC engine. One can expect an annual global energy savings from these three units to vary from 6-20% over the best conventional high efficiency appliances. The Stirling engine saves the least at 0-6%.
Global greenhouse gas savings is dependant on annual runtime of the MCHP unit and the source of the grid displaced electricity. If electricity generated from coal is displaced, GHG savings up to 5.5 tonnes can be achieved. Comparably, if grid electricity generated by natural gas is displaced, GHG savings of up to 1.7 tonnes can be achieved. This amount of GHG is not insignificant. On average, a 1700 ft2 house in Canada produces approximately 9 tonnes of GHG[52]. (Bear in mind that most of Canada’s electricity comes from low emission hydroelectric dams not coal or natural gas, but it is the coal or natural gas electricity that would most likely be displaced.)
Table 8-11 Comparison of MCHP Benefits
MCHP Unit Type Displaced Electricity
Advanced Integration
Annual Energy Savings
Advanced Integration
Annual GHG
Savings [tonnes]
Advanced Integration
Annual Energy
Cost Savings [$]
Coal 9 - 17% 4.8 - 5.5NG 7 - 13% 0.4 - 1.0Coal 11 - 20% 3.7 - 5.1NG 10 - 19 % 1.1 - 1.7Coal 0 - 6% 0.4 - 2.4NG 0 - 5% -0.1 - 0.5Coal 7 - 13% 2.5 - 4.0NG 6 - 11% 0.4 - 1.0
SOFC
PEMFC
Stirling Engine
IC Engine
696 - 715
422 - 565
183 - 618
409 - 807
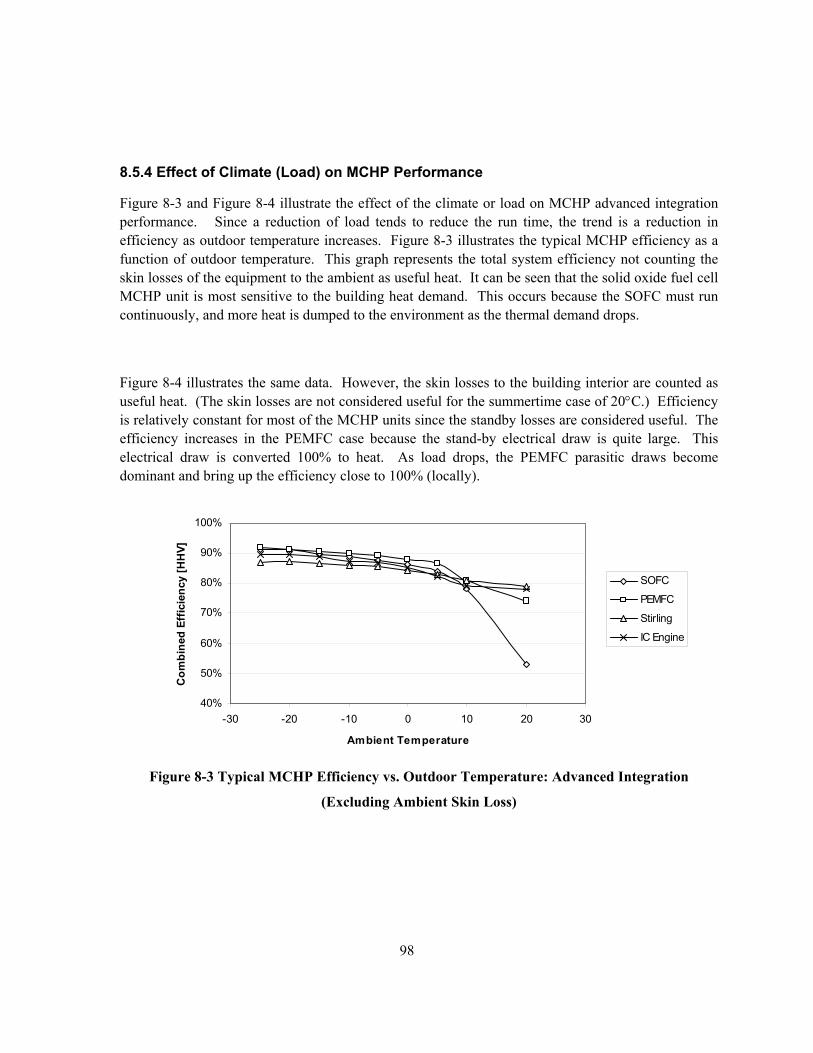
98
8.5.4 Effect of Climate (Load) on MCHP Performance
Figure 8-3 and Figure 8-4 illustrate the effect of the climate or load on MCHP advanced integration performance. Since a reduction of load tends to reduce the run time, the trend is a reduction in efficiency as outdoor temperature increases. Figure 8-3 illustrates the typical MCHP efficiency as a function of outdoor temperature. This graph represents the total system efficiency not counting the skin losses of the equipment to the ambient as useful heat. It can be seen that the solid oxide fuel cell MCHP unit is most sensitive to the building heat demand. This occurs because the SOFC must run continuously, and more heat is dumped to the environment as the thermal demand drops.
Figure 8-4 illustrates the same data. However, the skin losses to the building interior are counted as useful heat. (The skin losses are not considered useful for the summertime case of 20°C.) Efficiency is relatively constant for most of the MCHP units since the standby losses are considered useful. The efficiency increases in the PEMFC case because the stand-by electrical draw is quite large. This electrical draw is converted 100% to heat. As load drops, the PEMFC parasitic draws become dominant and bring up the efficiency close to 100% (locally).
Figure 8-3 Typical MCHP Efficiency vs. Outdoor Temperature: Advanced Integration
(Excluding Ambient Skin Loss)
40%
50%
60%
70%
80%
90%
100%
-30 -20 -10 0 10 20 30
Ambient Temperature
Com
bine
d Ef
ficie
ncy
[HH
V]
SOFC
PEMFC
Stirling
IC Engine
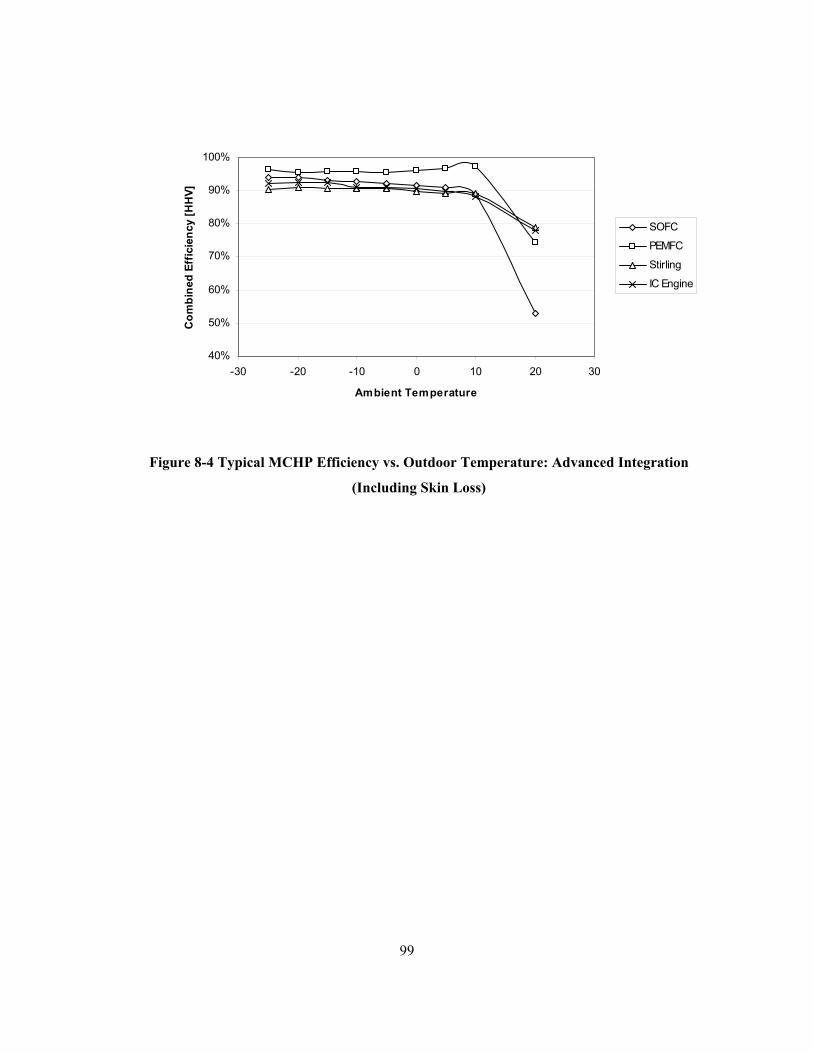
99
Figure 8-4 Typical MCHP Efficiency vs. Outdoor Temperature: Advanced Integration
(Including Skin Loss)
40%
50%
60%
70%
80%
90%
100%
-30 -20 -10 0 10 20 30
Ambient Temperature
Com
bine
d Ef
ficie
ncy
[HH
V]
SOFC
PEMFC
Stirling
IC Engine
100
Chapter 9 Conclusions
All of the MCHP units under study were capable of providing a net annual benefit with respect to global energy and greenhouse gas (GHG) emissions. The fuel cells offer the highest performance. However, due to the cost and emerging nature of the technology, the internal combustion engine is the most viable at this time. Annual global energy savings up to 20%, and GHG savings up to 5.5 tonnes per year can be achieved over the best conventional high efficiency appliances.
Due to their small capacity and high electricity / heat output ratio, the PEMFC, SOFC, and IC engine are beneficial even in very well insulated homes, with a low thermal demand. Comparatively, the Stirling engine is much better suited to high thermal demand applications such as old or large buildings.
Integrating the MCHP units with two tanks (one for domestic hot water, and one for space heating thermal storage) improves the overall performance of the system for all of the generators. Homes containing forced air furnaces benefit the most from the integration of the double tank design.
As the rated thermal output approaches the average winter thermal demand, integration becomes much more critical. Thermal storage is required to smooth out the intermittent nature of thermal demand and promote long generator running times.
For the domestic hot water load specified in this study, the PEMFC unit can be operated throughout the summer with a net energy and GHG emissions benefit compared to a high efficiency tank water heater. In the summer, the SOFC and IC engine MCHP units can produce an environmental benefit if grid electricity produced from coal is displaced, but not if natural gas produced electricity is displaced. The Stirling engine cannot achieve a net emissions or energy savings while operating under partial load in the summertime.
At current fuel and electrical prices, fuel cost savings occur in all cases. The magnitude of the savings is dependant on load and generator type. However, these savings do not account for the cost of the CHP equipment, installation or maintenance.

101
Due to the low thermal output from the SOFC MCHP unit, a single tank installation will suffice except when the system is integrated with a forced air furnace.
The PEMFC should be set back to 30% of its rated load in the summer to prevent inefficient on / off cycling. Allowing the PEMFC to operate continuously at this low setting is more beneficial than on / off operation.
9.1 Recommendations for Further work
Larger combined heat and power units should be investigated. Increasing the capacity of the MCHP units will yield greater benefits in the heating season. However, significant performance sacrifices may occur in shoulder seasons, and especially the summertime, which may prove impractical for larger capacity MCHP operation. Also, care must be taken if the electrical output exceeds the annual consumption. It must be understood how electrical utilities will deal with small individuals becoming net producers.

102
Appendix A Canadian Centre for Housing Technology Occupant Energy Usage
Schedule
Occupant Load Schedule [28] (Adapted from the Canadian Centre for Housing Technology Test Houses in Ottawa)
Note: Water draws shown here are for hot water only, in
litres. Overnight
Device Water Utility Draw Time Duration
Bedroom 2
humans 66.4 W 0:00 6 hrs 45 min
Master bedroom
humans 99.6 W 0:00 6 hrs 45 min
Morning
Device Water Utility Draw Time Duration
2nd floor lights 410 W 6:45 60.0 min
1. Master bedroom
shower 36 L 6:50 10.2 min
Family room
humans 166 W 7:00 60.0 min
Main floor lights 200 W 7:00 60.0 min
Kitchen products 450 W 7:30 10.2 min
Kitchen fan 80 W 7:30 10.2 min
Kitchen stove 1600 W 7:30 20.0 min
2. Kitchen tap 13L 7:45 3.0 min
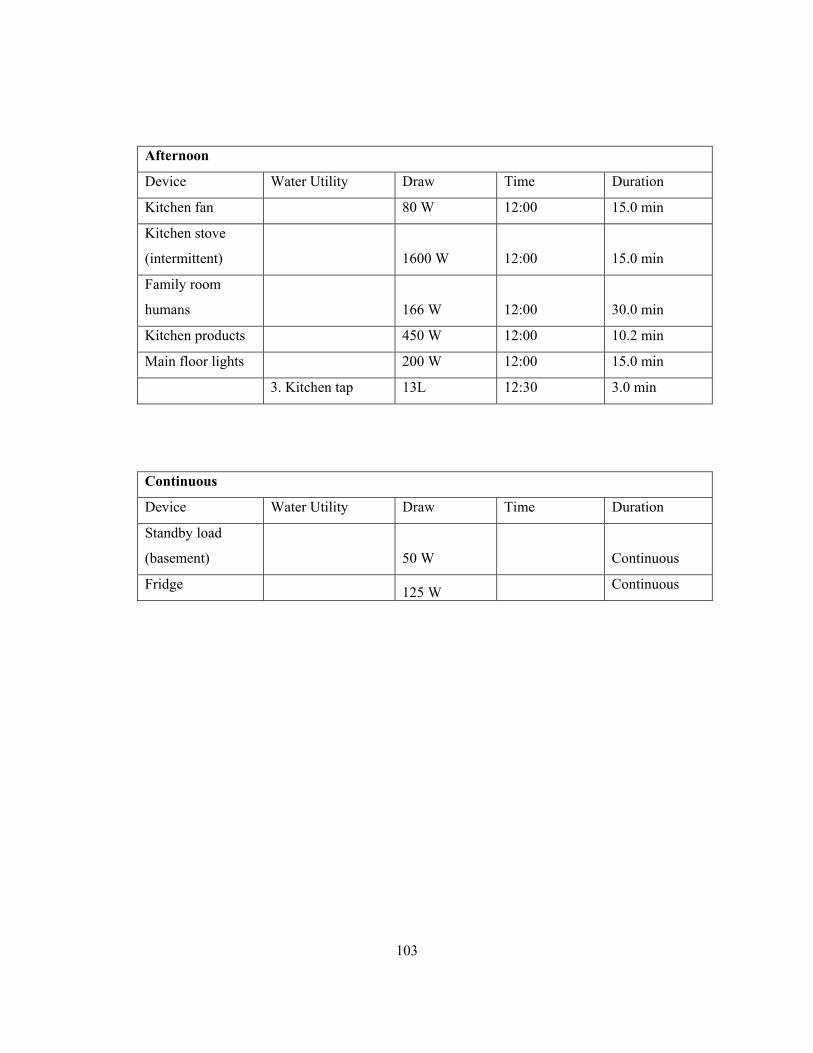
103
Afternoon
Device Water Utility Draw Time Duration
Kitchen fan 80 W 12:00 15.0 min
Kitchen stove
(intermittent) 1600 W 12:00 15.0 min
Family room
humans 166 W 12:00 30.0 min
Kitchen products 450 W 12:00 10.2 min
Main floor lights 200 W 12:00 15.0 min
3. Kitchen tap 13L 12:30 3.0 min
Continuous
Device Water Utility Draw Time Duration
Standby load
(basement) 50 W Continuous
Fridge 125 W Continuous
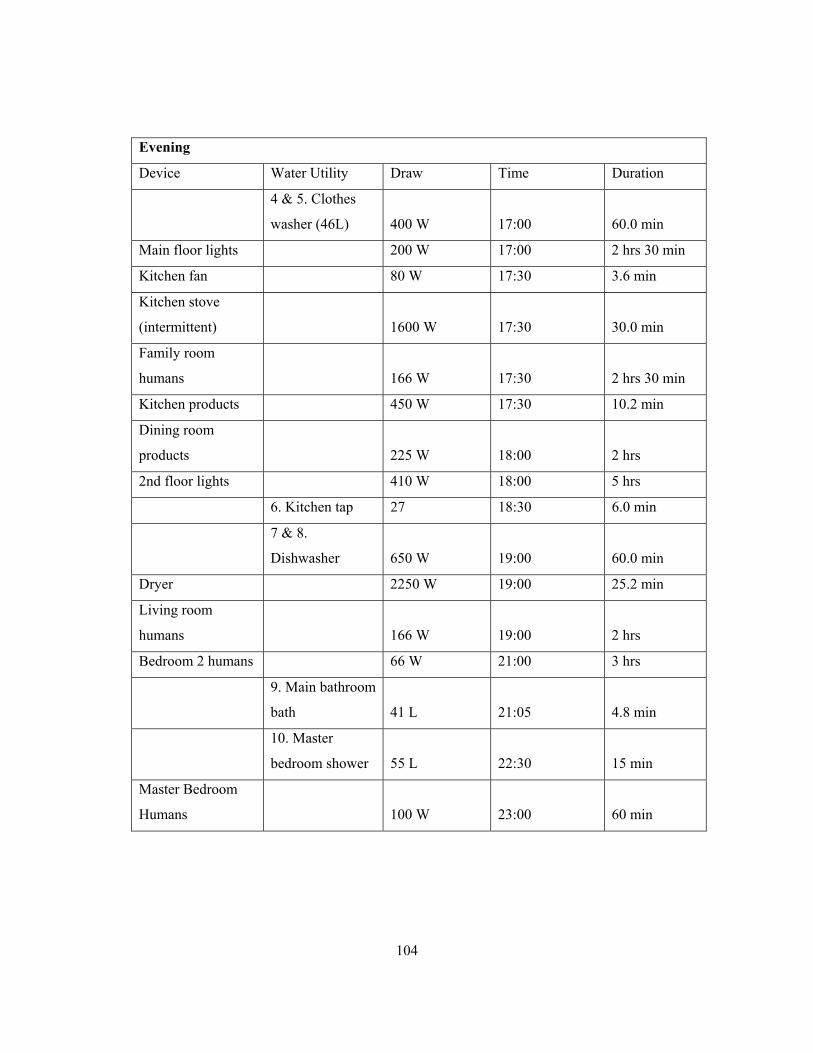
104
Evening
Device Water Utility Draw Time Duration
4 & 5. Clothes
washer (46L) 400 W 17:00 60.0 min
Main floor lights 200 W 17:00 2 hrs 30 min
Kitchen fan 80 W 17:30 3.6 min
Kitchen stove
(intermittent) 1600 W 17:30 30.0 min
Family room
humans 166 W 17:30 2 hrs 30 min
Kitchen products 450 W 17:30 10.2 min
Dining room
products 225 W 18:00 2 hrs
2nd floor lights 410 W 18:00 5 hrs
6. Kitchen tap 27 18:30 6.0 min
7 & 8.
Dishwasher 650 W 19:00 60.0 min
Dryer 2250 W 19:00 25.2 min
Living room
humans 166 W 19:00 2 hrs
Bedroom 2 humans 66 W 21:00 3 hrs
9. Main bathroom
bath 41 L 21:05 4.8 min
10. Master
bedroom shower 55 L 22:30 15 min
Master Bedroom
Humans 100 W 23:00 60 min

105
Appendix B R2000 Building Report
The report found in this appendix was generated using the publicly available HOT 2000 building simulation software developed by Natural Resources Canada. The sole intent of this appendix is to show that the high efficiency home specified in this thesis exceeds the R2000 target by 25%. Note that this report was generated incorporating the high efficiency water heater. If a standard water heater is used, the annual fuel usage increases to 66800 MJ, which exceeds the R2000 target by 15%

106
HOT2000Natural Resources CANADA
Version 9.31
File: Energy Efficient Home.HSE
Application Type: R-2000
Weather Data for OTTAWA, ONTARIO
Builder Code:
Data Entry by: A.B. DeBruyn
Date of entry: 03/01/2006
Company: University of Waterloo
Client name: Energy Efficient Home – Constant Temperature
Street address:
City: Ottawa Region:
Postal code: Telephone:
GENERAL HOUSE CHARACTERISTICS House type: Single detached
Number of stories: Two storeys
Plan shape: Rectangular
Front orientation:
South
Year House Built:
2005
Wall colour: Default Absorptivity: 0.40
Roof colour: Medium brown Absorptivity: 0.84
Soil Condition: Normal conductivity (dry sand, loam,
clay)
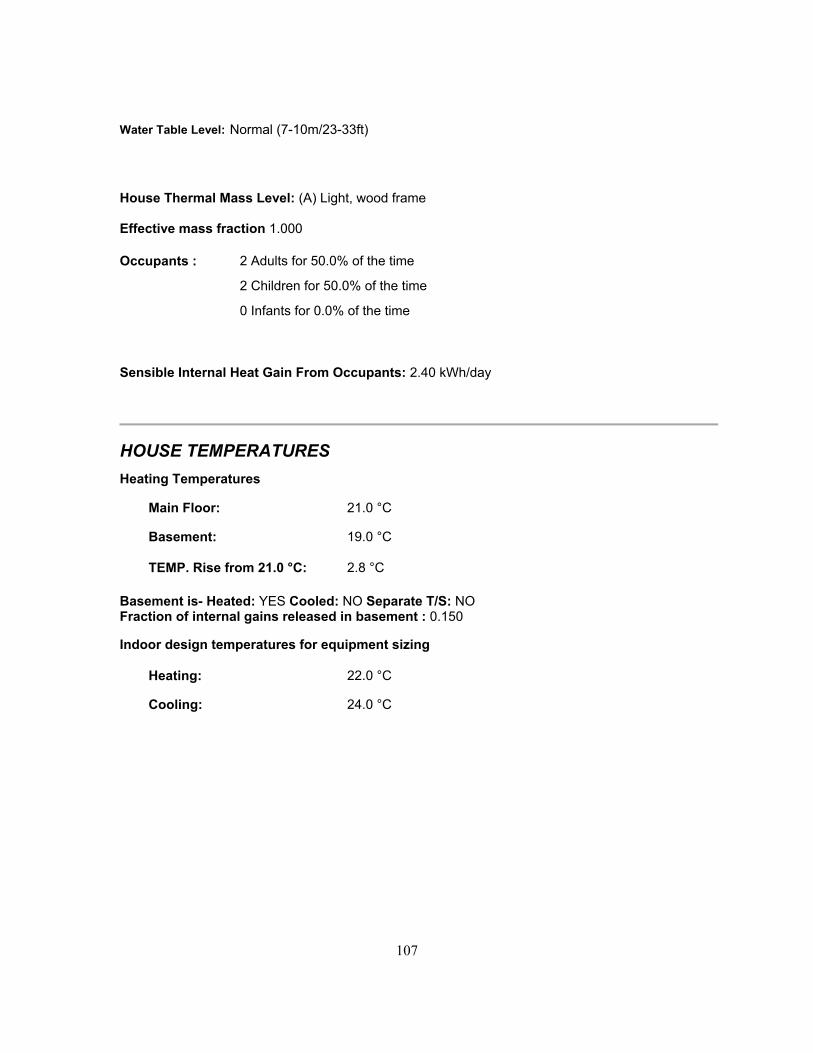
107
Water Table Level: Normal (7-10m/23-33ft)
House Thermal Mass Level: (A) Light, wood frame Effective mass fraction 1.000
Occupants : 2 Adults for 50.0% of the time
2 Children for 50.0% of the time
0 Infants for 0.0% of the time
Sensible Internal Heat Gain From Occupants: 2.40 kWh/day
HOUSE TEMPERATURES Heating Temperatures
Main Floor: 21.0 °C
Basement: 19.0 °C
TEMP. Rise from 21.0 °C: 2.8 °C
Basement is- Heated: YES Cooled: NO Separate T/S: NO Fraction of internal gains released in basement : 0.150
Indoor design temperatures for equipment sizing
Heating: 22.0 °C
Cooling: 24.0 °C
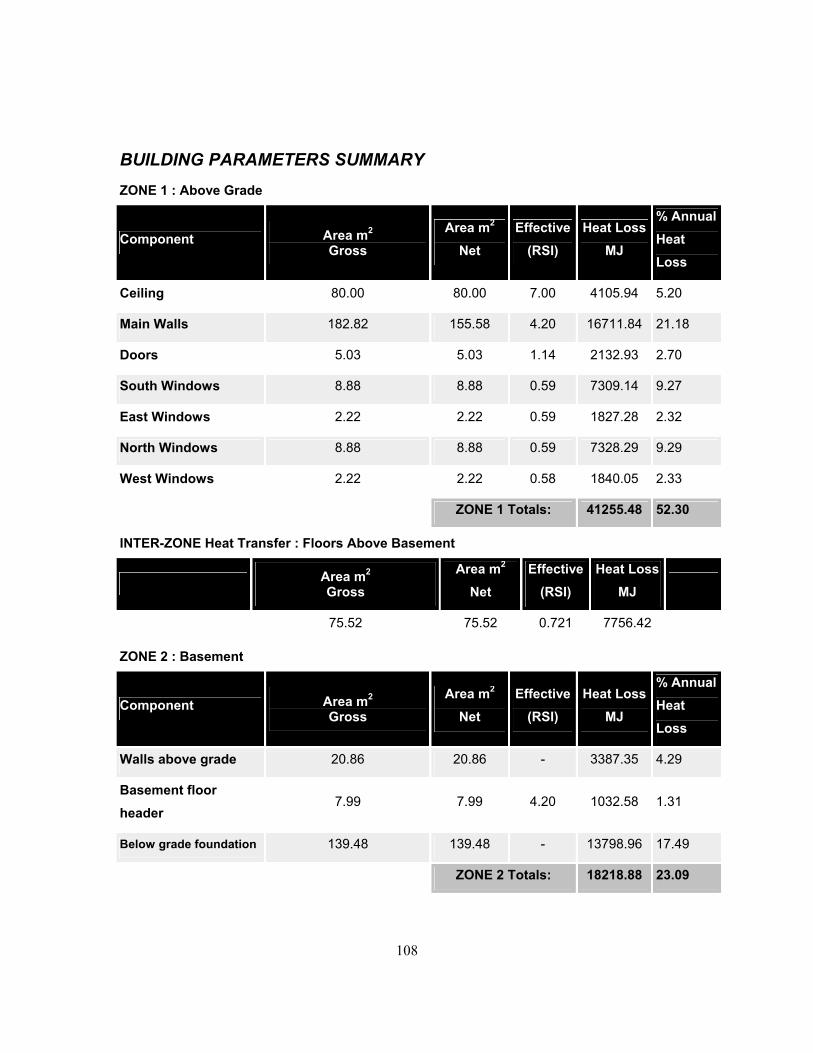
108
BUILDING PARAMETERS SUMMARY ZONE 1 : Above Grade
Component Area m2 Gross
Area m2 Net
Effective (RSI)
Heat Loss MJ
% Annual Heat Loss
Ceiling 80.00 80.00 7.00 4105.94 5.20
Main Walls 182.82 155.58 4.20 16711.84 21.18
Doors 5.03 5.03 1.14 2132.93 2.70
South Windows 8.88 8.88 0.59 7309.14 9.27
East Windows 2.22 2.22 0.59 1827.28 2.32
North Windows 8.88 8.88 0.59 7328.29 9.29
West Windows 2.22 2.22 0.58 1840.05 2.33
ZONE 1 Totals: 41255.48 52.30
INTER-ZONE Heat Transfer : Floors Above Basement
Area m2 Gross
Area m2 Net
Effective (RSI)
Heat LossMJ
75.52 75.52 0.721 7756.42
ZONE 2 : Basement
Component Area m2 Gross
Area m2 Net
Effective (RSI)
Heat Loss MJ
% Annual Heat Loss
Walls above grade 20.86 20.86 - 3387.35 4.29
Basement floor header
7.99 7.99 4.20 1032.58 1.31
Below grade foundation 139.48 139.48 - 13798.96 17.49
ZONE 2 Totals: 18218.88 23.09
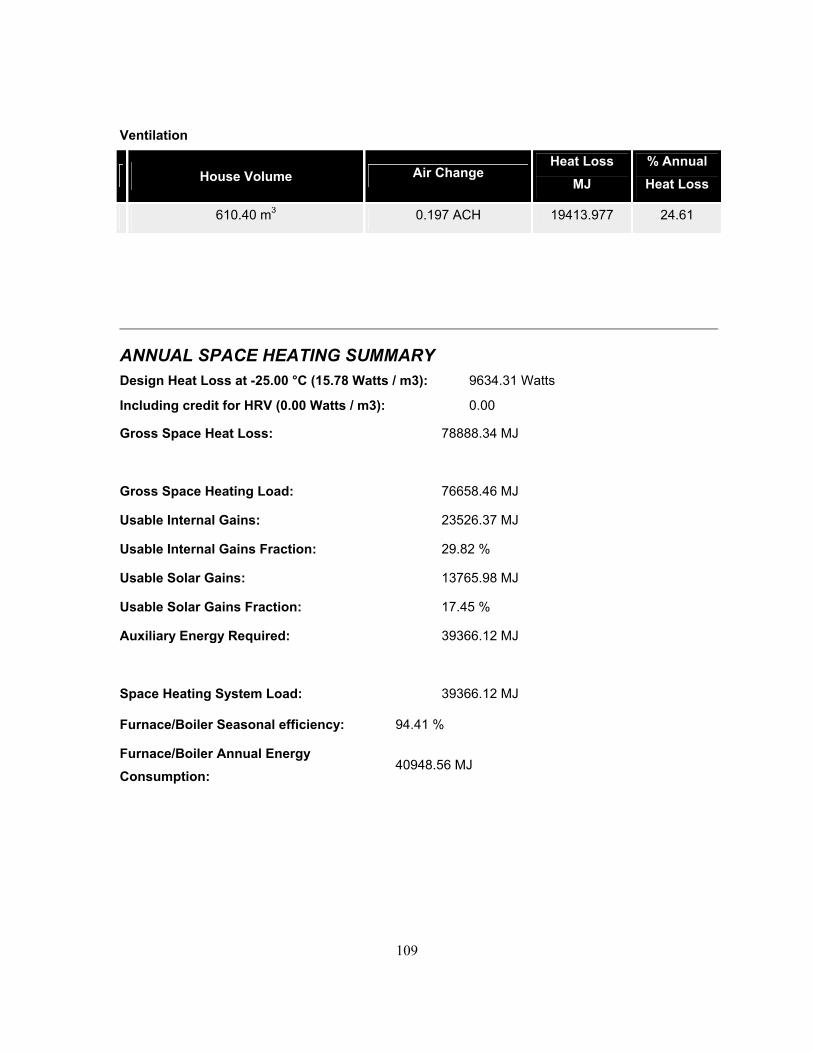
109
Ventilation
House Volume Air Change Heat Loss
MJ % Annual Heat Loss
610.40 m3 0.197 ACH 19413.977 24.61
ANNUAL SPACE HEATING SUMMARY Design Heat Loss at -25.00 °C (15.78 Watts / m3): 9634.31 Watts
Including credit for HRV (0.00 Watts / m3): 0.00
Gross Space Heat Loss: 78888.34 MJ
Gross Space Heating Load: 76658.46 MJ
Usable Internal Gains: 23526.37 MJ
Usable Internal Gains Fraction: 29.82 %
Usable Solar Gains: 13765.98 MJ
Usable Solar Gains Fraction: 17.45 %
Auxiliary Energy Required: 39366.12 MJ
Space Heating System Load: 39366.12 MJ
Furnace/Boiler Seasonal efficiency: 94.41 %
Furnace/Boiler Annual Energy Consumption:
40948.56 MJ
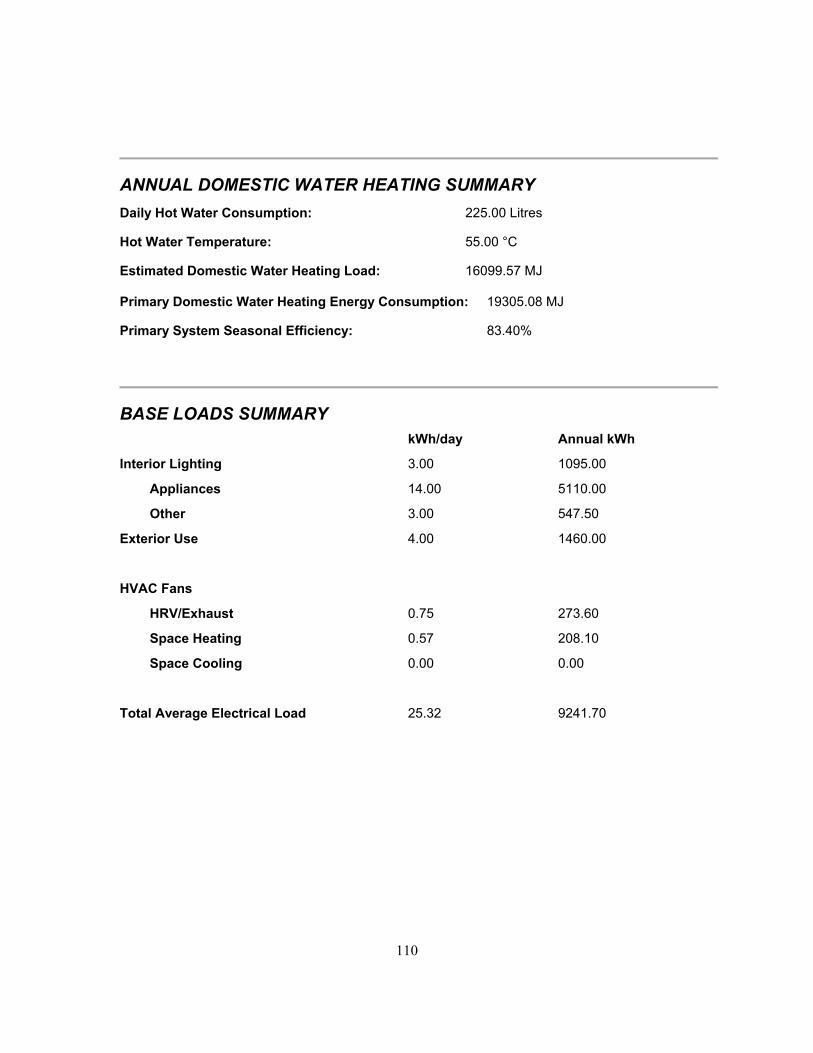
110
ANNUAL DOMESTIC WATER HEATING SUMMARY Daily Hot Water Consumption: 225.00 Litres
Hot Water Temperature: 55.00 °C
Estimated Domestic Water Heating Load: 16099.57 MJ
Primary Domestic Water Heating Energy Consumption: 19305.08 MJ
Primary System Seasonal Efficiency: 83.40%
BASE LOADS SUMMARY kWh/day Annual kWh
Interior Lighting 3.00 1095.00
Appliances 14.00 5110.00
Other 3.00 547.50
Exterior Use 4.00 1460.00
HVAC Fans
HRV/Exhaust 0.75 273.60
Space Heating 0.57 208.10
Space Cooling 0.00 0.00
Total Average Electrical Load 25.32 9241.70
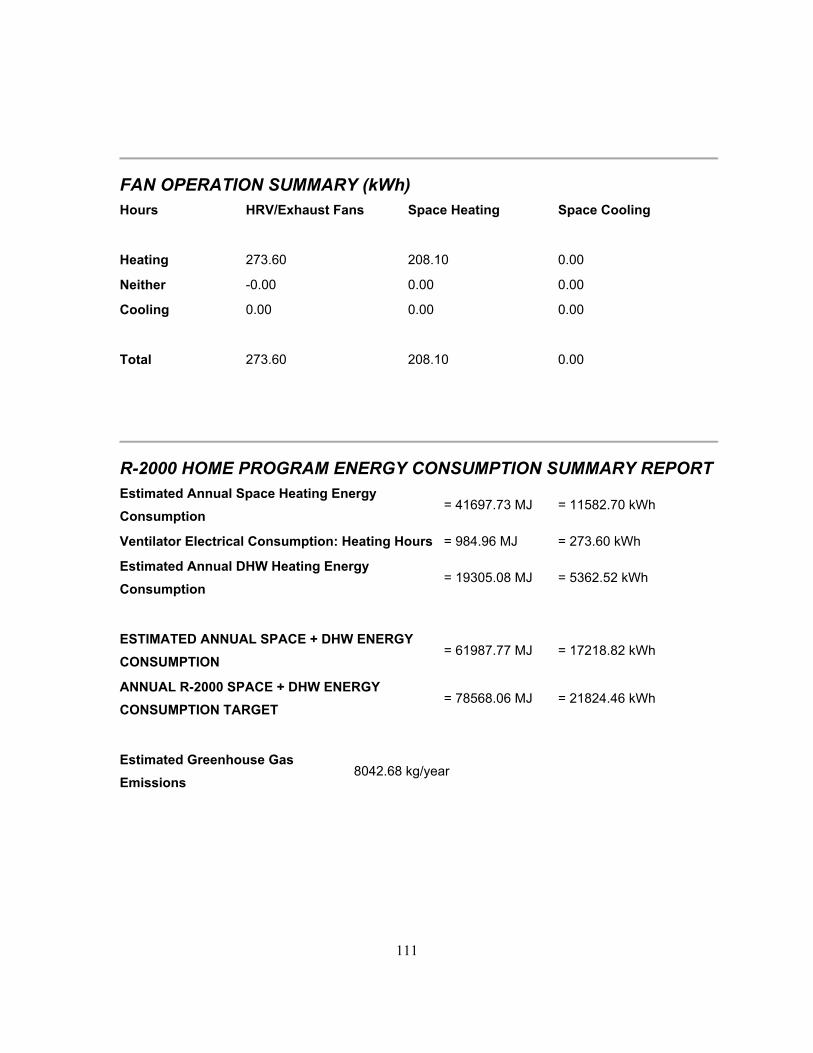
111
FAN OPERATION SUMMARY (kWh) Hours HRV/Exhaust Fans Space Heating Space Cooling
Heating 273.60 208.10 0.00
Neither -0.00 0.00 0.00
Cooling 0.00 0.00 0.00
Total 273.60 208.10 0.00
R-2000 HOME PROGRAM ENERGY CONSUMPTION SUMMARY REPORT Estimated Annual Space Heating Energy Consumption
= 41697.73 MJ = 11582.70 kWh
Ventilator Electrical Consumption: Heating Hours = 984.96 MJ = 273.60 kWh
Estimated Annual DHW Heating Energy Consumption
= 19305.08 MJ = 5362.52 kWh
ESTIMATED ANNUAL SPACE + DHW ENERGY CONSUMPTION
= 61987.77 MJ = 17218.82 kWh
ANNUAL R-2000 SPACE + DHW ENERGY CONSUMPTION TARGET
= 78568.06 MJ = 21824.46 kWh
Estimated Greenhouse Gas Emissions
8042.68 kg/year
112
Appendix C Error and Accuracy Discussion
Combined Heat and Power Engine Models
The CHP models developed in this study were based on efficiency and heat recovery data predominantly from independent test programs. The models exactly reproduced the fuel consumption and electrical behaviour as outlined in the independent and manufacturers reports. Therefore, these aspects of the models were as accurate as the input data. Unfortunately, the manufacturers gave no specification tolerances and no measurement accuracy was provided in the published reports. Therefore the accuracy of the model curve fits to could not be determined.
The thermal efficiency was also based on test data. However, some assumptions were made on thermal mass and on how the thermal efficiency varied with the cooling water temperature and flowrate. The same assumptions were applied on all four of the engine models. Thus, the effect of the assumption should be uniform across the different cases, allowing the comparison between models to be fair.
The amount of heat transferred to the ambient was also based on test data, and on the assumption that all the parasitic electrical loads will be transformed into heat to the ambient. Additional assumptions on generator/inverter efficiencies were made. As stated before, the assumptions were applied identically to all four of the CHP units under study to ensure a fair comparison. It is important to note that the heat transferred to the ambient was small compared to the thermal and electrical output from the generators. Thus, assumptions affecting a portion of the heat loss to the ambient had minimal impact on the simulation outcome.
For each of the simulations undertaken, an energy balance was performed to ensure that no mistakes in the TRNSYS simulation environment were present. All energy flows were monitored to ensure that conservation of energy was maintained. In the simulation environment, the convergence requirement was 0.1%.

113
Building Simulation Accuracy
The buildings simulations contained in this study were performed using eQuest, and TMY2 weather data which represents a typical meteorological year for Ottawa. The results from eQuest were checked against Hot2000 building simulation software to ensure that no significant errors were present. It is worth noting that eQuest is a version of the DOE2 building simulation engine that has been extensively validated. However, the absolute accuracy of the building simulations cannot be determined, and is of not consequence to this study. All that was required was a good representation of a residential load profile. Since this profile will be different for every household, any load profile would have been sufficient as long as it contains typical occupant behaviour.
In summary, the quantitative results presented in this study cannot be treated as absolute values for the installation configurations proposed. However, the comparisons between the test cases and the four MCHP units should represent reality closely. The specific installation details and the actual building / occupant loads will influence the true performance and output of the MCHP unit greatly. However, the trends between the low, mid, and high heat demand houses presented in this work will be representative of the CHP behaviour for the respective installation.
114
Appendix D Simulation Environment Overview
This section describes how the various software components were combined into a single simulation.
The first main component of this work was the building simulation software. EQuest was a stand-alone program that simulated the buildings in this study. An hourly output file was generated by eQuest that summarized the energy fluxes into and out of the building.
TRNSYS was the software that incorporated all of the simulation components together. TRNSYS is a differential equation solver (written in FORTRAN) that treats each component as a separate control volume. The outputs from one control volume are linked to the inputs of the next. The simulations were performed on a minute-by-minute basis. It is appropriate to think of the individual components as functions containing differential equations describing their respective behaviour. The inputs and outputs from each component are the variables, and TRNSYS creates a matrix of all of the components and generates a solution for each time step.
Figure A1 illustrates the architecture within the TRNSYS environment of a typical simulation. Note that this illustration is a simplified representation, and not all of the energy flows or components are shown.
The building was represented in TRNSYS as a control volume containing the appropriate amount of air, and thermal mass. The eQuest file was used as a boundary condition for the building control volume. Thermal losses and gains were forced on the building control volume from the eQuest data file. Interpolation was done between the hourly data points of the eQuest file in order to achieve the minute-by-minute analysis necessary for the MCHP systems.
From Figure A1 it can be seen that a controller monitored the air temperature in the building control volume. If the temperature dropped below the set point, the pump would activate moving heat from the storage tank to the building control volume. (This was accomplished through a water to air heat exchanger not shown in the figure for simplicity.) If the temperature continued to drop, the secondary heating system (furnace in this case) would activate.
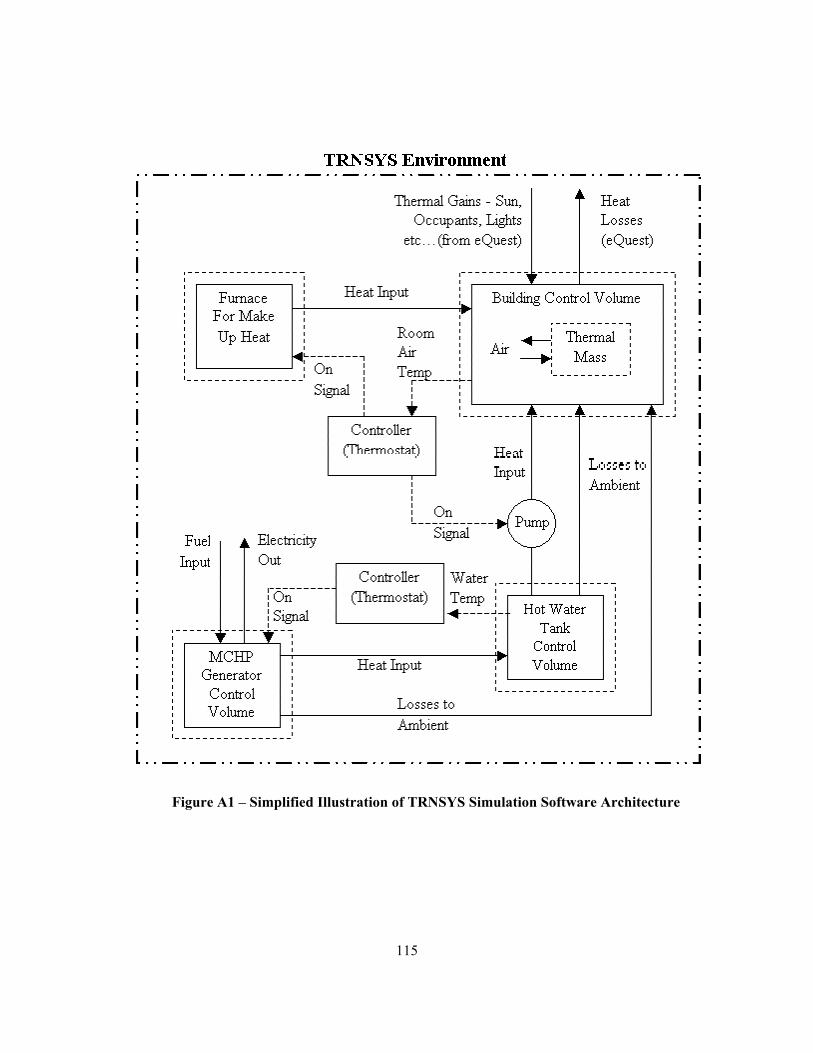
115
Figure A1 – Simplified Illustration of TRNSYS Simulation Software Architecture

116
Similarly, a second controller monitored the temperature of the hot water tank. If the temperature dropped below a set point, the MCHP unit would activate. The MCHP model specified the time varying fuel input, electricity output, ambient losses, and heat output to the tank. Note that the thermal losses to the ambient from the MCHP generator and the hot water tank were inputted into the building control volume.
The actual simulations contained many more detailed components. In order to ensure that the simulation is correctly configured, an energy balance on the entire system needed to be checked. The energy flows from each component were recorded and then a calculation was completed to ensure that conservation of energy was fulfilled.

117
Bibliography
[1] US Energy Information Agency, “Annual Energy Review 2004” Report Number DOE/EIA-0384(2004) August 2005
[2] Ebara-Ballard News Release: news20040423.html Available at www.ebara.co.jp Accessed March
30, 2004
[3] Transportation Technology R&D Center, Argonne National Laboratories www.transportation.anl.gov Accessed July 20, 2006
[4] Halliday J., Ruddell A., Powell J., Peters M.,, “Fuel Cells: Providing Heat and Power in the Urban Environment”, Tyndall Centre for Climate Change Research, Technical Report 32, PP. 30-31 August 2005
[5] University of Wisconsin Madison, http://sel.me.wisc.edu/trnsys/, last accessed July 90, 2006 [6] The University of Strathclyde, www.esru.strath.ac.uk, last accessed on July 20, 2006 [7] Natural Resources Canada, www.retscreen.net, last accessed May 20, 2006
[8] Oak Ridge National Laboratories, www.ornl.gov, last accessed on July 20, 2006 [9] The Chartered Institution of Building Services Engineers, www.cibse.org, last accessed July 20,
2006 [10] Natural Resources Canada, Sustainable Buildings and Communities, www.sbc.nrcan.gc.ca ,last
accessed July 20, 2006 [11] GE Energy, www.gepower.com last accessed July 20, 2006 [12] Dash G.H., “Investigation of a Combined Heat and Power Fuel Cell System for Small Scale
Residential Applications” MASc Thesis, Mechanical Engineering, North Carolina State University, 2003
[13] Dorer V., Weber R., Weber A., “Performance Assessment of Fuel Cell Micro-Cogeneration
Systems for Residential Buildings” Energy and Buildings 37, 1132–1146, 2005
[14] Beausoleil-Morrison I., Cuthbert D., Deuchars G., and McAlary G., "The Simulation of Fuel Cell Cogeneration Systems within Residential Buildings", Proceedings of eSim, bi-annual conference, The Canadian Conference on Building Energy Simulation, (IBPSA-Canada) Montréal Canada. 2002
118
[15] Kelly N.J. and Beausoleil-Morrison I., "Modelling and Simulation of Small Embedded Generation Systems", Proceedings of. eSim, bi-annual conference, The Canadian Conference on Building Energy Simulation, Montréal Canada. (IBPSA-Canada) 2002
[16] Ferguson A., Beausoleil-Morrison I., Ugursal V.I., “A Comparative Assessment of Fuel Cell Cogeneration Heat Recovery Models” IEA/ECBCA Annex 42 Technical Paper, 2003
[17] Ferguson A., Ugursal V.I., “Fuel Cell Modelling for Building Cogeneration Applications” Journal of Power Sources 137 (1), 30–42, 2004
[18] Beausoleil-Morrison, Ian, Team Manager, Building Simulation, Canmet Energy Technology Centre, Natural Resources Canada - Telephone conversation October 21, 2005
[19] Vetter M., Wittwer C., “Dynamic Modelling and Investigation of Residential Fuel Cell
Cogeneration Systems” Fraunhofer Institute of Solar Energy Systems ISE, IEA/ECBCA Annex 42 Technical Paper, 2003
[20] Ferguson A, “Modelling Building-Integrated Stirling CHP Systems” To be published in
ASHRAE Transactions 2006
[21] Knight I., Urgursal I, Beausoleil-Morrison I., “Residential Cogeneration Systems: A Review of the Current Technologies” IEA/ECBCA Annex 42 Publication ISBN No.: 0-662040482-3, 2005
[22] Jalalzadeh A., Swinton M., “Testing a Residential Fuel Cell for Combined Heat and Power” To
Be published ACEEE, 2006
[23] van den Oosterkamp P.F., van der Laag P.C., “Operational Experience with Micro-CHP Residential Fuel Cell Systems” Energy Research Centre of the Netherlands (ECN), Document Number ECN-RX--03-006, 2003
[24] Boettner D.D., Massie C.A., Massie D.D., “Lessons Learned from Residential Experience with Proton Exchange Membrane Fuel Cell Systems for Combined Heat and Power “ Proceedings of ASME conference - Fuel Cell Science Engineering and Technology, June 14-16, Rochester, New York, 2004-2480, 2004
[25] Do Val L.G., Orlando A.F., Siqueira C. E. R., Oexmann J., “Analysis of the Co-Generation Potential of a 5 kW PEMFC From Experimentally Determined Performance Data” Proceedings of ASME conference - Fuel Cell Science Engineering and Technology, June 14-16, Rochester, New York, 2004-2479, 2004
[26] Hideki Inakaa, Shindo Sumia, Kunihiro Nishizakib, Takeshi Tabatac, Akihiro Kataokad, Hidetoshi Shinkaie, “The Development of Effective Heat and Power use Technology for Residential in a PEFC Co-generation System” Journal of Power Sources 106 60–67 (2002)

119
[27] The Japan Gas Association "Establishing Platforms for the Widespread Use of Stationary Polymer Electrolyte Fuel Cells" (in Japanese) New Energy and Technology Development Organization (NEDO), FY2003 Report, March. 2004 Available at http://www.nedo.go.jp (accessed March 30, 2006)
[28] Bell M., Swinton M., Entchev E., Gusdorf J., Kalbfleisch W., Marchand R., Szadkowski F.
“Development of Micro Combined Heat and Power Technology Assessment Capability At the Canadian Centre for Housing Technology” Canadian Centre for Housing Technology Report Number B-6010, 2003
[29] Low Carbon Solutions Inc. “DCHP Report” Document Number NIE/DCHP/004 Available at
http://www.niesmart.co.uk/casestudies/DCHPSmartReport.pdf Last Accessed April 3, 2006
[30] Voorspools K., D’haeseleer W.,. “The Evaluation of Small Cogeneration for Residential Heating” International Journal of Energy Research 26, 1175-1190, 2002
[31] United States Department of Energy www.doe2.com, last accessed July 20, 2006 [32] Ministry of Natural Resources Canada “Survey of Houses Built in Canada in 1994 – Statistical
Report” ISBN 0-662-62970-1, Cat. No. M92-136/1994
[33] Ministry of Natural Resources Canada “1993 Survey of Household Energy Use, National Results – Statistical Report” ISBN 0-662-22793-X, Cat. No. M92-85/1994E
[34] Christian J.E., Kosny J., “Thermal Performance and Wall Rating” Oak Ridge National Laboratory, November 10, 2003 Available at www.ornl.org accessed April 2, 2006
[35] ASHRAE, “2004 Fundamentals” American Society of Heating, Refrigerating and Air-Conditioning Engineers Inc., Atlanta, USA, Section 26.14 Figure 9, 2004
[36] Natural Resources Canada “R-2000 Standard” Available at www.r2000.chba.ca accessed April 2, 2006
[37] Kelly N., “Specifications for Models of Cogeneration Equipment: Discussion Document” IEA/ECBCS Annex 42 Subtask B Working Document, University of Strathclyde, 2004
[38] Reynolds W.C., Perkins H.C., “Engineering Thermodynamics” McGraw-Hill Inc. 1977
[39] Dentice d’accadia M., Sasso M., Sibilio S., Vanoli L. “Micro-Combined Heat and Power in Residential and Light Commercial Applications” Applied Thermal Engineering 23, 1247-1259, 2003
[40] Climate Energy LLC www.climate-energy.com accessed on April 5, 2006
120
[41] Major G., “Small Scale Cogeneration”. CADDET, Analysis Series 1, Nov 1995.
[42] Gas Appliance Manufactures Association, “November 2005 Consumers’ Directory of Certified Efficiency Ratings for Heating and Water Heating Equipment” Available at www.gama.com Last Accessed December, 2005
[43] ASHRAE, “2003 HVAC Applications” American Society of Heating, Refrigerating and Air-Conditioning Engineers Inc., Atlanta, USA, 2003
[44] Straube J., Burnett E., “Building Science for Building Enclosures” Building Science Press Inc., Westford , Massachusetts, 2006
[45] Incropera F., DeWitt D., “Fundamentals of Heat and Mass Transfer” Fourth Edition, John Wiley and Sons, Inc. 1996
[46] McQuiston F.C., Parker J.D., Spitler J.D., “Heating, Ventilating, and Air Conditioning Analysis
and Design” Fifth Edition, John Wiley & Sons, Inc. New York, 2000
[47] Radiantec, www.radiantec.com, last accessed April 15, 2006
[48] Caradon Stelrad Inc, www.stelrad.com, last accessed April 20,2006
[49] Viessmann Manufacturing Company Inc., www.viessmann.ca , last accessed April 20, 2006
[50] Canadian National Plumbing Code - Standing Committee on Building and Pluming Services “Report of the SCBPS Hot Water Delivery in Buildings” Final Report August 26, 2006 Available at www.nationalcodes.ca
[51] IPEX Inc., www.ipex.com, last accessed May 1, 2006
[52] Natural Resources Canada, “Energy Use Data Handbook”, ISBN 0-662-39609-X, 2005
[53] Kinectrics Inc. “Distribution System Energy Losses at Hydro One” Report # K-011568-001-RA-0001-R00 July 20, 2005
Related Documents