Integrated Monitoring of Infrastructures and Applications in Cloud Environments Roberto Palmieri * , Pierangelo di Sanzo * , Francesco Quaglia * , Paolo Romano † , Sebastiano Peluso † , and Diego Didona † Dipartimento di Informatica e Sistemistica, Sapienza Rome University, Italy( * );Distributed Systems Group, INESC-ID, Lisbon, Portugal( † ) Abstract. One approach to fully exploit the potential of Cloud tech- nologies consists in leveraging on the Autonomic Computing paradigm. It could be exploited in order to put in place reconfiguration strategies span- ning the whole protocol stack, starting from the infrastructure and then going up to platform/application level protocols. On the other hand, the very base for the design and development of Cloud oriented Autonomic Managers is represented by monitoring sub-systems, able to provide au- dit data related to any layer within the stack. In this article we present the approach that has been taken while designing and implementing the monitoring sub-system for the Cloud-TM FP7 project, which is aimed at realizing a self-adapting, Cloud based middleware platform providing transactional data access to generic customer applications. 1 Introduction As well known, Cloud based technologies are making a revolutionary change in the way systems and applications are built, configured and run. In particular, the ability to acquire computational power and storage on- the-fly has opened the possibility to massively put in place Autonomic Management schemes aimed at optimizing performance/availability in- dexes vs specific cost metrics. A relevant reflection of such a revolutionary change is in that several projects targeting Cloud oriented software platforms and applications aim at designing/integrating multi-modal operating modes. In particular, the target is to make differentiated protocols coexist within both the platform and the application layer in order to dynamically select the best suited protocol (and well suited parameter settings for it) depending on specific environmental conditions, such as the current workload profile. Conse- quently, the need arises for defining/implementing frameworks and sys- tems supporting audit and monitoring functionalities spanning the whole set of differentiated layers within the Cloud based system.

Welcome message from author
This document is posted to help you gain knowledge. Please leave a comment to let me know what you think about it! Share it to your friends and learn new things together.
Transcript
Integrated Monitoring of Infrastructures andApplications in Cloud Environments
Roberto Palmieri∗, Pierangelo di Sanzo∗, Francesco Quaglia∗,Paolo Romano†, Sebastiano Peluso†, and Diego Didona†
Dipartimento di Informatica e Sistemistica, Sapienza Rome University,Italy(∗);Distributed Systems Group, INESC-ID, Lisbon, Portugal(†)
Abstract. One approach to fully exploit the potential of Cloud tech-nologies consists in leveraging on the Autonomic Computing paradigm. Itcould be exploited in order to put in place reconfiguration strategies span-ning the whole protocol stack, starting from the infrastructure and thengoing up to platform/application level protocols. On the other hand, thevery base for the design and development of Cloud oriented AutonomicManagers is represented by monitoring sub-systems, able to provide au-dit data related to any layer within the stack. In this article we presentthe approach that has been taken while designing and implementing themonitoring sub-system for the Cloud-TM FP7 project, which is aimedat realizing a self-adapting, Cloud based middleware platform providingtransactional data access to generic customer applications.
1 Introduction
As well known, Cloud based technologies are making a revolutionarychange in the way systems and applications are built, configured and run.In particular, the ability to acquire computational power and storage on-the-fly has opened the possibility to massively put in place AutonomicManagement schemes aimed at optimizing performance/availability in-dexes vs specific cost metrics.
A relevant reflection of such a revolutionary change is in that severalprojects targeting Cloud oriented software platforms and applications aimat designing/integrating multi-modal operating modes. In particular, thetarget is to make differentiated protocols coexist within both the platformand the application layer in order to dynamically select the best suitedprotocol (and well suited parameter settings for it) depending on specificenvironmental conditions, such as the current workload profile. Conse-quently, the need arises for defining/implementing frameworks and sys-tems supporting audit and monitoring functionalities spanning the wholeset of differentiated layers within the Cloud based system.

At current date, several proposals exist in the context of monitor-ing the usage of infrastructure level resources (e.g. CPU and RAM) [1].These are mostly suited for Infrastructure-as-a-Service (IaaS) customers,to whom the possibility to trigger infrastructure level reconfigurations ei-ther automatically or on demand, based on the monitoring outcomes, isprovided. On the other hand, Cloud providers offer the possibility to mon-itor the level of performance provided by specific, supported platforms [4],such as Web based platforms, in order to enable, e.g., auto-scale facilitiesaimed at dynamically resizing the offered computational platform. This issuited for Platform-as-a-Service (PaaS) customers, who aim at deliveringspecific performance levels, while relying on facilities already offered bytheir reference Cloud providers.
In this paper we describe the approach we have taken in the de-sign/development of a Workload and Performance Monitor (WPM) thatprovides audit data for both infrastructure resources and platform (orapplication) level components in an integrated manner. The main dis-tinguishing feature of our solution is that it does not target any specificplatform or application. Instead, it is flexible and adaptable so to al-low integration with differentiated platform/application types. On thetechnological side, our design comes from the integration of the Latticeframework (natively oriented to infrastructure monitoring), which hasbeen largely exploited in the context of the RESERVOIR project [2], andthe JMX JAVA oriented framework (suited for the audit of JAVA basedcomponents). The whole design/implementation has been tailored for in-tegration within the platform targeted by the Cloud-TM FP7 project[3]. This project aims at designing/developing a self-adaptive middlewarelevel platform, based on the Infinispan in-memory data management layer[6], providing transactional data access services (according to agreed uponQoS vs cost constraints) to the overlying customer applications.
2 Technological Background
2.1 The Lattice framework
Lattice relies on a reduced number of interacting components, each onedevoted (and encapsulating) a specific task in relation to distributed data-gathering activities. In terms of interaction abstraction, the Lattice frame-work is based on the producer-consumer scheme, where both the producerand consumer components are, in their turn, formed by sub-components,whose instantiation ultimately determines the functionalities of the im-plemented monitoring system. A producer contains data sources which,
in turn, contain one or more probes. Probes read data values to be moni-tored, encapsulate measures within measurement messages and put theminto message queues. Data values can be read by probes periodically,or as a consequence of some event. A message queue is shared by thedata source and the contained probes. When a measurement message isavailable within some queue, the data source sends it to the consumer,which makes it available to reporter components. Overall, the producercomponent injects data that are delivered to the consumer. Also, pro-ducer and consumer have the capability to interact in order to internally(re)configure their operating mode.
Three logical channels are defined for the interaction between the twocomponents, named
– data plane;– info plane;– control plane.
The data plane is used to transfer data-messages, whose payload is aset of measures, each kept within a proper message-field. The structureof the message (in terms of amount of fields, and meaning of each field) ispredetermined. Hence, message-fields do not need to be explicitly taggedso that only data-values are really transmitted, together with a conciseheader tagging the message with very basic information, mostly related tosource identification and timestamping. Such a structure can be anywaydynamically reconfigured via interactions supported by the info plane.This is a very relevant feature of Lattice since it allows minimal messagefootprint for (frequently) exchanged data-messages, while still enablingmaximal flexibility, in terms of on-the-fly (infrequent) reconfiguration ofthe monitoring-information structure exchanged across the distributedcomponents within the monitoring architecture.
Finally, the control plane can be used for triggering reconfiguration ofthe producer component, e.g., by inducing a change of the rate at whichmeasurements need to be taken. Notably, the actual transport mechanismsupporting the planes is decoupled from the internal architecture of pro-ducer/consumer components. Specifically, data are disseminated acrossthese components through configurable distribution mechanisms rangingfrom IP multicast to publish/subscribe systems, which can be selected onthe basis of the actual deployment and which can even be changed overtime without affecting other components, in term of their internal con-figuration. The framework is designed to support multiple producers andmultiple consumers, providing the chance to dynamically manage data

source configuration, probe-activation/deactivation, data sending rate,redundancy and so on.
2.2 Portability issues
The Lattice framework is based on JAVA technology, so that producer/consumer components encapsulate sub-components that are mapped ontoa set of JAVA threads, each one taking care of specific activities. Someof these threads, such as the data-source or the data-consumer, consti-tute the general purpose backbone of the skeleton provided by Lattice.Other threads, most notably the probe-thread and the reporter-thread,implement the actual logic for taking/reporting measurement samples.The implementation of these threads can be seen as the ad-hoc portionof the whole monitoring infrastructure, which performs activities tailoredto specific measurements to be taken, in relation to the context where themonitoring system operates.
By the reliance on JAVA, portability issues are mostly limited tothe implementation of the ad-hoc components. As an example, a probe-thread based on direct access to the “proc” file system for gatheringCPU/memory usage information is portable only across (virtualized) op-erating systems supporting that type of file system (e.g. LINUX). How-ever, widening portability across general platforms would only entail re-programming the internal logic of this probe, which in some cases caneven be done by exploiting, e.g., pre-existing JAVA packages providingplatform-transparent access to physical resource usage.
The aforementioned portability considerations also apply to reporter-threads, which can implement differentiated, portable logics for exposingdata to back-end applications (e.g. by implementing logics that store thedata within a conventional database).
3 Architectural Organization
Figure 1 shows the general architectural organization we have devisedfor WPM. It has been defined according to the need for supporting thefollowing two main functionalities:
– statistical data gathering (SDG);– statistical data logging (SDL).
The SDG functionality maps onto an instantiation of the Latticeframework. In our instantiation, the elements belonging to the monitored
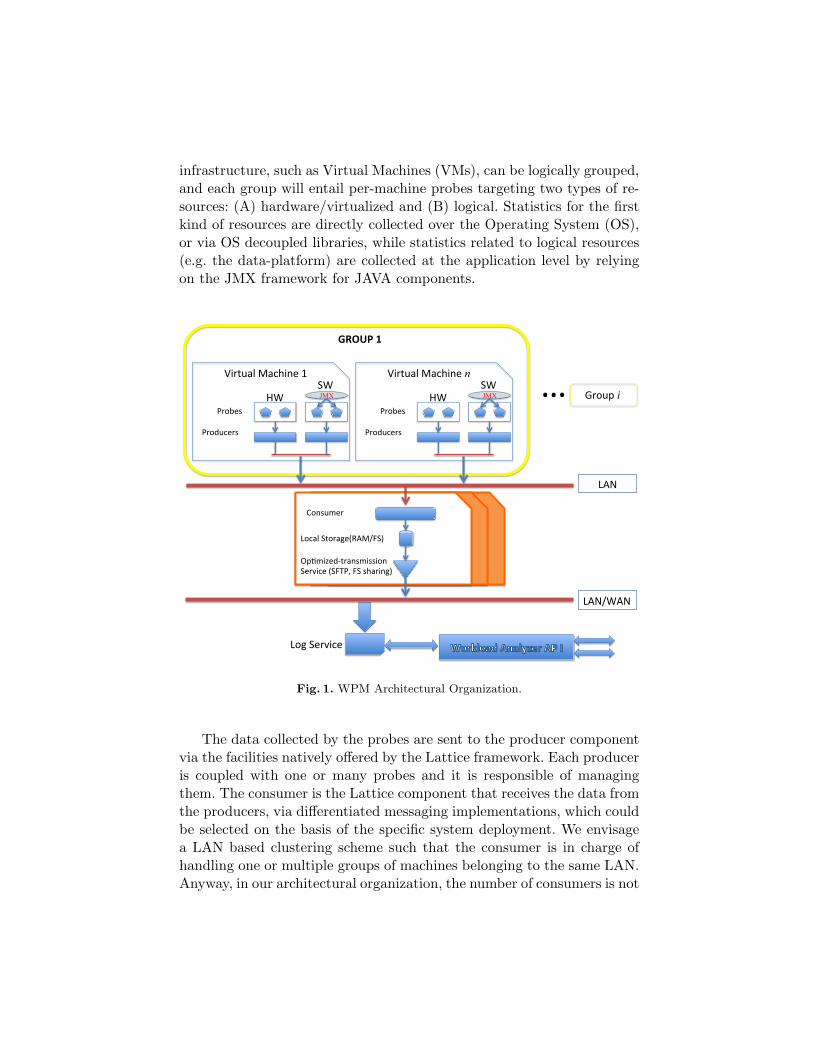
infrastructure, such as Virtual Machines (VMs), can be logically grouped,and each group will entail per-machine probes targeting two types of re-sources: (A) hardware/virtualized and (B) logical. Statistics for the firstkind of resources are directly collected over the Operating System (OS),or via OS decoupled libraries, while statistics related to logical resources(e.g. the data-platform) are collected at the application level by relyingon the JMX framework for JAVA components.
Log Service
LAN/WAN
LAN
GROUP 1
… Group i
Consumer
Local Storage(RAM/FS)
Op@mized-‐transmission Service (SFTP, FS sharing)
Virtual Machine 1
Probes HW
SW
Producers
JMX
Virtual Machine n
Probes HW
SW
Producers
JMX
Fig. 1. WPM Architectural Organization.
The data collected by the probes are sent to the producer componentvia the facilities natively offered by the Lattice framework. Each produceris coupled with one or many probes and it is responsible of managingthem. The consumer is the Lattice component that receives the data fromthe producers, via differentiated messaging implementations, which couldbe selected on the basis of the specific system deployment. We envisagea LAN based clustering scheme such that the consumer is in charge ofhandling one or multiple groups of machines belonging to the same LAN.Anyway, in our architectural organization, the number of consumers is not

meant to be fixed, instead it can be scaled up/down depending on theamount of instantiated probes/producers. Overall, the consumer can beinstantiated as a centralized or a distributed process. Beyond collectingdata from the producers, the consumer is also in charge of performing alocal elaboration aimed at producing a suited stream representation tobe provided as the input to the Log Service, which is in turn in charge ofsupporting the SDL functionality.
We decided to exploit the file system locally available at the consumerside to temporarily keep the stream instances to be sent towards theLog Service. The functional block which is responsible for the interactionbetween SDG and SDL is the so called optimized-transmission service.This can rely on top of differentiated solutions depending on whether theinstance of SDL is co-located with the consumer or resides on a remotenetwork. Generally speaking, with our organization we can exploit, e.g.,SFTP or a locally shared File System. Also, stream compression schemescan be actuated to optimize both latency and storage occupancy.
The Log Service is the logical component responsible for storing andmanaging all the gathered data. It must support queries from any exter-nal application so to expose the statistical data for subsequent process-ing/analysis. The Log Service could be implemented in several manners,in terms of both the underlying data storage technology and the selecteddeployment (centralized vs distributed). As for the first aspect, differ-ent solutions could be envisaged in order to optimize access operationsdepending on, e.g. suited tradeoffs between performance and access flex-ibility. This is also related with the data model ultimately supported bythe Log Service, which might be a traditional relational model or, alter-natively, a <key,value> model. Further, the Log Service could maintainthe data onto a stable storage support or within volatile memory, for per-formance vs reliability tradeoffs. The above aspects could depend on thethe functionality/architecture of the application that is responsible foranalyzing statistical data, which could be designed to be implemented asa geographically distributed process in order to better fit the WPM de-ployment (hence taking advantage from data partitioning and distributedprocessing).
3.1 Implementation of infrastructure oriented probes
In this section we provide some technical specification for the probesdeveloped in WPM. The design and the implementation of the infras-tructure oriented probes has been tailored to the acquisition of statisticaldata in relation to (virtualized) hardware resources with no binding on
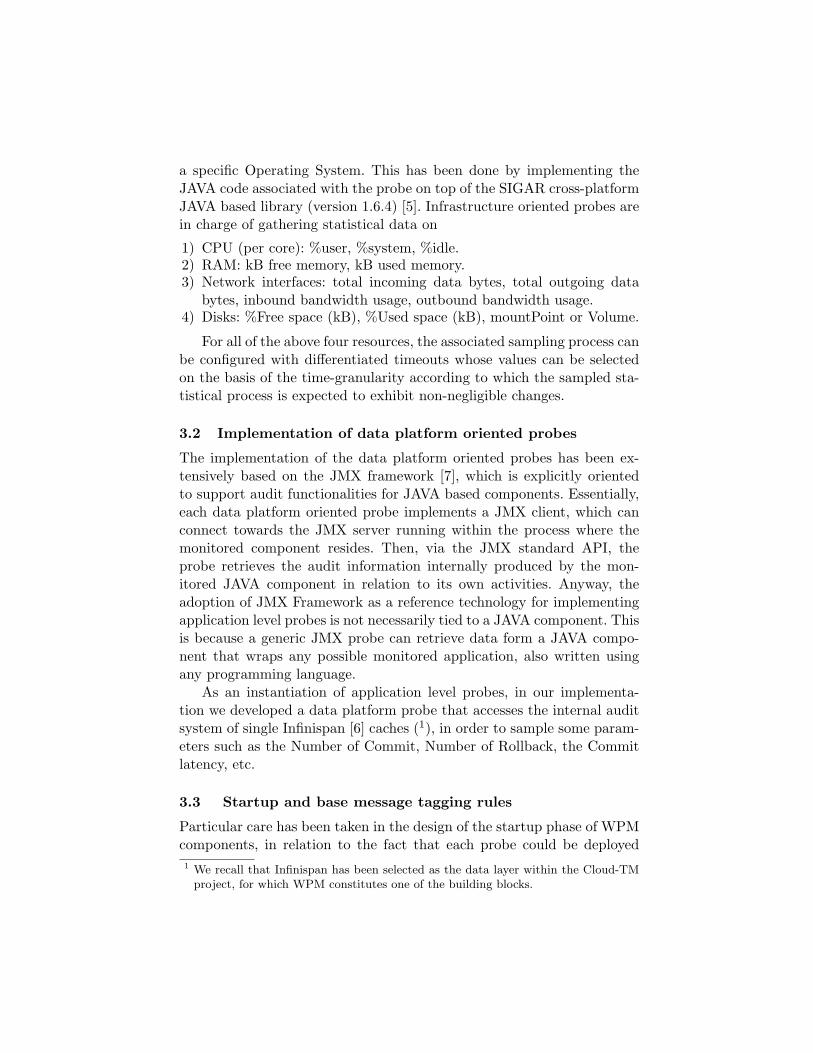
a specific Operating System. This has been done by implementing theJAVA code associated with the probe on top of the SIGAR cross-platformJAVA based library (version 1.6.4) [5]. Infrastructure oriented probes arein charge of gathering statistical data on
1) CPU (per core): %user, %system, %idle.2) RAM: kB free memory, kB used memory.3) Network interfaces: total incoming data bytes, total outgoing data
bytes, inbound bandwidth usage, outbound bandwidth usage.4) Disks: %Free space (kB), %Used space (kB), mountPoint or Volume.
For all of the above four resources, the associated sampling process canbe configured with differentiated timeouts whose values can be selectedon the basis of the time-granularity according to which the sampled sta-tistical process is expected to exhibit non-negligible changes.
3.2 Implementation of data platform oriented probes
The implementation of the data platform oriented probes has been ex-tensively based on the JMX framework [7], which is explicitly orientedto support audit functionalities for JAVA based components. Essentially,each data platform oriented probe implements a JMX client, which canconnect towards the JMX server running within the process where themonitored component resides. Then, via the JMX standard API, theprobe retrieves the audit information internally produced by the mon-itored JAVA component in relation to its own activities. Anyway, theadoption of JMX Framework as a reference technology for implementingapplication level probes is not necessarily tied to a JAVA component. Thisis because a generic JMX probe can retrieve data form a JAVA compo-nent that wraps any possible monitored application, also written usingany programming language.
As an instantiation of application level probes, in our implementa-tion we developed a data platform probe that accesses the internal auditsystem of single Infinispan [6] caches (1), in order to sample some param-eters such as the Number of Commit, Number of Rollback, the Commitlatency, etc.
3.3 Startup and base message tagging rules
Particular care has been taken in the design of the startup phase of WPMcomponents, in relation to the fact that each probe could be deployed1 We recall that Infinispan has been selected as the data layer within the Cloud-TM
project, for which WPM constitutes one of the building blocks.

within a highly dynamic environment, where the set of monitored com-ponents (either belonging to the infrastructure or to the data platform)and the related instances can vary over time.
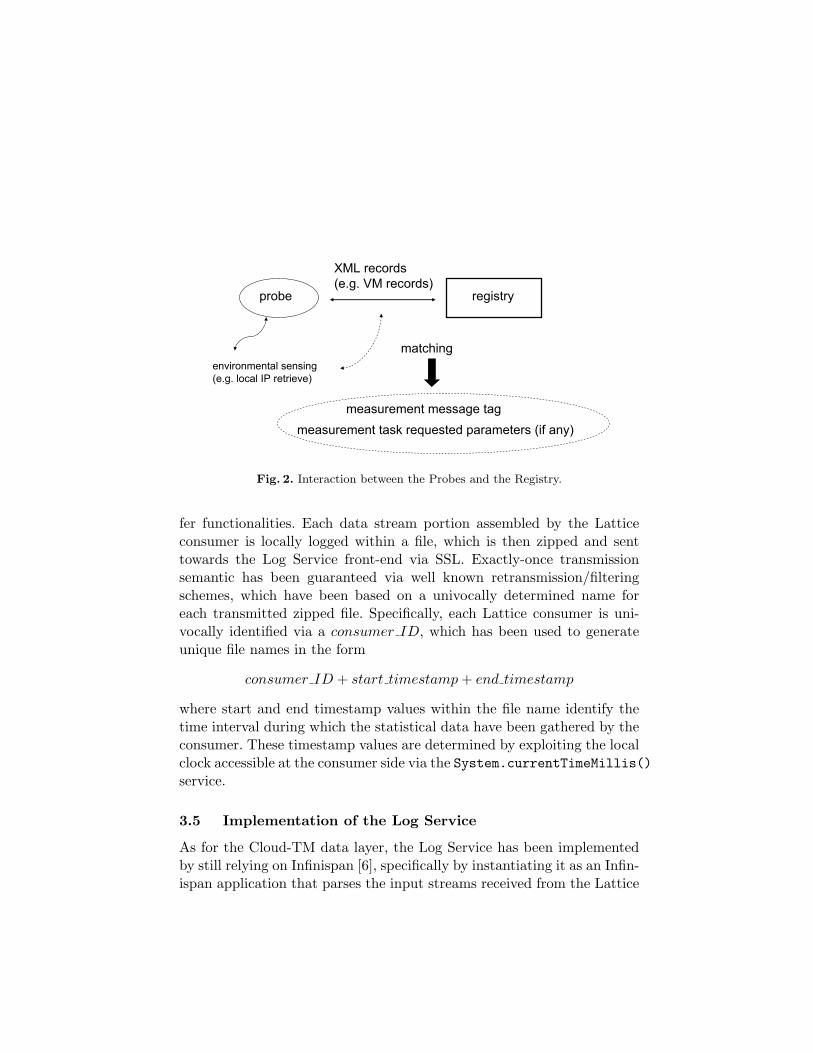
As pointed out, WPM will be a part of the Autonomic Manager ofthe Cloud-TM platform, which will rely on a Repository of Tunable Com-ponents where an XML description for each component currently takingpart to the Cloud-TM platform is recorded at component startup time. Inthe design of the WPM we rely on this repository, by exploiting it as a reg-istry, where each probe can automatically retrieve information allowing itto univocally tag each measurement message sent to the Lattice consumerwith the identity of the corresponding monitored component instance, ascurrently maintained by the registry. This will allow supporting a perfectmatching between the measurement message and the associated instanceof component, as seen by the overall infrastructure at any time instant.Such a process has been supported by embedding within Lattice probesa sensing functionality, allowing the retrieval of basic information relatedto the environment where the probe is activated (e.g. the IP number ofthe VM hosting that instance of the probe), which has been coupled witha matching functionality vs the registry in order to both
(a) retrieve the ID of the currently monitored component instance;(b) retrieve information needed to correctly carry out the monitoring task,
in relation to the target component instance.
Such a behavior is shown in Figure 2, where the interaction with theregistry is actuated as a query over specific component types, depend-ing on the type of probe issuing the query (an infrastructure orientedprobe will query the registry for extracting records associated with VMinstances, while a data platform oriented probe will query the registry forextracting records related to the specific component it is in charge of).
As for point (b), data platform probes rely on the use of JMX serversexposed by monitored components. Hence, the information requested tocorrectly support the statistical data gathering process entails the ad-dress (e.g. the port number) associated with the JMX server instanceto be contacted. The information associated with point (b) is a “don’tcare” for infrastructure oriented probes since they do not operate via anyintermediary (e.g. JMX server) entity.
3.4 Implementation of the Optimized-transmission Service
In the current implementation, the optimized-transmission service hasbeen implemented by relying on the use of zip and SSL-based file trans-
probe
environmental sensing
(e.g. local IP retrieve)
registry
XML records
(e.g. VM records)
matching
measurement message tag
measurement task requested parameters (if any)
Fig. 2. Interaction between the Probes and the Registry.
fer functionalities. Each data stream portion assembled by the Latticeconsumer is locally logged within a file, which is then zipped and senttowards the Log Service front-end via SSL. Exactly-once transmissionsemantic has been guaranteed via well known retransmission/filteringschemes, which have been based on a univocally determined name foreach transmitted zipped file. Specifically, each Lattice consumer is uni-vocally identified via a consumer ID, which has been used to generateunique file names in the form
consumer ID + start timestamp + end timestamp
where start and end timestamp values within the file name identify thetime interval during which the statistical data have been gathered by theconsumer. These timestamp values are determined by exploiting the localclock accessible at the consumer side via the System.currentTimeMillis()service.
3.5 Implementation of the Log Service
As for the Cloud-TM data layer, the Log Service has been implementedby still relying on Infinispan [6], specifically by instantiating it as an Infin-ispan application that parses the input streams received from the Lattice

consumer, and performs put operations on top of an Infinispan cache in-stance. The keys used for put operations correspond to message tags, asdefined by the Lattice producer and its hosted probes. In particular, asexplained above, each probe tags measurement messages with the uniqueID associated with the monitored component. This ID has been usedin our implementation to determine a unique key, to be used for a putoperation, formed by:
component ID + type of measure + measure timestamp
where the type of measure identifies the specific measure carried out forthat component (e.g. CPU vs RAM usage in case of a VM component),and the value expressed by measure timestamp is again generated viathe local clock accessible by the probe instance producing the message.Currently, the Log Service exposes to the external applications the Infin-ispan native <key,value> API, which does not prevent the possibility ofsupporting a different API in future releases.
4 Summary
In this article we have presented the architecture and the implementa-tion of a Workload and Performance Monitor to be integrated within thearchitectural design of the Cloud-TM FP7 project platform. Our moni-toring system provides integrated supports for gathering samples relatedto both hardware/virtualized resources and logical resources. It relies onthe integration between the Lattice framework and JMX.
References
1. Stuart Clayman, Alex Galis, Clovis Chapman, Giovanni Toffetti and Luis Rodero-Merino and Luis M. Vaquero and Kenneth Nagin and Benny Rochwerger, Moni-toring Service Clouds in the Future Internet. IOS Press, 2010.
2. http://www.reservoir-fp7.eu/index.php?page=open-source-code3. http://www.cloudtm.eu/4. http://aws.amazon.com/ec2/5. http://www.hyperic.com/products/sigar6. http://www.jboss.org/infinispan7. Java Management Extensions (JMX) Technology,
http://www.oracle.com/technetwork/java/javase/tech/javamanagement-140525.html
Related Documents