Enabling Fairness in Cloud Computing Infrastructures by Ram Srivatsa Kannan A dissertation submitted in partial fulfillment of the requirements for the degree of Doctor of Philosophy (Computer Science and Engineering) in The University of Michigan 2019 Doctoral Committee: Assistant Professor Jason Mars, Co-Chair Assistant Professor Lingjia Tang, Co-Chair Associate Professor Karthik Duraiswamy Professor Trevor N. Mudge

Welcome message from author
This document is posted to help you gain knowledge. Please leave a comment to let me know what you think about it! Share it to your friends and learn new things together.
Transcript

Enabling Fairness in Cloud ComputingInfrastructures
by
Ram Srivatsa Kannan
A dissertation submitted in partial fulfillmentof the requirements for the degree of
Doctor of Philosophy(Computer Science and Engineering)
in The University of Michigan2019
Doctoral Committee:
Assistant Professor Jason Mars, Co-ChairAssistant Professor Lingjia Tang, Co-ChairAssociate Professor Karthik DuraiswamyProfessor Trevor N. Mudge


To my family, Dasrath Srivatsa, Narasimhan Kannan, Mithra Kannan and
Vineetha Govindaraj
ii
ACKNOWLEDGEMENTS
To my life-coach and my undergraduate advisor Venkateswaran Nagarajan: be-
cause I owe it all to you. Many Thanks!
First and foremost I would like to express my sincere gratitude to my advisors,
Jason and Lingjia. Jason, for being patient with me and trusting me. Your passion
has profoundly impacted me to pursue the things I want. Lingjia, for teaching me how
to articulate my thoughts with scientific rigor. Lavanya Subramanian, my mentor who
traveled with me along my Ph.D. You were always there to support me throughout
my Ph.D. I really owe you a lot. I thank my dissertation committee Lingjia, Jason,
Trevor, Karthik - for their guidance in constructing this dissertation.
I want to thank Jeongseob. He was the first person I would approach if I had an
idea. He was really critical and pushed me really hard. I would also like to thank
Animesh for teaching me how to write papers. His feedback really helped me shape
my papers. Mike, I am really going to miss your feedback. He helped me out right
from my first project all the way up to my defense talk. Clarity Lab has been a great
source of encouragement and feedback for shaping my research. Yunqi, Vini, Parker,
Johann, Yiping, Chang-Hong, Shih-Chieh, Austin, Matt, Steve, Md, Hailong, and
Quan were great colleagues. It was through the collaboration and discussion with
you all that I grow and improve tremendously and become a better scientist. Thanks
for being there during my successes and failures.
I would like to thank Davide Bergamasco from the performance engineering team
of VMware for being a great mentor during my internships. His experience in data-
iii

center research helped me identify problems for my Ph.D. I also thank Eric Schkufza
from VMware research for being a great mentor. He made me look at his research
with awe and taught me what it takes to be a great researcher.
Grad school is indeed a tiring journey. In this process, I am very thankful for
having blessed with a great roommate – Bikash. He was there throughout my entire
journey. My great moments with him will never be forgotten. I thank Srayan Datta
for being a great friend. Dada started his Ph.D. with me and had also graduated
with me. I had a great time at EECS 470 which continued forward with Thomas,
Salsa, Karthik, and Walter. I also thank Ann Arbor’s tamil gumbal Balaji, Prasanna
Kumar, John Titus, Prashipa Selvaraj, Rahul, Karthik, Naveen, Maddy, UV, Ezhil,
Keshav, Sandeep, Devi, Rashmi, Veena, Sandipp, Kavin, Anand, Suresh, and Subbu
for helping me feel home by recreating Tamil Nadu. I also thank my other Ann
Arbor friends Akshitha, Subarno, Arun, Amen, Desing, Ankush, Jana, Mani, Ananda,
Javad, Naveen, Vaishnav, Nilmini, Pallavi and Digna. I had a great time during your
stay at Ann Arbor.
I am very thankful to all my teachers from school and professors from undergrad
for strengthening my fundamentals to deal grad school with courage. Special thanks
to Uma mam and Shivakumar Sir from my school days Pughazendhi Sir and Radha
Senthilkumar mam from MIT, Anna University.
Carnatic music was a great stress buster during my grad school days. I thanks
my beloved guru Vidwan Vijayan Bhaskar for teaching me to play mridangam during
my childhood days. He was one of the most passionate teachers, and I am fortunate
to be acquainted with me. I owe him and Guru Kaaraikudi Mani a lot. I also thank
Michigan Sahana for helping me rediscover Carnatic music during my grad school
days. Special thanks to Krithika, Shalini, Srihari (thin one), Srihari (gym body) and
Sandeep.
My first step towards my research career was initiated by Prof Venateswaran Na-
iv

garajan (Waran). I feel I am the luckiest person in the world to have been acquainted
with him. Waran is the greatest guru I can ever get and I owe my entire professional
success to him. I am proud to be holding the legacy of being his student. I thank
my WARFT colleagues Thina, Vinesh, Ramprakash, SR, Rajagopal, and Vignesh. I
am also grateful to A Vignesh and Aswin for being great mentors at WARFT. I’m
also happy to have been close with my batchmates Prashanth and Abullu from MIT,
Anna University. They were great friends and mentors with whom most I have had
my most elongated conversations.
I’d also like to thank my two greatest friends Mahesh and Vignesh. I feel it’s
incredible to have such great friends where there is absolutely no career overlap.
Whenever I travel back to India, I am as excited to see Mahesh and Vignesh as my
family. Living away with family for graduate education is really stressful. Having
such friends back home makes one feel better. My career and personal life trajectory
have been shaped with great detail because of Vignesh and Mahesh. I owe them a
lot.
My family has been my biggest source of support. Thanks to my mother, Mithra
and my father Kannan for supporting my educational career both financially and
morally. My father’s work ethic, sincerity, and commitment has been a great influence
in my life. He was there to make sure I did not fall. My mother’s love, affection, and
commitment to my family took our family to the next level. My family is happy and
prosperous because of her sincere efforts in raising her kids. I had a really happy and
fun childhood which I owe entirely to my brother. He was really really awesome. I’d
also thank my grandma, uncle, Abhishek and aunt, Anu for their fun times. Also my
paternal aunt, Kowsalya and her daughter Jaya for their great support.
Finally, I’d like to thank my great wife, Vineetha. She had always believed in
me. My life started taking a positive trajectory after her arrival. I envision her
as my luckiest charm. My last days of my Ph.D. was the most stressful. She was
v

instrumental in making me hang in there. I am lucky to have been married to an
extremely smart significant other. I am also grateful to Vineetha’s parents Vedha and
Shrikanth for helping us build and start our family on our own.
vi

TABLE OF CONTENTS
DEDICATION . . . . . . . . . . . . . . . . . . . . . . . . . . . . . . . . . . ii
ACKNOWLEDGEMENTS . . . . . . . . . . . . . . . . . . . . . . . . . . iii
LIST OF FIGURES . . . . . . . . . . . . . . . . . . . . . . . . . . . . . . . x
LIST OF TABLES . . . . . . . . . . . . . . . . . . . . . . . . . . . . . . . . xii
ABSTRACT . . . . . . . . . . . . . . . . . . . . . . . . . . . . . . . . . . . xiii
CHAPTER
I. Introduction . . . . . . . . . . . . . . . . . . . . . . . . . . . . . . 1
1.1 Motivation . . . . . . . . . . . . . . . . . . . . . . . . . . . . 21.1.1 Interference Estimation . . . . . . . . . . . . . . . . 21.1.2 Interference Detection and Mitigation . . . . . . . . 31.1.3 Guaranteeing QoS for Latency Critical Applications 4
1.2 Enabling Fairness in multi-tenant Cloud Computing Infras-tructures . . . . . . . . . . . . . . . . . . . . . . . . . . . . . 5
1.2.1 Caliper . . . . . . . . . . . . . . . . . . . . . . . . . 51.2.2 Interference Detection and Inestigation . . . . . . . 71.2.3 Guaranteeing QoS at microservice computing frame-
works . . . . . . . . . . . . . . . . . . . . . . . . . . 81.3 Summary of Contributions . . . . . . . . . . . . . . . . . . . 9
II. Background and Related Work . . . . . . . . . . . . . . . . . . . 11
2.1 Interference Estimation . . . . . . . . . . . . . . . . . . . . . 112.2 Interference Detection and Mitigation . . . . . . . . . . . . . 122.3 Guaranteeing Response Latencies in Microservice Execution
Frameworks . . . . . . . . . . . . . . . . . . . . . . . . . . . . 142.3.1 Improving QoS without Violating Latency Constraints 142.3.2 Managing SLAs in Multi-Stage Applications . . . . 15
vii

III. Caliper: Interference Estimator for Multi-tenant Environ-ments Sharing Architectural Resources . . . . . . . . . . . . . 17
3.1 Motivation . . . . . . . . . . . . . . . . . . . . . . . . . . . . 183.1.1 Multi-tenant Execution of Batch Applications . . . 183.1.2 Limitations of the State-of-the-art Approach . . . . 20
3.2 Overview of Caliper . . . . . . . . . . . . . . . . . . . . . . . 223.3 Application Phase Behaviors . . . . . . . . . . . . . . . . . . 26
3.3.1 Two Classes of Phase Changes . . . . . . . . . . . . 263.3.2 Characteristics of Exogenous Phase Changes . . . . 27
3.4 Identifying Phase Changes during Co-location . . . . . . . . . 283.4.1 Obtaining PMU Scoreboard . . . . . . . . . . . . . 303.4.2 Ranking and Selecting PMU Types . . . . . . . . . 333.4.3 Putting It All Together . . . . . . . . . . . . . . . . 34
3.5 Evaluation . . . . . . . . . . . . . . . . . . . . . . . . . . . . 353.5.1 Methodology . . . . . . . . . . . . . . . . . . . . . . 353.5.2 Caliper – Accuracy and Overhead . . . . . . . . . . 363.5.3 Comparison with Prior Work . . . . . . . . . . . . . 403.5.4 Leveraging Caliper for Fair Pricing in Datacenters . 46
IV. Proctor – Detecting and Investigating Performance Interfer-ence in Shared Datacenters . . . . . . . . . . . . . . . . . . . . . 48
4.1 Background and Motivation . . . . . . . . . . . . . . . . . . . 504.1.1 Sources of Contention . . . . . . . . . . . . . . . . . 504.1.2 Limitations of Prior Work . . . . . . . . . . . . . . 51
4.2 Overview of the Proposed Approach . . . . . . . . . . . . . . 524.2.1 Goals and Challenges . . . . . . . . . . . . . . . . . 52
4.3 Proctor Architecture . . . . . . . . . . . . . . . . . . . . . . . 544.3.1 Performance Degradation Detector . . . . . . . . . . 554.3.2 Performance Degradation Investigator . . . . . . . . 59
4.4 Evaluation . . . . . . . . . . . . . . . . . . . . . . . . . . . . 624.4.1 Methodology . . . . . . . . . . . . . . . . . . . . . . 624.4.2 Proctor Accuracy . . . . . . . . . . . . . . . . . . . 644.4.3 Detection of Performance Interference . . . . . . . . 654.4.4 Investigating the Performance Degradation . . . . . 664.4.5 Scalability . . . . . . . . . . . . . . . . . . . . . . . 714.4.6 Putting It All Together . . . . . . . . . . . . . . . . 73
V. GrandSLAm: Guaranteeing SLAs for Jobs at MicroservicesExecution Framework . . . . . . . . . . . . . . . . . . . . . . . . . 75
5.1 Analysis of Microservices . . . . . . . . . . . . . . . . . . . . 785.1.1 Performance of Microservices . . . . . . . . . . . . . 79
viii

5.1.2 Execution Time Estimation Model . . . . . . . . . . 815.2 GrandSLAm Design . . . . . . . . . . . . . . . . . . . . . . . 83
5.2.1 Building Microservice Directed Acyclic Graph . . . 845.2.2 Calculating Microservice Stage Slack . . . . . . . . 845.2.3 Dynamic Batching with Request Reordering . . . . 855.2.4 Slack Forwarding . . . . . . . . . . . . . . . . . . . 87
5.3 Evaluation . . . . . . . . . . . . . . . . . . . . . . . . . . . . 885.3.1 Experimental Environments . . . . . . . . . . . . . 895.3.2 Achieving Service Level Agreements (SLAs) . . . . . 915.3.3 Comparing with prior techniques . . . . . . . . . . . 935.3.4 GrandSLAm Performance . . . . . . . . . . . . . . . 100
VI. Conclusion . . . . . . . . . . . . . . . . . . . . . . . . . . . . . . . 103
BIBLIOGRAPHY . . . . . . . . . . . . . . . . . . . . . . . . . . . . . . . . 105
ix

LIST OF FIGURES
Figure
3.1 Interference estimation by POPPA [22] vs. Caliper . . . . . . . . . 243.2 (a) Solo Execution of application. (b) Fluctuations in PMU type
during co-location. (c) Co-phase interference during co-location . . 273.3 Comparing phases during co-located execution with phases present
in solo execution . . . . . . . . . . . . . . . . . . . . . . . . . . . . . 293.4 Overview of PMU scoreboard technique . . . . . . . . . . . . . . . . 313.5 Phase changes triggered by PMU types when running with astar.
Single PMU type is insufficient to detect phase changes . . . . . . . 333.6 Accuracy (in percentage error) of SPEC CPU2006, NAS Parallel
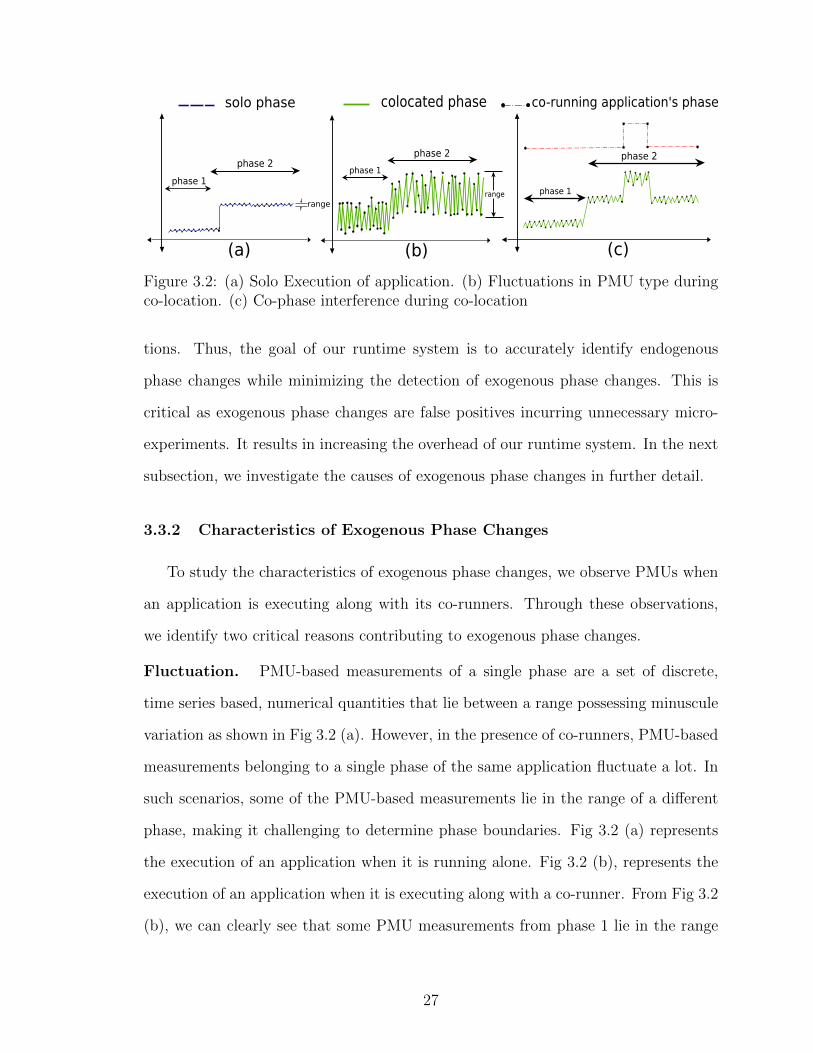
Benchmarks, Sirius Suite and Djinn&Tonic suite while estimatingslowdown when 4 applications are co-located. . . . . . . . . . . . . . 37
3.7 Accuracy and overheads for Caliper under different pause periods. . 393.8 Estimation error: Caliper vs. state-of-the-art software (POPPA [22])
and hardware (FST [31], PTCA [30], ASM [102]) techniques for esti-mating interference . . . . . . . . . . . . . . . . . . . . . . . . . . . 40
3.9 Phase level behavior of Caliper for mcf and milc when runningwith co-runners, 3 libquantum (a) and mcf (b), respectively. Micro-experiments are triggered effectively at phase boundaries. . . . . . . 42
3.10 Overhead: Caliper vs. POPPA . . . . . . . . . . . . . . . . . . . . . 433.11 Performance of micro-architectural entities when POPPA’s runtime
systems are being executed . . . . . . . . . . . . . . . . . . . . . . . 443.12 Comparison of fairness in pricing by Caliper with POPPA . . . . . 474.1 Proctor System Architecture - a two-step process performing De-
tection and Investigation to identify the root cause of performanceinterference [62] . . . . . . . . . . . . . . . . . . . . . . . . . . . . . 54
4.2 PDD detects abrupt performance variations in the application teleme-try data . . . . . . . . . . . . . . . . . . . . . . . . . . . . . . . . . 55
4.3 PDD Step Detection using Finite Difference Method . . . . . . . . . 564.4 Comparison of detection accuracies (a) without noise removal, (b)
with exponential moving average and (c) with median filtering forthe application TPC-C. Median filtering algorithm detects abruptchanges in performance . . . . . . . . . . . . . . . . . . . . . . . . . 57
x
4.5 Percentage of true and false positives while utilizing Proctor to detectperformance issue and identify its root cause. . . . . . . . . . . . . 65
4.6 Number of falsely identified performance degradation scenarios whenexponential moving average/median filtering is utilized to removenoise before step detection . . . . . . . . . . . . . . . . . . . . . . . 67
4.7 Correlation between primary QoS of affected VM and other co-runningVMs . . . . . . . . . . . . . . . . . . . . . . . . . . . . . . . . . . . 67
4.8 Root cause metrics identified by Proctor. . . . . . . . . . . . . . . . 684.9 No. of Proctor servers required to handle 12800 VMs . . . . . . . . 714.10 Performance improvement due to Proctor runtime system . . . . . . 735.1 Sharing microservice instances between Image Querying and Intel-
ligent Personal Assistant applications using microservices executionframework . . . . . . . . . . . . . . . . . . . . . . . . . . . . . . . . 76
5.2 Increase in latency/throughput/input size as the sharing degree in-creases . . . . . . . . . . . . . . . . . . . . . . . . . . . . . . . . . . 79
5.3 Error(%) in predicting ETC for different input sizes with increase inthe sharing degree (x-axis) . . . . . . . . . . . . . . . . . . . . . . . 81
5.4 Extracting used microservices from given jobs in the microservicecluster . . . . . . . . . . . . . . . . . . . . . . . . . . . . . . . . . . 83
5.5 Microservice stage slack corresponding to different microservices presentin Pose Estimation for Sign Language application . . . . . . . . . . 85
5.6 Request reordering and dynamic batching mechanism . . . . . . . . 865.7 Forwarding unused slack in the ASR stage to the NLP stage . . . . 875.8 Comparing the effect of different components present in GrandSLAm’s
policy . . . . . . . . . . . . . . . . . . . . . . . . . . . . . . . . . . 905.9 Comparing the cumulative distribution function of latencies for prior
approaches and GrandSLAm. . . . . . . . . . . . . . . . . . . . . . 925.10 Comparing the latency of workloads under different policies. Grand-
SLAm has the lowest average and tail latency. . . . . . . . . . . . . 965.11 Percentage of requests violating SLAs under different schemes . . . 975.12 Throughput gains from GrandSLAm . . . . . . . . . . . . . . . . . 1005.13 Decrease in number of servers due to GrandSLAm . . . . . . . . . . 102
xi

LIST OF TABLES
Table
3.1 Comparison between Caliper and other interference estimation tech-niques . . . . . . . . . . . . . . . . . . . . . . . . . . . . . . . . . . 22
3.2 PMU types ordered by their effectiveness . . . . . . . . . . . . . . . 323.3 Experimental platforms . . . . . . . . . . . . . . . . . . . . . . . . . 353.4 Benchmark used in evaluation . . . . . . . . . . . . . . . . . . . . . 363.6 Number of false positives incured in Caliper runtime system. First
row contains the benchmarks and the respective number of endoge-nous phases present in them. For example milc (8) means milc has 8endogenous phases. First colunm contains co-runners. . . . . . . . . 45
4.1 List of metrics utilized for performing correlation with the primaryQoS metric to identify source of contention . . . . . . . . . . . . . . 59
4.2 Experimental platform where Proctor is evaluated . . . . . . . . . . 624.3 Benchmarks which have been used to evaluate Proctor and its de-
scriptions . . . . . . . . . . . . . . . . . . . . . . . . . . . . . . . . 634.4 Workload scenarios that have been created from the benchmarks to
evaluate Proctor . . . . . . . . . . . . . . . . . . . . . . . . . . . . . 645.1 Summary of microservices and their funcationality . . . . . . . . . . 885.2 Experimental platforms . . . . . . . . . . . . . . . . . . . . . . . . 885.3 Applications used in evaluation . . . . . . . . . . . . . . . . . . . . 895.4 Workload scenarios . . . . . . . . . . . . . . . . . . . . . . . . . . . 90
xii

ABSTRACT
Cloud computing has emerged as a key technology in many ways over the past
few years, evidenced by the fact that 93% of the organizations is either running
applications or experimenting with Infrastructure-as-a-Service (IaaS) cloud. Hence,
to meet the demands of a large set of target audience, IaaS cloud service providers
consolidate applications belonging to multiple tenants. However, consolidation of
applications leads to performance interference with each other as these applications
end up competing for the shared resources violating QoS of the executing tenants.
This dissertation investigates the implications of interference in consolidated cloud
computing environments to enable fairness in the execution of applications across
tenants. In this context, this dissertation identifies three key issues in cloud computing
infrastructures. We observe that tenants using IaaS public clouds share multi-core
datacenter servers. In such a situation, we identify that the applications belonging
to tenants might compete for shared architectural resources like Last Level Cache
(LLC) and bandwidth to memory, slowing down the execution time of applications.
This necessitates a need for a technique that can accurately estimate the slowdown in
execution time caused due to multi-tenant execution. Such slowdown estimates can
be used to bill tenants appropriately enabling fairness among tenants.
For private datacenters, where performance degradation cannot be tolerated, it
becomes critical to detect interference and investigate its root cause. Under such
circumstances, there is a need for a real-time, lightweight and scalable mechanism
that can detect performance degradation and identify the root cause resource which
xiii

applications are contending for (I/O, network, CPU, Shared Cache).
Finally, the advent of microservice computing environments, calls for a need to
rethink resource management strategies in multi-tenant execution scenarios. Specifi-
cally, we observe that the visibility enabled by microservices execution framework can
be exploited to achieve high throughput and resource utilization while still meeting
Service Level Agreements (SLAs) in multi-tenant execution scenarios. To enable this,
we propose techniques that can dynamically batch and reorder requests propagating
through individual microservice stages within an application.
xiv

CHAPTER I
Introduction
The design choice of datacenters revolves around the use of homogeneous high-
performance hardware including SSDs for storage, high bandwidth network, CPUs
and compute heavy GPUs [123]. In this design style, a management service layer like
a hypervisor is provisioned for enabling efficient utilization of underlying infrastruc-
ture, streamlined processing of applications, and cost-effective growth of datacenters
resources [41, 65, 16, 118]. Such an approach unifies high-performance datacenter
resources together with state-of-the-art hypervisor technologies for optimizing the
execution of a wide variety of applications. An execution environment with such ca-
pabilities enables co-location of applications belonging to multiple tenants on a single
system, improving resource utilization of the entire datacenter.
However, co-location degrades the performance of users’ applications in many
situations [71, 37, 133, 27, 95, 97, 84, 103]. Hence, the issues germinating from co-
location might spawn a variety of problems creating an unfair execution scenario.
For example, tenants co-located in the same server in an Infrastructure-as-a-Service
public cloud might share microarchitectural resources like Last Level Cache (LLC)
and bandwidth to memory [71, 22, 103]. This situation slows down the execution of
these applications. As a result, such a slowdown will increase the cost incurred by
each tenant giving rise to an unfair execution scenario.
1

Motivated by these limitations, there has been a wealth of prior work aiming to
improve the execution efficiency of datacenters [71, 37, 133, 27, 95, 97, 84, 103]. These
include a wide variety of hardware enabled approaches and software-based approaches
that are existing either as standalone runtime systems or integrated as a part of the
operating system/hypervisor. This dissertation argues that the key to enabling har-
monious application execution in consolidated datacenters is to realize a mechanism
for detecting, identifying, estimating and mitigating interference. Such a mechanism
should incur low-performance overhead, should be platform-agnostic, highly accurate
and should be compatible with previous, existing and future generation architectures.
Towards this end, we identify and characterize such unfair execution scenarios and
provide solutions categorically based on the nature and requirement of each datacen-
ter (public clouds, private datacenters, and serverless computing infrastructures).
1.1 Motivation
This section motivates the need for techniques to enable fairness in cloud com-
puting infrastructures. Towards this end, we compartmentalize challenges that exist
in current generation clouds based on the type of datacenter and provide solutions
based on the requirements of tenants utilizing a specific datacenter type.
1.1.1 Interference Estimation
Infrastructure as a Service (IaaS) cloud computing enables users to take advan-
tage of the computing resources under the pay-as-you-go scheme by paying an hourly
price per running application [11]. Customers renting IaaS public clouds now can
choose resource fragments at varying granularity – the number of virtual CPUs, the
amount of memory and storage size, based on their usage requirements. Cloud ser-
vice providers utilize virtualization to instantiate Virtual Machines (VMs) that hosts
tenant applications based on their requested configurations.
2

In light of the significant potential for improving resource utilization, cloud ser-
vice providers consolidate VMs belonging to different tenants into a single server.
This causes applications to slow down due to the sharing of specific architectural
resources like Last Level Cache (LLC) and DRAM bandwidth [71, 37, 133, 27, 79].
The increased execution time that applications are subjected due to slowdown reflects
directly on the price paid by the users under the pay-as-you-go scheme creating an
unfair pricing scenario in IaaS public clouds.
In order to enable fair pricing in public clouds, a solution is needed to quantify
slowdown of an application due to its co-runners [22, 104]. The slowdown is generally
quantified as the ratio of the execution time of an application when it is running along
with the co-runner to the ratio of the execution time of the application when it is
running alone. In this work, we design a runtime system that can accurately estimate
the slowdown exhibited by individual applications on shared cloud infrastructures.
1.1.2 Interference Detection and Mitigation
The design of private datacenters centers is centered around utilizing high-performance
hardware including SSDs for storage, high bandwidth network, CPUs and compute
heavy GPUs all in a single datacenter infrastructure. Such private datacenter infras-
tructures when coalesced with state of the art virtualization technologies offer users
with isolated fragments of high-performance computing resources suited for housing
a wide variety of applications.
However, there exist many situations where the performance of users applications
might be degraded [95, 97, 84, 103]. For example, in VSAN (Virtual Storage Area
Network), the virtual disks of a VM (Virtual Machine) are split into chunks which are
then replicated and distributed to multiple physical disks on different hosts in order
to provide high data availability. Under such circumstances, several VMs will end
up sharing the same physical disk, which may potentially lead to a noisy neighbor
3

scenario. In such a scenario, a VM running a particular I/O heavy workload, causing
significant contention with other VMs at disk I/O, will affect the neighboring VMs
latency/throughput.
Similarly, in many instances, hypervisor software may oversubscribe server re-
sources in order to increase resource utilization. In such situations, it is common
to observe CPU, Last Level Cache, Memory Bandwidth and Network contention
due to noisy neighbors. The effect of interference can be avoided by scheduling
potentially contentious VMs on different machines. However, this requires datacen-
ter providers/hypervisor software to identify problematic VMs (VMs that affect the
performance of co-running applications) and also to determine the root cause of con-
tention for each of the affected VMs.
In order to abstract private datacenter users from the effect of contention, we
need a solution to detect contention and investigate its root causes during runtime.
In other words, we need a system that can pinpoint an antagonistic VM and identify
the root cause resource at which contention occurs (CPU, I/O, Network, Storage).
In this work, we design a real-time system that utilizes system software telemetry
to detect contentious VMs and identify the root cause resource at which contention
occurs.
1.1.3 Guaranteeing QoS for Latency Critical Applications
Multi-tenant execution has been explored actively in the context of traditional
datacenters and cloud computing frameworks towards improving resource utilization.
Prior works that study multi-tenant execution have proposed to co-locate high prior-
ity latency sensitive applications with other low priority batch applications [71, 126].
However, multi-tenant execution in a serverless computing framework would operate
on a fundamentally different set of considerations/assumptions. Firstly, execution
scenarios in serverless computing frameworks house multiple latency critical appli-
4

cations belonging to different tenants [47, 120]. This is uncommon in virtualized
public clouds where there is limited knowledge of the executing application. As a
result, guaranteeing user defined SLAs under such execution environments becomes
extremely difficult. Secondly, serverless computing framework is priority agnostic, in
contrast to traditional datacenters where batch applications are given low priority
while latency sensitive applications are given a higher priority. In a serverless com-
puting framework, meeting the service level agreements (SLA) of every individual
tenant is critical. Lastly, resource sharing in multi-tenant serverless execution sce-
narios happens at a microservice level granularity. This is in contrast to traditional
datacenters where resource sharing is characterized by contention at LLC, CPU, I/O,
and network.
These fundamentally unique characteristics of serverless computing frameworks
motivate us to rethink the design of runtime systems that drive multi-tenancy in such
frameworks. For this purpose, we design a system that enables consolidated execution
of queries belonging to multiple tenants in a serverless computing framework.
1.2 Enabling Fairness in multi-tenant Cloud Computing In-
frastructures
The goal of this dissertation is to enable fairness in multi-tenant cloud computing
infrastructures. This section gives a brief introduction of the techniques used for
enabling fairness in cloud computing infrastructures.
1.2.1 Caliper
Accurately estimating slowdown at runtime can be utilized to enable fair pricing
in IaaS public clouds. Towards this end, there have been many efforts that try to
estimate slowdown of applications at runtime [76, 31, 22, 40, 108, 126, 102, 84, 71].
5
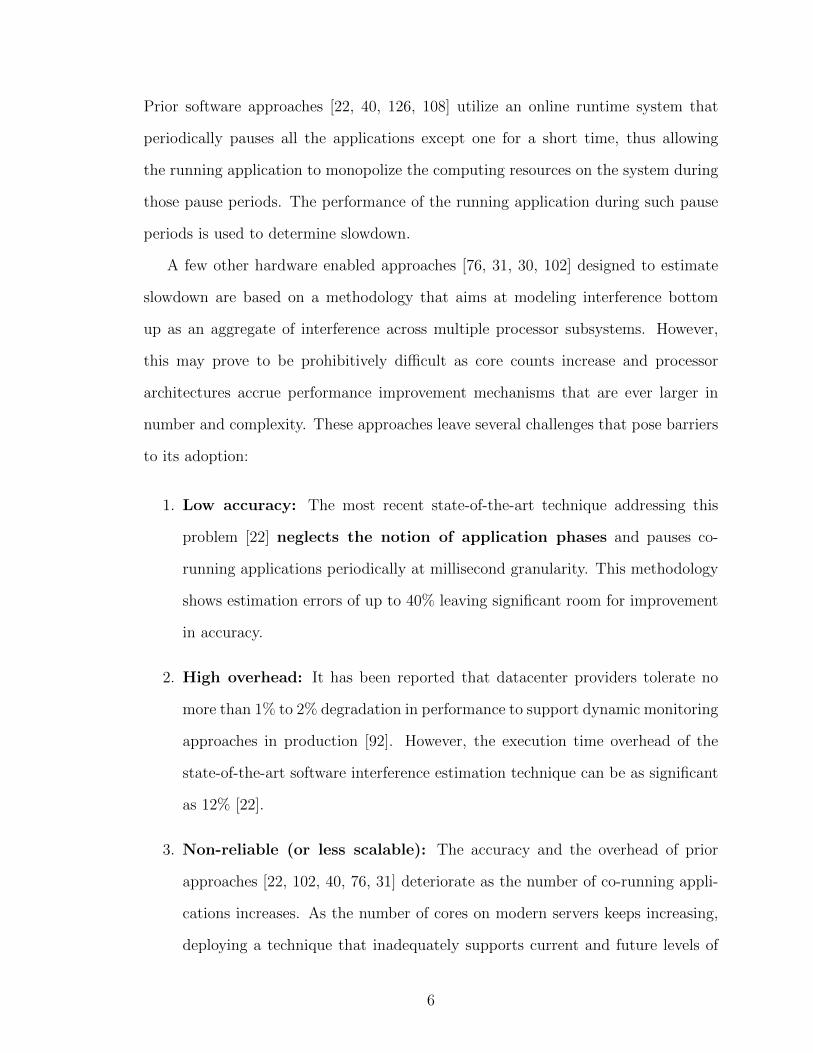
Prior software approaches [22, 40, 126, 108] utilize an online runtime system that
periodically pauses all the applications except one for a short time, thus allowing
the running application to monopolize the computing resources on the system during
those pause periods. The performance of the running application during such pause
periods is used to determine slowdown.
A few other hardware enabled approaches [76, 31, 30, 102] designed to estimate
slowdown are based on a methodology that aims at modeling interference bottom
up as an aggregate of interference across multiple processor subsystems. However,
this may prove to be prohibitively difficult as core counts increase and processor
architectures accrue performance improvement mechanisms that are ever larger in
number and complexity. These approaches leave several challenges that pose barriers
to its adoption:
1. Low accuracy: The most recent state-of-the-art technique addressing this
problem [22] neglects the notion of application phases and pauses co-
running applications periodically at millisecond granularity. This methodology
shows estimation errors of up to 40% leaving significant room for improvement
in accuracy.
2. High overhead: It has been reported that datacenter providers tolerate no
more than 1% to 2% degradation in performance to support dynamic monitoring
approaches in production [92]. However, the execution time overhead of the
state-of-the-art software interference estimation technique can be as significant
as 12% [22].
3. Non-reliable (or less scalable): The accuracy and the overhead of prior
approaches [22, 102, 40, 76, 31] deteriorate as the number of co-running appli-
cations increases. As the number of cores on modern servers keeps increasing,
deploying a technique that inadequately supports current and future levels of
6

multi-tenancy would not be a preferred choice.
4. Priori knowledge: Another class of static techniques requires a priori [71, 37]
knowledge about all workloads and the profiling for each type of workload. This
requirement limits the types of workloads for which such a technique can be
applied and, more broadly, the kind of datacenters that can adopt the approach
(e.g., public clouds).
To overcome these challenges, we design a mechanism called micro-experiments –
short-lived measurements of application performance under different conditions – to
accurately estimate the interference experienced by applications due to performance
degradation. On top of this mechanism, we introduce Caliper to estimate slowdown
of an application at runtime with high accuracy and negligible overhead. To enable
Caliper, one of the most significant challenges is to accurately, efficiently, and con-
tinuously detect phases within applications. In this work, we design a solution to
identify all such phases by leveraging performance monitoring units (PMUs).
1.2.2 Interference Detection and Inestigation
Private clouds are critical for tenants that require high-performance datacenter
infrastructure. In such infrastructures, it becomes the responsibility of the cloud
service provider to abstract its users from noisy neighbors who contend for shared
resources. An important step towards solving this problem is to pinpoint each noisy
neighbor and the resource for which contention occurs. However, there exist three
major challenges while tackling the datacenter contention problem.
1. Absence of Apriori Application Profile. New applications are getting
executed in the cloud infrastructure, for which the datacenter operators do not
have any prior performance profile. This makes the Detection task challenging
7
as there is no baseline performance to compare against to detect a change in
the QoS metric.
2. Multiple Sources of Contention. Different applications exert stress on
different subsystems of the stack (one application might only stress network
while other application might have a large number of I/O requests stressing
I/O system stack), requiring Investigation task to handle multiple sources of
contention.
3. Low Runtime Overhead. The technique needs to perform both these tasks
with very low-performance overhead in order to quickly adapt to the application
runtime environment.
Prior relevant body of work solves these challenges partially. Bubble-up [72] and
Cuanta [37] require a priori knowledge of application behavior restricting its appli-
cability in the Detection task. While Application Slowdown Model (ASM) [103],
Geiko [97], and Seawall [95] detect performance degradation, they are unable to iden-
tify the source of contention, restricting its applicability in the Investigation task.
Finally, the third category of work, Deepdive [84] and CPI2 [130], have very high
overhead in performing these two tasks, making it difficult to deploy them at runtime
systems.
To tackle these challenges, we present Proctor, a runtime system that continuously
monitors, automatically detects and investigates a wide range of performance issues
directly affect- ing the Quality of Service of VMs running in a cloud-scale datacenter,
with high accuracy and low-performance overhead.
1.2.3 Guaranteeing QoS at microservice computing frameworks
Improving the resource utilization of serverless computing infrastructures is a
critical and unsolved problem. There are several steps that we undertook towards
8
identifying and solving this problem.
• Analysis of microservice execution scenarios. Our investigation observes the
key differences between traditional and microservice-based computing platforms –
primarily in the context of visibility into the underlying microservices that exist
providing exposure to application specific QoS metrics.
• Accurate estimation of completion time at individual microservice stages. We
provide insights towards building a model that could estimate with high accuracy
the completion time of individual requests at the different microservice stages and
hence, the overall time of completion.
• Guarantee end-to-end SLAs by exploiting stage level SLAs. By utilizing
the completion time predictions from the model, we derive individual stage SLAs
for each microservice/stage. We then combine this per-stage SLA requirement with
our understanding of end-to-end latency and slack. This enables an efficient request
scheduling mechanism towards the end goal of maximizing server throughput with-
out violating the end-to-end SLA.
Using these techniques, we built GrandSlam, a holistic runtime framework that
enables consolidated execution of queries belonging to multiple tenants in a serverless
cloud computing framework. GrandSlam does so by providing a prediction based on
identifying ”safe” consolidation to deliver satisfactory QoS (latency) while maximizing
throughput simultaneously.
1.3 Summary of Contributions
The specific contributions of this dissertation are as follows.
1. Caliper: This dissertation presents Caliper, a novel phase aware interference
estimation technique that is accurate, lightweight and can be used to estimate
slowdown of applications belonging to multiple tenants running in public clouds.
9

This, in turn, can be utilized to enable fair pricing among tenants using IaaS
public clouds.
2. Proctor: This dissertation presents Proctor, a runtime system, continuously
monitors VMs in a datacenter to automatically detects and identify the sources
of contention, with low overhead and high accuracy. We envision Proctor as a
guide, that can direct the corrective measures for mitigating interference.
3. GrandSlam: This dissertation presents GrandSlam, a runtime system to guar-
antee SLAs among applications utilizing microservices in a serverless computing
platform. This enables an efficient request scheduling mechanism towards the
end goal of maximizing server throughput without violating the end-to-end SLA.
10
CHAPTER II
Background and Related Work
In this Chapter, we give a background and survey the related literature to the
topics covered in this dissertation. These include prior efforts in estimating slowdown
due to interference online, as well as techniques that have been used to enable co-
location to improve datacenter server utilization and techniques to detect interference
due to contention at I/O, network, CPU and Last Level Cache.
2.1 Interference Estimation
There have been many prior studies to detect performance interference in a variety
aspects of architectural resources. We look first into the hardware enabled approaches
and then address the prior work that utilizes system and OS level approaches for
detecting interference.
Hardware techniques: There are several approaches that try to estimate
slowdown due to contention in shared caches, memory controller and bandwidth [83,
31, 105, 90]. Nesbit et al. employed the network fair queuing model in the memory
scheduler to meet the fairness [83]. Mutlu and Moscibroda focused on DRAM specific
architectural features such as row buffers and DRAM banks [76]. They utilized mem-
ory scheduling techniques to ensure the fairness between multiple threads. Ebrahimi
et al. extended the fairness problem in memory subsystems by including shared last
11

level cache and memory bandwidth [31]. This work focused on the source incurring
performance interference and proposed throttling mechanism by controlling injection
rates of requests to alleviate the contention of shared resources. Suh et al. firstly
discussed the cache partitioning scheme to efficiently use the shared resources [105].
Qureshi et al. proposed utility based cache partitioning technique to achieve high
performance [90].
Software/Systems approaches: There are many efforts introducing software
frameworks and proposing the new designs of operating systems [37, 71, 126, 108,
82, 86, 68]. Q-Cloud measures the resource capacity for satisfying QoS in a dedi-
cated server called as a staging server and then performs placement decisions based
on choosing the right server that will be profitable to minimize interference [82]. To
accurately estimate the performance interferences without profiling on a dedicated
server, Bubble-up [71] and Cuanta [37] designed the synthetic workloads to under-
stand the degree of interference when co-locating applications. Meanwhile, Soares et
al. studied the concept of pollute buffer in shared last level caches to prevent filling the
shared caches as non-reusable data. Their work focused on improving the utilization
of shared caches through OS-level page allocation [98]. Zhuravlev et al. extended the
CPU scheduler to alleviate the some of the interferences. The goal of this work is to
schedule the threads by evenly distributing the load intensity to caches [133]. Blago-
durov et al. proposed that the scheduler needs to consider the effects of NUMA [21].
Also, there are numerous prior studies to solve the contention problems such as shared
last level cache and NUMA by scheduling virtual machines [6, 91, 69].
2.2 Interference Detection and Mitigation
In this section we discuss work relevant detection and mitigation of interference
causing application/VM behavior and diagnosing its root causes. We present related
work that attempts to mitigate CPU, I/O and network contention.
12

VM Management: State-of-the-art VM management tools such as vSphere [41],
XenServer [124] or resource management tools utilized in IaaS public clouds like Mi-
crosoft Azure [67] and Amazon Web Services [11] performs VM placements naively
using primitive factors and metrics. For example, VMware’s Distributed Resource
Management (DRM) [39] takes into account factors like load balancing and power
management as factors for optimal placement of VMs. However, this is agnostic to-
wards performance issues due to disk failures, congestion in the network or contention
by neighboring VMs. Proctor can complement such systems by informing datacenter
providers information pertaining to problematic VMs and its root causes. This can
motivate smart VM placement strategies.
Contention Detection Techniques Major classes of contention detection tech-
niques focus on a particular aspect present in the system rather than providing an
integrated approach. Zhuravlev et al.extended the CPU scheduler to alleviate the
degree of interferences in a native system. The goal of this work is to schedule the
threads by evenly distributing the load intensity to caches[134]. Shieeh et.al [95]
tries to eliminate disk contention by utilizing a log-structured design for disk arrays.
Parda [38] and IOFlow [110] tries to address contention at the disk level by observ-
ing latency of I/O requests and re-ordering disk queues. Seawall [96], EyeQ [55]
and Hadrian [15] focus mainly on isolating interference in network in multi-tenant
environments. However, all these techniques fail to provide an integrated solution
for hyperconverged environments where contention exists at storage, network and in
CPUs.
A Priori Knowledge Another class of applications observe correlation between
various system parameters to detect performance issues in runtime and its root
causes [4][119][125][77][63]. Typically, these techniques leverage baseline performance
from a set of training applications and provide predictive solutions at runtime for un-
known applications. However, the hyper-parameters present in current day systems
13

are too complex to create a generalized model for prediction. Moreover, in current
generation datacenters, we observe system configurations to be highly dynamic which
is directly reflected on the application’s performance. Hence, in addition to being ag-
nostic towards the nature of the application, it becomes mandatory for our solution
to be adaptable towards changing characteristics of system as well as newer systems.
2.3 Guaranteeing Response Latencies in Microservice Exe-
cution Frameworks
Prior literature on guaranteeing response latency fall into two primary categories:
Improving QoS without violating latency constraints, managing SLAs in multi-stage
applications.
2.3.1 Improving QoS without Violating Latency Constraints
Prior work on addressing response latency variation and providing quality of ser-
vice (QoS) guarantees have primarily been in the context of traditional datacen-
ters [111, 71, 126, 28, 70]. Bubble-Up [71] and Bubble-Flux [126] quantify contention
for last level cache capacity and memory bandwidth towards enabling co-location of
a latency critical application alongside batch applications. However, these techniques
prioritize the latency critical user-facing application and end up significantly hurting
the performance of the co-running batch applications. Paragon [28] and Whare-
Map [70] utilize runtime systems using machine learning techniques like collaborative
filtering and sensitivity analysis towards identifying the right amount of resources re-
quired for guaranteeing QoS in heterogeneous datacenters. However, these techniques
are designed for traditional datacenter applications like Memcached, Web Search etc.
There is some prior literature that attempts to estimate performance at co-located
situations in accelerator environments [56, 25, 24, 64, 5, 109, 113, 112]. Baymax [25]
14

predicts the behavior of tasks executing in a GPU accelerator context. Prophet [24]
models the interference across accelerator resources in co-located execution scenarios.
However, neither of these techniques cater to the needs of a microservice execution
framework, as they do not tackle the challenge of providing solutions for guarantee-
ing latency for applications containing multiple stages. A small body of prior work
also focusses on batch processing OLD requests [43, 74]. In addition to that, none
of these techniques have attempted to perform dynamic batching which is critical
in improving the throughput when DNN based artificial intelligence applications are
being executed.
2.3.2 Managing SLAs in Multi-Stage Applications
Recent prior works have identified the advantages of architectures/applications
that are composed of multiple stages, especially its ease of deployment [53, 59, 115,
89, 48, 106, 54, 46, 32, 58]. Under such scenarios, support for multi-tenancy as
well as schemes to abstract users from the impact of multi-tenancy would be crit-
ical. However, explorations in this direction by companies such as Facebook [60],
Microsoft [53, 89] and academic institutions neglect multi-tenant execution scenar-
ios [116, 127]. However, the most relevant prior works that have looked into multi-
stage applications from the academic standpoint are as follows:
TimeTrader. [116] addresses the problem of meeting application specific latency
targets for multi request execution in Online Data Intensive applications (OLDIs).
Towards meeting that objective, they employ a mechanism that tries to reorder re-
quests that contain varying slack using merely an Earliest Deadline First schedul-
ing methodology. However, this technique assumes that the applications contain a
single processing stage and fails to acknowledge the intrinsic latency variance across
multiple stages. Hence, it deprioritizes requests assuming to contain relaxed latency
constraints, however, would be subjected to a bulk of compute at its later stages.
15
This leads to diminished effectiveness in mitigating response latency for multi-stage
applications, as we quantitatively show in Section 5.3.
PowerChief. [127] seeks to identify the bottleneck stages present in multi-stage
voice and image based intelligent personal assisstant applications towards employing
dynamic voltage frequency scaling to boost partial execution stages. However, Pow-
erChief does not strive to guarantee SLAs at a user/request level. Furthermore, the
proposed solution is not generalized for a microservice execution framework which
handles requests from multiple tenants and focuses on a particular class of applica-
tions.
16

CHAPTER III
Caliper: Interference Estimator for Multi-tenant
Environments Sharing Architectural Resources
One of the major drawbacks of datacenter co-location is the slowdown caused to
the execution of applications. Under such circumstances, it is essential to have the
ability to estimate the slowdown of applications accurately. Such slowdown estimates
could enable resource allocation of shared resources to each application in a slowdown
aware manner motivated towards providing strong Quality-of-Service (QoS) guaran-
tees. Also, in Infrastructure-as-a-Service (IaaS) clouds, such a mechanism could be
used to bill its customers appropriately based on the amount of slowdown that their
applications have been subjected to by the co-running applications [102, 22].
In this study, we design a mechanism called micro-experiments – short-lived mea-
surements of application performance under different conditions – to accurately esti-
mate the interference experienced by applications due to slowdown. On top of this
mechanism, we introduce Caliper to estimate slowdown of an application at runtime
with high accuracy and negligible overhead. A micro-experiment is a period during
which the performance of an application is abstracted from the interference incurred
by co-runners, using which an accurate estimate of its slowdown can be obtained.
One of the most crucial challenges while utilizing micro-experiments for estimating
the slowdown is to determine when micro-experiments should be performed. We ob-
17

serve that interference does not change significantly within a single application phase.
Thus, the problem of identifying when to perform a micro-experiment boils down to-
wards identifying phases of applications at runtime while executing with co-runners.
Triggering a micro-experiment on the application at each of its phases once allows
the runtime to estimate co-runner interference with negligible overheads accurately.
To enable Caliper, one of the most significant challenges is to accurately, effi-
ciently, and continuously detect not only phases within applications but also phases
in application’s co-runners. In this work, we design a solution to identify all such
phases by leveraging performance monitoring units (PMUs). Since each application
has different sensitivities towards architectural resources, we identify the right set of
PMU types that can differentiate phase changes across a wide variety of unknown ap-
plications. We perform cross-validation on these selected PMU types on a spectrum
of application workloads to demonstrate generality.
With Caliper, we are able to estimate the slowdown at multi-tenant execution
scenarios accurately with a mean absolute error of 4% and negligible overhead of less
than 1% for a broad spectrum of workload scenarios when executing 16 applications,
making it readily deployable in current and future datacenters.
3.1 Motivation
In this section, we introduce key challenges that are present while co-locating
multiple batch applications in multi-core systems. We then illustrate the state-of-
the-art techniques that try to address these challenges and their limitations.
3.1.1 Multi-tenant Execution of Batch Applications
Modern computer systems host a wide range of applications of varying nature.
These applications are broadly classified into two types (1) batch applications and
(2) user-facing applications. Applications which are of batch type are throughput
18

oriented and not user-facing. This type of application represents today’s workloads
that execute in datacenters and clouds. Consolidation of such applications to increase
the resource utilization of the system is a common trend [11, 13]. On the other hand,
another class of applications like Memcached and Web Search is latency critical/user-
facing and hence is required to meet strict Quality of Service (QoS) guarantees. As a
result, the consolidation of such latency critical applications with other applications
is generally avoided as co-location will affect the latency of these applications signif-
icantly [132, 1, 73]. These applications are typically housed in private datacenters or
run on dedicated machines that guarantee Service Level Agreements (SLAs).
Although the consolidation of batch applications onto a single server increases
the resource utilization, it has a direct impact on individual application performance.
State-of-the-art virtualization technologies try to provide performance isolation at
some levels. Current hypervisors perform:
1. Strict CPU reservations by disallowing sharing of CPU cores among different
applications [65, 16].
2. Statically partitioning DRAM memory and disk space among different applica-
tions [65, 16].
3. Static partitioning of I/O and network bandwidth proportionally among appli-
cations using SR-IOV [57, 87].
However, applications are still slowed down mainly due to contention at the last-
level cache (LLC) and main memory bandwidth. The resource contention at the
LLC and main memory bandwidth increases the overall memory access latency, sig-
nificantly slowing down the execution of different applications. Hence, it becomes
critical to identify and gauge the slowdown applications are subjected to when they
are housed at multi-tenant execution scenarios. As a major step towards solving this
19

problem, prior approaches try to precisely estimate the amount of slowdown each
application which is subjected to in multi-tenant execution scenarios [102, 22].
3.1.2 Limitations of the State-of-the-art Approach
Broadly, state-of-the-art approaches that try to estimate slowdown are classified
into two different categories – static approaches that require a priori knowledge
about the applications executing and dynamic approaches which can perform
slowdown estimation for unknown applications. In this section, we enumerate the
limitations of the state-of-the-art static and dynamic approaches that try to solve
this problem.
3.1.2.1 Static Approaches
Prior static approaches like Bubble-Up [71] and Cuanta [37] have shown to be
effective at generating precise performance predictions at co-located execution sce-
narios with high accuracy. However, there exist several primary limitations of the
work, including requiring a priori knowledge of application behavior and the lack of
adaptability to changes in application dynamic behaviors. These limitations restrict
the possibility of deploying such static approaches for a variety of datacenter infras-
tructures which encounter unknown applications on a regular basis. (e.g., private
datacenters and public clouds)
3.1.2.2 Dynamic Approaches
Another class of prior works, that does not require a priori knowledge, has at-
tempted to estimate slowdown of applications due to shared cache capacity and/or
memory bandwidth interference [22, 126, 102]. The most recent prior work by Breslow
et al. [22] is software based that utilizes a technique called POPPA. The main motiva-
tion behind POPPA towards estimating slowdown is based on modeling interference
20
as a ratio of solo and co-located execution performance. While co-located application
performance can be directly measured at runtime, it is challenging to estimate solo
performance of an application while running with co-runners simultaneously. Towards
obtaining an estimate of solo performance, POPPA periodically pauses all co-running
applications for a very short time except one application repeatedly at fixed time in-
tervals as depicted in Fig 3.1a. The pause periods allow it to monopolize system
resources and (briefly) match its solo performance. POPPA has several limitations
as it suffers severely from low accuracy and high overheads especially as the number
of application contexts increases.
On the other hand, there is a class of literature that has attempted to tackle the
problem of estimating slowdown at runtime by utilizing novel hardware to track appli-
cation interference among individual processor subsystems, which are taken together
to model the overall interference of the applications [76, 30, 31, 102]. The most re-
cent work by Subramanian et al. presents Application Slowdown Model (ASM). This
work is based on the hypothesis that performance of each application is proportional
to the rate at which it accesses the shared cache. Hence, in order to identify the
shared cache access rate, it maintains an auxiliary tag store for each application,
which tracks the state of the cache in a situation where the application would have
been running alone. Every application that is co-located within the system utilizes
this specialized hardware periodically in a round robin fashion to collect its corre-
sponding shared cache access rates, which in turn is utilized by ASM to estimate
its corresponding slowdown. One of the key limitations of ASM is that it requires
additional hardware support precluding it from being used as a solution on existing
commodity servers [76, 30, 31, 102, 101, 35, 34].
The combination of the poor accuracy, overhead, inadequate support for multi-
tenancy, deployability, requirement of additional hardware support significantly limits
the applicability of the prior approaches. Towards satisfying these shortcomings, we
21

Bubble-Up [71] POPPA [22] ASM [102] FST [31] Caliper
Low overhead X XNo additional hardware X X XNo offline profile X X XEstimation error 7% 45% 20% 30% 4%
Table 3.1: Comparison between Caliper and other interference estimation techniques
design a technique that can be deployed readily in production-grade datacenters.
Our technique can accurately estimate slowdown in executions scenar-
ios that encounter a wide class of unknown applications, unlike prior static
approaches [71, 37] that require a priori knowledge of the executing applications. Ta-
ble 3.1 presents a comparison between Caliper and sever other interference estimation
techniques.
Later in Section 3.5.3, we experimentally evaluate each of these scenarios to illus-
trate the shortcomings of the prior dynamic approaches [22, 102]. Then, we show how
our proposed phase aware interference estimation technique is able to estimate slow-
down accurately with negligible overhead even when the number of simultaneously
executing applications is up to 16 contexts as existing in modern datacenters.
3.2 Overview of Caliper
In this section, we describe Caliper, a runtime system for estimating interference
at multi-tenant execution environments.
Goal. The design goal of Caliper is to accurately estimate the slowdown of an
application at runtime. To achieve this, we need to gauge the performance of the
application running with co-runners, Perf(co−run), as well as the performance of the
application when it is running alone, Perf(solo−run). Using these quantities, the slow-
down of the applications can be easily estimated by the following Equation 3.1.
22

slowdown = Perf(co−run)/Perf(solo−run) (3.1)
We have utilized Instructions Per Cycle (IPC) as the metric to quantify per-
formance. Perf(co−run) from equation 3.1 is the IPC of the application during co-
location and is directly measured when the application is running along with the
co-runners. Perf(solo−run) is the solo execution performance of the application. IPC
can be measured easily and cheaply on commodity processors. A wide body of prior
interference estimation techniques utilizes IPC as their primary metric to quantify
performance [102, 22, 40]. For even latency-sensitive applications, a prior study from
Google leveraged the CPI (Cycles Per Instructions) metric as a performance indica-
tor [131]. Although the metric may not be highly accurate for some applications, it
is used to only guide the performance estimation.
Approach. The primary objective of this study is to be able to precisely estimate
Perf(solo−run) even during the presence of co-runners. To achieve this goal, we in-
troduce a software technique, called micro-experiment. A micro-experiment is a
short-lived runtime period for a few milliseconds during which an experi-
ment is run to collect a measurement of interest. Our runtime system performs
micro-experiments by opportunistically pausing the execution of an application’s co-
runners for a small amount of time so that the resource contention is eliminated
temporarily in the system. The result of such a micro-experiment represents an ac-
curate estimate of the application’s solo execution performance and this estimation
along with Perf(co−run) (direct performance measurement of an application when it is
run together with other applications) can be used as a basis to obtain the slowdown
at runtime.
Challenges. To keep the cost of the estimation process low, we need to address a
key challenge. A recent prior study that periodically pauses co-running applications
23

Co−running
Fixed interval
Solo−running
Paused
Pausing time
App 2
App 1
App 3
(a) POPPA [22]
App 1
Time
IPC
Phase change
Co-running
Solo-running
Paused
Steady phase Steady phase
App 2
App 3
App 1
App 2
App 3
(b) Caliper
Figure 3.1: Interference estimation by POPPA [22] vs. Caliper
to estimate the performance degradation has been shown to cause non-negligible
overheads [22]. This is due to the following reasons:
1. Frequent pausing can disturb forward progress of the applications due to the
execution stalls.
2. Pausing an application evicts its entries present in hardware caches, TLBs,
BTBs, etc. This exacerbates the performance overhead problem.
3. As the number of cores in a server increases, more applications (or VMs) can
be housed in servers. Under such circumstances, periodically pausing every
co-running application will increase the effective time for which individual ap-
plications is paused. Hence, a naive technique like periodic pausing becomes an
unsuitable solution for operation at scale.
Thus, it is essential to identify when micro-experiments need to be triggered. In
24

this study, we overcome this challenge by utilizing phase boundaries as the triggers for
conducting micro-experiments. The key observations that led towards utilizing phase
boundaries as triggers are as follows. First, the execution behavior of applications
does not drastically change within a single phase. This means that we do not need to
estimate slowdown by performing micro-experiments within a steady phase. Second,
we observe that the number of phase changes is not large in most applications, as
also observed by previous works [94, 29, 42]. The majority of applications have a
very few phases spanning over an execution time which range from a few minutes
up to half an hour [81]. It gives us an opportunity to opportunistically conduct our
micro-experiments technique so that we are able to avoid excessive pauses for the
common case where applications have very few phase changes.
Fig 3.1b illustrates how Caliper estimates the slowdown by using micro-experiments.
Whenever there is a phase change, we perform a micro-experiment by pausing all the
co-running applications giving an opportunity for the un-paused applications to elim-
inate the resource contention. Then, we are able to measure Perf(solo−run) for the
application without the resource contentions. However the most recent work that
ties to estimate slowdown during runtime [22], pauses the co-running applications
in a periodic fashion as shown in Fig 3.1a. We have conducted micro-experiments
using 75 milliseconds as a pause period. The parameter is empirically determined
in our testbed to monopolize architectural resources during that time. Section 3.5.2
talks in detail about the choice of our pause period. As a result, we can estimate the
slowdown with negligible overheads of less than 0.5% for most of the situations. We
will discuss the parameter sensitivity in the evaluation section.
While performing micro-experiments, our runtime estimates Perf(solo−run) of an
application at every phase boundary. We aggregate the estimation of slowdown at
every these individual phases of the application to calculate the slowdown for the
entire execution of the application as shown by Equation 3.2.
25

Perf(solo−run) =IPC(1) × T(1) + IPC(2) × T(2) + ....+ IPC(n) × T(n)
T1 + T2....+ Tn(3.2)
where, Perf(solo−run) is the estimated IPC of solo execution of an application,
IPC(i) is estimated IPC of solo execution of the application during phase i, T(i) is the
time for which the application remains in phase i and n is the total number of phases
in the application.
3.3 Application Phase Behaviors
In this section, we describe phase behaviors of applications in multi-tenant ex-
ecution environments. Traditionally, phases can be defined as intervals within the
execution of a program with similar behavior [42]. Phase changes typically manifest
themselves as observable changes in execution behavior of applications. Although
there have been many efforts to detect phase changes of a single application via per-
formance monitoring units (PMUs) [52, 94, 42, 29], it is challenging to precisely iden-
tify phase boundaries in multi-tenant environments. This is because the PMU-based
measurements of individual applications in multi-tenant environments are affected by
the behavior of co-running applications. Prior techniques are unreliable when multi-
ple applications are simultaneously running and hence cannot be directly applicable
to our runtime system.
3.3.1 Two Classes of Phase Changes
As a first step towards detecting phase changes in co-located environments, we
taxonomize phases detected by PMUs (e.g., as shifts in an application’s CPI) as falling
into one of two classes – endogenous phase changes that result from an application’s
innate behavior and exogenous phase changes that result from co-running applica-
26
phase 2
phase 1phase 1
colocated phase co-running application's phase
rangerange
solo phase
phase 2
phase 1
phase 2
(a) (b) (c)
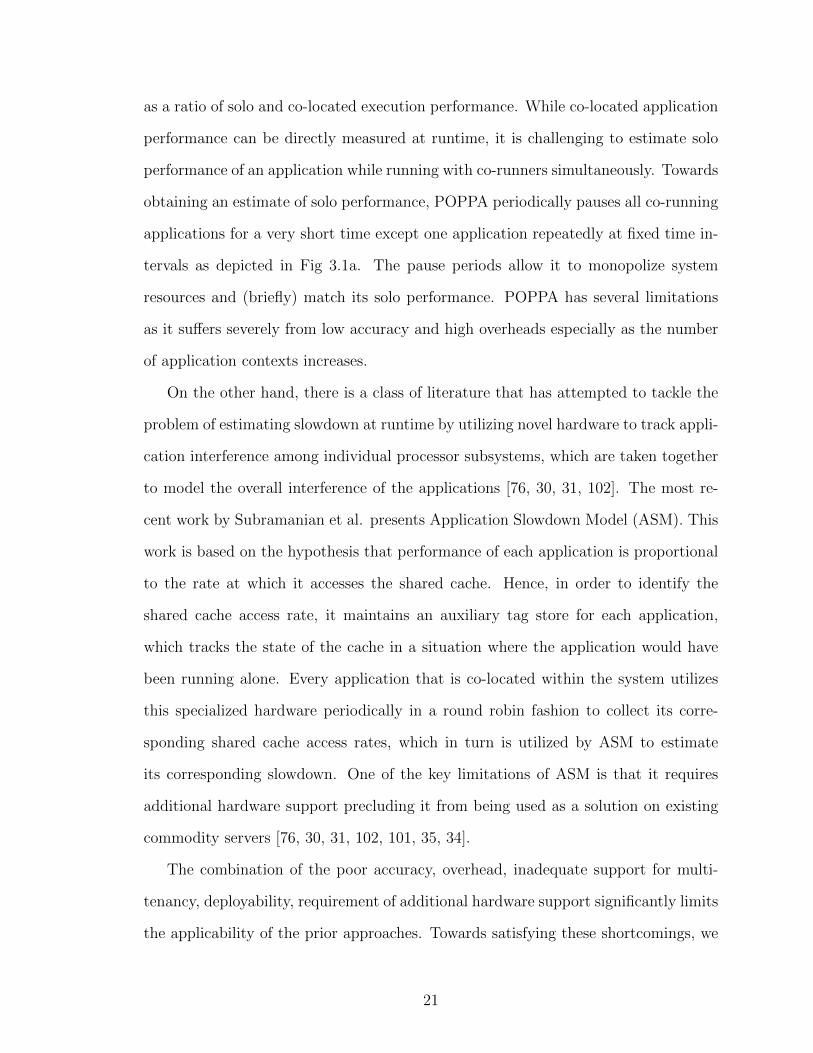
Figure 3.2: (a) Solo Execution of application. (b) Fluctuations in PMU type duringco-location. (c) Co-phase interference during co-location
tions. Thus, the goal of our runtime system is to accurately identify endogenous
phase changes while minimizing the detection of exogenous phase changes. This is
critical as exogenous phase changes are false positives incurring unnecessary micro-
experiments. It results in increasing the overhead of our runtime system. In the next
subsection, we investigate the causes of exogenous phase changes in further detail.
3.3.2 Characteristics of Exogenous Phase Changes
To study the characteristics of exogenous phase changes, we observe PMUs when
an application is executing along with its co-runners. Through these observations,
we identify two critical reasons contributing to exogenous phase changes.
Fluctuation. PMU-based measurements of a single phase are a set of discrete,
time series based, numerical quantities that lie between a range possessing minuscule
variation as shown in Fig 3.2 (a). However, in the presence of co-runners, PMU-based
measurements belonging to a single phase of the same application fluctuate a lot. In
such scenarios, some of the PMU-based measurements lie in the range of a different
phase, making it challenging to determine phase boundaries. Fig 3.2 (a) represents
the execution of an application when it is running alone. Fig 3.2 (b), represents the
execution of an application when it is executing along with a co-runner. From Fig 3.2
(b), we can clearly see that some PMU measurements from phase 1 lie in the range
27

of the PMU measurements from phase 2 and vice versa. This makes it challenging
to identify phase boundaries. We have observed this phenomenon especially with
PMU measurements corresponding to micro-architectural entities like last-level cache
misses that are shared by multiple cores.
Co-phase interference. Phase changes in one application can cause changes to
other co-running applications. We call this phenomenon as co-phase interference.
Fig 3.2 (c), again represents the execution of an application when it is executing
along with a different co-runner. From Fig 3.2 (c), we can clearly see that the change
in PMU measurements corresponding to co-phase interference is difficult to be dis-
tinguished from endogenous phase changes.
Our goal here is to build a robust phase aware runtime system that detects en-
dogenous phase changes while minimizing the detection of exogenous phase changes.
This is because triggering micro-experiments during exogenous phase changes is un-
desired as they will result in increasing the performance overhead due to pausing of
co-runners.
3.4 Identifying Phase Changes during Co-location
The primary goal of Caliper’s phase detection approach is to detect endogenous
phases (true positives) while ignoring exogenous phases (false positives) at runtime.
For this purpose, we propose a PMU-based mechanism. The primary objective of our
mechanism is to identify the representative PMU types which accurately detect every
single endogenous phase change while neglecting all exogenous phases. In addition
to that, the extracted PMU types should be generic. In other words, it should be
able to detect endogenous phase changes even for an unknown application whose
phase behavior has not been witnessed before. For this purpose, we first assess each
PMU type, to detect phase changes for a training set of applications. We then cross
validate to examine its ability to detect endogenous phases and ignore exogenous
28

Phase 2
Phase 3
PM
U m
ea
su
rem
en
ts
Phase 1
Executed instructions
solo-run
Annotated phase
Endogeneous phase
Exogeneous phase Co
mp
ariso
n solo-run
with
co-run
Executed instructions
PM
U A
me
asu
rem
en
ts
co-run
Executed instructions
PM
U B
me
asu
rem
en
ts
co-run
Executed instructions
PM
U C
me
asu
rem
en
ts
co-run
Figure 3.3: Comparing phases during co-located execution with phases present in soloexecution
phases for unknown applications. This determines the generality of each PMU type.
Based on the ability of each PMU type, we choose the best PMU type.
The initial step in this process is to carefully choose our training set of appli-
cations to cover a wide range of contentiousness, sensitivity and phase changing
attributes [107]. The list of training applications is shown in the first column of
Table 3.2. We use astar as our training co-runner which is cross-validated in our
evaluation under section 4.4. The application astar from SPEC CPU2006 is known
to be both contentious and to have numerous and rapidly changing phases [107], which
can train our model to be resistant against both fluctuations as well as co-phase in-
terference. With these pointers, we undertake the following three-step approach to
extract the set of PMU types that can be utilized for phase detection.
(1) Comparing PMU measurements during co-run with solo execution. We
execute the training set of applications alone to obtain PMU measurements during
solo execution. We manually annotate the endogenous phases present in each of the
training set of applications.
We then collect PMU measurements for each application present in training set
29

during co-location. By using the PMU measurements during co-location, we verify for
each PMU type its ability to detect endogenous phases by comparing the timestamps
corresponding to the actual phase changes that happen during solo execution (from
the annotated phases during previous step). This process is illustrated in Fig 3.3 as
we observe that the measurements for PMU A detect all the two endogenous phases
present which are confirmed by the annotated solo execution of the application. How-
ever, the measurements for PMU B could not detect any endogenous phase changes.
It just detects an exogenous phase change which is not desired. With the PMU C, it
detects only an endogenous phase chase, but misses the other endogenous phase. So,
the PMU type A is resilient for the application to detect phase changes in multi-tenant
environments. We performed above process for 18 different PMU types.
(2) Obtaining PMU scoreboard. We then quantify the effectiveness of each PMU
type that was successful in identifying phase changes during the previous step (1).
This quantification helps in selecting the best PMU type that detects every possible
phase change present in the system. This is done by obtaining the PMU scoreboard
which will be discussed in detail at Section 3.4.1.
(3) Selecting the final set of PMU types. From observing the best PMU type
for every single application present in the training set, we obtain a single set of PMU
type(s). Those PMU types can be utilized to detect phase changes across a diverse
class of application. We describe this step in the Section 3.4.2.
3.4.1 Obtaining PMU Scoreboard
The motivation of PMU scoreboarding is to quantify the effectiveness of each PMU
type. Using this quantification, we obtain a common set of PMUs that can work
effectively towards identifying phase changes. Our PMU scoreboarding quantifies
PMU types by gauging how steep change in PMU measurements are at each phase
boundary. We use a technique called step detection to quantify steepness at each
30

Application
PMU measurements(co-run with astar)
Input
Application
CPI
PMU Type δ
Output
PMU scoreboard
technique
1.721.71 1.731.71 1.721.71 1.731.71 8.52 8.558.51 8.518.52
Y Y Y Y Y Y Y Y Y Y Y YY
- - - - - - - - - - - -
0.010.01 0.02 0.02 0.01 0.01 0.02
Y’ Y’ Y’ Y’ Y’ Y’ Y’ Y’ Y’ Y’
6.79 0.01 0.04
Phase change (δ1 = 6.79)
PMU
measurements
finite
difference
Phase 2
Phase 3
δ1
Time
PM
U m
ea
su
rem
en
ts
Phase 1 δ2
T0 T1 T2
Final δ = min(δ1, δ2, ...)
L1-D load miss
LLC store miss
…
Figure 3.4: Overview of PMU scoreboard technique
phase boundary. Fig 3.4 shows the overall flow for obtaining the PMU scoreboard.
Inputs. Application and training dataset of time series PMU measurements during
co-location.
Output. Threshold of separation (δ, described below) quantifying the steepness of
a PMU type at phase boundary for an application.
Objective function. To quantify the effectiveness of a PMU type we assess the
steepness magnitude expressed by PMU measurements during phase change (higher
variation means PMU type distinguishes phase boundaries significantly better).
Methodology. The steepness is obtained by performing the step detection scheme.
The step detection scheme is a process of finding abrupt changes in a time series
signal and internally uses a technique called finite difference method for identifying
abrupt changes. The fundamental hypothesis of finite difference method for identi-
fying abrupt changes is based on the fact that the absolute difference between sub-
sequent time-series measurements is very high at the exact point where the abrupt
changes occur.
Mathematically, the finite difference of a time series signal is the rate of change
31

WorkloadsPMU rank
1st 2nd 3rd
astar CPI branch L1-D load missbzip2 LLC store miss CPI L1-D load misscactusADM L1-D load miss L1-D load CPIdealII CPI L1-D load branchmcf L1-D load miss CPI LLC loadmilc LLC store miss L1-D load branchxalancbmk LLC store miss LLC load L1-D loadtonto L1-D load miss branch CPI
Table 3.2: PMU types ordered by their effectiveness
in the individual elements. We implement the finite difference method by perform-
ing pair wise difference of subsequent elements present in the time series using the
following formula :-
Y ′ =Yj+1 − Yj
2∆TY ′j = Yj (for 1 < j < n− 1)
where Yj is the jth points present in the time series, n being the number of points,
∆T being the difference between the number of timestamps for time series values.
The result highlights the drastic change by showcasing a high value for Y ′. Figure 3.4
clearly illustrates this where we can see a sharp increase in the PMU measurement
at time T1 (at the point Y9 ). Its corresponding finite differential value is very high
at point Y ′8 , which is utilized to indicate a phase change at that timestamp T1.
Based on statistical analysis by prior studies, abrupt changes are defined as points
that are higher than three standard deviations above or below mean. The lowest
numerical value of each such abrupt change obtained by step detection is returned as
the threshold of separation δ for a PMU type that is being utilized to perform phase
detection for an application. For the example given at Fig 3.4, the value of δ is the
minimum of the value of δ1 and δ2.
32

0.0 0.5 1.0 1.5 2.0Executed instructions 1e11
0
5
10
15
20
25
CPI
CPI solo
0
5
10
15
20
25
PMU m
easu
rementsLLC store misses
L1-d load misses
(a) mcf
0 1 2 3 4 5 6Executed instructions 1e11
−0.5
0.0
0.5
1.0
1.5
2.0
2.5
3.0
CPI
CPI solo
−0.5
0.0
0.5
1.0
1.5
2.0
2.5
3.0
PMU m
easurementsLLC store misses
L1-d load misses
(b) milc
Figure 3.5: Phase changes triggered by PMU types when running with astar. SinglePMU type is insufficient to detect phase changes
3.4.2 Ranking and Selecting PMU Types
In order to choose appropriate PMU types for identifying endogenous phase changes,
we rank PMU types for every single application using the δ value (threshold of sepa-
ration) obtained from the PMU scoreboarding technique. From that, we choose the
PMU type that is capable of detecting endogenous phases across all the applications.
In this paper, we have shown the top 3 PMU types in Table 3.2 for each application
that are ranked using the δ value.
However, an observation from our training experiments whose results as depicted
in Table 3.2 shows that no single PMU type can detect phase changes across all
the training set of applications. In other words, there can be a situation where an
architectural resource that can detect phase changes on an application could fail
to detect phase changes completely on a different application. We illustrate this
hypothesis based on a real-world example.
Fig 3.5 shows an example where a single PMU type will not be able to identify
phase boundaries across two different applications. Each application requires different
PMU types to precisely detect phase changes. In other words, mcf requires L1-d load
misses while milc requires LLC store misses and vice versa fails. The x-axis indicates
the cumulative number of instructions executed as time progresses. The left y-axis
featured as yellow (diamond) line shows the CPI of the applications when running
33

alone and the right y-axis and the blue (circle) and red (dashed) line show the selected
hardware performance monitors for the application when running with three instances
of astar as co-runners.
From Fig 3.5 (a), we find out that the PMU type, L1-d cache load misses, can
effectively detect phase changes of mcf in co-located environments. This is not true
for the application milc as the same PMU type L1-d cache load misses fails to detect
phase changes as shown in Fig 3.5 (b). These results motivate the need for multiple
PMU types to capture phase changes across a variety of applications. To achieve this,
we undertake an approach where we observe a set of architectural resources (CPI, LLC
store miss, and L1-D load miss) in contrast to a single resource. Moreover, to avoid
missing endogenous phase changes, we use a conservative approach to trigger a micro-
experiment even if one of the PMU types out of the three detects a phase change.
This is because failing to detect endogenous phase changes will significantly reduce
the accuracy in estimating IPC of solo execution. On the other hand, predicting a
non-existent phase change causes only negligible overheads when the occurrence of
such mispredictions is low.
3.4.3 Putting It All Together
As discussed, the final objective of Caliper is to estimate the slowdown of an
application during runtime accurately. Caliper performs micro-experiments, a short-
lived experiment to collect a measurement of interest, by opportunistically pausing
the execution of co-running applications for a small amount of time so that resource
contention can be temporarily eliminated in the system. The result of such a micro-
experiment represents an accurate estimate of the solo performance for the application
in that small period.
Performing micro-experiments frequently causes huge execution overheads. Hence,
it is essential to identify when micro-experiments need to be triggered. In this study,
34

Processor Microarchitecture Kernel Hypervisor
Intel Xeon E5-2630 @2.4 GHz Sandy Bridge-EP 3.8.0 KVM-QEMU v2.0Intel Xeon E3-1420 @3.7 GHz Haswell 3.8.0 KVM-QEMU v2.0
Table 3.3: Experimental platforms
we overcome this challenge by utilizing phase boundaries as triggers for conducting
micro-experiments. This is because the execution behavior of applications does not
drastically change within a single phase. Hence a single micro-experiment for a phase
is sufficient to characterize the execution behavior of an application for that phase.
Adding to that, the number of phase changes is not many in most applications.
We utilize Performance Monitoring Units (PMUs) to detect phase changes during
runtime.
3.5 Evaluation
3.5.1 Methodology
Infrastructure. We evaluate Caliper on two commodity multicore systems sum-
marized in Table 5.2. We use Linux KVM as the hypervisor and run applications
on virtual machines (VMs) [65] because running virtual machines is a standard way
for cloud providers to isolate infrastructure among different customers. Hence our
infrastructural setup consists of co-locating multiple virtual machines (VMs) where
each VM belongs to a different user.
Each virtual machine has 4GB of main memory and 16GB disk. We use the
Ubuntu 12.04 distribution as guest operating systems with Linux kernel 3.11.0. There
is no change in the execution characteristics of the applications while executing them
using virtualized environments. We take advantage of perf tool to collect hardware
performance monitors while observing applications.
Applications. To evaluate the effectiveness of our technique, we use the bench-
35

Benchmarks Class of applications AWS use cases [7]
Sirius Suite Machine learning NTT Docomo (voice recognition) [8]DjiNN & Tonic Deep neural network PIXNET (facial recognition) [10]SPEC 2006 General purpose & Scientific Penn State [9]NPB Parallel computing workloads NASA NEX [13]
Table 3.4: Benchmark used in evaluation
marks from SPEC CPU 2006 [49] with ref inputs, NPB - NAS Parallel bench-
marks [14]. In addition to that, we execute emerging applications from SiriusSuite [45]
and DjiNN&Tonic suite [44] in batch mode. Sirius suite and DjiNN & Tonic suite
contain a class of applications which implement state-of-the-art machine learning and
computer vision algorithms. It has been a common trend to execute such applica-
tions in modern public clouds where multiple applications are oversubscribed in the
same server [7, 9, 10, 8]. We can clearly see that the benchmark suites that we
have utilized to evaluate Caliper are similar to the applications that are being ex-
ecuted in state-of-the-art public cloud computing environments (e.g., Amazon web
services [122]). Table 3.4 enumerates the applications, their description, input, ap-
plication domain and the respective suite from which the benchmarks are obtained.
Also, SiriusSuite [45] and DjiNN&Tonic suite [44] have stemmed into a startup that
builds conversational artificial intelligence systems for banking sector [2].
3.5.2 Caliper – Accuracy and Overhead
In this section, we evaluate the efficacy of Caliper. We discuss the accuracy in
estimating slowdown by Caliper and its overhead experimentally. Accuracy calcu-
lated by comparing the estimated slowdown from our runtime system with the actual
slowdown, a metric that is consistently followed by existing literature that focuses on
estimating slowdown [22, 30, 31, 102].
Fig 3.6 shows the accuracy when Caliper is trying to estimate slowdown when 4
applications are co-located on a single server. The experimental setup here consists
36
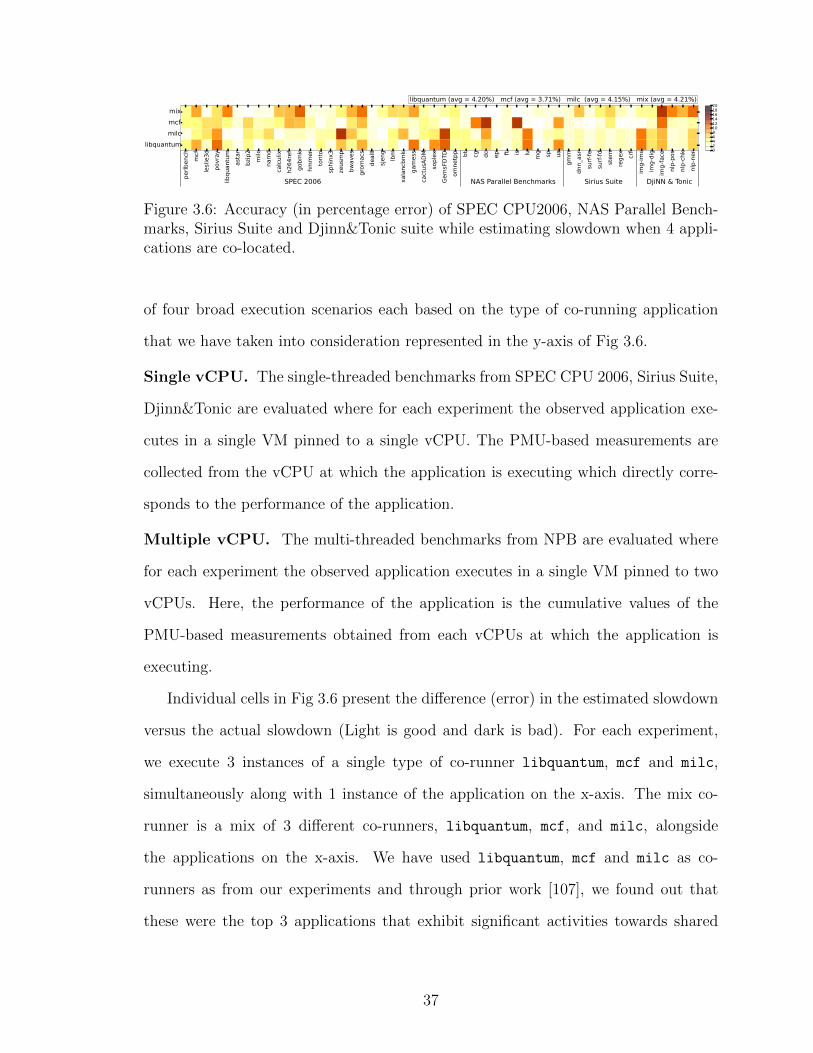
perlb
ench
mcf
leslie3d
povray
libquantum
astar
bzip2
milc
namd
calculix
h264
ref
gobm
khm
mer
tonto
sphinx3
zeusmp
bwaves
grom
acs
dealII
sjeng
lbm
xalancbm
kgamess
cactusAD
Msoplex
GemsFDT
Dom
netpp bt
cg
dc
ep ft
is lu mg sp ua
gmm
dnn_asr
surf-fe
surf-fd
stem
regex
crf
img-imc
img-dig
img-face
nlp-pos
nlp-chk
nlp-ner
libquantummilcmcfmix
SPEC 2006 NAS Parallel Benchmarks Sirius Suite DjiNN & Tonic
libquantum (avg = 4.20%) mcf (avg = 3.71%) milc (avg = 4.15%) mix (avg = 4.21%)
02468101214161820
Figure 3.6: Accuracy (in percentage error) of SPEC CPU2006, NAS Parallel Bench-marks, Sirius Suite and Djinn&Tonic suite while estimating slowdown when 4 appli-cations are co-located.
of four broad execution scenarios each based on the type of co-running application
that we have taken into consideration represented in the y-axis of Fig 3.6.
Single vCPU. The single-threaded benchmarks from SPEC CPU 2006, Sirius Suite,
Djinn&Tonic are evaluated where for each experiment the observed application exe-
cutes in a single VM pinned to a single vCPU. The PMU-based measurements are
collected from the vCPU at which the application is executing which directly corre-
sponds to the performance of the application.
Multiple vCPU. The multi-threaded benchmarks from NPB are evaluated where
for each experiment the observed application executes in a single VM pinned to two
vCPUs. Here, the performance of the application is the cumulative values of the
PMU-based measurements obtained from each vCPUs at which the application is
executing.
Individual cells in Fig 3.6 present the difference (error) in the estimated slowdown
versus the actual slowdown (Light is good and dark is bad). For each experiment,
we execute 3 instances of a single type of co-runner libquantum, mcf and milc,
simultaneously along with 1 instance of the application on the x-axis. The mix co-
runner is a mix of 3 different co-runners, libquantum, mcf, and milc, alongside
the applications on the x-axis. We have used libquantum, mcf and milc as co-
runners as from our experiments and through prior work [107], we found out that
these were the top 3 applications that exhibit significant activities towards shared
37

architectural resources including last-level cache and memory bandwidth. Hence,
accurately estimating slowdown during the presence of such co-runners was a big
challenge for us[107]. Our experiments to estimate the accuracy of slowdown and
runtime overhead takes into account all the 4 applications executing in the system.
We run each benchmark three times and take the mean to minimize run to run
variability. We check to see if there is any phase change every second owing to
the observation that phases are consistent for a few seconds. During every phase
change, micro-experiments are performed for 75ms to eliminate resource contention
during observation. We obtain the value 75ms empirically by performing a sweep for
different quantities optimizing for reduced overhead and increased accuracy. Details
will be discussed later.
Accuracy. From Fig 3.6, we can see that Caliper shows very low error rates across
all the applications even when running with multiple instances of cache contentious
co-runners like libquantum. The average error rate when co-locating with such con-
tentious co-runners is around 4%. We observe that 95% of our applications have errors
less than 10% and the worst case error is 12% in our technique, whereas the worst case
error of prior techniques is up to 60% (details presented in Section 3.5.3 of evalua-
tion). We also observe that the error in estimating interference using Caliper remains
consistent regardless of the nature of the co-runners. This is indicative of two things
(1) accuracy with respect to detecting phases (2) precision of micro-experiments in
detecting per phase interference. In the next section, we discuss the importance of
having a robust phase detection methodology and its impact on the accuracy of of
estimating interference.
Overhead. To enable Caliper on production systems, we have to achieve low over-
heads so as to minimize the interference to running application on the servers. Ta-
ble 3.5 indicates the overhead that is incurred by Caliper while estimating slowdown.
We evaluate the overhead at the same experimental setup under which we had eval-
38

20 40 60 80 100 120
Pause Periods (ms)0
10
20
30
40
50
Err
or
(%)
libquantum
milc
mcf
mix
(a) Accuracy
20 40 60 80 100 120
Pause Periods (ms)0
2
4
6
8
10
Execu
tion t
ime
overh
eads
(%) libquantum
milc
mcf
mix
(b) Overheads
Figure 3.7: Accuracy and overheads for Caliper under different pause periods.
SPEC NPB SiriusOverhead Phase changes Overhead Phase changes Overhead Phase changes
(%) (per min) (%) (per min) (%) (per min)
main-app 0.65 1.58 0.35 0.38 0.25 0.20colo-app 0.74 0.91 0.45 0.75 0.44 0.80
Table 3.5: Execution time overhead and number of phase changes
uated accuracy. From Table 3.5, we can clearly see that the overhead of the main
observed application, as well as the average overhead of the co-running applications,
remain less than 1% in most of the cases. On average, the overhead of Caliper’s run-
time system is around 0.6%. Similarly, we also see that the number of phase changes
per minute is also very less. On average, there is a single phase change per minute.
This indicates that each application is paused for a few hundred milliseconds every
minute making the overhead extremely negligible.
Sensitivity of the pause period. Towards obtaining an optimal pause period
for operating Caliper, we performed a sensitivity study. The results of this study is
shown in Fig 3.7. From figures 3.7a and 3.7a, we clearly observe two trends. First, the
accuracy of estimating slowdown increases as the pause periods increase up to 75ms.
Then there is no benefit in increasing the pause periods. Hence we have utilized 75ms
as an optimal pause period for our mechanism. Second, the overheads do not change
drastically as we increase the pause periods. This is because Caliper’s frequency at
which it pauses the co-runners is too low causing negligible impact in the execution
time overheads.
39

4 8 16Number of co-runners
010203040506070
Estim
ation
Error (%)
POPPA FST PTCA ASM Caliper
Figure 3.8: Estimation error: Caliper vs. state-of-the-art software (POPPA [22]) andhardware (FST [31], PTCA [30], ASM [102]) techniques for estimating interference
3.5.3 Comparison with Prior Work
Accuracy. Fig 3.8 shows the accuracy of Caliper as compared to the accuracy
of POPPA [22], FST [31], PTCA [30], and ASM [102] for the benchmarks present
in SPEC CPU 2006, NPB, Sirius suite and Djinn&Tonic suite. POPPA works by
periodically pausing all co-running applications except one for a very short time
at fixed time intervals. The aggregated performance of the applications during the
pause periods is the key measure by which slowdown is estimated. Through these
experiments, we can see that the estimation error is much lower for Caliper than
POPPA [22]. The mean error of POPPA is 13.23%. On the other hand, our technique
shows much lower error rates averaging around 3.77%.
It is challenging to estimate the slowdown when running with contentious co-
runners as they quickly pollute the shared last-level cache and excessively use the
shared memory bandwidth. One of the main reasons for POPPA’s poor accuracy is
that the pausing time (3.2ms) is too short to capture solo performance of an appli-
cation. This is because the shared cache would not be warmed up to be containing
the entire working set of the application which is to be measured. As a result, the
measured application would spend most of its pausing time filling in the shared cache,
giving much less time to observe how the application performs when it monopolizes
40

computing resources. On the other hand, Caliper performs micro-experiments which
pauses co-runners only when discovering phase boundaries. This enables us to ob-
serve the solo execution performance for a longer time without worrying much about
the overhead caused due to pausing for additional time. Hence, we are able to achieve
high accuracy in estimating slowdown at runtime.
We also observed that the state-of-the-art hardware enabled approaches towards
estimating slowdown [31, 30, 102] showed a high error rate. Just like the other soft-
ware approaches, state-of-the-art hardware enabled approaches utilizes cache access
rates of applications during solo execution time to determine slowdown of an appli-
cation. Cache access rates of applications during solo execution is again obtained by
periodically pausing co-running applications in a round robin fashion. Hence the lim-
itations of the prior software approaches hold good for the hardware approaches too.
The mean errors of POPPA, FST, PTCA, and ASM are 11.04%, 28.28%, 38.42% and
9.98% respectively. From these results, we were able to see that Caliper can outper-
form even the state-of-the-art hardware enabled approaches present in the literature.
Multi-tenancy. To evaluate the effectiveness of the state-of-the-art hardware or
software based approaches and Caliper towards supporting multiple tenants, we in-
crease the number of executing application contexts to 8 applications and 16 ap-
plications. Fig 3.8 shows the average accuracy of Caliper as compared to POPPA
for SPEC CPU2006 and NPB when co-locating with libquantum. We can see that
Caliper’s accuracy is around 3.95% when co-locating with 16 applications in contrast
to POPPA [22], FST [31], PTCA [30] and ASM [102] whose error is around 22%, 40%,
41% and 19% respectively. The low accuracy of the prior techniques is because as the
number of co-runners increases, the shared cache becomes much more polluted due to
the contention. POPPA even on such situations pauses for the same amount of time
which is too less for the shared last-Level cache to warm up so as to exhibit the per-
formance corresponding to solo execution. Hence, its slowdown estimation becomes
41
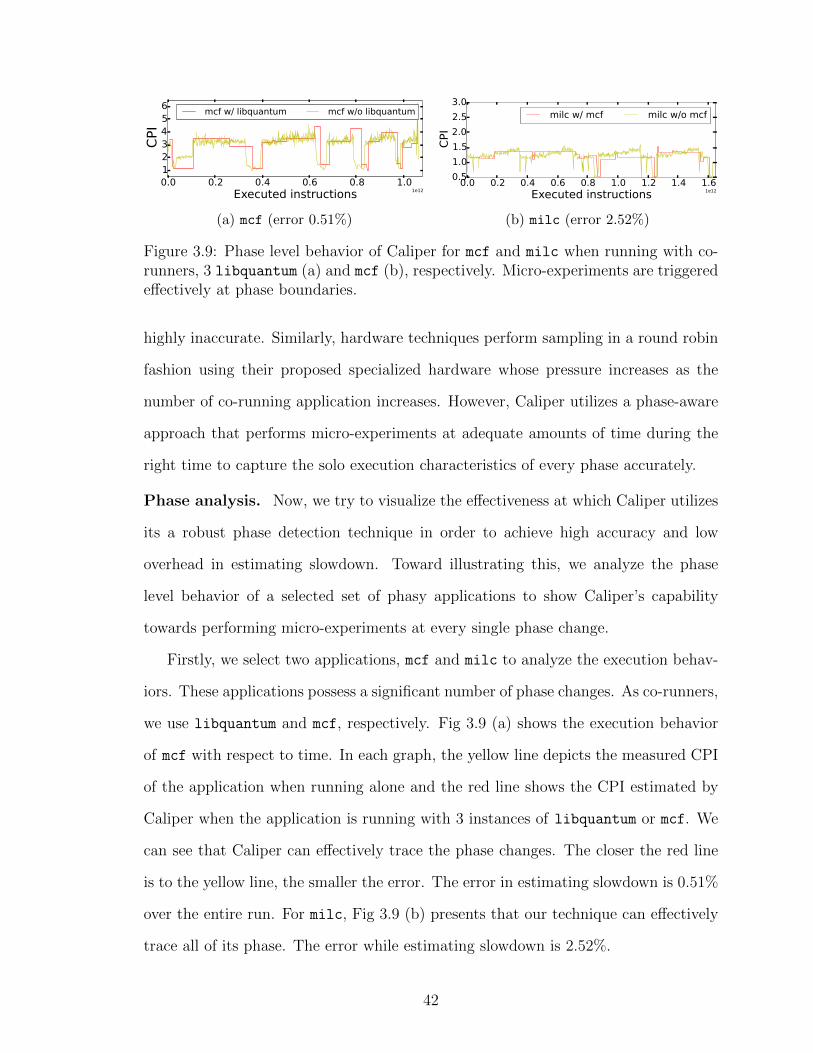
0.0 0.2 0.4 0.6 0.8 1.0Executed instructions 1e12
123456
CPI
mcf w/ libquantum mcf w/o libquantum
(a) mcf (error 0.51%)
0.0 0.2 0.4 0.6 0.8 1.0 1.2 1.4 1.6Executed instructions 1e12
0.51.01.52.02.53.0
CPI
milc w/ mcf milc w/o mcf
(b) milc (error 2.52%)
Figure 3.9: Phase level behavior of Caliper for mcf and milc when running with co-runners, 3 libquantum (a) and mcf (b), respectively. Micro-experiments are triggeredeffectively at phase boundaries.
highly inaccurate. Similarly, hardware techniques perform sampling in a round robin
fashion using their proposed specialized hardware whose pressure increases as the
number of co-running application increases. However, Caliper utilizes a phase-aware
approach that performs micro-experiments at adequate amounts of time during the
right time to capture the solo execution characteristics of every phase accurately.
Phase analysis. Now, we try to visualize the effectiveness at which Caliper utilizes
its a robust phase detection technique in order to achieve high accuracy and low
overhead in estimating slowdown. Toward illustrating this, we analyze the phase
level behavior of a selected set of phasy applications to show Caliper’s capability
towards performing micro-experiments at every single phase change.
Firstly, we select two applications, mcf and milc to analyze the execution behav-
iors. These applications possess a significant number of phase changes. As co-runners,
we use libquantum and mcf, respectively. Fig 3.9 (a) shows the execution behavior
of mcf with respect to time. In each graph, the yellow line depicts the measured CPI
of the application when running alone and the red line shows the CPI estimated by
Caliper when the application is running with 3 instances of libquantum or mcf. We
can see that Caliper can effectively trace the phase changes. The closer the red line
is to the yellow line, the smaller the error. The error in estimating slowdown is 0.51%
over the entire run. For milc, Fig 3.9 (b) presents that our technique can effectively
trace all of its phase. The error while estimating slowdown is 2.52%.
42
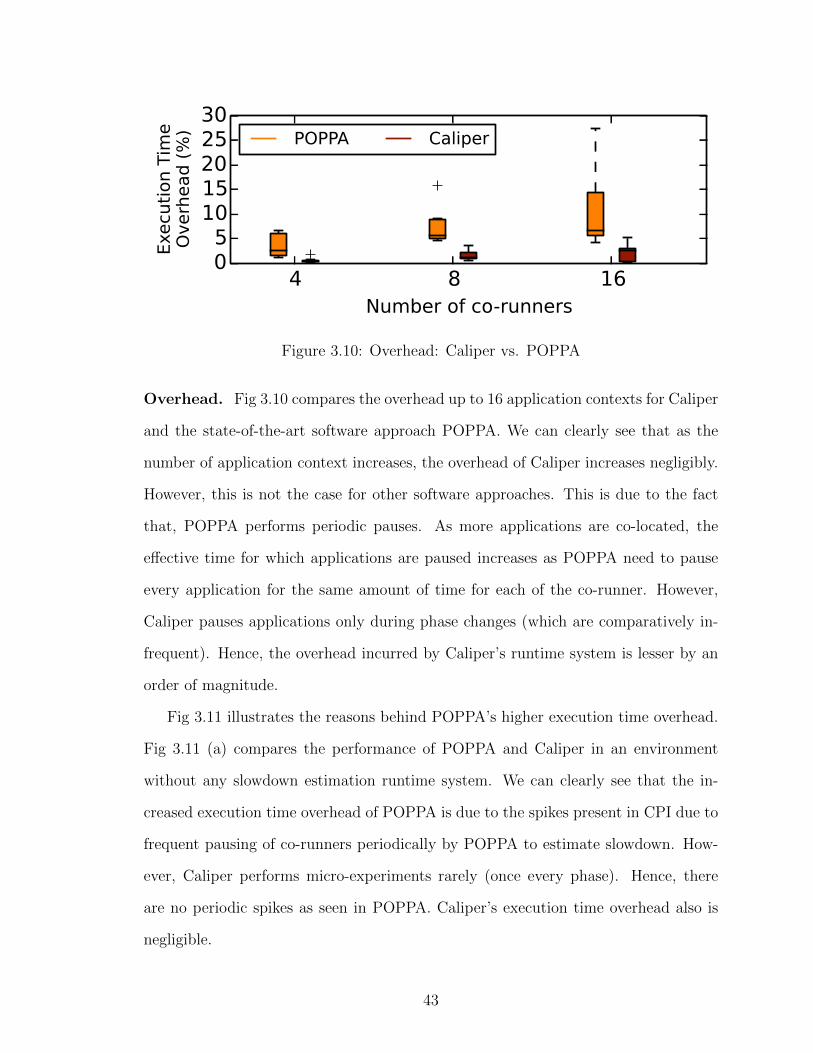
4 8 16Number of co-runners
051015202530
Execution Time
Overhead (%
) POPPA Caliper
Figure 3.10: Overhead: Caliper vs. POPPA
Overhead. Fig 3.10 compares the overhead up to 16 application contexts for Caliper
and the state-of-the-art software approach POPPA. We can clearly see that as the
number of application context increases, the overhead of Caliper increases negligibly.
However, this is not the case for other software approaches. This is due to the fact
that, POPPA performs periodic pauses. As more applications are co-located, the
effective time for which applications are paused increases as POPPA need to pause
every application for the same amount of time for each of the co-runner. However,
Caliper pauses applications only during phase changes (which are comparatively in-
frequent). Hence, the overhead incurred by Caliper’s runtime system is lesser by an
order of magnitude.
Fig 3.11 illustrates the reasons behind POPPA’s higher execution time overhead.
Fig 3.11 (a) compares the performance of POPPA and Caliper in an environment
without any slowdown estimation runtime system. We can clearly see that the in-
creased execution time overhead of POPPA is due to the spikes present in CPI due to
frequent pausing of co-runners periodically by POPPA to estimate slowdown. How-
ever, Caliper performs micro-experiments rarely (once every phase). Hence, there
are no periodic spikes as seen in POPPA. Caliper’s execution time overhead also is
negligible.
43

0 80 160 240 320 400 480 560 640Time (milliseconds)
05
10152025
CPI
no runtime system POPPA
(a) Execution performance - 10.5% increase in execution time due to POPPA’s runtimesystem
0 80 160 240 320 400 480 560 640Time (milliseconds)
0.0
0.2
0.4
0.6
0.8
1.0
Cach
e misses 1e6
no runtime system POPPA
(b) Cache misses – 11.6% increase in cache misses due to POPPA’s runtime system
0 80 160 240 320 400 480 560 640Time (milliseconds)
0.0
0.2
0.4
0.6
0.8
1.0
Branch Misses 1e7
no runtime system POPPA
(c) Branch misses – 5.7% increase in branchmisses due to POPPA’s runtime system.
0 80 160 240 320 400 480 560 640Time (milliseconds)
0.0
0.2
0.4
0.6
0.8
1.0
TLB Misses
1e7
no runtime system POPPA
(d) TLB misses – 7% increase in TLB missesdue to POPPA’s runtime system
Figure 3.11: Performance of micro-architectural entities when POPPA’s runtime sys-tems are being executed
44
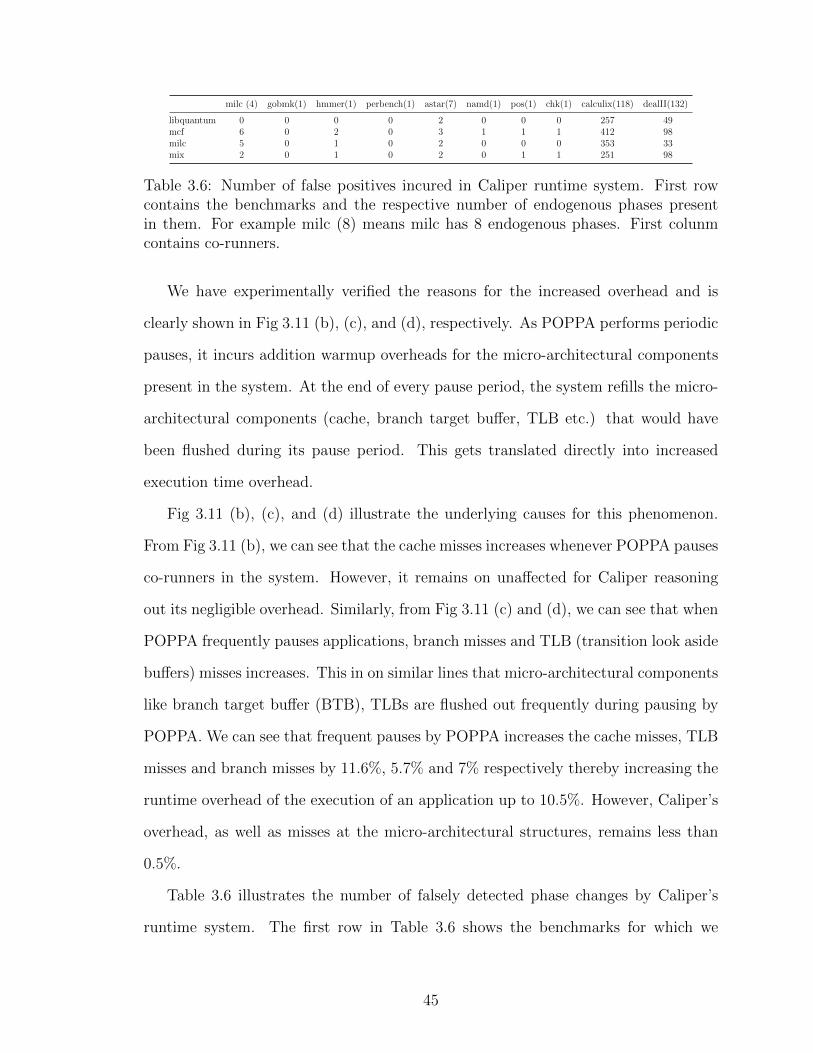
milc (4) gobmk(1) hmmer(1) perbench(1) astar(7) namd(1) pos(1) chk(1) calculix(118) dealII(132)
libquantum 0 0 0 0 2 0 0 0 257 49mcf 6 0 2 0 3 1 1 1 412 98milc 5 0 1 0 2 0 0 0 353 33mix 2 0 1 0 2 0 1 1 251 98
Table 3.6: Number of false positives incured in Caliper runtime system. First rowcontains the benchmarks and the respective number of endogenous phases presentin them. For example milc (8) means milc has 8 endogenous phases. First colunmcontains co-runners.
We have experimentally verified the reasons for the increased overhead and is
clearly shown in Fig 3.11 (b), (c), and (d), respectively. As POPPA performs periodic
pauses, it incurs addition warmup overheads for the micro-architectural components
present in the system. At the end of every pause period, the system refills the micro-
architectural components (cache, branch target buffer, TLB etc.) that would have
been flushed during its pause period. This gets translated directly into increased
execution time overhead.
Fig 3.11 (b), (c), and (d) illustrate the underlying causes for this phenomenon.
From Fig 3.11 (b), we can see that the cache misses increases whenever POPPA pauses
co-runners in the system. However, it remains on unaffected for Caliper reasoning
out its negligible overhead. Similarly, from Fig 3.11 (c) and (d), we can see that when
POPPA frequently pauses applications, branch misses and TLB (transition look aside
buffers) misses increases. This in on similar lines that micro-architectural components
like branch target buffer (BTB), TLBs are flushed out frequently during pausing by
POPPA. We can see that frequent pauses by POPPA increases the cache misses, TLB
misses and branch misses by 11.6%, 5.7% and 7% respectively thereby increasing the
runtime overhead of the execution of an application up to 10.5%. However, Caliper’s
overhead, as well as misses at the micro-architectural structures, remains less than
0.5%.
Table 3.6 illustrates the number of falsely detected phase changes by Caliper’s
runtime system. The first row in Table 3.6 shows the benchmarks for which we
45

have evaluated this experiment. We have shown only ten benchmarks in this table
in the interest of space constraints. The numbers present in the bracket after the
benchmarks show the endogenous phase counts (true positives). The first column
shows the co-runners along which the benchmarks present in the first row have been
evaluated. Each cell in table 3.6 illustrates the number of falsely detected phases by
Caliper’s runtime system. From our experiments, we observed that the results for
most of the benchmarks were similar to gobmk, hmmer, namd, pos, chk. There was
just one phase, and Caliper was able to detect that phase. Additionally, detecting
false phases were a rare occurrence consuming negligible overheads. However, we had
a few interesting observations for the benchmarks calculix and dealII. The phases
of these applications are very irregular and contain spikes once every few seconds.
Each of these situations where spikes occur triggers a phase change resulting in a
larger number of false positives. Additionally, another interesting observation from
our experiments was that there were more false positives when mcf was a co-runner.
This is because mcf has many phase changes introducing many more false positives
due to co-phase interference. However, the frequency at which Caliper’s runtime
system triggers phase changes is so low that our overhead remains lesser than 1% for
most of the time.
3.5.4 Leveraging Caliper for Fair Pricing in Datacenters
Infrastructure-as-a-service (IaaS) clouds primarily use a pay-as-you-go pricing
model that charges users a flat hourly fee for running their applications on shared
servers. Customers renting IaaS public clouds now have the capability to choose re-
source fragments at varying granularity in terms of the number of virtual CPUs, the
amount of memory and storage size. Cloud service providers rely on virtualization to
isolate resource fragments belonging to each customer. However, in light of signifi-
cant potential for parallelism, cloud service providers co-locate applications belonging
46

perlb
ench
leslie3d
povr
aylib
quan
tum
asta
rbz
ip2
milc
namd
calculix
h264
ref
gobm
khm
mer
tont
osp
hinx
3ze
usmp
bwav
esgr
omac
sde
alII
sjen
glbm
xalanc
bmk
games
sca
ctus
ADM
soplex
GemsF
DTD
omne
tpp ft bt mg sp ua lu ep cg dc is
gmm
dnn_
asr
surf-
fesu
rf-fd
stem
rege
xcrf
img-im
cim
g-dig
img-face
nlp-po
snlp-ch
knlp-ne
r0.00.51.01.52.02.5
Price
Nor
malized
to
solo
SPEC CPU2006 NAS Parallel Benchmarks Sirius Suite DjiNN & Tonic
POPPA (avg price = 16.78%) Caliper (avg price = 2.47%) Oracle
Figure 3.12: Comparison of fairness in pricing by Caliper with POPPA
to different users. Since the last-level cache and DRAM bandwidth remain shared
among applications running within a single server, applications are slowed down as
compared to when they run alone on the system. This increased execution time that
the application is subjected to reflects directly on the price paid by the users under
the pay-as-you-go scheme creating an unfair pricing scenario.
To enable fair pricing in public clouds, it is essential to estimate the performance
impact that co-running applications have on an application. Identifying slowdown at
runtime would be a very useful information in this regard as it would be an appropriate
indicator of influence of co-runners on an application. Hence, such a scheme can be
used as a critical substrate upon which any pricing scheme can be built. However,
such a scheme is highly dependent on the accuracy at which fairness is estimated.
Hence, achieving high accuracy in estimating slowdown becomes critical.
We compare the unfairness that is present while utilizing the hardware enabled
approaches for pricing with our approach. We define unfairness as the price by which
users are overcharged when they are executing their applications in IaaS public clouds.
We use the pricing model proposed by Toosi et al. [114] and apply the slowdown esti-
mation techniques along with it so as to calculate the resultant price. From Fig 3.12,
we can see that is able to price applications with 5X more fairness while pricing
users using their slowdown model as compared to the POPPA technique proposed in
Breslow et al. [22]
47
CHAPTER IV
Proctor – Detecting and Investigating
Performance Interference in Shared Datacenters
Enterprise datacenters like VMWare, Microsoft, and Amazon often house thou-
sands of servers to service large-scale cloud applications across the globe. Cloud
computing is becoming more common every day and so improving utilization is of
critical importance in terms of improving cost and reducing the footprint of the dat-
acenters [117, 11, 67].
Over past few years, datacenter operators have switched to virtualization, a tech-
nique that encapsulates and abstracts applications from the physical hardware by
creating Virtual Machines (VM), that assists sharing of physical hardware by schedul-
ing multiple VMs on the same physical machine. State-of-the-art VM monitors, also
known as hypervisors, like Xen, Hyper-V and ESXi [124, 118] reserve fragments of
the physical server resources (like CPU core, DRAM storage etc) for each application
separately in a virtualized environment. This abstraction leads to better hardware
utilization, as multiple VMs can now be easily scheduled on the same physical ma-
chine.
However, virtualization does not provide complete performance isolation as VMs
still compete for non-reservable shared resources (like caches, network, I/O bandwidth
etc.), resulting in performance interference between the VMs, which can have signif-
48
icant and unpredictable effects on the application performance. This unpredictable
performance is particularly problematic for user-facing applications that have strict
Quality of Service (QoS) requirements, forcing the datecenter operators to disable
co-location, reducing datacenter utilization. Therefore, data center operators need to
achieve the best of both worlds - satisfy strict QoS requirements while also keeping
server utilization high.
A suitable solution to mitigate the interference problem so that it can take correc-
tive measures later to meet QoS requirement while achieving good server utilization,
needs to perform two major tasks at runtime – Detection and Investigation. First,
when a performance intrusive VM is colocated with an application having strict QoS
requirement and negatively impacts its performance, the technique should be able
to detect this performance degradation. Second, once this performance intrusion
is detected, it is necessary to investigate the source of this contention (both the
performance-intrusive VM and the contended shared resource) to undertake useful
remediation.
In order to detect contention and mitigate the effect of interference, we present
Proctor [62], a runtime system that continuously monitors, automatically detects
and investigates a wide range of performance issues directly affecting the Quality
of Service of VMs running in a cloud scale datacenter, with high accuracy and low
performance overhead. For Detection, Proctor employs a Performance Degradation
Detector (PDD), that continuously monitors the performance metric of the executing
VMs, looking for abrupt changes in the QoS. PDD uses state-of-the-art noise removal
technique (median filtering algorithm) and step detection to detect a performance
anomaly, as opposed to previous work that requires a priori knowledge. For Investi-
gation, Proctor employs Performance Degradation Investigator (PDI), that identifies
the source of contention for a performance anomaly at runtime using online statistical
correlation analysis. The challenge here lies in performing investigation quickly as this
49

process is laborious and requires querying a database consisting of large amounts of
VM monitoring data. To tackle this challenge, PDD uses a robust sub-sampling tech-
nique that reduces the amount of the data that needs to be queried while accurately
detecting the source of contention.
We perform a thorough evaluation of our platform on real systems across a wide
range of applications and commonly contended shared resources, demonstrating its
effectiveness in diagnosing performance issues at runtime, improving the performance
of the applications running in datacenter by up to 2.2×.
4.1 Background and Motivation
In this section, we provide the background for the performance interference for
different sources of contention, followed by the limitations of the prior work in solving
the problem of mitigating interference.
4.1.1 Sources of Contention
Although virtualization reserves fragments of machine resources for each applica-
tion individually, the VMs can still experience performance interference when multiple
VMs are colocated on the same physical machine. This happens because there are
a number of non-reservable resources that can be shared among VMs, that can have
significant and unpredictable effect on the VM performance. In datacenters, there are
mainly four such shared resources - I/O, CPU core, Network and Last Level Cache.
As an example, I/O contention can occur when guest operating system within
each VM is oblivious to the virtual nature of underlying disk and the existence of
neighboring VMs on the same machine. Under such situations, a single badly be-
haved application that continuously issues frequent I/O requests to a disk array can
disrupt the latency/throughput of every other application running over that array,
negatively impacting the performance of other VMs. Similarly, such performance
50

intrusive behavior can happen at other hardware resources like CPU core, Network
and Last Level Cache.
4.1.2 Limitations of Prior Work
There exists several prior approaches that are specifically designed to mitigate
the effects of contention when multiple VMs are consolidated in a shared datacenter.
However, these approaches have some limitations that restrict their deployability in
a commercial datacenter. We have broadly classified them under the following three
categories based on their limitations towards solving the Detection and Investigation
problems.
1. Require A Priori Application Profile. Prior approaches like Bubble-Up
and Cuanta [37, 72] have been shown to be effective at generating a precise esti-
mation of performance degradation at co-located execution scenarios. However,
these techniques require a priori knowledge of application behavior restrict-
ing their deployability in datacenters that encounter unknown applications on
a regular basis (for eg., private datacenters and public clouds). Additionally,
these techniques are incapable of investigating the root cause of performance
intrusion. Therefore, this category is unsuitable to perform Detection and In-
vestigation tasks in datacenters that encounter unknown applications.
2. Incapable of Investigating Root Cause. Second category of prior ap-
proaches [103, 38], that do not require a priori knowledge, focus on investi-
gating a particular source of contention, unable to detect and mitigate the
performance interference caused by other shared resources. In addition, the
overhead incurred by these techniques in detecting performance degradation is
high because their methodology perturbs the execution of VMs periodically for
brief periods of time in order to profile application execution. Therefore, this
51

class of prior work is also unsuitable because of its high overhead in performing
Detection task and their disability to execute the Investigation task.
3. Performs VM Migration/Cloning. A third class of approaches, identifies
performance intrusion as well as its root causes. However, these techniques per-
form frequent VM migration and cloning, resulting in many drawbacks. First,
copying huge data across machines is time consuming and introduces additional
contention on the computing resources. Second, the overhead with respect to the
number of additional servers required to perform these techniques is very high.
Therefore, this category of prior work is also not suitable in shared datacenters
as they incur high overheads while executing the Detection and Investigation
tasks.
4.2 Overview of the Proposed Approach
To this end, we present Proctor [62], a runtime system that utilizes a two step
methodology to solve the Detection and Investigation tasks respectively. In this
section, we provide a high level overview of our technique along with the challenges
in designing Proctor components.
4.2.1 Goals and Challenges
Performing Detection. Proctor utilizes Performance Degradation Detector (PDD)
for this purpose. In contrast to prior approaches which affect the execution of ap-
plication by utilizing synthetic benchmarks like smashbench, PDD is an extremely
low overhead continuous monitoring infrastructure that observes individual VM QoS
metric to detect drastic variation in the numerical range of the QoS metrics. This
change would be an indication of an event that signifies performance degradation of
the application. To detect drastic variation in numerical range of metrics, we employ
52

step detection – a signal processing technique that is utilized to find abrupt changes
in time series signals [85].
Challenges and Approach – However, the time series data obtained from system soft-
ware tools and performance counters is highly corrupted due to noise. The most
straightforward solution for such problems is to perform curve smoothing. However,
the most commonly used curve smoothing techniques, like exponential moving aver-
age and Kalman filter [121], are not effective in highlighting drastic changes in the
time series data. This is because they project drastic changes in QoS measurements
as a slow cumulatively occurring event, making it hard to detect the abrupt changes.
Hence, we used a technique called median filtering designed specifically to cater to
the step detection problem.
Performing Investigation. Once, PDD establishes the existence of performance
degradation, we utilize the Performance Degradation Identifier (PDI) to pinpoint
the exact source of contention (both VM and the shared resource the applications
are competing for). PDI uses correlation analysis for this purpose, finding correlation
between the hardware counter metrics of all the co-running VMs and the primary QoS
metric of the affected VM (as detected by PDD). High value of correlation co-efficient
for a particular metric provides sufficient evidence that the co-running VM and the
resource corresponding to that metric is the root cause of performance degradation.
Challenges and Approach – However, performing correlation analysis on large amounts
of HW performance counter data, which is collected at a second level granularity, is
computationally intensive, resulting in high performance overhead. To tackle this
problem, we sub-sample the performance counter data, reducing the amount of data
that is to be utilized to find the source of contention. A random sub-sampling method
can be utilized for this purpose. However, it becomes crucial that the obtained sample
should be a good representation of the population from which it is drawn, as biased
samples can lead to inaccuracy in performing Investigation. To address this challenge,
53

VM
VM
01
1
0
000
1
1
1
0
1
10
0
0
1
01
0
01
0
1010
1
0
0
1
0
1
11
0
1
1
10
1
00
000
0
1
01
0
1
0
1
00
1
0
10 1
1
1
0
1
110
10
0
0
0
0 1 01
0
1
0
1
10
1
01
1
1
0
1
1
10
10
0
0
00
01
0
00
1
1
0
11
11
0
10
0
0
0
0
0
1
11001
11 1
10101
1010
10
1
0
1100
1010
0101
1 100
10
00
0 0100
10100
01111000
1
0
1
10
01
100
0
1
0
0
1
0 101
0
0
0
11
1
1
1
1
1
0
000
1
0000 1
1
1
0
110
1
0
0
0
10
0
00
0
0
1
0
01
100
0
1
0
0
11
1
1
10
0
0 11
10
1
00
0
0
0
1
1
1
0
0
0
01
11
0
Step1:PerformanceDegradation
Detection(PDD)
Step2:PerformanceDegradation
Identification(PDI)
t1
QoS
Input
ChangeS Investigator
performance issue at t1
t0
0.01 0.02 0.01 0.03 0.01 0.02 0.57 3.32 10.7 4.73 0.01
performance issue
(b) Moving Window
t2
(a) CSI Flow
1.71 1.72 1.71 1.73 1.71 1.72 1.71 1.73 8.528.52 8.51 8.55 8.52 8.51
t1
QoS
Input
ChangeS Investigator
performance issue at t1
t0
0.01 0.02 0.01 0.03 0.01 0.02 0.57 3.32 10.7 4.73 0.01
performance issue
(b) Moving Window
t2
(a) CSI Flow
1.71 1.72 1.71 1.73 1.71 1.72 1.71 1.73 8.528.52 8.51 8.55 8.52 8.51
VM
stepdetection
Sub-sampling
VM
VMVM
VM
VM
VM
VM
IntrusiveVM
Figure 4.1: Proctor System Architecture - a two-step process performing Detectionand Investigation to identify the root cause of performance interference [62]
we validate each sample by utilizing hypothesis testing techniques. As our time series
measurements do not follow the guassian curve, we use a non-parametric statistical
hypothesis testing technique called χ2 test to ensure that the sub-sampled data is a
good representation of the original performance counter data [130].
4.3 Proctor Architecture
Proctor is a dynamic runtime system that automatically detects performance in-
trusive VMs in the datacenters, their victims and the shared resource that is causing
contention, with high accuracy and low overhead. In order to achieve this, Proctor
utilizes a two step approach as shown in Figure 4.1. The first step, PDD, detects
performance degradation caused due to performance intrusive VMs. The second step
PDI, pinpoints the root cause by identifying the exact VM that is responsible for the
performance intrusion and the corresponding metric for which there is contention.
This section elaborates in detail the key components present in Proctor’s design.
54

t1Q
oS PDD performance
issue at t1
t2
VM
stepdetection
t0
Figure 4.2: PDD detects abrupt performance variations in the application telemetrydata
4.3.1 Performance Degradation Detector
Proctor utilizes (PDD) that operates in parallel with applications, continuously
monitoring and looking for performance anomalies in the dataceters at runtime. It
utilizes time series measurements of the primary QoS metric of each application ex-
ecuting inside a VM to detect drastic variation in the numerical range of metrics.
This drastic variation acts as an indication of an event that the performance of the
application has degraded significantly.
PDD employs a signal processing technique called step detection to detect these
abrupt changes in the application performance [85, 93]. However, time series perfor-
mance data of an application has high amount of noise, causing many false alarms if
step detection is applied naively. We use Median filtering algorithm [23] to reduce the
noise in the telemetry data, making PDD accurate in detecting performance anoma-
lies. In the next two subsections, we will elaborate on the step detection and median
filtering techniques.
4.3.1.1 Step Detection
Step detection is a process of finding abrupt changes in a time series signal [85, 93].
Using the time series measurements of the primary QoS metrics, we try to identify
55

0.01 0.01 0.02 0.01 0.01 0.01 0.02 6.79 0.01 0.04
performance issue
1.71 1.72 1.71 1.73 1.71 1.72 1.71 1.73 8.52 8.51 8.55 8.52 8.51
Y1 Y2 Y3 Y4 Y5 Y6 Y7 Y8 Y9 Y10 Y11 Y12 Y13
Y'1 Y'2 Y'3 Y'4 Y'5 Y'6 Y'7 Y'8 Y'9 Y'10
QoSmetric
finitedifference
Figure 4.3: PDD Step Detection using Finite Difference Method
the exact timestamp at which abrupt changes occur in the numerical quantity of
primary QoS metric. An abrupt change is statistically defined as a point in time
where the statistical properties before and after this time point differ significantly.
This is clearly illustrated by Figure 4.2 where we can see a sharp increase in the QoS
metric at time t1. The role of PDD here is to detect such abrupt changes at runtime
and identify the exact timestamp at which such abrupt changes occur. We utilize
finite difference method for this purpose.
The fundamental hypothesis of finite difference method towards identifying abrupt
changes is based on the fact that the absolute difference between subsequent time
series measurements is very high at the exact point where the abrupt changes occur.
This can be utilized to highlight the timestamp at which these abrupt changes occur.
Mathematically, finite difference of a time series signal is the rate of change in
the individual elements in the time series. We implement finite difference method
by performing pair wise difference of subsequent elements present in the time series
using the following formula :-
Y ′ =Yj+1 − Yj
2∆TY ′j = Yj (for 1 < j < n− 1)
where Yj is the jth points present in the time series, n being the number of points,
∆T being the difference between the X values of adjacent data points (difference in
56

0 100 200 300 400 500 600
Execution Time
50
100
150
200
250
300
I/O
Late
ncy
I/O latency TPC-C
0
1
2
3
4
5
6
7
8PDD
(a) no noise removal
0 100 200 300 400 500 600
Execution Time
2550
100150200250300250400
I/O
Late
ncy
I/O latency TPC-C
024681012141618
PDD
(b) exponential moving average
0 50 100 150 200 250 300 350 400Execution Time
050
100150200250300350
I/O L
aten
cy
I/O latency TPC-C
2000200400600800100012001400
Performance Degradation Detector (PDD)
(c) median filtering
Figure 4.4: Comparison of detection accuracies (a) without noise removal, (b) withexponential moving average and (c) with median filtering for the application TPC-C.Median filtering algorithm detects abrupt changes in performance
the number of timestamps for time series values). The result highlights the drastic
change by showcasing a high value for Y ′. This is clearly illustrated by Figure 4.3
where we can see a sharp increase in the QoS metric at time t1 at the point Y9. Its
corresponding finite differential value is very high at point Y ′9 , which is utilized to
indicate performance degradation at that timestamp t1.
4.3.1.2 Noise Reduction
Naively applying step detection leads to large number of false positives because
of the noise in the time series measurements of QoS metric. For example, we directly
apply the step detection algorithm for TPC-C benchmark and show the detected
57

performance anomalies in Figure 4.4a. The figure shows that there are large number
of false alarms.
In order to eliminate the noise present in the raw time series measurements, we
tried to utilize the state-of-the-art curve smoothing techniques like exponential mov-
ing average and kalman filter [66]. However, these techniques still show significantly
high number of false positives. This is because these techniques end up smooth-
ing out drastic changes in time series measurements, projecting them as a slow and
cumulatively occurring event as shown in Figure 4.4b, failing to detect the drastic
performance degradation.
To tackle this problem, we use median filtering for noise reduction as this technique
preserves drastic changes. Our implementation of median filter consists of a moving
window that selectively discard elements that are significantly higher than the median
within that window. This preserves drastic changes while also removing noise from
the time series measurement. Finally, Figure 4.4c shows the effectiveness of applying
median filtering for noise reduction, reducing number of false alarms and making
PDD highly accurate.
4.3.1.3 Obtaining QoS Measurements
The presence of virtualization in datacenter infrastructures introduces challenges
towards obtaining application specific QoS metrics. Applications often run as per-
formance black-boxes and adaptive services must infer application performance from
low-level information or rely on system-specific ad hoc methods. Although this is
not a challenge for CPU intensive batch applications and I/O intensive applications
as their respective QoS metrics can be obtained through performance counters and
system software tools, a class of user facing latency critical applications that run
as performance black-boxes, provide very little information about their current per-
formance and no information about their performance goals (eg. 99th percentile tail
58

Name Descriptionload Input load of applicationCPU util CPU utilization of apppage-faults Page faults per sec of appcontext-switches Context switches per sec of appn/w throughput Total bytes sent and received by networkcache-misses Total cache misses (L1,L2 and LLC)I/O requests Total I/O requests ( read + write)branch-misses No. of branch mispredictions of app
Table 4.1: List of metrics utilized for performing correlation with the primary QoSmetric to identify source of contention
latency). The primary goal in such situations is to offload the responsibility of provid-
ing time series measurements corresponding to the QoS metrics of an application to
the user. For this purpose we utilize the the Application Heartbeats framework [50]
which provides a simple, standardized way for applications to report their perfor-
mance/goals to external observers. These are enabled through API calls consisting
of a few functions that can be called from applications or through system software.
This is being utilized to track the progress of any executing application which is fed
into our proposed PDD for identifying performance intrusion during runtime.
4.3.2 Performance Degradation Investigator
Once PDD establishes the existence of performance degradation, Performance
Degradation Investigator (PDI) is invoked for further analysis which pinpoints per-
formance intrusive VMs and the major server resource that is causing the performance
degradation.
4.3.2.1 Correlation Based Root Cause Identification
PDI identifies performance intrusive VMs and the major server resource causing
contention by utilizing a correlation based root cause identification technique. The
primary objective of correlation based root cause identification is to highlight the root
59

cause VM and the metrics corresponding to it that correlate highly with the primary
QoS metric of the affected VM. In order to obtain that, PDI utilizes the time series
measurements from each low level metric corresponding to the co-running VM and
tries to correlate them with the time series measurements of the affected VM’s primary
QoS metric. The metrics having the highest value of correlation coefficient are the
most highly likely indicators of resource contention and its corresponding VMs are
the most likely culprits for creating performance intrusion. The list of metrics that we
try to correlate is enumerated in Table 4.1. Our implementation of correlation tries to
obtain Pearson’s correlation coefficient [17]. However, performing correlation analysis
on the complete telemetry data causes high performance overhead. Therefore, we sub-
sample the complete dataset and reduce the time to find the source of contention.
4.3.2.2 Real Time Sub-sampling
One of the key challenges faced by Proctor while realizing a real time solution is the
large amount of telemetry data that needs to be queried, resulting in high performance
overhead. Hence, instead of performing correlation analysis on full telemetry data,
we utilize a sub-sampling technique where a sample from a large data is utilized as
input to PDI.
The key objective to be satisfied while realizing a sub-sampling technique is that
the statistical characteristics of the sample should be consistent with that of the
population. For example, measurements obtained from system software tools are
bound to contain extreme values (spikes) at a very low frequency. The sub-sample
that we collect should include these events as well. To ensure that, we perform a
hypothesis testing to check whether the random sample that we select is representative
enough of the population. If not, our hypothesis testing techniques repeats the process
by randomly selecting a sample till it is representative enough of the population.
Most widely used hypothesis testing techniques assume population to be normally
60

distributed. However, based on our experiments we have observed that measurements
that come from system software tools and performance counters are highly deviated
from being normally distributed. Therefore, widely used parametric hypothesis test-
ing techniques like t-test and F-test are not suitable for our purpose.
Hence, we use non-parametric hypothesis testing approaches that are capable
of testing samples irrespective of their nature (being normally distributed). Unlike
parametric statistics which primarily utilize mean and variance for this purpose, non-
parametric statistics make no such assumptions on the probability distributions of the
variables being assessed. Therefore, we utilize Pearson’s Chi-Squared test for testing
whether a sample is representative of a population [128].
Chi-square χ2 test is a statistical test used to examine differences within cat-
egorical variables [128]. For time series data, we have taxonomized categories as
numerical ranges within which measurements from system software tools and per-
formance counters can fall into. In other words, we segregate the population data
into different categories where each category refers to a specific range of numerical
quantities. Subsequently, we classify the sample data also into the same categories as
the population. We now obtain the frequency of elements present in each category
for both the sample and population data. For the sample data to be acceptable,
the frequency of elements of the sample data in each category should be close to the
frequency of elements of the population data in the same category. Chi squared test,
compares the frequency of elements of sample and population data in every category
to determine the sample’s acceptability
Input. Frequencies of population measurements and sample measurements lying in
each range.
Output. Accept/Reject sample to be representative of a population.
Methodology. We undertake the following steps to perform Chi-square χ2 test.
1. We identify the frequency of entities that belong to every range for the sample
61
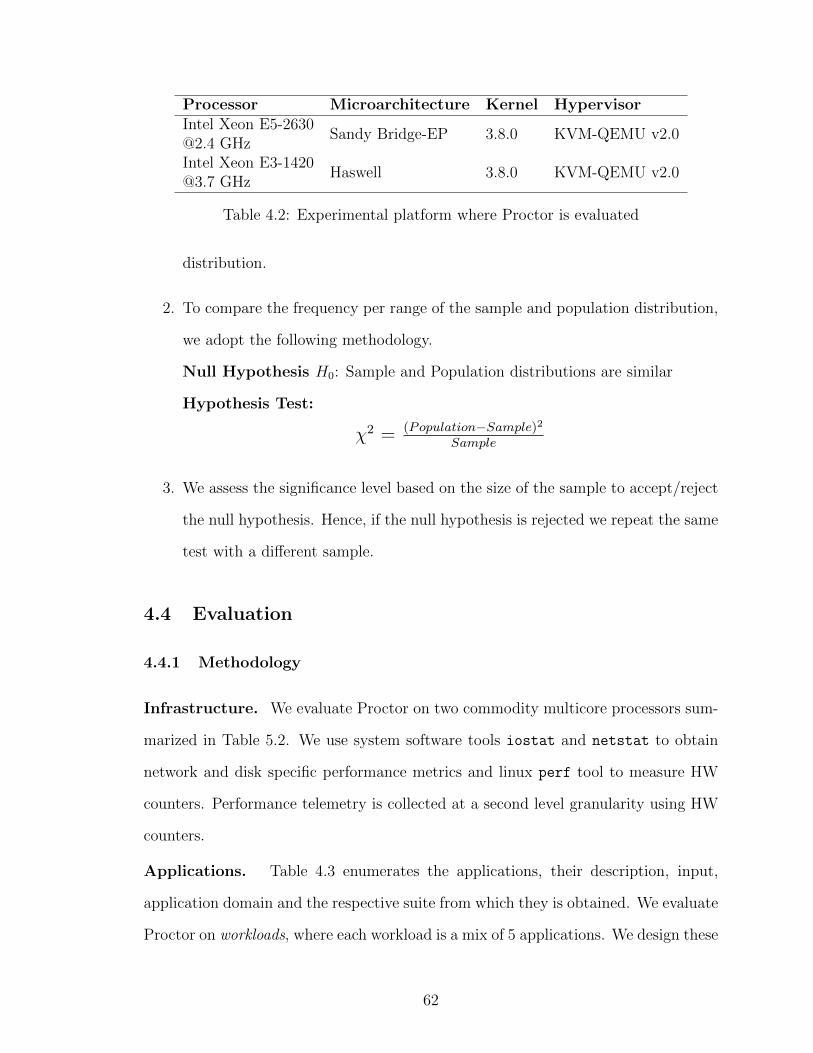
Processor Microarchitecture Kernel HypervisorIntel Xeon [email protected] GHz
Sandy Bridge-EP 3.8.0 KVM-QEMU v2.0
Intel Xeon [email protected] GHz
Haswell 3.8.0 KVM-QEMU v2.0
Table 4.2: Experimental platform where Proctor is evaluated
distribution.
2. To compare the frequency per range of the sample and population distribution,
we adopt the following methodology.
Null Hypothesis H0: Sample and Population distributions are similar
Hypothesis Test:
χ2 = (Population−Sample)2
Sample
3. We assess the significance level based on the size of the sample to accept/reject
the null hypothesis. Hence, if the null hypothesis is rejected we repeat the same
test with a different sample.
4.4 Evaluation
4.4.1 Methodology
Infrastructure. We evaluate Proctor on two commodity multicore processors sum-
marized in Table 5.2. We use system software tools iostat and netstat to obtain
network and disk specific performance metrics and linux perf tool to measure HW
counters. Performance telemetry is collected at a second level granularity using HW
counters.
Applications. Table 4.3 enumerates the applications, their description, input,
application domain and the respective suite from which they is obtained. We evaluate
Proctor on workloads, where each workload is a mix of 5 applications. We design these
62

Application DescriptionBenchmark
SuiteQoS Metric
CPU /
LLC
lbm Fluid Dynamics
SPEC
CPU2006IPC
libquantum Quantum Computing
omnetppDiscrete Event
Simulation
sphinx3 speech recognition
CPU /
LLC
Naive Bayes Big data classification
Big Data
BenchIPC
Sort Sort words from text
Grep Search words from text
Word Count Count words from text
KmeansProcessing facebook
network
I/O
YCSBQuerying from Yahoo
datasetOLTP
bench
I/O latency
and throughput
TPC-CQuerying from retail
databaseI/O latency
TPC-HQuerying from business
databaseI/O latency
Twitter Querying from tweetsI/O latency
and throughput
NetworkRedis Key value store Redis Tail Latency
netperfNetwork packet
generatornetperf
network
throughput
Table 4.3: Benchmarks which have been used to evaluate Proctor and its descriptions
workloads in a careful manner to study different types of resource contention. 4 out of
5 applications in a workload are chosen in a manner that they put stress on the four
shared resources - I/O, network, CPU core and LLC. Once these four applications
are executing, arrival of fifth application now causes contention for the resource it
uses heavily. Table 4.4 illustrates the workload mixes that we have considered in our
evaluation. Workloads are executed for a period of one hour where each application
63

WorkLoad ID
App 1 -Main app
App 2 -Colo app
App 3 -Colo app
App 4 -Colo app
App 5 -problematic app
Network WL1 Redis Search lbm Sort netperf
DiskI/O
WL2 Twitter lbm Redis Sort YCSBWL3 TPC - C libquantum Redis Grep Random I/OWL4 YCSB sphinx3 Redis Word Count TPC - HWL5 TPC - H lbm Redis K-Means YCSB
CPUWL6 Naive Bayes libquantum Redis lbm Page RankWL7 Grep TPC-C Redis sphinx3 SortWL8 lbm TPC-H Redis Sort libquantum
LLCWL9 omnetpp TPC-H Redis Word Count lbmWL10 libquantum Random I/O Redis Grep povrayWL11 Redis povray Redis povray libquantum
Table 4.4: Workload scenarios that have been created from the benchmarks to eval-uate Proctor
is introduced after a period of 12 mins.
4.4.2 Proctor Accuracy
We first evaluate end to end accuracy of Proctor in detecting and investigating
the source of contention. In this experiment, we execute all the workloads and check
whether Proctor is able to detect and identify the source of contention correctly. The
findings of this experiment are presented in Figure 4.5, showing the true positive
and the false positive rates across our workloads.True positives are the situations
during which Proctor identifies performance intrusion when it exists. False positives
are the situations during which Proctor identifies performance intrusion when there
aren’t any. In this graph, false positives represent the percentage of falsely identified
metrics compared to the total number of metrics present.
We observe that Proctor detects the interference and investigates its root cause
for all the workloads, whenever a performance intrusive VM is introduced into the
system, as shown by 100% true positives. In additional, Proctor shows low false
positive rate with an average of 8% across our workloads. This experiment show
that Proctor is accurate in detecting and investigating the source of a performance
64

WL1 WL2 WL3 WL4 WL5 WL6 WL7 WL8 WL10 WL11 avg0
20
40
60
80
100
Perc
enta
ge
Networkcontention I/O contention core sharing LLC contention
True Positives False Positives
Figure 4.5: Percentage of true and false positives while utilizing Proctor to detectperformance issue and identify its root cause.
anomaly, and is fully capable of guiding the remediation techniques for mitigating
the performance interference. We now show evaluate the two components of Proctor
in more detail.
4.4.3 Detection of Performance Interference
In this section, we evaluate the accuracy and performance of Proctor Performance
Degradation Detector (PDD).
Accuracy. One of the main reasons for Proctor’s accuracy is its robustness in
performing the Detection task by PDD. The median filtering technique is highly
effective in minimizing the false positives in detecting performance intrusion. Here, we
compare the false positive rate for median filtering against state-of-the-art exponential
moving average curve smoothing technique. In this experiment, we measure the false
positives for both the techniques just for detecting the performance anomaly across all
our workloads. The findings of this experiment are presented in Figure 4.6, showing
the number of false positives for both the techniques.
The figure shows that the average number of false positives is around 10× lesser
for median filtering as compared to exponential moving average. This is because
exponential moving averages are highly affected by extreme values, as described in
65

Section 4.3.1.2, misinterpreting such noisy events as the performance degradation
events. However, median filtering discards such extreme values, thereby reducing the
error rate.
Performance. The computational time required for PDD is extremely negligi-
ble. The functionalities can be broken down into performing two tasks :- 1) a single
subtraction per second per VM for performing step detection and 2) sorting and dis-
carding outliers once in every 30 seconds per VM for performing median filtering.
Therefore, PDD has minimal performance impact on VM performance.
4.4.4 Investigating the Performance Degradation
In this section, we evaluate the efficiency of Proctor’s Performance Degradation
Investigator, in pinpointing the root cause of performance degradation, towards iden-
tifying both the VM causing the performance degradation (referred to as contentious
VM) and the shared resource for which the applications are competing. In this ex-
periment, we execute each workload with the Proctor runtime system, enabling PDI
to investigate performance anomalies. Here, we first show how the QoS metric of
VMs affected on the arrival of a contentious VM. The QoS metric of the contentious
VM would correlate with the QoS metric of the affected VM. Second, we enumerate
the correlation coefficients obtained from correlating the HW performance counter
measurements of the contentious VM and the QoS metric of the affected VM. Due
to lack of space, we show the results for only 4 workloads, covering the four shared
resources most commonly contended in datacenters - Network, I/O, CPU and Last
level cache (LLC). The findings of this experiment are presented in 4.7. We show
all the five applications only for workload WL1, but show only the contentious and
affected VMs for the rest of the workloads for clarity. We now present the evaluation
for each source of contention in detail.
Network Contention. We use setup present in WL1 to study network contention,
66
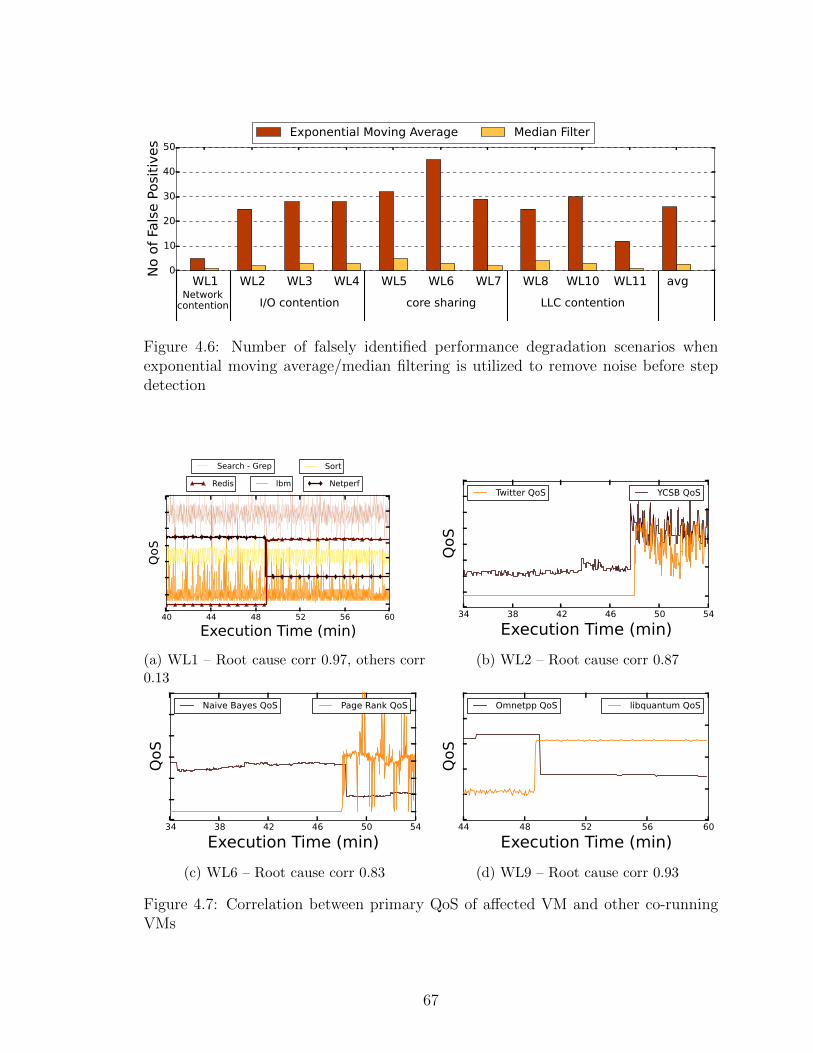
WL1 WL2 WL3 WL4 WL5 WL6 WL7 WL8 WL10 WL11 avg0
10
20
30
40
50No
of False Positives
Networkcontention I/O contention core sharing LLC contention
Exponential Moving Average Median Filter
Figure 4.6: Number of falsely identified performance degradation scenarios whenexponential moving average/median filtering is utilized to remove noise before stepdetection
Search - Grep
lbm
Sort
40 44 48 52 56 60
Execution Time (min)
QoS
NetperfRedis
(a) WL1 – Root cause corr 0.97, others corr0.13
34 38 42 46 50 54
Execution Time (min)
QoS
YCSB QoSTwitter QoS
(b) WL2 – Root cause corr 0.87
34 38 42 46 50 54
Execution Time (min)
QoS
Naive Bayes QoS Page Rank QoS
(c) WL6 – Root cause corr 0.83
44 48 52 56 60
Execution Time (min)
QoS
Omnetpp QoS libquantum QoS
(d) WL9 – Root cause corr 0.93
Figure 4.7: Correlation between primary QoS of affected VM and other co-runningVMs
67
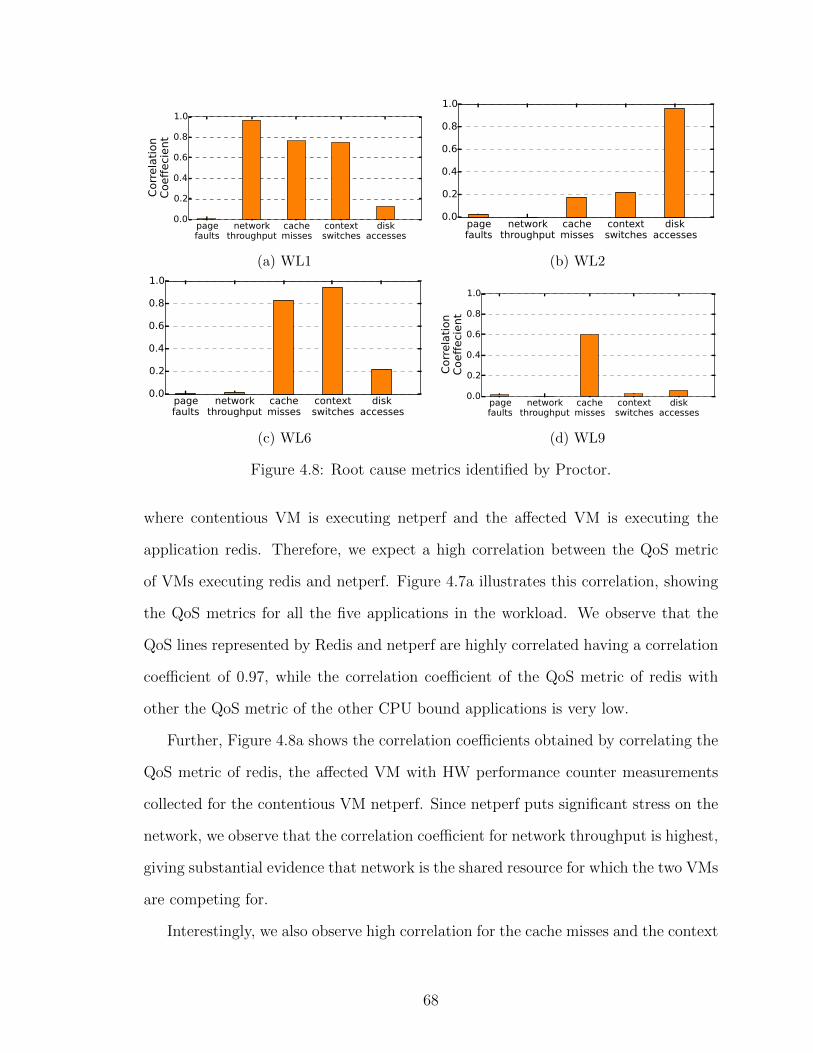
pagefaults
networkthroughput
cachemisses
contextswitches
diskaccesses
0.0
0.2
0.4
0.6
0.8
1.0
Corre
latio
nCo
effecien
t
(a) WL1
pagefaults
networkthroughput
cachemisses
contextswitches
diskaccesses
0.0
0.2
0.4
0.6
0.8
1.0
(b) WL2
pagefaults
networkthroughput
cachemisses
contextswitches
diskaccesses
0.0
0.2
0.4
0.6
0.8
1.0
(c) WL6
pagefaults
networkthroughput
cachemisses
contextswitches
diskaccesses
0.0
0.2
0.4
0.6
0.8
1.0
Corre
latio
nCo
effecien
t(d) WL9
Figure 4.8: Root cause metrics identified by Proctor.
where contentious VM is executing netperf and the affected VM is executing the
application redis. Therefore, we expect a high correlation between the QoS metric
of VMs executing redis and netperf. Figure 4.7a illustrates this correlation, showing
the QoS metrics for all the five applications in the workload. We observe that the
QoS lines represented by Redis and netperf are highly correlated having a correlation
coefficient of 0.97, while the correlation coefficient of the QoS metric of redis with
other the QoS metric of the other CPU bound applications is very low.
Further, Figure 4.8a shows the correlation coefficients obtained by correlating the
QoS metric of redis, the affected VM with HW performance counter measurements
collected for the contentious VM netperf. Since netperf puts significant stress on the
network, we observe that the correlation coefficient for network throughput is highest,
giving substantial evidence that network is the shared resource for which the two VMs
are competing for.
Interestingly, we also observe high correlation for the cache misses and the context
68

switches. Upon further investigation, we found the when netperf starts executing,
its CPU based telemetry like cache misses and context switches start giving non-
zero measurements compared to zero measurements when it was idle. This directly
correlates with the primary QoS metric of the affected VM. As Proctor only looks
at the most correlated metric (network throughput in this case), these false positives
are ignored while performing the investigation.
I/O Contention. We use the scenario exhibited by WL2 to study Disk I/O con-
tention. Here, Twitter, an I/O latency critical application, is being affected and
Yahoo Cloud Serving Benchmark (YCSB) is the contentious application both run-
ning in virtualized environments. Therefore, we expect the QoS metric of YCSB to
correlate with QoS metric of Twitter application.
We show this correlation in Figure 4.7b. YCSB, being an I/O intensive appli-
cation, increases the latency of the Twitter drastically. This is because the I/O
requests of the throughput intensive I/O applications pollute the I/O queue present
in the disk, increasing the access time of the latency critical I/O applications. There-
fore, we observe high correlation coefficient of 0.87 between the QoS metrics of YCSB
and Twitter application.
Since both are I/O critical applications, sending a large number of disk requests,
we expect the I/O to the be shared resource that VMs are competing for. Figure 4.8b
shows this investigation where the disk accesses are highly correlated with the QoS
of the Twitter application. In this manner, PDI correctly identifies the contentious
VM and the shared resource for I/O intensive applications.
CPU Core Sharing. We use the setup present in WL6 for studying contention
due to CPU core sharing. In this workload, Naive Bayes is the affected VM and Page
Rank is the contentious VM. When a VM executing Naive Bayes is consolidated with
a VM executing Google Page Rank in the same physical core, the IPC of Naive Bayes
is affected as both of them are CPU intensive and end up time sharing the CPU core.
69
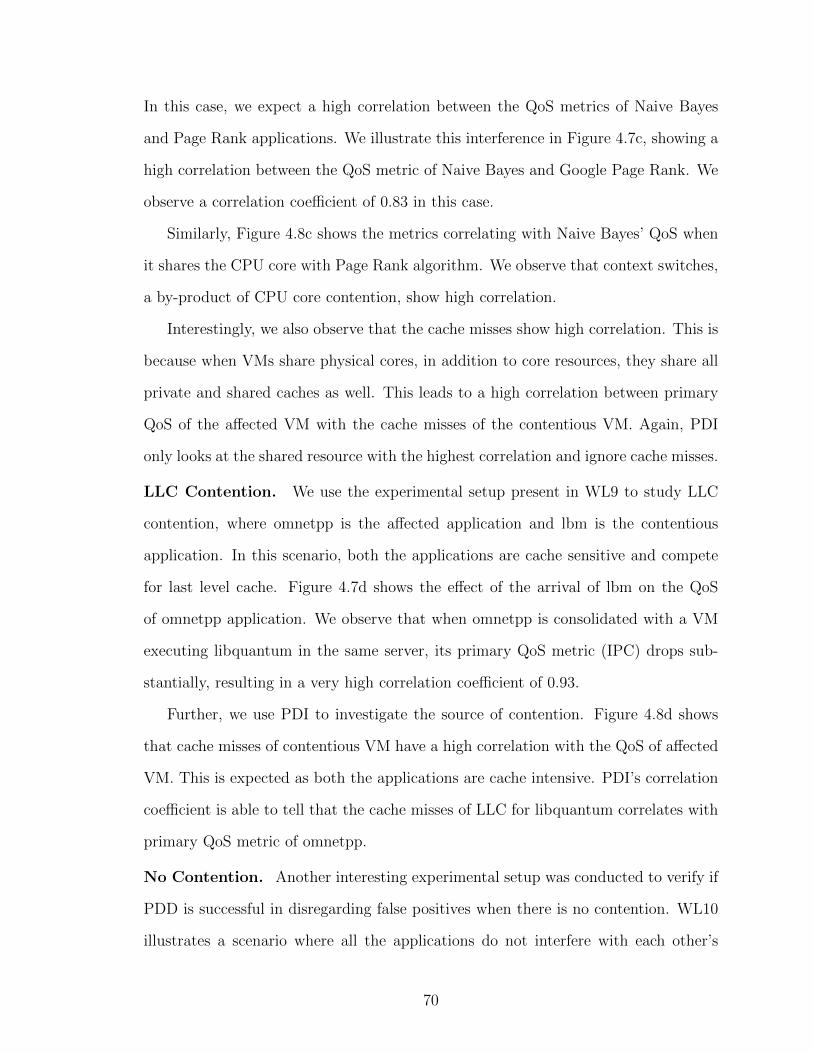
In this case, we expect a high correlation between the QoS metrics of Naive Bayes
and Page Rank applications. We illustrate this interference in Figure 4.7c, showing a
high correlation between the QoS metric of Naive Bayes and Google Page Rank. We
observe a correlation coefficient of 0.83 in this case.
Similarly, Figure 4.8c shows the metrics correlating with Naive Bayes’ QoS when
it shares the CPU core with Page Rank algorithm. We observe that context switches,
a by-product of CPU core contention, show high correlation.
Interestingly, we also observe that the cache misses show high correlation. This is
because when VMs share physical cores, in addition to core resources, they share all
private and shared caches as well. This leads to a high correlation between primary
QoS of the affected VM with the cache misses of the contentious VM. Again, PDI
only looks at the shared resource with the highest correlation and ignore cache misses.
LLC Contention. We use the experimental setup present in WL9 to study LLC
contention, where omnetpp is the affected application and lbm is the contentious
application. In this scenario, both the applications are cache sensitive and compete
for last level cache. Figure 4.7d shows the effect of the arrival of lbm on the QoS
of omnetpp application. We observe that when omnetpp is consolidated with a VM
executing libquantum in the same server, its primary QoS metric (IPC) drops sub-
stantially, resulting in a very high correlation coefficient of 0.93.
Further, we use PDI to investigate the source of contention. Figure 4.8d shows
that cache misses of contentious VM have a high correlation with the QoS of affected
VM. This is expected as both the applications are cache intensive. PDI’s correlation
coefficient is able to tell that the cache misses of LLC for libquantum correlates with
primary QoS metric of omnetpp.
No Contention. Another interesting experimental setup was conducted to verify if
PDD is successful in disregarding false positives when there is no contention. WL10
illustrates a scenario where all the applications do not interfere with each other’s
70

0% 20% 10% 6.5% 4%Sampling rate
0
1
2
3
4
5
% of total serve
rs Servers
0
2
4
6
8
10% Error
Error
Figure 4.9: No. of Proctor servers required to handle 12800 VMs
performance. In such scenarios, PDD did not trigger a performance degradation at
all. This shows the robustness of our technique in disregarding false positives.
These experiments show that PDI is accurate in investigating the source of con-
tention across a wide range of shared resources.
4.4.5 Scalability
One of the key goals of Proctor is to provide a datacenter wide solution towards
identifying performance intrusion. In this section, we study how Proctor scales in a
large datacenter. In particular, we evaluate the benefits of subsampling when scaled
and show that there is a minimal loss in the accuracy of detecting performance in-
trusive VMs when a sub-sampled data is utilized by Proctor.
For this evaluation, we simulate an environment similar to a datacenter setup
capable of executing up to 12800 VMs simultaneously while utilizing 2560 nodes. For
this experiment, we collect telemetry data obtained from multiple executions runs
for the workload scenarios enumerated in 4.3. We then extrapolate the telemetry to
obtain data nearly equivalent to the amount of data that is being collected at large-
scale data centers. PDI then queries the large-scale telemetry data to identify the
71

source of contention. In this experiment, we start with no sampling and then increase
the rate of subsampling, calculating the number of servers required to address the PDI
requests from 12800 VMs. The findings of this experiment are presented in Figure 4.9,
showing the impact of subsampling on datacenter resources (left y-axis).
Our baseline utilizes live telemetry (no sampling) to investigate the root cause of
performance intrusion. We observe that the size of telemetry data for 12800 VMs that
have been executing for an hour is around 91 GB. The baseline requires 50 servers (2%
of production datacenters) to keep up with the requests of 12800 VMs. To reduce
the amount of data required for the investigation, PDI uses a robust subsampling
technique, that significantly reduces the server resource requirements. As shown
in the figure, Proctor at 20% sampling requires only 15 machines, as compared to
50 machines with no sampling. This number reduces to just 6 machines with 4%
sampling.
However, aggressive sampling can result in inaccurate results. We show the effect
of sampling rate on accuracy error in Figure 4.9 (right y-axis), where accuracy error is
measured from the difference between the correlation coefficients obtained by querying
the sampled data and corrletaion coefficient obtained from the original data. As shown
in the Figure, no sampling has zero error. We observe that subsampling results in
low error in the investigation process, increasing the error to just 5% and 8% for 20%
and 4.5% samples respectively. In addition, this error gets masked because the VM
or the metric having maximum correlation coefficient stays the same before and after
sampling. We observe diminishing benefits with more aggressive sub-sampling rate.
Hence, we utilize 6.5% sampling as a final parameter for our experiments as it was
the sweet spot optimizing for low error and server count overhead.
72

WL1 WL2 WL3 WL4 WL5 WL6 WL7 WL8 WL10 WL11 avg0.0
0.5
1.0
1.5
2.0
2.5
3.0
Spee
dup
Networkcontention I/O contention core sharing LLC contention
No mitigation Proctor with mitigation
Figure 4.10: Performance improvement due to Proctor runtime system
4.4.6 Putting It All Together
The key use case of Proctor’s detection and investigation technique is mitigate
VMs that are subjected to performance intrusion. In this section, we demonstrate the
benefits brought by Proctor towards this regard. For this study, we couple Proctor’s
detection and investigation methodology with a simple mitigation technique that
migrates the contentious application to another core/physical disk/network channel if
Proctor detects a performance anomaly. Our baseline is a system with no performance
degradation detection and identification mechanism. Speedup is calculated as the
ratio of QoS of the application when its performance is degraded with the QoS of the
application after Proctor mitigates the performance intrusive VM at the point when
PDD detects intrusion. The findings of this experiment are presented in Figure 4.10,
showing the speedup achieved by Proctor for the affected VM as compared to baseline.
We are able to see that in every situation, the presence of Proctor is able to improve
the QoS of the affected VMs. For example, Proctor improves the performance of I/O
and network intensive workloads on an average of about 2×. This is due to the fact
that the latency of I/O intensive workloads are highly affected in many cases due to
intrusion. In situations when CPU cores are being shared, IPC is affected minimum
2×. This is primarily due to context switch overhead when two applications share the
73

same CPU core. On an average, we observe that the presence of Proctor improves
the performance of datacenters by 2.2×.
74

CHAPTER V
GrandSLAm: Guaranteeing SLAs for Jobs at
Microservices Execution Framework
Multi-tenant execution has been explored actively in the context of traditional
datacenters and cloud computing frameworks towards improving resource utiliza-
tion [71, 126, 28, 104]. Prior studies have proposed to co-locate high priority latency-
sensitive applications with other low priority batch applications [71, 126]. However,
multi-tenant execution in a microservice based computing framework would operate
on a fundamentally different set of considerations/assumptions since resource sharing
can now be viewed at a micro-service granularity rather than at an entire application
granularity.
Figure 5.1b illustrates an example scenario in which an end-to-end intelligent per-
sonal assistant (IPA) application shares microservice instances with an image based
querying application. Each of these applications is constructed as an amalgamation of
different microservices (or stages). In such a scenario, requests corresponding to both
the IPA and image querying applications share the natural language understanding
(Stage 2) and question answering (Stage 3) microservices. As a result, the execution
load in these particular microservices increases, thereby causing the latency of query
execution in stages 2 and 3 to increase. This increase in latency at specific stages
affects the end-to-end latency of the IPA application, thereby violating service level
75

0 500 1000 1500 2000 2500 3000 3500 4000Requests served
0200400600800
10001200
Latenc
y
stage 1 stage 2 stage 3 stage 4Image solo Image colo SLA
(a) Image application SLA not violated
App 1I/P
Speech RecognitionNatural Language
UnderstandingQuestion
AnsweringO/P
Object Recognition
App 2I/P O/P
Stage 1 Stage 2 Stage 3 Stage 4
(b) Sharing NLU and QA
0 500 1000 1500 2000 2500 3000 3500 4000Requests served
200400600800
100012001400160018002000
Latenc
y
stage 1 stage 2 stage 3 IPA soloIPA coloSLA
(c) IPA application SLA violated
Figure 5.1: Sharing microservice instances between Image Querying and IntelligentPersonal Assistant applications using microservices execution framework
agreements. This phenomenon is illustrated by Figures 5.1c and 5.1a. The x-axis
represents the number of requests served while the y-axis denotes latency. Horizontal
dotted lines separate individual stages. As can be seen, the QoS violation for the
image querying application 5.1a is small, whereas the IPA application suffers heavily
from QoS violation. However, our understanding of resource contention need not
stop at such an application granularity, unlike traditional private data centers. It can
rather be broken down into contention at the microservice granularity, which makes
resource contention management a more tractable problem.
76

This fundamentally different characteristic of microservice environments motivates
us to rethink the design of runtime systems that drive multi-tenancy in microservice
execution frameworks. Specifically, even in virtualized private data centers, consol-
idation of multiple latency critical applications is limited as such scenarios can be
performance intrusive. In particular, the tail latency of these latency critical applica-
tions could increase significantly due to the inter-application interference from sharing
the last level cache (LLC) capacity and memory bandwidth [71, 126, 132, 73]. Even
in a private datacenter, there is limited visibility into application specific behavior
and QoS which makes it hard to even determine the existence of such performance
intrusion. As a result, cloud service providers would not be able to meet SLAs in such
execution scenarios that co-locate multiple latency critical applications. In stark con-
trast, the execution flow of requests through individual microservices is much more
transparent.
We observe that this visibility creates a new opportunity in a microservice-based
execution framework and can enable high throughput from consolidating the execu-
tion of multiple latency critical jobs, while still employing fine grained task manage-
ment to prevent SLA violations. In this context, satisfying end-to-end QoS merely
becomes a function of meeting disaggregated partial SLAs at each microservice stage
through which requests belonging to individual jobs propagate. However, focusing on
each microservice stage’s SLAs standalone misses a key opportunity, since we observe
that there is significant variation in the request level execution slack among individual
requests of multiple jobs. This stems from the variability that exists with respect to
user specific SLAs, which we seek to exploit.
In this study, we propose GrandSLAm [61], a holistic runtime framework that en-
ables consolidated execution of requests belonging to multiple jobs in a microservice-
based computing framework. GrandSLAm does so by providing a prediction based
on identifying safe consolidation to simultaneously deliver satisfactory QoS (la-
77

tency) while maximizing throughput. GrandSLAm exploits the microservice exe-
cution framework and the visibility it provides, to build a model that can estimate
the completion time of requests at different stages of a job with high accuracy. It
then leverages the prediction model to estimate per-stage SLAs using which it 1) en-
sures end-to-end job latency by reordering requests to prioritize those requests with
low computational slack, 2) batches multiple requests to the maximum extent pos-
sible to achieve high throughput under the user specified latency constraints. It is
important to note that employing each of these techniques standalone does not yield
effective QoS and SLA enforcement. An informed combination of request re-ordering
with a view of end-to-end latency slack and batching is what yields effective QoS
enforcement, as we demonstrate later in the paper.
Our evaluations on a real system deployment of a 6 node CPU cluster coupled with
graphics processing accelerators demonstrates GrandSLAm’s capability to increase
throughput of a datacenter by up to 3× over the state-of-the-art request execution
schemes for a broad range of real-world applications. We perform scale-out studies
as well that demonstrate increase throughput while meeting SLAs.
5.1 Analysis of Microservices
This section investigates the performance characteristics of applications utitlizing
microservice execution frameworks. By utilizing the findings of our investigation, we
develop a methodology that can accurately estimate completion time for any given
request at each microservice stage prior to its execution. This information becomes
beneficial towards safely enabling fine-grained request consolidation when microser-
vices are shared among different applications under varying latency constraints.
78

0 8 16 24 32Sharing degree0
400800
12001600
Latenc
y (m
s)
(a) Latency
0 8 16 24 32Sharing Degree
04080
120160
Throug
hput (q
ps)
(b) Throughput
64 128 256Input Size
0200040006000
Latenc
y (m
s)
(c) Input size
Figure 5.2: Increase in latency/throughput/input size as the sharing degree increases
5.1.1 Performance of Microservices
In this section, we analyze three critical factors that determine the execution time
of a request at each microservice stage: (i) Sharing degree (ii) Input size (iii)
Queuing Delay. For this analysis, we select a microservice that performs image
classification (IMC).
Sharing Degree. Sharing degree defines the granularity at which requests belonging
to different jobs/applications are batched together for execution. A sharing degree of
one means that the microservice processes only one request at a time. This situation
arises where a microservice instance restricts sharing its resources among requests
belonging to other jobs. Requests under this scheme can achieve low latency at
the cost of low resource utilization. On the other hand, a sharing degree of thirty
indicates that the microservice merges thirty requests into a single batch. Increasing
the sharing degree has demonstrated to increase the occupancy/throughput of the
underlying computing platform (especially for GPU implementations). However, it
has a direct impact on the latency of the executing requests as the first request arriving
at the microservice would end up waiting until the arrival of the 30th request (when
the sharing degree is 30). Figures 5.2a and 5.2b illustrate the impact of sharing degree
on latency and throughput. The inputs that we have used for studying this effect is a
set of images of dimension 128x128. The horizontal axes on both figures 5.2a and 5.2b
represent the sharing degree. The vertical axis in figure 5.2a and figure 5.2b represents
79

latency in milliseconds and throughput in requests per second respectively. From
figures 5.2a and 5.2b we can clearly see that the sharing degree improves throughput.
However, it affects the latency of execution of individual requests as well.
Input size. Second, we observe changes in the execution time of a request by varying
its input size. As the input size increases, additional amounts of computation would
be performed by the microservices. Hence input sizes play a key role in determining
the execution time of a request. To study this using the image classification (IMC)
microservice, we obtain request execution times for different input sizes of images
from 64x64 to 256x256. The sharing degree is kept constant in this experiment.
Figure 5.2c illustrates the findings of our experiment. We observe that as input sizes
increase, execution time of requests increase. We also observed similar performance
trends for other microservice types.
Queuing delay. The last factor that affects execution time of a requests is queuing
delay. This is experienced by requests waiting on previously dispatched requests to
be completed.
From our analysis, we observe that there is a linear relationship between the
execution time of a request, sharing degree and input size respectively. Queuing
delay can be easily calculated at runtime based on execution sequences of requests
and the estimated execution time of the preceding requests. From these observations,
we conclude that there is an opportunity to build a highly accurate performance
model for each microservice that our microservice execution framework can leverage
to enable sharing across jobs. Further, we also provide capabilities that can control
the magnitude of sharing at every microservice instance. These attributes can be
utilized simultaneously for preventing SLA violations due to microservice sharing
while optimizing for datacenter throughput.
80

0 2 4 6 8 10 12 14Small Input
−30
−20
−10
0
10
20
30
Erro
r (%
)
IMC FACED FACER HS
0 2 4 6 8 10 12 14Medium Input
−30
−20
−10
0
10
20
30
0 2 4 6 8 10 12 14Large Input
−30
−20
−10
0
10
20
30
Figure 5.3: Error(%) in predicting ETC for different input sizes with increase in thesharing degree (x-axis)
5.1.2 Execution Time Estimation Model
Accurately estimating the execution time of a request at each microservice stage is
a crucial as it drives the entire microservice execution framework. Towards achieving
this, we try to build a model that calculates the estimated time of completion (ETC)
for a request at each of its microservice stages. The ETC of a request is a function
of its compute time on the microservice and its queuing time ( time spent waiting
for the completion of requests that are scheduled to be executed before the current
request).
ETC = Tqueuing + Tcompute (5.1)
We use a linear regression model to determine the Tcompute of a request, for each
microservice type and the input size, as a function of the sharing degree.
Y = a+ bX (5.2)
where X is the sharing degree (batch size) which is an independent variable and Y
is the dependent variable that we try to predict, the completion time of a request. b
and a are the slope and intercepts of the regression equation. Tqueuing is determined
as the sum of the execution times of the previous requests that need to be completed
before the current request can be executed on the microservice which can directly be
81

determined at runtime.
Data normalization. A commonly followed approach in machine learning is to
normalize data before performing linear regression so as to achieve high accuracy.
Towards this objective, we rescale the raw input data present in both dimensions in
the range of [0, 1], normalizing with respect to the min and max, as in the equation
below.
x′ =x−min (x)
max (x)−min (x)(5.3)
We trained our model for sharing degrees following powers of two to create a pre-
dictor corresponding to every microservice and input size pair. We cross validated
our trained model by subsequently creating test beds and comparing the actual val-
ues with the estimated time of completion by our model. Figure 5.3 shows the error
rate that exists in predicting the completion time, given a sharing degree for different
input sizes. For the image based microservices, the input sizes utilized are images of
dimensions 64, 128 and 256 for small, medium and large inputs, respectively. These
are standardized inputs from publicly available datasets whose details are enumer-
ated in Table 5.1. As can be clearly observed from the graph, the error in predicting
the completion time from our model is around 4% on average. This remains consis-
tent across other microservices too whose plots are not shown in the figure to avoid
obscurity.
The estimated time of completion (ETC) obtained from our regression models
is used to drive decisions on how to distribute requests belonging to different users
across microservice instances. However, satisfying application-specific SLAs becomes
mandatory under such circumstances. For this purpose, we seek to exploit the vari-
ability in the SLAs of individual requests and the resulting slack towards building
our request scheduling policy. Later in section 5.2.2 and 5.2.3, we describe in detail
the methodology by which we compute and utilize slack to undertake optimal request
82

Microservice cluster
IMC()
NLU()
QA()
TTS()
……
……
…
ASR()
NLU()
QA()
……
……
Job A
Job B
1
ASR
IMC
NLU
QA
2 Building microservice DAG
IMC NLU QA TTS
ASR NLU QA
Job A’s DAG
Job B’s DAG
Submitting job
TTS
Figure 5.4: Extracting used microservices from given jobs in the microservice cluster
distribution policies.
5.2 GrandSLAm Design
This section presents the design and architecture of GrandSLAm [61], our pro-
posed runtime system for moderating request distribution at microservice execution
frameworks. The goal of GrandSLAm is to enable high throughput at microservice
instances without violating application specific SLAs. GrandSLAm leverages the exe-
cution time predictions from ETC to determine the amount of execution slack different
jobs’ requests possess at each microservice stage. We then exploit this slack informa-
tion for efficiently sharing microservices amongst users to maximize throughput while
meeting individual users’ Service Level Agreements (SLAs).
83

5.2.1 Building Microservice Directed Acyclic Graph
The first step in GrandSlam’s execution flow is to identify the pipeline of microser-
vices present in each job. For this purpose, our system takes the user’s job written
in a high-level language such as Python, Scala, etc. as an input 1 in Figure 5.4
and converts it into a directed acyclic graph (DAG) 2 of microservices. Here, each
vertex represents a microservice and each edge represents communication between
two microservices (e.g., RPC call). Such DAG based execution models have been
widely adopted in distributed systems frameworks like Apache Spark [129], Apache
Storm [51] etc. Building a microservice DAG is an offline step that needs to be per-
formed once before GrandSLA’s runtime system starts distributing requests across
microservice instances.
5.2.2 Calculating Microservice Stage Slack
The end-to-end latency of a request is a culmination of the completion time of
the request at each individual microservice stage. Therefore, in order to design a
runtime mechanism that provides end-to-end latency guarantees for requests, we take
a disaggregated approach. We calculate the partial deadlines at each microservice
stage which every request needs to meet at so that end-to-end latency targets are
not violated. We define this as microservice stage slack. In other words, microservice
stage slack is defined as the maximum amount of time a request can spend at a
particular microservice stage. Stage slacks are allocated offline after building the
microservice DAG, prior to the start of the GrandSLAm runtime system.
Mathematically slack at every stage is determined by calculating the proportion of
end-to-end latency that a request can utilize at each particular microservice stage.
slack =Lm
La + Lb · · ·+ Lm + . . .× SLA (5.4)
84

0 5 10 15 20 25 30
Batch Size (CPU)0
20
40
60
80
100
Slack (%
)
Activity PoseNatural Language UnderstandingQuestion AnsweringSequence Learning
Figure 5.5: Microservice stage slack corresponding to different microservices presentin Pose Estimation for Sign Language application
where Lm is the latency of job at stage m and La, Lb . . . are the latency of the same
job at the other stages a, b . . . respectively. Figure 5.5 illustrates the proportion of
time that should be allocated at each microservice stage for varying batch sizes, for
a real world application called Pose Estimation for Sign Language. We can clearly
see from figure 5.5 that the percentage of time a request would take to execute the
Sequence Learning stage is much higher than the percentage of time the same request
would take to execute the Activity Pose stage. Hence, requests are allocated stage
level execution slacks proportionally.
5.2.3 Dynamic Batching with Request Reordering
GrandSLAm’s final step is orchestrating requests at each microservice stage based
on two main objective functions (i) meeting end-to-end latency (ii) maximizing through-
put. For this purpose, GrandSLAm tries to execute every request that is queued up
at a microservice stage in a manner at which it simultaneously maximizes the sharing
degree while meeting end-to-end latency guarantees. Here, GrandSLAm undertakes
two key optimizations: 1 Request Reordering and 2 Dynamic batching as depicted
in Figure 5.6. GrandSLAm through these optimizations tries to maximize through-
put. However, it keeps a check on the latency of the executing job by comparing slack
possessed by every request (calculated offline as described at 5.2.2) with its execution
85

7310532 2025 7310532 2025 7310532 2025
3571025 2032
Reordering requests based on the slack1
2
3571025 2032
Batch size: 3 Batch size: 2 Batch size: 2
Dynamically adjusting the batch size
ASR
IMC
QA
TTS
NLU
Figure 5.6: Request reordering and dynamic batching mechanism
time estimates obtained from the model described at Section 5.1.2.
Request reordering. Slack based request reordering is performed at each microser-
vice instance by our runtime system. The key objective of our request reordering
mechanism is to prioritize the execution of requests with lower slack as they possess
much tighter completion deadlines. Hence, our GrandSLAm runtime system reorders
requests at runtime that promotes requests with lower slack to the head of the exe-
cution queue. The request reordering mechanism in Figure 5.6 illustrates this with
an example. Each rectangle is a request present in the microservice execution and
the number in each rectangle illustrates its corresponding slack value. On the left,
it shows the status before reordering and on the middle, it shows the status after
reordering.
Algorithm 1 Dynamic batching algorithm
1: procedure DynBatch(Q) . Queue of requests2: startIdx = 03: Slackq = 04: executed = 05: len = length(Q)6: while executed ≤ QSize do . All are not batched7: window = 08: partQ = Q[startidx : length]9: window = getMaxBatchSizeUnderSLA(partQ, Slackq)
10: startIdx = startIdx + window11: Slackq = Slackq + latency12: executed = executed + window13: end while14: end procedure
86

slackExecution time
ASR NLU
Slack forwarding
Figure 5.7: Forwarding unused slack in the ASR stage to the NLP stage
Dynamic batching. At each microservice, once the requests have been reordered
using slack, we identify the largest sharing degree (actual batch size during execution)
that can be employed such that each request meets its stage level SLAs. Such a safe
identification of the largest sharing degree is done by comparing the allocated slack
obtained by the process described in Section 5.2.2 with the slack estimation model
described in Section 5.1.2.
Algorithm 1 summarizes the dynamic batching approach that we employ. The
input to the algorithm is a queue of requests sorted by their respective slack values.
Starting from the request possessing the lowest slack value we traverse through the
queue increasing the batch size. We perform this until increasing batch size violates
the sub-stage SLA of individual requests present in the queue. We repeat the request
reordering and dynamic batching process continuously as new incoming requests ar-
rive from time to time. Figure 5.6 shows how the dynamic batching is used in our
system from the middle part to the right part.
5.2.4 Slack Forwarding
While performing slack based request scheduling in multi-stage jobs, we encounter
a common scenario. At the end of each microservice stage, there is some slack that
remains unused for a few requests. We reutilize this remaining slack, by performing
slack forwarding, wherein we carry forward the unused slack on to the subsequent mi-
87

Type Application Input Sizes Output Network Type Layers Parameters
Image Services
Image Classification (IMC)
64X64, 128X128and 256 X 256 images
Probability of an object Alexnet CNN 8 15MFace Detection (FACED) Facial Key Points Xception CNN 9 58KFacial Recognition (FACER) Probability of a person VGGNet CNN 14 40MHuman Activity Pose (AP) Probability of a pose deeppose CNN 8 40MHuman Segmentation (HS) Presence of a body part VGG16 CNN 16 138M
Speech ServicesSpeech Recognition (ASR)
52.3KB, 170.2KB audioRaw text NNet3 DNN 13 30M
Text to Speech (TTS) Audio output WaveNet DNN 15 12M
Text Services
Part-of-Speech Tagging (POS)
text containing 4-70words per sentence
Words part of speech eg. Noun SENNA DNN 3 180KWord Chuncking (CHK) Label Words as begin chunk etc. SENNA DNN 3 180KName Entity Recognition (NER) Labels words SENNA DNN 3 180KQuestion Answering (QA) Answer for question MemNN RNN 2 43KSequence Learning (SL) Translated text seq2seq RNN 3 3072
General PurposeServices
NoSQL Database (NoSQL) Directory input Output of Query N/A N/A N/A N/AWeb Socket Programmig (WS) Text, image Data communication N/A N/A N/A N/A
Table 5.1: Summary of microservices and their funcationality
CPU/GPU config Microarchitecture
Intel Xeon E5-2630 @2.4 GHz Sandy Bridge-EPIntel Xeon E3-1420 @3.7 GHz HaswellNvidia GTX Titan X MaxwellGeForce GTX 1080 Pascal
Table 5.2: Experimental platforms
croservice stages. In many scenarios, such a technique ends up deprioritizing requests
that had higher priorities in previous stages. This shuffles the queueing time across
requests, as they propagate through the execution stages. By the time requests reach
the last stage, their cumulative compute and queuing delay (end-to-end delay) be-
comes fairly consistent meeting the microservice-specific SLA. Figure 5.7 exemplifies
the case where the unused slack in the ASR stage can be forwarded into the next
microservice stage.
5.3 Evaluation
In this section, we evaluate GrandSLAm’s policy and also demonstrate its effec-
tiveness in meeting service level agreements (SLAs), while simultaneously achieving
high throughput in datacenters that house microservices.
88

Application Description Microservice DAG
1. IPA-QueryProvides answers to queries thatare given as input through voice.
ASR→NLP→QA
2. IMG-QueryGenerates natural language descri-ptions of the images as output.
IMG→NLP→QA
3. POSE-SignAnalyzes interrogative imagesand provides answers.
AP→NLP→QA→SL
4. FACE-SecurityScans images to detect the presenceof identified humans.
FACED→FACER
5. DETECT-FatigueDetects in real time the onsetof sleep in fatigued drivers.
HS→AP→FACED→FACER
6. Translation Performs language translation. SL QA NoSQL
Table 5.3: Applications used in evaluation
5.3.1 Experimental Environments
Infrastructure. We evlauate GrandSLAm on a testbed consisting of 100 docker
containers. Each container has a single 2.4 GHz CPU core, 2GB of RAM and
runs Ubuntu 16.10. Executing applications using accelerators has been a common
trend [45, 44, 80, 25, 24, 89, 78]. Hence, we evaluate GrandSLAm on both CPU
and GPU platforms as enumerated in Table 5.2. We setup a topology of services and
processes according to that of IBM Bluemix [36]. In other words, each microservice
executes on containerized execution environments. We use docker containers for this
purpose.
Microservice types. Table 5.1 show the list of microservices that we have uti-
lized in our experiments. POS, CHK and NER microservices utilize the kernels
from Djinn&Tonic [43] suite which in turn uses SENNA [26]. Similarly, ASR mi-
croservice utilizes kernels from Djinn&Tonic suite [43], which in turn uses Kaldi [88].
IMC, FACED, FACER, AP, HS, QA and SL microservices are implemented using
Tensorflow framework version 1.0 [3]. Using these microservices we build a
wide range of applications as shown in Table 5.3. These applications cover a vari-
ety of domains incuding Natural Language Processing, Computer Vision and Secu-
rity [19, 45, 44, 99, 18, 33, 100, 20, 12].
89

Workload App1 App2 App3 App4 Shared microservices
WL1 IMG-Query FACE-Security DETECT-Fatigue POSE-Sign QA, FACED, FACER, APWL2 IPA-Query POSE-Sign Translation NLU, QAWL3 I/O -IPA-Query I/O-Sign I/O-Translation NLU, NoSQL
Table 5.4: Workload scenarios
WL1 WL2 WL3020406080
100
Perc
enta
geof
vio
latio
nsBaselineBaseline + reordering
Baseline + dynamic batchingGrandSlam
(a) Percentage of requests that violate SLA
WL1 WL2 WL305000
1000015000200002500030000
99% Ta
il Latenc
y (m
s)
(b) 99th Percentile tail latency of each application
Figure 5.8: Comparing the effect of different components present in GrandSLAm’spolicy
Load generator/Input. To evaluate the effectiveness of GrandSLAm, we design
a load generator that submits user requests following a Poisson distribution that
is widely used to mimic cloud workloads [75]. The effect of performance degradation
at multi-tenant execution scenarios is luminous extensively at servers handling high
load. Hence, our experiments are evaluated at scenarios in datacenters where the
load is high. Such a distribution has been used by several prior works on multi-stage
applications [127, 116, 106]. The SLA that we use for each application is obtained
and calculated from the methodology proposed by PowerChief [127]. Table 5.4 shows
the workload table and the microservices that are shared when they are executed
together. For each microservice request we have evaluated our methodology using
inputs that correspond to data that is available from open source datasets.
90

5.3.2 Achieving Service Level Agreements (SLAs)
First, we evaluate the effectiveness of GrandSLAm in achieving Service Level
Agreements (SLAs) for the workload scenarios enumerated in Table 5.4. For this
purpose, we incrementally introduce reordering and batching over the baseline system
and try to study its effects on the percentage of SLA violations.
5.3.2.1 Reducing SLA violations
For this experiment, we deployed a docker container instance for each microser-
vice type. Communication across microservice instances within the cluster happens
through web sockets. Under this experimental setup, we first obtain the % of re-
quests violating SLA under a baseline scheme which executes requests (i)in a first-
in-first-out (FIFO) fashion (ii)without sharing the microservices. Subsequently, we
introduce a request re-ordering scheme that executes requests in an Earliest Deadline
First (EDF) fashion to compare it with the baseline system. Similarly, we also exe-
cute requests in where requests share microservice instances to see how it improves
performance. Lastly, we compare GrandSLAm with these schemes to instantiate its
effectiveness. Our experiment keeps the input load constant at fixed Requests per
Second (RPS) while comparing each policy.
Figure 5.8 shows the results of this experiment. From figure 5.8a we can clearly see
that for a given workload, almost all of the requests violate SLAs under the baseline
and reordering policies. However, the effect is much amortized when requests are
grouped together in batches. This is because batching can improve the overall latency
of a multitude of requests [43] collectively. This is clearly evident from the percentage
of requests violated under baseline+dynamic batching policy. GrandSLAm utilizes
best of both the policies where it ends up having a low percentage of requests that
violate SLA.
91

1500 1800 2100 2400 2700 3000Latency (ms)
0.00.20.40.60.81.0
Cumila
tive
Distrib
ution
Func
tion
IPA-WL2 Pose-WL2
1500 1800 2100 2400 2700 3000 3300Latency (ms)
IPA-WL2 Pose-WL2
(a) EDF dynamic batching VS GrandSLAm
1500 1800 2100 2400 2700 3000Latency (ms)
0.00.20.40.60.81.0
Cumila
tive
Distrib
ution
Func
tion
IPA-WL3 Pose-WL3
1500 1800 2100 2400 2700 3000 3300Latency (ms)
IPA-WL3 Pose-WL3
(b) EDF static batching (batch size 50) VS GrandSLAm
800 1800 2800 3800 4800 5800Latency (ms)
0.00.20.40.60.81.0
Cumilative
Distrib
ution
Functio
n
Pose-WL2 Translate-WL2
800 1800 2800 3800 4800 5800Latency (ms)
Pose-WL2 Translate -WL2
(c) ED dynamic batching VS GrandSLAm
1800 2100 2400 2700 3000Latency (ms)
0.00.20.40.60.81.0
Cumila
tive
Distrib
ution
Func
tion
Face Security-WL1 Fatigue Driver-WL1
1000 1300 1600 1900 2200 2500 2800Latency (ms)
Face Security-WL1 Fatigue Driver-WL1
(d) ED static batching (batch size 30) VS GrandSLAm
Figure 5.9: Comparing the cumulative distribution function of latencies for priorapproaches and GrandSLAm.
92

5.3.3 Comparing with prior techniques
Prior approaches which try to solve this problem are categorized based on their
respective (i) batching policies for aggregating requests and (ii) slack calculation poli-
cies for reordering requests. Most relevant work use a no-batching policy where
they do not batch multiple requests. Djinn&Tonic [43] utilizes a static batching
policy where they used a fixed batch size for all applications. However, we pro-
pose a dynamic batching technique which varies the batch size based on the slack
available for each request. Again, with respect to slack calculation policy, prior ap-
proaches [129, 51] utilize a equal division slack allocation (ED) policy which
equally divides slack across individual microservice stages. Certain other approaches
utilize a first-in-first-out policy while most approaches utilize earliest deadline
first (EDF) slack allocation policy [116, 106]. However, we propose a slack calcu-
lation policy which allocates slack taking into account the intrinsic variation present
in the execution time of different computational stages. This is clearly explained in
Section 5.2.2.
We derive 4 baselines on equal division policy. ED-NB(equal division no batch)
disables batching, ED-30 and ED-50 statically fix batch size to 30 and 50 respec-
tively, and ED-DNB(equal division dynamic batch) utilizes the dynamic batching
approach proposed by GrandSLAm along with the ED policy. We also derive 4 base-
lines on using earliest deadline first policy: EDF-NB, EDF-30, EDF-50 and EDF-
DNB respectively. EDF-NB disables batching, EDF-30 and EDF-50 statically fix
batch size to 30 and 50 while EDF-DNB utilizes the dynamic batching proposed by
GrandSLAm. GrandSLAm’s policy is abbrevated as GS in our graphs.
5.3.3.1 Reordering Requests based on Slack
In this subsection, we quantify the effectiveness of GrandSLAm’s slack calculation
and reordering policy by comparing it with ED and EDF. We illustrate this using the
93

cumulative distribution function (CDF) of latencies, as shown in Figure 5.9. We have
used the same experimental setup where the configuration of the input load and the
number of microservice instances remains constant.
Figures 5.9a, 5.9b, 5.9c and 5.9d compare the CDF of the policies EDF dynamic
batch (EDF-DYN), EDF constant batch size 50 (EDF-50), ED constant batch size 50
ED-50, and ED dynamic batching (ED-DYN) respectively with GrandSLAm(GS. The
horizontal axis denotes time. The vertical axis denotes the CDF of the percentage
of requests executed at a particular time. The dashed lines correspond to the target
SLAs that individual applications are subjected to meet. For each figure, the graph
in the left portrays the CDF of the baseline techniques (EDF-DYN, EDF-50, ED-
DYN, and ED-30) and the graph in the right portrays the CDF of GrandSLAm. The
green shaded portion illustrates the leftover slack at the final stage when requests
execute before the deadline. The red shaded portion illustrates slack violation when
requests execute after the deadline has passed. In an ideal case, both green and
red portions should be minimized. In other words, requests should be reordered and
batched in such a way that it neither passes the deadline nor executes way ahead
of the deadline. Executing way ahead of the deadline restricts requests with lower
slack to stall creating a situation where other requests end up violating SLAs. In an
ideal situation, slack remaining should be transferred to the requests who are about
to violate slack. From these graphs, we draw the following conclusion. As shown
in figures 5.9a, 5.9b, 5.9c and 5.9d requests reordering policies proposed by prior
literature creates a situation where a few requests execute much before the expected
deadline while other requests end up violating the SLAs.
Figures 5.9a and 5.9b compares EDF with with GrandSLAm. EDF’s slack al-
location policy for each request is agnostic to the intrinsic variation present in the
microservice execution stages within an application. Hence, in many instances, it
underestimates execution times of requests and performs aggressive batching. As a
94

result of this, some requests complete their execution well ahead of the latency targets
while other requests end up violating SLAs. GrandSLAm, on the other hand, avoids
this situation by allocating slack that is proportional to the time that would be taken
at each stage. GrandSLAm performs judicious batching while limiting aggressive
batching by introducing sub-stage SLAs. This is clearly illustrated in Figure 5.9a.
Pose and IPA are two applications present in WL2. Under EDF’s policy, we see that
the requests corresponding to the Pose application complete well ahead of time (as
shown in the green patch). However, a substantial number of requests corresponding
to the IPA violate SLAs(as shown in the red patch). GrandSLAm, on the other hand,
carefully reallocates slack among applications. Hence, the execution of requests with
abundant slack is stalled until just before the deadline thereby allowing requests with
less amount of slack to be executed, preventing them from violating SLAs. The can
clearly be seen in figure 5.9a as the amount of green and red patches are much lesser
for GrandSLAm. A similar phenomenon can be witnessed for EDF’s static batching
policy with batch size 50, as illustrated in Figure 5.9b.
Figures 5.9c and 5.9d compare ED dynamic and static batching with GrandSLAm.
The major drawback of the ED technique lies in its inability to gauge the slack that
should be allocated in each stage. This is clearly illustrated in Figures 5.9c and 5.9d.
In many cases, it wrongly allocates more slack to requests that do not require it, while
depriving other requests that actually need slack. This introduces additional queuing
time, thereby violating the SLA for a substantial amount of requests. This could
be avoided if slack is being distributed judiciously across requests. GrandSLAm is
cognizant of this need and hence, predicts the appropriate amount of compute time
required for each stage and allocates slack proportionally.
95

EDNB
ED-30
ED-50
ED-DYB
EDF-NB
EDF-30
EDF-50
EDF-DYB
GS EDNB
ED-30
ED-50
ED-DYB
EDF-NB
EDF-30
EDF-50
EDF-DYB
GS EDNB
ED-30
ED-50
ED-DYB
EDF-NB
EDF-30
EDF-50
EDF-DYB
GS0
1000200030004000
Avg
Late
ncy
(ms)
WL1 WL2 WL3
Queuing Delay IMC NLU QA AP SL NoSQL
(a) Average Latency
EDNB
ED-30
ED-50
ED-DYB
EDF-NB
EDF-30
EDF-50
EDF-DYB
GS EDNB
ED-30
ED-50
ED-DYB
EDF-NB
EDF-30
EDF-50
EDF-DYB
GS EDNB
ED-30
ED-50
ED-DYB
EDF-NB
EDF-30
EDF-50
EDF-DYB
GS0
1000200030004000
99th
% Ta
il La
tenc
y (m
s)
WL1 WL2 WL3
(b) 99th Percentile tail latency
Figure 5.10: Comparing the latency of workloads under different policies. Grand-SLAm has the lowest average and tail latency.
5.3.3.2 Dynamic batching for latency reduction
In order to study the effects of dynamic batching, we compare GrandSLAm with
all our baseline policies. Figures 5.10 and 5.11 illustrate the results of this experiment.
In Each stacked bar in Figure 5.10a and 5.10b represents the average latencies and
the tail latencies of the applications respectively. The policies in each figure are or-
dered starting from ED-NB followed by ED-30, ED-50, ED-DYN, EDF-NB, EDF-30,
EDF-50, EDF-DYN concluding with GrandSLAm as GS respectively. GrandSLAm
is distinctively distinguished from other bars by hatching it with slanting lines. The
color in the stacked graph corresponds to either queuing latency experienced at any
stage or the compute latency at individual microservice stages. The different compo-
nents of this plot are stacked breaking the end-to-end latency as queuing latency or
compute stage delay over time (which is why there is a queuing latency stack after
each stage). As can be seen in Figure 5.10a, GrandSLAm achieves the lowest latency
across all policies. GrandSLAm is able to meet the required SLA for almost every
request, as compared to prior policies that violate SLAs for several of these requests.
We draw the following insights into why prior policies are ineffective in meeting SLAs.
No batching techniques. The latency of requests is completely dominated by the
96

WL1 WL2 WL3020406080
100
Percen
tage
of violatio
ns
ED-NBED-30
ED-50ED-DNB
TT-NBTT-30
TT-50TT-DNB
GS
Figure 5.11: Percentage of requests violating SLAs under different schemes
queueing latency when employing techniques that don’t perform batching, namely
ED-NB and EDF-NB. Hench, such policies are undesirable.
Static batching techniques. In view of the clear disadvantage when requests are
not batched, statically batching them is one of the simplest policies that can be
employed to improve throughput. However, latencies and SLAs could be compromised
if they are not batched judiciously.
Assigning a large fixed batch size for execution can critically violate the latency
of many requests within that particular batch. Let us take WL1 for example. From
Figure 5.10a and 5.10b we see that employing a fixed batch size (batch size 50) under
EDF policy violates SLA only by a small proportion. However, it violates the SLA
for most requests present in the workload. This can be seen in Figure 5.11 where
the percentage of violations for WL1 under ED-50 goes up to 60%. This is caused
because of using a large batch size resulting in a situation where every request ends
up violating the SLA especially at the last stage of the application. This is because a
fixed batch size is not aware of the latencies and slack of requests that are executing
at a point in time. This is an unfavorable outcome especially for applications that
require strict latency targets.
To remediate this, employing smaller batch sizes could be viewed as a favorable
solution. However, smaller batch sizes can be conservative, thereby not being able to
exploit the potential opportunities where aggressive batching can increase throughput
while still meeting the latency constraints. Furthermore, small batch sizes could
97

also cause excessive queuing. Specifically, when requests are grouped with small
batch sizes, the first few batches might have low queuing delays. However subsequent
batches of requests would end up waiting for a substantial period of time for the
execution of prior batches of requests to complete, thereby affecting the end-to-end
latency. This increase in queueing latency at the later stages can be clearly seen in
situations created by WL2 (from figure 5.10a and 5.10b ) where policies ED-30 and
EDF-30 violates SLAs both in terms of average latencies as well as tail latencies.
Additionally, many requests also violate SLAs as queuing becomes a huge problem
due to large batch sizes. This can be seen in figure 5.11. These observations strongly
motivate a dynamic batching policy where batch sizes are determined online, during
runtime, depending upon each application’s latency constraints.
Dynamic batching. Equal Division dynamic batching, Earliest Deadline First dy-
namic batching and Grand Slam determines appropriate batch sizes during runtime.
The difference between these three policies is the way by which they compute slack.
Once slack is computed, the largest batch size which accommodates all the requests
without violating its slack is obtained during runtime. For Equal Division dynamic
batching, slack for each request is a fair share from the SLA for each stage in the end-
to-end pipeline. For instance, for an application consisting of 3 stages, each request of
that application is estimated to have a slack of 33% of the SLA at each stage. Earliest
Deadline first approach, however, undertakes a greedy approach wherein the slack for
each request of an application at each stage is the remaining time the request pos-
sesses before it would end up violating the SLA. GrandSLAm is unique and distinct
from all these mechanisms. We adopt the methodology elaborated in Section 5.2.2
that is cognizant of the volume of computation each individual stage performs.
In Figures 5.10a and 5.10b we clearly see that both Equal Division dynamic batch-
ing and Earliest Deadline First dynamic batching perform poorly. This is due to the
following reasons. First, the policy that Earliest Deadline First (EDF) utilizes to
98

determine the appropriate batch size for a set of requests is a greedy policy. EDF
dynamically selects batch sizes for the requests aggressively until there is remaining
slack. Although this can be beneficial for traditional datacenter applications where
execution can only be thought of as single stage and monolithic, such an approach
performs poorly at microservice execution framework that possesses multistage exe-
cution pipelines. This is due to the fact that when requests reach the final stages of
execution, they have a limited amount of slack, which in turn restricts the amount of
batching possible to avoid potential SLA violations due to excessive batching. Such
a policy has two key downsides, First, it increases the queuing time for subsequent
requests thereby increasing the of those requests. This has a negative impact espe-
cially on the tail latency of applications as shown in figure 5.10b. Second, it becomes
difficult to identify the exact individual stage that was the causing this bottleneck. As
a result, the command center will perform non-optimal remediations where unwanted
instances would be scaled up leading to high resource utilization. This is experimen-
tally validated in section 5.3.4.2. Third, equal division dynamic batching introduces a
fair share of sub-stage SLA for each stage. This can restrict microservices from batch-
ing aggressively at a single stage. It can also identify the exact microservice instance
that was responsible for end-to-end SLA violation. Such a policy, on the one hand,
can address the high tail latency problem that exists in the Earliest Deadline First’s
aggressive and greedy dynamic batching approach. However, on the other hand, it
neglects the fact that the computation time at each stage is very different. Hence, in
many scenarios, it does not exploit the full benefits of batching for stages that have
high slack. For example, during the final stage in WL2 shown in figure 5.10a and
figure 5.10b, if all the requests have been batched, the percentage of requests that
would have violated slack would be much lower. However, the equal division policy
cannot exploit this opportunity resulting in an increased latency of requests.
GrandSLAm. Our technique, on the other utilizes a hybrid approach by exploiting
99

0.00.20.40.60.81.0
Throughput (QPS)
normalized to
GrandSlam
ED-30ED-50
ED-DYNEDF-30
EDF-50EDF-DYN
GS
0.00.20.40.60.81.0
CPU GPU
Figure 5.12: Throughput gains from GrandSLAm
the advantages of dynamic batching as well as enabling sub stage cut off slacks.
GrandSLAm utilizes a weighted sub-stage SLA slack based on the computational
requirements of each stage and an online dynamic batching technique. As a result,
GrandSLAm is able to outperform all prior approaches and achieve a much lower
average and tail latency as shown in figures 5.10a and 5.10b.
5.3.4 GrandSLAm Performance
In this section, we evaluate GrandSLAm’s capability in increasing datacenter
throughput and server utilization, while guaranteeing Service Level Agreements (SLAs)
for the workload scenarios enumerated in Table 5.4.
5.3.4.1 Throughput Increase
In this section, we demonstrate the throughput benefits of GrandSLAm, as com-
pared to the state-of-the-art techniques at scale-out environments. We compare the
different execution policies by constructing a real-time simulational experimental
setup consisting of a 1000 node CPU and GPU enabled cluster. As executing AI
applications in accelerator platforms is becoming more common, we try to evaluate
our technique at both CPU and GPU platforms. For GPU based experiments the
executing workloads do not utilize the CPU and are executed only in the GPU de-
100

vice and vice versa. Additionally, to mimic scale out execution scenarios, we collect
performance telemetry of workload scenarios for multiple execution runs. We then
extrapolate the performance telemetry to obtain data nearly equivalent to the amount
of data being collected at large scale datacenter. On top of that, we build a simula-
tion infrastructure that mimics GrandSLAm’s execution model at a larger scale. We
also we fix our application specific SLA, instance count and the server configuration
across experimental runs. We ensure that every request executing across the end-to-
end pipeline meets the latency constraints. Under such situations, we observe the
throughput gains corresponding to each execution policy.
Figure 5.12 illustrates the throughput gains of GrandSLAm compared to state
of the art execution policies. Each bar represents the average number of Requests
executed per Second (RPS) across all the applications and workload scenarios enu-
merated in Table 5.4, normalized to the average QPS of GrandSLAm. We normalize
with respect to GrandSLAm since the best prior technique is different for the CPU
and GPU systems. We clearly see that GrandSLAm outperforms other execution poli-
cies. The graph on the left is the average throughput for executing the workloads on
a CPU cluster while the graph on the right illustrates the results of the same experi-
ment on a GPU platform. An interesting observation consistent across both CPU and
accelerator platforms is that the static batching techniques consistently outperform
the dynamic batching techniques. This is because, dynamic batching, for instance, in
the context of time trader, aggressively batches requests initially. However, requests
get stalled during the terminal stages resulting in decreased throughput. On the con-
trary, equal division misjudges the proportion of slack that is to be allocated. As a
result, the policy restricts aggressive batching during scenarios where latency does
not take a hit. This results in low throughput. On an average we obtain up to 3×
performance on the GPU platform and around 2.2× performance on the CPU server
cluster, over the best prior mechanism.
101
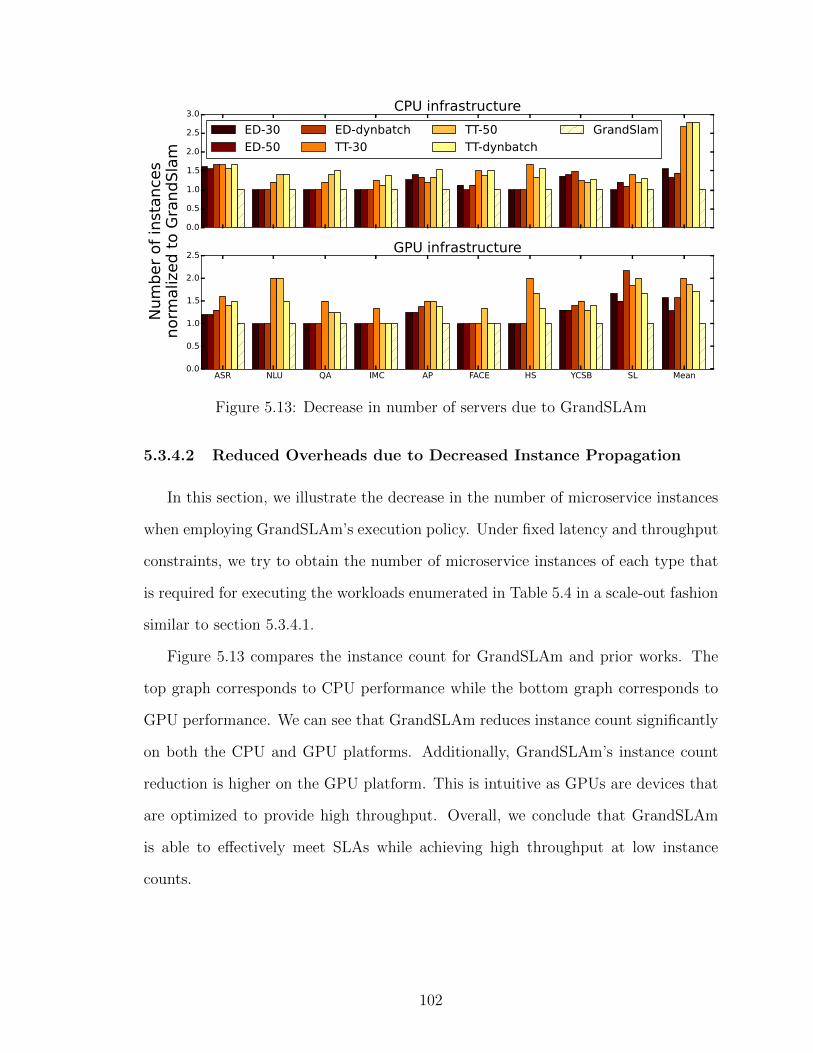
0.0
0.5
1.0
1.5
2.0
2.5
3.0 CPU infrastructureED-30ED-50
ED-dynbatchTT-30
TT-50TT-dynbatch
GrandSlam
ASR NLU QA IMC AP FACE HS YCSB SL Mean0.0
0.5
1.0
1.5
2.0
2.5 GPU infrastructure
Num
ber o
f ins
tanc
esno
rmal
ized
to G
rand
Slam
Figure 5.13: Decrease in number of servers due to GrandSLAm
5.3.4.2 Reduced Overheads due to Decreased Instance Propagation
In this section, we illustrate the decrease in the number of microservice instances
when employing GrandSLAm’s execution policy. Under fixed latency and throughput
constraints, we try to obtain the number of microservice instances of each type that
is required for executing the workloads enumerated in Table 5.4 in a scale-out fashion
similar to section 5.3.4.1.
Figure 5.13 compares the instance count for GrandSLAm and prior works. The
top graph corresponds to CPU performance while the bottom graph corresponds to
GPU performance. We can see that GrandSLAm reduces instance count significantly
on both the CPU and GPU platforms. Additionally, GrandSLAm’s instance count
reduction is higher on the GPU platform. This is intuitive as GPUs are devices that
are optimized to provide high throughput. Overall, we conclude that GrandSLAm
is able to effectively meet SLAs while achieving high throughput at low instance
counts.
102
CHAPTER VI
Conclusion
Cloud-scale datacenter management systems utilize virtualization in multi-tenant
execution scenarios to provide performance isolation while maximizing the utilization
of the underlying hardware infrastructure. However, virtualization does not provide
complete performance isolation as Containers/Virtual Machines (VMs) still compete
for non-reservable shared resources. This becomes highly challenging to address in
datacenter environments housing tens of thousands of VMs, causing degradation in
application performance. This dissertation tries to address this problem for pro-
duction datacenters by providing solutions based on the type of datacenter and the
requirements of the tenants that are utilizing the datacenter.
First, I conduct an analysis of performance interference in a multi-core datacen-
ter server to characterize the impact in performance due to sharing of architectural
resources. Based in that I designed a runtime system to estimate performance degra-
dation of applications running in datacenter servers. Second, I compartmentalize
performance interference based on the type of architectural resource for which ap-
plications are contending. Subsequently, I design a mechanism that can detect and
identify the source of interference at a tenant level and at the specific resource level.
Lastly, I explore and identify an important problem due to multi-tenant execution in
microservice execution framework. With that, I design a runtime system to guarantee
103

SLAs among applications utilizing microservices in a serverless computing platform.
This has proved to be useful especially for microservices executing DNN based ma-
chine learning algorithms in serverless framework.
104

BIBLIOGRAPHY
105

BIBLIOGRAPHY
[1] Private vs public clouds which one to choose. http://www.logicworks.net/
blog/2015/03/difference-private-public-hybrid-cloud-comparison/.Accessed: 2015.
[2] Dec 2018.
[3] M. Abadi, A. Agarwal, P. Barham, E. Brevdo, Z. Chen, C. Citro, G. S. Corrado,A. Davis, J. Dean, M. Devin, et al. Tensorflow: Large-scale machine learningon heterogeneous distributed systems. arXiv preprint arXiv:1603.04467, 2016.
[4] M. K. Aguilera, J. C. Mogul, J. L. Wiener, P. Reynolds, and A. Muthitacharoen.Performance debugging for distributed systems of black boxes. In Proceedingsof the Nineteenth ACM Symposium on Operating Systems Principles, SOSP ’03,pages 74–89, New York, NY, USA, 2003. ACM.
[5] P. Aguilera, K. Morrow, and N. S. Kim. Fair share: Allocation of gpu resourcesfor both performance and fairness. In Computer Design (ICCD), 2014 32ndIEEE International Conference on, pages 440–447. IEEE, 2014.
[6] J. Ahn, C. Kim, J. Han, Y.-R. Choi, and J. Huh. Dynamic virtual machinescheduling in clouds for architectural shared resources. In Proceedings of the 4thUSENIX Conference on Hot Topics in Cloud Ccomputing, HotCloud’12, pages19–19, Berkeley, CA, USA, 2012. USENIX Association.
[7] Amazon. Amazon web services User Case Studies. https://aws.amazon.com/solutions/case-studies/. Accessed: 2015-08-12.
[8] Amazon. AWS Case Study: NTT Docomo. http://aws.amazon.com/
solutions/case-studies/ntt-docomo/. Accessed: 2015-08-12.
[9] Amazon. AWS Case Study: Penn State. http://aws.amazon.com/solutions/case-studies/penn-state/. Accessed: 2015-08-12.
[10] Amazon. AWS Case Study: PIXNET. http://aws.amazon.com/solutions/
case-studies/pixnet/. Accessed: 2015-08-12.
[11] Amazon Inc. Amazon Elastic Compute Cloud(EC2).
106

[12] S. Avireddy, V. Perumal, N. Gowraj, R. S. Kannan, P. Thinakaran, S. Ganapthi,J. R. Gunasekaran, and S. Prabhu. Random4: An application specific ran-domized encryption algorithm to prevent sql injection. In 2012 IEEE 11thInternational Conference on Trust, Security and Privacy in Computing andCommunications, pages 1327–1333, June 2012.
[13] AWS Case Study. NASA/JPL’s Desert Research and Training Studies:https://aws.amazon.com/solutions/case-studies/nasa-jpl/.
[14] D. H. Bailey, E. Barszcz, J. T. Barton, D. S. Browning, R. L. Carter, L. Dagum,R. A. Fatoohi, P. O. Frederickson, T. A. Lasinski, R. S. Schreiber, H. D. Si-mon, V. Venkatakrishnan, and S. K. Weeratunga. The nas parallel bench-marks—summary and preliminary results. In Proceedings of the 1991ACM/IEEE Conference on Supercomputing, Supercomputing ’91, pages 158–165, New York, NY, USA, 1991. ACM.
[15] H. Ballani, D. Gunawardena, and T. Karagiannis. Network sharing in multi-tenant datacenters. Technical report, February 2012.
[16] P. Barham, B. Dragovic, K. Fraser, S. Hand, T. Harris, A. Ho, R. Neugebauer,I. Pratt, and A. Warfield. Xen and the art of virtualization. In ACM SIGOPSoperating systems review, volume 37, pages 164–177. ACM, 2003.
[17] J. Benesty, J. Chen, Y. Huang, and I. Cohen. Pearson correlation coefficient.In Noise reduction in speech processing, pages 1–4. Springer, 2009.
[18] C. F. Benitez-Quiroz, R. Srinivasan, Q. Feng, Y. Wang, and A. M. Martinez.Emotionet challenge: Recognition of facial expressions of emotion in the wild.arXiv preprint arXiv:1703.01210, 2017.
[19] C. F. Benitez-Quiroz, R. Srinivasan, and A. M. Martinez. Facial color is anefficient mechanism to visually transmit emotion. Proceedings of the NationalAcademy of Sciences, page 201716084, 2018.
[20] F. Benitez-Quiroz, R. Srinivasan, and A. M. Martinez. Discriminant functionallearning of color features for the recognition of facial action units and theirintensities. IEEE transactions on pattern analysis and machine intelligence,2018.
[21] S. Blagodurov, S. Zhuravlev, M. Dashti, and A. Fedorova. A case for numa-aware contention management on multicore systems. In Proceedings of the2011 USENIX Conference on USENIX Annual Technical Conference, USENIX-ATC’11, pages 1–1, Berkeley, CA, USA, 2011. USENIX Association.
[22] A. D. Breslow, A. Tiwari, M. Schulz, L. Carrington, L. Tang, and J. Mars.Enabling fair pricing on high performance computer systems with node sharing.Scientific Programming, 22(2):59–74, 2014.
107

[23] D. R. K. Brownrigg. The weighted median filter. Commun. ACM, 27(8):807–818, Aug. 1984.
[24] Q. Chen, H. Yang, M. Guo, R. S. Kannan, J. Mars, and L. Tang. Prophet:Precise qos prediction on non-preemptive accelerators to improve utilization inwarehouse-scale computers. SIGOPS Oper. Syst. Rev., 51(2):17–32, Apr. 2017.
[25] Q. Chen, H. Yang, J. Mars, and L. Tang. Baymax: Qos awareness and increasedutilization for non-preemptive accelerators in warehouse scale computers. SIG-PLAN Not., 51(4):681–696, Mar. 2016.
[26] R. Collobert, J. Weston, L. Bottou, M. Karlen, K. Kavukcuoglu, andP. P. Kuksa. Natural language processing (almost) from scratch. CoRR,abs/1103.0398, 2011.
[27] C. Delimitrou and C. Kozyrakis. Paragon: Qos-aware scheduling for heteroge-neous datacenters. In Proceedings of the Eighteenth International Conferenceon Architectural Support for Programming Languages and Operating Systems,ASPLOS ’13, pages 77–88, New York, NY, USA, 2013. ACM.
[28] C. Delimitrou and C. Kozyrakis. Paragon: Qos-aware scheduling for heteroge-neous datacenters. In Proceedings of the Eighteenth International Conferenceon Architectural Support for Programming Languages and Operating Systems,ASPLOS ’13, pages 77–88, New York, NY, USA, 2013. ACM.
[29] A. S. Dhodapkar and J. E. Smith. Comparing program phase detection tech-niques. In Proceedings of the 36th Annual IEEE/ACM International Symposiumon Microarchitecture, MICRO 36, pages 217–, Washington, DC, USA, 2003.IEEE Computer Society.
[30] K. Du Bois, S. Eyerman, and L. Eeckhout. Per-thread cycle accounting inmulticore processors. ACM Trans. Archit. Code Optim., 9(4):29:1–29:22, Jan.2013.
[31] E. Ebrahimi, C. J. Lee, O. Mutlu, and Y. N. Patt. Fairness via source throt-tling: A configurable and high-performance fairness substrate for multi-corememory systems. In Proceedings of the Fifteenth Edition of ASPLOS on Archi-tectural Support for Programming Languages and Operating Systems, ASPLOSXV, pages 335–346, New York, NY, USA, 2010. ACM.
[32] S. Elnikety, E. Nahum, J. Tracey, and W. Zwaenepoel. A method for trans-parent admission control and request scheduling in e-commerce web sites. InProceedings of the 13th international conference on World Wide Web, pages276–286. ACM, 2004.
[33] C. Fabian Benitez-Quiroz, R. Srinivasan, and A. M. Martinez. Emotionet: Anaccurate, real-time algorithm for the automatic annotation of a million facialexpressions in the wild. In Proceedings of the IEEE Conference on ComputerVision and Pattern Recognition, pages 5562–5570, 2016.
108
[34] E. Forbes, R. Basu, R. Chowdhury, B. Dwiel, A. Kannepalli, V. Srinivasan,Z. Zhang, T. Belanger, S. Lipa, E. Rotenberg, W. R. Davis, and P. D. Franzon.Experiences with two fabscalar-based chips, 2015.
[35] E. Forbes, Z. Zhang, R. Widialaksono, B. Dwiel, R. B. R. Chowdhury, V. Srini-vasan, S. Lipa, E. Rotenberg, W. R. Davis, and P. D. Franzon. Under 100-cyclethread migration latency in a single-isa heterogeneous multi-core processor. In2015 IEEE Hot Chips 27 Symposium (HCS), pages 1–1, Aug 2015.
[36] A. Gheith, R. Rajamony, P. Bohrer, K. Agarwal, M. Kistler, B. L. W. Eagle,C. A. Hambridge, J. B. Carter, and T. Kaplinger. Ibm bluemix mobile cloudservices. IBM Journal of Research and Development, 60(2-3):7:1–7:12, March2016.
[37] S. Govindan, J. Liu, A. Kansal, and A. Sivasubramaniam. Cuanta: Quantifyingeffects of shared on-chip resource interference for consolidated virtual machines.In Proceedings of the 2Nd ACM Symposium on Cloud Computing, SOCC ’11,pages 22:1–22:14, New York, NY, USA, 2011. ACM.
[38] A. Gulati, I. Ahmad, and C. A. Waldspurger. Parda: Proportional allocationof resources for distributed storage access. In Proccedings of the 7th Conferenceon File and Storage Technologies, FAST ’09, pages 85–98, Berkeley, CA, USA,2009. USENIX Association.
[39] A. Gulati, A. Holler, M. Ji, G. Shanmuganathan, C. Waldspurger, andX. Zhu. Vmware distributed resource management: Design, implementation,and lessons learned. VMware Technical Journal, 1(1):45–64, 2012.
[40] A. Gupta, J. Sampson, and M. Taylor. Quality time: A simple online techniquefor quantifying multicore execution efficiency. In Performance Analysis of Sys-tems and Software (ISPASS), 2014 IEEE International Symposium on, pages169–179, March 2014.
[41] F. Guthrie, S. Lowe, and K. Coleman. VMware vSphere Design. SYBEX Inc.,Alameda, CA, USA, 2nd edition, 2013.
[42] G. Hamerly, E. Perelman, J. Lau, and B. Calder. Simpoint 3.0: Faster andmore flexible program phase analysis. J. Instruction-Level Parallelism, 7, 2005.
[43] J. Hauswald, Y. Kang, M. A. Laurenzano, Q. Chen, C. Li, R. Dreslinski,T. Mudge, J. Mars, and L. Tang. Djinn and tonic: Dnn as a service and itsimplications for future warehouse scale computers. In Proceedings of the 42ndAnnual International Symposium on Computer Architecture (ISCA), ISCA ’15,New York, NY, USA, 2015. ACM. Acceptance Rate: 19
[44] J. Hauswald, Y. Kang, M. A. Laurenzano, Q. Chen, C. Li, T. Mudge, R. G.Dreslinski, J. Mars, and L. Tang. Djinn and tonic: Dnn as a service and itsimplications for future warehouse scale computers. In Proceedings of the 42Nd
109
Annual International Symposium on Computer Architecture, ISCA ’15, pages27–40, New York, NY, USA, 2015. ACM.
[45] J. Hauswald, M. A. Laurenzano, Y. Zhang, C. Li, A. Rovinski, A. Khurana,R. G. Dreslinski, T. Mudge, V. Petrucci, L. Tang, and J. Mars. Sirius: Anopen end-to-end voice and vision personal assistant and its implications forfuture warehouse scale computers. In Proceedings of the Twentieth InternationalConference on Architectural Support for Programming Languages and OperatingSystems, ASPLOS ’15, pages 223–238, New York, NY, USA, 2015. ACM.
[46] Y. He, S. Elnikety, J. R. Larus, and C. Yan. Zeta: scheduling interactive serviceswith partial execution. In SoCC, 2012.
[47] S. Hendrickson, S. Sturdevant, T. Harter, V. Venkataramani, A. C. Arpaci-Dusseau, and R. H. Arpaci-Dusseau. Serverless computation with openlambda.Elastic, 60:80, 2016.
[48] S. Hendrickson, S. Sturdevant, T. Harter, V. Venkataramani, A. C. Arpaci-Dusseau, and R. H. Arpaci-Dusseau. Serverless computation with openlambda.In 8th USENIX Workshop on Hot Topics in Cloud Computing (HotCloud 16),Denver, CO, 2016. USENIX Association.
[49] J. L. Henning. Spec cpu2006 benchmark descriptions. SIGARCH Comput.Archit. News, 34(4):1–17, Sept. 2006.
[50] H. Hoffmann, J. Eastep, M. D. Santambrogio, J. E. Miller, and A. Agarwal.Application heartbeats: A generic interface for specifying program performanceand goals in autonomous computing environments. In Proceedings of the 7thInternational Conference on Autonomic Computing, ICAC ’10, pages 79–88,New York, NY, USA, 2010. ACM.
[51] M. H. Iqbal and T. R. Soomro. Big data analysis: Apache storm perspective.International journal of computer trends and technology, 19(1):9–14, 2015.
[52] C. Isci and M. Martonosi. Phase characterization for power: evaluating control-flow-based and event-counter-based techniques. In HPCA, pages 121–132, 2006.
[53] V. Jalaparti, P. Bodik, S. Kandula, I. Menache, M. Rybalkin, and C. Yan.Speeding up distributed request-response workflows. SIGCOMM Comput. Com-mun. Rev., 43(4):219–230, Aug. 2013.
[54] V. Jalaparti, P. Bodık, S. Kandula, I. Menache, M. Rybalkin, and C. Yan.Speeding up distributed request-response workflows. In SIGCOMM, 2013.
[55] V. Jeyakumar, M. Alizadeh, D. Mazieres, B. Prabhakar, C. Kim, and A. Green-berg. Eyeq: Practical network performance isolation at the edge. REM,1005(A1):A2, 2013.
110

[56] A. Jog, E. Bolotin, Z. Guz, M. Parker, S. W. Keckler, M. T. Kandemir, andC. R. Das. Application-aware memory system for fair and efficient execution ofconcurrent gpgpu applications. In Proceedings of Workshop on General PurposeProcessing Using GPUs, GPGPU-7, pages 1:1–1:8, New York, NY, USA, 2014.ACM.
[57] J. Jose, M. Li, X. Lu, K. C. Kandalla, M. D. Arnold, and D. K. Panda. Sr-iovsupport for virtualization on infiniband clusters: Early experience. In Cluster,Cloud and Grid Computing (CCGrid), 2013 13th IEEE/ACM InternationalSymposium on, pages 385–392. IEEE, 2013.
[58] E. Kalyvianaki, M. Fiscato, T. Salonidis, and P. Pietzuch. Themis: Fairness infederated stream processing under overload. In Proceedings of the 2016 Inter-national Conference on Management of Data, pages 541–553. ACM, 2016.
[59] S. Kanev, J. P. Darago, K. Hazelwood, P. Ranganathan, T. Moseley, G.-Y.Wei, and D. Brooks. Profiling a warehouse-scale computer. In Proceedings ofthe 42Nd Annual International Symposium on Computer Architecture, ISCA’15, pages 158–169, New York, NY, USA, 2015. ACM.
[60] S. Kanev, K. Hazelwood, G. Y. Wei, and D. Brooks. Tradeoffs between powermanagement and tail latency in warehouse-scale applications. In 2014 IEEEInternational Symposium on Workload Characterization (IISWC), pages 31–40,Oct 2014.
[61] R. S. Kannan, L. , Subramanian, A. Raju, J. Ahn, L. Tang, and J. Mars.Grandslam: Guaranteeing slas for jobs at microservices execution framework.In Proceedings of the Fourteenth EuroSys Conference, EuroSys ’19, 2019.
[62] R. S. Kannan, A. Jain, M. A. Laurenzano, L. Tang, and J. Mars. Proctor:Detecting and investigating interference in shared datacenters. In PerformanceAnalysis of Systems and Software (ISPASS), 2018 IEEE International Sympo-sium on, pages 76–86. IEEE, 2018.
[63] M. P. Kasick, J. Tan, R. Gandhi, and P. Narasimhan. Black-box problemdiagnosis in parallel file systems. In Proceedings of the 8th USENIX Conferenceon File and Storage Technologies, FAST’10, pages 4–4, Berkeley, CA, USA,2010. USENIX Association.
[64] O. Kayiran, N. C. Nachiappan, A. Jog, R. Ausavarungnirun, M. T. Kandemir,G. H. Loh, O. Mutlu, and C. R. Das. Managing gpu concurrency in heteroge-neous architectures. In 2014 47th Annual IEEE/ACM International Symposiumon Microarchitecture, pages 114–126, Dec 2014.
[65] A. Kivity, Y. Kamay, D. Laor, U. Lublin, and A. Liguori. kvm: the linuxvirtual machine monitor. In Proceedings of the Linux Symposium, volume 1,pages 225–230, Ottawa, Ontario, Canada, June 2007.
111

[66] A. J. Lawrance and P. A. W. Lewis. An exponential moving-average sequenceand point process (ema1). Journal of Applied Probability, 14(1):98?113, 1977.
[67] H. Li. Introducing Windows Azure. Apress, Berkely, CA, USA, 2009.
[68] L. Liu, Y. Li, Z. Cui, Y. Bao, M. Chen, and C. Wu. Going vertical in memorymanagement: Handling multiplicity by multi-policy. In Proceeding of the 41stAnnual International Symposium on Computer Architecuture, ISCA ’14, pages169–180, Piscataway, NJ, USA, 2014. IEEE Press.
[69] M. Liu and T. Li. Optimizing virtual machine consolidation performance onnuma server architecture for cloud workloads. In Proceeding of the 41st AnnualInternational Symposium on Computer Architecuture, ISCA ’14, pages 325–336,Piscataway, NJ, USA, 2014. IEEE Press.
[70] J. Mars and L. Tang. Whare-map: Heterogeneity in ”homogeneous” warehouse-scale computers. In Proceedings of the 40th Annual International Symposium onComputer Architecture, ISCA ’13, pages 619–630, New York, NY, USA, 2013.ACM.
[71] J. Mars, L. Tang, R. Hundt, K. Skadron, and M. L. Soffa. Bubble-up: Increas-ing utilization in modern warehouse scale computers via sensible co-locations.In Proceedings of the 44th Annual IEEE/ACM International Symposium onMicroarchitecture (MICRO), MICRO-44, pages 248–259, New York, NY, USA,2011. ACM.
[72] J. Mars, L. Tang, R. Hundt, K. Skadron, and M. L. Soffa. Bubble-up: Increas-ing utilization in modern warehouse scale computers via sensible co-locations.In Proceedings of the 44th Annual IEEE/ACM International Symposium on Mi-croarchitecture, MICRO-44, pages 248–259, New York, NY, USA, 2011. ACM.
[73] S. Marston, Z. Li, S. Bandyopadhyay, J. Zhang, and A. Ghalsasi. Cloud com-puting - the business perspective. Decis. Support Syst., 51(1):176–189, Apr.2011.
[74] J. C. McCullough, J. Dunagan, A. Wolman, and A. C. Snoeren. Stout: Anadaptive interface to scalable cloud storage. In Proceedings of the 2010 USENIXConference on USENIX Annual Technical Conference, USENIXATC’10, pages4–4, Berkeley, CA, USA, 2010. USENIX Association.
[75] D. Meisner and T. F. Wenisch. Dreamweaver: Architectural support for deepsleep. SIGARCH Comput. Archit. News, 40(1):313–324, Mar. 2012.
[76] O. Mutlu and T. Moscibroda. Stall-time fair memory access scheduling for chipmultiprocessors. In Proceedings of the 40th Annual IEEE/ACM InternationalSymposium on Microarchitecture, MICRO 40, pages 146–160, Washington, DC,USA, 2007. IEEE Computer Society.
112

[77] K. Nagaraj, C. Killian, and J. Neville. Structured comparative analysis of sys-tems logs to diagnose performance problems. In Proceedings of the 9th USENIXConference on Networked Systems Design and Implementation, NSDI’12, pages26–26, Berkeley, CA, USA, 2012. USENIX Association.
[78] V. Nagarajan, R. Hariharan, V. Srinivasan, R. S. Kannan, P. Thinakaran,V. Sankaran, B. Vasudevan, R. Mukundrajan, N. C. Nachiappan, A. Sridha-ran, K. P. Saravanan, V. Adhinarayanan, and V. V. Sankaranarayanan. Scoc ipcores for custom built supercomputing nodes. In 2012 IEEE Computer SocietyAnnual Symposium on VLSI, pages 255–260, Aug 2012.
[79] V. Nagarajan, K. Lakshminarasimhan, A. Sridhar, P. Thinakaran, R. Hariha-ran, V. Srinivasan, R. S. Kannan, and A. Sridharan. Performance and energyefficient cache system design: Simultaneous execution of multiple applicationson heterogeneous cores. In 2013 IEEE Computer Society Annual Symposiumon VLSI (ISVLSI), pages 200–205, Aug 2013.
[80] V. Nagarajan, V. Srinivasan, R. Kannan, P. Thinakaran, R. Hariharan, B. Va-sudevan, N. C. Nachiappan, K. P. Saravanan, A. Sridharan, V. Sankaran, V. Ad-hinarayanan, V. S. Vignesh, and R. Mukundrajan. Compilation accelerator onsilicon. In 2012 IEEE Computer Society Annual Symposium on VLSI, pages267–272, Aug 2012.
[81] A. A. Nair and L. K. John. Simulation points for spec cpu 2006. In ComputerDesign, 2008. ICCD 2008. IEEE International Conference on, pages 397–403.IEEE, 2008.
[82] R. Nathuji, A. Kansal, and A. Ghaffarkhah. Q-clouds: Managing performanceinterference effects for qos-aware clouds. In Proceedings of the 5th EuropeanConference on Computer Systems, EuroSys ’10, pages 237–250, New York, NY,USA, 2010. ACM.
[83] K. J. Nesbit, N. Aggarwal, J. Laudon, and J. E. Smith. Fair queuing memorysystems. In Proceedings of the 39th Annual IEEE/ACM International Sympo-sium on Microarchitecture, MICRO 39, pages 208–222, Washington, DC, USA,2006. IEEE Computer Society.
[84] D. Novakovic, N. Vasic, S. Novakovic, D. Kostic, and R. Bianchini. Deepdive:Transparently identifying and managing performance interference in virtualizedenvironments. In Proceedings of the 2013 USENIX Conference on Annual Tech-nical Conference, USENIX ATC’13, pages 219–230, Berkeley, CA, USA, 2013.USENIX Association.
[85] E. S. Page. A test for a change in a parameter occurring at an unknown point.Biometrika, 42(3/4):523–527, 1955.
[86] H. Park, S. Baek, J. Choi, D. Lee, and S. H. Noh. Regularities considered harm-ful: Forcing randomness to memory accesses to reduce row buffer conflicts for
113
multi-core, multi-bank systems. In Proceedings of the Eighteenth InternationalConference on Architectural Support for Programming Languages and OperatingSystems, ASPLOS ’13, pages 181–192, New York, NY, USA, 2013. ACM.
[87] N. Partitioning and SR-IOV. Nic partitioning and sr-iov, technology brief bycavium.
[88] D. Povey, A. Ghoshal, G. Boulianne, L. Burget, O. Glembek, N. Goel, M. Han-nemann, P. Motlicek, Y. Qian, P. Schwarz, et al. The kaldi speech recognitiontoolkit. In IEEE 2011 workshop on automatic speech recognition and under-standing, number EPFL-CONF-192584. IEEE Signal Processing Society, 2011.
[89] A. Putnam, A. Caulfield, E. Chung, D. Chiou, K. Constantinides, J. Demme,H. Esmaeilzadeh, J. Fowers, J. Gray, M. Haselman, S. Hauck, S. Heil, A. Hor-mati, J.-Y. Kim, S. Lanka, E. Peterson, A. Smith, J. Thong, P. Y. Xiao,D. Burger, J. Larus, G. P. Gopal, and S. Pope. A reconfigurable fabric foraccelerating large-scale datacenter services. In Proceeding of the 41st Annual In-ternational Symposium on Computer Architecuture (ISCA), pages 13–24. IEEEPress, June 2014.
[90] M. K. Qureshi and Y. N. Patt. Utility-based cache partitioning: A low-overhead,high-performance, runtime mechanism to partition shared caches. In Proceed-ings of the 39th Annual IEEE/ACM International Symposium on Microarchitec-ture, MICRO 39, pages 423–432, Washington, DC, USA, 2006. IEEE ComputerSociety.
[91] J. Rao, K. Wang, X. Zhou, and C. zhong Xu. Optimizing virtual machinescheduling in numa multicore systems. In High Performance Computer Ar-chitecture (HPCA2013), 2013 IEEE 19th International Symposium on, pages306–317, Feb 2013.
[92] G. Ren, E. Tune, T. Moseley, Y. Shi, S. Rus, and R. Hundt. Google-wideprofiling: A continuous profiling infrastructure for data centers. IEEE Micro,30(4):65–79, July 2010.
[93] B. M. Sadler and A. Swami. Analysis of multiscale products for step detectionand estimation. IEEE Transactions on Information Theory, 45(3):1043–1051,Apr 1999.
[94] T. Sherwood, S. Sair, and B. Calder. Phase tracking and prediction. In Proceed-ings of the 30th Annual International Symposium on Computer Architecture,ISCA ’03, pages 336–349, New York, NY, USA, 2003. ACM.
[95] A. Shieh, S. K, A. Greenberg, C. Kim, and B. Saha. Sharing the data centernetwork. In In NSDI, 2011.
[96] A. Shieh, S. Kandula, A. G. Greenberg, and C. Kim. Seawall: Performanceisolation for cloud datacenter networks. In HotCloud, 2010.
114

[97] J. Y. Shin, M. Balakrishnan, T. Marian, and H. Weatherspoon. Gecko:Contention-oblivious disk arrays for cloud storage. In Presented as part of the11th USENIX Conference on File and Storage Technologies (FAST 13), pages285–297, San Jose, CA, 2013. USENIX.
[98] L. Soares, D. Tam, and M. Stumm. Reducing the harmful effects of last-levelcache polluters with an os-level, software-only pollute buffer. In Proceedingsof the 41st Annual IEEE/ACM International Symposium on Microarchitecture,MICRO 41, pages 258–269, Washington, DC, USA, 2008. IEEE Computer So-ciety.
[99] R. Srinivasan, J. D. Golomb, and A. M. Martinez. A neural basis of facial actionrecognition in humans. Journal of Neuroscience, 36(16):4434–4442, 2016.
[100] R. Srinivasan and A. M. Martinez. Cross-cultural and cultural-specific pro-duction and perception of facial expressions of emotion in the wild. IEEETransactions on Affective Computing, 2018.
[101] V. Srinivasan, R. B. R. Chowdhury, E. Forbes, R. Widialaksono, Z. Zhang,J. Schabel, S. Ku, S. Lipa, E. Rotenberg, W. R. Davis, and P. D. Franzon. H3(heterogeneity in 3d): A logic-on-logic 3d-stacked heterogeneous multi-core pro-cessor. In 2017 IEEE International Conference on Computer Design (ICCD),pages 145–152, Nov 2017.
[102] L. Subramanian, V. Seshadri, A. Ghosh, S. Khan, , and O. Mutlu. The ap-plication slowdown model: Quantifying and controlling the impact of inter-application interference at shared caches and main memory. In Proceedings ofthe 48th Annual IEEE/ACM International Symposium on Microarchitecture,MICRO-48. IEEE Computer Society, 2015.
[103] L. Subramanian, V. Seshadri, A. Ghosh, S. Khan, and O. Mutlu. The ap-plication slowdown model: Quantifying and controlling the impact of inter-application interference at shared caches and main memory. In 2015 48thAnnual IEEE/ACM International Symposium on Microarchitecture (MICRO),pages 62–75, Dec 2015.
[104] L. Subramanian, V. Seshadri, A. Ghosh, S. Khan, and O. Mutlu. The ap-plication slowdown model: Quantifying and controlling the impact of inter-application interference at shared caches and main memory. In Proceedingsof the 48th International Symposium on Microarchitecture, MICRO-48, pages62–75, New York, NY, USA, 2015. ACM.
[105] G. E. Suh, S. Devadas, and L. Rudolph. A new memory monitoring schemefor memory-aware scheduling and partitioning. In Proceedings of the 8th Inter-national Symposium on High-Performance Computer Architecture, HPCA ’02,pages 117–, Washington, DC, USA, 2002. IEEE Computer Society.
115

[106] L. Suresh, P. Bodik, I. Menache, M. Canini, and F. Ciucu. Distributed resourcemanagement across process boundaries. In Proceedings of the 2017 Symposiumon Cloud Computing, SoCC ’17, pages 611–623, New York, NY, USA, 2017.ACM.
[107] L. Tang, J. Mars, and M. L. Soffa. Contentiousness vs. sensitivity: Improvingcontention aware runtime systems on multicore architectures. In Proceedingsof the 1st International Workshop on Adaptive Self-Tuning Computing Systemsfor the Exaflop Era, EXADAPT ’11, pages 12–21, New York, NY, USA, 2011.ACM.
[108] L. Tang, J. Mars, W. Wang, T. Dey, and M. L. Soffa. Reqos: Reactivestatic/dynamic compilation for qos in warehouse scale computers. In Proceed-ings of the Eighteenth International Conference on Architectural Support forProgramming Languages and Operating Systems, ASPLOS ’13, pages 89–100,New York, NY, USA, 2013. ACM.
[109] S. Tang, B. He, S. Zhang, and Z. Niu. Elastic multi-resource fairness: Balancingfairness and efficiency in coupled cpu-gpu architectures. In SC16: InternationalConference for High Performance Computing, Networking, Storage and Analy-sis, pages 875–886, Nov 2016.
[110] E. Thereska, H. Ballani, G. O’Shea, T. Karagiannis, A. Rowstron, T. Talpey,R. Black, and T. Zhu. Ioflow: a software-defined storage architecture. In Pro-ceedings of the Twenty-Fourth ACM Symposium on Operating Systems Princi-ples, pages 182–196. ACM, 2013.
[111] P. Thinakaran, J. R. Gunasekaran, B. Sharma, M. T. Kandemir, and C. R.Das. Phoenix: a constraint-aware scheduler for heterogeneous datacenters. InDistributed Computing Systems (ICDCS), 2017 IEEE 37th International Con-ference on, pages 977–987. IEEE, 2017.
[112] P. Thinakaran, D. Guttman, M. Kandemir, M. Arunachalam, R. Khanna,P. Yedlapalli, and N. Ranganathan. Visual Search Optimization, volume 2,pages 191–209. Elsevier Inc., United States, 7 2015.
[113] P. Thinakaran, J. Raj, B. Sharma, M. T. Kandemir, and C. R. Das. Thecurious case of container orchestration and scheduling in gpu-based datacenters.In Proceedings of the ACM Symposium on Cloud Computing, pages 524–524.ACM, 2018.
[114] A. N. Toosi, R. N. Calheiros, R. K. Thulasiram, and R. Buyya. Resourceprovisioning policies to increase iaas provider’s profit in a federated cloud en-vironment. In High Performance Computing and Communications (HPCC),2011 IEEE 13th International Conference on, pages 279–287, Sept 2011.
116

[115] T. Ueda, T. Nakaike, and M. Ohara. Workload characterization for microser-vices. In 2016 IEEE International Symposium on Workload Characterization(IISWC), pages 1–10, Sept 2016.
[116] B. Vamanan, H. B. Sohail, J. Hasan, and T. N. Vijaykumar. Timetrader: Ex-ploiting latency tail to save datacenter energy for online search. In Proceedingsof the 48th International Symposium on Microarchitecture, MICRO-48, pages585–597, New York, NY, USA, 2015. ACM.
[117] VMware. Vmware.
[118] VMWare. Vmware esxi and esx.
[119] H. J. Wang, J. C. Platt, Y. Chen, R. Zhang, and Y.-M. Wang. Automaticmisconfiguration troubleshooting with peerpressure. In Proceedings of the 6thConference on Symposium on Opearting Systems Design & Implementation -Volume 6, OSDI’04, pages 17–17, Berkeley, CA, USA, 2004. USENIX Associa-tion.
[120] L. Wang, M. Li, Y. Zhang, T. Ristenpart, and M. Swift. Peeking behind thecurtains of serverless platforms. In 2018 USENIX Annual Technical Conference(USENIX ATC 18), pages 133–146, Boston, MA, 2018. USENIX Association.
[121] G. Welch and G. Bishop. An introduction to the kalman filter. Technical report,Chapel Hill, NC, USA, 1995.
[122] Wikipedia. Amazon Elastic Compute Cloud. https://en.wikipedia.org/
wiki/Amazon_Elastic_Compute_Cloud. Accessed: 2015-08-10.
[123] Wikipedia. Hyper-converged infrastructure — wikipedia, the free encyclopedia,2017. [Online; accessed 5-May-2017].
[124] D. E. Williams. Virtualization with Xen(Tm): Including XenEnterprise,XenServer, and XenExpress: Including XenEnterprise, XenServer, and Xen-Express. Syngress Publishing, 2007.
[125] W. Xu, L. Huang, A. Fox, D. Patterson, and M. I. Jordan. Detecting large-scalesystem problems by mining console logs. In Proceedings of the ACM SIGOPS22Nd Symposium on Operating Systems Principles, SOSP ’09, pages 117–132,New York, NY, USA, 2009. ACM.
[126] H. Yang, A. Breslow, J. Mars, and L. Tang. Bubble-flux: Precise online qos man-agement for increased utilization in warehouse scale computers. In Proceedingsof the 40th Annual International Symposium on Computer Architecture, ISCA’13, pages 607–618, New York, NY, USA, 2013. ACM.
[127] H. Yang, Q. Chen, M. Riaz, Z. Luan, L. Tang, and J. Mars. Powerchief: Intelli-gent power allocation for multi-stage applications to improve responsiveness on
117

power constrained cmp. In Proceedings of the 44th Annual International Sym-posium on Computer Architecture, ISCA ’17, pages 133–146, New York, NY,USA, 2017. ACM.
[128] F. Yates. Contingency tables involving small numbers and the χ 2 test. Sup-plement to the Journal of the Royal Statistical Society, 1(2):217–235, 1934.
[129] M. Zaharia, R. S. Xin, P. Wendell, T. Das, M. Armbrust, A. Dave, X. Meng,J. Rosen, S. Venkataraman, M. J. Franklin, A. Ghodsi, J. Gonzalez, S. Shenker,and I. Stoica. Apache spark: A unified engine for big data processing. Commun.ACM, 59(11):56–65, Oct. 2016.
[130] X. Zhang, E. Tune, R. Hagmann, R. Jnagal, V. Gokhale, and J. Wilkes. Cpi2:Cpu performance isolation for shared compute clusters. In Proceedings of the 8thACM European Conference on Computer Systems, EuroSys ’13, pages 379–391,New York, NY, USA, 2013. ACM.
[131] X. Zhang, E. Tune, R. Hagmann, R. Jnagal, V. Gokhale, and J. Wilkes. Cpi2:Cpu performance isolation for shared compute clusters. In Proceedings of the 8thACM European Conference on Computer Systems, EuroSys ’13, pages 379–391,New York, NY, USA, 2013. ACM.
[132] Y. Zhang, Z. Zheng, and M. Lyu. Exploring latent features for memory-basedqos prediction in cloud computing. In Reliable Distributed Systems (SRDS),2011 30th IEEE Symposium on, pages 1–10, Oct 2011.
[133] S. Zhuravlev, S. Blagodurov, and A. Fedorova. Addressing shared resourcecontention in multicore processors via scheduling. In Proceedings of the FifteenthEdition of ASPLOS on Architectural Support for Programming Languages andOperating Systems, ASPLOS XV, pages 129–142, New York, NY, USA, 2010.ACM.
[134] S. Zhuravlev, S. Blagodurov, and A. Fedorova. Addressing shared resourcecontention in multicore processors via scheduling. SIGPLAN Not., 45(3):129–142, Mar. 2010.
118
Related Documents