Graduate Theses, Dissertations, and Problem Reports 2013 Integrated Marketing Communications (IMC) Variables that Integrated Marketing Communications (IMC) Variables that Influence Perceived Return on Investment (ROI) in higher Influence Perceived Return on Investment (ROI) in higher education: Chief Marketing Officers' perceptions education: Chief Marketing Officers' perceptions Adrienne L. King West Virginia University Follow this and additional works at: https://researchrepository.wvu.edu/etd Recommended Citation Recommended Citation King, Adrienne L., "Integrated Marketing Communications (IMC) Variables that Influence Perceived Return on Investment (ROI) in higher education: Chief Marketing Officers' perceptions" (2013). Graduate Theses, Dissertations, and Problem Reports. 491. https://researchrepository.wvu.edu/etd/491 This Dissertation is protected by copyright and/or related rights. It has been brought to you by the The Research Repository @ WVU with permission from the rights-holder(s). You are free to use this Dissertation in any way that is permitted by the copyright and related rights legislation that applies to your use. For other uses you must obtain permission from the rights-holder(s) directly, unless additional rights are indicated by a Creative Commons license in the record and/ or on the work itself. This Dissertation has been accepted for inclusion in WVU Graduate Theses, Dissertations, and Problem Reports collection by an authorized administrator of The Research Repository @ WVU. For more information, please contact [email protected].

Welcome message from author
This document is posted to help you gain knowledge. Please leave a comment to let me know what you think about it! Share it to your friends and learn new things together.
Transcript
Graduate Theses, Dissertations, and Problem Reports
2013
Integrated Marketing Communications (IMC) Variables that Integrated Marketing Communications (IMC) Variables that
Influence Perceived Return on Investment (ROI) in higher Influence Perceived Return on Investment (ROI) in higher
education: Chief Marketing Officers' perceptions education: Chief Marketing Officers' perceptions
Adrienne L. King West Virginia University
Follow this and additional works at: https://researchrepository.wvu.edu/etd
Recommended Citation Recommended Citation King, Adrienne L., "Integrated Marketing Communications (IMC) Variables that Influence Perceived Return on Investment (ROI) in higher education: Chief Marketing Officers' perceptions" (2013). Graduate Theses, Dissertations, and Problem Reports. 491. https://researchrepository.wvu.edu/etd/491
This Dissertation is protected by copyright and/or related rights. It has been brought to you by the The Research Repository @ WVU with permission from the rights-holder(s). You are free to use this Dissertation in any way that is permitted by the copyright and related rights legislation that applies to your use. For other uses you must obtain permission from the rights-holder(s) directly, unless additional rights are indicated by a Creative Commons license in the record and/ or on the work itself. This Dissertation has been accepted for inclusion in WVU Graduate Theses, Dissertations, and Problem Reports collection by an authorized administrator of The Research Repository @ WVU. For more information, please contact [email protected].
Integrated Marketing Communications (IMC) Variables that Influence Perceived Return on Investment (ROI) in higher education:
Chief Marketing Officers’ perceptions
Adrienne L. King
Dissertation submitted to the College of Education and Human Services
at West Virginia University
in partial fulfillment of the requirements for the degree of
Doctor of Education in Educational Leadership
Reagan Curtis, Ph.D., Chair Ernest Goeres, Ph.D.
Neal Shambaugh, Ph.D. Jay Cole, Ph.D.
Marie Gnage, Ph.D.
Department of Curriculum and Instruction Literacy Studies
Morgantown, West Virginia 2013
Keywords: Integrated Marketing Communications, Higher Education Leadership Copyright 2013 Adrienne L. King

IMC VARIABLES THAT INFLUENCE PERCEIVED ROI IN HIGHER EDUCATION
ABSTRACT
Integrated Marketing Communications (IMC) Variables that Influence Perceived Return on Investment (ROI) in higher education:
Chief Marketing Officers’ perceptions
Adrienne L. King
This study examines the relationship of the level of Integrated Marketing Communications (IMC) implementation, level of open systems and change in state appropriations on perceived return on investment (ROI) in U.S. public higher education institutions (HEIs). Designed to provide HEI leaders with data to more accurately determine the best IMC resource allocations, the analysis represents the responses of 40 Chief Marketing Officers (CMOs) at HEIs with high and very high research activity, as defined by the Carnegie Classification, and Council for the Advancement and Support of Education (CASE) memberships. Building on previous research from the corporate industry indicating four stages of IMC implementation, the researcher first analyzed the participants’ responses to determine their HEI’s level of IMC implementation before running the final multiple regression analysis. The researcher found no statistically significant relationships between the dependent variable (perceived ROI) and the independent variables (level of IMC implementation, level of open systems, and change in state appropriations). The results indicate reliability issues related to the survey instrument and provide evidence for the need of future instrument development.
This dissertation furthers the limited research related to IMC as an organization-wide strategic approach to the problem of institutional survival in an increasingly competitive and evolving market. It confirms the growth of IMC in higher education. The organizational structure reported by participants indicates the growing value of IMC and the CMO’s influence in senior level strategic decisions.
IMC VARIABLES THAT INFLUENCE PERCEIVED ROI IN HIGHER EDUCATION iii
Table of Contents
Table of Contents …….…………………………………………………………………………..iii
Chapter I: Introduction …………………………………………………………………………... 1
Statement of the Research Problem …..………………………….…………………...………... 1
Purpose and Significance of the Study ………………….……………..………………...…….. 2
Research Question ….........….………………………………………………………………… 4
Definition of Terms ……..……………………………………………………………………… 5
Chapter II: Literature Review …………………………………………………………………… 6
Historical Review of IMC ……...………………………………………………………………. 6
Development of IMC ………………………...……………………………………………….. 6
IMC Success in Industry …..………………...……………………………………………….. 7
Four Stages of IMC Framework ……………………………………………………………… 8
Systems Theory as a Framework for Understanding IMC ...…………………………….… 10
Challenges of IMC ………..……………………..……………………………………………. 12
Measuring ROI…………………………………………………………………………......... 12
Long-term Investment ...…………………………………………………………………….. 12
Organization-wide Support …………..……………………………………………………… 12
IMC in Higher Education ……………………………………………………………..………. 13
A Competitive Landscape …………………………………………………………………… 13
From Corporate to Higher Education ...……………………………………………………... 14
Campus Marketing Leader …………..……………………………………………………… 15
Brand Identity & Equity.…………...……………………………………………………...… 15
Business Strategy ………...…………..…………………………………………………….... 16
IMC VARIABLES THAT INFLUENCE PERCEIVED ROI IN HIGHER EDUCATION iv
Summary ……………………………..……………………………………………………… 17
Chapter III: Methodology ……………………………………………………………………… 18
Research Question ……………………………………………………………………………. 18
Participants ……………………………………………………………………………………. 18
Selection Criteria ……………………………………………………………………………. 18
Sample Size ………………………………………………………………………………….. 19
Respondents ………...……………………………………………………………………….. 19
Institutional Demographics …...…………………………………………………………….20
Organizational Structure ……...…………………………………………………………….20
Respondent Demographics …...…………………………………………………………….21
Measurement …………………………………………………………………………….…… 23
Design ………………………………………………………………………………………… 24
Procedures …………………………………………………………………………………….. 25
Data Analysis …………………………………………………………………………………. 25
Chapter IV: Results …………………………………………………………..………………… 29
Descriptive Statistics …………………………………………………………………………. 29
Return on Investment …..……………………………………………………………………. 29
Level of IMC Implementation ………………………………………………………………. 30
Level of Open Systems Achieved……………………………………………………………. 31
Change in State Appropriations ……..………………………………………………………. 31
Correlations ……………………...…..………………………………………………………. 32
Multiple Regression Analysis…………………………………………………………………. 33
Assumptions Assessment …..…….…………………………………………………………. 32
IMC VARIABLES THAT INFLUENCE PERCEIVED ROI IN HIGHER EDUCATION v
Summary …………………...…………………………………………………………………. 35
Chapter V: Discussion ……...………………………………………………..………………… 36
IMC in Higher Education ……………………………………………………………………...36
Campus Marketing Leader.……………..……………………………………………………. 36
Research Variables ……...……………………………………………………………………...37
IMC Implementation…………………………………………………………………………. 37
Collaboration in an Open System……………………………………………………………. 38
Increased Financial Challenges………………………………………………………………. 39
Research Limitations ……...…………………………………………………………………...39
Recommendations ………..………………………………………………………………….....39
Theoretical Advancement..……………..……………………………………………………. 40
Practical Application.….....……………..……………………………………………………. 40
Future Research.………....……………..……………………………………………………. 41
References ……………………………………………………………………………………… 43
Appendices A, B, C, D, E………………………………………………………………………. 46
Appendix A: Participant Sample……………………………………………………………… 47
Appendix B: Modified Edmiston-Strasser Instrument ……………………………………….. 51
Appendix C: Initial Request Letter …………………………………………………………… 55
Appendix D: Email Survey Request ………………………………………………………….. 56
Appendix E: Participant Titles ……………………………………………………………….. 57
IMC VARIABLES THAT INFLUENCE PERCEIVED ROI IN HIGHER EDUCATION 1
Chapter I: Introduction
First introduced to the corporate world in the late 1980s, the concept of integrated
marketing communication (IMC) is a fairly new phenomenon in American higher education.
Research on the concept within higher education, although limited, suggests that more and more
institutions are beginning to adopt the practice due to increased competition for students and
funding.
Oregon State University (OSU), for example, is facing a plethora of challenges, not
unlike most American higher education institutions (HEI), stemming from the current
competitive landscape. These challenges include declining educational aspirations among
traditionally aged, in-state college students; intense competition for state resources; aggressive
competition among HEIs; and increased competition for federal research funds. In response, in
2009 OSU developed an IMC plan in conjunction with their university-wide strategic plan to
elevate institutional marketing and visibility and further the university’s progress toward its
vision of achieving top-ten status among land grant HEIs (Oregon State University, n.d. para.3).
Administrators of HEIs must face this increasingly competitive environment and respond
to the inevitable question “Why should students choose our institution?” Institutions must
convey their distinctive attributes to prospective students, among others, as they compete, in
many cases, for their very survival.
Statement of the Research Problem
The world of higher education has changed drastically in the last two decades.
Competition for students and funding is at an all-time high. No longer can HEIs rely on the
“Field of Dreams” mentality that “If we build it, they will come.” Add to this increased
competition for enrollment, public and private funding for HEIs is becoming extremely scarce.
IMC VARIABLES THAT INFLUENCE PERCEIVED ROI IN HIGHER EDUCATION 2
Cardona (2007) states that higher education’s response to the “. . . intense competition for
students and funding [has] led campus leaders to embrace marketing and planning as done in
corporate America” (p. 2).
A review of the literature reveals that few research studies have been done to analyze the
return on investment (ROI) in marketing in higher education, and even fewer have examined the
concept of IMC or the role of leadership in successful implementation. One recent study
examined IMC in public HEIs and found the importance of institutional leadership to be the most
frequently mentioned IMC success factor. The study found that senior marketing professionals
working at institutions shown to have reached intermediate or advanced levels of IMC
consistently voiced the importance of leadership’s commitment to IMC and their role in
instituting the coordination of IMC efforts (Edmiston-Strasser, 2007).
The problem is institutional survival in an increasingly competitive and evolving market.
IMC as an organization-wide strategic approach is helping bring about institutional solvency, as
previously proven in the business industry. In light of the growing competitive landscape, HEI
administrators have the immense responsibility to lead their institutions during this challenging
time with fewer and fewer resources. They must know that the resource investment will pay off
in stabilizing their institution’s future survival.
Purpose and Significance of the Study
This study builds on the limited, but growing, research available on IMC in higher
education. In addition, it provides a research foundation for institutional leaders to use when
making data-driven decisions regarding resource allocations. Successful implementation of IMC
is resource dependent and complex in a bureaucratic system, which conflicts with the very idea
of integration. The system of higher education in the United States is divided into colleges,
IMC VARIABLES THAT INFLUENCE PERCEIVED ROI IN HIGHER EDUCATION 3
divisions and departments, each of which, by their very nature, are independent and often
divisive.
As the competitive forecast continues for HEIs, universities must harness their own
distinctive qualities, constituent feedback and research to build stronger brand awareness and
institutional recognition. Requiring substantial coordination, these efforts are resource intensive
– requiring both financial and human resource investments. The ROI, however, has the potential
to propel the institution forward and secure its future.
As one case study illustrated, when a private research university in the northeastern
United States successfully implemented an integrated marketing communications plan they
realized a variety of strategic successes. These successes included a rise in their U.S. News &
World Report ranking, increased applications and increased student quality (Horrigan, 2007).
As the need for successful IMC and branding has increased in higher education, so has
institutional investment. According to a survey by LipmanHearne, in partnership with the
Council for Advancement and Support of Education (CASE), in the past decade, overall
marketing budgets have increased more than 100 percent. “Clearly, marketing is being
increasingly regarded as a ‘mission critical’ process in higher education, worthy of significant
investment” (LipmanHearne, 2010, p. 1). As Rob Moore, CEO of LipmanHearne explained,
“Smart marketing doesn’t cost money, it makes money…investments in communications and
marketing are directly related to success in fundraising, alumni relations, student recruitment,
and other areas” (p. 2). This suggests that successful IMC is critical.
In consideration of all of the variables impacting HEIs today, declining state funding,
decreasing endowment values, dwindling private funding sources, and increasing competition for
the best and brightest students, institutional leaders have a unique opportunity to strategically
IMC VARIABLES THAT INFLUENCE PERCEIVED ROI IN HIGHER EDUCATION 4
differentiate themselves from the competition with the successful implementation of IMC.
Managed effectively, IMC’s ROI can be seen in the institution’s bottom line.
The significance of successful IMC implementation can obviously be seen in dollars—
increased enrollment and attainment of fundraising goals. It can also be identified in increased
brand awareness and enhanced institutional reputation, which can, ultimately, enable institutions
to attract and retain higher achieving students and more prestigious faculty. The results can be a
continuous circle of improvements for the university.
Although relevant for anyone working in higher education, this study is most significant
for HEI senior administrators. Specifically, these professionals include: (a) university presidents,
(b) vice presidents of advancement, communications, enrollment, and human resources, (c)
college deans, (d) athletic directors, and (e) chief financial officers. Senior administrative
professionals will have a better comprehension of the value of IMC as a strategic function, which
can be used to establish a competitive edge in this challenging market.
Research Question
Is perceived successful ROI related to a. level of IMC implementation, b. level of open
systems achieved, and c. percentage of decline/increase in state appropriations? Can these
independent variables be utilized to predict the potential for successful ROI?
IMC VARIABLES THAT INFLUENCE PERCEIVED ROI IN HIGHER EDUCATION 5
Definition of Terms
Integrated marketing communications. Once defined as simply coordinating tactical
aspects of a marketing and communications program, Schultz (2004) defined IMC as:
A strategic business process used to plan, develop, execute and evaluate coordinated,
measurable, persuasive brand communications programs over time with consumers,
customers, prospects, employees, associates and other targeted relevant external and
internal audiences. The goal is to generate both short-term financial returns and build
long-term brand and shareholder value (p. 8).
Brand Identity. One aspect of IMC’s growing popularity and adoption is its role in
developing and sustaining brand identity and equity. According to Belch and Belch (2009),
“Brand identity is a combination of many factors, including the name, logo, symbols, design,
packaging, and performance of a product or service as well as the image or type of associations
that comes to mind when consumers think about a brand” (p. 16).
Promotional Mix. Tactical elements typically used to accomplish an organization’s
communications objectives include: advertising, direct marketing, interactive/web media, sales
promotion, public relations and personal selling. Each of these tools can have a distinct role in a
well-coordinated IMC program (Belch and Belch, 2009).
IMC VARIABLES THAT INFLUENCE PERCEIVED ROI IN HIGHER EDUCATION 6
Chapter II: Literature Review
This chapter presents an overview of the evolution of Integrated Marketing
Communication (IMC) since its introduction, including the development of a four-stage
framework used to assess IMC implementation and a brief explanation of systems theory as a
model used to further examine IMC as a strategic function within organizations. Challenges of
the IMC strategy, including difficulties calculating direct ROI and gaining organization-wide
buy-in are discussed. Finally, the transition from corporate business strategy to academia is
presented, along with a look at the current competitive forecast for HEIs.
Historical Review of Integrated Marketing Communications
Development of IMC. Integrated Marketing Communications was initially defined as
the coordination of the various tactical elements of marketing communications to achieve a
consistent message across all channels and increased cost efficiency. The tactical elements are
(a) advertising, (b) public relations, (c) direct marketing, (d) sales promotion, (e) online
communication, and (f) social media.
Schultz (2004) explains that IMC has evolved since its initial introduction in the 1980s to
become:
A strategic business process used to plan, develop, execute and evaluate coordinated,
measurable, persuasive brand communications programs over time with consumers,
customers, prospects, employees, associates and other targeted relevant external and
internal audiences. The goal is to generate both short-term financial returns and build
long-term brand and shareholder value (p. 8).
IMC VARIABLES THAT INFLUENCE PERCEIVED ROI IN HIGHER EDUCATION 7
This revised definition represents an ongoing, strategic process rather than simply
integrating one-time tactical efforts. It also recognizes multiple audiences that are an important
part of the process, including internal and external constituents. Finally, defined as a business
process, this evolution now includes an increased emphasis on accountability and outcomes
(Belch and Belch, 2009).
Why the evolution from the traditional Four Ps of marketing developed by Jerome
McCarthy in the late 1950s (product, price, place and promotion)? Several key developments
influenced the shift towards IMC, including the development of digital technology in all areas of
business operations, increased emphasis on branding as a major competitive advantage, and the
demand for value-based business practices that demanded increased accountability (Belch and
Belch, 2009).
IMC success in industry. As this evolution has occurred, many successful businesses
have changed their approach to sales and marketing, instead adopting an IMC approach. Procter
and Gamble (P&G), one of the world’s largest consumer goods producers, used to be one of the
largest mass advertisers in the world. “In 2007 the company spent over $8.5 billion on media
advertising and other forms of promotion – more than the gross domestic product of many
developing countries” (Belch and Belch, 2009, p. 27). In recent years the company’s marketing
strategy has shifted from mass, one-way communication to targeted, relationship-building
strategies emphasized in IMC. Former P&G Global Marketing Officer Jim Stengel explained,
“It’s not about telling and selling. It’s about bringing a relationship mind-set to everything we
do” (Bloom, 2007).
Other product-based corporations like Coca-Cola are utilizing IMC to establish their
brand’s global positioning. Coca-Cola’s “Open Happiness” IMC campaign was rolled out
IMC VARIABLES THAT INFLUENCE PERCEIVED ROI IN HIGHER EDUCATION 8
worldwide in 2009 inviting all “earthlings” to unite in joy and happiness in the world by
consuming Coca-Cola. The campaign focuses on Coca-Cola’s refreshing, optimistic perspective
of the world, uniting consumers worldwide (Paul, 2009).
This shift has also been used successfully in the entertainment and hospitality industry.
Harrah’s Entertainment, the world’s largest gaming company, has been using IMC strategies
such as their Total Rewards program and Customer Relationship Management to ensure
continued growth. Mehling (2007) concluded that Harrah’s IMC success stems from the
company’s data analysis and knowledge about their consumers, thus enabling them to create
demand (p. 25).
Four stages of IMC framework. In 1997, the American Productivity and Quality Center
(APQC) initiated the first systematic qualitative study to benchmark best practices in IMC.
According to this study IMC is developed through a four-stage process “progressing from a
highly practical, tactical orientation to one increasingly driven by an understanding of customers
and their behaviors” (Schultz & Schultz, 2003, p. 21). The research study was one of the first to
focus on organizations that were actually practicing IMC, rather than the ad agencies that were
deploying the output efforts. The study analyzed 22 national organizations that practiced varying
degrees of IMC such as Dow Chemical, FedEx, Fidelity Investments, Hewlett-Packard, USAA,
and Prudential Insurance. The research resulted in several key findings, which were analyzed
using a framework described as the Four Stages of IMC (McGoon, 1998).
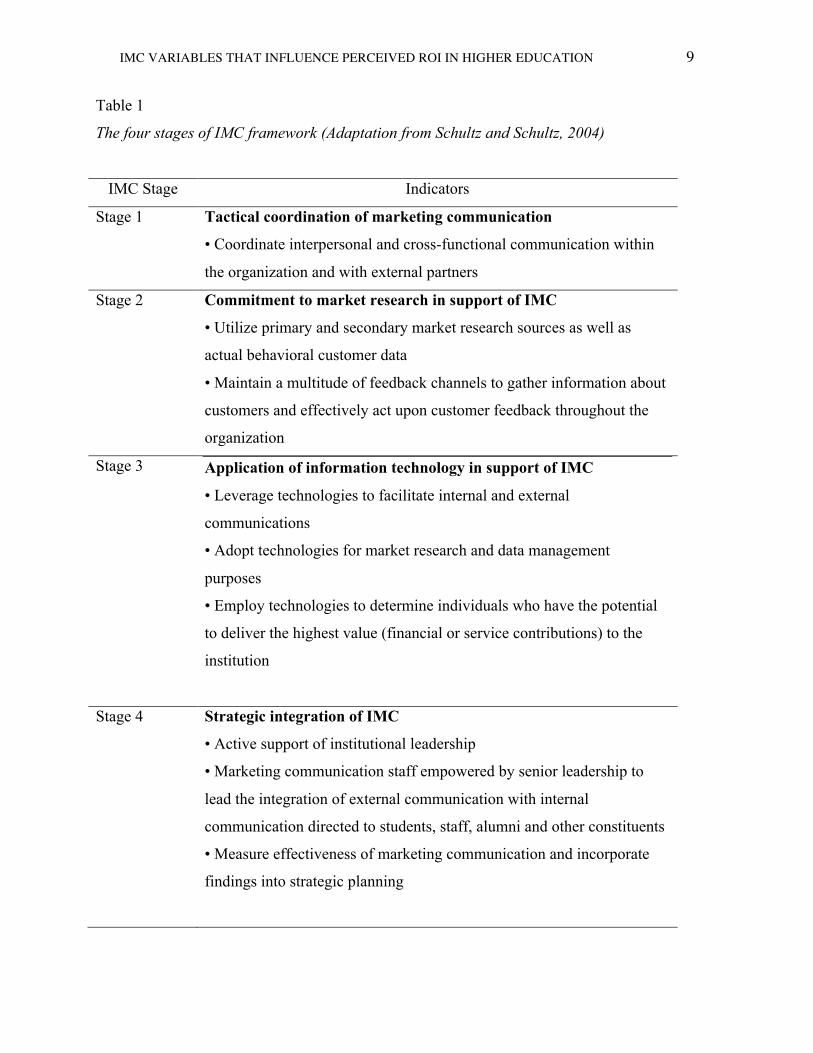
As illustrated in Table 1, Stage 1 involves tactical coordination of an organization’s
marketing communication efforts. The primary focus at this stage is to achieve a consistent
message and voice across channels.
IMC VARIABLES THAT INFLUENCE PERCEIVED ROI IN HIGHER EDUCATION 9
Table 1
The four stages of IMC framework (Adaptation from Schultz and Schultz, 2004)
IMC Stage Indicators
Stage 1 Tactical coordination of marketing communication
• Coordinate interpersonal and cross-functional communication within
the organization and with external partners
Stage 2 Commitment to market research in support of IMC
• Utilize primary and secondary market research sources as well as
actual behavioral customer data
• Maintain a multitude of feedback channels to gather information about
customers and effectively act upon customer feedback throughout the
organization
Stage 3 Application of information technology in support of IMC
• Leverage technologies to facilitate internal and external
communications
• Adopt technologies for market research and data management
purposes
• Employ technologies to determine individuals who have the potential
to deliver the highest value (financial or service contributions) to the
institution
Stage 4 Strategic integration of IMC
• Active support of institutional leadership
• Marketing communication staff empowered by senior leadership to
lead the integration of external communication with internal
communication directed to students, staff, alumni and other constituents
• Measure effectiveness of marketing communication and incorporate
findings into strategic planning
IMC VARIABLES THAT INFLUENCE PERCEIVED ROI IN HIGHER EDUCATION 10
Stage 2 in the framework is defined by an organization’s use of market research in
planning, developing and executing their IMC efforts. Organizations at this stage use primary,
secondary, and actual consumer data to customize their IMC efforts — not just the data
traditionally maintained by the marketing communications department, but all information-
bearing points of contact within the organization. They maintain a multitude of consumer
feedback channels to solicit information and feedback to further develop the organization’s
understanding of who their customers are in terms of demographic information, and also how
and why they do what they do.
In Stage 3, organizations apply information technology in support of their marketing
efforts. They maintain a number of databases and the marketing staff has access to the data for
use in planning IMC programs. They also utilize new technologies to improve how and when
messages are delivered to consumers and other target constituents. According to the APQC study
few organizations were taking advantage of the technology available to more effectively target
their communication programs and determine the costs associated with attracting and retaining
customers (Schultz & Schultz, 2003, p. 29).
At the pinnacle of IMC implementation, Stage 4 realizes strategic integration of IMC into
the organization’s overall strategic objectives. This stage requires support of the organization’s
senior leadership, empowering marketing communications staff and enabling them to customize
the organization’s messaging towards internal and external constituents.
Systems theory as a framework for understanding IMC. Edmiston-Strasser (2007)
stated that, “IMC (in its ideal form) is an integral part of a systemic and interactive process” (p.
17). As such, systems theory can be used as a lens through which to better understand the various
interactive components of the IMC framework. Bertalanffy (1972) added to this understanding
IMC VARIABLES THAT INFLUENCE PERCEIVED ROI IN HIGHER EDUCATION 11
when he said, “since the fundamental character of the living thing is its organization, the
customary investigation of the single parts and processes cannot provide a complete explanation
of the vital phenomena” (p. 410). Bertalanffy argued that one must also consider the interaction
of the parts and processes. The very nature of IMC requires interaction across an organization.
Reidenbach and Oliva (1981) defined marketing as a dynamic systemic process. They
explained that even “the most diehard functionalist would have to agree that marketing involves
more than the four Ps and that it is hard to separate the marketing functions from other
functions” (p. 30) within an organization. Marketing, they argued, deals with “complex,
interrelated operations accomplished within a systemic context” (p. 31).
Successful IMC is accomplished as a result of multiple subunits within an organization
working together toward a common goal. These subunits must also interact with external
components, such as consumers, competitors, and other environmental constituents. This
approach applies to higher education where interdependent relationships are established among
organizations and constituents. Edmiston-Strasser (2007) clarifies this when she stated that “a
university is part of a system comprised of many publics to include students, faculty,
administration, alumni, donors, community members, employers, and other educational
institutions” (p. 19).
The challenge lies within the system of American higher education, which has become
overspecialized creating “functional silos” established to fulfill specific needs of the
organization. Sands and Smith (1999) further explain this situation: “The administrative
hierarchies in American colleges and universities are rooted in technical expertise and areas of
specialized, exclusive knowledge and skill” (p. 49).

IMC VARIABLES THAT INFLUENCE PERCEIVED ROI IN HIGHER EDUCATION 12
Challenges of IMC
Measuring return on investment (ROI). One of the major criticisms of IMC is the
challenge of measuring its effectiveness. Certainly organizations can measure outputs such as the
number of advertisements, press releases, and other marketing pieces that are developed. The
challenge is measuring the outcomes, or impact, of these outputs.
There is often no way to directly link a particular outcome to an organization’s output
efforts. For example, if a customer purchases something with a coupon, one cannot assume that
this particular purchase was the sole result of the coupon. It may have been the result of a
combination of ongoing advertisements, previous product experience, or simply brand
preference. Measuring the interactive effects of the IMC components has proven to be extremely
difficult.
Adding to this challenge, response hierarchy models imply that IMC tactics have
intermediate effects, either consciously or subconsciously, on consumer behavior. Two major
types of intermediate effects include cognitive and affective outcomes. “Cognitive effects
include outcomes such as awareness, knowledge, comprehension and retention. The affective
dimension includes measures such as feelings, attitudes, preferences, desires and intentions”
(Belch and Belch, 2012, p. 8).
Long-term investment. In the current economy many organizations are looking for
immediate returns and instantaneous results. As a strategic function, IMC is not intended to be a
short-term solution to an immediate problem. It requires long-term, strategic planning and a
sustained resource commitment.
Organization-wide support. In its very terminology IMC requires an integrated
approach—dependent upon the buy-in and participation from every unit in the entire
IMC VARIABLES THAT INFLUENCE PERCEIVED ROI IN HIGHER EDUCATION 13
organization. Every facet of the organization must support the IMC efforts in order to fulfill the
IMC objectives. This requires support and directives from the senior executive officer down
through each department of the organization.
IMC in Higher Education
A competitive landscape. The world of higher education has changed drastically in the
last two decades. Competition for students and funding is at an all-time high. Even if students are
interested in a particular institution or program offering, they simply may not come in the
numbers or with the resources necessary to keep the institution viable, let alone growing and
thriving (Sands and Smith, 1999). Not only have the number of U.S. colleges and universities,
including branch campuses, grown, but so have the number of for-profit HEIs such as the
University of Phoenix that have aggressively embraced IMC strategies.
Add to this increased competition for enrollment, public and private funding for HEIs is
becoming extremely scarce. Cardona (2007) explained that, “By the 1990s, intense competition
for students and funding led campus leaders to embrace marketing and planning as done in
corporate America” (p. 2). In 1997, management guru Drucker predicted the need for American
higher education to evolve, “Thirty years from now the big university campuses will be relics.
Universities won’t survive. It’s as large a change as when we first got the printed book” (Lezner
and Johnson, “Education,” para.2).
In order to survive in this increasingly competitive environment, institutions are being forced
to define their “niche” in the higher education industry. They must develop their uniqueness.
Colleges and universities can no longer broadly define themselves as prestigious institutions of
academic excellence. With limited resources, universities cannot be all things to all people. They
IMC VARIABLES THAT INFLUENCE PERCEIVED ROI IN HIGHER EDUCATION 14
must emphasize the programs and services that make them distinctive and focus on new ways to
differentiate themselves from other HEIs.
From corporate to higher education. Initially dismissed as a conflicting value,
marketing practices have only recently been adopted by HEIs as a result of the growing
competition for enrollment and funding. One initial objection against marketing in higher
education was a concern that it would “commercialize” the industry and undermine the integrity
of academia and scholarly standards of quality and excellence.
The research-based marketing models that have been successful in the business industry
have not necessarily translated well in higher education. In many cases they became more of a
coordination effort of communication tactics and promotional messages. The collegial nature of
higher education, coupled with shared governance, led to the creation of elaborate five- and ten-
year plans that were too general and often did not adequately address institutional deficiencies
(Cardona, 2007).
Marketing has grown incrementally in higher education. As administrators begin to see
successful returns on their efforts – that is increased applications, enrollment and the like – they
have been willing to devote more resources to IMC efforts. According to a LipmanHearne/CASE
(2010) survey representing feedback from 212 CASE member institutions on marketing practices
in higher education, marketing is “increasingly being regarded as a ‘mission critical’ process in
higher education, worthy of significant investment” (p. 1). In fact, the survey results indicated
that marketing budgets grew, on average, more than 100 percent from 2001 to 2011. The study
also reported that participating institutions had seen significantly positive impacts of their
marketing efforts in three key areas: (a) brand management, (b) positioning, and (c) quality of
applicants.
IMC VARIABLES THAT INFLUENCE PERCEIVED ROI IN HIGHER EDUCATION 15
Campus marketing leader. Higher education marketing leaders have emerged with the
adoption of IMC on college campuses. These individuals hold administrative positions on
campus. Their acceptance and influence has varied widely from simply coordinating tactical
communications elements to serving as senior leaders in a position to influence long-range,
institutional planning. The resistance to marketing as a business strategy in academia requires
marketing leaders to utilize their interpersonal communication and leadership skills to influence
change. Cardona (2007) provides insight when he stated, “winning university-wide acceptance
may mean changing institutional culture” (p. 22).
Brand identity and equity. IMC’s growing popularity is the direct result of its
successful use in developing, and more importantly, sustaining an organization’s brand identity.
Belch and Belch (2009) defined brand identity as the “combination of many factors, including
the name, logo, symbols, design, packaging, and performance of a product or services as well as
the image or type of associations that come to mind when consumers think about a brand.” In
essence, it encompasses everything a consumer knowingly, and even unconsciously, associates
with a particular product or company.
Although not always defined in financial terms, an organization’s brand identity is of
substantial value. Brand equity is the value of a given brand. According to BusinessWeek (2009),
the top three global brands—Coca-Cola, IBM and Microsoft—are valued at more than $50
billion each.
For-profit corporations are not the only ones to recognize the value of and seek to grow their
brand equity. Based on the first-ever Times Higher Education World Reputation Rankings
survey conducted in 2010-11 American HEIs continue to have a dominant global position. The
rankings suggest that the top six colleges—Harvard University, Massachusetts Institute of
IMC VARIABLES THAT INFLUENCE PERCEIVED ROI IN HIGHER EDUCATION 16
Technology, the University of Cambridge, University of California at Berkeley, Stanford
University and the University of Oxford—form a group of globally recognized "super brands"
(Morgan, 2011).
Brand building efforts typically result in four major areas of return: (a) increased consumer
loyalty, (b) increased consumption, (c) increased consumer spending as a result of growing
customer loyalty, and (d) the ability of the organization to expand based on the increase in
number of consumers, sales, or both (Schultz and Schultz, 2004).
Business strategy. Many HEI leaders have written about the need to adopt a business
perspective when addressing today’s growing challenges. Thor (2006) cited tremendous
opportunity for educators to learn from established and innovative business strategies.
Just like business, higher education in the twenty-first century is facing numerous factors that
are influencing, for better or worse, organizational effectiveness. These include globalization,
changing demographics, mass customization, and often, flattened financial resources (p.10).
The strategies that have long been successful in the world of business are not necessarily
contradictory to the traditional role of higher education and the honored trinity of teaching,
research, and service. They offer solutions to the challenges threatening the survival of our
universities.
In an editorial in The Chronicle of Higher Education, Gee (2011) defined this challenge:
At this moment, American public higher education faces a reality check of the highest order.
Distilled to its essence, the concern takes us back to first principles: Who are we as a
community of learners, and how do we reconfigure ourselves for a financially sustainable
future (para.1)?
IMC VARIABLES THAT INFLUENCE PERCEIVED ROI IN HIGHER EDUCATION 17
Outlining several innovative business-style concepts being implemented at The Ohio State
University to ensure its future, Gee confirmed the University’s commitment to the traditional
values of higher education: “We teach, we learn, we think, we discover, we write and create in
service of our students, our community, our times, and our future. That will never change”
(para.15).
The challenge for HEI leaders is applying business strategies in a transparent fashion
overlying the institution’s mission and service of education. Duderstadt (1997) explained:
While many in the academy would undoubtedly view with derision or alarm the depiction of
the higher education enterprise as an ‘industry,’ operating in a highly competitive,
increasingly deregulated, global marketplace, this is nevertheless an important perspective
that will require a new paradigm for how we think about post-secondary education…
Universities will have to learn to balance the competitive pressures for the millennium-old
model against the new market forces compelling change (p. 14).
Summary
A proven successful business strategy, IMC is now being used by many HEIs to leverage
a competitive advantage in the world of academia. With little research available on its
implementation in higher education, academic leaders’ ability to make smart, data-driven
resource investment decisions has been limited. Assessment of HEIs’ level of IMC
implementation, open-systems orientation, impact of funding increases and decreases, and
successful ROI provides invaluable data for higher education leaders facing this competitive
landscape. This data enables institutional leaders to assess the potential use of IMC as a strategic
function within their organization, as well as determine the best course of investment of their
limited resources.
IMC VARIABLES THAT INFLUENCE PERCEIVED ROI IN HIGHER EDUCATION 18
Chapter III: Methodology
This study was designed to provide Higher Education Institution (HEI) leaders with data
that could be used to more accurately determine the best Integrated Marketing Communications
(IMC) resource allocations. The survey was distributed to 133 chief marketing officers (CMOs)
at public, high and very high research activity institutions in the United States, as defined by the
Carnegie Classification, with CASE memberships in 2012. Designed to analyze the perceived
return on investment (ROI) of HEI’s IMC efforts based on potential predictor variables, the
study included institutions with similar funding and academic stature; as well as those that had a
history of investing institutional resources in IMC efforts.
Research Question
Is perceived successful ROI related to a. level of IMC implementation, b. level of open
systems achieved, and c. percentage of decline/increase in state appropriations? Can these
independent variables be utilized to predict the potential for successful ROI?
Participants
Selection criteria. Participating HEIs were selected based on two pre-determined
criteria. These included: (a) Carnegie classification (public, high and very high research activity
HEIs) and (b) 2012 CASE membership.
For comparison purposes, it was critical that the participants’ institutions be comparable
in funding and academic stature. For this reason, the first criterion selected was the participants’
institution’s Carnegie classification.
First published in 1973, the Carnegie Classification is the leading framework for
comparing peer U.S. HEIs based on similar attributes. The framework was updated in 2005 to
reflect the current landscape in American higher education. The new classification formula
IMC VARIABLES THAT INFLUENCE PERCEIVED ROI IN HIGHER EDUCATION 19
includes a variety of factors such as research and development spending, number of post-docs
and non-faculty research staff members with a doctorate, and number of doctoral degrees
conferred (Jaschik, 2006).
Participating institutions in the United States were selected based on their current
Carnegie Classification. One hundred and forty-six HEIs were identified as public institutions
with a high or very high research classification. It was then determined which of these HEIs held
a current CASE membership. This second criterion was selected as evidence of the participants’
institution’s current resource commitment to IMC efforts.
Founded in 1974, CASE is the world’s largest nonprofit education association. Members
of CASE include more than 3,500 colleges and universities, primary and secondary independent
and international schools and nonprofit education organizations in 74 countries. The professional
organization helps educational institutions build stronger relationships with alumni and donors,
increase fundraising, market the institution, and recruit prospective students.
Sample size. These criteria narrowed the participant pool to CMOs at public HEIs in the
United States facing similar enrollment and funding challenges. Of the 146 HEIs identified as
meeting the first selection criteria, 133 held CASE memberships in 2012 (Appendix A),
illustrating a financial commitment to IMC in their organization. The survey instrument was
distributed to the CMOs at these 133 HEIs for this study.
Respondents. Forty-six survey responses were received. However, six did not include
sufficient data to define all three independent variables needed for the analysis and were
therefore omitted. One participant responded to all questions except for those related to the
HEI’s state location and enrollment. This participant’s responses were included in descriptive
analysis where possible. The remaining 40 responses resulted in a 30% response rate. The final

IMC VARIABLES THAT INFLUENCE PERCEIVED ROI IN HIGHER EDUCATION 20
multiple regression analysis included only these 40 responses because they contained sufficient
data to assess all of the independent variables. Thirty-seven respondents indicated that they were
the individual chiefly responsible for marketing and communication efforts at their institution,
while four respondents indicated that they were not. Of these, two responses were received from
HEIs that had requested the survey instrument be redirected to the individual they felt had a
better understanding of their institution’s IMC efforts. These responses were included in the final
analysis because they all held senior-level administrative positions (Vice President, Assistant
Vice President, Director, etc.) indicating first-hand knowledge of their institution’s IMC efforts.
Institutional demographics. The 41 responses included in this analysis represented HEIs
in 29 different states. These institutions’ overall operating budgets ranged from $142 million to
$5.42 billion. Their enrollment (Table 2) ranged from 5,001-10,000 FTE (full-time equivalency)
to more than 20,000 FTE.
Table 2
Participating HEIs’ Current Enrollment
Size Frequency Percent
5,001 – 10,000 FTE 3 7.3
10,001 – 20,000 FTE 10 24.4 20,000+ FTE 27 65.9 Total 40 97.6
Missing 1 2.4
Total 41 100.0

IMC VARIABLES THAT INFLUENCE PERCEIVED ROI IN HIGHER EDUCATION 21
Organizational structure. The CMOs at each of the participating HEIs were identified
using the institution’s website and the CASE directory. As indicated in the survey results, these
individuals’ titles range from Director to Assistant Vice President to Associate Vice President to
Vice President. In some institutions, the titles included Assistant Vice Chancellor and Vice
Chancellor. Their specific titles represented a variety of areas including: Communications,
Public Affairs, Marketing, University Relations, External Affairs and Advancement. As
indicated in Table 3, these individuals held senior-level administrative positions with the
majority reporting directly to the University President or a Vice President.
Table 3
CMOs’ Reporting Structure
Direct Report Frequency Percent President 19 46.3 Vice President 19 46.3 Director 2 4.9 None of the Above 1 2.4 Total 41 100.0
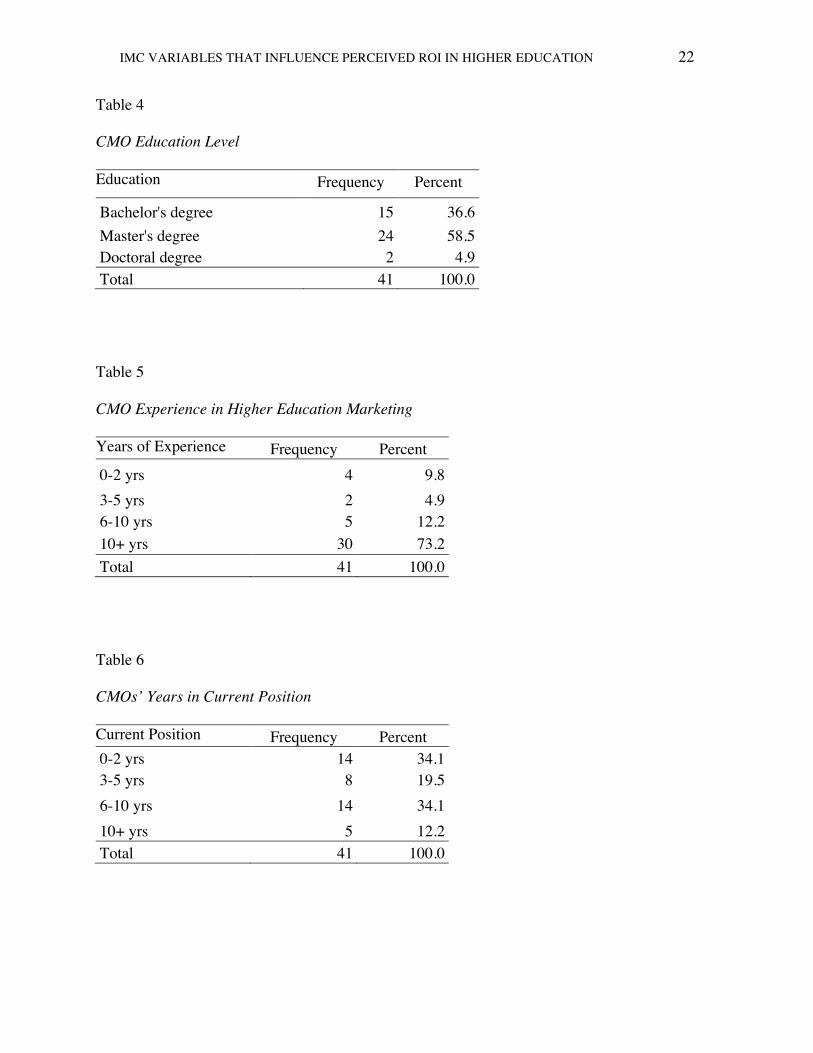
Respondent demographics. The sample included 22 men and 19 women. The sample’s
ethnicity included 38 Caucasians, 2 African Americans, and 1 Hispanic. Their education varied
from bachelor’s degrees to doctoral degrees as seen in Table 4. The majority of the CMOs, 24,
held a master’s degree. Thirty of the participants had more than 10 years of experience in higher
education marketing (Table 5). The time in their current position, however, was more dispersed,
ranging from less than 2 years to more than 10 years (Table 6).
IMC VARIABLES THAT INFLUENCE PERCEIVED ROI IN HIGHER EDUCATION 22
Table 4
CMO Education Level
Education Frequency Percent
Bachelor's degree 15 36.6 Master's degree 24 58.5 Doctoral degree 2 4.9 Total 41 100.0
Table 5
CMO Experience in Higher Education Marketing
Years of Experience Frequency Percent 0-2 yrs 4 9.8 3-5 yrs 2 4.9 6-10 yrs 5 12.2 10+ yrs 30 73.2 Total 41 100.0
Table 6
CMOs’ Years in Current Position
Current Position Frequency Percent 0-2 yrs 14 34.1 3-5 yrs 8 19.5 6-10 yrs 14 34.1 10+ yrs 5 12.2 Total 41 100.0
IMC VARIABLES THAT INFLUENCE PERCEIVED ROI IN HIGHER EDUCATION 23
Measurement
The Edminston-Strasser instrument (ESI) was first developed, and initially administered,
by Edminston-Strasser (2009) to six senior IMC practitioners during a pre-test research stage.
Based on feedback, the instrument was modified before being administered to the 82 selected
public U.S. HEIs in her study. The original ESI included 31 Likert-type scale questions with
specific groupings related to each of the four dimensions of the IMC framework, level of open
systems achieved, and perceived successful ROI.
For the purpose of this study, the ESI was modified before administering it to the 133
selected participants. Additional demographic information including participants’ years of
experience, years of service at their current institution, level of education, gender, and ethnicity
was included in this study. In an effort to strengthen the ESI, the order of the Likert-type scale
questions on the questionnaire was randomly interchanged and included reverse scale questions.
The revised ESI (Appendix B) included alternating positive and negative Likert items in an effort
to reduce response bias. The researcher also removed the “Don’t Know” option from the original
ESI to force participants’ selections. Finally, the instrument’s format was modified for online
distribution.
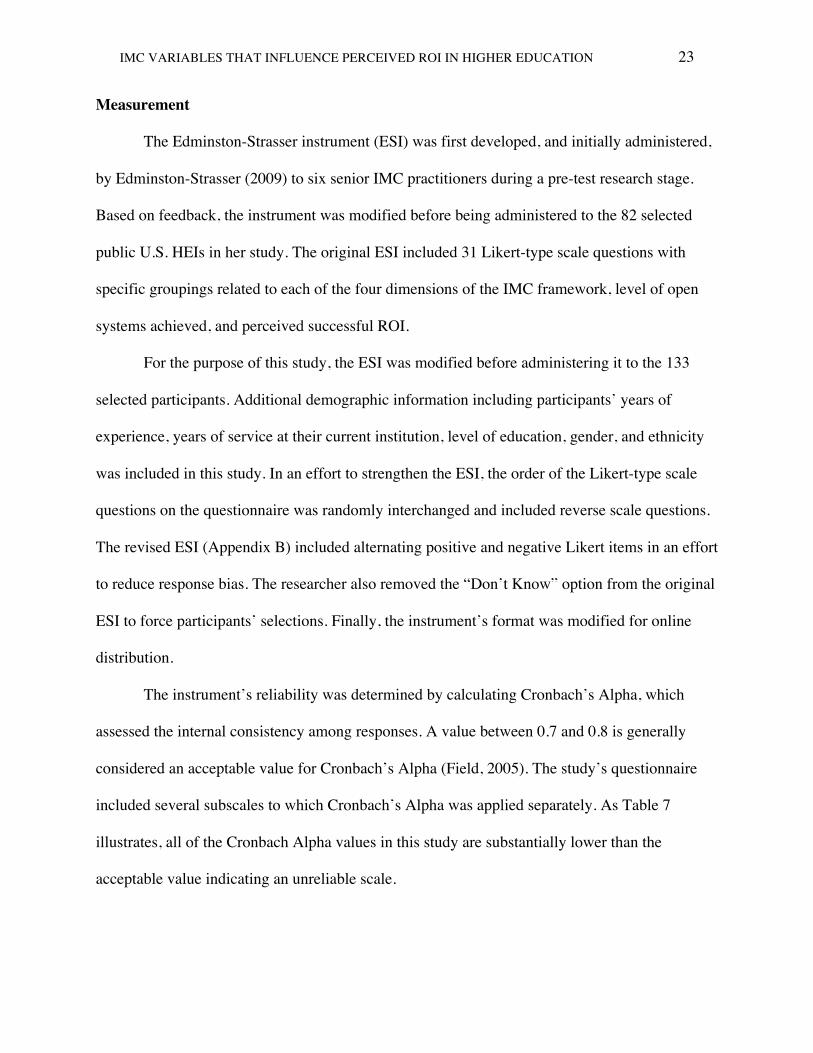
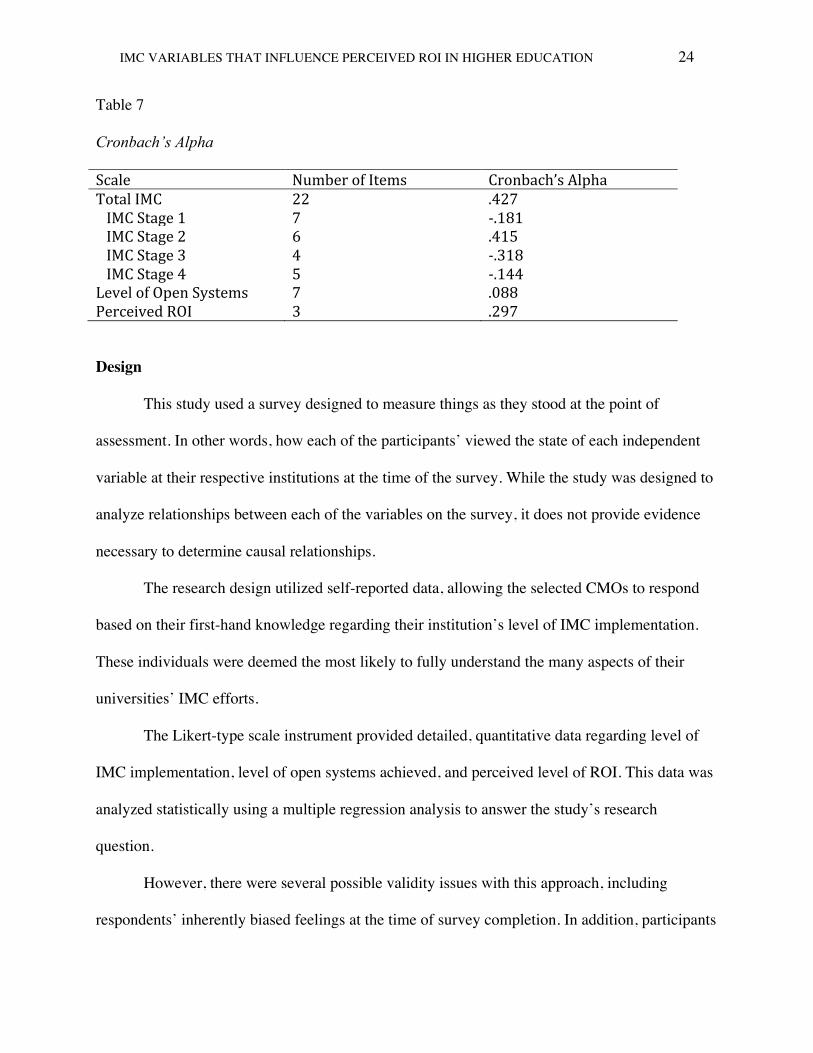
The instrument’s reliability was determined by calculating Cronbach’s Alpha, which
assessed the internal consistency among responses. A value between 0.7 and 0.8 is generally
considered an acceptable value for Cronbach’s Alpha (Field, 2005). The study’s questionnaire
included several subscales to which Cronbach’s Alpha was applied separately. As Table 7
illustrates, all of the Cronbach Alpha values in this study are substantially lower than the
acceptable value indicating an unreliable scale.
IMC VARIABLES THAT INFLUENCE PERCEIVED ROI IN HIGHER EDUCATION 24
Table 7
Cronbach’s Alpha
Scale Number of Items Cronbach’s Alpha Total IMC 22 .427 IMC Stage 1 7 -‐.181 IMC Stage 2 6 .415 IMC Stage 3 4 -‐.318 IMC Stage 4 5 -‐.144 Level of Open Systems 7 .088 Perceived ROI 3 .297
Design
This study used a survey designed to measure things as they stood at the point of
assessment. In other words, how each of the participants’ viewed the state of each independent
variable at their respective institutions at the time of the survey. While the study was designed to
analyze relationships between each of the variables on the survey, it does not provide evidence
necessary to determine causal relationships.
The research design utilized self-reported data, allowing the selected CMOs to respond
based on their first-hand knowledge regarding their institution’s level of IMC implementation.
These individuals were deemed the most likely to fully understand the many aspects of their
universities’ IMC efforts.
The Likert-type scale instrument provided detailed, quantitative data regarding level of
IMC implementation, level of open systems achieved, and perceived level of ROI. This data was
analyzed statistically using a multiple regression analysis to answer the study’s research
question.
However, there were several possible validity issues with this approach, including
respondents’ inherently biased feelings at the time of survey completion. In addition, participants

IMC VARIABLES THAT INFLUENCE PERCEIVED ROI IN HIGHER EDUCATION 25
might have selected the neutral response on the Likert-type scale questions in an effort to quickly
complete the survey or appear less extreme.
Procedures
The researcher received approval through the Human Research Protections Program and
the Institutional Review Board for the Protection of Human Subjects at West Virginia
University. The CMO was identified at each participating HEI using the institutions’ websites
and CASE membership log. This individual held a director or VP level position, with the
primary responsibility of overseeing the university’s IMC efforts. Contact information was
collected using the online CASE membership directory and/or the institutional website.
A hard copy letter (Appendix C) was mailed to each participant on June 7, 2013,
outlining the research objectives and informing the participant that they would be receiving an
online survey the following week. The modified ESI was distributed electronically on June 11
using the Qualtrics survey tool, along with an email request (Appendix D), to the CMOs at each
of the 133 HEIs selected. Follow-up emails were sent on June 18, 25, July 9, 12, and 17.
Individual phone calls were placed to those participants who had not yet responded or opted out
on July 10-11 in an effort to achieve a minimum response rate of 25 percent.
Data Analysis
After the data collection was complete, the researcher prepared the data for analysis.
Each of the survey questions that had not been randomly interchanged to reverse scale were
transposed. A response of 5 then indicated that the participant was strongly in agreement and a
response of 1 signified a strong sense of disagreement.
Demographics of respondents were explored using descriptive statistics. Descriptive
statistics were also analyzed to look at general observations regarding the four dimensions of the
IMC VARIABLES THAT INFLUENCE PERCEIVED ROI IN HIGHER EDUCATION 26
IMC framework, level of open systems achieved, and change in state appropriations. Focus was
placed on analyzing the relationships between the variables in an attempt to answer the study’s
research question.
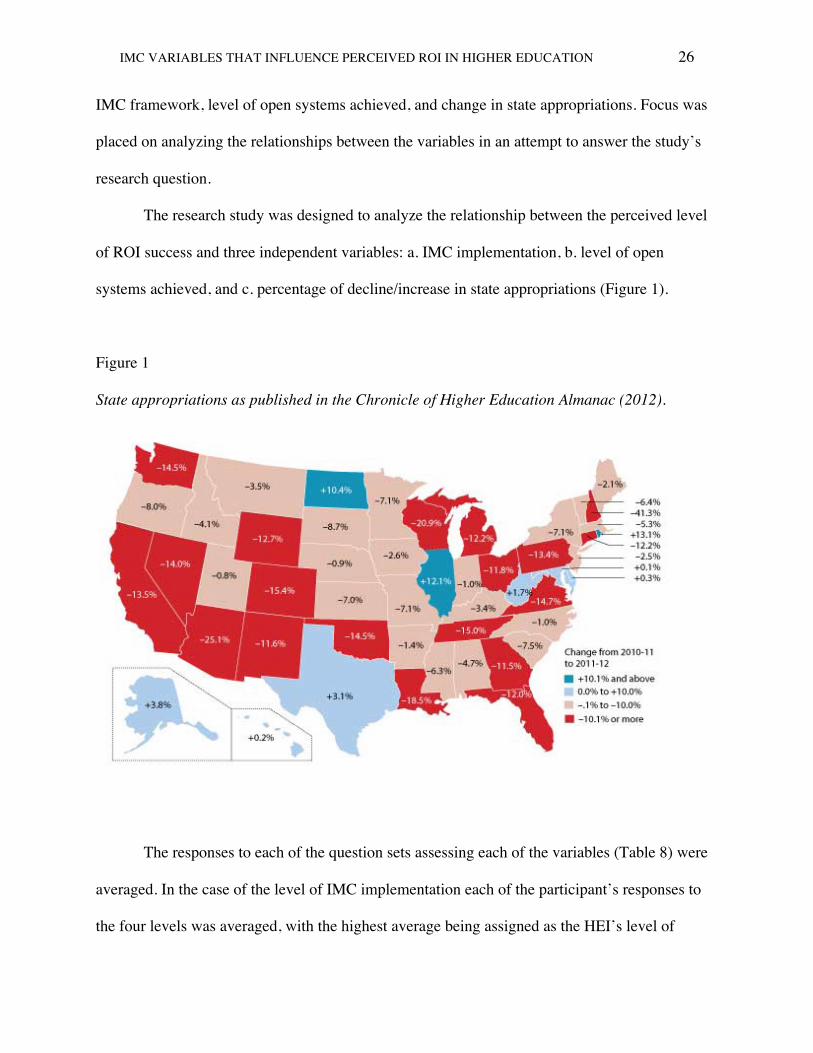
The research study was designed to analyze the relationship between the perceived level
of ROI success and three independent variables: a. IMC implementation, b. level of open
systems achieved, and c. percentage of decline/increase in state appropriations (Figure 1).
Figure 1
State appropriations as published in the Chronicle of Higher Education Almanac (2012).
The responses to each of the question sets assessing each of the variables (Table 8) were
averaged. In the case of the level of IMC implementation each of the participant’s responses to
the four levels was averaged, with the highest average being assigned as the HEI’s level of

IMC VARIABLES THAT INFLUENCE PERCEIVED ROI IN HIGHER EDUCATION 27
implementation. In the case of a tie, the researcher assigned the higher stage to that response
based on the assumption that the IMC stages are part of a linear process and the respective HEI
had demonstrated that their IMC efforts were moving toward the higher level. The researcher
then used dummy variables to convert the averages for each of the levels into categorical data,
which was then combined with the other variables to run a multiple regression analysis. This test
shows how much variance each independent variable accounts for in the prediction equation. In
other words, can any of the independent variables significantly predict ROI of an institution’s
IMC efforts, and to what extent?
Table 8
Variables as assessed in ESI
Variable Survey Question(s)
Level of IMC Implementation Q 14-‐35
• Stage 1: Tactical coordination of marketing communication Q 14-‐20
• Stage 2: Commitment to market research Q 21-‐26
• Stage 3: Application of information technology Q 27-‐30
• Stage 4: Strategic integration of IMC Q 31-‐35
Level of Open Systems Perceived Q 36-‐42
Perceived ROI Q 43-‐45
Change in State Appropriations Q10
IMC VARIABLES THAT INFLUENCE PERCEIVED ROI IN HIGHER EDUCATION 28
The researcher assessed several assumptions. As described, the researcher converted all
predictor variables so that they were categorical, with only two categories, and had some
variation in value. They should have no correlation to other external variables. It was also
assumed that each outcome variable was reported by a separate entity and that the relationship of
the dependent variable and the independent variables was linear, which was assessed by
examining the scatterplots of the dependent variable by each of the independent variables.
Homogeneity of the residuals was assessed by visually examining the scatterplot of standardized
residuals by the standardized predictor values. Multicollinearity was assessed using the variance
inflation factor (VIF) calculated in SPSS to be certain that no two-predictor variables correlated
too highly. The assumption of independent errors was tested with the Durbin-Watson test, which
tests for serial correlations among errors.
IMC VARIABLES THAT INFLUENCE PERCEIVED ROI IN HIGHER EDUCATION 29
Chapter IV: Results
Designed to provide HEI leaders with data to more accurately determine the best
Integrated Marketing Communications (IMC) resource allocations, this study represents the
responses of Chief Marketing Officers (CMOs) at public, high and very high research activity
institutions in the United States, as defined by the Carnegie Classification. In analyzing the
perceived Return on Investment (ROI) of Higher Education Institution’s (HEI) IMC efforts, the
study examined three potential predictor variables: (a) level of IMC implementation, (b) level of
open systems achieved, and (c) change in state appropriations.
Descriptive Statistics
Each of the variables was analyzed using descriptive statistics as described below.
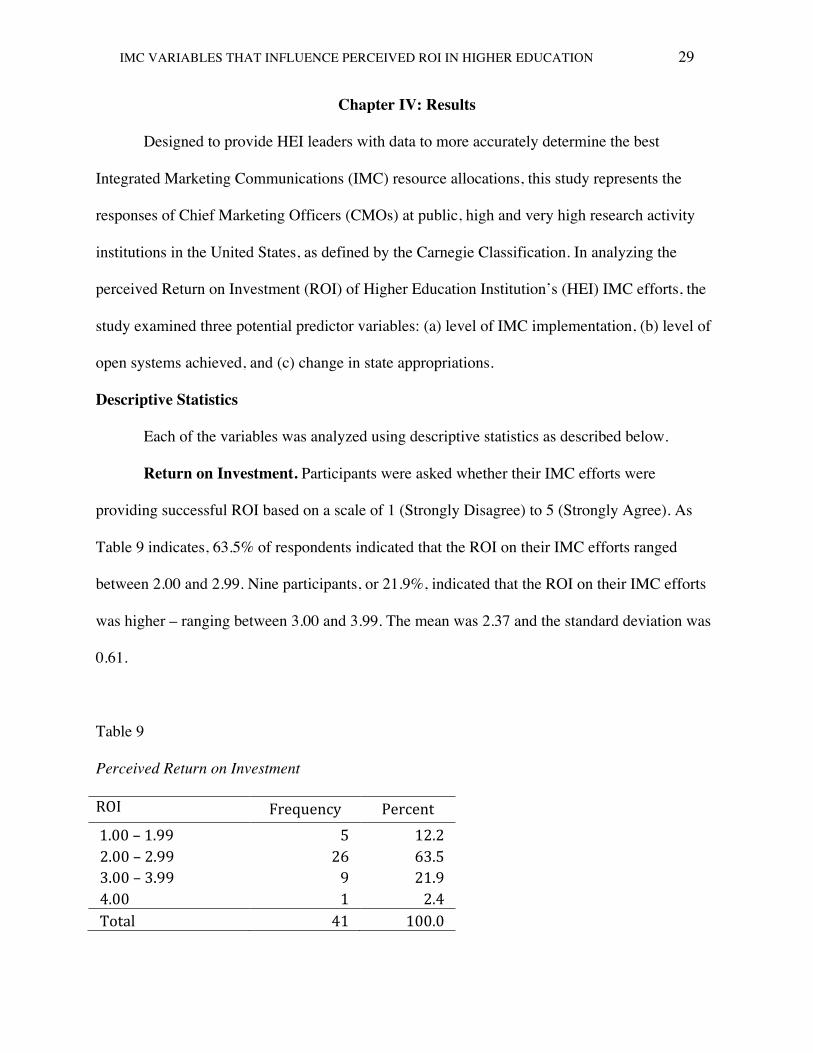
Return on Investment. Participants were asked whether their IMC efforts were
providing successful ROI based on a scale of 1 (Strongly Disagree) to 5 (Strongly Agree). As
Table 9 indicates, 63.5% of respondents indicated that the ROI on their IMC efforts ranged
between 2.00 and 2.99. Nine participants, or 21.9%, indicated that the ROI on their IMC efforts
was higher – ranging between 3.00 and 3.99. The mean was 2.37 and the standard deviation was
0.61.
Table 9
Perceived Return on Investment
ROI Frequency Percent 1.00 – 1.99 5 12.2 2.00 – 2.99 26 63.5 3.00 – 3.99 9 21.9 4.00 1 2.4 Total 41 100.0
IMC VARIABLES THAT INFLUENCE PERCEIVED ROI IN HIGHER EDUCATION 30
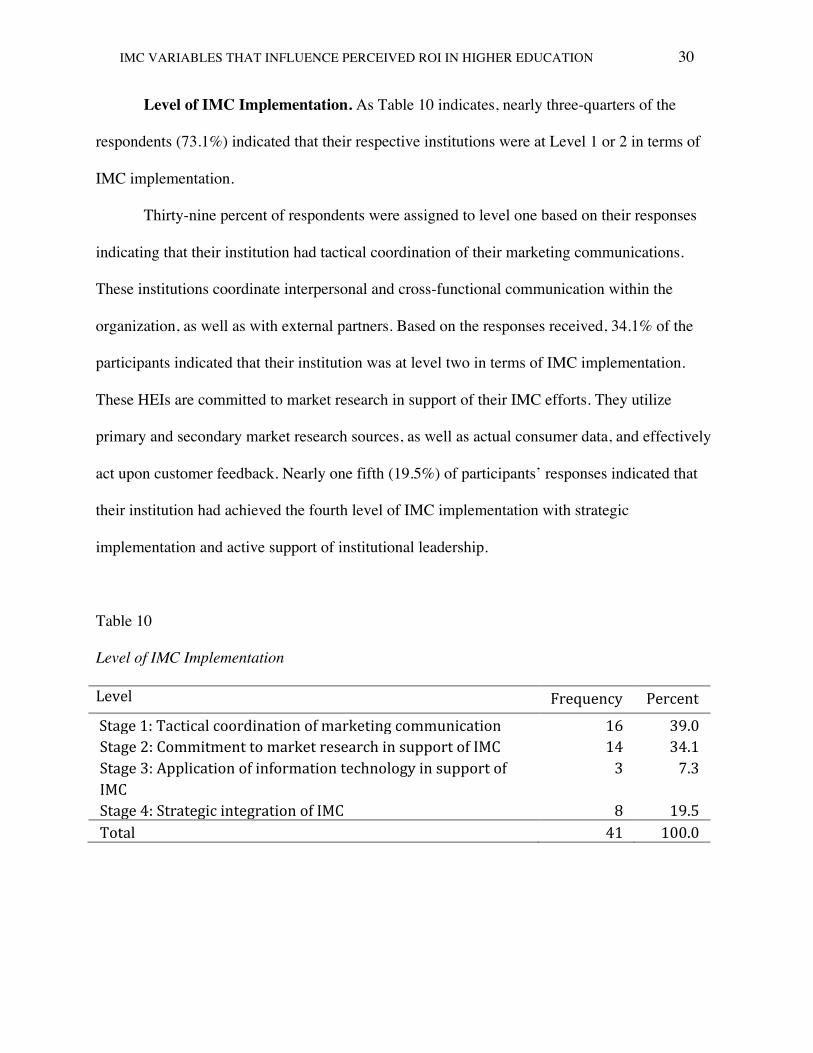
Level of IMC Implementation. As Table 10 indicates, nearly three-quarters of the
respondents (73.1%) indicated that their respective institutions were at Level 1 or 2 in terms of
IMC implementation.
Thirty-nine percent of respondents were assigned to level one based on their responses
indicating that their institution had tactical coordination of their marketing communications.
These institutions coordinate interpersonal and cross-functional communication within the
organization, as well as with external partners. Based on the responses received, 34.1% of the
participants indicated that their institution was at level two in terms of IMC implementation.
These HEIs are committed to market research in support of their IMC efforts. They utilize
primary and secondary market research sources, as well as actual consumer data, and effectively
act upon customer feedback. Nearly one fifth (19.5%) of participants’ responses indicated that
their institution had achieved the fourth level of IMC implementation with strategic
implementation and active support of institutional leadership.
Table 10
Level of IMC Implementation
Level Frequency Percent
Stage 1: Tactical coordination of marketing communication 16 39.0 Stage 2: Commitment to market research in support of IMC 14 34.1 Stage 3: Application of information technology in support of IMC
3 7.3
Stage 4: Strategic integration of IMC 8 19.5 Total 41 100.0

IMC VARIABLES THAT INFLUENCE PERCEIVED ROI IN HIGHER EDUCATION 31
Level of Open Systems Achieved. The extent to which the survey participants viewed
their institution’s level of open systems achieved ranged from 1 (strongly disagree) to 5 (strongly
agree), as illustrated in Table 11. The largest number of participants (17) responses ranged
between 3.01 and 3.49 indicating that these institutions have established some level of
interdependent relationships between departments as needed for their IMC efforts. The mean was
3.29 and the standard deviation was 0.37.
Table 11
Level of Open Systems Achieved
Open Systems Frequency Percent
1.00 – 3.00 13 31.8 3.01 – 3.49 17 41.5 3.50 – 3.99 8 19.6 4.00 3 7.3 Total 41 100.0
Change in State Appropriations. Only 40 of the 41 respondents answered the question
regarding the state in which their institution was located resulting in only 40 responses regarding
this variable. These responses represent public HEIs in 29 different states. As reported in the
Chronicle of Higher Education’s 2012 Almanac, these institutions saw a state appropriation
change ranging from a decrease of 25.1% to an increase of 13.1% last year. The mean percentage
change in state appropriations was -7.46%.
IMC VARIABLES THAT INFLUENCE PERCEIVED ROI IN HIGHER EDUCATION 32
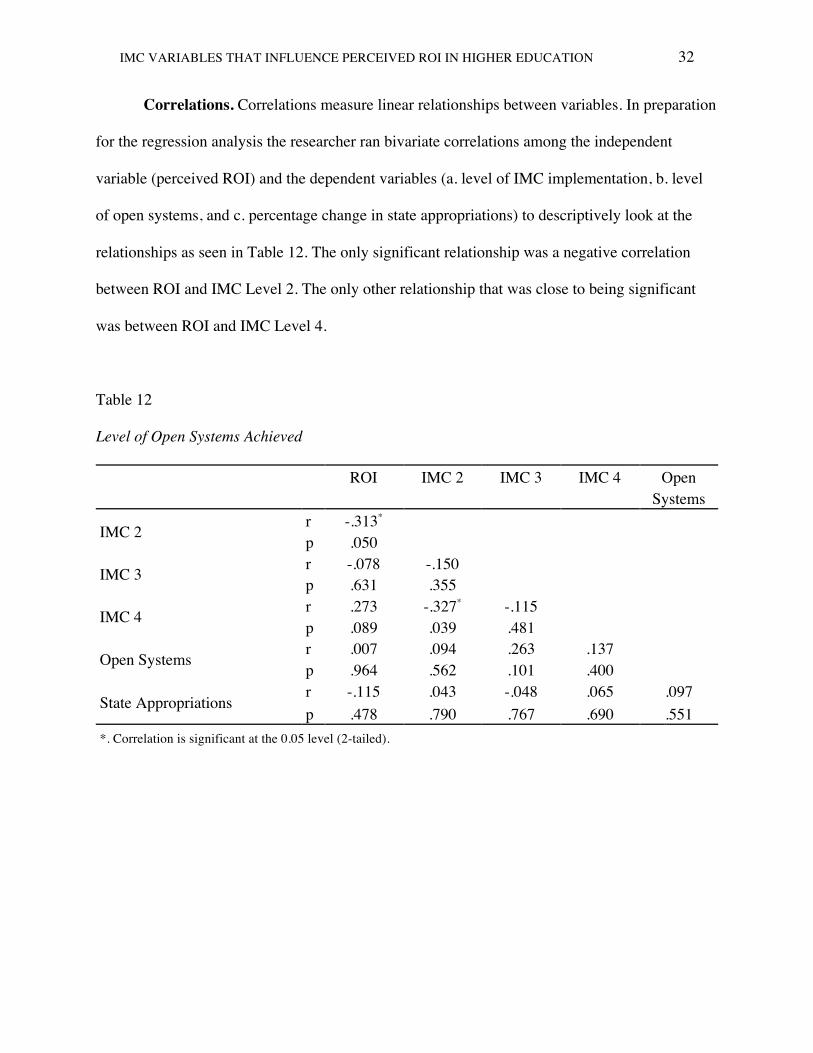
Correlations. Correlations measure linear relationships between variables. In preparation
for the regression analysis the researcher ran bivariate correlations among the independent
variable (perceived ROI) and the dependent variables (a. level of IMC implementation, b. level
of open systems, and c. percentage change in state appropriations) to descriptively look at the
relationships as seen in Table 12. The only significant relationship was a negative correlation
between ROI and IMC Level 2. The only other relationship that was close to being significant
was between ROI and IMC Level 4.
Table 12
Level of Open Systems Achieved
ROI IMC 2 IMC 3 IMC 4 Open Systems
IMC 2 r -.313* p .050
IMC 3 r -.078 -.150 p .631 .355
IMC 4 r .273 -.327* -.115 p .089 .039 .481
Open Systems r .007 .094 .263 .137 p .964 .562 .101 .400
State Appropriations r -.115 .043 -.048 .065 .097 p .478 .790 .767 .690 .551
*. Correlation is significant at the 0.05 level (2-tailed).
IMC VARIABLES THAT INFLUENCE PERCEIVED ROI IN HIGHER EDUCATION 33
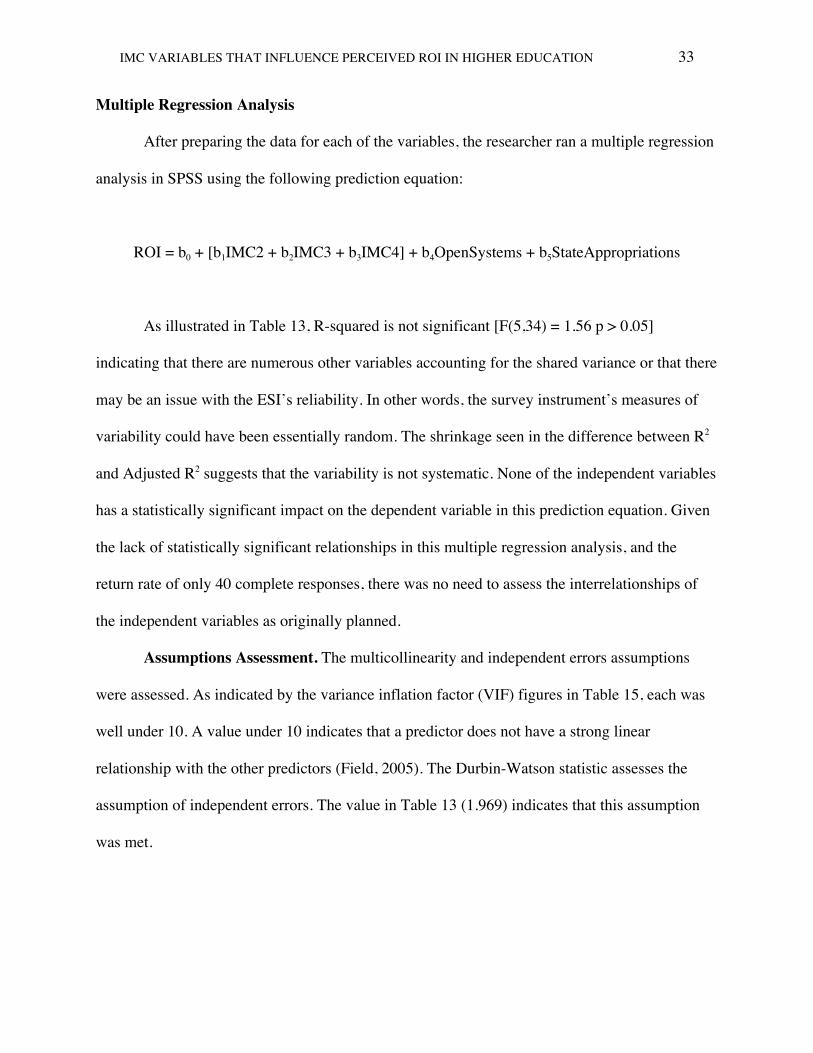
Multiple Regression Analysis
After preparing the data for each of the variables, the researcher ran a multiple regression
analysis in SPSS using the following prediction equation:
ROI = b0 + [b1IMC2 + b2IMC3 + b3IMC4] + b4OpenSystems + b5StateAppropriations
As illustrated in Table 13, R-squared is not significant [F(5,34) = 1.56 p > 0.05]
indicating that there are numerous other variables accounting for the shared variance or that there
may be an issue with the ESI’s reliability. In other words, the survey instrument’s measures of
variability could have been essentially random. The shrinkage seen in the difference between R2
and Adjusted R2 suggests that the variability is not systematic. None of the independent variables
has a statistically significant impact on the dependent variable in this prediction equation. Given
the lack of statistically significant relationships in this multiple regression analysis, and the
return rate of only 40 complete responses, there was no need to assess the interrelationships of
the independent variables as originally planned.
Assumptions Assessment. The multicollinearity and independent errors assumptions
were assessed. As indicated by the variance inflation factor (VIF) figures in Table 15, each was
well under 10. A value under 10 indicates that a predictor does not have a strong linear
relationship with the other predictors (Field, 2005). The Durbin-Watson statistic assesses the
assumption of independent errors. The value in Table 13 (1.969) indicates that this assumption
was met.

IMC VARIABLES THAT INFLUENCE PERCEIVED ROI IN HIGHER EDUCATION 34
Table 13
Model Summaryb
Model R R Square Adjusted R Square Std. Error of the Estimate Durbin-Watson
1 .396a .156 .032 .60863 1.969
a. Predictors: (Constant), q10 Percent change in State Appropriations, IMCStage2d, OpenSysLvl Level of Open Systems, IMCStage3d, IMCStage4d b. Dependent Variable: PercROI Perceived Return on Investment
Table 14
Coefficientsa
Model Unstandardized Coefficients
Standardized Coefficients t Sig.
B SE B β Constant 2.085 .922 2.260 .030 IMC2 -‐.366 .233 -‐.275 -‐1.574 .125 IMC3 -‐.377 .480 -‐.120 -‐.702 .488 IMC4 .260 .267 .170 .973 .338 OpenSystems .089 .283 .054 .315 .755 StateAppropriations -‐.010 .012 -‐.126 -‐.790 .435
a. Dependent Variable: PercROI Perceived Return on Investment
Table 15
Coefficientsa
Model Collinearity Statistics VIF
Constant IMC2 IMC3 IMC4 OpenSystems StateAppropriations
1.227 1.182 1.230 1.174 1.019
a. Dependent Variable: PercROI Perceived Return on Investment

IMC VARIABLES THAT INFLUENCE PERCEIVED ROI IN HIGHER EDUCATION 35
Summary
The prediction equation regressing the independent variables (level of IMC
implementation, level of open systems, and change in state appropriations) on the dependent
variable (perceived ROI) was not significant. The lack of relationship, however, provides further
insight into the field of IMC in higher education. As previously noted in the literature review,
this is an emerging field within higher education with very little past research.

IMC VARIABLES THAT INFLUENCE PERCEIVED ROI IN HIGHER EDUCATION 36
Chapter V: Discussion
This study confirms the growth of Integrated Marketing Communications (IMC) as a
strategic initiative in the sustainability and growth of U.S. Higher Education Institutions (HEIs).
Despite varying levels of IMC implementation reported by the study’s participants, it is apparent
that these Chief Marketing Officers (CMOs) are positioned among the universities’ key
leadership enabling them to influence their institution’s overall strategic decision-making.
IMC in Higher Education
Campus marketing leader. The demographic information regarding the research
participants provides further understanding regarding this field, especially in higher education.
These individuals have a range of educational backgrounds and years of experience. However,
the number of CMOs reporting directly to the university president suggests that this position is
quickly becoming a valued member of the institution’s senior leadership. This may be a positive
indication that the field of IMC is being seen as a strategic initiative with the potential to provide
institutions with a competitive advantage as previously illustrated in corporate industry.
As mentioned in the literature review, this field is still in its infancy – especially in higher
education, which is often hesitant to adopt business models from industry. Horrigan (2007)
reminded us that until recently, marketing and communications efforts were handled
independently by the HEI administrators in various units such as enrollment and development,
without any practical marketing or business background. A senior level administrator responsible
for the oversight of their institution’s IMC efforts is a more recent development. The many job
titles seen in this study’s responses, however, indicate that this position and its responsibilities
are still inconsistent across higher education.

IMC VARIABLES THAT INFLUENCE PERCEIVED ROI IN HIGHER EDUCATION 37
In 2007 Cardona argued that while CMOs were members of the management team, they
are often viewed as tacticians rather than strategists. “To be seen as strategists, they must prove
that they can solve problems beyond their own discipline and effect broad institutional issues that
impact the larger university community. And report directly to the president” (p. 1). The results
of this study indicate that these individuals’ job duties encompass a range of responsibilities
including integrated marketing communications, public affairs, development, and admissions.
Several of the job titles seen in Appendix E actually include the term “strategic” or “strategy,”
which may indicate a new level of acceptance regarding this role in long-term strategic decision
making.
Combined with the financial investment reported in the 2011 LipmanHearne/CASE
survey, it appears that IMC’s role in strategic, outcomes-based decision-making is only
beginning:
Investments in communications and marketing are directly related to success in
fundraising, alumni relations, student recruitment, and other areas. At a time when
schools, colleges, and universities are facing tighter budgets, it’s especially important to
benchmark marketing spending and make sure that every dollar is used wisely and
strategically in support of institutional goals (p. 2).
Research Variables
Although the hypothesis that the study’s independent variables could be used to predict
the dependent variable – perceived ROI – proved null, the independent variables did provide
additional insight into the topic of IMC in higher education.
IMC Implementation. Belch and Belch (2012) described the shift toward the IMC
perspective as “one of the most significant changes” in the history of marketing communications

IMC VARIABLES THAT INFLUENCE PERCEIVED ROI IN HIGHER EDUCATION 38
and as “the major communications development of the last decade of the 20th century” (p. 2).
Based on the results of this study, it appears that HEIs are still in the early stages of IMC
implementation. With nearly three-quarters of the survey respondents indicating that their
respective institutions were only at level one or two in terms of implementation, it appears that
further development of higher education’s IMC efforts is needed. As Schultz and Schultz (2003)
explained, in the third and fourth stages organizations are able to move beyond simple
coordination of their IMC efforts to full integration. Only in stage four can an institution “apply
IMC tools and principles to the overall strategic objectives” (p. 30). This development is critical
to the success of an HEI’s IMC efforts, as well as to the CMO’s ability to move beyond
“tactician” to “strategist”.
Collaboration in an open system. As the literature explains, one of the challenges of
IMC implementation in higher education is the multitude of silos in HEIs. Academia, by its
bureaucratic nature, consists of experts in various fields, departments, units, and colleges. Each
of which operates independently and dependently at the same time. Horrigan’s (2007) research
demonstrated the importance of coordination among these various units in an HEI’s IMC
success. His analysis of successful IMC efforts at a private university emphasized a high degree
of coordination between its cross-functional schools and departments as a significant factor.
Edmiston-Strasser (2007) found that formal communications mechanisms such as the
establishment of a campus-wide marketing committee can increase collaboration, and as a result,
the success of the HEI’s IMC efforts. Her research suggested these types of working committees
can help educate key leaders across campus about the IMC efforts, therefore creating advocates
for the institution’s marketing efforts. In addition, she suggested that including formal marketing
IMC VARIABLES THAT INFLUENCE PERCEIVED ROI IN HIGHER EDUCATION 39
mechanisms such as communications audits and marketing forums could demonstrate the ROI of
an institution’s IMC efforts, which assists in establishing campus-wide support and buy-in.
Increased financial challenges. As the literature describes, IMC efforts require
significant, long-term investments of both time and resources. This can be particularly
challenging for HEIs as they face increased financial challenges. The research sample in this
study consisted of entirely public HEIs. On average, these institutions saw a 7.46% decline in
state appropriations in 2011. According to the most recent Chronicle of Higher Education’s
Almanac (2013), overall spending on higher education declined only slightly in 2012. However,
all indications are that this will not be the continued trend for higher education. In addition to
state appropriations, HEIs must continue to fight for enrollment numbers and private research
funding.
Research Limitations
There were several limitations to this research, including sample size, sample selection,
study design, timing, and measurement reliability. The sample size, although sufficient for the
statistical analysis presented, may not be representative of the general population. The researcher
selected a purposeful sample (high and very high, public HEIs with a CASE membership in
2012), which might also limit the ability to apply the results to all HEIs. Smaller, private
institutions, for example, might provide very different responses than those collected in this
sample. The data used in this study was self-reported, which by its very nature has limits,
including possible participant bias. In addition, the timing of the data collection (Summer) may
have influenced the respondent’s feelings toward the variables given the activities in key areas
such as enrollment and development. Finally, the survey instrument proved to have severe
reliability issues as seen in the assessment of Cronbach’s Alpha. Further instrument development
IMC VARIABLES THAT INFLUENCE PERCEIVED ROI IN HIGHER EDUCATION 40
is needed in order to more accurately assess the study’s variables and their relationships, if any,
on perceived ROI.
Recommendations
Integrated Marketing Communications in higher education will likely continue to evolve
as competitive markets change and funding challenges increase. It is apparent that the initial
resistance to this business concept in higher education is lessening as these challenges provide
new opportunities for those HEIs willing and able to successfully harness this strategy.
Theoretical advancement. The measurement’s reliability issues seen in this study
indicate a critical need for further instrument development. As a result of IMC’s infancy in
higher education, few instruments exist to assess an organization’s IMC implementation level or
other independent variables included in this study. Further instrument development focusing
solely on HEIs’ level of IMC implementation and the reliability assessment of individual
questions across participants would result in a more substantive measurement tool. This tool
could be used to benchmark the current state of an HEI’s IMC implementation, as well as
account for progress and justification of future resource allocations.
It could also be used to further research related to the linear nature of the four IMC stages
of implementation initially defined in the APQC study (Schultz and Schultz, 2003, p. 21). For
example, given resource allocations limiting technological investments, would it possible for a
HEI to advance from stage 2 of implementation to stage 4 without stage 3?
Practical application. The research confirms the growth and influence of IMC in higher
education. The extent to which IMC is integrated in institutional strategic planning is still widely
unknown. Defined as an ongoing, strategic business process with an emphasis on accountability
IMC VARIABLES THAT INFLUENCE PERCEIVED ROI IN HIGHER EDUCATION 41
suggests that institutional IMC efforts should coincide with the university’s long-term strategic
plan.
This requires that CMOs have a “seat at the table” in terms of senior-level decision
making. This study confirms that while IMC implementation in higher education is growing, the
role of the CMO is still ambiguous. Higher education leaders should strive to formalize this role
with a clearly defined title, role, and expectations. This will not only provide clear direction for
professionals currently serving in this role, but also students with IMC career aspirations in
higher education. Additionally, this clarity will enable HEI administrators to more accurately
determine IMC resource allocations and hold CMOs accountable in terms of the ROI of their
institution’s IMC efforts.
Future research. Future research should be conducted seeking input from other
constituents impacted by, or involved in, their HEI’s IMC efforts. These responses could be
compared to those of the institution’s CMO to determine the extent to which their efforts are
truly integrated and shared among the entire campus. In particular, it would be interesting to
compare the responses of the institutional president and the CMO to see if their expectations and
perceptions align.
As noted in this study, it appears that some CMOs are beginning to gain influence and
respect for their contributions in their institution’s overall strategic planning. It would therefore
be interesting to compare their IMC objectives to that of the campus’ strategic, long-range
planning efforts. What role does the institution’s IMC strategy play in the overall strategic plan?
Similar studies could be done to compare different HEIs, including private institutions,
land-grant universities and for-profit institutions. This data could be used to analyze similarities
and differences between these different organizations. For instance, have private institutions
IMC VARIABLES THAT INFLUENCE PERCEIVED ROI IN HIGHER EDUCATION 42
adopted IMC strategies as a means to increase their competitive advantage in this increasingly
challenging economy? Are land-grant universities able to utilize IMC principles in spite of their
mission to provide services to a wide-range of constituents? Have for-profit HEIs been more
successful in implementing IMC as a business strategy because of their focus on profit and
sustainability?
Finally, it would be interesting to examine the long-term success of these efforts as they
relate to enrollment, alumni affinity and fundraising efforts. Are the institutions’ investments in
IMC paying off in terms of brand loyalty, and ultimately, increased revenue? This might be
increased revenue from enrollment due to increased retention or increased donations from alumni
and donors as a result of their commitment to IMC.
IMC VARIABLES THAT INFLUENCE PERCEIVED ROI IN HIGHER EDUCATION 43
References
Belch, G. & Belch, M. (2009). Advertising and promotion: An integrated marketing
communications perspective. New York, NY: McGraw-Hill.
Belch, G. & Belch, M. (2012). Evaluating the effectiveness of elements of integrated
marketing communications: A review of research. Retrieved from
http://imc.sdsu.edu/articles-abstracts/ae_effect-imc.htm
Bertalanffy, L. (1972). The history and status of general systems theory. The Academy
of Management Journal, 15(4), 407-426.
Bloom, Jonah. (2007). Jim Stengel exhorts 4A’s: ‘It’s not about telling and selling’.
AdvertisingAge, March 1, 2007.
Cardona, J. (2007). The emergence of the educational marketer as a campus leader.
(Doctoral dissertation, Rowan University). Retrieved January 12, 2012, from ProQuest
dissertations and theses database.
Duderstadt, J. (1997). “The future of the university in an era of change.” Presented to the
Association of the Collegiate Schools of Planning on March 7, 1997.
Edmiston-Strasser, D. M. (2007) An examination of integrated marketing communication in
U.S. public institutions of higher education (Doctoral dissertation, University of
Maryland University College). Retrieved from the Education Resources Information
Center.
Edmiston-Strasser, D. M. (2009). An examination of integrated marketing
communication in U.S. public institutions of higher education. Journal of Marketing for
Higher Education, 19, 142-165.
Field, Andy. (2005). Discovering statistics using SPSS. London: SAGE Publications Ltd.

IMC VARIABLES THAT INFLUENCE PERCEIVED ROI IN HIGHER EDUCATION 44
Gee, G. E. (2011). Colleges must find innovative ways to finance their missions. The
Chronicle of Higher Education, October 20, 2011.
Horrigan, D. W. (2007). Integrated marketing communications in higher education.
(Doctoral dissertation, University of Connecticut). Retrieved from ProQuest dissertations
and theses database.
Jaschik, S. (2006). The new Carnegie classifications. Inside Higher Education, February 2006.
Lezner, R. & Johnson, S. (1997). Seeing things as they really are. Forbes, March 10, 1997.
Retrieved from http://www.forbes.com/
Lipman Hearne/CASE. (2010). Wondering what works? The changing marketing mix in higher
education: A report on marketing spending at colleges and universities. Lipman Hearne
Key Insights: July 2010. Retrieved from http://www.lipmanhearne.com/home.aspx
McGoon, C. (1998). “Cutting-edge companies use integrated marketing communication.”
Communication World, December 1998.
Mehling, Michael. (2007). Integrated marketing communications strategy: An examination of
Harrah’s Entertainment, Inc. (Professional Paper, University of Nevada, Las Vegas).
Retrieved from http://digitalscholarship.unlv.edu/thesesdissertations/618
Morgan, J. (2011). Six “super-brands”: Their reputations precede them. Times Higher
Education, March 10, 2011.
Oregon State University IMC Strategy and Plan. (n.d.). In Oregon State University website.
Retrieved from http://oregonstate.edu/ua/imc-strategy-and-plan
Paul, Jonathan. (2009). Coca-Cola opens happiness. Strategy, July 2009, pp.15.
Reidenback, E. & Olivia, T. (1981). “General living systems theory and marketing: A
framework for analysis.” Journal of Marketing, 45, 30-37.
IMC VARIABLES THAT INFLUENCE PERCEIVED ROI IN HIGHER EDUCATION 45
Sands, G. & Smith, R. (1999). “Organizing for effective marketing communications in
higher education: Restructuring for your competitive edge in marketing.” Journal of
Marketing for Higher Education, 9(2).
Schultz, D. E. (2004). IMC receives more appropriate definition. Marketing News,
September 15, 2004, pp. 8-9.
Schultz, D. & Schultz, H. (2003). IMC the next generation: Five steps for delivering
value and measuring returns using marketing communication. New York, NY: McGraw-
Hill.
Thor, L. (2006). Bringing the best of business strategies to higher education. Educause:
September/October 2006.
What sets you apart? Times Higher Education: 23 July 2009.
IMC VARIABLES THAT INFLUENCE PERCEIVED ROI IN HIGHER EDUCATION 46
Appendices A, B, C, D, E
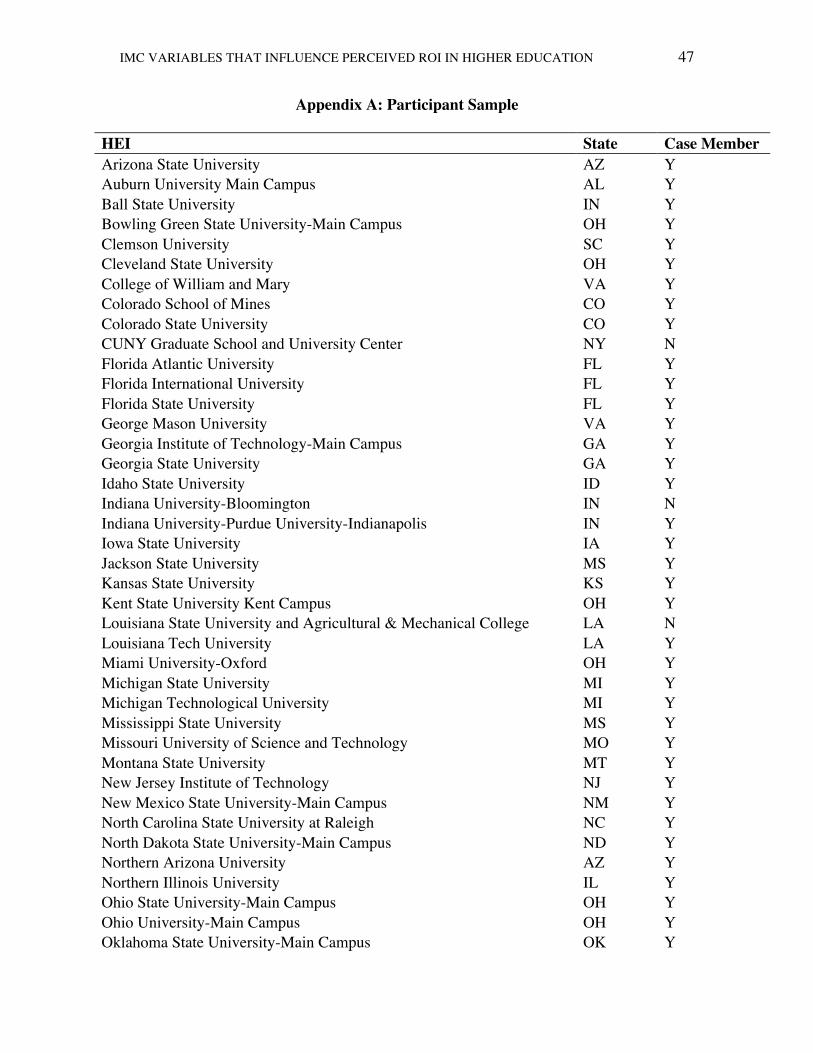
IMC VARIABLES THAT INFLUENCE PERCEIVED ROI IN HIGHER EDUCATION 47
Appendix A: Participant Sample
HEI State Case Member Arizona State University AZ Y Auburn University Main Campus AL Y Ball State University IN Y Bowling Green State University-Main Campus OH Y Clemson University SC Y Cleveland State University OH Y College of William and Mary VA Y Colorado School of Mines CO Y Colorado State University CO Y CUNY Graduate School and University Center NY N Florida Atlantic University FL Y Florida International University FL Y Florida State University FL Y George Mason University VA Y Georgia Institute of Technology-Main Campus GA Y Georgia State University GA Y Idaho State University ID Y Indiana University-Bloomington IN N Indiana University-Purdue University-Indianapolis IN Y Iowa State University IA Y Jackson State University MS Y Kansas State University KS Y Kent State University Kent Campus OH Y Louisiana State University and Agricultural & Mechanical College LA N Louisiana Tech University LA Y Miami University-Oxford OH Y Michigan State University MI Y Michigan Technological University MI Y Mississippi State University MS Y Missouri University of Science and Technology MO Y Montana State University MT Y New Jersey Institute of Technology NJ Y New Mexico State University-Main Campus NM Y North Carolina State University at Raleigh NC Y North Dakota State University-Main Campus ND Y Northern Arizona University AZ Y Northern Illinois University IL Y Ohio State University-Main Campus OH Y Ohio University-Main Campus OH Y Oklahoma State University-Main Campus OK Y

IMC VARIABLES THAT INFLUENCE PERCEIVED ROI IN HIGHER EDUCATION 48
Old Dominion University VA Y Oregon State University OR Y Pennsylvania State University-Main Campus PA Y Portland State University OR Y Purdue University-Main Campus IN Y Rutgers University-New Brunswick NJ Y Rutgers University-Newark NJ Y San Diego State University CA Y South Dakota State University SD Y Southern Illinois University Carbondale IL Y Stony Brook University NY Y SUNY at Albany NY N SUNY at Binghamton NY Y Temple University PA Y Texas A & M University TX Y Texas Tech University TX Y The University of Alabama AL Y The University of Montana MT Y The University of Tennessee TN Y The University of Texas at Arlington TX Y The University of Texas at Austin TX Y The University of Texas at Dallas TX Y The University of Texas at El Paso TX Y The University of Texas at San Antonio TX Y University at Buffalo NY Y University of Akron Main Campus OH N University of Alabama at Birmingham AL Y University of Alabama in Huntsville AL Y University of Alaska Fairbanks AK N University of Arizona AZ N University of Arkansas AR Y University of California-Berkeley CA Y University of California-Davis CA Y University of California-Irvine CA Y University of California-Los Angeles CA Y University of California-Riverside CA Y University of California-San Diego CA Y University of California-Santa Barbara CA N University of California-Santa Cruz CA Y University of Central Florida FL Y University of Cincinnati-Main Campus OH Y University of Colorado at Boulder CO N University of Colorado Denver CO Y
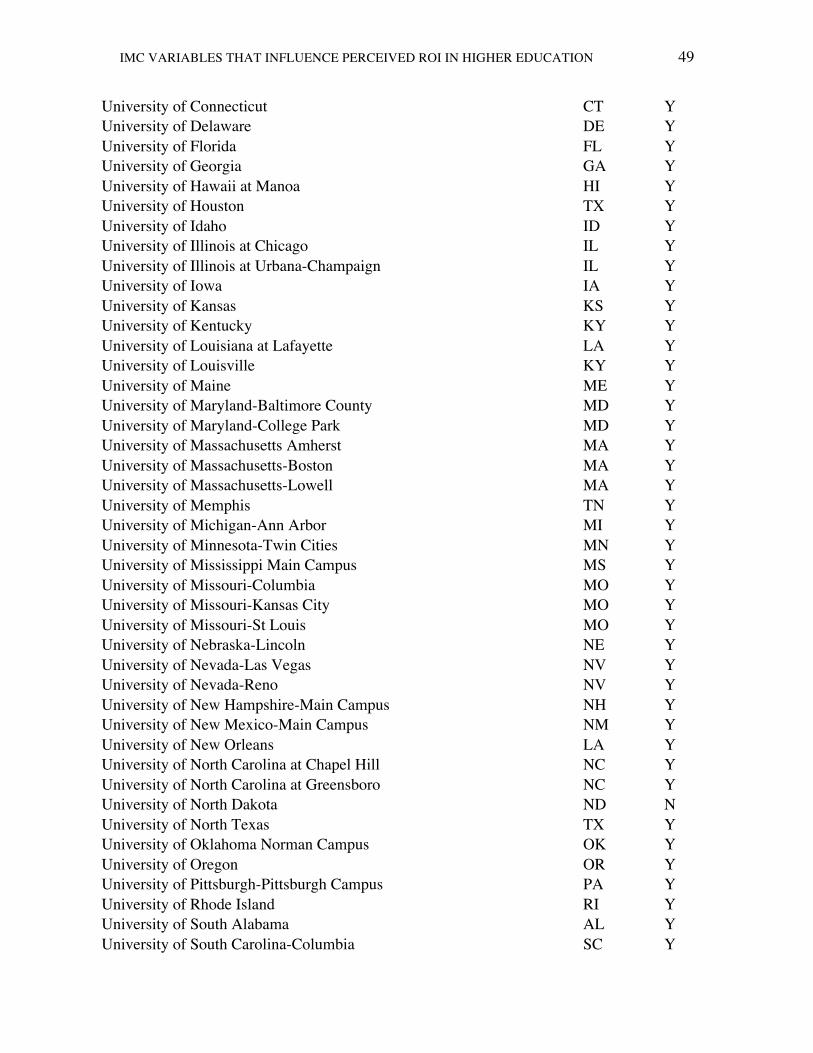
IMC VARIABLES THAT INFLUENCE PERCEIVED ROI IN HIGHER EDUCATION 49
University of Connecticut CT Y University of Delaware DE Y University of Florida FL Y University of Georgia GA Y University of Hawaii at Manoa HI Y University of Houston TX Y University of Idaho ID Y University of Illinois at Chicago IL Y University of Illinois at Urbana-Champaign IL Y University of Iowa IA Y University of Kansas KS Y University of Kentucky KY Y University of Louisiana at Lafayette LA Y University of Louisville KY Y University of Maine ME Y University of Maryland-Baltimore County MD Y University of Maryland-College Park MD Y University of Massachusetts Amherst MA Y University of Massachusetts-Boston MA Y University of Massachusetts-Lowell MA Y University of Memphis TN Y University of Michigan-Ann Arbor MI Y University of Minnesota-Twin Cities MN Y University of Mississippi Main Campus MS Y University of Missouri-Columbia MO Y University of Missouri-Kansas City MO Y University of Missouri-St Louis MO Y University of Nebraska-Lincoln NE Y University of Nevada-Las Vegas NV Y University of Nevada-Reno NV Y University of New Hampshire-Main Campus NH Y University of New Mexico-Main Campus NM Y University of New Orleans LA Y University of North Carolina at Chapel Hill NC Y University of North Carolina at Greensboro NC Y University of North Dakota ND N University of North Texas TX Y University of Oklahoma Norman Campus OK Y University of Oregon OR Y University of Pittsburgh-Pittsburgh Campus PA Y University of Rhode Island RI Y University of South Alabama AL Y University of South Carolina-Columbia SC Y
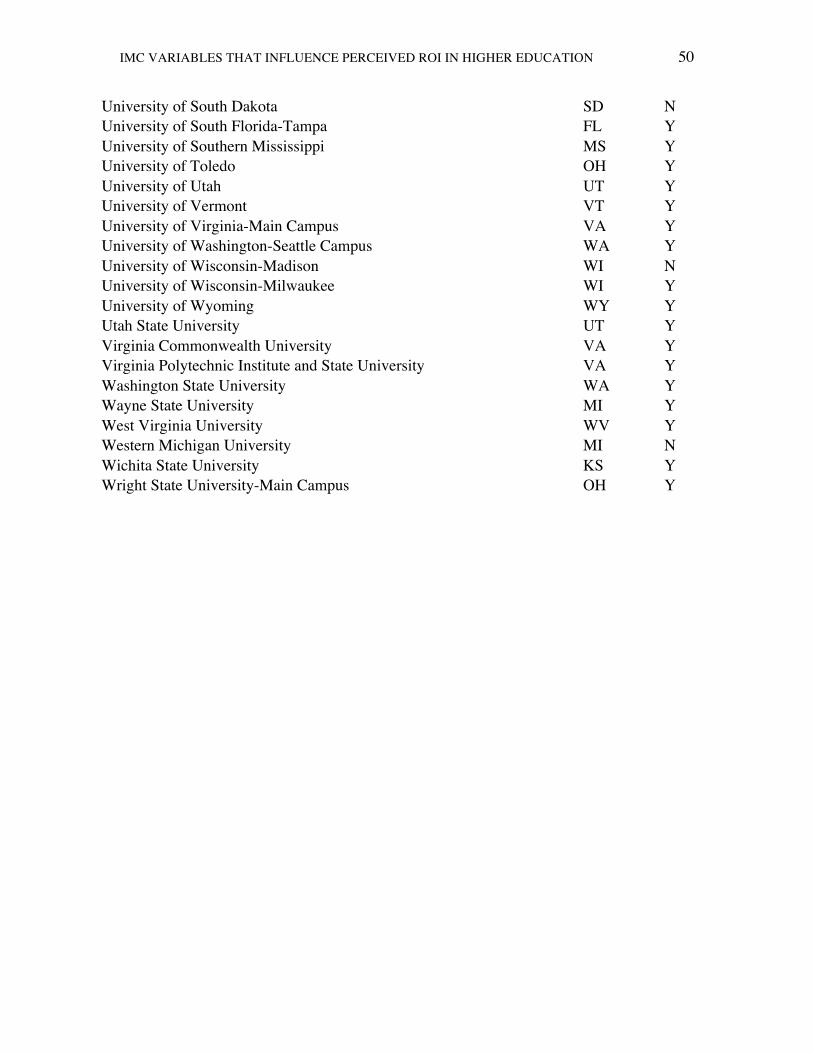
IMC VARIABLES THAT INFLUENCE PERCEIVED ROI IN HIGHER EDUCATION 50
University of South Dakota SD N University of South Florida-Tampa FL Y University of Southern Mississippi MS Y University of Toledo OH Y University of Utah UT Y University of Vermont VT Y University of Virginia-Main Campus VA Y University of Washington-Seattle Campus WA Y University of Wisconsin-Madison WI N University of Wisconsin-Milwaukee WI Y University of Wyoming WY Y Utah State University UT Y Virginia Commonwealth University VA Y Virginia Polytechnic Institute and State University VA Y Washington State University WA Y Wayne State University MI Y West Virginia University WV Y Western Michigan University MI N Wichita State University KS Y Wright State University-Main Campus OH Y

IMC VARIABLES THAT INFLUENCE PERCEIVED ROI IN HIGHER EDUCATION 51
Appendix B: Modified Edmiston-Strasser Instrument This questionnaire is part of a broader study that is examining integrated marketing communication practices in higher education. This survey should take approximately 10 minutes to complete and all individual responses will remain confidential. Your participation is greatly appreciated. 1. Are you the person chiefly responsible for directing your institution-wide marketing and communication efforts? ______ Y ______ N 2. What is your job title? _________________________________________________ 3. Who do you report to? (check one) _____ President of the institution _____ Vice President (or an equivalent title, who reports to the President) _____ Director (or an equivalent title, who reports to a Vice President) _____ None of the above (list title) _____________________________________________ 4. Please list the title of the person you report to ______________________________ 5. How long have you been in their current position within the institution? _____ 0-2 years _____ 3-5 years _____ 6-10 years _____ 10+ years 6. How many years of experience in marketing do you have in higher education? _____ 0-2 years _____ 3-5 years _____ 6-10 years _____ 10+ years 7. What is your highest level of education attained? ____ Bachelor’s degree ____ Master’s degree or equivalent ____ Doctoral degree or equivalent 8. What is your gender? ______ M _______ F 9. What is your ethnicity? 10. In what state is your institution located? ______________________________________________ 11. What is your institution’s overall operating budget? _________________________________ 12. What percentage is state appropriated? _______________________________ 13. Which of the following most closely matches your institution’s current enrollment? _____ Less than 5,000 FTE _____ 5,001 – 10,000 FTE _____ 10,001 – 20,000 FTE _____ 20,000+ FTE
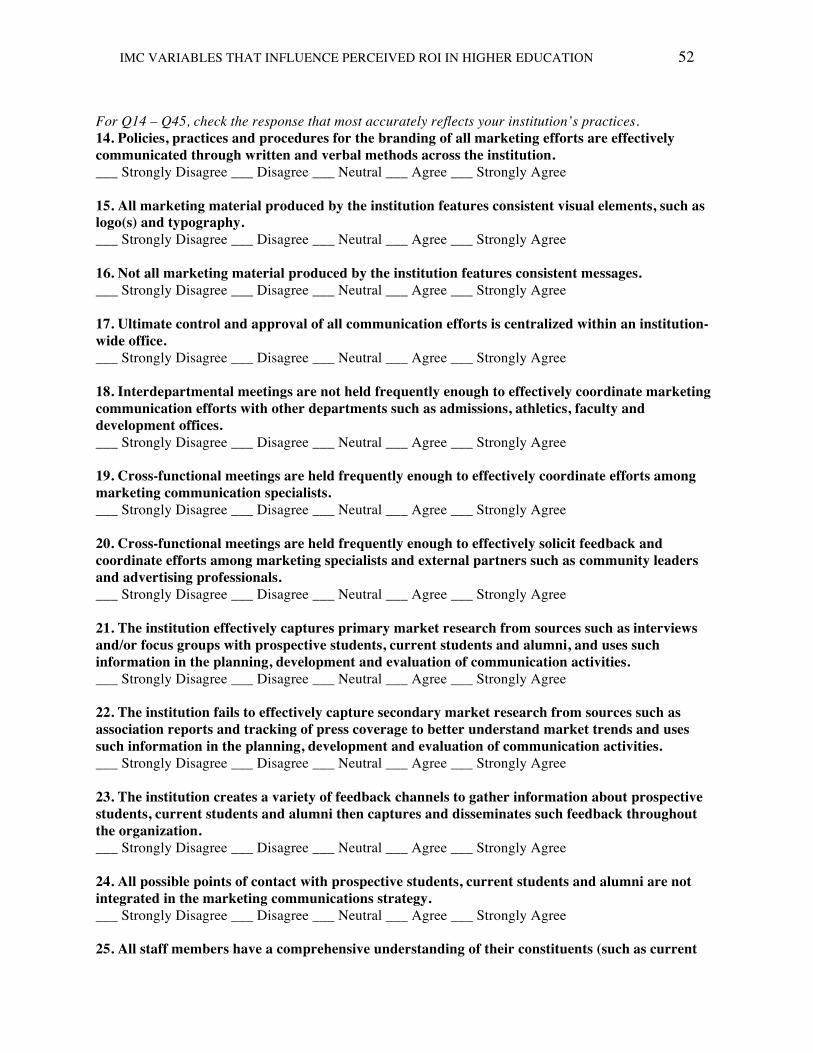
IMC VARIABLES THAT INFLUENCE PERCEIVED ROI IN HIGHER EDUCATION 52
For Q14 – Q45, check the response that most accurately reflects your institution’s practices. 14. Policies, practices and procedures for the branding of all marketing efforts are effectively communicated through written and verbal methods across the institution. ___ Strongly Disagree ___ Disagree ___ Neutral ___ Agree ___ Strongly Agree 15. All marketing material produced by the institution features consistent visual elements, such as logo(s) and typography. ___ Strongly Disagree ___ Disagree ___ Neutral ___ Agree ___ Strongly Agree 16. Not all marketing material produced by the institution features consistent messages. ___ Strongly Disagree ___ Disagree ___ Neutral ___ Agree ___ Strongly Agree 17. Ultimate control and approval of all communication efforts is centralized within an institution-wide office. ___ Strongly Disagree ___ Disagree ___ Neutral ___ Agree ___ Strongly Agree 18. Interdepartmental meetings are not held frequently enough to effectively coordinate marketing communication efforts with other departments such as admissions, athletics, faculty and development offices. ___ Strongly Disagree ___ Disagree ___ Neutral ___ Agree ___ Strongly Agree 19. Cross-functional meetings are held frequently enough to effectively coordinate efforts among marketing communication specialists. ___ Strongly Disagree ___ Disagree ___ Neutral ___ Agree ___ Strongly Agree 20. Cross-functional meetings are held frequently enough to effectively solicit feedback and coordinate efforts among marketing specialists and external partners such as community leaders and advertising professionals. ___ Strongly Disagree ___ Disagree ___ Neutral ___ Agree ___ Strongly Agree 21. The institution effectively captures primary market research from sources such as interviews and/or focus groups with prospective students, current students and alumni, and uses such information in the planning, development and evaluation of communication activities. ___ Strongly Disagree ___ Disagree ___ Neutral ___ Agree ___ Strongly Agree 22. The institution fails to effectively capture secondary market research from sources such as association reports and tracking of press coverage to better understand market trends and uses such information in the planning, development and evaluation of communication activities. ___ Strongly Disagree ___ Disagree ___ Neutral ___ Agree ___ Strongly Agree 23. The institution creates a variety of feedback channels to gather information about prospective students, current students and alumni then captures and disseminates such feedback throughout the organization. ___ Strongly Disagree ___ Disagree ___ Neutral ___ Agree ___ Strongly Agree 24. All possible points of contact with prospective students, current students and alumni are not integrated in the marketing communications strategy. ___ Strongly Disagree ___ Disagree ___ Neutral ___ Agree ___ Strongly Agree 25. All staff members have a comprehensive understanding of their constituents (such as current
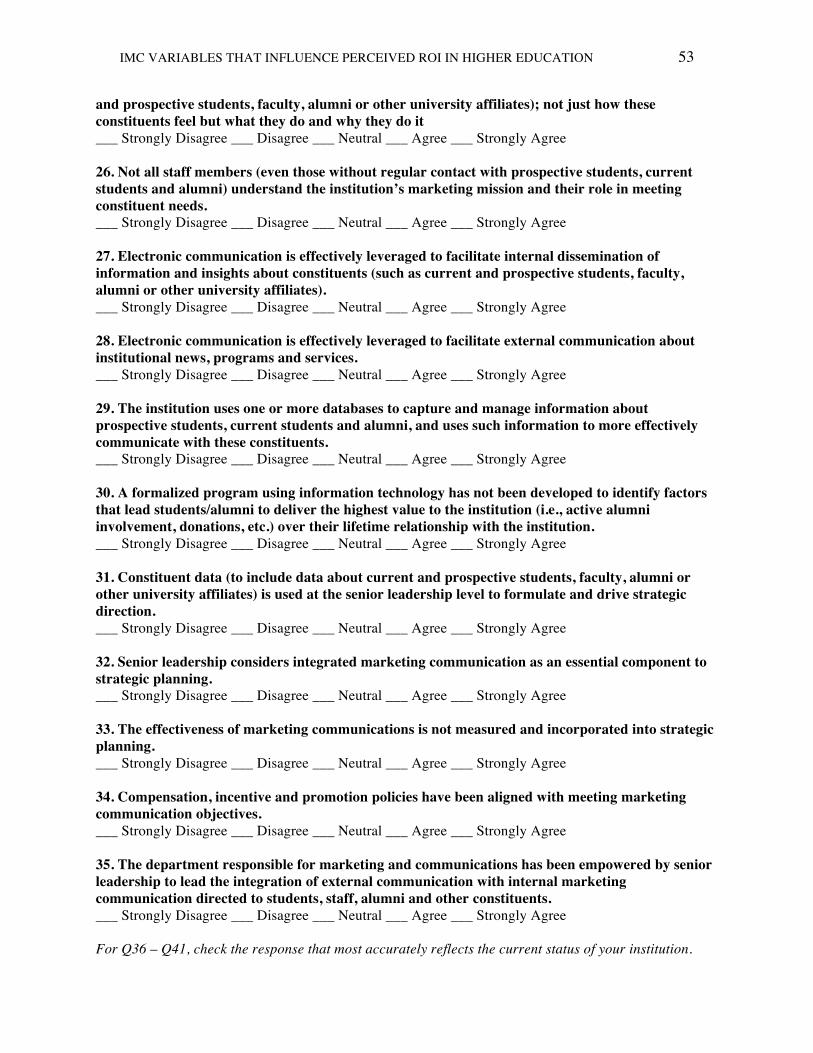
IMC VARIABLES THAT INFLUENCE PERCEIVED ROI IN HIGHER EDUCATION 53
and prospective students, faculty, alumni or other university affiliates); not just how these constituents feel but what they do and why they do it ___ Strongly Disagree ___ Disagree ___ Neutral ___ Agree ___ Strongly Agree 26. Not all staff members (even those without regular contact with prospective students, current students and alumni) understand the institution’s marketing mission and their role in meeting constituent needs. ___ Strongly Disagree ___ Disagree ___ Neutral ___ Agree ___ Strongly Agree 27. Electronic communication is effectively leveraged to facilitate internal dissemination of information and insights about constituents (such as current and prospective students, faculty, alumni or other university affiliates). ___ Strongly Disagree ___ Disagree ___ Neutral ___ Agree ___ Strongly Agree 28. Electronic communication is effectively leveraged to facilitate external communication about institutional news, programs and services. ___ Strongly Disagree ___ Disagree ___ Neutral ___ Agree ___ Strongly Agree 29. The institution uses one or more databases to capture and manage information about prospective students, current students and alumni, and uses such information to more effectively communicate with these constituents. ___ Strongly Disagree ___ Disagree ___ Neutral ___ Agree ___ Strongly Agree 30. A formalized program using information technology has not been developed to identify factors that lead students/alumni to deliver the highest value to the institution (i.e., active alumni involvement, donations, etc.) over their lifetime relationship with the institution. ___ Strongly Disagree ___ Disagree ___ Neutral ___ Agree ___ Strongly Agree 31. Constituent data (to include data about current and prospective students, faculty, alumni or other university affiliates) is used at the senior leadership level to formulate and drive strategic direction. ___ Strongly Disagree ___ Disagree ___ Neutral ___ Agree ___ Strongly Agree 32. Senior leadership considers integrated marketing communication as an essential component to strategic planning. ___ Strongly Disagree ___ Disagree ___ Neutral ___ Agree ___ Strongly Agree 33. The effectiveness of marketing communications is not measured and incorporated into strategic planning. ___ Strongly Disagree ___ Disagree ___ Neutral ___ Agree ___ Strongly Agree 34. Compensation, incentive and promotion policies have been aligned with meeting marketing communication objectives. ___ Strongly Disagree ___ Disagree ___ Neutral ___ Agree ___ Strongly Agree 35. The department responsible for marketing and communications has been empowered by senior leadership to lead the integration of external communication with internal marketing communication directed to students, staff, alumni and other constituents. ___ Strongly Disagree ___ Disagree ___ Neutral ___ Agree ___ Strongly Agree For Q36 – Q41, check the response that most accurately reflects the current status of your institution.
IMC VARIABLES THAT INFLUENCE PERCEIVED ROI IN HIGHER EDUCATION 54
36. Each member of the institution has a clear understanding of his or her individual role within the institution. ___ Strongly Disagree ___ Disagree ___ Neutral ___ Agree ___ Strongly Agree 37. Each member of the institution has a clear understanding of the roles of all other members within the institution. ___ Strongly Disagree ___ Disagree ___ Neutral ___ Agree ___ Strongly Agree 38. Each member of the institution knows and accepts the institutional marketing objectives, and understands how their role contributes to the accomplishment of such objectives. ___ Strongly Disagree ___ Disagree ___ Neutral ___ Agree ___ Strongly Agree 39. The institution has a stable environment (i.e., nominal turnover and turbulence), which enables effective integration and coordination of institution activities. ___ Strongly Disagree ___ Disagree ___ Neutral ___ Agree ___ Strongly Agree 40. The institution is not organized in an efficient manner that enables effective integration and coordination of institution activities. ___ Strongly Disagree ___ Disagree ___ Neutral ___ Agree ___ Strongly Agree 41. The institution has an effective communications network for gathering, evaluating and disseminating information. ___ Strongly Disagree ___ Disagree ___ Neutral ___ Agree ___ Strongly Agree 42. The institution does not formally recognize or reward cooperative and team-centered behavior. ___ Strongly Disagree ___ Disagree ___ Neutral ___ Agree ___ Strongly Agree 43. The institution is achieving set student retention goals. ___ Strongly Disagree ___ Disagree ___ Neutral ___ Agree ___ Strongly Agree 44. The institution is increasingly in a position to be more selective of incoming students. ___ Strongly Disagree ___ Disagree ___ Neutral ___ Agree ___ Strongly Agree 45. The institution is achieving greater brand recognition across key target markets. ___ Strongly Disagree ___ Disagree ___ Neutral ___ Agree ___ Strongly Agree End of survey questions. Thank you for taking the time to complete this survey.
IMC VARIABLES THAT INFLUENCE PERCEIVED ROI IN HIGHER EDUCATION 55
Appendix C: Initial Request Letter
[HEI] [Address] June 7, 2013 Dear [CMO Name]: As we all know, the world of higher education has changed drastically in the last two decades. Competition for students and funding is at an all-time high. As a result, many higher education institutions have adopted Integrated Marketing Communications (IMC) as a strategic response, which requires administrative support and resource investments. Few research studies have been done to analyze the return on this investment. Therefore, I am requesting your participation in the examination of the IMC implementation in academia, which is a partial requirement for the completion of my doctoral studies in Educational Leadership in Higher Education at West Virginia University. The study explores the relationship between (a) the level of institutional IMC implementation, (b) level of open systems achieved, and (c) percentage of decline/increase in state funding on (d) perceived ROI. In a few days you will be receiving an email invitation with a link to the survey instrument, which was adapted from a previous research instrument designed by Edmiston-Strasser in 2007. The survey should take approximately 10 minutes to complete and questions may be skipped. This research has been approved by the West Virginia University Internal Review Board (IRB). The names of all participants and institutions will remain completely anonymous throughout the study and the final research report. Your completed instruments will be identified by a code for follow-up purposes only. Your participation in this study is voluntary, but will be greatly appreciated. If you have questions regarding this study, please contact me via e-mail at [email protected]. You may also contact my dissertation committee chair, Dr. Reagan Curtis at [email protected]. A summary of the study and findings will be forwarded to you at your request. Your time and consideration for participating in this study is greatly appreciated. Sincerely, Adrienne L. King Dr. Reagan Curtis Doctoral Candidate Dissertation Chair Educational Leadership Educational Psychology West Virginia University West Virginia University

IMC VARIABLES THAT INFLUENCE PERCEIVED ROI IN HIGHER EDUCATION 56
Appendix D: Email Survey Request
To: [email address] From: [email protected] Date: June 13, 2013 Subject: Integrated Marketing Communications (IMC) in Academia Questionnaire Body: Dear [CMO Name]: As we all know, the world of higher education has changed drastically in the last two decades. Competition for students and funding is at an all-time high. As a result, many higher education institutions have adopted Integrated Marketing Communications (IMC) as a strategic response, which requires administrative support and resource investments. Few research studies have been done to analyze the return on this investment. Therefore, I am requesting your participation in the examination of the IMC implementation in academia, which is a partial requirement for the completion of my doctoral studies in Educational Leadership in Higher Education at West Virginia University. This study explores the relationship between (a) the level of institutional IMC implementation, (b) level of open systems achieved, and (c) percentage of decline/increase in state funding on (d) perceived ROI. This study involves one survey instrument, which was adapted from a previous research instrument designed by Edmiston-Strasser in 2007. The survey should take approximately 10 minutes to complete and questions may be skipped. This research has been approved by the West Virginia University Internal Review Board (IRB). The names of all participants and institutions will remain completely anonymous throughout the study and the final research report. Your completed instruments will be identified by a code for follow-up purposes only. Your participation in this study is voluntary, but will be greatly appreciated. Below is the link to the survey instrument: [Insert survey link] If you have questions regarding this study, please contact me via e-mail at [email protected]. You may also contact my dissertation committee chair, Dr. Reagan Curtis at [email protected]. A summary of the study and findings will be forwarded to you at your request. Your time and consideration for participating in this study is greatly appreciated. Sincerely, Adrienne L. King Dr. Reagan Curtis Doctoral Candidate Dissertation Chair Educational Leadership Educational Psychology West Virginia University West Virginia University

IMC VARIABLES THAT INFLUENCE PERCEIVED ROI IN HIGHER EDUCATION 57
Appendix E: Participants Titles
Vice President for Public Relations and Marketing Communications Associate Vice President and Chief Marketing Officer Associate Vice President for University Relations Chief Marketing Officer Chief Marketing and Communications Officer Chief Communications Officer Vice Chancellor for Strategic Marketing and Communications Vice President of Strategy, Marketing, Communications and Admissions Senior Associate Vice Chancellor/Chief Marketing Officer Executive Director, University Communications and Marketing Vice Chancellor for Public Affairs Director of University Relations Vice President for Communications Director of Marketing and Communications Vice President University Relations and Development Director of Marketing Vice Chancellor for University Relations Associate Chancellor for Public Affairs Vice President of University Relations and Marketing Assistant Vice President of University Communications Vice President for Advancement Vice President for External Relations Assistant Vice President for Marketing and Communications Executive Director, Public Relations and Marketing Senior Associate Vice President, Communications and Marketing Associate Vice President, Communications and Marketing Director of Web Communications Vice Chancellor for External Affairs Director, Marketing & New Media Associate Vice President for University Communications Director of Marketing and Creative Services Vice President, University Relations
Related Documents


