Scholars' Mine Scholars' Mine Masters Theses Student Theses and Dissertations Fall 2013 Insufficient CT data reconstruction based on directional total Insufficient CT data reconstruction based on directional total variation (DTV) regularized maximum likelihood expectation variation (DTV) regularized maximum likelihood expectation maximization (MLEM) method maximization (MLEM) method Fahima Fahmida Islam Follow this and additional works at: https://scholarsmine.mst.edu/masters_theses Part of the Nuclear Engineering Commons Department: Department: Recommended Citation Recommended Citation Islam, Fahima Fahmida, "Insufficient CT data reconstruction based on directional total variation (DTV) regularized maximum likelihood expectation maximization (MLEM) method" (2013). Masters Theses. 5445. https://scholarsmine.mst.edu/masters_theses/5445 This thesis is brought to you by Scholars' Mine, a service of the Missouri S&T Library and Learning Resources. This work is protected by U. S. Copyright Law. Unauthorized use including reproduction for redistribution requires the permission of the copyright holder. For more information, please contact [email protected].

Welcome message from author
This document is posted to help you gain knowledge. Please leave a comment to let me know what you think about it! Share it to your friends and learn new things together.
Transcript

Scholars' Mine Scholars' Mine
Masters Theses Student Theses and Dissertations
Fall 2013
Insufficient CT data reconstruction based on directional total Insufficient CT data reconstruction based on directional total
variation (DTV) regularized maximum likelihood expectation variation (DTV) regularized maximum likelihood expectation
maximization (MLEM) method maximization (MLEM) method
Fahima Fahmida Islam
Follow this and additional works at: https://scholarsmine.mst.edu/masters_theses
Part of the Nuclear Engineering Commons
Department: Department:
Recommended Citation Recommended Citation Islam, Fahima Fahmida, "Insufficient CT data reconstruction based on directional total variation (DTV) regularized maximum likelihood expectation maximization (MLEM) method" (2013). Masters Theses. 5445. https://scholarsmine.mst.edu/masters_theses/5445
This thesis is brought to you by Scholars' Mine, a service of the Missouri S&T Library and Learning Resources. This work is protected by U. S. Copyright Law. Unauthorized use including reproduction for redistribution requires the permission of the copyright holder. For more information, please contact [email protected].


INSUFFICIENT CT DATA RECONSTRUCTION BASED ON DIRECTIONAL TOTAL
VARIATION (DTV) REGULARIZED MAXIMUM LIKELIHOOD EXPECTATION
MAXIMIZATION (MLEM) METHOD
by
FAHIMA FAHMIDA ISLAM
A THESIS
Presented to the Faculty of the Graduate School of the
MISSOURI UNIVERSITY OF SCIENCE AND TECHNOLOGY
In Partial Fulfillment of the Requirements for the Degree
MASTER OF SCIENCE IN NUCLEAR ENGINEERING
2013
Approved by
Hyoung Koo Lee, Advisor
Ayodeji Alajo
Xin Liu

iii
ABSTRACT
Sparse tomography is an efficient technique which saves time as well as
minimizes cost. However, due to few angular data it implies the image reconstruction
problem as ill-posed. In the ill posed problem, even with exact data constraints, the
inversion cannot be uniquely performed. Therefore, selection of suitable method to
optimize the reconstruction problems plays an important role in sparse data CT. Use of
regularization function is a well-known method to control the artifacts in limited angle
data acquisition. In this work, we propose directional total variation regularized ordered
subset (OS) type image reconstruction method for neutron limited data CT. Total
variation (TV) regularization works as edge preserving regularization which not only
preserves the sharp edge but also reduces many of the artifacts that are very common in
limited data CT. However TV itself is not direction dependent. Therefore, TV is not very
suitable for images with a dominant direction. The images with dominant direction it is
important to know the total variation at certain direction. Hence, here a directional TV is
used as prior term. TV regularization assumes the constraint of piecewise smoothness. As
the original image is not piece wise constant image, sparsifying transform is used to
convert the image in to sparse image or piecewise constant image. Along with this
regularized function (D TV) the likelihood function which is adapted as objective
function. To optimize this objective function a OS type algorithm is used. Generally there
are two methods available to make OS method convergent. This work proposes OS type
directional TV regularized likelihood reconstruction method which yields fast
convergence as well as good quality image. Initial iteration starts with the filtered back
projection (FBP) reconstructed image. The indication of convergence is determined by
the convergence index between two successive reconstructed images. The quality of the
image is assessed by showing the line profile of the reconstructed image. The proposed
method is compared with the commonly used FBP, MLEM, and MLEM-TV algorithm.
In order to verify the performance of the proposed algorithm a Shep-Logan head phantom
is simulated as well as a real neutron CT image is tested to demonstrate the feasibility of
the algorithm for the practical sparse CT reconstruction applications.

iv
ACKNOWLEDGMENTS
I am especially grateful to Dr. Hyoung Koo Lee for giving me the opportunity to
pursue research providing with scientific guidance, constant support and sharing his
knowledge relating to image reconstruction.
I would also like to thank Muhammad Abir for sharing his vast knowledge on
image processing and Matlab. I also thank Dr. Xin Liu and Dr. Ayodeji Alajoa for being
a member of my thesis defense.
Finally, I would like to acknowledge my family members: my father, Muhammad
Nazrul Islam, my mother Mahmuda Islam, my sister Sanzida Islam, my brother in law
Muhammad Azam have supported me in every moment.

v
TABLE OF CONTENTS
Page
ABSTRACT ....................................................................................................................... iii
ACKNOWLEDGMENTS ................................................................................................. iii
LIST OF ILLUSTRATIONS ............................................................................................ vii
LIST OF TABLES ........................................................................................................... viii
NOMENCLATURE .......................................................................................................... ix
SECTION
1. INTRODUCTION ...................................................................................................... 1
1.1. MOTIVATION ................................................................................................... 1
1.2. ORIGINALCONTRIBUTION ........................................................................... 2
1.3. ORGANIZATION OF THESIS ......................................................................... 2
2. BACKGROUND ........................................................................................................ 4
2.1. INTRODUCTION TO NEUTRON .................................................................... 4
2.1.1. Discovery of Neutron. .............................................................................. 4
2.1.2. Properties of Neutrons. ............................................................................. 4
2.1.3. Interaction with Matter and Cross Sections. ............................................ 6
2.2. THE BASICS OF NEUTRON IMAGING ......................................................... 6
2.3. NEUTRON COMPUTED TOMOGRAPHY ..................................................... 9
2.3.1. The Concept of Tomographic Imaging. ................................................... 9
2.3.2. History and Current Trends of Neutron CT. .......................................... 10
2.3.3. Basic Apparatus for Neutron CT Data Acquisition. .............................. 12
2.3.4. The Radon Transform and Inverse Radon Transform. .......................... 17
2.3.5. Neutron CT Reconstruction. .................................................................. 19
2.4. LIMITED DATA NEUTRON TOMOGRAPHY ............................................. 20
2.4.1. Classification of Limited Data Tomography. ......................................... 20
2.4.2. Ill Posed Nature of Limited data CT. ..................................................... 21
3. MATERIALS AND METHODS ............................................................................. 23
3.1. PHANTOM GENERATION ............................................................................ 23
3.2. SINOGRAM GENERATION .......................................................................... 24

vi
3.3. NEUTRON IMAGE ACQUISITION............................................................... 25
3.4. SINOGRAM OF NEUTRON RADIOGRAPHS ............................................. 25
3.5. IMAGE RECONSTRUCTION ........................................................................ 26
3.5.1. Filtered Back Projection ......................................................................... 28
3.5.2. Iterative reconstruction ........................................................................... 29
3.5.2.1. Maximum- likelihood expectation maximization (ML-EM) .....30
3.5.2.2. Total variation ............................................................................30
3.5.2.3. Directional total variation. .........................................................31
3.5.2.4. Ordered subset expectation maximization. ................................33
3.6. PROPOSED TECHNIQUE .............................................................................. 33
3.6.1. Algorithm of DTV-OS-MLEM. ............................................................. 34
4. RESULTS ................................................................................................................. 36
4.1. EVALUATION CRITERIA ............................................................................. 36
4.2. STUDY WITH SHEP-LOGAN HEAD PHANTOM ....................................... 37
4.3. STUDY WITH REAL NEUTRON CT DATA ................................................ 38
5. DISCUSSION AND CONCLUSION ...................................................................... 45
BIBLIOGRAPHY ............................................................................................................. 46
VITA... .............................................................................................................................. 47
vii
LIST OF ILLUSTRATIONS
Page
Figure 2.1. Absorption and scattering of neutrons ............................................................ 6
Figure 2.2. Principle of transmission image formation ..................................................... 7
Figure 2.3. Attenuation coefficients of x-ray and neutrons in different elements ............. 8
Figure 2.4. Method of acquiring projections ................................................................... 10
Figure 2.5. (a) Computed tomography of a (b) Calcitic marble ...................................... 12
Figure 2.6 Principles of accelerators ............................................................................... 13
Figure 2.7. Isotopic neutron sources................................................................................ 14
Figure 2.8. Thermal nuclear reactor source ..................................................................... 16
Figure 2.9. Neutron collimator ........................................................................................ 16
Figure 2.10. Performance of various detection systems .................................................. 17
Figure 2.11. Radon transform .......................................................................................... 18
Figure 2.12. Methods of CT reconstruction .................................................................... 21
Figure 2.13. Different angular position of the detector ................................................... 21
Figure 3.1. Construction of a Shepp-Logan phantom .................................................... 23
Figure 3.2. Process of generating sinogram .................................................................... 24
Figure 3.3. Sinogram of the fuel assembly. ..................................................................... 26
Figure 3.4. Example of projection and back projection calculation. ............................... 26
Figure 3.5. Flow chart of the FBP algorithm................................................................... 29
Figure 3.6. Position relationship between f(x,y) and its neighbor pixels ........................ 31
Figure 3.7. (a) Illustration of the calculation of the TV (b) projection geometry ........... 32
Figure 4.1. Reconstructed image using various algorithms for head phantom ............... 39
Figure 4.2. Line profiles for various reconstruction methods of head phantom ............ 41
Figure 4.3. Comparison of line profiles of head phantom for various reconstruction
algorithms ...................................................................................................... 41
Figure 4.4 The cross section of L07 fuel bundle ............................................................. 42
Figure 4.5. Reconstructed image of nuclear fuel using various algorithm methods. ...... 43
Figure 4.6. Line profiles for various reconstruction methods of nuclear fuel ................. 44

viii
LIST OF TABLES
Page
Table 2.1. Classification of neutrons ................................................................................. 5
Table 2.2. Accelerator Neutron Sources .......................................................................... 13
Table 2.3. Radio isotopic Neutron Sources .................................................................... 15
Table 3.1. Properties of generating Shepp-Logan phantom ............................................ 24
Table 4.1. Evaluation metrics of various reconstruction methods for head phantom ..... 38
Table 4.2. Evaluation metrics of various reconstruction methods for nuclear fuel ......... 42

ix
NOMENCLATURE
Symbol Description
FBP Filtered Back Projection
MLEM Maximum Likelihood Expectation Maximization
TV Total Variation
MAP Maximum-A-Posterior
DTV Directional Total Variation
MAP-TV Maximum A Posterior with Total Variation

1. INTRODUCTION
1.1. MOTIVATION
When irreplaceable and valuable objects are in the scope of an investigation,
computed tomography (CT) is commonly used as the nondestructive evaluation technique
to hold the integrity of an object. In this work for practical application neutron CT will be
used. So the description of the CT will be discussed on the bases of neutron CT. X-ray
CT is widely adapted for medical use to reconstructs the cross section image of a
specimen. However, for some industrial use of CT such as for the nondestructive
inspection of nuclear fuel, neutron computed tomography could be used as well. While
X-rays and gamma rays which interact with the electrons of the atomic shell, and have
the uniform attenuation increment with the atomic number are used for viewing heavy
objects (high atomic number materials) in light materials (low atomic number materials),
the neutron CT may be helpful to view light object wrapped in heavy materials, though
the absorption or scattering of neutron does not show a linear dependence of the total
cross section on the atomic mass. Therefore, as an evaluation technique, neutron CT can
be used to great advantage for many cases.
Conventionally CT requires the 180 degree angular range of data for the cross
sectional image reconstruction of the object. In many applications of computerized
tomography, however, it is not possible or desirable to collect a complete set of data. For
example, in cases such as electron microscopy, astronomy, geophysical exploration and
non-destructive evaluation, data can only be collected over a limited angular range. The
application of limited angle tomography constitutes a substantial advantage over
conventional CT in that it can significantly reduce total imaging time, cost and radiation
dosage applied to the image object or patient. Acquiring data for 180 degree angular
range requires more time. So limited angle tomography is more desirable than
conventional CT. However, limited angular view causes the lower quality image to
interpret the evaluation. So the image reconstruction method is very important in limited
angle tomography. It is desirable to design a reconstruction algorithm that takes into
account different structure scales and yields a reduction in overall computational cost.

2
There are mainly two types of algorithm available for CT reconstruction. One is
analytical method and another one is iterative method. The advantage of using iterative
method over analytical method is the multiple repetitions of iterative algorithm in which
the current solution converges towards a better solution. Although it is claimed that
iterative algorithms takes more time than analytical method, using of some important
regularization parameters make the iterative method faster as well as yield better image
quality. Directional Total variation (DTV) regularization is one of the most important
regularization parameter that is effectively used for limited angle CT to produce better
quality image within reasonable computation cost.
1.2. ORIGINAL CONTRIBUTION
This thesis presents a novel algorithm that efficiently produces high-quality
reconstructions for certain classes of neutron limited-data tomography reconstruction
problems. As the emphasis is placed on the efficiency and effectiveness of the
reconstruction algorithm, several other algorithms are presented to compare with and
analyze the proposed method. Since much of the work reported within was motivated by
the application to neutron computed tomography, the reconstruction algorithm used here
are mostly applicable to neutron computed tomography though there are very little
differences in principle of reconstruction algorithm for neutron CT and x-ray CT.
1.3. ORGANIZATION OF THESIS
This thesis is organized in the following way. Section 2 describes the theory and
background of the thesis. This includes introduction to neutron , the basics of neutron
imaging , the concept of tromographic imaging, history of and current trends in neutron
CT ,basic apparatus used for neutron ct data acquisition, fundamental theory of image
reconstruction, classification of limited angle CT, properties of limited angle CT, the
short description of various reconstruction methods available for limited angle CT
reconstruction. Section 3 describes the method of the proposed image reconstruction
algorithm. Detail explanation of the method and mathematical background of applying
the method are presented. Section 4 contains the result and analysis of the algorithm.
Experimental analysis and quantitative evaluation is demonstrated in this section. The

3
evaluation criteria for image quality are briefly described in this section also. Section 5
presents the concluding remarks of this thesis.

4
2. BACKGROUND
This section presents some background of writing the proposed thesis. In this
chapter, the introduction of neutron, neutron imaging, neutron CT, and the reconstruction
method are described briefly.
2.1. INTRODUCTION TO NEUTRON
This section introduces the neutron with a short summary of its discovery and
continues with a presentation of its properties like its interaction with matters and its
cross sections.
2.1.1. Discovery of Neutron. The neutron was discovered as one of the
constituents of the atom, well after its electrically charged companions the electron and
the proton, for which there is some debate over any individual discoverer. In 1920, E.
Rutherford proposed a close combination of electron and a proton as a neutral doublet,
which he postulated would have novel properties of having the ability to move freely
through matter. Therefore, it would be difficult to detect, and perhaps impossible to
contain in a vessel. The term neutron was apparently first noted in the literature in a
discussion on classifying isotopes in 1921 by W.D. Harkins. However, It took time to
have the conclusive evidence for the existence of the neutron until 1932 when J.
Chadwick reported first the possible existence and shortly thereafter the existence of the
neutron. Chadwick received the 1935 Nobel Prize in Physics quite simply for the
discovery of neutron [1].
2.1.2. Properties of Neutrons. Electrical neutrality is assumed to be the marked
fundamental property of the neutron that makes it so useful in both neutron scattering and
neutron imaging applications. According to Rutherford, as the neutron is uncharged, it
interacts primarily with nuclei with highly penetrating characteristics and well able to
investigate the interior of large assemblies; and as a significant additional benefit, it does
so non-destructively.
Another basic property of the neutron is its mass, mn=1.6749XE-27 Kg, which
gives the neutron a de Broglie wavelength on the order of atomic distances for energies
which is comparable to the excitations in condensed matter at room temperature [1].
Therefore, the neutron is simultaneously sensitive to both length and time scales relevant

5
to condensed matter. This is particularly relevant to neutron scattering applications; but
the microscopic response to length scales is also important for imaging applications,
particularly for polycrystalline materials in which the primary attenuation is due to Bragg
scattering from the crystal lattice. The de Broglie wavelength, λ in units of nm, is given
by
(1)
Where J is Planck’s constant and v is the neutron velocity in
. The neutron energy, E in units of meV, is given by
(2)
A neutron with an energy characteristic of 25.85 meV at a room temperature of 300 K,
will have a velocity of 2224 and a wavelength of 0.18 nm. The neutron carries
momentum as expressed by its wave vector . The direction of is that of the neutron,
while its magnitude | |
Other basic properties of the neutron include an associated nuclear magnetic
moment of and its intrinsic spin of ½. Thus in addition to nuclear
interactions, the neutron will interact with the magnetic moments of unpaired electrons in
matter. Neutrons are loosely assigned to band of energies associated with characteristic
moderator temperatures, as shown in Table 2.1.
Table 2.1. Classification of neutrons [1]
Neutron
Classification
Energy
(meV)
Velocity
(m/s)
λ (nm)
Ultra-cold 0.00025 6.9 57
Cold 1 437 0.9
Thermal 25 2187 0.18
Epithermal 1000 13832 0.029

6
2.1.3. Interaction with Matter and Cross Sections. In neutron imaging
applications, the primary interest lies in neutron interactions that attenuate a well-defined
incident beam of neutrons. Neutrons can be removed from the incident beam either by
absorption or by a change in direction as they interact with material in the beam which is
called scattering. More often, attenuation related to neutron absorption gives the clearer
images than those related to neutron scattering. The absorption and scattering interaction
are shown in Figure 2.1.
Figure 2.1. Absorption and scattering of neutrons [1]
The cross section quantifies the probability that a reaction will take place between
the neutron (travelling at some effective velocity) and the target material; it can be
considered as a target size and it is measured in cm2. There are several types of cross
section but the two that are of principal interest to neutron tomography are the absorption
cross section and the scattering cross section. The total cross section is the some of these
two. The unit of cross section is the ‘barn’, which is 10-24
cm2, and typically cross
sections vary from a few millibarns to several thousand barns. The cross section of the
elements and their isotopes vary with the energy of the bombarding neutrons. In general,
the lower the energy the higher the cross section. This fact provides the opportunity to
increase the transmission of the neutron through the sample
2.2. THE BASICS OF NEUTRON IMAGING
As a fundamental particle, the neutron shows many unique attributes that is very
useful for imaging techniques with a variety of contrast mechanisms. Neutron imaging
has long been known to provide complementary, nondestructive imaging capabilities to

7
X-ray and gamma-ray imaging methods. The neutron imaging principle based on its
cross-section properties. Any analysis of a neutron image, be it film or electronic, begins
with an understanding of how the image is formed. The relationship between the incident
neutron intensity upon an object to be imaged and the transmitted neutron intensity
(ignoring scattering) is the simple exponential attenuation law:
(3)
The transmitted neutron intensity, I, is a function of the incident neutron intensity
Io and the product of the total macroscopic cross section and thickness of the object, .
Macroscopic cross section is the product of microscopic cross section (σ) and number
density (n) of the matter.
Figure 2.2. Principle of transmission image formation
The visibility of objects from neutron CT depends on the absorption cross section
of neutron with that objects. The higher the absorption cross-section of neutron with the
object is, the more visible the object will be. Since the principle of neutron attenuation is
not based upon the same principle of x-ray attenuation, the objects that are poorly visible
with x-ray imaging are easily visible with neutron imaging. For example a piece of paper
in a glass container wrapped in a lead fuel can be better seen with neutron images than
with x-ray images because smaller number of neutron than x-ray are attenuated by lead.
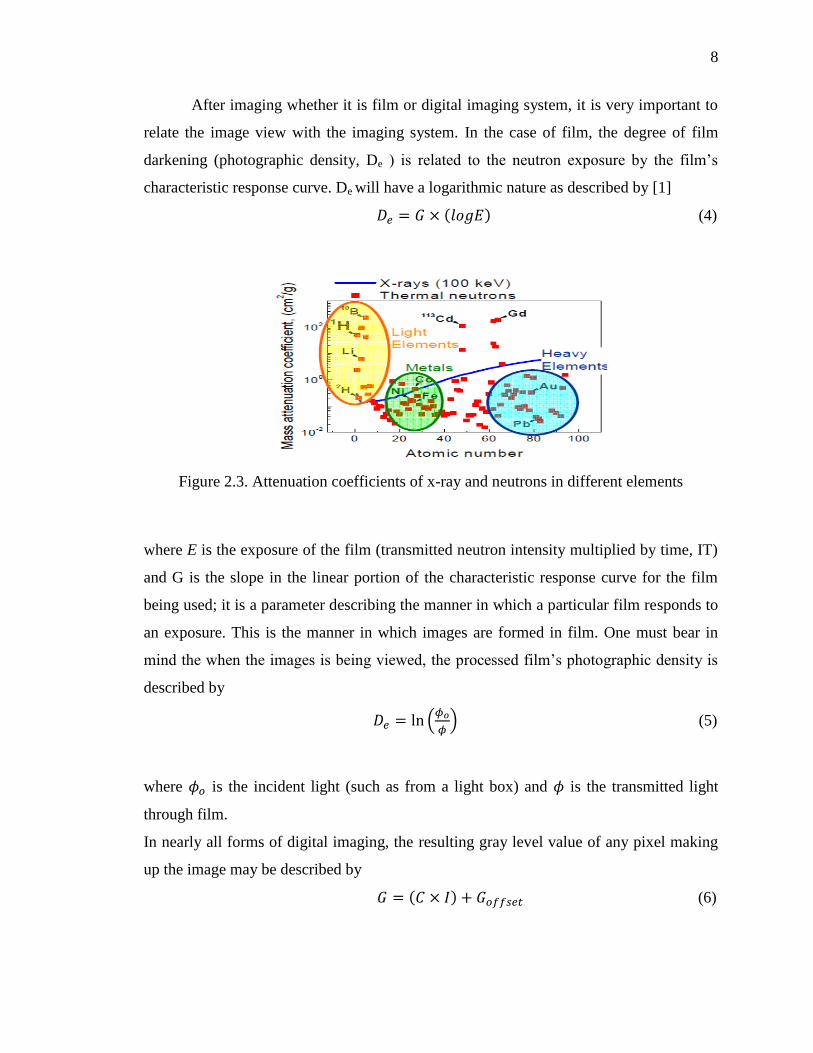
Figure 2.3 shows the mass attenuation coefficient of x-ray and neutrons for different
atoms.
8
After imaging whether it is film or digital imaging system, it is very important to
relate the image view with the imaging system. In the case of film, the degree of film
darkening (photographic density, De ) is related to the neutron exposure by the film’s
characteristic response curve. De will have a logarithmic nature as described by [1]
( ) (4)
Figure 2.3. Attenuation coefficients of x-ray and neutrons in different elements
where E is the exposure of the film (transmitted neutron intensity multiplied by time, IT)
and G is the slope in the linear portion of the characteristic response curve for the film
being used; it is a parameter describing the manner in which a particular film responds to
an exposure. This is the manner in which images are formed in film. One must bear in
mind the when the images is being viewed, the processed film’s photographic density is
described by
(
) (5)
where is the incident light (such as from a light box) and is the transmitted light
through film.
In nearly all forms of digital imaging, the resulting gray level value of any pixel making
up the image may be described by
( ) (6)

9
where G is the numerical gray level value of the pixel within an image, C is the electronic
gain of the camera or imaging system (a constant), I is the transmitted neutron intensity
and is the dark current, an additive offset due to electronic noise [1].
2.3. NEUTRON COMPUTED TOMOGRAPHY
In this section, the principle of computed tomography, the history and common
trend of neutron CT, the apparatus used for neutron CT and the introduction of the
techniques available for neutron CT are concisely described.
2.3.1. The Concept of Tomographic Imaging. Neutron computed tomography is
a powerful tool for non-destructive testing of materials and finds numerous applications
in industry and in material research as well. The basic principle is similar to that of X ray
tomography. Tomography and radiography are well known from their uses in medicine
and many people have already come into contact with one or more of these methods.
They are closely related because tomography is based on radiography, which is a two
dimensional attenuation coefficient distribution or the cross section of a ray-path-
integrated projection from a three dimensional object. An extension of this two
dimensional method (radiography) is tomography in which many projections of the same
object is taken in different orientation and then the set of projections are used to
reconstruct a three dimensional image. From different projections of one cross section, a
two dimensional image can be formed. If these two dimensional images of different
position are stacked together, the three dimensional view will be obtained. In other
words, if line integrals (referred to as projections) of a property of a body are acquired
such that these line integrals cover the area at all angles of a slice through the body, then
the interior density of the slice can be reconstructed from these projections. The process
of reconstruction is called tomography and the image of the interior spatial density is
known as the tomographic image.
There are multiple steps involved in the whole reconstruction process. First a
fixed number of beam of neutrons are directed from source through an object at a
particular direction [1]. The number of neutrons from each beam passing through the
object is recorded by neutron detectors, and this is called a projection view. Next, the
object is rotated, and the projection process is repeated. Conversely, the object can be

10
held stationary, and the configuration of neutron source and detector can be rotated. The
key concept behind this process is that each projection view occurs from a different
direction or angle, and thus providing the additional information about the internal
structure of the object. The set of projections are taken in different direction at a fixed
rotational increment. Once the desired number of views is obtained, an image of the
internal structure of the object can be computed from the projection view using various
techniques.
Figure 2.4. Method of acquiring projections[9]
2.3.2. History and Current Trends of Neutron CT. Neutron imaging has
expanded rapidly as a means of Non-Destructive Testing of materials. Radiography with
neutrons began shortly after the discovery of the neutron in 1932. The initial experiments
in neutron radiography were performed in Germany in the late 1930’s by H. Kallmann
and E. Khun. In the years 1935 to 1938 H. Kallmann and Khun used Ra-Be sources and
a small neutron generator at the research laboratory of the I.G. Farben Aktiengesellschaft
to develop methods of photographic detection of neutrons. The next development of
neutron radiography took place when nuclear reactor was invented for the first time in
1956 which produced the radiographs of much better quality than those of Kallmann and
Khun. This technique developed slowly for several years until the advent of concept of
computed tomography (CT) was discovered in 1960. Working with neutron CT expanded
rapidly from that time to today.

11
Today, neutron CT with conventional reactor-based sources enables the
interrogation of complex, multi-component systems for many applications, such as
nuclear material nondestructive testing, characterizing flight control surfaces on aircraft,
testing heat transfer in porous materials, examining heat exchanger systems, development
of hydrogen fuel cells, inspection cultural heritage objects and interrogation biological
systems. Newer, intense sources of neutrons from spallation facilities are providing the
potential to interrogate time and energy dependent phenomena as well.
Nuclear application: Nuclear field is the place where neutron tomography
applications started. Neuclear reactor use its neutron source to inspect the nuclear fuel
and control material before and after irradation for comparison. To show the internal
details and fission materials deposited in the central void of irradiated fuel, epithermal
neutron tomography is very effective allowing good penetration. Other examples of
nuclear neutron CT include determination burn-up in control materials, inspecting other
nuclear components such as cold traps.
Archaeological and geological investigations: Archarlogical sector is the new
application of neutron CT which was first reported in 1996. As most of the
archaeological specimen are hydrogenous, neutron CT is very effective to give clear idea
about them due to its characteristics of having high cross section with hydrogen. Besides,
the high penetrating ability of thermal neutrons makes them a unique tool to investigate
metal samples like historical weapons even when they are covered with thick calcareous
concretions like in the case of finds from sunken ships. As an example, Neutron
Tomography (Figure 2.5a) are shown for one sample of white calcitic marble recovered
from the Villa Adriana (Tivoli, Italy) shown in Figure 2.5b.
Aerospace application: There is a huge application of neutron tomography in
aerospace industry. The use of neutron tomography to detect corrosion in aircraft
structure helps to redesign and operate the practical inspection facility for aircraft
maintenance. Some major examples of neutron CT in aerospace sector are the inspection
of assemblies to detect rubber or plastic seals, detection of adhesives in bonded
assemblies and inspection of explosive devices.

12
Figure 2.5. (a) Computed tomography of a (b) Calcitic marble [1]
Dynamic/Motion Application of neutron tomography: Neutron time laps
tomography can be used to study the dynamic or motion behavior of any system by using
dynamic detectors such as neutron image intensifiers and scintillator-camera systems. To
obtain useful information from extensive rapid motion event, very fast image frame rates
are required with high speed devises like high speed camera and pulsed reactor. For
example, the general rates at which images are observed for dynamic events are as high
as 10,000 frames/second. The neutron tomographic application for dynamic events can
led to redesign of any motion system to work easily during system operation. The
application of dynamic neutron tomography includes observing thermal expansion of
nuclear fuel material, liquid metal in the casting process, fluid flow in metallic
assemblies, lubricant and fuels in engine, aircraft corrosion, hydrogen location in
titanium, filters and moisture/water migration [1].
2.3.3. Basic Apparatus for Neutron CT Data Acquisition. A neutron
tomography systems consists of a neutron source, a moderator to thermalize the neutron,
an aparture and a collimator to organize the neutrons into a beam, and a detector to
visualize the image.
Source: Neutron tomography requires, off course, a source of neutrons. There are
three general types of neutron sources: accelerator, radioisotope and nuclear reactor. Two
types of sources can be used. One is high flux sources and another one is smaller or
portable sources. Nuclear reactors are the example of high flux sources and radioisotope
decay is the example of smaller sources. Accelerator based neutron sources can be the
example of both type.

13
Accelerators: Accelerator-based neutron sources are ones that accelerate and
direct a beam of charged particles such as protons, deuterons and alphas on to a target,
which then results the emission of neutrons. There are a variety of combinations of
incident particle and target material that can be used. High energy protons can create
large number of spalled neutrons from bombardment of heavy nuclei.
Figure 2.6 Principles of accelerators [12]
Table 2.2. Accelerator Neutron Sources [12]
Manufac-
turer
Type Particle Target
materials
Ope-
rating
voltage
KV
Beam
curre
nt
mA
Fast
neutron
output
n/s
Neutron
energy
MeV
Elliot
Automation
20th
century
P
Tube
Deuteron Tritium 120 2 14
Electronics NGH
150
Deuteron Tritium 150 3.5
4
Sames T Deuteron Tritium 400 3 2
High
Voltage
Eng. Co.
Van
der
Graaff
Deuteron Berylliu
m
3000 0.6 1.6
Mulfard Linac Electron Berylliu
m
5500 0.2
1.4

14
Small accelerator sources produce thermal neutrons in the range from to
n
. Small accelerator sources produce thermal neutrons in the range from to
n
and offer the benefit of intermittent operation and portability. On the other hand,
though large spallation sources can achieve fluxes of more than n
, they are very
complex and not portable.
Radioisotopic sources: There are no naturally occurring radioisotopes which emit
neutrons. A radioisotope based neutron source allows the gamma rays or alpha particles
emitted by the decay of a radioactive isotope to bombard a neutron emitting target. Table
2.3. shows a number of (ϒ,n) and (α,n) radioisotopic neutron sources. Although these
systems are simple in operation and ease of portability, they produce low thermal
neutron fluxes in the range from to n
. The other disadvantages it has are the
inability to turn off the radiation and the decreasing number of neutrons because of the
deterioration of the target and decay of the source [1].
Figure 2.7. Isotopic neutron sources [12]
Nuclear reactors: Reactor based source produce neutrons from the fission
reaction of uranium. For high quality neutron tomography, this source can be used as they
provide intense neutron beams. These sources have thermal neutron fluxes within the
range of to n
or even higher. However, large spallation neutron sources
may provide neutron beams with intensities equal to or higher than those produced by
nuclear reactors. Although the reactors

15
Deuteron-Tritiated tubes:These neutron sources are based upon deuteron beams
impinging upon tritiated targets with relatively low accelerating potential and fairly high
current with the resultant yield of 14 MeV fusion neutrons at a rate up to n/s. These
14 MeV neutrons can be used directly for fast-neutron imaging as they are very
penetrating in and of themselves.
Table 2.3. Radio isotopic Neutron Sources [12]
Source Half-life Reaction Neutron yield
( )
Neutron energy
(MeV)
124Sb-Be 60 d (ϒ,n) 0.024
210Po-Be 138 d (α,n) 4.3
241Am-Be 458 y (α,n)
226Ra-Be 1620 y (α,n)
227Ac-Be 218 y (α,n)
228Th-Be 191 y (α,n)
252Cf 265 y fission 2.3
However, these high energy neutrons can also be used in epithermal, thermal or
even cold neutron imaging by moderating them to a lower temperature. It has the
advantage of portability that makes the infield application possible. With the small size
of moderator it gives the higher contrast by yielding a small, bright source of neutrons.
Moderation: Neutrons produced in fission reaction or from spallation procedure
possess very high energy peaking from 0.85 MeV from fission in reactor to 14 MeV in
accelerators. However, for conventional neutron tomography the energy range of neutron
should be in the thermal range of 0.025 eV to 10 KeV. For this purpose, the moderator is
used.
Collimation: As neutrons have no charge, they cannot be focused directly to the
object being imaged. They are scattered randomly in the moderator. In order to allow
desired number of neutron beam to stream down toward the object being imaged, the
collimator are used into or adjacent the moderator. A divergent collimator which spread

16
the lower neutron flax has small entrance aperture and larger exit. The wall of the
collimator is lined with neutron absorbing material so that the stray neutron are prevented
Figure 2.8. Thermal nuclear reactor Source [12]
to enter and the scattering of neutron become minimized. The angular spread
depends on the L/D ratio which is a characteristic property of a collimator. The higher the
ratio, the narrower the angular spread is [1].
Figure 2.9. Neutron collimator [12]
Detector: Neutron has no charge so the only way to detect neutron is the detection
of charged particles produced during the interaction of neutrons with matters. So, in
tomography, the detector terms is applied collectively to both a converter and a recorder.
The converter is used to emit alpha, beta or light which are more readily detectable
radiation when encounter with neutron. And a recorder is used to record the emitted
radiation. When film is used as image recorder gadolinium type foil is used and emits the
electron during the exposure of neutron. the foil is placed with the direct contact with the
recorder emulsion. When electronic form of imaging is used, a scintillator converter is
coupled with an analog or digital camera image recorder. This allows the successive
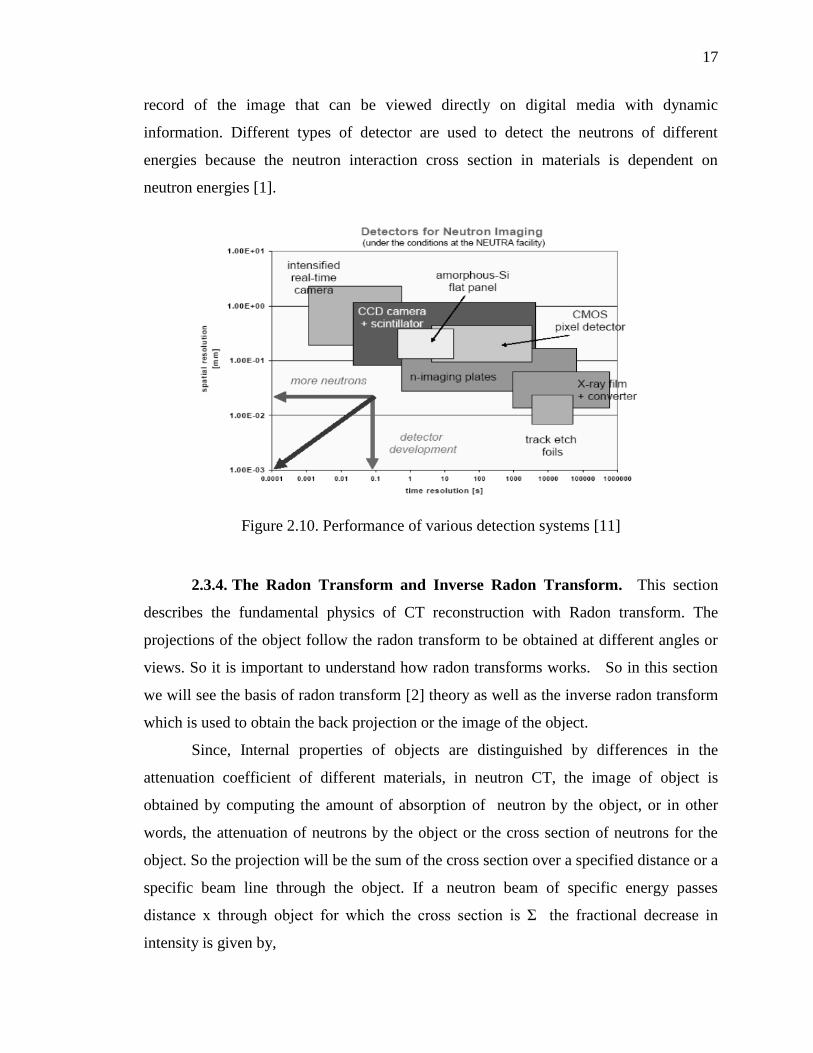
17
record of the image that can be viewed directly on digital media with dynamic
information. Different types of detector are used to detect the neutrons of different
energies because the neutron interaction cross section in materials is dependent on
neutron energies [1].
Figure 2.10. Performance of various detection systems [11]
2.3.4. The Radon Transform and Inverse Radon Transform. This section
describes the fundamental physics of CT reconstruction with Radon transform. The
projections of the object follow the radon transform to be obtained at different angles or
views. So it is important to understand how radon transforms works. So in this section
we will see the basis of radon transform [2] theory as well as the inverse radon transform
which is used to obtain the back projection or the image of the object.
Since, Internal properties of objects are distinguished by differences in the
attenuation coefficient of different materials, in neutron CT, the image of object is
obtained by computing the amount of absorption of neutron by the object, or in other
words, the attenuation of neutrons by the object or the cross section of neutrons for the
object. So the projection will be the sum of the cross section over a specified distance or a
specific beam line through the object. If a neutron beam of specific energy passes
distance x through object for which the cross section is Ʃ the fractional decrease in
intensity is given by,

18
(7)
Any two dimensional object is a function of two variables. These two variables
are the spatial co-ordinate or the x and y coordinates in the rectangular (Cartesian)
coordinate system. Let Ʃ(x,y) designate the attenuation or cross section of neutron for the
(x,y) position of the object. If L is the any beam of neutrons through the object, the
fractional decrease in intensity is given by,
∫ ( )
(8)
where ds is an increment of length along L. The natural logarithm of above equation yield
a sing projection,
(
) ∫ ( )
(9)
In neutron CT, if there are some other parallel neutron beams coming from the
source for the a fixed direction of ϕ, then the set of projections or profile for the angle ϕ
would be,
( ) ∫ ( )
(10)
Figure 2.11. Radon transform

19
The mapping or projection or neutron beam line integral of Ʃ(x,y) along the
beam line L through the object is the radon transform of Ʃ(x,y). Explicitly,
( ) ∫ ( )
(11)
R is used to define radon transform operator. One of the important property of radon
transform is that can be uniquely determined from the integration along all lines L if
and only if ( ) is continuous and compact support.
So, L and S are the coordinate of the detector, the equation of neutron beam line L is
(12)
and the equation of S would be
(13)
Therefore, if we know p and ϕ, we can find out spatial coordinate of cross section
and finding the (x, y) coordinate of Ʃ from p and ϕ is called the inverse radon transform
or backprojection. S is a function of p, S is just the orthogonal value of p. So,
(14)
(15)
In one word, the radon transform or line integral is nothing but to convert the Cartesian
coordinate in to polar coordinate system.
2.3.5. Neutron CT Reconstruction. CT reconstruction involves the
reconstruction of a single slice. Stacking of such slices yields a 3D image. By means of
image processing parts of the 3D reconstruction can then be extracted and displayed
separately from the rest of the data set.
Neutron CT reconstruction is an inverse problem to solve. In neutron CT , the
collection of the projection images from a physical body is the direct problem and the

20
corresponding inverse problem is the reconstruction of the unknown inner structure of the
physical body from the known neutron projections taken from different directions [1].
There are several reconstruction methods applied to solve this inverse problem or neutron
CT. For continuous tomographic data, analytical method or FBP is usually used which is
based on inverse radon transform and for discrete data iterative reconstruction method is
used. There are various model is used to discretize the object such as pixel based model,
voxel based model, blob based model. In this thesis pixel based model is used [2].
Iterative method can be divided in to two categories based on the statistical model. If the
statistical model is not considered, the iterative techniques include the large class of
algebraic reconstruction techniques or ART methods which did not consider the noise in
the data. In order to take account the effects of noise and background, statistical model
based iterative reconstruction methods are used. The most common algorithm of
statistical model based iterative reconstruction methods is MLEM (maximum likelihood
expectation maximization). When the prior information of the image is known, Bayesian
method is used to incorporate the prior knowledge of the image. The most common
reconstruction algorithm which use the Bayesian technique is known as MAP or
Maximum a Posterior algorithm.
2.4.LIMITED DATA NEUTRON TOMOGRAPHY
In this section, the classification of neutron data tomography and the nature of
limited data CT are briefly described.
2.4.1. Classification of Limited Data Tomography. Limited data tomography is
related to insufficient data to reconstruction [5]. There are many forms available for
insufficient data. Some important forms are sparse sample which means the image
reconstruction from projection data at few views, limited angular range and gaps in the
projection data caused by bad detector bins.
In each of these three examples, the projection data are not sufficient for exact
reconstruction or the unique solution of tomographic images For the case where the data
are consistent but are not sufficient to determine a unique solution to the imaging model,
the application of standard analytic algorithms such as filtered back-projection (FBP) will
lead to conspicuous artifacts in reconstructed images.

21
Figure 2.12 Methods of CT reconstruction
Figure 2.13. Different angular position of the detector [5]
2.4.2. Ill Posed Nature of Limited data CT. Image reconstruction is an inverse
problem. For any inverse problem ill posedness is a characteristic [8]. Ill posedness is a
characteristic that is defined by sensitivity of reconstruction to the measurement noise
and modeling errors. Where there is not a unique solution of the reconstructed image and
the solution is not dependent continuously on the true object then this type of nature is
called the illposed nature of reconstruction.
In case of limited data projection, if the traditional analytical method is used to
reconstruct the limited or insufficient data CT, the illposedness of the reconstructed
image can be resulted in as the analytical method deals with the continuous

22
representation of the reconstruction problem. As this approach is established on the basis
of the assumption that the projection data is available for all angles, in case of limited
data CT problem this methods does not give the high quality reconstructed result.
However, it is well established that the application of iterative method for the
reconstruction of the limited data CT minimizes the illposedness of the reconstructed
image as iterative method assumes the discrete representation of the problem and tries to
minimize the error between the reconstructed image and the object iteratively.

23
3. MATERIALS AND METHODS
For limited angle tomography, a rigorous statistical reconstruction method that
incorporated an accelerated regularized model was used. The convergence characteristics
of this model were also included. The reconstruction process was carried out with
MATLAB. In this section, each of the steps of the reconstruction process and the
associated properties are described.
3.1. PHANTOM GENERATION
In order to validate the reconstruction algorithm, a 256×256 image is constructed
according to the definition of the Shepp-Logan phantom. The Shepp-Logan phantom is
the cross section of human head obtained using x-ray. There are 10 ellipses in Shepp-
Logan phantom. The parameters of the ellipse are described below [10]:
Figure 3.1. Construction of a Shepp-Logan phantom [10]
The refractive index of one ellipse indicates how less or more attenuating object
the ellipse is than the surrounding ellipse or relative intensity.

24
3.2. SINOGRAM GENERATION
The sinogram for the Shepp-Logan phantom is created at 2.40 increments for
180˚.
Table 3.1. Properties of generating Shepp-Logan phantom [10]
Ellipse
number
Center coordinate
Major axis
Minor axis
Rotation angle with
respect to
horizontal axis
A (0,0) 0.92 0.69 90
B (0, -0.0184) 0.874 0.6624 90
C (0.22,0) 0.31 0.11 72
D (-0.22,0) 0.41 0.16 108
E (0,0.35) 0.25 0.21 90
F (0, 0.1) 0.046 0.046 0
G (0,-0.1) 0.046 0.046 0
H (-0.08, -0.605) 0.046 0.023 0
I (0, - 0.605) 0.023 0.023 0
J (0.06, -0.605) 0.046 0.023 90
Figure 3.2. Process of generating sinogram

25
3.3. NEUTRON IMAGE ACQUISITION
Neutron radiographs of the L07 fuel assembly are produced at the Neutron
Radiography (NRAD) facility in Idaho National Laboratory (INL) using the near parallel
beam geometry[7]. The assembly is rotated at 2.4˚ of precise increments with a
radiographs produced in each increment. INL has developed an image acquisition system
using transfer technique where x-ray films are used to image the irradiated nuclear fuel at
NRAD. This technique involves a metal foil (Dy/ In) as the image recorder and captures
the image by a buildup of radioactivity through neutron absorption. Thus an activation
image is formed in the foil which is subsequently transferred in a photographic film by
decay radiation. Metals like Dy/In emit beta particles sometime after neutron absorption,
so, these metal foils are used as the detector and the radiographic image will be stored in
the foil during the exposure. The screen is then removed from the neutron exposure and
pressed against a suitable film in a cassette and the image will be formed to the film as
the foil activity decays. The optical density (OD) measures the amount of decay in a
certain point through an exposed and developed x-ray film. The OD is calculated through
the attenuation formula, which assumes exponential beta decay inside the cassette [1].
3.4. SINOGRAM OF NEUTRON RADIOGRAPHS
Sinogram creation is the first step of the recostruction process from projections.
The sinogram is created from the radiographs of different directions. The size of the
radiographs should be the size of the detector. We have 76 radiographs of 941×941 size.
For creating sinogram, we only consider one section of radiographs in different
directions. One section of radiograph should be the one array of the detector. There are
941 bins in each detector array and 2.4˚ angular increment up to 180˚ angular range. So
the total different angular directions are 76. If we place the projection of each bins in
different directions we will get the sinogram.Therefore, the size of the sinogram should
be 76 × 941.

26
Figure 3.3. Sinogram of the fuel assembly.
3.5. IMAGE RECONSTRUCTION
An example is shown about how to calculate the projection and backprojection
using radon transform.
Figure 3.4. Example of projection and back projection calculation.
The angle between the image y axis and detector p axis is ϕ, for ϕ=0, and
(x,y)=(0,0) position, the detector position will be,
( ) ( ) (16)
and since, the pixel value of the position of (x,y)=(0,0) is v1;

27
( ) (17)
For the pixel position of (x,y)=(1,0) and ϕ=0, the detector position will be:
( ) ( ) ( ) (18)
As the pixel value for the pixel position of (x,y)=(1,0) is v7:
( ) (19)
Therefore, the final detector value for each detector position i for specific angle ϕ
will be the summation of all the detector values for that position:
( ) ∑ ( ) (20)
( ) (21)
Similarly,
( ) (22)
Now, considering the angle between the image or pixel y axis and the detector axis is 450.
Therefore, for ϕ=450, and (x,y)=(0,0) position, the detector position will be,
( ) ( ) ( ) (23)
The intensity value for the (x,y)=(0,0) position is the v1,
( ) (24)
For the back projection:
(25)
(26)
(27)

28
To model the image system, the pixel number is kept half of the number which is
one less than the bin number.
( ) (28)
The position axis of the image or pixel is chosen as the mid position of the pixel
which is calculated as following [2]:
(29)
(30)
The proposed algorithm is made up of a model which incorporate the following
assumptions that are specific for neutron CT measurements:
1. For neutron counting detector, the number of neutrons recorded by detector is a
Poisson random variable.
2. In this case, since the neutron beam and the object are placed much closed to each
other, the scattering effect is ignored.
3. The energy of source assumes to be mono-energetic (thermal energy).
3.5.1. Filtered Back Projection. Filtered back projection (FBP) is a well know
technique for parallel beam image reconstruction. The algorithm involves the following
steps:
1. Finding the 1D Fourier transform for each angle.
2. Multiply a filter with the result obtained from step 1.
3. Finding the inverse Fourier transform of the result obtained from step 2.
4. Back projecting the result obtained from step 3 to spatial domain.
The filter used in FBP is a high pass filter to reduce the blurring effect. The blurring
effect is caused by the |r|-1
no-uniform weighing, where
| | √ (31)

29
in the 2D Fourier plane. Applying various filters (e.g. Ram-Lak, Hamming, Han) reduces
high frequency (i.e. noise) but enhances the blurring effect. Therefore, a perfect filter is
difficult to construct without prior knowledge of the type of noise. A flow chart of the fbp
algorithm is show in Figure 3.5 [9].
Figure 3.5. Flow chart of the FBP algorithm [9]
3.5.2. Iterative reconstruction. An iterative reconstruction algorithm developed
as part of this work produces a better-quality image than the image obtained by
conventional FBP. FBP algorithm utilizes integral equation but iterative algorithm uses
algebraic equation which models complex imaging geometry and imaging physics more
realistically. Another disadvantage of FBP is that it cannot model noise, and the noise
control is achieved by frequency windowing.

30
3.5.2.1. Maximum- likelihood expectation maximization (ML-EM).
Maximum likelihood expectation maximization algorithm is used to reconstruct the L07
fuel bundle since it can model noise by minimizing an objective function. The ML-EM
algorithm uses prior knowledge about the projection data to make the iterative algorithm
more stable. Therefore, FBP reconstructed image is used as an initial guess. The general
reconstruction algorithm for the ML-EM is [2]:
∑
∑
∑ (32)
Pi: measured projection
where Pi is the measured projection, xjnew
is the value of the pixel xj after (n+1)th
iteration,
xjcurrent
is the value of the pixel xj after nth
iteration, aij is the weight of the contribution
of pixel xj to the projection Pi (backprojection of constant 1 in image domain), and M×N
is the image size. The ML-EM algorithm has two steps:
E (expectation) step: estimation of observed data from current estimate of the model
parameters and observed data
M (maximization) step: computation of the maximum-likelihood estimate of the model
parameters using estimated observed data.
Convergence is an important criterion for any iterative algorithm. Each iteration
of the EM algorithm includes a step to determine the likelihood of convergence. If the
likelihood function converges, it returns to the E-step for next iteration.
ML-EM algorithm reconstructs images from limited data but the result is not
useful enough. A regularization parameter is employed to obtain smooth image with
sharp edge. Several methods (e.g. Bayesian and total variation) are used as a
regularization parameter.
3.5.2.2. Total variation. Total variation (TV) based [4] ML-EM algorithm is
used to reconstruct L07 fuel bundle. Total variation measures how the signal changes
between signal values, thus it measures the change in signal if any information is missing
in between two rotation angles. In 1D, the total variation of N point signal is defined as:
( ) ∑ | | (33)

31
In 2D form, it can be written as:
( ) ∑ | | | | (34)
Figure 3.6. Position relationship between f(x,y) and its neighbor pixels
Implementing TV algorithm the TV regularized ML-EM algorithm can be written as [2]
∑ ( )
∑
∑ (35)
where,
( )
√( ) ( )
√( ) ( )
√( ) ( )
(36)
where xk,l is a pixel of image x and ɛ is a penalized parameter [6]. The algorithm can be
described in few steps as follows:
3.5.2.3. Directional total variation. The previous total variation is independent
in direction. To make the total variation of the image direction dependent, a weighing

32
function is used [3]. If the gradient of the image with respect to a particular pixel f(x,y) is
, the directional gradient along the α direction would be
( ) ( ) ( ) (37)
where,
( ) ( ) (38)
( ) ( ) (39)
( ) is the weighting function which only dependent on the direction of the image. It is
uniform on the pixel values or the reconstructed image for parallel beam scan . So if we
consider the directional total variation of the image
( )∑ √( ) ( ) (40)
( ) calculates the summation of the contribution of all the views for a particular view
of the image. So for the calculation of ( ), if the particular view of the image makes an
angle of α with the x-axis, and the other views makes the angle of β(Ө) with the x-axis,
where Ө is the angle between the detector and x-axis [3].
Figure 3.7. (a) Illustration of the calculation of the TV (b) projection geometry
( ) ∑ (
| ( )|) (41)

33
If there are more than one selected views,
∑ ( ) (42)
3.5.2.4. Ordered subset expectation maximization. The convergence rate of
MLEM is not so much high that’s why it is necessary to increase the convergence rate.
One way to speed up the convergence rate is to update the images more frequently. So, in
that case order subset can be used. In case of order subset, the projection views are
grouped in different sets. These sets are called subsets. The image is updated using each
of the set in a specified order. The updating of the image using one subset is called the
sub iteration. When all the subsets will be considered, then one iteration will be
completed. There are many strategies available for grouping the views. It is established
that increasing the number of subsets though increase the convergence rate, decrease the
image quality [2].
3.6. PROPOSED TECHNIQUE
The proposed technique combines OS-MLEM with directional TV. The algorithm
involves the following steps:
1. Initializing the image using FBP reconstructed image
2. Find out the projection of the FBP image
3. Compare the projection of the FBP image with the given projection (sinogram) by
dividing given projection value by FBP projection for the projection views that are 9.470
apart from 00
to 1800. Thus there are 4 subsets for 76 projections. Each subset has 19
projections.
4. Back projecting the compared projection (ratio) into the image for different angles.
5. Normalizing the image obtained from previous step by dividing this image by the
image that is obtained from back projecting the value of ‘1’ for different angles.
6. Updating the image reconstructed by MLEM by multiplying the normalized image
with the initial image.
7. Applying the DTV minimization in the image obtained from previous step for different
angles.

34
8. Adding the DTV minimized images with the updated image.
9. Ending the first sub iteration, for the next iteration, this updated image will be the
initial image.
One iteration will be completed when all the subsets will be considered for iteration.
3.6.1. Algorithm of DTV-OS-MLEM. Given: The number of views ( ),
projections for different views ( ).
Initialization and selection: Number of subset (M), Number of selected directional
views( ), the weighting factor for selected direction( ), the
number of iteration ( ) the mean difference between two intermediate
image ( ) the initial image ( )
Main iteration Loop:
Sub-iteration loop:
MLEM updating:
∑ ( ) ∑ (
∑ ( ))
DTV Minimization:
∑ ( ( )
)
DTVM with OSMLEM:
end
Image Updating:
Exit Criteria:
then
exit
end

35
BPi is the backward projection for ith
view which follows the inverse radon transform and
FPi is the forward projection for ith
view which follows the radon transform.

36
4. RESULTS
In this section, the experimental studies are carried out in order to evaluate the
performance of the proposed algorithm. Study includes the evaluation of the
reconstruction quality. In this experiment our proposed algorithm is compared with FBP,
MLEM, MLEM-TV. In order to verify the performance of the proposed algorithm a
Shep-Logan head phantom is simulated as well as a real neutron CT image is tested to
demonstrate the feasibility of the algorithm for the practical sparse CT reconstruction
applications.
4.1. EVALUATION CRITERIA
There are two types of metrics are used in order to analyze quantitatively the
development of the CT algorithms. The first type measures the performance of the
numerical iteration. It includes the iteration index, convergence index and the
measurement fidelity index. And the second type evaluates the image quality using the
metrics of root mean square error (RMSE) and the ratio of the image TV.
Iteration index (k): iteration index measures the total number of the iteration that has
been through. K indicates the long computational time when the algorithm will take a
longer time for which k is larger [3].
Convergence index ( ): This index measures the degree of convergence of the
algorithm by calculating the difference of the images obtained from two subsequent
iterations.
| | (43)
where is the total number of pixels, and is the reconstructed image from a
particular iteration.
Measurement fidelity index ( ) this index compares the forward projections of the
reconstructed image with the given projections by taking the ratio of them
(44)

37
where p is the given projection and is the forward projection of the reconstructed
image for k iterations.
RMSE: This measure can only be used when the density distribution of the phantom is
prior known. However, in the practical case, the measure is not available. It compares the
reconstructed image with the true image.
√∑(
)
(45)
where is the true image and is the reconstructed image.
TV ratio ( ): The value of noise parameter or degree of smoothness (ε) can be
verified by calculating the ratio of the total variation of the reconstructed image to the
original phantom from the following equation:
|| ||
|| ||
(46)
where is the reconstructed image and is the original phantom.
4.2. STUDY WITH SHEP-LOGAN HEAD PHANTOM
A parallel beam CT scan is simulated which contains 76 views covering
equally with angular increment. Each view contains 941 detectors. A 941 by 941
sized image is reconstructed using different algorithms. In order to verify the algorithm a
941 by 941 sized Shep-Logan phantom is created. FBP, MLEM, MLEM-TV, MLEM-
DTV, OS-MLEM-DTV are studied. In all the TV cases the optimal value of ε is chosen
as 0.05. The total number of selected direction is set to six which are apart from
to . So the set of selected direction is { . For OS-
MLEM-DTV, four subsets are selected for 76 views. Each view is apart.
are used to determine the stopping criteria . When the two matrices stops decreasing or
begin to oscillate the iteration will be terminated.
Table 4.1. shows the numerical evaluation metrics for neutron CT studies. Figure
4.2. shows the reconstructed image of Shepp-Logan phantom using FBP, MLEM,
MLEM-TV, MLEM-DTV and OS-MLEM-DTV. The line profile of the reconstructed

38
images obtained from each of the methods are drawn in Figure 4.3. The comparison of
line profiles of head phantom for various algorithm is shown on Figure 4.4.
Table 4.1. Evaluation metrics of various reconstruction methods for head phantom
Reconstruction
Methods
Number
of
Views
(Number
of
iterations)
(
)
(
)
FBP _ 0 _ 10.08 _
MLEM _ 20 0.04 0.56 _
MLEM-DTV 6 15 0.06 0.10 0.001
OS-MLEM-
DTV
6 9 0.07 0.40 0.007
4.3. STUDY WITH REAL NEUTRON CT DATA
A real neutron CT data of a nuclear fuel [7] is used to verify the application of our
algorithm in the practical case. The neutron CT data A parallel beam CT scan which
contains 76 views covering equally with angular increment. Each view
contains 941 detectors. A 941 by 941 sized image is reconstructed using different
algorithms. In order to verify the algorithm a 941 by 941 sized Shep-Logan phantom is
created. FBP, MLEM, MLEM-TV, MLEM-DTV, OS-MLEM-DTV are studied. In all
the TV cases the optimal value of ε is chosen as 0.05. The total number of selected
direction is set to six which are apart from to . So the set of selected
direction is { . For OS-MLEM-DTV, four subsets are
selected for 76 views. Each views are apart.
are used to determine the
stopping criteria . when the two matrices stops decreasing or begins to oscillate the
iteration will be terminated. Table 4.2 shows the numerical evaluation metrices for
nuclear fuel studies. Figure 4.4 shows the cross section of L07 fuel bundle. Figure 4.5
shows the reconstructed image of nuclear fuel using FBP, MLEM, MLEM-TV, MLEM-
DTV and OS-MLEM-DTV. The line profiles of the reconstructed images obtained from
each of the methods are drawn in Figure 4.6.

39
Original Shepp- Logan Phantom FBP Reconstructed
MLEM Reconstructed MLEM-TV Reconstructed
MLEM-DTV Reconstructed OS-MLEM-DTV Reconstructed
Figure 4.1. Reconstructed image using various algorithms for head phantom

40
Figure 4.2. Line profiles for various reconstruction methods of head phantom
0
50
100
150
200
250
300
0 500 1000
Gra
y V
alu
e
Distance (Pixel)
Line Profile
Simulated Head
Phantom
0
50
100
150
200
0 500 1000
Gra
y V
alu
e
Distance (Pixel)
Line Profile
FBP
0
50
100
150
200
0 500 1000
Gra
y V
alu
e
Distance (Pixel)
Line Profile
MLEM
0
50
100
150
200
0 500 1000
Gra
y V
alu
e
Distance (Pixel)
Line Profile
MLEM-TV
0
50
100
150
200
250
300
0 500 1000
Gra
y V
alu
e
Distance (Pixel)
Line Profile
MLEM-DTV

41
Figure 4.3. Line profiles for various reconstruction methods of head phantom
Figure 4.4. Comparison of line profiles of head phantom for various reconstruction
algorithms
0
50
100
150
200
250
300
0 500 1000G
ray
Val
ue
Distance (Pixel)
Line Profile
OS-MLEM-DTV
0
50
100
150
200
250
300
0 100 200 300 400 500 600 700 800 900 1000
Gra
y V
alu
e
Distance (Pixel)
Horizontal Line Profile
Simulated head phantom
FBP
MLEM
MLEM-TV
MLEM-DTV
OS-MLEM-DTV

42
Table 4.2. Evaluation metrics of various reconstruction methods for nuclear fuel
Reconstruction
Methods
Number
of
Views
Number
of
subsets
(Number
of
iterations)
(
)
(
)
FBP _ _ _ _ 15
MLEM _ _ 20 0.04 10
MLEM-DTV 6 _ 15 0.002 4
OS-MLEM-
DTV
6 4 10 0.0043 7
Figure 4.5 The cross section of L07 fuel bundle

43
FBP Reconstructed MLEM Reconstructed
MLEM-TV Reconstructed MLEM-DTV Reconstructed
OS-MLEM-DTV Reconstructed
Figure 4.6. Reconstructed image of nuclear fuel using various algorithm methods.

44
Line along which the profile drawn
Figure 4.7. Line profiles for various reconstruction methods of nuclear fuel
-50
0
50
100
150
200
250
300
0 500 1000
Gra
y V
alu
e
Distance (Pixel)
Line Profile
FBP
0
50
100
150
200
250
0 500 1000
Gra
y V
alu
e
Distance(Pixel)
Line Profile
MLEM
0
50
100
150
200
250
0 500 1000
Gra
y V
alu
e
Distance (Pixel)
Line Profile
MLEM-TV
0
50
100
150
200
250
0 500 1000
Gra
y V
alu
e
Distance (Pixel)
Line profile
MLEM-DTV
0
50
100
150
200
250
0 500 1000
Gra
y V
alu
e
Distance(Pixel)
Line Profile
OS-MLEM-DTV

45
5. DISCUSSION AND CONCLUSION
It is shown from the line profile of the FBP reconstructed image that very little
details can be observed with high oscillations. The MLEM reconstructed image line
profile has very high oscillations. MLEM-TV gives the smoother image than MLEM but
still far away from the truth profile. However, the smoothness is achieved because the
MLEM only focuses on making an agreement between the measured data and the
forwarded projection, while the TV added part focus on both the measurement agreement
and smoothness property. Comparison of the reconstruction results with various
algorithms for Shepp-Logan Phantom has shown that the MLEM-DTV method recovers
more details and smooth out more noise than other algorithms. The profiles of the
MLEM-DTV and OS-MLEM-DTV results are closest to the truth. It also shows that the
image quality of MLEM-DTV and OS-MLEM-DTV is almost same. The use of order
subset for MLEM-DTV is mainly due to increase the convergence rate.
While the study of Shepp-Logan head phantom shows the performance of the
proposed algorithm, the test on real neutron CT data evaluates its potential in practical
applications. In this case it is difficult to compare as there is no truth phantom available.
However it can be shown that the MLEM-DTV and OS-MLEM-DTV maintains a better
balance between the smoothness and the image details than the other algorithms.
In conclusion, it can be said that in sparse CT reconstruction, MLEM –DTV is
very useful for getting almost exact reconstruction over other used methods. This method
uses the directional total variation as a prior of the image and reconstructs the image by
using MAP rule. The advantage lies in this method is that, it recover the better quality
image which gives the better balance between the image details and the smooth property
than that of other well-known methods.

46
BIBLIOGRAPHY
[1] Ian S. Anderson, Robert L. McGreevy, Hassina Z. Bilheux, “Neutron Imaging
Applications: A reference for the imaging community,” Springer, 2009.
[2] Zeng L. GengSheng, “Medical Image Reconstruction: A conceptual tutorial,”
Springer, 2010.
[3] Chen Zhiqiang, Jin Xin, et al, “A limited-angle CT reconstruction method based on
anisotropic TV minimization,” Physics in Medicine and Biology, 2013, Vol. 58,
2119-2141.
[4] Sidky Y. Emil, Kao Chien-Min, et al, “Accurate image reconstruction from few-
views and limited-angle data in divergent-beam CT,” J. X-ray Sci. Tech., 2006, Vol.
14, 119-139.
[5] Kaipio Jari, Somersalo Erkki, “Statistical and Computational Inverse Problems,”
Springer, 2006.
[6] Das Mini, Gifford C. Howard, et al, “Penalized maximum likelihood reconstruction
for improved micro calcification detection in breast tomosynthesis,” IEEE Trans.
Med. Imaging, 2011, Vol. 30(4), 904-914.
[7] Morman J. A., Froehle P. H., “Tomographic Reconstruction of Fuel Assembly
Configurations: PFR/TREAT Test L07 Lower Blockage Region,” ANL Technical
Report, 1989.
[8] Muller L. Jennifer, Siltanen Samuli, “Linear and Nonlinear Inverse Problems with
Practical Applications,” Society for Industrial and Applied Mathematics, 2012.
[9] Jiang Hsieh, “Computed Tomography Principles, Design, Artifacts, and Recent
Advances,” Wiley, 2009.
[10] Avinash C. Kak, Malcolm Slaney, “Principles of Computerized Tomographic
Imaging,” SIAM, 1988.
[11] Glenn F. Knoll, “Radiation Detection and Measurement,” Wiley, 2010.
[12] Heinz Röttger, “Neutron Radiography Handbook: Nuclear Science and
Technology,” Springer, 1981.

47
VITA
Fahima Fahmida Islam was born on October, 1987, in Dhaka, Bangladesh. She
received her Bachelor of Science in Civil Engineering from Bangladesh University of
Engineering and Technology, Dhaka, Bangladesh in October 2010. After graduation,
being a part of researcher, she joined to Missouri University of Science and Technology
(Missouri S&T) for pursuing her M.S. in Nuclear Engineering. She is planning to pursue
her PhD after finishing her M.S.
Fahima held a Graduate Research Assistantship under Dr. Hyoung Koo Lee with
the department of Nuclear Engineering at Missouri S&T. She will receive her Master of
Science in Nuclear Engineering from Missouri University of Science and Technology in
December 2013.

48
Related Documents