Price et al., (2014) 1 Inhibition of JAK/STAT signaling stimulates adult satellite cell function Feodor D. Price, Julia von Maltzahn, C. Florian Bentzinger, Nicolas A. Dumont, Hang Yin, Natasha C. Chang, David H. Wilson, Jérôme Frenette, and Michael A. Rudnicki SUPPLEMENTARY INFORMATION Supplementary Figures 1-9 Supplementary Table 1 Nature Medicine: doi:10.1038/nm.3655

Welcome message from author
This document is posted to help you gain knowledge. Please leave a comment to let me know what you think about it! Share it to your friends and learn new things together.
Transcript

Price et al., (2014)
1
Inhibition of JAK/STAT signaling stimulates adult satellite cell function
Feodor D. Price, Julia von Maltzahn, C. Florian Bentzinger, Nicolas A. Dumont, Hang Yin,
Natasha C. Chang, David H. Wilson, Jérôme Frenette, and Michael A. Rudnicki
SUPPLEMENTARY INFORMATION
Supplementary Figures 1-9
Supplementary Table 1
Nature Medicine: doi:10.1038/nm.3655

Price et al., (2014)
2
Supplementary Figure 1
3 weeks 3 months 18 months
3 w
eeks
3 m
onth
s18
month
s
********
*******
1wk
Embryonic Postnatal
Co
nception
3 weeks
(Adolescent)
3 months
(Young Adult)
18 months
(Late Adult)
1 y
r
Log ZsGreen
Lo
g P
E
3 months - WT 3 weeks ZsGreen
104
103
102
101
100
100 101 102 103 104
104
103
102
101
100
100 101 102 103 104
104
103
102
101
100
100 101 102 103 104
104
103
102
101
100
100 101 102 103 104
0.08% 1.39%
3 months ZsGreen
0.90%
18 months ZsGreen
0.52%
Price et al., (2014)
a
b
***
******
c d
ß1 CXCR4 CD34 Pdgfra Mcad
***
0
20
40
60
80
100
120
Zsgre
en
+ c
ells
expre
ssin
g a
giv
en c
ell
surf
ace
mark
er
(%)
Supplementary Figure 1.
Tota
l # o
f Z
sG
reen
+ c
ells
/ m
ouse
hin
dlim
b m
uscle
dig
est
0
50000
100000
150000
200000
250000
Supplementary Figure 1 Satellite cells decrease in number and alter their cell
surface complement with age. (a) Isolation time points for satellite cells. 3 weeks
(Adolescent), 3–4 months (Young Adult) and 18 ± 2 months (Late Adult). (b)
FACS profile of digests from Pax7-ZsGreen mice at adolescent, young adult and
late adult stages. (c) Total number of ZsGreen+ cells per hind limb muscle digest
relative to age stage. (d) Cell surface profile of ZsGreen+
cells collected from
different age groups and analyzed with common satellite cell surface markers. * p
< 0.05 **, p < 0.01, *** p < 0.001. Abbreviations: PE, phycoerythrin; FSC,
forward scatter; SSC, side scatter; CXCR4, C-X-C chemokine receptor type 4;
Mcad, Muscle-cadherin; PDGFRα, platelet derived growth factor receptor α.
Nature Medicine: doi:10.1038/nm.3655
Price et al., (2014)
3
Supplementary Figure 2
Saline
Price et al., (2014)
Zs
gre
en
DA
PI
Zsg
ree
n P
ax7 D
AP
I
Zsg
ree
n P
ax
7 D
AP
I
Zs
gre
en
Pa
x7
DA
PI
Pa
x7
Dystr
op
hin
Lam
inin
DA
PI
Dy
str
op
hin
La
min
in D
AP
I
Dy
str
op
hin
DA
PI
c
b
d
e
Supplementary Figure 2.
Saline
3 months
3 weeks
3 weeks
a
Zs
gre
en
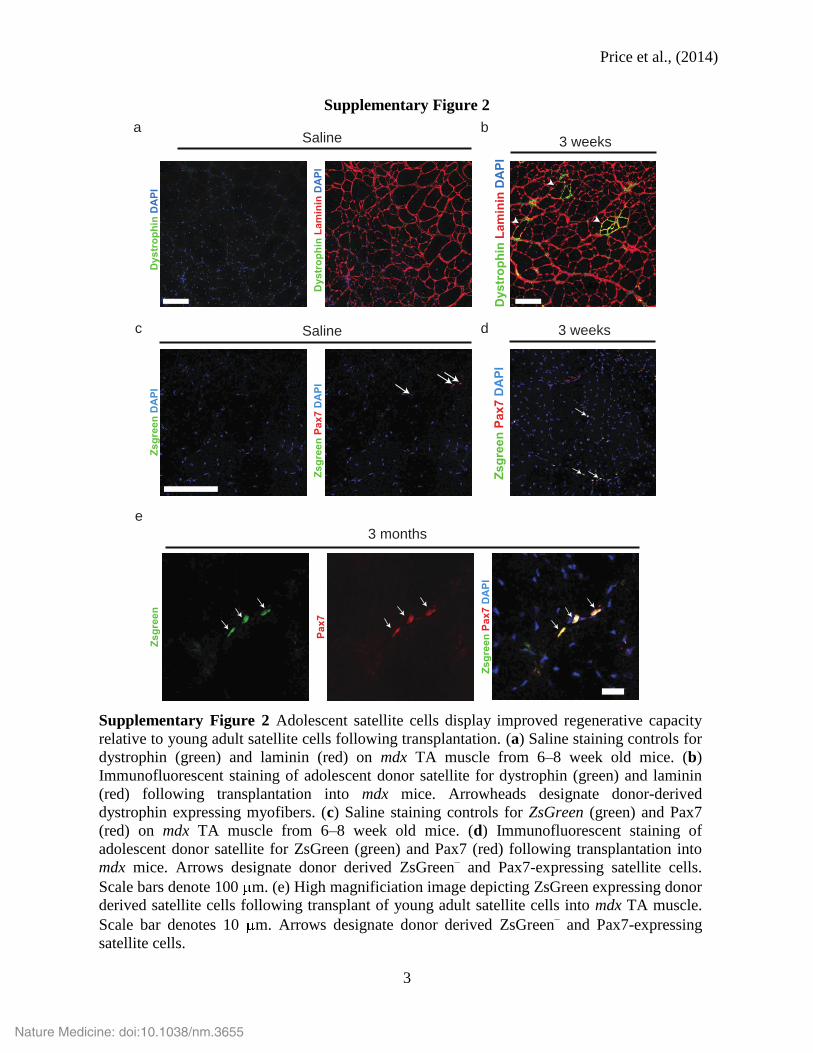
Supplementary Figure 2 Adolescent satellite cells display improved regenerative capacity
relative to young adult satellite cells following transplantation. (a) Saline staining controls for
dystrophin (green) and laminin (red) on mdx TA muscle from 6–8 week old mice. (b)
Immunofluorescent staining of adolescent donor satellite for dystrophin (green) and laminin
(red) following transplantation into mdx mice. Arrowheads designate donor-derived
dystrophin expressing myofibers. (c) Saline staining controls for ZsGreen (green) and Pax7
(red) on mdx TA muscle from 6–8 week old mice. (d) Immunofluorescent staining of
adolescent donor satellite for ZsGreen (green) and Pax7 (red) following transplantation into
mdx mice. Arrows designate donor derived ZsGreen– and Pax7-expressing satellite cells.
Scale bars denote 100 m. (e) High magnificiation image depicting ZsGreen expressing donor
derived satellite cells following transplant of young adult satellite cells into mdx TA muscle.
Scale bar denotes 10 m. Arrows designate donor derived ZsGreen– and Pax7-expressing
satellite cells.
Nature Medicine: doi:10.1038/nm.3655

Price et al., (2014)
4
Supplementary Figure 3
a b
dc
Price et al., (2014)
Invers
e p
-valu
e (
Log) GO terms enriched in
3 week Satellite cells
1.0E+00
1.0E+08
1.0E+16
1.0E+24
1.0E+32
1.0E+40
1.0E+48
1.0E+56
1.0E+64
Ce
ll C
ycle
Cell
Div
isio
n
Mitosis
DN
A P
ackag
ing
DN
A R
epa
ir
Chro
matin
Org
an
iza
tio
n
Ce
llula
r R
esp
onse t
o S
tre
ss
Str
iate
d M
uscle
Cell
Develo
pm
en
t
Cyto
ske
leto
n O
rgan
iza
tio
n
Re
gu
latio
n o
f M
icro
tub
ule
C
yto
ske
leto
n O
rgan
iza
tio
n
Invers
e p
-valu
e (
Log) GO terms enriched in
18 month Satellite cells
1.0E+00
1.0E+02
1.0E+04
1.0E+06
1.0E+08
1.0E+10
1.0E+12
Imm
une R
espo
nse
Vascula
ture
De
ve
lopm
ent
Inflam
mato
ry R
espo
nse
Re
spo
nse
to W
oun
din
g
He
mop
oie
tic o
r Lym
pho
id
Org
an
De
ve
lop
me
nt
Reg
ula
tio
n o
f C
ell
Adh
esio
n
Oxid
ation R
ed
uction
Ossific
atio
n
Reg
ula
tio
n o
f A
pop
tosis
Po
sitiv
e R
eg
ula
tio
n o
f T
ranscrip
tio
n
Supplementary Figure 3.
Myobla
st
3 w
eeks
3 m
on
ths
18
mo
nth
s
Myoblast
3 weeks
3 months
18 months
fe
5 5.5 6
pI
p-Stat3
18
mo
nth
s3
mo
nth
s3
we
ek
s
1.5
2.0
Sig
nal
2.5
3.0
3.5
4.0
1.0
0.5
0.0
0.0
0.2
0.4
0.6
0.8
1.0
1.2
1.4
1.6
1.8
2.0
0 10 20 30 40 50 60 80
Glyoxylate and dicarboxylate
metabolism
Citrate cycle TCA cycle
Starch and sucrose metabolism
P53 signaling pathway
Galactose metabolism
N glycan biosynthesis
No
rma
lize
d E
nri
ch
men
t S
co
re
(NE
S)
for
3w
k v
s 1
8m
th S
ate
llite
Ce
ll
Tra
nscri
pto
me
s
KEGG Signaling Pathway
1
1
1
1
0.932 0.892 0.891
0.975 0.975
0.985
Supplementary Figure 3 Gene expression analysis reveals intrinsic differences between
skeletal muscle myoblasts and satellite cells of varying ages. (a,b) Pearson correlation
analysis and 3D component analysis identify a distinct difference between myoblasts and all
satellite cell samples irrespective of age. (c) GO term enrichment for genes >2 fold up
regulated in adolescent satellite cells. (d) GO term enrichment for genes >2 fold up regulated
in late adult satellite cells. (f) Representative chemiluminescent signal profiles of phospho-
Stat3 (p-Stat3) from freshly sorted satellite cell lysates isolated from adolescent, young adult
and late adult mice (n=3 for each age group).
Nature Medicine: doi:10.1038/nm.3655

Price et al., (2014)
5
Supplementary Figure 4
Supplementary Figure 4 Age related transcriptional changes in myogenic, satellite cell,
quiescence, cell cycle and extracellular matrix markers. Log2 transformed RMA values from 5
d and 2 d differentiated myotubes, proliferating myoblasts along with adolescent, young adult
and late adult satellite cells were used to generate global ratio heat maps. Red indicates genes
that have high log2 expression values while blue represents those with low log2 expression
values. Data represents pooled replicates for adolescent (n=5), young adult (n=8), aged (n=8)
satellite cell samples along with 5 d myotubes (n=3), 2 day myotubes (n=3), and myoblasts
samples (n=3).
Nature Medicine: doi:10.1038/nm.3655
Price et al., (2014)
6
Supplementary Figure 5
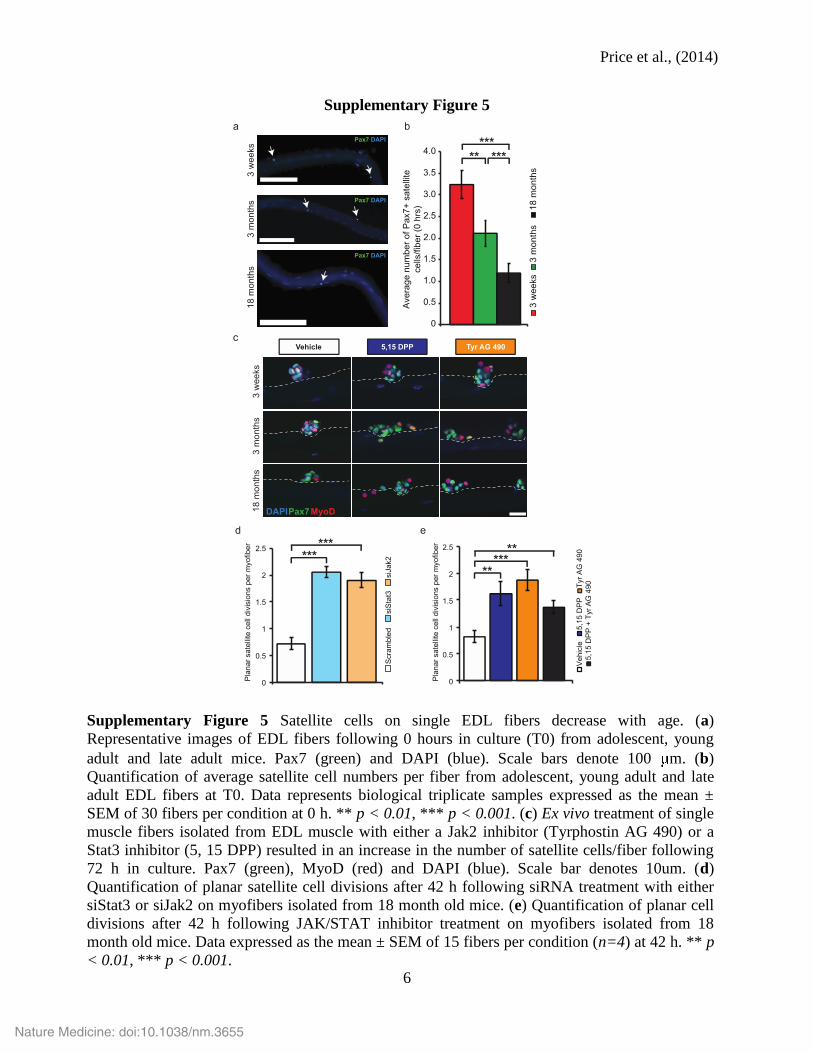
Supplementary Figure 5 Satellite cells on single EDL fibers decrease with age. (a)
Representative images of EDL fibers following 0 hours in culture (T0) from adolescent, young
adult and late adult mice. Pax7 (green) and DAPI (blue). Scale bars denote 100 m. (b)
Quantification of average satellite cell numbers per fiber from adolescent, young adult and late
adult EDL fibers at T0. Data represents biological triplicate samples expressed as the mean ±
SEM of 30 fibers per condition at 0 h. ** p < 0.01, *** p < 0.001. (c) Ex vivo treatment of single
muscle fibers isolated from EDL muscle with either a Jak2 inhibitor (Tyrphostin AG 490) or a
Stat3 inhibitor (5, 15 DPP) resulted in an increase in the number of satellite cells/fiber following
72 h in culture. Pax7 (green), MyoD (red) and DAPI (blue). Scale bar denotes 10um. (d)
Quantification of planar satellite cell divisions after 42 h following siRNA treatment with either
siStat3 or siJak2 on myofibers isolated from 18 month old mice. (e) Quantification of planar cell
divisions after 42 h following JAK/STAT inhibitor treatment on myofibers isolated from 18
month old mice. Data expressed as the mean ± SEM of 15 fibers per condition (n=4) at 42 h. ** p
< 0.01, *** p < 0.001.
Nature Medicine: doi:10.1038/nm.3655

Price et al., (2014)
7
Supplementary Figure 6
*** ***
Price et al., (2014)Supplementary Figure 6.a
0
0.2
0.4
0.6
0.8
1
siSCR siJAK2
Rela
tive
Fo
ld C
ha
ng
e
in J
ak2
Exp
ressio
n
0
0.2
0.4
0.6
0.8
1
siSCR siSTAT3
Re
lative F
old
Ch
an
ge
in S
tat3
Expre
ssio
n
Supplementary Figure 6 siRNA knock down validation of Stat3 and Jak2. (a) QPCR validation
of siStat3 and siJak2 in mouse primary myoblasts. Data are presented as the mean ± SEM of 2
biological replicates normalized to GAPDH. *** p < 0.001.
Nature Medicine: doi:10.1038/nm.3655

Price et al., (2014)
8
Supplementary Figure 7
c
d
TyrAG 4905,15 DPPVehicle
b
ZsG
reen
Pax7
DA
PI
% Z
sg
reen p
ositiv
e s
ate
llite
cells
NS
NS
0
5
10
15
20
25
30
Re
-in
jury
Inju
ry
Re
-in
jury
Inju
ry
CTX
injury
FACS isolation
and transplantation
CTX
re-injury
Assess self-renewal capacity
21 Days 21 Days 48 h
Price et al., (2014)
3 months 18 months
aSupplementary Figure 7.
NS NS
3 months of age
Age of donor cells transplanted into Bl/6 mice
18 months of age
Host
sa
telli
te c
ells
pe
r are
a (
%)
Host sate
llite
cells
per
are
a (
%)
0
20
40
60
80
100
120
140
0 20 40 60 80
100 120 140 160 180 200
Supplementary Figure 7 Ex vivo treatment with JAK/STAT inhibitors promotes satellite cells
expansion and self-renewal. (a) ZsGreen (green), Pax7 (red) and DAPI (blue) staining in mdx TA
muscle 3 weeks following transplantation of 10,000 donor ZsGreen+ satellite cells. Arrows
designate Pax7+/ZsGreen
+ nuclei. Scale bar denotes 100 m. (b) Quantification of host satellite
cells following the transplantation of young adult and late adult satellite cells ex vivo treated with
JAK/STAT inhibitors. NS designates values that are not significant. (c) Experimental schematic
for re-injury of transplanted young adult and late adult satellite cells. (d) Quantification of donor
derived ZsGreen+ satellite cells from young adult or late adult mice after 21 d of regeneration,
subsequent re-injury and an additional 21 d of regeneration. Data represent the mean ± SEM
conducted in biological triplicate. NS designates values that are not significant.
Nature Medicine: doi:10.1038/nm.3655

Price et al., (2014)
9
Supplementary Figure 8
Supplementary Figure 8 Regenerating young adult or late adult TA muscle displays fewer
developmental myosin heavy chain (devMyHC) expressing fibers and a greater number of
Pax7+/MyoD
– satellite cells following treatment with JAK/STAT inhibitors. (a) Regenerating TA
muscle following direct IM injection of JAK/STAT inhibiters. Laminin (red), Pax7 (green) and
DAPI (blue). Scale bar denotes 100um. (b) Quantification of devMyHC+ fibers following 7 days
of regeneration in the presence of small molecule inhibitors of JAK/STAT signaling in either
young adult or late adult TA muscle. Data represent the mean ± SEM conducted in biological
triplicate (n=3). * p < 0.05, ** p < 0.01. (c) Quantification of satellite cells expressing Pax7
and/or MyoD following treatment with JAK/STAT signaling inhibitors in regenerating young
adult TA muscle 7 days after injury with CTX. MyoD (green), Pax7 (red) and DAPI (blue). Scale
bar denotes 100 m. (d) Quantification of Pax7+/MyoD
– satellite cells in regenerating young
adult and late adult TA muscle following treatment with JAK/STAT signaling inhibitors. Data
represent the mean ± SEM conducted in biological triplicate. * p < 0.05, ** p < 0.01.
Nature Medicine: doi:10.1038/nm.3655

Price et al., (2014)
10
Supplementary Figure 9
TyrA
G 4
90
5,1
5 D
PP
+
TyrA
G 4
90
5,1
5 D
PP
Ve
hic
leU
nin
jure
d
a b
c0
5
10
15
20
25
30
35
40
45 A
vg C
d11b e
xpre
ssin
g c
ells
per
fie
ld
TyrAG 490
5,15 DPP
5,15 DPP+TyrAG 490
Vehicle
Supplementary Figure 9. Price et al., (2014)
Supplementary Figure 9 Late adult skeletal muscle displays a decrease in fibrosis and an
amelioration in muscle architecture following treatment with JAK/STAT signalling inhibitors. (a)
Average number of Cd11b cells per field following treatment with JAK/STAT signalling
inhibitors. (b) Sirius Red connective tissue stain in adult TA muscle following treatment with
JAK/STAT signalling inhibitors. Scale bar denotes 100um. (c) Hematoxylin and Eosin stain in
late adult TA muscle following treatment with JAK/STAT signalling inhibitors. Scale bar denotes
100um.
Nature Medicine: doi:10.1038/nm.3655
Price et al., (2014)
11
SUPPLEMENTARY TABLES
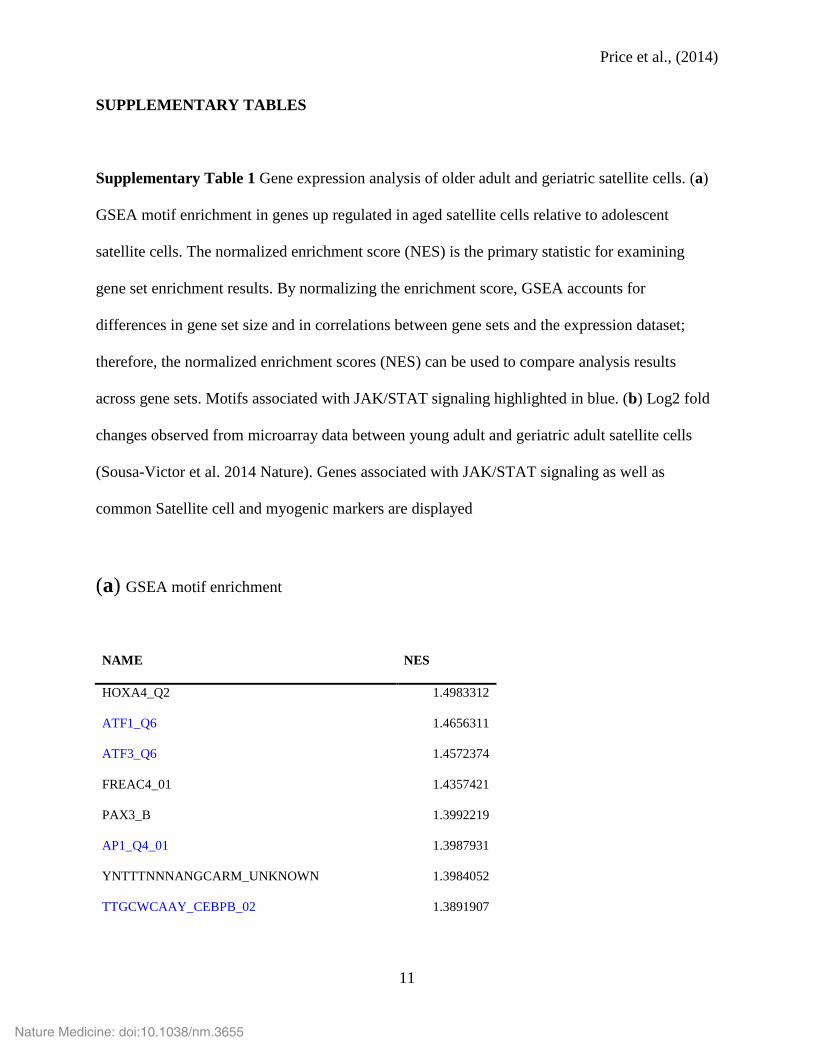
Supplementary Table 1 Gene expression analysis of older adult and geriatric satellite cells. (a)
GSEA motif enrichment in genes up regulated in aged satellite cells relative to adolescent
satellite cells. The normalized enrichment score (NES) is the primary statistic for examining
gene set enrichment results. By normalizing the enrichment score, GSEA accounts for
differences in gene set size and in correlations between gene sets and the expression dataset;
therefore, the normalized enrichment scores (NES) can be used to compare analysis results
across gene sets. Motifs associated with JAK/STAT signaling highlighted in blue. (b) Log2 fold
changes observed from microarray data between young adult and geriatric adult satellite cells
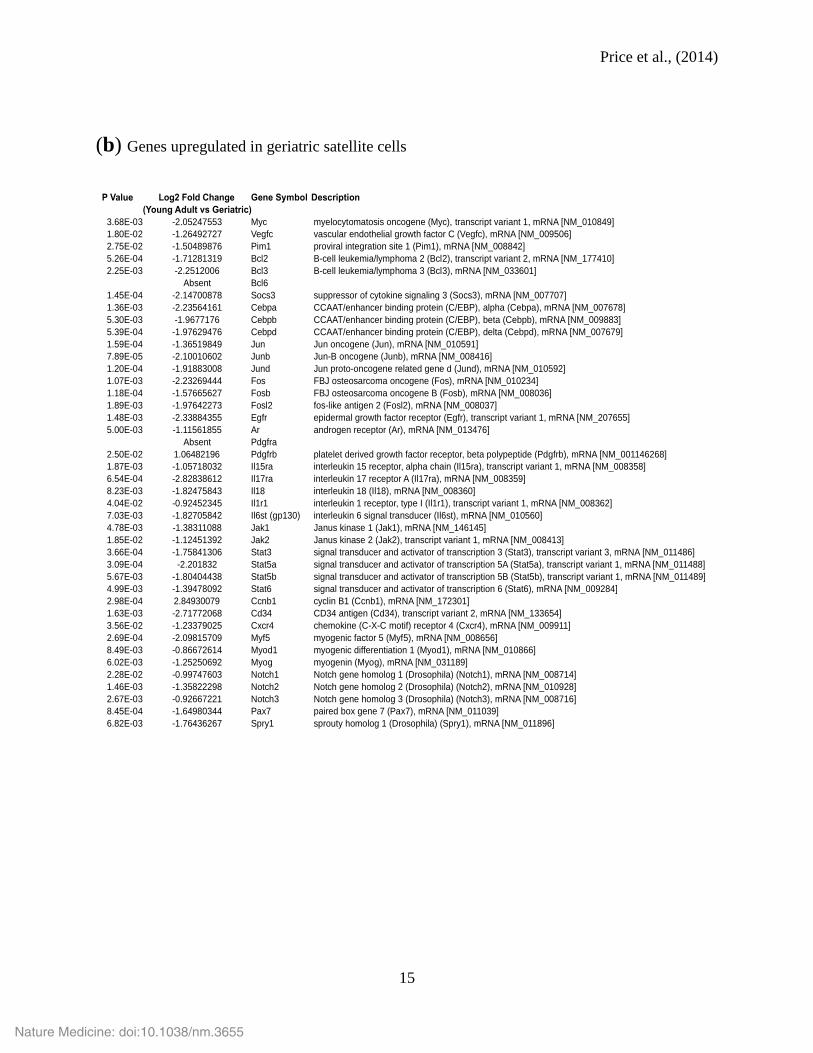
(Sousa-Victor et al. 2014 Nature). Genes associated with JAK/STAT signaling as well as
common Satellite cell and myogenic markers are displayed
(a) GSEA motif enrichment
NAME NES
HOXA4_Q2 1.4983312
ATF1_Q6 1.4656311
ATF3_Q6 1.4572374
FREAC4_01 1.4357421
PAX3_B 1.3992219
AP1_Q4_01 1.3987931
YNTTTNNNANGCARM_UNKNOWN 1.3984052
TTGCWCAAY_CEBPB_02 1.3891907
Nature Medicine: doi:10.1038/nm.3655

Price et al., (2014)
12
NFKAPPAB_01 1.3882123
NFKB_C 1.3881786
IRF2_01 1.3841386
GATA3_01 1.3798792
PAX8_01 1.3777196
OCT1_01 1.374703
LMO2COM_02 1.3714612
FXR_IR1_Q6 1.3699574
NFKB_Q6 1.369385
MYOGENIN_Q6 1.3535694
TGTYNNNNNRGCARM_UNKNOWN 1.3479842
NFKB_Q6_01 1.345761
EN1_01 1.3368281
GGGNNTTTCC_NFKB_Q6_01 1.3365896
SREBP1_02 1.3349676
ARP1_01 1.331565
AP1_C 1.329848
PXR_Q2 1.3287233
AAAYWAACM_HFH4_01 1.3222685
CEBPDELTA_Q6 1.3195753
AP1_Q6_01 1.3114696
CREBP1_Q2 1.3109635
CHX10_01 1.3049413
NFKAPPAB65_01 1.3032994
GCCNNNWTAAR_UNKNOWN 1.3000053
FOXJ2_02 1.2978952
YTAATTAA_LHX3_01 1.2976207
PAX8_B 1.2967724
Nature Medicine: doi:10.1038/nm.3655

Price et al., (2014)
13
AREB6_02 1.2902988
OCT1_02 1.2874292
ATF4_Q2 1.2851044
CEBP_Q2_01 1.28358
DBP_Q6 1.2817761
GGARNTKYCCA_UNKNOWN 1.2813796
STTTCRNTTT_IRF_Q6 1.2811085
CDPCR1_01 1.2790228
AR_Q2 1.2774649
IK2_01 1.2760376
HNF3B_01 1.2759829
LFA1_Q6 1.2714353
CREB_Q2 1.2659374
AP1_01 1.2652273
TAXCREB_01 1.2614539
AP1FJ_Q2 1.2588943
SRF_01 1.2537456
ATF_B 1.2503577
BACH2_01 1.2498549
STAT3_02 1.2484115
MZF1_01 1.2451184
T3R_Q6 1.2405772
FOXO4_01 1.2395285
SMAD4_Q6 1.2346556
POU1F1_Q6 1.2320962
FOXO1_02 1.2313038
CDPCR3HD_01 1.2303405
STAT5A_02 1.2291081
Nature Medicine: doi:10.1038/nm.3655

Price et al., (2014)
14
E12_Q6 1.2258477
TAL1BETAE47_01 1.2252668
TTAYRTAA_E4BP4_01 1.2251939
TFIII_Q6 1.224314
GNCF_01 1.2223188
AFP1_Q6 1.2214636
GFI1_01 1.2196105
ICSBP_Q6 1.215643
PBX1_01 1.2144768
PITX2_Q2 1.2133756
IK3_01 1.2075506
STAT5A_01 1.2064092
P300_01 1.2050723
VDR_Q3 1.2038164
IRF_Q6 1.2020484
PR_01 1.2014045
HNF3ALPHA_Q6 1.2002699
Nature Medicine: doi:10.1038/nm.3655
Price et al., (2014)
15
(b) Genes upregulated in geriatric satellite cells
P Value Log2 Fold Change Gene Symbol Description
(Young Adult vs Geriatric)
3.68E-03 -2.05247553 Myc myelocytomatosis oncogene (Myc), transcript variant 1, mRNA [NM_010849]
1.80E-02 -1.26492727 Vegfc vascular endothelial growth factor C (Vegfc), mRNA [NM_009506]
2.75E-02 -1.50489876 Pim1 proviral integration site 1 (Pim1), mRNA [NM_008842]
5.26E-04 -1.71281319 Bcl2 B-cell leukemia/lymphoma 2 (Bcl2), transcript variant 2, mRNA [NM_177410]
2.25E-03 -2.2512006 Bcl3 B-cell leukemia/lymphoma 3 (Bcl3), mRNA [NM_033601]
Absent Bcl6
1.45E-04 -2.14700878 Socs3 suppressor of cytokine signaling 3 (Socs3), mRNA [NM_007707]
1.36E-03 -2.23564161 Cebpa CCAAT/enhancer binding protein (C/EBP), alpha (Cebpa), mRNA [NM_007678]
5.30E-03 -1.9677176 Cebpb CCAAT/enhancer binding protein (C/EBP), beta (Cebpb), mRNA [NM_009883]
5.39E-04 -1.97629476 Cebpd CCAAT/enhancer binding protein (C/EBP), delta (Cebpd), mRNA [NM_007679]
1.59E-04 -1.36519849 Jun Jun oncogene (Jun), mRNA [NM_010591]
7.89E-05 -2.10010602 Junb Jun-B oncogene (Junb), mRNA [NM_008416]
1.20E-04 -1.91883008 Jund Jun proto-oncogene related gene d (Jund), mRNA [NM_010592]
1.07E-03 -2.23269444 Fos FBJ osteosarcoma oncogene (Fos), mRNA [NM_010234]
1.18E-04 -1.57665627 Fosb FBJ osteosarcoma oncogene B (Fosb), mRNA [NM_008036]
1.89E-03 -1.97642273 Fosl2 fos-like antigen 2 (Fosl2), mRNA [NM_008037]
1.48E-03 -2.33884355 Egfr epidermal growth factor receptor (Egfr), transcript variant 1, mRNA [NM_207655]
5.00E-03 -1.11561855 Ar androgen receptor (Ar), mRNA [NM_013476]
Absent Pdgfra
2.50E-02 1.06482196 Pdgfrb platelet derived growth factor receptor, beta polypeptide (Pdgfrb), mRNA [NM_001146268]
1.87E-03 -1.05718032 Il15ra interleukin 15 receptor, alpha chain (Il15ra), transcript variant 1, mRNA [NM_008358]
6.54E-04 -2.82838612 Il17ra interleukin 17 receptor A (Il17ra), mRNA [NM_008359]
8.23E-03 -1.82475843 Il18 interleukin 18 (Il18), mRNA [NM_008360]
4.04E-02 -0.92452345 Il1r1 interleukin 1 receptor, type I (Il1r1), transcript variant 1, mRNA [NM_008362]
7.03E-03 -1.82705842 Il6st (gp130) interleukin 6 signal transducer (Il6st), mRNA [NM_010560]
4.78E-03 -1.38311088 Jak1 Janus kinase 1 (Jak1), mRNA [NM_146145]
1.85E-02 -1.12451392 Jak2 Janus kinase 2 (Jak2), transcript variant 1, mRNA [NM_008413]
3.66E-04 -1.75841306 Stat3 signal transducer and activator of transcription 3 (Stat3), transcript variant 3, mRNA [NM_011486]
3.09E-04 -2.201832 Stat5a signal transducer and activator of transcription 5A (Stat5a), transcript variant 1, mRNA [NM_011488]
5.67E-03 -1.80404438 Stat5b signal transducer and activator of transcription 5B (Stat5b), transcript variant 1, mRNA [NM_011489]
4.99E-03 -1.39478092 Stat6 signal transducer and activator of transcription 6 (Stat6), mRNA [NM_009284]
2.98E-04 2.84930079 Ccnb1 cyclin B1 (Ccnb1), mRNA [NM_172301]
1.63E-03 -2.71772068 Cd34 CD34 antigen (Cd34), transcript variant 2, mRNA [NM_133654]
3.56E-02 -1.23379025 Cxcr4 chemokine (C-X-C motif) receptor 4 (Cxcr4), mRNA [NM_009911]
2.69E-04 -2.09815709 Myf5 myogenic factor 5 (Myf5), mRNA [NM_008656]
8.49E-03 -0.86672614 Myod1 myogenic differentiation 1 (Myod1), mRNA [NM_010866]
6.02E-03 -1.25250692 Myog myogenin (Myog), mRNA [NM_031189]
2.28E-02 -0.99747603 Notch1 Notch gene homolog 1 (Drosophila) (Notch1), mRNA [NM_008714]
1.46E-03 -1.35822298 Notch2 Notch gene homolog 2 (Drosophila) (Notch2), mRNA [NM_010928]
2.67E-03 -0.92667221 Notch3 Notch gene homolog 3 (Drosophila) (Notch3), mRNA [NM_008716]
8.45E-04 -1.64980344 Pax7 paired box gene 7 (Pax7), mRNA [NM_011039]
6.82E-03 -1.76436267 Spry1 sprouty homolog 1 (Drosophila) (Spry1), mRNA [NM_011896]
Nature Medicine: doi:10.1038/nm.3655
Related Documents