Ultrasound in Med. & Biol., Vol. 23, No. 3, pp. 405-414, 1997 Copyright 0 1997 World Federationfor Ultrasound in Medicine & Biology Printed in the USA. All rights reserved 0301-5629/97 $17.00 + .OO ELSEVIER PI1 SO301-5629(96)00227-X @Original Contribution INFLUENCE OF DATA PROCESSING ON CYCLIC VARIATION OF INTEGRATED BACKSCATTER AND WALL THICKNESS IN STUNNED PORCINE MYOCARDIUM ANTON F. W. VAN DER STEEN, ?a HANS RIJSTERBORGH, i-t CHARLES T. LAN&E, T FRITS MASTIK, + ROB I&AMS, + PIETER D. VERDOUW,’ Jos R. T. C. ROELANDT~ and NICOLAAS BoM?$ ‘Department of Cardiology, Thoraxcenter, Erasmus University Rotterdam, Rotterdam, The Netherlands; and *Interuniversity Cardiology Institute of The Netherlands. Utrecht, The Netherlands (Received 12 Augusr 1996; in jnal form 18 November 1996) Abstract-This study was performed to investigate the relationship between the cyclic variation of integrated backscatter and myocardial wall thickening in stunned myocardium. Dllerent definitions of cyclic variation were evaluated to be able to compare with other studies.Ultrasound data were acquired from 10 open- chestedYorkshire pigs (25-33 kg) at baseline, during regional ischemiaand during 30 min of stun&g, using a broadband ultrasound transducer (3-7 MHz) sutured directly upon the left ventricular myocardlal wall. Cyclic variation of integrated backscatter and myocardlal wall thickening were calculated using three definitions obtained from the literature. Independent of the definition, cyclic variation of wall thickness and integrated backscatter were blunted during acute &hernia and returned transiently to or abovebaseline during the first minute of reperfusion, followed by a gradual decrease to a level under baseline during stunning. An early return of the cyclic variation of the integrated backscatter was not observed ln pigs, independentof the data processing used.The relationship between integrated backscatter and wall thickness was maintained. 0 1997 World Federation for Ultrasound in Medicine & Biology. Key Words: Integrated backscatter, Cyclic variation, Wall thickening, Stunned myocardium, Data processing. INTRODUCTION The objective of this study was to obtain a better under- standing of the phenomena concerned with stunning, variation in wall thickness and integrated backscatter, particularly the asynchronous recovery of cyclic varia- tion of wall thickness and integrated backscatter. The cyclic variation of ultrasound myocardial in- tegrated backscatter during the cardiac cycle is widely regarded as a parameter to assess regional myocardial contractile performance (Barzilai et al. 1984; Glueck et al. 1985; Mottley et al. 1984; Sagar et al. 1987, 1988; Wear et al. 1986, 1989; Wickline et al. 1985a, 1985b). This cyclic variation of normal myocardial tissue as well as its disappearance during acute myo- cardial ischemia (Barzilai et al. 1984; Maderas et al. 1983; Miller et al. 1983; Mimbs et al. 1981) can be Address correspondence to: Ton van der Steen, Ph.D., Labora- tory of Experimental Echocardiography, Thorax Centre, Room Ee2302, P.O. Box 1738, 3000 DR Rotterdam, The Netherlands. Hans Rijsterborgh deceased 16 November 1993. explained by an empirical linear inverse relationship between myocardial integrated backscatter and myo- cardial wall thickness (Rijsterborgh et al. 1990, 1991; van der Steen et al. 199 1) . However, a simple relation- ship between backscatter level and wall thickness, re- gardless of the state of the myocardium, does not ex- plain the normal cyclic variation of integrated back- scatter observed in stunned myocardium, i.e., viable myocardial tissue, with depressed wall thickening dur- ing early reperfusion following acute ischemia (Milun- ski et al. 1989a, 1989b). Milunski et al. (1989a) per- formed in situ experiments on regionally stunned ca- nine myocardium and found that the cyclic variation of integrated backscatter returned to normal values be- fore the cyclic variation in wall thickness returned to baseline values. Furthermore, these investigators found in humans that the cyclic variation of integrated back- scatter returned before a normal cyclic variation in wall thickness was observed (Milunski et al. 1989b). Hypothetically, this could be caused by the fact that, in stunned myocardium, perfusion recovers more rapidly 405

Welcome message from author
This document is posted to help you gain knowledge. Please leave a comment to let me know what you think about it! Share it to your friends and learn new things together.
Transcript

Ultrasound in Med. & Biol., Vol. 23, No. 3, pp. 405-414, 1997 Copyright 0 1997 World Federation for Ultrasound in Medicine & Biology
Printed in the USA. All rights reserved 0301-5629/97 $17.00 + .OO
ELSEVIER PI1 SO301-5629(96)00227-X
@Original Contribution
INFLUENCE OF DATA PROCESSING ON CYCLIC VARIATION OF INTEGRATED BACKSCATTER AND WALL THICKNESS IN STUNNED
PORCINE MYOCARDIUM
ANTON F. W. VAN DER STEEN, ?a HANS RIJSTERBORGH, i-t CHARLES T. LAN&E, T FRITS MASTIK, + ROB I&AMS, + PIETER D. VERDOUW,’
Jos R. T. C. ROELANDT~ and NICOLAAS BoM?$ ‘Department of Cardiology, Thoraxcenter, Erasmus University Rotterdam, Rotterdam, The Netherlands; and
*Interuniversity Cardiology Institute of The Netherlands. Utrecht, The Netherlands
(Received 12 Augusr 1996; in jnal form 18 November 1996)
Abstract-This study was performed to investigate the relationship between the cyclic variation of integrated backscatter and myocardial wall thickening in stunned myocardium. Dllerent definitions of cyclic variation were evaluated to be able to compare with other studies. Ultrasound data were acquired from 10 open- chested Yorkshire pigs (25-33 kg) at baseline, during regional ischemia and during 30 min of stun&g, using a broadband ultrasound transducer (3-7 MHz) sutured directly upon the left ventricular myocardlal wall. Cyclic variation of integrated backscatter and myocardlal wall thickening were calculated using three definitions obtained from the literature. Independent of the definition, cyclic variation of wall thickness and integrated backscatter were blunted during acute &hernia and returned transiently to or above baseline during the first minute of reperfusion, followed by a gradual decrease to a level under baseline during stunning. An early return of the cyclic variation of the integrated backscatter was not observed ln pigs, independent of the data processing used. The relationship between integrated backscatter and wall thickness was maintained. 0 1997 World Federation for Ultrasound in Medicine & Biology.
Key Words: Integrated backscatter, Cyclic variation, Wall thickening, Stunned myocardium, Data processing.
INTRODUCTION
The objective of this study was to obtain a better under- standing of the phenomena concerned with stunning, variation in wall thickness and integrated backscatter, particularly the asynchronous recovery of cyclic varia- tion of wall thickness and integrated backscatter.
The cyclic variation of ultrasound myocardial in- tegrated backscatter during the cardiac cycle is widely regarded as a parameter to assess regional myocardial contractile performance (Barzilai et al. 1984; Glueck et al. 1985; Mottley et al. 1984; Sagar et al. 1987, 1988; Wear et al. 1986, 1989; Wickline et al. 1985a, 1985b). This cyclic variation of normal myocardial tissue as well as its disappearance during acute myo- cardial ischemia (Barzilai et al. 1984; Maderas et al. 1983; Miller et al. 1983; Mimbs et al. 1981) can be
Address correspondence to: Ton van der Steen, Ph.D., Labora- tory of Experimental Echocardiography, Thorax Centre, Room Ee2302, P.O. Box 1738, 3000 DR Rotterdam, The Netherlands.
Hans Rijsterborgh deceased 16 November 1993.
explained by an empirical linear inverse relationship between myocardial integrated backscatter and myo- cardial wall thickness (Rijsterborgh et al. 1990, 1991; van der Steen et al. 199 1) . However, a simple relation- ship between backscatter level and wall thickness, re- gardless of the state of the myocardium, does not ex- plain the normal cyclic variation of integrated back- scatter observed in stunned myocardium, i.e., viable myocardial tissue, with depressed wall thickening dur- ing early reperfusion following acute ischemia (Milun- ski et al. 1989a, 1989b). Milunski et al. (1989a) per- formed in situ experiments on regionally stunned ca- nine myocardium and found that the cyclic variation of integrated backscatter returned to normal values be- fore the cyclic variation in wall thickness returned to baseline values. Furthermore, these investigators found in humans that the cyclic variation of integrated back- scatter returned before a normal cyclic variation in wall thickness was observed (Milunski et al. 1989b). Hypothetically, this could be caused by the fact that, in stunned myocardium, perfusion recovers more rapidly
405
406 Ultrasound in Medicine and Biology Volume 23, Number 3, 1997
than contractile function. However, other studies (Haasler et al. 1993; McPherson et al. 1986; Rijster- borgh et al. 1996) revealed that perfusion as such does not influence variation in integrated backscatter.
In this study, integrated backscatter and wall thickness as well as their cyclic variation were studied in open-chested Yorkshire pigs during baseline condi- tions, left anterior descending coronary artery (LADCA) occlusion and several stages of reperfusion. To be able to compare the results with those from studies per- formed by other groups, the cyclic variation was calcu- lated using three different definitions as described and used by several authors (Mohr et al. 1989; Rijsterborgh et al. 1990; Sagar et al. 1987).
METHODS
Animal preparation All experiments were performed in accordance
with the Guiding Principles in the Care and Use of Animals as approved by the Council of the American Physiological Society (Office of Science and Health Reports No. (NIH) 80-23) and under the regulations of the Committee on Animal Experimentation of the Erasmus University Rotterdam.
After an overnight fast, 10 cross-bred Landrace X Yorkshire pigs (HVC, Hedel, The Netherlands) of either sex (25-33 kg) were sedated with 20 mg kg-’ ketamine IM (AUV, Cuijk, The Netherlands), anaesthetized with 20 mg kg-r sodium pentobarbital (Apharmo BV, Arnhem, The Netherlands), intubated and connected to a ventilator for intermittent positive pressure ventilation with a mixture of O2 and N2 ( 1:2, vol/vol). Respiratory rate and tidal volume were set and adjusted, when necessary, to keep arterial blood gases within the normal range (Soei et al. 1994). Cath- eters were placed in the superior vena cava for continu- ous infusion of lo- 15 mg kg-’ h-r sodium pentobar- bital and in the descending aorta for withdrawal of blood samples and measurement of central aortic blood pressure. A 7-French Sensodyn micromanometer- tipped catheter (B. Braun Medical B.V., Uden, The Netherlands), inserted via the left carotid artery, was used to measure left ventricular pressure. After admin- istration of 4 mg of the muscle relaxant pancuronium bromide (Organon Teknika B.V., Boxtel, The Nether- lands) and a midline stemotomy, the left mammary vessels were ligated and the second left rib was re- moved for ease of further instrumentation, while the heart was suspended in a pericardial cradle. The as- cending aorta was dissected free for placement of an electromagnetic flow probe (Skalar, Delft, The Nether- lands) for measurement of aortic blood flow. The prox- imal LADCA was dissected free for positioning of an atraumatic clamp. Rectal temperature was monitored
throughout the experiment and maintained between 37°C and 38°C using external heating pads and appro- priate coverage of the animals.
Experimental protocol A broadband ultrasound transducer (-20 dB
bandwidth 3.2-7.2 MHz, Krautkramer-Branson, Lew- istown, PA, USA) was sutured directly on the vascular free surface in the distribution area of the LADCA, while ensuring perpendicular insonification of the myocardial fibres. This set-up enabled the study of the same area throughout the entire experiment. However, it prevented spatial averaging.
After a stabilization period following completion of the surgical procedures, baseline recordings were made of pressures in the descending aorta ( AP) , left ventricle (LVP) and its first derivative (LVdP/dt), ascending aortic blood flow (cardiac output, CO), wall thickness and backscatter in the distribution area of the LADCA. The perfusion area of the LADCA was then stunned by 10 min of LADCA occlusion and 30 min of reperfusion. Due to technical timing difficulties, it was not possible to acquire the full series in all 10 pigs.
Measurements of wall thickness, backscatter properties and hemodynamics were subsequentially re- peated at baseline (n = lo), after 10 min of occlusion (n = 9) and after 1 (n = 8), 3 (n = 7), 5 (n = 8), 10 (n = lo), 15 (n = lo), 20 (n = lo), 25 (n = 10) and 30 min (n = 10) of reperfusion.
Data acquisition The ultrasound transducer was connected to a cus-
tom-designed transmitter/receiver (input impedance 100 0, fixed gain 29 dB, -6 dB cutoff frequencies 1.2 and 10 MHz). The amplified ultrasound signal was filtered by a fifth order lo-MHz low pass Chebyshev filter and connected to a dual channel digital oscillo- scope (LeCroy 9310L). Ultrasound signals from the time interval of interest (4.5-24.5 /.LS following the transmitter pulse) were digitized with g-bit resolution at a sample frequency of 25 MHz. In the other channel the left ventricular pressure was digitized. The digi- tized signals were stored in an IBM-compatible PC for off-line analysis.
Measurement sequences were generated by the PC. The heart rate was determined from the left ven- tricular pressure. The transmitter was triggered such that 51 traces could be acquired per heartbeat. A se- quence of 10 heartbeats was acquired at each measure- ment. Heartbeats with cycle length outside the range of 90%- 110% of the cycle length of the first beat of the measurements were omitted from further analysis. This occurred for < 1% of the beats.
Backscatter and wall thickness in stunned myocardium 0 A. F. W. VAN DER STEEN et al. 407
Data processing Data were processed off line. Transmural myocar-
dial wall thickness was calculated as the distance from the transducer on the epicardial to the endocardial wall. To locate the endocardial wall, the recorded ultrasound signals were displayed in M-mode and the wall was traced manually in every cardiac cycle by an observer using the computer system’s mouse. The timing scale of all measurements was resealed (based on the pres- sure curve) along the cardiac cycle from the beginning of systole (0%) to the end of diastole (loo%), with increments of 2% of the cardiac cycle.
Ultrasound spectra were extracted from the sig- nals after applying a split cosine bell window (p = 0.1) of 5~s length (Bloomfield 1976), excluding the endocardial wall. Integrated backscatter was calculated by averaging the spectra in the frequency range from 3.2-7.2 MHz (Le., the -20 dB bandwidth of the trans- ducer) .
Mean values and standard deviations of the inte- grated backscatter, wall thickness and left ventricular pressure were calculated for every 2% increment of the cardiac cycle.
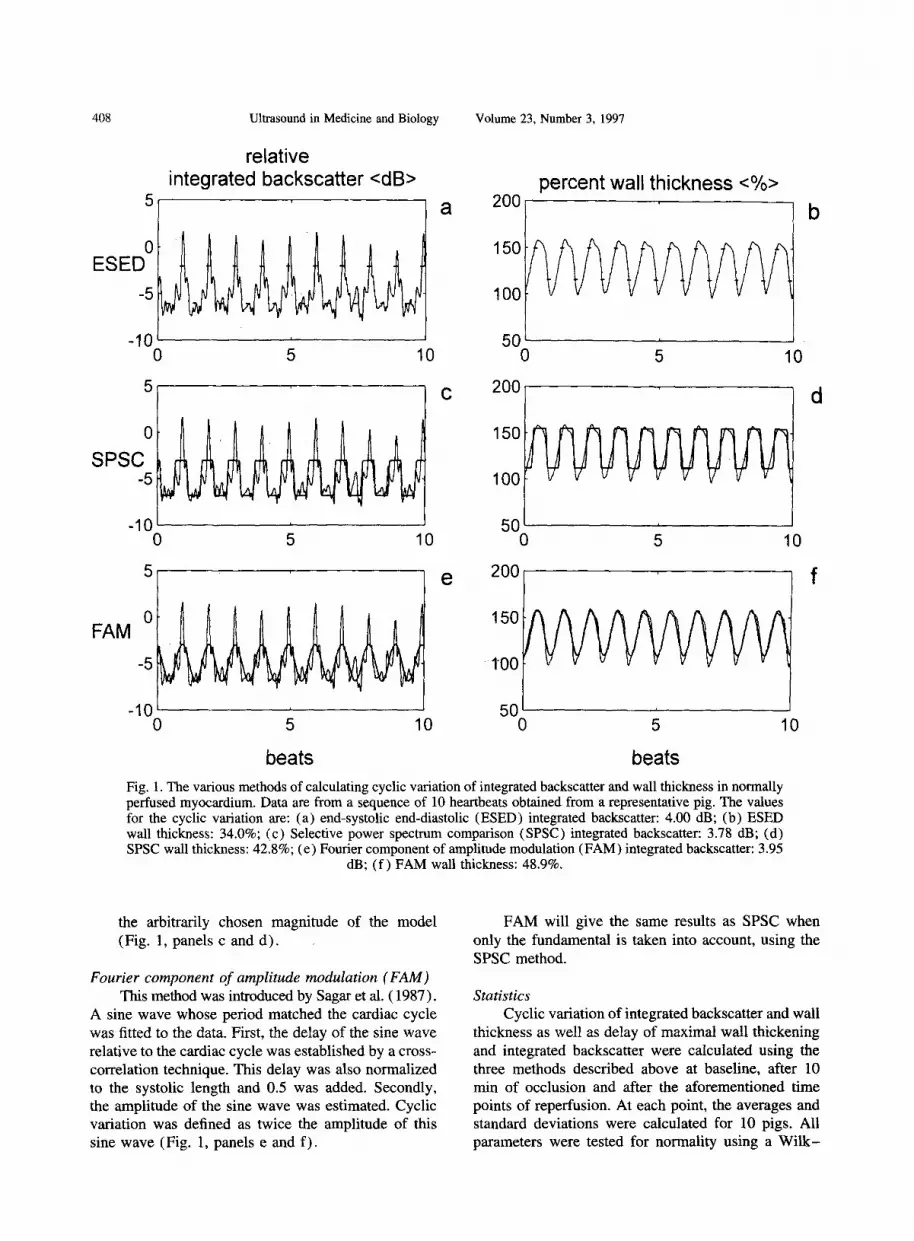
Since various definitions of cyclic variation of integrated backscatter appeared in the literature, the cyclic variations of integrated backscatter and wall thickness were calculated three different ways (Fig. 1) . Because of the empirical inverse relationship be- tween wall thickness and integrated backscatter (Mad- eras et al. 1983; Miller et al. 1983; Mimbs et al. 1981; Rijsterborgh et al. 1990, 1991; van der Steen et al. 1991) , all models were inverted before calculating cy- clic variation in wall thickness in all three methods.
End-systolic and end-diastolic differences (ESED) This method was described by Rijsterborgh et al.
( 1990). End systole was defined as the time interval from 30%-46% cardiac cycle and end diastole as be- ing from 80%-96%, each interval containing nine samples. End-systolic and end-diastolic values of inte- grated backscatter and wall thickness were calculated by averaging the mean values of the parameters over these intervals. Cyclic variation was defined as the difference between the values in those intervals (Fig. 1, panels a and b) .
Selective power spectrum comparison (SPSC) This method describes the cyclic variation of inte-
grated backscatter as a smoothed square wave function and determines its amplitude from the harmonics of the spectrum from this square wave function. It was described in detail by Mohr et al. ( 1989). In summary, it is described as follows. (a) First the average length of systole and the full
(b)
(cl
Cd)
(e)
(f)
cardiac cycle were determined. [Mohr et al. ( 1989) defined these as the average time interval from the beginning of each QRS complex to the end of each T wave and the average period be- tween two R tops. We extracted them from the left ventricular pressure. This is the only minor adaption to the method as it was introduced.] Then an objective model function was fitted to the data. This was a square wave function with a high value during the systolic interval and low value during the rest of cardiac cycle. The magnitude of the cyclic variation of the model is initially arbitrary. Both data and model were filtered by a binomial coefficient digital filter. The smoothed square wave was offset to have zero mean over the cardiac period. The data were truncated at both ends to retain an integral number of heartbeats. Offset and sloping trends in the data were removed by applying a least square fit to the filtered data and subtracting this fit from the data. An eventual delay between the model and the data was removed by cross-correlating them and shift- ing the model over the time interval at which the maximum cross-correlation occurred. Mohr et al. ( 1989) normahzed this time delay to the systolic length and added 0.5 to this value for display purposes. In this way, the delay is dis- played as the delay between the start of the systolic interval and the nadir of cyclic variation. Then both model and data were Fourier trans- formed. Since the model was a periodical smoothed square wave containing an integral number of heartbeats, the spectrum of the model carries power over the fundamental frequency (which corresponds to the frequency of the heart- beat) and its higher harmonics. Finally, the amplitude of the model has to be de- termined. This was done in two steps (e and f). At each harmonic, the power in the data was com- pared to the power in the model. There were two criteria for excluding a harmonic: ( 1) the power of the particular model harmonic was < 1% of the power at the maximal model harmonic; and (2) the power at the particular harmonic in the data was greater than the power in the fundamental of the data. Typically, 3-6 harmonics remained for further analysis. The power in each of these harmonics of the data was divided by the power in the corresponding harmonic in the model. These power ratios were weighted by the corresponding power content of the data and then averaged. Finally, the cyclic variation is defined as the square root of this weighted average multiplied by
408 Ultrasound in Medicine and Biology Volume 23, Number 3, 1997
relative integrated backscatter <dB>
ESEDO -5
-10' I
0
SPSC -5
FAM 0
-5
I I -10 '
0 I
5 10
beats
percent wall thickness c%> 200 b
150
5 10
d
100
502 0 5 10
200 f
150
1'00
5 10
beats Fig. 1. The various methods of calculating cyclic variation of integrated backscatter and wall thickness in normally perfused myocardium. Data are from a sequence of 10 heartbeats obtained from a representative pig. The values for the cyclic variation are: (a) end-systolic end-diastolic (ESED) integrated backscatter: 4.00 dB; (b) ESED wall thickness: 34.0%; (c) Selective power spectrum comparison (SPSC) integrated backscatter: 3.78 dB; (d) SPSC wall thickness: 42.8%; (e) Fourier component of amplitude modulation (FAM) integrated backscatter: 3.95
dB; (f ) FAM wall thickness: 48.9%.
the arbitrarily chosen magnitude of the model (Fig. 1, panels c and d) .
Fourier component of amplitude modulation (FAM) This method was introduced by Sagar et al. ( 1987).
A sine wave whose period matched the cardiac cycle was fitted to the data. First, the delay of the sine wave relative to the cardiac cycle was established by a cross- correlation technique. This delay was also normalized to the systolic length and 0.5 was added. Secondly, the amplitude of the sine wave was estimated. Cyclic variation was defined as twice the amplitude of this sine wave (Fig. 1, panels e and f) .
FAM will give the same results as SPSC when only the fundamental is taken into account, using the SPSC method.
Statistics Cyclic variation of integrated backscatter and wall
thickness as well as delay of maximal wall thickening and integrated backscatter were calculated using the three methods described above at baseline, after 10 min of occlusion and after the aforementioned time points of reperfusion. At each point, the averages and standard deviations were calculated for 10 pigs. All parameters were tested for normality using a Wilk-
Backscatter and wall thickness in stunned myocardium 0 A. F. W. VAN DER STEEN et al. 409
Table la. Cyclic variation of wall thickness according to the three methods during the different phases
of the experiments.
ESED FAM SPSC
Baseline 10 min occlusion
1 min reperfusion 3 min reperfusion 5 min reperfusion
10 min reperfusion 15 min reperfusion 20 min reperfusion 25 min reperfusion 30 min reperfusion
37.9 (11.2) -2.2 (2.8)* 37.8 (7.2) 26.4 (11.5) 21.8 (10.5)” 23.5 (9.2)* 23.7 (lO.l)* 24.4 (9.5)* 24.0 (9.2)* 23.9 (9.2)*
36.6 (8.6) 32.5 (8.0) 18.4 (7.4)* 22.7 (13.6) 36.1 (5.5) 33.8 (6.8) 32.8 (6.7) 30.6 (7.1) 3 1 .o (4.9) 28.4 (5.2) 32.2 (4.0) 30.0 (5.2) 31.6 (4.3) 29.3 (4.7) 31.3 (4.4) 28.5 (4.4) 30.5 (4.9) 27.8 (4.8) 31.5 (3.8) 29.0 (4.3)
Values are mean (SD) (%). * Values that differ significantly from baseline ( p < 0.05).
Table lb. Cyclic variation of integrated backscatter according to the three methods during the
different phases of the experiments.
ESED FAM SPSC
Baseline 3.3 (3.4) 4.1 (2.7) 4.2 (2.2) 10 min occlusion 0.3 (0.8)" 1.9 (1.2)* 3.1 (2.2) 1 min reperfusion 4.1 (2.3) 4.2 (1.6) 4.5 (2.0) 3 min reperfusion 2.6 (1.8) 4.9 (1.8) 6.0 (1.9) 5 min reperfusion 1.4 (1.6) 4.6 (2.2) 4.8 (2.0)
10 min reperfusion 2.0 (1.6) 4.1 (2.5) 4.6 (1.9) 1.5 min reperfusion 1.8 (1.8) 4.4 (2.6) 4.8 (2.5) 20 min reperfusion 2.0 (1.9) 4.4 (2.6) 4.7 (2.5) 25 min reperfusion 2.2 (1.8) 4.2 (2.4) 4.6 (2.3) 30 min reperfusion 2.2 (1.6) 4.3 (2.6) 4.4 (2.0)
Values are mean (SD) (dB). * Values that differ significantly from baseline (p < 0.05).
Shapiro test at each reperfusion time and during the whole experiment. Significant difference from baseline was calculated using paired t-tests (p < 0.05).
RESULTS
The Wilk-Shapiro test revealed that the observa- tions per reperfusion time were normally distributed, but because of the experimental design, the parameter set over the full experiment was not normally distrib- uted. The histogram will be trimodally distributed (see Figs. 2-6). One peak will appear around the values that occur after 10 min of occlusion, one peak around the values shortly after initial reperfusion (1 min) and the largest peak around the remaining values.
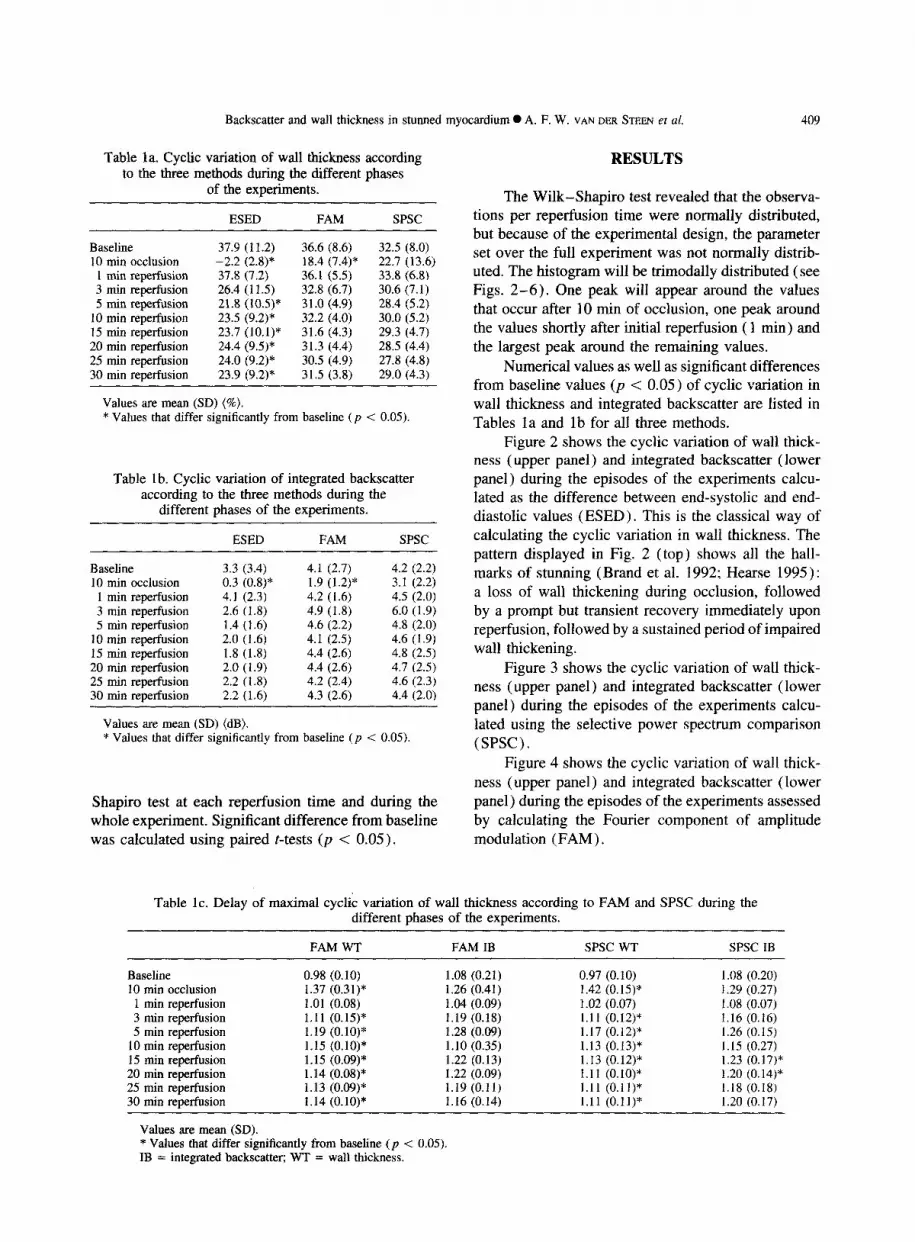
Numerical values as well as significant differences from baseline values (p < 0.05) of cyclic variation in wall thickness and integrated backscatter are listed in Tables la and lb for all three methods.
Figure 2 shows the cyclic variation of wall thick- ness (upper panel) and integrated backscatter (lower panel) during the episodes of the experiments calcu- lated as the difference between end-systolic and end- diastolic values (ESED) . This is the classical way of calculating the cyclic variation in wall thickness. The pattern displayed in Fig. 2 (top) shows all the hall- marks of stunning (Brand et al. 1992; Hearse 1995 ) : a loss of wall thickening during occlusion, followed by a prompt but transient recovery immediately upon reperfusion, followed by a sustained period of impaired wall thickening.
Figure 3 shows the cyclic variation of wall thick- ness (upper panel) and integrated backscatter (lower panel) during the episodes of the experiments calcu- lated using the selective power spectrum comparison (SPSC).
Figure 4 shows the cyclic variation of wall thick- ness (upper panel) and integrated backscatter (lower panel) during the episodes of the experiments assessed by calculating the Fourier component of amplitude modulation (FAM) .
Table lc. Delay of maximal cyclic variation of wall thickness according to FAM and SPSC during the different phases of the experiments.
FAM WT FAMIB SPSC WT SPSC IB
Baseline 10 min occlusion
1 min reperfusion 3 min reperfusion 5 min reperfusion
10 min reperfusion 15 min reperfusion 20 min reperfusion 25 min reperfusion 30 min reperfusion
0.98 (0.10) 1.37 (0.31)* 1.01 (0.08) 1.11 (0.15)* 1.19 (o.lo)* 1.15 (o.lo)* 1.15 (0.09)* 1.14 (0.08)* 1.13 (0.09)” 1.14 (0.10)”
1.08 (0.21) 1.26 (0.41) 1.04 (0.09) 1.19 (0.18) 1.28 (0.09) 1.10 (0.35) 1.22 (0.13) 1.22 (0.09) 1.19 (0.11) 1.16 (0.14)
0.97 (0.10) 1.42 (0.15)* 1.02 (0.07) 1.11 (0.12)* 1.17 (0.12)* 1.13 (0.13)* 1.13 (0.12)* 1.11 (o.lo)* 1.11 (o.ll)* 1.11 (o.ll)*
1.08 (0.20) 1.29 (0.27) 1.08 (0.07) 1.16 (0.16) 1.26 (0.15) 1.15 (0.27) 1.23 (0.17)* 1.20 (0.14)* 1.18 (0.18) 1.20 (0.17)
Values are mean (SD). * Values that differ significantly from baseline (p < 0.05). IB = integrated backscatter; WT = wall thickness.

Ultrasound in Medicine and Biology Volume 23, Number 3, 1997
6o magnitude cyclic variation WT ESEO c%>
50
-10 1 , , ( occlusion reperfuslon cmin> , , , ( , -10 0 5 10 15 20 25 30 35
magnitude CyCllC varlatlon 16 ESED <dE>
Occlusion reperfuslon cmln>
-10 0 5 IO 15 20 25 30 35
Fig. 2. The cyclic variation of wall thickness (upper panel) and integrated backscatter (lower panel) during the episodes of the experiments calculated as tire end-systolic and end-
diastolic difference (ESED ) .
All three methods reveal the same trend: the cyclic variations in wall thickness and integrated backscatter were blunted after 10 min of occlusion. After a short period of reperfusion, an overshoot in cyclic variation occurred and, after a longer period, it returned to a value that does not change between 5 and 30 min. ESED reveals a relatively lower cyclic variation in wall thickness and integrated backscatter during stun- ning, as compared to the other two methods of calculat- ing the cyclic variation. For ESED, the cyclic variation in wall thickness is significantly lower during stunning as compared to baseline, while the difference in cyclic variation in integrated backscatter is not significant. This is due to the lower relative standard deviation of the cyclic variation in wall thickness.
Return of cyclic variation in wall thickness and integrated backscatter occurred simultaneously, inde- pendent of the method used.
Figures 5 and 6 show the time delay, normalized to the systolic interval, of wall thickening and inte-
grated backscatter relative to the beginning of systole as calculated from SPSC and FAM, respectively. The numerical values as well as significant differences from baseline values (p < 0.05) are listed in Table lc.
DISCUSSION
Many studies have described phenomena that are related or potentially related to myocardial ultrasonic integrated backscatter and its variation during the car- diac cycle (Barzilai et al. 1984; Glueck et al. 1985; Hoffmeister et al. 1991; Maderas et al. 1988; Mottley and Miller 1988; Mottley et al. 1984; Recchia et al. 1993, 1995; Sagar et al. 1987, 1988, 1990; Wear et al. 1986, 1989; Wickline et al. 1985a, 1985b, 1991, 1992). An important observation has been the empiri- cal inverse linear relation between wall thickness and integrated backscatter (Rijsterborgh et al. 1990, 1991; van der Steen et al. 199 1) , This relation does not seem to hold in all cases (Milunski et al. 1989a, 1989b).
601magnltude cyclic varlatlon WT SPSC c%>
10
1
1
0
-10 J , , , , , , , . , , occlusion reperfuslon cmin>
-10 0 5 10 15 20 25 30 35
' magnitude CYCLIC varl tlon 1 P
IB SPSC <dB>
0
-1 1,. ;qcF!ysip?, __, , , , , reperfuslon cmln>
-10 0 5 10 15 20 25 30 35
Fig. 3. The cyclic variation of wall thickness (upper panel) and integrated backscatter (lower panel) during the episodes of the experiments calculated using tire selective power spec-
trum comparison (SPSC).

Backscatter and wall thickness in stunned myocardium 0 A. F. W. VAN DER STEEN ef ~2. 411
nagrlltude cyclic varlatlon WT FAM <%>
occlusion reperfuslon cmln>
-10 0 5 10 15 20 25 30 35
-lj,,,,,,,,,, occlusion ,__ ,, ,,,C_ ,,,, reperfusion ,,,, ,,, crnln' r,_ -!3 0 5 10 15 20 25 30 35
Fig. 4. The cyclic variation of wall thickness (upper panel) and integrated backscatter (lower panel) during the episodes of the experiments assessed by calculating the Fourier com-
ponent of amplitude modulation (FAM).
One specific situation where integrated backscatter may have additional value over wall thickness mea- surements is to detect stunned but viable myocardium. Milunski et al. (1989a) found after coronary occlusion for 15 min an earlier return of cyclic variation of inte- grated backscatter compared to the variation in wall thickness in mongrel dogs. In patients, Milunski et al. ( 1989b) noticed a variation in integrated backscatter where a variation in wall thickness could not yet be detected. In earlier studies from our laboratory, an em- pirical relationship between wall thickness and inte- grated backscatter was measured during a variety of conditions of pig myocardium (van der Steen and Rij- sterborgh 1996), including normal myocardium (LancCe et al. 1988; Rijsterborgh et al. 1993), fresh isolated myocardium (van der Steen et al. 199 1) , early ischemic myocardium (Rijsterborgh et al. 1990, 1991) , isolated heart myocardium under isovolumetric contraction (Rijsterborgh et al. 1996) and stunned myocardium (van der Steen et al. 1995). Our studies
and the results of Milunski et al. ( 1989b) seem to contradict. We therefore repeated a study in pigs in which myocardial stunning was produced, and we ana- lyzed the results using three standard definitions of cyclic variation of wall thickness and integrated back- scatter.
Comparison of difSerent definitions In this study, it is shown that results obtained by
these three definitions are closely related. There are a few principal differences. The definition as used by Rijsterborgh et al. ( 1990) (ESED) is the most straight- forward one. It does not, however, include the influ- ence of an eventual time shift between the rise of inte- grated backscatter or wall thickness under different circumstances. Another disadvantage is that it uses only a limited part of the data. The method as intro- duced by Mohr et al. ( 1989) (SPSC) includes the time shift and uses all data. However, it presumes that the
1.8 delay cyclic varlatlon IB SPSC
jelay cyclic variatlcn WT SPSC
A
.occlusion reperfusion cmln>
- -10 0 5 10 15 20 25 30 35
1.4
1.2
1 0
I A 0.e ,,, occlusion reperfuslon <m117>
-10 0 -k----i3 ;5 20 ?5 30 35
Fig. 5. The time delay of wall thickening and integrated backscatter normalized to the systolic interval and shifted half a systolic interval from the onset of contraction as calculated from the selective power spectrum comparison
(SPSC).
412 Ultrasound in Medicine and Biology Volume 23, Number 3, 1997
T
I.41
1.2- 1 T 1
I l.O-
i A 0.8 J , ( ( , , , . , , occlusion reperfusion <min>
-10 0 5 10 15 20 25 30 35
1.8 delay cyclic variation IB FAM 1
1.6 1
1.4-
J
1.2.
1.0.
1 O.BJ,,,,, occlusion ,,,, ,,,, ,,,, ,,,,I,,,, ,,,, reperfuslon ,,,, cmln>
-10 0 5 IO 15 20 2!7--%-75
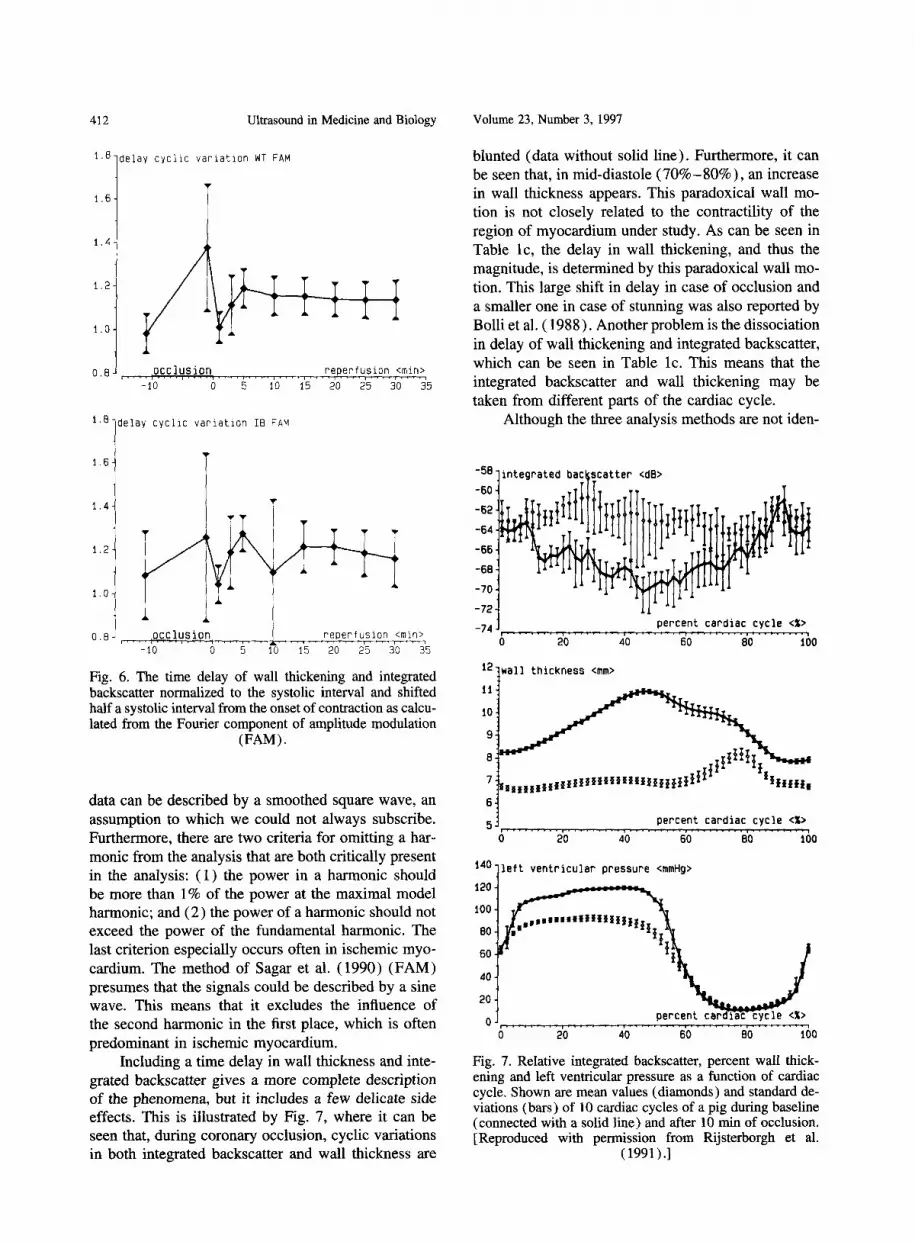
Fig. 6. The time delay of wall thickening and integrated backscatter normalized to the systolic interval and shifted half a systolic interval from the onset of contraction as calcu- lated from the Fourier component of amplitude modulation
(FAM).
data can be described by a smoothed square wave, an assumption to which we could not always subscribe. Furthermore, there are two criteria for omitting a har- monic from the analysis that are both critically present in the analysis: ( 1) the power in a harmonic should be more than 1% of the power at the maximal model harmonic; and (2) the power of a harmonic should not exceed the power of the fundamental harmonic. The last criterion especially occurs often in ischemic myo- cardium. The method of Sagar et al. ( 1990) (FAM) presumes that the signals could be described by a sine wave. This means that it excludes the influence of the second harmonic in the first place, which is often predominant in ischemic myocardium.
Including a time delay in wall thickness and inte- grated backscatter gives a more complete description of the phenomena, but it includes a few delicate side effects. This is illustrated by Fig. 7, where it can be seen that, during coronary occlusion, cyclic variations in both integrated backscatter and wall thickness are
blunted (data without solid line). Furthermore, it can be seen that, in mid-diastole (70%-80%)) an increase in wall thickness appears. This paradoxical wall mo- tion is not closely related to the contractility of the region of myocardium under study. As can be seen in Table lc, the delay in wall thickening, and thus the magnitude, is determined by this paradoxical wall mo- tion. This large shift in delay in case of occlusion and a smaller one in case of stunning was also reported by Bolli et al. ( 1988). Another problem is the dissociation in delay of wall thickening and integrated backscatter, which can be seen in Table lc. This means that the integrated backscatter and wall thickening may be taken from different parts of the cardiac cycle.
Although the three analysis methods are not iden-
-587integrated bac@catter <da>
-724 11
-74 percent cardiac cycle <X> ,
0 20 40 60 80 100
12+ia11 thickness <mm>
51,. _. _, , , ., _. , percent cardiac cycle cX> _, -1 0 20 40 60 80 100
140]1eft ventricular pressure cmmHg>
u-r------ I.....,...... ......l.........l....C 0 20 40 60 80 -700
Fig. 7. Relative integrated backscatter, percent wall thick- ening and left ventricular pressure as a function of cardiac cycle. Shown are mean values (diamonds) and standard de- viations (bars) of 10 cardiac cycles of a pig during baseline (connected with a solid line) and after 10 min of occlusion. [Reproduced with permission from Rijsterborgh et al.
(1991).]
Backscatter and wall thickness in stunned myocardium 0 A. F. W. VAN DER STEEN ef al. 413
tical, they reveal basically the same result. There are some differences: using ESED, the cyclic variation in integrated backscatter at baseline is somewhat lower than that described by the other two methods. Further- more, it remains lower after reperfusion. This could be explained by the inclusion of the time delay in the latter two methods. In Figs. 5 and 6, it can be seen that coronary occlusion introduces an extra time delay in maximum integrated backscatter during the cardiac cycle, which does not fully return during the period of reperfusion under study. This means that maximal and minimal integrated backscatter do not occur at end diastole and end systole, which blunts the cyclic varia- tion according to ESED. The same effect could be the cause for the observation that the maximal cyclic variation is found after 1 min according to ESED but after 3 min for SPSC and FAM. Figures 5 and 6 show that the delay varies most in this time interval, so it is not surprising that a method that does not include this delay reveals somewhat different results. As a result of these differences, a dissociation of cyclic variation of integrated backscatter and wall thickness will occur if they are not determined by the same method.
An early return of the cyclic variation of inte- grated backscatter in stunned myocardium could not be observed in Yorkshire pigs, independent of the method of data processing. The present results are in accordance with our earlier findings and indicate that the relationship between integrated backscatter and wall thickness is maintained, even during stunning. The discrepancy with the results by Milunski et al. (1989a) could possibly be explained by the choice of the animal. The coronary bed of the heart of dogs is characterized by the presence of collaterals that are absent in pigs. This results in a larger decrease of myocardial wall thickening in the pig as compared to the dog for similar occlusion periods. To facilitate comparison between our study and that of Milunski et al. ( 1989a), we occluded for 10 min, while they oc- cluded for 15 min. However, the resulting cardiac dys- function in our study was far less than noted in their study, implying that the differences might be related to the degree of stunning. Another explanation is the fact that they used SPSC for calculation of the cyclic variation in integrated backscatter while they used ESED for the cyclic variation in wall thickness. As stated above, this may cause a dissociation.
O’Brien et al. (1995) performed in situ measure- ments on mongrel dogs in which they compared abso- lute values of integrated backscatter at 5 MHz in nor- mal, stunned and ischemic myocardium. They oc- cluded the LAD for 15 min to provoke stunning, in accordance with the measurements of Milunski et al. ( 1989a). They measured absolute backscatter levels
after 180 min of reperfusion and did not find a differ- ence in stunned and normal myocardium, which is in accordance with both our measurements and those of Milunski et al. (1989a).
In conclusion, we did not find an earlier return of cyclic variation of integrated backscatter than of wall thickness in stunned myocardium, so the relationship between wall thickness and integrated backscatter is maintained.
Acknowledgements-These investigations were supported by grant RGN02332 from the Netherlands Technology Foundation (STW).
REFERENCES
Barzilai B, Madaras EI, Sobel BE, Miller JG, Perez JE. Effects of myocardial contraction on ultrasonic backscatter before and after ischemia. Am J Physiol 1984;247:H478-H483.
Bloomfield P. Fourier analysis of time series: An introduction. New York: John Wiley, 1976:80-85.
Bolli R, Zhu WX, Thomby JI, O’Neill PG, Roberts R. Time course and determinants of recovery of function after reversible isch- emia in conscious dogs. Am J Physiol 1988;254:H102-H114.
Brand T, Sharma HS, Fleischmamt KE, et al. Proto-oncogene expres- sion in porcine myocardium subjected to ischemia and reperfu- sion. Circ Res 1992;71:1351-1360.
Glueck RM, Mottley JG, Sobel BE, Miller JG, Perez JE. Changes in ultrasonic attenuation and backscatter of muscle with state of contraction. Ultrasound Med Biol 1985; 11:605-610.
Haasler GB, Rhyne TL, Komorowski R, Boerboom LE, Sagar KB. The lack of effect of hemodilution, myocardial water content, and increased coronary artery blood flow on integrated backscatter in the beating canine heart. Ultrason Imaging 1993; 1525-35.
Hearse DJ. Stunning: Three questions and concerns. Basic Res Cardiol 1995;90:263-265.
Hoffmeister BK, Wong AK, Verdonck ED, Wickline SA, Miller JG. Anisotropy of ultrasonic backscatter from human tendon compared to that from normal human myocardium. IEEE Tram UFFC 1991;9lCH3079-1:1127-1131.
Lancee CT, Mastik F. Rijsterborgh H, Born N. Myocardial backscat- ter analysis in animal experiments. Ultrasonics 1988;26:155- 163.
Maderas EI, Barzilai B, Perez JE, Sobel BE, Miller JG. Changes in myocardial backscatter throughout the cardiac cycle. Ultrason Imaging 1983;5:229-239.
Maderas EI, Perez J, Sobel BE, Mottley JG, Miller JG. Anisotropy of the ultrasonic backscatter of myocardial tissue: II. Measure- ments in vitro. J Acoust Sot Am 1988;83:762-769.
McPherson DD, Skorton DJ, Wilbricht CJ, et al. Is myocardial perfu- sion a determinant of integrated ultrasound backscatter. Clin Res 1986; 34:898A.
Miller JG, Perez JE, Mottley JG, et al. Myocardial tissue character- ization: An approach based on quantitative backscatter and atten- uation. Proc IEEE Ultrasonics Symp 1983;CH1947-1:782-793.
Milunski MR, Mohr GA, Wear KA, et al. Early identification with ultrasonic integrated backscatter of viable but stunned myocar- dium in dogs. J Am Co11 Cardiol 1989a; 14:462-471.
Milunski MR, Mohr GA, Perez JE, et al. Ultrasonic tissue character- ization with integrated backscatter: Acute myocardial ischemia, reperfusion, and stunned myocardium in patients. Circulation 1989b;80:491-503.
Mimbs WJ, Bauwens D, Cohen RD. et al. Effects of myocardial ischemia on quantitative ultrasonic backscatter and identification of responsible determinants. Circ Res 1981;49:89-96.
Mohr GA. Vered Z, Barzilai B, et al. Automated determination of the magnitude and time delay (“phase”) of the cardiac cycle dependent variation of myocardial ultrasonic integrated backscat- ter. Ultrason Imaging 1989; 11:245-259.
Mottley JG, Glueck RM, Perez JE, Sobel BE. Miller JG. Regional
414 Ultrasound in Medicine and Biology Volume 23, Number 3, 1997
differences in the cyclic variation of rnyocardial backscatter that parallel regional differences in contractile performance. J Acoust Sot Am 1984;76:1617-1623.
Mottley JG, Miller JG. Anisotropy of the ultrasonic backscatter of myocardial tissue: I. Theory and measurements in vitro. J Acoust Sot Am 1988;83:755-761.
O’Brien WD, Sagar KB, Warltier DC, Rhyne TL. Acoustic propaga- tion of normal, stunned and infarcted myocardium: Morphologi- cal and biochemical determinants. Circulation 1995;91:154- 160.
Office of Science and Health Reports. Guide for the care and use of laboratory animals. DHEW Publication No. (NIH)80-23, DRRl NIH Bethesda.
Recchia D, Miller JG, Wickline SA. Quantification of ultrasonic anisotropy in normal myocardium with lateral gain compensation of two dimensional integrated backscatter images. Ultrasound Med Biol 1993; 19:497-505.
Recchia D, Hall CS, Shepard RK, Miller JG, Wickline SA. Mecha- nisms of the view dependence of ultrasonic backscatter from normal myocardium. IEEE Tram UFFC 1995;42:91-98.
Rijsterborgh H, Mastik F, Lancee CT, et al. Ultrasonic myocardial integrated backscatter and myocardial wall thickness in animal experiments. Ultrasound Med Biol 1990; 16:29-36.
Rijsterborgh H, Mastik F, Lancee CT, et al. The relative contribu- tions of myocardial wall thickness and ischemia to ultrasonic myocardial integrated backscatter during experimental ischemia. Ultrasound Med Biol 1991; 17:41-48.
Riisterborgh H, Mastik F, Lancee CT, et al. Ultrasound myocardial integrated backscatter signal processing: Frequency domain ver- sus time domain. Ultrasound Med Biol 1993; 19:21 l-219.
Rijsterborgh H, van der Steen AFW, Mastik F, et al. The relationship between myocardial integrated backscatter and wall thickness during isovolurnic contraction: An isolated pig heart study. Ultra- sound Med Biol 1996;22:43-52.
Sagar KB, Rhyne TL, Warltier DC, Pelt LE, Warm LS. Intramyocar- dial variability in integrated backscatter: Effects of coronary oc- clusion and reperfusion. Circulation 1987;75:436-442.
Sagar KB, Pelt LE, Rhyne TL, Warm LS, Warltier DC. Influence
of heart rate, preload, afterload, and inotropic state on myocardial ultrasonic backscatter. Circulation 1988;77:478-483.
Sagar KB, Pelt LR, Rhyne TL, et al. Role of ultrasonic tissue charac- terization to distinguish reversible from irreversible myocardial injury. J Am Sot Echocardiogr 1990;3:471-477.
Soei LK, Sassen LMA, Fan DS, et al. Myofibrillar Ca*+ sensitization predominantly enhances function and mechanical efficiency of stunned myocardium. Circulation 1994;90:959-969.
van der Steen AFW, Rijsterborgh H. Myocardial ultrasonic tissue characterization: The Rotterdam approach. Thorax Centre J 1996;8:25-29.
van der Steen AFW, Rijsterborgh H, Mastik F, et al. Influence of attenuation on measurements of ultrasonic myocardial integrated backscatter during the cardiac cycle. Ultrasound Med Biol 1991;17:869-877.
van der Steen AFW, Rijsterborgh H, Krams R, et al. Cyclic variation of integrated backscatter and wall thickness in stunned myocar- dium. Ultrasonogr Bull 1995;23:6-10.
Wear KA, Shoup TA, Popp RI,. Ultrasonic characterization of ca- nine myocardium contraction. IEEE Trans UFFC 1986;33:347- 353.
Wear KA, Milunski MR, Wickline SA, et al. Contraction-related variation dependence of acoustic properties of canine myocar- dium. J Acoust Sot Am 1989;86:2067-2072.
Wickline SA, Thomas LJ III, Miller JG, Sobel BE, Perez JE. The dependence of myocardial ultrasonic integrated backscatter on contractile performance. Circulation 1985a;72:183-192.
Wickline SA, Thomas LJ III, Miller JG, Sobel BE, Perez JE. A relationship between ultrasonic integrated backscatter and myo- cardial contractile function. J Clin Invest 1985b;76:2151-2160.
Wickline SA, Verdonk ED, Miller JG. Three-dimensional character- ization of human ventricular myofiber architecture by ultrasonic backscatter. J Clin Invest 1991;88:438-446.
Wickline SA, Verdonk ED, Wong AK, Shepard RK, Miller JG. Structural remodeling of human myocardial tissue after in- farction: Quantification with ultrasonic backscatter. Circulation 1992;85:259-268.
Related Documents