INFLUENCE OF ADVERTISING THROUGH MEDIA ON CONSUMERS’ ATTITUDE: A COMPARISON OF ONLINE AND OFFLINE CHANNELS USED BY SELECTED COMMERCIAL BANKS IN NAIROBI COUNTY, KENYA KIPCHILLAT NANCY JERONO A Thesis submitted to the Institute of Postgraduate Studies in fulfilment of the requirements for the award of Doctor of Philosophy in Business Administration (Marketing) in Kabarak University. OCTOBER, 2020

Welcome message from author
This document is posted to help you gain knowledge. Please leave a comment to let me know what you think about it! Share it to your friends and learn new things together.
Transcript

INFLUENCE OF ADVERTISING THROUGH MEDIA ON CONSUMERS’
ATTITUDE: A COMPARISON OF ONLINE AND OFFLINE CHANNELS
USED BY SELECTED COMMERCIAL BANKS IN NAIROBI COUNTY,
KENYA
KIPCHILLAT NANCY JERONO
A Thesis submitted to the Institute of Postgraduate Studies in fulfilment of the
requirements for the award of Doctor of Philosophy in Business Administration
(Marketing) in Kabarak University.
OCTOBER, 2020

ii
DECLARATION
1. I do hereby declare that:
(i) This thesis is my own work and to the best of my knowledge, it has not
been presented for the award of a degree in any university or college.
(ii) That the work has not incorporated material from other works or a
paraphrase of such material without due and appropriate acknowledgment
(iii) That the work has been subjected to processes of anti-plagiarism and has
met Kabarak University 15% similarity index threshold.
2. I do understand that issues of academic integrity are paramount and therefore I
may be suspended or expelled from the University or my degree may be recalled
for academic dishonesty or any other related academic malpractices.
Signed: _______________________________Date: _____________________
Name of the Student: Kipchillat, Nancy Jerono Admission No: GDB/M/1200/09/15

iii
RECOMMENDATION
To the Institute of Postgraduate Studies:
The thesis entitled “Influence of advertising through media on consumers’ attitude: A
comparison of online and offline media channels used by selected commercial banks in
Nairobi County, Kenya” and written by Nancy Jerono Kipchillat, is presented to the
Institute of Postgraduate Studies of Kabarak University. We have received this thesis and
as university supervisors, we recommend it to be accepted in the fulfilment for the
requirements of the award for the Degree of Doctor of Philosophy in Business
Administration (Marketing Option).
Signed: ___________________________ Date: ________________________
Dr. Hillary O. Busolo
Chair of Department of Marketing and Logistics Management,
School of Business, Economics and Human Resources Development
Alupe University College
Signed: ___________________________ Date ________________________
Prof. Ronald K. Chepkilot
Professor of Human Resource Management
School of Business and Economics
Kabarak University

iv
COPYRIGHT
@2020
Nancy Jerono Kipchillat
All rights reserved. No part of this thesis may be reproduced, published or transmitted
in any form by means of either mechanical, including photocopying, recording or any
other information storage or retrieval system without permission in writing from the
author or Kabarak University on behalf of the author.
v
ACKNOWLEDGEMENT
I thank the Lord Jesus for the wisdom and strength He bestowed upon me to continue
pursuing education to this level.
My gratitude also goes to my dear mum, Mrs. Sally Kimooi Kipchillat, who has been a
source of inspiration to me on the need to diligently follow through on my goals with
great enthusiasm and zeal despite challenges on the way. Mum, you remain my role
model, particularly on having faith in God as we work towards achieving our personal
and community ambitions. I also thank my daughter Kayana Kimoi for her patience even
when I spent a lot of time away from her to ensure my research work is accomplished. I
will always appreciate her cheerfulness, love, and patience. I will not forget my late Dad,
Mr. Stephen Kigen Kipchillat; you will remain my inspiration on the value of hard work
and academic pursuit.
I also acknowledge my supervisors; Dr. Hillary Busolo and Prof. Ronald Chepkilot, for
their relentless support to ensure that I finish this study. Much appreciation also goes to
Dr. Betty Tikoko, for her focused words of wisdom in ensuring that I accomplish my
academic goals. Appreciation also goes to Dr. Peter Juma my research assistant who
assisted in field work and data analysis; Dr Evelyn Mahero and Francis Ndegwa who
proof read and edited the final document; May God bless you.
Lastly, my gratitude goes to my family members, prayer partners, friends and colleagues
who encouraged me towards achieving this goal. May God bless you for your sacrifice
of time and other resources you offered me in the course of this academic journey; I
salute you all.

vi
DEDICATION
This thesis is dedicated to the Almighty God, who has made this study possible. I will
always be grateful. Receive all the glory and honour.
I also dedicate it to the next generation of marketers who will find this research work
useful in their day-to-day decision-making. I pray this work will inspire you to always
use research as a guide to your daily work as you aim to impact humanity.
This work is also dedicated to my dear family, friends, and everyone else who has
continuously encouraged me to be the best that I can in all my endeavours.

vii
ABSTRACT
The media landscape in Kenya has changed over time with more internet-enabled
channels, giving marketers a wide range of communication mediums to advertise
through. This has made institutions to push their advertising through online instead of
offline channels, yet there is scanty scientific studies to justify this shift. Marketers use
media advertisements to shape consumers’ attitude positively. The objective of this study
was to establish the influence of advertising through media on consumers’ attitude: a
comparison of online (Facebook, Google Ads and YouTube) and offline (TV, Radio and
Newspaper) media channels used by selected commercial banks in Nairobi County,
Kenya. The study used the AIDA model to make assumptions on advertising through
media and the Tri-Component attitude model on consumer’s attitude. The study
population comprised all consumers who bank with Equity Bank Limited, Kenya
Commercial Bank Limited and Co-operative Bank of Kenya Limited in Nairobi County.
It adopted a positivist paradigm research philosophy and used a descriptive cross-
sectional survey from a sample size of 384. Data were collected using questionnaires
comprising Likert scale type of questions to measure consumers’ attitude. Collected data
were analysed using descriptive and inferential statistics. The study established that there
was a significant and positive influence of offline media channels (TV and Radio) on
consumers’ attitude; save for Newspaper. Further, the study found out that the influence
of online media (Facebook and Google Ads) was insignificant in influencing consumers’
attitude, save for YouTube. The relationship between advertising through media and
consumers’ attitude was found to be moderated by age. The recommendation for this
study is that marketers should advertise through online channels to influence awareness
and offline channels to influence action sub-constructs of consumers’ attitude.
Keywords: Advertising, Consumers’ Attitude, Online Media, Offline Media
viii
TABLE OF CONTENTS
DECLARATION ............................................................................................................ ii
RECOMMENDATION ................................................................................................iii
COPYRIGHT ................................................................................................................ iv
ACKNOWLEDGEMENT ............................................................................................. v
DEDICATION ............................................................................................................... vi
ABSTRACT .................................................................................................................. vii
TABLE OF CONTENTS ............................................................................................viii
LIST OF TABLES ....................................................................................................... xii
LIST OF FIGURES .................................................................................................... xiv
ABBREVIATIONS AND ACRONYMS .................................................................... xv
OPERATIONAL DEFINITION OF KEY TERMS ................................................ xvi
CHAPTER ONE ............................................................................................................. 1
INTRODUCTION .......................................................................................................... 1
1.1 Introduction ........................................................................................................... 1
1.2 Background of the study ........................................................................................ 1
1.2.1 The concept of advertising through media ..................................................... 5
1.2.2 Consumer attitude .......................................................................................... 6
1.2.3 Commercial banks in Nairobi County ........................................................... 8
1.2 Statement of the problem ..................................................................................... 10
1.3 Research objectives ............................................................................................. 13
1.3.1 Main objective ............................................................................................. 13
1.3.2 Specific objectives ....................................................................................... 13
1.4 Research hypotheses ............................................................................................ 14
1.5 Justification of the study ...................................................................................... 14
1.6 Significance of the study ..................................................................................... 16
1.7 Limitations of the study ....................................................................................... 16
1.8 Delimitations of the study .................................................................................... 18
1.9 Summary of the chapter ....................................................................................... 19
CHAPTER TWO .......................................................................................................... 20
LITERATURE REVIEW ............................................................................................ 20
2.1 Introduction ......................................................................................................... 20
2.2 Theoretical literature review ................................................................................ 20
2.2.1 Tri-Component Attitude Model ................................................................... 20
2.2.2 AIDA Model ................................................................................................ 22
2.3 Empirical literature review .................................................................................. 26
2.3.1 Advertising through media........................................................................... 27
2.3.1.1 Advertising through online media channels ........................................... 31

ix
2.3.1.2 Advertising through Facebook ............................................................. 37
2.3.3.3 Advertising through Google Ads ......................................................... 40
2.3.3.4 Advertising through YouTube ............................................................. 40
2.3.4 Advertising through offline media channels ................................................ 41
2.3.4.1 Advertising through television ............................................................. 43
2.3.4.2 Advertising through radio .................................................................... 43
2.3.4.3 Advertising through newspaper ........................................................... 44
2.3.5 Consumers’ attitude ..................................................................................... 46
2.3.5.1 Awareness, liking and action components of attitude .......................... 47
2.3.5.2 Attitude development ........................................................................... 49
2.3.5.3 Functions of attitude ............................................................................. 50
2.3.5.4 Measuring attitude ................................................................................ 51
2.3.6 Age of the consumer .................................................................................... 54
2.4 Overview of existing literature ............................................................................ 57 2.4.1 Kenya Commercial Bank ............................................................................. 57 2.4.2 Equity Bank ................................................................................................. 58 2.4.3 Co-operative Bank of Kenya........................................................................ 59
2.5 Summary and gaps ............................................................................................... 59
2.6 Conceptual framework ........................................................................................ 63
CHAPTER THREE ..................................................................................................... 65
RESEARCH METHODOLOGY ................................................................................ 65
3.1 Introduction ......................................................................................................... 65
3.2 Research philosophy ............................................................................................ 65
3.3 Research design ................................................................................................... 66
3.4 The Population of the study ................................................................................. 67
3.5 Sample size determination ................................................................................... 67
3.6 Study area ............................................................................................................ 69
3.7 Instrumentation .................................................................................................... 70
3.7.1 Validity of the instrument ................................................................................. 71
3.7.2 Reliability of the instrument ............................................................................. 72
3.8 Data collection procedure .................................................................................... 74
3.9 Operationalization and measurement of variables ............................................... 75
3.10 Data analysis ...................................................................................................... 76 3.10.1 Descriptive analysis ................................................................................... 77 3.10.2 Inferential analysis ..................................................................................... 77
3.11 Sampling adequacy ............................................................................................ 78
3.12 Ethical considerations ........................................................................................ 79
CHAPTER FOUR ........................................................................................................ 80
DATA ANALYSIS, RESULTS AND DISCUSSION ................................................ 80
4.1 Introduction ......................................................................................................... 80
4.2 Preliminary analysis ............................................................................................ 80

x
4.2.1 Response rate ............................................................................................... 81
4.3 Demographics ...................................................................................................... 81 4.3.1 Respondents’ age ......................................................................................... 81 4.3.2 Respondents’ gender and level of education ............................................... 82
4.4 Consumer preference for media channels ........................................................... 84 4.4.1 Order of preference for the advertising channels ......................................... 85
4.5 Time spent on media channels ............................................................................. 88
4.6 Attention on advertisements done through media channels. ............................... 92
4.7 Understanding advertisements done through media channels ............................. 97
4.8 Influence of advertising through media channels on consumers’ attitude ........ 102 4.8.1 Advertising through online media on consumers’ attitude (awareness) .... 103 4.8.2 Advertising through offline media on consumers’ attitude (awareness) ... 106
4.8.3 Advertising through online media on consumers’ attitude (liking) ........... 108 4.8.4 Offline media advertisements on consumer attitude (liking) ..................... 112 4.8.5 Online media advertisements on consumer attitude (action) ..................... 115 4.8.6 Offline media advertisement on consumer attitude (action) ...................... 118 4.8.7 Summary of the results on the influence of advertising through media on
consumers’ attitude ............................................................................... 121
4.9 Hypotheses testing ............................................................................................. 123 4.9.1 Correlation analysis results ........................................................................ 123
4.9.2 The influence of advertising through Facebook on consumers’ attitude ... 124 4.9.3 The influence of advertising through Google Ads on consumers’ attitude 128
4.9.4 The influence of advertising through YouTube on consumers’ attitude ... 131 4.9.5 The influence of advertising through television on consumers’ attitude ... 134 4.9.6 The influence of advertising through radio on consumer attitude ............. 137
4.9.7 The influence of advertising through newspaper on consumers’ attitude . 141 4.9.9 Influence of the moderating effect of age on advertising through online and
offline media channels on consumers’ attitude. .................................... 152 4.9.10. Summary results of hypotheses testing. .................................................. 156
4.10 Discussion ........................................................................................................ 157
4.10.1 Relationship between advertising through online media channels and
consumers’ attitude ............................................................................... 157 4.10.2 Relationship between advertising through offline media channel and
consumers’ attitude ............................................................................... 158 4.10.3 Relationship between advertising through media channel, consumers’
age and consumers’ attitude .................................................................. 159
4.11 Summary of the chapter ................................................................................... 161
CHAPTER FIVE ........................................................................................................ 163
CONCLUSION AND RECOMMENDATIONS ..................................................... 163
5.1 Introduction ....................................................................................................... 163
5.2 Summary of the findings ................................................................................... 163
5.3 Conclusion ......................................................................................................... 165
5.4 Recommendations of the research findings ....................................................... 168
5.4.1 Theoretical recommendations .................................................................... 169 5.4.2 Policy recommendations ............................................................................ 171

xi
5.4.3 Practitioners’ recommendations ................................................................. 172
5.5 Suggestions for further research ........................................................................ 174
5.6 Summary of the chapter ..................................................................................... 175
REFERENCES ........................................................................................................... 176
APPENDICES ............................................................................................................ 189
Appendix I: Letter of Introduction ............................................................................... 189
Appendix II: Questionnaire .......................................................................................... 190
Appendix III: Bank branches used for the study in Nairobi County ............................ 194
Appendix IV: Equity Bank branches in Nairobi County ............................................. 195
Appendix V: Kenya Commercial Bank branches in Nairobi County .......................... 197
Appendix VI: Co-operative Bank of Kenya branches in Nairobi County ................... 199
Appendix VII: Letter to NACOSTI from Kabarak University .................................... 201
Appendix VIII: Research authorization from NACOSTI ............................................ 202
Appendix IX: Research permit from NACOSTI .......................................................... 203
Appendix X: Research authorization from Ministry of Education .............................. 204
Appendix XI: Research acknowledgment from Nairobi County ................................. 205
Appendix XII: Publication 1 ........................................................................................ 206
Appendix XIII: Publication 2 ....................................................................................... 207

xii
LIST OF TABLES
Table 1: Global digital snapshot Jan.2017 ..................................................................... 38 Table 2: Digital in Africa, Jan. 2017 .............................................................................. 39 Table 3: Population of the study………...………………...………………………. …67
Table 4: Sample size setermination ............................................................................... 68 Table 5: Reliability tests ................................................................................................. 74 Table 6: Variables in the questionnaire .......................................................................... 76 Table 7: Kaiser-Meyer-Olkin (KMO) and Bartlett's Test .............................................. 78 Table 8: Respondents’ age distribution from the three selected banks .......................... 82
Table 9: Respondents’ gender distribution for the three selected banks ........................ 83 Table 10: Respondents’ level of education for the three selected banks........................ 83 Table 11: Preference for media channel by consumers from selected Commercial Banks
in Nairobi County ................................................................................................. 84 Table 12: Order of preference for the online and offline media channel used by
respondents ........................................................................................................... 86 Table 13: Time spent on media channels by Equity Bank respondents ......................... 89 Table 14: Time spent on media channels by KCB Bank respondents ........................... 89
Table 15: Time spent on media channels by Co-operative Bank respondents ............... 90 Table 16: Attention to advertisements done through media channels by Equity Bank
respondents ........................................................................................................... 93 Table 17: Attention on advertisements done through media channels by KCB Bank
respondents ........................................................................................................... 94 Table 18: Attention on advertisement done through media channels by Co-operative
Bank of Kenya respondents .................................................................................. 95 Table 19: Understanding advertisements done through media channels by Equity Bank
respondents ........................................................................................................... 98 Table 20: Understanding advertisements done through media channels by KCB
respondents ........................................................................................................... 99 Table 21: Understanding advertisements done through media channel by Co-operative
Bank respondents ................................................................................................ 100
Table 22: Advertising through online media by Equity Bank on consumers’ attitude
(awareness) ......................................................................................................... 103
Table 23: Advertising through online media by KCB on consumers’ attitude
(awareness) ......................................................................................................... 104
Table 24: Advertising through online media by Co-operative Bank of Kenya on
consumers’ attitude (awareness) ......................................................................... 105
Table 25: Advertising through offline media by Equity Bank on consumers’ attitude
(awareness) ......................................................................................................... 106 Table 26: Advertising through online media by KCB on consumers’ attitude
(awareness) ......................................................................................................... 107 Table 27: Advertising through offline media by Co-operative Bank of Kenya on
consumers’ attitude (awareness) ......................................................................... 107 Table 28: Advertising through online media by Equity Bank on consumers’ attitude
(liking) ................................................................................................................. 109 Table 29: Advertising through online media by KCB on consumers’ attitude (liking)
............................................................................................................................. 110 Table 30: Advertising through online media by Co-operative Bank of Kenya on
consumers’ attitude (liking) ................................................................................ 111
Table 31: Offline media advertisements by Equity Bank on consumer attitude (liking)
............................................................................................................................. 112 Table 32: Offline media advertisements by KCB on consumer attitude (liking) ......... 113

xiii
Table 33: Offline media advertisements by Co-operative Bank on consumer attitude
(liking) ................................................................................................................. 114 Table 34: Online media advertisements by Equity Bank on consumer attitude (action)
............................................................................................................................. 115
Table 35: Online media advertisements by KCB on consumer attitude (action) ......... 116 Table 36: Online media advertisements by Co-operative Bank of Kenya on consumer
attitude (action) ................................................................................................... 117 Table 37: Offline advertisement by Equity Bank on consumer attitude (action) ......... 118 Table 38: Offline advertisement by KCB on consumer attitude (action)..................... 119
Table 39: Offline advertisement by Co-operative Bank of Kenya on consumer attitude
(action) ................................................................................................................ 120 Table 40: Summary of descriptive statistics ................................................................ 121
Table 41: Correlation analysis between advertising through Facebook and consumer
attitude (awareness, liking and action) ................................................................ 125 Table 42: Regression results of advertising through Facebook and consumer attitude126 Table 43: Correlation analysis between advertising through Google Ads and consumer
attitude (awareness, liking and action) ................................................................ 128
Table 44: Regression results of advertising through Google Ads and consumer attitude
............................................................................................................................. 130 Table 45: Correlation analysis between advertising through YouTube and consumer
attitude (awareness, liking and action) ................................................................ 132
Table 46: Regression results of advertising through YouTube and consumer attitude 133 Table 47: Correlation analysis between advertising through TV and consumer attitude
(awareness, liking and action) ............................................................................. 135 Table 48: Regression results of advertising through TV and consumer attitude ......... 136
Table 49: Correlation analysis between advertising through Radio and consumer
attitude (awareness, liking and action) ................................................................ 138
Table 50: Regression results of advertising through tadio and consumers’ attitude .... 139 Table 51: Correlation analysis between advertising through newspaper and consumer
attitude (awareness, liking and action) ................................................................ 142
Table 52: Regression results of advertising through newspaper and consumers’ attitude
............................................................................................................................. 143
Table 53: Correlation analysis between advertising through online media channels and
consumer attitude ................................................................................................ 145
Table 54: Regression results of advertising through online media channels and
consumer attitude ................................................................................................ 147
Table 55: Correlation analysis between advertising through offline media channels and
consumers’ attitude ............................................................................................. 149 Table 56: Regression Results of advertising through offline media channels and
consumer attitude ................................................................................................ 151 Table 57: Regression results of the moderating effect of age ...................................... 153
Table 58: Summary results of hypotheses testing ........................................................ 156

xiv
LIST OF FIGURES
Figure 1: Tri-Component Attitude Model…………………………………………...22
Figure 2: Schematic diagram on conceptual framework….…………………………64

xv
ABBREVIATIONS AND ACRONYMS
AIDA Awareness, Interest, Desire and Action
AIDAS Awareness, Interest, Desire, Action and Satisfaction
BRIC Brazil, Russia, India and China (Economic Force)
CAK Communications Authority of Kenya
CBK Central Bank of Kenya
CBD Central Business District
CO-OP BANK Co-operative Bank of Kenya
CV Coefficient of Variance
DAGMAR Defining Advertising Goals of Measured Advertising Results
EGTA European Trade Association for Marketers of Advertising
EKB Engel, Kollet, Blackwell Model
KARF Kenya Audiences Research Foundation
KBA Kenya Bankers Association
KCB Kenya Commercial Bank of Kenya
KMO Kaiser – Meyer-Olkin
KNBS Kenya National Bureau of Statistics
NACOSTI National Commission for Science, Technology and Innovation
PR Public Relations
RNI Registrar of Newspaper for India
SEE Standard Error of Estimate
SD Standard Deviation
SPSS Statistical Package for Social Sciences
TV Television

xvi
OPERATIONAL DEFINITION OF KEY TERMS
Advertising
This is any paid form of non-personal presentation and promotion of ideas, goods, and
services of an identified sponsor through mass media such as newspapers, television, or
radio (Kotler, 2017). In this study, this definition is adopted and measured through
selected online and offline media.
Age
Age is a variable used by marketers to segment the consumers in order to target specific
audiences in their advertising. It is also the length of one’s existence on earth. This study
adopted the Rebecca Howell grouping of consumers into age cohorts.
Age Cohort
An age cohort consists of people of similar ages who have similar experiences
(Solomon, 2016). Examples of age cohorts are Baby Boomers, who were born between
1946 and 1964, Generation X, who were born between 1965 and 1985, and Generation
Y, who were born between 1986 and 2002 (Solomon, 2016). This study examined age
cohorts of consumers below 29 years; 30 years to 49 years and those above 50 years.
Consumer Attitude
This is a learned predisposition to behave in a consistently favourable or unfavourable way
based on feelings and opinions that result from an evaluation of knowledge about the object
(Schiffman & Kanuk, 2014).In this study, consumer attitude is an expression of inner feelings
that reflect whether a person is favourably or unfavourably predisposed to online or offline
media.

xvii
Consumer Behaviour
Everything that a consumer does relating to acquiring, using, and disposing of products
(Perner, 2016). The variable of consumer attitude under consumer behaviour was the
focus of this study.
Commercial Bank
A financial institution that provides various financial services such as accepting deposits
and issuing loans (Central Bank of Kenya Annual Supervisory report, 2016). This
study’s object was the three largest commercial banks in Kenya as measured by the
Central Bank of Kenya, which were Kenya Commercial Bank, Equity Bank of Kenya,
and Co-operative Bank of Kenya as at the time of the study.
Online Media
Online Media are communication technologies that use the internet or the World Wide
Web to present or exchange information (Kaplan & Haenlein, 2017). In this study, online
media refer to Facebook, Google Ads and YouTube.
Offline Media
Offline Media refers to other media channels that are not connected to the World Wide
Web; they are also called old media or traditional media (Kramer, Winter, Benninghoff
and Gallus, 2015). In this study, they are TV, Radio, and Newspapers.

1
CHAPTER ONE
INTRODUCTION
1.1 Introduction
This chapter provides an introduction and background of the study. It offers an overview
of the concepts of advertising, consumer attitude, online media channels, offline media
channels, age of the consumer and commercial banks in Nairobi County, Kenya. It
covers the study’s contextual background by providing the media channels that
commercial banks have adopted over time to reach out and influence consumer attitude
favourably. It captures the research problem, outlines the research objectives and
hypotheses. It also summarises the justification, significance and scope of the study,
including its limitations and delimitations. The chapter concludes by providing a
summary of the organisation of the proposal.
1.2 Background of the study
According to Jobber and Ellis–Chadwick (2013), the internet has changed the way
advertising is carried out, making it possible for advertisers to choose from a wide variety
of online platforms, which include Facebook, Google Ads and YouTube, among others.
They added that advertising has, for a long time been carried out through traditional
platforms of television, radio and newspaper until the internet technology disrupted the
industry by introducing a wide variety of platforms to advertise through. They further
posit that this change has made it possible for consumers to access information from a
wide variety of channels and at very high speed, making the earth a global village. These
new prospects have changed advertising and subsequently, the effect it has had on
consumers, particularly where it concerns their attitudes and subsequently, by extension,
product or service awareness, liking and action. Facebook and Google, for instance, have
created new environments which are part of the networks to which the planet belongs

2
and which operate at break-neck speed. They further alluded that the introduction of these
internet-enabled channels have changed the way consumers communicate and
subsequently, the production of advertisements where individual consumers can now
create advertising content and use the wide available channels to share their content.
They gave an illustration of where consumers can review information from a company
using the internet-enabled channels which can then be freely shared among a group
constituting advertising that the company needs. They concluded that the new internet
platforms have enabled interactivity of companies' advertisements, making it more
customised and targeted.
Hot Wire Company sold the first advertising banner on its company’s website in the year
1994, setting the stage for advertising through online platforms, according to Bakshi &
Gupta (2013). They added that this growth was spontaneous and by the beginning of the
year 2000, the United States had recorded 8.2 billion dollars in the amount spent on
advertising through online channels and the numbers continuously increased to 12.7
billion dollars by the end of the same year as many consumers across the United States
enrolled in the platforms, and spent more time on the new channels. They therefore
confirmed that advertising through online media channels had developed quickly in the
last decade. (Bakshi & Gupta, 2013).
The advertising industry has however, been significantly disrupted by the internet with
the introduction of more channels. In 2005, YouTube was launched and it set the stage
to compete with the only existing visual and traditional channel, Television (Snelson,
2011). He mentioned that the media usage pattern has, as a result, changed and consumers
can now interact with moving images outside Television through the use of YouTube.
He further added that YouTube had established itself as the most successful and the most
visited online video sharing and viewing platform since its launch in 2005. Despite this

3
success, Television still emerged as the most used and viewed more than YouTube as per
the study done by the European Trade Association for Marketers of Advertising (EGTA)
in 2018. The study confirmed that in 2018, Television remained the most used visual
channel more than YouTube in European countries. The study revealed that this was true,
especially when the consumption time between the two channels was compared, where
71% of total video time was spent on Television compared to 6.4% spent on YouTube
across all age groups in 2018. According to Trendera, 2017, he argued that there was a
gradual change in video time spent in which American teenagers spend 34% of their total
video time watching YouTube.
The advertising industry has also experienced another shift in consumer behaviour where
more and more users were using multiple mediums. A case in point is where consumers
watch TV and YouTube channels simultaneously. This increased multiple uses of
channels have affected advertising and thus marketers are required to constantly keep in
touch with consumers to continuously monitor consumer behaviour in media usage in
order to align advertising channels with need to shape consumers’ attitude favorably
(O’Barr, 2010). Television advertising in the second half of the 20th Century was
considered a crucial communication channel that had the power to shape the way of life
and attitude of consumers (O’Barr, 2010). The introduction of YouTube into the scene
has changed this power of Television and introduced an element of active consumption
of media channels where consumers could simultaneously watch media and actively
avoid advertisements (O’Barr, 2010; Teixera et.al. 2010). According to Shin and Lin,
(2016), the transformation in the media landscape has shifted power to the consumers to
determine what to watch and at what time; creating time shift television watching,
recording of video and popularity of shared content through social media channels.
Despite all these changes, TV advertising expenditure having plateaued continue to
slightly increase, and as per a study done by Kafka and Molla (2017), it showed that 178

4
billion dollars was spent on TV advertising and that online media channels advertising
spending including YouTube, had reached 209 billion dollars worldwide; which was
41% of the expenditure compared to 35% of Television advertising. They alluded that
out of the 41% of the advertising spent on online media channels, YouTube accounted
for 27%, confirming that Television advertising was higher than on YouTube despite the
continuous change in consumer behaviour.
According to Kotler (2017), advertising is a way of communication that consists of an
offer of information and a request for services. Sutherland and Sylvester (2000) mentions
that the main aim of advertising is to increase awareness of a brand and inform consumers
about new products and services in order to persuade them to purchase a product or
service. Dehghani et al. (2016) concurs with this and confirms that the aim of all media
channels, whether Television or YouTube, is ultimately the same - to shape attitude of
consumers favorably towards the brands or products being advertised. Similarly,
Venkatraman et al. (2015) argue that the two central objectives of advertising through a
media channel are to create awareness of a brand, and to influence action which is
purchase intention of the consumer. This concurs with studies done by Bronner et al.
(2006), Malthouse et al. (2007) and Dehghani et al. (2016).
According to World Internet Usage and Population Statistics (2018), there were 7.6
billion people in the world as of 30th June 2018; 2 billion of them were internet users, and
44% were on social media channels, while the rest used the other online platforms. In
Africa, out of a population of 1.3 billion, 335 million were internet users, and 147 million
were on Facebook. In Kenya, out of 48 million people, 43 million were internet users,
and over 7.2 million were on Facebook (Kaplan & Haenlein, 2019). The high number of
people online has made many company executives to push their advertising activities to
online rather than offline media platforms in a bid to save costs and still reach out to
many people. Online media platforms, in this case, are Facebook, Google Ads and
5
YouTube, whereas offline are TV, Radio and Newspaper. Marketers are being pushed
by their institutions to shift most of their advertising activities to online platforms which
are deemed affordable, however, the question remains; what is the influence of
advertising through these mediums on consumers’ attitude? A question that is yet to be
answered by various studies done under consumer behaviour, in which this study seeks
to answer.
1.2.1 The concept of advertising through media
Advertising is anchored on the broad concept of promotion mix in marketing. The
promotion mix forms one of the major four ‘Ps’ in Marketing, which include product,
price, place and promotion, (Kotler, 2017). Cravens and Piercy (2006) posit that a well-
defined product or service that meets consumers’ needs is important for effective
marketing but not sufficient for market success. They alluded that consumers must know
that the product is available and must understand its benefits and its advantages over the
competitors, and therefore promotion comes in to inform and remind prospective
consumers of the company’s offer and advocate a position in the minds of its audiences.
Kotler (2017) says that marketers have at their disposal four major methods of promotion,
which are advertising, public relations and publicity, sales promotion, and personal
selling. He alludes that among the four methods, advertising is a paid form of
communication that uses media channels of information to sell goods, services, images
and ideas to the target audiences.
According to Kotler (2017), advertising is any paid form of non-personal presentation of
ideas, goods, and services by an identified sponsor. Advertising is published or
broadcasted because the advertiser has purchased time or space to tell the story of a
certain product or service, unlike publicity. He further says that it is a non-personal form
of communication since it is done through media, unlike personal selling, which uses a

6
person. He alludes that advertising identifies the source of the opinion or idea and
therefore distinguishes it from propaganda.
Arens (2002) regards advertising as the promotion of a company’s products and services
carried out to drive up sales of those products and/or services. The scholar further posits
that advertising is done to build a brand image, communicate changes in old products or
introduce new products or services to consumers. Advertising has become an essential
element of the corporate world, and hence companies allot a considerable amount of
resources towards their advertising budget. According to Lancaster and Massingham
(2018), advertising is a paid form of communication that relies on media choice to reach
its target audiences. It is, therefore, paramount to understand consumers’ attitude when
advertising through the various available channels.
1.2.2 Consumer attitude
Consumer attitude is a concept that is broadly anchored in understanding consumer
behaviour in marketing. Consumer behaviour is influenced by various factors, which are
classified under three aspects – personal factors that are mainly the demographics of the
consumer such as age, gender, income level and education level; Psychological factors
such as perception and attitude; and, Social factors such as peer groups, family, friends,
culture and media (Kotler, 2017). This study investigated one of the three factors in each
category; the age of the consumer, attitude of the consumer and media used in advertising
to reach the consumer.
According to Perner (2016), attitude is a learned predisposition to behave in a
consistently favourable or unfavourable way with respect to a given object. Perner further
explains that attitude varies in strength and reflects consumers’ values, which are learned.
According to Perner (2016), different situations impact attitudes, and thus, marketers
need to continually keep in touch with the changing consumer attitudes to be able to

7
influence their actions. Changing consumer’s attitude towards a product, service, or
brand is a marketer’s primary responsibility whose strategy includes changing beliefs,
changing affect and changing behaviour (Perner, 2016). Schiffman and Kainuk (2014)
explain that an individual with a positive attitude towards a product or service offering
is more likely to make a purchase, making consumer attitude an important variable to
study for marketers.
Consumer attitude is a general evaluation of a product or service formed over time, and
which satisfies personal motive, while at the same time affecting the shopping and buying
habits of consumers (Solomon, 2016). Perner (2016) defines consumer attitudes simply
as a composite of a consumer’s beliefs, feelings and behavioural intentions towards some
object within the context of marketing. Perner explains that a consumer can hold negative
or positive beliefs or feelings towards a product or service. Understanding consumer
attitudes and how they are shaped by advertising through online and offline media
platforms is therefore necessary to enable marketers to make the right decisions when
choosing communication channels to use.
This concept of consumer attitude is widely studied by marketers and has various models
such as the Tri-component attitude model (Solomon, 2016), the Multi-attribute attitude
model, which has two sub-models: attitude towards the object model and attitude towards
behaviour model (Fishbein & Ajzen, 1975). Others include the trying to consume model,
which replaced the attitude towards behaviour model by Martin Fishbein and attitude
towards the ad model that is still similar to the one towards the object by Martin Fishbein.
This study used the tri-component attitude model that has been widely used in consumer
attitude research as its conceptual foundation for the study.
8
Consumer attitude is fundamental in consumer behaviour because a positive consumer
attitude indicates the likelihood of the consumer purchasing a product, service or idea.
This is the reason why this variable was chosen for this study. Consumer purchasing
behaviour refers to the methods involved when individuals or groups choose, buy, utilize
or dispose of products, services, concepts or experiences to suit their needs and desires
(Solomon, 2016). Consumers display a behaviour in searching for, paying for, using,
evaluating and disposing of products and services that they think will satisfy their needs
(Schiffman & Kanuk, 2007). Attaining a successful consumer purchasing behaviour
requires a convergence of three fields of social science; individual psychology, societal
psychology and cultural anthropology (Perner, 2011) to come up with a theory that
answers what, why, how, when and where an individual makes a purchase (Green, 2007).
This study assessed the influence of advertising through media on consumers’ attitude.
Various studies have been done around consumer attitude (Schiffman & Kainuk, 2014;
Njuguna, 2014), which focused on the models and foreign clothing with none focusing
on the influence of advertising through media on consumer attitude and comparing online
and offline channels. This study will help guide the media planners and marketing
practitioners as a whole in choosing the type of media to use based on consumer attitude.
1.2.3 Commercial banks in Nairobi County
According to the Central Bank of Kenya Annual Supervision Report (2016), commercial
banks in Kenya were classified into three peer groups using a weighted composite index
that comprises net assets, consumer deposits, capital and reserves, number of deposit
accounts and number of loan accounts. A bank with a weighted composite index of 5
percent and above is categorised as a large bank. A medium bank has a weighted
composite index of between 1 percent and 5 percent, while a small bank has a weighted
composite index of less than 1 percent. It further explains that for the period ended 31st

9
December 2016, there were eight large banks with a market share of 65.32 percent, 11
medium banks with a market share of 25.90 percent and 20 small banks with a market
share of 8.77 percent. It further indicates that the three selected commercial banks,
namely; KCB, Equity Bank of Kenya and Co-operative Bank of Kenya, fall under the
large banks and control over 50% of the market share in the large peer category that is:
14.10%, 10.00% and 9.9% respectively. The three banks also have the largest number of
branch representation in Nairobi and in the number of consumers compared to all the 39
banks in Kenya; thus, the reason for their selection for this study.
According to Social Bakers.com, Co-operative Bank had 1.1 million Facebook fans at
the end of February 2017 compared to its close competitors as follows: KCB at 914
thousand fans and Equity at over 600 thousand fans. It further informs that the
commercial banks with the highest Twitter account followers in Kenya as of February
2017 were KCB at 178,696 followers; Co-op Bank at 149,480 followers and Equity Bank
at 110,805 followers. The high number of fans and followers for these commercial banks
in Kenya are the reason they were selected for this study.
This is in addition to the fact that they were the biggest local commercial banks in Kenya
at the time of the study in terms of asset base and number of consumers, according to the
Central Bank of Kenya Annual Supervision Report of 2016. According to the Kenya
Audience Research Foundation (KARF) report of 2017, the three largest banks in terms
of asset base were listed among the ten companies controlling the highest share of voice
in terms of advertising and in advertising expenditure in 2017/2018, competing with
telecommunication companies and betting companies in corporate Kenya
communication.

10
1.2 Statement of the problem
In a competitive market, advertising managers need to grab consumers’ attention through
advertisements and sales promotion. A sizable marketing budget is spent on advertising.
The trend of using digital media platforms for advertisements is growing; however, the
traditional mediums are still relevant. This study explored the influence of advertising
through various media channels on consumers’ attitude.
Kotler (2017) defines marketing as the science and art of exploring, creating and
delivering value to satisfy the needs of a target market at a profit. Kotler defines
advertising as any paid form of non - personal presentation and promotion of goods,
services or ideas by an identified sponsor. This definition shows that marketers should
identify the needs of consumers first as they explore to create and deliver value. This
need is shaped through the promotion aspect of marketing, of which the paid form is
advertising aimed at influencing consumers’ attitude favourably towards products,
services, and ideas of a company. Given that it is a paid part of a promotion and that the
financial resources of companies are declining, leading to a reduction of marketing
budgets, then the choice of advertising channel becomes a critical aspect to marketers.
This is because they have to advertise through the media in order to achieve the objective
of influencing consumers’ attitude favourably. The changing media landscape globally
and in Kenya, fuelled by the growing internet has, however, made the choice of media
channels to advertise through more difficult. This therefore, has necessitated the need to
use scientific research to guide marketers on this choice in order to influence consumers’
attitude positively.
The media landscape in Kenya has been changing over time due to growth in internet-
enabled technologies, which according to the Communication Authority of Kenya report
2016/17, has allowed over 70% of Kenyans in Nairobi County to access the internet.
11
These findings almost concurs with a study done by World Internet Usage and Population
Statistics (2018), which indicated that as of 30th June 2018, Kenya had a population of
48 million, out of which 43 million were internet users. This means that approximately
90% of the population countrywide could access online media and therefore change in
media consumption (Kaplan & Haenlein, 2019). This change means that marketers now
have a wider selection of media channels to choose from for their company
advertisements in order to reach their target audiences, and influence them positively
towards their products, services, and ideas. The World internet usage and population
statistics further revealed that over 7.2 million of the Kenyan population were on
Facebook as of 30th June 2018, with indications that the same population could access
other online channels like YouTube and Google search engines. Research also confirms
that the main reason most consumers were on these online channels was because of the
need to access information, get entertained and interact with their loved ones across the
country and the globe (Kaplan & Haenlein, 2019). Existing studies on online media
(Chikandiwa, 2013; Kamau, 2017) have not shed light on whether advertising through
these channels would favourably or unfavourably influence consumers’ attitude sub-
construct of awareness, liking and action. Further scrutiny of the studies does not indicate
the comparative influence of advertising through online and offline media channels on
consumers’ attitude, leaving a gap for the study.
Advertising being a paid form of communication needs to be done well to conform to
the AIDA model of creating awareness, generating interest, desire and eventually action.
This study assumes that the advertisements that have been done by selected commercial
banks have met the AIDA model requirements. The choice of advertising channel is
therefore critical since it determines whether the advert will reach the consumer and
subsequently influence those consumers’ attitude favourably. The challenge that
marketers have been facing is the fragmented media channels that have seen an increased

12
number of media channels due to the improved internet access locally, continentally and
globally. Advertising through the right channels has never been as critical as now, given
the declining marketing budget allocations as a result of cost management in most
institutions and therefore, the call for efficient use of resources. The scenario has been
worsened by the increased cost of purchasing offline media channels compared to online
media channels. This perception has pushed most companies to want to advertise through
online platforms as opposed to offline platforms without scientific research to support
this move. This study therefore sought to understand how advertising through online and
offline media channels influence consumers’ attitude in order to guide the choice of the
channel.
The statistics showing that 90% of Kenyans are online and only 10% are offline should
not aid the blind shift of marketing resources to online media platforms with disregard to
offline media platforms. Empirical review by the researcher shows that in the recent past,
marketing resources like marketing budgets, human resources and online ad agencies
have significantly increased in online media channels of Facebook, YouTube and Google
Ads. On the other hand, there is a significant decrease in resources supporting offline
media channels of TV, Radio and Newspaper. However, as this shift is happening, no
one has done a study to understand the influence that advertising through these channels
has had on consumers’ attitude; a gap that this research sought to fill. This study,
therefore, specifically sought to establish the influence of advertising through media on
consumers’ attitude, a comparison of online and offline channels as used by selected
commercial banks in Nairobi County, Kenya.
13
1.3 Research objectives
1.3.1 Main objective
The main objective of this study was to investigate the influence of advertising through
media on consumers’ attitude by comparing online and offline media channels used by
the selected commercial banks in Nairobi County, Kenya.
1.3.2 Specific objectives
The specific objectives were;
i. To examine the influence of advertising through Facebook on consumers’ attitude
in selected commercial banks in Nairobi County, Kenya.
ii. To determine the influence of advertising through Google Ads on consumers’
attitude in selected commercial banks in Nairobi County, Kenya.
iii. To establish the influence of advertising through YouTube on consumers’ attitude
in selected commercial banks in Nairobi County, Kenya.
iv. To examine the influence of advertising through Television on consumers’
attitude in selected commercial banks in Nairobi County, Kenya.
v. To determine the influence of advertising through Radio on consumers’ attitude
in selected commercial banks in Nairobi County, Kenya.
vi. To establish the influence of advertising through Newspaper on consumers’
attitude in selected commercial banks in Nairobi County, Kenya.
vii. To assess the differences in moderating effect of age on advertising through
online media channels and advertising through offline on consumers’ attitude in
selected commercial banks in Nairobi County, Kenya.

14
1.4 Research hypotheses
(i) Ho1: Advertising through Facebook has no statistically significant influence
on consumers’ attitude in selected commercial banks in Nairobi County,
Kenya.
(ii) Ho2: Advertising through Google Ads has no statistically significant
influence on consumers’ attitude in selected commercial banks in Nairobi
County, Kenya.
(iii) Ho3: Advertising through YouTube has no statistically significant influence
on consumers’ attitude in selected commercial banks in Nairobi County,
Kenya.
(iv) Ho4: Advertising through Television has no statistically significant influence
on consumers’ attitude in selected commercial banks in Nairobi, County,
Kenya.
(v) Ho5: Advertising through Radio has no statistically significant influence on
consumers’ attitude in selected commercial banks in Nairobi County, Kenya.
(vi) Ho6: Advertising through Newspaper has no statistically significant influence
on consumers’ attitude in selected commercial banks in Nairobi County,
Kenya.
(vii) Ho7: There are no statistically significant differences of moderating effect of
age on the relationship between advertising through online media channels
and advertising through offline media channels on consumers’ attitude in
selected commercial banks in Nairobi County, Kenya.
1.5 Justification of the study
The growth of internet-enabled devices has changed the media landscape in Kenya and
the world, availing marketers a wide range of media channels through which to advertise

15
their products, services and ideas. However, despite the growth of online media channels
like Facebook, YouTube and Google Ads that have provided marketers with a wide
variety of media platforms to choose from while advertising, a survey has, however, not
been done to understand how advertising through these channels influence consumers’
attitude. The choice of channels for a campaign remains a key strategy to determine the
success of a marketing communication campaign (Solomon, 2016). Organisations are
adopting online channels of communication to advertise their products, services and
ideas as a result of an increased number of consumers that are online (Kaplan & Haenlein,
2017). This shift and push by organisation to have marketers to advertise through online
media channels has not been backed by research and more so whether advertising through
these channels can influence consumers’ attitude favourably; a key variable of consumer
behaviour.
Consumer consumption of offline media channels of TV, Radio and Newspaper is
believed to be reducing in appeal given the widespread of internet-based channels;
however, marketers need to be guided through scientific research on the influence it has
on consumers’ attitude. This study, therefore, assessed the influence of advertising
through these platforms on consumers’ attitude in order to bridge the gap.
This study adopted age as a key variable that moderates the effect of advertising through
media on consumers’ attitude. This is in a bid to use scientific research to determine how
marketers can differentiate the choice of the advertising channels based on the
moderating variable of age. This study therefore scientifically assessed how this variable
moderates the relationship between advertising through media type in order to guide
marketers on the distribution of marketing resources across the available online and
offline channels. This is in a bid to confirm if there are any significant differences of
moderating effect of age on advertising through online and offline media channels

16
adopted by selected commercial banks in Nairobi County, Kenya, on consumers’
attitude. The research findings will help marketers with resource allocation as they
purchase media channels for their advertisements. It will also help them to align their
choice of media for advertising on given that the findings show that the various media
channels selected for this study influence the sub-constructs of consumer attitude
(awareness, liking and action) differently, as shown in the data analysis chapter of this
research work.
1.6 Significance of the study
The findings of the study may be useful to commercial banks in Kenya who would want
to know the influence of advertising through online and offline media channels on
consumers’ attitude. This understanding will help marketers in these institutions to
allocate resources appropriately across available mediums.
The study also provides information for future researchers and scholars who may want
to gain knowledge on how age, which is a key variable of consumer behaviour, affects
the relationship between advertising and consumers’ attitude.
1.7 Limitations of the study
This study established the influence of advertising through media on consumers’ attitude,
then compared the influence of advertising through online and offline channels used by
chosen commercial banks in Nairobi County. The study, nonetheless, was subject to
several limitations. One, the nature of such research versus resources available during
the study period limited the conduct of the study to Nairobi County, and involved only
three selected commercial banks. Future studies may be done to cover the entire country
and all the banks in Kenya. Subsequently, the constraints influenced the scale of the study
but did not affect the conduct of the research once the design was arrived at. There were
also constraints in terms of time, cost and other operational requirements, thus the study

17
focused only on six selected media channels as used by the selected commercial banks
in Nairobi County, Kenya.
The study used a multistage sampling technique where the branches of the selected banks
were sampled and then within the branches, consumers were further sampled using
random convenience sampling according to age. This means consumers were
conveniently divided into the identified age cohorts of below 29 years; 30 years to 49
years and those above 50 years before they could fill the questionnaires. The limitation
here was on the convenient availability of the age limits that the study focused on. This
limitation was mitigated by ensuring that the research assistants were well-briefed prior
to collecting data to ensure those who filled the questionnaire were within the selected
age cohorts.
Data for this study were collected using a questionnaire attached in Appendix II of this
research thesis and provided conveniently to the consumers who were found transacting
at the sampled branches of the selected banks. The limitation here was the hope that all
consumers intended for the study were able to agree to complete the questionnaire;
therefore, they could read and write.
This research work was projected to be done in April 2019. However, the study was done
in May 2019 and June 2019. The limitation here was the timelines that took to get the
approvals for the research proposal from NACOSTI and subsequently from the Director
of Education, Nairobi County, and Ministry of Education. These timelines that had not
been factored in the research plan.
Data were collected from consumers of the selected commercial banks across Nairobi
County to get their views and perceptions concerning the variables and constructs under
study. This was helpful in getting insights about the dynamics of the study variables at a
18
particular point in time. The results may consequently not be appropriate to some other
periods, meaning that there are chances to conduct broader as well as longitudinal studies
in similar research areas.
The use of quantitative methods alone in this research was also restrictive; as it did not
allow respondents to express other views apart from those sought in the questionnaire.
Data obtained purely based on quantitative methods limits the research design and
findings. The respondents are likely to provide better insights on the variables under
investigation when given a chance to discuss related issues openly and freely. Qualitative
research methods may, therefore, be used in future studies.
1.8 Delimitations of the study
This study was delimitated in seven ways. Firstly, the study only assessed the influence
of advertising through media on consumers’ attitude and compared online and offline
channels used by selected commercial banks in Nairobi County. Secondly, the study
examined advertising through Facebook, YouTube and Google Ads under online media
channels with high numbers of active users within commercial banks at the time of the
research; future studies, therefore, may be expanded to include advertising through other
media channels that are online and may have increased in the number of active users
beyond what the three selected ones currently have. Thirdly, the research only focused
on advertising through Television, Newspaper and Radio under the offline media
channels as used by commercial banks in Nairobi County, Kenya being the most used
channels by consumers who are not online; future studies may expand to include
advertising through other offline media channels not captured here. Fourthly, the study
assessed the influence that advertising through media channels has on consumers’
attitude under consumer behaviour; other studies may look at other aspects of consumer
behaviour, which are perception, motivation and learning, among others. Fifthly, the

19
research collected data from consumers banking in the three largest commercial banks in
Kenya, which were Equity Bank Limited, Kenya Commercial Bank Limited and Co-
operative Bank of Kenya Limited who had a high share of voice in advertising and had
invested in online media channels at the time of the study as per rankings from Kenya
Audiences of Research Foundation (KARF) and Social Bakers 2017 respectively.
Sixthly, the study assessed the moderating effect of age on the influence of advertising
through media on consumers’ attitude because there was a strong belief that certain age
of consumers (Youth) in Kenya used online more than offline media channels compared
to others. This study, therefore, excluded exploring the moderating effect of additional
consumer demographics like gender, level of education and level of income, among
others. Seventh and lastly, the study was done in Nairobi County because of the large
representation of branches for the selected commercial banks in Kenya being in the
county compared to other counties as shown by the Central Bank of Kenya Annual Bank
Supervision Report, 2017; where over 30% of branches in Nairobi County were from the
three largest commercial banks and therefore equally had a high number of consumers.
1.9 Summary of the chapter
Chapter one of this thesis reviewed the background of the study. It presented the
overview of the advertising concepts through media, consumers’ attitude and age of the
consumer as the key variables for the study. It also gave background information on the
commercial banks that were used in the study. The chapter also described the research
problem, objectives of the research, hypotheses of the research, justification,
significance, limitations and delimitations of the study.

20
CHAPTER TWO
LITERATURE REVIEW
2.1 Introduction
This chapter discusses the literature relevant to the study. It presents the theories that this
research is hinged upon which, are the Tri-Component Attitude Model and the AIDA
model for dependent and independent variables, respectively. Also covered in this
chapter is the empirical literature review on the study variables of the investigation for
purposes of highlighting the research gaps; including advertising through media, online
media (Facebook, Google Ads & YouTube), offline media ( Television, Radio and
Newspaper), consumers’ attitude and Age of the consumer. A summary of the key
research gaps is also presented to support the need to conduct the study. The chapter
concludes by outlining the conceptual framework of the research work.
2.2 Theoretical literature review
The study used the Tri-Component attitude model to examine the dependent variable
(consumers’ attitude) and used the AIDA model to make assumptions on the independent
variable (advertising through media). This study examined advertising through online
media channels (Facebook, Google Ads and YouTube) and offline channels (Radio,
Television and Newspaper) used by the selected commercial banks in Nairobi County,
Kenya.
2.2.1 Tri-Component Attitude Model
According to the Tri-Component attitude model, attitude contains three major
components: Cognitive (Knowledge or Awareness), Affective (Feelings or Liking), and
Conative (Behaviour or Action) (Solomon, 2016). The cognitive component consists of
knowledge acquired by a combination of direct experience with the attitude object and
related information from various sources. This knowledge commonly takes the form of
21
beliefs that the object has particular attributes and that specific behaviour results in
specific outcomes that know as attitude which is a component of awareness. The affective
component consists of a person’s emotions or feelings about a particular product or a
brand. These emotions and feelings are frequently treated by consumer researchers as
primarily evaluative in nature since it that can be rated with degrees of an attribute of
whether good or bad, favourable or unfavourable. This study referred to attitude
component as liking. The third part, the conative component consists of a person’s
likelihood or tendency to undertake a specific action or behaviour towards the attitude
object. Often this means the actual action or behaviour itself, or the intention to buy a
particular product. In this study, we have referred to this attitude component as an action.
Belch and Belch (2012) asserted that there are three attitudinal stages or components,
which are encapsulated in the tri-component attitude model: cognitive component (an
individual’s beliefs regarding an object), affective component (an individual’s feelings
towards the object that may be positive or negative) and the behavioural component (an
individual’s readiness to respond to the object in the form of behaviour).
Consumer attitude, as explained in the Tri-component attitude model, is illustrated in
figure 1.

22
Figure 1: Tri-Component Attitude Model
2.2.2 AIDA Model
The Attention, Interest, Desire, and Action (AIDA) model was proposed by Elmo Lewis
in 1898. The AIDA Model is a hierarchical models that describe the consumers’ stages
of consumers as they go through the purchase of a product/service or idea. The model
has been in use by marketers for over 100 years in developing relevant advertisements
that can then be carried in various communication channels with the aim of influencing
consumers to purchase products or services. This theory was developed based on a study
of the life insurance industry that describes the four (4) cognitive phases experienced by
an individual upon receipt of a new idea or a new product purchased (Michaelson &
Stacks, 2011). Batra et al. (2009), deviated a little from the original AIDA meaning and
preferred to use the acronym for Awareness, Interest, Desire and Action. Study have
shown that AIDA model involves four steps during evaluation that is to assess the
attention, attract interest, create desire, finally the action taken which influence the
purchase decision ( Barry and Howard, 2007).
Liking
(Feeling or Affective)
Awareness
(Knowledge or Cognition)
Source: Solomon, 2016
Action
(Behaviour or Conative)
23
This model is very useful in assessing the impact of advertising by controlling every step
of the psychological transformation that starts from the individual level to see an
advertisement influencing the individual purchase for a particular product or service
(Kojima et al., 2010). Although the model was introduced centuries ago and has gone
through various modifications, the basic principle of this model remains intact and is still
relevant today. Despite living in a world of interactive online communication and
emerging social networks, users still need to be aware of the existence of a product, show
interest in the product based on information obtained related to the benefits of the
product, and express a desire to have these products because they meet the needs, wants,
and their interests, and take relevant action or other alternative actions on decision to
purchase the product (Michaelson & Stacks, 2011). According to Ashcroft and Hoey
(2001), the AIDA model can be applied to internet services as it is applied to other
products and services. The AIDA model has different levels. The cognitive level is when
the user's attention can be drawn. The initial step to communication process which
consumers need to acquaint themselves with the existing service. Affirmation of the
effectiveness of the communication channel is the interest of the consumer to be
interested in the product or service offered or the interest to explore more about the offer.
This leads to the desire to acquire the product or service. At the level of behaviour, the
action takes place and the consumer uses the service provided as a valued resource.
Referring to the respondents’ values to the steps in the advertising development process
based on the AIDA model, the study by Lagrosen (2005) found that the capturing of user
attention aspect is slightly weak in online marketing. The possibility of the prospective
consumer to visit a company's website when browsing the internet intentionally, as
occurs in traditional advertising, is low. However, this problem can be overcome through
banner advertising on popular websites or through information and links from any
relevant portal. He alluded that creating interest with consumers is a strong aspect of

24
online marketing. He added that when prospective consumers are browsing a company’s
website, a lot of information can be passed on to them in an interactive and interesting
method so as to create consumer interest in the products or services offered. Lagrosen
(2005) further posited that website content may also be continuously renewed regularly
to encourage repeat visitors.
Kotler (2017) argues that advertising through online channels has many opportunities to
provide explanations about the products or services using interactive methods in shaping
consumers’ attitude favourably in order to purchase company products or services. He
further explained that advertising through online channels can be very supportive in the
process of consumers’ action as one can combine with interactive enablement to include
payment through the integrated card system. Hoek and Gendall (2003) assert that by
creating awareness or attention in consumers, advertising can create interest and desire
before triggering one to take action. The attention given to the AIDA model and its
variations on advertising studies allows the model to also be applied to other marketing
and communication activities among them being sponsorships and purchasing behaviour.
Initially it was postulated that the AIDA framework has been frequently used in the field
of marketing both on online and offline (traditional) media advertising channels. This
study assumes that all the advertisements that have been carried out by the selected
commercial banks meet the standards of the AIDA model and therefore, can uniformly
shape consumer attitude. This therefore allows the researcher to focus on the variable of
media selection for further scrutiny in shaping consumers’ attitude.
Arens (2002), argues that despite criticism, the AIDA model has not lost its core
simplicity hence has survived over decades. He posits that models that have developed
out of the AIDA model include the Hierarchy of effects model (which breaks advertising

25
goals into six stages of interest, knowledge, liking, preference, conviction and purchase),
DAGMAR model (which implies Defining, Advertising Goals for Measured
Advertising) and finally the AIDAS (which stands for Awareness, Interest, Desire,
Action and Satisfaction). Lavidge and Steiner (1961) deviated from the previous early
hierarchy response model development since they believed that immediate sales were an
insufficient factor of advertising effectiveness, even if it was measurable. They posited
that advertising was an enduring investment, mainly due to the long-term nature of
advertising effects that resulted in the development of the hierarchy-of-effects model.
It seems inconceivable that a consumer shifts from the level of low interest of eager buyer
but that it is gradual shift to buying a product or service. These steps include unawareness
of the brand’s existence, awareness, knowledge of what the brand offers (awareness and
knowledge form the cognitive attitude component), consumers liking the brand (a
favourable affective attitude), consumers preferring the brand over others (a favourable
affective predisposition) and have a desire to purchase the brand and conviction that it
would be a wise purchase that leads to purchase intent, and finally culminating in the
actual purchase (behavioural attitude component). The steps of the hierarchy-of-effects
model are analogous to the communications of effect pyramid (also known as the
purchase funnel).Studies have reported that it a great challenge to attain the upper-levels
of the AIDAS hence there is drop in the number of the consumers as they ascend the later
level of pyramid (Safko, 2012; Belch & Belch, 2012).
According to Safko (2012), advertising theory need to be distinct by way of features that
are different from other fields in order to be informative. He added that in earlier years,
advertising was unsophisticated in comparison to the present day practise. Belch and
Belch (2012) explain that researchers in the field of advertising have hardly taken a step
back to determine if the theoretical perspectives borrowed from other fields are

26
appropriate to use in their industry and if they adequately incorporated the elements that
define the nature of advertising. Safko (2012), adds that the basic objective for advertisers
is to inform consumers on ideas, services or products in order to shape or influence their
attitude, towards a product or service. He alludes that advertising therefore formed part
of the method that was used by marketers to close the vacuum. Advertising through mass
media therefore makes it possible for a producer to bring their products to the knowledge
of their numerous prospective consumers and therefore shape or influence their attitude.
The AIDA model is still being used by marketers today and has been employed in various
studies in advertising (Kotler, 2017). This study, therefore, used the model to make
assumptions that all the advertisements that the selected commercial banks carried out
had met the AIDA model aspects of attention, interest, desire and finally, action. It
assumed that the advertisements done through the online channels (Facebook, Google
Ads) and offline channels (Radio, Television and Newspapers) met the standards of the
AIDA model of creating Attention, Interest, Desire and Action. This study, therefore,
focused on the advertising channel rather than the advert itself and how it influences the
various sub-constructs of consumer attitude, which are awareness, liking and action.
2.3 Empirical literature review
This section discusses the literature pertaining to the research variables, which are
advertising through media (online media of Facebook, Google Ads and YouTube; offline
media of Television, Radio and Newspaper), consumers’ attitude and Age of the
consumer as a moderating variable. It highlights the existing gaps in relation to the study
objectives and issues of interest to the current study.

27
2.3.1 Advertising through media
Ayanwale et.al. (2005) confirmed that marketers advertise through various media
channels in order to reach the target audiences. Among the channels he listed and
mentioned that they were popular with marketers were Television, Radio, Newspaper,
Magazines and Events. Ducoffe (1996), on the other hand argued that many companies
have moved from traditional media channels to the internet-enabled channels which have
combined several forms of advertising to include banners, corporate websites, email
signatures and messages just to mention a few. A study done on advertising expenditure
in 2004 confirmed that 44% of the advertising budgets were used by marketers to
advertise through Television and Radio which was slightly higher compared to the
expenditure on Newspaper and Magazines (Sadhasivam & Nithya, 2015; Sorce & Dewitz
, 2007). The higher expenditure on these two channels was accredited to a positive effect
adverts carried on Television and online channels on attitude of the consumers. On the
other hand, Nayak and Shah (2015), opined that advertisements done through
newspapers were crucial in brand development and that they influenced purchase
decisions. This argument concurred with the study done by Raju and Devi (2012) who
confirmed that advertisements done through print were more trusted by consumers
compared to other advertisements in other channels. A study done by Sorce and Dewitz
(2007) found out that advertisements done through magazines were more effective
compared to those done through Television. Similarly, a study done by Pongiannan and
Chinnasamy (2014) provided an empirical evidence that advertisers preferred using print
media compared to other channels. Trivedi (2007) contradicted the notions prevailing
and alluded that advertising through online channels did not have an impact on
consumers’ actions. Trivedi argued that processing the advertising message that has been
posted via online mediums is a combination of the media channels used and the
company’s brand image that will ultimately influence consumers’ attitude positively to
28
act. The aforesaid inferences state that advertising through media affects consumers’
attitude sub-constructs of awareness, liking and action, which will, in turn, affect
consumer behaviour on various purchasing levels.
Related studies were limited to general positive and negative influence of the media
channel as well as the evaluation of the level of the effect of media channel on the brand
awareness and decision to purchase a service or product offered. Recently, it has been
proposed that companies engage not on production of goods or products but also market
their products through consumer information on the benefit of the product by winning
the consumer trust or loyalty on a particular good or service. This can be achieved
through tense and skillful large-scale promotion of the advertisement media channels,
public relation and sale promotions. Study have shown that sale promotion and
advertising through a particular media channel provide information about the product,
service of a particular sponsor or promoting company (Kotler and Armstrong
2012).Developing an advertising strategy consists of two major elements; creating
advertising messages and selecting advertising media (Kotler, 2017). This study dwelt
on selecting the advertising media, given the wide variety of mediums available.
Kotler (2017) further averred that advertisements should be persuasive and, at the same
time, entertaining; they should cut through the clutter and seize the viewers in one to
three seconds before they are gone. According to Kotler (2017), selection of an
advertising media undergoes five major steps; deciding on the reach, frequency and
impact; choosing among major media types, selecting specific media vehicles and
deciding on media timing. This research work, therefore, assumes that the advert that has
been created by the selected commercial banks for use in the various mediums has met

29
the AIDA model requirements of creating attention, interest, desire and action. It
therefore focuses on the choice of media to use for advertising.
According to Arens (2002), the advertising mantra, AIDA, works well where it is strictly
adhered to, and further notes that a good advert should create Attention, Interest, Desire
and Action and make a Learn-Feel-Do sequence. There has been considerable debate on
how advertising works, however, the general consensus has been that there can be no
single all-embracing theory that explains how all advertising works because they have
varied tasks (Pongiannan & Chinnasamy, 2014). The mentioned scholars gave an
example of advertising that attempts to make an instant sale by incorporating a return
coupon that can be used to order a product, which was found to be very different from a
corporate image advertising that is aimed at reinforcing attitudes. They further argued
that there were competing views on how advertising works owing to existence of strong
theory of advertising and weak theory of advertising - both theories being based on how
they affect consumers and their end results. They alluded that the strong theory follows
that a consumer passes through the stages of AIDA – awareness, interest, desire and
action. This theory argues that advertising is strong enough to increase the public’s
knowledge and change their attitude and as a result, it is capable of persuading new
consumers to purchase a brand. This is called the conversion theory of advertising, where
non-buying consumers are converted to buyers.
The AIDA model, however, has been criticized on two grounds; one is that there is little
evidence that consumers experience a strong desire before making a purchase because in
cases of inexpensive product, a consumer could very well purchase a brand on a trial
basis without any strong conviction that the brand is superior. Secondly, it has been
reported that the AIDA theory underscores what precedes after the action upon the
30
advertisement in a well-established market target where consumers are aware of the
brand (Jobber & Ellis-Chadwick, 2013).
Advertising is a significant component of the market economy. It plays a significant role
in motivating consumers to either use a particular brand or increase consumption of that
brand (O’Guinn & Faber, 1991; Tan, 1981). They argued that the growth of a discipline
is as a result of accidents in history showing the transforming consumer lifestyle and
needs over a given time. They gave an example of mass communication which has grown
to become an academic field of interest and that it developed as a result of propaganda
in World War I and World War II. A study done by Pearl et al. (1982) concurred that
mass communication being a critical aspect of advertising, developed out of a concern
of violence displayed by Television in World War I & II. These authors opined that
advertising presents a relatively new research area compared to other more established
fields such as psychology and economics. They therefore argued that it was not
uncommon for advertising researchers to borrow theories from other more established
fields and apply them in advertising settings. Pearl et al. (1982) further averred that
utilizing relevant theories from other fields to examine advertising has certainly
deepened the understanding of the phenomena under investigation over the years.
However, what was being frequently ignored in these theories is that advertising is a
unique phenomenon, and a set of important characteristics define this field.
Advertisement is defined as the art capturing or convincing human intellect on a
particular product or service to generate income from that product or service (Bernoff,
2009).
Industries spend millions, even billions of dollars to win hearts and minds and to
influence choices towards their products and ideas. Bernoff avers that in advertising, the
product is the audience, and the consumers are the corporate advertisers who buy media.
31
He further alluded that the media type whether online or offline carry the audiences and
advertisers bring the money to the media companies and concluded that the media
therefore has and sell the audiences.
Studies have also shown that advertising media are no longer neutral agent of the
merchants but are used as the machinery owned by large cooperates companies (Bronner
and Neijens, 2006). The developed advertisements will therefore need media channels to
use in order to reach their audiences. This study evaluates how advertising through the
various selected online and offline channels influence consumers’ attitude.
2.3.1.1 Advertising through online media channels
Online media channels as communication technologies that use the internet or the World
Wide Web (www) to present or exchange information. Such content was digitized and
transmitted over the internet or computer networks via text, audio, video and graphics
and, therefore, sometimes it is called digital media (Kaplan et al., (2017). The internet
began to grow when the text was put onto the internet instead of being stored on papers
as was previously done. These scholars posited that soon after the text was placed onto
computers, images followed, and then came audio and video. Kaplan et al. (2017)
observe that digital media has come a long way in the few short years to become as we
know it today and it continues to grow.
Online media is anchored under digital marketing, which uses digital technologies to
communicate about products and services to consumers through the internet. According
to Kaplan and Haenlein (2017), this is one of the growing advertising media channels
that is fuelled by the growth of access to the internet and is used to reach audiences on
Facebook (a social media channel), YouTube, Google Ads and any other channel that
uses the internet to transmit information. The scholars noted that the internet has changed

32
the way brands and businesses use technology for marketing. Marketers are including
digital platforms in addition to traditional platforms in their marketing plans, with the
aim of reaching out to consumers who are increasingly using digital devices for their
daily transactions and information instead of visiting physical shops.
Empirical review informs this study that use of online media channels in communication
is deemed to be cheaper compared to offline media channels; however, no one has done
research to understand whether advertising through these online channels has a role in
influencing consumers’ attitude, and the strength of the influence that it has on each sub-
construct of attitude (awareness, liking and action).
The marketing communication mediums have evolved from print media, electronic
media, and then to social media in cyberspace (Woodcok & Green, 2010). The scholars
observe that consumers in the new millennium are not only changing interest to shop
online, but also to find information through online media channels before making
purchase decisions. This continuing trend shows that consumers tend to trust their friends
and contacts in online media channels like social mediums over the ads displayed by
business organizations (Woodcock & Green, 2010). Online media channels, therefore,
have resulted in significant changes to the strategies and tools used by business
organizations to communicate with users. Mangold and Faulds (2009) asserted that
online media tools combine the features of traditional integrated marketing
communications tools where business organizations communicate with the users and
word-of-mouth marketing mainly found in online channels where consumers
communicate with each other (whereby marketing managers cannot control the content
of communicated information). They further alluded that interaction in online media
channels is a much more attractive forum compared to offline media given that
information could be presented in various forms which include sharing experiences,

33
jokes, videos and comments from friends. They concluded that forums for sharing
information and experiences could positively or negatively shape consumers’ attitude
towards the product or service being offered by the business organizations. Woodcock
and Green (2010) confirm that advertising through online media channels is a quick
avenue to deliver information and thus, its use as an advertising media channel may
impact product performance and branding given its continuous shaping of consumers’
attitude.
Online media channels may be used as advertising tools by business organizations of
various sizes and types (Birkner, 2011). Birkner asserts that online media channels such
as Facebook, Google Ads, and YouTube enable business organizations to connect with
consumers at the right time, directly with lower cost, and with higher efficiency than
traditional media channels of Television, Radio or Newspaper. This has therefore seen
these online media channels being monopolized by both large business organizations and
also by the small and medium enterprises (Kaplan & Haenlein, 2017). In addition, social
media sites such as Facebook and Twitter allow users to follow their favourite brands
and to comment or post questions related to products or services. The use of these social
media sites has enabled business organizations to identify what is being said about their
brands and communicate directly with consumers thus continuously shaping their
attitudes (Reyneke et al., 2011).
According to Kotler et al. (2017), a lot of people are connected to social media channels,
searching on Google and are subscribed to video–sharing sites. Since the rise of this
digital phenomenon, marketers have been tapping on the online crowd. There is much to
do this day and age about online marketing since consumers spend so much time on
computers, smartphones and tablets. Thus, being able to reach them digitally is not only
quick and efficient but also wide in choice. This study assessed three types of online
34
media channels: Facebook, Google Ads and YouTube, which have a high number of
users and are used by commercial banks in Kenya in their digital/online marketing
strategies to reach out to consumers (Qazi & Muhammad, 2017). The online media is of
interest in this study given the high number of the world population who can now access
the internet.
According to Qaziand Muhammad (2017), the leading social media platform is Facebook
with more than a billion monthly active users world-wide. YouTube also estimates a
billion monthly active users with over 4 billion video views per day. Currently, it is
estimated that from the customer base of 320 million approximately 500milion use
Tweeter per day. WhatsApp and Instagram, which were taken over by Facebook, have
an active user base of 900 million and 400 million, respectively. Instagram’s active
consumer base has exceeded both Twitter and Pinterest, recording more than 80 million
photos and 3.5 billion posts per day. Moreover, LinkedIn (100 million), Snap Chat (200
million) and Google+ (400 million) active users are also recognised social media
platforms (Qazi & Muhammad 2017).
Social media, such as Facebook, Twitter, LinkedIn, YouTube, WhatsApp, Instagram,
Tumblr, Pinterest, WeChat and Google+, permit young users to create personalized
online pages, communicate and interact with friends, as well as exchange content that
they have created themselves (user-generated content) and/or information from other
brand-related sources (Madana, 2011; Statista, 2015). Social behaviour and how
consumers think have conventionally been disseminated by media such as television,
radio, newspaper and magazines, but in the twenty-first century, social media has begun
to replace traditional media’s enduring and influential role on young consumers. This
change in behaviour represents both an opportunity and a challenge from an
organization’s viewpoint (Uitz, 2012; Nhlapo, 2015). Marketers progressively depend
35
more on social and mobile information communication technology (ICT) channels to
market and promote their brands amongst the youth. Additionally, the notion of
implementing content that is both entertaining and current would entice young
consumers to interact and disseminate the information to their friends. This significant
feature, which is also referred to as word-of-mouth (WOM), can be considered as the
future of social media marketing communications (Yaakop et al., 2013).
Studies have postulated that on the theoretical point of view social media have significant
impact on the advertisement of a good and a service as a marketing communication tool
which have gained a theoretical foundation (Okazaki and Taylor, 2013). Bolton et al.
(2013) observe that there were few studies that assessed whether there were differences
within a separate cohort in online media marketing. Additionally, they confirmed that
there were few empirical international inquiries that consider Generation Z. Furthermore,
advertising through online media and its influence on Generation Z’s attitudes had not
been suitably measured in South Africa. South Africa has become one of Africa’s leading
regional economic forces and joined the newly industrialised countries- Brazil, Russia,
India and China (BRICS) in 2010. BRICS represents newly industrialized countries with
large developing economies and will (and do) play an important role in the world
economy (Peter & De Meyer, 2012). Hoffman and Novak (2012) propose that a sound
theoretical framework of online media is required for organizations to implement precise
marketing tactics, particularly regarding usage variables such as mobile device access.
Peter and De Meyer (2012) suggest that a more holistic approach was required to
effectively assess multiple elements of online media to make informed marketing
communication decisions.
36
According to Mwenda (2013), millions of ordinary consumers in Kenya have access to
the internet, and the once pristine network is fast becoming dotted with storefronts,
shopping centres, and expanding digital shops in many virtual streets. Recently, in
Kenya, Motor vehicle dealers, Television stations, Radio station, and many industries
advertise their products and services on social media platforms or on internet to target
their customers. This concurs with Morrison’s (2014) review that the emergence of
online advertising over the past decade has radically transformed the electronic landscape
not only in the world but also in Kenya. Mwenda (2013) argues that in Kenya, the digital
revolution offers unprecedented opportunities for economic growth and development.
The fast growth of the internet and the accompanying shift in internet user demographics
have created an exciting new commerce channel that helps businesses to increase revenue
and awareness dramatically (Morrison, 2014). The internet has had a greater impact on
the marketing of goods and services than any technology since the invention of
television, rendering the need to study advertising through the various media channels
and the impact it has on shaping consumers’ attitude.
Social networks are considered the platform through which online reviews are
exchanged, although they should be considered separate elements (Morrison, 2014).
Social network platforms such as Facebook, which grew by 22% between October 2011,
and November 2011, and YouTube which grew 67% percent between the same time
frame, are the new age medium of online advertising, reaching millions of people at a go
(Darban & Li, 2012). The online media channels that this research focuses on are
Facebook, YouTube and Google Ads being the biggest and with largest followers
(Kaplan & Haenlein, 2017).
37
2.3.1.2 Advertising through Facebook
Facebook, as defined by Kaplan and Haenlein (2017), is an online platform that facilitates
interaction among people in which they create, share and/or exchange information and
ideas in virtual communities and networks through social media sites. The scholars
describe it as a computer-mediated communication channel that uses the internet as its
backbone. According to Kaplan and Haenlein (2017), technology advancement has
made it possible for one to connect to the internet on their mobile phones and tablets.
Facebook, according to these scholars, differs from traditional media in many ways,
including quality, reach, frequency, usability, immediacy, cost and permanence. This
concurs with Evans (2012), who posits that unlike traditional mass media, Facebook
media channel is participative in nature because audiences are part of the creative process
or force that generate content, and is collaborative in nature in terms of how information
is created, shared, altered and destroyed.
Facebook is a popular free social networking website that allows registered users to
create profiles, upload photos and videos, send messages and keep in touch with friends,
family and colleagues (Evans, 2012). According to Kaplan and Haenlein (2017),
Facebook is a leading social media platform that is used by many users currently to
acquire information away from the traditional method of using newspapers, radio and
television. They further posit that it is a recommended platform for any marketer trying
to reach out to its consumers. In Kenya, commercial banks have created profiles in this
platform in order to get followers for purposes of marketing their services and engaging
consumers online. Advertising through Facebook as an online media channel and how it
influences consumers’ attitude was one of this study’s objectives.
Mark Zuckerburg, then a Harvard undergraduate, founded Facebook in 2004 with his
college roommates and fellow computer science students –Eduardo Saverin, Dustin

38
Moskovitz and Chris Hughes (Harvey & Jose, 2005). The site grew rapidly and had 4,300
users after only two weeks and in a month, Facebook had become such a hit that it started
expanding to universities in Europe, and only 20 months after going public, Facebook
had already expanded to every university in the United States and had an estimated value
of US dollar 100 million (Harvey et al., 2005)
According to Statista.com, Facebook had 1.86 billion monthly active users globally as of
the 4th quarter of 2016, further explaining that it is the biggest social networking service
based on global reach and total active users (Qazi & Muhammad, 2017). These huge
numbers are making marketers have their companies sign up profiles as Facebook users
so that they can engage consumers online. In Africa, there were over 146 million active
Facebook users as of March 2016, out of which 5.5 million users were in Kenya.
According to Social Bakers.com, Co-operative Bank had 1.1 million fans as at the end
of February 2017 compared to its close competitors as follows: KCB at 914 thousand
fans and Equity at over 600 thousand fans. These huge numbers make it necessary to
understand if advertising through this online channel will have an influence on
consumers’ attitude and how the results will compare with those in other online channels
and also those in selected offline channels.
According to Kaplan and Hainlein (2017), 3.7 billion people use the internet globally;
out of which 2.7 billion people were active social media users as shown by Table, 1:
Table 1: Global digital snapshot Jan.2017
Total World Population Internet Users Active Social Media Users
7.476 billion 3.773 billion 2.789 billion
50% Penetration 37% Penetration
Source: Kaplan & Hainlein, (2017)
In Africa, the number of active social media users are approximately 170 million as
shown by Table 2

39
Table 2: Digital in Africa, Jan. 2017
Total World Population Internet Users Active Social Media Users
1,231 million 362 million 170 million
49% Penetration 14% Penetration
Source: Kaplan & Hainlein, (2017)
According to the Communication Authority of Kenya (CAK) (2016), out of a population
of 46 million, approximately 70% of the population as of September 2015 used the
internet, and this was attributed to penetration and availability of smartphones.
Advertising over social media, in this case, Facebook, is still considered a new
phenomenon (Okazaki & Taylor, 2013).
Advertising through social media channels involves direct and indirect marketing
methods to generate consumer awareness, recognition and recall for a product, person or
brand through web tools of social networking, content dissemination and microblogging
(Gunelius, 2011). Specifically, Facebook advertising involves companies using banner
ads, embedded videos, animations, brand pages, surveys, classified and sponsored ads to
promote their products and services. It selects target audiences based on their application
and use of social networks (Jung et al. (2016); Irfan et al., (2017). All these set of
advertising through media activities either use Facebook for sales promotion, Twitter for
generating a specific trend (use of hashtags), uploading a product, launch video on
YouTube, engaging through a photo on Instagram, posting a blog on HubSpot and
networking with marketing managers on LinkedIn (Kaplan & Haenlein, 2017). This
study therefore examined the influence of advertising through Facebook on consumers’
attitude as used by selected commercial banks in Nairobi County, Kenya.

40
2.3.3.3 Advertising through Google Ads
Google Ads is an online advertising platform developed by Google, where advertisers
pay to display brief advertisements, service offerings, product listings, video content and
generate mobile applications installs within the Google ad network to web users
(Benaifer, 2005). Google Ad’s system is based partly on cookies and partly on keywords
determined by the advertisers. Google therefore uses these characteristics to place
advertising copy and images on pages where they think it might be relevant. Benaifer
(2005) further notes that advertisers pay when users divert their browsing to click on the
advertising copy. Partner websites receive a portion of the generated income. Google
Ads has evolved into Google’s main source of revenue contributing to Google’s total
advertising revenues of USD 95.4 billion in 2017. This research sought to establish the
influence of advertising through Google Ads on consumers’ attitude as used by selected
commercial banks in Nairobi County, Kenya.
2.3.3.4 Advertising through YouTube
YouTube platform allows users to upload, view, rate, share, add to favourites, report,
comment on videos and subscribe to other users (Kaplan & Haenlein, 2017). It offers a
wide variety of user-generated and corporate media videos. Available content includes
video clips, TV show clips, music videos, short and documentary films, audio recordings,
movie trailers, live streams and other content such as video blogging, short original
videos and educational videos. Content on YouTube is largely uploaded by individuals,
but media corporates like commercial banks in Kenya, who are registered users place
their ads in there (Evans, 2012) and that unregistered users can only watch videos on the
site, while registered users are permitted to upload an unlimited number of videos and
add comments to videos.

41
According to Kaplan and Haenlein (2017), YouTube earns advertising revenue from
Google AdSense, a program that targets ads according to the site content and audience.
The vast majority of its videos are free to view, but there are exceptions, including
subscription-based premium channels, film rentals, as well as YouTube Premium, a
subscription service offering ad-free access to the website and access to exclusive content
made in partnership with existing users. As of February 2017, there were more than 400
hours of content uploaded to YouTube every day, and as of August 2018, Alexa Internet
ranked the website as the second-most popular site in the world after Facebook. This
study examined the influence of advertising through YouTube on consumers’ attitude as
used by selected commercial banks in Nairobi County, Kenya.
2.3.4 Advertising through offline media channels
Offline media is anchored as a tool that aids marketing communication to convey
information to the target audiences. The mediums do not use the internet according to
Kotler et al. (2017), and they include TV, Radio and Newspapers among others.
According to the world internet usage and population statistics (2018), although most of
the world, (55%) has adapted to the internet, there is a huge number (45%) who are off
the net and who can only be reached through offline media. Additionally, in Africa, over
75% of the population (about 965 million) was not on the internet, making offline media
relevant. . The research presents Kenya differently with over 70% of the population able
to access the internet, according to CAK report 2016/17, but this remains to be
ascertained given the unreliability of the internet access in the country.
The tremendous growth of the internet has made today’s marketers refer to other media
channels that are not connected to the World Wide Web as offline, old media or
traditional media (Kramer et. al. 2015). They include TV, Radio and Newspaper among

42
others. As much as the arrival of the internet appeared to be the end of offline media,
they still play such a leading role in online searches for products and services, and offline
media is still referred to as the real world (Bronner & Neijens, 2006). In this study,
offline refers to media that is not connected to the internet and they include traditional
ones like TV, Radio and Newspaper. Offline marketing is any promotion or
advertisement that is published and released outside the internet (Kramer et. al. 2015).
This primarily grabs the attention of people who are within the vicinity of marketing
activity. Marketers and advertisers still rely on traditional offline tools to reach
consumers and consumers have not abandoned these channels completely (Kramer et al.
2015).
The 2016/17 report by the Communication Authority of Kenya (CAK) shows that offline
media is still relevant given the reliability issues around the internet in Kenya, and the
consumption of offline media, especially radio, is still high in rural Kenya where the
internet is not reliable. Most of the studies done on offline media channels have focused
on comparisons between offline and online adoption statistics instead of how advertising
through them influences consumers’ attitude (Ha & McCann, 2008). This study therefore
closes the gap by researching on advertising through offline media channels and how it
influences consumers’ attitude especially in Kenya, where the internet is still expensive
and unreliable. This study therefore specifically assessed the influence of advertising
through offline media channels of TV, Radio and Newspaper on consumers’ attitude and
compared the results with those of online media channels in order to inform marketing
practitioners on the choice of media.

43
2.3.4.1 Advertising through television
Television is a traditional media that combines audio and visual methods to pass
communication to its audiences (Snyder & Garcia-Garcia, 2016). It is a domestic media
that one can watch at the comfort of their homes and allows one to witness events
happening thousands of miles away. The tremendous success of television as a mass
medium has its roots in its ability to incorporate both visual and aural content. This audio-
visual character gives it great power in conveying realism and this keeps the viewer
emotionally involved (Snyder & Garcia-Garcia, 2016). This study therefore examined
the influence of advertising through TV on consumers’ attitude as used by selected
commercial banks in Nairobi County, Kenya.
2.3.4.2 Advertising through radio
Radio is the transmission of signals by modulation of electromagnetic waves with
frequencies below those of visible light (Kramer et al. 2015). In electronics, modulation
is the process of varying one or more properties of high-frequency periodic waveform,
called the carrier signal, with respect to a modulating signal (Malthouse et al. 2007). This
is done in a similar fashion as a musician may modulate the tone from a musical
instrument by varying its volume, timing and pitch. The three key parameters of a
periodic waveform are its amplitude (volume), its phase (timing) and its frequency
(pitch), all of which can be modified in accordance with low-frequency signals to obtain
the modulated signal (Malthouse et al., 2007). Radio advertising is a method by which
producers and sellers use radio time to give information to their prospective customers
through the audio process. Specifically, the purpose of radio advertising is to enhance
potential consumers’ responses to the organization and its offerings. It seeks to do this
by providing information that the consumers desire by supplying reasons for preferring
a particular organisation’s offer. Producers and sellers find radio more convenient in

44
reaching the majority of the potential buyers, especially in the rural areas where other
forms of advertising cannot easily reach.
Radio is an attractive medium among the various mass communication media because of
its special characteristics. It continues to be as relevant and potent as it was in the early
years despite the emergence of more glamorous media. It is true that in the first phase of
broadcasting spanning three decades from the early twenties, radio reigned alone or was
the dominant player (Bronner & Neijens, 2006). However, over a period, the media scene
has changed drastically. Television, with its inherent strength of audio-visual component,
has captured the imagination of the people. The advent of satellite television, the internet
and the convergence of technology have added further dimensions to media utilization
patterns (Kramer et al, 2015). However, despite the presence of a plethora of media,
there is room and scope for each medium. New technologies, according to Kramer et al.
(2015), add things on but do not replace others; each medium reinvents itself in the
context of changes in the communication environment. In a changed media scenario,
radio is reorienting itself with more innovative programmes and formats. This research
work therefore examined the influence of advertising through the radio on consumers’
attitude as used by selected commercial banks in Nairobi County, Kenya.
2.3.4.3 Advertising through newspaper
Newspaper media includes those media that are controlled by space rather than time
(Bronner & Neijens, 2006). This is because a newspaper can be read at any available
time and can be kept for record. Newspaper is one of the most important and effective
print medium of mass media. It provides valuable services to the masses like information,
education, entertainment, cultural transmission and keeping records, making it an
inevitable medium for the contemporary world (Bronner & Neijens, 2006).
45
According to Nayak and Shah (2015), the newspaper forms an effective form of media
in a developing country such as India, where its reach is almost in every household.
Nayak and Shah reported that India led the world in terms of newspaper circulation with
nearly 330 million newspapers circulated daily, and it also showed a growth rate of
6.25% over the previous year. They also shared similar figures of Nielsen Company,
where expenditure in India on Newspaper advertisements was 4 billion US dollars in the
year 2011 and was expected to grow at a remarkable rate. In the twenty-first-century
media revolution, consumers have more media options. Hence, more research needs to
be conducted to measure the effects of media advertisements on various stages of
consumer behaviour and specifically how it shapes consumer’s attitude. This is the
concern of this study. This will capacitate advertisers to take the right media mix
decisions when allocating marketing resources for positively shaping the consumers’
attitude.
A newspaper provides information to the people about various events, issues and
occurrences in the world. It also interprets and explains matters, which are otherwise
difficult to be understood by readers. It is a great public educator discussing every topic
ranging from news to literature. It provides up-to-date information about science and
technology and promotes civilization in the society (Malthouse et al., 2007). Newspaper
also helps its readers build an opinion about various national and international issues,
events and policies through its editorials and opinion columns. It also entertains its
readers through special features and stories of human interests. This study therefore
explored the influence of advertising through the newspaper on consumers’ attitude as
used by selected commercial banks in Nairobi County, Kenya.
46
2.3.5 Consumers’ attitude
According to Schiffman & Kanuk (2014), attitude is a learned predisposition to behave
in a consistently favourable or unfavourable way with respect to a given object. Attitudes
vary in their strength, reflect consumers’ values and are learned. Further, different
situations impact attitudes differently; thus, marketers need to continually keep in touch
with the changing consumers’ attitude to be able to influence their actions. According
to Batra et al. (2009), attitude is a central concept in the entire field of social psychology
and therefore theories and methods associated with its explanation and measurement
have largely evolved from the work of social psychologists and psychometricians. Kotler
(2017) defines an attitude as persons’ enduring favourable or unfavourable evaluations,
feelings and action tendencies towards some object or idea.
Schiffman et al. (2014) further explain that as an outcome of psychological processes,
attitudes are not directly observable but are inferred from what people say or from their
behaviour. Consumer researchers therefore, tend to assess attitudes by asking questions
or making inferences from behaviour. A major point of convergence between definitions
by Schiffman et al. (2014) and Kotler (2017), is the manner the individual displays
favourable or unfavourable behaviour towards an object or idea in determining his/her
attitude towards it.
Scholars, such as Batra et al. (2009), have identified the following characteristics of
attitude: Attitudes are a learned predisposition; there is a consensus that attitudes relevant
to purchase behaviour are learned. They are formed as a result of direct experience with
the product, information acquired from others, and exposure to mass media and thus can
propel a consumer towards a given behaviour. Attitudes have consistency: An attitude is
relatively consistent with the behaviour it reflects. However, attitudes are not necessarily
permanent as they do change. Normally, we expect consumer attitudes to correspond
47
with behaviour; therefore when consumers are free to act as they wish, we anticipate that
their actions will be consistent with their attitudes. However, circumstances often vary;
hence, it is important to consider the influence of the situation on consumer attitudes and
behaviour (Batra et al., 2009)
According to Solomon (2016), the most popular model that can help marketers
understand the relationship between attitude and behaviour is the Tri-Component attitude
model. The model postulates that attitudes consist of three major components: cognitive
(awareness), affective (liking) and conative (action). The cognitive consist of knowledge
and perceptions that form beliefs; the affective component are consumers’ emotions and
feelings about a particular object which can be favourable or unfavourable whereas
conative is concerned with the likelihood or tendency that the individual would undertake
a specific action or behave in a particular way in regard to the attitude object. This is
also in line with Batra et al. (2009) who referred to the Tri-Component Attitude Model
as the ABC Model of attitude; Affective, Behaviour/Conative and Cognition.
2.3.5.1 Awareness, liking and action components of attitude
The awareness component refers to cognition, comprehension, knowledge, belief, or
disbelief about an object, product or brand (Batra et al., 2009). According to Hannah
(2013), awareness refers to the beliefs, thoughts and attributes that we would associate
with an object. Hannah further regards awareness as the opinion or belief segment of
attitude which is related to the general knowledge of a person. Aaker (1991) defined
awareness as the knowledge that the consumer has about a certain brand. A study done
by Rowley (1998) posits that it is a critical stage in which consumers should be made
aware of the product features and benefits of the specific brand. This concurs with a study
done by Baca et al. (2005) who postulated that advertisers’ main goal at this stage is to
convey the product features and benefits. In a study done by Rossiter et al. (1991) they
48
established that a precondition for producing brand interest was awareness. Numerous
researchers have determined that there was a strong connection between the behaviour
of a buyer and awareness of its brand (Hoyer, 1984; Nedungadi, 1990). Meyrick (2006)
concluded that in order to create more awareness on products, services, ideas or brands,
marketers need to inform consumers continuously on the new updated features of the
product or service using advertising.
Schiffman and Kanuk, (2014) explain that the liking component of attitude is the
emotional or the feeling segment of attitude and it involves a kind of emotion experienced
towards the object of attitude, which could be like or dislike; palatable or unpalatable.
They averred that the emotional component is quite strong and normally stands in the
way of attitude change. They further explained that the underlying assumption is that the
overall liking component i.e., affective, is based on the cognitive component. However,
there are arguments that people generally develop an overall attitudinal liking for objects
without first cognitively evaluating as good – with such overall attitude being based
purely on emotions and feelings rather than rational, cognitive belief – based evaluation
(Batra et al., 2009). The liking component refers to evaluation, affective, or preference
towards an object. Attention is usually focused on this component by marketers, which
involves assessing the degree of positive or negative feelings for an object (Batra et al.,
2009).
The action component refers to conative tendencies such as intentions, behavioural, trial
or purchases in respect of an object, product or brand (Assael, 2005). Assael further
explains action component involves the consumer’s tendency to act toward an object or
communication, which is often measured in terms of intention to buy or acquire. The
action component of attitude is the performance one does based on the awareness and
liking components and the only observable component among the three components of
49
attitude which can be seen through what one says will do or actually how he behaves, or
does (Perner, 2016).
2.3.5.2 Attitude development
Assael (2005) explains several ways in which attitudes are developed, including
personality, family influence, peer group pressures, information and experiences. He
explains that personality traits such as aggression, submissiveness, authoritarianism or
extroversion may influence attitudes towards products or brands. In addition, the family
influences the purchase decision of an individual and that there is a high correlation
between children’s attitudes and those of their parents. He further alludes that there is a
pervasive group influence on the buying behaviour and thus peer groups are much more
likely to influence attitudes and purchase decisions than advertising. Additionally, Assael
argues that experiences and information received by consumers also influence their brand
attitudes towards products.
On peer group influence, Kotler and Armstrong (2012) argue that the extent to which
another person’s attitude reduces one’s preferred alternative depends on two factors i.e.
the intensity of the other person’s negative attitude towards the consumer’s preferred
alternative and the consumer’s motivation to comply with other person’s wishes. They
concluded that the influence of others becomes complex when several people close to
the buyer hold contradictory opinions and the buyer would want to please them.
On the other hand, Schiffman et al. (2014) divided attitude development into three broad
areas; classical conditioning, instrumental conditioning and cognitive learning theory.
They further explain that attitude development or formation refers to a shift from NO
attitude of a given object to SOME attitude toward it. The basic learning process as
explained by the following learning theories therefore guides attitude formation.

50
Classical conditioning, according to Schiffman et al. (2014) is an originally neutral
stimulus such as the brand name of a new product that can produce a favourable or
unfavourable attitude if it is repeatedly followed by or associated with some kind of a
positive or a negative reinforcement e.g. using celebrities to give a positive association
to an already neutral new product. Instrumental conditioning involves buying a product
that is the only remaining product on a shelf and out of experience in using, the consumer
develops either a positive or a negative attitude towards the product. Cognitive learning
theory refers to where the consumer is involved in the purchase decision of the product
and awareness or knowledge of it is likely to be a major input in the formation of
attitudes. The more information an individual has about a product or service, the more
likely they are to have an attitude toward it – either a negative or positive (Schiffman et
al., 2014). This study leans towards the Cognitive learning theory. Marketers influence
consumers’ awareness by use of advertising.
According to Kotler and Armstrong (2012), consumers’ attitude are among internal
factors that influence consumer-purchasing decisions; others include motivation and
involvement, personality and self-concept, learning and memory and information
processing function of the brain. External factors include culture, social class influences,
social groupings, and family unit and personality features.
2.3.5.3 Functions of attitude
Schiffman et al. (2014) classify attitude functions strategies into Utilitarian, Ego
defensive, Value expressive, and Knowledge (Awareness) functions, which all fall under
basic motivational functions. In the utilitarian function, people hold certain brand
attitudes partly because of a brand’s utility. If a product has helped one in the past, even
in a small way, one’s attitude towards it tends to be favourable. One way of changing
attitudes in favour of a product is by showing people that it can serve a utilitarian purpose
51
that they may not have considered before. The ego defensive function involves protecting
people’s self-image from inner feelings of doubt e.g., in advertisements for cosmetics
and personal hygiene products, which this purpose is usually incorporated. Value
expressive functions are attitudes that articulate one’s general values, lifestyle and
outlook e.g. if a consumer segment holds a high evaluation or attitude towards social
media channels of Facebook, Google Ads or YouTube, then they are likely to have
profiles or use the mediums. Lastly, the knowledge or awareness function is based on
individuals’ general need to know and understand people and things they come into
contact with, especially when such people and things might influence behaviour. Most
brand positioning attempt to satisfy consumers’ needs to know and to improve their
attitudes toward the brand by clarifying its advantages over competitive brands
(Schiffman et al., 2014). This study focused on how advertising through media channels,
both offline and online, shapes the awareness or knowledge function of consumers’
attitude.
2.3.5.4 Measuring attitude
According to Batra et al. (2009), the simplest way to measure how an object (advertising
through media type) influences consumer attitude is to ask the respondent whether he or
she likes or dislikes it. They further alluded that there are no explicit attribute criteria
given on which evaluation is made and respondents are simply asked to answer ‘yes’ or
‘no’, and these responses are used to determine the consumers’ attitude.
Attitudes are hypothetical constructs that are not directly observable; thus, their strength
and direction can only be inferred (Kotler & Armstrong, 2012). According to these
scholars, attitude measurement techniques concentrate on what individuals describe as
being their ‘feelings’ towards the objective concern of attitude. Batra et al. (2009)
expounded that the most widely used approach to attitude measurement is the attitude
52
scale, which is usually concerned with measuring the valence i.e., the degree of positive
or negative feelings. Interest centres on attempting to capture the degree of attitude by
asking a question in the form of a scale; for example a respondent could be asked to
express how much he or she liked a brand on a scale ranging from ‘very much’ (1) to
‘very little’ (5) (Batra et al., 2009).
Likert Scale is one of the methods used to measure attitudes and it is probably the most
commonly used technique for scaling, having been developed by Likert in 1932 ( Bartra
et al., 2009). In this scale, individuals are asked if they agree or disagree with a statement,
but are also asked to indicate the extent to which they agree by choosing one of the
following five categories: Strongly agree; Agree; Neutral/Don’t Know; Disagree; and
Strongly disagree. This produces numerical scores and values that are given to each
category and that a high overall score can be interpreted as a positive attitude and a low
overall score as a negative attitude. The Likert Scale was used in this study to measure
the influence of advertising through media on consumers’ attitude and to compare the
online and offline channels.
Rank Order Scales is a technique where subjects are asked to rank items such as products
or retail stores in order of likings in terms of a criterion, such as overall quality of
price/value for the money (Schiffman et al., 2014). Ranking order scales was used in this
research work to show which media channels are liked by consumers of the commercial
banks under the study. Rank order scaling procedures provide important competitive
information and enable marketers to identify needed areas of improvement in product
design or product positioning and therefore in this study choice of media channels to use
in advertising in order to influence consumers’ attitude positively. Apart from using self-
report attitude scales, consumers’ attitude may also be measured using
53
observation/inference and qualitative research methods, which was also employed to
expand this research work.
Schiffman et al. (2014) argue that since we cannot get inside consumers’ heads and
observe their attitudes directly, we must rely on indirect measure of attitudes. They
suggested that one such measurement approach is to observe consumers’ behaviour and
to infer their attitudes from their behaviour. They further added that although
observational research is a useful research technique, drawing conclusions about
consumers’ attitude from their behaviour is rather often and very likely to be subjective.
They posit that it is difficult for an observer, even a highly trained one, to be confident
about attitudes inferred from a single situation, therefore, since researchers seldom have
the opportunity to observe the same consumers repeatedly, it is common practice to
employ observations as a supplement to other research approaches, rather than as the
primary research method. This was one of the reasons why this research work opted for
quantitative survey methodology that allows assessment of consumers’ self-filled
questionnaires.
Attitude researchers have found qualitative research methods, such as depth interviews,
focus-group sessions and projective tests, to be very useful in understanding the nature
of consumers’ attitude (Batra et al., 2009). They further alluded that while these research
methods may differ in composition, they all have roots in psychoanalytic and clinical
aspects of psychology and stress open-ended and free-response types of questions to
stimulate respondents to reveal their inner thoughts and beliefs. The techniques are
employed in the early stages of attitude research to pinpoint relevant product-related
beliefs or attributes and to develop an initial picture of consumers’ attitude (Schiffman
et al., 2014). They further explained that this is especially for the beliefs and attributes
they associate with particular products and services.

54
2.3.6 Age of the consumer
This concept is anchored in understanding consumer behaviour in marketing. Consumer
behaviour is the study of how people make decisions about what they buy, want, need or
act in regards to a product, service or company (Kotler, 2017). Kotler argues that it is
critical to understand consumer behaviour to know how potential customers would
respond to a new product or service and identify opportunities that are not currently met.
Kotler (2017) further says that consumer behaviour is influenced by various personal
characteristics of the consumer, which are age, gender, income level, marital status and
education level among others. For example, an older person was likely to exhibit different
consumer behaviour than a younger person, meaning, they would choose products
differently and spend their money on items that may not interest a younger generation.
The focus of this study was the moderating effect of age on the relationship between
advertising through selected media channels on consumer attitude. The effect was also
compared to assess how it differs between online and offline channels. This is based on
the belief that consumers’ attitude on the use of various media channels vary with age
and therefore the need to guide decisions around this demography.
Age is one of the personal factors that affect consumer behaviour and thus there is a need
to understand how it moderates the influence of advertising through media channels on
consumers’ attitude. There are various models on age in consumer behaviour; the most
researched and used models being the theory of reasoned action, Engel, Kollet, Blackwell
(EKB) model and motivation theory also known as need theory by Abraham Maslow and
Hawkins Stern Impulse Buying theory (Perner, 2016). Age is one of the personal factors
that determine the economic and decision-making capability of a person and is therefore
a key factor in consumer behaviour. This study used the theory of reasoned action to
assess the moderating effect of age on advertising through media on consumers’ attitude.
55
Age is a critical variable in marketing that determines the distribution of resources
according to Perner (2016). The youth are deemed to be studying, the middle age is
considered to be working and the old are supposed to be in leisure (Rebecca Howell,
2012). Given that age is a key variable in the distribution of wealth, it is vital that
marketers understand the difference it brings as it intervenes in the relationship between
advertising through media and consumers’ attitude.
According to Perner (2016), age is one of the demographic variables that heavily
influences marketing strategy. He explained that the variable segments a market
according to the age of consumers and it is based on the premise that typical consumers’
needs and desires change as they age. Perner further argues that age enables the
classification of consumers into four categories: Children (Infant), Teenage, middle aged
and older population. He also posits that age helps marketers to determine the purchasing
power of the consumer, based on their age category.
Intra-individual change in behaviour with age constitutes the essential element in
research but unless age is broken down into its component parts, age is devoid of meaning
(Solomon, 2016). The different components of chronological age are considered in terms
of cognitive level, different types of biological maturity and the duration of type of life
experiences. Solomon thus concludes that consumer attitude is different based on age
distinctions and thus the need for the study.
According to Howell (2012), marketers use segmentation in advertising in order to target
a specific audience and they use variables such as age to identify and determine the
difference in sections of a market. Howell further observes that much research has
56
focused on consumer buying correlates that looked at age cohorts as specific
segmentation variables to be used in marketing. According to Rachel et al. (2015), an
age cohort consist of people of similar ages who have similar experiences, for examples,
the Baby Boomers, Generation X and Generation Y. They defined Baby Boomers as
people who were born between 1946 and 1964; people born between 1965 and 1986,
were considered generation X; while people born between 1986 and 2002, were
considered generation Y (Rachel et al., 2015). This therefore brings in the rationale of
grouping age for this study at below 29 years, 30 to 49 years and above 50 years. It finally
guided in analysing the effect of age as a moderating variable in this study.
According to Iyer and Reisenwitz (2009), the title Generation Y, was first used by the
advertising agents and has become a commonly used name for consumers born in that
era. Other names given to consumers of Generation Y are Echo Boomers, the Millennium
Generation, Generation Next, the Net Generation and the Generation why? Generation
X got its name from a book written by Douglas Copland on Tales for Accelerated
Culture. Members of generation X have a variety of nicknames such as Baby Busters,
YIFFIES, the Brash Pack, FLYERS, the NIKES, the indifferent generation and the
invisible generation. Baby Boomer generation received their name from post-World War
II society where males returned from war and had children all around the same time,
resulting in a dramatic increase in birth rates. Thus, the Baby Boomers were mostly
referred to as the ‘me generation’ (Iyer & Reisenwitz, 2009),
Rachel et al. (2015) claims that one of the main reasons for understanding age cohorts in
market segmentation is being able to use different target strategies and segmentation
strategies. They further advanced that having knowledge of the different types of
segmentation variables aided in choosing the most effective and appropriate strategy for
advertising to consumers. Howell (2012) says that consumers have similar interests and

57
experiences that they share with their specific generation, and these interests influenced
their consumer behaviour and buying patterns. She argues that understanding different
age groups makes advertising to them more effective, because marketers can determine
what appeals to the majority of these consumers, and help narrow down the target
audiences drastically. In this study therefore, assessing how age moderates the
relationship of advertising through media channels was important in helping establish
the consumers’ attitude.
2.4 Overview of existing literature
Additional literature for selected commercial banks for this research work is captured
here below:
2.4.1 Kenya Commercial Bank
Kenya Commercial Bank started as a Bank of India, which opened a small branch in the
coastal town of Mombasa in 1896, according to the Kenya Commercial Bank’s annual
report (2015). It is reported that in the early 1970 Kenya government acquired 60 percent
shareholdings in National and Grindlays Bank consequently rebranding it to Kenya
Commercial Bank was after the 1958 merger with the National Bank of India and
National and Grindlays Bank of Britain. In addition, 1976 the Kenya government
acquired 100 percent of the shares making it a state bank after which later reduced its
shares to the current 25 percent while 75 percent owned by the public.
According to the KCB annual report (2016), the bank is listed in the Nairobi Stock
Exchange with a customer base of over 4.14 million, agency outlets of over 10,102, over
962 ATMs, and over 242 branch-network. The bank has presence in Kenya, Tanzania,
Uganda, Burundi, South Sudan, and Rwanda. The report further explained that the bank
had adopted innovative ways of communicating to consumers through online channels

58
of social media; specifically, Facebook and Twitter, in addition to their traditional way
of communication via TV, Radio and the Newspaper. This study studied the influence of
KCB’s advertising through media on consumers’ attitude in Kenya and particularly in
Nairobi County, then compared how these attitudes vary between online and offline
channels, further assessing how age moderates this relationship.
2.4.2 Equity Bank
Equity Bank Limited commenced business in 1984 as a Building Society, a Micro-
Finance Institution and is currently among the Nairobi Stock Exchange listed commercial
banks as per its annual report of 2016. It is one of the most profitable companies in East
Africa, and since its listing in 2006, Equity Bank’s shareholder value has grown
tremendously creating immense wealth for shareholders, from a customer base of 27,000
in 1993 to 7.8 million accounts in 2016; accounting for over 50 percent of all bank
accounts in Kenya. The report also shows that Equity Bank is the largest bank by
customer base in Africa that focuses on providing affordable, accessible and relevant
products and services at the bottom of the pyramid.
According to Equity Bank’s annual report (2017), the bank has presence in 6 countries
namely, Kenya, Uganda, South Sudan, Tanzania, Rwanda and DRC. The bank has about
50 branches in Nairobi County. The report also showed that the outlets across the six
countries were 35,272 agent outlets, 22,243 Point of Sale Terminals (POS) and 693
ATMs. The report further showed that the bank communicated with its consumers
through both online and offline channels of communication and this is the reason it was
chosen for this study. This research work studied the influence of Equity Bank’s
advertising through media on consumers’ attitude in Kenya and particularly in Nairobi

59
County then compared how these attitudes vary between online and offline channels,
further assessing how age moderates this relationship.
2.4.3 Co-operative Bank of Kenya
According to Co-op Bank Financial report (2016), Co-operative Bank of Kenya (Co-op
bank) was founded in 1965 and granted a banking licence in 1968. It is a large financial
service institution and falls under tier 1 and controls 9.9% of the market share according
to the Central Bank of Kenya supervision report (2016). It serves over 6.2 million
consumers countrywide with 145 branches, over 8,000 agents and 580 ATMS (Co-op
Bank Financial report, 2016).
According to Co-op Bank Annual Report (2017), the bank’s social media accounts on
Facebook had over 1 million fans, while its Twitter accounts had over 100,000 followers.
The report further indicated that the bank was rated as one of the fastest growing
commercial banks in terms of social media fans and followers as of February, 2017 by
Social Bakers, an online network monitoring and analysis company. The Co-operative
bank therefore is a major player in the marketing communication space through various
channels, both online and offline and thus the reason for it being chosen for this study.
This study therefore studied the influence of Co-op Bank’s advertising through media on
consumers’ attitude in Kenya and particularly in Nairobi County, then compared how
these attitudes vary between online and offline channels, further assessing how age
moderates the relationship.
2.5 Summary and gaps
From the available literature reviewed, consumer attitude has been studied mainly in
social and behavioural studies under marketing mix of Product, Price, Place and
Promotion, but there is no research done on the influence of advertising through media
60
on consumers’ attitude, comparing the online and offline channels. Extant research on
advertising through media (Kaplan & Haenlein, 2017; Evans, 2012, and Bernoff, 2009)
focused on explaining what online is, its nature, need for marketers to invest in them; and
the world, continent and country statistics of users, with barely any studying what
influence of advertising through media channels has on consumers’ attitude, specifically
with regard to the influence that online and offline channels have on consumers’ attitude.
This aspect is critical in order to prudently guide practitioners on resource allocation,
because from the researcher’s empirical review, companies’ resources especially on
marketing investment have since been reducing. This study findings thus helped fill the
gap and have contributed to the knowledge on consumer behaviour; therefore,
practitioners now have a better understanding of consumers in relation to advertising
through media and consumer’s attitude.
Research has also shown that studies have been done on online media (Gangi & Wasko,
2016), with no attention to how the consumer attitude compared with online and offline
media. This created a gap in literature that this study has attempted to fill. This study
therefore compared advertising through online and offline media channels specifically
on their influence on consumers’ attitude sub constructs of awareness, liking and action
in order to bridge the identified gap.
Marketers are finding that interactive and targeted marketing is the key to success and
that traditional advertising is essentially a waste of money. Six out of ten marketers
surveyed by Forrester Research stated that they would increase their budget for
interactive online marketing and reduce budgets for traditional one-way advertising
(Bernoff, 2009). Empirical review by the researcher, shows that online media channels
are increasingly changing the landscape of media consumption in Kenya. This shift of
consumer audiences from traditional media (TV, Radio and Newspaper) to new media

61
(Facebook, Google Ads and YouTube) is the reason why this research study was
necessary in order to guide on marketing resource allocation.
According to Knoll (2015), substantial research has been done on online media and
continue to be done; however, little is known about how advertising through these media
channels affect consumers’ attitude. Knoll further argues that in order to accommodate a
digital world, scholarly research must adopt new approaches to theory and method. Over
the last several years, there has been some scholarly research on consumer behaviour in
the digital media context; unfortunately, most of the research done dealt with small
behavioural questions regarding online behaviour with no focus on consumers’ attitude
(Ratchford et al., 2007). The scholars recommended that scholarly studies on digital
media needed to change to accommodate consumer online media use, computational
models for advertising allocation, network influences of brand communications and most
importantly a theory for marketing on digital media. They however cautioned that many
research studies on digital media get outdated before they are published due to the rapid
changes on the use of the internet. They further alluded that online media despite its rapid
changes cannot be ignored since it is the default form of the channel that has recently
gotten the attention of the marketers and specifically advertisers due to the number of
consumers using the online channels. The question therefore remains whether online
channels form good platforms for marketers to advertising through in order to positively
influence consumers’ attitude and, therefore, enable the purchase of their goods, services
and or ideas. This research work was intended to contribute to this knowledge gap.
The research work was further motivated by the changing landscape of media
consumption in Kenya, where over 30 million individuals are users of internet, according
to the Communication Authority of Kenya, annual report (2016/17). This growth in the
internet use further corroborates the empirical review findings by the researcher that

62
corporate leaders in Kenya were pushing their marketers to engage customers on online
platforms like Facebook, Google Ads and YouTube as opposed to using traditional
mediums like TV, Radio and Newspaper. However, no one has assessed the influence of
advertising through these channels on consumers’ attitude, a gap that this study has filled.
Studies have been done on online media (Chikandiwa, 2013; Kimani, 2010 & Kamau,
2012), but none so far, has been done to assess the effect that advertising through the
online platforms has had on consumers’ attitude.
Closer examination of existing research disclosed that a gap in literature existed in the
assessment of how age as a variable moderated the relationship between advertising
through media and consumers’ attitude, with a focus on online and offline media. The
probability of making assumptions on the choice of advertising medium by
communication professionals in marketing when targeting different age groups is
therefore conceivable and commercial implications evident. This research therefore
examined how age moderated the relationship and therefore filled this knowledge gap.
The study found it exciting to use online and offline platforms of Facebook, Google Ads,
YouTube and TV, Radio and Newspaper respectively for the three selected commercial
banks in Kenya; namely, KCB, Equity Bank, and Co-operative Bank of Kenya Ltd. These
banks reported to be communicating using both online and offline channels of media as
per their respective annual reports of 2016. In addition, the CBK supervision report
(2016) disclosed that they were the three largest banks controlling over 30% of the
market share in the banking industry, thus reliable in terms of informing the industry.
The literature review also found out that the three commercial banks controlled share of
voice in terms of advertising expenditure through various mediums of online and offline
channels unlike other banks, KARF (2016).
63
2.6 Conceptual framework
According to Miles et al. (2013), a conceptual framework is an illustrative diagram that
explains graphically and in a narrative method, the main variables of the study and
presumed relationships among them. They explained that the framework outlines in a
diagrammatic way the relationship between the independent variable and the dependent
variable and any other variable that the study may be examining, in this case the
moderating variable. This study hypothesised that advertising through media (Online
channels of Facebook, Google Ads and YouTube, and offline channels of Radio,
Television and Newspaper), which are the independent variables would influence
consumers’ attitude sub-constructs of awareness, liking and action which is the
dependent variable. The study also presumed that there is a linear relationship between
the independent variable and the dependent variable as illustrated in Figure 2 below. It
further hypothesised that the relationship between the independent variable and
dependent variable might be moderated by the age of the consumer therefore taking the
age of the consumer as the moderating variable (see Figure 2).
In order to test the hypothesised relationships between the study variables, the terms were
translated into operational definitions that were observable and could be measured for
purposes of this research work using cardinal scales. The independent variables in this
study were advertising through various media channels of online and offline as carried
out by the selected commercial banks in Nairobi County, Kenya. The research assumed
that the advertisements carried out in the selected channels met the AIDA model
requirement of raising Awareness, Interest, Desire and finally Action; and therefore, did
not dwell on examining the details of the advert itself but the channel that was used for
the communication and if the channel used was shaping consumers’ attitude positively
or negatively. The dependent variable which is consumers’ attitude in this study was

64
assessed based on its three sub-constructs of awareness, liking and action according to
the Tri-component Attitude model. The age of the consumer was assumed to moderate
the relationship between advertising through media and consumers’ attitude. Figure 2
below captures the details of the conceptual framework for this research work.
Figure 2: Schematic diagram on conceptual framework
Source: Own conception, 2018
Dependent
Variable
Moderating
Variable
Advertising through
Advertising through
Google Ads
Age
Consumers’ attitude
Awareness
Liking
Action
Advertising through You
Tube
Advertising through
Television
Advertising through
Newspaper
Advertising through
Radio
Online media channels
Offline media channels
Independent
Variables

65
CHAPTER THREE
RESEARCH METHODOLOGY
3.1 Introduction
This chapter describes the philosophical underpinning of the study and the research
methodology of the study. It outlines the plan that the researcher used to undertake the
study. It therefore details the research philosophy, research design, target population,
sampling design, research instruments, data collection procedure, operational definitions
and data analysis methods that were used in the study. It concludes with a discussion of
the data analysis techniques adopted for the study.
3.2 Research philosophy
Research philosophy can be viewed as a conviction that provides legitimate scientific
approach such as phenomenon data gathering and analysis (Bergman, 2011; Cresswell
& Clark, 2007; Greene, 2007; Teddlie & Tashakkori, 2009; Harrits, 2011). The research
philosophy can also be viewed as shared understanding by researchers of reality with
differences in assumption about how problems should be understood, the researcher’s
role in any study and how research should be conducted or problem addressed (Scotland,
2012). Research philosophy enables a holistic view of how a researcher sees himself/
herself in relation to knowledge and methodological strategies adopted to discover it –
the intellectual structure upon which research and development in a field of inquiry is
based.
This study adopted a positivist pattern, which holds that reality could be observed and
described from an objective point of view; without interfering with the phenomenon of
what is being studied (Pring, 2000; Krauss, 2005). In the current study application of the
approach was aimed at establishing the nature of relationships that underlie the

66
independent, dependent, and moderating variables; test the formulated hypotheses, and
generalize from research findings. Since this study aimed to establish individuals’
knowledge, beliefs and preferences, the positivist paradigm was ideal particularly as it
enables description, explanation and analysis of the social world using scientific
methodology. This paradigm was adopted because it allowed the neutrality of the
researcher in the entire investigation.
3.3 Research design
Research design can be defined as a well described procedure to collect, measure and
analyse data; whose choice is dependent on the stage to which knowledge about the
research topic has advanced (Sekaran and Bougie, 2010). They further described it as a
logical model that guides the investigator in the various stages of the research. This study
used a descriptive cross-sectional survey as its research design to conduct the
investigation.
The descriptive research design was adopted for the study because it limited active
intervention by the researcher, which may have produced researcher bias (Shaughnessy
et al., 2011). A cross sectional survey study enabled the researcher to obtain data about
the practices, situations or views at one point in time through questionnaires. This study
collected data only once, thus the research design was ideal. Cross-sectional surveys
allows the researcher to evaluate many variables at one time unlike the laboratory
research or field experiments where data could be collected about the real world
environment. In addition, it is more feasible to obtain a variety of responses because each
unit has an equal chance of being selected (Nargundkar, 2003). This design has been used
in the past in marketing studies and has successfully yielded credible results (Bashar et
al. 2012; Kodjamanis, 2013; Wambugu et al., 2014; and, Njuguna, 2014).

67
3.4 The Population of the study
The population of the study is the complete group of individuals or companies that the
researcher wishes to investigate (Sekaran & Bougie, 2010). Population is defined in
terms of availability of elements, time-frame, geographical boundaries and the topic of
interest (Sekaran & Bougie, 2010). The population of interest for this study comprised
all consumers banking in the three selected commercial banks in Kenya and residing in
Nairobi County. Table 3 summarise the distribution of the study population.
Table 3: The population of the study
Commercial Bank No. of Branches in
Nairobi County
No. of Customers
Kenya Commercial Bank 62 1,003,365
Co-operative Bank of Kenya 55 2,304,115
Equity Bank of Kenya 50 2,290,235
Total 167 5,597,715
Source: Annual reports for the Commercial Bank (2017)
At the time of the study, Kenya Commercial Bank (KCB) had 62 branches in Nairobi
County, Co-operative Bank of Kenya had 55 branches and Equity Bank had 50 branches.
The Nairobi branches of selected commercial banks had consumers distributed as
follows: Co-operative Bank of Kenya had 2,304,115, Kenya Commercial Bank had
1,003,365, and Equity Bank had 2,290,235 consumers.
3.5 Sample size determination
Neuman (2014) argues that there is a need to keep the sample size that is manageable
enough in order to derive detailed data at an affordable cost. This study therefore used a
multi-stage sampling procedure to arrive at the sample size. First, the commercial bank
branches were sampled by application of Mugenda and Mugenda (2008) formulae, which
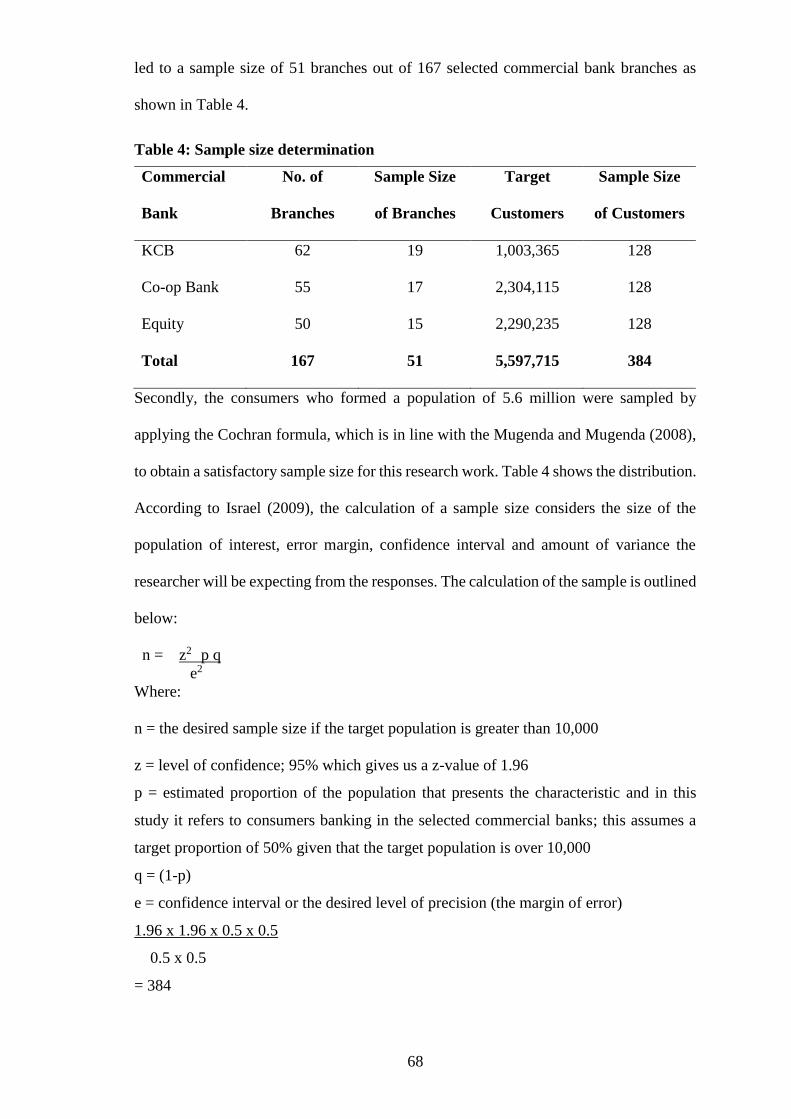
68
led to a sample size of 51 branches out of 167 selected commercial bank branches as
shown in Table 4.
Table 4: Sample size determination
Commercial
Bank
No. of
Branches
Sample Size
of Branches
Target
Customers
Sample Size
of Customers
KCB 62 19 1,003,365 128
Co-op Bank 55 17 2,304,115 128
Equity 50 15 2,290,235 128
Total 167 51 5,597,715 384
Secondly, the consumers who formed a population of 5.6 million were sampled by
applying the Cochran formula, which is in line with the Mugenda and Mugenda (2008),
to obtain a satisfactory sample size for this research work. Table 4 shows the distribution.
According to Israel (2009), the calculation of a sample size considers the size of the
population of interest, error margin, confidence interval and amount of variance the
researcher will be expecting from the responses. The calculation of the sample is outlined
below:
n = z2 p q
e2
Where:
n = the desired sample size if the target population is greater than 10,000
z = level of confidence; 95% which gives us a z-value of 1.96
p = estimated proportion of the population that presents the characteristic and in this
study it refers to consumers banking in the selected commercial banks; this assumes a
target proportion of 50% given that the target population is over 10,000
q = (1-p)
e = confidence interval or the desired level of precision (the margin of error)
1.96 x 1.96 x 0.5 x 0.5
0.5 x 0.5
= 384

69
According to Kothari (2004), this Cochran formulae assumes that 50% of the population
presents the characteristics that are required in the study at 95% confidence level with a
5% precision interval. The study therefore used 384 participants from the three selected
commercial bank branches in Nairobi County, Kenya to draw conclusions for this study.
They were distributed equally as shown in Table 4, to allow for reliable results. This
sample size of 384 is consistent with Oppeheim’s (2001) assertion that a prospective
sample size for attitudinal research need not be larger than a few hundreds. This concurs
with a study done by Dalen (1979) that established that a sample size of 384 was adequate
for use in research work for a target population that was greater than 10,000 persons.
3.6 Study area
The study was conducted in Nairobi County, Kenya, located in East Africa and lies along
latitude 1017’ South and Longitude 36049’ East. Nairobi County is the main commercial
center of Kenya and boasts of headquarter offices of all commercial banks in Kenya,
according to KNBS (2016). The study area was selected for this research work because
it is the chief business hub of Kenya and a host to 625 branches out of 1,541 branches of
commercial banks in Kenya, translating to 41% of the total bank branch network,
according to Central Bank Supervision report (2017). In addition, the three largest
commercial banks in terms of asset base, namely: Kenya Commercial Bank (KCB),
Equity Bank and Co-operative Bank (Co-op Bank), were selected because they
controlled almost 30% of the bank branches in Nairobi County, translating to 167
branches in total, CBK (2017). Communication Authority of Kenya (CAK) 2016/17
annual report, indicated that there were 30 million internet subscribers in Kenya as of
June, 2017, out of which 89.7% were in Nairobi. This meant that 90% of the 5 million
consumers banking in the selected commercial banks were internet users and therefore
could access online marketing communication platforms that included, Facebook,

70
Google Ads and YouTube; however whether the use of these channels to advertise
through by selected commercial banks was shaping consumers’ attitude positively
remained scanty. The report also indicated that Radio was being widely used with a few
accessing TV and Newspapers.
3.7 Instrumentation
Structured questionnaire was used to collect data for this study, (Appendix II). According
to Pallant (2011), a closed ended or structured questionnaire is good for a quantitative
method of research, which is positivist in nature. Pallant (2011) further argues that
questionnaires are quite popular especially in cases involving surveys and big enquiries
as they give consistency in data collection, and minimises time and costs of collection.
This was one of the key considerations for the choice of the instrument for this study.
The questionnaire for this study was therefore divided into three sub sections; part A
contained general information about the demography of the respondent; Part B contained
questions on advertising through media channel and used the 5 point Likert scale that
measured the time spent on a media channel, attention on the advert based on channel
and understanding of the advert and finally part C contained questions that measured the
influence of advertising through media on consumers’ attitude using the 5 point Likert
scale (Appendix II).
A well-designed and administered questionnaire reduces non-responses and
measurement errors according to Kothari (2004). Kothari further posits that such a
questionnaire has the potential to reach a large number of respondents, generate
standardised, quantifiable, empirical data and offer confidentiality. The main constructs
of this study were measured by adopting existing scales in literature; and modifying them
to suit the research work. Independent variable of Consumers’ attitude was measured
using a 5-point Likert scale, where 1 = Strongly Disagree; 2 = Disagree; 3 = Neutral; 4
71
= Agree; 5 = Strongly Agree. Likert scales offer advantage of speed and ease of coding
(Neuman, 2014). Researchers have used the scale in their study work on consumers’
attitude (Haque et al., 2007; Kwek et al., 2010) and have come up with credible results.
The study instrument was administered to the sampled respondents who were found
transacting at the banking halls of the selected commercial bank branches using a
convenient random sampling. The branches of commercial banks spread out in Nairobi
County, Kenya, were equally selected using a random convenient method. Prior to
administering the questionnaire, its validity and reliability were determined to ensure it
measured what it was to measure and also that it was consistent across the board.
3.7.1 Validity of the instrument
The validity of the instrument in this study combined both face and construct validity.
According to Oso and Onen (2008), validity is the degree to which the sample of test
items represent the construct the test was designed to measure. Face validity involved
pilot testing the questionnaire using forty-five randomly selected respondents from
Mombasa County (fifteen from each bank, given that the study focused on three selected
commercial banks), prior to administering it to the entire elements of the population. The
test received feedback on the appropriateness of the wording and clarity of the questions,
estimated the length of the survey and traced any important issues that might have been
overlooked (Iraossi, 2006; Ellis, 2010; Mayring, 2014).The test showed that the wordings
were clear, save for the need to indicate the branch, which after deliberation with the
supervisors was left as was before. Secondly, construct validity was achieved by
engaging the research supervisors, fellow students and colleagues who checked the
questions to ensure that they were addressing the research objectives (Pallant, 2011;

72
Kothari, 2004).They appraised the instruments prior to use and gave approval that the
instruments were addressing the objectives.
3.7.2 Reliability of the instrument
Reliability of a scale indicates how free it is from random error and frequently used
indicators for reliability are test-retest reliability and internal consistency (Neuman,
2014). In this study, reliability was assessed first by administering the questionnaire to
forty-five eligible consumers from the three selected banks in Mombasa County (15 from
Equity Bank; 15 from KCB and 15 from Co-operative Bank of Kenya) after which, minor
changes were done.
Pilot study is prerequisite approach to ensure the research instruments like questionnaires
and interview are free from any discrepancies that would be potential bottleneck during
the actual research (Samson, 2004). Generally, problems such as logistics and language
barrier are likely to be encountered during the field study hence leading to poor recording
and response rates (Van Teijlingen et al., 2001). The pilot study was done in the period
between April 2019 and May 2019 to ensure valid and reliable results were obtained, and
errors of translation corrected, before the tools were used in the main study. Mombasa
County was chosen because all the three commercial banks reported to have branches in
that county according to their Annual Financial Reports of 2017, and given that Mombasa
is the second largest city in Kenya, believed to have almost the same urban setting and
consumers like the main study location of Nairobi County, Kenya.
A pilot study is the most common technique used to polish research instruments, such as
questionnaires and interview schedules (Samson, 2004), and to identify potential
problems that would likely be encountered during data collection (Van Teijlingen, et al.,
73
2001). Piloting also helps to uncover logistical problems that could affect the survey
process, such as the perceptions of local language interpreters and research guides,
including poor recording and response rates (Van Teijlingen et al., 2001). Therefore, the
data gathered by the principal researcher and research assistants, in each setting were
compared, to ensure inter-rated reliability. After the pilot study, the principal researcher
held a one-hour meeting with the research assistants to reflect on the challenges that had
been encountered and to make alterations to the questionnaire where applicable.
Statistical Package for Social Sciences (SPSS) version 18 was used to evaluate the second
aspect of reliability is internal consistency that is degree which an items make up the
scale measure the same underlying construct thus Cronbach’s alpha coefficient was used
to measure internal consistency of reliability (Pallant, 2011; Bhattacherjee, 2012).
Cronbach’s Alpha is considered as an adequate index of the inter-item reliability of the
predictor and criterion variables (Sekaran , 2006) . Neuman, (2014) asserts that a value
of 0.70 or higher demonstrates that the instrument is reliable. This concurs with Boilen
et al. (2005), who proposed that an Alpha value above 90 percent indicates a very high
reliability of the scale; values between 75 and 90 percent indicate useful reliability while
values below 75 percent indicate weak reliability. Table 5 presents the results of the
reliability analysis derived from responses in the questionnaires.

74
Table 5: Reliability tests
Variable Measures
Cronbach’s
Alpha
Number
of items
Advertising
through Media
Online {Facebook, Google,
YouTube}
Offline {TV, Radio ,and
Newspaper}
Other
0.796 3
Consumer
Characteristics
Age
Gender
Level of education
0.813 3
Consumer
attitude
Online media on Awareness
Offline media on Awareness
Online channel on Liking
Offline channel on Liking
Online channel on Action
Offline channel on Action
0.823 6
Statistical interpretation : Cronbach’s Alpha>0.6 to 0.9 indicate high reliability of data construct
The results in Table 5 shows that Cronbach’s Alpha coefficient ranged between 0.796
(Advertising through Media) to 0.823 (consumer’s attitude). This indicate that the
measurement scales for variables of the instruments used in this study were sufficiently
reliable and statistically adequate to measure internal consistency. The reliability
coefficient for all the constructs used exceeded the 0.6 lower level of acceptability
recommended by Neuman (2014). The values were also above the 0.70 as according to
Pallant (2011) therefore reliable and acceptable for further analysis.
3.8 Data collection procedure
This study relied on primary data that was collected from the respondents using
questionnaires administered by the research assistants (Appendix II). The bank branches
of the commercial banks for this study were conveniently and randomly selected from
their distribution across the sub counties in Nairobi County, Kenya. See appendix III on
the branches that were involved in this study per sub-county in Nairobi County, Kenya.
Co-operative Bank of Kenya had one branch selected from each sub county, Kenya
Commercial Bank had also one branch selected from each sub-county; county plus two

75
additional branches selected randomly to make them nineteen. Equity Bank had 15
branches selected from each sub county. Where a bank did not have a branch in a
respective sub county, additional branches were selected randomly within Starehe Sub
County, which covers the Central Business District (CBD) of the county where most of
the bank branches were located. Research assistants who had been well briefed on the
study were released to the involved bank branches (two per bank). The research assistants
were conveniently stationed at the banking hall with the permission of the branch
administration. They administered the questionnaires using a random convenient method
to consumers found transacting at the banking hall of the selected commercial banks. The
research assistants were used in this study to distribute the research instrument to willing
participants and to ensure that they followed the instructions of the questionnaire. They
administered 7 to 8 questionnaires in one bank branch and as soon as they completed,
they moved to the other selected branches. Permission had already been obtained from
the bank administration with the support of Nacosti. The use of the student introduction
letter also facilitated access to the bank branches. See appendix VIII for Research
Authorization from Nacosti, appendix IX for Research Permit from Nacosti and appendix
I for the student introduction letter respectively.
3.9 Operationalization and measurement of variables
The independent variables in this study were advertising through online media and
advertising through offline media, whereas the dependent variable was the consumers’
attitude. Under online media channels, the research assessed Facebook, Google Ads and
YouTube; and in offline media, the channels assessed were TV, Radio and Newspaper.
In addition, age of the consumers was used as the moderating variable between the
relationships of advertising through media and consumers’ attitude. The
operationalization of variables is outlined in Table 6.

76
Table 6: Variables in the questionnaire
Variable Indicators Measurement Data
Instrument
Analysis
Method
Independent
Advertising
through Media
Online
Channels
Offline
Channels
Perception
Questionnaire
Regression
Analysis
Dependent
Consumers’
Attitude
Cognition
Affection
Behaviour
Awareness
Liking
Action
Perception
Questionnaire
Regression
Analysis
Moderating
Consumer’s
Age
Youthful
Mature
Old
Perception Questionnaire Regression
Analysis
3.10 Data analysis
Data analysis usually involves the editing and reduction of data into more convenient
portions so as to summarize, identify patterns and apply statistical approaches with the
sole purpose of interpreting data to answer the questions at hand (Blumberg et al.,
2011; Bhattacherjee, 2012). Data was captured and examined via statistical software
known as Statistical Package for Social Sciences (SPSS), version 18 and was presented
using frequencies, percentages, tables and bar charts. However, all of the questionnaires
were first accurately scrutinized in terms of correctness, consistency and completeness
in order to establish whether they should be incorporated in the statistical analysis. The
researcher used percentages, mean scores, standard deviation and coefficient of variation
to summarize and interpret collected data.
77
3.10.1 Descriptive analysis
The data collected from the sampled population was examined through descriptive
analysis methods, which are percentages, measures of central tendency like mean,
median and mode and measures of dispersion like range, standard deviation, quartile
deviation and variance among others. The results were presented in charts, graphs and
tables for ease of interpretation.
3.10.2 Inferential analysis
The researcher applied inferential statistics to establish the nature and magnitude of the
relationships between the variables, and to test the hypothesized relationships.
Standard multiple regression analysis was used to measure the predictive ability of
advertising through various media types, being independent variables on consumers’
attitude, and on one continuous dependent variable, as per the regression equation
(Bhattacherjee,2012) below:
𝑌 =(∑𝑦)(∑𝑥2) − (∑𝑥)(∑𝑥𝑦)
n(∑𝑥2) − (∑𝑥)2+ 𝑋 (
n(∑𝑥𝑦) − (∑𝑥)(∑𝑦)
n(∑𝑥2) − (∑𝑥)2)
where 𝑌 is the independent variable and 𝑋 the dependent variable, n = is the number of
elements; 𝑥 is the dependent variable; 𝑦 is the independent variable; ∑𝑥𝑦 is the sum
of the product of dependent and independent variable ; ∑𝑥 is the sum of dependent
variable, ∑𝑦 is the sum of independent variable scores; ∑𝑥2 is the sum of square
dependents variable. In the current study, multi-collinearity of the independent variables
we evaluated where deemed to exist highly correlated (𝑟 ≤ 0.9) independent variables
(Tabachnick & Fidell, 2007). Finally, age was considered as the moderating variable in
the correlation and regression analysis.
78
3.11 Sampling adequacy
The suitability of data analysis was determined using the Kaiser-Meyer-Olkin (KMO)
measure of sampling adequacy and the Bartlett’s Test of Sphericity. These two analyses
were conducted as per the study done by Williams et al., (2010). The KMO was
computed as follows:
𝐾𝑀𝑂 =∑ 𝑆𝑟𝑖𝑗
2
∑ 𝑆(𝑎𝑖𝑗2 − 𝑟𝑖𝑗
2), 𝑆 = (𝑖, 𝑗; 𝑖 ≠ 𝑗)
Where; 𝑟𝑖𝑗 is the correlation of variables i and j while 𝑎𝑖𝑗 is the anti-image correlation.
The KMO findings were interpreted according to the Kaiser, Meyer and Olkin measure
of sampling adequacy (Dzuban & Shirkey, 2014). The Bartlett’s Test of Sphericity was
used to examine the redundancy between the variables that are summarized with a small
number of factors (Yong & Pearce, 2013; Williams et al. 2010). The data was considered
suitable at significant value of p<.05 (Williams et al., 2010). The following is the
Bartlett’s Test of Sphericity formula:
Table 7: Kaiser-Meyer-Olkin (KMO) and Bartlett's test
Factor
KMO
Test
Bartlett's Test of Sphericity
Determinant
Approx. Chi-
Square
df Sig.
Advertising
through Media
channel
0.810 401.133 9 0.000 0.045
Consumer
characteristics 0.721 148.112 18 0.000 0.007
Consumer attitude 0.799 552.224 4 0.000 0.198
Note: KMO<0.05; Bartlett’s Test of Sphericity p < 0.05; determinant > 0 is acceptable
sampling adequacy.
According to Table 7 all the factors indicated a threshold above 0.7 (advertising through
media channel =0.810, consumer characteristics = 0.721 and consumer attitude =0.799)
implying that findings for this analysis were in tandem with the study conducted by
Williams et al. (2012) which established that KMO of 0.50 is suitable for sampling
adequacy with values above 0.5 being better. Likewise, the test for Bartlett's Test of
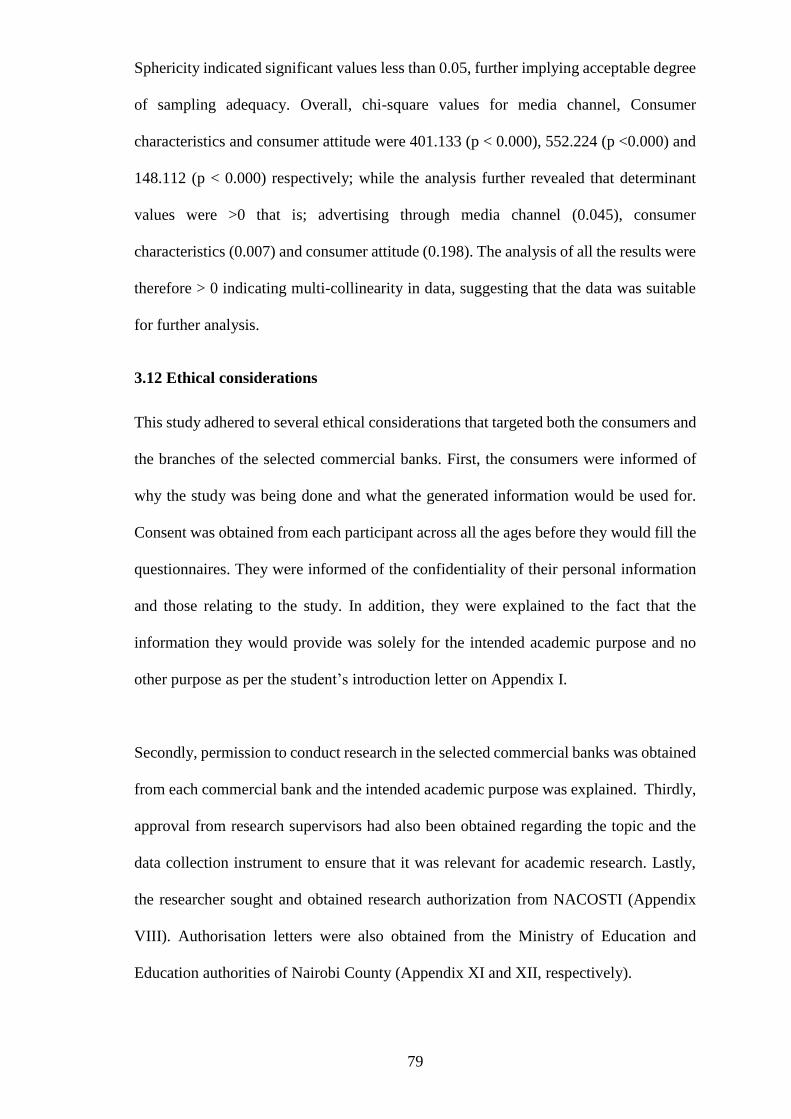
79
Sphericity indicated significant values less than 0.05, further implying acceptable degree
of sampling adequacy. Overall, chi-square values for media channel, Consumer
characteristics and consumer attitude were 401.133 (p < 0.000), 552.224 (p <0.000) and
148.112 (p < 0.000) respectively; while the analysis further revealed that determinant
values were >0 that is; advertising through media channel (0.045), consumer
characteristics (0.007) and consumer attitude (0.198). The analysis of all the results were
therefore > 0 indicating multi-collinearity in data, suggesting that the data was suitable
for further analysis.
3.12 Ethical considerations
This study adhered to several ethical considerations that targeted both the consumers and
the branches of the selected commercial banks. First, the consumers were informed of
why the study was being done and what the generated information would be used for.
Consent was obtained from each participant across all the ages before they would fill the
questionnaires. They were informed of the confidentiality of their personal information
and those relating to the study. In addition, they were explained to the fact that the
information they would provide was solely for the intended academic purpose and no
other purpose as per the student’s introduction letter on Appendix I.
Secondly, permission to conduct research in the selected commercial banks was obtained
from each commercial bank and the intended academic purpose was explained. Thirdly,
approval from research supervisors had also been obtained regarding the topic and the
data collection instrument to ensure that it was relevant for academic research. Lastly,
the researcher sought and obtained research authorization from NACOSTI (Appendix
VIII). Authorisation letters were also obtained from the Ministry of Education and
Education authorities of Nairobi County (Appendix XI and XII, respectively).
80
CHAPTER FOUR
DATA ANALYSIS, RESULTS AND DISCUSSION
4.1 Introduction
The main objective of this study was to assess the influence of advertising through media
on consumers’ attitude and to compare online and offline media channels as used by
selected commercial banks in Nairobi County, Kenya. It further sought to find out how
age as the moderating variable affected this relationship. In addition, the study sought to
establish the nature and magnitude of the relationships between these key variables and
to test the hypothesized associations. The chapter presents the results of the data analysis
and findings for the key objective and other associated objectives of the study. It starts
by addressing the socio-demographic characteristics which include respondents’ age and
level of education. The sections that follow provide descriptive and inferential statistics
of each of the specific objectives of the study. Data is mainly presented in tables.
Statistical Package for Social Sciences (SPSS) Version 18 programme was used to
analyse both descriptive and inferential statistics for this research. The seven hypotheses
of the study were tested using correlation and regression analysis. Lastly, the chapter
concludes with a summary of the various tests of hypotheses as outlined in the study. In
summary, this chapter presents data analysis and interpretation of the research findings.
4.2 Preliminary analysis
The overall overview of the consumer response rate and their demographic distribution
from selected commercial banks in Nairobi County were generated by means of basic
descriptive statistics, and findings are discussed in the sub-sections below.
81
4.2.1 Response rate
Evaluation of the response rate plays a critical role in qualitative research. Mugenda and
Mugenda (2008) asserted that a 50% response rate is adequate, 60% good and above 70%
was excellent. On the premise of this, this research sought to determine the general
response rate from a complete of 384 questionnaires administered to respondents from
Equity Bank, Kenya banking company, and Co-operative Bank of Kenya from selected
bank branches in Nairobi County. This study had an overall response rate of 98.67%
having recorded 99%, 98% and 99% response rate from Equity Bank, Kenya banking
company and Co-operative Bank of Kenya respectively. This indicates that almost all the
respondents completed the questionnaires, which in line with Mugenda and Mugenda
(2008) amounts to a superb response rate. This might have been as a result of the pilot
study conducted and the data collection procedures at various branches of selected
commercial banks in Nairobi County, Kenya.
4.3 Demographics
The study evaluated the demographic characteristics of the general respondents’ as
indicated in the questionnaire, which included age, gender and level of education. Age
was assessed particularly because it played a moderating effect on the relationship
between advertising through media channels and attitudes of consumers in the selected
commercial banks in Nairobi County, Kenya.
4.3.1 Respondents’ age
The study sought to establish the age distribution of the respondents among sampled
consumers from the three selected commercial banks in Nairobi County, Kenya.

82
Table 8: Respondents’ age distribution from the three selected banks
Bank Age Frequency Percentage
(%)
Equity bank
Below 29 years 39 30.5
30-49 71 55.5
50 years above 18 14.1
Total 128 100
KCB
Below 29 years 48 37.5
30-49 60 46.9
50 years above 20 15.6
Total 128 100
Co-operative
Bank of Kenya
Below 29 years 38 29.7
30-49 69 53.9
50 years above 21 16.4
Total 128 100
Table 8 shows that 71 (55.5%) of respondents from Equity bank were aged between 30
and 49 years, those below 29 years were 39 (30.5%), while those over 50 years were 18
(14.1%). Likewise, 60 (46.9%) respondents from KCB were between 30 and 49 years,
those below 29 years were 48 (37.5%), while 20 (15.6%) were aged 50 and above. For
the Co-operative Bank of Kenya, 69 (53.9%) of the respondents were between 30 and 49
years, those below 29 years were 38 (29.7%) and those above 50 years were 21 (16.4%).
This implies that the majority of the respondents holding accounts with the three selected
commercial banks were between 30-49 years old therefore this age cohort, could be relied
upon to make comprehensive conclusions about this study. The study also captured all
the categories of age in the study and this therefore confirmed that the objective of
assessing the moderating effect of age on advertising through media on consumers’
attitude would be achieved.
4.3.2 Respondents’ gender and level of education
Evaluation of respondents’ gender and level of education was part of the preliminary
questions in the data collection instrument. The findings are captured on Table 9 and
Table 10.
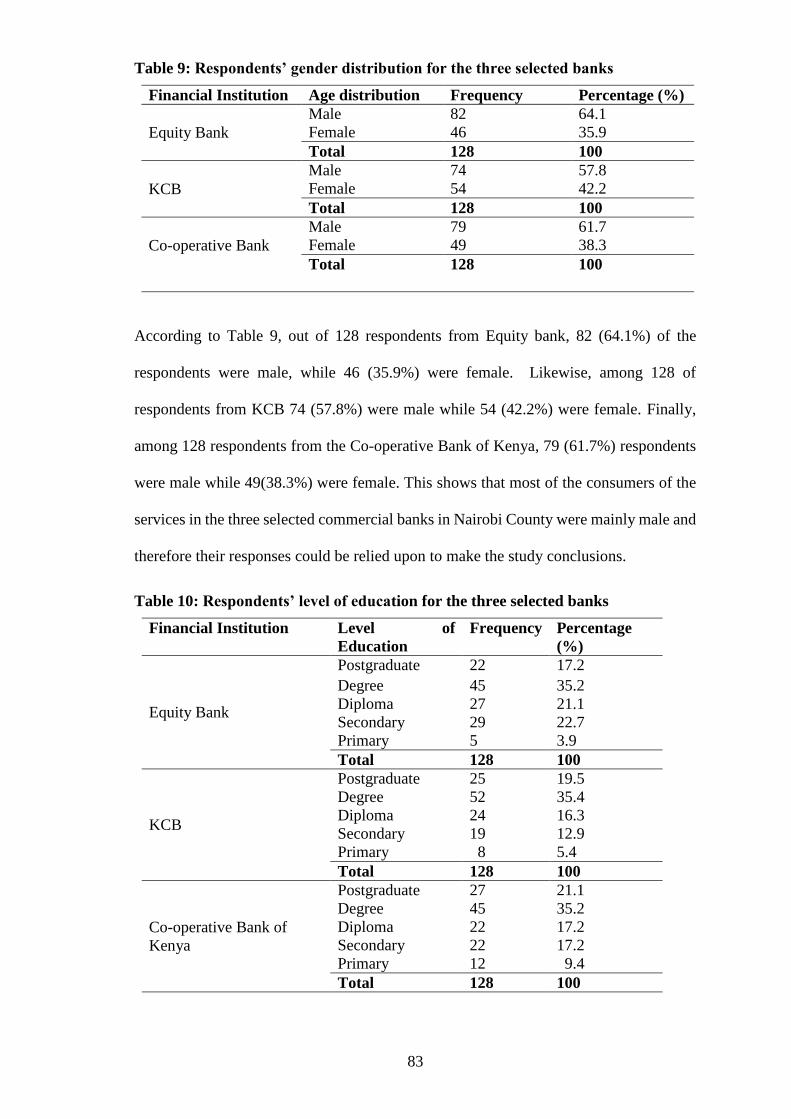
83
Table 9: Respondents’ gender distribution for the three selected banks
Financial Institution Age distribution Frequency Percentage (%)
Equity Bank
Male 82 64.1
Female 46 35.9
Total 128 100
KCB
Male 74 57.8
Female 54 42.2
Total 128 100
Co-operative Bank
Male 79 61.7
Female 49 38.3
Total 128 100
According to Table 9, out of 128 respondents from Equity bank, 82 (64.1%) of the
respondents were male, while 46 (35.9%) were female. Likewise, among 128 of
respondents from KCB 74 (57.8%) were male while 54 (42.2%) were female. Finally,
among 128 respondents from the Co-operative Bank of Kenya, 79 (61.7%) respondents
were male while 49(38.3%) were female. This shows that most of the consumers of the
services in the three selected commercial banks in Nairobi County were mainly male and
therefore their responses could be relied upon to make the study conclusions.
Table 10: Respondents’ level of education for the three selected banks
Financial Institution Level of
Education
Frequency Percentage
(%)
Equity Bank
Postgraduate 22 17.2
Degree 45 35.2
Diploma 27 21.1
Secondary 29 22.7
Primary 5 3.9
Total 128 100
KCB
Postgraduate 25 19.5
Degree 52 35.4
Diploma 24 16.3
Secondary 19 12.9
Primary 8 5.4
Total 128 100
Co-operative Bank of
Kenya
Postgraduate 27 21.1
Degree 45 35.2
Diploma 22 17.2
Secondary 22 17.2
Primary 12 9.4
Total 128 100

84
The results in Table 10 indicate that the respondents from Equity bank had a relatively
higher level of education, with 45 (35.2%), 27 (21.1%) and 29 (22.7%) holding university
first degree, college diploma and secondary certificates, respectively. Likewise,
52(35.4%), 27(21.1%) and 22(17.2%) respondents from KCB were holders of university
first degree, postgraduate and college diploma certificates, respectively. Additionally, 45
(35.2%), 25(19.5%) and 24 (16.3%) of the respondents from the Co-operative Bank of
Kenya were holders of university first degree, postgraduate and college diploma
certificates, respectively. This implies that the majority of the respondents had basic
knowledge to make sound decisions on the appropriate media channel through which to
access the bank advertisements hence their results could be relied upon to make the study
conclusions.
4.4 Consumer preference for media channels
The study evaluated the consumers’ preference for online and offline media channels
used by the selected commercial banks in Nairobi County, Kenya. Thus, the study
determined the mode of the respondents based on online or offline media channels
preference, and the summary of the results is presented in Table 11
Table 11: Preference for media channel by consumers from selected commercial
banks in Nairobi County
Commercial Bank Consumer Preference Frequency Percentage
(%)
Equity Bank
Offline advertising channels 70 54.7
Online advertising channels 32 25.0
Both online and offline 25 19.5
Other 1 0.8
Total 128 100
KCB
Offline advertising channels 33 25.8
Online advertising channels 78 60.9
Both online and offline 16 12.5
Other 1 0.8
Total 128 100
Co-operative Bank of
Kenya
Offline advertising channels 52 40.6
Online advertising channels 18 14.1
Both online and offline 56 43.8
Other 2 1.6
Total 128 100

85
The results in Table 11 reveal that an overwhelming majority of the respondents from
Equity Bank and Co-operative Bank of Kenya 70 (54.7%) and 52 (40.6%), respectively
mentioned that they preferred using offline media channels as opposed to online media
channels. This was in contrast with Kenya Commercial Bank where majority 78 (60.9%)
of the respondents mentioned that they preferred using online media channels. The
consumers who chose other as preferred media channel were less than 2%; making it not
significant for further analysis in this study. The results demonstrate that the channels
chosen for this study were the most popular media platforms used by the respondents in
the selected commercial banks.
4.4.1 Order of preference for the advertising channels
To ascertain specific media channels preferred by the respondents, the study computed
preference and ranking of the media channels by the respondents from the three selected
commercial banks in Nairobi County. The six media channels were ranked in order of preference
from the most preferred to the least preferred media channel. Table 12 presents the order of
ranking for the six media channels.

86
Table 12: Order of preference for the online and offline media channel used by
respondents
Preference and ranking of
Media Channels n
Computation
Method
Actual Score
(A)
Ideal Score
(n x 3) (B)
*Index
(A/B X100)
TV 124
K52x3=156 C47x2=94 E25x1=25
275 372 73.93
Radio 106
K42x3= 126 E42x2=84 C22x1= 22
232 318 72.96
Google Ads 116
E45x3=135 K42x2=84 C29x1=29
248 348 71.26
YouTube 124
k47x3=141 E46x2=92 C31x1=31
264 372 70.97
Facebook 82
C33x3=99 E26x2=52 k23x1=23
174 246 70.73
Newspaper 57
E22x1= 21 C20x2=40 K15x3=45
106 171 61.99
Grand total 609 - 1299 1827 71.10
* Index (A/B) >70 high preference; *Index (A/B) >60 intermediate preference:
*Index (A/B) <60 low preference E: Equity bank; K: Kenya Commercial Bank; C: Co-
operative bank of Kenya
The results in Table 12 revealed that TV had the highest score of 73.93%, indicating that
of the six evaluated media channels, TV was the most preferred media channel by the
respondents. TV was the most preferred advertising channel probably due to its visual
impact, affordability, and ease of access by the majority of the respondents. Other media
channels like Radio, Google Ads, YouTube, Facebook and Newspaper were ranked 2nd,
3rd, 4th, 5th and 6th position, respectively. The second preferred advertising channel by the
respondents was Radio, possibly due to its affordability by the majority of the urban
dwellers in Kenya as well as the availability of a wide range of vernacular stations.
Interestingly, Google Ads was ranked third, notably as the only online media channel
preferred by the respondents possibly because it is a popular search option hence well
87
perceived and readily accessed by respondents when seeking banking services inquiries
online. YouTube was ranked 4th, indicating that it was among the main source of
advertisements widely used by the three selected commercial banks in Nairobi County.
Though Facebook ranked fifth among the selected media channels, it is among the
popular media platforms, widely accessed by the majority of the respondents. At the
bottom in the preferred media channel ranking was Newspaper probably attributed to
cost, accessibility and time spent to read the newspaper by the respondents, this rendered
it less preferred media channel by the commercial bank consumers.
Nayak and Shah (2015) findings contrasted with results of this study, since they found
out that advertising through Newspaper was vital in brand awareness and most preferred
by advertisers in influencing consumer behaviour. A similar study was conducted by
Raju and Devi (2012) and found out that print advertisements were more trusted
compared to advertisements done through other channels. Sorce and Dewitz (2007) also
concurred with these scholars in the study that confirmed that the most effective media
channel for advertising was magazines compared to Television. In the same way,
Pongiannan and Chinnasamy, (2014) postulated that advertisers preferred print media as
an advertising channel compared to other platforms available for use. These contrasting
results from earlier research studies (where Newspaper was more preferred) are
attributed to the continuous change in the market place where Newspaper may be
relaying information that is already outdated and thus may not be relevant to the
audiences.
In summary, it can be deduced that consumers from the selected commercial banks in
Nairobi County, Kenya preferred offline media channels compared to online media
channels (save for Newspaper) given that the top two-offline media channels (TV and
Radio) were regarded as the most preferred platforms by the majority of the respondents

88
in this study. From the findings of this study, commercial banks may need to consider
offline media channels when communicating with their consumers, particularly on TV
and Radio channels.
4.5 Time spent on media channels
This study further sought to establish the time spent per media channel in order to
measure the liking aspect of attitude by the respondents from the three selected
commercial banks. In this case, the respondents were provided with statements regarding
the time spent on media channels in order of a five-point scale ranging from 1 to 5; where
1 = Strongly Disagree; 2 = Disagree; 3 = Neutral; 4 = Agree; 5= Strongly Agree. The
sub-constructs under time spent on media channels included: Facebook, YouTube,
Google Ads, TV, Radio and Newspaper. Each online and offline media channel was
rated in relation to the time spent by respondents. For analysis purpose, the study
computed the descriptive measures of the mean (to measure central tendency), standard
deviation (to measure the dispersion) and co-efficient of variation (to the normalized
measure of the dispersion of a probability distribution or frequency distribution for
comparing the degree of variation from one data series). According to Neuman (2014)
a CV ≤50% (0.5) is statistically acceptable for internal consistency on data variability.
Table 13 presents the results of the time spent on media channels by Equity Bank respondents.

89
Table 13: Time spent on media channels by Equity Bank respondents
Item description N Mean
score
SD CV (%)
Online
I spend most of my time on Facebook 67 3.36 1.055 31.40
I spend most of my time browsing on Google 72 3.45 1.190 34.49
I spend most of my time on YouTube 76 3.55 1.221 34.39
Average score 72 3.45 1.155 34.43
Offline
I spend most of my time watching TV 81 3.58 0.802 22.24
I spend most of my time reading Newspaper 50 2.70 1.657 61.37
I spend most of my time listening to Radio 55 3.02 1.343 44.47
Average score 62 3.10 1.267 42.69
Overall score 67 3.27
5
1.211 38.56
Note: High mean and low Coefficient of Variance (CV) values is the best score.
According to Table 13, Equity Bank had an overall mean score of 3.275 and an average
CV of 38.56%. The attribute of time spent watching TV had the highest mean score
(mean=3.58, SD=0.802, CV=22.24%). The lowest score was reported on time spent on
reading newspapers (mean=2.70, SD=1.657, CV=61.37%). This analysis showed that the
CV ranged between 61.37% (highest) and 22.24 % (lowest); Newspaper and Facebook
were rated relatively poor as far as time spent on media channels was concerned for
offline and online respectively. This implies that consumers in Equity Bank prefer
spending time watching TV and YouTube as well as listening to Radio.
Table 14: Time spent on media channels by KCB Bank respondents
Item description N Means
score
SD CV
Online
I spend most of my time on Facebook 66 3.37 0.995 29.52
I spend most of my time browsing on Google
Ads
77 3.61 1.103 30.55
I spend most of my time on YouTube 77 3.59 1.187 33.06
Average score 73 3.523 1.095 31.04
Offline
I spend most of my time watching TV 47 2.79 1.332 47.74
I spend most of my time reading Newspapers 55 2.80 1.667 59.53
I spend most of my time listening to Radio 77 3.59 1.187 33.06
Average score 59 3.06 1.395 46.78
Overall score 66 3.292 1.245 34.86
Note: High mean and low Coefficient of Variance (CV) values is the best score.
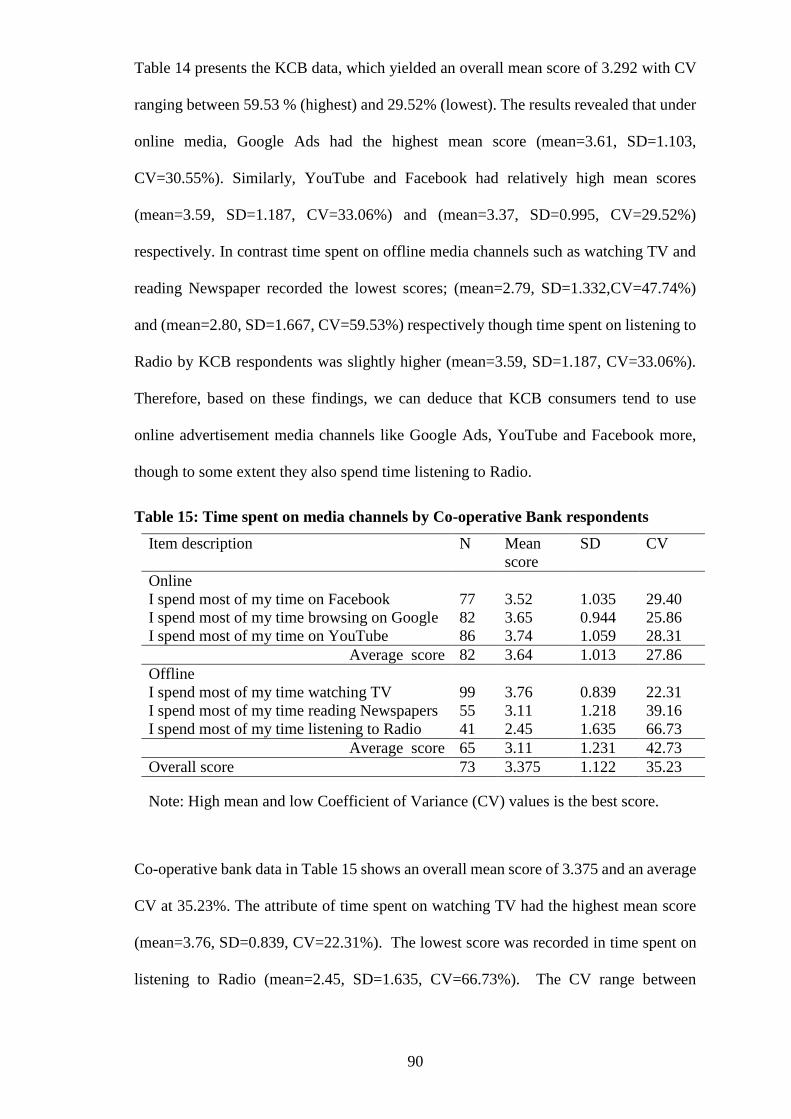
90
Table 14 presents the KCB data, which yielded an overall mean score of 3.292 with CV
ranging between 59.53 % (highest) and 29.52% (lowest). The results revealed that under
online media, Google Ads had the highest mean score (mean=3.61, SD=1.103,
CV=30.55%). Similarly, YouTube and Facebook had relatively high mean scores
(mean=3.59, SD=1.187, CV=33.06%) and (mean=3.37, SD=0.995, CV=29.52%)
respectively. In contrast time spent on offline media channels such as watching TV and
reading Newspaper recorded the lowest scores; (mean=2.79, SD=1.332,CV=47.74%)
and (mean=2.80, SD=1.667, CV=59.53%) respectively though time spent on listening to
Radio by KCB respondents was slightly higher (mean=3.59, SD=1.187, CV=33.06%).
Therefore, based on these findings, we can deduce that KCB consumers tend to use
online advertisement media channels like Google Ads, YouTube and Facebook more,
though to some extent they also spend time listening to Radio.
Table 15: Time spent on media channels by Co-operative Bank respondents
Item description N Mean
score
SD CV
Online
I spend most of my time on Facebook 77 3.52 1.035 29.40
I spend most of my time browsing on Google 82 3.65 0.944 25.86
I spend most of my time on YouTube 86 3.74 1.059 28.31
Average score 82 3.64 1.013 27.86
Offline
I spend most of my time watching TV 99 3.76 0.839 22.31
I spend most of my time reading Newspapers 55 3.11 1.218 39.16
I spend most of my time listening to Radio 41 2.45 1.635 66.73
Average score 65 3.11 1.231 42.73
Overall score 73 3.375 1.122 35.23
Note: High mean and low Coefficient of Variance (CV) values is the best score.
Co-operative bank data in Table 15 shows an overall mean score of 3.375 and an average
CV at 35.23%. The attribute of time spent on watching TV had the highest mean score
(mean=3.76, SD=0.839, CV=22.31%). The lowest score was recorded in time spent on
listening to Radio (mean=2.45, SD=1.635, CV=66.73%). The CV range between
91
66.73% (highest) and 22.31% (lowest) was recorded; all in offline media. Likewise, time
spent on reading Newspapers and listening to Radio were rated relatively poor. Online
media ratings were almost the same, with YouTube leading the pack. In conclusion, Co-
operative Bank consumers according to these results prefer spending time watching TV
and YouTube, meaning they prefer visual channels.
Generally, the results on time spend on media channel indicate that consumers in Equity
Bank spend more time watching Television and YouTube media channels; the ones in
Kenya Commercial Bank of Kenya spend their time more on Google Ad, YouTube and
Listening to Radio whereas Co-operative Bank consumers spend more time watching
Television and YouTube and also listening to Radio. The liking sub construct of
consumer attitude is displayed here in visual channels of Television and YouTube. These
findings concur with a study done by Snelson (2011), where he mentioned that
consumers like interacting with moving images found on Television and YouTube. He
affirmed that the launch of YouTube in 2005 made consumers to have an additional
channel that can provide moving image interaction. This also concurs with a study done
by the European Trade Association for Marketers of Advertising (EGTA) in 2018 where
they confirmed that in 2018, Television remained the most used visual channel more than
YouTube in European countries. The study revealed that this was true especially when
the consumption time between the two channels was compared; where 71% of total video
time was spent in Television compared to 6.4% spent on YouTube across all age groups.
According to Trendera, 2017, he argued that there was a gradual change in video time
spent in which American teenagers spend 34% of their total video time watching
YouTube.
As much as these results indicate the liking by consumers for moving visual channels of
Television and YouTube, there is also a need to check the simultaneous viewing. A study

92
done by O’Barr (2010) indicated that there was multiple use of channels by consumers
and he gave an example of consumers who watch TV and YouTube channels
simultaneously. This increased multiple use of channels has affected advertising and thus
marketers are required to constantly keep in touch with consumers to continuously
monitor consumer behaviour in media usage in order to align advertising channel to use
for shaping consumers’ attitude favourably.
Similar research work done by eMarketer (2020) in the United Kingdom (UK) showed
that the growth in time spent with digital media platforms had reduced and that it may
stagnate in the years to come. It argued that the growth that remains will be fuelled by an
increase in time spent with smartphones and other devices including connected
Television and Radio. The study confirmed that adults in the UK used their smartphones
(excluding voice calls) for 2:16 per day, on average in 2019. It confirmed that
Smartphones will continue to gain an increasing share of time spent with total media,
surpassing 25% by 2021.
4.6 Attention on advertisements done through media channels.
This study also sought to establish the attention that consumers had on advertisements
done through media channels in order to measure the likelihood of the banks reaching
them with their adverts based on the channel used. The respondents were provided with
statements regarding whether their bank would likely reach them if they advertised
through the various selected media channels in the study. This used five-point scale
ranging from 1 to 5; where 1 = Strongly Disagree; 2 = Disagree; 3 = Neutral; 4 = Agree;
5= Strongly Agree. The sub-constructs under attention to the advertisement done through
the media channel included Facebook, Google Ads, YouTube, TV, Radio and
Newspaper. Each online and offline media channel was rated in relation to whether they
would likely be reached by their specific bank if they advertised through the channel.

93
The study computed descriptive measures for analysis purposes such as mean (to
measure central tendency), standard deviation (to measure the dispersion) and co-
efficient of variation (to a normalized measure of dispersion of a probability distribution
or frequency distribution for comparing the degree of variation from one data series).
Note that according to Neuman (2014) a CV ≤50% (0.5) is statistically acceptable for
internal consistency on data variability. Table 16 presents results of attention on
advertisements done through media channels by Equity Bank respondents.
Table 16: Attention to advertisements done through media channels by Equity
Bank respondents
Item description N Mean
score
SD CV
Online
My bank would likely reach me if they use
Facebook in their advertisements
62 3.16 1.258 39.81
My bank would likely reach me if they use
Google Ads in their advertisements
32 2.41 1.295 53.73
My bank would likely reach me if they use
YouTube in their advertisements
78 3.40 0.983 28.91
Average score 57.33 2.99 1.179 40.82
Offline
My bank would likely reach me if they use
TV in their advertisements
74 3.59 1.239 34.51
My bank would likely reach me if they use
Newspaper in their advertisements
39 2.84 1.142 40.21
My bank would likely reach me if they use
Radio in their advertisements
65 3.33 1.191 35.77
Average score 58 3.25 1.191 36.83
Overall score 58 3.122 1.185 38.82
Note: High mean and low Coefficient of Variance (CV) values is the best score.
The results in Table 16 depicts the mean score for the six statements used with regard to
attention to advertisement done through online and offline media channels by Equity
Bank respondents. It shows that Equity had an overall mean score of 3.122 with CV at
38.82%. The statement that my bank would likely reach me if they use TV in their
advertisements had the highest score (mean=3.59, SD =1.239, CV=34.51%). The
statement that my bank would likely reach me if they use Newspaper in their

94
advertisements had the lowest score (mean=2.84, SD =1.142, CV=40.21%) in offline
channels. The results also reveal that the respondents were of the view that the bank
would likely reach them if they use Google Ads in their advertisements with this attribute
recording the lowest score among all channels with an agreement scale (mean=2.41,
SD=1.295, CV=53.73%). Facebook and YouTube were rated equally high with mean
scores above 3 each, hence consumers could still be reached, if Equity Bank used
YouTube and Facebook online media platforms in their advertising.
Table 17: Attention on advertisements done through media channels by KCB
Bank respondents
Item description N Mean
score
SD CV
Online
My bank would likely reach me if they use Facebook
in their advertisements
63 3.13 1.257 40.16
My bank would likely reach me if they use Google
Ads in their advertisements
30 2.48 1.328 53.55
My bank would likely reach me if they use YouTube
in their advertisements
56 3.16 1.056 33.42
Average score 50 2.92 1.214 42.38
Offline
My bank would likely reach me if they use TV in
their advertisements
68 3.51 1.304 37.15
My bank would likely reach me if they use
Newspaper in their advertisements
33 2.62 1.204 45.95
My bank would likely reach me if they use Radio in
their advertisements
58 3.32 1.216 36.63
Average score 53 3.15 1.241 39.91
Overall score 51 3.037 1.228 41.14
Note: High mean and low Coefficient of Variance (CV) values is the best score.
Table 17 presents the mean score for the six statements used with respect of attention on
advertisement done through online and offline media channels by KCB with an overall
mean score of 3.037 with CV at 41.14 %. The statement that my bank would likely reach
me if they use TV in their advertisements had the highest score (mean=3.51, SD =1.304,
CV=37.15%). The statement that my bank would likely reach me if they use Google Ads
in their advertisements had the lowest score (mean=2.48, SD =1.328, CV=53.55%). The
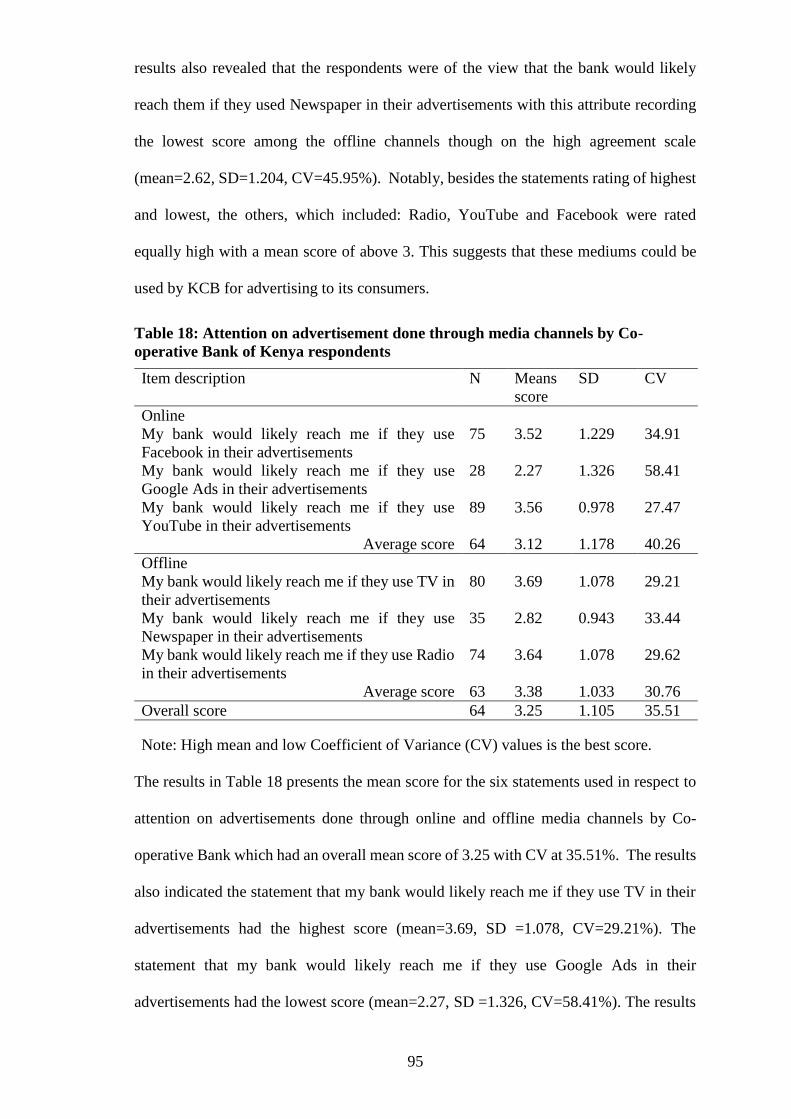
95
results also revealed that the respondents were of the view that the bank would likely
reach them if they used Newspaper in their advertisements with this attribute recording
the lowest score among the offline channels though on the high agreement scale
(mean=2.62, SD=1.204, CV=45.95%). Notably, besides the statements rating of highest
and lowest, the others, which included: Radio, YouTube and Facebook were rated
equally high with a mean score of above 3. This suggests that these mediums could be
used by KCB for advertising to its consumers.
Table 18: Attention on advertisement done through media channels by Co-
operative Bank of Kenya respondents
Item description N Means
score
SD CV
Online
My bank would likely reach me if they use
Facebook in their advertisements
75 3.52 1.229 34.91
My bank would likely reach me if they use
Google Ads in their advertisements
28 2.27 1.326 58.41
My bank would likely reach me if they use
YouTube in their advertisements
89 3.56 0.978 27.47
Average score 64 3.12 1.178 40.26
Offline
My bank would likely reach me if they use TV in
their advertisements
80 3.69 1.078 29.21
My bank would likely reach me if they use
Newspaper in their advertisements
35 2.82 0.943 33.44
My bank would likely reach me if they use Radio
in their advertisements
74 3.64 1.078 29.62
Average score 63 3.38 1.033 30.76
Overall score 64 3.25 1.105 35.51
Note: High mean and low Coefficient of Variance (CV) values is the best score.
The results in Table 18 presents the mean score for the six statements used in respect to
attention on advertisements done through online and offline media channels by Co-
operative Bank which had an overall mean score of 3.25 with CV at 35.51%. The results
also indicated the statement that my bank would likely reach me if they use TV in their
advertisements had the highest score (mean=3.69, SD =1.078, CV=29.21%). The
statement that my bank would likely reach me if they use Google Ads in their
advertisements had the lowest score (mean=2.27, SD =1.326, CV=58.41%). The results

96
also revealed that the respondents were of the view that the bank would likely reach them
if they use Newspaper in their advertisements with this attribute recording the lowest
score among offline channels though on the high agreement scale (mean=2.82,
SD=0.943, CV=33.44%). Notable however is that besides the statements rated highest
and lowest, the others, which included: YouTube, Facebook and Radio were rated
equally high with a mean score above 3. This suggests that the Co-operative Bank of
Kenya could still use these mediums to advertise through in order to reach its consumers.
Generally, results for this indicate that advertising through Television, YouTube and
Facebook would enable the consumers notice the bank communication. The lowest
attention would be received if the bank advertised through Newspaper. This concurs with
a study done by Hilde et al. (2018), who reported that most consumers got exposed to
advertising on Facebook. However in his study, he found out that advertisements were
evaluated negatively mostly on YouTube followed closely by Facebook compared to
other social media channels. He posited that the online media platforms may have many
differences; however the most outstanding one was the negative emotions related to the
platforms. He indicated that 30% of the stated moments, consumers reported that they
were confronted with a product, brand or company message. The findings further
indicated that nearly 30% of respondents were irritated or felt confused by the advertising
on YouTube, and over 20% had similar feelings with advertisements on Facebook. This
negative rating of advertisements in these channels could be attributed to the level of
attention that is required for moving images in the platforms and an interruption to the
movement is considered to be offensive. These negative emotions associated with
advertising through online platforms of YouTube and Facebook could eventually affect
the attention that consumers will place on advertisements done through these channels.
Consumers therefore may eventually obtain gadgets that can totally block advertisements

97
in their personal online channels, therefore impacting the communication industry as a
whole.
4.7 Understanding advertisements done through media channels
In this study, the respondents were further required to rate statements concerning
understanding advertisements done through Media channels by their respective
commercial banks. The statements were anchored on a five-point scale ranging from 1
to 5 where 1 = Strongly Disagree; 2 = Disagree; 3 = Neutral;4 = Agree; 5= Strongly
Agree. The sub-constructs under these statements were: Facebook, Google Ads,
YouTube, TV, Radio and Newspaper. Each online and offline media channels was rated
in relation to consumer understanding of adverts done through the channel. The study
computed descriptive measures for analysis purposes such as mean (to measure central
tendency), standard deviation (to measure the dispersion) and coefficient of variation (to
a normalized measure of a dispersion of a probability distribution or frequency
distribution for comparing the degree of variation from one data series). Note that
according to Neuman (2014) a CV ≤50% (0.5) is statistically acceptable for internal
consistency of data variability. Table 19 presents results of understanding advertisements
done through media channels by Equity Bank respondents.
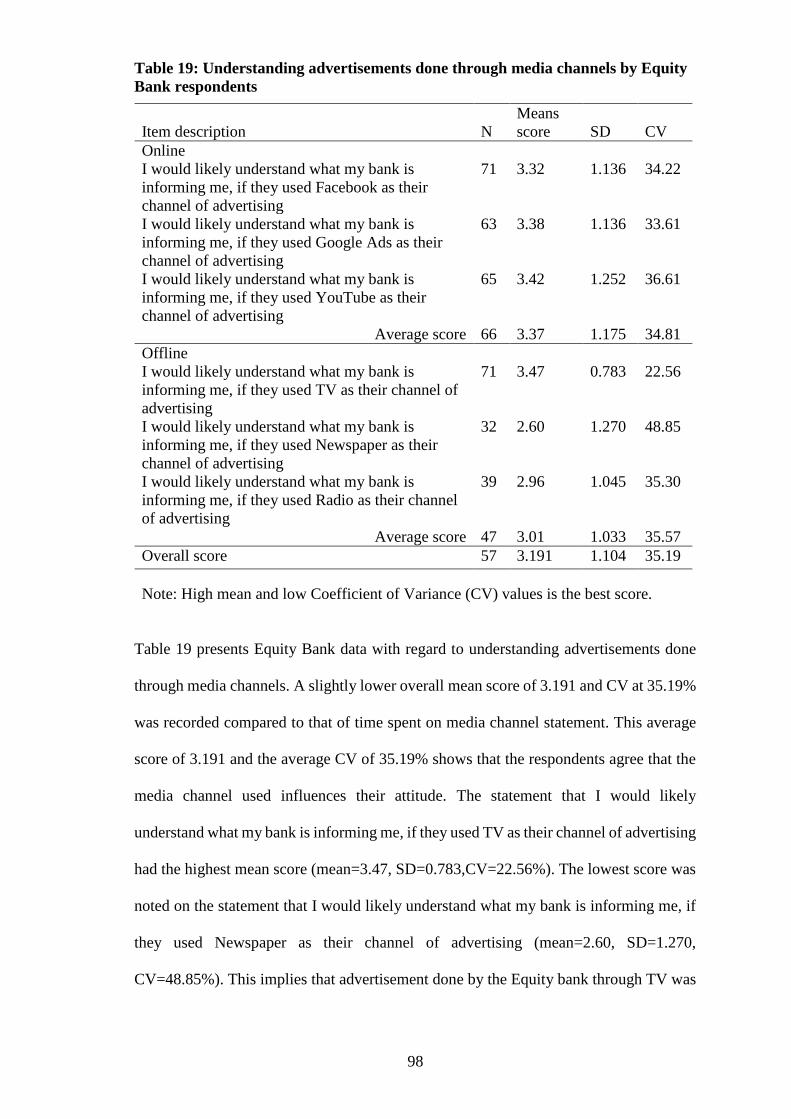
98
Table 19: Understanding advertisements done through media channels by Equity
Bank respondents
Item description N
Means
score SD CV
Online
I would likely understand what my bank is
informing me, if they used Facebook as their
channel of advertising
71 3.32 1.136 34.22
I would likely understand what my bank is
informing me, if they used Google Ads as their
channel of advertising
63 3.38 1.136 33.61
I would likely understand what my bank is
informing me, if they used YouTube as their
channel of advertising
65 3.42 1.252 36.61
Average score 66 3.37 1.175 34.81
Offline
I would likely understand what my bank is
informing me, if they used TV as their channel of
advertising
71 3.47 0.783 22.56
I would likely understand what my bank is
informing me, if they used Newspaper as their
channel of advertising
32 2.60 1.270 48.85
I would likely understand what my bank is
informing me, if they used Radio as their channel
of advertising
39 2.96 1.045 35.30
Average score 47 3.01 1.033 35.57
Overall score 57 3.191 1.104 35.19
Note: High mean and low Coefficient of Variance (CV) values is the best score.
Table 19 presents Equity Bank data with regard to understanding advertisements done
through media channels. A slightly lower overall mean score of 3.191 and CV at 35.19%
was recorded compared to that of time spent on media channel statement. This average
score of 3.191 and the average CV of 35.19% shows that the respondents agree that the
media channel used influences their attitude. The statement that I would likely
understand what my bank is informing me, if they used TV as their channel of advertising
had the highest mean score (mean=3.47, SD=0.783,CV=22.56%). The lowest score was
noted on the statement that I would likely understand what my bank is informing me, if
they used Newspaper as their channel of advertising (mean=2.60, SD=1.270,
CV=48.85%). This implies that advertisement done by the Equity bank through TV was
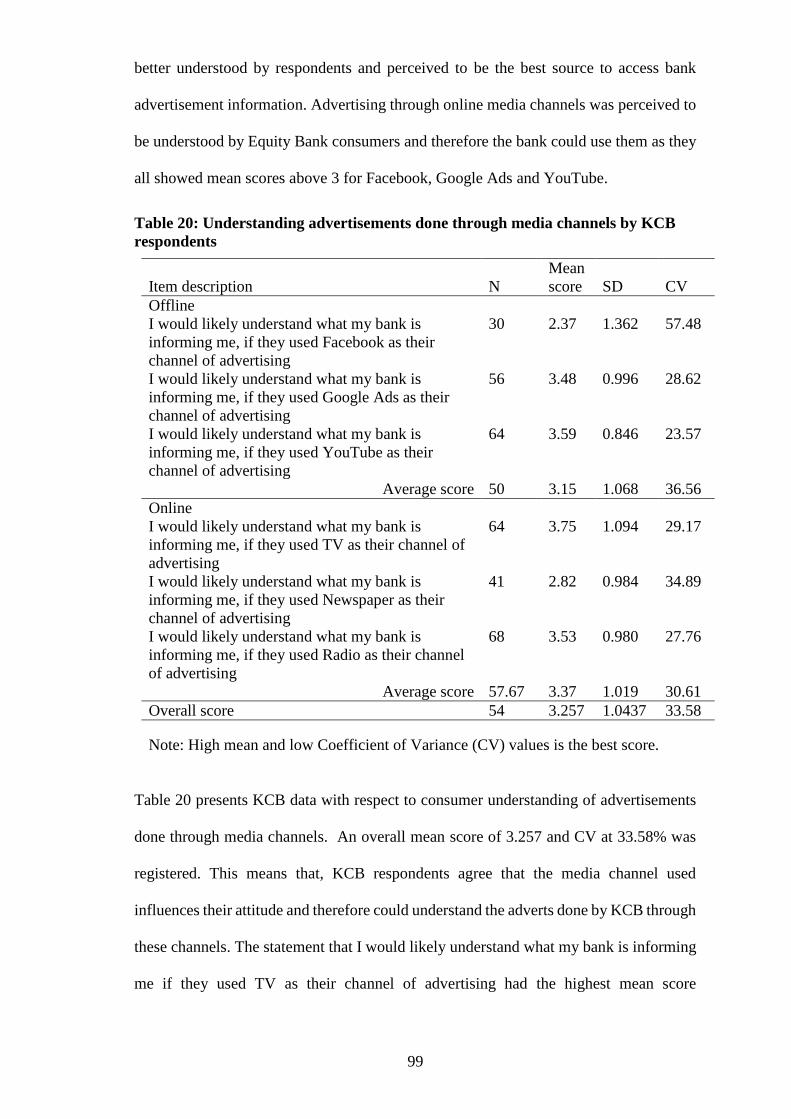
99
better understood by respondents and perceived to be the best source to access bank
advertisement information. Advertising through online media channels was perceived to
be understood by Equity Bank consumers and therefore the bank could use them as they
all showed mean scores above 3 for Facebook, Google Ads and YouTube.
Table 20: Understanding advertisements done through media channels by KCB
respondents
Item description N
Mean
score SD CV
Offline
I would likely understand what my bank is
informing me, if they used Facebook as their
channel of advertising
30 2.37 1.362 57.48
I would likely understand what my bank is
informing me, if they used Google Ads as their
channel of advertising
56 3.48 0.996 28.62
I would likely understand what my bank is
informing me, if they used YouTube as their
channel of advertising
64 3.59 0.846 23.57
Average score 50 3.15 1.068 36.56
Online
I would likely understand what my bank is
informing me, if they used TV as their channel of
advertising
64 3.75 1.094 29.17
I would likely understand what my bank is
informing me, if they used Newspaper as their
channel of advertising
41 2.82 0.984 34.89
I would likely understand what my bank is
informing me, if they used Radio as their channel
of advertising
68 3.53 0.980 27.76
Average score 57.67 3.37 1.019 30.61
Overall score 54 3.257 1.0437 33.58
Note: High mean and low Coefficient of Variance (CV) values is the best score.
Table 20 presents KCB data with respect to consumer understanding of advertisements
done through media channels. An overall mean score of 3.257 and CV at 33.58% was
registered. This means that, KCB respondents agree that the media channel used
influences their attitude and therefore could understand the adverts done by KCB through
these channels. The statement that I would likely understand what my bank is informing
me if they used TV as their channel of advertising had the highest mean score

100
(mean=3.75, SD=1.094,CV=29.17%). The lowest score was noted on the statement that
I would likely understand what my bank is informing me, if they used Facebook as their
channel of advertising (mean=2.37, SD=1.362, CV=57.48%). This implies that TV is
most perceived by KCB consumers to be the best channel that they can understand
advertisements from their bank. YouTube, Radio and Google Ads in that order were also
perceived to be media channels through which consumers can easily understand the bank
adverts given that they all scored mean scores above 3. KCB therefore could use the said
channels to reach out to their consumers.
Table 21: Understanding advertisements done through media channel by Co-
operative Bank respondents
Item description N
Means
score SD CV
Online
I would likely understand what my bank is informing
me, if they used Facebook as their channel of
advertising
32 2.30 1.162 50.52
I would likely understand what my bank is informing
me, if they used Google Ads as their channel of
advertising
63 3.42 0.796 23.75
I would likely understand what my bank is informing
me, if they used YouTube as their channel of
advertising
82 3.50 0.946 27.03
Average score 59 3.07 0.968 33.77
Offline
I would likely understand what my bank is informing
me, if they used TV as their channel of advertising
80 3.75 1.194 31.84
I would likely understand what my bank is informing
me, if they used Newspaper as their channel of
advertising
34 2.90 0.784 27.03
I would likely understand what my bank is informing
me, if they used Radio as their channel of advertising
79 3.43 0.880 25.66
Average score 64 3.36 0.953 28.18
Overall score 62 3.215 0.961 30.98
Note: High mean and low Coefficient of Variance (CV) values is the best score.
Results in Table 21 show Co-operative Bank of Kenya respondents’ data on
understanding advertisements done through media channels with an overall mean score
of 3.215 and CV of 30.98%. This suggests that the respondents of Co-op Bank agree that

101
the media channel used influences their attitude. Again, the statement that I would likely
understand what my bank is informing me, if they used TV as their channel of advertising
had the highest mean score (mean=3.75, SD=1.194, CV=31.84%). Likewise, to Co-
operative Bank of Kenya the lowest score was noted on the statement that I would likely
understand what my bank is informing me, if they used Facebook as their channel of
advertising (mean=2.30, SD=1.162, CV=50.52%). Like Equity bank and KCB, Co-
operative Bank of Kenya, consumers also perceived TV as the best media channel to
understand bank adverts and therefore bank information. YouTube, Radio and Google
Ads followed in that order and therefore meaning Co-operative Bank of Kenya could
choose these channels to advertise through in order to influence their consumers’ attitude.
Overall, the understanding aspect of the advertisements done through various media
channels indicate a slightly different trend where in addition to Television and YouTube
scoring high, Radio also scored the best medium that can drive understanding of
advertisements by consumers of Kenya Commercial Bank and Co-operative Bank of
Kenya. Google ad also emerged as the best channel to use for shaping understanding of
the advert. Radio could have done well because of the elaborative aspect of the channel
that is usually carried very well by the presenters who are sometimes opinion leaders in
a community. Google ad featured in the responses of all respondents of the banks as a
channel that can shape understanding of the ad. This could be attributed to other support
channels where if one wanted more details of the communication, they would click it and
be taken to the respective bank websites for additional details.
The study concurs with the research by Lagrosen (2005) who posited that corporate
websites boosted the understanding of the Google Ad messages. He explained that the
corporate websites allowed content to be continuously renewed regularly based on the

102
advertising campaign and thus would encourage repeat visitors. He confirmed that
advertising through Newspaper was based on time and therefore its messages expired
immediately. Radio also featured as the platform that could be used to shape the
understanding of the advertisements done by the bank. A study done by Bronner et al.
(2006), postulated that Radio continued to be a significant and powerful communication
channel as it was in the past centuries notwithstanding the development of more
fashionable media like online channels of Facebook, Google Ad and YouTube among
others. This may explain the high score of understanding advertisements done through
Radio across all the respondents in all the banks in this study. According to Kramer et al.
(2015), new technologies, may sometimes add things on, but may not substitute and
therefore some platforms like Radio for example reinvented itself in the context of
changes in the communication landscape. He argued that Radio achieved relevance
despite the changing environment through direct engagement with listeners and
introduction of reward winning programmes that keep audiences active and therefore
able to shape understanding of the advertisements done through it by organisations.
4.8 Influence of advertising through media channels on consumers’ attitude
The current study evaluated the influence of advertising through media channels on
consumers’ attitude (awareness, liking and action) and compared online and offline
media channels used by the selected commercial banks (Equity Bank, KCB and Co-
operative Bank of Kenya) in Nairobi County. Research respondents were asked to
indicate the extent to which one agreed or disagreed with statements regarding their
attitude as a result of their respective banks advertising through online or offline channels
on a scale of 1 to 5; where 1 = Strongly Disagree; 2 = Disagree;3 = Neutral;4 = Agree;
5= Strongly Agree. The results of which are discussed below.

103
4.8.1 Advertising through online media on consumers’ attitude (awareness)
The study sought to find out if consumers of the selected commercial banks were aware
that their banks were advertising through various online media channels. The findings of
which are discussed in the sub-sections below for each of the selected commercial banks.
Table 22: Advertising through online media by Equity Bank on consumers’
attitude (awareness)
Item description N Mean
score
SD CV
I am aware that my bank advertises through Facebook 76 3.43 1.092 31.84
I am aware that my bank advertises through Google
Ads
69 3.52 1.079 30.65
I am aware that my bank advertises through YouTube 64 3.42 1.259 36.81
Average score 70 3.457 1.143 33.1
Note: High mean and low Coefficient of Variance (CV) values is the best score.
The results in Table 22 suggest that Equity Bank respondents, on average, are aware of
advertisements done through online channels, with an overall mean score of 3.457 and
an average CV of 33.1%. The highest CV registered was 36.81% (YouTube) while the
lowest was 30.65% (Google Ads). The statement I am aware that my bank advertises
through Google Ads had the highest mean score (mean=3.52, SD=1.079, CV=30.65%).
The statement that I am aware that my bank advertises through Facebook had a relatively
high mean score (mean=3.42, SD=1.259, CV=36.81%); with the statement, I am aware
that my bank advertises through YouTube having the lowest mean score (mean=3.42,
SD=1.259, CV=36.81%). This implies that Equity Bank consumers are aware that the
bank advertises in Google Ads, Facebook and YouTube in that order.

104
Table 23: Advertising through online media by KCB on consumers’ attitude
(awareness)
Item description N Means
score
SD CV
I am aware that my bank advertises through
79 3.55 1.034 29.13
I am aware that my bank advertises through Google
Ads
70 3.51 1.035 29.49
I am aware that my bank advertises through
YouTube
65 3.43 1.234 35.98
Average score 71 3.50 1.101 31.53
Note: High mean and low Coefficient of Variance (CV) values is the best score.
The results in Table 23 suggest that KCB respondents on average are aware of
advertisements done through online channels, with an overall mean score of 3.50 and an
average CV of 31.53%. The highest CV registered was 35.98% (YouTube) while the
lowest was 29.13% (Google Ads). The statement that I am aware that my bank advertises
through Facebook had the highest mean score (mean=3.55, SD=1.034, CV=29.13%).
The statement that I am aware that my bank advertises through Google Ads had a
relatively high mean score (mean=3.51, SD=1.035, CV=29.49%) with the statement that
I am aware that my bank advertises through YouTube having the lowest mean score
(mean=3.43, SD=1.234, CV=35.98%). Findings also implied that as much as KCB
consumers prefer online media channels; their consumers perceive high awareness on
advertisements done through Facebook and Google Ads. It also suggests that in order to
gain higher awareness, KCB could consider using Facebook and Google Ads,
respectively, for its bank communication.

105
Table 24: Advertising through online media by Co-operative Bank of Kenya on
consumers’ attitude (awareness)
Item description N Means
score
SD CV
I am aware that my bank advertises through Facebook 68 3.70 1.024 27.68
I am aware that my bank advertises through Google Ads 80 3.66 1.029 28.11
I am aware that my bank advertises through YouTube 82 3.84 1.090 28.39
Average score 77 3.73 1.048 28.10
Note: High mean and low Coefficient of Variance (CV) values is the best score.
Table 24 shows that the Co-operative Bank of Kenya respondents on average indicated
to be aware that their bank advertises through online media channels with an overall
mean score of 3.73 and an average CV of 28.10 %. The highest CV registered was
28.39% (YouTube) while the lowest was 27.68% (Facebook). The statement that I am
aware that my bank advertises through YouTube had the highest mean score (mean=3.84,
SD=1.090, CV=28.39%). The statement that I am aware that my bank advertises through
Facebook had a relatively high mean score (mean=3.70, SD=1.024, CV=27.68%) with
the statement that I am aware that my bank advertises through Google Ads having the
lowest mean score (mean=3.66, SD=1.029, CV=28.11%). These findings imply that
advertising through YouTube and Facebook receives high awareness among the Co-
operative Bank of Kenya consumers; Google Ads also receive high awareness. This
could mean that high awareness levels could be achieved through online channels.
Overall, the study shows that consumers were strongly aware of advertisements done by
the bank through Facebook and Google Ads. This study concurs with the findings of
Priyanka (2012) that advertising through online channels like Facebook strongly
influences awareness but moderately influences action sub constructs of attitude.
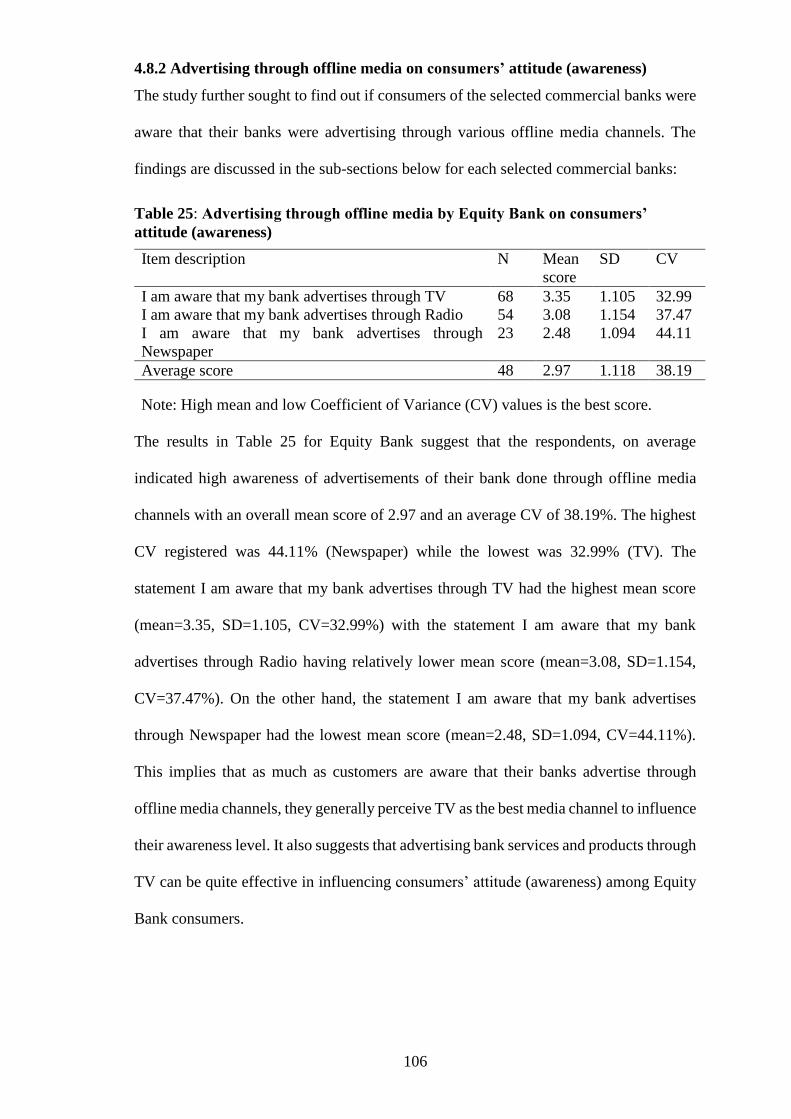
106
4.8.2 Advertising through offline media on consumers’ attitude (awareness)
The study further sought to find out if consumers of the selected commercial banks were
aware that their banks were advertising through various offline media channels. The
findings are discussed in the sub-sections below for each selected commercial banks:
Table 25: Advertising through offline media by Equity Bank on consumers’
attitude (awareness)
Item description N Mean
score
SD CV
I am aware that my bank advertises through TV 68 3.35 1.105 32.99
I am aware that my bank advertises through Radio 54 3.08 1.154 37.47
I am aware that my bank advertises through
Newspaper
23 2.48 1.094 44.11
Average score 48 2.97 1.118 38.19
Note: High mean and low Coefficient of Variance (CV) values is the best score.
The results in Table 25 for Equity Bank suggest that the respondents, on average
indicated high awareness of advertisements of their bank done through offline media
channels with an overall mean score of 2.97 and an average CV of 38.19%. The highest
CV registered was 44.11% (Newspaper) while the lowest was 32.99% (TV). The
statement I am aware that my bank advertises through TV had the highest mean score
(mean=3.35, SD=1.105, CV=32.99%) with the statement I am aware that my bank
advertises through Radio having relatively lower mean score (mean=3.08, SD=1.154,
CV=37.47%). On the other hand, the statement I am aware that my bank advertises
through Newspaper had the lowest mean score (mean=2.48, SD=1.094, CV=44.11%).
This implies that as much as customers are aware that their banks advertise through
offline media channels, they generally perceive TV as the best media channel to influence
their awareness level. It also suggests that advertising bank services and products through
TV can be quite effective in influencing consumers’ attitude (awareness) among Equity
Bank consumers.

107
Table 26: Advertising through online media by KCB on consumers’ attitude
(awareness)
Item description N Mean
score
SD CV
I am aware that my bank advertises through TV 75 3.45 1.209 35.04
I am aware that my bank advertises through Radio 46 3.06 1.099 35.92
I am aware that my bank advertises through
Newspaper
38 2.69 1.290 47.96
Average score 53 3.07 1.199 39.64
Note: High mean and low Coefficient of Variance (CV) values is the best score.
Table 26 for KCB respondents indicated that, on average, consumers are aware that their
bank runs adverts through offline media channels with an overall mean score of 3.07 and
an average CV of 39.64%. The highest CV registered was 47.96% (Newspaper) while
the lowest was 35.04% (TV). The statement I am aware that my bank advertises through
TV had the highest mean score (mean=3.45, SD=1.209, CV=35.04%) with the statement
I am aware that my bank advertises through Radio having relatively lower mean score
(mean=3.06, SD=1.099, CV=35.92%). On the other hand, the statement I am aware that
my bank advertises through Newspaper had the lowest mean score (mean=2.69,
SD=1.290, CV=47.96%).This, therefore implies that consumers perceive advertising
through TV as the most effective media channel to influence consumer awareness among
offline channels. It also suggests that advertising bank services and products through TV
would be effective in influencing consumer awareness among KCB Bank consumers.
Table 27: Advertising through offline media by Co-operative Bank of Kenya on
consumers’ attitude (awareness)
Item description N Mean
score
SD CV
I am aware that my bank advertises through TV 80 3.45 1.196 34.67
I am aware that my bank advertises through Radio 27 2.56 1.025 40.04
I am aware that my bank advertises through Newspaper 49 3.07 0.990 32.25
Average score 52 3.03 1.07 35.65
Note: High mean and low Coefficient of Variance (CV) values is the best score.
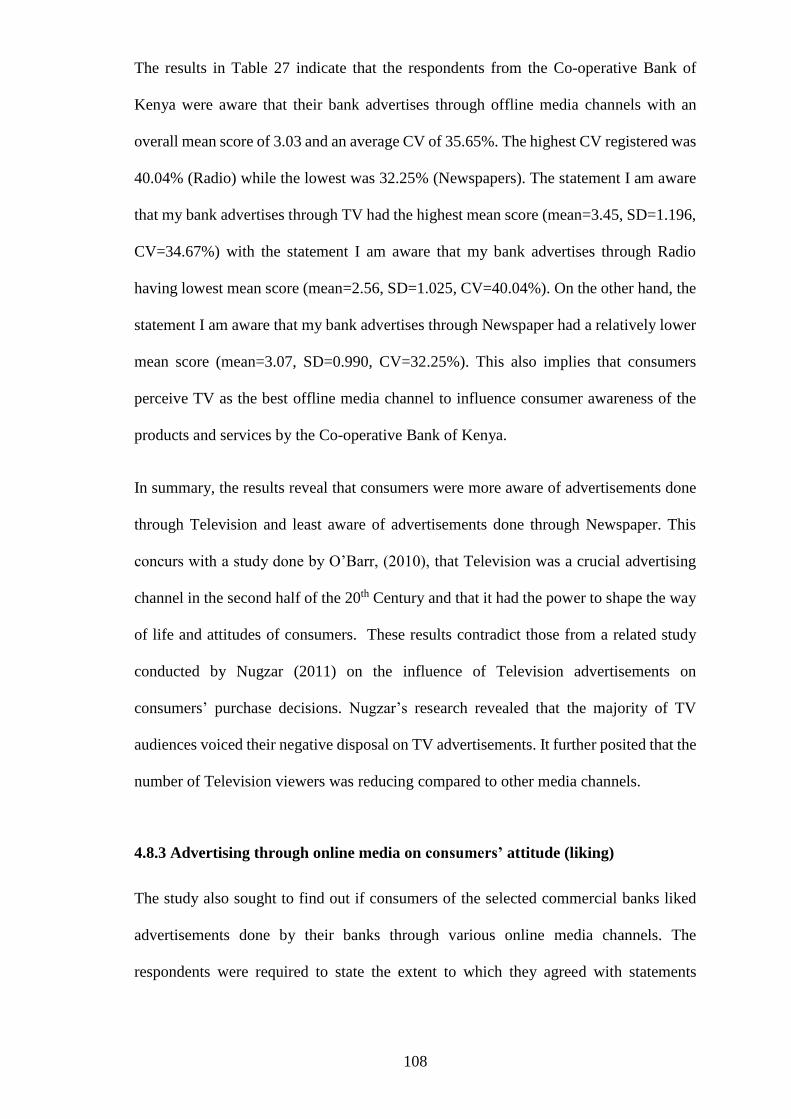
108
The results in Table 27 indicate that the respondents from the Co-operative Bank of
Kenya were aware that their bank advertises through offline media channels with an
overall mean score of 3.03 and an average CV of 35.65%. The highest CV registered was
40.04% (Radio) while the lowest was 32.25% (Newspapers). The statement I am aware
that my bank advertises through TV had the highest mean score (mean=3.45, SD=1.196,
CV=34.67%) with the statement I am aware that my bank advertises through Radio
having lowest mean score (mean=2.56, SD=1.025, CV=40.04%). On the other hand, the
statement I am aware that my bank advertises through Newspaper had a relatively lower
mean score (mean=3.07, SD=0.990, CV=32.25%). This also implies that consumers
perceive TV as the best offline media channel to influence consumer awareness of the
products and services by the Co-operative Bank of Kenya.
In summary, the results reveal that consumers were more aware of advertisements done
through Television and least aware of advertisements done through Newspaper. This
concurs with a study done by O’Barr, (2010), that Television was a crucial advertising
channel in the second half of the 20th Century and that it had the power to shape the way
of life and attitudes of consumers. These results contradict those from a related study
conducted by Nugzar (2011) on the influence of Television advertisements on
consumers’ purchase decisions. Nugzar’s research revealed that the majority of TV
audiences voiced their negative disposal on TV advertisements. It further posited that the
number of Television viewers was reducing compared to other media channels.
4.8.3 Advertising through online media on consumers’ attitude (liking)
The study also sought to find out if consumers of the selected commercial banks liked
advertisements done by their banks through various online media channels. The
respondents were required to state the extent to which they agreed with statements

109
provided by inserting a number that reflects their rating of each media channel using a
Likert type of scale ranging from 1 to 5 where 1 = Strongly Disagree; 2 = Disagree;3 =
Neutral;4 = Agree; 5= Strongly Agree. The relevant results of the study are depicted
below.
Table 28: Advertising through online media by Equity Bank on consumers’
attitude (liking)
Item description N Mean
score
SD CV
I like when my bank advertises through
57 3.16 1.068 33.80
I like when my bank advertises through Google
Ads
58 3.44 1.272 36.98
I like when my bank advertises through YouTube 59 3.45 1.121 32.49
Average score 58 3.35 1.154 34.42
Note: High mean and low Coefficient of Variance (CV) values is the best score.
The results in Table 28 shows that respondents from Equity Bank liked advertisements
done through online media channels with the average mean score relatively high
(mean=3.35, SD=1.154, CV=34.42%). The highest CV registered was 36.98% (Google
Ads) while the lowest was 32.492% (YouTube). The study showed that the Equity Bank
respondents liked it when the bank advertises through YouTube having registered the
highest score (mean=3.45, SD=1.121, CV=32.49%). Google Ads had a relatively lower
mean score though it still depicted a high agreement score (mean=3.44, SD=1.272,
CV=36.98%). The statement that respondents usually like when my bank advertises
through Facebook recorded the lowest score (mean=3.16, SD=1.068, CV=33.80%).
From the findings, it can be deduced that the respondents from Equity Bank had a
relatively high affection for YouTube advertisements. It can hence be argued that in order
for Equity Bank to influence consumers’ liking of their online advertisements, they need
to use more of YouTube as a channel of choice among online mediums.

110
Table 29: Advertising through online media by KCB on consumers’ attitude
(liking)
Item description N Means
score
SD CV
I like when my bank advertises through Facebook 66 3.38 1.017 30.09
I like when my bank advertises through Google Ads 60 3.53 1.031 29.21
I like when my bank advertises through YouTube 61 3.56 1.243 35.62
Average score 62 3.49 1.097 31.64
Note: The Best score is a mean score that is high and a CV that is low
According to results in Table 29, KCB respondents liked advertisements done by their
bank through online media channels, showing an average mean score that was relatively
high (mean=3.49, SD=1.097, CV=31.64%). The study also revealed that the KCB
respondents always like when their bank advertisements are done through YouTube,
having registered the highest score (mean=3.56, SD=1.243, CV=35.62%). The highest
CV registered was 35.62% (YouTube) while the lowest was 29.21% (Google Ads). The
statement that respondents usually like when my bank advertises through Facebook
recorded the lowest mean score (mean=3.38, SD=1.017, CV=30.09%). Likewise, Google
Ads had a relatively lower mean score though it still depicted a high agreement score
(mean=3.53, SD=1.031, CV=29.21%). From the findings, it can be deduced that the
respondents had a relatively high affection for YouTube advertisements followed by
Google Ads and Facebook respectively. It can therefore be argued that in order for KCB
to influence consumers’ liking of their online advertisements, they need to use more of
YouTube as a channel of choice among online mediums for their bank advertisements.

111
Table 30: Advertising through online media by Co-operative Bank of Kenya on
consumers’ attitude (liking)
Item description N Mean
score
SD CV
I like when my bank advertises through Facebook 73 3.50 0.988 28.23
I like when my bank advertises through Google
Ads
70 3.57 0.986 27.62
I like when my bank advertises through YouTube 76 3.80 1.087 28.61
Average score 73 3.62 1.020 28.15
Note: High mean and low Coefficient of Variance (CV) values is the best score.
Table 30 shows Co-operative bank of Kenya results with regard to the liking of online
media channels, the average mean score was relatively high (mean=3.62, SD=1.020,
CV=28.15%). Similarly, the results of this analysis established that the Co-operative
Bank respondents always like when bank advertisements are done through YouTube,
having registered the highest score (mean=3.80, SD=1.087, CV=28.61%). The statement
that respondents usually like when my bank advertises through Facebook recorded the
lowest score (mean=3.50, SD=0.988, CV=28.23%). The highest CV registered was
28.61% (YouTube) while the lowest was 27.62% (Google Ads). Google Ads had a
relatively lower mean score though it still depicted a high agreement score (mean=3.57,
SD=0.986, CV=27.62%). From the findings, it was also deduced that the respondents
had a relatively high affection for YouTube advertisements, given that it scored highly
compared to other online channels.
In summary, advertising through YouTube scores was the best in this study, deducing
that consumers banking in the selected commercial banks liked advertisements done
through YouTube. Facebook scores were equally good. This concurs with a study done
by Mwenda (2013) and Morrison (2014) that the fast growth of the internet in Kenya has
enabled millions of consumers to access online media channels like Facebook and
YouTube and therefore liked viewing advertisements through these channels. According
to Darban and Li (2012), Social network platforms such as Facebook grew by 22%
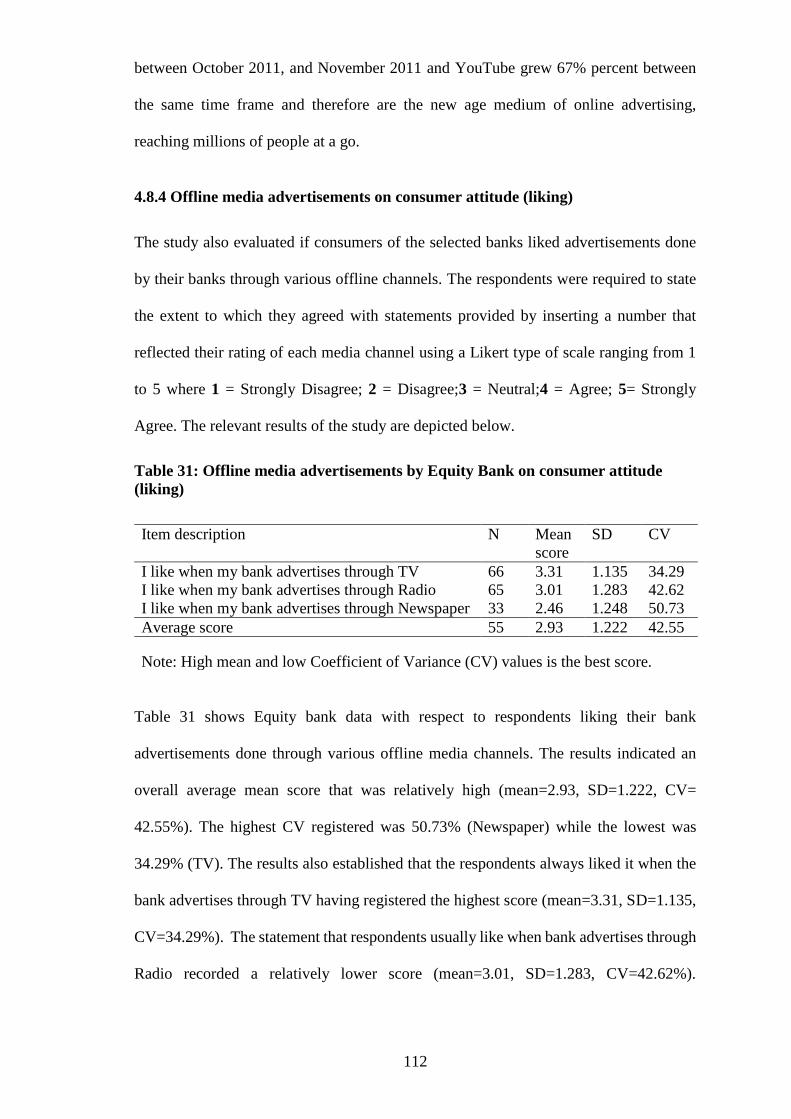
112
between October 2011, and November 2011 and YouTube grew 67% percent between
the same time frame and therefore are the new age medium of online advertising,
reaching millions of people at a go.
4.8.4 Offline media advertisements on consumer attitude (liking)
The study also evaluated if consumers of the selected banks liked advertisements done
by their banks through various offline channels. The respondents were required to state
the extent to which they agreed with statements provided by inserting a number that
reflected their rating of each media channel using a Likert type of scale ranging from 1
to 5 where 1 = Strongly Disagree; 2 = Disagree;3 = Neutral;4 = Agree; 5= Strongly
Agree. The relevant results of the study are depicted below.
Table 31: Offline media advertisements by Equity Bank on consumer attitude
(liking)
Item description N Mean
score
SD CV
I like when my bank advertises through TV 66 3.31 1.135 34.29
I like when my bank advertises through Radio 65 3.01 1.283 42.62
I like when my bank advertises through Newspaper 33 2.46 1.248 50.73
Average score 55 2.93 1.222 42.55
Note: High mean and low Coefficient of Variance (CV) values is the best score.
Table 31 shows Equity bank data with respect to respondents liking their bank
advertisements done through various offline media channels. The results indicated an
overall average mean score that was relatively high (mean=2.93, SD=1.222, CV=
42.55%). The highest CV registered was 50.73% (Newspaper) while the lowest was
34.29% (TV). The results also established that the respondents always liked it when the
bank advertises through TV having registered the highest score (mean=3.31, SD=1.135,
CV=34.29%). The statement that respondents usually like when bank advertises through
Radio recorded a relatively lower score (mean=3.01, SD=1.283, CV=42.62%).
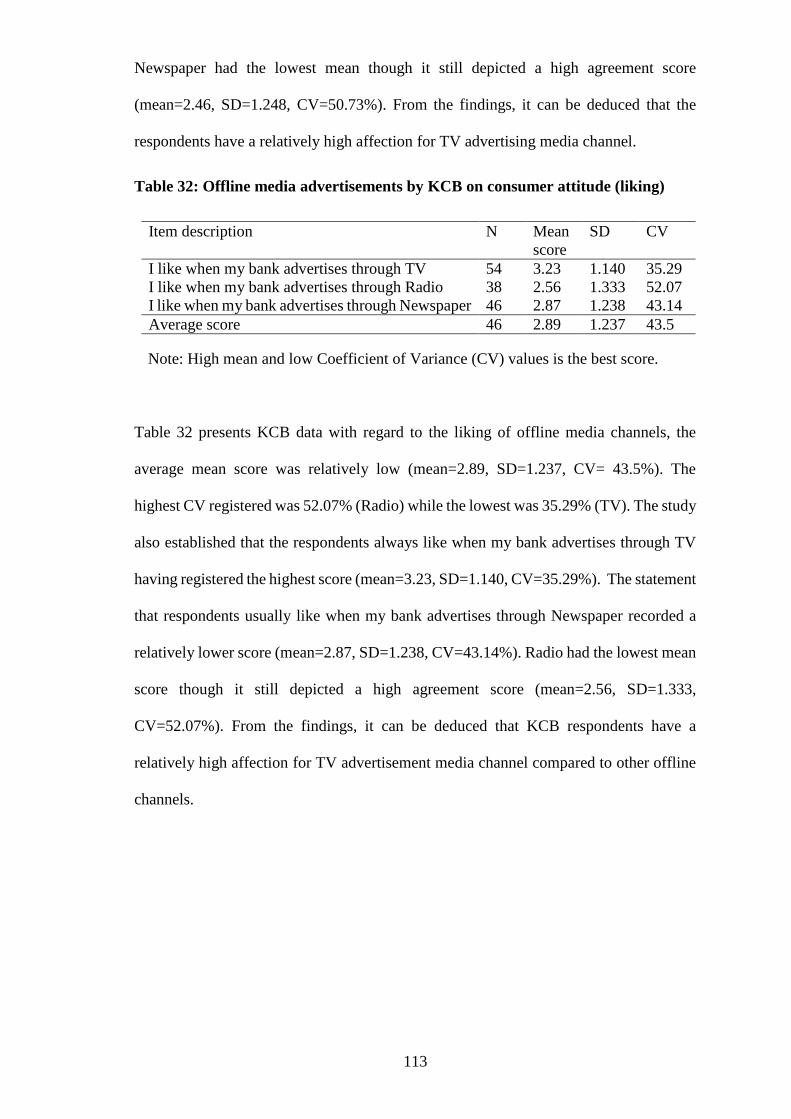
113
Newspaper had the lowest mean though it still depicted a high agreement score
(mean=2.46, SD=1.248, CV=50.73%). From the findings, it can be deduced that the
respondents have a relatively high affection for TV advertising media channel.
Table 32: Offline media advertisements by KCB on consumer attitude (liking)
Item description N Mean
score
SD CV
I like when my bank advertises through TV 54 3.23 1.140 35.29
I like when my bank advertises through Radio 38 2.56 1.333 52.07
I like when my bank advertises through Newspaper 46 2.87 1.238 43.14
Average score 46 2.89 1.237 43.5
Note: High mean and low Coefficient of Variance (CV) values is the best score.
Table 32 presents KCB data with regard to the liking of offline media channels, the
average mean score was relatively low (mean=2.89, SD=1.237, CV= 43.5%). The
highest CV registered was 52.07% (Radio) while the lowest was 35.29% (TV). The study
also established that the respondents always like when my bank advertises through TV
having registered the highest score (mean=3.23, SD=1.140, CV=35.29%). The statement
that respondents usually like when my bank advertises through Newspaper recorded a
relatively lower score (mean=2.87, SD=1.238, CV=43.14%). Radio had the lowest mean
score though it still depicted a high agreement score (mean=2.56, SD=1.333,
CV=52.07%). From the findings, it can be deduced that KCB respondents have a
relatively high affection for TV advertisement media channel compared to other offline
channels.

114
Table 33: Offline media advertisements by Co-operative Bank on consumer
attitude (liking)
Item description N Means
score
SD CV
I like when my bank advertises through TV 80 3.48 1.050 30.17
I like when my bank advertises through Radio 25 2.34 1.167 48.87
I like when my bank advertises through
Newspaper
47 2.94 1.162 39.52
Average score 51 2.92 1.126 39.52
Note: High mean and low Coefficient of Variance (CV) values is the best score.
Likewise, this study sought to find out the Co-operative Bank of Kenya consumers liking
towards offline advertisements. The results in Table 33 reported an average mean score
that was relatively high (mean=2.92, SD=1.126, CV= 39.52%). The highest CV
registered was 48.87% while the lowest was 30.17%. The study also established that the
respondents always like when their bank advertises through TV having registered the
highest score (mean=3.48, SD=1.050, CV=30.17%). The statement that respondents
usually like when their bank advertises through Newspaper recorded a relatively lower
score (mean=2.94, SD=1.162, CV=39.52%). Radio had the lowest mean though it still
depicted a high agreement score (mean=2.34, SD=1.167, CV=48.87%). From the
findings, it can be deduced that the respondents of the Co-operative Bank of Kenya have
a relatively high affection for TV advertisement media channel compared to other offline
channels.
Overall, advertising through Television had the best scores across the respondents of all
the banks; whereas Newspapers scores were not good across the board. The findings
concur with a study done by Snelson (2011) that consumers prefer interacting with
moving images rather than motionless images. This therefore confirms the findings of
this study in which Television had the best scores compared to the other two offline
channels of Radio and Newspaper.

115
4.8.5 Online media advertisements on consumer attitude (action)
This study further sought to evaluate the influence of advertising through online media
channels on consumer action. In this case, a set of three items similar to that employed
for the liking of advertising media channels were used. The results are presented in the
tables below.
Table 34: Online media advertisements by Equity Bank on consumer attitude
(action)
Item description N Mean
score
SD CV
I am likely to act, if I receive my banks’
advertisements through Facebook
74 3.28 1.108 33.78
I am likely to act, if I receive my banks’
advertisements through Google Ads
61 3.37 1.011 30.00
I am likely to act, if I receive my banks’
advertisements through YouTube
68 3.55 1.107 31.18
Average score 68 3.40 1.075 31.65
Note: High mean and low Coefficient of Variance (CV) values is the best score.
According to Table 34 Equity bank respondents scored a relatively high average score
(mean=3.40, SD=1.075, CV=31.65%), meaning they were likely to act if they received
advertisements through the various online channels. The highest CV recorded was
33.78% (Facebook) while the lowest was 30.0% (Google Ads). The results also showed
that advertisements done through YouTube were effective in influencing consumers’
attitude, in this case, having recorded the highest mean score (mean=3.55, SD=1.107,
CV=31.18%) compared to other online channels. However, the statement that I am likely
to act, if I receive banks’ advertisements through Google Ads had a relatively low mean
score though it still depicted a high agreement score (mean=3.37, SD=1.011,
CV=30.00%). The results also demonstrated that the statement that I am likely to act, if
I receive my banks’ advertisements through Facebook had a relatively low mean though
it still depicted a high agreement score (mean=3.28, SD=1.108, CV=33.78%). This can
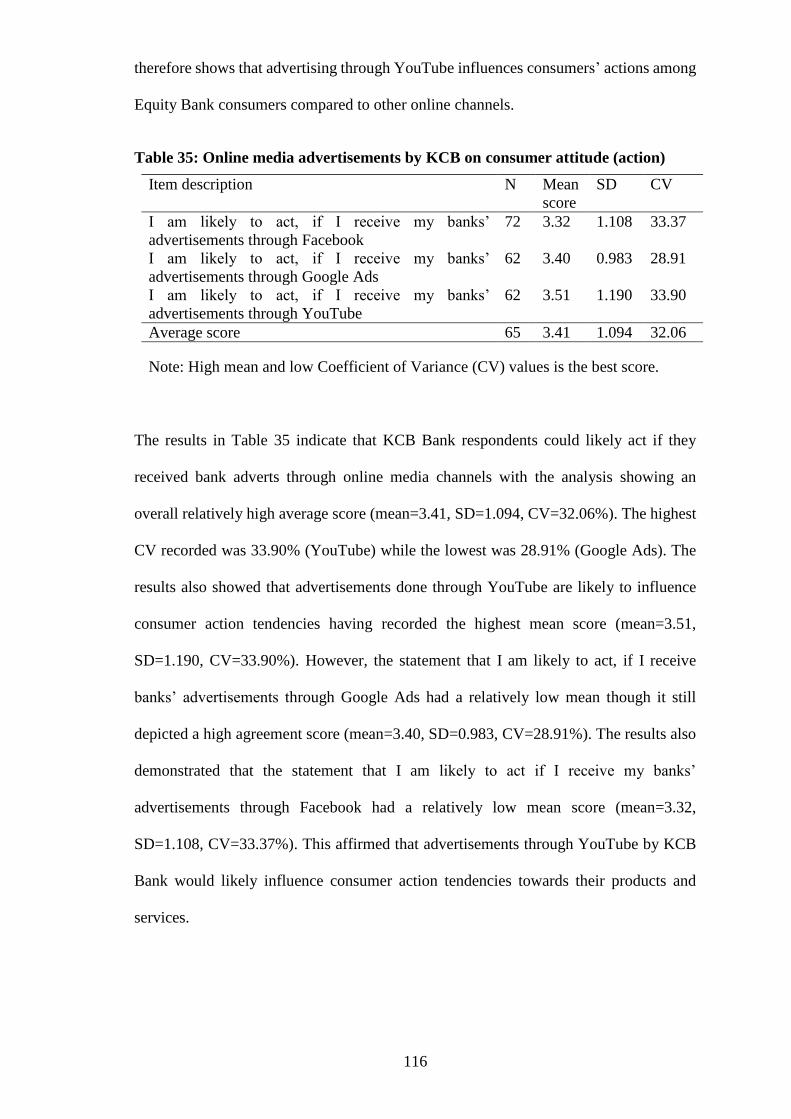
116
therefore shows that advertising through YouTube influences consumers’ actions among
Equity Bank consumers compared to other online channels.
Table 35: Online media advertisements by KCB on consumer attitude (action)
Item description N Mean
score
SD CV
I am likely to act, if I receive my banks’
advertisements through Facebook
72 3.32 1.108 33.37
I am likely to act, if I receive my banks’
advertisements through Google Ads
62 3.40 0.983 28.91
I am likely to act, if I receive my banks’
advertisements through YouTube
62 3.51 1.190 33.90
Average score 65 3.41 1.094 32.06
Note: High mean and low Coefficient of Variance (CV) values is the best score.
The results in Table 35 indicate that KCB Bank respondents could likely act if they
received bank adverts through online media channels with the analysis showing an
overall relatively high average score (mean=3.41, SD=1.094, CV=32.06%). The highest
CV recorded was 33.90% (YouTube) while the lowest was 28.91% (Google Ads). The
results also showed that advertisements done through YouTube are likely to influence
consumer action tendencies having recorded the highest mean score (mean=3.51,
SD=1.190, CV=33.90%). However, the statement that I am likely to act, if I receive
banks’ advertisements through Google Ads had a relatively low mean though it still
depicted a high agreement score (mean=3.40, SD=0.983, CV=28.91%). The results also
demonstrated that the statement that I am likely to act if I receive my banks’
advertisements through Facebook had a relatively low mean score (mean=3.32,
SD=1.108, CV=33.37%). This affirmed that advertisements through YouTube by KCB
Bank would likely influence consumer action tendencies towards their products and
services.

117
Table 36: Online media advertisements by Co-operative Bank of Kenya on
consumer attitude (action)
Item description N Mean
score
SD CV
I am likely to act, if I receive my banks’
advertisements through Facebook
75 3.38 1.130 33.43
I am likely to act, if I receive my banks’
advertisements through Google Ads
69 3.55 0.921 25.94
I am likely to act, if I receive my banks’
advertisements through YouTube
78 3.73 1.099 29.46
Average score 74 3.553 1.050 29.61
Note: High mean and low Coefficient of Variance (CV) values is the best score.
Table 36 presents the Co-operative Bank of Kenya data, showing that advertisements
done through online channels were likely to influence consumer attitude (action) with a
high overall average score (mean=3.553, SD=1.050, CV=29.61%). The highest CV
recorded was 33.43% (Facebook) while the lowest was 25.94% (Google Ads). The
results also showed that advertisements done through YouTube were likely to influence
consumer attitude more compared to other online channels (Facebook and Google Ads)
having recorded the highest mean score (mean=3.73, SD=1.099, CV=29.46%).
However, the statement that I am likely to act, if I receive my banks’ advertisements
through Google Ads had a relatively low mean though it still depicted a high agreement
score (mean=3.55, SD=0.921, CV=25.94%). The results further demonstrated the
statement that I am likely to act if I receive my banks’ advertisements through Facebook
had a relatively low mean though it still demonstrated a high agreement score
(mean=3.38, SD=1.130, CV=33.43%). This shows that the Co-operative Bank of Kenya
can choose YouTube as the online media channel since it scored highly in influencing
consumer action to their advertisements.
In summary, YouTube emerged as the most influencer in the action sub-construct of
attitude across all the respondents from all the commercial banks in this study. The results
concur with a study done by Stelzner, 2013 which surveyed the social media channel that

118
marketers preferred to use for advertising. It found out that 69% of marketers were
planning to increase the use of YouTube as an advertising channel, the highest increase
compared to intention to use other channels. This could be as a result of belief that
YouTube was effective in influencing the action sub construct of consumers’ attitude.
4.8.6 Offline media advertisement on consumer attitude (action)
The study further sought to evaluate the influence of advertising through offline media
channels on consumer action. In this case, a set of three items similar to that employed
for online advertising media channels was used. The results are presented in the Tables
below.
Table 37: Offline advertisement by Equity Bank on consumer attitude (action)
Item description N Mean
score
SD CV
I like when my bank advertises through TV 70 3.31 1.010 30.51
I like when my bank advertises through Radio 30 2.52 1.170 46.43
I like when my bank advertises through Newspaper 49 3.02 1.200 39.74
Average score 50 2.95 1.127 38.89
Note: High mean and low Coefficient of Variance (CV) values is the best score.
The results in Table 37 indicate that Equity Bank respondents were on average likely to
act if their bank advertised through offline media channels with an overall action average
medium score (mean=2.95, SD=1.127, CV=38.89%). The highest CV recorded was
46.43% (Radio) while the lowest was 30.51% (TV). The highest mean scores
(mean=3.31, SD=1.010, CV=30.51%) were recorded on TV, showing that advertising
through this channel had the highest influence on consumer attitude, in this case, action.
However, the statement that they are likely to act when the bank advertises through
Newspaper had a lower mean score (mean=3.02, SD=1.200, CV=39.74%) but the lowest
was recorder on Radio channel (mean=2.52, SD=1.170, CV=46.43%). TV therefore

119
would be the best offline channel for Equity Bank to influence consumer action when
advertising.
Table 38: Offline advertisement by KCB on consumer attitude (action)
Item description N Mean
score
SD CV
I like when my bank advertises through TV 75 3.12 1.148 36.79
I like when my bank advertises through Radio 30 2.63 1.255 47.72
I like when my bank advertises through Newspaper 39 2.84 1.078 37.96
Average score 48 2.86 1.160 40.82
Note: High mean and low Coefficient of Variance (CV) values is the best score.
According to KCB data in Table 38, advertising through offline media channels had a
relatively lower average score (mean=2.86, SD=1.160, CV=43.09%) compared to Equity
and Co-op Bank, meaning that consumers of KCB were not likely to act if their bank
used offline channels. The highest CV recorded was 47.72% (Radio), while the lowest
was 36.79% (TV). The results also showed that despite offline channels not scoring high
for KCB consumers, they would still likely to act if their bank chooses TV among other
offline channels to advertise having recorded the highest mean score (mean=3.12,
SD=1.148, CV=36.79%). However, the statement that they would likely act if their bank
advertises through Radio had the lowest mean score though it still depicted a high
agreement score (mean=2.63, SD=1.255, CV=47.72%). Newspaper recorded a
moderately low score (mean=2.84, SD=1.078, CV=37.96%). The results showed that
KCB consumers would be influenced by advertisements done through TV to act on their
products and services followed by Newspaper and Radio in that order; therefore, KCB
would need to choose TV as a medium of choice for advertising through offline
platforms.
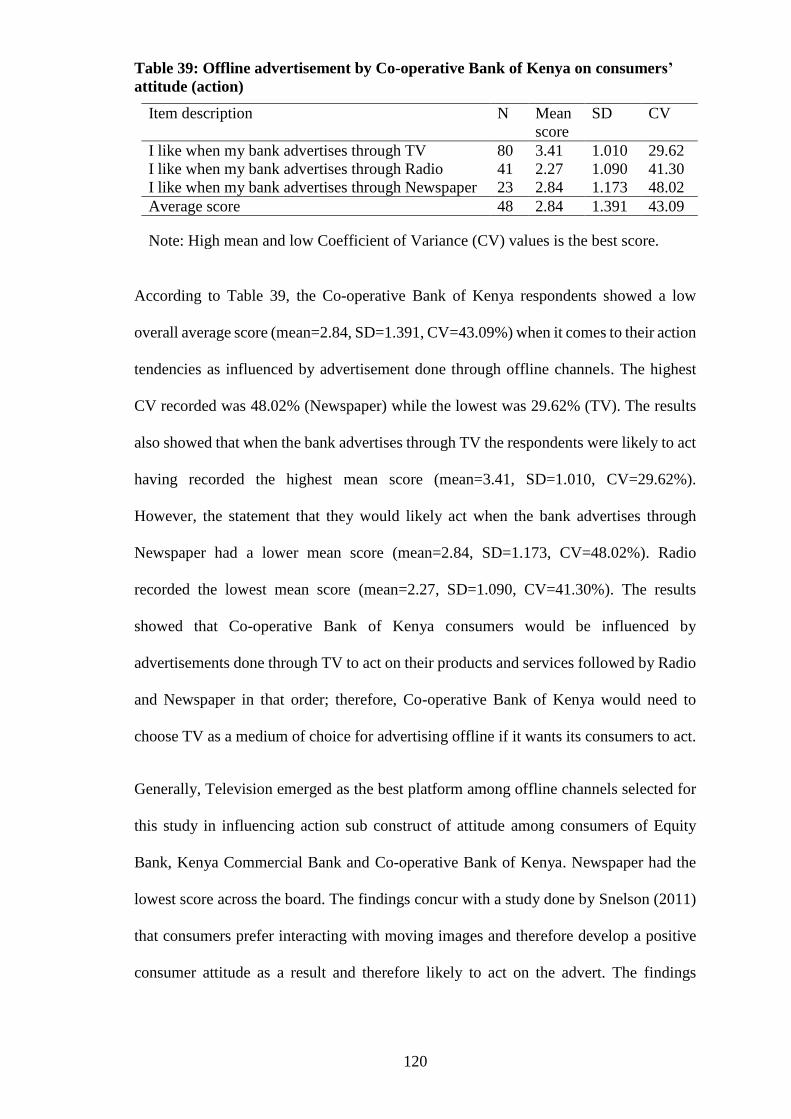
120
Table 39: Offline advertisement by Co-operative Bank of Kenya on consumers’
attitude (action)
Item description N Mean
score
SD CV
I like when my bank advertises through TV 80 3.41 1.010 29.62
I like when my bank advertises through Radio 41 2.27 1.090 41.30
I like when my bank advertises through Newspaper 23 2.84 1.173 48.02
Average score 48 2.84 1.391 43.09
Note: High mean and low Coefficient of Variance (CV) values is the best score.
According to Table 39, the Co-operative Bank of Kenya respondents showed a low
overall average score (mean=2.84, SD=1.391, CV=43.09%) when it comes to their action
tendencies as influenced by advertisement done through offline channels. The highest
CV recorded was 48.02% (Newspaper) while the lowest was 29.62% (TV). The results
also showed that when the bank advertises through TV the respondents were likely to act
having recorded the highest mean score (mean=3.41, SD=1.010, CV=29.62%).
However, the statement that they would likely act when the bank advertises through
Newspaper had a lower mean score (mean=2.84, SD=1.173, CV=48.02%). Radio
recorded the lowest mean score (mean=2.27, SD=1.090, CV=41.30%). The results
showed that Co-operative Bank of Kenya consumers would be influenced by
advertisements done through TV to act on their products and services followed by Radio
and Newspaper in that order; therefore, Co-operative Bank of Kenya would need to
choose TV as a medium of choice for advertising offline if it wants its consumers to act.
Generally, Television emerged as the best platform among offline channels selected for
this study in influencing action sub construct of attitude among consumers of Equity
Bank, Kenya Commercial Bank and Co-operative Bank of Kenya. Newspaper had the
lowest score across the board. The findings concur with a study done by Snelson (2011)
that consumers prefer interacting with moving images and therefore develop a positive
consumer attitude as a result and therefore likely to act on the advert. The findings
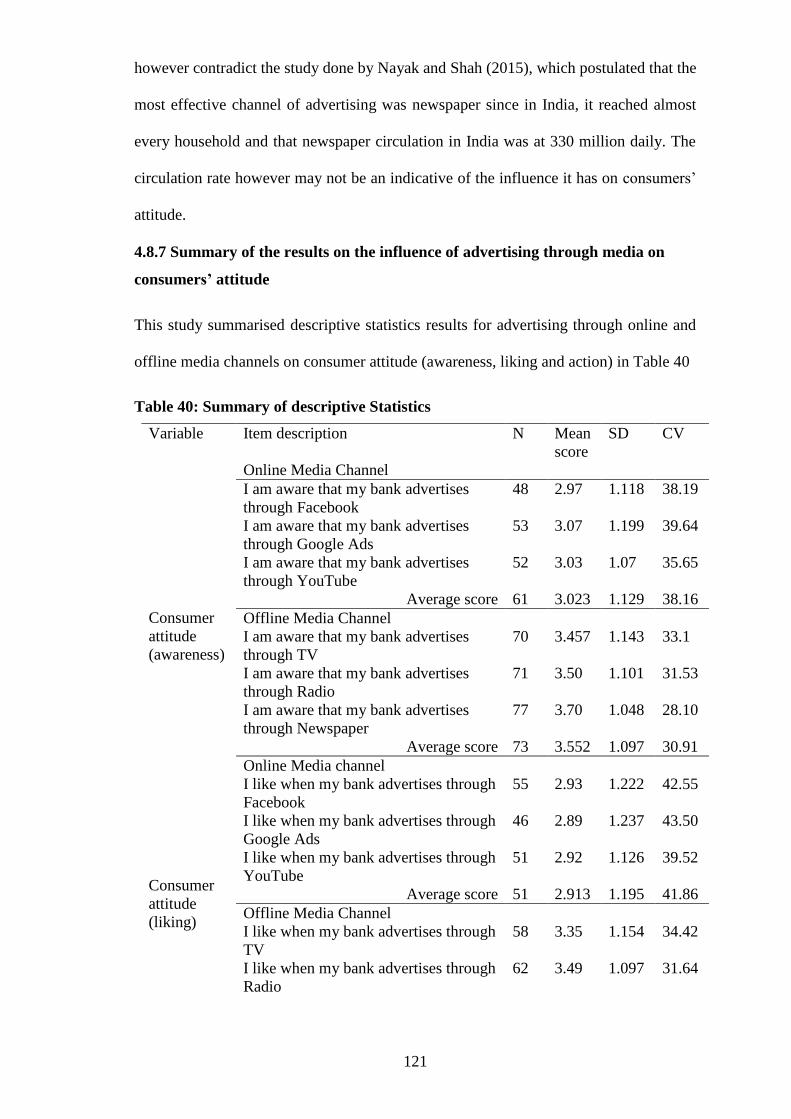
121
however contradict the study done by Nayak and Shah (2015), which postulated that the
most effective channel of advertising was newspaper since in India, it reached almost
every household and that newspaper circulation in India was at 330 million daily. The
circulation rate however may not be an indicative of the influence it has on consumers’
attitude.
4.8.7 Summary of the results on the influence of advertising through media on
consumers’ attitude
This study summarised descriptive statistics results for advertising through online and
offline media channels on consumer attitude (awareness, liking and action) in Table 40
Table 40: Summary of descriptive Statistics
Variable Item description N Mean
score
SD CV
Online Media Channel
Consumer
attitude
(awareness)
I am aware that my bank advertises
through Facebook
48 2.97 1.118 38.19
I am aware that my bank advertises
through Google Ads
53 3.07 1.199 39.64
I am aware that my bank advertises
through YouTube
52 3.03 1.07 35.65
Average score 61 3.023 1.129 38.16
Offline Media Channel
I am aware that my bank advertises
through TV
70 3.457 1.143 33.1
I am aware that my bank advertises
through Radio
71 3.50 1.101 31.53
I am aware that my bank advertises
through Newspaper
77 3.70 1.048 28.10
Average score 73 3.552 1.097 30.91
Consumer
attitude
(liking)
Online Media channel
I like when my bank advertises through
55 2.93 1.222 42.55
I like when my bank advertises through
Google Ads
46 2.89 1.237 43.50
I like when my bank advertises through
YouTube
51 2.92 1.126 39.52
Average score 51 2.913 1.195 41.86
Offline Media Channel
I like when my bank advertises through
TV
58 3.35 1.154 34.42
I like when my bank advertises through
Radio
62 3.49 1.097 31.64

122
I like when my bank advertises through
Newspaper
73 3.62 1.020 28.15
Average score 64 3.491 1.090 31.40
Consumer
attitude
(action)
Online Media Channel
I am likely to act, if I receive my banks
advertisements through Facebook
50 2.95 1.127 38.20
I am likely to act, if I receive my banks
advertisements through Google Ads
48 2.86 1.160 40.56
I am likely to act, if I receive my banks
advertisements through YouTube
48 2.84 1.141 40.18
Average score 49 2.881 1.143 39.65
Offline Media Channel
I am likely to act, if I receive my banks
advertisements through TV
58 3.40 1.075 31.62
I am likely to act, if I receive my banks
advertisements through Radio
65 3.41 1.094 32.08
I am likely to act, if I receive my banks
advertisements through Newspaper
74 3.553 1.050 29.55
Average score 66 3.454 1.073 31.08
Overall mean score 61 3.219 1.121 35.64
Note: High mean and low Coefficient of Variance (CV) values is the best score.
The results for descriptive statistics in Table 40 revealed that the overall mean scores for
the three variables (consumer awareness, liking and action) were above average
(mean=3.219, SD=1.121, CV=35.64%). The findings further revealed that advertising
through offline channels by banks had the highest average mean score and therefore
influenced consumers’ attitude (Awareness, Liking and Action) more compared to
online. Consumer awareness of offline media channels had the highest score
(mean=3.552, SD=1.097, CV=30.9%) followed by consumer liking for offline media
channels (mean=3.491, SD=1.090, CV=31.40%). On the other hand, consumer action
tendencies for offline media channels also had a relatively higher average score
(mean=3.454, SD=1.073, CV=31.11%). Online media channels had the lowest average
mean scores; where it showed that advertising through online channels would relatively
influence consumer awareness with a high mean score (mean=3.023, SD=1.129,
CV=38.16%) compared to consumer liking (mean=2.913, SD=1.195, CV=41.86%) and
consumer action which recorded the lowest average score (mean=2.881, SD=1.143,

123
CV=31.08%). This implies that despite high consumer awareness that could be achieved
when banks advertise through online media channels, they would likely have a
moderately low liking (affection) and a low action tendency as a result of advertisements
done through online media channels. In conclusion, this summary shows that advertising
through offline media channels tends to influence consumer awareness (cognition),
consumer liking (affection) and consumer action (Behaviour) towards bank products and
services more compared to using online channels.
4.9 Hypotheses testing
This study tested the seven research hypotheses according to specific objectives of
assessing the influence of advertising through media channels on consumer attitude; and
to compare the use of online and offline media channels as used by commercial banks in
Nairobi, County, Kenya. The inferential statistics were conducted in order to accept or
reject the null hypotheses earlier outlined. This was done through simple and multiple
regression analysis at a 95% confidence level. In addition, individual mean scores were
computed for the independent, moderating and dependent variables and the results used
in regression models that involved tests for moderation effects. The results of the
regression analysis were then used to test the research hypotheses. In the analysis,
standardized beta coefficients from the regression model were adopted to estimations and
comparison of the relative impacts on variables (Kwan & Chan, 2011).
4.9.1 Correlation analysis results
The current study determined the relationship between advertising through media on
consumer attitude (awareness, liking and action) as used by the selected commercial
banks in Nairobi County, Kenya using Pearson Product Moment to calculate correlation

124
coefficient between variables. Studies done by Njuguna (2014) and Mwenda (2013) used
a similar method and gained credible results.
4.9.2 The influence of advertising through Facebook on consumers’ attitude
The first objective of this research was to examine the influence of advertising through
Facebook on consumer’s attitude among selected commercial banks in Nairobi County,
Kenya. In this case the magnitude of the relationship between advertising through
Facebook and consumers’ attitude was evaluated based on the hypothesis: H01:
Advertising through Facebook has no statistically significant influence on consumers’
attitude among selected commercial banks in Nairobi County, Kenya. The respondents
were asked to indicate the extent to which they agreed with statements of awareness,
liking or acting based on their banks carrying out advertisements on Facebook as a media
channel. These statements were then evaluated based on indicators of awareness, liking
and action as a result of bank advertisements done through Facebook. Correlation
analysis was carried out to determine the relationship between advertising through
Facebook and Customer attitude (Awareness, Liking and Action). Table 42 presents the
results of the evaluation of the relationship.
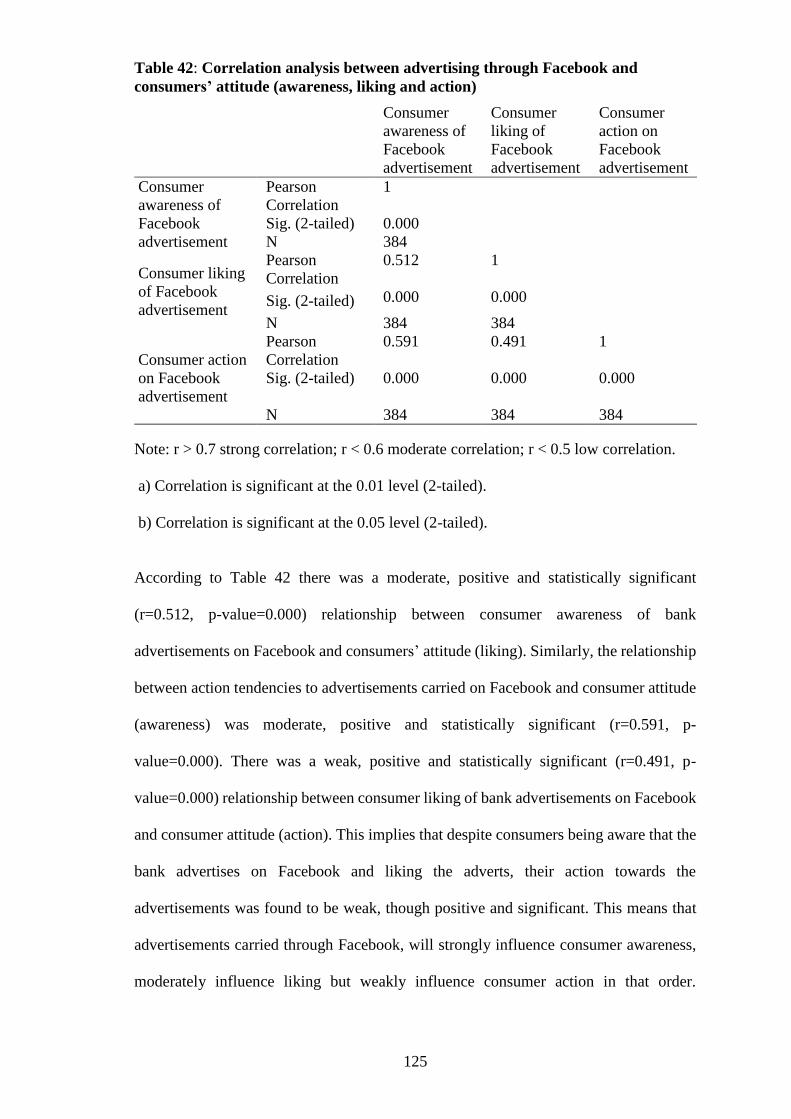
125
Table 42: Correlation analysis between advertising through Facebook and
consumers’ attitude (awareness, liking and action)
Consumer
awareness of
advertisement
Consumer
liking of
advertisement
Consumer
action on
advertisement
Consumer
awareness of
advertisement
Pearson
Correlation
1
Sig. (2-tailed) 0.000
N 384
Consumer liking
of Facebook
advertisement
Pearson
Correlation
0.512 1
Sig. (2-tailed) 0.000 0.000
N 384 384
Consumer action
on Facebook
advertisement
Pearson
Correlation
0.591 0.491 1
Sig. (2-tailed) 0.000 0.000 0.000
N
384
384
384
Note: r > 0.7 strong correlation; r < 0.6 moderate correlation; r < 0.5 low correlation.
a) Correlation is significant at the 0.01 level (2-tailed).
b) Correlation is significant at the 0.05 level (2-tailed).
According to Table 42 there was a moderate, positive and statistically significant
(r=0.512, p-value=0.000) relationship between consumer awareness of bank
advertisements on Facebook and consumers’ attitude (liking). Similarly, the relationship
between action tendencies to advertisements carried on Facebook and consumer attitude
(awareness) was moderate, positive and statistically significant (r=0.591, p-
value=0.000). There was a weak, positive and statistically significant (r=0.491, p-
value=0.000) relationship between consumer liking of bank advertisements on Facebook
and consumer attitude (action). This implies that despite consumers being aware that the
bank advertises on Facebook and liking the adverts, their action towards the
advertisements was found to be weak, though positive and significant. This means that
advertisements carried through Facebook, will strongly influence consumer awareness,
moderately influence liking but weakly influence consumer action in that order.
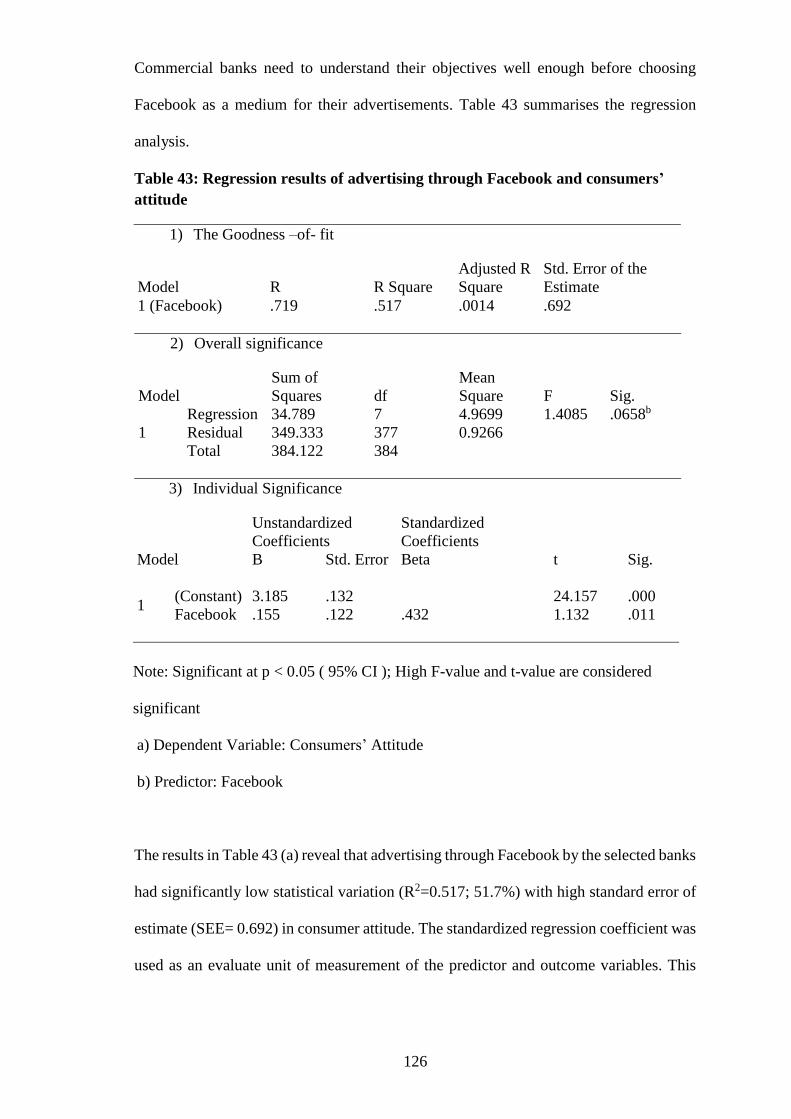
126
Commercial banks need to understand their objectives well enough before choosing
Facebook as a medium for their advertisements. Table 43 summarises the regression
analysis.
Table 43: Regression results of advertising through Facebook and consumers’
attitude
1) The Goodness –of- fit
Model R R Square
Adjusted R
Square
Std. Error of the
Estimate
1 (Facebook) .719 .517 .0014 .692
2) Overall significance
Model
Sum of
Squares df
Mean
Square F Sig.
1
Regression 34.789 7 4.9699 1.4085 .0658b
Residual 349.333 377 0.9266
Total 384.122 384
3) Individual Significance
Model
Unstandardized
Coefficients
Standardized
Coefficients
t Sig. B Std. Error Beta
1 (Constant) 3.185 .132 24.157 .000
Facebook .155 .122 .432 1.132 .011
Note: Significant at p < 0.05 ( 95% CI ); High F-value and t-value are considered
significant
a) Dependent Variable: Consumers’ Attitude
b) Predictor: Facebook
The results in Table 43 (a) reveal that advertising through Facebook by the selected banks
had significantly low statistical variation (R2=0.517; 51.7%) with high standard error of
estimate (SEE= 0.692) in consumer attitude. The standardized regression coefficient was
used as an evaluate unit of measurement of the predictor and outcome variables. This

127
allowed the researcher to compare the relative effect of predictors measured on different
scales.
The equation of regression that approximates advertising through Facebook on
consumers’ attitude was specified as follows:
𝑌 = 0.363 + 0.327X1 + 𝜀
Where 𝛼 the constant (intercept) is, 𝑌 is the consumer attitude, 𝑋1 is the advertisement
through Facebook and 𝜀 is the error term.
The calculation endorses that the Beta coefficient for advertising through Facebook is
positive and statistically significant to influence consumer attitude.
Comparison of the joint effect of advertisement through Facebook on consumers’ attitude
(Awareness, Liking and Action) by F-statistics, according to Table 43 (b), shows less
significance (F=1.4085; P=0.0658). Thus, a small F-value and a large p-value means
Facebook had a less significant impact on consumer attitude. According to the hypothesis
test via Student's t-test (Table 43 (c) the standardized regression coefficient (β=0.432)
value of Facebook indicated a significantly low t-test value (t=1.132; p=0.011). A low
t-value indicates that the test statistics result is equal to the null hypothesis. Thus, if the
absolute value of the t-value decreases as the difference between the sample test data of
the correspondents using Facebook then the null hypothesis is supported. Therefore,
analysis supports the hypothesis “Advertising through Facebook has no statistically
significant influence on consumers’ attitude among selected commercial banks in
Nairobi County, Kenya”.

128
4.9.3 The influence of advertising through Google Ads on consumers’ attitude
The second objective of this study was to establish the influence of advertising through
Google Ads on consumers’ attitude among selected commercial banks in Nairobi
County, Kenya. The following hypothesis was formulated: H02: Advertising through
Google Ads has no statistically significant influence on consumers’ attitude among
selected commercial banks in Nairobi County, Kenya. The respondents were asked to
indicate the extent to which they agreed with statements of awareness, liking or acting
based on their banks carrying out advertisements in Google Ads as a media channel.
These statements were then evaluated based on indicators of awareness, liking and action
as a result of bank adverts on Google Ads. Correlation analysis was computed to
determine the relationship between advertising through Google Ads and Consumers’
attitude (Awareness, Liking and Action). Table 44 presents the results of the relationship.
Table 44: Correlation analysis between advertising through Google Ads and
consumers’ attitude (awareness, liking and action)
Consumer
awareness of
Google Ads
Consumer
liking of
Google Ads
Consumer
action on
Google Ads
Consumer
awareness of
Google Ads
Pearson
Correlation
1
Sig. (2-tailed) 0.000
N 384
Consumer liking
of Google Ads
Pearson
Correlation
0.432 1
Sig. (2-tailed) 0.000 0.000
N 384 384
Consumer action
on Google Ads
Pearson
Correlation
0.461 0.483 1
Sig. (2-tailed) 0.000 0.000 0.000
N 384 384 384
Note: r>0.7: strong correlation; r<0.6: moderate correlation; r< 0.5: low correlation
a) Correlation is significant at the 0.01 level (2-tailed)
b) Correlation is significant at the 0.05 level (2-tailed).

129
The results in Table 44 indicate that there was a weak, positive and statistically
significant (r=0.432, p-value=0.000) relationship between awareness of Google Ads
advertisement and consumer attitude (liking). Similarly, there was a weak, positive and
statistically significant (r= 0.461, p-value=0.000) relationship between consumer liking
of advertisements done through Google Ads and consumers’ attitude (action). The
relationship between advertisements that were liked in Google Ads and consumers’
action tendencies was also weak, positive and statistically significant (r = 0.483, p-value
= 0.000). Like Facebook, the results of Google Ads showed that despite consumers
knowing and liking adverts carried in Google Ads, their action tendencies towards them
was weak. Since all marketers’ aim is to eventually drive action, then it implies that
advertising through Google Ads has no statistical significance to influence consumers’
attitude. Table 45 presents the results of the regression analysis

130
Table 45: Regression results of advertising through Google Ads and consumers’
attitude
1) The Goodness –of- fit
Model R R Square
Adjusted R
Square
Std. Error of the
Estimate
1 (Google Ads) .886 .785 .0021 .611
2) Overall significance
Model
Sum of
Squares df
Mean
Square F Sig.
1
Regression 27.998 3 9.3327 0.3215 .03441b
Residual 356.013 381 0.9344
Total 384.011 384
3) Individual Significance
Model
Unstandardized
Coefficients
Standardized
Coefficients
t Sig. B Std. Error Beta
1
(Constant) 3.185 .132 24.157 .000
Ads .193 .176 .511 2.113 .012
Note: Significant at p < 0.05 (95% CI ); High F-value and t-value are considered
significant
a) Dependent Variable: Customers’ Attitude
b) Predictor: Google Ads
The results in Table 45 (a) revealed that unlike Facebook, advertising through Google
Ads by the selected banks had a significantly higher statistical variation (R2=0.785; 78.5
%) though with a high standard error of estimate (SEE= 0.611) in consumer attitude. The
standardized regression coefficient was used as an evaluate unit of measurement of the
predictor and outcome variables. This allowed the researcher to compare the relative
effect of predictors measured on different scales. The equation of regression that
approximates the influence of advertising through Google Ads on consumers’ attitude
was specified as follows:
131
𝑌 = 0.279 + 0.314𝑋1 + 𝜀
Where 𝛼 is the constant (intercept), 𝑌 is the consumer attitude, 𝑋1 is the advertisement
through Google Ads and 𝜀 is the error term.
The calculation endorses that the Beta coefficient for advertising through Google Ads is
positive and quite statistically significant to influence consumers’ attitude
The F statistic for comparison of the joint effect of advertisement through Google Ads
on consumers’ attitude (Awareness, Liking and Action) according to Table 45 (b) shows
less significance (F=0.3215; P=0.03441). Thus, a small F-value and a large p-value mean
Google Ads had a less significant impact on consumer attitude. The study further tested
the hypothesis via Student's t-test according to Table 45 (c) the standardized regression
coefficient (β=0.511) value of Google Ads indicated a significantly low t-test value
(t=2.113; p=0.012). A low t-value indicates that the test statistics results is equal to the
null hypothesis. Thus, if the absolute value of the t-value decreases as the difference
between the sample test data of the correspondents using Google Ads, then the null
hypothesis is supported. Therefore, low t-value supports the hypothesis “Advertising
through Google Ads has no statistical significant influence on consumers’ attitude
among selected commercial banks in Nairobi County, Kenya”.
4.9.4 The influence of advertising through YouTube on consumers’ attitude
The third objective of this study was to examine the influence of advertising through
YouTube on consumers’ attitude among selected commercial banks in Nairobi County,
Kenya. The following hypothesis was formulated: H03: Advertising through YouTube
has no statistically significant influence on consumers’ attitude among selected
commercial banks in Nairobi County, Kenya. The respondents were asked to indicate the
extent to which they agreed with statements of awareness, liking or acting based on their
banks carrying out advertisements on YouTube as a media channel. These statements

132
were then evaluated based on indicators of awareness, liking and action as a result of
bank adverts on YouTube. Correlation analysis was computed to determine the
relationship between advertising through YouTube and consumers’ attitude (Awareness,
Liking and Action). Table 46 presents the results of the relationship.
Table 46: Correlation analysis between advertising through YouTube and
consumers’ attitude (awareness, liking and action)
Consumer
awareness of
YouTube
advertisement
Consumer
liking of
YouTube
advertisement
Consumer
action on
YouTube
advertisement
Consumer
awareness of
YouTube
advertisement
Pearson
Correlation
1
Sig. (2-tailed) 0.000
N 384
Consumer liking
of YouTube
advertisement
Pearson
Correlation
0.592 1
Sig. (2-tailed) 0.000 0.000
N 384 384
Consumer action
on YouTube
advertisement
Pearson
Correlation
0.399 0.567 1
Sig. (2-tailed) 0.000 0.000 0.000
N 384 384 384
Note: r>0.7: strong correlation; r<0.6: moderate correlation; r< 0.5: low correlation
a) Correlation is significant at the 0.01 level (2-tailed).
b) Correlation is significant at the 0.05 level (2-tailed).
Table 46 indicates a moderate and positive (r=.592, p-value=.000) relationship between
awareness of advertisements done through YouTube and consumers’ attitude (liking).
Again, there was a weak and positive (r=0.399, p-value=.000) relationship between
consumers’ awareness of advertisements done through YouTube and consumers’ attitude
(action). The relationship between consumers’ liking of advertisements done through
YouTube and consumers’ action tendencies towards the adverts was moderate and
positive (r= 0.567, p-value=.000). This could be interpreted that though consumers were
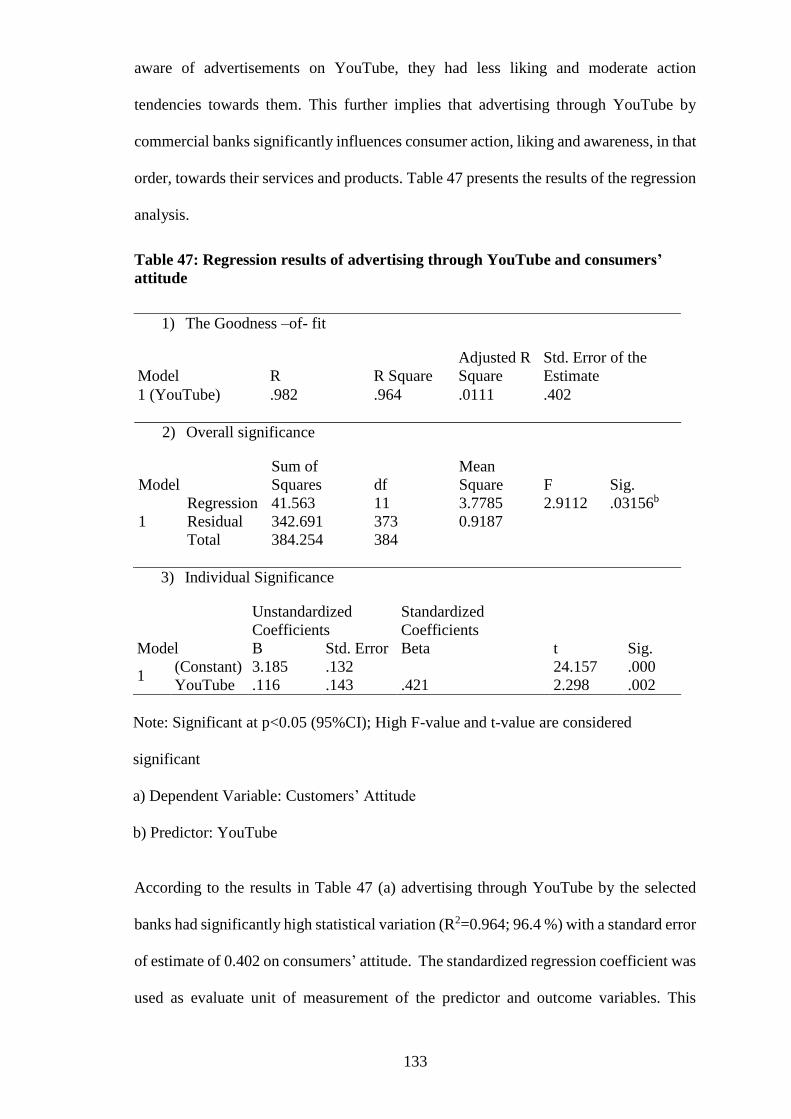
133
aware of advertisements on YouTube, they had less liking and moderate action
tendencies towards them. This further implies that advertising through YouTube by
commercial banks significantly influences consumer action, liking and awareness, in that
order, towards their services and products. Table 47 presents the results of the regression
analysis.
Table 47: Regression results of advertising through YouTube and consumers’
attitude
1) The Goodness –of- fit
Model R R Square
Adjusted R
Square
Std. Error of the
Estimate
1 (YouTube) .982 .964 .0111 .402
2) Overall significance
Model
Sum of
Squares df
Mean
Square F Sig.
1
Regression 41.563 11 3.7785 2.9112 .03156b
Residual 342.691 373 0.9187
Total 384.254 384
3) Individual Significance
Model
Unstandardized
Coefficients
Standardized
Coefficients
t Sig. B Std. Error Beta
1 (Constant) 3.185 .132 24.157 .000
YouTube .116 .143 .421 2.298 .002
Note: Significant at p<0.05 (95%CI); High F-value and t-value are considered
significant
a) Dependent Variable: Customers’ Attitude
b) Predictor: YouTube
According to the results in Table 47 (a) advertising through YouTube by the selected
banks had significantly high statistical variation (R2=0.964; 96.4 %) with a standard error
of estimate of 0.402 on consumers’ attitude. The standardized regression coefficient was
used as evaluate unit of measurement of the predictor and outcome variables. This
134
allowed the researcher to compare the relative effect of predictors measured on different
scales. The equation of regression that approximates advertising through YouTube on
consumers’ attitude was specified as follows:
𝑌 = 0.523 + 0.367𝑋1 + 𝜀
Where 𝛼 the constant is (intercept), 𝑌 is the consumer attitude, 𝑋1 is the advertisement
through YouTube and 𝜀 is the error term.
The calculation endorses that the Beta coefficient for advertising through YouTube is
positive and quite statistically significant to influence consumers’ attitude.
Comparison of the joint effect of advertisement through YouTube on consumers’ attitude
(Awareness, Liking, Action) by F-statistics according to Table 47 (b) shows high
significance (F=2.9112; P=0.03156). Thus, a large F-value and a small p-value means
YouTube had a high significant impact on consumers’ attitude. The study further tested
the hypothesis via Student's t-test to determine if to support or reject the hypothesis.
According to Table 47 (c) the standardized regression coefficient (β=0.511) value of
YouTube indicated a significantly high t-test value (t=2.298; p=0.002). A high t-value
indicates that the test statistics results are greater than the null hypothesis. From the
analysis, if the t-value increases with difference between the sample test data of the
correspondents using YouTube, then the null hypothesis is rejected. Accordingly, the
hypothesis “Advertising through YouTube has no statistically significant influence on
consumers’ attitude among selected commercial banks in Nairobi County, Kenya” is
rejected.
4.9.5 The influence of advertising through television on consumers’ attitude
The fourth objective of this study was to determine the influence of advertising through
Television on consumers’ attitude among selected commercial banks in Nairobi County,
Kenya. The following hypothesis was formulated: Ho4: Advertising through Television

135
has no statistically significant influence on consumers’ attitude among selected
commercial banks in Nairobi County, Kenya. The respondents were asked to indicate the
extent to which they agreed with statements of awareness, liking or acting based on their
banks carrying out advertisements on Television as a media channel. These statements
were then evaluated based on indicators of awareness, liking and action as a result of
bank adverts on TV. Correlation analysis was computed to determine the relationship
between advertising through TV and Consumers’ attitude (Awareness, Liking and
Action). Table 48 presents the results of analysis for the relationship
Table 48: Correlation analysis between advertising through TV and consumer
attitude (awareness, liking and action)
Consumer
awareness of
TV
advertisement
Consumer
liking of TV
advertisement
Consumer
action on TV
advertisement
Consumer
awareness of TV
advertisement
Pearson Correlation 1
Sig. (2-tailed) 0.000
N 384
Consumer liking
of TV
advertisement
Pearson Correlation 0.881 1
Sig. (2-tailed) 0.000 0.000
N 384 384
Consumer action
of TV
advertisement
Pearson Correlation 0.756 0.722 1
Sig. (2-tailed) 0.000 0.000 0.000
N 384 384 384
Note: r > 0.7 strong correlation; r < 0.6 moderate correlation; r< 0.5 low correlation
a) Correlation is significant at the 0.01 level (2-tailed).
b) Correlation is significant at the 0.05 level (2-tailed).
Table 48 indicates that there was a strong, positive and statistically significant (r=0.881,
p-value=.000) relationship between consumers’ awareness of advertisement on TV
media channel and consumers’ liking. Likewise, the relationship between consumers’
awareness of advertisement on TV media channel and consumers’ action tendencies was
strong, positive and statistically significant (r=0.756, p-value=.000). The relationship
between consumer liking the adverts carried out on TV and action tendencies towards

136
the adverts was also positive, significant and strong (r=0.722, p-value=.000). This
implies that advertising through TV by commercial banks significantly influences
awareness, liking and action, in that order, towards their services and products.
Table 49 presents the results of the regression analysis
Table 49: Regression results of advertising through TV and consumer attitude
1) The Goodness –of- fit
Model R R Square
Adjusted R
Square
Std. Error of the
Estimate
1 (Television) .978 .956 .012 .017
2) Overall significance
Model
Sum of
Squares df
Mean
Square F Sig.
1
Regression 46.132 15 3.076 4.8765 .0188b
Residual 338.039 369 0.9161
Total 384.171 384
3) Individual Significance
Model
Unstandardized
Coefficients
Standardized
Coefficients
t Sig. B Std. Error Beta
1 (Constant) 3.185 .132 24.157 .000
TV .613 .792 .689 6.334 .011
Note: Significant at p < 0.05 (95% CI); High F-value and t-value are considered
significant
a) Dependent Variable: Customer Attitudes
b) Predictor: Television
Unlike online media channels, the results in Table 49 (a) revealed that advertising
through TV by the selected banks had significantly high statistical variation (R2=0.956;
95.6%) with a low standard error of estimate (SEE= 0.017) in consumers’ attitude. The
standardized regression coefficient was used as an evaluate unit of measurement of the
predictor and outcome variables. This allowed the researcher to compare the relative
effect of predictors measured on different scales. The equation of regression that
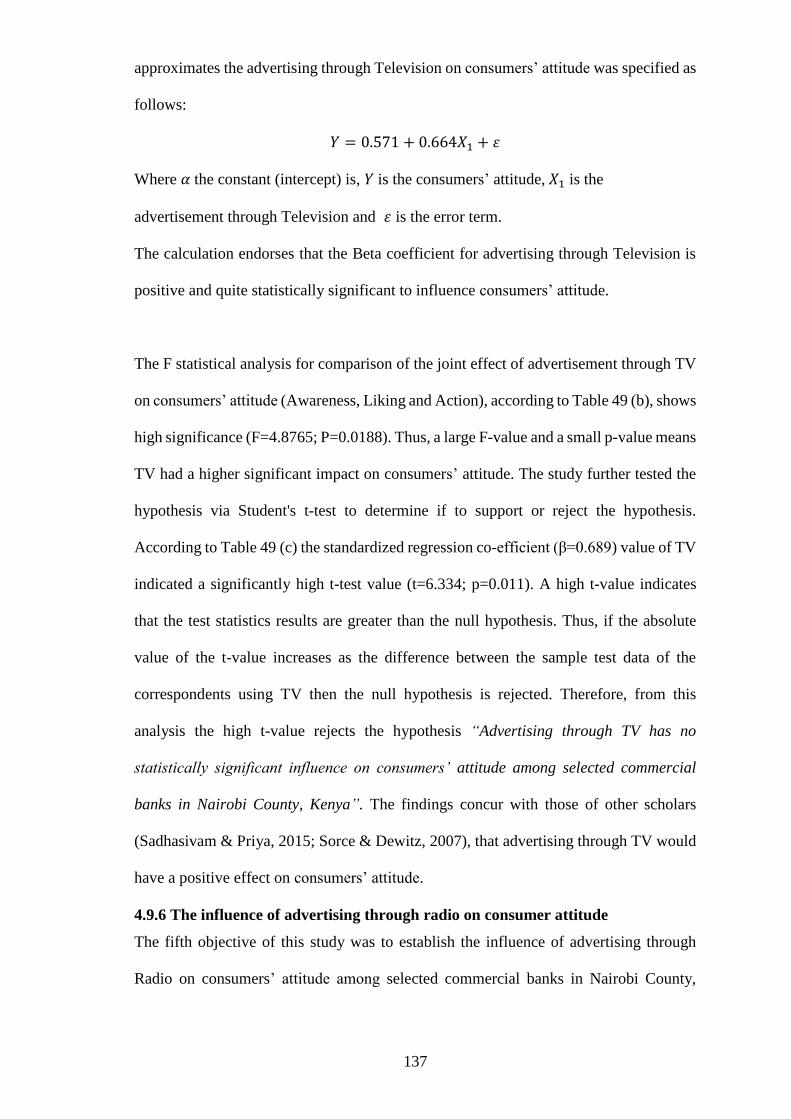
137
approximates the advertising through Television on consumers’ attitude was specified as
follows:
𝑌 = 0.571 + 0.664𝑋1 + 𝜀
Where 𝛼 the constant (intercept) is, 𝑌 is the consumers’ attitude, 𝑋1 is the
advertisement through Television and 𝜀 is the error term.
The calculation endorses that the Beta coefficient for advertising through Television is
positive and quite statistically significant to influence consumers’ attitude.
The F statistical analysis for comparison of the joint effect of advertisement through TV
on consumers’ attitude (Awareness, Liking and Action), according to Table 49 (b), shows
high significance (F=4.8765; P=0.0188). Thus, a large F-value and a small p-value means
TV had a higher significant impact on consumers’ attitude. The study further tested the
hypothesis via Student's t-test to determine if to support or reject the hypothesis.
According to Table 49 (c) the standardized regression co-efficient (β=0.689) value of TV
indicated a significantly high t-test value (t=6.334; p=0.011). A high t-value indicates
that the test statistics results are greater than the null hypothesis. Thus, if the absolute
value of the t-value increases as the difference between the sample test data of the
correspondents using TV then the null hypothesis is rejected. Therefore, from this
analysis the high t-value rejects the hypothesis “Advertising through TV has no
statistically significant influence on consumers’ attitude among selected commercial
banks in Nairobi County, Kenya”. The findings concur with those of other scholars
(Sadhasivam & Priya, 2015; Sorce & Dewitz, 2007), that advertising through TV would
have a positive effect on consumers’ attitude.
4.9.6 The influence of advertising through radio on consumer attitude
The fifth objective of this study was to establish the influence of advertising through
Radio on consumers’ attitude among selected commercial banks in Nairobi County,

138
Kenya. The following hypothesis was formulated: Ho5: Advertising through Radio has
no statistically significant influence on consumers’ attitude by selected commercial
banks in Nairobi County, Kenya. The respondents were asked to indicate the extent to
which they agreed with statements of awareness, liking or acting based on their banks
carrying out advertisements through Radio as a media channel. These statements were
then evaluated based on indicators of awareness, liking and action as a result of bank
adverts on Radio. Correlation analysis was computed to determine the relationship
between advertising through Radio and Consumers’ attitude (Awareness, Liking and
Action). Table 50 presents the results of the relationship.
Table 50: Correlation analysis between advertising through radio and consumer
attitude (awareness, liking and action)
Consumer
awareness of
Radio
advertisement
Consumer
liking of
Radio
advertisement
Consumer
action of
Radio
advertisement
Consumer
awareness of
Radio
advertisement
Pearson Correlation 1
Sig. (2-tailed) 0.000
N 384
Consumer liking
of Radio
advertisement
Pearson Correlation 0.753 1
Sig. (2-tailed) 0.000 0.000
N 384 384
Consumer action
on Radio
advertisement
Pearson Correlation 0.789 0.776 1
Sig. (2-tailed) 0.000 0.000 0.000
N 384 384 384
a) Correlation is significant at the 0.01 level (2-tailed).
b) Correlation is significant at the 0.05 level (2-tailed).
The results in Table 50 indicate that there was a strong, positive and statistically
significant (r=0.753, p-value=.000) relationship between awareness of adverts on Radio
and consumers’ attitude (liking). Similarly, there was a strong, positive and statistically
significant (r=0.789, p-value=.000) relationship between consumers’ awareness of
adverts on Radio and consumers’ attitude (action). The relationship was equally strong,
positive and statistically significant between advertising through radio on consumers’
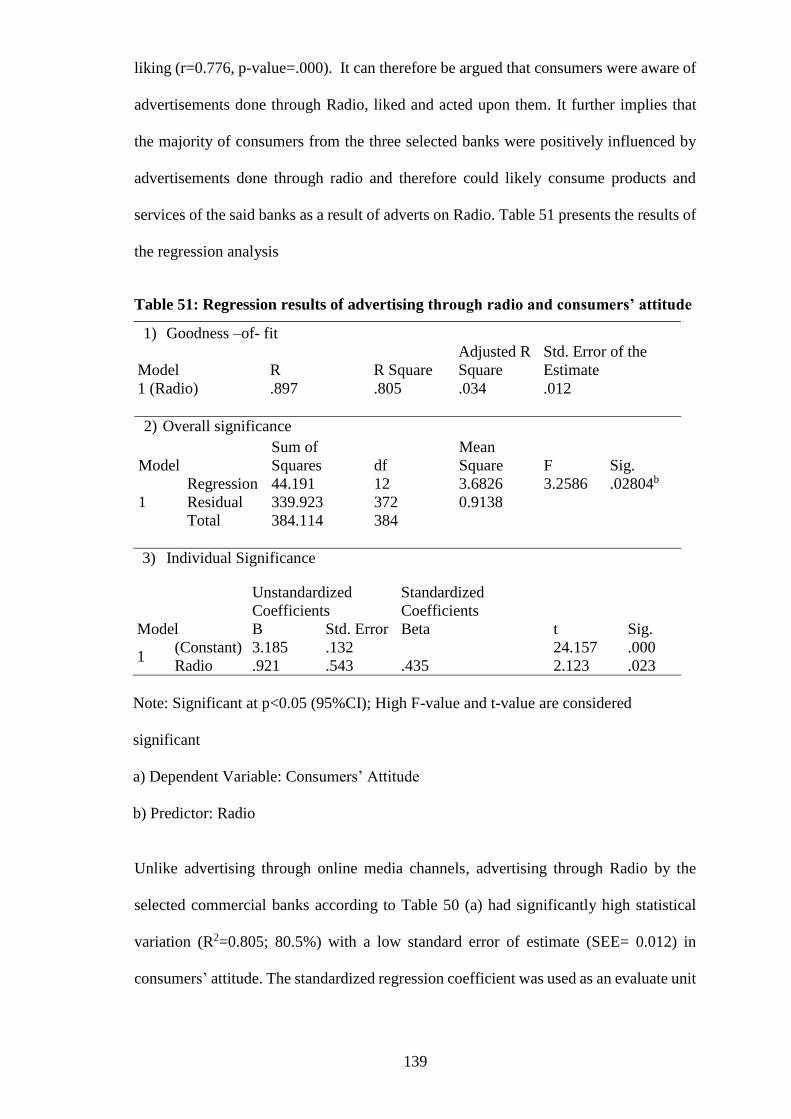
139
liking (r=0.776, p-value=.000). It can therefore be argued that consumers were aware of
advertisements done through Radio, liked and acted upon them. It further implies that
the majority of consumers from the three selected banks were positively influenced by
advertisements done through radio and therefore could likely consume products and
services of the said banks as a result of adverts on Radio. Table 51 presents the results of
the regression analysis
Table 51: Regression results of advertising through radio and consumers’ attitude
1) Goodness –of- fit
Model R R Square
Adjusted R
Square
Std. Error of the
Estimate
1 (Radio) .897 .805 .034 .012
2) Overall significance
Model
Sum of
Squares df
Mean
Square F Sig.
1
Regression 44.191 12 3.6826 3.2586 .02804b
Residual 339.923 372 0.9138
Total 384.114 384
3) Individual Significance
Model
Unstandardized
Coefficients
Standardized
Coefficients
t Sig. B Std. Error Beta
1 (Constant) 3.185 .132 24.157 .000
Radio .921 .543 .435 2.123 .023
Note: Significant at p<0.05 (95%CI); High F-value and t-value are considered
significant
a) Dependent Variable: Consumers’ Attitude
b) Predictor: Radio
Unlike advertising through online media channels, advertising through Radio by the
selected commercial banks according to Table 50 (a) had significantly high statistical
variation (R2=0.805; 80.5%) with a low standard error of estimate (SEE= 0.012) in
consumers’ attitude. The standardized regression coefficient was used as an evaluate unit

140
of measurement of the predictor and outcome variables. This allowed the researcher to
compare the relative effect of predictors measured on different scales. The equation of
regression that approximates advertising through Radio on consumers’ attitude was
specified as follows:
Y = 0.371 + 0.304X1 + ε
Where 𝛼 is the constant (intercept), 𝑌 is the consumer attitude, 𝑋1 is the advertisement
through Radio and 𝜀 is the error term.
The calculation endorses that the Beta coefficient for advertising through Radio is
positive and quite statistically significant to influence consumers’ attitude.
Comparison of the joint effect of advertisement through Radio on consumers’ attitude
(Awareness, Liking and Action) by F-statistics according to Table 50 (b) shows high
significance (F=3.2586; P=0.02804). Thus, a large F-value and a small p-value means
Radio had a higher significant impact on consumers’ attitude. The study further tested
the hypothesis via Student's t-test to determine if to support or reject the hypothesis.
According to Table 4.43(c) the standardized regression co-efficient (β=0.435) value of
Radio indicated a significantly high t-test value (t=2.123; p=0.023). A high t-value
indicates that the test statistics results are greater than the null hypothesis. Thus, if the
absolute value of the t-value increases as the difference between the sample data of the
correspondents using Radio then the null hypothesis is rejected. Therefore, from this
analysis the high t-value rejects the hypothesis “Advertising through Radio has no
statistically significant influence on consumers’ attitude among selected commercial
banks in Nairobi County, Kenya”

141
4.9.7 The influence of advertising through newspaper on consumers’ attitude
The sixth objective of this study was to establish the influence of advertising through
Newspaper on consumers’ attitude among selected commercial banks in Nairobi County,
Kenya. The following hypothesis was formulated: Ho6: Advertising through Newspaper
has no statistically significant influence on consumers’ attitude among selected
commercial banks in Nairobi County, Kenya. The respondents were asked to indicate the
extent to which they agreed with statements of awareness, liking or acting based on their
banks carrying out advertisements through Newspaper as a media channel. These
statements were then evaluated based on indicators of awareness, liking and action as a
result of bank adverts on Newspaper. Correlation analysis was computed to determine
the relationship between advertising through Newspaper and Consumers’ attitude
(Awareness, Liking and Action). Table 52 presents the results of the relationship.

142
Table 52: Correlation analysis between advertising through newspaper and
consumer attitude (awareness, liking and action)
Consumer
awareness of
Newspaper
advertisement
Consumer
liking of
Newspaper
advertisement
Consumer
action of
Newspaper
advertisement
Consumer
awareness of
Newspaper
advertisement
Pearson
Correlation
1
Sig. (2-tailed) 0.000
N 384
Consumer liking
of Newspaper
advertisement
Pearson
Correlation
0.887 1
Sig. (2-tailed) 0.000 0.000
N 384 384
Consumer action
on of Newspaper
advertisement
Pearson
Correlation
0.471 0.531 1
Sig. (2-tailed) 0.000 0.000 0.000
N 384 384 384
Note: Statistical interpretation: r>0.7: strong correlation; r<0.6: moderate correlation; r<
0.5: low correlation
a) Correlation is significant at the 0.01 level (2-tailed).
b) Correlation is significant at the 0.05 level (2-tailed).
The results in Table 52 indicate that the relationship between consumers’ awareness of
Newspaper advertising media and consumer attitude (liking) was strong, positive and
statistically significant (r=0.887, p-value=.000). However, the relationship between
advertising through Newspaper and consumers’ awareness and action tendency was
weak and positive (r=0.471, p-value=.000). The relationship between advertising through
Newspaper and consumers’ liking and action tendencies was moderate and positive
(r=0.531, p-value=.000). Thus, it can be argued that advertising through Newspaper
influences consumers’ awareness, liking but it is weak in influencing consumers’ action.
Table 53 presents the results of the regression analysis.

143
Table 53: Regression results of advertising through newspaper and consumers’
attitude
1) The Goodness –of- fit
Model R R Square
Adjusted R
Square
Std. Error of the
Estimate
1 (Newspaper) .729 .531 .022 .092
2) Overall significance
Model
Sum of
Squares df
Mean
Square F Sig.
1
Regression 38.283 8 4.7854 1.6718 .05501b
Residual 345.738 376 0.9196
Total 384.021 384
3) Individual Significance
Model
Unstandardized
Coefficients
Standardized
Coefficients
t Sig. B Std. Error Beta
1 (Constant) 3.185 .132 24.157 .000
Newspaper .734 .513 .451 1.002 .031
Note: Significant at p<0.05 (95%CI); High F-value and t-value are considered
significant
a) Dependent Variable: Customers’ Attitudes
b) Predictor: Newspaper
Unlike TV and Radio, advertising by the selected banks through Newspaper, according
to Table 53 (a), had significantly low statistical variation (R2=0.531; 53.1%) with a low
standard error of estimate (SEE= 0.092) in consumer attitude. The standardized
regression coefficient was used as evaluate unit of measurement of the predictor and
outcome variables. This allowed the researcher to compare the relative effect of
predictors measured on different scales. The equation of regression that approximates
advertising through Newspaper on consumers’ attitude was specified as follows:
Y = 0.271 + 0.249X1 + ε

144
Where 𝛼 is the constant (intercept), 𝑌 is the consumer attitude, 𝑋1 is the advertisement
through Newspaper and 𝜀 is the error term.
The calculation endorses that the Beta coefficient for advertising through Newspaper is
positive and quite statistically significant to influence consumers’ attitude. The study
applied the F-statistic to compare the joint effect of advertisement through Newspaper
on consumers’ attitude (Awareness, Liking and Action) as depicted in Table 53 (b)
showing low significance (F=1.6718; P=0.05501). Thus, a small F value and a large p-
value mean Newspaper had a less significant impact on consumers’ attitude. The study
further tested the hypothesis via Student's t-test to determine if to support or reject the
hypothesis. According to Table 53 (c) the standardized regression co-efficient (β=0.451)
value of Newspaper indicated a significantly low t-test value (t=1.002; p=0.031). A low
t-value indicates that the test statistics results are equal to the null hypothesis. Thus, if
the absolute value of the t-value decreases as the difference between the sample test data
of the correspondents using Newspaper then the null hypothesis is supported. Therefore,
from this analysis the low t-value supports the hypothesis “Advertising through
Newspaper has no statistically significant influence on consumers’ attitude among
selected commercial banks in Nairobi County, Kenya”.
4.9.8 The overall influence of advertising through media channels on consumers’
attitude
The study sought to establish the overall influence of online and offline media channels
on consumers’ attitude in order to inform the differences. Table 54 presents the results
for correlation analysis of online media channels and consumers’ attitude (awareness,
liking and action).

145
Table 54: Correlation analysis between advertising through online media channels and
consumers’ attitude
Consumer
awareness
Consumer
liking
Consumer
action
Facebook Google
Ads
YouTube
Consumer
awareness
Pearson
Correlation
1
Sig. (2-tailed) 0.000
N 384
Consumer
liking
Pearson
Correlation
0.423* 1
Sig. (2-tailed) 0.000 0.000
N 384 384
Consumer
action
Pearson
Correlation
0.671* 0.578* 1
Sig. (2-tailed) 0.000 0.000 0.000
N 384 384 384
Pearson
Correlation
0.599* 0.575 0.568* 1
Sig. (2-tailed) 0.000 0.000 0.000 0.00
N 384 384 384 384
Ads
Pearson
Correlation
0.411 0.471 0.598 0.776 1
Sig. (2-tailed) 0.000 0.000 0.000 0.00 0.00
N 384 384 384 384 384
YouTube
Pearson
Correlation
0.767* 0.574 0.501 0.474 0.565 1
Sig. (2-tailed) 0.000 0.000 0.000 0.00 0.00 0.00
N 384 384 384 384 384 384
Note: Statistical interpretation: r>0.7: strong correlation; r<0.6: moderate correlation; r< 0.5:
low correlation
** Correlation is significant at the 0.01 level (2-tailed).
* Correlation is significant at the 0.05 level (2-tailed).
The results in Table 54 indicate that the influence of advertising through Facebook on
consumers’ attitude (awareness) is moderate and positive (r=0.599, p-value= 0.000).
Similarly, the influence of advertising through Facebook on consumers’ attitude (liking)
was found to be moderate and positive (r=0.575, p-value =.000). The influence of
advertising through Facebook on consumers’ attitude (action) was found to be moderate
and positive (r=0.568, p-value =.000). The finding further indicated that the influence
of advertising through YouTube on consumers’ attitude (awareness) was strong and
146
positive (r=0.776, p-value= 0.000). Similarly, the influence of advertising through
YouTube on consumers’ attitude (liking) was moderate and positive (r=0.574, p-value
=.000). The influence of advertising through YouTube on consumers’ attitude (action)
was moderate and positive (r=0.501, p-value =.000). The results also indicate that the
influence of advertising through Google Ads on consumers’ attitude (awareness) was
found to be weak and positive (r=0.411, p-value= 0.000). Likewise, the influence of
advertising through Google Ads on consumers’ attitude (liking) was weak and positive
and statistically significant (r=0.471, p-value =.000). In addition, the influence between
Google Ads and consumer attitude (action) was moderate and positive (r=0.598, p-value
=.000). Table 55 presents the results of linear regression analysis

147
Table 55: Regression results of advertising through online media channels and
consumers’ attitude
1) Goodness -of-fit
Model R
R
Square
Adjusted
R
Square
Std. Error of
the Estimate
Change Statistics
R Square
Change F Change df1 df2
Sig. F
Change
1 (Facebook) .719 .517 .0014 .692 .183 8.331 10 373 .028
2 (YouTube) .982 .964 .0111 .402 .195 6.832 13 370 .014
3 (Google Ads) .886 .785 .0021 .611 .101 1.416 11 372 .034
2) Overall significance
Model Sum of Squares df Mean Square F Sig.
1
Regression 45.511 8 5.689 1.406 .0064b
Residual 338.601 376 0.901
Total 384.112 384
3) Individual significance
Model
Unstandardized
Coefficients
Standardized
Coefficients
t Sig.
95.0% Confidence
Interval for B
VIF B
Std.
Error Beta
Lower
Bound
Upper
Bound
(Constant) 3.185 .132 24.157 .000 1.214 2.261 Facebook .193 .176 .511 2.113 .012 .272 .125 1.341 YouTube .116 .143 .421 2.298 .002 .159 .040 1.122 Google Ads .155 .122 .432 1.132 .011 .144 .031 1.011
Note: Significant at p<0.05 (95%CI); High F-value and t-value are considered significant
a) Dependent Variable: Customer Attitudes
b) Predictor: Online media channel (Facebook, YouTube, Google Ads)
From the results (Table 55 a) YouTube had a high significance in influencing
consumers’ attitude compared to other channels with a statistically variation of 96.4 %
(R2=.964) in consumers’ attitude compared to Google Ads and Facebook which had a
statistical variation of 78.5% (R2=.785) and 51.7% (R2=.517) respectively. The
standardized regression coefficient was used as an evaluate unit of measurement of the
predictor and outcome variables. This allowed the researcher to compare the relative
effect of predictors measured on different scales. The equation of regression that

148
approximates advertising through online media channel on consumers’ attitude was
specified as follows:
Y = 0.471+0.514X1 + ε
Where 𝛼 is the constant (intercept), 𝑌 is the consumer attitude, 𝑋1 is the advertisement
through online media channel and 𝜀 is the error term.
The calculation endorses that the Beta coefficient for advertising through online media
channels is positive and quite statistically significant to influence consumers’ attitude.
The study compared statistical models (Facebook, YouTube and Google Ads) on fitted
data set to identify the online media channels that influence the consumer attitude.
Overall, the model revealed that there was statistically no significant relationship
between advertising through online media channels and consumers’ attitude (F=1.406,
p-value=.00064). The Beta coefficients for all the online advertising media channels
were positive, statistically less significant. Individual significance however, revealed that
YouTube significantly (p=0.002) highly influenced the consumer attitude compared to
other online channels under the study.
The study further evaluated the overall influence of offline media channels on
consumers’ attitude. Table 56 presents the results for correlation analysis of consumer
attitude (awareness, liking and action) and offline media channels results.

149
Table 56: Correlation analysis between advertising through offline media channels
and consumers’ attitude
Consumer
awareness
Consumer
liking
Consumer
action TV Radio Newspaper
Consumer
awareness
Pearson Correlation 1
Sig. (2-tailed) 0.00
N 384
Consumer
liking
Pearson Correlation 0.789* 1
Sig. (2-tailed) 0.000 0.000
N 384 384
Consumer
action
Pearson Correlation 0.834* 0.518* 1
Sig. (2-tailed) 0.000 0.000 0.000
N 384 384 384
TV
Pearson Correlation 0.799* 0.898 0.718* 1
Sig. (2-tailed) 0.000 0.000 0.000 0.000
N 384 384 384 384
Radio
Pearson Correlation 0.659* 0.681 0.778* 0.672 1
Sig. (2-tailed) 0.000 0.000 0.000 0.000 0.000
N 384 384 384 384 384
Newspaper
Pearson Correlation 0.611* 0.593 0.678* 0.534 0.672 1
Sig. (2-tailed) 0.000 0.000 0.000 0.000 0.000 0.000
N 384 384 384 384 384 384
Note: Statistical interpretation: r>0.7: strong correlation; r<0.6: moderate correlation; r< 0.5: low
correlation
** Correlation is significant at the 0.01 level (2-tailed).
* Correlation is significant at the 0.05 level (2-tailed).
This study also sought to establish the relationship between advertising through offline
media channel and consumer attitude. The results in Table 56 indicate that the
relationship between consumer attitude (awareness) and advertising through TV was
strong, positive and statistically significant (r=0.799, p-value= 0.000). Similarly, the
relationship between consumer attitude (liking) and advertising through TV was
stronger, positive and statistically significant (r=0.898, p-value =.000). On the other
hand, the relationship between advertising through TV and consumer attitude (action)
was strong, positive and statistically significant (r=0.718, p-value =.000). The findings
further indicated that the relationship between advertising through Radio and consumer
attitude (awareness) was moderate, positive and statistically significant (r=0.659, p-
value= 0.000).

150
The relationship between advertising through Radio and consumer attitude (liking) was
strong, positive and statistically significant (r=0.681, p-value =.000). The influence of
advertising through radio on consumer attitude (action) was moderate strong, positive
and statistically significant (r=0.778, p-value =.000). The results also indicate that the
relationship between advertising through Newspaper and consumer attitude (awareness)
was moderate, positive and statistically insignificant (r=0.611, p-value= 0.000).
Likewise, the relationship between advertising through newspaper and consumer attitude
(liking) was moderate, positive and statistically significant (r=0.593, p-value =.000). The
relationship between advertising through newspaper and consumer attitude (action) was
moderate, positive and statistically significant (r=0.678, p-value =.000). This implies
that advertising through TV and Radio plays a strong influence on consumer attitude in
the selected banks in Nairobi County, whereas Newspaper plays a low influence.
Table 57 presents the results for the linear regression analysis.

151
Table 57: Regression Results of advertising through offline media channels and
consumer attitude
1) Goodness -of-fit
Model R
R
Square
Adjusted
R
Square
Std. Error of
the Estimate
Change Statistics
R Square
Change F Change df1 df2
Sig. F
Change
1 (TV) .978 .956 .012 .017 .198 9.541 10 373 .003
2 (Radio) .897 .805 .034 .012 .216 7.914 13 370 .011
3 (Newspaper) .729 .531 .022 .092 .111 1.681 9 374 .010
2) Overall significance
Model Sum of Squares df Mean Square F Sig.
1
Regression 48.243 10 4.8243 2.072 .002b
Residual 335.857 372 .9028
Total 384.10 382
3) Individual significance
Model
Unstandardized
Coefficients
Standardized
Coefficients
t Sig.
95.0% Confidence
Interval for B
VIF B
Std.
Error Beta
Lower
Bound
Upper
Bound
(Constant) 3.185 .132 24.157 .000 1.534 2.465
TV .613 .792 .689 6.334 .011 .368 .118 1.331
Radio .921 .543 .435 2.123 .023 .178 .043 1.129
Newspaper .734 .513 .451 1.002 .031 .164 .061 1.015
Note: Significant at p<0.05 (95%CI); High F-value and t-value are considered significant
a) Dependent Variable: Consumer Attitude
b) Predictor: Offline media channel
According to Goodness of -fit analysis (Table 57 a) TV significantly influenced
consumer attitude with a statistical variation of 95.6 % in consumer attitude (R2=.95.6)
compared to Radio and Newspaper which had a statistical variation of 80.5 % (R2=.805)
and 53.1% (R2=.531) respectively. The standardized regression coefficient was used as
an evaluate unit of measurement of the predictor and outcome variables. This allowed
the researcher to compare the relative effect of predictors measured on different scales.
The equation of regression that approximates advertising through offline media on
consumers’ attitude was specified as follows:
Y = 0.493 + 0.514𝑋1 + 𝜀

152
Where 𝛼 is the constant (intercept), 𝑌 is the consumer attitude, 𝑋1 is the advertisement
through offline media channel and 𝜀 is the error term.
The calculation endorses that the Beta coefficient for advertising through offline media
channels is positive and quite statistically significant to influence consumers’ attitude.
The study further compared statistical models (Radio, TV and Newspaper) on fitted data
set to identify the offline media channel that highly influenced consumers’ attitude. The
overall model (Table 57 b) revealed that there was a statistically significant relationship
between advertising through offline media channels and consumers’ attitude (F=2.072,
p-value=.002). From the analysis large F-value indicates a significant test. The Beta
coefficient for all the offline advertising media channels was positive and statistically
significant. Individual significance (Table 57c) revealed that TV had greater significant
influence (t=6.334; p=0.011) on consumers’ attitude. Offline media channels in this
study were found to be the most influential platforms compared to online channels and
were thus preferred by a majority of the respondents from selected commercial banks,
therefore giving a clear indication of their effectiveness in influencing consumers’
attitude.
4.9.9 Influence of the moderating effect of age on advertising through online and
offline media channels on consumers’ attitude.
The seventh objective of this study sought to assess the differences in moderating effect
of age on advertising through online and advertising through offline media channels on
consumers’ attitude by selected commercial banks in Nairobi County, Kenya. The
hypothesis, H07: There are no statistically significant differences of moderating effect of
age on advertising through online and advertising through offline media channels on
consumers’ attitude among selected commercial banks in Nairobi County, Kenya. This
analysis tested the effect of moderating variable (Age) on the independent variables
(online and offline media channels) as well as the dependent variable (consumers attitude

153
sub constructs of awareness, liking and action). Advertising media channel and age
measures were first centred and a single item indicator representing the product of the
two measures was then calculated to create an interaction term. Table 58 presents the
regression results of the moderating effect of age.
Table 58: Regression results of the moderating effect of age
1) Goodness of fit
Model R R
Square
Adjusted
R Square
Std. Error of
the Estimate
Change Statistics
R2
Change
F
Change
df1 df2 Sig. F
Change
1 (Online media channel) .772 .596 .174 .950 .0312 1.292 10 374 .00018
2 (Offline media channel) .886 .785 .261 .755 .0616 3.018 12 372
.00010
2) Overall significance
Model Sum of Squares df Mean Square F Sig.
1 (Online media channel)
Regression 37.195 9 4.133 2.178 .0042b
Residual 346.96 375 0.925
Total 384.155 384
2 (Offline media channel)
Regression 35.295 11 3.209 3.428 .0027b
Residual 348.717 373 0.935
Total 384.012 384
3) Individual significance
Model Unstandardized
Coefficients
Standardized
Coefficients
t Sig. B Std. Error Beta
1
(Constant) 12.765 8.177 1.561 .012101
Online media channel .235 .176 .120 1.334 .000022
Respondent age .101 .073 .122 1.380 .000014
Product of online media channel and age .024 .013 .015 1.441 .000011
2
(Constant) 2.318 6 .386 .795 .022101
Offline media channel .235 .166 .115 1.531 .000014
Respondents age .123 .044 .111 2.991 .000019
Product of Offline Media channel and age .0289 0.007 0.013 1.721 .000010

154
Note: Significant at p<0.05 (95%CI)
Dependent Variable: Consumers’ attitude
1. Predictors: (Constant), Age* media channel
2. Predictors: (Constant), Age* media channel
Table 58 shows that online media channels and age explained 59.6 % of the variation in
consumers' attitude (R2=.596). This indicated that the R2 change increased by 0.031%
when the interaction variable (online media channel x age) was added and that there was
a statistically significant change (α=.05; p-value=.00018). This analysis indicates that
there is a significant relationship between online media channel, age and the interaction
(F=2.178, p value=.0042).
On the other hand, offline media channels and age explained 78.5% of the variation in
consumer attitude (R2=.785). The results on changed statistics reveal that the R2 change
increased by 0.0616% when the interaction variable (offline media channel x age) was
added and that there was a statistically significant change (α=.05; p-value=0.00010). The
results show a statistically significant relationship between offline media channel and
age with the interaction (F=3.428; p value=0.0027). The results in model 1 Table 58 (c)
show statistically significant regression co-efficient for advertisement on online media
channel (t=1.334, p-value=.000022) indicating that there was a dependency of age and
consumer attitude towards access to bank advertisement. On the other hand, there was a
statistically significant relationship between age and advertisements done through offline
channels on consumer attitude (t=1.531, p-value=.000014). Similarly, a statistically
linear relationship of consumers’ attitude towards media channel on the multiplicative
term of online media channel and age was detected (t=1.441, p=.000011). Whereas

155
multiplicative term of the offline media channel and consumer characteristics was
detected (t=1.721, p=.000010). Similarly, a statistically linear relationship of consumers
age on the relationship between bank advertisement on the multiplicative term of the
media channel and consumer’s attitude was detected (β=.209, p=.020). This implies that
change in consumer age positively and significantly affects the media channel and
consumers’ attitude relationship as the direction of the relationship is positive.
From the current research findings, the multiple regression equation used to estimate the
moderating effect of consumers’ age on media channels and consumers’
attitude is stated as follows:
𝑌 = 0.833 + 0.297𝑋1 + 0.331𝑍 + 0.209𝑋𝑍 + 𝜀
where 𝛼 is the constant (intercept), 𝑌 is the consumer attitude, 𝑋1 is the advertisement
media channel and 𝜀 is the error term 𝑍 is the consumer age, 𝑋𝑍 is the product of
media channel and consumers age.
This implies that age positively and significantly affect the use of offline media channel
and consumers’ attitude relationship. From the analysis, it was established that the Beta
coefficients for advertisement media channel, age and product of advertisement media
channel had a statistically significant influence of age as moderating result on consumers’
attitude showing differences in the multiplicative effect on media channel type, thus
rejecting the hypothesis “There are no statistically significant differences of moderating
effect of age on the relationship between advertising through online and offline media
channels on consumers’ attitude among selected commercial banks in Nairobi County
Kenya”.

156
4.9.10. Summary results of hypotheses testing.
Table 59 outlines in summary the outcome of hypothesised relationships and the overall
decision of the hypotheses tests undertaken in this study.
Table 59: Summary results of hypotheses testing
Test Hypothesis Test Statistics Decision
H01: Advertising through Facebook has no statistically significant
influence on Consumers’ attitude in selected commercial banks in
Nairobi County, Kenya,
R2=0.517
Accept H01
F-value=1.4085
P-value =0.0658
t-value = 1.132
H02: Advertising through Google Ads has no statistically
significant influence on Consumers’ attitude in selected
commercial banks in Nairobi County, Kenya.
R2=0.785
Accept H02
F-value=0.3215
P-value =0.03441
t-value = 2.113
H03: Advertising through YouTube has no statistically significant
influence on Consumers’ attitude in selected commercial banks in
Nairobi County, Kenya.
R2= 0.964
Reject H03
F-value= 2.9112
P-value = 0.03156
t-value = 2.298
H04: Advertising through TV has no statistically significant
influence on Consumers’ attitude in selected commercial banks in
Nairobi County, Kenya.
R2= 0.956
Reject H04
F-value= 4.8763
P-value = 0.0188
t-value =6.334
H05: Advertising through Radio has no statistically significant
influence on Consumers’ attitude in selected commercial banks in
Nairobi County, Kenya.
R2= 0.805
Reject H05
F-value= 3.2586
P-value =0.02804
t-value =2.123
H06: Advertising through Newspaper has no statistically
significant influence on Consumers’ attitude in selected
commercial banks in Nairobi County, Kenya.
R2=0.531
Accept H06
F-value = 1.6718
P-value = 0.05501
t-value = 1.002
H07: There are no statistically significant differences of
moderating effect of age on the relationship between advertising
through online and offline media channels on consumers’ attitude
in selected commercial banks in Nairobi County, Kenya.
Online Media
Reject H07
R2=0.772
F-value=2.178
P-value = 0.042
t-value = 1.380
Product t-value=1.441
Offline Media
Reject H07
R2=0.886
F-value=3.428
P-value =0.027
t-value =2.991
Product t-value= 1.721
In summary; advertising through Facebook by selected commercial banks in Nairobi
County, Kenya, is not statistically significant on consumers’ attitude, which implies that
consumers’ attitude is not affected by advertising through Facebook. Advertising through
Google Ads by selected commercial banks in Nairobi County, Kenya, is not statistically
significant on consumers’ attitude, implying that consumers’ attitude is not affected by
advertising through Google Ads. Advertising through YouTube by selected commercial

157
banks in Nairobi County, Kenya, is statistically significant on consumers’ attitude, which
indicates that consumers’ attitude is influenced by advertising through YouTube.
Advertising through TV by selected commercial banks in Nairobi County, Kenya, is
statistically significant on consumers’ attitude, implying that consumers’ attitude is
affected by advertising through TV. Advertising through Radio by selected commercial
banks in Nairobi County, Kenya, is statistically significant on consumers’ attitude,
showing that consumers’ attitude is positively influenced by advertising through Radio.
Advertising through Newspaper by selected commercial banks in Nairobi County,
Kenya, is not statistically significant on consumers’ attitude, which implies that
consumers’ attitude is not affected by advertising through Newspaper. Lastly, there exists
no statistical significant differences of moderating effect of age on advertising through
online and offline media channels on consumers’ attitude as used by selected commercial
banks in Nairobi County, Kenya.
4.10 Discussion
This section discusses the findings of the results in a larger perspective and will discuss
them in sub-sections of: Influence of advertising through online media channels on
consumers’ attitude; Influence of advertising through offline media channels on
consumers’ attitude and finally moderating effect of age on online and offline media
channels on consumers’ attitude. These discussions are based on the original conceptual
framework, to test empirical relationships among the variables in relation to the
hypotheses.
4.10.1 Relationship between advertising through online media channels and
consumers’ attitude
One of the main aims of this study was to establish the influence of advertising through
online media channels (Facebook, Google Ads and YouTube) on the attitude of
consumers from selected commercial banks in Nairobi County. Overall, the results

158
revealed that there was no statistically significant influence of advertisements done
through online channels on consumers’ attitude. Consumer liking (affection) of
advertisements in online media channels (Facebook, YouTube and Google Ads) was
relatively low compared to offline media channels. Similarly, the influence of
advertisements done through Facebook and YouTube on consumer attitude (action) was
slightly low compared to those done through Google Ads. This study therefore concludes
that online media channels are strong for influencing consumer awareness but low in
influencing liking and action. (See Table 59). These results could be attributed to
inadequate internet accessibility, high cost of internet bundles and poor network
connectivity from some internet providers unlike the offline media channels (TV and
Radio), which could be cheap (save for newspaper) and easy to access in Nairobi County.
4.10.2 Relationship between advertising through offline media channel and
consumers’ attitude
This study further sought to broadly establish the influence of advertising through offline
media channels (TV, Radio and Newspaper) on the attitude of consumers from selected
commercial banks in Nairobi County. The results revealed that the influence of
advertising through offline media channels was strong, positive and statistically
significant on consumer awareness for TV and Radio. In contrast, there was a weak
influence of advertising through Newspaper on consumer awareness. Overall, the high
influence achieved through these two offline channels of TV and Radio could be
attributed to the ease of understanding information, affordability and accessibility of the
channels. In addition, most of the advertisements on TV and Radio were often easy to
understand and attractive as the three selected banks often use celebrities in their
advertisement, therefore enhancing consumer cognition of the advertised products and
services. The consumers’ liking of the media channels used by the selected commercial
159
banks was also assessed and according to the results, there was strong relationship
between use of offline channels particularly TV and Radio on consumer liking .In the
current study, it was observed that there was insignificance relationship between
advertising through Newspaper on consumer liking. This indicated that majority of the
consumers had high affection for watching TV and listening to Radio; on the other hand
consumers tend to have low affection on reading Newspapers probably due to cost of
buying newspaper.
The study further sought to establish the relationship between advertising through offline
channels on consumer action tendencies and the results revealed that there was strong
relationship between the consumer action tendencies on bank advertisement done
through TV and Radio unlike reading Newspaper which recorded low relationship. This
findings demonstrate that consumers have high tendencies to access bank advertisement
through TV and Radio, and this could be attributed to affordability, accessibility and ease
of understanding advertisement contents in these channels which are done in simple and
elaborate manner (see Table 59). Generally, these findings demonstrate that the most
effective offline media channel that can influence consumers’ actions; and can be
considered by marketers in the three selected commercial banks are TV and Radio. A
similar study by Chen (2010) notes that the rational or cognitive factor of advertising in
the media channels is the perceived media channels which tend to be evaluated based on
the technological advancement, prestige, workmanship, economic status and service
offered (Sharma, 2011)
4.10.3 Relationship between advertising through media channel, consumers’ age
and consumers’ attitude
The study further established that there was a positive and statistically significant
relationship between consumers’ age on both online and offline advertising channels and

160
consumers’ attitude. Age was found to influence consumers’ attitude specifically
awareness, liking and action by 68%. Correlation analysis revealed that there is a strong
and significant relationship between advertising through offline media, consumers’ age
and consumers’ attitude. It can therefore be argued that bank consumers falling in the
age cohort of 30 years to 49 years and those above 50 years prefer to use offline media
channels compared to younger individual below 29 years. In conclusion, this study
affirms that there is a moderating effect of age on the relationship between advertising
through media channels and consumer attitude.
The results revealed that there is a strong, positive and statistically significant moderating
effect of age on the relationship between advertising through offline media channel and
consumer attitude. The findings further indicated that offline media channels and age
combined constituted a 68 % variation in influencing consumer attitude; but the
introduction of the moderating effect of age increased variation by 13.1 % to 81.1 %. It
can therefore be argued that the change in consumers’ age positively and significantly
affects the influence of offline media channels on consumers’ attitude. In addition, this
implies that as the consumers’ age increases, they are likely to increase their preference
to access bank advertisements through offline media channels in view of their growth in
age and social status. This therefore, means that age contributes to the highest moderating
influence.
The study further sought to establish the moderating effect of age on the relationship
between advertising through online media channels and consumers’ attitude. The results
revealed a positive and statistically significant moderating effect of age on the
relationship between advertising through online media channel and consumers’ attitude.
In addition, combined online media channels and age constituted a 57 % variation in
consumers’ attitude; but the introduction of the moderating effect of age increased

161
variation by 16.1 % to 73.1 %. This implies that the change in consumers’ age positively,
significantly and slightly affects the influence of the relationship between advertising
through online media channels on consumers’ attitude. This analysis therefore supports
the argument that as the consumers’ age decreases, they are likely to increase their
preference to access bank advertisements through online media channels in view of their
youthful age and social environments.
In summary, the findings demonstrated that the consumers’ age, moderate the
relationship between advertising through media channels (online and offline) as used by
the selected commercial banks in Nairobi County on consumers’ attitude. The study
revealed that the majority of the commercial bank’s consumers were between the ages of
30-49 years and therefore their responses could be relied upon to exigent conclusions.
The study further sought to establish the highest level of education attained by the bank
consumers. The results revealed that the majority had a relatively high level of
qualification as they held a university first degree, college diploma certificates,
secondary certificate, and postgraduate degrees, with just a few having up to primary
schooling. This implied that the respondents had the relevant knowledge on media
channels used for advertisements by the selected commercial banks in Nairobi County
and, therefore, their responses could be relied upon to make study conclusions. In
addition, there was a statistically significant (P<0.05) relationship between media
channels and consumers’ attitude, with the moderating effect of consumers’ age on the
relationship also confirmed to be significant.
4.11 Summary of the chapter
This chapter presented the results of the research variables and how the hypotheses tests
were calculated in order to realise the objectives. The results were measured based on

162
the 0.05 significance level between the key variables of the study, which were advertising
through media, consumers’ attitude and age of the consumer.
The discussions and analysis of the results were consistent with the theoretical and
empirical studies discussed in chapter two. This was done in consideration of the
philosophy adopted, which was positivistic in nature and therefore was able to explain
the relationship between the variables under this study. The results comprised of
validating, testing reliability and piloting of the data collection instruments, descriptive
statistics and inferential statistics and finally, testing of the formulated hypotheses for the
study.

163
CHAPTER FIVE
CONCLUSION AND RECOMMENDATIONS
5.1 Introduction
This chapter revisits the major findings of the study, the discussions and conclusions
realised. The chapter further highlights the limitations of the study and outlines the
proposed areas for future study. The first objective was to determine the influence of
advertising through Facebook on consumers’ attitude by selected commercial banks in
Nairobi County, Kenya. The second objective was to determine the influence of
advertising through Google Ads on consumers’ attitude by selected commercial banks in
Nairobi County, Kenya. The third objective was to establish the influence of advertising
through YouTube on consumers’ attitude by selected commercial banks in Nairobi
County, Kenya. The focus of the fourth objective was to determine the influence of
advertising through TV on consumers’ attitude by selected commercial banks in Nairobi
County, Kenya. The fifth objective was to determine the influence of advertising through
Radio on consumers’ attitude by selected commercial banks in Nairobi County, Kenya.
The sixth objective was to establish the influence of advertising through Newspaper on
consumers’ attitude by selected commercial banks in Nairobi County, Kenya. Finally,
the seventh objective was to determine the differences of moderating effect of age on
advertising through online and offline media channels on consumers’ attitude by selected
commercial banks in Nairobi County, Kenya on consumers’ attitude.
5.2 Summary of the findings
The aim of the study was to examine the influence of advertising through media on
consumers’ attitude and to compare the online channels (Facebook, Google Ads and
YouTube) and offline channels (Radio, Television and Newspaper) used by selected
commercial banks in Nairobi County, Kenya. The study had a target population of

164
5,597,715 consumers banking in selected commercial banks (Equity Bank, Kenya
Commercial Bank and Co-operative Bank) in Nairobi County, Kenya. The research
design was a descriptive cross-sectional survey that used a quantitative data collection
method.
This research sampled 384 consumers from the three selected commercial banks in
Nairobi County. General information from respondents revealed that majority of the
respondents holding accounts with the three selected commercial banks were aged
between 30-49 years and could therefore be relied upon to make comprehensive
conclusions about the study. The study also sought to establish the gender and the highest
level of education attained by the respondents. The results indicated that the majority of
the respondents were male, with a more than 50% response rate in each bank. On the
level of education, the majority of the respondents were degree holders (>40%), followed
by the diploma and secondary school certificate holders (>25%), whereas the minority
respondents were primary school certificate holders (<5%). This implies that most of the
account holders from the selected commercial banks in Nairobi County, Kenya were
aged 30-49 years, male and degree holders.
On the advertising media channel construct, the findings revealed that an overwhelming
majority of the respondents from Equity and Co-operative banks 70 (55.47%) and 52
(40.63%), respectively, mentioned they used offline media channels to access bank
advertisements. This was in contrast with the Kenya Commercial Bank consumers where
majority 78 (60.94%) of the respondents mentioned that they used online media channels
to access bank advertisements. In order of preference, the results indicated that TV,
Radio, Google Ads, YouTube, Facebook and Newspaper were ranked as 1st, 2nd, 3rd, 4th,
5th and 6th position, respectively. This implied that consumers highly preferred watching

165
TV as a media channel compared to other media platforms. This means that offline
channels are still critical to consumers in the banking industry. It can also be deduced
that advertising through TV, Radio and YouTube could have a high and strong influence
on consumers’ attitude. The findings contradict other studies (Nayak, 2015; Devi 2012
& Sorce, 2007) that showed Newspaper as the most preferred media channel to advertise
through by marketers with the belief that consumers like them.
The current research also sought to find out and compare the overall effect of advertising
through online and offline media channels on consumers’ attitude. The results showed
that the mean scores for offline media on awareness (3.552), liking (3.491) and action
(3.454) were higher compared to online mean scores at awareness (3.023), liking (2.913)
and action (2.881). This means that advertising through offline media channels will tend
to be more effective compared to online mediums having scored higher mean scores in
all sub-constructs of consumers’ attitude of awareness, liking and action. In comparison
of specific media channels; online platforms of Facebook and Google ads were found to
strongly influence awareness and moderately influence liking and action sub constructs
of consumer’s attitude. This was different for YouTube which strongly influenced action.
Offline media channels of Television and Radio were found to strongly influence all the
sub constructs of consumers’ attitude whereas Newspaper was found to be moderate in
influencing awareness and liking but weak on action sub construct of consumer’s
attitude.
5.3 Conclusion
This study affirms the assertion that advertising through online media channels and
offline media channels influences consumers’ attitude among the selected commercial
banks in Nairobi County, with different significance levels registered per channel. The
first objective was to examine the influence of advertising through Facebook on

166
consumers’ attitude by selected commercial banks in Nairobi County. The results
revealed that though consumers were aware of the advertisements done through
Facebook, this channel had a statistically low significant influence on consumers’
attitude, showing low liking and action and a very strong influence on awareness sub
constructs of attitude. Linear regression analysis indicated a low Beta coefficient for
Facebook therefore not statistically significant to influence consumers’ attitude. The
hypothesis that the advertising through Facebook has no statistically significant influence
on consumers’ attitude among selected commercial banks in Nairobi County, Kenya is
therefore supported.
The second objective sought to determine the influence of advertising through Google
Ads on consumers’ attitude among selected commercial banks in Nairobi County. Again,
results showed that though respondents were aware of advertising through Google Ads,
the channel had a statistically low significant influence on consumers’ attitude; recording
low liking and low action sub construct of consumer’s attitude. Linear regression analysis
indicated a low Beta coefficient for Google Ads therefore not statistically significant to
influence consumers’ attitude. The hypothesis that advertising through Google Ads has
no statistically significant influence on consumers’ attitude among selected commercial
banks in Nairobi County has no statistically significant influence on consumers’ attitude
is therefore supported.
The third objective set to determine the influence of advertising through YouTube on
consumers’ attitude among selected commercial banks in Nairobi County, Kenya.
Results revealed that advertising through YouTube was statistically significant on
consumers’ attitude with all indicators scoring highly on consumer awareness, however,
moderate on consumer liking and consumer action. Linear regression analysis indicated

167
a relatively moderate Beta coefficient for YouTube therefore statistically significant to
influence consumer attitude. The hypothesis that advertising through YouTube has no
statistically significant influence on consumers’ attitude among selected commercial
banks in Nairobi County, Kenya is therefore not supported.
The fourth objective sought to determine the influence of advertising through TV on
consumers’ attitude among selected commercial banks in Nairobi County. Results
revealed that advertising through TV was statistically significant in influencing
consumers’ attitude with all indicators scoring highly on consumer awareness, consumer
liking and consumer action. Linear regression analysis indicated a relatively high Beta
coefficient for TV therefore statistically significant to influence consumers’ attitude. The
hypothesis that advertising through TV has no statistically significant influence on
consumers’ attitude among selected commercial banks in Nairobi County, Kenya is
therefore not supported.
The fifth objective set to determine the influence of advertising through Radio on
consumers’ attitude among selected commercial banks in Nairobi County, Kenya.
Results revealed that advertising through Radio was statistically significant in
influencing consumers’ attitude with all indicators scoring highly on consumer
awareness, consumer liking and consumer action. Linear regression analysis indicated
relatively high Beta coefficient for Radio therefore statistically significant to influence
consumer attitude. The hypothesis that advertising through Radio has no statistically
significant influence on consumers’ attitude among selected commercial banks in
Nairobi County, Kenya is therefore not supported.

168
The sixth objective sought to determine the influence of advertising through Newspaper
on consumers’ attitude by selected commercial banks in Nairobi County, Kenya. Again,
results showed that though respondents were aware of advertising through Newspaper, it
had a statistically moderate significant influence on consumers’ attitude recording
moderate liking and low action sub constructs of consumer’s attitude. Linear regression
analysis indicated relatively low Beta coefficient for Newspaper, therefore statistically
low significance to influence consumer attitude. The hypothesis that advertising through
Newspaper has no statistically significant influence on consumers’ attitude among
selected commercial banks in Nairobi County, Kenya is therefore supported.
The seventh objective was to determine the differences of moderating effect of age on
the relationship between advertising through online and advertising through offline
media channels on consumers’ attitude among selected commercial banks in Nairobi
County, Kenya. The results revealed that the moderating effect of age on the relationship
between advertising through media channels and consumer attitude was positive and had
a statistically significant index that were different for online and offline mediums. The
hypothesis that there are no statistically significant differences of moderating effect of
age on the relationship between advertising through online and offline media channels
on consumers’ attitude among selected commercial banks in Nairobi County, Kenya is
therefore not supported. Consumers’ age had a moderating effect on the relationship
between advertising through online and offline media channel on consumers’ attitude.
5.4 Recommendations of the research findings
The current study established the influence of advertising through media on consumers’
attitude then compared the attitude of online and offline channels as used by selected
commercial banks in Nairobi County. In addition, the moderating role of age was also
169
explored. The theoretical, policy and practitioners’ implications of the study results are
presented in the sub-sections below.
5.4.1 Theoretical recommendations
The findings of this study found a number of issues that have implications for
Consumers’ attitude theory and Marketing theory. According to Solomon (2016) the Tri-
Component attitude model contains three major components: Awareness (Cognitive or
Knowledge), Liking (Affective of Feelings) and Action (Conative or Behaviour). The
first implication of this theory is that consumers’ attitude cannot be influenced as a whole
and thus each indicator of attitude in this study was influenced separately, at different
significance levels. This means that each component of attitude may be studied
separately. In this study, it was found out that one can achieve significant levels of
influence across the board for all the three major components of attitude; awareness,
liking and action, if advertising is done through selected offline media channels
(Television and Radio; save for Newspaper). However, advertising through online media
channels will enable one to only influence awareness and liking but not action, save for
YouTube.
According to Ramzan (2019), the era of the digital revolution is characterised by
consumers who are bombarded with hundreds of advertising messages. This brings the
need for managers to design a media mix strategy which will break through the chaos
and create the necessary impact. When a medium is selected for showcasing advertising,
it should be carefully chosen to ensure the achievement of the advertiser’s goals.
Numerous studies have been conducted on the assessment of the effect of advertisements
on consumer behaviour. However, few research have exploited or investigated the
influence of advertising through media channels on consumers’ attitude such as the

170
influence of type of advertisement media channel on consumer awareness, liking and
action this proved a fundamental basis and novel contribution of this research.
Furthermore, this research work has also suggested that advertising through offline
channels and advertising through online channels have different impact on consumers’
attitude sub-constructs, thus the need to understand one’s communication objective in
order to guide on media choice. Trivedi (2007) postulates that brand managers should
allocate huge budgets to media advertisements, however the allocation of these budget
to various media channels may be guided by this research findings based on the
advertising goal.
Study conducted recently revealed that estimated 1.14 million advertisements are made
on different Television channels (Patanjali,2ö16) this was asserted by study that
emphasized importance of selection of appropriate media channel for advertisement as
justified by the current study (Laghate, 2017). Additionally, the study will help build on
the consumer attitude theory on the fact that the results for the attitude construct will be
determined by the moderating effect of the age of the consumer. Age was found to have
a strong, positive and significant moderating influence between advertising through
media channel and consumers’ attitude. This implies that the higher the age the higher
the possibility of the consumer to interact with the media. There was no skewness
detected to the younger consumers.
This research work has implications on marketing theory having reiterated the need to
develop one’s objectives well in advance when one is intending to carry out any
communication work. The communication objective chosen will help in the choice of
media type to use. This will avoid following the hype of the day where there is a belief

171
that online channels can influence consumer attitude as a whole. In this study, online
media channels are good for pushing product awareness and brand equity building but
not uptake of the products and services being communicated. Also the study found out
that advertising through each channel will have different strengths in influencing
consumers’ attitude. The study also found out that offline media channels should not be
ignored by marketers but should be used as a strategy to influence consumers’ attitude.
The study has also enriched the body of knowledge, which despite the existence of
numerous studies on the number of online consumers, the study on influence on
consumer attitude was lacking. The conceptual framework developed in this study can
therefore be expanded to test other channels in media for example billboards, streetlight
pole displays, LinkedIn, Pinterest and Instagram, among others.
5.4.2 Policy recommendations
The findings of this study present significant implication for marketing communication
industry. In addition, the study provides fundamental statistics on preference of online
versus offline channels by consumers which is useful in guiding communication
strategies for advertising goods and services. The policy guide for this study demonstrate
that advertising through online media channels will enable the marketer to achieve
consumer awareness and consumer liking of the brand/advertisement but not good in
driving action for the said product and service being advertised. On the other hand,
findings also indicate that advertising through offline media channels will enable the
advertiser of the respective company to achieve consumer action for its brand, products
or services, particularly through the use of TV and Radio though low action tendencies
were reported on advertisement through Newspaper. The policy guide here provides an
online and offline perspective on the choice of advertising media channels and the need
to align the communication objectives in the choice of the media channel.

172
Moreover, at national level, the research finding will provide a guide to policy makers
on the need to conduct further research to find the impact of the advertisement media
channels on various aspects of consumer behaviour in various industries other than
banking. It will guide the need to do research and not rely only on high sign offs in a
platform. For example in this case, high numbers in online media do not mean action for
the advertised products and services but support awareness and liking. Kenya Audiences
Research Foundation (KARF), which is mandated by the advertising industry, both
media owners and advertisers, to guide the industry through research findings, should go
further in trying to find out what numbers mean to the audiences in terms of consumer
attitude. Currently, the research studies are focused on the number of consumers in
online/offline channels and growth levels of the channels over time.
This study presents significant findings that will aid in the development of marketing
policy to guide the choice of communication channels based on marketing objectives for
not only the banking industry, but also corporate advertising. The current practice where
institutions are blindly pushing marketers to advertise through online channels without
understanding communication objectives is wrong and the study guides that online
channels drive mainly awareness and liking but not action; whereas offline channels
drive action more than awareness and liking. Altering consumers’ attitude favourably is
a key strategy consideration for most marketers and a raft of attitude change strategies
that can be classified into various categories exist (Schiffman & Kanuk, 2014).
5.4.3 Practitioners’ recommendations
The study problem for this research was based on the statistics that 90% of Kenyans
living in Nairobi County, were on online channels and only 10% could not access online
channels, according to the CAK report of 2016/2017. These statistics were found to be
blindly guiding the allocation of marketing resources in the selected commercial banks

173
to online channels with disregard to offline channels. The motivation for this study was
based on empirical review by the researcher that marketing resources like marketing
budgets, human resources and online ad agencies had significantly increased for online
media channels of Facebook, YouTube and Google Ads with a reduction on those of
offline media channels of TV, Radio and Newspaper. However, as mentioned in the
statement of the problem, the shift in the allocation of resources from offline channels to
online channels in advertising was happening without scientific research guiding the
process, therefore creating a gap. This study therefore fills the gap by assessing the
influence of advertising through media channels on consumers’ attitude; a comparison
of online and offline channels as used by selected commercial banks in Nairobi County,
Kenya. The study recommends that marketers in the advertising institutions should not
blindly allocate their resources to buying online channels as a result of the increasing
popularity, but to first understand their marketing communication objectives and align
their resources accordingly. Where a company is driving consumer awareness and
consumer liking, then the use of online channels was recommended, but where one wants
to influence consumer action, then offline channels are advisable. The comparison of
advertising through either online or offline channels can be achieved when the respective
marketers understand their objective for carrying out communication. The study
therefore guides that objectives of the advert should determine the channels to use since
online media channels were found to be good for awareness and liking whereas offline
mediums were found to be good for action-oriented objectives.
The results of the moderating effect of age have several implications for the marketers.
Batra et al. (2003) advocates that a market can be segmented on the basis of varying
degrees of attitudes, whether positive, neutral or negative, held by different age groups
of consumers and advertising media. This makes it necessary for the marketers to

174
understand what attitudes are most important in the age cohort of the consumers, so as to
determine the media choice. Marketers therefore need to keep track of the age cohorts of
their target audiences even as they choose the mediums to use in implementing their
communication strategies.
5.5 Suggestions for further research
Though this study present promising findings related or further research need to be
conducted in the future with consideration of different models and additional parameters
such as analysis of mediating effect of age or gender on advertising media channels with
regards to consumers’ attitude in order to enhance understanding of how the two
variables relate. The inclusion of additional factors could enhance the robustness of the
study model as well as the generalizability and validity of the results. Given that insights
about the study variables were obtained at a particular point in time, that may not
necessarily be applicable to other times, therefore there are opportunities for longitudinal
and broader studies in this area of research.
Future study to be conducted in other counties in the country to understand how
advertising through either online or offline channels affect consumers’ attitude.
Furthermore, it could be good to replicate this study outside Kenya to other countries and
indeed the world. This is particularly important because decisions by marketers are also
influenced by research done by media companies all over the world. The study could also
be expanded to cover other commercial banks not selected in this study and thus could
provide more insights into the conceptual framework.
This study was done using a quantitative research design in which data was obtained
using a structured questionnaire, thus limiting the research design and findings. Future
research could seek to address these limitations by incorporating qualitative research
design methods such as focus group sessions and structured interviews. Quantitative

175
research techniques combined with qualitative methods would enrich the research design
and findings significantly.
5.6 Summary of the chapter
Chapter five of this research work has discussed the summary of the findings of the study.
It has presented key conclusions of the research, including recommendations touching
on theoretical, policy and practitioners’ implications. The chapter has also provided
recommendations for future studies.

176
REFERENCES
Aaker, D. A. (1991), Managing brand equity: Capitalizing on the value of a brand
name. The Free Press.
Afzal, S., & Rabbani, K. J. (2015). Impact of online and conventional advertisements
on consumer buying behaviour of branded garments. Asian Journal of
Management Sciences and Education, 4(1), 126 – 135.
Arens, W. F. (2002).Contemporary advertising (8th ed.). McGraw Hill/Irwin.
Arkin, R.C., Ali, K., Weitzenfeld, A., & Cervantes-Perez, F. (2000). Behavioural models
of the praying mantis as a basis for robotic behaviour, Robotics and Autonomous
Systems, 32:39-60.
Ashcroft, L., & Hoey, C. (2001). PR, marketing and the internet:
implications for information professionals. Library Management, 22 (1/2),
68-74.
Assael, H. (2005), Consumer behaviour; A strategic approach. Dreamtech Press.
Ayanwale, A. B., Alimi, T., & Ayanbime, M. A. (2005). The Influence of Advertising
on consumer brand preference. Journal of Social Sciences, 10(1), 9-16.
Baca, E. E., Holguin, J. J., & Stratemeyer, A. W. (2005). Direct-to-consumer advertising
and young consumers: Building brand value. Journal of Consumer Marketing,
22(7), 379–387.
Bakshi, G., & Gupta, S. (2013). Online Advertising and its impact on consumer buying
behaviour. International Journal of Research in Finance and Marketing, 3(1),
21-30.
Barki, H., & Hartwick, J. (1994). User participation, conflict, and conflict resolution: The
mediating roles of influence. Information Systems Research, 5 (4), 422-438.
Bashar, A., Ahmad, I., & Wasiq, M., (2012). Effectiveness of social media as a
marketing tool: An empirical study. International Journal of Marketing,
Financial Services & Management Research 1(11), 88-99.
Batra, R., Myers, J. G., & Aaker, D. A. (2009). Advertising Management (6th ed.). Zed
Books Ltd.
Battista, J., & Almond, R. (1973). The development of meaning in life. Psychiatry, 36,
409-427.
Belch, B., & Belch, H. K. (2012). Sharing the love: Marketing news. Marketing
Intelligence and Planning Journal, 45(3), 11-12.
Benaifer, J. (2005). Trojan Horse program that targets Google AdSense ads. Tech Shout.
Bergiman, H. (2011). Internet advertising and consumer behaviour in the purchase of
products. Kuwait Chapter of the Arabian Journal of Business and Management
Review, 2(11), 1-8.

177
Bergmann, M. M. (2011). The politics, fashions, and conventions of research methods.
Journal of Mixed Methods Research, 5, 99 – 102.
Berkner, S. (2011). Impact of advertising on brand preference of high involvement
products. International Journal of Commerce and Management Research, 2(4),
202–211.
Bernager, K. (2005). The Economic Analysis of advertising. Handbook of Industrial
Organization, 3, 1701-1844
Bernoff, J. (2009). Advertising will change forever. Advertising Age.
http:adage.com/digitalnext/article?article_id=138023
Bezjian-Avery, A., Calder, B., Iacobucci, D. (1998). New media interactive advertising
vs. Traditional advertising. Journal of Advertising Research, 38(4), 23–32.
Bhattacherjee, A. (2012). Social science research: Principles, methods and practices.
Textbooks Collection. http:scholacommonc.usf.edu/oa_textbooks/3
Bishnoi, V. K., & Sharma, R. (2009). The impact of TV advertising on buying behaviour:
A comparative study of urban and rural teenagers. JK Journal of Management
& Technology, 1(1), 65–76.
Blumberg, B., Cooper, D. R. & Schindler, P. S. (2011). Business Research Methods (3rd
ed.). McGraw-Hill.
Boilen, N., Dollard, J., Doob, L. W., Miller, N. E., Mower, O. H., & Sears, R. R. (2005).
Mass media and American politics. Yale University Press.
Bolton, M. A., Havlena, O., Hansen, P. K., Mishra, V., & Vashiath, A., (2013). Is
advertising medium an important constraint in consumer purchase intention: The
theoretical foundation. Journal of General Management Research, 4(1), 38–45.
Bronner, F., & Neijens, P. C. (2006). Audience experiences of media context and
embedded advertising – a comparison of eight media. International Journal of
Market Research, 48(1), 81-100.
Communication Authority of Kenya. (2016). 2016/2017 annual report. .
https://ca.go.ke/downloads/publications/annual-reports/
Central Bank of Kenya (2016). Supervision annual report on commercial banks and
mortgage finance institutions.
www.centralbank.go.ke/uploads/banking_sector_annual_reports/323855712_2
016%20BSD%20ANNUAL%20REPORT%20V5.pdfChen, H. L. (2010).
Effects of country variables on brand strength: Moderating by brand life cycle
and cultural identification. International journal of Trade, Economics and
Finance, 1 (4), 400-4005
Chikandiwa, S., Contogiannis, E., & Jember, E. (2013). The adaptation of social media
marketing in South African banks. European Business Review, 25. 6-16.
Cravens, D. W., & Piercy, N. (2006). Strategic Marketing. (7th ed.). McGraw Hill.
178
Cresswell, J. W., & Clark, V. L. (2007). Designing and Conducting Mixed Methods
Research. Sage Publications.
Dalen V. D. (1979). Understanding Educational Research: An Introduction. (4th ed.)
McGraw Hill.
Darban, A. & Li, W. (2012).The impact of online social networks on consumer
purchasing decision [Master’s thesis, Jonkoping University]
Debats, D. I. (1998). Measurement of personal meaning: The psychometric properties of
the life regard index. In I. B. Weiner (Ed.), The Human Quest for meaning
(pp.237-259). Lawrence Erbaum Associates.
Dehghani, M., Niaki, M. K., Ramezani, I., & Sali, R. (2016). Evaluating the influence of
YouTube advertising for attraction of young customers. Journal of Computer
Human Behaviour, 59, 165-172. doi:10.1016/j.chb.2016.01.037
Dibb, S., & Simkin, L. (2010). Market segmentation success: Making it happen!, The
Haworth Press.
Dongwoo, K., Yohan, J., Il-Chul, M., & Oh, A. (2010). Analysis of twitter lists as a
potential source for discovering latent characteristics of users. Workshop on
Microblogging at the ACM Conference on Human Factors in Computer Systems.
Atlanta. GA
Ducoffe, R. H. (1996). How consumers assess the value of advertising. Journal of
Current Issues & Research in Advertising, 17(1), 1-18
Duffet, R. G. (2015). Facebook advertising’s influence on intention-to-purchase and
purchase amongst Millennials. Internet Research Journal, 25(4), 498-526.
Dzuban, P., & Shirkey, J. (2014). Multi-product advertising budgeting. Institute of
Operations Research and Management Science, 9(2), 97–113
EGTA. (2018). Advances in hybrid television audience measurement. Available at:
http://www.egta.com/documents/2018_egta_insight_tam_edition 3
Ellis, P. (2010). The essential guide to effect sizes: Statistical power, meta-analysis, and
the interpretation of research results. Cambridge University Press.
Ellison, N. B., Steinfield, C., & Lampe, C. (2007). The benefits of Facebook ‘friends:'
social capital and college students' use of online social network sites. Journal
of Computer-Mediated Communication, 12(4), 1143-1168.
eMarketer (2012), “Social media key influencer in multi-exposure purchase path”,
available at: www.emarketer.com/Article.aspx?R=1008845 &
ecid=a6506033675d47f881651943c21c5ed4
Evans, D. (2012). Social media marketing: An hour a day. John Wiley & Sons.
Evans, L. (2010). Social media marketing: Strategies for engaging in Facebook, Twitter
&other Social Media. Que Publishing.
179
Feilzer, M. Y. (2010). Doing mixed methods research pragmatically: Implications for the
rediscovery of pragmatism as a research paradigm. Journal of Mixed Methods
Research, 4, 6 – 16.
Fishbein, M., & Ajzen, I. (1975). Belief, attitude, intention, and behavior: An
introduction to theory and research. Addison-Wesley
Fiore, A. M., Lee, S., Kunz, G., & Campell, J. R. (2001). Relationship between optimum
stimulation level and willingness to use mass customization options. Journal of
Fashion Marketing and Management, 5(2), 99 – 107.
Gangi, M., & Wangi, T. (2016). The impact of online advertising on generation Y’s
purchase decision in Malaysia. International Journal of Humanities and Social
Sciences, 11 (4), 973–981.
Gefen, R. K. (2014). The role of advertising in consumer decision making. Journal of
Business and Management, 14(4), 37-45.
Greene, J. C. (2007). Mixed methods in social inquiry. John Wiley & Sons.
Gunelius, S. (2011). Internet advertising and consumer behaviour in the purchase of
products. Kuwait Chapter of the Arabian Journal of Business and Management
Review, 2(11), 1.
Ha, L., & McCann, K. (2008). An integrated model of advertising clutter in offline and
online media, International Journal of Advertising, 27(4), 569-
592, DOI: 10.2501/S0265048708080153
Hannah, M. A, (2013). Impact of TV advertisements on the ‘response process’ of the
private service holders of Bangladesh. Business and Economic Research, 3(1),
427–441.
Harrits, G. S. (2011). More than method?: A discussion of paradigm differences within
mixed methods research. Journal of Mixed Methods Research, 5, 150 – 166.
Harvey, J., & Jose, H. S. (2005). Facebook: Threats to privacy. Retrieved from
http://groups.csail.mit.edu/mac/class/6.805/student-papers/fall05-
papers/facebook.pdf
Haque, A., Tarofder, A. K., Mahmud, S. A., & Ismail, A. Z. (2007). Internet advertising
in Malasyia: A study of attitudinal differences. Electronic Journal on Information
Systems in Developing Countries, 31(9), 1-15
Hawkins, D. I., & Mothersbaugh, D. L. (2010). Consumer Behavior: Building
marketing strategy. McGraw-Hill Irwin
Heath, R., & Feldwick, P. (2007). Fifty years using the wrong model of advertising.
International Journal of Market Research, 50(1), 29-59.
Hilde, A. M., Guda, V.N., Daniël, G. M & Fred, B. (2018). Engagement with social
media and social media advertising: The differentiating role of platform type.
Journal of Advertising, 47(1), 38-54.

180
Hoek, J. & Gendall, P. (2003, December 1-3). How does sponsorship work? [Paper
presentation] ANZMAC Conference 2003, Adelaide.
Hoffman, S., & Norak, H. (2012). Internet advertising and consumer behaviour in the
purchase of products. Kuwait. Arabian Journal of Business and Management
Review, 2(11), 1.
Howell, R. (2012). Market segmentation: the importance of age cohorts. http:
www.neuman.edu/about/publications/NeumanBusinessReview/journal/
Review 2012/Howell.pdf
Hoyer, W. D. (1984). An examination of consumer decision making for a common repeat
purchase product. Journal of Consumer Research, 11(3), 822–829.
Internet World Statistics (2018). Internet users estimated in June 30, 2018,
www.internetworldstats.com/stats.htm.
Iraosii, G. (2006). The power of survey design: A user’s guide for managing surveys,
interpreting results, and influencing respondents. The World Bank.
Irfan, A., Rasli, A., Sami, A., & Liaquat, H. (2017). Role of social media in promoting
education tourism. Advanced Science Letters, 23(9), 8728–8731.
https://doi.org/10.1166/asl.2017.9959
Israel, P. S. (2009). Means of advertisement impact on consumer buying behaviour with
reference to health drinks in Kuppam. International Journal of Management and
Social Sciences Research, 1(2), 31–35.
Iyer, R. J., & Resinwitz, C. T. (2009). Competitive interference effects in consumer
memory for advertising: The role of brand familiarity. Journal of Marketing, 58
(3).
Jobber, D. & Ellis-Chadwick, F. (2013). Principles and practice of marketing. (7th ed.).
McGraw Hill Education
Jung, J., Shim, S. W., Jin, H. S, & Khang, H. (2016). Factors affecting attitudes and
behavioural intention towards social networking advertising: A case of
Facebook users in South Korea. International Journal of Advertising, 35(2),
248-265
Kafka, P., & Molla, R. (2017, December 4). 2017 was the year digital ad spending finally
beat TV. Vox recode. https://www.recode.net/2017/12/4/16733460/2017-
digital-ad-spend-advertising-beat-tv
Kamau, S. (2017). Democratic engagement in the digital age: Youth, social media and
participatory politics in Kenya. Journal of Communication, 43(2), 128 -146.
Kankanhalli, A., Tan, B. C. Y., & Wei, K. K. (2005). Contributing knowledge to
electronic knowledge repositories: An empirical investigation. MIS Quarterly,
29(1), 113-143.
Kaplan, A. M., & Haenlein, M. (2017). Users of the world, unite! The challenges and
opportunities of social media. Business Horizons, 53(1), 59-68.

181
Kaplan, A. M., & Haenlein, M. (2019). Users of the world, unite! The challenges and
opportunities of Social Media. Business Horizons, 67(3), 29-90.
Kenya Audience Research Foundation. (2017). Quarter 1 report, 2017.
https://www.karf.or.ke/
Kaushik, R. (2012). Impact of social media on marketing. IJCEM International Journal
of Computational Engineering and Management, 15(2), 91-95.
Khaniwale, Z. (2015). Effective advertising and its influence on consumer buying
behaviour. European Journal of Business and Management, 3(3), 55–67.
Kim, A. J., & Ko, E. (2011). Do social media marketing activities ENHANCE customer
equity? An empirical study of the luxury fashion brand, Journal of Business
Research, 65, 1480-1486
Kirtis, A. K., & Karahan, F. (2011). To be or not to be in Social Media arena as the most
cost-efficient marketing strategy after the global recession, Social and
Behavioral Sciences, 25(3), 260-268
Kenya National Bureau of Statistics (2016) Annual report (2016)
www.knbs.or.ke>economic-survey-2016-
Knoll, A. (2015). Do advertisements work? A study on change in consumers’ purchasing
behaviour due to advertisements. Abhinav International Monthly Refereed
Journal of Research in Management & Technology, 3(5), 14–21
Kodjamanis, A., & Angelopoulos, S. (2013, May 2-4). Consumer perception and attitude
towards advertising on social networking sites: The case of Facebook. [Paper
presentation] International Conference on Communication, Media, Technology
and Design. Famagusta, North Cyprus.
Koetsier, J. (2013). Facebook: 15 million businesses, companies, and organizations now
have a Facebook page. Venture Bit
Kojima, T., Kimura, T., Yamaji, M., & Amasaka, K., (2010). Proposals and
development of the direct mail method "PMCI-DM" for effectively attracting
customers. International Journal of Management & Information Systems, 14(5),
15-21
Kothari, C. N. (2004). Research methods. New Age International (P) Ltd. Publishers.
Kotler, P., & Keller, K. L. (2007). A framework for marketing management (3rd ed.).
Pearson Education.
Kotler, P., & Armstrong, G. (2012). Principles of marketing (14th Ed.). Prentice Hall.
Kotler, P., Kertajaya, H., & Setiawan, I. (2017). Marketing 4.0: Moving from traditional
to digital. John Wiley & Sons, Inc.
Kotler, P. (2017). My adventures in marketing: The autobiography of Philip Kotler (1st
Ed.). Prentice Hall.

182
Kramer, N. C., Winter, S., Benninghoff, B., & Gallus, C. (2015). How social is social
TV? The influence of social motives and expected outcomes on the usage of
social TV applications. Computers in Human Behavior, 51: 255-62.
Krauss, S. E. (2005). Research paradigms and meaning making: A primer. The
Qualitative Report, 10(4), 758-770. http://www.nova.edu/ssss/QR/QR10-4/krauss.
Kirtis, A. K., & Karahan, F. (2011). To be or not to be in Social Media
arena as the most cost-efficient marketing strategy after the global
recession. Social and Behavioural Sciences, 23(2), 260-268.
Kwan, J. L.Y., & Chan, W. (2011). Comparing standardized coefficients in structural
equation modelling: A model parameterization approach. Behavioral Research,
43, 730-745.
Kwek, C. L., Tan, H. P., & Lau, T. C. (2010). The determinants of consumers’ attitude
towards advertising. Canadian Social Science, 6(4), 114 – 126.
Laghate, G. (2017, Jan 31). Baba Ramdev advertises his presence on TV 20 hours a day.
The Economic Times. https://economictimes.indiatimes.com/industry/baba-ramdev-advertises--his-presence-on-tv-20-hours-a-day/articleshow/56881020.cms
Lagrosen, S. (2005). Effects of the internet on the marketing communication of service
to companies. Journal of Services Marketing, 19(2), 63-69.
Lancaster, G. & Massingham, L. (2018). Essentials of marketing Management (2nd ed.).
Routledge.
Lavidge, R. J., & Steiner, G. A. (1961). A model for predictive measurements of
advertising effectiveness. Journal of Marketing, 25 (6), 59–62.
Lessing, L. (2008). Remix: Making art and commerce thrive in the hybrid economy. The
penguin Press.
Leung, X. Y., Bai, B., & Stahura, K. A. (2015). The marketing effectiveness of social
media in the hotel industry: A comparison of Facebook and Twitter. Journal of
Hospitality & Tourism Research, 39 (2), 147-169.
Li, C., & Bernoff, J. (2008). Groundswell: Winning in a world transformed by social
technologies. Havard Business School Press.
Louisa, H. (2015). Myths & truths about journalism & mass communication quarterly.
Journalism and Mass Communication Quarterly, 92(4), 785-790.
Malthouse, E.C., Calder, B. J., & Tamhane, A. (2007). The effects of media context
experiences on advertising effectiveness. Journal of consumer advertising, 36,
(3), 7-18.
183
Mangold, W. G., & Faulds, D. J. (2009). Social media: The new hybrid element
of the promotion mix. Business Horizons, 52(4), 357-365.
Madana, M. M. (2010). Impact of advertising on consumer behaviour: A study with
reference to selected consumer durable and non-durable goods[Masters thesis,
Sri Krishnadevariya University]
Mayring, P. (2014). Qualitative content analysis. Theoretical foundation, basic
procedures and software solution. Klagenfurt http://nbn-
resolving.de/urn:nbn:de:0168-ssoar-395173.
Meyrick, J. (2006). A call to action on two fronts: Better objectives and better strategies.
Health Education, 106(5), 341–344.
Michaelson, D., & Stacks, W. D. (2011). Standardization in public relations
measurement and evaluation standardization. Public Relations Journal, 5(2), 1-
22
Miles, T., Huberman, K., & Saldana, P. (2013). How urban children process advertising
message: Special reference to television advertising in Pakistan. African Journal
of Business Management, 5(10), 39-62
Morrison, K. (2014, December 22). Social Media has changed how consumers shop
online. http://www.adweek.com/socialtimes/social-media-changed-consumers-
shop-online-infographic/209738 ***
Mohit B., & Shubham, G. (2014). Impact of newspaper advertisement on consumer
behavior. Global Journal of Finance and Management, 6(7), 669-674.
Mugenda, O. M., & Mugenda, A. (2008). Research methods, quantitative & qualitative
approach. Acts Press.
Mwenda, M. A. (2013). Social media advertising in the telecommunication sector in
Kenya: Exploring the adoption, value and influence of Twitter use by Safaricom
Limited. [Masters thesis, Nairobi University]
Nargundkar, R. (2003). Marketing research: Text and cases. Tata McGraw-Hill
Publishing Company Limited.
Nayak, K., & Shah, B. (2015). The effectiveness of newspaper print ads. Indian Journal
of Applied Research, 5(2), 328-331
Nedungadi, P. (1990). Recall and consumer consideration sets: Influencing choice
without altering brand evaluations. Journal of Consumer Research, 17(3), 263–
276.
Nelson-Field, K., & Taylor, J. (2012, May 17). Facebook fans: A fan for
life?.http://www.warc.com/content/LinkResolver.aspx?AID=96814&M=ad
Neuman, W. L. (2014). Social research methods: Qualitative and quantitative
approaches (7th Ed). Person Education Limited.

184
Nhlapo, T. (2015). The impact of online advertising on generation Y’s purchase decision
in Malaysia. International Journal of Humanities and Social Sciences, 11(4),
973–981.
Njuguna, R. K. (2014). The moderating effect of industrial context on the relationship
between brand equity and consumer choice in branded bottled water Nairobi,
Kenya. European Scientific Journal, 10 (4), 337-339
Njuguna, N. J. (2014). The effects of country of origin, consumer characteristics and
consumer attitudes on consumer behaviour towards foreign clothing brands in
Nairobi, Kenya [Doctoral dissertation, University of Nairobi].
Nugzar, L. (2011). Impact of radio advertisements on buying behaviour of urban
commuters. International Journal of Retail & Distribution Management, 39(7),
480–503
Nuttney A. (2010). The social networking Marketing Opportunity. Journal of Strategic
Marketing 24 (3), 58-87
O’Barr, W. M. (2010). The rise and fall of the TV commercial. Adv. Soc , Rev. 11 doi:
10.1353/asr.0.0046
Ogla, A., & Natalia, V. (2006). Consumer perceptions of product packaging. Journal of
Consumer Marketing, 23(2), 100-112.
Okazaki, R., & Taylor, C. (2011, September 8). Twitter has 100 million active users.
http://mashable.com/2011/09/08/twitter-has-100-million-active-users
Oppeheim’s, M. (2001). Point of view: Does advertising cause a” hierarchy of effects”?
Journal of Advertising Research, 41, 33-51.
Oso, T., & Onen, K. (2008). Proposals and development of the direct mail method
"PMCI-DM" for effectively attracting customers. International Journal of
Management & Information Systems, 14 (5), 15-21.
O’Guinn, T. C. & Faber, R. J. (1991). ‘Mass communication and consumer
behaviour’, in T.S. Robertson and H. H. Kassarjian (eds). Handbook of
Consumer Behavior, pp. 349–400. Prentice-Hall.
Pallant, J. (2011). A Step by step guide to data analysis using SPSS (4th Ed.). Everbest
Printing Co.
Pearl, D., Bouthilet, L., & Lazar, J. (1982). Television and behaviour: Ten years of
scientific progress and implications for the eighties. Vol. 1: Summary Report.
Washington, DC: US Government Printing Office
Perner, L. (2016). Consumer behaviour: the psychology of marketing. Retrieved August,
17 2017 from http://www.consumerpsychologist.com/
Peter, P. J., & Donnelly, H. J. (2012). Marketing management: Knowledge and skills
(11th Ed.). Irwin/McGraw-Hill.
Peter, P. J., & Olson, C. J. (2009). Consumer behaviour & marketing strategy (9th Ed.).
Irwin/McGraw-Hill.

185
Pongiannan, K., & Chinnasamy, J. (2014). Do advertisements for fast
moving consumer goods create response among the consumers? An
analytical assessment with reference to India. International
Journal of Innovation, Management, and Technology, 5(4), 249-254.
Priyanka, S. (2012). A study on the impact of online advertising on consumer behaviour
(with special reference to emails). International Journal of Engineering and
Management Sciences, 3 (4), 22-31.
Pring, R. (2000). Philosophy of Educational Research. Continuum.
Qazi, A., & Muhammed, M. R. (2017). The impact of exposure to advertisement online
on purchase decision empirical study of Saudi customers in Western Region.
International Journal of Academic Research in Business and Social Sciences, 7
(7), 366–386.
Rachel, A., Michael, R. S., & Julia, W. (2015). An old model of new age: Consumer
decision making in participatory digital culture. Journal of Customer
Behaviour, 14(3), 127-136.
Raju, D. A., & Devi, .P. S. (2012). Means of advertisement impact on consumer buying
behaviour with reference to health drinks in Kuppam. International Journal of
Management and Social Sciences Research, 1(2), 31-35.
Ramzan, S. (2019. Impact of media advertisements on consumer behavior. Journal of
Creative Communications, 14(1), 54-68.
Ratchford, B. T., Talukdar, D., Lee, M. (2007). The impact of the internet on consumers'
use of information sources for automobiles: A Re-Inquiry. Journal of Consumer
Research, 34(1), 111–119. doi.org/10.1086/513052
Ray, S., Kim, S.S., & Morris, J. G. (2014). The central role of engagement in online
communities. Information systems Research, 25(3), 528-546.
Reisenwitz, T., & Iyer, R. (2009). Differences in generation X and generation Y:
implications for the organisation and marketers. Marketing Management
Journal, 19(2), 91 – 103. Retrieved from Business Source Premier Database.
Reyneke, M., Pitt, L., & Berthon, P. R. (2011). Luxury wine brand visibility
in social media: An exploratory study. International Journal of Wine Business
Research, 23 (1), 21-35.
Rossiter, J. R., Percy, L., Donovan, R. J. (1991). A better advertising planning grid.
Journal of Advertising Research, 31(5), 11–21.
Rowley, S. E. (1998). A Communication-Based marketing model for managing
relationships. Journal of Marketing, 62(2), 1–13.
Sadhasivam, D. P., & Nithya P, A. (2015). A literature review on the impact of television
advertising vs. online advertisement among consumers. International Journal of
Advanced Research in Computer Science and Management Studies, 3 (10), 151–
154.
186
Safko, D. A. (2012). Means of advertisement impact on consumer buying behaviour with
reference to health drinks in Kuppam. International Journal of Management and
Social Sciences Research, 1(2), 31–35.
Saito, A. (2000). Social origin of cognition: Bartlett, evolutionary perspective and
embodied mind approach. Journal for the Theory of Social Behaviour, 26(4),
399-421.
Samson, E. (2004). Towards a general theory of creativity in advertising: Examining the
role of divergence. Journal of Marketing Theory, 4 (2), 142-151.
Schiffman, L. G. & Kanuk, L. L. (2014). Consumer behaviour. Global Edition. Pearson
Prentice Hall
Scotland, J., (2012). Exploring the philosophical underpinnings of research: Relating
ontology and epistemology to the methodology and methods of the scientific,
interpretive, and critical research paradigms. English Language Teaching, 5(9),
9–16.
Sekaran, U. (2006). Research methods for business: A skill building approach. John
Wiley & Sons.
Sekaran, U., & Bougie, R. (2010). Research methods for business: A skill-building
approach (5th Ed.). John Wiley & Sons.
Sharma, P. (2011). Country of origin effects in developed and emerging markets:
Exploring the contrasting roles of materialism and value consciousness. Journal
of International Business Studies, 42(2), 285 -306.
Shaughnessy, J. J., Zechmeister, E. B., & Zechmeister, J. S. (2011). Research methods
in Psychology. McGraw Hill Higher Education
Shin, W., & Lin, T. T. C. (2016). Who avoids location-based advertising and why?
Investigating the relationship between user perceptions and advertising
avoidance. Comput Hum Behav 63(2016), 444–452 Doi:
10.1016/j.chb.2016.05.036
Smith, J., Terry, D., Manstead, A., Louis,W., Kotterman, D., & Wolfs, J. (2008). The
attitude –Behaviour relationship in consumer conduct: The role of norms, past
behaviour, and self-identity. The Journal of Psychology, 148(3), 311-33.
Snelson, C. (2011). YouTube across the disciplines: a review of the literature. Merlot
Journal Online Learn Teaching, 7, 159–169.
Snyder, J., & Garcia- Garcia M., (2016). Advertising across platforms: Conditions for
multimedia campaigns: A method for determining optional media investment
and creative strategies across platforms. Journal of Advertising Research, 56
(4), 352-67.
Social Bakers (2016). Social Media and Reporting; Kenya Report, 2016. downloaded
from www.socialbakers.com › blog › 2647-our-best-content
Solomon, M. R. (2008). Consumer Behaviour. Prentice Hall.
187
Solomon, M. R. (2016). Consumer behaviour; buying, having and being (12th ed.).
Prentice Hall.
Sorce, P., & Dewitz, A. (2007). The case for print media advertising in the internet age.
https://scholarworks.rit.edu/books/22
Soumitra, D. W. (2010, November). Your personal social media strategy? Managing
yourself- Harvard business review.
Statista. (2015). The advertising industry in India Statistics & Facts.
https://www.statista.com/topics/2116/advertising-industry-in-india/
Stelzner, M. (2013). “Social media marketing industry report”.
http://www.socialmediaexaminer.com/SocialMediaMarketingIndustryReport2
013.pdf
Sutherland, J., & Sylvester, C. M (2000). Oracles on advertising: Searching for a
definition. Journal of Advertising, 31 (2), 63–78.
Tabachnick, B. G. & Fidell, L. S. (2007). Using multivariate statistics (5th Ed.) Pearson
Education.
Tan, A. S. (1981). Mass communication theories and research. Grid Publishing.
Teddlie, C., & Tashakkori, A. (2009). Foundations of mixed methods research. Sage
Publications.
Teixeira, T. S., Wedel, M., & Pieters, R. (2010). Moment- to -moment optimal branding
in TV commercials: preventing avoidance by pulsing. Mark. Sci. 29, 783-804.
Doi:10.1287/mksc.1100.0567
Trendera S. (2017). Gen. Z: Leaders of the Mobile social movement.
https://www.scribd.com/document/380106092/Gen-Z-Leaders-of -the Mobile -
Social-Movement
Trivedi, J. (2007). Do long formats ads sell? Evidence from Indian consumers. Global
Business Review, 18(3), S38–S51.
Tuten, L. T. (2008). Advertising 2.0. Social media marketing in Web 2.0 world. Praeger
Publisher.
Tyenjee, T. T (1979). Response time, conflict and involvement in brand choice. Journal
of Consumer Research, 6, 295 -304.
Uitz, R. (2012). Impact of radio advertisements on buying behaviour of urban
commuters. International Journal of Retail & Distribution Management, 39(7),
480–503.
Van, Teijlingen, R., Hundley, H., & Grahaman, P. (2001). A better advertising planning
grid. Journal of Advertising Research, 31(5), 11–21.
Venkatraman, V., Dimoka, A., Pavlou, P. A., Vo, K., Hampton, W.,
Bollinger, B., Hershfield, H. E., Ishihara, M., & Winer, R. S (2015). Predicting
advertising success beyond traditional measures: new insights from
188
neurophysiological methods and market response modelling. Journal of
Marketing Research, 52,436–452. doi:10.1509/jmr.13.0593
Wambugu, A. W., Gichira, R., Wanjau, K. N., & Mung’atu, J. (2014). The relationship
between risk taking and performance of small and medium agro processing
enterprises in Kenya. International Journal of Economics, Commerce and
Management, 3(12), 441-454.
Woodcock, N, & Green, A. (2010). “Social CRM as a business strategy,
the customer framework”. http://customerframework.com
Yaakop, A., Anuar, M. M. & Omar, K. (2013). Like it or not: issue of credibility in
Facebook advertising. Asian Social Science, 9(3), 154-163.
Yong, B., Pearce, A. (2013). Assessing the effectiveness of electronic conservation
advertisements in Isfahan channel television. International Business Research,
4(3), 194.
Zaichkowsky, J. L. (1985). Measuring the involvement construct. Journal of Consumer
Research, 12, 341-352.
189
APPENDICES
Appendix I: Letter of Introduction
Nancy Jerono Kipchillat
P.O. Box 47707 -00100
Nairobi
Tel.0722 855 301
Email: [email protected]
To All Respondents,
RE: Letter of Introduction
I am a Postgraduate student at Kabarak University, pursuing a Doctor of Philosophy in
Business Administration (Marketing). My topic of study is on “Influence of advertising
through media on Consumers’ attitude: A comparison of online and offline media
channels used by selected commercial banks in Nairobi County, Kenya.”
The research is intended to generate information that is to be used in understanding the
influence that advertising through various media channels has had on consumers’
attitude, and to compare moderating effect of age on advertising through media channel
on consumers’ attitude. The study is intended to enrich academic knowledge in this area
and offer practical solutions to developing relevant policies regarding resource allocation
by marketers in the advertising and communication industry.
You have been selected to be part of the study sample by virtue of being a consumer of
this bank. Kindly take a few minutes to answer the questions on this questionnaire to the
best of your knowledge. The information and data you will provide will be treated with
confidence and shall only be used for statistical purposes in this academic research.
Thank you in advance
Yours sincerely,
Nancy Jerono Kipchillat
PhD Student, Kabarak University.

190
Appendix II: Questionnaire
Bank:……………………………..Branch:…………………………..
Key:
This is a study on the ‘Influence of advertising through media on consumers’ attitude: A
comparison of online and offline media channels used by selected commercial banks in
Nairobi County, Kenya’. This questionnaire has three sections; Section A requires
general information, Section B requires details on advertising through media channels
and, Section C requires details on consumers’ attitude.
Kindly follow instructions indicated per section to answer the questions.
A: General information (Kindly tick in the appropriate bracket)
1) Indicate your gender:
Male ( ) Female ( )
2) Indicate your age bracket
Below 29 Yrs. ( ) 30 – 49 Yrs. ( ) 50 Yrs. & Above ( )
3) Indicate your level of education
Post Graduate ( ) Degree ( ) Diploma ( )
Secondary ( ) Primary ( ) Other ( ) Specify ……………………….
B: Advertising through media
4). Indicate the media channel that you prefer using
Online Channel ( ) Offline Channel ( ) Other ( ) Specify ……………………
5). Indicate if you use any of the following online channels (You can tick more than one
where applicable)
Facebook ( ) Google ( ) YouTube ( )
Other ( ) Specify ……………………….
6). Indicate if you use any of the following offline channels (You can tick more than one
where applicable)
TV ( ) Radio ( ) Newspaper ( )
Other ( ) Specify ……………………….
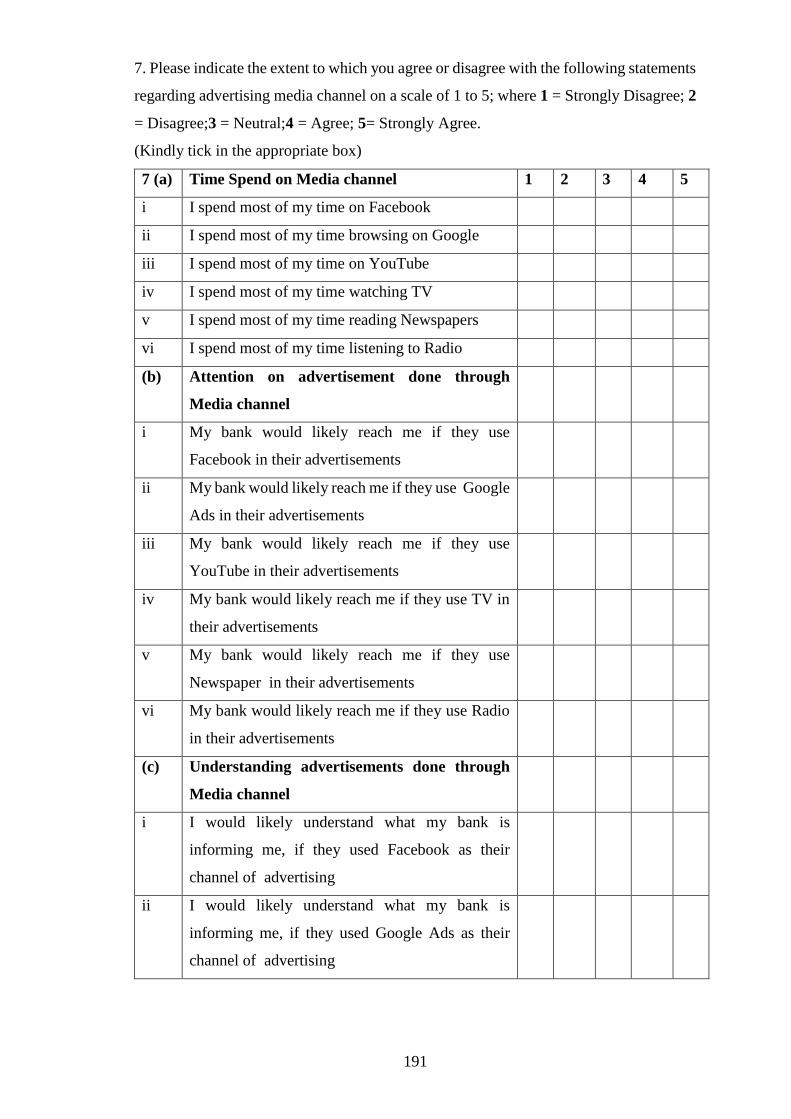
191
7. Please indicate the extent to which you agree or disagree with the following statements
regarding advertising media channel on a scale of 1 to 5; where 1 = Strongly Disagree; 2
= Disagree;3 = Neutral;4 = Agree; 5= Strongly Agree.
(Kindly tick in the appropriate box)
7 (a) Time Spend on Media channel 1 2 3 4 5
i I spend most of my time on Facebook
ii I spend most of my time browsing on Google
iii I spend most of my time on YouTube
iv I spend most of my time watching TV
v I spend most of my time reading Newspapers
vi I spend most of my time listening to Radio
(b) Attention on advertisement done through
Media channel
i My bank would likely reach me if they use
Facebook in their advertisements
ii My bank would likely reach me if they use Google
Ads in their advertisements
iii My bank would likely reach me if they use
YouTube in their advertisements
iv My bank would likely reach me if they use TV in
their advertisements
v My bank would likely reach me if they use
Newspaper in their advertisements
vi My bank would likely reach me if they use Radio
in their advertisements
(c) Understanding advertisements done through
Media channel
i I would likely understand what my bank is
informing me, if they used Facebook as their
channel of advertising
ii I would likely understand what my bank is
informing me, if they used Google Ads as their
channel of advertising

192
iii I would likely understand what my bank is
informing me, if they used YouTube as their
channel of advertising
iv I would likely understand what my bank is
informing me, if they used TV as their channel of
advertising
v I would likely understand what my bank is
informing me, if they used Newspaper as their
channel of advertising
vi I would likely understand what my bank is
informing me, if they used Radio as their channel
of advertising
C: Consumers’ attitude
8). Please indicate the extent to which you agree or disagree with the following
statements regarding your attitude as a result of your bank advertising through online or
offline channels to reach you on a scale of 1 to 5;where 1 = Strongly Disagree; 2 =
Disagree;3 = Neutral;4 = Agree; 5= Strongly Agree.
(Kindly tick in the appropriate box)
Statement
8 (a) Online on Consumer Attitude (Awareness) 1 2 3 4 5
i I am aware that my bank advertises through
ii I am aware that my bank advertises through
Google Ads
iii I am aware that my bank advertises through TV
(b) Offline on Consumer Attitude (Awareness)
i I am aware that my bank advertises through TV
ii I am aware that my bank advertises through Radio
iii I am aware that my bank advertises through
Newspaper
(c) Online on Consumer Attitude (Liking)
i I like when my bank advertises through Facebook

193
ii I like when my bank advertises through Google
Ads
iii I like when my bank advertises through TV
(d) Offline on Consumer Attitude (Liking)
i I like when my bank advertises through TV
ii I like when my bank advertises through Radio
iii I like when my bank advertises through
Newspaper
(e) Online on Consumer Attitude (Action)
i I am likely to act, if I receive my banks’
advertisements through Facebook
ii I am likely to act, if I receive my banks’
advertisements through Google Ads
iii I am likely to act, if I receive my banks’
advertisements through TV
(f) Offline on Consumer Attitude (Action)
i I am likely to act, if I receive my banks’
advertisements through TV
ii I am likely to act, if I receive my banks’
advertisements through Radio
iii I am likely to act, if I receive my banks’
advertisements through Newspaper
Thank you for your time and contribution. God bless you!

194
Appendix III: Bank branches used for the study in Nairobi County
Sub County Equity Branch KCB Branch Co-op Bank
Branch
1 Dagoretti North Kawangware Kawangware Kawangware
2 Dagoretti South Dagoretti Corner Prestige Ngong Rd Dagoretti Corner
3 Embakasi Central Kayole Kayole Kayole
4 Embakasi East Utawala - -
5 Embakasi North - - Dandora
6 Embakasi South Kenya Pipeline
Donholm
Jogoo Road Embakasi 1
Embakasi 2
7 Embakasi West Kariobangi Kariobangi Kariobangi
8 Kamukunji Eastleigh Eastleigh
Gikomba
Eastleigh
Gikomba
9 Kasarani Ruai Kasarani -
10 Kibra Kibera Kibera Kibera
11 Langata Karen Karen Karen
12 Makadara Buruburu Industrial Area
Buruburu
Industrial Area
Buruburu
13 Mathare - - -
14 Roysambu Githurai Kahawa West Zimmerman
15 Ruaraka - Thika Road Mall Thika Road Mall
16 Starehe Fourways Kimathi Street
Moi Avenue
River Road
Kimathi
17 Westlands Westlands Sarit Center
Parklands
Westlands

195
Appendix IV: Equity Bank branches in Nairobi County
No. Branch Name No. Branch Name
1 Buru Buru 31 Knut House
2 Community 32 Lavington
3 Donholm 33 Mama Ngina
4 Dagoretti Corner 34 Mayfair
5 Eastleigh 35 Mlolongo
6 Embakasi 36 Moi Avenue
7 Enterprise Road 37 Mombasa Road
8 Equity Centre 38 Nairobi West
9 Fourways 39 Ngara
10 Garden City Mall 40 Parliament Road
11 Gigiri 41 Ruai
12 Gikomba 42 Tea Room
13 Githurai 43 Utawala
14 Harambee 44 Wangige
15 JKIA 45 Westlands
16 Kahawa House 46 Kawangware
17 Kangemi 47 Kenyatta Market
18 Karen 48 Tom Mboya
19 Kariobangi 49 ICDC Embakasi
20 Kasarani 50 JKIA Terminal 4
21 Kayole
22 Kenyatta Avenue Supreme
23 Kibera
24 Kilimani

196
25 Kenya Pipeline
26 Kenyatta Avenue
27 Kenyatta University
28 Fourways Corporate
29 Equity Center Corporate
30 Kiserian
Source: Equity Bank Website, 2018

197
Appendix V: Kenya Commercial Bank branches in Nairobi County
No. Branch Name No. Branch Name
1 Biashara Street 31 Industrial Area
2 Capital Hill 32 JKUAT
3 Gateway House Mombasa Road 33 Jogoo Road
4 Gigiri Square 34 Kariobangi
5 Hurlingham 35 Kasarani
6 JKIA 36 Kayole
7 Karen 37 Kimathi Street
8 Kawangware 38 Mashariki
9 Kibera 39 Moi Avenue
10 Kilimani 40 Ngara
11 KICC 41 River Road
12 Kilimani Platinum Branch 42 Thika Road Mall
13 Kipande House 43 Tom Mboya St.
14 Lavington 44 Two Rivers
15 Mlimani 45 Utawala
16 Nextgen 46 Kiserian
17 Parklands 47 Kitengela
18 Prestige Plaza Ngong Road 48 Ongata Rongai
19 Riverside Advantage 49 Kikuyu
20 Sarit Center 50 Limuru
21 Syokimau 51 Salama Mortgage Center
22 UN Gigiri 52 Sarit Mortgage Center
23 University Way 53 Upper Hill Platinum
24 Village Market 54 Garden Mortgage Center

198
25 Westgate Advantage 55 Haille Sellasie Mortgage
Centre
26 Buru Buru 56 Nairobi High Court
27 Eastleigh 57 Kencom Advantage
28 Garden City 58 KCB Towers
29 Gikomba 59 KCB Yaya Center
30 Githunguri 60 KCB Custody Services
61 KCB Koinange Street
62 KCB Mortgage Ufundi Hse
Source: KCB Website, 2018

199
Appendix VI: Co-operative Bank of Kenya branches in Nairobi County
No. Branch Name No. Branch Name
1 AghaKhan Walk 31 Mlolongo
2 Athi River 32 Moi Avenue
3 Buruburu 33 Money Transfer Centre
4 Dagoretti 34 Nacico
5 Dandora 35 JKIA
6 Donholm 36 Mombasa Road
7 Eastleigh 37 NBC Ngong Road
8 Embakasi 1 38 Ngong
9 Embakassi 2 39 Ongata Rongai
10 Enterprise Road 40 Parliament Road
11 Gigiri Mall 41 Ridgeways Mall
12 Githurai 42 River Road
13 Githurai Kimbo 43 Ruaka
14 Gikomba 1 44 Stima Plaza
15 Gikomba 2 45 T-Mall / Langata Road
16 Greenhouse Mall 46 Thika Road Mall
17 Karen 47 Tom Mboya
18 Kangemi 48 Two Rivers Mall
19 Kariobangi 49 Ukulima
20 Kawangware 50 Umoja
21 Kawangware 46 51 University Way
22 Kayole 52 Upper Hill
23 Kibera Ayany 53 Wakulima
24 Kilimani 54 Westlands

200
25 Kikuyu 55 Zimmerman
26 Kimathi Street
27 Kiserian
28 Kitengela
29 Lavington Mall
30 Maasai Mall
Source: Co-operative Bank of Kenya Website, 2018

201
Appendix VII: Letter to NACOSTI from Kabarak University

202
Appendix VIII: Research authorization from NACOSTI

203
Appendix IX: Research permit from NACOSTI

204
Appendix X: Research authorization from Ministry of Education

205
Appendix XI: Research acknowledgment from Nairobi County

206
Appendix XII: Publication 1
Comparative Study of Influence of Advertising through Online and Offline Media
Channels on Consumers’ attitude by Selected Commercial Banks in Nairobi
County, Kenya
Kipchillat Nancy, Hillary Busolo and Ronald Chepkilot
Additional contact information
International Review of Management and Marketing, 2019, vol. 9, issue 6, 169-178
Abstract: The aim of this study was to compare the influence of advertising through
online and offline media channels on consumers’ attitude as used by selected commercial
banks in Nairobi County, Kenya. Across-sectional study using a stratified sampling
technique was used to sample the respondents from selected three commercial banks in
Nairobi County, Kenya (Kenya Commercial Bank, Equity Bank, and Co-operative
Bank). A sample size of 384 from three selected banks in Nairobi County was used. The
data was then collected using a questionnaire, with questions comprising Likert scale
type to measure consumers’ attitude. The data was then analysed using Statistical
Package for the Social Sciences software to determine descriptive and inferential
statistics. The results revealed that TV (73.93) was ranked first followed by Google Ads
(71.26%) by the consumers from the three selected bank. Offline media channel had
highest overall score on consumer awareness (mean = 3.552; CV = 30.91%), liking
(mean = 3.491; CV = 31.40%) and action (mean = 3.454; CV = 31.08%) compared to
online media channels which had awareness (mean = 3.02; CV = 38.16%), liking (mean
= 2.913; CV = 41.86%) and action (mean = 2.881; CV = 39.65%). Correlation analysis
indicates that there was a strong and positive correlation between offline channels and
consumers’ attitude compared to online media channels. In addition, strong, positive and
statistically significant relationship between use of TV and consumer awareness(r =
0.799, P = 0.000), liking (r = 0.898, P = 0.000) and consumer action tendency (r = 0.718,
P = 0.000). Regression analysis revealed that offline media channels significantly
influence (F = 3.994; P = 0.0131) consumers’ attitude compared to online media channels
(F = 2.551; P = 0.0341) when accessing bank advertisement. Age had no significant
moderating effect on offline media channels 78.5 % (R2 = 0.559) and consumers’ attitude
whereas online media channel 55.9 % (R2 = 0.559). In conclusion, this study has
demonstrated that advertising through offline media channel by the selected bank
significantly influence consumers’ attitude and age plays no significant moderating effect
on consumer attitude and media channels.
Keywords: Advertising; Consumers’ Attitudes; Online Media; Offline Media Econ
journals, vol. 9(6), pages 169-178.
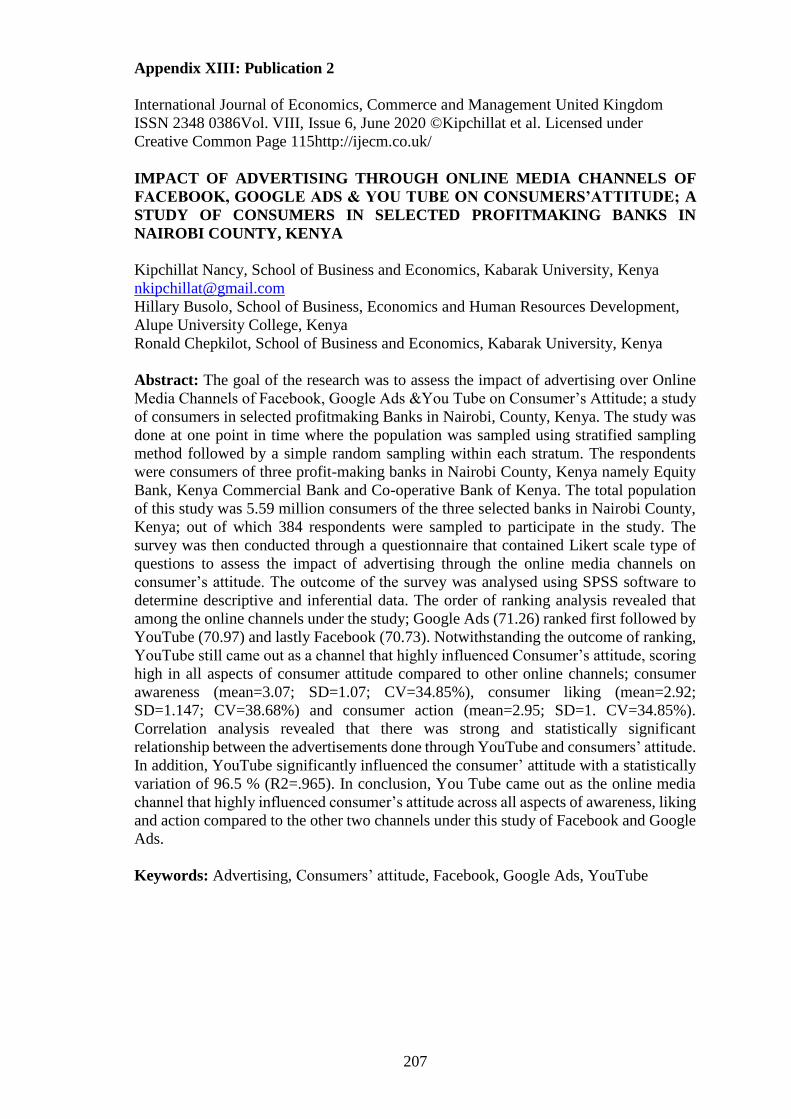
207
Appendix XIII: Publication 2
International Journal of Economics, Commerce and Management United Kingdom
ISSN 2348 0386Vol. VIII, Issue 6, June 2020 ©Kipchillat et al. Licensed under
Creative Common Page 115http://ijecm.co.uk/
IMPACT OF ADVERTISING THROUGH ONLINE MEDIA CHANNELS OF
FACEBOOK, GOOGLE ADS & YOU TUBE ON CONSUMERS’ATTITUDE; A
STUDY OF CONSUMERS IN SELECTED PROFITMAKING BANKS IN
NAIROBI COUNTY, KENYA
Kipchillat Nancy, School of Business and Economics, Kabarak University, Kenya
Hillary Busolo, School of Business, Economics and Human Resources Development,
Alupe University College, Kenya
Ronald Chepkilot, School of Business and Economics, Kabarak University, Kenya
Abstract: The goal of the research was to assess the impact of advertising over Online
Media Channels of Facebook, Google Ads &You Tube on Consumer’s Attitude; a study
of consumers in selected profitmaking Banks in Nairobi, County, Kenya. The study was
done at one point in time where the population was sampled using stratified sampling
method followed by a simple random sampling within each stratum. The respondents
were consumers of three profit-making banks in Nairobi County, Kenya namely Equity
Bank, Kenya Commercial Bank and Co-operative Bank of Kenya. The total population
of this study was 5.59 million consumers of the three selected banks in Nairobi County,
Kenya; out of which 384 respondents were sampled to participate in the study. The
survey was then conducted through a questionnaire that contained Likert scale type of
questions to assess the impact of advertising through the online media channels on
consumer’s attitude. The outcome of the survey was analysed using SPSS software to
determine descriptive and inferential data. The order of ranking analysis revealed that
among the online channels under the study; Google Ads (71.26) ranked first followed by
YouTube (70.97) and lastly Facebook (70.73). Notwithstanding the outcome of ranking,
YouTube still came out as a channel that highly influenced Consumer’s attitude, scoring
high in all aspects of consumer attitude compared to other online channels; consumer
awareness (mean=3.07; SD=1.07; CV=34.85%), consumer liking (mean=2.92;
SD=1.147; CV=38.68%) and consumer action (mean=2.95; SD=1. CV=34.85%).
Correlation analysis revealed that there was strong and statistically significant
relationship between the advertisements done through YouTube and consumers’ attitude.
In addition, YouTube significantly influenced the consumer’ attitude with a statistically
variation of 96.5 % (R2=.965). In conclusion, You Tube came out as the online media
channel that highly influenced consumer’s attitude across all aspects of awareness, liking
and action compared to the other two channels under this study of Facebook and Google
Ads.
Keywords: Advertising, Consumers’ attitude, Facebook, Google Ads, YouTube
Related Documents